UNITED STATES
SECURITIES AND EXCHANGE COMMISSION
Washington, D.C. 20549
FORM N-CSR
CERTIFIED SHAREHOLDER REPORT OF REGISTERED MANAGEMENT
INVESTMENT COMPANIES
| |
| Investment Company Act file number | 811-4765 |
Dreyfus New York AMT-Free Municipal Bond Fund
(Exact name of Registrant as specified in charter)
c/o The Dreyfus Corporation
200 Park Avenue
New York, New York 10166
(Address of principal executive offices) (Zip code)
Michael A. Rosenberg, Esq.
200 Park Avenue
New York, New York 10166
(Name and address of agent for service)
| | | |
| Registrant's telephone number, including area code: | (212) | 922-6000 |
| Date of fiscal year end: | 11/30 | | |
| Date of reporting period: | 11/30/09 | | |
FORM N-CSR
| |
| Item 1. | Reports to Stockholders. |
-2-
Save time. Save paper. View your next shareholder report online as soon as it’s available. Log into www.dreyfus.com and sign up for Dreyfus eCommunications. It’s simple and only takes a few minutes.
The views expressed in this report reflect those of the portfolio manager only through the end of the period covered and do not necessarily represent the views of Dreyfus or any other person in the Dreyfus organization. Any such views are subject to change at any time based upon market or other conditions and Dreyfus disclaims any responsibility to update such views.These views may not be relied on as investment advice and, because investment decisions for a Dreyfus fund are based on numerous factors, may not be relied on as an indication of trading intent on behalf of any Dreyfus fund.
Not FDIC-Insured • Not Bank-Guaranteed • May Lose Value
| | Contents |
| | THE FUND |
| 2 | A Letter from the Chairman and CEO |
| 3 | Discussion of Fund Performance |
| 6 | Fund Performance |
| 8 | Understanding Your Fund’s Expenses |
| 8 | Comparing Your Fund’s Expenses With Those of Other Funds |
| 9 | Statement of Investments |
| 20 | Statement of Assets and Liabilities |
| 21 | Statement of Operations |
| 22 | Statement of Changes in Net Assets |
| 24 | Financial Highlights |
| 28 | Notes to Financial Statements |
| 37 | Report of Independent Registered Public Accounting Firm |
| 38 | Important Tax Information |
| 39 | Information About the Review and Approval of the Fund’s Management Agreement |
| 44 | Board Members Information |
| 46 | Officers of the Fund |
| | FOR MORE INFORMATION |
| | Back Cover |
Dreyfus
New York AMT-Free
Municipal Bond Fund
The Fund

A LETTER FROM THE CHAIRMAN AND CEO
Dear Shareholder:
We are pleased to present this annual report for Dreyfus New York AMT-Free Municipal Bond Fund, covering the 12-month period from December 1, 2008, through November 30, 2009.
Evidence has continued to accumulate that the global recession is over and sustained economic recoveries have begun in the United States and worldwide. Central bank liquidity actions, accommodative monetary policies and economic stimulus programs in many different countries succeeded in calming the financial crisis, ending the recession and sparking the beginning of a global expansion.As 2009 draws to a close, economic policy remains stimulative in nearly every country in the world, and we expect these simultaneous stimuli to support a sustained but moderate global expansion in 2010.
The American Recovery and Reinvestment Act of 2009 has had a noticeable impact on the municipal bond market, helping to provide credit stability and aiding supply-and-demand dynamics. In addition, risk premiums have subsided and yield differences have steepened along the bond market’s maturity range.While lower-quality securities had led the broader financial markets’ advance as investors sought bargains in the wake of economic and market turbulence, higher-quality municipal bonds have exhibited improved fundamentals along with solid performance gains year-to-date. Is now a good time to consider allocating within municipal bonds? Talk to your financial advisor, who can help you make that determination and prepare for the challenges and opportunities that lie ahead.
For information about how the fund performed during the reporting period, as well as market perspectives, we have provided a Discussion of Fund Performance.
Thank you for your continued confidence and support.

Jonathan R. Baum
Chairman and Chief Executive Officer
The Dreyfus Corporation
December 15, 2009
2

DISCUSSION OF FUND PERFORMANCE
For the period of December 1, 2008, through November 30, 2009, as provided by Thomas Casey and David Belton, Portfolio Managers
Fund and Market Performance Overview
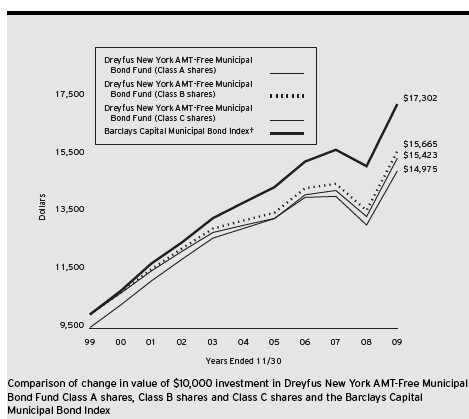
For the 12-month period ended November 30, 2009, Dreyfus NewYork AMT-Free Municipal Bond Fund’s Class A, Class B and Class C shares produced total returns of 15.15%, 14.55% and 14.29%, respectively.1 Between their inception on December 15, 2008, and November 30, 2009, the fund’s Class I shares produced a return of 21.06%. In comparison, the Barclays Capital Municipal Bond Index (the “Index”), the fund’s benchmark, achieved a total return of 14.17% for the full 12-month period.2
Municipal bonds rallied strongly over the reporting period as the U.S. economy and credit markets stabilized.The fund’s returns were higher than its benchmark, primarily due to strong results from its higher yielding holdings.
The Fund’s Investment Approach
The fund seeks to maximize current income exempt from federal, New York state and NewYork city income taxes to the extent consistent with the preservation of capital.To pursue this goal, the fund normally invests substantially all of its assets in municipal bonds that provide income exempt from federal, NewYork state and NewYork city personal income taxes. The fund also seeks to provide income exempt from the federal alternative minimum tax (“AMT”).The fund will invest at least 70% of its assets in investment-grade municipal bonds or the unrated equivalent as determined by Dreyfus. For additional yield, the fund may invest up to 30% of its assets in municipal bonds rated below investment grade (“high yield” or “junk” bonds) or the unrated equivalent as determined by Dreyfus. Under normal market conditions, the dollar-weighted average maturity of the fund’s portfolio is expected to exceed 10 years.
We may buy and sell bonds based on credit quality, market outlook and yield potential. In selecting municipal bonds for investment, we may assess the current interest-rate environment and the municipal bond’s
The Fund 3
DISCUSSION OF FUND PERFORMANCE (continued)
potential volatility in different rate environments. We focus on bonds with the potential to offer attractive current income, typically looking for bonds that can provide consistently attractive current yields or that are trading at competitive market prices. A portion of the fund’s assets may be allocated to“discount”bonds,which are bonds that sell at a price below their face value, or to “premium” bonds, which are bonds that sell at a price above their face value.The fund’s allocation to either discount bonds or to premium bonds will change along with our changing views of the current interest-rate and market environment.We may also look to select bonds that are most likely to obtain attractive prices when sold.
Municipal Bonds Rebounded with U.S. Economy
In the wake of severe market declines stemming from a global financial crisis and recession through the end of 2008, the municipal bond market rebounded sharply over the first 11 months of 2009.The rally was fueled by changing investor sentiment as government and monetary authorities’ aggressive remedial measures—including historically low interest rates, injections of liquidity into the banking system, the rescues of major corporations and a massive economic stimulus program—seemed to gain traction.Although most municipal bonds participated in the rebound,gains were particularly strong among higher yielding issues.
Security Selection Strategy Bolstered Fund Returns
Despite evidence of an economic recovery, most states and municipalities have continued to face fiscal challenges stemming from lower-than-projected tax receipts and intensifying demands for services.These pressures were particularly intense in NewYork, where tax revenues were hurt by a slumping financial services industry. Consequently, we intensified our focus on high-quality securities, including bonds backed by pledged tax appropriations or dedicated revenue streams from facilities providing essential services. We shied away from issuers we regarded as heavily dependent on state aid.We set the fund’s average duration in a range that was roughly in line with industry averages.
While this generally defensive investment posture limited the fund’s participation in a rally led by lower-quality bonds, the fund’s holdings of income-oriented securities, many of which were purchased with higher yields than are currently available, offset any relative weakness.The fund
4
received particularly strong results from bonds with a first-lien claim on state sales tax revenues.
Supply-and-Demand Factors Appear Favorable
With short-term interest rates expected to remain low for some time, we believe that credit conditions may be the dominant influence on market sentiment over the foreseeable future.Therefore, we have maintained the fund’s generally conservative investment posture.
With that said, we are cautiously optimistic regarding the prospects for municipal bonds. Despite the lingering impacts of the recession, technical factors remain favorable.The supply of newly issued municipal bonds has fallen significantly so far in 2009 compared to one year ago as the Build America Bonds program, part of the economic stimulus package, has diverted a substantial portion of new issuance to the taxable bond market. At the same time, demand for municipal bonds has intensified from individual and institutional investors. We expect this positive supply-and-demand dynamic to persist into 2010.
December 15, 2009
| |
| 1 | Total return includes reinvestment of dividends and any capital gains paid, and does not take into |
| | consideration the maximum initial sales charge in the case of Class A shares, or the applicable |
| | contingent deferred sales charges imposed on redemptions in the case of Class B and Class C |
| | shares. Had these charges been reflected, returns would have been lower. Each share class is subject |
| | to a different sales charge and distribution expense structure and will achieve different returns. |
| | Class I is not subject to any initial or deferred sales charge. Past performance is no guarantee of |
| | future results. Share price, yield and investment return fluctuate such that upon redemption, fund |
| | shares may be worth more or less than their original cost. Income may be subject to state and local |
| | taxes for non-NewYork residents. Capital gains, if any, are fully taxable. Return figures provided |
| | reflect the absorption of certain fund expenses by The Dreyfus Corporation pursuant to an |
| | undertaking in effect for Class A through April 30, 2010, and in effect for Class B and Class C |
| | through April 01, 2010, at which time it may be extended, terminated or modified. Had these |
| | expenses not been absorbed, the fund’s returns would have been lower. Return figure for Class I |
| | shares reflects the absorption of certain fund expenses by The Dreyfus Corporation which may be |
| | modified or terminated at any time. Had these expenses not been absorbed, the fund’s returns |
| | would have been lower. |
| 2 | SOURCE: LIPPER INC. — Reflects reinvestment of dividends and, where applicable, capital |
| | gain distributions.The Barclays Capital Municipal Bond Index is a widely accepted, unmanaged |
| | and geographically unrestricted total return performance benchmark for the long-term, investment- |
| | grade, tax-exempt bond market. Index returns do not reflect the fees and expenses associated with |
| | operating a mutual fund. |
The Fund 5
FUND PERFORMANCE
|
| † Source: Lipper Inc. |
| Past performance is not predictive of future performance. |
| The above graph compares a $10,000 investment made in Class A shares, Class B shares and Class C shares of |
| Dreyfus NewYork AMT-Free Municipal Bond Fund on 11/30/99 to a $10,000 investment made in the Barclays |
| Capital Municipal Bond Index (the “Index”) on that date. All dividends and capital gain distributions are reinvested. |
| The fund invests primarily in NewYork municipal securities and the fund’s performance shown in the line graph takes |
| into account the maximum initial sales charge on Class A shares and all other applicable fees and expenses on all share |
| classes. Performance for Class I shares will vary from the performance of Class A shares, Class B shares and Class C |
| shares shown above due to differences in charges and expenses.The Index is not limited to investments principally in |
| NewYork municipal obligations and does not take into account charges, fees and other expenses.The Index, unlike the |
| fund, is an unmanaged total return performance benchmark for the long-term, investment-grade, geographically unrestricted |
| tax-exempt bond market, calculated by using municipal bonds selected to be representative of the municipal market |
| overall.These factors can contribute to the Index potentially outperforming or underperforming the fund. Unlike a mutual |
| fund, the Index is not subject to charges, fees and other expenses. Investors cannot invest directly in any index. Further |
| information relating to fund performance, including expense reimbursements, if applicable, is contained in the Financial |
| Highlights section of the prospectus and elsewhere in this report. |
6
| | | | |
| Average Annual Total Returns as of 11/30/09 | | | |
| |
| | Inception | | | |
| | Date | 1 Year | 5 Years | 10 Years |
| Class A shares | | | | |
| with maximum sales charge (4.5%) | 12/31/86 | 9.96% | 2.54% | 4.43% |
| without sales charge | 12/31/86 | 15.15% | 3.50% | 4.91% |
| Class B shares | | | | |
| with applicable redemption charge † | 1/15/93 | 10.55% | 2.64% | 4.59% |
| without redemption | 1/15/93 | 14.55% | 2.98% | 4.59% |
| Class C shares | | | | |
| with applicable redemption charge †† | 9/11/95 | 13.29% | 2.72% | 4.12% |
| without redemption | 9/11/95 | 14.29% | 2.72% | 4.12% |
| Class I shares | 12/15/08 | 15.26%††† | 3.52%††† | 4.92%††† |
| |
| Past performance is not predictive of future performance.The fund’s performance shown in the graph and table does not |
| reflect the deduction of taxes that a shareholder would pay on fund distributions or the redemption of fund shares. |
| Performance for Class B shares assumes the conversion of Class B shares to Class A shares at the end of the sixth year |
| following the date of purchase. |
| † | The maximum contingent deferred sales charge for Class B shares is 4%. After six years Class B shares convert to |
| | Class A shares. |
| †† | The maximum contingent deferred sales charge for Class C shares is 1% for shares redeemed within one year of the |
| | date of purchase. |
| ††† | The total return performance figures presented for Class I shares of the fund reflect the performance of the fund’s |
| | Class A shares for periods prior to 12/15/08 (the inception date for Class I shares). |
The Fund 7
UNDERSTANDING YOUR FUND’S EXPENSES (Unaudited)
As a mutual fund investor, you pay ongoing expenses, such as management fees and other expenses. Using the information below, you can estimate how these expenses affect your investment and compare them with the expenses of other funds.You also may pay one-time transaction expenses, including sales charges (loads) and redemption fees, which are not shown in this section and would have resulted in higher total expenses. For more information, see your fund’s prospectus or talk to your financial adviser.
Review your fund’s expenses
The table below shows the expenses you would have paid on a $1,000 investment in Dreyfus NewYork AMT-Free Municipal Bond Fund from June 1, 2009 to November 30, 2009. It also shows how much a $1,000 investment would be worth at the close of the period, assuming actual returns and expenses.
| | | | |
| Expenses and Value of a $1,000 Investment | | | |
| assuming actual returns for the six months ended November 30, 2009 | | |
| | Class A | Class B | Class C | Class I |
| Expenses paid per $1,000† | $ 4.37 | $ 6.94 | $ 8.22 | $ 3.86 |
| Ending value (after expenses) | $1,052.80 | $1,050.00 | $1,048.80 | $1,053.30 |
|
| COMPARING YOUR FUND’S EXPENSES |
| WITH THOSE OF OTHER FUNDS (Unaudited) |
Using the SEC’s method to compare expenses
The Securities and Exchange Commission (SEC) has established guidelines to help investors assess fund expenses. Per these guidelines, the table below shows your fund’s expenses based on a $1,000 investment, assuming a hypothetical 5% annualized return. You can use this information to compare the ongoing expenses (but not transaction expenses or total cost) of investing in the fund with those of other funds.All mutual fund shareholder reports will provide this information to help you make this comparison. Please note that you cannot use this information to estimate your actual ending account balance and expenses paid during the period.
| | | | |
| Expenses and Value of a $1,000 Investment | | | |
| assuming a hypothetical 5% annualized return for the six months ended November 30, 2009 |
| | Class A | Class B | Class C | Class I |
| Expenses paid per $1,000† | $ 4.31 | $ 6.83 | $ 8.09 | $ 3.80 |
| Ending value (after expenses) | $1,020.81 | $1,018.30 | $1,017.05 | $1,021.31 |
|
| † Expenses are equal to the fund’s annualized expense ratio of .85% for Class A, 1.35% for Class B, 1.60% for |
| Class C and .75% for Class I, multiplied by the average account value over the period, multiplied by 183/365 (to |
| reflect the one-half year period). |
8
| | | | | |
| STATEMENT OF INVESTMENTS | | | | |
| November 30, 2009 | | | | | |
| |
| |
| |
| |
| Long-Term Municipal | Coupon | Maturity | Principal | | |
| Investments—98.2% | Rate (%) | Date | Amount ($) | | Value ($) |
| New York—91.6% | | | | | |
| Albany Industrial Development | | | | | |
| Agency, Civic Facility Revenue | | | | | |
| (Saint Peter’s Hospital of the | | | | | |
| City of Albany Project) | 5.25 | 11/15/27 | 2,000,000 | | 1,988,460 |
| Dutchess County Industrial | | | | | |
| Development Agency, Civic | | | | | |
| Facility Revenue (Bard College | | | | | |
| Civic Facility) | 5.00 | 8/1/22 | 775,000 | a | 791,779 |
| Hempstead Industrial Development | | | | | |
| Agency, Civic Facility Revenue | | | | | |
| (Adelphi University Civic Facility) | 5.00 | 10/1/30 | 1,565,000 | a | 1,589,414 |
| Hempstead Industrial Development | | | | | |
| Agency, Civic Facility Revenue | | | | | |
| (Adelphi University Civic Facility) | 5.00 | 10/1/35 | 1,500,000 | a | 1,504,410 |
| Hempstead Local Development | | | | | |
| Corporation, Revenue (Molloy | | | | | |
| College Project) | 5.70 | 7/1/29 | 2,000,000 | a | 2,014,560 |
| Huntington Housing Authority, | | | | | |
| Senior Housing Facility | | | | | |
| Revenue (Gurwin Jewish Senior | | | | | |
| Residences Project) | 6.00 | 5/1/29 | 1,370,000 | | 1,148,498 |
| Long Island Power Authority, | | | | | |
| Electric System General Revenue | 6.00 | 5/1/33 | 1,500,000 | | 1,683,390 |
| Long Island Power Authority, | | | | | |
| Electric System General | | | | | |
| Revenue (Insured; National | | | | | |
| Public Finance Guarantee Corp.) | 5.00 | 12/1/19 | 1,000,000 | | 1,075,660 |
| Metropolitan Transportation | | | | | |
| Authority, Transit Facilities | | | | | |
| Revenue (Insured; Assured | | | | | |
| Guaranty Municipal Corp.) | | | | | |
| (Prerefunded) | 5.13 | 1/1/12 | 1,225,000 | b | 1,338,533 |
| Metropolitan Transportation | | | | | |
| Authority, Transportation Revenue | 6.50 | 11/15/28 | 1,000,000 | | 1,145,300 |
| Metropolitan Transportation | | | | | |
| Authority, Transportation Revenue | 5.00 | 11/15/31 | 1,500,000 | | 1,523,745 |
| Metropolitan Transportation | | | | | |
| Authority, Transportation | | | | | |
| Revenue (Insured; AMBAC) | 5.50 | 11/15/18 | 4,000,000 | | 4,351,080 |
| New York City, | | | | | |
| GO | 5.38 | 12/1/20 | 150,000 | | 154,672 |
The Fund 9
STATEMENT OF INVESTMENTS (continued)
| | | | | |
| Long-Term Municipal | Coupon | Maturity | Principal | | |
| Investments (continued) | Rate (%) | Date | Amount ($) | | Value ($) |
| New York (continued) | | | | | |
| New York City, | | | | | |
| GO | 5.00 | 8/1/21 | 2,000,000 | | 2,115,420 |
| New York City, | | | | | |
| GO | 5.25 | 8/15/24 | 1,420,000 | | 1,507,926 |
| New York City, | | | | | |
| GO (Prerefunded) | 5.38 | 12/1/11 | 850,000 | b | 931,608 |
| New York City Housing Development | | | | | |
| Corporation, Capital Fund | | | | | |
| Program Revenue (New York City | | | | | |
| Housing Authority Program) | | | | | |
| (Insured; National Public | | | | | |
| Finance Guarantee Corp.) | 5.00 | 7/1/25 | 2,265,000 | | 2,348,601 |
| New York City Industrial | | | | | |
| Development Agency, Civic | | | | | |
| Facility Revenue (Vaughn | | | | | |
| College of Aeronautics and | | | | | |
| Technology Project) | 5.25 | 12/1/36 | 1,000,000 | a | 729,370 |
| New York City Industrial | | | | | |
| Development Agency, Civic | | | | | |
| Facility Revenue (YMCA of | | | | | |
| Greater New York Project) | 5.00 | 8/1/36 | 4,000,000 | | 3,684,920 |
| New York City Industrial | | | | | |
| Development Agency, PILOT | | | | | |
| Revenue (Yankee Stadium | | | | | |
| Project) (Insured; Assured | | | | | |
| Guaranty Municipal Corp.) | 7.00 | 3/1/49 | 2,500,000 | | 2,872,725 |
| New York City Municipal Water | | | | | |
| Finance Authority, Water and | | | | | |
| Sewer System Second General | | | | | |
| Resolution Revenue | 5.25 | 6/15/40 | 1,225,000 | | 1,278,312 |
| New York City Municipal Water | | | | | |
| Finance Authority, Water and | | | | | |
| Sewer System Second General | | | | | |
| Resolution Revenue | 5.50 | 6/15/40 | 1,000,000 | | 1,074,530 |
| New York City Transitional Finance | | | | | |
| Authority, Building Aid | | | | | |
| Revenue (Insured; National | | | | | |
| Public Finance Guarantee Corp.) | 5.00 | 7/15/25 | 1,000,000 | | 1,058,560 |
| New York City Transitional Finance | | | | | |
| Authority, Building Aid | | | | | |
| Revenue (Insured; National | | | | | |
| Public Finance Guarantee Corp.) | 5.00 | 7/15/36 | 2,000,000 | | 2,026,200 |
10
| | | | | |
| Long-Term Municipal | Coupon | Maturity | Principal | | |
| Investments (continued) | Rate (%) | Date | Amount ($) | | Value ($) |
| New York (continued) | | | | | |
| New York City Transitional Finance | | | | | |
| Authority, Future Tax | | | | | |
| Secured Revenue | 5.00 | 11/1/25 | 1,205,000 | | 1,283,072 |
| New York City Transitional Finance | | | | | |
| Authority, Future Tax Secured | | | | | |
| Revenue (Prerefunded) | 6.00 | 5/15/10 | 450,000 | b | 466,349 |
| New York State Dormitory | | | | | |
| Authority, Catholic Health | | | | | |
| Services of Long Island | | | | | |
| Obligated Group Revenue (Saint | | | | | |
| Francis Hospital Project) | 5.00 | 7/1/21 | 2,000,000 | | 1,950,140 |
| New York State Dormitory | | | | | |
| Authority, Consolidated Second | | | | | |
| General Resolution Revenue | | | | | |
| (City University System) | | | | | |
| (Insured; National Public | | | | | |
| Finance Guarantee Corp.) | 5.75 | 7/1/16 | 1,000,000 | a | 1,026,570 |
| New York State Dormitory | | | | | |
| Authority, FHA-Insured | | | | | |
| Mortgage Hospital Revenue | | | | | |
| (Hospital for Special Surgery) | 6.00 | 8/15/38 | 1,470,000 | c | 1,566,697 |
| New York State Dormitory | | | | | |
| Authority, FHA-Insured | | | | | |
| Mortgage Hospital Revenue (The | | | | | |
| New York and Presbyterian | | | | | |
| Hospital) (Insured; Assured | | | | | |
| Guaranty Municipal Corp.) | 5.25 | 8/15/27 | 1,000,000 | | 1,039,600 |
| New York State Dormitory | | | | | |
| Authority, Insured Revenue | | | | | |
| (Manhattan College) | | | | | |
| (Insured; Radian) | 5.50 | 7/1/16 | 975,000 | a | 1,002,885 |
| New York State Dormitory | | | | | |
| Authority, Insured Revenue | | | | | |
| (New York University) | | | | | |
| (Insured; AMBAC) | 5.00 | 7/1/32 | 1,345,000 | a | 1,378,208 |
| New York State Dormitory | | | | | |
| Authority, Mortgage Hospital | | | | | |
| Revenue (The Long Island | | | | | |
| College Hospital) (Insured; FHA) | 6.00 | 8/15/15 | 1,485,000 | | 1,617,700 |
| New York State Dormitory | | | | | |
| Authority, Revenue (Consolidated | | | | | |
| City University System) | 5.63 | 7/1/16 | 4,000,000 | a | 4,426,600 |
The Fund 11
STATEMENT OF INVESTMENTS (continued)
| | | | | |
| Long-Term Municipal | Coupon | Maturity | Principal | | |
| Investments (continued) | Rate (%) | Date | Amount ($) | | Value ($) |
| New York (continued) | | | | | |
| New York State Dormitory | | | | | |
| Authority, Revenue | | | | | |
| (Consolidated City University | | | | | |
| System) (Insured; Assured | | | | | |
| Guaranty Municipal Corp.) | 5.75 | 7/1/18 | 1,000,000 | a | 1,140,980 |
| New York State Dormitory | | | | | |
| Authority, Revenue | | | | | |
| (Cornell University) | 5.00 | 7/1/24 | 2,000,000 | a | 2,175,660 |
| New York State Dormitory | | | | | |
| Authority, Revenue | | | | | |
| (Cornell University) | 5.00 | 7/1/35 | 2,000,000 | a | 2,068,480 |
| New York State Dormitory | | | | | |
| Authority, Revenue (Fordham | | | | | |
| University) (Insured; Assured | | | | | |
| Guaranty Municipal Corp.) | 5.00 | 7/1/33 | 1,000,000 | a | 1,022,370 |
| New York State Dormitory | | | | | |
| Authority, Revenue (Mental | | | | | |
| Health Services Facilities | | | | | |
| Improvement) | 5.00 | 2/15/28 | 880,000 | | 900,706 |
| New York State Dormitory | | | | | |
| Authority, Revenue (Miriam | | | | | |
| Osborne Memorial Home) | | | | | |
| (Insured; ACA) | 6.88 | 7/1/19 | 1,000,000 | | 1,026,200 |
| New York State Dormitory | | | | | |
| Authority, Revenue (Mount Sinai | | | | | |
| NYU Health Obligated Group) | 5.50 | 7/1/26 | 2,000,000 | | 2,001,140 |
| New York State Dormitory | | | | | |
| Authority, Revenue (Mount | | | | | |
| Sinai School of Medicine of | | | | | |
| New York University) | 5.50 | 7/1/25 | 1,320,000 | a | 1,380,971 |
| New York State Dormitory | | | | | |
| Authority, Revenue (New York | | | | | |
| State Department of Health) | | | | | |
| (Insured; CIFG) | 5.00 | 7/1/25 | 2,500,000 | | 2,604,900 |
| New York State Dormitory | | | | | |
| Authority, Revenue | | | | | |
| (New York University) | 5.00 | 7/1/34 | 1,000,000 | a,c | 1,027,560 |
| New York State Dormitory | | | | | |
| Authority, Revenue (North | | | | | |
| Shore-Long Island Jewish | | | | | |
| Obligated Group) | 5.00 | 5/1/25 | 2,750,000 | | 2,782,175 |
12
| | | | | |
| Long-Term Municipal | Coupon | Maturity | Principal | | |
| Investments (continued) | Rate (%) | Date | Amount ($) | | Value ($) |
| New York (continued) | | | | | |
| New York State Dormitory Authority, | | | | | |
| Revenue (North Shore-Long Island | | | | | |
| Jewish Obligated Group) | 5.50 | 5/1/37 | 1,000,000 | | 1,002,870 |
| New York State Dormitory | | | | | |
| Authority, Revenue (NYU | | | | | |
| Hospitals Center) | 5.25 | 7/1/24 | 1,000,000 | | 988,920 |
| New York State Dormitory | | | | | |
| Authority, Revenue (NYU | | | | | |
| Hospitals Center) | 5.00 | 7/1/26 | 1,000,000 | | 953,330 |
| New York State Dormitory | | | | | |
| Authority, Revenue (Orange | | | | | |
| Regional Medical Center | | | | | |
| Obligated Group) | 6.25 | 12/1/37 | 1,500,000 | | 1,331,025 |
| New York State Dormitory | | | | | |
| Authority, Revenue (Rochester | | | | | |
| Institute of Technology) | 6.00 | 7/1/33 | 3,250,000 | a | 3,562,358 |
| New York State Dormitory | | | | | |
| Authority, Revenue (State | | | | | |
| University Educational Facilities) | 5.88 | 5/15/17 | 2,000,000 | a | 2,359,140 |
| New York State Dormitory Authority, | | | | | |
| Revenue (Teachers College) | 5.38 | 3/1/29 | 2,000,000 | a | 2,124,880 |
| New York State Dormitory | | | | | |
| Authority, Revenue (The | | | | | |
| Bronx-Lebanon Hospital Center) | | | | | |
| (LOC; TD Bank) | 6.50 | 8/15/30 | 2,000,000 | | 2,211,260 |
| New York State Dormitory | | | | | |
| Authority, Revenue (The | | | | | |
| Rockefeller University) | 5.00 | 7/1/40 | 1,500,000 | a | 1,557,225 |
| New York State Dormitory | | | | | |
| Authority, Revenue (University | | | | | |
| of Rochester) | 5.00 | 7/1/34 | 2,870,000 | a | 2,905,043 |
| New York State Dormitory | | | | | |
| Authority, South Nassau | | | | | |
| Communities HR (Winthrop South | | | | | |
| Nassau University Health | | | | | |
| System Obligated Group) | 5.50 | 7/1/23 | 1,650,000 | | 1,645,232 |
| New York State Housing Finance | | | | | |
| Agency, State Personal Income | | | | | |
| Tax Revenue (Economic | | | | | |
| Development and Housing) | 5.00 | 3/15/34 | 1,575,000 | | 1,613,682 |
The Fund 13
STATEMENT OF INVESTMENTS (continued)
| | | | | |
| Long-Term Municipal | Coupon | Maturity | Principal | | |
| Investments (continued) | Rate (%) | Date | Amount ($) | | Value ($) |
| New York (continued) | | | | | |
| New York State Mortgage Agency, | | | | | |
| Education Loan Revenue | | | | | |
| (New York Higher | | | | | |
| Education Loan Program) | 5.25 | 11/1/20 | 1,605,000 | a,c | 1,718,441 |
| New York State Thruway Authority, | | | | | |
| General Revenue (Insured; | | | | | |
| National Public Finance | | | | | |
| Guarantee Corp.) | 5.00 | 1/1/27 | 3,000,000 | | 3,152,490 |
| New York State Thruway Authority, | | | | | |
| Second General Highway and | | | | | |
| Bridge Trust Fund Bonds | 5.00 | 4/1/25 | 2,000,000 | | 2,132,260 |
| New York State Thruway Authority, | | | | | |
| Second General Highway and | | | | | |
| Bridge Trust Fund Bonds | 5.00 | 4/1/27 | 2,000,000 | | 2,109,880 |
| New York State Thruway Authority, | | | | | |
| Second General Highway and | | | | | |
| Bridge Trust Fund Bonds | | | | | |
| (Insured; AMBAC) | 5.00 | 4/1/19 | 3,000,000 | | 3,274,080 |
| New York State Thruway Authority, | | | | | |
| Second General Highway and | | | | | |
| Bridge Trust Fund Bonds | | | | | |
| (Insured; AMBAC) | 5.00 | 4/1/22 | 2,000,000 | | 2,143,000 |
| New York State Thruway Authority, | | | | | |
| State Personal Income Tax | | | | | |
| Revenue (Transportation) | 5.25 | 3/15/27 | 1,000,000 | | 1,086,400 |
| New York State Urban Development | | | | | |
| Corporation, State Personal | | | | | |
| Income Tax Revenue (Economic | | | | | |
| Development and Housing) | | | | | |
| (Insured; AMBAC) | 5.00 | 12/15/23 | 2,000,000 | | 2,137,460 |
| New York State Urban Development | | | | | |
| Corporation, State Personal | | | | | |
| Income Tax Revenue (State | | | | | |
| Facilities and Equipment) | | | | | |
| (Insured; FGIC) (Prerefunded) | 5.50 | 3/15/13 | 2,450,000 | b | 2,814,683 |
| Niagara County Industrial | | | | | |
| Development Agency, | | | | | |
| Solid Waste Disposal | | | | | |
| Facility Revenue (American | | | | | |
| Ref-Fuel Company of | | | | | |
| Niagara, LP Facility) | 5.55 | 11/15/15 | 1,970,000 | | 1,905,049 |
14
| | | | | |
| Long-Term Municipal | Coupon | Maturity | Principal | | |
| Investments (continued) | Rate (%) | Date | Amount ($) | | Value ($) |
| New York (continued) | | | | | |
| Orange County Industrial | | | | | |
| Development Agency, Life Care | | | | | |
| Community Revenue (Glenn | | | | | |
| Arden, Inc. Project) | 5.63 | 1/1/18 | 920,000 | | 801,016 |
| Port Authority of New York and | | | | | |
| New Jersey (Consolidated | | | | | |
| Bonds, 142nd Series) | 5.00 | 7/15/23 | 2,000,000 | | 2,145,660 |
| Rensselaer County Industrial | | | | | |
| Development Agency, Civic | | | | | |
| Facility Revenue (Emma Willard | | | | | |
| School Project) | 5.00 | 1/1/31 | 1,000,000 | a | 1,010,410 |
| Rensselaer County Industrial | | | | | |
| Development Agency, Civic | | | | | |
| Facility Revenue (Emma Willard | | | | | |
| School Project) | 5.00 | 1/1/36 | 1,000,000 | a | 987,040 |
| Rensselaer County Industrial | | | | | |
| Development Agency, Civic | | | | | |
| Facility Revenue (Rensselaer | | | | | |
| Polytechnic Institute Project) | 5.00 | 3/1/36 | 2,000,000 | a | 2,030,960 |
| Schenectady Industrial Development | | | | | |
| Agency, Civic Facility Revenue | | | | | |
| (Union College Project) | 5.00 | 7/1/26 | 1,380,000 | a | 1,448,572 |
| Schenectady Industrial Development | | | | | |
| Agency, Civic Facility Revenue | | | | | |
| (Union College Project) | 5.00 | 7/1/31 | 1,335,000 | a | 1,373,395 |
| Suffolk Tobacco Asset Securitization | | | | | |
| Corporation, Tobacco Settlement | | | | | |
| Asset-Backed Bonds | 6.00 | 6/1/48 | 2,000,000 | | 1,815,160 |
| Tobacco Settlement Financing | | | | | |
| Corporation of New York, | | | | | |
| Asset-Backed Revenue Bonds | | | | | |
| (State Contingency | | | | | |
| Contract Secured) | 5.50 | 6/1/21 | 3,930,000 | | 4,154,717 |
| Triborough Bridge and Tunnel | | | | | |
| Authority, General | | | | | |
| Purpose Revenue | 6.00 | 1/1/12 | 1,630,000 | | 1,727,001 |
| Triborough Bridge and Tunnel | | | | | |
| Authority, Subordinate Revenue | | | | | |
| (Insured; National Public | | | | | |
| Finance Guarantee Corp.) | 5.00 | 11/15/32 | 2,000,000 | | 2,029,020 |
The Fund 15
STATEMENT OF INVESTMENTS (continued)
| | | | |
| Long-Term Municipal | Coupon | Maturity | Principal | |
| Investments (continued) | Rate (%) | Date | Amount ($) | Value ($) |
| New York (continued) | | | | |
| Westchester Tobacco Asset | | | | |
| Securitization Corporation, | | | | |
| Tobacco Settlement | | | | |
| Asset-Backed Bonds | 5.13 | 6/1/45 | 1,200,000 | 949,092 |
| U.S. Related—6.6% | | | | |
| Children’s Trust Fund of Puerto | | | | |
| Rico, Tobacco Settlement | | | | |
| Asset-Backed Bonds (Prerefunded) | 6.00 | 7/1/10 | 2,000,000 b | 2,066,520 |
| Puerto Rico Aqueduct and Sewer | | | | |
| Authority, Senior Lien Revenue | 6.00 | 7/1/38 | 2,000,000 | 2,014,540 |
| Puerto Rico Aqueduct and Sewer | | | | |
| Authority, Senior Lien Revenue | | | | |
| (Insured; Assured Guaranty | | | | |
| Municipal Corp.) | 5.00 | 7/1/28 | 1,000,000 | 1,024,500 |
| Puerto Rico Commonwealth, | | | | |
| Public Improvement GO | 5.25 | 7/1/14 | 1,000,000 | 1,050,070 |
| Puerto Rico Commonwealth, | | | | |
| Public Improvement GO | | | | |
| (Prerefunded) | 5.25 | 7/1/16 | 1,180,000 b | 1,413,510 |
| Puerto Rico Electric Power | | | | |
| Authority, Power Revenue | 5.50 | 7/1/38 | 1,500,000 | 1,478,655 |
| Puerto Rico Infrastructure | | | | |
| Financing Authority, Special | | | | |
| Tax Revenue | 5.00 | 7/1/46 | 1,000,000 | 892,290 |
| Total Long-Term Municipal Investments | | | |
| (cost $145,403,991) | | | | 148,967,472 |
16
| | | | |
| Short-Term Municipal | Coupon | Maturity | Principal | |
| Investment—.7% | Rate (%) | Date | Amount ($) | Value ($) |
| New York; | | | | |
| New York City, | | | | |
| GO Notes (LOC; JPMorgan | | | | |
| Chase Bank) | | | | |
| (cost $1,000,000) | 0.22 | 12/1/09 | 1,000,000 d | 1,000,000 |
| |
| Total Investments (cost $146,403,991) | | | 98.9% | 149,967,472 |
| Cash and Receivables (Net) | | | 1.1% | 1,620,066 |
| Net Assets | | | 100.0% | 151,587,538 |
|
| a At November 30, 2009, the fund had $44,357,281 or 29.3% of net assets invested in securities whose payment of |
| principal and interest is dependent upon revenues generated from education. |
| b These securities are prerefunded; the date shown represents the prerefunded date. Bonds which are prerefunded are |
| collateralized by U.S. Government securities which are held in escrow and are used to pay principal and interest on |
| the municipal issue and to retire the bonds in full at the earliest refunding date. |
| c Purchased on a delayed delivery basis. |
| d Variable rate demand note—rate shown is the interest rate in effect at November 30, 2009. Maturity date represents |
| the next demand date, or the ultimate maturity date if earlier. |
The Fund 17
STATEMENT OF INVESTMENTS (continued)
| | | |
| Summary of Abbreviations | | |
| |
| ABAG | Association of Bay Area Governments | ACA | American Capital Access |
| AGC | ACE Guaranty Corporation | AGIC | Asset Guaranty Insurance Company |
| AMBAC | American Municipal Bond | ARRN | Adjustable Rate Receipt Notes |
| | Assurance Corporation | | |
| BAN | Bond Anticipation Notes | BPA | Bond Purchase Agreement |
| CIFG | CDC Ixis Financial Guaranty | COP | Certificate of Participation |
| CP | Commercial Paper | EDR | Economic Development Revenue |
| EIR | Environmental Improvement Revenue | FGIC | Financial Guaranty Insurance |
| | | | Company |
| FHA | Federal Housing Administration | FHLB | Federal Home Loan Bank |
| FHLMC | Federal Home Loan Mortgage | FNMA | Federal National |
| | Corporation | | Mortgage Association |
| GAN | Grant Anticipation Notes | GIC | Guaranteed Investment Contract |
| GNMA | Government National | GO | General Obligation |
| | Mortgage Association | | |
| HR | Hospital Revenue | IDB | Industrial Development Board |
| IDC | Industrial Development Corporation | IDR | Industrial Development Revenue |
| LOC | Letter of Credit | LOR | Limited Obligation Revenue |
| LR | Lease Revenue | MFHR | Multi-Family Housing Revenue |
| MFMR | Multi-Family Mortgage Revenue | PCR | Pollution Control Revenue |
| PILOT | Payment in Lieu of Taxes | RAC | Revenue Anticipation Certificates |
| RAN | Revenue Anticipation Notes | RAW | Revenue Anticipation Warrants |
| RRR | Resources Recovery Revenue | SAAN | State Aid Anticipation Notes |
| SBPA | Standby Bond Purchase Agreement | SFHR | Single Family Housing Revenue |
| SFMR | Single Family Mortgage Revenue | SONYMA State of New York Mortgage Agency |
| SWDR | Solid Waste Disposal Revenue | TAN | Tax Anticipation Notes |
| TAW | Tax Anticipation Warrants | TRAN | Tax and Revenue Anticipation Notes |
18
| | | | | |
| Summary of Combined Ratings (Unaudited) | |
| |
| Fitch | or | Moody’s | or | Standard & Poor’s | Value (%)† |
| AAA | | Aaa | | AAA | 29.7 |
| AA | | Aa | | AA | 29.5 |
| A | | A | | A | 23.4 |
| BBB | | Baa | | BBB | 13.3 |
| BB | | Ba | | BB | 1.4 |
| F1 | | MIG1/P1 | | SP1/A1 | .7 |
| Not Ratede | | Not Ratede | | Not Ratede | 2.0 |
| | | | | | 100.0 |
| |
| † | Based on total investments. |
| e | Securities which, while not rated by Fitch, Moody’s and Standard & Poor’s, have been determined by the Manager to |
| | be of comparable quality to those rated securities in which the fund may invest. |
| See notes to financial statements. |
The Fund 19
STATEMENT OF ASSETS AND LIABILITIES
November 30, 2009
| | | | |
| | | | Cost | Value |
| Assets ($): | | | | |
| Investments in securities—See Statement of Investments | 146,403,991 | 149,967,472 |
| Cash | | | | 1,663,356 |
| Interest receivable | | | | 2,314,625 |
| Receivable for investment securities sold | | | 2,129,260 |
| Receivable for shares of Beneficial Interest subscribed | | 12,423 |
| Prepaid expenses | | | | 28,316 |
| | | | | 156,115,452 |
| Liabilities ($): | | | | |
| Due to The Dreyfus Corporation and affiliates—Note 3(c) | | 116,204 |
| Payable for investment securities purchased | | | 4,264,040 |
| Payable for shares of Beneficial Interest redeemed | | | 81,125 |
| Accrued expenses | | | | 66,545 |
| | | | | 4,527,914 |
| Net Assets ($) | | | | 151,587,538 |
| Composition of Net Assets ($): | | | |
| Paid-in capital | | | | 150,517,380 |
| Accumulated net realized gain (loss) on investments | | | (2,493,323) |
| Accumulated net unrealized appreciation | | | |
| (depreciation) on investments | | | | 3,563,481 |
| Net Assets ($) | | | | 151,587,538 |
| |
| |
| Net Asset Value Per Share | | | |
| | Class A | Class B | Class C | Class I |
| Net Assets ($) | 135,625,500 | 1,633,365 | 13,031,224 | 1,297,449 |
| Shares Outstanding | 9,494,410 | 114,343 | 912,257 | 90,833 |
| Net Asset Value Per Share ($) | 14.28 | 14.28 | 14.28 | 14.28 |
| |
| See notes to financial statements. | | | | |
20
| |
| STATEMENT OF OPERATIONS | |
| Year Ended November 30, 2009 | |
| |
| |
| |
| |
| Investment Income ($): | |
| Interest Income | 7,359,568 |
| Expenses: | |
| Management fee—Note 3(a) | 801,798 |
| Shareholder servicing costs—Note 3(c) | 454,117 |
| Distribution fees—Note 3(b) | 101,240 |
| Professional fees | 98,683 |
| Registration fees | 52,116 |
| Custodian fees—Note 3(c) | 20,219 |
| Prospectus and shareholders’ reports | 16,450 |
| Trustees’ fees and expenses—Note 3(d) | 8,789 |
| Loan commitment fees—Note 2 | 2,435 |
| Interest expense—Note 2 | 19 |
| Miscellaneous | 30,629 |
| Total Expenses | 1,586,495 |
| Less—reduction in expenses due to undertaking—Note 3(a) | (239,832) |
| Less—reduction in fees due to earnings credits—Note 1(b) | (3,657) |
| Net Expenses | 1,343,006 |
| Investment Income—Net | 6,016,562 |
| Realized and Unrealized Gain (Loss) on Investments—Note 4 ($): | |
| Net realized gain (loss) on investments | (1,480,006) |
| Net unrealized appreciation (depreciation) on investments | 15,684,951 |
| Net Realized and Unrealized Gain (Loss) on Investments | 14,204,945 |
| Net Increase in Net Assets Resulting from Operations | 20,221,507 |
| |
| See notes to financial statements. | |
The Fund 21
STATEMENT OF CHANGES IN NET ASSETS
| | |
| | Year Ended November 30, |
| | 2009a | 2008 |
| Operations ($): | | |
| Investment income—net | 6,016,562 | 5,895,816 |
| Net realized gain (loss) on investments | (1,480,006) | (968,461) |
| Net unrealized appreciation | | |
| (depreciation) on investments | 15,684,951 | (14,893,339) |
| Net Increase (Decrease) in Net Assets | | |
| Resulting from Operations | 20,221,507 | (9,965,984) |
| Dividends to Shareholders from ($): | | |
| Investment income—net: | | |
| Class A Shares | (5,497,423) | (5,288,112) |
| Class B Shares | (116,713) | (301,684) |
| Class C Shares | (391,303) | (303,694) |
| Class I Shares | (3,615) | — |
| Net realized gain on investments: | | |
| Class A Shares | — | (539,085) |
| Class B Shares | — | (40,258) |
| Class C Shares | — | (34,365) |
| Total Dividends | (6,009,054) | (6,507,198) |
| Beneficial Interest Transactions ($): | | |
| Net proceeds from shares sold: | | |
| Class A Shares | 22,628,424 | 42,287,369 |
| Class B Shares | 49,798 | 283,906 |
| Class C Shares | 3,306,736 | 4,843,462 |
| Class I Shares | 1,290,978 | — |
| Dividends reinvested: | | |
| Class A Shares | 4,371,587 | 4,560,479 |
| Class B Shares | 84,295 | 231,544 |
| Class C Shares | 282,900 | 243,844 |
| Cost of shares redeemed: | | |
| Class A Shares | (32,272,319) | (39,050,221) |
| Class B Shares | (4,843,330) | (4,860,234) |
| Class C Shares | (1,540,974) | (2,125,649) |
| Increase (Decrease) in Net Assets from | | |
| Beneficial Interest Transactions | (6,641,905) | 6,414,500 |
| Total Increase (Decrease) in Net Assets | 7,570,548 | (10,058,682) |
| Net Assets ($): | | |
| Beginning of Period | 144,016,990 | 154,075,672 |
| End of Period | 151,587,538 | 144,016,990 |
22
| | |
| | Year Ended November 30, |
| | 2009a | 2008 |
| Capital Share Transactions: | | |
| Class Ab | | |
| Shares sold | 1,663,892 | 3,013,815 |
| Shares issued for dividends reinvested | 317,643 | 328,115 |
| Shares redeemed | (2,396,738) | (2,782,324) |
| Net Increase (Decrease) in Shares Outstanding | (415,203) | 559,606 |
| Class Bb | | |
| Shares sold | 3,616 | 20,159 |
| Shares issued for dividends reinvested | 6,194 | 16,568 |
| Shares redeemed | (359,256) | (345,675) |
| Net Increase (Decrease) in Shares Outstanding | (349,446) | (308,948) |
| Class C | | |
| Shares sold | 238,691 | 341,748 |
| Shares issued for dividends reinvested | 20,528 | 17,559 |
| Shares redeemed | (111,436) | (151,893) |
| Net Increase (Decrease) in Shares Outstanding | 147,783 | 207,414 |
| Class I | | |
| Shares sold | 90,833 | — |
| Net Increase (Decrease) in Shares Outstanding | 90,833 | — |
| |
| a | From December 15, 2008 (commencement of initial offering) to November 30, 2009 for Class I shares. |
| b | During the period ended November 30, 2009, 147,629 Class B shares representing $1,982,428, were |
| | automatically converted to 147,629 Class A shares and during the period ended November 30, 2008, 131,525 |
| | Class B shares representing $1,866,412 were automatically converted to 131,516 Class A shares. |
| See notes to financial statements. |
The Fund 23
FINANCIAL HIGHLIGHTS
The following tables describe the performance for each share class for the fiscal periods indicated.All information (except portfolio turnover rate) reflects financial results for a single fund share.Total return shows how much your investment in the fund would have increased (or decreased) during each period, assuming you had reinvested all dividends and distributions.These figures have been derived from the fund’s financial statements.
| | | | | |
| | | Year Ended November 30, | |
| Class A Shares | 2009 | 2008 | 2007 | 2006 | 2005 |
| Per Share Data ($): | | | | | |
| Net asset value, beginning of period | 12.93 | 14.43 | 14.88 | 14.80 | 15.00 |
| Investment Operations: | | | | | |
| Investment income—neta | .58 | .56 | .57 | .57 | .56 |
| Net realized and unrealized | | | | | |
| gain (loss) on investments | 1.35 | (1.44) | (.42) | .33 | (.17) |
| Total from Investment Operations | 1.93 | (.88) | .15 | .90 | .39 |
| Distributions: | | | | | |
| Dividends from investment income—net | (.58) | (.56) | (.57) | (.58) | (.56) |
| Dividends from net realized | | | | | |
| gain on investments | — | (.06) | (.03) | (.24) | (.03) |
| Total Distributions | (.58) | (.62) | (.60) | (.82) | (.59) |
| Net asset value, end of period | 14.28 | 12.93 | 14.43 | 14.88 | 14.80 |
| Total Return (%)b | 15.15 | (6.36) | 1.06 | 6.25 | 2.58 |
| Ratios/Supplemental Data (%): | | | | | |
| Ratio of total expenses | | | | | |
| to average net assets | 1.02 | .98 | 1.00 | .98 | .98 |
| Ratio of net expenses | | | | | |
| to average net assets | .85 | .86 | .89 | .88 | .96 |
| Ratio of net investment income | | | | | |
| to average net assets | 4.20 | 3.97 | 3.93 | 3.94 | 3.70 |
| Portfolio Turnover Rate | 13.34 | 32.04 | 17.81 | 30.45 | 52.26 |
| Net Assets, end of period ($ x 1,000) | 135,626 | 128,135 | 134,892 | 142,631 | 144,978 |
| |
| a | Based on average shares outstanding at each month end. |
| b | Exclusive of sales charge. |
| See notes to financial statements. |
24
| | | | | |
| | | Year Ended November 30, | |
| Class B Shares | 2009 | 2008 | 2007 | 2006 | 2005 |
| Per Share Data ($): | | | | | |
| Net asset value, beginning of period | 12.93 | 14.43 | 14.88 | 14.79 | 15.00 |
| Investment Operations: | | | | | |
| Investment income—neta | .48 | .49 | .49 | .50 | .48 |
| Net realized and unrealized | | | | | |
| gain (loss) on investments | 1.37 | (1.44) | (.41) | .33 | (.18) |
| Total from Investment Operations | 1.85 | (.95) | .08 | .83 | .30 |
| Distributions: | | | | | |
| Dividends from investment income—net | (.50) | (.49) | (.50) | (.50) | (.48) |
| Dividends from net realized | | | | | |
| gain on investments | — | (.06) | (.03) | (.24) | (.03) |
| Total Distributions | (.50) | (.55) | (.53) | (.74) | (.51) |
| Net asset value, end of period | 14.28 | 12.93 | 14.43 | 14.88 | 14.79 |
| Total Return (%)b | 14.55 | (6.79) | .53 | 5.71 | 2.06 |
| Ratios/Supplemental Data (%): | | | | | |
| Ratio of total expenses | | | | | |
| to average net assets | 1.62 | 1.52 | 1.53 | 1.50 | 1.50 |
| Ratio of net expenses | | | | | |
| to average net assets | 1.35 | 1.36 | 1.39 | 1.38 | 1.48 |
| Ratio of net investment income | | | | | |
| to average net assets | 3.76 | 3.49 | 3.41 | 3.43 | 3.19 |
| Portfolio Turnover Rate | 13.34 | 32.04 | 17.81 | 30.45 | 52.26 |
| Net Assets, end of period ($ x 1,000) | 1,633 | 5,997 | 11,147 | 19,390 | 24,710 |
| |
| a | Based on average shares outstanding at each month end. |
| b | Exclusive of sales charge. |
| See notes to financial statements. |
The Fund 25
FINANCIAL HIGHLIGHTS (continued)
| | | | | |
| | | Year Ended November 30, | |
| Class C Shares | 2009 | 2008 | 2007 | 2006 | 2005 |
| Per Share Data ($): | | | | | |
| Net asset value, beginning of period | 12.93 | 14.43 | 14.88 | 14.80 | 15.00 |
| Investment Operations: | | | | | |
| Investment income—neta | .47 | .45 | .46 | .47 | .44 |
| Net realized and unrealized | | | | | |
| gain (loss) on investments | 1.35 | (1.44) | (.42) | .32 | (.17) |
| Total from Investment Operations | 1.82 | (.99) | .04 | .79 | .27 |
| Distributions: | | | | | |
| Dividends from investment income—net | (.47) | (.45) | (.46) | (.47) | (.44) |
| Dividends from net realized | | | | | |
| gain on investments | — | (.06) | (.03) | (.24) | (.03) |
| Total Distributions | (.47) | (.51) | (.49) | (.71) | (.47) |
| Net asset value, end of period | 14.28 | 12.93 | 14.43 | 14.88 | 14.80 |
| Total Return (%)b | 14.29 | (7.07) | .30 | 5.46 | 1.81 |
| Ratios/Supplemental Data (%): | | | | | |
| Ratio of total expenses | | | | | |
| to average net assets | 1.77 | 1.73 | 1.75 | 1.74 | 1.73 |
| Ratio of net expenses | | | | | |
| to average net assets | 1.60 | 1.61 | 1.64 | 1.63 | 1.71 |
| Ratio of net investment income | | | | | |
| to average net assets | 3.43 | 3.22 | 3.16 | 3.19 | 2.95 |
| Portfolio Turnover Rate | 13.34 | 32.04 | 17.81 | 30.45 | 52.26 |
| Net Assets, end of period ($ x 1,000) | 13,031 | 9,885 | 8,036 | 6,553 | 7,552 |
| |
| a | Based on average shares outstanding at each month end. |
| b | Exclusive of sales charge. |
| See notes to financial statements. |
26
| |
| | Period Ended |
| Class I Shares | November 30, 2009a |
| Per Share Data ($): | |
| Net asset value, beginning of period | 12.29 |
| Investment Operations: | |
| Investment income—netb | .47 |
| Net realized and unrealized gain (loss) on investments | 2.09 |
| Total from Investment Operations | 2.56 |
| Distributions: | |
| Dividends from investment income—net | (.57) |
| Net asset value, end of period | 14.28 |
| Total Return (%) | 21.06c |
| Ratios/Supplemental Data (%): | |
| Ratio of total expenses to average net assets | .86d |
| Ratio of net expenses to average net assets | .75d |
| Ratio of net investment income to average net assets | 4.11d |
| Portfolio Turnover Rate | 13.34 |
| Net Assets, end of period ($ x 1,000) | 1,297 |
| |
| a | From December 15, 2008 (commencement of initial offering) to November 30, 2009. |
| b | Based on average shares outstanding at each month end. |
| c | Not annualized. |
| d | Annualized. |
| See notes to financial statements. |
The Fund 27
NOTES TO FINANCIAL STATEMENTS
NOTE 1—Significant Accounting Policies:
Dreyfus New York AMT-Free Municipal Bond Fund (the “fund”) is registered under the Investment Company Act of 1940, as amended (the “Act”), as a non-diversified open-end management investment company. The fund’s investment objective is to maximize current income exempt from federal, New York state and New York city personal income taxes to the extent consistent with the preservation of capital. The Dreyfus Corporation (the “Manager” or “Dreyfus”), a wholly-owned subsidiary of The Bank of New York Mellon Corporation (“BNY Mellon”), serves as the fund’s investment adviser.
On November 3, 2008, the Board of Trustees approved, effective December 15, 2008, adding Class I shares.
MBSC Securities Corporation (the “Distributor”), a wholly-owned subsidiary of Dreyfus, is the distributor of the fund’s shares.The fund is authorized to issue an unlimited number of $.001 par value shares of Beneficial Interest in the following classes of shares: Class A, Class B, Class C and Class I. Class A, Class B and Class C shares are sold primarily to retail investors through financial intermediaries and bear a distribution fee and/or service fee. Class A shares are sold with a front-end sales charge, while Class B and Class C shares are subject to a contingent deferred sales charge (“CDSC”). Class B shares automatically convert to Class A shares after six years. The fund does not offer Class B shares, except in connection with dividend re-investment and permitted exchanges of Class B shares.Class I shares are sold primarily to bank trust departments and other financial service providers (includi ng The Bank of New York Mellon, a subsidiary of BNY Mellon and an affiliate of Dreyfus) acting on behalf of customers having a qualified trust or investment account or relationship at such institution, and bear no distribution or service fees. Class I shares are offered without a front-end sales charge or contingent deferred sales charge (“CDSC”). Each class of shares has identical rights and privileges, except with respect to distribution and service fees, the allocation of certain transfer agency costs and voting rights on matters affecting a single class. Income, expenses (other than expenses attributable to a specific class), and realized and unrealized
28
gains or losses on investments are allocated to each class of shares based on its relative net assets.
The Financial Accounting Standards Board (“FASB”) Accounting Standards Codification (“ASC”) has become the exclusive reference of authoritative U.S. generally accepted accounting principles (“GAAP”) recognized by the FASB to be applied by nongovernmental entities. Rules and interpretive releases of the Securities and Exchange Commission (“SEC”) under authority of federal laws are also sources of authoritative GAAP for SEC registrants. The ASC has superseded all existing non-SEC accounting and reporting standards. The fund’s financial statements are prepared in accordance with GAAP, which may require the use of management estimates and assumptions.Actual results could differ from those estimates.
The fund enters into contracts that contain a variety of indemnifications. The fund’s maximum exposure under these arrangements is unknown.The fund does not anticipate recognizing any loss related to these arrangements.
(a) Portfolio valuation: Investments in securities are valued each business day by an independent pricing service (the “Service”) approved by the Board of Trustees. Investments for which quoted bid prices are readily available and are representative of the bid side of the market in the judgment of the Service are valued at the mean between the quoted bid prices (as obtained by the Service from dealers in such securities) and asked prices (as calculated by the Service based upon its evaluation of the market for such securities). Other investments (which constitute a majority of the portfolio securities) are carried at fair value as determined by the Service, based on methods which include consideration of: yields or prices of municipal securities of comparable quality, coupon, maturity and type; indications as to values from dealers; and gener al market conditions. Options and financial futures on municipal and U.S.Treasury securities are valued at the last sales price on the securities exchange on which such securities are primarily traded or at the last sales price on the national securities market on each business day.
The Fund 29
NOTES TO FINANCIAL STATEMENTS (continued)
The fair value of a financial instrument is the amount that would be received to sell an asset or paid to transfer a liability in an orderly transaction between market participants at the measurement date (i.e. the exit price). GAAP establishes a fair value hierarchy that prioritizes the inputs of valuation techniques used to measure fair value.This hierarchy gives the highest priority to unadjusted quoted prices in active markets for identical assets or liabilities (Level 1 measurements) and the lowest priority to unobservable inputs (Level 3 measurements).
Additionally, GAAP provides guidance on determining whether the volume and activity in a market has decreased significantly and whether such a decrease in activity results in transactions that are not orderly. GAAP requires enhanced disclosures around valuation inputs and techniques used during annual and interim periods.
Various inputs are used in determining the value of the fund’s investments relating to fair value measurements.These inputs are summarized in the three broad levels listed below:
Level 1—unadjusted quoted prices in active markets for identical investments.
Level 2—other significant observable inputs (including quoted prices for similar investments, interest rates, prepayment speeds, credit risk, etc.).
Level 3—significant unobservable inputs (including the fund’s own assumptions in determining the fair value of investments).
The inputs or methodology used for valuing securities are not necessarily an indication of the risk associated with investing in those securities.
The following is a summary of the inputs used as of November 30, 2009 in valuing the fund’s investments:
| | | | |
| | Level 1— | Level 2—Other | Level 3— | |
| | Unadjusted | Significant | Significant | |
| | Quoted | Observable | Unobservable | |
| | Prices | Inputs | Inputs | Total |
| Assets ($) | | | | |
| Investments in Securities: | | | |
| Municipal Bonds | — | 149,967,472 | — | 149,967,472 |
30
(b) Securities transactions and investment income: Securities transactions are recorded on a trade date basis. Realized gains and losses from securities transactions are recorded on the identified cost basis. Interest income, adjusted for accretion of discount and amortization of premium on investments, is earned from settlement date and recognized on the accrual basis.
The fund has arrangements with the custodian and cash management bank whereby the fund may receive earnings credits when positive cash balances are maintained, which are used to offset custody and cash management fees. For financial reporting purposes, the fund includes net earnings credits as an expense offset in the Statement of Operations.
The fund follows an investment policy of investing primarily in municipal obligations of one state. Economic changes affecting the state and certain of its public bodies and municipalities may affect the ability of issuers within the state to pay interest on, or repay principal of, municipal obligations held by the fund.
(c) Dividends to shareholders: It is the policy of the fund to declare dividends daily from investment income-net; such dividends are paid monthly. Dividends from net realized capital gains, if any, are normally declared and paid annually, but the fund may make distributions on a more frequent basis to comply with the distribution requirements of the Internal Revenue Code of 1986, as amended (the “Code”).To the extent that net realized capital gains can be offset by capital loss carryovers, it is the policy of the fund not to distribute such gains. Income and capital gain distributions are determined in accordance with income tax regulations, which may differ from GAAP.
(d) Federal income taxes: It is the policy of the fund to continue to qualify as a regulated investment company, which can distribute tax exempt dividends, by complying with the applicable provisions of the Code, and to make distributions of income and net realized capital gain sufficient to relieve it from substantially all federal income and excise taxes.
The Fund 31
NOTES TO FINANCIAL STATEMENTS (continued)
As of and during the period ended November 30, 2009, the fund did not have any liabilities for any uncertain tax positions.The fund recognizes interest and penalties, if any, related to uncertain tax positions as income tax expense in the Statement of Operations. During the period, the fund did not incur any interest or penalties.
Each of the tax years in the four-year period ended November 30, 2009 remains subject to examination by the Internal Revenue Service and state taxing authorities.
At November 30, 2009, the components of accumulated earnings on a tax basis were as follows: undistributed tax exempt income $34,976, accumulated capital losses $2,503,157 and unrealized appreciation $3,573,315.
The accumulated capital loss carryover is available for federal income tax purposes to be applied against future net securities profits, if any, realized subsequent to November 30, 2009. If not applied, $1,023,151 of the carryover expires in fiscal 2016 and $1,480,006 expires in fiscal 2017.
The tax character of distributions paid to shareholders during the fiscal periods ended November 30, 2009 and November 30, 2008 were as follows: tax exempt income $6,009,054 and $5,894,117 and long-term capital gains $0 and $613,081, respectively.
During the period ended November 30, 2009, as a result of permanent book to tax differences, primarily due to the tax treatment for amortization adjustments, the fund decreased accumulated undistributed investment income-net by $7,508 and increased accumulated net realized gain (loss) on investments by the same amount. Net assets and net asset value per share were not affected by this reclassification.
NOTE 2—Bank Lines of Credit:
The fund participated with other Dreyfus-managed funds in a $145 million unsecured credit facility led by Citibank, N.A. and a $300 million unsecured credit facility provided by The Bank of New York Mellon, a subsidiary of BNY Mellon and an affiliate of Dreyfus, (each, a “Facility”), each to be utilized primarily for temporary or emergency
32
purposes, including the financing of redemptions. Effective October 14, 2009,the $145 million unsecured credit facility with Citibank,N.A.,was increased to $215 million and effective December 10, 2009, was further increased to $225 million.The fund continues participation in the $300 million unsecured credit facility provided by The Bank of New York Mellon. In connection therewith, the fund has agreed to pay its pro rata portion of commitment fees for each Facility. Interest is charged to the fund based on rates determined pursuant to the terms of the respective Facility at the time of borrowing.
The average amount of borrowings outstanding under the Facilities during the period ended November 30, 2009 was approximately $1,400, with a related weighted average annualized interest rate of 1.37%.
NOTE 3—Management Fee and Other Transactions With Affiliates:
(a) Pursuant to a management agreement with the Manager, the management fee is computed at the annual rate of .55% of the value of the fund’s average daily net assets and is payable monthly.The Manager has agreed, until January 31, 2011, to waive receipt of its fees and/or assume the expenses of the fund’s Class A shares so that the expenses (exclusive of taxes, brokerage fees, interest on borrowings, commitment fees and extraordinary expenses) do not exceed .85% of the value of the fund’s average daily net assets. The reduction in expenses, pursuant to the undertaking amounted to $213,377 during the period ended November 30, 2009.The Manager has also agreed, until April 1, 2010, to waive receipt of its fees and/or assume the expenses of the fund’s Class B and Class C shares so that the expenses (exclusive of Rule 12b-1 fees, shareh older services fees and certain expense as described above) do not exceed .60% of the value of such class’ average daily net assets. The reduction in expenses, pursuant to the undertaking amounted to $26,390 during the period ended November 30, 2009. The Manager had undertaken from December 15, 2008 through November 30, 2009 to reduce the expenses paid by Class I shares, to the extent that Class I shares aggregate annual expenses, exclusive of certain expenses as
The Fund 33
NOTES TO FINANCIAL STATEMENTS (continued)
described above, exceed an annual rate of .75% of the value of the average daily net assets of Class I shares. The reduction in expenses for Class I shares, pursuant to the undertaking amounted to $65 during the period ended November 30, 2009.
During the period ended November 30, 2009, the Distributor retained $10,458 from commissions earned on sales of the fund’s Class A shares and $13,577 and $6,829 from CDSCs on redemptions of the fund’s Class B and Class C shares, respectively.
(b) Under the Distribution Plan (the “Plan”) adopted pursuant to Rule 12b-1 under the Act, Class B and Class C shares pay the Distributor for distributing their shares at an annual rate of .50% of the value of the average daily net assets of Class B shares and .75% of the value of the average daily net assets of Class C shares. During the period ended November 30, 2009, Class B and Class C shares were charged $15,552 and $85,688, respectively, pursuant to the Plan.
(c) Under the Shareholder Services Plan, Class A, Class B and Class C shares pay the Distributor at an annual rate of .25% of the value of their average daily net assets for the provision of certain services.The services provided may include personal services relating to shareholder accounts, such as answering shareholder inquiries regarding the fund and providing reports and other information, and services related to the maintenance of shareholder accounts.The Distributor may make payments to Service Agents (a securities dealer, financial institution or other industry professional) in respect of these services.The Distributor determines the amounts to be paid to Service Agents. During the period ended November 30, 2009, Class A, Class B and Class C shares were charged $327,895, $7,776 and $28,563, respectively, pursuant to the Shareholder Services Pla n.
The fund compensates Dreyfus Transfer, Inc., a wholly-owned subsidiary of the Manager, under a transfer agency agreement for providing personnel and facilities to perform transfer agency services for the fund. During the period ended November 30, 2009, the fund was
34
charged $39,249 pursuant to the transfer agency agreement, which is included in Shareholder servicing costs in the Statement of Operations.
The fund compensates The Bank of New York Mellon under a cash management agreement for performing cash management services related to fund subscriptions and redemptions. During the period ended November 30, 2009, the fund was charged $3,657 pursuant to the cash management agreement, which is included in Shareholder servicing costs in the Statement of Operations.These fees were offset by earnings credits pursuant to the cash management agreement.
The fund also compensates The Bank of New York Mellon under a custody agreement for providing custodial services for the fund. During the period ended November 30, 2009, the fund was charged $20,219 pursuant to the custody agreement.
During the period ended November 30, 2009, the fund was charged $6,539 for services performed by the Chief Compliance Officer.
The components of “Due to The Dreyfus Corporation and affiliates” in the Statement of Assets and Liabilities consist of: management fees $68,308, Rule 12b-1 distribution plan fees $8,624, shareholder services plan fees $30,853, custody fees $4,923, chief compliance officer fees $4,454 and transfer agency per account fees $10,155, which are offset against an expense reimbursement currently in effect in the amount of $11,113.
(d) Each Board member also serves as a Board member of other funds within the Dreyfus complex. Annual retainer fees and attendance fees are allocated to each fund based on net assets.
NOTE 4—Securities Transactions:
The aggregate amount of purchases and sales of investment securities, excluding short-term securities, during the period ended November 30, 2009, amounted to $18,964,321 and $21,653,323, respectively.
The Fund 35
NOTES TO FINANCIAL STATEMENTS (continued)
The fund adopted the provisions of ASC Topic 815 “Derivatives and Hedging” which requires qualitative disclosures about objectives and strategies for using derivatives, quantitative disclosures about fair value amounts of gains and losses on derivative instruments and disclosures about credit-risk-related contingent features in derivative agreements. The fund held no derivatives during the period ended November 30, 2009. These disclosures did not impact the notes to the financial statements.
At November 30, 2009, the cost of investments for federal income tax purposes was $146,394,157; accordingly, accumulated net unrealized appreciation on investments was $3,573,315, consisting of $5,302,141 gross unrealized appreciation and $1,728,826 gross unrealized depreciation.
NOTE 5—Plan of Reorganization
At a meeting of the Board of Trustees of the fund held on July 21, 2009, the Board approved an Agreement and Plan of Reorganization between the fund and General NewYork Municipal Bond Fund (the “Acquired Fund”), providing for the transfer of all of the assets of the Acquired Fund to the fund as part of a tax-free reorganization.The merger, which was approved by the Acquired Fund’s shareholders on December 29, 2009, currently is anticipated to occur on or about January 21, 2010. On that date, the Acquired Fund’s shareholders will receive Class A shares of the fund in an amount equal to the aggregate net asset value, subject to liabilities, of their investment in the Acquired Fund at the time of the exchange.
NOTE 6—Subsequent Events Evaluation:
Dreyfus has evaluated the need for disclosures and/or adjustments resulting from subsequent events through January 27, 2010, the date the financial statements were issued. This evaluation did not result in any subsequent events that necessitated disclosures and/or adjustments other than the increase in the Citibank, N.A. Facility to $225 million as noted in Note 2.
36
|
| REPORT OF INDEPENDENT REGISTERED |
| PUBLIC ACCOUNTING FIRM |
Shareholders and Board of Trustees
Dreyfus New York AMT-Free Municipal Bond Fund
We have audited the accompanying statement of assets and liabilities of Dreyfus New York AMT-Free Municipal Bond Fund, including the statement of investments, as of November 30,2009, and the related statement of operations for the year then ended, the statement of changes in net assets for each of the two years in the period then ended and financial highlights for each of the periods indicated therein.These financial statements and financial highlights are the responsibility of the Fund’s management. Our responsibility is to express an opinion on these financial statements and financial highlights based on our audits.
We conducted our audits in accordance with the standards of the Public Company Accounting Oversight Board (United States).Those standards require that we plan and perform the audit to obtain reasonable assurance about whether the financial statements and financial highlights are free of material misstatement.We were not engaged to perform an audit of the Fund’s internal control over financial reporting. Our audits included consideration of internal control over financial reporting as a basis for designing audit procedures that are appropriate in the circumstances, but not for the purpose of expressing an opinion on the effectiveness of the Fund’s internal control over financial reporting. Accordingly, we express no such opinion.An audit also includes examining, on a test basis, evidence supporting the amounts and disclosures in the financial statements and financial highlights, assessing the accounting principles used and significant estimates made by management, and evaluating the overall financial statement presentation. Our procedures included confirmation of securities owned as of November 30, 2009 by correspondence with the custodian and others.We believe that our audits provide a reasonable basis for our opinion.
In our opinion, the financial statements and financial highlights referred to above present fairly, in all material respects, the financial position of Dreyfus NewYork AMT-Free Municipal Bond Fund at November 30, 2009, the results of its operations for the year then ended, the changes in its net assets for each of the two years in the period then ended, and the financial highlights for each of the indicated periods, in conformity with U.S. generally accepted accounting principles.

New York, New York January 27, 2010
The Fund 37
IMPORTANT TAX INFORMATION (Unaudited)
In accordance with federal tax law, the fund hereby designates all the dividends paid from investment income-net during the fiscal year ended November 30, 2009 as “exempt-interest dividends” (not subject to regular federal income tax, and for individuals who are New York residents, New York state and New York city personal income taxes). Where required by federal tax law rules, shareholders will receive notification of their portion of the fund’s taxable ordinary dividends (if any) and capital gains distributions (if any) paid for the 2009 calendar year on Form 1099-DIV and their portion of the fund’s exempt-interest dividends paid for the 2009 calendar year on Form 1099-INT, both of which will be mailed in early 2010.
38
|
| INFORMATION ABOUT THE REVIEW AND APPROVAL |
| OF THE FUND’S MANAGEMENT AGREEMENT (Unaudited) |
At a meeting of the Board of Trustees held on July 21, 2009, the Board considered the re-approval for an annual period of the fund’s Management Agreement, pursuant to which the Manager provides the fund with investment advisory and administrative services. The Board members, none of whom are “interested persons” (as defined in the Investment Company Act of 1940, as amended) of the fund, were assisted in their review by independent legal counsel and met with counsel in executive session separate from representatives of the Manager.
Analysis of Nature, Extent and Quality of Services Provided to the Fund.The Board members considered information previously provided to them in a presentation from representatives of the Manager regarding services provided to the fund and other funds in the Dreyfus fund complex, and representatives of the Manager confirmed that there had been no material changes in this information.The Board also discussed the nature, extent and quality of the services provided to the fund pursuant to its Management Agreement. The Manager’s representatives reviewed the fund’s distribution of accounts and the relationships the Manager has with various intermediaries and the different needs of each.The Manager’s representatives noted the distribution channels for the fund as well as the diversity of distribution among the funds in the Dreyfus fund complex, and the Manager’s corresponding need for broad, deep, and diverse resources to be able to provide ongoing shareholder services in each distribution channel, including those of the fund.The Manager provided the number of shareholder accounts in the fund, as well as the fund’s asset size.
The Board members also considered the Manager’s research and portfolio management capabilities and that the Manager also provides oversight of day-to-day fund operations, including fund accounting and administration and assistance in meeting legal and regulatory requirements.The Board members also considered the Manager’s extensive administrative, accounting and compliance infrastructure.The Board also considered the Manager’s brokerage policies and practices and the standards applied in seeking best execution.
The Fund 39
|
| INFORMATION ABOUT THE REVIEW AND APPROVAL OF THE |
| FUND’S MANAGEMENT AGREEMENT (Unaudited) (continued) |
Comparative Analysis of the Fund’s Performance, Management Fee and Expense Ratio. The Board members reviewed the fund’s performance and comparisons to a group of comparable funds (the “Performance Group”) and to a broader group of funds (the “Performance Universe”), selected and provided by Lipper, Inc. (“Lipper”), an independent provider of investment company data.The Board was provided with a description of the methodology Lipper used to select the Performance Group and Performance Universe, as well as the Expense Group and Expense Universe (discussed below). The Board members discussed the results of the comparisons for the past ten one-year periods ended May 31 (2000-2009) and noted that the fund’s yield performance was below the Performance Group median for each reported time period, and equal to or above the Pe rformance Universe median for each reported time period, except the one-year periods ended May 31, 2003, 2004 and 2005.The Board members also noted that the fund’s total return performance for various periods ended May 31, 2009 was below the Performance Group median for each reported time period, and above the Performance Universe median for each reported time period except the two-year period ended May 31, 2009, when it was below the median. The Manager also provided a comparison of the fund’s calendar year total returns to the returns of its Lipper category average for the prior ten calendar years, and the Board members noted that the fund outperformed its Lipper category average in six of the last ten calendar years, including calendar years 2006, 2007 and 2008.The Board members discussed with representatives of the Manager the reasons for the fund’s underperformance compared to the Performance Group medians for the applicable periods, and the Manager’s efforts to improve performance.T he Board members also received a presentation from the fund’s primary portfolio manager during which he discussed the fund’s investment strategy and the factors that affected performance.
The Board members also discussed the fund’s contractual and actual management fee and total expense ratio as compared to a comparable group of funds (the “Expense Group”) that was composed of the same funds included in the Performance Group and a broader group of funds
40
(the “Expense Universe”), each selected and provided by Lipper. The Board noted that the fund’s contractual management fee was above the Expense Group median, and that the fund’s actual management fee was equal to the Expense Group median and below the Expense Universe median. The Board also noted that the fund’s total expense ratio was equal to the Expense Group median and above the Expense Universe median. The Board members also discussed the Manager’s current undertaking to waive fees and/or reimburse expenses, which representatives of the Manager stated would be extended.
Representatives of the Manager reviewed with the Board members the fees paid to the Manager or its affiliates by mutual funds managed by the Manager or its affiliates with similar investment objectives, policies and strategies, and included in the same category, as the fund (the “Similar Funds”).The Board members considered the relevance of the fee information provided for the Similar Funds to evaluate the appropriateness and reasonableness of the fund’s management fee.The Board acknowledged that differences in fees paid by the Similar Funds seemed to be consistent with the services provided. Representatives of the Manager informed the Board members that there were no separate accounts or wrap fee accounts managed by the Manager or its affiliates with similar investment objectives, policies and strategies as the fund.
Analysis of Profitability and Economies of Scale. The Manager’s representatives reviewed the dollar amount of expenses allocated and profit received by the Manager and the method used to determine such expenses and profit. The Board previously had been provided with information prepared by an independent consulting firm regarding the Manager’s approach to allocating costs to, and determining the profitability of, individual funds and the entire Dreyfus mutual fund com-plex.The Board members also had been informed that the methodology also had been reviewed by an independent registered public accounting firm which, like the consultant, found the methodology to be reasonable.The consulting firm also analyzed where any economies of scale might emerge in connection with the management of a fund.
The Fund 41
|
| INFORMATION ABOUT THE REVIEW AND APPROVAL OF THE |
| FUND’S MANAGEMENT AGREEMENT (Unaudited) (continued) |
The Board members evaluated the profitability analysis in light of the relevant circumstances for the fund, and the extent to which economies of scale would be realized if the fund grows and whether fee levels reflect these economies of scale for the benefit of fund shareholders.
The Board members also considered potential benefits to the Manager and its affiliates from acting as investment adviser to the fund and noted that there were no soft dollar arrangements with respect to trading the fund’s portfolio.
It was noted that the Board members should consider the Manager’s profitability with respect to the fund as part of their evaluation of whether the fees under the Management Agreement bear a reasonable relationship to the mix of services provided by the Manager, including the nature, extent and quality of such services and that a discussion of economies of scale is predicated on increasing assets and that, if a fund’s assets had been decreasing, the possibility that the Manager may have realized any economies of scale would be less. It was also noted that the profitability percentage for managing the fund was within the range determined by appropriate court cases to be reasonable given the services rendered and generally superior service levels provided by the Manager.The Board also noted the fee waiver and expense reimbursement arrangement and its effect on the Manager’s profitability.
At the conclusion of these discussions, the Board agreed that it had been furnished with sufficient information to make an informed business decision with respect to continuation of the fund’s Management Agreement. Based on the discussions and considerations as described above, the Board made the following conclusions and determinations.
42
The Board was concerned with the fund’s overall performance but was satisfied with fund’s performance relative to the Performance Universe and with the Manager’s efforts to improve performance as discussed at the meeting, noting the improvement in the fund’s yield performance relative to the Performance Group for the one-year period ended May 31, 2009.
The Board concluded that the fee paid to the Manager by the fund was reasonable in light of the services provided, comparative perfor- mance and expense and management fee information, including the extension of the Manager’s undertaking to waive or reimburse cer- tain fees and expenses of the fund, costs of the services provided, and profits to be realized and benefits derived or to be derived by the Manager from its relationship with the fund.
The Board determined that the economies of scale which may accrue to the Manager and its affiliates in connection with the management of the fund had been adequately considered by the Manager in con- nection with the management fee rate charged to the fund, and that, to the extent in the future it were to be determined that material economies of scale had not been shared with the fund, the Board would seek to have those economies of scale shared with the fund.
The Board members considered these conclusions and determinations, along with the information received on a routine and regular basis throughout the year, and, without any one factor being dispositive, the Board determined that re-approval of the fund’s Management Agreement was in the best interests of the fund and its shareholders.
The Fund 43

OFFICERS OF THE FUND (Unaudited)
BRADLEY J. SKAPYAK, President since January 2010.
Chief Operating Officer and a director of the Manager since June 2009. From April 2003 to June 2009, Mr. Skapyak was the head of the Investment Accounting and Support Department of the Manager. He is an officer of 76 investment companies (comprised of 171 portfolios) managed by the Manager. He is 51 years old and has been an employee of the Manager since February 1988.
PHILLIP N. MAISANO, Executive Vice President since July 2007.
Chief Investment Officer,Vice Chair and a director of the Manager, and an officer of 76 investment companies (comprised of 171 portfolios) managed by the Manager. Mr. Maisano also is an officer and/or Board member of certain other investment management subsidiaries of The Bank of New York Mellon Corporation, each of which is an affiliate of the Manager. He is 62 years old and has been an employee of the Manager since November 2006. Prior to joining the Manager, Mr. Maisano served as Chairman and Chief Executive Officer of EACM Advisors, an affiliate of the Manager, since August 2004.
J. DAVID OFFICER, Vice President since January 2010.
Director of Mellon United National Bank, an affiliate of the Manager, and an officer of 77 investment companies (comprised of 194 portfolios) managed by the Manager. Prior to June 2009, Mr. Officer was Chief Operating Officer,Vice Chairman and a director of the Manager, where he had been employed since April 1998. He is 61 years old.
MICHAEL A. ROSENBERG, Vice President and Secretary since August 2005.
Assistant General Counsel of BNY Mellon, and an officer of 77 investment companies (comprised of 194 portfolios) managed by the Manager. He is 49 years old and has been an employee of the Manager since October 1991.
KIESHA ASTWOOD, Vice President and Assistant Secretary since January 2010.
Counsel of BNY Mellon, and an officer of 77 investment companies (comprised of 194 portfolios) managed by the Manager. She is 36 years old and has been an employee of the Manager since July 1995.
JAMES BITETTO, Vice President and Assistant Secretary since August 2005.
Senior Counsel of BNY Mellon and Secretary of the Manager, and an officer of 77 investment companies (comprised of 194 portfolios) managed by the Manager. He is 43 years old and has been an employee of the Manager since December 1996.
JONI LACKS CHARATAN, Vice President and Assistant Secretary since August 2005.
Senior Counsel of BNY Mellon, and an officer of 77 investment companies (comprised of 194 portfolios) managed by the Manager. She is 54 years old and has been an employee of the Manager since October 1988.
JOSEPH M. CHIOFFI, Vice President and Assistant Secretary since August 2005.
Senior Counsel of BNY Mellon, and an officer of 77 investment companies (comprised of 194 portfolios) managed by the Manager. He is 48 years old and has been an employee of the Manager since June 2000.
KATHLEEN DENICHOLAS, Vice President and Assistant Secretary since January 2010.
Senior Counsel of BNY Mellon, and an officer of 77 investment companies (comprised of 194 portfolios) managed by the Manager. She is 35 years old and has been an employee of the Manager since February 2001.
46
JANETTE E. FARRAGHER, Vice President and Assistant Secretary since August 2005.
Assistant General Counsel of BNY Mellon, and an officer of 77 investment companies (comprised of 194 portfolios) managed by the Manager. She is 46 years old and has been an employee of the Manager since February 1984.
JOHN B. HAMMALIAN, Vice President and Assistant Secretary since August 2005.
Managing Counsel of BNY Mellon, and an officer of 77 investment companies (comprised of 194 portfolios) managed by the Manager. He is 46 years old and has been an employee of the Manager since February 1991.
M. CRISTINA MEISER, Vice President and Assistant Secretary since January 2010.
Senior Counsel of BNY Mellon, and an officer of 77 investment companies (comprised of 194 portfolios) managed by the Manager. She is 39 years old and has been an employee of the Manager since August 2001.
ROBERT R. MULLERY, Vice President and Assistant Secretary since August 2005.
Managing Counsel of BNY Mellon, and an officer of 77 investment companies (comprised of 194 portfolios) managed by the Manager. He is 57 years old and has been an employee of the Manager since May 1986.
JEFF PRUSNOFSKY, Vice President and Assistant Secretary since August 2005.
Managing Counsel of BNY Mellon, and an officer of 77 investment companies (comprised of 194 portfolios) managed by the Manager. He is 44 years old and has been an employee of the Manager since October 1990.
JAMES WINDELS, Treasurer since November 2001.
Director – Mutual Fund Accounting of the Manager, and an officer of 77 investment companies (comprised of 194 portfolios) managed by the Manager. He is 51 years old and has been an employee of the Manager since April 1985.
RICHARD CASSARO, Assistant Treasurer since January 2008.
Senior Accounting Manager – Money Market and Municipal Bond Funds of the Manager, and an officer of 77 investment companies (comprised of 194 portfolios) managed by the Manager. He is 50 years old and has been an employee of the Manager since September 1982.
GAVIN C. REILLY, Assistant Treasurer since December 2005.
Tax Manager of the Investment Accounting and Support Department of the Manager, and an officer of 77 investment companies (comprised of 194 portfolios) managed by the Manager. He is 41 years old and has been an employee of the Manager since April 1991.
ROBERT ROBOL, Assistant Treasurer since August 2005.
Senior Accounting Manager – Fixed Income Funds of the Manager, and an officer of 77 investment companies (comprised of 194 portfolios) managed by the Manager. He is 45 years old and has been an employee of the Manager since October 1988.
ROBERT SALVIOLO, Assistant Treasurer since July 2007.
Senior Accounting Manager – Equity Funds of the Manager, and an officer of 77 investment companies (comprised of 194 portfolios) managed by the Manager. He is 42 years old and has been an employee of the Manager since June 1989.
ROBERT SVAGNA, Assistant Treasurer since December 2002.
Senior Accounting Manager – Equity Funds of the Manager, and an officer of 77 investment companies (comprised of 194 portfolios) managed by the Manager. He is 42 years old and has been an employee of the Manager since November 1990.
The Fund 47
OFFICERS OF THE FUND (Unaudited) (continued)
JOSEPH W. CONNOLLY, Chief Compliance Officer since October 2004.
Chief Compliance Officer of the Manager and The Dreyfus Family of Funds (77 investment companies, comprised of 194 portfolios). From November 2001 through March 2004, Mr. Connolly was first Vice-President, Mutual Fund Servicing for Mellon Global Securities Services. In that capacity, Mr. Connolly was responsible for managing Mellon’s Custody, Fund Accounting and Fund Administration services to third-party mutual fund clients. He is 52 years old and has served in various capacities with the Manager since 1980, including manager of the firm’s Fund Accounting Department from 1997 through October 2001.
WILLIAM GERMENIS, Anti-Money Laundering Compliance Officer since September 2002.
Vice President and Anti-Money Laundering Compliance Officer of the Distributor, and the Anti-Money Laundering Compliance Officer of 73 investment companies (comprised of 190 portfolios) managed by the Manager. He is 39 years old and has been an employee of the Distributor since October 1998.
48
The Registrant has adopted a code of ethics that applies to the Registrant's principal executive officer, principal financial officer, principal accounting officer or controller, or persons performing similar functions. There have been no amendments to, or waivers in connection with, the Code of Ethics during the period covered by this Report.
| |
| Item 3. | Audit Committee Financial Expert. |
The Registrant's Board has determined that Joseph S. DiMartino, a member of the Audit Committee of the Board, is an audit committee financial expert as defined by the Securities and Exchange Commission (the "SEC"). Mr. DiMartino is "independent" as defined by the SEC for purposes of audit committee financial expert determinations.
| |
| Item 4. | Principal Accountant Fees and Services. |
(a) Audit Fees. The aggregate fees billed for each of the last two fiscal years (the "Reporting Periods") for professional services rendered by the Registrant's principal accountant (the "Auditor") for the audit of the Registrant's annual financial statements or services that are normally provided by the Auditor in connection with the statutory and regulatory filings or engagements for the Reporting Periods, were $31,807 in 2008 and $32,444 in 2009.
(b) Audit-Related Fees. The aggregate fees billed in the Reporting Periods for assurance and related services by the Auditor that are reasonably related to the performance of the audit of the Registrant's financial statements and are not reported under paragraph (a) of this Item 4 were $10,398 in 2008 and $5,276 in 2009. These services consisted of security counts required by Rule 17f-2 under the Investment Company Act of 1940.
The aggregate fees billed in the Reporting Periods for non-audit assurance and related services by the Auditor to the Registrant's investment adviser (not including any sub-investment adviser whose role is primarily portfolio management and is subcontracted with or overseen by another investment adviser), and any entity controlling, controlled by or under common control with the investment adviser that provides ongoing services to the Registrant ("Service Affiliates"), that were reasonably related to the performance of the annual audit of the Service Affiliate, which required pre-approval by the Audit Committee were $0 in 2008 and $0 in 2009.
(c) Tax Fees. The aggregate fees billed in the Reporting Periods for professional services rendered by the Auditor for tax compliance, tax advice, and tax planning ("Tax Services") were $3,273 in 2008 and $3,576 in 2009. These services consisted of: (i) review or preparation of U.S. federal, state, local and excise tax returns; (ii) U.S. federal, state and local tax planning, advice and assistance regarding statutory, regulatory or administrative developments; and (iii) tax advice regarding tax qualification matters and/or treatment of various financial instruments held or proposed to be acquired or held. The aggregate fees billed in the Reporting Periods for Tax Services by the Auditor to Service Affiliates, which required pre-approval by the Audit Committee were $ 0 in 2008 and $0 in 2009.
(d) All Other Fees. The aggregate fees billed in the Reporting Periods for products and services provided by the Auditor, other than the services reported in paragraphs (a) through (c) of this Item, were $58 in 2008 and $41 in 2009. These services consisted of a review of the Registrant's anti-money laundering program.
The aggregate fees billed in the Reporting Periods for Non-Audit Services by the Auditor to Service Affiliates, other than the services reported in paragraphs (b) through (c) of this Item, which required pre-approval by the Audit Committee, were $0 in 2008 and $0 in 2009.
-3-
SSL-DOCS2 70128344v15
Note: In each of (b) through (d) of this Item 4, 100% of all services provided by the Auditor were pre-approved as required.
Audit Committee Pre-Approval Policies and Procedures. The Registrant's Audit Committee has established policies and procedures (the "Policy") for pre-approval (within specified fee limits) of the Auditor's engagements for non-audit services to the Registrant and Service Affiliates without specific case-by-case consideration. Pre-approval considerations include whether the proposed services are compatible with maintaining the Auditor's independence. Pre-approvals pursuant to the Policy are considered annually.
Non-Audit Fees. The aggregate non-audit fees billed by the Auditor for services rendered to the Registrant, and rendered to Service Affiliates, for the Reporting Periods were $9,452,992 in 2008 and $26,086,988 in 2009.
Auditor Independence. The Registrant's Audit Committee has considered whether the provision of non-audit services that were rendered to Service Affiliates, which were not pre-approved (not requiring pre-approval), is compatible with maintaining the Auditor's independence.
| |
| Item 5. | Audit Committee of Listed Registrants. |
| | Not applicable. [CLOSED-END FUNDS ONLY] |
| Item 6. | Investments. |
| (a) | Not applicable. |
| Item 7. | Disclosure of Proxy Voting Policies and Procedures for Closed-End Management |
| | Investment Companies. |
| | Not applicable. [CLOSED-END FUNDS ONLY] |
| Item 8. | Portfolio Managers of Closed-End Management Investment Companies. |
| | Not applicable. [CLOSED-END FUNDS ONLY, beginning with reports for periods ended |
| | on and after December 31, 2005] |
| Item 9. | Purchases of Equity Securities by Closed-End Management Investment Companies and |
| | Affiliated Purchasers. |
| | Not applicable. [CLOSED-END FUNDS ONLY] |
| Item 10. | Submission of Matters to a Vote of Security Holders. |
| There have been no material changes to the procedures applicable to Item 10. |
| |
| Item 11. | Controls and Procedures. |
(a) The Registrant's principal executive and principal financial officers have concluded, based on their evaluation of the Registrant's disclosure controls and procedures as of a date within 90 days of the filing date of this report, that the Registrant's disclosure controls and procedures are reasonably designed to ensure that information required to be disclosed by the Registrant on Form N-CSR is recorded, processed, summarized
-4-
SSL-DOCS2 70128344v15
and reported within the required time periods and that information required to be disclosed by the Registrant in the reports that it files or submits on Form N-CSR is accumulated and communicated to the Registrant's management, including its principal executive and principal financial officers, as appropriate to allow timely decisions regarding required disclosure.
(b) There were no changes to the Registrant's internal control over financial reporting that occurred during the second fiscal quarter of the period covered by this report that have materially affected, or are reasonably likely to materially affect, the Registrant's internal control over financial reporting.
(a)(1) Code of ethics referred to in Item 2.
(a)(2) Certifications of principal executive and principal financial officers as required by Rule 30a-2(a) under the Investment Company Act of 1940.
(a)(3) Not applicable.
(b) Certification of principal executive and principal financial officers as required by Rule 30a-2(b) under the Investment Company Act of 1940.
-5-
SSL-DOCS2 70128344v15
SIGNATURES
Pursuant to the requirements of the Securities Exchange Act of 1934 and the Investment Company Act of 1940, the Registrant has duly caused this Report to be signed on its behalf by the undersigned, thereunto duly authorized.
Dreyfus New York AMT-Free Municipal Bond Fund
| |
| By: | /s/ Bradley J. Skapyak |
| | Bradley J. Skapyak, |
| | President |
| |
| Date: | January 19, 2010 |
Pursuant to the requirements of the Securities Exchange Act of 1934 and the Investment Company Act of 1940, this Report has been signed below by the following persons on behalf of the Registrant and in the capacities and on the dates indicated.
| |
| By: | /s/ Bradley J. Skapyak |
| | Bradley J. Skapyak, |
| | President |
| |
| Date: | January 19, 2010 |
| |
| By: | /s/ James Windels |
| | James Windels, |
| Treasurer |
| |
| Date: | January 19, 2010 |
EXHIBIT INDEX
(a)(1) Code of ethics referred to in Item 2.
(a)(2) Certifications of principal executive and principal financial officers as required by Rule 30a-2(a) under the Investment Company Act of 1940. (EX-99.CERT)
(b) Certification of principal executive and principal financial officers as required by Rule 30a-2(b) under the Investment Company Act of 1940. (EX-99.906CERT)
-6-
SSL-DOCS2 70128344v15