UNITED STATES
SECURITIES AND EXCHANGE COMMISSION
Washington, D.C. 20549
FORM N-CSR
CERTIFIED SHAREHOLDER REPORT OF REGISTERED MANAGEMENT
INVESTMENT COMPANIES
Investment Company Act file number | 811- 4765 |
| |
| Dreyfus New York AMT-Free Municipal Bond Fund | |
| (Exact name of Registrant as specified in charter) | |
| | |
| c/o The Dreyfus Corporation 200 Park Avenue New York, New York 10166 | |
| (Address of principal executive offices) (Zip code) | |
| | |
| Michael A. Rosenberg, Esq. 200 Park Avenue New York, New York 10166 | |
| (Name and address of agent for service) | |
|
Registrant's telephone number, including area code: | (212) 922-6000 |
| |
Date of fiscal year end: | 11/30 | |
Date of reporting period: | 11/30/10 | |
| | | | | | |
FORM N-CSR
Item 1. Reports to Stockholders.
Dreyfus
New York AMT-Free
Municipal Bond Fund
ANNUAL REPORT November 30, 2010

Save time. Save paper. View your next shareholder report online as soon as it’s available. Log into www.dreyfus.com and sign up for Dreyfus eCommunications. It’s simple and only takes a few minutes.
The views expressed in this report reflect those of the portfolio manager only through the end of the period covered and do not necessarily represent the views of Dreyfus or any other person in the Dreyfus organization. Any such views are subject to change at any time based upon market or other conditions and Dreyfus disclaims any responsibility to update such views.These views may not be relied on as investment advice and, because investment decisions for a Dreyfus fund are based on numerous factors, may not be relied on as an indication of trading intent on behalf of any Dreyfus fund.

| |
| | Contents |
| |
| | THE FUND |
| 2 | A Letter from the Chairman and CEO |
| 3 | Discussion of Fund Performance |
| 6 | Fund Performance |
| 8 | Understanding Your Fund’s Expenses |
| 8 | Comparing Your Fund’s Expenses |
| | With Those of Other Funds |
| 9 | Statement of Investments |
| 23 | Statement of Assets and Liabilities |
| 24 | Statement of Operations |
| 25 | Statement of Changes in Net Assets |
| 27 | Financial Highlights |
| 31 | Notes to Financial Statements |
| 42 | Report of Independent Registered |
| | Public Accounting Firm |
| 43 | Important Tax Information |
| 44 | Information About the Review and Approval |
| | of the Fund’s Management Agreement |
| 49 | Board Members Information |
| 51 | Officers of the Fund |
| |
| | FOR MORE INFORMATION |
| | Back Cover |
Dreyfus
New York AMT-Free
Municipal Bond Fund
The Fund

A LETTER FROM THE CHAIRMAN AND CEO
Dear Shareholder:
We are pleased to present this annual report for Dreyfus NewYork Tax AMT-Free Municipal Bond Fund, covering the 12-month period from December 1, 2009, through November 30, 2010.
Municipal bonds delivered respectable returns during the reporting period, despite periodic bouts of volatility — most notably as we write this Letter — stemming from economic uncertainty and year-end technical factors which affect the municipal bond markets.Although U.S. GDP growth was positive throughout the reporting period, the economic recovery has been milder than historical averages. Stubbornly high levels of unemployment, lower revenue streams and persistent weakness in housing markets continue to weigh on domestic economic activity, putting pressure on the fiscal conditions of many state and local governments.Yet, municipal bond prices were supported by positive supply-and-demand dynamics and robust demand from investors seeking alternatives to low-yielding money market funds.
We are cautiously optimistic regarding economic and market prospects in 2011. A weaker U.S. dollar is likely to support exports and limit imports and residential construction appears set to begin recovering from depressed levels. However, some state and local municipalities continue to face budget shortfalls as a result of the current subpar economic recovery. So is your portfolio positioned accordingly? Talk with your financial advisor, who can help you evaluate your portfolio investments given these recent market events to help meet, and possibly adjust, your individual tax-exempt investment needs and future capital goals.
For information about how the fund performed during the reporting period, as well as general market perspectives, we provide a Discussion of Fund Performance on the pages that follow.
Thank you for your continued confidence and support.

Jonathan R. Baum
Chairman and Chief Executive Officer
The Dreyfus Corporation
December 15, 2010
2

DISCUSSION OF FUND PERFORMANCE
For the period of December 1, 2009, through November 30, 2010, as provided by Thomas Casey and David Belton, Portfolio Managers
Fund and Market Performance Overview
For the 12-month period ended November 30, 2010, Dreyfus New York AMT-Free Municipal Bond Fund’s Class A, Class B, Class C and Class I shares produced total returns of 4.40%, 3.89% 3.62% and 4.58%, respectively.1 In comparison, the Barclays Capital Municipal Bond Index (the “Index”), the fund’s benchmark, achieved a total return of 4.76% for the same period.2
Municipal bonds paused in their long advance during the reporting period as the market’s supply-and-demand dynamics changed. The fund produced lower returns than its benchmark, due primarily to its focus on higher-quality securities.
The Fund’s Investment Approach
The fund seeks to maximize current income exempt from federal, New York state and NewYork city income taxes to the extent consistent with the preservation of capital.To pursue this goal, the fund normally invests substantially all of its assets in municipal bonds that provide income exempt from federal, New York state and New York city personal income taxes.The fund also seeks to provide income exempt from the federal alternative minimum tax.The fund will invest at least 70% of its assets in investment-grade municipal bonds or the unrated equivalent as determined by Dreyfus. For additional yield, the fund may invest up to 30% of its assets in municipal bonds rated below investment grade (“high yield” or “junk” bonds) or the unrated equivalent as determined by Dreyfus. Under normal market conditions, the dollar-weighted average maturity of the fund’s portfolio is expected to exceed 10 years .
In managing the fund, we focus on identifying undervalued sectors and securities, and we minimize the use of interest rate forecasting.We select municipal bonds by using fundamental credit analysis to estimate the relative value and attractiveness of various sectors and securities
The Fund 3
DISCUSSION OF FUND PERFORMANCE (continued)
and to exploit pricing inefficiencies in the municipal bond market.We actively trade among various sectors, such as pre-refunded, general obligation and revenue, based on their apparent relative values.
Market Reversed Course as Technical Influences Changed
The U.S. economic rebound persisted during the reporting period, but the pace of recovery remained slower than historical averages. Early in the reporting period, investors continued to digest recent economic developments, including a sovereign debt crisis in Europe and high unemployment in the United States.While NewYork has continued to struggle with recession-related fiscal pressures, improved conditions on Wall Street recently have bolstered tax revenues. Nonetheless, the Federal Reserve Board left short-term interest rates unchanged in a historically low range between 0% and 0.25%, and it later announced new efforts to stimulate the economy through a new round of quantitative easing.
Municipal bonds encountered heightened volatility when market dynamics began to change in the late summer. Supply-and-demand dynamics had been favorable as the Build America Bonds program shifted a substantial portion of new issuance to the taxable bond market, but it became clearer in the fall that Congress would not renew the program at year-end. Consequently, investors began to sell municipal bonds in anticipation of a more ample supply of securities in 2011. By the end of November, the market had given back some of the reporting period’s previous gains.
Quality Bias Dampened Relative Returns
Although the fund’s participation in the rally over the reporting period’s first half was limited to a degree by its bias toward higher-quality securities, a relatively defensive investment posture helped cushion later market volatility. In addition, the fund received positive results from its emphasis on investment-grade bonds backed by dedicated revenues, including those from hospitals and airports. The fund held an underweighted position in the general obligation bonds of New York municipalities, which trailed market averages. Sources of underperformance included overweighted exposure to bonds backed by educational institutions, water and sewer systems and electric utilities.
4
We set the fund’s average duration in a position that was roughly in line with industry averages, a strategy that had little impact on relative performance. However, our focus on bonds with maturities in the 12- to 20-year range benefited the fund as yield differences were relatively steep in that segment of the maturity spectrum.
Weathering a Period of Transition
While we expect the U.S. economic recovery to persist, recent municipal bond market behavior suggests that we may see heightened volatility during the transition to a more robust supply of newly issued bonds in 2011. In addition, we believe that many states, including NewYork, will continue to struggle with budget pressures. Therefore, we expect the municipal bond market to begin responding more to fundamental factors than to technical influences.
We are more optimistic over the longer term. Once the transition to a more ample supply of tax-exempt securities is complete, demand for municipal bonds seems likely to stay robust as investors respond to higher state taxes and possible federal income tax increases down the road.
December 15, 2010
Bond funds are subject generally to interest rate, credit, liquidity and market risks, to varying
degrees, all of which are more fully described in the fund’s prospectus. Generally, all other factors
being equal, bond prices are inversely related to interest-rate changes, and rate increases can cause
price declines.
1 Total return includes reinvestment of dividends and any capital gains paid, and does not take into
consideration the maximum initial sales charge in the case of Class A shares, or the applicable
contingent deferred sales charges imposed on redemptions in the case of Class B and Class C
shares. Had these charges been reflected, returns would have been lower. Class I is not subject to
any initial or deferred sales charge. Past performance is no guarantee of future results. Share price,
yield and investment return fluctuate such that upon redemption, fund shares may be worth more
or less than their original cost. Income may be subject to state and local taxes for non-NewYork
residents. Capital gains, if any, are fully taxable. Return figures provided reflect the absorption of
certain fund expenses by The Dreyfus Corporation pursuant to an undertaking in effect for Class
A, Class B and Class C through February 28, 2011, at which time it may be extended,
terminated or modified. Had these expenses not been absorbed, the fund’s returns for Class A,
Class B and Class C would have been lower.
2 SOURCE: LIPPER INC. — Reflects reinvestment of dividends and, where applicable, capital
gain distributions.The Barclays Capital Municipal Bond Index is a widely accepted, unmanaged
and geographically unrestricted total return performance benchmark for the long-term, investment-
grade, tax-exempt bond market. Index returns do not reflect the fees and expenses associated with
operating a mutual fund.
The Fund 5
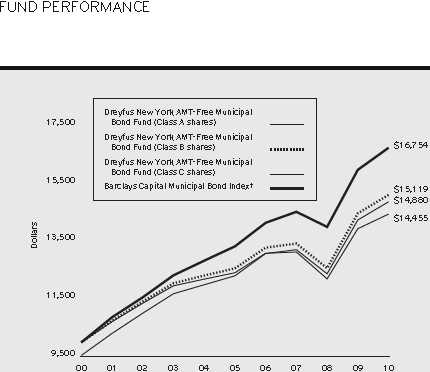
Years Ended 11/30
Comparison of change in value of $10,000 investment in Dreyfus New York AMT-Free Municipal Bond Fund Class A shares, Class B shares and Class C shares and the Barclays Capital Municipal Bond Index
† Source: Lipper Inc.
Past performance is not predictive of future performance.
The above graph compares a $10,000 investment made in Class A shares, Class B shares and Class C shares of Dreyfus NewYork AMT-Free Municipal Bond Fund on 11/30/00 to a $10,000 investment made in the Barclays Capital Municipal Bond Index (the “Index”) on that date.All dividends and capital gain distributions are reinvested. The fund invests primarily in NewYork municipal securities and the fund’s performance shown in the line graph takes into account the maximum initial sales charge on Class A shares and all other applicable fees and expenses on all share classes. Performance for Class I shares will vary from the performance of Class A shares, Class B shares and Class C shares shown above due to differences in charges and expenses. Performance for Class B shares assumes the conversion of Class B shares to Class A shares at the end of the sixth year following the date of purchase.The Index is not limited to investments principally in NewYork municipal obligations and does not take into account charges, fees and other expenses.The Index, unlike the fund, is an unmanaged total return performance benchmark for the long-term, investment-grade, geographically unrestricted tax-exempt bond market, calculated by using municipal bonds selected to be representative of the municipal market overall.These factors can contribute to the Index potentially outperforming or underperforming the fund. Unlike a mutual fund, the Index is not subject to charges, fees and other expenses. Investors cannot invest directly in any index. Further information relating to fund performance, including expense reimbursements, if applicable, is contained in the Financial Highlights section of the prospectus and elsewhere in this report.
6
| | | | | | | |
| Average Annual Total Returns as of 11/30/10 | | | | | | |
| |
| | Inception | | | | | | |
| | Date | 1 | Year | 5 Years | | 10 Years | |
| Class A shares | | | | | | | |
| with maximum sales charge (4.5%) | 12/31/86 | –0.28 | % | 2.91 | % | 4.05 | % |
| without sales charge | 12/31/86 | 4.40 | % | 3.86 | % | 4.54 | % |
| Class B shares | | | | | | | |
| with applicable redemption charge † | 1/15/93 | –0.11 | % | 3.00 | % | 4.22 | % |
| without redemption | 1/15/93 | 3.89 | % | 3.35 | % | 4.22 | % |
| Class C shares | | | | | | | |
| with applicable redemption charge †† | 9/11/95 | 2.62 | % | 3.09 | % | 3.75 | % |
| without redemption | 9/11/95 | 3.62 | % | 3.09 | % | 3.75 | % |
| Class I shares | 12/15/08 | 4.58 | % | 3.92 | %††† | 4.57 | %††† |
| Barclays Capital | | | | | | | |
| Municipal Bond Index | | 4.76 | % | 4.67 | % | 5.30 | % |
Past performance is not predictive of future performance.The fund’s performance shown in the graph and table does not reflect the deduction of taxes that a shareholder would pay on fund distributions or the redemption of fund shares.
† The maximum contingent deferred sales charge for Class B shares is 4%.After six years Class B shares convert to
Class A shares.
The maximum contingent deferred sales charge for Class C shares is 1% for shares redeemed within one year of the
date of purchase.
The total return performance figures presented for Class I shares of the fund reflect the performance of the fund’s
Class A shares for periods prior to 12/15/08 (the inception date for Class I shares).
The Fund 7
UNDERSTANDING YOUR FUND’S EXPENSES (Unaudited)
As a mutual fund investor, you pay ongoing expenses, such as management fees and other expenses. Using the information below, you can estimate how these expenses affect your investment and compare them with the expenses of other funds.You also may pay one-time transaction expenses, including sales charges (loads) and redemption fees, which are not shown in this section and would have resulted in higher total expenses. For more information, see your fund’s prospectus or talk to your financial adviser.
Review your fund’s expenses
The table below shows the expenses you would have paid on a $1,000 investment in Dreyfus New York AMT-Free Municipal Bond Fund from June 1, 2010 to November 30, 2010. It also shows how much a $1,000 investment would be worth at the close of the period, assuming actual returns and expenses.
Expenses and Value of a $1,000 Investment
assuming actual returns for the six months ended November 30, 2010
| | | | | | | | |
| | | Class A | | Class B | | Class C | | Class I |
| Expenses paid per $1,000† | $ | 4.27 | $ | 6.73 | $ | 8.08 | $ | 3.32 |
| Ending value (after expenses) | $ | 1,005.80 | $ | 1,003.40 | $ | 1,002.10 | $ | 1,006.60 |
COMPARING YOUR FUND’S EXPENSES WITH THOSE OF OTHER FUNDS (Unaudited)
Using the SEC’s method to compare expenses
The Securities and Exchange Commission (SEC) has established guidelines to help investors assess fund expenses. Per these guidelines, the table below shows your fund’s expenses based on a $1,000 investment, assuming a hypothetical 5% annualized return. You can use this information to compare the ongoing expenses (but not transaction expenses or total cost) of investing in the fund with those of other funds.All mutual fund shareholder reports will provide this information to help you make this comparison. Please note that you cannot use this information to estimate your actual ending account balance and expenses paid during the period.
Expenses and Value of a $1,000 Investment
assuming a hypothetical 5% annualized return for the six months ended November 30, 2010
| | | | | | | | |
| | | Class A | | Class B | | Class C | | Class I |
| Expenses paid per $1,000† | $ | 4.31 | $ | 6.78 | $ | 8.14 | $ | 3.35 |
| Ending value (after expenses) | $ | 1,020.81 | $ | 1,018.35 | $ | 1,017.00 | $ | 1,021.76 |
† Expenses are equal to the fund’s annualized expense ratio of .85% for Class A, 1.34% for Class B, 1.61% for
Class C and .66% for Class I, multiplied by the average account value over the period, multiplied by 183/365 (to
reflect the one-half year period).
8
| | | | | |
| STATEMENT OF INVESTMENTS | | | | |
| November 30, 2010 | | | | | |
| |
| |
| |
| |
| Long-Term Municipal | Coupon | Maturity | Principal | | |
| Investments—100.3% | Rate (%) | Date | Amount ($) | | Value ($) |
| New York—90.6% | | | | | |
| Albany Industrial Development | | | | | |
| Agency, Civic Facility Revenue | | | | | |
| (Saint Peter’s Hospital of the | | | | | |
| City of Albany Project) | 5.25 | 11/15/27 | 4,500,000 | | 4,386,510 |
| Albany Industrial Development | | | | | �� |
| Agency, Civic Facility Revenue | | | | | |
| (Saint Peter’s Hospital of the | | | | | |
| City of Albany Project) | 5.25 | 11/15/32 | 1,000,000 | | 947,600 |
| Dutchess County Industrial | | | | | |
| Development Agency, Civic | | | | | |
| Facility Revenue (Bard College | | | | | |
| Civic Facility) | 5.00 | 8/1/20 | 1,000,000 | a | 1,053,190 |
| Dutchess County Industrial | | | | | |
| Development Agency, Civic | | | | | |
| Facility Revenue (Bard College | | | | | |
| Civic Facility) | 5.00 | 8/1/22 | 775,000 | a | 802,939 |
| Hempstead Industrial Development | | | | | |
| Agency, Civic Facility Revenue | | | | | |
| (Adelphi University Civic Facility) | 5.00 | 10/1/30 | 3,565,000 | | 3,607,495 |
| Hempstead Industrial Development | | | | | |
| Agency, Civic Facility Revenue | | | | | |
| (Adelphi University Civic Facility) | 5.00 | 10/1/35 | 1,500,000 | a | 1,501,170 |
| Hempstead Local Development | | | | | |
| Corporation, Revenue (Molloy | | | | | |
| College Project) | 5.70 | 7/1/29 | 4,865,000 | a | 5,120,948 |
| JPMorgan Chase Putters/Drivers | | | | | |
| Trust (New York State | | | | | |
| Dormitory Authority, Revenue | | | | | |
| (The Rockefeller University)) | 5.00 | 7/1/18 | 4,000,000 | a,b,c | 4,213,120 |
| Long Island Power Authority, | | | | | |
| Electric System General Revenue | 6.00 | 5/1/33 | 3,000,000 | | 3,268,470 |
| Long Island Power Authority, | | | | | |
| Electric System General | | | | | |
| Revenue (Insured; National | | | | | |
| Public Finance Guarantee Corp.) | 5.00 | 12/1/19 | 2,375,000 | | 2,584,879 |
| Metropolitan Transportation | | | | | |
| Authority, Transportation Revenue | 5.00 | 11/15/25 | 1,000,000 | | 1,032,280 |
| Metropolitan Transportation | | | | | |
| Authority, Transportation Revenue | 6.50 | 11/15/28 | 1,000,000 | | 1,132,160 |
The Fund 9
STATEMENT OF INVESTMENTS (continued)
| | | | | |
| Long-Term Municipal | Coupon | Maturity | Principal | | |
| Investments (continued) | Rate (%) | Date | Amount ($) | | Value ($) |
| New York (continued) | | | | | |
| Metropolitan Transportation | | | | | |
| Authority, Transportation Revenue | 5.00 | 11/15/31 | 3,000,000 | | 3,003,750 |
| Metropolitan Transportation | | | | | |
| Authority, Transportation Revenue | 5.00 | 11/15/34 | 3,000,000 | | 2,956,680 |
| Metropolitan Transportation | | | | | |
| Authority, Transportation | | | | | |
| Revenue (Insured; AMBAC) | 5.50 | 11/15/18 | 7,745,000 | | 8,216,670 |
| New York City, | | | | | |
| GO | 5.38 | 12/1/20 | 5,000 | | 5,191 |
| New York City, | | | | | |
| GO | 5.00 | 8/1/21 | 2,000,000 | | 2,144,860 |
| New York City, | | | | | |
| GO | 5.00 | 8/1/22 | 1,200,000 | | 1,280,220 |
| New York City, | | | | | |
| GO | 5.50 | 6/1/23 | 25,000 | | 26,961 |
| New York City, | | | | | |
| GO | 5.25 | 8/15/24 | 5,420,000 | | 5,878,640 |
| New York City, | | | | | |
| GO | 5.00 | 8/1/26 | 3,565,000 | | 3,820,290 |
| New York City, | | | | | |
| GO (Prerefunded) | 5.38 | 12/1/11 | 260,000 | d | 273,179 |
| New York City, | | | | | |
| GO (Prerefunded) | 5.50 | 6/1/13 | 125,000 | d | 139,932 |
| New York City Health and | | | | | |
| Hospitals Corporation, | | | | | |
| Health System Revenue | 5.00 | 2/15/30 | 5,000,000 | | 5,114,500 |
| New York City Housing Development | | | | | |
| Corporation, Capital Fund | | | | | |
| Program Revenue (New York City | | | | | |
| Housing Authority Program) | | | | | |
| (Insured; National Public | | | | | |
| Finance Guarantee Corp.) | 5.00 | 7/1/25 | 3,465,000 | | 3,584,542 |
| New York City Industrial | | | | | |
| Development Agency, Civic | | | | | |
| Facility Revenue (YMCA of | | | | | |
| Greater New York Project) | 5.00 | 8/1/36 | 7,500,000 | | 6,900,075 |
| New York City Industrial | | | | | |
| Development Agency, PILOT | | | | | |
| Revenue (Yankee Stadium | | | | | |
| Project) (Insured; Assured | | | | | |
| Guaranty Municipal Corp.) | 7.00 | 3/1/49 | 5,000,000 | | 5,657,750 |
10
| | | | |
| Long-Term Municipal | Coupon | Maturity | Principal | |
| Investments (continued) | Rate (%) | Date | Amount ($) | Value ($) |
| New York (continued) | | | | |
| New York City Municipal Water | | | | |
| Finance Authority, Water and | | | | |
| Sewer System Revenue | 5.00 | 6/15/22 | 3,000,000 | 3,212,340 |
| New York City Municipal Water | | | | |
| Finance Authority, Water and | | | | |
| Sewer System Second General | | | | |
| Resolution Revenue | 5.00 | 6/15/31 | 3,000,000 | 3,133,020 |
| New York City Municipal Water | | | | |
| Finance Authority, Water and | | | | |
| Sewer System Second General | | | | |
| Resolution Revenue | 5.25 | 6/15/40 | 2,975,000 | 3,100,664 |
| New York City Municipal Water | | | | |
| Finance Authority, Water and | | | | |
| Sewer System Second General | | | | |
| Resolution Revenue | 5.50 | 6/15/40 | 2,500,000 | 2,683,875 |
| New York City Transitional Finance | | | | |
| Authority, Building Aid | | | | |
| Revenue (Insured; National | | | | |
| Public Finance Guarantee Corp.) | 5.00 | 7/15/25 | 2,000,000 | 2,100,400 |
| New York City Transitional Finance | | | | |
| Authority, Building Aid | | | | |
| Revenue (Insured; National | | | | |
| Public Finance Guarantee Corp.) | 5.00 | 7/15/36 | 4,000,000 | 4,064,080 |
| New York City Transitional | | | | |
| Finance Authority, Future Tax | | | | |
| Secured Revenue | 5.00 | 11/1/22 | 4,000,000 | 4,279,880 |
| New York City Transitional | | | | |
| Finance Authority, Future Tax | | | | |
| Secured Revenue | 5.00 | 11/1/25 | 3,565,000 | 3,730,273 |
| New York City Transitional | | | | |
| Finance Authority, Future Tax | | | | |
| Secured Revenue | 5.00 | 11/1/28 | 2,695,000 | 2,785,848 |
| New York State Dormitory | | | | |
| Authority, Catholic Health | | | | |
| Services of Long Island | | | | |
| Obligated Group Revenue | | | | |
| (Saint Francis Hospital Project) | 5.00 | 7/1/21 | 5,000,000 | 5,116,650 |
| New York State Dormitory | | | | |
| Authority, FHA-Insured | | | | |
| Mortgage Hospital Revenue | | | | |
| (Hospital for Special Surgery) | 6.00 | 8/15/38 | 3,470,000 | 3,749,127 |
The Fund 11
STATEMENT OF INVESTMENTS (continued)
| | | | | |
| Long-Term Municipal | Coupon | Maturity | Principal | | |
| Investments (continued) | Rate (%) | Date | Amount ($) | | Value ($) |
| New York (continued) | | | | | |
| New York State Dormitory | | | | | |
| Authority, FHA-Insured | | | | | |
| Mortgage Hospital Revenue | | | | | |
| (The New York and Presbyterian | | | | | |
| Hospital) (Insured; Assured | | | | | |
| Guaranty Municipal Corp.) | 5.25 | 8/15/27 | 2,505,000 | | 2,616,598 |
| New York State Dormitory | | | | | |
| Authority, Health Center | | | | | |
| Revenue (Guaranteed; SONYMA) | 5.00 | 11/15/19 | 1,000,000 | | 1,029,810 |
| New York State Dormitory | | | | | |
| Authority, Insured Revenue | | | | | |
| (Manhattan College) | | | | | |
| (Insured; Radian) | 5.50 | 7/1/16 | 2,975,000 | a | 3,040,034 |
| New York State Dormitory | | | | | |
| Authority, Insured Revenue | | | | | |
| (New York University) | | | | | |
| (Insured; AMBAC) | 5.00 | 7/1/32 | 3,345,000 | a | 3,446,019 |
| New York State Dormitory | | | | | |
| Authority, Mortgage Hospital | | | | | |
| Revenue (The Long Island College | | | | | |
| Hospital) (Collateralized; FHA) | 6.00 | 8/15/15 | 2,580,000 | | 2,748,964 |
| New York State Dormitory | | | | | |
| Authority, Revenue (Consolidated | | | | | |
| City University System) | 5.63 | 7/1/16 | 6,500,000 | a | 7,245,680 |
| New York State Dormitory | | | | | |
| Authority, Revenue (Consolidated | | | | | |
| City University System) | 5.75 | 7/1/18 | 2,500,000 | a | 2,868,425 |
| New York State Dormitory | | | | | |
| Authority, Revenue | | | | | |
| (Consolidated City University | | | | | |
| System) (Insured; Assured | | | | | |
| Guaranty Municipal Corp.) | 5.75 | 7/1/18 | 2,290,000 | a | 2,644,950 |
| New York State Dormitory | | | | | |
| Authority, Revenue | | | | | |
| (Cornell University) | 5.00 | 7/1/24 | 4,500,000 | a | 4,813,965 |
| New York State Dormitory | | | | | |
| Authority, Revenue | | | | | |
| (Cornell University) | 5.00 | 7/1/35 | 3,500,000 | a | 3,581,130 |
| New York State Dormitory | | | | | |
| Authority, Revenue | | | | | |
| (Cornell University) | 5.00 | 7/1/35 | 2,000,000 | a | 2,081,040 |
12
| | | | | |
| Long-Term Municipal | Coupon | Maturity | Principal | | |
| Investments (continued) | Rate (%) | Date | Amount ($) | | Value ($) |
| New York (continued) | | | | | |
| New York State Dormitory | | | | | |
| Authority, Revenue (Fordham | | | | | |
| University) (Insured; Assured | | | | | |
| Guaranty Municipal Corp.) | 5.00 | 7/1/33 | 2,000,000 | a | 2,056,460 |
| New York State Dormitory | | | | | |
| Authority, Revenue (Mental Health | | | | | |
| Services Facilities Improvement) | 5.00 | 2/15/28 | 1,725,000 | | 1,748,322 |
| New York State Dormitory | | | | | |
| Authority, Revenue (Miriam | | | | | |
| Osborne Memorial Home) | | | | | |
| (Insured; ACA) | 6.88 | 7/1/19 | 2,475,000 | | 2,527,520 |
| New York State Dormitory | | | | | |
| Authority, Revenue (Mount | | | | | |
| Sinai Hospital Obligated Group) | 5.00 | 7/1/26 | 2,000,000 | | 2,049,680 |
| New York State Dormitory | | | | | |
| Authority, Revenue (Mount | | | | | |
| Sinai School of Medicine of | | | | | |
| New York University) | 5.50 | 7/1/25 | 2,320,000 | a | 2,453,980 |
| New York State Dormitory | | | | | |
| Authority, Revenue (New York | | | | | |
| Methodist Hospital) | 5.25 | 7/1/33 | 2,000,000 | | 1,908,340 |
| New York State Dormitory | | | | | |
| Authority, Revenue (New York | | | | | |
| State Department of Health) | 5.00 | 7/1/15 | 3,885,000 | | 4,299,840 |
| New York State Dormitory | | | | | |
| Authority, Revenue (New York | | | | | |
| State Department of Health) | | | | | |
| (Insured; CIFG) | 5.00 | 7/1/25 | 5,500,000 | a | 5,700,200 |
| New York State Dormitory Authority, | | | | | |
| Revenue (New York University) | 5.00 | 7/1/34 | 2,000,000 | a | 2,054,000 |
| New York State Dormitory | | | | | |
| Authority, Revenue (New York | | | | | |
| University Hospitals Center) | 5.25 | 7/1/24 | 2,000,000 | | 2,055,900 |
| New York State Dormitory | | | | | |
| Authority, Revenue (New York | | | | | |
| University Hospitals Center) | 5.00 | 7/1/26 | 2,500,000 | | 2,512,575 |
| New York State Dormitory | | | | | |
| Authority, Revenue (North | | | | | |
| Shore—Long Island Jewish | | | | | |
| Obligated Group) | 5.00 | 5/1/25 | 5,515,000 | | 5,591,217 |
The Fund 13
STATEMENT OF INVESTMENTS (continued)
| | | | | |
| Long-Term Municipal | Coupon | Maturity | Principal | | |
| Investments (continued) | Rate (%) | Date | Amount ($) | | Value ($) |
| New York (continued) | | | | | |
| New York State Dormitory | | | | | |
| Authority, Revenue (North | | | | | |
| Shore—Long Island Jewish | | | | | |
| Obligated Group) | 5.50 | 5/1/37 | 2,000,000 | a | 2,039,040 |
| New York State Dormitory | | | | | |
| Authority, Revenue (Orange | | | | | |
| Regional Medical Center | | | | | |
| Obligated Group) | 6.13 | 12/1/29 | 1,500,000 | | 1,501,410 |
| New York State Dormitory | | | | | |
| Authority, Revenue (Orange | | | | | |
| Regional Medical Center | | | | | |
| Obligated Group) | 6.25 | 12/1/37 | 1,500,000 | | 1,480,170 |
| New York State Dormitory | | | | | |
| Authority, Revenue (Rochester | | | | | |
| Institute of Technology) | 6.00 | 7/1/33 | 5,250,000 | a | 5,684,543 |
| New York State Dormitory | | | | | |
| Authority, Revenue (Siena College) | 5.00 | 7/1/31 | 1,015,000 | | 1,013,660 |
| New York State Dormitory | | | | | |
| Authority, Revenue (State | | | | | |
| University Educational Facilities) | 5.88 | 5/15/17 | 4,060,000 | a | 4,764,816 |
| New York State Dormitory | | | | | |
| Authority, Revenue | | | | | |
| (Teachers College) | 5.00 | 3/1/24 | 2,500,000 | a | 2,652,450 |
| New York State Dormitory | | | | | |
| Authority, Revenue | | | | | |
| (Teachers College) | 5.38 | 3/1/29 | 2,000,000 | a | 2,105,300 |
| New York State Dormitory | | | | | |
| Authority, Revenue (The | | | | | |
| Bronx-Lebanon Hospital | | | | | |
| Center) (LOC; TD Bank) | 6.50 | 8/15/30 | 4,000,000 | | 4,422,200 |
| New York State Dormitory | | | | | |
| Authority, Revenue | | | | | |
| (The New School) | 5.25 | 7/1/30 | 2,500,000 | a | 2,536,550 |
| New York State Dormitory | | | | | |
| Authority, Revenue (The | | | | | |
| Rockefeller University) | 5.00 | 7/1/40 | 4,000,000 | a | 4,203,520 |
| New York State Dormitory | | | | | |
| Authority, Revenue | | | | | |
| (University of Rochester) | 5.00 | 7/1/34 | 6,870,000 | a | 6,932,517 |
14
| | | | | |
| Long-Term Municipal | Coupon | Maturity | Principal | | |
| Investments (continued) | Rate (%) | Date | Amount ($) | | Value ($) |
| New York (continued) | | | | | |
| New York State Dormitory | | | | | |
| Authority, South Nassau | | | | | |
| Communities HR (Winthrop South | | | | | |
| Nassau University Health | | | | | |
| System Obligated Group) | 5.50 | 7/1/23 | 3,475,000 | | 3,531,226 |
| New York State Dormitory | | | | | |
| Authority, State Personal Income | | | | | |
| Tax Revenue (General Purpose) | 5.25 | 2/15/22 | 2,500,000 | | 2,796,225 |
| New York State Dormitory | | | | | |
| Authority, State Personal Income | | | | | |
| Tax Revenue (General Purpose) | 5.00 | 2/15/26 | 1,730,000 | | 1,862,760 |
| New York State Energy Research and | | | | | |
| Development Authority, Gas | | | | | |
| Facilities Revenue (The Brooklyn | | | | | |
| Union Gas Company Project) | 6.37 | 4/1/20 | 5,000,000 | | 5,091,050 |
| New York State Environmental | | | | | |
| Facilities Corporation, State | | | | | |
| Clean Water and Drinking Water | | | | | |
| Revolving Funds Revenue (New | | | | | |
| York City Municipal Water | | | | | |
| Finance Authority Projects— | | | | | |
| Second Resolution Bonds) | 5.00 | 6/15/29 | 2,470,000 | | 2,649,075 |
| New York State Housing Finance | | | | | |
| Agency, State Personal Income | | | | | |
| Tax Revenue (Economic | | | | | |
| Development and Housing) | 5.00 | 3/15/34 | 3,575,000 | | 3,643,783 |
| New York State Mortgage Agency, | | | | | |
| Education Loan Revenue | | | | | |
| (New York Higher Education | | | | | |
| Loan Program) | 5.25 | 11/1/20 | 3,105,000 | a | 3,374,235 |
| New York State Mortgage Agency, | | | | | |
| Mortgage Revenue | 5.00 | 4/1/28 | 1,500,000 | | 1,619,715 |
| New York State Thruway Authority, | | | | | |
| General Revenue (Insured; | | | | | |
| National Public Finance | | | | | |
| Guarantee Corp.) | 5.00 | 1/1/27 | 5,000,000 | | 5,194,650 |
| New York State Thruway Authority, | | | | | |
| Second General Highway and | | | | | |
| Bridge Trust Fund Bonds | 5.00 | 4/1/25 | 5,000,000 | | 5,264,250 |
The Fund 15
STATEMENT OF INVESTMENTS (continued)
| | | | | |
| Long-Term Municipal | Coupon | Maturity | Principal | | |
| Investments (continued) | Rate (%) | Date | Amount ($) | | Value ($) |
| New York (continued) | | | | | |
| New York State Thruway Authority, | | | | | |
| Second General Highway and | | | | | |
| Bridge Trust Fund Bonds | 5.00 | 4/1/26 | 2,500,000 | | 2,653,650 |
| New York State Thruway Authority, | | | | | |
| Second General Highway and | | | | | |
| Bridge Trust Fund Bonds | 5.00 | 4/1/26 | 2,500,000 | | 2,712,325 |
| New York State Thruway Authority, | | | | | |
| Second General Highway and | | | | | |
| Bridge Trust Fund Bonds | 5.00 | 4/1/27 | 3,000,000 | | 3,156,630 |
| New York State Thruway Authority, | | | | | |
| Second General Highway and | | | | | |
| Bridge Trust Fund Bonds | | | | | |
| (Insured; AMBAC) | 5.00 | 4/1/19 | 7,500,000 | | 8,384,400 |
| New York State Thruway Authority, | | | | | |
| Second General Highway and | | | | | |
| Bridge Trust Fund Bonds | | | | | |
| (Insured; AMBAC) | 5.00 | 4/1/22 | 5,000,000 | | 5,352,650 |
| New York State Thruway Authority, | | | | | |
| State Personal Income Tax | | | | | |
| Revenue (Transportation) | 5.25 | 3/15/27 | 3,000,000 | | 3,203,430 |
| New York State Urban Development | | | | | |
| Corporation, Correctional | | | | | |
| Facilities Revenue | 5.50 | 1/1/14 | 3,000,000 | | 3,171,090 |
| New York State Urban Development | | | | | |
| Corporation, Correctional | | | | | |
| Facilities Revenue (Insured; | | | | | |
| Assured Guaranty Municipal Corp.) | 5.50 | 1/1/14 | 3,000,000 | | 3,187,710 |
| New York State Urban Development | | | | | |
| Corporation, State Personal | | | | | |
| Income Tax Revenue (Economic | | | | | |
| Development and Housing) | | | | | |
| (Insured; AMBAC) | 5.00 | 12/15/23 | 2,000,000 | | 2,131,140 |
| New York State Urban Development | | | | | |
| Corporation, State Personal | | | | | |
| Income Tax Revenue (State | | | | | |
| Facilities and Equipment) | | | | | |
| (Insured; FGIC) (Prerefunded) | 5.50 | 3/15/13 | 2,450,000 | d | 2,706,858 |
| New York State Urban Development | | | | | |
| Corporation, State Personal | | | | | |
| Income Tax Revenue (State | | | | | |
| Facilities and Equipment) | | | | | |
| (Insured; FGIC) (Prerefunded) | 5.50 | 3/15/13 | 3,000,000 | d | 3,314,520 |
16
| | | | | |
| Long-Term Municipal | Coupon | Maturity | Principal | | |
| Investments (continued) | Rate (%) | Date | Amount ($) | | Value ($) |
| New York (continued) | | | | | |
| Niagara County Industrial | | | | | |
| Development Agency, Solid | | | | | |
| Waste Disposal Facility | | | | | |
| Revenue (American Ref-Fuel | | | | | |
| Company of Niagara, LP Facility) | 5.55 | 11/15/15 | 3,470,000 | | 3,483,672 |
| North Country Development | | | | | |
| Authority, Solid Waste | | | | | |
| Management System Revenue | | | | | |
| (Insured; Assured Guaranty | | | | | |
| Municipal Corp.) | 6.00 | 5/15/15 | 1,680,000 | | 1,839,180 |
| Orange County Industrial | | | | | |
| Development Agency, Life Care | | | | | |
| Community Revenue (Glenn | | | | | |
| Arden, Inc. Project) | 5.63 | 1/1/18 | 1,685,000 | | 1,502,464 |
| Port Authority of New York and New | | | | | |
| Jersey (Consolidated Bonds, | | | | | |
| 142nd Series) | 5.00 | 7/15/23 | 2,000,000 | | 2,140,140 |
| Port Authority of New York and New | | | | | |
| Jersey (Consolidated Bonds, | | | | | |
| 163rd Series) | 5.00 | 7/15/35 | 5,000,000 | | 5,159,750 |
| Rensselaer County Industrial | | | | | |
| Development Agency, Civic | | | | | |
| Facility Revenue (Emma Willard | | | | | |
| School Project) | 5.00 | 1/1/31 | 2,000,000 | a | 2,016,440 |
| Rensselaer County Industrial | | | | | |
| Development Agency, Civic | | | | | |
| Facility Revenue (Emma Willard | | | | | |
| School Project) | 5.00 | 1/1/36 | 2,000,000 | a | 1,975,960 |
| Rensselaer County Industrial | | | | | |
| Development Agency, Civic | | | | | |
| Facility Revenue (Rensselaer | | | | | |
| Polytechnic Institute Project) | 5.00 | 3/1/36 | 2,000,000 | a | 2,012,240 |
| Schenectady Industrial Development | | | | | |
| Agency, Civic Facility Revenue | | | | | |
| (Union College Project) | 5.00 | 7/1/25 | 2,260,000 | a | 2,378,288 |
| Schenectady Industrial Development | | | | | |
| Agency, Civic Facility Revenue | | | | | |
| (Union College Project) | 5.00 | 7/1/26 | 1,380,000 | a | 1,438,319 |
| Schenectady Industrial Development | | | | | |
| Agency, Civic Facility Revenue | | | | | |
| (Union College Project) | 5.00 | 7/1/31 | 3,335,000 | a | 3,396,631 |
The Fund 17
STATEMENT OF INVESTMENTS (continued)
| | | | | |
| Long-Term Municipal | Coupon | Maturity | Principal | | |
| Investments (continued) | Rate (%) | Date | Amount ($) | | Value ($) |
| New York (continued) | | | | | |
| Suffolk Tobacco Asset | | | | | |
| Securitization Corporation, | | | | | |
| Tobacco Settlement | | | | | |
| Asset-Backed Bonds | 6.00 | 6/1/48 | 5,000,000 | | 4,417,100 |
| Triborough Bridge and | | | | | |
| Tunnel Authority, General | | | | | |
| Purpose Revenue | 6.00 | 1/1/12 | 1,120,000 | | 1,156,165 |
| Triborough Bridge and Tunnel | | | | | |
| Authority, General Purpose | | | | | |
| Revenue (Prerefunded) | 5.50 | 1/1/22 | 2,000,000 | d | 2,484,560 |
| Triborough Bridge and Tunnel | | | | | |
| Authority, General Revenue | | | | | |
| (MTA Bridges and Tunnels) | 5.00 | 11/15/27 | 1,640,000 | | 1,745,632 |
| Triborough Bridge and Tunnel | | | | | |
| Authority, General Revenue | | | | | |
| (MTA Bridges and Tunnels) | 5.00 | 11/15/30 | 4,655,000 | | 4,861,403 |
| Triborough Bridge and Tunnel | | | | | |
| Authority, General Revenue | | | | | |
| (MTA Bridges and Tunnels) | 5.00 | 11/15/33 | 3,000,000 | | 3,088,230 |
| Triborough Bridge and Tunnel | | | | | |
| Authority, Subordinate Revenue | | | | | |
| (Insured; National Public | | | | | |
| Finance Guarantee Corp.) | 5.00 | 11/15/32 | 2,500,000 | | 2,538,125 |
| Westchester Tobacco Asset | | | | | |
| Securitization Corporation, | | | | | |
| Tobacco Settlement | | | | | |
| Asset-Backed Bonds | 5.00 | 6/1/26 | 2,000,000 | | 1,783,260 |
| Westchester Tobacco Asset | | | | | |
| Securitization Corporation, | | | | | |
| Tobacco Settlement | | | | | |
| Asset-Backed Bonds | 5.13 | 6/1/45 | 1,200,000 | | 904,800 |
| U.S. Related—9.7% | | | | | |
| Guam Power Authority, | | | | | |
| Revenue | 5.50 | 10/1/30 | 1,000,000 | | 990,390 |
| Guam Waterworks Authority, | | | | | |
| Water and Wastewater | | | | | |
| System Revenue | 5.63 | 7/1/40 | 1,000,000 | | 940,300 |
18
| | | | | |
| Long-Term Municipal | Coupon | Maturity | Principal | | |
| Investments (continued) | Rate (%) | Date | Amount ($) | | Value ($) |
| U.S. Related (continued) | | | | | |
| Puerto Rico Aqueduct and Sewer | | | | | |
| Authority, Senior Lien Revenue | 6.00 | 7/1/38 | 4,000,000 | | 4,122,480 |
| Puerto Rico Aqueduct and Sewer | | | | | |
| Authority, Senior Lien Revenue | | | | | |
| (Insured; Assured Guaranty | | | | | |
| Municipal Corp.) | 5.00 | 7/1/28 | 2,000,000 | | 2,025,740 |
| Puerto Rico Commonwealth, | | | | | |
| Public Improvement GO | 5.25 | 7/1/14 | 1,000,000 | | 1,057,500 |
| Puerto Rico Commonwealth, | | | | | |
| Public Improvement GO | 6.00 | 7/1/39 | 1,500,000 | | 1,565,295 |
| Puerto Rico Commonwealth, | | | | | |
| Public Improvement GO | | | | | |
| (Prerefunded) | 5.25 | 7/1/16 | 3,045,000 | d | 3,660,973 |
| Puerto Rico Electric Power | | | | | |
| Authority, Power Revenue | 5.25 | 7/1/27 | 4,000,000 | | 4,102,800 |
| Puerto Rico Electric Power | | | | | |
| Authority, Power Revenue | 5.50 | 7/1/38 | 3,000,000 | | 3,035,070 |
| Puerto Rico Electric Power | | | | | |
| Authority, Power Revenue | 5.25 | 7/1/40 | 2,000,000 | | 1,979,160 |
| Puerto Rico Electric Power Authority, | | | | | |
| Power Revenue (Insured; National | | | | | |
| Public Finance Guarantee Corp.) | 5.25 | 7/1/25 | 1,705,000 | | 1,812,398 |
| Puerto Rico Sales Tax Financing | | | | | |
| Corporation, Sales Tax Revenue | | | | | |
| (First Subordinate Series) | 5.38 | 8/1/39 | 2,500,000 | | 2,511,475 |
| Puerto Rico Sales Tax Financing | | | | | |
| Corporation, Sales Tax Revenue | | | | | |
| (First Subordinate Series) | 6.00 | 8/1/39 | 4,000,000 | | 4,246,680 |
| Puerto Rico Sales Tax Financing | | | | | |
| Corporation, Sales Tax Revenue | | | | | |
| (First Subordinate Series) | 6.00 | 8/1/42 | 3,000,000 | | 3,169,830 |
| Virgin Islands Public Finance | | | | | |
| Authority, Revenue (Virgin | | | | | |
| Islands Matching Fund Loan Note) | 5.00 | 10/1/25 | 2,500,000 | | 2,528,900 |
| Total Long-Term Municipal Investments | | | | |
| (cost $379,710,246) | | | | | 390,093,705 |
The Fund 19
STATEMENT OF INVESTMENTS (continued)
| | | | | | | |
| Short-Term Municipal | Coupon | Maturity | Principal | | | | |
| Investments—.2% | Rate (%) | Date | Amount ($) | | | Value ($) | |
| New York; | | | | | | | |
| Metropolitan Transportation | | | | | | | |
| Authority, Transportation | | | | | | | |
| Revenue (LOC; BNP Paribas) | 0.26 | 12/1/10 | 500,000 | | e | 500,000 | |
| New York City, | | | | | | | |
| GO Notes (LOC; JPMorgan | | | | | | | |
| Chase Bank) | 0.29 | 12/1/10 | 300,000 | | e | 300,000 | |
| Total Short-Term Municipal Investments | | | | | | |
| (cost $800,000) | | | | | | 800,000 | |
| |
| Total Investments (cost $380,510,246) | | | 100.5 | % | | 390,893,705 | |
| Liabilities, Less Cash and Receivables | | | (.5 | %) | | (1,813,235 | ) |
| Net Assets | | | 100.0 | % | | 389,080,470 | |
a At November 30, 2010, the fund had $102,188,099 or 26.3% of net assets invested in securities whose payment
of principal and interest is dependent upon revenues generated from education.
b Collateral for floating rate borrowings.
c Security exempt from registration under Rule 144A of the Securities Act of 1933.This security may be resold in
transactions exempt from registration, normally to qualified institutional buyers.At November 30, 2010, this security
had a market value of $4,213,120 or 1.1% of net assets.
d These securities are prerefunded; the date shown represents the prerefunded date. Bonds which are prerefunded are
collateralized by U.S. Government securities which are held in escrow and are used to pay principal and interest on
the municipal issue and to retire the bonds in full at the earliest refunding date.
e Variable rate demand note—rate shown is the interest rate in effect at November 30, 2010. Maturity date represents
the next demand date, or the ultimate maturity date if earlier.
20
| | | |
| Summary of Abbreviations | | |
| |
| ABAG | Association of Bay Area Governments | ACA | American Capital Access |
| AGC | ACE Guaranty Corporation | AGIC | Asset Guaranty Insurance Company |
| AMBAC | American Municipal Bond | ARRN | Adjustable Rate Receipt Notes |
| | Assurance Corporation | | |
| BAN | Bond Anticipation Notes | BPA | Bond Purchase Agreement |
| CIFG | CDC Ixis Financial Guaranty | COP | Certificate of Participation |
| CP | Commercial Paper | EDR | Economic Development Revenue |
| EIR | Environmental Improvement Revenue | FGIC | Financial Guaranty Insurance |
| | | | Company |
| FHA | Federal Housing Administration | FHLB | Federal Home Loan Bank |
| FHLMC | Federal Home Loan Mortgage | FNMA | Federal National |
| | Corporation | | Mortgage Association |
| GAN | Grant Anticipation Notes | GIC | Guaranteed Investment Contract |
| GNMA | Government National | GO | General Obligation |
| | Mortgage Association | | |
| HR | Hospital Revenue | IDB | Industrial Development Board |
| IDC | Industrial Development Corporation | IDR | Industrial Development Revenue |
| LOC | Letter of Credit | LOR | Limited Obligation Revenue |
| LR | Lease Revenue | MFHR | Multi-Family Housing Revenue |
| MFMR | Multi-Family Mortgage Revenue | PCR | Pollution Control Revenue |
| PILOT | Payment in Lieu of Taxes | PUTTERS Puttable Tax-Exempt Receipts |
| RAC | Revenue Anticipation Certificates | RAN | Revenue Anticipation Notes |
| RAW | Revenue Anticipation Warrants | RRR | Resources Recovery Revenue |
| SAAN | State Aid Anticipation Notes | SBPA | Standby Bond Purchase Agreement |
| SFHR | Single Family Housing Revenue | SFMR | Single Family Mortgage Revenue |
| SONYMA | State of New York Mortgage Agency | SWDR | Solid Waste Disposal Revenue |
| TAN | Tax Anticipation Notes | TAW | Tax Anticipation Warrants |
| TRAN | Tax and Revenue Anticipation Notes | XLCA | XL Capital Assurance |
The Fund 21
STATEMENT OF INVESTMENTS (continued)
| | | | | |
| Summary of Combined Ratings (Unaudited) | |
| |
| Fitch | or | Moody’s | or | Standard & Poor’s | Value (%)† |
| AAA | | Aaa | | AAA | 23.8 |
| AA | | Aa | | AA | 35.7 |
| A | | A | | A | 27.0 |
| BBB | | Baa | | BBB | 11.1 |
| BB | | Ba | | BB | 1.0 |
| F1 | | MIG1/P1 | | SP1/A1 | .2 |
| Not Ratedf | | Not Ratedf | | Not Ratedf | 1.2 |
| | | | | | 100.0 |
† Based on total investments.
f Securities which, while not rated by Fitch, Moody’s and Standard & Poor’s, have been determined by the Manager to
be of comparable quality to those rated securities in which the fund may invest.
See notes to financial statements.
22
STATEMENT OF ASSETS AND LIABILITIES
November 30, 2010
| | | | | |
| | | | Cost | Value | |
| Assets ($): | | | | | |
| Investments in securities—See Statement of Investments | | 380,510,246 | 390,893,705 | |
| Cash | | | | 39,247 | |
| Interest receivable | | | | 5,810,371 | |
| Receivable for shares of Beneficial Interest subscribed | | | 266,438 | |
| Prepaid expenses | | | | 28,242 | |
| | | | | 397,038,003 | |
| Liabilities ($): | | | | | |
| Due to The Dreyfus Corporation and affiliates—Note 3(c) | | | 297,848 | |
| Payable for investment securities purchased | | | 5,296,335 | |
| Payable for floating rate notes issued—Note 4 | | | 2,000,000 | |
| Payable for shares of Beneficial Interest redeemed | | | 289,728 | |
| Interest and expense payable related | | | | | |
| to floating rate notes issued—Note 4 | | | | 4,539 | |
| Accrued expenses | | | | 69,083 | |
| | | | | 7,957,533 | |
| Net Assets ($) | | | | 389,080,470 | |
| Composition of Net Assets ($): | | | | | |
| Paid-in capital | | | | 383,131,511 | |
| Accumulated net realized gain (loss) on investments | | | (4,434,500 | ) |
| Accumulated net unrealized appreciation | | | | |
| (depreciation) on investments | | | | 10,383,459 | |
| Net Assets ($) | | | | 389,080,470 | |
| |
| |
| Net Asset Value Per Share | | | | | |
| | Class A | Class B | Class C | Class I | |
| Net Assets ($) | 367,648,972 | 768,845 | 14,109,928 | 6,552,725 | |
| Shares Outstanding | 25,618,412 | 53,568 | 983,074 | 456,631 | |
| Net Asset Value Per Share ($) | 14.35 | 14.35 | 14.35 | 14.35 | |
| |
| See notes to financial statements. | | | | | |
The Fund 23
| | |
| STATEMENT OF OPERATIONS | | |
| Year Ended November 30, 2010 | | |
| |
| |
| |
| |
| Investment Income ($): | | |
| Interest Income | 16,681,717 | |
| Expenses: | | |
| Management fee—Note 3(a) | 1,968,965 | |
| Shareholder servicing costs—Note 3(c) | 1,056,059 | |
| Distribution fees—Note 3(b) | 110,473 | |
| Professional fees | 68,453 | |
| Registration fees | 55,602 | |
| Custodian fees—Note 3(c) | 42,812 | |
| Trustees’ fees and expenses—Note 3(d) | 23,324 | |
| Prospectus and shareholders’ reports | 20,482 | |
| Interest and expense related to floating rate notes issued—Note 4 | 4,539 | |
| Loan commitment fees—Note 2 | 3,472 | |
| Miscellaneous | 42,109 | |
| Total Expenses | 3,396,290 | |
| Less—reduction in expenses due to undertaking—Note 3(a) | (242,492 | ) |
| Less—reduction in fees due to earnings credits—Note 3(c) | (511 | ) |
| Net Expenses | 3,153,287 | |
| Investment Income—Net | 13,528,430 | |
| Realized and Unrealized Gain (Loss) on Investments—Note 4 ($): | | |
| Net realized gain (loss) on investments | 145,796 | |
| Net unrealized appreciation (depreciation) on investments | (6,430 | ) |
| Net Realized and Unrealized Gain (Loss) on Investments | 139,366 | |
| Net Increase in Net Assets Resulting from Operations | 13,667,796 | |
| |
| See notes to financial statements. | | |
24
STATEMENT OF CHANGES IN NET ASSETS
| | | | |
| | Year Ended November 30, | |
| | 2010 | | 2009 | a |
| Operations ($): | | | | |
| Investment income—net | 13,528,430 | | 6,016,562 | |
| Net realized gain (loss) on investments | 145,796 | | (1,480,006 | ) |
| Net unrealized appreciation | | | | |
| (depreciation) on investments | (6,430 | ) | 15,684,951 | |
| Net Increase (Decrease) in Net Assets | | | | |
| Resulting from Operations | 13,667,796 | | 20,221,507 | |
| Dividends to Shareholders from ($): | | | | |
| Investment income—net: | | | | |
| Class A Shares | (12,886,690 | ) | (5,497,423 | ) |
| Class B Shares | (38,874 | ) | (116,713 | ) |
| Class C Shares | (428,106 | ) | (391,303 | ) |
| Class I Shares | (164,680 | ) | (3,615 | ) |
| Total Dividends | (13,518,350 | ) | (6,009,054 | ) |
| Beneficial Interest Transactions ($): | | | | |
| Net proceeds from shares sold: | | | | |
| Class A Shares | 33,381,754 | | 22,628,424 | |
| Class B Shares | 39,163 | | 49,798 | |
| Class C Shares | 3,911,150 | | 3,306,736 | |
| Class I Shares | 7,105,767 | | 1,290,978 | |
| Net assets received in connection | | | | |
| with reorganization—Note 1 | 225,813,343 | | — | |
| Dividends reinvested: | | | | |
| Class A Shares | 9,945,107 | | 4,371,587 | |
| Class B Shares | 27,329 | | 84,295 | |
| Class C Shares | 310,532 | | 282,900 | |
| Class I Shares | 103,668 | | — | |
| Cost of shares redeemed: | | | | |
| Class A Shares | (37,233,189 | ) | (32,272,319 | ) |
| Class B Shares | (949,257 | ) | (4,843,330 | ) |
| Class C Shares | (3,189,396 | ) | (1,540,974 | ) |
| Class I Shares | (1,922,485 | ) | — | |
| Increase (Decrease) in Net Assets from | | | | |
| Beneficial Interest Transactions | 237,343,486 | | (6,641,905 | ) |
| Total Increase (Decrease) in Net Assets | 237,492,932 | | 7,570,548 | |
| Net Assets ($): | | | | |
| Beginning of Period | 151,587,538 | | 144,016,990 | |
| End of Period | 389,080,470 | | 151,587,538 | |
The Fund 25
STATEMENT OF CHANGES IN NET ASSETS (continued)
| | | | |
| | Year Ended November 30, | |
| | 2010 | | 2009 | a |
| Capital Share Transactions: | | | | |
| Class Ab | | | | |
| Shares sold | 2,288,144 | | 1,663,892 | |
| Shares issued in connection | | | | |
| with reorganization—Note 1 | 15,714,220 | | — | |
| Shares issued for dividends reinvested | 683,324 | | 317,643 | |
| Shares redeemed | (2,561,686 | ) | (2,396,738 | ) |
| Net Increase (Decrease) in Shares Outstanding | 16,124,002 | | (415,203 | ) |
| Class Bb | | | | |
| Shares sold | 2,659 | | 3,616 | |
| Shares issued for dividends reinvested | 1,885 | | 6,194 | |
| Shares redeemed | (65,319 | ) | (359,256 | ) |
| Net Increase (Decrease) in Shares Outstanding | (60,775 | ) | (349,446 | ) |
| Class C | | | | |
| Shares sold | 268,085 | | 238,691 | |
| Shares issued for dividends reinvested | 21,365 | | 20,528 | |
| Shares redeemed | (218,633 | ) | (111,436 | ) |
| Net Increase (Decrease) in Shares Outstanding | 70,817 | | 147,783 | |
| Class I | | | | |
| Shares sold | 490,530 | | 90,833 | |
| Shares issued for dividends reinvested | 7,088 | | — | |
| Shares redeemed | (131,820 | ) | — | |
| Net Increase (Decrease) in Shares Outstanding | 365,798 | | 90,833 | |
a From December 15, 2008 (commencement of initial offering) to November 30, 2009 for Class I shares.
b During the period ended November 30, 2010, 17,698 Class B shares representing $254,733, were automatically
converted to 17,703 Class A shares and during the period ended November 30, 2009, 147,629 Class B shares
representing $1,982,428 were automatically converted to 147,629 Class A shares.
See notes to financial statements.
26
FINANCIAL HIGHLIGHTS
The following tables describe the performance for each share class for the fiscal periods indicated.All information (except portfolio turnover rate) reflects financial results for a single fund share.Total return shows how much your investment in the fund would have increased (or decreased) during each period, assuming you had reinvested all dividends and distributions.These figures have been derived from the fund’s financial statements.
| | | | | | | | | | |
| | | | Year Ended November 30, | | | |
| Class A Shares | 2010 | | 2009 | | 2008 | | 2007 | | 2006 | |
| Per Share Data ($): | | | | | | | | | | |
| Net asset value, beginning of period | 14.28 | | 12.93 | | 14.43 | | 14.88 | | 14.80 | |
| Investment Operations: | | | | | | | | | | |
| Investment income—neta | .56 | | .58 | | .56 | | .57 | | .57 | |
| Net realized and unrealized | | | | | | | | | | |
| gain (loss) on investments | .07 | | 1.35 | | (1.44 | ) | (.42 | ) | .33 | |
| Total from Investment Operations | .63 | | 1.93 | | (.88 | ) | .15 | | .90 | |
| Distributions: | | | | | | | | | | |
| Dividends from investment income—net | (.56 | ) | (.58 | ) | (.56 | ) | (.57 | ) | (.58 | ) |
| Dividends from net realized | | | | | | | | | | |
| gain on investments | — | | — | | (.06 | ) | (.03 | ) | (.24 | ) |
| Total Distributions | (.56 | ) | (.58 | ) | (.62 | ) | (.60 | ) | (.82 | ) |
| Net asset value, end of period | 14.35 | | 14.28 | | 12.93 | | 14.43 | | 14.88 | |
| Total Return (%)b | 4.40 | | 15.15 | | (6.36 | ) | 1.06 | | 6.25 | |
| Ratios/Supplemental Data (%): | | | | | | | | | | |
| Ratio of total expenses | | | | | | | | | | |
| to average net assets | .92 | | 1.02 | | .98 | | 1.00 | | .98 | |
| Ratio of net expenses | | | | | | | | | | |
| to average net assets | .85 | | .85 | | .86 | | .89 | | .88 | |
| Ratio of net investment income | | | | | | | | | | |
| to average net assets | 3.81 | | 4.20 | | 3.97 | | 3.93 | | 3.94 | |
| Portfolio Turnover Rate | 10.32 | | 13.34 | | 32.04 | | 17.81 | | 30.45 | |
| Net Assets, end of period ($ x 1,000) | 367,649 | | 135,626 | | 128,135 | | 134,892 | | 142,631 | |
a Based on average shares outstanding at each month end.
b Exclusive of sales charge.
See notes to financial statements.
The Fund 27
FINANCIAL HIGHLIGHTS (continued)
| | | | | | | | | | |
| | | | Year Ended November 30, | | | |
| Class B Shares | 2010 | | 2009 | | 2008 | | 2007 | | 2006 | |
| Per Share Data ($): | | | | | | | | | | |
| Net asset value, beginning of period | 14.28 | | 12.93 | | 14.43 | | 14.88 | | 14.79 | |
| Investment Operations: | | | | | | | | | | |
| Investment income—neta | .47 | | .48 | | .49 | | .49 | | .50 | |
| Net realized and unrealized | | | | | | | | | | |
| gain (loss) on investments | .08 | | 1.37 | | (1.44 | ) | (.41 | ) | .33 | |
| Total from Investment Operations | .55 | | 1.85 | | (.95 | ) | .08 | | .83 | |
| Distributions: | | | | | | | | | | |
| Dividends from investment income—net | (.48 | ) | (.50 | ) | (.49 | ) | (.50 | ) | (.50 | ) |
| Dividends from net realized | | | | | | | | | | |
| gain on investments | — | | — | | (.06 | ) | (.03 | ) | (.24 | ) |
| Total Distributions | (.48 | ) | (.50 | ) | (.55 | ) | (.53 | ) | (.74 | ) |
| Net asset value, end of period | 14.35 | | 14.28 | | 12.93 | | 14.43 | | 14.88 | |
| Total Return (%)b | 3.89 | | 14.55 | | (6.79 | ) | .53 | | 5.71 | |
| Ratios/Supplemental Data (%): | | | | | | | | | | |
| Ratio of total expenses | | | | | | | | | | |
| to average net assets | 1.59 | | 1.62 | | 1.52 | | 1.53 | | 1.50 | |
| Ratio of net expenses | | | | | | | | | | |
| to average net assets | 1.35 | | 1.35 | | 1.36 | | 1.39 | | 1.38 | |
| Ratio of net investment income | | | | | | | | | | |
| to average net assets | 3.34 | | 3.76 | | 3.49 | | 3.41 | | 3.43 | |
| Portfolio Turnover Rate | 10.32 | | 13.34 | | 32.04 | | 17.81 | | 30.45 | |
| Net Assets, end of period ($ x 1,000) | 769 | | 1,633 | | 5,997 | | 11,147 | | 19,390 | |
a Based on average shares outstanding at each month end.
b Exclusive of sales charge.
See notes to financial statements.
28
| | | | | | | | | | |
| | | | Year Ended November 30, | | | |
| Class C Shares | 2010 | | 2009 | | 2008 | | 2007 | | 2006 | |
| Per Share Data ($): | | | | | | | | | | |
| Net asset value, beginning of period | 14.28 | | 12.93 | | 14.43 | | 14.88 | | 14.80 | |
| Investment Operations: | | | | | | | | | | |
| Investment income—neta | .45 | | .47 | | .45 | | .46 | | .47 | |
| Net realized and unrealized | | | | | | | | | | |
| gain (loss) on investments | .07 | | 1.35 | | (1.44 | ) | (.42 | ) | .32 | |
| Total from Investment Operations | .52 | | 1.82 | | (.99 | ) | .04 | | .79 | |
| Distributions: | | | | | | | | | | |
| Dividends from investment income—net | (.45 | ) | (.47 | ) | (.45 | ) | (.46 | ) | (.47 | ) |
| Dividends from net realized | | | | | | | | | | |
| gain on investments | — | | — | | (.06 | ) | (.03 | ) | (.24 | ) |
| Total Distributions | (.45 | ) | (.47 | ) | (.51 | ) | (.49 | ) | (.71 | ) |
| Net asset value, end of period | 14.35 | | 14.28 | | 12.93 | | 14.43 | | 14.88 | |
| Total Return (%)b | 3.62 | | 14.29 | | (7.07 | ) | .30 | | 5.46 | |
| Ratios/Supplemental Data (%): | | | | | | | | | | |
| Ratio of total expenses | | | | | | | | | | |
| to average net assets | 1.68 | | 1.77 | | 1.73 | | 1.75 | | 1.74 | |
| Ratio of net expenses | | | | | | | | | | |
| to average net assets | 1.60 | | 1.60 | | 1.61 | | 1.64 | | 1.63 | |
| Ratio of net investment income | | | | | | | | | | |
| to average net assets | 3.07 | | 3.43 | | 3.22 | | 3.16 | | 3.19 | |
| Portfolio Turnover Rate | 10.32 | | 13.34 | | 32.04 | | 17.81 | | 30.45 | |
| Net Assets, end of period ($ x 1,000) | 14,110 | | 13,031 | | 9,885 | | 8,036 | | 6,553 | |
a Based on average shares outstanding at each month end.
b Exclusive of sales charge.
See notes to financial statements.
The Fund 29
FINANCIAL HIGHLIGHTS (continued)
| | | | |
| | Year Ended November 30, | |
| Class I Shares | 2010 | | 2009 | a |
| Per Share Data ($): | | | | |
| Net asset value, beginning of period | 14.28 | | 12.29 | |
| Investment Operations: | | | | |
| Investment income—netb | .58 | | .47 | |
| Net realized and unrealized | | | | |
| gain (loss) on investments | .07 | | 2.09 | |
| Total from Investment Operations | .65 | | 2.56 | |
| Distributions: | | | | |
| Dividends from investment income—net | (.58 | ) | (.57 | ) |
| Net asset value, end of period | 14.35 | | 14.28 | |
| Total Return (%) | 4.58 | | 21.06 | c |
| Ratios/Supplemental Data (%): | | | | |
| Ratio of total expenses to average net assets | .67 | | .86 | d |
| Ratio of net expenses to average net assets | .67 | | .75 | d |
| Ratio of net investment income to average net assets | 3.97 | | 4.11 | d |
| Portfolio Turnover Rate | 10.32 | | 13.34 | |
| Net Assets, end of period ($ x 1,000) | 6,553 | | 1,297 | |
a From December 15, 2008 (commencement of initial offering) to November 30, 2009.
b Based on average shares outstanding at each month end.
c Not annualized.
d Annualized.
See notes to financial statements.
30
NOTES TO FINANCIAL STATEMENTS
NOTE 1—Significant Accounting Policies:
Dreyfus New York AMT-Free Municipal Bond Fund (the “fund”) is registered under the Investment Company Act of 1940, as amended (the “Act”), as a non-diversified open-end management investment company. The fund’s investment objective is to maximize current income exempt from federal, NewYork state and NewYork city income taxes to the extent consistent with the preservation of capital. The Dreyfus Corporation (the “Manager” or “Dreyfus”), a wholly-owned subsidiary ofThe Bank of NewYork Mellon Corporation (“BNY Mellon”), serves as the fund’s investment adviser.
As of the close of business on January 21, 2010, pursuant to an Agreement and Plan of Reorganization previously approved by the fund’s Board of Trustees, all of the assets, subject to the liabilities of General New York Municipal Bond Fund (“New York Municipal Bond”) were transferred to the fund in exchange for Class A shares of Beneficial Interest of the fund of equal value. Shareholders of New York Municipal Bond received Class A shares of the fund, in an amount equal to the aggregate net asset value of their investment in NewYork Municipal Bond at the time of the exchange.The exchange ratio was 1.3159 to 1.The net asset value of the fund’s shares on the close of business on January 21, 2010 after the reorganization was $14.37 for Class A shares and a total of 15,714,220 Class A shares representing net assets of $225,813,343 (including $6,826,408 net unrealized appreciation on investments) we re issued to shareholders of NewYork Municipal Bond in the exchange.The exchange was a tax-free event to New York Municipal Bond shareholders. For financial reporting purposes, assets received and shares issued by the fund were recorded at fair value; however the cost basis of investments received from NewYork Municipal Bond was carried forward to align ongoing reporting of the fund’s realized and unrealized gains and losses with amounts distributed to shareholders for tax purposes.
The Fund 31
NOTES TO FINANCIAL STATEMENTS (continued)
The net assets and net unrealized appreciation on investments immediately before the acquisition as of the merger date for the acquired funds and as of January 21, 2010 for the fund, were as follows:
| | |
| | Unrealized | |
| | Appreciation ($) | Net Assets ($) |
| New York Municipal Bond—Target Fund | 6,826,408 | 225,813,343 |
| Dreyfus New York AMT-Free | | |
| Municipal Bond Fund-Acquiring Fund | 4,504,724 | 152,345,888 |
| Total | 11,331,132 | 378,159,231 |
Assuming the acquisition of NewYork Municipal Bond had been completed on December 1, 2009, the acquiring fund’s pro forma results in the Statement of Operations during the period ended November 30, 2010 would have been as follows:
| | |
| Net investment income | $ | 14,763,6441 |
| Net realized and unrealized gain | | |
| (loss) on investments | $ | 1,469,6942 |
| Net increase (decrease) in net assets | | |
| resulting from operations | $ | 16,233,338 |
| 1 | $13,528,430 as reported in the Statement of Operations, plus $1,235,214 NewYork Municipal Bond pre-merger. |
| 2 | $139,366 as reported in the Statement of Operations plus $1,330,328 NewYork Municipal Bond pre-merger. |
MBSC Securities Corporation (the “Distributor”), a wholly-owned subsidiary of the Manager, is the distributor of the fund’s shares. The fund is authorized to issue an unlimited number of $.001 par value shares of Beneficial Interest in the following classes of shares: Class A, Class B, Class C and Class I. Class A, Class B and Class C shares are sold primarily to retail investors through financial intermediaries and bear a distribution fee and/or service fee. Class A shares are sold with a front-end sales charge. Class B and Class C shares are subject to a contingent deferred sales charge (“CDSC”). Class B shares automatically convert to Class A shares after six years.The fund no longer offers Class B shares, except in connection with dividend re-investment and permitted exchanges of Class B shares. Class I shares are sold at net asset value per share only to institutional investors. Other differences between the
32
classes include the services offered to and the expenses borne by each class, the allocation of certain transfer agency costs and certain voting rights. Income, expenses (other than expenses attributable to a specific class), and realized and unrealized gains or losses on investments are allocated to each class of shares based on its relative net assets.
The Financial Accounting Standards Board (“FASB”) Accounting Standards Codification (“ASC”) is the exclusive reference of authoritative U.S. generally accepted accounting principles (“GAAP”) recognized by the FASB to be applied by nongovernmental entities. Rules and interpretive releases of the Securities and Exchange Commission (“SEC”) under authority of federal laws are also sources of authoritative GAAP for SEC registrants. The fund’s financial statements are prepared in accordance with GAAP, which may require the use of management estimates and assumptions.Actual results could differ from those estimates.
The fund enters into contracts that contain a variety of indemnifications. The fund’s maximum exposure under these arrangements is unknown.The fund does not anticipate recognizing any loss related to these arrangements.
(a) Portfolio valuation: Investments in securities are valued each business day by an independent pricing service (the “Service”) approved by the Board of Trustees. Investments for which quoted bid prices are readily available and are representative of the bid side of the market in the judgment of the Service are valued at the mean between the quoted bid prices (as obtained by the Service from dealers in such securities) and asked prices (as calculated by the Service based upon its evaluation of the market for such securities). Other investments (which constitute a majority of the portfolio securities) are carried at fair value as determined by the Service, based on methods which include consideration of: yields or prices of municipal securities of comparable quality, coupon, maturity and type; indications as to va lues from dealers; and general market conditions.
The Fund 33
NOTES TO FINANCIAL STATEMENTS (continued)
The fair value of a financial instrument is the amount that would be received to sell an asset or paid to transfer a liability in an orderly transaction between market participants at the measurement date (i.e. the exit price). GAAP establishes a fair value hierarchy that prioritizes the inputs of valuation techniques used to measure fair value.This hierarchy gives the highest priority to unadjusted quoted prices in active markets for identical assets or liabilities (Level 1 measurements) and the lowest priority to unobservable inputs (Level 3 measurements).
Additionally, GAAP provides guidance on determining whether the volume and activity in a market has decreased significantly and whether such a decrease in activity results in transactions that are not orderly. GAAP requires enhanced disclosures around valuation inputs and techniques used during annual and interim periods.
Various inputs are used in determining the value of the fund’s investments relating to fair value measurements.These inputs are summarized in the three broad levels listed below:
Level 1—unadjusted quoted prices in active markets for identical investments.
Level 2—other significant observable inputs (including quoted prices for similar investments, interest rates, prepayment speeds, credit risk, etc.).
Level 3—significant unobservable inputs (including the fund’s own assumptions in determining the fair value of investments).
The inputs or methodology used for valuing securities are not necessarily an indication of the risk associated with investing in those securities.
The following is a summary of the inputs used as of November 30, 2010 in valuing the fund’s investments:
| | | | |
| | | Level 2—Other | Level 3— | |
| | Level 1— | Significant | Significant | |
| | Unadjusted | Observable | Unobservable | |
| | Quoted Prices | Inputs | Inputs | Total |
| Assets ($) | | | | |
| Investments in Securities: | | | |
| Municipal Bonds | — | 390,893,705 | — | 390,893,705 |
34
In January 2010, FASB issued Accounting Standards Update (“ASU”) No. 2010-06 “Improving Disclosures about FairValue Measurements”. The portions of ASU No. 2010-06 which require reporting entities to prepare new disclosures surrounding amounts and reasons for significant transfers in and out of Level 1 and Level 2 fair value measurements as well as inputs and valuation techniques used to measure fair value for both recurring and nonrecurring fair value measurements that fall in either Level 2 or Level 3 have been adopted by the fund. No significant transfers between Level 1 or Level 2 fair value measurements occurred at November 30, 2010. The remaining portion of ASU No. 2010-06 requires reporting entities to make new disclosures about information on purchases, sales, issuances and settlements on a gross basis in the reconciliation of activity in Level 3 fair value measurements. These new and re vised disclosures are required to be implemented for fiscal years beginning after December 15, 2010. Management is currently evaluating the impact that the adoption of this remaining portion of ASU No. 2010-06 may have on the fund’s financial statement disclosures.
(b) Securities transactions and investment income: Securities transactions are recorded on a trade date basis. Realized gains and losses from securities transactions are recorded on the identified cost basis. Interest income, adjusted for accretion of discount and amortization of premium on investments, is earned from settlement date and recognized on the accrual basis.
The fund follows an investment policy of investing primarily in municipal obligations of one state. Economic changes affecting the state and certain of its public bodies and municipalities may affect the ability of issuers within the state to pay interest on, or repay principal of, municipal obligations held by the fund.
(c) Dividends to shareholders: It is the policy of the fund to declare dividends daily from investment income-net; such dividends are paid monthly. Dividends from net realized capital gains, if any, are normally declared and paid annually, but the fund may make distributions on a more frequent basis to comply with the distribution requirements of
The Fund 35
NOTES TO FINANCIAL STATEMENTS (continued)
the Internal Revenue Code of 1986, as amended (the “Code”).To the extent that net realized capital gains can be offset by capital loss carryovers, it is the policy of the fund not to distribute such gains. Income and capital gain distributions are determined in accordance with income tax regulations, which may differ from GAAP.
(d) Federal income taxes: It is the policy of the fund to continue to qualify as a regulated investment company, which can distribute tax exempt dividends, by complying with the applicable provisions of the Code, and to make distributions of income and net realized capital gain sufficient to relieve it from substantially all federal income and excise taxes.
As of and during the period ended November 30, 2010, the fund did not have any liabilities for any uncertain tax positions.The fund recognizes interest and penalties, if any, related to uncertain tax positions as income tax expense in the Statement of Operations. During the period, the fund did not incur any interest or penalties.
Each of the tax years in the four-year period ended November 30, 2010 remains subject to examination by the Internal Revenue Service and state taxing authorities.
At November 30, 2010, the components of accumulated earnings on a tax basis were as follows: undistributed tax exempt income $39,010, accumulated capital losses $4,444,056 and unrealized appreciation $10,398,444. In addition, the fund had $5,429 of capital losses realized after October 31, 2010, which were deferred for tax purposes to the first day of the following fiscal year.
The accumulated capital loss carryover is available for federal income tax purposes to be applied against future net securities profits, if any, realized subsequent to November 30, 2010. If not applied, $2,964,050 of the carryover expires in fiscal 2016 and $1,480,006 expires in fiscal 2017.
The tax character of distributions paid to shareholders during the fiscal periods ended November 30, 2010 and November 30, 2009 were as follows: tax exempt income $13,515,035 and $6,009,054 and ordinary income $3,315 and $0, respectively.
36
During the period ended November 30, 2010, as a result of permanent book to tax differences, primarily due to the tax treatment for amortization adjustments and capital loss carryover from the fund’s merger, the fund decreased accumulated undistributed investment income-net by $10,080, decreased accumulated net realized gain (loss) on investments by $2,086,973 and increased paid-in capital by $2,097,053. Net assets and net asset value per share were not affected by this reclassification.
NOTE 2—Bank Lines of Credit:
The fund participates with other Dreyfus-managed funds in a $225 million unsecured credit facility led by Citibank, N.A. and a $300 million unsecured credit facility provided by The Bank of New York Mellon, a subsidiary of BNY Mellon and an affiliate of Dreyfus (each, a “Facility”), each to be utilized primarily for temporary or emergency purposes, including the financing of redemptions. In connection therewith, the fund has agreed to pay its pro rata portion of commitment fees for each Facility. Interest is charged to the fund based on rates determined pursuant to the terms of the respective Facility at the time of borrowing. During the period ended on November 30, 2010, the fund did not borrow under the Facilities.
NOTE 3—Management Fee and Other Transactions With Affiliates:
(a) Pursuant to a management agreement with the Manager, the management fee is computed at the annual rate of .55% of the value of the fund’s average daily net assets and is payable monthly.The Manager has agreed, until February 28, 2011, to waive receipt of its fees and/or assume the expenses of the fund’s Class A shares so that the expenses (exclusive of taxes, brokerage fees, interest on borrowings, commitment fees and extraordinary expenses) do not exceed .85% of the value of Class A shares’ average daily net assets.The reduction in expenses, pursuant to the undertaking amounted to $228,719 for Class A shares during the period ended November 30, 2010.The Manager has also agreed, until February 28, 2011, to waive receipt of its fees and/or assume the expenses of the
The Fund 37
NOTES TO FINANCIAL STATEMENTS (continued)
fund’s Class B and Class C shares so that the expenses (exclusive of Rule 12b-1 fees, shareholder services fees and certain expenses as described above) do not exceed .60% of the value of the such class’ average daily net assets. The reduction in expenses, pursuant to the undertaking amounted to $2,806 for Class B shares and $10,967 for Class C shares during the period ended November 30, 2010.
During the period ended November 30, 2010, the Distributor retained $10,080 from commissions earned on sales of the fund’s Class A shares and $995 and $1,516 from CDSCs on redemptions of the fund’s Class B and Class C shares, respectively.
(b) Under the Distribution Plan (the “Plan”) adopted pursuant to Rule 12b-1 under the Act, Class B and Class C shares pay the Distributor for distributing their shares at an annual rate of .50% of the value of the average daily net assets of Class B shares and .75% of the value of the average daily net assets of Class C shares. During the period ended November 30, 2010, Class B and Class C shares were charged $5,816 and $104,657, respectively, pursuant to the Plan.
(c) Under the Shareholder Services Plan, Class A, Class B and Class C shares pay the Distributor at an annual rate of .25% of the value of their average daily net assets for the provision of certain services.The services provided may include personal services relating to shareholder accounts, such as answering shareholder inquiries regarding the fund and providing reports and other information, and services related to the maintenance of shareholder accounts. The Distributor may make payments to Service Agents (a securities dealer, financial institution or other industry professional) in respect of these services. The Distributor determines the amounts to be paid to Service Agents. During the period ended November 30, 2010, Class A, Class B and Class C shares were charged $846,807, $2,908 and $34,886, respectively, pursuant t o the Shareholder Services Plan.
38
The fund compensates Dreyfus Transfer, Inc., a wholly-owned subsidiary of the Manager, under a transfer agency agreement for providing personnel and facilities to perform transfer agency services for the fund. During the period ended November 30, 2010, the fund was charged $100,363 pursuant to the transfer agency agreement, which is included in Shareholder servicing costs in the Statement of Operations.
The fund has arrangements with the custodian and cash management bank whereby the fund may receive earnings credits when positive cash balances are maintained, which are used to offset custody and cash management fees. For financial reporting purposes, the fund includes net earnings credits as an expense offset in the Statement of Operations.
The fund compensates The Bank of New York Mellon under a cash management agreement for performing cash management services related to fund subscriptions and redemptions. During the period ended November 30, 2010, the fund was charged $8,411 pursuant to the cash management agreement, which is included in Shareholder servicing costs in the Statement of Operations. These fees were partially offset by earnings credits of $511.
The fund also compensates The Bank of New York Mellon under a custody agreement for providing custodial services for the fund. During the period ended November 30, 2010, the fund was charged $42,812 pursuant to the custody agreement.
During the period ended November 30, 2010, the fund was charged $6,399 for services performed by the Chief Compliance Officer.
The components of “Due to The Dreyfus Corporation and affiliates” in the Statement of Assets and Liabilities consist of: management fees $177,766, Rule 12b-1 distribution plan fees $9,197, shareholder services plan fees $79,556, custodian fees $14,379, chief compliance
The Fund 39
NOTES TO FINANCIAL STATEMENTS (continued)
officer fees $1,152 and transfer agency per account fees $29,049, which are offset against an expense reimbursement currently in effect in the amount of $13,251.
(d) Each Board member also serves as a Board member of other funds within the Dreyfus complex. Annual retainer fees and attendance fees are allocated to each fund based on net assets.
NOTE 4—Securities Transactions:
The aggregate amount of purchases and sales of investment securities, excluding short-term securities, during the period ended November 30, 2010, amounted to $68,977,153 and $35,877,800, respectively.
Inverse Floater Securities: The fund participates in secondary inverse floater structures in which fixed-rate, tax-exempt municipal bonds are transferred to a trust.The trust subsequently issues two or more variable rate securities that are collateralized by the cash flows of the fixed-rate, tax-exempt municipal bonds. One or more of these variable rate securities pays interest based on a short-term floating rate set by a remarketing agent at predetermined intervals. A residual interest tax-exempt security is also created by the trust, which is transferred to the fund, and is paid interest based on the remaining cash flow of the trust, after payment of interest on the other securities and various expenses of the trust.
The fund accounts for the transfer of bonds to the trust as secured borrowings, with the securities transferred remaining in the fund’s investments, and the related floating rate certificate securities reflected as fund liabilities in the Statement of Assets and Liabilities.
The average amount of borrowings outstanding under the inverse floater structure during the period ended November 30, 2010, was approximately $500,000, with a related weighted average annualized interest rate of .91%.
40
The provisions of ASC Topic 815 “Derivatives and Hedging” require qualitative disclosures about objectives and strategies for using derivatives, quantitative disclosures about fair value amounts of gains and losses on derivative instruments and disclosures about credit-risk-related contingent features in derivative agreements.The fund held no derivatives during the period ended November 30, 2010.
At November 30, 2010, the cost of investments for federal income tax purposes was $378,495,261; accordingly, accumulated net unrealized appreciation on investments was $10,398,444, consisting of $13,269,499 gross unrealized appreciation and $2,871,055 gross unrealized depreciation.
The Fund 41
REPORT OF INDEPENDENT REGISTERED
PUBLIC ACCOUNTING FIRM
Shareholders and Board of Trustees
Dreyfus New York AMT-Free Municipal Bond Fund
We have audited the accompanying statement of assets and liabilities of Dreyfus NewYork AMT-Free Municipal Bond Fund, including the statement of investments, as of November 30, 2010, and the related statement of operations for the year then ended, the statement of changes in net assets for each of the two years in the period then ended and financial highlights for each of the periods indicated therein.These financial statements and financial highlights are the responsibility of the Fund’s management. Our responsibility is to express an opinion on these financial statements and financial highlights based on our audits.
We conducted our audits in accordance with the standards of the Public Company Accounting Oversight Board (United States).Those standards require that we plan and perform the audit to obtain reasonable assurance about whether the financial statements and financial highlights are free of material misstatement. We were not engaged to perform an audit of the Fund’s internal control over financial reporting. Our audits included consideration of internal control over financial reporting as a basis for designing audit procedures that are appropriate in the circumstances, but not for the purpose of expressing an opinion on the effectiveness of the Fund’s internal control over financial reporting. Accordingly, we express no such opinion. An audit also includes examining, on a test basis, evidence supporting the amounts and disclosures in the financial statements and financial highlights, assessing the accounting principles used and significant estimates made by management, and evaluating the overall financial statement presentation. Our procedures included confirmation of securities owned as of November 30, 2010 by correspondence with the custodian and others.We believe that our audits provide a reasonable basis for our opinion.
In our opinion, the financial statements and financial highlights referred to above present fairly, in all material respects, the financial position of Dreyfus NewYork AMT-Free Municipal Bond Fund at November 30, 2010, the results of its operations for the year then ended, the changes in its net assets for each of the two years in the period then ended, and the financial highlights for each of the indicated periods, in conformity with U.S. generally accepted accounting principles.

New York, New York
January 28, 2011
42
IMPORTANT TAX INFORMATION (Unaudited)
In accordance with federal tax law, the fund hereby designates all the dividends paid from investment income-net during the fiscal year ended November 30, 2010 as “exempt-interest dividends” (not subject to regular federal income tax, and for individuals who are New York residents, New York state and New York city personal income taxes), except $3,315 that is being designated as an ordinary income distribution for reporting purposes.Where required by federal tax law rules, shareholders will receive notification of their portion of the fund’s taxable ordinary dividends (if any) and capital gains distributions (if any) paid for the 2010 calendar year on Form 1099-DIV and their portion of the fund’s exempt-interest dividends paid for the 2010 calendar year on Form 1099-INT, both of which will be mailed in early 2011.
The Fund 43
INFORMATION ABOUT THE REVIEW AND APPROVAL
OF THE FUND’S MANAGEMENT AGREEMENT (Unaudited)
At a meeting of the Board of Trustees held on July 20, 2010, the Board considered the re-approval for an annual period of the fund’s Management Agreement, pursuant to which the Manager provides the fund with investment advisory and administrative services. The Board members, none of whom are “interested persons” (as defined in the Investment Company Act of 1940, as amended) of the fund, were assisted in their review by independent legal counsel and met with counsel in executive session separate from representatives of the Manager.
Analysis of Nature, Extent and Quality of Services Provided to the Fund. The Board members considered information previously provided to them in a presentation from representatives of the Manager regarding services provided to the fund and other funds in the Dreyfus fund complex, and representatives of the Manager confirmed that there had been no material changes in this information.The Board also discussed the nature, extent and quality of the services provided to the fund by the Manager pursuant to the Management Agreement. The Manager’s representatives reviewed the fund’s distribution of accounts and the relationships the Manager has with various intermediaries and the different needs of each. The Manager’s representatives noted the distribution channels for the fund as well as the diversity of distribution among th e funds in the Dreyfus fund complex, and the Manager’s corresponding need for broad, deep, and diverse resources to be able to provide ongoing shareholder services in each distribution channel, including those of the fund. The Manager provided the number of shareholder accounts in the fund, as well as the fund’s asset size.
The Board members also considered the Manager’s research and portfolio management capabilities and that the Manager also provides oversight of day-to-day fund operations, including fund accounting and administration and assistance in meeting legal and regulatory requirements. The Board members also considered the Manager’s extensive administrative, accounting and compliance infrastructure. The Board also considered portfolio management’s brokerage policies and practices and the standards applied in seeking best execution.
44
Comparative Analysis of the Fund’s Performance, Management Fee and Expense Ratio.The Board members reviewed the fund’s performance and comparisons to a group of comparable funds (the “Performance Group”) and to a broader group of funds (the “Performance Universe”), selected and provided by Lipper, Inc., an independent provider of investment company data.The Board was provided with a description of the methodology Lipper used to select the Performance Group and Performance Universe, as well as the Expense Group and Expense Universe (discussed below).The Board members discussed the results of the comparisons and noted that the fund’s yield performance for the past ten one-year periods ended May 31 (2001-2010) was below the Performance Group median for each reported time period and was variously above, at and below the Performance Universe median for each reported time period. The Board members also noted that the fund’s total return performance for various periods ended May 31, 2010 was below the Performance Group median for each reported time period, but above the Performance Universe median for each reported time period except the one-year period ended May 31, 2010, when it was below the median.The Manager also provided a comparison of the fund’s calendar year total returns to the returns of its Lipper category average for the prior ten calendar years, and the Board members noted that the fund outperformed its Lipper category average in six of the last ten calendar years.The Board members discussed with representatives of the Manager the reasons for the fund’s underperformance compared to the Performance Group medians for the applicable periods, and the Manager’s efforts to improve performance. The Board members also received a presentation from the fund’s primary portfolio man ager during which she discussed the fund’s investment strategy and the factors that affected performance.
The Board members also discussed the fund’s contractual and actual management fee and total expense ratio as compared to a comparable group of funds (the “Expense Group”) that was composed of the same funds included in the Performance Group and a broader group of
The Fund 45
INFORMATION ABOUT THE REVIEW AND APPROVAL OF THE
FUND’S MANAGEMENT AGREEMENT (Unaudited) (continued)
funds (the “Expense Universe”), each selected and provided by Lipper. The Board noted that the fund’s contractual management fee was above the Expense Group median, that the fund’s actual management fee was below the Expense Group and Expense Universe medians and that the fund’s total expense ratio was below the Expense Group median and above the Expense Universe median.The Board members also discussed the Manager’s current undertaking to waive fees and/or reimburse fund expenses, which representatives of the Manager stated would be extended until January 31, 2011.
Representatives of the Manager reviewed with the Board members the fees paid to the Manager or its affiliates by the only mutual fund managed by the Manager or its affiliates with similar investment objectives, policies and strategies, and included in the same Lipper category, as the fund (the “Similar Fund”). The Board members considered the relevance of the fee information provided for the Similar Fund to evaluate the appropriateness and reasonableness of the fund’s management fee. Representatives of the Manager informed the Board members that there were no separate accounts or wrap fee accounts managed by the Manager or its affiliates with similar investment objectives, policies and strategies as the fund.
Analysis of Profitability and Economies of Scale.The Manager’s representatives reviewed the dollar amount of expenses allocated and profit received by the Manager and the method used to determine such expenses and profit.The Board previously had been provided with information prepared by an independent consulting firm regarding the Manager’s approach to allocating costs to, and determining the profitability of, individual funds and the entire Dreyfus mutual fund complex.The Board members also had been informed that the methodology also had been reviewed by an independent registered public accounting firm which, like the consultant, found the methodology to be reasonable.The consulting firm also analyzed where any economies of scale might emerge in connection with the management of a fund. The Board members evaluated the pro fitability analysis in light of the relevant
46
circumstances for the fund and the extent to which economies of scale would be realized if the fund grows and whether fee levels reflect these economies of scale for the benefit of fund shareholders.
The Board members also considered potential benefits to the Manager and its affiliates from acting as investment adviser to the fund and noted that there were no soft dollar arrangements with respect to trading the fund’s portfolio.
It was noted that the Board members should consider the Manager’s profitability with respect to the fund as part of their evaluation of whether the fees under the Management Agreement bear a reasonable relationship to the mix of services provided by the Manager, including the nature, extent and quality of such services and that a discussion of economies of scale is predicated on increasing assets and that, if a fund’s assets had been decreasing, the possibility that the Manager may have realized any economies of scale would be less. It was also noted that the profitability percentage for managing the fund was within the range determined by appropriate court cases to be reasonable given the services rendered and generally superior service levels provided by the Manager.The Board also noted the fee waiver and expense reimbursement arrangement and its effect on the Manager’s profitability.
At the conclusion of these discussions, the Board agreed that it had been furnished with sufficient information to make an informed business decision with respect to continuation of the fund’s Management Agreement. Based on the discussions and considerations as described above, the Board made the following conclusions and determinations.
The Board concluded that the nature, extent and quality of the services provided by the Manager to the fund are adequate and appropriate.
The Board was satisfied with management’s efforts to improve fund performance as discussed at the meeting, and determined to closely monitor the performance of the fund.
The Board concluded that the fee paid to the Manager by the fund was reasonable in light of the considerations described above.
The Fund 47
INFORMATION ABOUT THE REVIEW AND APPROVAL OF THE
FUND’S MANAGEMENT AGREEMENT (Unaudited) (continued)
The Board determined that the economies of scale which may accrue to the Manager and its affiliates in connection with the management of the fund had been adequately considered by the Manager in con- nection with the management fee rate charged to the fund, and that, to the extent in the future it were to be determined that material economies of scale had not been shared with the fund, the Board would seek to have those economies of scale shared with the fund.
The Board members considered these conclusions and determinations, along with the information received on a routine and regular basis throughout the year, and, without any one factor being dispositive, the Board determined that re-approval of the fund’s Management Agreement was in the best interests of the fund and its shareholders.
48
The Fund 49
50
The Fund 51
52
The Fund 53
For More Information
| | | | |
| Ticker Symbols: | Class A: PSNYX | Class B: PRNBX | Class C: PNYCX | Class I: DNYIX |
Telephone Call your financial representative or 1-800-554-4611
Mail The Dreyfus Family of Funds, 144 Glenn Curtiss Boulevard, Uniondale, NY 11556-0144
The fund files its complete schedule of portfolio holdings with the Securities and Exchange Commission (“SEC”) for the first and third quarters of each fiscal year on Form N-Q. The fund's Forms N-Q are available on the SEC’s website at http://www.sec.gov and may be reviewed and copied at the SEC’s Public Reference Room in Washington, DC. Information on the operation of the Public Reference Room may be obtained by calling 1-800-SEC-0330.
Information regarding how the fund voted proxies relating to portfolio securities for the most recent 12-month period ended June 30 is available on the SEC’s website at http://www.sec.gov and without charge, upon request, by calling 1-800-645-6561.

|
| © 2011 MBSC Securities Corporation |
Item 2. Code of Ethics.
The Registrant has adopted a code of ethics that applies to the Registrant's principal executive officer, principal financial officer, principal accounting officer or controller, or persons performing similar functions. There have been no amendments to, or waivers in connection with, the Code of Ethics during the period covered by this Report.
Item 3. Audit Committee Financial Expert.
The Registrant's Board has determined that Joseph S. DiMartino, a member of the Audit Committee of the Board, is an audit committee financial expert as defined by the Securities and Exchange Commission (the "SEC"). Mr. DiMartino is "independent" as defined by the SEC for purposes of audit committee financial expert determinations.
Item 4. Principal Accountant Fees and Services.
(a) Audit Fees. The aggregate fees billed for each of the last two fiscal years (the "Reporting Periods") for professional services rendered by the Registrant's principal accountant (the "Auditor") for the audit of the Registrant's annual financial statements or services that are normally provided by the Auditor in connection with the statutory and regulatory filings or engagements for the Reporting Periods, were $32,444 in 2009 and $32,444 in 2010.
(b) Audit-Related Fees. The aggregate fees billed in the Reporting Periods for assurance and related services by the Auditor that are reasonably related to the performance of the audit of the Registrant's financial statements and are not reported under paragraph (a) of this Item 4 were $5,276 in 2009 and $11,382 in 2010. These services consisted of one or more of the following: (i) agreed upon procedures related to compliance with Internal Revenue Code section 817(h), (ii) security counts required by Rule 17f-2 under the Investment Company Act of 1940, as amended, (iii) advisory services as to the accounting or disclosure treatment of Registrant transactions or events and (iv) advis ory services to the accounting or disclosure treatment of the actual or potential impact to the Registrant of final or proposed rules, standards or interpretations by the Securities and Exchange Commission, the Financial Accounting Standards Boards or other regulatory or standard-setting bodies.
The aggregate fees billed in the Reporting Periods for non-audit assurance and related services by the Auditor to the Registrant's investment adviser (not including any sub-investment adviser whose role is primarily portfolio management and is subcontracted with or overseen by another investment adviser), and any entity controlling, controlled by or under common control with the investment adviser that provides ongoing services to the Registrant ("Service Affiliates"), that were reasonably related to the performance of the annual audit of the Service Affiliate, which required pre-approval by the Audit Committee were $0 in 2009 and $0 in 2010.
(c) Tax Fees. The aggregate fees billed in the Reporting Periods for professional services rendered by the Auditor for tax compliance, tax advice, and tax planning ("Tax Services") were $3,576 in 2009 and $3,496 in 2010. These services consisted of: (i) review or preparation of U.S. federal, state, local and excise tax returns; (ii) U.S. federal, state and local tax planning, advice and assistance regarding statutory, regulatory or administrative developments; (iii) tax advice regarding tax qualification matters and/or treatment of various financial instruments held or proposed to be acquired or held. The aggregate fees billed in the Reporting Periods for Tax Services by the Auditor to Service Affiliates, which r equired pre-approval by the Audit Committee were $0 in 2009 and $0 in 2010.
(d) All Other Fees. The aggregate fees billed in the Reporting Periods for products and services provided by the Auditor, other than the services reported in paragraphs (a) through (c) of this Item, were $41 in 2009 and $130 in 2010. [These services consisted of a review of the Registrant's anti-money laundering program].
The aggregate fees billed in the Reporting Periods for Non-Audit Services by the Auditor to Service Affiliates, other than the services reported in paragraphs (b) through (c) of this Item, which required pre-approval by the Audit Committee, were $0 in 2009 and $0 in 2010.
(e)(1) Audit Committee Pre-Approval Policies and Procedures. The Registrant's Audit Committee has established policies and procedures (the "Policy") for pre-approval (within specified fee limits) of the Auditor's engagements for non-audit services to the Registrant and Service Affiliates without specific case-by-case consideration. The pre-approved services in the Policy can include pre-approved audit services, pre-approved audit-related services, pre-approved tax services and pre-approved all other services. Pre-approval considerations include whether the proposed services are compatible with maintaining the Auditor's independence. Pre-approvals pursuant to the Policy are considered annually.
(e)(2) Note: None of the services described in paragraphs (b) through (d) of this Item 4 were approved by the Audit Committee pursuant to paragraph (c)(7)(i)(C) of Rule 2-01 of Regulation S-X.
(f) None of the hours expended on the principal accountant's engagement to audit the registrant's financial statements for the most recent fiscal year were attributed to work performed by persons other than the principal account's full-time, permanent employees.
Non-Audit Fees. The aggregate non-audit fees billed by the Auditor for services rendered to the Registrant, and rendered to Service Affiliates, for the Reporting Periods were $26,086,988 in 2009 and $33,851,490 in 2010.
Auditor Independence. The Registrant's Audit Committee has considered whether the provision of non-audit services that were rendered to Service Affiliates, which were not pre-approved (not requiring pre-approval), is compatible with maintaining the Auditor's independence.
Item 5. Audit Committee of Listed Registrants.
Not applicable. [CLOSED-END FUNDS ONLY]
Item 6. Investments.
(a) Not applicable.
Item 7. Disclosure of Proxy Voting Policies and Procedures for Closed-End Management Investment Companies.
Not applicable. [CLOSED-END FUNDS ONLY]
Item 8. Portfolio Managers of Closed-End Management Investment Companies.
Not applicable. [CLOSED-END FUNDS ONLY, beginning with reports for periods ended on and after December 31, 2005]
Item 9. Purchases of Equity Securities by Closed-End Management Investment Companies and Affiliated Purchasers.
Not applicable. [CLOSED-END FUNDS ONLY]
Item 10. Submission of Matters to a Vote of Security Holders.
There have been no material changes to the procedures applicable to Item 10.
Item 11. Controls and Procedures.
(a) The Registrant's principal executive and principal financial officers have concluded, based on their evaluation of the Registrant's disclosure controls and procedures as of a date within 90 days of the filing date of this report, that the Registrant's disclosure controls and procedures are reasonably designed to ensure that information required to be disclosed by the Registrant on Form N-CSR is recorded, processed, summarized and reported within the required time periods and that information required to be disclosed by the Registrant in the reports that it files or submits on Form N-CSR is accumulated and communicated to the Registrant's management, including its principal executive and principal financial officers, as appropriate to allow timely decisions regarding required disclosure.
(b) There were no changes to the Registrant's internal control over financial reporting that occurred during the second fiscal quarter of the period covered by this report that have materially affected, or are reasonably likely to materially affect, the Registrant's internal control over financial reporting.
Item 12. Exhibits.
(a)(1) Code of ethics referred to in Item 2.
(a)(2) Certifications of principal executive and principal financial officers as required by Rule 30a-2(a) under the Investment Company Act of 1940.
(a)(3) Not applicable.
(b) Certification of principal executive and principal financial officers as required by Rule 30a-2(b) under the Investment Company Act of 1940.
SIGNATURES
Pursuant to the requirements of the Securities Exchange Act of 1934 and the Investment Company Act of 1940, the Registrant has duly caused this Report to be signed on its behalf by the undersigned, thereunto duly authorized.
Dreyfus New York AMT-Free Municipal Bond Fund
By: /s/ Bradley J. Skapyak |
Bradley J. Skapyak, President |
Date: | January 24, 2011 |
|
Pursuant to the requirements of the Securities Exchange Act of 1934 and the Investment Company Act of 1940, this Report has been signed below by the following persons on behalf of the Registrant and in the capacities and on the dates indicated. |
|
By: /s/ Bradley J. Skapyak |
Bradley J. Skapyak, President |
Date: | January 24, 2011 |
|
By: /s/ James Windels |
James Windels, Treasurer |
Date: | January 24, 2011 |
|
EXHIBIT INDEX
(a)(1) Code of ethics referred to in Item 2.
(a)(2) Certifications of principal executive and principal financial officers as required by Rule 30a-2(a) under the Investment Company Act of 1940. (EX-99.CERT)
(b) Certification of principal executive and principal financial officers as required by Rule 30a-2(b) under the Investment Company Act of 1940. (EX-99.906CERT)