| UNITED STATES |
| SECURITIES AND EXCHANGE COMMISSION |
| Washington, D.C. 20549 |
| FORM N-CSR |
| CERTIFIED SHAREHOLDER REPORT OF REGISTERED MANAGEMENT |
| INVESTMENT COMPANIES |
| Investment Company Act file number: 811-4764 |
| DREYFUS PREMIER MUNICIPAL BOND FUND |
| (Exact name of Registrant as specified in charter) |
| c/o The Dreyfus Corporation |
| 200 Park Avenue |
| New York, New York 10166 |
| (Address of principal executive offices) (Zip code) |
| |
| Mark N. Jacobs, Esq. |
| 200 Park Avenue |
| New York, New York 10166 |
| (Name and address of agent for service) |
| |
| Registrant's telephone number, including area code: (212) 922-6000 |
| Date of fiscal year end: | | 04/30 |
| Date of reporting period: | | 10/31/04 |
| | | | | FORM N-CSR |
| Item 1. | | Reports to Stockholders. | | |
| Dreyfus Premier |
| Municipal Bond Fund |
SEMIANNUAL REPORT October 31, 2004

The views expressed in this report reflect those of the portfolio manager only through the end of the period covered and do not necessarily represent the views of Dreyfus or any other person in the Dreyfus organization. Any such views are subject to change at any time based upon market or other conditions and Dreyfus disclaims any responsibility to update such views.These views may not be relied on as investment advice and, because investment decisions for a Dreyfus fund are based on numerous factors, may not be relied on as an indication of trading intent on behalf of any Dreyfus fund.
Not FDIC-Insured • Not Bank-Guaranteed • May Lose Value
| Contents |
| |
| | | THE FUND |
| |
|
| 2 | | Letter from the Chairman |
| 3 | | Discussion of Fund Performance |
| 6 | | Understanding Your Fund’s Expenses |
| 6 | | Comparing Your Fund’s Expenses |
| With Those of Other Funds |
| 7 | | Statement of Investments |
| 19 | | Statement of Assets and Liabilities |
| 20 | | Statement of Operations |
| 21 | | Statement of Changes in Net Assets |
| 23 | | Financial Highlights |
| 27 | | Notes to Financial Statements |
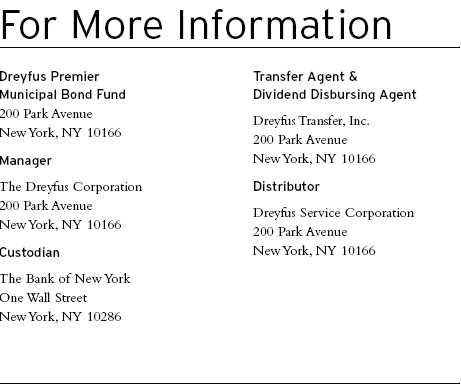
| FOR MORE INFORMATION |
|
| | | Back Cover |
| Dreyfus Premier |
| Municipal Bond Fund |

LETTER FROM THE CHAIRMAN
We are pleased to present this semiannual report for Dreyfus Premier Municipal Bond Fund, covering the six-month period from May 1, 2004, through October 31, 2004. Inside, you’ll find valuable information about how the fund was managed during the reporting period, including a discussion with the fund’s portfolio managers, James Welch and W. Michael Petty.
The Federal Reserve Board has raised short-term interest rates three times since the beginning of the summer, higher commodity prices suggest that inflationary pressures may be rising over the near term and lower federal tax rates have made tax-advantaged investments somewhat less beneficial for many investors. Nonetheless, the municipal bond market is on its way to posting another successful year. In our view, investor demand for municipal bonds has remained strong due to concerns that record energy prices and persistent geopolitical tensions may be eroding the rate of U.S. economic growth.
In uncertain markets such as these, the tax-exempt investments that are right for you depend on your current needs, future goals, tolerance for risk and the composition of your current portfolio. As always, your financial advisor may be in the best position to recommend the specific market sectors that will satisfy most effectively your tax-exempt income and capital preservation needs.
Thank you for your continued confidence and support.

DISCUSSION OF FUND PERFORMANCE
James Welch and W. Michael Petty, Portfolio Managers
How did Dreyfus Premier Municipal Bond Fund perform relative to its benchmark?
For the six-month period ended October 31, 2004, the fund achieved total returns of 5.00% for Class A shares, 4.73% for Class B shares and 4.61% for Class C shares.1 The Lehman Brothers Municipal Bond Index, the fund’s benchmark, achieved a total return of 4.79% for the same period.2 In addition, the fund is reported in the Lipper General Municipal Debt Funds category. Over the reporting period, the average total return for all funds reported in the category was 4.25% .3
On October 13, 2004, Dreyfus Premier Municipal Bond Fund began to offer Class Z shares generally only to shareholders who received Class Z shares in exchange for shares of General Municipal Bond Fund, Inc. — which transferred all of its assets into the fund at the close of business on October 13, 2004. Since its inception through October 31,2004, the fund achieved a total return of 0.60% for Class Z shares.4 On October 14, 2004, W. Michael Petty and James Welch became co-portfolio managers of the fund.
Despite heightened market volatility and higher short-term interest rates, longer-term municipal bonds generally gained value over the reporting period in a market environment characterized by sluggish economic growth and low inflation.The fund’s returns were roughly in line with its benchmark and higher than the Lipper category average, primarily because of the fund’s relatively long average duration — a measure of sensitivity to changing interest rates — which enabled it to participate more fully in market rallies.
What is the fund’s investment approach?
The fund seeks to maximize current income exempt from federal income tax to the extent consistent with the preservation of capital.To pursue its goal, the fund normally invests substantially all of its assets in municipal bonds that provide income exempt from federal income tax. The fund invests at least 70% of its assets in investment-grade municipal
The Fund 3
DISCUSSION OF FUND PERFORMANCE (continued)
|
bonds or the unrated equivalent as determined by Dreyfus.The fund may invest up to 30% of its assets in municipal bonds rated below investment grade or the unrated equivalent as determined by Dreyfus. Under normal market conditions, the dollar-weighted average maturity of the fund’s portfolio is expected to exceed 10 years.
We may buy and sell bonds based on credit quality, market outlook and yield potential. In selecting municipal bonds for investment, the portfolio manager may assess the current interest-rate environment and a municipal bond’s potential volatility in different rate environ-ments.We focus on bonds with the potential to offer attractive current income, typically looking for bonds that can provide consistently attractive current yields or that are trading at competitive market prices. A portion of the fund’s assets may be allocated to “discount” bonds, which are bonds that sell at a price below their face value, or to “premium” bonds, which are bonds that sell at a price above their face value. The fund’s allocation either to discount bonds or to premium bonds will change along with our changing views of the current interest-rate and market environments. We may also look to select bonds that are most likely to obtain attractive prices when sold.
What other factors influenced the fund’s performance?
In the weeks just before the beginning of the reporting period, stronger-than-expected labor statistics and surging oil and gas prices had rekindled investors’ inflation concerns, and municipal bond prices had declined sharply. As inflationary pressures mounted, investors began to revise forward their expectations of the timing of eventual interest-rate hikes from the Federal Reserve Board (the “Fed”). Indeed, between late June and September, the Fed implemented three separate increases of short-term interest rates, driving the overnight federal funds from 1% to 1.75% .
During the summer of 2004, the U.S. economy hit a “soft patch,” and investors’ inflation concerns began to wane. Monthly job statistics failed to match their springtime gains, and higher energy prices threatened to erode the rate of economic growth. As a result, longer-term municipal bonds rallied, erasing their previous losses.At the same time, yields of shorter-term securities rose to reflect higher interest rates,
causing yield differences between shorter-term and longer-term bonds to narrow significantly.
In this environment, the fund benefited from its modest emphasis on bonds in the 20-year range and its lighter-than-average exposure to short-term securities. Because of this “yield curve” positioning, the fund was able to participate more fully in the market’s summertime rally.
When making new purchases, we generally focused on investment-grade, premium-priced bonds with strong liquidity characteristics. Because yield differences between higher-quality (such as AA-rated) and lower-quality (such as BBB-rated) bonds also were relatively narrow during the reporting period, it made little sense to us to assume the risks of lower-rated securities.
What is the fund’s current strategy?
We have continued to maintain the fund’s relatively conservative investment posture.Although we expect the Fed to continue to raise short-term interest rates, several factors currently appear to be constraining the rate of U.S. economic growth, and inflation appears to be under control. At the same time, however, we have attempted to manage risks by maintaining our focus on high-quality, premium-priced bonds, which historically have held more of their value during market declines.
| 1 | | Total return includes reinvestment of dividends and any capital gains paid, and does not take into |
| | | consideration the maximum initial sales charge in the case of Class A shares or the applicable |
| | | contingent deferred sales charges imposed on redemptions in the case of Class B and Class C |
| | | shares. Had these charges been reflected, returns would have been lower. Past performance is no |
| | | guarantee of future results. Share price, yield and investment return fluctuate such that upon |
| | | redemption, fund shares may be worth more or less than their original cost. Income may be subject |
| | | to state and local taxes, and some income may be subject to the federal alternative minimum tax |
| | | (AMT) for certain investors. Capital gains, if any, are fully taxable. |
| 2 | | SOURCE: LIPPER INC. — Reflects reinvestment of dividends and, where applicable, capital |
| | | gain distributions.The Lehman Brothers Municipal Bond Index is a widely accepted, unmanaged |
| | | total return performance benchmark for the long-term, investment-grade, tax-exempt bond market. |
| | | Index returns do not reflect fees and expenses associated with operating a mutual fund. |
| 3 | | Source: Lipper Inc. |
| 4 | | Class Z is not subject to any initial or deferred sales charge. Return figure provided reflects the |
| | | absorption of fund expenses by The Dreyfus Corporation pursuant to an agreement in effect |
| | | through April 30, 2006, at which time it may be extended, modified or terminated. Had these |
| | | expenses not been absorbed, the fund’s return would have been lower. |
| |
| | | The Fund 5 |
U N D E R S TA N D I N G YO U R F U N D ’ S E X P E N S E S ( U n a u d i t e d )
As a mutual fund investor, you pay ongoing expenses, such as management fees and other expenses. Using the information below, you can estimate how these expenses affect your investment and compare them with the expenses of other funds.You also may pay one-time transaction expenses, including sales charges (loads) and redemption fees, which are not shown in this section and would have resulted in higher total expenses. For more information, see your fund’s prospectus or talk to your financial adviser.
Review your fund’s expenses
The table below shows the expenses you would have paid on a $1,000 investment in Dreyfus Premier Municipal Bond Fund from May 1, 2004 to October 31, 2004. It also shows how much a $1,000 investment would be worth at the close of the period, assuming actual returns and expenses.
| Expenses and Value of a $1,000 Investment | | | | | | | | |
| assuming actual returns for the six months ended October 31, 2004† | | | | |
| | | Class A | | Class B | | Class C | | | | Class Z |
| |
| |
| |
| |
| |
|
| Expenses paid per $1,000 †† | | $ 4.81 | | $ 7.53 | | $ 8.61 | | $ | | .43 |
| Ending value (after expenses) | | $1,050.00 | | $1,047.30 | | $1,046.10 | | $1,006.00 |
| |
| COMPARING YOUR FUND’S EXPENSES | | | | | | |
| WITH THOSE OF OTHER FUNDS (Unaudited) | | | | | | |
Using the SEC’s method to compare expenses
The Securities and Exchange Commission (SEC) has established guidelines to help investors assess fund expenses. Per these guidelines, the table below shows your fund’s expenses based on a $1,000 investment, assuming a hypothetical 5% annualized return. You can use this information to compare the ongoing expenses (but not transaction expenses or total cost) of investing in the fund with those of other funds.All mutual fund shareholder reports will provide this information to help you make this comparison. Please note that you cannot use this information to estimate your actual ending account balance and expenses paid during the period.
Expenses and Value of a $1,000 Investment assuming a hypothetical 5% annualized return for the six months ended October 31, 2004†
| | | Class A | | Class B | | Class C | | Class Z |
| |
| |
| |
| |
|
| Expenses paid per $1,000 †† | | $ 4.74 | | $ 7.43 | | $ 8.49 | | $ .42 |
| Ending value (after expenses) | | $1,020.52 | | $1017.85 | | $1,016.79 | | $1,002.04 |
| † | | For Class A, Class B and Class C shares and from October 14, 2004 (commencement of initial offering) to |
| | | October 31, 2004 for Class Z shares. |
| †† | | Expenses are equal to the fund’s annualized expense ratio of .93% for Class A, 1.46% for Class B, 1.67% for |
| | | Class C and .86% for Class Z; multiplied by the average account value over the period, multiplied by 18/365 for |
| | | Class Z and 184/365 for Class A, Class B and Class C (to reflect actual days since inception for Class Z shares |
| | | and one-half year period for Class A, Class B and Class C shares). |
STATEMENT OF INVESTMENTS
October 31, 2004 (Unaudited)
|
| | | Principal | | |
| Long-Term Municipal Investments—95.9% | | Amount ($) | | Value ($) |
| |
| |
|
| Alabama—2.0% | | | | |
| Jefferson County, Sewer Revenue | | | | |
| (Capital Improvement Warrants): | | | | |
| 5.25%, 2/1/2023 (Insured; FGIC) | | | | |
| (Prerefunded 8/1/2012) | | 2,055,000 a | | 2,344,940 |
| 5.125%, 2/1/2039 (Insured; FGIC) | | | | |
| (Prerefunded 2/1/2009) | | 4,000,000 a | | 4,434,080 |
| 5%, 2/1/2042 (Insured; FGIC) | | | | |
| (Prerefunded 8/1/2012) | | 3,030,000 a | | 3,405,811 |
| University of Alabama, HR | | | | |
| 5.75%, 9/1/2020 (Insured; MBIA) | | 3,000,000 | | 3,384,810 |
| Arizona—.4% | | | | |
| Arizona School Facilities Board, Revenue | | | | |
| (State School Improvement) 5.25%, 7/1/2020 | | 2,500,000 | | 2,766,150 |
| Arkansas—.7% | | | | |
| Lake Hamilton, School District Number 005 | | | | |
| (Capital Improvement) 5.50%, 4/1/2029 | | | | |
| (Insured; AMBAC) | | 4,600,000 | | 4,917,906 |
| California—9.9% | | | | |
| California: | | | | |
| 5.625%, 5/1/2018 | | 5,550,000 | | 6,247,080 |
| 5.625%, 5/1/2020 | | 5,715,000 | | 6,426,346 |
| California Department of Water Resources, | | | | |
| Power Supply Revenue: | | | | |
| 6%, 5/1/2015 | | 6,000,000 | | 7,024,080 |
| 5.375%, 5/1/2018 (Insured; AMBAC) | | 5,280,000 | | 5,856,576 |
| California Economic Recovery 5%, 7/1/2017 | | 5,000,000 | | 5,364,150 |
| California Pollution Control Financing Authority, PCR | | | | |
| 9.783%, 6/1/2014 | | 6,355,000 b,c | | 8,742,510 |
| California Public Works Board, LR | | | | |
| (Dept. of Corrections—Corcoran II) | | | | |
| 5.50%, 1/1/2017 (Insured; AMBAC) | | 5,000,000 | | 5,298,400 |
| Foothill/Eastern Transportation Corridor Agency, | | | | |
| Toll Road Revenue | | | | |
| 6%, 1/1/2034 (Prerefunded 1/1/2007) | | 5,000,000 a | | 5,429,050 |
| Golden State Tobacco Securitization Corp., | | | | |
| Tobacco Settlement Revenue (Asset Backed) | | | | |
| 7.90%, 6/1/2042 | | 1,500,000 | | 1,621,575 |
| Lincoln, Special Tax | | | | |
| (Community Facilities District Number 2003-1) | | | | |
| 6%, 9/1/2034 | | 3,500,000 | | 3,590,825 |
| |
| |
| |
| | | The Fund | | 7 |
S T A T E M E N T O F I N V E S T M E N T S ( U n a u d i t e d ) (continued)
| | | Principal | | | | |
| Long-Term Municipal Investments (continued) | | Amount ($) | | Value ($) |
| |
| |
|
| California (continued) | | | | | | |
| Los Angeles Unified School District | | | | | | |
| 5.25%, 7/1/2020 (Insured; FSA) | | 4,000,000 | | | | 4,389,240 |
| Port Oakland, Revenue | | | | | | |
| 5.50%, 11/1/2020 (Insured; FGIC) | | 4,085,000 | | | | 4,490,926 |
| San Diego Unified School District, Election of 1998 | | | | | | |
| 5.50%, 7/1/2023 (Insured; MBIA) | | 3,205,000 | | | | 3,756,292 |
| Colorado—8.2% | | | | | | |
| Arapahoe County Capital Improvement Trust Fund, | | | | | | |
| Highway Revenue (E-470 Project): | | | | | | |
| Zero Coupon, 8/31/2005 | | 2,530,000 | | | | 2,492,657 |
| Zero Coupon, 8/31/2007 (Prerefunded 8/31/2005) | | 4,000,000 | | a | | 3,516,880 |
| 7%, 8/31/2026 (Prerefunded 8/31/2005) | | 11,000,000 | | a | | 11,800,030 |
| Broomfield City and County, COP | | | | | | |
| (Open Space Park and Recreation Facilities) | | | | | | |
| 5.50%, 12/1/2020 (Insured; AMBAC) | | 1,000,000 | | | | 1,119,840 |
| Colorado Educational and Cultural Facilities Authority, | | | | | | |
| LR (Community Colleges of Colorado) | | | | | | |
| 5.50%, 12/1/2021 (Insured; AMBAC) | | 1,100,000 | | | | 1,238,644 |
| Colorado Housing Finance Authority, | | | | | | |
| 7.15%, 10/1/2030 (Insured; FHA) | | 130,000 | | | | 132,411 |
| Denver City and County, Airport Revenue: | | | | | | |
| 6%, 11/15/2017 (Insured; AMBAC) | | 5,000,000 | | | | 5,586,400 |
| 7.50%, 11/15/2023 (Insured; MBIA) | | 9,715,000 | | | | 9,941,262 |
| E-470 Public Highway Authority, Revenue | | | | | | |
| 5.75%, 9/1/2035 (Insured; MBIA) | | 5,500,000 | | | | 6,179,140 |
| Lakewood, MFHR (Insured Mortgage Loan) | | | | | | |
| 6.70%, 10/1/2036 (Insured; FHA) | | 5,000,000 | | | | 5,159,450 |
| Northwest Parkway Public Highway Authority, Revenue: | | | | | | |
| Zero Coupon, 6/15/2027 (Insured; AMBAC) | | 6,125,000 | | | | 1,738,336 |
| 7.125%, 6/15/2041 | | 6,750,000 | | | | 7,198,808 |
| Connecticut—4.0% | | | | | | |
| Connecticut: | | | | | | |
| 9.542%, 6/15/2011 | | 4,000,000 | | b,c | | 5,162,360 |
| 9.042%, 12/15/2015 | | 3,700,000 | | b,c | | 5,027,893 |
| Connecticut Health and Educational Facilities Authority, | | | | | | |
| Revenue: | | | | | | |
| (Saint Francis Hospital & Medical Center) | | | | | | |
| 5.50%, 7/1/2017 | | | | | | |
| (Insured; Radianassurance) | | 4,040,000 | | | | 4,460,928 |
| (University of Hartford) 5.625%, 7/1/2026 | | | | | | |
| (Insured; Radianassurance) | | 4,345,000 | | | | 4,686,821 |
| |
| |
| 8 | | | | | | |
| | | Principal | | |
| Long-Term Municipal Investments (continued) | | Amount ($) | | Value ($) |
| |
| |
|
| Connecticut (continued) | | | | |
| Mashantucket Western Pequot Tribe, | | | | |
| Special Revenue | | | | |
| 5.75%, 9/1/2027 | | 8,000,000 c | | 8,249,280 |
| District of Columbia—1.0% | | | | |
| Washington Convention Center Authority, | | | | |
| Dedicated Tax Revenue (Senior Lien) | | | | |
| 5%, 10/1/2021 (Insured; AMBAC) | | 6,500,000 | | 6,910,735 |
| Florida—.9% | | | | |
| Highlands County Health Facilities Authority, Revenue | | | | |
| (Adventist/Sunbelt) 6%, 11/15/2031 | | 2,500,000 | | 2,688,375 |
| Jacksonville Electric Authority, Revenue | | | | |
| 5.50%, 10/1/2030 | | 3,385,000 | | 3,474,669 |
| Georgia—2.5% | | | | |
| Atlanta and Fulton County Recreation Authority, | | | | |
| Revenue (Downtown Arena Public Improvement) | | | | |
| 5.375%, 12/1/2026 (Insured; MBIA) | | 2,180,000 | | 2,338,071 |
| College Park Business and Industrial Development | | | | |
| Authority, Revenue (Civic Center) | | | | |
| 5.75%, 9/1/2026 (Insured; AMBAC) | | 4,250,000 | | 4,784,607 |
| Georgia 5.25%, 7/1/2017 | | 5,000,000 | | 5,559,150 |
| Milledgeville-Baldwin County Development Authority, | | | | |
| Revenue (Georgia College and | | | | |
| State University Foundation) | | | | |
| 5.50%, 9/1/2024 | | 4,490,000 | | 4,711,537 |
| Illinois—2.7% | | | | |
| Carol Stream, First Mortgage Revenue | | | | |
| (Windsor Park Manor) 6.50%, 12/1/2007 | | 1,445,000 | | 1,538,115 |
| Illinois Development Finance Authority, Revenue | | | | |
| (Community Rehabilitation Providers Facility): | | | | |
| 8.75%, 3/1/2010 | | 107,000 | | 107,775 |
| 8.25%, 8/1/2012 | | 1,365,000 | | 1,275,333 |
| Illinois Educational Facilities Authority, Revenues | | | | |
| (University of Chicago) | | | | |
| 5.125%, 7/1/2038 (Insured; MBIA) | | 5,000,000 | | 5,107,650 |
| Illinois Health Facilities Authority, Revenue | | | | |
| (Residential Centers Inc.) 8.50%, 8/15/2016 | | 4,660,000 | | 4,665,452 |
| Metropolitan Pier and Exposition Authority, | | | | |
| Dedicated State Tax Revenue | | | | |
| (McCormick Place Expansion) | | | | |
| 5.50%, 6/15/2023 (Insured; MBIA) | | 5,000,000 | | 5,493,050 |
| |
| |
| | | The Fund | | 9 |
S T A T E M E N T O F I N V E S T M E N T S ( U n a u d i t e d ) (continued)
| | | Principal | | |
| Long-Term Municipal Investments (continued) | | Amount ($) | | Value ($) |
| |
| |
|
| Kansas—2.4% | | | | |
| Kansas Department of Transportation, | | | | |
| Highway Revenue | | | | |
| 5%, 3/1/2022 | | 5,000,000 | | 5,332,000 |
| Wichita, HR (Via Christi Health System, Inc.): | | | | |
| 6.25%, 11/15/2019 | | 2,000,000 | | 2,248,980 |
| 6.25%, 11/15/2020 | | 3,000,000 | | 3,363,780 |
| Wyandotte County Kansas City | | | | |
| Unified Government, Utility Systems Revenue | | | | |
| 5.65%, 9/1/2022 (Insured; AMBAC) | | 5,000,000 | | 5,837,800 |
| Kentucky���2.1% | | | | |
| Mount Sterling, LR | | | | |
| (Kentucky League of Cities Funding) | | | | |
| 6.10%, 3/1/2018 | | 5,500,000 | | 6,628,160 |
| Pendleton County, Multi-County LR | | | | |
| (Kentucky Association of Counties | | | | |
| Leasing Trust Program) | | | | |
| 6.40%, 3/1/2019 | | 6,000,000 | | 7,409,940 |
| Louisiana—.2% | | | | |
| Saint James Parish, SWDR | | | | |
| (Freeport-McMoran Partnership) | | | | |
| 7.70%, 10/1/2022 | | 1,000,000 | | 1,001,650 |
| Maryland—.3% | | | | |
| Maryland Energy Financing Administration, SWDR | | | | |
| (Wheelabrator Water) 6.45%, 12/1/2016 | | 2,100,000 | | 2,213,106 |
| Massachusetts—3.4% | | | | |
| Massachusetts Health and Educational | | | | |
| Facilities Authority, Revenue: | | | | |
| (Harvard Pilgrim Health) | | | | |
| 5%, 7/1/2014 (Insured; FSA) | | 4,500,000 | | 4,732,695 |
| (Harvard University) 5.75%, 1/15/2012 | | 4,075,000 | | 4,762,086 |
| Massachusetts Industrial Finance Agency, Revenue: | | | | |
| Health Care Facility | | | | |
| (Metro Health Foundation, Inc.) | | | | |
| 6.75%, 12/1/2027 | | 8,000,000 | | 7,762,160 |
| Water Treatment (American Hingham) | | | | |
| 6.95%, 12/1/2035 | | 2,640,000 | | 2,817,487 |
| Route 3 North Transportation | | | | |
| Improvement Association, LR | | | | |
| 5.75%, 6/15/2017 (Insured; MBIA) | | 3,000,000 | | 3,398,430 |
| | | Principal | | | | |
| Long-Term Municipal Investments (continued) | | Amount ($) | | Value ($) |
| |
| |
|
| Michigan—7.1% | | | | | | |
| Dearborn Economic Development Corp., HR | | | | | | |
| (Oakwood Obligation Group) | | | | | | |
| 5.875%, 11/15/2025 (Insured; FGIC) | | 4,950,000 | | | | 5,209,331 |
| Dickinson County Healthcare Systems, HR | | | | | | |
| 5.80%, 11/1/2024 (Insured; ACA) | | 1,930,000 | | | | 2,034,857 |
| Michigan Building Authority, Revenue | | | | | | |
| (Residual Certificates) 8.98%, 10/15/2017 | | 5,000,000 | | b,c | | 6,245,700 |
| Michigan Hospital Finance Authority: | | | | | | |
| HR (Genesys Health Systems): | | | | | | |
| 8.10%, 10/1/2013 (Prerefunded 10/1/2005) | | 2,000,000 | | a | | 2,152,920 |
| 8.125%, 10/1/2021 (Prerefunded 10/1/2005) | | 4,910,000 | | a | | 5,286,499 |
| 7.50%, 10/1/2027 (Prerefunded 10/1/2005) | | 8,000,000 | | a | | 8,413,920 |
| Revenue 8.772%, 11/15/2007 | | 3,225,000 | | b,c | | 3,765,059 |
| Michigan Strategic Fund, SWDR | | | | | | |
| (Genesee Power Station) | | | | | | |
| 7.50%, 1/1/2021 | | 6,900,000 | | | | 6,085,248 |
| Pontiac Tax Increment Finance Authority, | | | | | | |
| Tax Increment Revenue | | | | | | |
| (Development Area Number 3) | | | | | | |
| 6.25%, 6/1/2022 | | 3,250,000 | | | | 3,270,150 |
| Romulus Economic Development Corp., EDR | | | | | | |
| (HIR Limited Partnership) | | | | | | |
| 7%, 11/1/2015 | | | | | | |
| (Insured; ITT Lyndon Property Co. Inc.) | | 5,000,000 | | | | 6,368,500 |
| Minnesota—.6% | | | | | | |
| Chaska, Electric Revenue 6%, 10/1/2025 | | 2,000,000 | | | | 2,159,220 |
| Minnesota Housing Finance Agency, | | | | | | |
| Single Family Mortgage | | | | | | |
| 5.95%, 1/1/2017 | | 935,000 | | | | 983,218 |
| Northfield, HR 6%, 11/1/2026 | | 1,000,000 | | | | 1,054,680 |
| Missouri—1.4% | | | | | | |
| Missouri Development Finance Board, | | | | | | |
| Infrastructure Facilities Revenue (Branson) | | | | | | |
| 5.375%, 12/1/2027 | | 2,470,000 | �� | | | 2,548,299 |
| Missouri Health and Educational Facilities Authority, | | | | | | |
| Health Facilities Revenue | | | | | | |
| (Saint Anthony’s Medical Center) | | | | | | |
| 6.125%, 12/1/2019 | | 4,000,000 | | | | 4,343,120 |
S T A T E M E N T O F I N V E S T M E N T S ( U n a u d i t e d ) (continued)
| | | Principal | | | | |
| Long-Term Municipal Investments (continued) | | Amount ($) | | Value ($) |
| |
| |
|
| Missouri (continued) | | | | | | |
| Missouri Housing Development Commission, SFMR | | | | | | |
| (Homeown Loan) 6.30%, 9/1/2025 | | | | | | |
| (Collateralized; FNMA & GNMA) | | 255,000 | | | | 269,306 |
| Saint Louis Industrial Development Authority, Revenue | | | | | | |
| (Saint Louis Convention) 7.20%, 12/15/2028 | | 2,885,000 | | | | 2,326,176 |
| New Jersey—4.2% | | | | | | |
| Hudson County, COP (Correctional Facility) | | | | | | |
| 5%, 12/1/2021 (Insured; MBIA) | | 6,000,000 | | | | 6,478,440 |
| New Jersey Economic Development Authority, Revenue: | | | | | | |
| 8.532%, 6/1/2015 | | 2,495,000 | | b,c | | 3,026,011 |
| 8.532%, 6/15/2016 | | 2,495,000 | | b,c | | 3,026,011 |
| (School Facilities—Construction 2001): | | | | | | |
| 5.25%, 6/15/2015 (Insured; AMBAC) | | 10,000 | | | | 11,064 |
| 5.25%, 6/15/2016 (Insured; AMBAC) | | 10,000 | | | | 11,064 |
| Special Facility (Continental Airlines Inc.) | | | | | | |
| 7%, 11/15/2030 | | 2,000,000 | | | | 1,583,800 |
| New Jersey Turnpike Authority, Turnpike Revenue: | | | | | | |
| 10.013%, 1/1/2011 (Insured; MBIA) | | 6,350,000 | | b,c | | 8,431,086 |
| 5.50%, 1/1/2030 (Insured; MBIA) | | 6,000,000 | | | | 6,512,640 |
| New Mexico—1.6% | | | | | | |
| Farmington, PCR | | | | | | |
| (Public Service Co.—San Juan) 6.375%, 4/1/2022 | | 1,430,000 | | | | 1,528,098 |
| Jicarilla Apache Nation, Revenue 5.50%, 9/1/2023 | | 5,000,000 | | | | 5,342,350 |
| New Mexico Finance Authority, | | | | | | |
| State Transportation Revenue | | | | | | |
| 5.25%, 6/15/2020 (Insured; MBIA) | | 4,000,000 | | | | 4,411,240 |
| New York—7.2% | | | | | | |
| New York City 5.50%, 3/15/2015 | | 3,500,000 | | | | 3,868,865 |
| New York City Municipal Water Finance Authority, | | | | | | |
| Water & Sewer Systems Revenue | | | | | | |
| 6%, 6/15/2033 (Prerefunded 6/15/2010) | | 3,085,000 | | a | | 3,625,492 |
| New York State Dormitory Authority, Revenues: | | | | | | |
| (City University Systems) 5.50%, 7/1/2018 | | 5,175,000 | | | | 5,652,239 |
| (New York University) 6%, 7/1/2017 (Insured; MBIA) | | 3,500,000 | | | | 4,298,280 |
| (Rochester Institute of Technology) | | | | | | |
| 5.25%, 7/1/2024 (Insured; AMBAC) | | 3,345,000 | | | | 3,578,782 |
| (State University Educational Facilities) | | | | | | |
| 7.50%, 5/15/2013 | | 2,500,000 | | | | 3,221,200 |
| Sales Tax Asset Receivable Corp.: | | | | | | |
| 5.25%, 10/15/2019 (Insured; MBIA) | | 5,000,000 | | d | | 5,594,300 |
| 5%, 10/15/2032 (Insured; AMBAC) | | 4,875,000 | | d | | 5,047,088 |
| |
| |
| 12 | | | | | | |
| | | Principal | | | | |
| Long-Term Municipal Investments (continued) | | Amount ($) | | Value ($) |
| |
| |
|
| New York (continued) | | | | | | |
| Tobacco Settlement Financing Corp., | | | | | | |
| Revenue (Asset Backed) | | | | | | |
| 5.25%, 6/1/2021 (Insured; AMBAC) | | 3,000,000 | | | | 3,239,640 |
| Triborough Bridge and Tunnel Authority, | | | | | | |
| General Purpose Revenues | | | | | | |
| 5.50%, 1/1/2017 (Insured; MBIA) | | 10,000,000 | | | | 11,589,800 |
| North Carolina—2.0% | | | | | | |
| North Carolina Eastern Municipal Power Agency, | | | | | | |
| Power Systems Revenue: | | | | | | |
| 7%, 1/1/2013 | | 3,500,000 | | | | 4,161,325 |
| 6.75%, 1/1/2026 (Insured; ACA) | | 5,000,000 | | | | 5,574,100 |
| North Carolina Medical Care Commission, Revenue | | | | | | |
| (Housing Foundation Inc.): | | | | | | |
| 6.45%, 8/15/2020 (Insured; ACA) | | 1,000,000 | | | | 1,112,780 |
| 6.625%, 8/15/2030 (Insured; ACA) | | 2,565,000 | | | | 2,806,649 |
| Ohio—5.3% | | | | | | |
| Cincinnati, Water Systems Revenue: | | | | | | |
| 5%, 12/1/2020 | | 2,420,000 | | | | 2,594,772 |
| 5%, 12/1/2021 | | 3,825,000 | | | | 4,032,047 |
| Cleveland-Cuyahoga County Port Authority, Revenue | | | | | | |
| (Special Assessment/Tax Increment) | | | | | | |
| 7.35%, 12/1/2031 | | 3,000,000 | | | | 3,182,190 |
| Cuyahoga County: | | | | | | |
| Hospital Facilities Revenue | | | | | | |
| (UHHS/CSAHS Cuyahoga Inc. & | | | | | | |
| CSAHS/UHHS Canton Inc.) | | | | | | |
| 7.50%, 1/1/2030 | | 7,000,000 | | | | 7,759,220 |
| HR (Metrohealth Systems) 6.15%, 2/15/2029 | | 3,115,000 | | | | 3,250,689 |
| Hamilton County, Sales Tax | | | | | | |
| Zero Coupon, 12/1/2025 (Insured; AMBAC) | | 14,865,000 | | | | 5,289,710 |
| Mahoning County, Hospital Facilities Revenue | | | | | | |
| (Forum Health Obligation Group) 6%, 11/15/2032 | | 2,500,000 | | | | 2,647,575 |
| Ohio Water Development Authority, | | | | | | |
| Pollution Control Facilities Revenue | | | | | | |
| (Cleveland Electric) | | | | | | |
| 6.10%, 8/1/2020 (Insured; ACA) | | 7,300,000 | | | | 7,714,421 |
| Oklahoma—2.1% | | | | | | |
| Holdenville Industrial Authority, | | | | | | |
| Correctional Facility Revenue: | | | | | | |
| 6.60%, 7/1/2010 (Prerefunded 7/1/2006) | | 2,045,000 | | a | | 2,242,199 |
| 6.70%, 7/1/2015 (Prerefunded 7/1/2006) | | 4,625,000 | | a | | 5,078,574 |
S T A T E M E N T O F I N V E S T M E N T S ( U n a u d i t e d ) (continued)
| | | Principal | | |
| Long-Term Municipal Investments (continued) | | Amount ($) | | Value ($) |
| |
| |
|
| Oklahoma (continued) | | | | |
| McGee Creek Authority, Water Revenue | | | | |
| 6%, 1/1/2013 (Insured; MBIA) | | 6,025,000 | | 7,122,394 |
| Oregon—.6% | | | | |
| Portland, Sewer Systems Revenue | | | | |
| 5.75%, 8/1/2019 (Insured; FGIC) | | 3,500,000 | | 3,978,380 |
| Pennsylvania—3.3% | | | | |
| Allegheny County Sanitation Authority, | | | | |
| Sewer Revenue 5.375%, 12/1/2024 (Insured; MBIA) | | 13,700,000 | | 14,939,302 |
| Butler County Industrial Development Authority, | | | | |
| Health Care Facilities Revenue | | | | |
| (Saint John Care Center) | | | | |
| 5.85%, 4/20/2036 (Collateralized; GNMA) | | 4,210,000 | | 4,478,598 |
| Montgomery County Higher Education and | | | | |
| Health Authority, Revenue | | | | |
| (First Mortgage—AHF/Montgomery, Inc.) | | | | |
| 10.50%, 9/1/2020 | | 3,145,000 | | 3,168,304 |
| Rhode Island—.7% | | | | |
| Providence, Special Tax Increment Obligation | | | | |
| 6.65%, 6/1/2016 | | 4,500,000 | | 4,553,145 |
| Rhode Island Housing and Mortgage Finance Corp. | | | | |
| (Homeownership Opportunity) | | | | |
| 7.55%, 10/1/2022 | | 355,000 | | 355,419 |
| South Carolina—3.7% | | | | |
| Greenville County School District, | | | | |
| Installment Purchase Revenue | | | | |
| (Building Equity Sooner Tomorrow): | | | | |
| 5.875%, 12/1/2016 | | 6,000,000 | | 6,818,700 |
| 5.50%, 12/1/2028 | | 12,900,000 | | 13,635,687 |
| Greenville Hospital System, | | | | |
| Hospital Facilities Revenue | | | | |
| 5.50%, 5/1/2026 (Insured; AMBAC) | | 4,385,000 | | 4,780,527 |
| Tennessee—1.5% | | | | |
| Memphis Center Revenue Finance Corp., | | | | |
| Sports Facility Revenue (Memphis Redbirds) | | | | |
| 6.50%, 9/1/2028 | | 8,000,000 | | 8,064,880 |
| Shelby County Health Educational and Housing | | | | |
| Facilities Board, MFHR (Cameron) | | | | |
| 7.25%, 7/1/2023 | | 2,755,000 | | 2,374,287 |
| | | Principal | | |
| Long-Term Municipal Investments (continued) | | Amount ($) | | Value ($) |
| |
| |
|
| Texas—4.0% | | | | |
| Alliance Airport Authority, | | | | |
| Special Facilities Revenue | | | | |
| (Federal Express Corp.) 6.375%, 4/1/2021 | | 5,040,000 | | 5,291,849 |
| Austin Convention Enterprises Inc., | | | | |
| Hotel Revenue (Convention Center): | | | | |
| 6.70%, 1/1/2028 | | 5,000,000 | | 5,323,400 |
| 5.75%, 1/1/2032 | | 3,105,000 | | 3,153,965 |
| Dallas-Fort Worth International Airport, | | | | |
| Joint Revenue 5.50%, 11/1/2021 | | | | |
| (Insured; FSA) | | 3,000,000 | | 3,255,960 |
| Sabine River Authority, PCR | | | | |
| (TXU Energy Company LLC) | | | | |
| 6.15%, 8/1/2022 | | 2,995,000 | | 3,251,522 |
| Texas Turnpike Authority, | | | | |
| Central Texas Turnpike System Revenue | | | | |
| 5.75%, 8/15/2038 (Insured; AMBAC) | | 3,500,000 | | 3,920,875 |
| Wichita Falls, Water and Sewer Revenue | | | | |
| 5.375%, 8/1/2024 (Insured; AMBAC) | | 3,000,000 | | 3,262,230 |
| Utah—1.2% | | | | |
| Carbon County, SWDR | | | | |
| (Sunnyside Cogeneration-A) | | | | |
| 7.10%, 8/15/2023 | | 8,649,000 | | 8,478,355 |
| Virginia—.3% | | | | |
| West Point Industrial Development Authority, | | | | |
| SWDR (Chesapeake Corp.) | | | | |
| 6.375%, 3/1/2019 | | 2,000,000 | | 2,000,460 |
| Washington—2.3% | | | | |
| Tobacco Settlement Authority, | | | | |
| Tobacco Settlement Revenue (Asset Backed) | | | | |
| 6.625%, 6/1/2032 | | 2,000,000 | | 1,926,440 |
| Washington Public Power Supply System, Revenue | | | | |
| (Nuclear Project Number 3) | | | | |
| 7.125%, 7/1/2016 (Insured; MBIA) | | 10,425,000 | | 13,644,552 |
| West Virginia—1.4% | | | | |
| Upshur County, SWDR (TJ International) | | | | |
| 7%, 7/15/2025 | | 3,500,000 | | 3,661,875 |
| West Virginia, State Road | | | | |
| 5.75%, 6/1/2025 (Insured; MBIA) | | 2,500,000 | | 2,807,875 |
S T A T E M E N T O F I N V E S T M E N T S ( U n a u d i t e d ) (continued)
| | | Principal | | | | |
| Long-Term Municipal Investments (continued) | | Amount ($) | | Value ($) |
| |
| |
|
| West Virginia (continued) | | | | | | |
| West Virginia Hospital Finance Authority, HR | | | | | | |
| (Charleston Area Medical Center) | | | | | | |
| 6%, 9/1/2012 (Prerefunded 9/1/2010) | | 2,440,000 | | a | | 2,832,425 |
| Wisconsin—2.5% | | | | | | |
| Badger Tobacco Asset Securitization Corp., | | | | | | |
| Tobacco Settlement Revenue | | | | | | |
| 7%, 6/1/2028 | | 13,000,000 | | | | 13,063,310 |
| Wisconsin Health and Educational Facilities Authority, | | | | | | |
| Revenue (Aurora Health Care) | | | | | | |
| 6.40%, 4/15/2033 | | 4,000,000 | | | | 4,262,280 |
| Wyoming—.4% | | | | | | |
| Wyoming Student Loan Corp., Student Loan Revenue | | | | | | |
| 6.25%, 6/1/2029 | | 2,500,000 | | | | 2,676,050 |
| U.S. Related—1.8% | | | | | | |
| Commonwealth of Puerto Rico: | | | | | | |
| 5.65%, 7/1/2015 (Insured; MBIA) | | 4,000,000 | | | | 4,739,800 |
| Public Improvement 5.25%, 7/1/2013 | | | | | | |
| (Insured; MBIA) | | 6,000,000 | | | | 6,883,140 |
| Puerto Rico Public Finance Corp. | | | | | | |
| 6%, 8/1/2026 (Insured; AGC) | | 580,000 | | | | 703,053 |
| Total Long-Term Municipal Investments | | | | | | |
| (cost $613,763,416) | | | | | | 658,793,663 |
| |
| |
| |
|
| |
| Short-Term Municipal Investments—3.7% | | | | | | |
| |
| |
| |
|
| California—.7% | | | | | | |
| California Pollution Control Financing Authority, | | | | | | |
| PCR, VRDN (Pacific Gas & Electric) | | | | | | |
| 1.72% (LOC; Bank One) | | 5,000,000 | | e | | 5,000,000 |
| Connecticut—.1% | | | | | | |
| Connecticut Health and Educational Facilities Authority, | | | | | | |
| Revenue, VRDN (Quinnipac University) 1.73% | | | | | | |
| (Insured; Radianassurance) | | 500,000 | | e | | 500,000 |
| Florida—.7% | | | | | | |
| Broward County Health Facilities Authority, | | | | | | |
| Revenue, VRDN (John Knox Village) | | | | | | |
| 1.83% (Insured; Radianassurance) | | 2,500,000 | | e | | 2,500,000 |
| | | Principal | | | | |
| Short-Term Municipal Investments (continued) | | Amount ($) | | Value ($) |
| |
| |
|
| Florida (continued) | | | | | | |
| Collier County Health Facilities Authority, | | | | | | |
| Revenue, VRDN (Cleveland Clinic Health) | | | | | | |
| 1.74% (LOC; JP Morgan Chase Bank) | | 2,000,000 | | e | | 2,000,000 |
| Dade County Industrial Development Authority, | | | | | | |
| PCR, VRDN (Florida Power and Light Co.) 1.79% | | 400,000 | | e | | 400,000 |
| Pennsylvania—.3% | | | | | | |
| Philadelphia Hospitals and Higher Education | | | | | | |
| Facilities Authority, Revenue, VRDN | | | | | | |
| (Children’s Hospital) 1.74% | | 1,300,000 | | e | | 1,300,000 |
| Schuylkill County Industrial Development Authority, | | | | | | |
| RRR, VRDN (Northeastern Power Co.) | | | | | | |
| 1.75% (LOC; Dexia Credit Locale de France) | | 1,000,000 | | e | | 1,000,000 |
| Tennessee—1.9% | | | | | | |
| Metropolitan Government Nashville and | | | | | | |
| Davidson County, Health and Education | | | | | | |
| Facilities Board, Revenue, VRDN | | | | | | |
| (Vanderbilt University) 1.72% | | 12,900,000 | | e | | 12,900,000 |
| Total Short-Term Municipal Investments | | | | | | |
| (cost $25,600,000) | | | | | | 25,600,000 |
| |
| |
| |
|
| |
| Total Investments (cost $639,363,416) | | 99.6% | | | | 684,393,663 |
| Cash and Receivables (Net) | | .4% | | | | 2,507,679 |
| Net Assets | | 100.0% | | | | 686,901,342 |
S T A T E M E N T O F I N V E S T M E N T S ( U n a u d i t e d ) (continued)
| Summary of Abbreviations | | | | |
| |
| ACA | | American Capital Access | | HR | | Hospital Revenue |
| AGC | | ACE Guaranty Corporation | | LOC | | Letter of Credit |
| AMBAC | | American Municipal Bond | | LR | | Lease Revenue |
| | | | | Assurance Corporation | | MBIA | | Municipal Bond Investors |
| COP | | Certificate of Participation | | | | Assurance Insurance |
| EDR | | Economic Development Revenue | | Corporation |
| FGIC | | Financial Guaranty Insurance | | MFHR | | Multi-Family Housing Revenue |
| | | | | Company | | PCR | | Pollution Control Revenue |
| FHA | | Federal Housing Administration | | RRR | | Resources Recovery Revenue |
| FNMA | | Federal National Mortgage | | SFMR | | Single Family Mortgage Revenue |
| | | | | Association | | SWDR | | Solid Waste Disposal Revenue |
| FSA | | Financial Security Assurance | | VRDN | | Variable Rate Demand Notes |
| GNMA | | Government National Mortgage | | | | |
| | | | | Association | | | | |
| |
| |
| |
| |
|
| |
| |
| |
| Summary of Combined Ratings (Unaudited) | | |
| |
| Fitch | | or Moody’s or | | Standard & Poor’s | | Value (%)† |
| |
| |
| |
|
| AAA | | AAA | | AAA | | 49.1 |
| AA | | Aa | | AA | | 14.8 |
| A | | | | A | | A | | 11.3 |
| BBB | | Baa | | BBB | | 10.9 |
| BB | | Ba | | BB | | 1.3 |
| B | | | | B | | B | | .6 |
| F-1 | | MIG1/ P1 | | SP1/A1 | | 3.6 |
| Not Rated f | | Not Rated f | | Not Rated f | | 8.4 |
| | | | | | | | | 100.0 |
| |
| † | | Based on total investments. | | | | |
| a | | Bonds which are prerefunded are collateralized by U.S. Government securities which are held in escrow and are used |
| | | to pay principal and interest on the municipal issue and to retire the bonds in full at the earliest refunding date. |
| b | | Inverse floater security—the interest rate is subject to change periodically. | | |
| c | | Securities exempt from registration under Rule 144A of the Securities Act of 1933.These securities may be resold |
| | | in transactions exempt from registration, normally to qualified institutional buyers.These securities have been |
| | | determined to be liquid by the Board of Trustees. At October 31, 2004, these securities amounted to $51,675,909 |
| | | or 7.5% of net assets. | | | | |
| d | | Purchased on a delayed delivery basis. | | | | |
| e | | Securities payable on demand.Variable interest rate—subject to periodic change. |
| f | | Securities which, while not rated by Fitch, Moody’s and Standard & Poor’s, have been determined by the Manager to |
| | | be of comparable quality to those rated securities in which the fund may invest. |
| See notes to financial statements. | | | | |
| |
| 18 | | | | | | |
STATEMENT OF ASSETS AND LIABILITIES
October 31, 2004 (Unaudited)
| | | | | | | Cost | | Value |
| |
| |
| |
| |
|
| Assets ($): | | | | | | | | |
| Investments in securities—See Statement of Investments | | 639,363,416 | | 684,393,663 |
| Cash | | | | | | | | 350,765 |
| Interest receivable | | | | | | | | 11,667,890 |
| Receivable for investment securities purchased | | | | | | 3,530,886 |
| Receivable for shares of Beneficial Interest subscribed | | | | 149,626 |
| Prepaid expenses | | | | | | | | 33,173 |
| | | | | | | | | 700,126,003 |
| |
| |
| |
| |
|
| Liabilities ($): | | | | | | | | |
| Due to The Dreyfus Corporation and affiliates—Note 3(c) | | | | 468,004 |
| Payable for investment securities purchased | | | | | | 12,183,539 |
| Payable for shares of Beneficial Interest redeemed | | | | | | 400,426 |
| Accrued expenses | | | | | | | | 172,692 |
| | | | | | | | | 13,224,661 |
| |
| |
| |
| |
|
| Net Assets ($) | | | | | | | | 686,901,342 |
| |
| |
| |
| |
|
| Composition of Net Assets ($): | | | | | | | | |
| Paid-in capital | | | | | | | | 681,492,008 |
| Accumulated undistributed investment income-net | | | | | | 9,496 |
| Accumulated net realized gain (loss) on investments | | | | (39,630,409) |
| Accumulated net unrealized appreciation | | | | | | |
| (depreciation) on investments | | | | | | | | 45,030,247 |
| |
| |
| |
| |
|
| Net Assets ($) | | | | | | | | 686,901,342 |
| |
| |
| |
| |
|
| |
| |
| Net Asset Value Per Share | | | | | | | | |
| | | Class A | | Class B | | Class C | | Class Z |
| |
| |
| |
| |
|
| Net Assets ($) | | 289,939,182 | | 24,792,880 | | 10,433,310 | | 361,735,970 |
| Shares outstanding | | 22,067,458 | | 1,886,238 | | 792,886 | | 27,530,028 |
| |
| |
| |
| |
|
| Net Asset Value Per Share ($) | | 13.14 | | 13.14 | | 13.16 | | 13.14 |
See notes to financial statements.
|
STATEMENT OF OPERATIONS
Six Months Ended October 31, 2004 (Unaudited)
|
| Investment Income ($): | | |
| Interest Income | | 10,110,586 |
| Expenses: | | |
| Management fee—Note 3(a) | | 1,005,011 |
| Shareholder servicing costs—Note 3(c) | | 587,621 |
| Distribution fees—Note 3(b) | | 106,369 |
| Registration fees | | 40,775 |
| Custodian fees | | 24,104 |
| Professional fees | | 11,661 |
| Prospectus and shareholders’ reports | | 8,941 |
| Trustees’ fees and expenses—Note 3(d) | | 6,631 |
| Loan commitment fees—Note 2 | | 1,042 |
| Miscellaneous | | 10,158 |
| Total Expenses | | 1,802,313 |
| Less—reduction in custody fees due to | | |
| earnings credits—Note 1(b) | | (2,801) |
| Net Expenses | | 1,799,512 |
| Investment Income—Net | | 8,311,074 |
| |
|
| Realized and Unrealized Gain (Loss) on Investments-Note 4 ($): |
| Net realized gain (loss) on investments and option transactions | | 1,126,285 |
| Net unrealized appreciation (depreciation) on investments | | 8,471,985 |
| Net Realized and Unrealized Gain (Loss) on Investments | | 9,598,270 |
| Net Increase in Net Assets Resulting from Operations | | 17,909,344 |
See notes to financial statements.
|
STATEMENT OF CHANGES IN NET ASSETS
| | | Six Months Ended | | |
| | | October 31, 2004 | | Year Ended |
| | | (Unaudited) a | | April 30, 2004 |
| |
| |
|
| Operations ($): | | | | |
| Investment income-net | | 8,311,074 | | 16,261,005 |
| Net realized gain (loss) on investments | | 1,126,285 | | (4,489,664) |
| Net unrealized appreciation | | | | |
| (depreciation) on investments | | 8,471,985 | | (1,575,929) |
| Net Increase (Decrease) in Net Assets | | | | |
| Resulting from Operations | | 17,909,344 | | 10,195,412 |
| |
| |
|
| Dividends to Shareholders from ($): | | | | |
| Investment income-net: | | | | |
| Class A shares | | (6,809,612) | | (14,256,130) |
| Class B shares | | (555,207) | | (1,447,639) |
| Class C shares | | (205,839) | | (460,325) |
| Class Z shares | | (802,154) | | |
| Total Dividends | | (8,372,812) | | (16,164,094) |
| |
| |
|
| Beneficial Interest Transactions ($): | | | | |
| Net proceeds from shares sold: | | | | |
| Class A shares | | 10,080,047 | | 35,607,537 |
| Class B shares | | 419,922 | | 3,753,629 |
| Class C shares | | 673,013 | | 2,247,684 |
| Class Z shares | | 2,456,185 | | — |
| Net assets received in connection | | | | |
| with reorganization—Note 1: | | 360,805,920 | | — |
| Dividends reinvested: | | | | |
| Class A shares | | 4,182,148 | | 8,431,974 |
| Class B shares | | 310,681 | | 778,442 |
| Class C shares | | 123,725 | | 269,128 |
| Class Z shares | | 532,827 | | — |
| Cost of shares redeemed: | | | | |
| Class A shares | | (24,677,180) | | (67,691,212) |
| Class B shares | | (6,049,889) | | (17,546,005) |
| Class C shares | | (1,873,749) | | (4,354,852) |
| Class Z shares | | (3,433,975) | | — |
| Increase (Decrease) in Net Assets | | | | |
| from Beneficial Interest Transactions | | 343,549,675 | | (38,503,675) |
| Total Increase (Decrease) in Net Assets | | 353,086,207 | | (44,472,357) |
| |
| |
|
| Net Assets ($): | | | | |
| Beginning of Period | | 333,815,135 | | 378,287,492 |
| End of Period | | 686,901,342 | | 333,815,135 |
| Undistributed investment income—net | | 9,496 | | 66,772 |
| |
| | | | | The Fund 21 |
STATEMENT OF CHANGES IN NET ASSETS (continued)
|
| | | Six Months Ended | | |
| | | October 31, 2004 | | Year Ended |
| | | (Unaudited) a | | April 30, 2004 |
| |
| |
|
| Capital Share Transactions: | | | | |
| Class A b | | | | |
| Shares sold | | 785,903 | | 15,370,781 |
| Shares issued for dividends reinvested | | 323,608 | | 703,863 |
| Shares redeemed | | (1,918,101) | | (19,248,196) |
| Net Increase (Decrease) in Shares Outstanding | | (808,590) | | (3,173,552) |
| |
| |
|
| Class B b | | | | |
| Shares sold | | 32,454 | | 937,925 |
| Shares issued for dividends reinvested | | 24,054 | | 76,169 |
| Shares redeemed | | (469,892) | | (1,034,265) |
| Net Increase (Decrease) in Shares Outstanding | | (413,384) | | (20,171) |
| |
| |
|
| Class C | | | | |
| Shares sold | | 52,445 | | 587,173 |
| Shares issued for dividends reinvested | | 9,559 | | 24,498 |
| Shares redeemed | | (146,748) | | (325,120) |
| Net Increase (Decrease) in Shares Outstanding | | (84,744) | | 286,551 |
| |
| |
|
| Class Z | | | | |
| Shares sold | | 186,923 | | — |
| Shares issued in connection | | | | |
| with reorganization—Note 1 | | 27,563,477 | | — |
| Shares issued for dividends reinvested | | 40,550 | | — |
| Shares redeemed | | (260,922) | | — |
| Net Increase (Decrease) in Shares Outstanding | | 27,530,028 | | — |
| a | | Effective October 14, 2004 (commencement of initial offering) to October 31, 2004, for Class Z shares. |
| b | | During the period ended October 31, 2004, 206,173 Class B shares representing $2,660,757 were automatically |
| | | converted to 206,242 Class A shares and during the period ended April 30, 2004, 413,589 Class B shares |
| | | representing $5,398,765 were automatically converted to 413,719 Class A shares. |
| See notes to financial statements. |
The following tables describe the performance for each share class for the fiscal periods indicated.All information (except portfolio turnover rate) reflects financial results for a single fund share.Total return shows how much your investment in the fund would have increased (or decreased) during each period, assuming you had reinvested all dividends and distributions.These figures have been derived from the fund’s financial statements.

| a As required, effective May 1, 2001, the fund has adopted the provisions of the AICPA Audit and Accounting Guide |
| for Investment Companies and began accreting discount or amortizing premium on a scientific basis for debt securities |
| on a daily basis.The effect of this change for the period ended April 30, 2002 was to increase net investment income |
| per share and decrease net realized and unrealized gain (loss) on investments per share by less than $.01 and increase |
| the ratio of net investment income to average net assets from 5.19% to 5.20%. Per share data and ratios/supplemental |
| data for periods prior to May 1, 2001 have not been restated to reflect this change in presentation. |
| b Based on average shares outstanding at each month end. |
| c Exclusive of sales charge. |
| d Not annualized. |
| e Annualized. |
See notes to financial statements.
The Fund 23
FINANCIAL HIGHLIGHTS (continued)
|
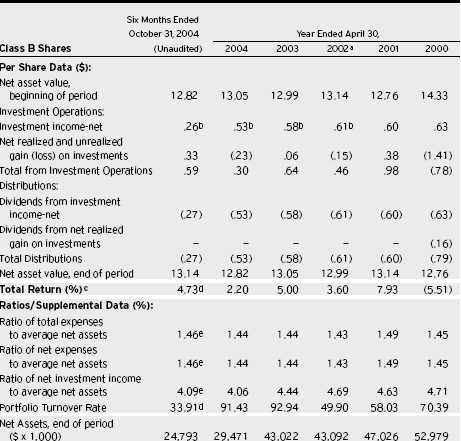
| a | | As required, effective May 1, 2001, the fund has adopted the provisions of the AICPA Audit and Accounting Guide |
| | | for Investment Companies and began accreting discount or amortizing premium on a scientific basis for debt securities |
| | | on a daily basis.The effect of this change for the period ended April 30, 2002 was to increase net investment income |
| | | per share and decrease net realized and unrealized gain (loss) on investments per share by less than $.01 and increase |
| | | the ratio of net investment income to average net assets from 4.68% to 4.69%. Per share data and ratios/supplemental |
| | | data for periods prior to May 1, 2001 have not been restated to reflect this change in presentation. |
| b | | Based on average shares outstanding at each month end. |
| c | | Exclusive of sales charge. |
| d | | Not annualized. |
| e | | Annualized. |
| See notes to financial statements. |
| 24 | | |
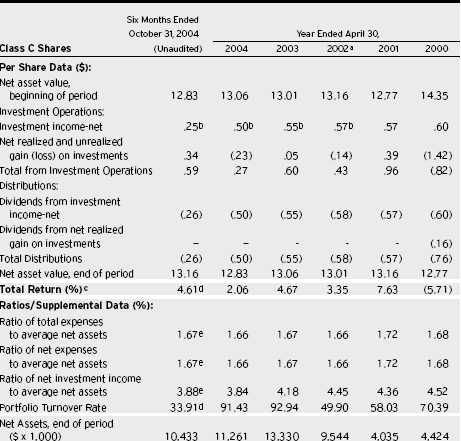
| a As required, effective May 1, 2001, the fund has adopted the provisions of the AICPA Audit and Accounting Guide |
| for Investment Companies and began accreting discount or amortizing premium on a scientific basis for debt securities |
| on a daily basis.The effect of this change for the period ended April 30, 2002 was to increase net investment income |
| per share and decrease net realized and unrealized gain (loss) on investments per share by less than $.01 and increase |
| the ratio of net investment income to average net assets from 4.42% to 4.45%. Per share data and ratios/supplemental |
| data for periods prior to May 1, 2001 have not been restated to reflect this change in presentation. |
| b Based on average shares outstanding at each month end. |
| c Exclusive of sales charge. |
| d Not annualized. |
| e Annualized. |
See notes to financial statements.
The Fund 25
FINANCIAL HIGHLIGHTS (continued)
|
| | | | | Six Months Ended |
| | | | | October 31, 2004 |
| Class Z Shares | | (Unaudited) a |
| |
|
| Per Share Data ($): | | |
| Net asset value, beginning of period | | 13.09 |
| Investment Operations: | | |
| Investment income—net | | .03b |
| Net realized and unrealized gain | | |
| (loss) on investments | | .05 |
| Total from Investment Operations | | .08 |
| Distributions: | | |
| Dividends from investment income—net | | (.03) |
| Dividends from net realized gain on investments | | — |
| Total Distributions | | (.03) |
| Net asset value, end of period | | 13.14 |
| |
|
| Total Return (%) c | | .60d |
| |
|
| Ratios/Supplemental Data (%): | | |
| Ratio of total expenses to average net assets | | .86e |
| Ratio of net expenses to average net assets | | .86e |
| Ratio of net investment income to average net assets | | 4.50e |
| Portfolio Turnover Rate | | 33.91d |
| |
|
| Net Assets, end of period ($ x 1,000) | | 361,736 |
| |
| a | | From October 14, 2004 (commencement of initial offering) to October 31, 2004. |
| b | | Based on average shares outstanding at month end. | | |
| c | | Exclusive of sales charge. | | |
| d | | Not annualized. | | |
| e | | Annualized. | | |
| See notes to financial statements. | | |
NOTES TO FINANCIAL STATEMENTS (Unaudited)
NOTE 1—Significant Accounting Policies:
Dreyfus Premier Municipal Bond Fund (the “fund”) is registered under the Investment Company Act of 1940, as amended (the “Act”), as a diversified open-end management investment company. The fund’s investment objective is to maximize current income exempt from federal income tax to the extent consistent with the preservation of capi-tal.The Dreyfus Corporation (the “Manager” or “Dreyfus”) serves as the fund’s investment adviser.The Manager is a wholly-owned subsidiary of Mellon Financial Corporation (“Mellon Financial”).
On April 6, 2004, the fund’s Board of Trustees approved the addition of Class Z shares, which became effective on October 13, 2004.
As of the close of business on October 13, 2004, pursuant to an Agreement and Plan of Reorganization previously approved by the fund’s Board of Trustees, all of the assets, subject to the liabilities, of General Municipal Bond Fund, Inc. were transferred to the fund. Shareholders of General Municipal Bond Fund, Inc. received Class Z shares of the fund, in an amount equal to the aggregate net asset value of their investment in General Municipal Bond Fund, Inc. at the time of the exchange.The net asset value of the fund’s Class Z shares at the close of business on October 13, 2004, after the reorganization, was $13.09 per share, and a total of 27,563,477 Class Z shares representing net assets of $360,805,920 (including $24,179,912 net unrealized appreciation on investments) were issued to General Municipal Bond Fund, Inc. shareholders in the exchange.The exchange was a tax-free event to shareholders.
Dreyfus Service Corporation (the “Distributor”), a wholly-owned subsidiary of the Manager, is the distributor of the fund’s shares.The fund is authorized to issue an unlimited number of $.001 par value shares of Beneficial Interest in each of the following classes of shares: Class A, Class B, Class C and Class Z. Class A shares are subject to a sales charge imposed at the time of purchase. Class B shares are subject to a contingent deferred sales charge (“CDSC”) imposed on Class B share redemptions made within six years of purchase and automatically con-
NOTES TO FINANCIAL STATEMENTS (Unaudited) (continued)
vert to Class A shares after six years. Class C shares are subject to a CDSC imposed on Class C shares redeemed within one year of purchase. Class Z shares are sold at net asset value per share generally only to shareholders who received Class Z shares in exchange for their shares of General Municipal Bond Fund, Inc. as a result of the reorganization of such fund. Class Z shares generally are not available for new accounts. Other differences between the classes include the services offered to and the expenses borne by each class and certain voting rights. Income, expenses (other than expenses attributable to a specific class), and realized and unrealized gains or losses on investments are allocated to each class of shares based on its relative net assets.
The fund’s financial statements are prepared in accordance with U.S. generally accepted accounting principles, which may require the use of management estimates and assumptions. Actual results could differ from those estimates.
The fund enters into contracts that contain a variety of indemnifications. The fund’s maximum exposure under these arrangements is unknown.The fund does not anticipate recognizing any loss related to these arrangements.
(a) Portfolio valuation: Investments in securities are valued each business day by an independent pricing service (the “Service”) approved by the Board of Trustees. Investments for which quoted bid prices are readily available and are representative of the bid side of the market in the judgment of the Service are valued at the mean between the quoted bid prices (as obtained by the Service from dealers in such securities) and asked prices (as calculated by the Service based upon its evaluation of the market for such securities). Other investments (which constitute a majority of the portfolio securities) are carried at fair value as determined by the Service based on methods which include consideration of: yields or prices of municipal securities of comparable quality, coupon, maturity and type; indications as to values from dealers; and general market conditions. Options and financial futures on municipal and U.S.Treasury securities are valued at the last
sales price on the securities exchange on which such securities are primarily traded or at the last sales price on the national securities market on each business day.
(b) Securities transactions and investment income: Securities transactions are recorded on a trade date basis. Realized gain and loss from securities transactions are recorded on the identified cost basis. Interest income, adjusted for accretion of discount and amortization of premium, is earned from settlement date and recognized on the accrual basis. Securities purchased or sold on a when-issued or delayed-delivery basis may be settled a month or more after the trade date.
The fund has an arrangement with the custodian bank whereby the fund receives earnings credits from the custodian when positive cash balances are maintained, which are used to offset custody fees. For financial reporting purposes, the fund includes net earnings credits as an expense offset in the Statement of Operations.
(c) Dividends to shareholders: It is the policy of the fund to declare dividends daily from investment income-net. Such dividends are paid monthly. Dividends from net realized capital gain, if any, are normally declared and paid annually, but the fund may make distributions on a more frequent basis to comply with the distribution requirements of the Internal Revenue Code of 1986, as amended (the “Code”).To the extent that net realized capital gain can be offset by capital loss carryovers, it is the policy of the fund not to distribute such gain. Income and capital gain distributions are determined in accordance with income tax regulations, which may differ from U.S. generally accepted accounting principles.
(d) Federal income taxes: It is the policy of the fund to continue to qualify as a regulated investment company, which can distribute tax exempt dividends, by complying with the applicable provisions of the Code, and to make distributions of income and net realized capital gain sufficient to relieve it from substantially all federal income and excise taxes.
NOTES TO FINANCIAL STATEMENTS (Unaudited) (continued)
The fund has an unused capital loss carryover of $39,071,105 available for federal income taxes to be applied against future net securities profits, if any, realized subsequent to April 30, 2004. If not applied, $11,182,708 of the carryover expires in fiscal 2008, $9,553,959 expires in fiscal 2009, $4,754,947 expires in fiscal 2010, $5,790,239 expires in fiscal 2011 and $7,789,252 expires in fiscal 2012.
The tax character of distributions paid to shareholders during the fiscal year ended April 30, 2004 was as follows: tax exempt income $16,164,094. The tax character of current year distributions will be determined at the end of the current fiscal year.
NOTE 2—Bank Line of Credit:
|
The fund participates with other Dreyfus-managed funds in a $350 million redemption credit facility (the “Facility”) to be utilized for temporary or emergency purposes, including the financing of redemptions. In connection therewith, the fund has agreed to pay commitment fees on its pro rata portion of the Facility. Interest is charged to the fund based on prevailing market rates in effect at the time of borrowings. During the period ended October 31, 2004, the fund did not borrow under the Facility.
NOTE 3—Management Fee and Other Transactions With Affiliates:
(a) Pursuant to a management agreement with the Manager, the management fee is computed at the annual rate of .55 of 1% of the value of the fund’s average daily net assets and is payable monthly.The Manager has contractually agreed to waive receipt of its fees and/or assume the fund’s expenses, until at least April 30, 2006, so that, the total annual operating expenses of the fund’s Class Z shares (exclusive of taxes, brokerage commissions, interest, commitment fees on borrowings and extraordinary expenses) do not exceed .87 of 1%.
During the period ended October 31, 2004, the Distributor retained $11,236 from commissions earned on sales of the fund’s Class A shares, and $43,104 and $410 from contingent deferred sales charges on redemptions of the fund’s Class B and Class C shares, respectively.
(b) Under the Distribution Plan (the “Plan”) adopted pursuant to Rule 12b-1 under the Act, Class B and Class C shares pay the Distributor for distributing their shares at an annual rate of .50 of 1% of the value of the average daily net assets of Class B shares and .75 of 1% of the value of the average daily net assets of Class C shares. During the period ended October 31, 2004, Class B and Class C shares were charged $67,044 and $39,325, respectively, pursuant to the Plan.
(c) Under the Shareholder Services Plan, Class A, Class B, Class C and Class Z shares pay the Distributor at an annual rate of .25 of 1% of the value of the average daily net assets of Class A, Class B and Class C shares and .20 of 1% of the value of the average daily net assets of Class Z shares, for the provision of certain services.The services provided may include personal services relating to shareholder accounts, such as answering shareholder inquiries regarding the fund and providing reports and other information, and services related to the maintenance of shareholder accounts.The Distributor may make payments to Service Agents (a securities dealer, financial institution or other industry professional) in respect of these services. The Distributor determines the amounts to be paid to Service Agents. During the period ended October 31, 2004, Class A, Class B, Class C and Class Z shares were charged $365,509, $33,522, $13,108 and 35,747 respectively, pursuant to the Shareholder Services Plan.
The fund compensates Dreyfus Transfer, Inc., a wholly-owned subsidiary of the Manager, under a transfer agency agreement for providing personnel and facilities to perform transfer agency services for the fund. During the period ended October 31, 2004, the fund was charged $84,424 pursuant to the transfer agency agreement.
The components of Due to The Dreyfus Corporation and affiliates in the Statement of Assets and Liabilities consist of: management fees $320,502, Rule 12b-1 distribution plan fees $17,163 and shareholder services plan fees $130,339.
(d) Each Board member also serves as a Board member of other funds within the Dreyfus complex. Annual retainer fees and attendance fees are allocated to each fund based on net assets.
NOTES TO FINANCIAL STATEMENTS (Unaudited) (continued)
NOTE 4—Securities Transactions:
|
The aggregate amount of purchases and sales of investment securities, excluding short-term securities, during the period ended October 31, 2004, amounted to $421,762,246 and $125,461,597, respectively.
At October 31, 2004, accumulated net unrealized appreciation on investments was $45,030,247, consisting of $47,770,222 gross unrealized appreciation and $2,739,975 gross unrealized depreciation.
At October 31, 2004, the cost of investments for federal income tax purposes was substantially the same as the cost for financial reporting purposes (see the Statement of Investments).
Two class actions have been filed against Mellon Financial, Mellon Bank, N.A., Dreyfus, Founders Asset Management LLC and the directors of all or substantially all of the Dreyfus funds, on behalf of a purported class and derivatively on behalf of said funds, alleging violations of the Investment Company Act of 1940, the Investment Advisers Act of 1940, and the common law. The complaints alleged, among other things, (i) that 12b-1 fees and directed brokerage were improperly used to pay brokers to recommend Dreyfus funds over other funds, (ii) that such payments were not disclosed to investors, (iii) that economies of scale and soft-dollar benefits were not passed on to investors, and (iv) that 12b-1 fees charged to certain funds that were closed to new investors were also improper. The complaints sought compensatory and punitive damages, rescission of the advisory contracts and an accounting and restitution of any unlawful fees, as well as an award of attorneys fees and litigation expenses. On April 22, 2004, the actions were consolidated under the caption In re Dreyfus Mutual Funds Fee Litigation, and a consolidated amended complaint was filed on September 13, 2004.While adding new parties and claims under state
and federal law, the allegations in the consolidated amended complaint essentially track the allegations in the prior complaints pertaining to 12b-1 fees, directed brokerage, soft dollars and revenue sharing. Dreyfus and the funds believe the allegations to be totally without merit and intend to defend the action vigorously.
Additional lawsuits arising out of these circumstances and presenting similar allegations and requests for relief may be filed against the defendants in the future. Neither Dreyfus nor the Dreyfus funds believe that any of the pending actions will have a material adverse effect on the Dreyfus funds or Dreyfus’ ability to perform its contracts with the Dreyfus funds.
Telephone Call your financial representative or 1-800-554-4611
| Mail | | The Dreyfus Premier Family of Funds |
| | | 144 Glenn Curtiss Boulevard, Uniondale, NY 11556-0144 |
The fund files its complete schedule of portfolio holdings with the Securities and Exchange Commission (“SEC”) for the first and third quarters of each fiscal year on Form N-Q. The fund’s Forms N-Q are available on the SEC’s website at http://www.sec.gov and may be reviewed and copied at the SEC’s Public Reference Room in Washington, DC. Information on the operation of the Public Reference Room may be obtained by calling 1-800-SEC-0330.
Information regarding how the fund voted proxies relating to portfolio securities for the 12-month period ended June 30, 2004, is available on the SEC’s website at http://www.sec.gov and without charge, upon request, by calling 1-800-645-6561.
© 2004 Dreyfus Service Corporation

| Item 2. | | Code of Ethics. |
| | | Not applicable. |
| Item 3. | | Audit Committee Financial Expert. |
| | | Not applicable. |
| Item 4. | | Principal Accountant Fees and Services. |
| | | Not Applicable. |
| Item 5. | | Audit Committee of Listed Registrants. |
| | | Not applicable. |
| Item 6. | | [Reserved] |
| Item 7. | | Disclosure of Proxy Voting Policies and Procedures for Closed-End Management |
| | | Investment Companies. |
| | | Not applicable. |
| Item 8. | | Purchases of Equity Securities by Closed-End Management Investment Companies |
| | | and Affiliated Purchasers. |
| | | Not applicable. |
| Item 9. | | Submission of Matters to a Vote of Security Holders. |
| | | Not applicable. |
| Item 10. | | Controls and Procedures. |
(a) The Registrant's principal executive and principal financial officers have concluded, based on their evaluation of the Registrant's disclosure controls and procedures as of a date within 90 days of the filing date of this report, that the Registrant's disclosure controls and procedures are reasonably designed to ensure that information required to be disclosed by the Registrant on Form N-CSR is recorded, processed, summarized and reported within the required time periods and that information required to be disclosed by the Registrant in the reports that it files or submits on Form N-CSR is accumulated and communicated to the Registrant's management, including its principal executive and principal financial officers, as appropriate to allow timely decisions regarding required disclosure.
(b) There were no changes to the Registrant's internal control over financial reporting that occurred during the Registrant's most recently ended fiscal half-year that have materially affected, or are reasonably likely to materially affect, the Registrant's internal control over financial reporting.
| (a)(1) | | not applicable |
| (a)(2) | | Certifications of principal executive and principal financial officers as required by Rule 30a-2(a) |
| under the Investment Company Act of 1940. |
| (a)(3) | | Not applicable. |
| (b) | | Certification of principal executive and principal financial officers as required by Rule 30a-2(b) |
| under the Investment Company Act of 1940. |
Pursuant to the requirements of the Securities Exchange Act of 1934 and the Investment Company Act of 1940, the Registrant has duly caused this Report to be signed on its behalf by the undersigned, thereunto duly authorized.
| | Dreyfus Premier Municipal Bond Fund
|
| By: | | /s/ Stephen E. Canter |
| | | Stephen E. Canter |
| | | President |
| |
| Date: | | December 28, 2004 |
Pursuant to the requirements of the Securities Exchange Act of 1934 and the Investment Company Act of 1940, this Report has been signed below by the following persons on behalf of the Registrant and in the capacities and on the dates indicated.
| By: | | /s/ Stephen E. Canter |
| | | Stephen E. Canter |
| | | Chief Executive Officer |
| |
| Date: | | December 28, 2004 |
| |
| By: | | /s/ James Windels |
| James Windels |
| | | Chief Financial Officer |
| |
| Date: | | December 28, 2004 |
EXHIBIT INDEX
(a)(2) Certifications of principal executive and principal financial officers as required by Rule 30a-2(a) under the Investment Company Act of 1940. (EX-99.CERT)
(b) Certification of principal executive and principal financial officers as required by Rule 30a-2(b) under the Investment Company Act of 1940. (EX-99.906CERT)