UNITED STATES
SECURITIES AND EXCHANGE COMMISSION
Washington, D.C. 20549
FORM N-CSR
CERTIFIED SHAREHOLDER REPORT OF REGISTERED MANAGEMENT
INVESTMENT COMPANIES
Investment Company Act file number | 811-4764 |
| |
| Dreyfus Municipal Bond Opportunity Fund | |
| (Exact name of Registrant as specified in charter) | |
| | |
| c/o The Dreyfus Corporation 200 Park Avenue New York, New York 10166 | |
| (Address of principal executive offices) (Zip code) | |
| | |
| Michael A. Rosenberg, Esq. 200 Park Avenue New York, New York 10166 | |
| (Name and address of agent for service) | |
|
Registrant's telephone number, including area code: | (212) 922-6000 |
| |
Date of fiscal year end: | 4/30 | |
Date of reporting period: | 4/30/11 | |
| | | | | | | |
FORM N-CSR
Item 1. Reports to Stockholders.
Save time. Save paper. View your next shareholder report online as soon as it’s available. Log into www.dreyfus.com and sign up for Dreyfus eCommunications. It’s simple and only takes a few minutes.
The views expressed in this report reflect those of the portfolio manager only through the end of the period covered and do not necessarily represent the views of Dreyfus or any other person in the Dreyfus organization. Any such views are subject to change at any time based upon market or other conditions and Dreyfus disclaims any responsibility to update such views.These views may not be relied on as investment advice and, because investment decisions for a Dreyfus fund are based on numerous factors, may not be relied on as an indication of trading intent on behalf of any Dreyfus fund.
Not FDIC-Insured • Not Bank-Guaranteed • May Lose Value
| | Contents |
| | THE FUND |
| 2 | A Letter from the Chairman and CEO |
| 3 | Discussion of Fund Performance |
| 6 | Fund Performance |
| 8 | Understanding Your Fund’s Expenses |
| 8 | Comparing Your Fund’s Expenses With Those of Other Funds |
| 9 | Statement of Investments |
| 25 | Statement of Assets and Liabilities |
| 26 | Statement of Operations |
| 27 | Statement of Changes in Net Assets |
| 29 | Financial Highlights |
| 33 | Notes to Financial Statements |
| 42 | Report of Independent Registered Public Accounting Firm |
| 43 | Important Tax Information |
| 44 | Board Members Information |
| 46 | Officers of the Fund |
| | FOR MORE INFORMATION |
| | Back Cover |
Dreyfus Municipal
Bond Opportunity Fund
The Fund

A LETTER FROM THE CHAIRMAN AND CEO
Dear Shareholder:
We are pleased to present this annual report for Dreyfus Municipal Bond Opportunity Fund, covering the 12-month period from May 1, 2010, through April 30, 2011.
Multiple crosscurrents have influenced the U.S. and global economies.A modest slowdown earlier in 2010 gave way to renewed strength during the reporting period.The recovery has been fueled by three important characteristics. First, macroeconomic policy has been stimulative in the United States and most of the developed world. Second, in response to inflation worries emerging countries have shifted policy from aggressively stimulative to neutral, but not restrictive, supporting ongoing demand for commodities. Third, corporate balance sheets have strengthened due to cheap bond financing, rising profits and relatively slow growth in corporate spending.
Within the municipal bond market, however, headline risks stemming from state and local budget pressures and changes to the supply-and-demand dynamics caused by the end of the federal financing subsidies led to significant price pressures during the latter part of the reporting period. Despite recent challenges, we believe that long-term municipal bond market fundamentals remain sound and current market conditions could give rise to attractive buying opportunities. As always, your financial advisor can help you align your investment portfolio with the opportunities and challenges that the future may have in store.
For information about how the fund performed during the reporting period, as well as general market perspectives, we provide a Discussion of Fund Performance on the pages that follow.
Thank you for your continued confidence and support.

Jonathan R. Baum
Chairman and Chief Executive Officer
The Dreyfus Corporation
May 16, 2011
2

DISCUSSION OF FUND PERFORMANCE
For the period of May 1, 2010, through April 30, 2011, as provided by James Welch and Mountaga Aw, Portfolio Managers
Fund and Market Performance Overview
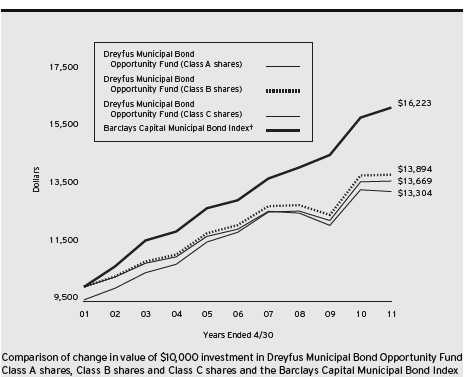
For the 12-month period ended April 30, 2011, the Class A, Class B, Class C and Class Z shares of Dreyfus Municipal Bond Opportunity Fund produced total returns of 0.20%, –0.49%, –0.46% and 0.34%, respectively.1 In comparison, the Barclays Capital Municipal Bond Index, the fund’s benchmark index, achieved a total return of 2.20% for the same period.2
Municipal bonds encountered heightened volatility over the second half of the reporting period amid rising long-term interest rates and changing supply-and-demand dynamics. The fund produced lower returns than its benchmark, primarily due to overweighted exposure to lower-rated and longer-term bonds, which lagged their higher-rated and shorter-term counterparts, respectively.
The Fund’s Investment Approach
The fund seeks to maximize current income exempt from federal income tax to the extent consistent with the preservation of capital.To pursue its goal, the fund normally invests substantially all of its assets in municipal bonds that provide income exempt from federal income tax. The fund invests at least 70% of its assets in investment-grade municipal bonds or the unrated equivalent as determined by Dreyfus.The fund may invest up to 30% of its assets in municipal bonds rated below investment grade or the unrated equivalent as determined by Dreyfus. Under normal market conditions, the dollar-weighted average maturity of the fund’s portfolio is expected to exceed 10 years.
In managing the fund, we focus on identifying undervalued sectors and securities, and we minimize the use of interest-rate forecasting.We select municipal bonds using fundamental analysis to estimate the relative value of various sectors and securities, and to exploit pricing inefficiencies in the municipal bond market. In addition, we trade among the market’s various sectors—such as the pre-refunded, general obligation and
DISCUSSION OF FUND PERFORMANCE (continued)
revenue sectors—based on their apparent relative values. The fund generally will invest simultaneously in several of these sectors.
Changing Market Forces Derailed Municipal Bonds
Municipal bonds fared relatively well over the first half of the reporting period, when a subpar economic recovery kept inflationary pressures at bay and the federally subsidized Build America Bonds program diverted a substantial amount of new bond issuance to the taxable bond market. However, the U.S. economic recovery gained traction in the fall of 2010 after a new round of quantitative easing of monetary policy, sparking a rise in longer-term interest rates, and municipal bond prices fell.
Furthermore, the market’s supply-and-demand dynamics deteriorated as it became clearer that the federal Build America Bonds program would be allowed to expire at the end of 2010. Investors sold longer-maturity bonds in anticipation of a surge in the supply of newly issued securities as states and municipalities rushed to lock in federal subsidies toward year-end. Finally, most states continued to struggle with fiscal pressures.
The market showed signs of stabilization over the first four months of 2011, when the supply of newly issued municipal bonds declined sharply. In addition, investor demand recovered when individuals reacted to higher state income taxes, and institutional investors regarded municipal bonds as inexpensively valued.
Longer-Term Holdings Dampened Relative Returns
The fund’s relative performance was undermined by overweighted exposure to longer-term bonds when interest rates climbed. In addition, the fund’s relatively heavy exposure to bonds backed by revenues from health care facilities and the state’s settlement of litigation with U.S. tobacco companies hurt its results compared to the benchmark. Municipal bonds issued by Puerto Rico also fared relatively poorly over the reporting period’s second half.
Our duration management strategy detracted mildly from the fund’s returns compared to the benchmark, as a slightly longer-than-average positioning during the final months of 2010 increased the fund’s sensi-
4
tivity to rising long-term interest rates and steepening yield differences along the market’s maturity range.
Although municipal bonds with BBB ratings dampened the fund’s relative results, the fund benefited from our efforts to upgrade its overall credit quality. We exited positions in bonds that had gained value, and we redeployed those assets to higher-quality bonds, including those backed by revenues from essential municipal services. In addition, the fund’s underweighted exposure to the general obligation bonds of local municipalities and its holdings of bonds backed by housing projects and industrial business development projects proved beneficial during the reporting period.
Weathering a Period of Transition
We have been encouraged by recent signs of market stabilization. Although we expect additional bouts of market volatility over the near term as inflation fears intensify, we remain optimistic over the longer term. Once the transition to a more ample supply of tax-exempt securities is complete, demand seems likely to stay robust as investors respond to higher state taxes and possible federal tax increases down the road.
May 16, 2011
| |
| | Bond funds are subject generally to interest rate, credit, liquidity and market risks, to varying |
| | degrees, all of which are more fully described in the fund’s prospectus. Generally, all other factors |
| | being equal, bond prices are inversely related to interest-rate changes, and rate increases can cause |
| | price declines. |
| 1 | Total return includes reinvestment of dividends and any capital gains paid, and does not take into |
| | consideration the maximum initial sales charge in the case of Class A shares or the applicable |
| | contingent deferred sales charges imposed on redemptions in the case of Class B and Class C |
| | shares. Had these charges been reflected, returns would have been lower. Class Z is not subject to |
| | any initial or deferred sales charge. Past performance is no guarantee of future results. Share price, |
| | yield and investment return fluctuate such that upon redemption, fund shares may be worth more |
| | or less than their original cost. Income may be subject to state and local taxes, and some income |
| | may be subject to the federal alternative minimum tax (AMT) for certain investors. Capital gains, |
| | if any, are taxable. |
| 2 | SOURCE: LIPPER INC. — Reflects reinvestment of dividends and, where applicable, capital |
| | gain distributions.The Barclays Capital Municipal Bond Index is a widely accepted, unmanaged |
| | total return performance benchmark for the long-term, investment-grade, tax-exempt bond market. |
| | Index returns do not reflect fees and expenses associated with operating a mutual fund. Investors |
| | cannot invest directly in any index. |
FUND PERFORMANCE
|
| † Source: Lipper Inc. |
| Past performance is not predictive of future performance. |
| The above graph compares a $10,000 investment made in Class A, Class B and Class C shares of Dreyfus Municipal |
| Bond Opportunity Fund on 4/30/01 to a $10,000 investment made in the Barclays Capital Municipal Bond Index |
| (the “Index”) on that date.All dividends and capital gain distributions are reinvested. |
| The fund invests primarily in municipal securities and its performance shown in the line graph takes into account the |
| maximum initial sales charge on Class A shares and all other applicable fees and expenses for Class A, Class B and |
| Class C shares. Performance for Class Z shares will vary from the performance of Class A, Class B and Class C shares |
| shown above due to differences in charges and expenses. Performance for Class B shares assumes the conversion of Class |
| B shares to Class A shares at the end of the sixth year following the date of purchase.The Index, unlike the fund, is an |
| unmanaged total return performance benchmark for the long-term, investment-grade, tax-exempt bond market, calculated |
| by using municipal bonds selected to be representative of the municipal market overall.These factors can contribute to the |
| Index potentially outperforming or underperforming the fund. Unlike a mutual fund, the Index is not subject to charges, |
| fees and other expenses. Investors cannot invest directly in any index. Further information relating to fund performance, |
| including expense reimbursements, if applicable, is contained in the Financial Highlights section of the prospectus and |
| elsewhere in this report. |
6
| | | | | |
| Average Annual Total Returns as of 4/30/11 | | | | |
| |
| | Inception | | | | From |
| | Date | 1 Year | 5 Years | 10 Years | Inception |
| Class A shares | | | | | |
| with maximum sales charge (4.5%) | 11/26/86 | –4.29% | 1.88% | 3.18% | — |
| without sales charge | 11/26/86 | 0.20% | 2.83% | 3.65% | — |
| Class B shares | | | | | |
| with applicable redemption charge † | 1/15/93 | –4.33% | 1.89% | 3.34% | — |
| without redemption | 1/15/93 | –0.49% | 2.22% | 3.34% | — |
| Class C shares | | | | | |
| with applicable redemption charge †† | 7/13/95 | –1.42% | 2.08% | 2.90% | — |
| without redemption | 7/13/95 | –0.46% | 2.08% | 2.90% | — |
| Class Z shares | 10/14/04 | 0.34% | 2.88% | — | 3.08% |
| Barclays Capital | | | | | |
| Municipal Bond Index | 9/30/04 | 2.20% | 4.52% | 4.96% | 4.19%††† |
| |
| Past performance is not predictive of future performance.The fund’s performance shown in the graph and table does not |
| reflect the deduction of taxes that a shareholder would pay on fund distributions or the redemption of fund shares. |
| † | The maximum contingent deferred sales charge for Class B shares is 4%.After six years Class B shares convert to |
| | Class A shares. |
| †† | The maximum contingent deferred sales charge for Class C shares is 1% for shares redeemed within one year of the |
| | date of purchase. |
| ††† | The Index date is based on the life of Class Z shares. For comparative purposes, the value of the Index as of |
| | 9/30/04 is used as the beginning value on 10/14/04 (the inception date for Class Z shares). |
UNDERSTANDING YOUR FUND’S EXPENSES (Unaudited)
As a mutual fund investor, you pay ongoing expenses, such as management fees and other expenses. Using the information below, you can estimate how these expenses affect your investment and compare them with the expenses of other funds.You also may pay one-time transaction expenses, including sales charges (loads) and redemption fees, which are not shown in this section and would have resulted in higher total expenses. For more information, see your fund’s prospectus or talk to your financial adviser.
Review your fund’s expenses
The table below shows the expenses you would have paid on a $1,000 investment in Dreyfus Municipal Bond Opportunity Fund from November 1, 2010 to April 30, 2011. It also shows how much a $1,000 investment would be worth at the close of the period, assuming actual returns and expenses.
| | | | |
| Expenses and Value of a $1,000 Investment | | | |
| assuming actual returns for the six months ended April 30, 2011 | | |
| | Class A | Class B | Class C | Class Z |
| Expenses paid per $1,000† | $ 4.58 | $ 7.10 | $ 8.22 | $ 4.33 |
| Ending value (after expenses) | $963.90 | $960.70 | $960.50 | $964.20 |
|
| COMPARING YOUR FUND’S EXPENSES |
| WITH THOSE OF OTHER FUNDS (Unaudited) |
Using the SEC’s method to compare expenses
The Securities and Exchange Commission (SEC) has established guidelines to help investors assess fund expenses. Per these guidelines, the table below shows your fund’s expenses based on a $1,000 investment, assuming a hypothetical 5% annualized return. You can use this information to compare the ongoing expenses (but not transaction expenses or total cost) of investing in the fund with those of other funds.All mutual fund shareholder reports will provide this information to help you make this comparison. Please note that you cannot use this information to estimate your actual ending account balance and expenses paid during the period.
| | | | |
| Expenses and Value of a $1,000 Investment | | | |
| assuming a hypothetical 5% annualized return for the six months ended April 30, 2011 |
| | Class A | Class B | Class C | Class Z |
| Expenses paid per $1,000† | $ 4.71 | $ 7.30 | $ 8.45 | $ 4.46 |
| Ending value (after expenses) | $1,020.13 | $1,017.55 | $1,016.41 | $1,020.38 |
Expenses are equal to the fund’s annualized expense ratio of .94% for Class A, 1.46% for Class B, 1.69% for Class C and .89% for Class Z, multiplied by the average account value over the period, multiplied by 181/365 (to reflect the one-half year period).
8
|
| STATEMENT OF INVESTMENTS |
| April 30, 2011 |
| | | | |
| Long-Term Municipal | Coupon | Maturity | Principal | |
| Investments—98.7% | Rate (%) | Date | Amount ($) | Value ($) |
| Arizona—3.7% | | | | |
| Arizona Health Facilities | | | | |
| Authority, Health Care | | | | |
| Facilities Revenue (The | | | | |
| Beatitudes Campus Project) | 5.20 | 10/1/37 | 2,400,000 | 1,743,720 |
| City of Phoenix, County of | | | | |
| Maricopa and the County of | | | | |
| Pima Industrial Development | | | | |
| Authorities, SFMR | | | | |
| (Collateralized: FHLMC, | | | | |
| FNMA and GNMA) | 5.80 | 12/1/39 | 1,610,000 | 1,623,411 |
| Glendale Western Loop 101 Public | | | | |
| Facilities Corporation, Third | | | | |
| Lien Excise Tax Revenue | 7.00 | 7/1/33 | 5,000,000 | 5,241,050 |
| Mohave County Industrial | | | | |
| Development Authority, | | | | |
| Correctional Facilities | | | | |
| Contract Revenue (Mohave | | | | |
| Prison, LLC Expansion Project) | 8.00 | 5/1/25 | 5,000,000 | 5,475,100 |
| Pima County Industrial Development | | | | |
| Authority, Education Revenue | | | | |
| (American Charter Schools | | | | |
| Foundation Project) | 5.63 | 7/1/38 | 5,000,000 | 4,055,650 |
| California—17.4% | | | | |
| Anaheim Public Financing | | | | |
| Authority, Revenue (City of | | | | |
| Anaheim Electric System | | | | |
| Distribution Facilities) | 5.25 | 10/1/34 | 3,185,000 | 3,222,933 |
| California, | | | | |
| Economic Recovery Bonds | 5.00 | 7/1/20 | 5,000,000 | 5,621,450 |
| California, | | | | |
| GO (Insured; AMBAC) | 6.00 | 2/1/18 | 2,245,000 | 2,677,724 |
| California, | | | | |
| GO (Various Purpose) | 5.25 | 10/1/20 | 2,300,000 | 2,579,749 |
| California, | | | | |
| GO (Various Purpose) | 5.75 | 4/1/31 | 7,725,000 | 8,107,542 |
| California, | | | | |
| GO (Various Purpose) | 6.50 | 4/1/33 | 5,000,000 | 5,500,850 |
| California, | | | | |
| GO (Various Purpose) | 6.00 | 11/1/35 | 3,000,000 | 3,166,440 |
STATEMENT OF INVESTMENTS (continued)
| | | | | |
| Long-Term Municipal | Coupon | Maturity | Principal | | |
| Investments (continued) | Rate (%) | Date | Amount ($) | | Value ($) |
| California (continued) | | | | | |
| California Health Facilities | | | | | |
| Financing Authority, Revenue | | | | | |
| (Providence Health and Services) | 6.50 | 10/1/38 | 2,955,000 | | 3,166,371 |
| California Health Facilities | | | | | |
| Financing Authority, Revenue | | | | | |
| (Providence Health and | | | | | |
| Services) (Prerefunded) | 6.50 | 10/1/18 | 45,000 | a | 57,527 |
| California Pollution Control | | | | | |
| Financing Authority, PCR | | | | | |
| (San Diego Gas and Electric | | | | | |
| Company) (Insured; National | | | | | |
| Public Finance Guarantee Corp.) | 5.90 | 6/1/14 | 7,710,000 | | 8,550,621 |
| California Statewide Communities | | | | | |
| Development Authority, | | | | | |
| Revenue (Daughters of | | | | | |
| Charity Health System) | 5.25 | 7/1/35 | 3,470,000 | | 2,664,197 |
| California Statewide Communities | | | | | |
| Development Authority, Revenue | | | | | |
| (Sutter Health) | 5.50 | 8/15/26 | 2,670,000 | | 2,689,865 |
| Chula Vista, | | | | | |
| IDR (San Diego Gas and | | | | | |
| Electric Company) | 5.88 | 2/15/34 | 2,000,000 | | 2,086,780 |
| Golden State Tobacco | | | | | |
| Securitization Corporation, | | | | | |
| Tobacco Settlement | | | | | |
| Asset-Backed Bonds | 4.50 | 6/1/27 | 6,585,000 | | 4,942,503 |
| Golden State Tobacco | | | | | |
| Securitization Corporation, | | | | | |
| Tobacco Settlement | | | | | |
| Asset-Backed Bonds | 5.00 | 6/1/33 | 6,900,000 | | 4,606,095 |
| Golden State Tobacco | | | | | |
| Securitization Corporation, | | | | | |
| Tobacco Settlement Asset-Backed | | | | | |
| Bonds (Prerefunded) | 7.88 | 6/1/13 | 2,170,000 | a | 2,486,060 |
| Golden State Tobacco | | | | | |
| Securitization Corporation, | | | | | |
| Tobacco Settlement Asset-Backed | | | | | |
| Bonds (Prerefunded) | 7.90 | 6/1/13 | 1,920,000 | a | 2,200,589 |
10
| | | | |
| Long-Term Municipal | Coupon | Maturity | Principal | |
| Investments (continued) | Rate (%) | Date | Amount ($) | Value ($) |
| California (continued) | | | | |
| Lincoln Community Facilities | | | | |
| District Number 2003-1, | | | | |
| Special Tax Bonds (Lincoln | | | | |
| Crossing Project) (Prerefunded) | 6.00 | 9/1/13 | 3,145,000 a | 3,569,418 |
| Los Angeles Harbor Department, | | | | |
| Revenue | 5.25 | 8/1/25 | 5,000,000 | 5,358,750 |
| Sacramento County, | | | | |
| Airport System Senior Revenue | 5.25 | 7/1/26 | 5,000,000 | 5,168,550 |
| Sacramento County, | | | | |
| Airport System Senior Revenue | 5.50 | 7/1/29 | 1,500,000 | 1,534,650 |
| San Bernardino Community College | | | | |
| District, GO | 6.25 | 8/1/33 | 2,000,000 | 2,193,060 |
| Tobacco Securitization Authority | | | | |
| of Southern California, | | | | |
| Tobacco Settlement | | | | |
| Asset-Backed Bonds | | | | |
| (San Diego County Tobacco | | | | |
| Asset Securitization Corporation) | 5.00 | 6/1/37 | 3,905,000 | 2,535,204 |
| Colorado—2.8% | | | | |
| Arkansas River Power Authority, | | | | |
| Power Improvement Revenue | | | | |
| (Insured; XLCA) | 5.25 | 10/1/40 | 2,900,000 | 2,386,410 |
| Colorado Educational and Cultural | | | | |
| Facilities Authority, LR | | | | |
| (Community Colleges of | | | | |
| Colorado System Headquarters | | | | |
| Project) (Insured; AMBAC) | 5.50 | 12/1/21 | 1,100,000 | 1,120,647 |
| Colorado Housing and Finance | | | | |
| Authority, Single Family | | | | |
| Program Senior and Subordinate | | | | |
| Bonds (Collateralized; FHA) | 7.15 | 10/1/30 | 25,000 | 25,499 |
| Colorado Housing and Finance | | | | |
| Authority, Single Family | | | | |
| Program Senior and Subordinate | | | | |
| Bonds (Collateralized; FHA) | 6.60 | 8/1/32 | 1,645,000 | 1,754,853 |
| Denver City and County, | | | | |
| Airport Revenue (Insured; AMBAC) | 6.00 | 11/15/17 | 4,085,000 | 4,093,824 |
STATEMENT OF INVESTMENTS (continued)
| | | | |
| Long-Term Municipal | Coupon | Maturity | Principal | |
| Investments (continued) | Rate (%) | Date | Amount ($) | Value ($) |
| Colorado (continued) | | | | |
| E-470 Public Highway Authority, | | | | |
| Senior Revenue | 5.38 | 9/1/26 | 1,000,000 | 907,960 |
| Northwest Parkway Public Highway | | | | |
| Authority, Revenue (Insured; | | | | |
| AMBAC) (Prerefunded) | 0.00 | 6/15/11 | 6,125,000 a,b | 2,327,806 |
| University of Colorado Regents, | | | | |
| University Enterprise Revenue | 5.75 | 6/1/28 | 1,000,000 | 1,098,500 |
| District of Columbia—.5% | | | | |
| Metropolitan Washington | | | | |
| Airports Authority, | | | | |
| Airport System Revenue | 5.00 | 10/1/27 | 2,425,000 | 2,404,800 |
| Florida—5.1% | | | | |
| Broward County Housing Finance | | | | |
| Authority, MFHR (Pembroke | | | | |
| Villas Project) (Insured; Assured | | | | |
| Guaranty Municipal Corp.) | 5.55 | 1/1/23 | 980,000 | 980,764 |
| Capital Projects Finance | | | | |
| Authority, Revenue (Capital | | | | |
| Projects Loan Program-AAAE | | | | |
| Airport Projects) (Insured; | | | | |
| National Public Finance | | | | |
| Guarantee Corp.) | 5.25 | 6/1/14 | 1,485,000 | 1,504,320 |
| Citizens Property Insurance | | | | |
| Corporation, High-Risk Account | | | | |
| Senior Secured Revenue | 5.50 | 6/1/17 | 2,000,000 | 2,160,180 |
| Florida Housing Finance Agency, | | | | |
| Housing Revenue (Brittany of | | | | |
| Rosemont Apartments Project) | | | | |
| (Insured; AMBAC) | 7.00 | 2/1/35 | 6,000,000 | 5,797,380 |
| Miami-Dade County, | | | | |
| Aviation Revenue | 5.00 | 10/1/30 | 2,000,000 | 1,926,520 |
| Miami-Dade County, | | | | |
| Aviation Revenue (Miami | | | | |
| International Airport—Hub of | | | | |
| the Americas) (Insured; Assured | | | | |
| Guaranty Municipal Corp.) | 5.00 | 10/1/33 | 1,285,000 | 1,186,402 |
| Miami-Dade County, | | | | |
| Water and Sewer System Revenue | 5.00 | 10/1/28 | 2,600,000 | 2,692,794 |
12
| | | | | |
| Long-Term Municipal | Coupon | Maturity | Principal | | |
| Investments (continued) | Rate (%) | Date | Amount ($) | | Value ($) |
| Florida (continued) | | | | | |
| Miami-Dade County Housing | | | | | |
| Finance Authority, MFMR | | | | | |
| (Country Club Villas II Project) | | | | | |
| (Insured; Assured Guaranty | | | | | |
| Municipal Corp.) | 5.70 | 7/1/21 | 400,000 | | 400,672 |
| Orange County Housing Finance | | | | | |
| Authority, MFHR (Seminole | | | | | |
| Pointe Apartments) | 5.75 | 12/1/23 | 2,580,000 | | 2,353,115 |
| Palm Bay, | | | | | |
| Educational Facilities Revenue | | | | | |
| (Patriot Charter School Project) | 7.00 | 7/1/36 | 215,000 | c | 107,124 |
| Palm Bay, | | | | | |
| Utility System Improvement | | | | | |
| Revenue (Insured; National | | | | | |
| Public Finance Guarantee Corp.) | 0.00 | 10/1/20 | 1,845,000 | b | 1,154,822 |
| Port of Palm Beach District, | | | | | |
| Revenue (Insured; XLCA) | 0.00 | 9/1/23 | 1,000,000 | b | 428,370 |
| Saint Johns County Industrial | | | | | |
| Development Authority, Revenue | | | | | |
| (Presbyterian Retirement | | | | | |
| Communities Project) | 5.88 | 8/1/40 | 1,000,000 | | 897,000 |
| Seminole Water Control District, | | | | | |
| Improvement Bonds (Unit of | | | | | |
| Development Number 2) | 6.75 | 8/1/22 | 1,470,000 | | 1,417,154 |
| Winter Park, | | | | | |
| Water and Sewer Revenue | | | | | |
| (Insured; AMBAC) | 5.38 | 12/1/18 | 1,730,000 | | 1,827,347 |
| Georgia—2.0% | | | | | |
| Atlanta, | | | | | |
| Water and Wastewater Revenue | 6.00 | 11/1/26 | 3,550,000 | | 3,869,180 |
| Atlanta, | | | | | |
| Water and Wastewater Revenue | | | | | |
| (Insured; Assured Guaranty | | | | | |
| Municipal Corp.) | 5.25 | 11/1/34 | 2,000,000 | | 2,015,000 |
| DeKalb County Hospital Authority, | | | | | |
| RAC (DeKalb Medical | | | | | |
| Center, Inc. Project) | 6.00 | 9/1/30 | 4,250,000 | | 3,986,457 |
STATEMENT OF INVESTMENTS (continued)
| | | | |
| Long-Term Municipal | Coupon | Maturity | Principal | |
| Investments (continued) | Rate (%) | Date | Amount ($) | Value ($) |
| Hawaii—1.5% | | | | |
| Hawaii, | | | | |
| Airports System Revenue | 5.25 | 7/1/26 | 3,575,000 | 3,711,815 |
| Hawaii Department of Budget and | | | | |
| Finance, Special Purpose | | | | |
| Revenue (Hawai’i Pacific | | | | |
| Health Obligated Group) | 5.63 | 7/1/30 | 3,695,000 | 3,442,595 |
| Illinois—5.9% | | | | |
| Chicago Board of Education, | | | | |
| Unlimited Tax GO | | | | |
| (Dedicated Revenues) | 5.25 | 12/1/25 | 10,000,000 | 10,071,000 |
| Illinois, | | | | |
| GO | 5.00 | 1/1/17 | 2,500,000 | 2,659,525 |
| Illinois, | | | | |
| GO | 5.00 | 1/1/22 | 2,500,000 | 2,501,575 |
| Illinois, | | | | |
| GO | 5.00 | 1/1/24 | 2,500,000 | 2,469,800 |
| Illinois Development Finance | | | | |
| Authority, Revenue (Community | | | | |
| Rehabilitation Providers | | | | |
| Facilities Acquisition Program) | 8.25 | 8/1/12 | 216,484 | 169,862 |
| Metropolitan Pier and Exposition | | | | |
| Authority, Dedicated State Tax | | | | |
| Revenue (McCormick Place | | | | |
| Expansion Project) (Insured; | | | | |
| National Public Finance | | | | |
| Guarantee Corp.) | 5.50 | 6/15/23 | 5,000,000 | 5,213,350 |
| Railsplitter Tobacco Settlement | | | | |
| Authority, Tobacco | | | | |
| Settlement Revenue | 5.50 | 6/1/23 | 1,750,000 | 1,694,402 |
| Railsplitter Tobacco Settlement | | | | |
| Authority, Tobacco | | | | |
| Settlement Revenue | 6.00 | 6/1/28 | 3,975,000 | 3,838,936 |
| Indiana—.5% | | | | |
| Indianapolis Local Public | | | | |
| Improvement Bond Bank, | | | | |
| Revenue (Indianapolis | | | | |
| Airport Authority Project) | | | | |
| (Insured; AMBAC) | 5.00 | 1/1/36 | 2,500,000 | 2,210,750 |
14
| | | | |
| Long-Term Municipal | Coupon | Maturity | Principal | |
| Investments (continued) | Rate (%) | Date | Amount ($) | Value ($) |
| Kansas—1.6% | | | | |
| Kansas Development Finance | | | | |
| Authority, Revenue (Lifespace | | | | |
| Communities, Inc.) | 5.00 | 5/15/30 | 1,500,000 | 1,301,895 |
| Sedgwick and Shawnee Counties, | | | | |
| SFMR (Mortgage-Backed Securities | | | | |
| Program) (Collateralized: | | | | |
| FNMA and GNMA) | 5.55 | 6/1/38 | 1,250,000 | 1,288,363 |
| Wichita, | | | | |
| HR (Via Christi | | | | |
| Health System, Inc.) | 6.25 | 11/15/19 | 2,000,000 | 2,065,160 |
| Wichita, | | | | |
| HR (Via Christi | | | | |
| Health System, Inc.) | 6.25 | 11/15/20 | 3,000,000 | 3,097,740 |
| Kentucky—3.2% | | | | |
| Mount Sterling, | | | | |
| LR (Kentucky League of Cities | | | | |
| Funding Trust Program) | 6.10 | 3/1/18 | 5,500,000 | 5,862,065 |
| Ohio County, | | | | |
| PCR (Big Rivers Electric | | | | |
| Corporation Project) | 6.00 | 7/15/31 | 2,500,000 | 2,447,050 |
| Pendleton County, | | | | |
| Multi-County LR (Kentucky | | | | |
| Association of Counties | | | | |
| Leasing Trust Program) | 6.40 | 3/1/19 | 6,000,000 | 7,154,460 |
| Louisiana—1.0% | | | | |
| Louisiana Local Government | | | | |
| Environmental Facilities and | | | | |
| Community Development | | | | |
| Authority, Revenue (Westlake | | | | |
| Chemical Corporation Projects) | 6.75 | 11/1/32 | 2,000,000 | 2,042,720 |
| Saint James Parish, | | | | |
| SWDR (Freeport-McMoRan | | | | |
| Partnership Project) | 7.70 | 10/1/22 | 3,020,000 | 3,019,940 |
| Massachusetts—2.8% | | | | |
| Massachusetts Department of | | | | |
| Transportation, Metropolitan | | | | |
| Highway System Senior Revenue | 5.00 | 1/1/27 | 5,000,000 | 5,148,600 |
STATEMENT OF INVESTMENTS (continued)
| | | | |
| Long-Term Municipal | Coupon | Maturity | Principal | |
| Investments (continued) | Rate (%) | Date | Amount ($) | Value ($) |
| Massachusetts (continued) | | | | |
| Massachusetts Development Finance | | | | |
| Agency, Revenue (Tufts Medical | | | | |
| Center Issue) | 6.25 | 1/1/27 | 2,250,000 | 2,256,232 |
| Massachusetts Health and | | | | |
| Educational Facilities Authority, | | | | |
| Revenue (Harvard | | | | |
| University Issue) | 5.50 | 11/15/36 | 3,500,000 | 3,773,945 |
| Massachusetts Industrial Finance | | | | |
| Agency, Water Treatment Revenue | | | | |
| (Massachusetts-American | | | | |
| Hingham Project) | 6.95 | 12/1/35 | 2,450,000 | 2,365,720 |
| Michigan—7.5% | | | | |
| Detroit, | | | | |
| Sewage Disposal System Senior | | | | |
| Lien Revenue (Insured; Assured | | | | |
| Guaranty Municipal Corp.) | 7.00 | 7/1/27 | 3,000,000 | 3,490,050 |
| Detroit School District, | | | | |
| School Building and Site | | | | |
| Improvement Bonds (GO— | | | | |
| Unlimited Tax) (Insured; FGIC) | 5.00 | 5/1/28 | 5,000,000 | 4,787,300 |
| Michigan Building Authority, | | | | |
| Revenue (Facilities Program) | | | | |
| (Insured; Assured Guaranty | | | | |
| Municipal Corp.) | 5.50 | 10/15/18 | 1,500,000 | 1,527,000 |
| Michigan Building Authority, | | | | |
| Revenue (Facilities Program) | | | | |
| (Insured; Assured Guaranty | | | | |
| Municipal Corp.) | 5.50 | 10/15/19 | 8,500,000 | 8,647,815 |
| Michigan Strategic Fund, | | | | |
| SWDR (Genesee Power | | | | |
| Station Project) | 7.50 | 1/1/21 | 6,725,000 | 6,165,480 |
| Pontiac Tax Increment Finance | | | | |
| Authority, Tax Increment | | | | |
| Revenue (Development | | | | |
| Area Number 3) | 6.25 | 6/1/22 | 610,000 | 392,541 |
| Pontiac Tax Increment Finance | | | | |
| Authority, Tax Increment | | | | |
| Revenue (Development Area | | | | |
| Number 3) (Prerefunded) | 6.25 | 6/1/12 | 2,640,000 a | 2,827,282 |
16
| | | | |
| Long-Term Municipal | Coupon | Maturity | Principal | |
| Investments (continued) | Rate (%) | Date | Amount ($) | Value ($) |
| Michigan (continued) | | | | |
| Romulus Economic | | | | |
| Development Corporation, | | | | |
| Limited Obligation EDR | | | | |
| (Romulus HIR Limited | | | | |
| Partnership Project) | | | | |
| (Insured; ITT Lyndon | | | | |
| Property Insurance Company) | 7.00 | 11/1/15 | 5,000,000 | 6,163,800 |
| Wayne County Airport Authority, | | | | |
| Airport Revenue (Detroit | | | | |
| Metropolitan Wayne | | | | |
| County Airport) | 5.00 | 12/1/18 | 2,500,000 | 2,529,475 |
| Missouri—1.7% | | | | |
| Missouri Development Finance | | | | |
| Board, Infrastructure | | | | |
| Facilities Revenue | | | | |
| (Branson Landing Project) | 5.38 | 12/1/27 | 2,470,000 | 2,474,891 |
| Missouri Highways and | | | | |
| Transportation Commission, | | | | |
| Second Lien State | | | | |
| Road Revenue | 5.25 | 5/1/22 | 5,000,000 | 5,625,450 |
| Missouri Housing Development | | | | |
| Commission, SFMR | | | | |
| (Homeownership Loan | | | | |
| Program) (Collateralized: | | | | |
| FNMA and GNMA) | 6.30 | 9/1/25 | 45,000 | 45,895 |
| Nevada—1.0% | | | | |
| Clark County, | | | | |
| Airport System Subordinate | | | | |
| Lien Revenue (Insured; Assured | | | | |
| Guaranty Municipal Corp.) | 5.00 | 7/1/26 | 2,860,000 | 2,862,660 |
| Clark County, | | | | |
| Passenger Facility Charge | | | | |
| Revenue (Las Vegas-McCarran | | | | |
| International Airport) | 5.00 | 7/1/30 | 2,000,000 | 1,958,800 |
| New Jersey—3.7% | | | | |
| New Jersey Economic Development | | | | |
| Authority, School Facilities | | | | |
| Construction Revenue | 5.75 | 9/1/23 | 3,250,000 | 3,518,807 |
STATEMENT OF INVESTMENTS (continued)
| | | | | |
| Long-Term Municipal | Coupon | Maturity | Principal | | |
| Investments (continued) | Rate (%) | Date | Amount ($) | | Value ($) |
| New Jersey (continued) | | | | | |
| New Jersey Economic Development | | | | | |
| Authority, School Facilities | | | | | |
| Construction Revenue | | | | | |
| (Insured; AMBAC) | 5.50 | 9/1/24 | 6,300,000 | | 6,745,095 |
| Tobacco Settlement Financing | | | | | |
| Corporation of New Jersey, | | | | | |
| Tobacco Settlement | | | | | |
| Asset-Backed Bonds | 4.63 | 6/1/26 | 2,640,000 | | 1,930,289 |
| Tobacco Settlement Financing | | | | | |
| Corporation of New Jersey, | | | | | |
| Tobacco Settlement Asset-Backed | | | | | |
| Bonds (Prerefunded) | 7.00 | 6/1/13 | 5,135,000 | a | 5,803,269 |
| New Mexico—1.1% | | | | | |
| Jicarilla Apache Nation, | | | | | |
| Revenue | 5.50 | 9/1/23 | 5,000,000 | | 5,186,400 |
| New York—7.4% | | | | | |
| Austin Trust | | | | | |
| (Port Authority of New York | | | | | |
| and New Jersey, Consolidated | | | | | |
| Bonds, 151st Series) | 6.00 | 9/15/28 | 9,690,000 | d,e | 10,255,508 |
| Long Island Power Authority, | | | | | |
| Electric System General Revenue | 6.00 | 5/1/33 | 5,000,000 | | 5,398,350 |
| Metropolitan Transportation | | | | | |
| Authority, Transportation | | | | | |
| Revenue | 5.25 | 11/15/28 | 2,500,000 | | 2,574,650 |
| New York City Health and Hospital | | | | | |
| Corporation, GO | 5.00 | 2/15/18 | 5,265,000 | | 5,804,873 |
| New York State Dormitory | | | | | |
| Authority, Revenue (New York | | | | | |
| University) (Insured; National | | | | | |
| Public Finance Guarantee Corp.) | 6.00 | 7/1/17 | 3,500,000 | | 4,200,035 |
| New York State Dormitory | | | | | |
| Authority, Revenue (Orange | | | | | |
| Regional Medical Center | | | | | |
| Obligated Group) | 6.25 | 12/1/37 | 5,000,000 | | 4,580,700 |
| New York State Dormitory | | | | | |
| Authority, Revenue | | | | | |
| (State University | | | | | |
| Educational Facilities) | 7.50 | 5/15/13 | 2,500,000 | | 2,814,025 |
18
| | | | |
| Long-Term Municipal | Coupon | Maturity | Principal | |
| Investments (continued) | Rate (%) | Date | Amount ($) | Value ($) |
| North Carolina—2.5% | | | | |
| North Carolina Eastern Municipal | | | | |
| Power Agency, Power | | | | |
| System Revenue | 7.00 | 1/1/13 | 3,080,000 | 3,208,005 |
| North Carolina Eastern Municipal | | | | |
| Power Agency, Power System | | | | |
| Revenue (Insured; AMBAC) | 6.00 | 1/1/18 | 7,500,000 | 8,684,025 |
| Ohio—2.0% | | | | |
| Cleveland-Cuyahoga County Port | | | | |
| Authority, Senior Special | | | | |
| Assessment/Tax Increment | | | | |
| Revenue (University Heights— | | | | |
| Public Parking Garage Project) | 7.35 | 12/1/31 | 3,000,000 | 2,879,880 |
| Hamilton County, | | | | |
| Sales Tax Refunding and | | | | |
| Improvement Bonds | | | | |
| (Insured; AMBAC) | 0.00 | 12/1/25 | 14,865,000 b | 6,728,345 |
| Oklahoma—.9% | | | | |
| Oklahoma Municipal Power | | | | |
| Authority, Power Supply | | | | |
| System Revenue | 6.00 | 1/1/38 | 4,000,000 | 4,180,400 |
| Oregon—1.1% | | | | |
| Oregon Department of Administrative | | | | |
| Services, Lottery Revenue | | | | |
| (Insured; Assured Guaranty | | | | |
| Municipal Corp.) | 5.00 | 4/1/26 | 4,885,000 | 5,181,129 |
| Pennsylvania—2.9% | | | | |
| Allegheny County Port Authority, | | | | |
| Special Transportation Revenue | 5.25 | 3/1/23 | 2,715,000 | 2,932,444 |
| Harrisburg Authority, | | | | |
| University Revenue (The | | | | |
| Harrisburg University of | | | | |
| Science and Technology Project) | 6.00 | 9/1/36 | 2,000,000 | 1,683,400 |
| Pennsylvania Higher Educational | | | | |
| Facilities Authority, Revenue | | | | |
| (University of Pennsylvania | | | | |
| Health System) | 6.00 | 8/15/26 | 5,000,000 | 5,413,100 |
| Philadelphia School District, | | | | |
| GO | 5.25 | 9/1/23 | 4,000,000 | 4,189,160 |
STATEMENT OF INVESTMENTS (continued)
| | | | |
| Long-Term Municipal | Coupon | Maturity | Principal | |
| Investments (continued) | Rate (%) | Date | Amount ($) | Value ($) |
| South Carolina—1.1% | | | | |
| South Carolina Public | | | | |
| Service Authority, | | | | |
| Revenue Obligations | 5.50 | 1/1/38 | 5,000,000 | 5,249,900 |
| Tennessee—1.4% | | | | |
| Johnson City Health and | | | | |
| Educational Facilities Board, | | | | |
| Hospital First Mortgage | | | | |
| Revenue (Mountain States | | | | |
| Health Alliance) | 5.50 | 7/1/31 | 4,955,000 | 4,427,491 |
| Johnson City Health and | | | | |
| Educational Facilities Board, | | | | |
| HR (Mountain States | | | | |
| Health Alliance) | 6.00 | 7/1/38 | 2,435,000 | 2,242,684 |
| Texas—6.5% | | | | |
| Brazos River Authority, | | | | |
| PCR (TXU Energy | | | | |
| Company LLC Project) | 5.00 | 3/1/41 | 1,500,000 | 467,115 |
| Brazos River Authority, | | | | |
| Revenue (Reliant | | | | |
| Energy, Inc. Project) | 5.38 | 4/1/19 | 3,250,000 | 3,250,975 |
| North Texas Tollway Authority, | | | | |
| First Tier System Revenue | | | | |
| (Insured; Assured Guaranty | | | | |
| Municipal Corp.) | 5.75 | 1/1/40 | 11,850,000 | 11,979,639 |
| North Texas Tollway Authority, | | | | |
| Second Tier System Revenue | 5.75 | 1/1/38 | 5,510,000 | 5,363,048 |
| Southwest Independent School | | | | |
| District, Unlimited Tax Bonds | | | | |
| (Permanent School Fund | | | | |
| Guarantee Program) | 5.25 | 2/1/25 | 6,110,000 | 7,111,918 |
| Texas Turnpike Authority, | | | | |
| Central Texas Turnpike | | | | |
| System Revenue | | | | |
| (Insured; AMBAC) | 5.75 | 8/15/38 | 3,500,000 | 3,421,915 |
| Virginia—.7% | | | | |
| Virginia Housing Development | | | | |
| Authority, Commonwealth | | | | |
| Mortgage Revenue | 6.25 | 7/1/31 | 3,470,000 | 3,601,409 |
20
| | | | |
| Long-Term Municipal | Coupon | Maturity | Principal | |
| Investments (continued) | Rate (%) | Date | Amount ($) | Value ($) |
| Washington—2.7% | | | | |
| Washington Public Power Supply | | | | |
| System, Revenue (Nuclear | | | | |
| Project Number 3) (Insured; | | | | |
| National Public Finance | | | | |
| Guarantee Corp.) | 7.13 | 7/1/16 | 10,425,000 | 13,075,452 |
| Wisconsin—2.3% | | | | |
| Badger Tobacco Asset | | | | |
| Securitization Corporation, | | | | |
| Tobacco Settlement Asset-Backed | | | | |
| Bonds (Prerefunded) | 7.00 | 6/1/12 | 4,500,000 a | 4,819,320 |
| Wisconsin Health and Educational | | | | |
| Facilities Authority, Revenue | | | | |
| (Aurora Health Care, Inc.) | 5.50 | 4/15/29 | 2,200,000 | 2,150,874 |
| Wisconsin Health and Educational | | | | |
| Facilities Authority, Revenue | | | | |
| (Aurora Health Care, Inc.) | 6.40 | 4/15/33 | 4,000,000 | 4,042,280 |
| U.S. Related—4.2% | | | | |
| Puerto Rico Commonwealth, | | | | |
| Public Improvement GO | 6.00 | 7/1/28 | 1,000,000 | 1,024,370 |
| Puerto Rico Electric Power | | | | |
| Authority, Power Revenue | 5.25 | 7/1/40 | 1,000,000 | 878,570 |
| Puerto Rico Government | | | | |
| Development Bank, Senior Notes | 5.00 | 12/1/15 | 5,315,000 | 5,664,249 |
| Puerto Rico Infrastructure | | | | |
| Financing Authority, Special | | | | |
| Tax Revenue (Insured; AMBAC) | 5.50 | 7/1/26 | 3,000,000 | 2,996,700 |
| Puerto Rico Public Finance | | | | |
| Corporation, Revenue (Insured; | | | | |
| Assured Guaranty Municipal Corp.) | 6.00 | 8/1/26 | 2,500,000 | 3,113,975 |
| Puerto Rico Sales Tax Financing | | | | |
| Corporation, Sales Tax Revenue | | | | |
| (First Subordinate Series) | 6.00 | 8/1/39 | 1,500,000 | 1,508,295 |
| Puerto Rico Sales Tax Financing | | | | |
| Corporation, Sales Tax Revenue | | | | |
| (First Subordinate Series) | 6.00 | 8/1/42 | 5,000,000 | 5,009,100 |
| Total Long-Term Municipal Investments | | | |
| (cost $466,176,858) | | | | 478,247,866 |
STATEMENT OF INVESTMENTS (continued)
| | | | | |
| Short-Term Municipal | Coupon | Maturity | Principal | | |
| Investments—.6% | Rate (%) | Date | Amount ($) | | Value ($) |
| New Jersey—.3% | | | | | |
| New Jersey Health Care Facilities | | | | | |
| Financing Authority, Revenue | | | | | |
| (Virtua Health Issue) (LOC; | | | | | |
| JPMorgan Chase Bank) | 0.25 | 5/1/11 | 1,400,000 | f | 1,400,000 |
| New York—.3% | | | | | |
| New York City, | | | | | |
| GO Notes (LOC; JPMorgan | | | | | |
| Chase Bank) | 0.21 | 5/1/11 | 500,000 | f | 500,000 |
| New York City, | | | | | |
| GO Notes (LOC; JPMorgan | | | | | |
| Chase Bank) | 0.21 | 5/1/11 | 1,000,000 | f | 1,000,000 |
| Total Short-Term Municipal Investments | | | | |
| (cost $2,900,000) | | | | | 2,900,000 |
| |
| Total Investments (cost $469,076,858) | | | 99.3% | | 481,147,866 |
| Cash and Receivables (Net) | | | .7% | | 3,364,498 |
| Net Assets | | | 100.0% | | 484,512,364 |
|
| a These securities are prerefunded; the date shown represents the prerefunded date. Bonds which are prerefunded are |
| collateralized by U.S. Government securities which are held in escrow and are used to pay principal and interest on |
| the municipal issue and to retire the bonds in full at the earliest refunding date. |
| b Security issued with a zero coupon. Income is recognized through the accretion of discount. |
| c Non-income producing—security in default. |
| d Collateral for floating rate borrowings. |
| e Security exempt from registration under Rule 144A of the Securities Act of 1933.This security may be resold in |
| transactions exempt from registration, normally to qualified institutional buyers.At April 30, 2011, this security was |
| valued at $10,255,508 or 2.1% of net assets. |
| f Variable rate demand note—rate shown is the interest rate in effect at April 30, 2011. Maturity date represents the |
| next demand date, or the ultimate maturity date if earlier. |
22
| | | |
| Summary of Abbreviations | | |
| |
| ABAG | Association of Bay Area Governments | ACA | American Capital Access |
| AGC | ACE Guaranty Corporation | AGIC | Asset Guaranty Insurance Company |
| AMBAC | American Municipal Bond | ARRN | Adjustable Rate Receipt Notes |
| | Assurance Corporation | | |
| BAN | Bond Anticipation Notes | BPA | Bond Purchase Agreement |
| CIFG | CDC Ixis Financial Guaranty | COP | Certificate of Participation |
| CP | Commercial Paper | EDR | Economic Development Revenue |
| EIR | Environmental Improvement Revenue | FGIC | Financial Guaranty Insurance |
| | | | Company |
| FHA | Federal Housing Administration | FHLB | Federal Home Loan Bank |
| FHLMC | Federal Home Loan Mortgage | FNMA | Federal National |
| | Corporation | | Mortgage Association |
| GAN | Grant Anticipation Notes | GIC | Guaranteed Investment Contract |
| GNMA | Government National | GO | General Obligation |
| | Mortgage Association | | |
| HR | Hospital Revenue | IDB | Industrial Development Board |
| IDC | Industrial Development Corporation | IDR | Industrial Development Revenue |
| LOC | Letter of Credit | LOR | Limited Obligation Revenue |
| LR | Lease Revenue | MFHR | Multi-Family Housing Revenue |
| MFMR | Multi-Family Mortgage Revenue | PCR | Pollution Control Revenue |
| PILOT | Payment in Lieu of Taxes | PUTTERS Puttable Tax-Exempt Receipts |
| RAC | Revenue Anticipation Certificates | RAN | Revenue Anticipation Notes |
| RAW | Revenue Anticipation Warrants | RRR | Resources Recovery Revenue |
| SAAN | State Aid Anticipation Notes | SBPA | Standby Bond Purchase Agreement |
| SFHR | Single Family Housing Revenue | SFMR | Single Family Mortgage Revenue |
| SONYMA | State of New York Mortgage Agency | SWDR | Solid Waste Disposal Revenue |
| TAN | Tax Anticipation Notes | TAW | Tax Anticipation Warrants |
| TRAN | Tax and Revenue Anticipation Notes | XLCA | XL Capital Assurance |
STATEMENT OF INVESTMENTS (continued)
| | | | | |
| Summary of Combined Ratings (Unaudited) | |
| |
| Fitch | or | Moody’s | or | Standard & Poor’s | Value (%)† |
| AAA | | Aaa | | AAA | 22.8 |
| AA | | Aa | | AA | 23.9 |
| A | | A | | A | 28.9 |
| BBB | | Baa | | BBB | 13.7 |
| BB | | Ba | | BB | 1.0 |
| B | | B | | B | .1 |
| CCC | | Caa | | CCC | .1 |
| F1 | | MIG1/P1 | | SP1/A1 | .4 |
| Not Ratedg | | Not Ratedg | | Not Ratedg | 9.1 |
| | | | | | 100.0 |
| |
| † | Based on total investments. |
| g | Securities which, while not rated by Fitch, Moody’s and Standard & Poor’s, have been determined by the Manager to |
| | be of comparable quality to those rated securities in which the fund may invest. |
| See notes to financial statements. |
24
|
| STATEMENT OF ASSETS AND LIABILITIES |
| April 30, 2011 |
| | | | |
| | | | Cost | Value |
| Assets ($): | | | | |
| Investments in securities—See Statement of Investments | 469,076,858 | 481,147,866 |
| Cash | | | | 826,518 |
| Interest receivable | | | | 8,047,910 |
| Receivable for shares of Beneficial Interest subscribed | | | 109,211 |
| Prepaid expenses | | | | 33,656 |
| | | | | 490,165,161 |
| Liabilities ($): | | | | |
| Due to The Dreyfus Corporation and affiliates—Note 3(c) | | 371,633 |
| Payable for floating rate notes issued—Note 4 | | | 4,845,000 |
| Payable for shares of Beneficial Interest redeemed | | | 305,193 |
| Interest and expense payable related to | | | |
| floating rate notes issued—Note 4 | | | | 5,651 |
| Accrued expenses | | | | 125,320 |
| | | | | 5,652,797 |
| Net Assets ($) | | | | 484,512,364 |
| Composition of Net Assets ($): | | | | |
| Paid-in capital | | | | 521,352,058 |
| Accumulated net realized gain (loss) on investments | | | (48,910,702) |
| Accumulated net unrealized appreciation | | | |
| (depreciation) on investments | | | | 12,071,008 |
| Net Assets ($) | | | | 484,512,364 |
| |
| |
| Net Asset Value Per Share | | | | |
| | Class A | Class B | Class C | Class Z |
| Net Assets ($) | 231,670,641 | 1,000,492 | 12,749,706 | 239,091,525 |
| Shares Outstanding | 19,554,334 | 84,395 | 1,073,552 | 20,179,668 |
| Net Asset Value Per Share ($) | 11.85 | 11.85 | 11.88 | 11.85 |
| |
| See notes to financial statements. | | | | |
|
| STATEMENT OF OPERATIONS |
| Year Ended April 30, 2011 |
| |
| Investment Income ($): | |
| Interest Income | 27,892,559 |
| Expenses: | |
| Management fee—Note 3(a) | 2,885,045 |
| Shareholder servicing costs—Note 3(c) | 1,552,556 |
| Distribution fees—Note 3(b) | 117,568 |
| Professional fees | 72,919 |
| Registration fees | 62,560 |
| Custodian fees—Note 3(c) | 53,458 |
| Interest and expense related to floating rate notes issued—Note 4 | 45,157 |
| Prospectus and shareholders’ reports | 34,128 |
| Trustees’ fees and expenses—Note 3(d) | 25,089 |
| Loan commitment fees—Note 2 | 3,613 |
| Miscellaneous | 46,954 |
| Total Expenses | 4,899,047 |
| Less—reduction in fees due to earnings credits—Note 3(c) | (1,359) |
| Net Expenses | 4,897,688 |
| Investment Income—Net | 22,994,871 |
| Realized and Unrealized Gain (Loss) on Investments—Note 4 ($): | |
| Net realized gain (loss) on investments | (7,322,753) |
| Net unrealized appreciation (depreciation) on investments | (14,631,334) |
| Net Realized and Unrealized Gain (Loss) on Investments | (21,954,087) |
| Net Increase in Net Assets Resulting from Operations | 1,040,784 |
| |
| See notes to financial statements. | |
26
STATEMENT OF CHANGES IN NET ASSETS
| | |
| | | Year Ended April 30, |
| | 2011 | 2010 |
| Operations ($): | | |
| Investment income—net | 22,994,871 | 25,060,287 |
| Net realized gain (loss) on investments | (7,322,753) | (7,436,926) |
| Net unrealized appreciation | | |
| (depreciation) on investments | (14,631,334) | 39,128,392 |
| Net Increase (Decrease) in Net Assets | | |
| Resulting from Operations | 1,040,784 | 56,751,753 |
| Dividends to Shareholders from ($): | | |
| Investment income—net: | | |
| Class A Shares | (11,034,091) | (12,400,899) |
| Class B Shares | (57,110) | (120,619) |
| Class C Shares | (522,738) | (553,707) |
| Class Z Shares | (11,160,219) | (11,795,334) |
| Total Dividends | (22,774,158) | (24,870,559) |
| Beneficial Interest Transactions ($): | | |
| Net proceeds from shares sold: | | |
| Class A Shares | 8,556,488 | 14,354,156 |
| Class B Shares | 47,459 | 172,090 |
| Class C Shares | 2,004,588 | 2,903,968 |
| Class Z Shares | 6,579,395 | 8,693,557 |
| Dividends reinvested: | | |
| Class A Shares | 7,776,863 | 8,788,377 |
| Class B Shares | 42,482 | 93,828 |
| Class C Shares | 319,429 | 353,898 |
| Class Z Shares | 8,254,115 | 8,706,505 |
| Cost of shares redeemed: | | |
| Class A Shares | (42,556,090) | (40,530,252) |
| Class B Shares | (1,184,828) | (2,664,135) |
| Class C Shares | (4,420,276) | (3,353,542) |
| Class Z Shares | (28,280,405) | (17,037,763) |
| Increase (Decrease) in Net Assets from | | |
| Beneficial Interest Transactions | (42,860,780) | (19,519,313) |
| Total Increase (Decrease) in Net Assets | (64,594,154) | 12,361,881 |
| Net Assets ($): | | |
| Beginning of Period | 549,106,518 | 536,744,637 |
| End of Period | 484,512,364 | 549,106,518 |
STATEMENT OF CHANGES IN NET ASSETS (continued)
| | |
| | | Year Ended April 30, |
| | 2011 | 2010 |
| Capital Share Transactions: | | |
| Class Aa | | |
| Shares sold | 711,573 | 1,180,064 |
| Shares issued for dividends reinvested | 638,911 | 724,520 |
| Shares redeemed | (3,530,667) | (3,341,862) |
| Net Increase (Decrease) in Shares Outstanding | (2,180,183) | (1,437,278) |
| Class Ba | | |
| Shares sold | 3,809 | 14,285 |
| Shares issued for dividends reinvested | 3,470 | 7,748 |
| Shares redeemed | (97,167) | (220,887) |
| Net Increase (Decrease) in Shares Outstanding | (89,888) | (198,854) |
| Class C | | |
| Shares sold | 162,532 | 237,851 |
| Shares issued for dividends reinvested | 26,153 | 28,686 |
| Shares redeemed | (366,054) | (276,164) |
| Net Increase (Decrease) in Shares Outstanding | (177,369) | (9,627) |
| Class Z | | |
| Shares sold | 535,652 | 716,227 |
| Shares issued for dividends reinvested | 678,507 | 717,724 |
| Shares redeemed | (2,346,573) | (1,404,857) |
| Net Increase (Decrease) in Shares Outstanding | (1,132,414) | 29,094 |
| |
| a | During the period ended April 30, 2011, 22,072 Class B shares representing $266,691 were automatically |
| | converted to 22,089 Class A shares and during the period ended April 30, 2010, 100,613 Class B shares |
| | representing $1,208,401 were automatically converted to 100,617 Class A shares. |
| See notes to financial statements. |
28
FINANCIAL HIGHLIGHTS
The following tables describe the performance for each share class for the fiscal periods indicated.All information (except portfolio turnover rate) reflects financial results for a single fund share.Total return shows how much your investment in the fund would have increased (or decreased) during each period, assuming you had reinvested all dividends and distributions.These figures have been derived from the fund’s financial statements.
| | | | | |
| | | Year Ended April 30, | |
| Class A Shares | 2011 | 2010 | 2009 | 2008 | 2007 |
| Per Share Data ($): | | | | | |
| Net asset value, beginning of period | 12.35 | 11.65 | 12.56 | 13.10 | 12.91 |
| Investment Operations: | | | | | |
| Investment income—neta | .53 | .55 | .57 | .57 | .57 |
| Net realized and unrealized | | | | | |
| gain (loss) on investments | (.50) | .70 | (.91) | (.54) | .18 |
| Total from Investment Operations | .03 | 1.25 | (.34) | .03 | .75 |
| Distributions: | | | | | |
| Dividends from investment income—net | (.53) | (.55) | (.57) | (.57) | (.56) |
| Net asset value, end of period | 11.85 | 12.35 | 11.65 | 12.56 | 13.10 |
| Total Return (%)b | .20 | 10.91 | (2.64) | .28 | 5.94 |
| Ratios/Supplemental Data (%): | | | | | |
| Ratio of total expenses | | | | | |
| to average net assets | .94 | .93 | 1.00 | 1.17 | 1.16 |
| Ratio of net expenses | | | | | |
| to average net assets | .94 | .93 | .99 | 1.17 | 1.16 |
| Ratio of interest and expense related | | | | | |
| to floating rate notes issued | | | | | |
| to average net assets | .01 | .01 | .07 | .23 | .25 |
| Ratio of net investment income | | | | | |
| to average net assets | 4.38 | 4.57 | 4.85 | 4.49 | 4.33 |
| Portfolio Turnover Rate | 21.95 | 22.61 | 56.67 | 77.20 | 68.06 |
| Net Assets, end of period ($ x 1,000) | 231,671 | 268,406 | 269,846 | 300,982 | 256,047 |
| |
| a | Based on average shares outstanding at each month end. |
| b | Exclusive of sales charge. |
| See notes to financial statements. |
FINANCIAL HIGHLIGHTS (continued)
| | | | | |
| | | Year Ended April 30, | |
| Class B Shares | 2011 | 2010 | 2009 | 2008 | 2007 |
| Per Share Data ($): | | | | | |
| Net asset value, beginning of period | 12.35 | 11.65 | 12.57 | 13.11 | 12.91 |
| Investment Operations: | | | | | |
| Investment income—neta | .44 | .47 | .49 | .49 | .49 |
| Net realized and unrealized | | | | | |
| gain (loss) on investments | (.50) | .70 | (.90) | (.53) | .21 |
| Total from Investment Operations | (.06) | 1.17 | (.41) | (.04) | .70 |
| Distributions: | | | | | |
| Dividends from investment income—net | (.44) | (.47) | (.51) | (.50) | (.50) |
| Net asset value, end of period | 11.85 | 12.35 | 11.65 | 12.57 | 13.11 |
| Total Return (%)b | (.49) | 10.22 | (3.26) | (.25) | 5.48 |
| Ratios/Supplemental Data (%): | | | | | |
| Ratio of total expenses | | | | | |
| to average net assets | 1.54 | 1.55 | 1.54 | 1.67 | 1.67 |
| Ratio of net expenses | | | | | |
| to average net assets | 1.54 | 1.55 | 1.53 | 1.67 | 1.67 |
| Ratio of interest and expense related | | | | | |
| to floating rate notes issued | | | | | |
| to average net assets | .01 | .01 | .07 | .23 | .25 |
| Ratio of net investment income | | | | | |
| to average net assets | 3.64 | 3.96 | 4.26 | 3.95 | 3.81 |
| Portfolio Turnover Rate | 21.95 | 22.61 | 56.67 | 77.20 | 68.06 |
| Net Assets, end of period ($ x 1,000) | 1,000 | 2,153 | 4,348 | 9,732 | 11,799 |
| |
| a | Based on average shares outstanding at each month end. |
| b | Exclusive of sales charge. |
| See notes to financial statements. |
30
| | | | | |
| | | Year Ended April 30, | |
| Class C Shares | 2011 | 2010 | 2009 | 2008 | 2007 |
| Per Share Data ($): | | | | | |
| Net asset value, beginning of period | 12.37 | 11.66 | 12.58 | 13.12 | 12.93 |
| Investment Operations: | | | | | |
| Investment income—neta | .44 | .46 | .49 | .47 | .47 |
| Net realized and unrealized | | | | | |
| gain (loss) on investments | (.49) | .71 | (.93) | (.53) | .19 |
| Total from Investment Operations | (.05) | 1.17 | (.44) | (.06) | .66 |
| Distributions: | | | | | |
| Dividends from investment income—net | (.44) | (.46) | (.48) | (.48) | (.47) |
| Net asset value, end of period | 11.88 | 12.37 | 11.66 | 12.58 | 13.12 |
| Total Return (%)b | (.46) | 10.15 | (3.42) | (.46) | 5.16 |
| Ratios/Supplemental Data (%): | | | | | |
| Ratio of total expenses | | | | | |
| to average net assets | 1.69 | 1.69 | 1.76 | 1.91 | 1.89 |
| Ratio of net expenses | | | | | |
| to average net assets | 1.69 | 1.69 | 1.75 | 1.91 | 1.89 |
| Ratio of interest and expense related | | | | | |
| to floating rate notes issued | | | | | |
| to average net assets | .01 | .01 | .07 | .23 | .25 |
| Ratio of net investment income | | | | | |
| to average net assets | 3.61 | 3.80 | 4.12 | 3.74 | 3.58 |
| Portfolio Turnover Rate | 21.95 | 22.61 | 56.67 | 77.20 | 68.06 |
| Net Assets, end of period ($ x 1,000) | 12,750 | 15,476 | 14,702 | 12,586 | 10,274 |
| |
| a | Based on average shares outstanding at each month end. |
| b | Exclusive of sales charge. |
| See notes to financial statements. |
FINANCIAL HIGHLIGHTS (continued)
| | | | | |
| | | Year Ended April 30, | |
| Class Z Shares | 2011 | 2010 | 2009 | 2008 | 2007 |
| Per Share Data ($): | | | | | |
| Net asset value, beginning of period | 12.34 | 11.65 | 12.56 | 13.10 | 12.91 |
| Investment Operations: | | | | | |
| Investment income—neta | .54 | .56 | .58 | .58 | .57 |
| Net realized and unrealized | | | | | |
| gain (loss) on investments | (.50) | .69 | (.91) | (.54) | .19 |
| Total from Investment Operations | .04 | 1.25 | (.33) | .04 | .76 |
| Distributions: | | | | | |
| Dividends from investment income—net | (.53) | (.56) | (.58) | (.58) | (.57) |
| Net asset value, end of period | 11.85 | 12.34 | 11.65 | 12.56 | 13.10 |
| Total Return (%) | .34 | 10.87 | (2.59) | .33 | 6.00 |
| Ratios/Supplemental Data (%): | | | | | |
| Ratio of total expenses | | | | | |
| to average net assets | .88 | .88 | .94 | 1.08 | 1.10 |
| Ratio of net expenses | | | | | |
| to average net assets | .88 | .88 | .94 | 1.08 | 1.10 |
| Ratio of interest and expense related | | | | | |
| to floating rate notes issued | | | | | |
| to average net assets | .01 | .01 | .07 | .23 | .25 |
| Ratio of net investment income | | | | | |
| to average net assets | 4.44 | 4.62 | 4.90 | 4.53 | 4.38 |
| Portfolio Turnover Rate | 21.95 | 22.61 | 56.67 | 77.20 | 68.06 |
| Net Assets, end of period ($ x 1,000) | 239,092 | 263,072 | 247,849 | 284,168 | 306,634 |
|
| a Based on average shares outstanding at each month end. |
| See notes to financial statements. |
32
NOTES TO FINANCIAL STATEMENTS
NOTE 1—Significant Accounting Policies:
Dreyfus Municipal Bond Opportunity Fund (the “fund”) is registered under the Investment Company Act of 1940, as amended (the “Act”), as a diversified open-end management investment company. The fund’s investment objective is to maximize current income exempt from federal income tax to the extent consistent with the preservation of capital. The Dreyfus Corporation (the “Manager” or “Dreyfus”), a wholly-owned subsidiary ofThe Bank of NewYork Mellon Corporation (“BNY Mellon”), serves as the fund’s investment adviser.
MBSC Securities Corporation (the “Distributor”), a wholly-owned subsidiary of the Manager, is the distributor of the fund’s shares. The fund is authorized to issue an unlimited number of $.001 par value shares of Beneficial Interest in each of the following classes of shares: Class A, Class B, Class C and Class Z. Class A shares are subject to a sales charge imposed at the time of purchase. Class B shares are subject to a contingent deferred sales charge (“CDSC”) imposed on Class B share redemptions made within six years of purchase and automatically convert to Class A shares after six years.The fund no longer offers Class B shares, except in connection with dividend reinvestment and permitted exchanges of Class B shares. Class C shares are subject to a CDSC imposed on Class C shares redeemed within one year of purchase. Class Z shares are sold at net asset value per share generally only to shareholders of the fund who received Class Z shares in exchange for their shares of a Dreyfus-managed fund as a result of the reorganization of such Dreyfus-managed fund, and who continue to maintain accounts with the fund at the time of purchase. Class Z shares generally are not available for new accounts. Other differences between the classes include the services offered to and the expenses borne by each class, the allocation of certain transfer agency costs and certain voting rights. Income, expenses (other than expenses attributable to a specific class), and realized and unrealized gains or losses on investments are allocated to each class of shares based on its relative net assets.
NOTES TO FINANCIAL STATEMENTS (continued)
The Financial Accounting Standards Board (“FASB”) Accounting Standards Codification (“ASC”) is the exclusive reference of authoritative U.S. generally accepted accounting principles (“GAAP”) recognized by the FASB to be applied by nongovernmental entities. Rules and interpretive releases of the Securities and Exchange Commission (“SEC”) under authority of federal laws are also sources of authoritative GAAP for SEC registrants. The fund’s financial statements are prepared in accordance with GAAP, which may require the use of management estimates and assumptions.Actual results could differ from those estimates.
The fund enters into contracts that contain a variety of indemnifications. The fund’s maximum exposure under these arrangements is unknown.The fund does not anticipate recognizing any loss related to these arrangements.
(a) Portfolio valuation: Investments in securities are valued each business day by an independent pricing service (the “Service”) approved by the Board of Trustees. Investments for which quoted bid prices are readily available and are representative of the bid side of the market in the judgment of the Service are valued at the mean between the quoted bid prices (as obtained by the Service from dealers in such securities) and asked prices (as calculated by the Service based upon its evaluation of the market for such securities). Other investments (which constitute a majority of the portfolio securities) are carried at fair value as determined by the Service, based on methods which include consideration of: yields or prices of municipal securities of comparable quality, coupon, maturity and type; indications as to values from dealers; and general market conditions.
The fair value of a financial instrument is the amount that would be received to sell an asset or paid to transfer a liability in an orderly transaction between market participants at the measurement date (i.e. the exit price). GAAP establishes a fair value hierarchy that prioritizes the inputs of valuation techniques used to measure fair value.This hierarchy gives the highest priority to unadjusted quoted prices in active markets for identical assets or liabilities (Level 1 measurements) and the lowest priority to unobservable inputs (Level 3 measurements).
34
Additionally, GAAP provides guidance on determining whether the volume and activity in a market has decreased significantly and whether such a decrease in activity results in transactions that are not orderly. GAAP requires enhanced disclosures around valuation inputs and techniques used during annual and interim periods.
Various inputs are used in determining the value of the fund’s investments relating to fair value measurements.These inputs are summarized in the three broad levels listed below:
Level 1—unadjusted quoted prices in active markets for identical investments.
Level 2—other significant observable inputs (including quoted prices for similar investments, interest rates, prepayment speeds, credit risk, etc.).
Level 3—significant unobservable inputs (including the fund’s own assumptions in determining the fair value of investments).
The inputs or methodology used for valuing securities are not necessarily an indication of the risk associated with investing in those securities.
The following is a summary of the inputs used as of April 30, 2011 in valuing the fund’s investments:
| | | | |
| | | Level 2—Other | Level 3— | |
| | Level 1— | Significant | Significant | |
| | Unadjusted | Observable | Unobservable | |
| | Quoted Prices | Inputs | Inputs | Total |
| Assets ($) | | | | |
| Investments in Securities: | | | |
| Municipal Bonds | — | 481,147,866 | — | 481,147,866 |
In January 2010, FASB issued Accounting Standards Update (“ASU”) No. 2010-06 “Improving Disclosures about FairValue Measurements”. The portions of ASU No. 2010-06 which require reporting entities to prepare new disclosures surrounding amounts and reasons for significant transfers in and out of Level 1 and Level 2 fair value measurements as well as inputs and valuation techniques used to measure fair
NOTES TO FINANCIAL STATEMENTS (continued)
value for both recurring and nonrecurring fair value measurements that fall in either Level 2 or Level 3 have been adopted by the fund. No significant transfers between Level 1 or Level 2 fair value measurements occurred at April 30, 2011.
(b) Securities transactions and investment income: Securities transactions are recorded on a trade date basis. Realized gains and losses from securities transactions are recorded on the identified cost basis. Interest income, adjusted for accretion of discount and amortization of premium on investments, is earned from settlement date and recognized on the accrual basis. Securities purchased or sold on a when-issued or delayed-delivery basis may be settled a month or more after the trade date.
(c) Dividends to shareholders: It is the policy of the fund to declare dividends daily from investment income-net. Such dividends are paid monthly. Dividends from net realized capital gains, if any, are normally declared and paid annually, but the fund may make distributions on a more frequent basis to comply with the distribution requirements of the Internal Revenue Code of 1986, as amended (the “Code”).To the extent that net realized capital gains can be offset by capital loss carryovers, it is the policy of the fund not to distribute such gains. Income and capital gain distributions are determined in accordance with income tax regulations, which may differ from GAAP.
(d) Federal income taxes: It is the policy of the fund to continue to qualify as a regulated investment company, which can distribute tax exempt dividends, by complying with the applicable provisions of the Code, and to make distributions of income and net realized capital gain sufficient to relieve it from substantially all federal income and excise taxes.
As of and during the period ended April 30, 2011, the fund did not have any liabilities for any uncertain tax positions.The fund recognizes interest and penalties, if any, related to uncertain tax positions as income tax expense in the Statement of Operations. During the period, the fund did not incur any interest or penalties.
36
Each of the tax years in the four-year period ended April 30, 2011 remains subject to examination by the Internal Revenue Service and state taxing authorities.
At April 30, 2011, the components of accumulated earnings on a tax basis were as follows: undistributed tax exempt income $377,192, accumulated capital losses $45,254,486 and unrealized appreciation $12,192,410. In addition, the fund had $3,777,618 of capital losses realized after October 31, 2010, which were deferred for tax purposes to the first day of the following fiscal year.
The accumulated capital loss carryover is available for federal income tax purposes to be applied against future net securities profits, if any, realized subsequent to April 30, 2011. If not applied, $8,158,132 of the carryover expires in fiscal 2012, $910,072 expires in fiscal 2016, $12,209,003 expires in fiscal 2017, $20,082,904 expires in fiscal 2018 and $3,894,375 expires in fiscal 2019.
The tax character of distributions paid to shareholders during the fiscal periods ended April 30, 2011 and April 30, 2010 were as follows: tax exempt income $22,770,304 and $24,870,339 and ordinary income $3,854 and $220, respectively.
During the period ended April 30, 2011, as a result of permanent book to tax differences, primarily due to the tax treatment for amortization adjustments and capital loss carryover expiration, the fund decreased accumulated undistributed investment income-net by $220,713, increased accumulated net realized gain (loss) on investments by $10,231,882 and decreased paid-in capital by $10,011,169. Net assets and net asset value per share were not affected by this reclassification.
NOTE 2—Bank Lines of Credit:
The fund participates with other Dreyfus-managed funds in a $225 million unsecured credit facility led by Citibank, N.A. and a $300 million unsecured credit facility provided by The Bank of New York
NOTES TO FINANCIAL STATEMENTS (continued)
Mellon, a subsidiary of BNY Mellon and an affiliate of Dreyfus (each, a “Facility”), each to be utilized primarily for temporary or emergency purposes, including the financing of redemptions. In connection therewith, the fund has agreed to pay its pro rata portion of commitment fees for each Facility. Interest is charged to the fund based on rates determined pursuant to the terms of the respective Facility at the time of borrowing. During the period ended April 30, 2011, the fund did not borrow under the Facilities.
NOTE 3—Management Fee and Other Transactions With Affiliates:
(a) Pursuant to a management agreement with the Manager, the management fee is computed at the annual rate of .55% of the value of the fund’s average daily net assets and is payable monthly.
During the period ended April 30, 2011, the Distributor retained $10,378 from commissions earned on sales of the fund’s Class A shares and $3,338 and $369 from CDSCs on redemptions of the fund’s Class B and Class C shares, respectively.
(b) Under the Distribution Plan (the “Plan”) adopted pursuant to Rule 12b-1 under the Act, Class B and Class C shares pay the Distributor for distributing their shares at an annual rate of .50% of the value of the average daily net assets of Class B shares and .75% of the value of the average daily net assets of Class C shares. During the period ended April 30, 2011, Class B and Class C shares were charged $7,899 and $109,669, respectively, pursuant to the Plan.
(c) Under the Shareholder Services Plan, Class A, Class B and Class C shares pay the Distributor at an annual rate of .25% of the value of the average daily net assets of Class A, Class B and Class C shares and Class Z shares pay the Distributor at an annual rate of .20% of the value of the average daily net assets of Class Z shares, for the provision of certain services. The services provided may include personal services relating to shareholder accounts, such as answering shareholder
38
inquiries regarding the fund and providing reports and other information, and services related to the maintenance of shareholder accounts. The Distributor may make payments to Service Agents (a securities dealer, financial institution or other industry professional) in respect of these services.The Distributor determines the amounts to be paid to Service Agents. During the period ended April 30, 2011, Class A, Class B, Class C and Class Z shares were charged $635,842, $3,950, $36,556 and $508,029, respectively, pursuant to the Shareholder Services Plan.
The fund compensates Dreyfus Transfer, Inc., a wholly-owned subsidiary of the Manager, under a transfer agency agreement for providing personnel and facilities to perform transfer agency services for the fund. During the period ended April 30, 2011, the fund was charged $207,668 pursuant to the transfer agency agreement, which is included in Shareholder servicing costs in the Statement of Operations.
The fund has arrangements with the custodian and cash management bank whereby the fund may receive earnings credits when positive cash balances are maintained, which are used to offset custody and cash management fees. For financial reporting purposes, the fund includes net earnings credits as an expense offset in the Statement of Operations.
The fund compensates The Bank of New York Mellon under a cash management agreement for performing cash management services related to fund subscriptions and redemptions. During the period ended April 30, 2011, the fund was charged $20,290 pursuant to the cash management agreement, which is included in Shareholder servicing costs in the Statement of Operations.These fees were partially offset by earnings credits of $1,359.
The fund also compensates The Bank of New York Mellon under a custody agreement for providing custodial services for the fund. During the period ended April 30, 2011, the fund was charged $53,458 pursuant to the custody agreement.
NOTES TO FINANCIAL STATEMENTS (continued)
During the period ended April 30, 2011, the fund was charged $6,327 for services performed by the Chief Compliance Officer.
The components of “Due to The Dreyfus Corporation and affiliates” in the Statement of Assets and Liabilities consist of: management fees $217,441, Rule 12b-1 distribution plan fees $8,185, shareholder services plan fees $89,088, custodian fees $23,880, chief compliance officer fees $2,481 and transfer agency per account fees $30,558.
(d) Each Board member also serves as a Board member of other funds within the Dreyfus complex. Annual retainer fees and attendance fees are allocated to each fund based on net assets.
NOTE 4—Securities Transactions:
The aggregate amount of purchases and sales of investment securities, excluding short-term securities, during the period ended April 30, 2011, amounted to $113,761,084 and $163,287,772, respectively.
Inverse Floater Securities: The fund participates in secondary inverse floater structures in which fixed-rate, tax-exempt municipal bonds are transferred to a trust.The trust subsequently issues two or more variable rate securities that are collateralized by the cash flows of the fixed-rate, tax-exempt municipal bonds. One or more of these variable rate securities pays interest based on a short-term floating rate set by a remarketing agent at predetermined intervals.A residual interest tax-exempt security is also created by the trust, which is transferred to the fund, and is paid interest based on the remaining cash flow of the trust, after payment of interest on the other securities and various expenses of the trust.
40
The fund accounts for the transfer of bonds to the trust as secured borrowings, with the securities transferred remaining in the fund’s investments, and the related floating rate certificate securities reflected as fund liabilities in the Statement of Assets and Liabilities.
The average amount of borrowings outstanding under the inverse floater structure during the period ended April 30, 2011, was approximately $4,845,000, with a related weighted average annualized interest rate of .93%.
At April 30, 2011, the cost of investments for federal income tax purposes was $464,110,456; accordingly, accumulated net unrealized appreciation on investments was $12,192,410, consisting of $21,847,232 gross unrealized appreciation and $9,654,822 gross unrealized depreciation.
|
| REPORT OF INDEPENDENT REGISTERED |
| PUBLIC ACCOUNTING FIRM |
Shareholders and Board of Trustees Dreyfus Municipal Bond Opportunity Fund
We have audited the accompanying statement of assets and liabilities of Dreyfus Municipal Bond Opportunity Fund, including the statement of investments, as of April 30, 2011, and the related statement of operations for the year then ended, the statement of changes in net assets for each of the two years in the period then ended, and financial highlights for each of the periods indicated therein.These financial statements and financial highlights are the responsibility of the Fund’s management. Our responsibility is to express an opinion on these financial statements and financial highlights based on our audits.
We conducted our audits in accordance with the standards of the Public Company Accounting Oversight Board (United States).Those standards require that we plan and perform the audit to obtain reasonable assurance about whether the financial statements and financial highlights are free of material misstatement.We were not engaged to perform an audit of the Fund’s internal control over financial reporting. Our audits included consideration of internal control over financial reporting as a basis for designing audit procedures that are appropriate in the circumstances, but not for the purpose of expressing an opinion on the effectiveness of the Fund’s internal control over financial reporting.Accordingly, we express no such opinion. An audit also includes examining, on a test basis, evidence supporting the amounts and disclosures in the financial statements and financial highlights, assessing the accounting principles used and significant estimates made by management, and evaluating the overall financial statement presentation. Our procedures included confirmation of securities owned as of April 30, 2011 by correspondence with the custodian and others.We believe that our audits provide a reasonable basis for our opinion.
In our opinion, the financial statements and financial highlights referred to above present fairly, in all material respects, the financial position of Dreyfus Municipal Bond Opportunity Fund at April 30, 2011, the results of its operations for the year then ended, the changes in its net assets for each of the two years in the period then ended, and the financial highlights for each of the indicated years, in conformity with U.S. generally accepted accounting principles.

New York, New York
June 28, 2011
42
IMPORTANT TAX INFORMATION (Unaudited)
In accordance with federal tax law, the fund hereby designates all the dividends paid from investment income-net during its fiscal year ended April 30, 2011 as “exempt-interest dividends” (not generally subject to regular federal income tax), except $3,854 that is being designated as an ordinary income distribution for reporting purposes. Where required by federal tax law rules, shareholders will receive notification of their portion of the fund’s taxable ordinary dividends (if any) and capital gains distributions (if any) paid for the 2011 calendar year on Form 1099-DIV and their portion of the fund’s tax-exempt dividends paid for the 2011 calendar year on Form 1099-INT, both of which will be mailed by early 2012.

OFFICERS OF THE FUND (Unaudited)
BRADLEY J. SKAPYAK, President since January 2010.
Chief Operating Officer and a director of the Manager since June 2009. From April 2003 to June 2009, Mr. Skapyak was the head of the Investment Accounting and Support Department of the Manager. He is an officer of 76 investment companies (comprised of 170 portfolios) managed by the Manager. He is 52 years old and has been an employee of the Manager since February 1988.
MICHAEL A. ROSENBERG, Vice President and Secretary since August 2005.
Assistant General Counsel of BNY Mellon, and an officer of 77 investment companies (comprised of 195 portfolios) managed by the Manager. He is 51 years old and has been an employee of the Manager since October 1991.
KIESHA ASTWOOD, Vice President and Assistant Secretary since January 2010.
Counsel of BNY Mellon, and an officer of 77 investment companies (comprised of 195 portfolios) managed by the Manager. She is 38 years old and has been an employee of the Manager since July 1995.
JAMES BITETTO, Vice President and Assistant Secretary since August 2005.
Senior Counsel of BNY Mellon and Secretary of the Manager, and an officer of 77 investment companies (comprised of 195 portfolios) managed by the Manager. He is 44 years old and has been an employee of the Manager since December 1996.
JONI LACKS CHARATAN, Vice President and Assistant Secretary since August 2005.
Senior Counsel of BNY Mellon, and an officer of 77 investment companies (comprised of 195 portfolios) managed by the Manager. She is 55 years old and has been an employee of the Manager since October 1988.
JOSEPH M. CHIOFFI, Vice President and Assistant Secretary since August 2005.
Senior Counsel of BNY Mellon, and an officer of 77 investment companies (comprised of 195 portfolios) managed by the Manager. He is 49 years old and has been an employee of the Manager since June 2000.
KATHLEEN DENICHOLAS, Vice President and Assistant Secretary since January 2010.
Senior Counsel of BNY Mellon, and an officer of 77 investment companies (comprised of 195 portfolios) managed by the Manager. She is 36 years old and has been an employee of the Manager since February 2001.
JANETTE E. FARRAGHER, Vice President and Assistant Secretary since August 2005.
Assistant General Counsel of BNY Mellon, and an officer of 77 investment companies (comprised of 195 portfolios) managed by the Manager. She is 48 years old and has been an employee of the Manager since February 1984.
JOHN B. HAMMALIAN, Vice President and Assistant Secretary since August 2005.
Managing Counsel of BNY Mellon, and an officer of 77 investment companies (comprised of 195 portfolios) managed by the Manager. He is 47 years old and has been an employee of the Manager since February 1991.
M. CRISTINA MEISER, Vice President and Assistant Secretary since January 2010.
Senior Counsel of BNY Mellon, and an officer of 77 investment companies (comprised of 195 portfolios) managed by the Manager. She is 41 years old and has been an employee of the Manager since August 2001.
46
ROBERT R. MULLERY, Vice President and Assistant Secretary since August 2005.
Managing Counsel of BNY Mellon, and an officer of 77 investment companies (comprised of 195 portfolios) managed by the Manager. He is 59 years old and has been an employee of the Manager since May 1986.
JEFF PRUSNOFSKY, Vice President and Assistant Secretary since August 2005.
Managing Counsel of BNY Mellon, and an officer of 77 investment companies (comprised of 195 portfolios) managed by the Manager. He is 45 years old and has been an employee of the Manager since October 1990.
JAMES WINDELS, Treasurer since November 2001.
Director – Mutual Fund Accounting of the Manager, and an officer of 77 investment companies (comprised of 195 portfolios) managed by the Manager. He is 52 years old and has been an employee of the Manager since April 1985.
RICHARD CASSARO, Assistant Treasurer since January 2008.
Senior Accounting Manager – Money Market and Municipal Bond Funds of the Manager, and an officer of 77 investment companies (comprised of 195 portfolios) managed by the Manager. He is 52 years old and has been an employee of the Manager since September 1982.
GAVIN C. REILLY, Assistant Treasurer since December 2005.
Tax Manager of the Investment Accounting and Support Department of the Manager, and an officer of 77 investment companies (comprised of 195 portfolios) managed by the Manager. He is 42 years old and has been an employee of the Manager since April 1991.
ROBERT ROBOL, Assistant Treasurer since August 2005.
Senior Accounting Manager – Fixed Income Funds of the Manager, and an officer of 77 investment companies (comprised of 195 portfolios) managed by the Manager. He is 47 years old and has been an employee of the Manager since October 1988.
ROBERT SALVIOLO, Assistant Treasurer since July 2007.
Senior Accounting Manager – Equity Funds of the Manager, and an officer of 77 investment companies (comprised of 195 portfolios) managed by the Manager. He is 44 years old and has been an employee of the Manager since June 1989.
ROBERT SVAGNA, Assistant Treasurer since August 2005.
Senior Accounting Manager – Equity Funds of the Manager, and an officer of 77 investment companies (comprised of 195 portfolios) managed by the Manager. He is 44 years old and has been an employee of the Manager since November 1990.
OFFICERS OF THE FUND (Unaudited) (continued)
JOSEPH W. CONNOLLY, Chief Compliance Officer since October 2004.
Chief Compliance Officer of the Manager and The Dreyfus Family of Funds (77 investment companies, comprised of 195 portfolios). From November 2001 through March 2004, Mr. Connolly was first Vice-President, Mutual Fund Servicing for Mellon Global Securities Services. In that capacity, Mr. Connolly was responsible for managing Mellon’s Custody, Fund Accounting and Fund Administration services to third-party mutual fund clients. He is 53 years old and has served in various capacities with the Manager since 1980, including manager of the firm’s Fund Accounting Department from 1997 through October 2001.
STEPHEN J. STOREN, Anti-Money Laundering Compliance Officer since May 2011.
Chief Compliance Officer of the Distributor, and the Anti-Money Laundering Compliance Officer of 73 investment companies (comprised of 191 portfolios) managed by the Manager. He is 56 years old and has been an employee of the Distributor since October 1999.
48
Item 2. Code of Ethics.
The Registrant has adopted a code of ethics that applies to the Registrant's principal executive officer, principal financial officer, principal accounting officer or controller, or persons performing similar functions. There have been no amendments to, or waivers in connection with, the Code of Ethics during the period covered by this Report.
Item 3. Audit Committee Financial Expert.
The Registrant's Board has determined that Joseph S. DiMartino, a member of the Audit Committee of the Board, is an audit committee financial expert as defined by the Securities and Exchange Commission (the "SEC"). Mr. DiMartino is "independent" as defined by the SEC for purposes of audit committee financial expert determinations.
Item 4. Principal Accountant Fees and Services.
(a) Audit Fees. The aggregate fees billed for each of the last two fiscal years (the "Reporting Periods") for professional services rendered by the Registrant's principal accountant (the "Auditor") for the audit of the Registrant's annual financial statements or services that are normally provided by the Auditor in connection with the statutory and regulatory filings or engagements for the Reporting Periods, were $ 39,208 in 2010 and $30,312 in 2011.
(b) Audit-Related Fees. The aggregate fees billed in the Reporting Periods for assurance and related services by the Auditor that are reasonably related to the performance of the audit of the Registrant's financial statements and are not reported under paragraph (a) of this Item 4 were $5,382 in 2010 and $6,000 in 2011. These services consisted of one or more of the following: (i) agreed upon procedures related to compliance with Internal Revenue Code section 817(h), (ii) security counts required by Rule 17f-2 under the Investment Company Act of 1940, as amended, (iii) advisory services as to the accounting or disclosure treatment of Registrant transactions or events and (iv) advisory services to the accounting or disclosure treatment of the actual or potential impact to the Registrant of final or proposed rules, standards or interpretations by the Securities and Exchange Commission, the Financial Accounting Standards Boards or other regulatory or standard-setting bodies.
The aggregate fees billed in the Reporting Periods for non-audit assurance and related services by the Auditor to the Registrant's investment adviser (not including any sub-investment adviser whose role is primarily portfolio management and is subcontracted with or overseen by another investment adviser), and any entity controlling, controlled by or under common control with the investment adviser that provides ongoing services to the Registrant ("Service Affiliates"), that were reasonably related to the performance of the annual audit of the Service Affiliate, which required pre-approval by the Audit Committee were $0 in 2010 and $0 in 2011.
(c) Tax Fees. The aggregate fees billed in the Reporting Periods for professional services rendered by the Auditor for tax compliance, tax advice, and tax planning ("Tax Services") were $3,863 in 2010 and $3,822 in 2011. These services consisted of: (i) review or preparation of U.S. federal, state, local and excise tax returns; (ii) U.S. federal, state and local tax planning, advice and assistance regarding statutory, regulatory or administrative developments; and (iii) tax advice regarding tax qualification matters and/or treatment of various financial instruments held or proposed to be acquired or held. The aggregate fees billed in the Reporting Periods for Tax Services by the Auditor to Service Affiliates, which required pre-approval by the Audit Committee were $0 in 2010 and $0 in 2011.
(d) All Other Fees. The aggregate fees billed in the Reporting Periods for products and services provided by the Auditor, other than the services reported in paragraphs (a) through (c) of this Item, were $0 in 2010 and $183 in 2011. These services consisted of a review of the Registrant's anti-money laundering program.
The aggregate fees billed in the Reporting Periods for Non-Audit Services by the Auditor to Service Affiliates, other than the services reported in paragraphs (b) through (c) of this Item, which required pre-approval by the Audit Committee, were $0 in 2010 and $0 in 2011.
(e)(1) Audit Committee Pre-Approval Policies and Procedures. The Registrant's Audit Committee has established policies and procedures (the "Policy") for pre-approval (within specified fee limits) of the Auditor's engagements for non-audit services to the Registrant and Service Affiliates without specific case-by-case consideration. The pre-approved services in the Policy can include pre-approved audit services, pre-approved audit-related services, pre-approved tax services and pre-approved all other services. Pre-approval considerations include whether the proposed services are compatible with maintaining the Auditor's independence. Pre-approvals pursuant to the Policy are considered annually.
(e)(2) Note: None of the services described in paragraphs (b) through (d) of this Item 4 were approved by the Audit Committee pursuant to paragraph (c)(7)(i)(C) of Rule 2-01 of Regulation S-X.
(f) None of the hours expended on the principal accountant's engagement to audit the registrant's financial statements for the most recent fiscal year were attributed to work performed by persons other than the principal account's full-time, permanent employees.
Non-Audit Fees. The aggregate non-audit fees billed by the Auditor for services rendered to the Registrant, and rendered to Service Affiliates, for the Reporting Periods were $27,572,994 in 2010 and $21,309,173 in 2011.
Auditor Independence. The Registrant's Audit Committee has considered whether the provision of non-audit services that were rendered to Service Affiliates, which were not pre-approved (not requiring pre-approval), is compatible with maintaining the Auditor's independence.
Item 5. Audit Committee of Listed Registrants.
Not applicable. [CLOSED-END FUNDS ONLY]
Item 6. Investments.
(a) Not applicable.
Item 7. Disclosure of Proxy Voting Policies and Procedures for Closed-End Management Investment Companies.
Not applicable. [CLOSED-END FUNDS ONLY]
Item 8. Portfolio Managers of Closed-End Management Investment Companies.
Not applicable. [CLOSED-END FUNDS ONLY, beginning with reports for periods ended on and after December 31, 2005]
Item 9. Purchases of Equity Securities by Closed-End Management Investment Companies and Affiliated Purchasers.
Not applicable. [CLOSED-END FUNDS ONLY]
Item 10. Submission of Matters to a Vote of Security Holders.
There have been no material changes to the procedures applicable to Item 10.
Item 11. Controls and Procedures.
(a) The Registrant's principal executive and principal financial officers have concluded, based on their evaluation of the Registrant's disclosure controls and procedures as of a date within 90 days of the filing date of this report, that the Registrant's disclosure controls and procedures are reasonably designed to ensure that information required to be disclosed by the Registrant on Form N-CSR is recorded, processed, summarized and reported within the required time periods and that information required to be disclosed by the Registrant in the reports that it files or submits on Form N-CSR is accumulated and communicated to the Registrant's management, including its principal executive and principal financial officers, as appropriate to allow timely decisions regarding required disclosure.
(b) There were no changes to the Registrant's internal control over financial reporting that occurred during the second fiscal quarter of the period covered by this report that have materially affected, or are reasonably likely to materially affect, the Registrant's internal control over financial reporting.
Item 12. Exhibits.
(a)(1) Code of ethics referred to in Item 2.
(a)(2) Certifications of principal executive and principal financial officers as required by Rule 30a-2(a) under the Investment Company Act of 1940.
(a)(3) Not applicable.
(b) Certification of principal executive and principal financial officers as required by Rule 30a-2(b) under the Investment Company Act of 1940.
SIGNATURES
Pursuant to the requirements of the Securities Exchange Act of 1934 and the Investment Company Act of 1940, the Registrant has duly caused this Report to be signed on its behalf by the undersigned, thereunto duly authorized.
Dreyfus Municipal Bond Opportunity Fund
By: /s/ Bradley J. Skapyak |
Bradley J. Skapyak, President |
Date: June 13, 2011 |
|
Pursuant to the requirements of the Securities Exchange Act of 1934 and the Investment Company Act of 1940, this Report has been signed below by the following persons on behalf of the Registrant and in the capacities and on the dates indicated. |
|
By: /s/ Bradley J. Skapyak |
Bradley J. Skapyak, President |
Date: June 13, 2011 |
|
By: /s/ James Windels |
James Windels, Treasurer |
Date: June 13, 2011 |
|
EXHIBIT INDEX
(a)(1) Code of ethics referred to in Item 2.
(a)(2) Certifications of principal executive and principal financial officers as required by Rule 30a-2(a) under the Investment Company Act of 1940. (EX-99.CERT)
(b) Certification of principal executive and principal financial officers as required by Rule 30a-2(b) under the Investment Company Act of 1940. (EX-99.906CERT)