UNITED STATES
SECURITIES AND EXCHANGE COMMISSION
Washington, D.C. 20549
FORM N-CSR
CERTIFIED SHAREHOLDER REPORT OF REGISTERED MANAGEMENT
INVESTMENT COMPANIES
Investment Company Act file number | 811- 4764 |
| |
| Dreyfus Municipal Bond Opportunity Fund | |
| (Exact name of Registrant as specified in charter) | |
| | |
| c/o The Dreyfus Corporation 200 Park Avenue New York, New York 10166 | |
| (Address of principal executive offices) (Zip code) | |
| | |
| John Pak, Esq. 200 Park Avenue New York, New York 10166 | |
| (Name and address of agent for service) | |
|
Registrant's telephone number, including area code: | (212) 922-6000 |
| |
Date of fiscal year end: | 4/30 | |
Date of reporting period: | 4/30/13 | |
| | | | | | | |
FORM N-CSR
Item 1. Reports to Stockholders.
|
| Dreyfus Municipal |
| Bond Opportunity Fund |
ANNUAL REPORT April 30, 2013

Save time. Save paper. View your next shareholder report online as soon as it’s available. Log into www.dreyfus.com and sign up for Dreyfus eCommunications. It’s simple and only takes a few minutes.
The views expressed in this report reflect those of the portfolio manager only through the end of the period covered and do not necessarily represent the views of Dreyfus or any other person in the Dreyfus organization. Any such views are subject to change at any time based upon market or other conditions and Dreyfus disclaims any responsibility to update such views.These views may not be relied on as investment advice and, because investment decisions for a Dreyfus fund are based on numerous factors, may not be relied on as an indication of trading intent on behalf of any Dreyfus fund.
|
| Not FDIC-Insured • Not Bank-Guaranteed • May Lose Value |
| | Contents |
| | THE FUND |
| 2 | A Letter from the President |
| 3 | Discussion of Fund Performance |
| 6 | Fund Performance |
| 8 | Understanding Your Fund’s Expenses |
| 8 | Comparing Your Fund’s Expenses With Those of Other Funds |
| 9 | Statement of Investments |
| 23 | Statement of Assets and Liabilities |
| 24 | Statement of Operations |
| 25 | Statement of Changes in Net Assets |
| 27 | Financial Highlights |
| 30 | Notes to Financial Statements |
| 42 | Report of Independent Registered Public Accounting Firm |
| 43 | Important Tax Information |
| 44 | Board Members Information |
| 46 | Officers of the Fund |
| | FOR MORE INFORMATION |
| | Back Cover |
Dreyfus Municipal
Bond Opportunity Fund
The Fund
A LETTER FROM THE PRESIDENT
Dear Shareholder:
We are pleased to present this annual report for Dreyfus Municipal Bond Opportunity Fund, covering the 12-month period from May 1, 2012, through April 30, 2013. For information about how the fund performed during the reporting period, as well as general market perspectives, we provide a Discussion of Fund Performance on the pages that follow.
The search for higher after-tax yields amid historically low interest rates continued to exert a major influence on the municipal bond market over the past year, as investors increasingly turned to lower rated and longer term securities for higher levels of current income.The market’s supply-and-demand dynamics were buoyed further when political pressure to reduce government spending and borrowing led to a relatively meager supply of newly issued securities through most of the reporting period.The market also benefited from a generally recovering U.S. economy, including a declining U.S. unemployment rate and improving housing markets, which helped to alleviate fiscal pressures for many states and municipalities.
Our chief economist currently expects the U.S. economic recovery to persist at a choppy and moderate pace over the next several months, but sees the potential for stronger growth to begin in the fall. Moreover, the United States generally is expected to remain in the lead in a global march toward better economic conditions, while Europe’s recovery from recession likely will be delayed as regional policymakers continue their efforts to resolve structural issues. As always, we encourage you to discuss our observations with your financial advisor, who can help you assess their implications for your investment portfolio.
Thank you for your continued confidence and support.
Sincerely,

J. Charles Cardona
President
The Dreyfus Corporation
May 15, 2013
2
DISCUSSION OF FUND PERFORMANCE
For the period of May 1, 2012, through April 30, 2013, as provided by Daniel Rabasco and Mountaga Aw, Portfolio Managers
Fund and Market Performance Overview
For the 12-month period ended April 30, 2013, Dreyfus Municipal Bond Opportunity Fund’s Class A shares produced a total return of 5.91%, Class C shares returned 5.12% and Class Z shares returned 5.97%.1 In comparison, the Barclays Municipal Bond Index, the fund’s benchmark index, achieved a total return of 5.19% for the same period.2
Despite bouts of heightened volatility, positive supply-and-demand dynamics stemming in part from investors’ search for higher levels of tax-exempt income helped support municipal bond prices over the reporting period.The fund’s Class A and Class Z shares produced higher returns than its benchmark, mainly due to strength among lower rated and longer dated securities.
The Fund’s Investment Approach
The fund seeks to maximize current income exempt from federal income tax to the extent consistent with the preservation of capital. To pursue its goal, the fund normally invests substantially all of its assets in municipal bonds that provide income exempt from federal income tax. The fund invests at least 70% of its assets in investment-grade municipal bonds or the unrated equivalent as determined by Dreyfus. For additional yield, the fund may invest up to 30% of its assets in municipal bonds rated below investment grade or the unrated equivalent as determined by Dreyfus. The dollar-weighted average maturity of the fund’s portfolio is not restricted, but normally exceeds 10 years.
In managing the fund, we focus on identifying undervalued sectors and securities, and we minimize the use of interest-rate forecasting. We select municipal bonds using fundamental analysis to estimate the relative value of various sectors and securities, and to exploit pricing inefficiencies in the municipal bond market. In addition, we trade among the market’s various sectors — such as the pre-refunded, general obligation and revenue sectors — based on their apparent relative values. The fund generally will invest simultaneously in several of these sectors.
DISCUSSION OF FUND PERFORMANCE (continued)
Municipal Bonds Encountered Heightened Volatility
Although the reporting period began in the midst of heightened economic concerns, investor sentiment soon began to recover when U.S. employment trends improved, housing markets recovered, and the Federal Reserve Board launched a new quantitative easing program. Investor optimism faltered briefly in November 2012 due to uncertainty surrounding automatic tax hikes and spending cuts scheduled for the start of 2013, but last-minute legislation to address the increases helped alleviate these worries. Positive economic data offered further support to investor sentiment over the first four months of 2013.
Lower rated municipal bonds generally outperformed broader market averages, supported by robust demand from investors seeking higher levels of after-tax income in a low interest rate environment. While the supply of newly issued municipal bonds increased compared to the very low levels reached earlier in 2012, new issuance remained muted relative to historical norms.
From a credit quality perspective, higher tax receipts and reduced spending have enabled many states to shore up their fiscal conditions and balance their budgets. However, some states and localities continue to face challenges stemming from revenue shortfalls and underfunded pension and health care liabilities.
Revenue Bonds Drove Fund Performance
The fund benefited during the reporting period from an overweighted exposure to revenue bonds backed by hospitals, airports, industrial development projects, and U.S. tobacco master settlement bonds issued by various states.The fund’s holdings of bonds with credit ratings toward the lower end of the investment-grade range fared especially well as other investors downgraded in credit quality in their reach for yield.Tactical trades into general obligation bonds from California and Illinois, both of which rallied from depressed levels, also added to relative returns. Detracting from relative returns were lower yielding, high-quality revenue bonds backed by essential municipal services such as water and sewer facilities.
The fund’s performance also was aided by our interest rate strategies, including a modestly long average duration and an emphasis on securities with maturities in the 10- to 15-year range.Also, the fund successfully employed futures contracts that helped capture the benefits of changing yield differences between municipal bonds and U.S.Treasury securities.
4
Maintaining a Selective Approach
The domestic economy continues to grow at a modest pace but remains vulnerable to fiscal uncertainty and unexpected global developments. In addition, while credit fundamentals are improving for the states, many localities face ongoing fiscal pressures. Therefore, we have maintained our research-intensive credit selection process to help identify attractively valued opportunities among fundamentally sound issuers of municipal securities.
As of the reporting period’s end, we have maintained our overweighted exposure to revenue bonds, including those with lower investment-grade credit ratings.The fund continues to maintain a slightly long duration posture with a focus at the long end of the intermediate-term maturity range. Over the long term, the fund’s holdings of tax-exempt municipal bonds should benefit from robust demand from individuals facing recently enacted higher income tax rates at the federal level.
May 15, 2013
Bond funds are subject generally to interest rate, credit, liquidity and market risks, to varying degrees, all of which are more fully described in the fund’s prospectus. Generally, all other factors being equal, bond prices are inversely related to interest-rate changes, and rate increases can cause price declines.
The amount of public information available about municipal bonds is generally less than that for corporate equities or bonds. Special factors, such as legislative changes, and state and local economic and business developments, may adversely affect the yield and/or value of the fund’s investments in municipal bonds. Other factors include the general conditions of the municipal bond market, the size of the particular offering, the maturity of the obligation and the rating of the issue. Changes in economic, business or political conditions relating to a particular municipal project, municipality, or state in which the fund invests may have an impact on the fund’s share price.
|
| 1 Total return includes reinvestment of dividends and any capital gains paid, and does not take into consideration the |
| maximum initial sales charge in the case of Class A shares or the applicable contingent deferred sales charge imposed |
| on redemptions in the case of Class C shares. Had these charges been reflected, returns would have been lower. Class |
| Z is not subject to any initial or deferred sales charge. Past performance is no guarantee of future results. Share price, |
| yield and investment return fluctuate such that upon redemption, fund shares may be worth more or less than their |
| original cost. Income may be subject to state and local taxes, and some income may be subject to the federal alternative |
| minimum tax (AMT) for certain investors. Capital gains, if any, are taxable. |
| 2 SOURCE: LIPPER INC. — Reflects reinvestment of dividends and, where applicable, capital gain distributions. |
| The Barclays Municipal Bond Index is a widely accepted, unmanaged total return performance benchmark for the |
| long-term, investment-grade, tax-exempt bond market. Index returns do not reflect fees and expenses associated with |
| operating a mutual fund. Investors cannot invest directly in any index. |
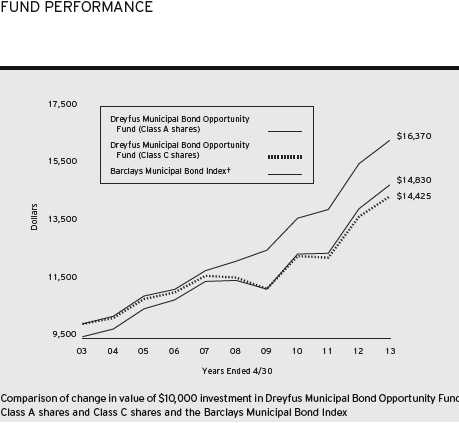
† Source: Lipper Inc.
Past performance is not predictive of future performance.
The above graph compares a $10,000 investment made in each of the Class A and Class C shares of Dreyfus Municipal Bond Opportunity Fund on 4/30/03 to a $10,000 investment made in the Barclays Municipal Bond Index (the “Index”) on that date.All dividends and capital gain distributions are reinvested.
The fund invests primarily in municipal securities and its performance shown in the line graph above takes into account the maximum initial sales charge on Class A shares and all other applicable fees and expenses for Class A and Class C shares. Performance for Class Z shares will vary from the performance of Class A and Class C shares shown above due to differences in charges and expenses.The Index, unlike the fund, is an unmanaged total return performance benchmark for the long-term, investment-grade, tax-exempt bond market, calculated by using municipal bonds selected to be representative of the municipal market overall.These factors can contribute to the Index potentially outperforming or underperforming the fund. Unlike a mutual fund, the Index is not subject to charges, fees and other expenses. Investors cannot invest directly in any index. Further information relating to fund performance, including expense reimbursements, if applicable, is contained in the Financial Highlights section of the prospectus and elsewhere in this report.
6
| | | | | | | | | |
| Average Annual Total Returns as of 4/30/13 | | | | | | | | |
| |
| | Inception | | | | | | | From | |
| | Date | 1 Year | | 5 Years | | 10 Years | | Inception | |
| Class A shares | | | | | | | | | |
| with maximum sales charge (4.5%) | 11/26/86 | 1.17 | % | 4.24 | % | 4.02 | % | — | |
| without sales charge | 11/26/86 | 5.91 | % | 5.20 | % | 4.50 | % | — | |
| Class C shares | | | | | | | | | |
| with applicable redemption charge † | 7/13/95 | 4.12 | % | 4.43 | % | 3.73 | % | — | |
| without redemption | 7/13/95 | 5.12 | % | 4.43 | % | 3.73 | % | — | |
| Class Z shares | 10/14/04 | 5.97 | % | 5.26 | % | — | | 4.48 | % |
| Barclays Municipal Bond Index | 9/30/04 | 5.19 | % | 6.09 | % | 5.05 | % | 5.12 | %†† |
Past performance is not predictive of future performance.The fund’s performance shown in the graph and table does not reflect the deduction of taxes that a shareholder would pay on fund distributions or the redemption of fund shares.
| |
| † | The maximum contingent deferred sales charge for Class C shares is 1% for shares redeemed within one year of the |
| | date of purchase. |
| †† | The Index date is based on the life of Class Z shares. For comparative purposes, the value of the Index as of |
| | 9/30/04 is used as the beginning value on 10/14/04 (the inception date for Class Z shares). |
UNDERSTANDING YOUR FUND’S EXPENSES (Unaudited)
As a mutual fund investor, you pay ongoing expenses, such as management fees and other expenses. Using the information below, you can estimate how these expenses affect your investment and compare them with the expenses of other funds.You also may pay one-time transaction expenses, including sales charges (loads) and redemption fees, which are not shown in this section and would have resulted in higher total expenses. For more information, see your fund’s prospectus or talk to your financial adviser.
Review your fund’s expenses
The table below shows the expenses you would have paid on a $1,000 investment in Dreyfus Municipal Bond Opportunity Fund from November 1, 2012 to April 30, 2013. It also shows how much a $1,000 investment would be worth at the close of the period, assuming actual returns and expenses.
Expenses and Value of a $1,000 Investment
assuming actual returns for the six months ended April 30, 2013
| | | | | | |
| | | Class A | | Class C | | Class Z |
| Expenses paid per $1,000† | $ | 4.56 | $ | 8.35 | $ | 4.31 |
| Ending value (after expenses) | $ | 1,019.70 | $ | 1,015.90 | $ | 1,019.90 |
COMPARING YOUR FUND’S EXPENSES
WITH THOSE OF OTHER FUNDS (Unaudited)
Using the SEC’s method to compare expenses
The Securities and Exchange Commission (SEC) has established guidelines to help investors assess fund expenses. Per these guidelines, the table below shows your fund’s expenses based on a $1,000 investment, assuming a hypothetical 5% annualized return. You can use this information to compare the ongoing expenses (but not transaction expenses or total cost) of investing in the fund with those of other funds.All mutual fund shareholder reports will provide this information to help you make this comparison. Please note that you cannot use this information to estimate your actual ending account balance and expenses paid during the period.
Expenses and Value of a $1,000 Investment
assuming a hypothetical 5% annualized return for the six months ended April 30, 2013
| | | | | | |
| | | Class A | | Class C | | Class Z |
| Expenses paid per $1,000† | $ | 4.56 | $ | 8.35 | $ | 4.31 |
| Ending value (after expenses) | $ | 1,020.28 | $ | 1,016.51 | $ | 1,020.53 |
|
| † Expenses are equal to the fund’s annualized expense ratio of .91% for Class A, 1.67% for Class C and .86% for |
| Class Z, multiplied by the average account value over the period, multiplied by 181/365 (to reflect the one-half |
| year period). |
8
| | | | | |
| STATEMENT OF INVESTMENTS | | | | |
| April 30, 2013 | | | | | |
| |
| |
| |
| |
| Long-Term Municipal | Coupon | Maturity | Principal | | |
| Investments—99.5% | Rate (%) | Date | Amount ($) | | Value ($) |
| Alabama—.6% | | | | | |
| Jefferson County, | | | | | |
| Limited Obligation | | | | | |
| School Warrants | 5.25 | 1/1/17 | 2,000,000 | | 2,000,680 |
| Jefferson County, | | | | | |
| Limited Obligation | | | | | |
| School Warrants | 5.00 | 1/1/24 | 1,000,000 | | 980,900 |
| Arizona—3.1% | | | | | |
| Mohave County Industrial | | | | | |
| Development Authority, | | | | | |
| Correctional Facilities | | | | | |
| Contract Revenue (Mohave | | | | | |
| Prison, LLC Expansion Project) | 8.00 | 5/1/25 | 5,000,000 | | 6,402,000 |
| Phoenix Civic Improvement | | | | | |
| Corporation, Junior Lien | | | | | |
| Water System Revenue | 5.00 | 7/1/17 | 3,405,000 | | 3,997,198 |
| Pima County Industrial Development | | | | | |
| Authority, Education Revenue | | | | | |
| (American Charter Schools | | | | | |
| Foundation Project) | 5.63 | 7/1/38 | 4,650,000 | | 4,650,465 |
| California—13.9% | | | | | |
| Anaheim Public Financing | | | | | |
| Authority, Revenue (City of | | | | | |
| Anaheim Electric System | | | | | |
| Distribution Facilities) | 5.25 | 10/1/34 | 3,185,000 | | 3,665,043 |
| California, | | | | | |
| GO (Insured; AMBAC) | 6.00 | 2/1/18 | 2,245,000 | | 2,769,095 |
| California, | | | | | |
| GO (Various Purpose) | 5.25 | 10/1/20 | 2,300,000 | | 2,864,581 |
| California, | | | | | |
| GO (Various Purpose) | 5.75 | 4/1/31 | 7,725,000 | | 9,166,022 |
| California, | | | | | |
| GO (Various Purpose) | 6.50 | 4/1/33 | 5,000,000 | | 6,261,150 |
| California, | | | | | |
| GO (Various Purpose) | 6.00 | 11/1/35 | 3,000,000 | | 3,680,070 |
| California Health Facilities | | | | | |
| Financing Authority, Revenue | | | | | |
| (Providence Health and Services) | 6.50 | 10/1/38 | 2,955,000 | | 3,580,544 |
| California Health Facilities | | | | | |
| Financing Authority, Revenue | | | | | |
| (Providence Health and | | | | | |
| Services) (Prerefunded) | 6.50 | 10/1/18 | 45,000 | a | 58,238 |
STATEMENT OF INVESTMENTS (continued)
| | | | | |
| Long-Term Municipal | Coupon | Maturity | Principal | | |
| Investments (continued) | Rate (%) | Date | Amount ($) | | Value ($) |
| California (continued) | | | | | |
| California State Public Works | | | | | |
| Board, LR (Judicial Council of | | | | | |
| California) (Various Judicial | | | | | |
| Council Projects) | 5.00 | 12/1/31 | 2,000,000 | | 2,237,280 |
| California State Public Works | | | | | |
| Board, LR (Various | | | | | |
| Capital Projects) | 5.13 | 10/1/31 | 1,000,000 | | 1,125,740 |
| California Statewide Communities | | | | | |
| Development Authority, | | | | | |
| Revenue (Sutter Health) | 5.50 | 8/15/26 | 2,670,000 | | 3,208,432 |
| Chula Vista, | | | | | |
| IDR (San Diego Gas and | | | | | |
| Electric Company) | 5.88 | 2/15/34 | 2,000,000 | | 2,409,540 |
| Los Angeles Harbor Department, | | | | | |
| Revenue | 5.25 | 8/1/25 | 5,000,000 | | 6,054,800 |
| Los Angeles Unified School | | | | | |
| District, GO | 5.00 | 7/1/18 | 7,210,000 | | 8,720,134 |
| Sacramento County, | | | | | |
| Airport System Senior Revenue | 5.25 | 7/1/26 | 5,000,000 | | 5,865,600 |
| Sacramento County, | | | | | |
| Airport System Senior Revenue | 5.50 | 7/1/29 | 1,500,000 | | 1,759,800 |
| San Bernardino Community College | | | | | |
| District, GO (Prerefunded) | 6.25 | 8/1/18 | 2,000,000 | a | 2,555,920 |
| San Diego County Regional | | | | | |
| Transportation Commission, | | | | | |
| Sales Tax Revenue | 5.00 | 4/1/20 | 1,250,000 | | 1,576,325 |
| Colorado—1.7% | | | | | |
| Colorado Housing and Finance | | | | | |
| Authority, Single Family | | | | | |
| Program Senior and Subordinate | | | | | |
| Bonds (Collateralized; FHA) | 6.60 | 8/1/32 | 1,030,000 | | 1,087,515 |
| E-470 Public Highway Authority, | | | | | |
| Senior Revenue | 5.38 | 9/1/26 | 1,000,000 | | 1,121,030 |
| Metro Wastewater | | | | | |
| Reclamation District, Sewer | | | | | |
| Improvement Revenue | 5.00 | 4/1/17 | 1,925,000 | | 2,250,594 |
| University of Colorado Regents, | | | | | |
| University Enterprise Revenue | 5.75 | 6/1/28 | 1,000,000 | | 1,230,280 |
| University of Colorado Regents, | | | | | |
| University Enterprise Revenue | 5.25 | 6/1/36 | 2,065,000 | | 2,444,361 |
10
| | | | | |
| Long-Term Municipal | Coupon | Maturity | Principal | | |
| Investments (continued) | Rate (%) | Date | Amount ($) | | Value ($) |
| Connecticut—.7% | | | | | |
| Connecticut Development Authority, | | | | | |
| Water Facilities Revenue | | | | | |
| (Aquarion Water Company of | | | | | |
| Connecticut Project) | 5.50 | 4/1/21 | 3,000,000 | | 3,546,060 |
| Florida—6.2% | | | | | |
| Broward County, | | | | | |
| Port Facilities Revenue | 5.00 | 9/1/22 | 3,285,000 | | 3,875,446 |
| Broward County Housing Finance | | | | | |
| Authority, MFHR (Pembroke | | | | | |
| Villas Project) (Insured; Assured | | | | | |
| Guaranty Municipal Corp.) | 5.55 | 1/1/23 | 865,000 | | 866,436 |
| Citizens Property Insurance | | | | | |
| Corporation, Coastal Account | | | | | |
| Senior Secured Revenue | 5.00 | 6/1/20 | 3,000,000 | | 3,621,360 |
| Citizens Property Insurance | | | | | |
| Corporation, High-Risk Account | | | | | |
| Senior Secured Revenue | 5.50 | 6/1/17 | 2,340,000 | | 2,749,102 |
| Citizens Property Insurance | | | | | |
| Corporation, Personal Lines | | | | | |
| Account/Commercial Lines | | | | | |
| Account Senior Secured Revenue | 5.00 | 6/1/22 | 3,500,000 | | 4,266,080 |
| Florida State Board of Education, | | | | | |
| Public Education Capital | | | | | |
| Outlay Bonds | 5.00 | 6/1/21 | 2,500,000 | | 3,163,275 |
| Jacksonville Electric Authority, | | | | | |
| Revenue (Saint Johns River | | | | | |
| Power Park System) | 5.00 | 10/1/22 | 1,625,000 | | 1,953,900 |
| Martin County Industrial | | | | | |
| Development Authority, IDR | | | | | |
| (Indiantown Cogeneration, | | | | | |
| L.P. Project) | 4.20 | 12/15/25 | 1,750,000 | | 1,775,235 |
| Orlando Utilities Commission, | | | | | |
| Utility System Revenue | 5.00 | 10/1/19 | 2,325,000 | | 2,868,469 |
| Palm Bay, | | | | | |
| Educational Facilities Revenue | | | | | |
| (Patriot Charter School Project) | 7.00 | 7/1/36 | 215,000 | b | 64,474 |
| Palm Bay, | | | | | |
| Utility System Improvement | | | | | |
| Revenue (Insured; National | | | | | |
| Public Finance Guarantee Corp.) | 0.00 | 10/1/20 | 1,845,000 | c | 1,393,178 |
STATEMENT OF INVESTMENTS (continued)
| | | | | |
| Long-Term Municipal | Coupon | Maturity | Principal | | |
| Investments (continued) | Rate (%) | Date | Amount ($) | | Value ($) |
| Florida (continued) | | | | | |
| Pinellas County Health Facilities | | | | | |
| Authority, Health System | | | | | |
| Revenue (BayCare Health System | | | | | |
| Issue) (Insured; National | | | | | |
| Public Finance Guarantee Corp.) | 0.26 | 11/15/23 | 2,000,000 | d | 1,882,040 |
| Port of Palm Beach District, | | | | | |
| Revenue (Insured; XLCA) | 0.00 | 9/1/23 | 1,000,000 | c | 571,320 |
| Saint Johns County Industrial | | | | | |
| Development Authority, Revenue | | | | | |
| (Presbyterian Retirement | | | | | |
| Communities Project) | 5.88 | 8/1/40 | 1,000,000 | | 1,120,640 |
| Georgia—3.8% | | | | | |
| Atlanta, | | | | | |
| Airport General Revenue | 5.00 | 1/1/27 | 3,000,000 | | 3,402,720 |
| Atlanta, | | | | | |
| Water and Wastewater Revenue | 6.00 | 11/1/26 | 3,550,000 | | 4,408,355 |
| Gwinnett County School District, | | | | | |
| GO Sales Tax Bonds | 4.00 | 10/1/16 | 2,875,000 | | 3,216,234 |
| Municipal Electric Authority of | | | | | |
| Georgia, Revenue (Project One | | | | | |
| Subordinated Bonds) | 5.00 | 1/1/20 | 6,290,000 | | 7,675,435 |
| Hawaii—.2% | | | | | |
| Hawaii Department of Budget and | | | | | |
| Finance, Special Purpose | | | | | |
| Revenue (Hawai’i Pacific | | | | | |
| Health Obligated Group) | 5.63 | 7/1/30 | 1,000,000 | | 1,123,210 |
| Illinois—6.1% | | | | | |
| Chicago, | | | | | |
| General Airport Third Lien | | | | | |
| Revenue (Chicago O’Hare | | | | | |
| International Airport) | | | | | |
| (Insured; National Public | | | | | |
| Finance Guarantee Corp.) | 5.25 | 1/1/17 | 3,500,000 | | 4,047,610 |
| Chicago Board of Education, | | | | | |
| Unlimited Tax GO | | | | | |
| (Dedicated Revenues) | 5.25 | 12/1/25 | 10,000,000 | | 11,362,800 |
| Illinois, | | | | | |
| GO | 5.00 | 4/1/22 | 3,000,000 | | 3,531,360 |
| Illinois, | | | | | |
| GO | 5.00 | 8/1/24 | 1,000,000 | | 1,146,220 |
12
| | | | |
| Long-Term Municipal | Coupon | Maturity | Principal | |
| Investments (continued) | Rate (%) | Date | Amount ($) | Value ($) |
| Illinois (continued) | | | | |
| Illinois Finance Authority, | | | | |
| Revenue (The Carle Foundation) | 5.00 | 8/15/18 | 2,500,000 | 2,931,025 |
| Railsplitter Tobacco Settlement | | | | |
| Authority, Tobacco | | | | |
| Settlement Revenue | 5.50 | 6/1/23 | 1,750,000 | 2,142,472 |
| Railsplitter Tobacco Settlement | | | | |
| Authority, Tobacco | | | | |
| Settlement Revenue | 6.00 | 6/1/28 | 3,975,000 | 4,862,220 |
| Indiana—1.0% | | | | |
| Indiana Finance Authority, | | | | |
| First Lien Wastewater Utility | | | | |
| Revenue (CWA Authority Project) | 5.25 | 10/1/25 | 1,500,000 | 1,838,850 |
| Indiana Finance Authority, | | | | |
| Midwestern Disaster Relief | | | | |
| Revenue (Ohio Valley Electric | | | | |
| Corporation Project) | 5.00 | 6/1/39 | 2,000,000 | 2,142,380 |
| Indiana Finance Authority, | | | | |
| Private Activity Bonds (Ohio | | | | |
| River Bridges East End | | | | |
| Crossing Project) | 5.00 | 1/1/19 | 1,000,000 | 1,114,240 |
| Kansas—1.1% | | | | |
| Kansas Department of | | | | |
| Transportation, Highway Revenue | 5.00 | 9/1/20 | 3,000,000 | 3,797,760 |
| Kansas Development Finance | | | | |
| Authority, Revenue (Lifespace | | | | |
| Communities, Inc.) | 5.00 | 5/15/30 | 1,500,000 | 1,600,245 |
| Kentucky—2.7% | | | | |
| Mount Sterling, | | | | |
| LR (Kentucky League of Cities | | | | |
| Funding Trust Program) | 6.10 | 3/1/18 | 5,500,000 | 6,230,620 |
| Pendleton County, | | | | |
| Multi-County LR (Kentucky | | | | |
| Association of Counties | | | | |
| Leasing Trust Program) | 6.40 | 3/1/19 | 6,000,000 | 6,947,280 |
| Louisiana—.5% | | | | |
| Louisiana Local Government | | | | |
| Environmental Facilities and | | | | |
| Community Development | | | | |
| Authority, Revenue (Westlake | | | | |
| Chemical Corporation Projects) | 6.75 | 11/1/32 | 2,000,000 | 2,289,220 |
STATEMENT OF INVESTMENTS (continued)
| | | | |
| Long-Term Municipal | Coupon | Maturity | Principal | |
| Investments (continued) | Rate (%) | Date | Amount ($) | Value ($) |
| Maine—.5% | | | | |
| Maine Health and Higher | | | | |
| Educational Facilities Authority, | | | | |
| Revenue (MaineGeneral | | | | |
| Medical Center Issue) | 7.50 | 7/1/32 | 2,000,000 | 2,568,140 |
| Maryland—2.5% | | | | |
| Maryland, | | | | |
| GO (State and Local | | | | |
| Facilities Loan) | 5.00 | 8/1/20 | 2,500,000 | 3,094,650 |
| Maryland Transportation Authority, | | | | |
| Airport Parking Revenue | | | | |
| (Baltimore/Washington | | | | |
| International Thurgood | | | | |
| Marshall Airport Projects) | 5.00 | 3/1/18 | 6,200,000 | 7,198,200 |
| Montgomery County, | | | | |
| Consolidated Public | | | | |
| Improvement GO | 5.00 | 7/1/21 | 1,500,000 | 1,845,975 |
| Massachusetts—4.0% | | | | |
| Massachusetts Department | | | | |
| of Transportation, | | | | |
| Metropolitan Highway | | | | |
| System Senior Revenue | 5.00 | 1/1/27 | 5,000,000 | 5,738,500 |
| Massachusetts Development Finance | | | | |
| Agency, Revenue (Tufts | | | | |
| Medical Center Issue) | 6.25 | 1/1/27 | 2,250,000 | 2,712,465 |
| Massachusetts School Building | | | | |
| Authority, Senior Dedicated | | | | |
| Sales Tax Revenue | 5.00 | 8/15/22 | 5,000,000 | 6,397,900 |
| Massachusetts School Building | | | | |
| Authority, Senior Dedicated | | | | |
| Sales Tax Revenue | 5.00 | 10/15/35 | 1,750,000 | 2,031,715 |
| Massachusetts Water Resources | | | | |
| Authority, General Revenue | 5.00 | 8/1/42 | 2,500,000 | 2,891,425 |
| Michigan—9.4% | | | | |
| Detroit, | | | | |
| Sewage Disposal System Senior | | | | |
| Lien Revenue (Insured; Assured | | | | |
| Guaranty Municipal Corp.) | 7.00 | 7/1/27 | 3,000,000 | 3,685,350 |
| Detroit Water and Sewerage | | | | |
| Department, Senior Lien Sewage | | | | |
| Disposal System Revenue | 5.25 | 7/1/39 | 2,500,000 | 2,732,750 |
14
| | | | | |
| Long-Term Municipal | Coupon | Maturity | Principal | | |
| Investments (continued) | Rate (%) | Date | Amount ($) | | Value ($) |
| Michigan (continued) | | | | | |
| Kent Hospital Finance Authority, | | | | | |
| Revenue (Spectrum | | | | | |
| Health System) | 5.50 | 11/15/25 | 2,500,000 | | 3,040,350 |
| Lansing Board of Water and Light, | | | | | |
| Utility System Revenue | 5.50 | 7/1/41 | 2,500,000 | | 2,962,675 |
| Michigan Finance Authority, | | | | | |
| Unemployment Obligation | | | | | |
| Assessment Revenue | 5.00 | 7/1/22 | 7,500,000 | | 8,494,275 |
| Michigan Municipal Bond Authority, | | | | | |
| State Clean Water Revolving | | | | | |
| Fund Revenue | 5.00 | 10/1/23 | 6,340,000 | | 7,449,120 |
| Michigan Strategic Fund, | | | | | |
| LOR (State of Michigan Cadillac | | | | | |
| Place Office Building Project) | 5.00 | 10/15/17 | 2,590,000 | | 2,980,572 |
| Michigan Strategic Fund, | | | | | |
| SWDR (Genesee Power | | | | | |
| Station Project) | 7.50 | 1/1/21 | 6,025,000 | | 6,024,397 |
| Romulus Economic Development | | | | | |
| Corporation, Limited Obligation EDR | | | | | |
| (Romulus HIR Limited Partnership | | | | | |
| Project) (Insured; ITT Lyndon | | | | | |
| Property Insurance Company) | 7.00 | 11/1/15 | 5,000,000 | | 5,784,400 |
| Wayne County Airport Authority, | | | | | |
| Airport Revenue (Detroit | | | | | |
| Metropolitan Wayne | | | | | |
| County Airport) | 5.00 | 12/1/18 | 2,500,000 | | 2,947,425 |
| Missouri—.6% | | | | | |
| Curators of the University of | | | | | |
| Missouri, System | | | | | |
| Facilities Revenue | 5.00 | 11/1/19 | 2,500,000 | | 3,106,950 |
| Nevada—.2% | | | | | |
| Clark County, | | | | | |
| Passenger Facility Charge | | | | | |
| Revenue (Las Vegas-McCarran | | | | | |
| International Airport) | 5.00 | 7/1/30 | 1,000,000 | | 1,128,740 |
| New Jersey—.5% | | | | | |
| New Jersey Turnpike Authority, | | | | | |
| Turnpike Revenue (Insured; | | | | | |
| National Public Finance | | | | | |
| Guarantee Corp.) | 0.39 | 1/1/30 | 2,500,000 | d | 2,250,000 |
STATEMENT OF INVESTMENTS (continued)
| | | | | |
| Long-Term Municipal | Coupon | Maturity | Principal | | |
| Investments (continued) | Rate (%) | Date | Amount ($) | | Value ($) |
| New York—12.0% | | | | | |
| Austin Trust | | | | | |
| (Port Authority of New York | | | | | |
| and New Jersey, Consolidated | | | | | |
| Bonds, 151st Series) | 6.00 | 9/15/28 | 9,690,000 | e,f | 11,419,859 |
| Long Island Power Authority, | | | | | |
| Electric System General Revenue | 6.00 | 5/1/33 | 5,000,000 | | 6,061,400 |
| Metropolitan Transportation | | | | | |
| Authority, Dedicated | | | | | |
| Tax Fund Revenue | 5.00 | 11/15/32 | 1,850,000 | | 2,161,096 |
| Metropolitan Transportation | | | | | |
| Authority, Transportation Revenue | 5.25 | 11/15/28 | 2,500,000 | | 2,914,700 |
| New York City, | | | | | |
| GO | 5.00 | 10/1/36 | 5,000,000 | | 5,745,050 |
| New York City Health and | | | | | |
| Hospital Corporation, GO | 5.00 | 2/15/18 | 5,265,000 | | 6,198,906 |
| New York City Industrial | | | | | |
| Development Agency, | | | | | |
| Senior Airport Facilities | | | | | |
| Revenue (Transportation | | | | | |
| Infrastructure Properties, LLC | | | | | |
| Obligated Group) | 5.00 | 7/1/20 | 3,000,000 | | 3,253,320 |
| New York City Municipal Water | | | | | |
| Finance Authority, Water and | | | | | |
| Sewer System Second General | | | | | |
| Resolution Revenue | 5.00 | 6/15/34 | 5,000,000 | | 5,760,900 |
| New York City Transitional Finance | | | | | |
| Authority, Future Tax Secured | | | | | |
| Subordinate Revenue | 5.00 | 2/1/24 | 2,000,000 | | 2,433,520 |
| New York Liberty Development | | | | | |
| Corporation, Liberty Revenue | | | | | |
| (4 World Trade Center Project) | 5.00 | 11/15/31 | 1,000,000 | | 1,146,050 |
| New York State Dormitory | | | | | |
| Authority, Revenue (Orange | | | | | |
| Regional Medical Center | | | | | |
| Obligated Group) | 6.25 | 12/1/37 | 5,000,000 | | 5,560,650 |
| New York State Dormitory | | | | | |
| Authority, State Personal | | | | | |
| Income Tax Revenue | | | | | |
| (General Purpose) | 5.00 | 8/15/18 | 5,000,000 | | 6,056,050 |
16
| | | | | |
| Long-Term Municipal | Coupon | Maturity | Principal | | |
| Investments (continued) | Rate (%) | Date | Amount ($) | | Value ($) |
| North Carolina—.9% | | | | | |
| Wake County Industrial Facilities | | | | | |
| and Pollution Control Financing | | | | | |
| Authority, PCR (Carolina Power | | | | | |
| and Light Company Project) | | | | | |
| (Insured; AMBAC) | 0.39 | 10/1/22 | 4,725,000 | d | 4,441,500 |
| Ohio—.6% | | | | | |
| Cleveland-Cuyahoga County | | | | | |
| Port Authority, Senior Special | | | | | |
| Assessment/Tax Increment | | | | | |
| Revenue (University Heights— | | | | | |
| Public Parking Garage Project) | 7.35 | 12/1/31 | 3,000,000 | | 3,028,770 |
| Oklahoma—1.0% | | | | | |
| Oklahoma Municipal Power | | | | | |
| Authority, Power Supply | | | | | |
| System Revenue | 6.00 | 1/1/38 | 4,000,000 | | 4,664,120 |
| Pennsylvania—3.5% | | | | | |
| Allegheny County Port Authority, | | | | | |
| Special Transportation Revenue | 5.25 | 3/1/23 | 2,715,000 | | 3,250,072 |
| Pennsylvania Economic Development | | | | | |
| Financing Authority, Unemployment | | | | | |
| Compensation Revenue | 5.00 | 7/1/22 | 3,000,000 | | 3,401,760 |
| Pennsylvania Higher Educational | | | | | |
| Facilities Authority, Revenue | | | | | |
| (University of Pennsylvania | | | | | |
| Health System) | 6.00 | 8/15/26 | 5,000,000 | | 5,994,900 |
| Philadelphia School District, | | | | | |
| GO | 5.25 | 9/1/23 | 4,000,000 | | 4,708,040 |
| South Carolina—1.2% | | | | | |
| South Carolina Public Service | | | | | |
| Authority, Revenue Obligations | 5.50 | 1/1/38 | 5,000,000 | | 5,766,700 |
| Tennessee—1.2% | | | | | |
| Johnson City Health and | | | | | |
| Educational Facilities Board, HR | | | | | |
| (Mountain States Health Alliance) | 6.00 | 7/1/38 | 2,435,000 | | 2,852,408 |
| Metropolitan Government of | | | | | |
| Nashville and Davidson County, | | | | | |
| Subordinate Lien Water and | | | | | |
| Sewer Revenue | 5.00 | 7/1/17 | 2,500,000 | | 2,915,175 |
STATEMENT OF INVESTMENTS (continued)
| | | | |
| Long-Term Municipal | Coupon | Maturity | Principal | |
| Investments (continued) | Rate (%) | Date | Amount ($) | Value ($) |
| Texas—8.5% | | | | |
| Dallas and Fort Worth, | | | | |
| Joint Improvement Revenue | | | | |
| (Dallas/Fort Worth | | | | |
| International Airport) | 5.00 | 11/1/42 | 5,000,000 | 5,325,850 |
| Dallas Independent School | | | | |
| District, Unlimited Tax Bonds | | | | |
| (Permament School Fund | | | | |
| Guarantee Program) | 5.00 | 2/15/23 | 5,000,000 | 6,184,900 |
| Houston, | | | | |
| Airport System Subordinate | | | | |
| Lien Revenue | 5.00 | 7/1/17 | 2,500,000 | 2,919,650 |
| Love Field Airport Modernization | | | | |
| Corporation, Special | | | | |
| Facilities Revenue (Southwest | | | | |
| Airlines Company—Love Field | | | | |
| Modernization Program Project) | 5.00 | 11/1/22 | 2,000,000 | 2,259,740 |
| Midlothian Independent School | | | | |
| District, Unlimited Tax School | | | | |
| Building Bonds (Permanent | | | | |
| School Fund Guarantee Program) | 5.00 | 2/15/40 | 1,500,000 | 1,739,865 |
| North Texas Tollway Authority, | | | | |
| First Tier System Revenue | | | | |
| (Insured; Assured Guaranty | | | | |
| Municipal Corp.) | 5.75 | 1/1/40 | 5,665,000 | 6,532,198 |
| North Texas Tollway Authority, | | | | |
| Second Tier System Revenue | 5.75 | 1/1/38 | 5,510,000 | 6,205,031 |
| San Antonio, | | | | |
| Water System Revenue | 5.00 | 5/15/36 | 3,945,000 | 4,513,751 |
| University of Texas System | | | | |
| Board of Regents, Financing | | | | |
| System Revenue | 5.00 | 8/15/17 | 5,000,000 | 5,914,450 |
| Virginia—1.5% | | | | |
| Henrico County, | | | | |
| Public Improvement GO | 5.00 | 7/15/17 | 2,845,000 | 3,369,703 |
| Virginia Housing Development | | | | |
| Authority, Commonwealth | | | | |
| Mortgage Revenue | 6.25 | 7/1/31 | 3,305,000 | 3,784,126 |
18
| | | | |
| Long-Term Municipal | Coupon | Maturity | Principal | |
| Investments (continued) | Rate (%) | Date | Amount ($) | Value ($) |
| Washington—3.6% | | | | |
| Chelan County Public Utility | | | | |
| District Number 1, | | | | |
| Consolidated System Revenue | 5.00 | 7/1/17 | 2,180,000 | 2,502,967 |
| Energy Northwest, | | | | |
| Electric Revenue (Project 3) | 5.00 | 7/1/18 | 5,000,000 | 6,031,850 |
| Seattle, | | | | |
| Water System Revenue | 5.00 | 9/1/22 | 2,735,000 | 3,496,096 |
| Washington, | | | | |
| GO (Various Purpose) | 5.00 | 7/1/16 | 2,500,000 | 2,852,025 |
| Washington, | | | | |
| Motor Vehicle Fuel Tax GO | | | | |
| (State Road 520 Corridor | | | | |
| Program—Toll Revenue) | 5.00 | 6/1/33 | 2,255,000 | 2,626,782 |
| West Virginia—1.2% | | | | |
| West Virginia University Board | | | | |
| of Governors, University | | | | |
| Improvement Revenue (West | | | | |
| Virginia University Projects) | 5.00 | 10/1/36 | 5,000,000 | 5,809,700 |
| Wisconsin—1.3% | | | | |
| Wisconsin Health and Educational | | | | |
| Facilities Authority, Revenue | | | | |
| (Aurora Health Care, Inc.) | 5.50 | 4/15/29 | 2,200,000 | 2,514,116 |
| Wisconsin Health and Educational | | | | |
| Facilities Authority, Revenue | | | | |
| (Aurora Health Care, Inc.) | 6.40 | 4/15/33 | 4,000,000 | 4,010,200 |
| U.S. Related—3.7% | | | | |
| Puerto Rico Aqueduct | | | | |
| and Sewer Authority, | | | | |
| Senior Lien Revenue | 5.00 | 7/1/21 | 2,000,000 | 2,003,200 |
| Puerto Rico Aqueduct | | | | |
| and Sewer Authority, | | | | |
| Senior Lien Revenue | 5.25 | 7/1/29 | 3,820,000 | 3,805,293 |
| Puerto Rico Commonwealth, | | | | |
| Public Improvement GO | 6.00 | 7/1/28 | 1,000,000 | 1,056,360 |
| Puerto Rico Electric Power | | | | |
| Authority, Power Revenue | 5.25 | 7/1/24 | 1,500,000 | 1,554,240 |
STATEMENT OF INVESTMENTS (continued)
| | | | | |
| Long-Term Municipal | Coupon | Maturity | Principal | | |
| Investments (continued) | Rate (%) | Date | Amount ($) | | Value ($) |
| U.S. Related (continued) | | | | | |
| Puerto Rico Electric Power | | | | | |
| Authority, Power Revenue | | | | | |
| (Insured; National Public | | | | | |
| Finance Guarantee Corp.) | 5.00 | 7/1/19 | 2,515,000 | | 2,697,413 |
| Puerto Rico Sales Tax Financing | | | | | |
| Corporation, Sales Tax Revenue | | | | | |
| (First Subordinate Series) | 6.00 | 8/1/39 | 1,500,000 | | 1,653,885 |
| Puerto Rico Sales Tax Financing | | | | | |
| Corporation, Sales Tax Revenue | | | | | |
| (First Subordinate Series) | 6.00 | 8/1/42 | 5,000,000 | | 5,479,950 |
| Total Long-Term Municipal Investments | | | | |
| (cost $442,187,066) | | | | | 486,894,869 |
| |
| Short-Term Municipal | | | | | |
| Investment—.4% | | | | | |
| California; | | | | | |
| California Infrastructure and | | | | | |
| Economic Development Bank, | | | | | |
| Revenue, Refunding (Los | | | | | |
| Angeles County Museum of | | | | | |
| Natural History Foundation) | | | | | |
| (LOC; Wells Fargo Bank) | | | | | |
| (cost $2,100,000) | 0.17 | 5/1/13 | 2,100,000 | g | 2,100,000 |
| |
| Total Investments (cost $444,287,066) | | | 99.9 | % | 488,994,869 |
| |
| Cash and Receivables (Net) | | | .1 | % | 671,765 |
| |
| Net Assets | | | 100.0 | % | 489,666,634 |
|
| a These securities are prerefunded; the date shown represents the prerefunded date. Bonds which are prerefunded are |
| collateralized by U.S. Government securities which are held in escrow and are used to pay principal and interest on |
| the municipal issue and to retire the bonds in full at the earliest refunding date. |
| b Non-income producing—security in default. |
| c Security issued with a zero coupon. Income is recognized through the accretion of discount. |
| d Variable rate security—interest rate subject to periodic change. |
| e Collateral for floating rate borrowings. |
| f Security exempt from registration pursuant to Rule 144A under the Securities Act of 1933.This security may be |
| resold in transactions exempt from registration, normally to qualified institutional buyers.At April 30, 2013, this |
| security was valued at $11,419,859 or 2.3% of net assets. |
| g Variable rate demand note—rate shown is the interest rate in effect at April 30, 2013. Maturity date represents the |
| next demand date, or the ultimate maturity date if earlier. |
20
| | | |
| Summary of Abbreviations | | |
| |
| ABAG | Association of Bay Area | ACA | American Capital Access |
| | Governments | | |
| AGC | ACE Guaranty Corporation | AGIC | Asset Guaranty Insurance Company |
| AMBAC | American Municipal Bond | ARRN | Adjustable Rate |
| | Assurance Corporation | | Receipt Notes |
| BAN | Bond Anticipation Notes | BPA | Bond Purchase Agreement |
| CIFG | CDC Ixis Financial Guaranty | COP | Certificate of Participation |
| CP | Commercial Paper | DRIVERS | Derivative Inverse |
| | | | Tax-Exempt Receipts |
| EDR | Economic Development | EIR | Environmental Improvement |
| | Revenue | | Revenue |
| FGIC | Financial Guaranty | FHA | Federal Housing |
| | Insurance Company | | Administration |
| FHLB | Federal Home | FHLMC | Federal Home Loan Mortgage |
| | Loan Bank | | Corporation |
| FNMA | Federal National | GAN | Grant Anticipation Notes |
| | Mortgage Association | | |
| GIC | Guaranteed Investment | GNMA | Government National Mortgage |
| | Contract | | Association |
| GO | General Obligation | HR | Hospital Revenue |
| IDB | Industrial Development Board | IDC | Industrial Development Corporation |
| IDR | Industrial Development | LIFERS | Long Inverse Floating |
| | Revenue | | Exempt Receipts |
| LOC | Letter of Credit | LOR | Limited Obligation Revenue |
| LR | Lease Revenue | MERLOTS | Municipal Exempt Receipts |
| | | | Liquidity Option Tender |
| MFHR | Multi-Family Housing Revenue | MFMR | Multi-Family Mortgage Revenue |
| PCR | Pollution Control Revenue | PILOT | Payment in Lieu of Taxes |
| P-FLOATS | Puttable Floating Option | PUTTERS | Puttable Tax-Exempt Receipts |
| | Tax-Exempt Receipts | | |
| RAC | Revenue Anticipation Certificates | RAN | Revenue Anticipation Notes |
| RAW | Revenue Anticipation Warrants | ROCS | Reset Options Certificates |
| RRR | Resources Recovery Revenue | SAAN | State Aid Anticipation Notes |
| SBPA | Standby Bond Purchase Agreement | SFHR | Single Family Housing Revenue |
| SFMR | Single Family Mortgage Revenue | SONYMA | State of New York Mortgage Agency |
| SPEARS | Short Puttable Exempt | SWDR | Solid Waste Disposal Revenue |
| | Adjustable Receipts | | |
| TAN | Tax Anticipation Notes | TAW | Tax Anticipation Warrants |
| TRAN | Tax and Revenue Anticipation Notes | XLCA | XL Capital Assurance |
STATEMENT OF INVESTMENTS (continued)
| | | | | |
| Summary of Combined Ratings (Unaudited) | |
| |
| Fitch | or | Moody’s | or | Standard & Poor’s | Value (%)† |
| AAA | | Aaa | | AAA | 14.8 |
| AA | | Aa | | AA | 31.7 |
| A | | A | | A | 36.8 |
| BBB | | Baa | | BBB | 8.5 |
| BB | | Ba | | BB | 2.6 |
| B | | B | | B | 2.1 |
| F1 | | MIG1/P1 | | SP1/A1 | .4 |
| Not Ratedh | | Not Ratedh | | Not Ratedh | 3.1 |
| | | | | | 100.0 |
|
| † Based on total investments. |
| h Securities which, while not rated by Fitch, Moody’s and Standard & Poor’s, have been determined by the Manager to |
| be of comparable quality to those rated securities in which the fund may invest. |
See notes to financial statements.
22
|
| STATEMENT OF ASSETS AND LIABILITIES |
| April 30, 2013 |
| | | | |
| | | Cost | Value | |
| Assets ($): | | | | |
| Investments in securities—See Statement of Investments | 444,287,066 | 488,994,869 | |
| Interest receivable | | | 6,409,676 | |
| Receivable for shares of Beneficial Interest subscribed | | 128,000 | |
| Prepaid expenses | | | 22,125 | |
| | | | 495,554,670 | |
| Liabilities ($): | | | | |
| Due to The Dreyfus Corporation and affiliates—Note 3(c) | | 372,670 | |
| Cash overdraft due to Custodian | | | 301,338 | |
| Payable for floating rate notes issued—Note 4 | | | 4,845,000 | |
| Payable for shares of Beneficial Interest redeemed | | | 266,411 | |
| Interest and expense payable related to | | | | |
| floating rate notes issued—Note 4 | | | 4,537 | |
| Accrued expenses | | | 98,080 | |
| | | | 5,888,036 | |
| Net Assets ($) | | | 489,666,634 | |
| Composition of Net Assets ($): | | | | |
| Paid-in capital | | | 474,404,129 | |
| Accumulated net realized gain (loss) on investments | | (29,445,298 | ) |
| Accumulated net unrealized appreciation | | | | |
| (depreciation) on investments | | | 44,707,803 | |
| Net Assets ($) | | | 489,666,634 | |
| |
| |
| Net Asset Value Per Share | | | | |
| | Class A | Class C | Class Z | |
| Net Assets ($) | 226,734,648 | 12,432,835 | 250,499,151 | |
| Shares Outstanding | 17,227,753 | 942,407 | 19,032,630 | |
| Net Asset Value Per Share ($) | 13.16 | 13.19 | 13.16 | |
| |
| See notes to financial statements. | | | | |
|
| STATEMENT OF OPERATIONS |
| Year Ended April 30, 2013 |
| | |
| Investment Income ($): | | |
| Interest Income | 19,910,925 | |
| Expenses: | | |
| Management fee—Note 3(a) | 2,760,281 | |
| Shareholder servicing costs—Note 3(c) | 1,387,762 | |
| Professional fees | 97,119 | |
| Distribution fees—Note 3(b) | 96,939 | |
| Registration fees | 54,802 | |
| Custodian fees—Note 3(c) | 43,981 | |
| Interest and expense related to floating rate notes issued—Note 4 | 39,390 | |
| Prospectus and shareholders’ reports | 34,229 | |
| Trustees’ fees and expenses—Note 3(d) | 24,351 | |
| Loan commitment fees—Note 2 | 5,264 | |
| Miscellaneous | 49,378 | |
| Total Expenses | 4,593,496 | |
| Less—reduction in fees due to earnings credits—Note 3(c) | (866 | ) |
| Net Expenses | 4,592,630 | |
| Investment Income—Net | 15,318,295 | |
| Realized and Unrealized Gain (Loss) on Investments—Note 4 ($): | | |
| Net realized gain (loss) on investments | 7,084,681 | |
| Net realized gain (loss) on financial futures | 367,517 | |
| Net Realized Gain (Loss) | 7,452,198 | |
| Net unrealized appreciation (depreciation) on investments | 6,152,143 | |
| Net Realized and Unrealized Gain (Loss) on Investments | 13,604,341 | |
| Net Increase in Net Assets Resulting from Operations | 28,922,636 | |
| |
| See notes to financial statements. | | |
24
STATEMENT OF CHANGES IN NET ASSETS
| | | | |
| | | | Year Ended April 30, | |
| | 2013 | | 2012 | a |
| Operations ($): | | | | |
| Investment income—net | 15,318,295 | | 19,733,002 | |
| Net realized gain (loss) on investments | 7,452,198 | | 12,015,713 | |
| Net unrealized appreciation | | | | |
| (depreciation) on investments | 6,152,143 | | 26,484,652 | |
| Net Increase (Decrease) in Net Assets | | | | |
| Resulting from Operations | 28,922,636 | | 58,233,367 | |
| Dividends to Shareholders from ($): | | | | |
| Investment income—net: | | | | |
| Class A Shares | (7,095,312 | ) | (9,305,877 | ) |
| Class B Shares | — | | (20,036 | ) |
| Class C Shares | (291,817 | ) | (432,566 | ) |
| Class Z Shares | (7,742,261 | ) | (9,823,657 | ) |
| Net realized gain on investments: | | | | |
| Class A Shares | (122,983 | ) | — | |
| Class C Shares | (6,497 | ) | — | |
| Class Z Shares | (131,012 | ) | — | |
| Total Dividends | (15,389,882 | ) | (19,582,136 | ) |
| Beneficial Interest Transactions ($): | | | | |
| Net proceeds from shares sold: | | | | |
| Class A Shares | 10,356,998 | | 12,674,888 | |
| Class B Shares | — | | 162,750 | |
| Class C Shares | 1,499,783 | | 1,504,474 | |
| Class Z Shares | 6,743,255 | | 6,921,528 | |
| Dividends reinvested: | | | | |
| Class A Shares | 5,240,463 | | 6,600,723 | |
| Class B Shares | — | | 14,891 | |
| Class C Shares | 205,567 | | 281,279 | |
| Class Z Shares | 5,912,657 | | 7,297,662 | |
| Cost of shares redeemed: | | | | |
| Class A Shares | (35,080,909 | ) | (29,495,384 | ) |
| Class B Shares | — | | (1,232,053 | ) |
| Class C Shares | (3,586,154 | ) | (1,627,193 | ) |
| Class Z Shares | (21,053,819 | ) | (20,371,121 | ) |
| Increase (Decrease) in Net Assets from | | | | |
| Beneficial Interest Transactions | (29,762,159 | ) | (17,267,556 | ) |
| Total Increase (Decrease) in Net Assets | (16,229,405 | ) | 21,383,675 | |
| Net Assets ($): | | | | |
| Beginning of Period | 505,896,039 | | 484,512,364 | |
| End of Period | 489,666,634 | | 505,896,039 | |
STATEMENT OF CHANGES IN NET ASSETS (continued)
| | | | |
| | | | Year Ended April 30, | |
| | 2013 | | 2012 | a |
| Capital Share Transactions: | | | | |
| Class Ab | | | | |
| Shares sold | 793,799 | | 1,019,158 | |
| Shares issued for dividends reinvested | 401,021 | | 531,701 | |
| Shares redeemed | (2,686,533 | ) | (2,385,727 | ) |
| Net Increase (Decrease) in Shares Outstanding | (1,491,713 | ) | (834,868 | ) |
| Class Bb | | | | |
| Shares sold | — | | 13,064 | |
| Shares issued for dividends reinvested | — | | 1,211 | |
| Shares redeemed | — | | (98,670 | ) |
| Net Increase (Decrease) in Shares Outstanding | — | | (84,395 | ) |
| Class C | | | | |
| Shares sold | 114,217 | | 121,443 | |
| Shares issued for dividends reinvested | 15,697 | | 22,595 | |
| Shares redeemed | (273,978 | ) | (131,119 | ) |
| Net Increase (Decrease) in Shares Outstanding | (144,064 | ) | 12,919 | |
| Class Z | | | | |
| Shares sold | 516,619 | | 554,644 | |
| Shares issued for dividends reinvested | 452,371 | | 587,938 | |
| Shares redeemed | (1,608,981 | ) | (1,649,629 | ) |
| Net Increase (Decrease) in Shares Outstanding | (639,991 | ) | (507,047 | ) |
|
| a Effective as of the close of business on March 13, 2012, the fund no longer offers Class B shares. |
| b During the period ended April 30, 2012, 29,619 Class B shares representing $369,815 were automatically |
| converted to 29,642 Class A shares. |
See notes to financial statements.
26
FINANCIAL HIGHLIGHTS
The following tables describe the performance for each share class for the fiscal periods indicated.All information (except portfolio turnover rate) reflects financial results for a single fund share.Total return shows how much your investment in the fund would have increased (or decreased) during each period, assuming you had reinvested all dividends and distributions.These figures have been derived from the fund’s financial statements.
| | | | | | | | | | |
| | | | Year Ended April 30, | | | |
| Class A Shares | 2013 | | 2012 | | 2011 | | 2010 | | 2009 | |
| Per Share Data ($): | | | | | | | | | | |
| Net asset value, beginning of period | 12.81 | | 11.85 | | 12.35 | | 11.65 | | 12.56 | |
| Investment Operations: | | | | | | | | | | |
| Investment income—neta | .40 | | .49 | | .53 | | .55 | | .57 | |
| Net realized and unrealized | | | | | | | | | | |
| gain (loss) on investments | .35 | | .96 | | (.50 | ) | .70 | | (.91 | ) |
| Total from Investment Operations | .75 | | 1.45 | | .03 | | 1.25 | | (.34 | ) |
| Distributions: | | | | | | | | | | |
| Dividends from investment income—net | (.39 | ) | (.49 | ) | (.53 | ) | (.55 | ) | (.57 | ) |
| Dividends from net realized | | | | | | | | | | |
| gain on investments | (.01 | ) | — | | — | | — | | — | |
| Total Distributions | (.40 | ) | (.49 | ) | (.53 | ) | (.55 | ) | (.57 | ) |
| Net asset value, end of period | 13.16 | | 12.81 | | 11.85 | | 12.35 | | 11.65 | |
| Total Return (%)b | 5.91 | | 12.45 | | .20 | | 10.91 | | (2.64 | ) |
| Ratios/Supplemental Data (%): | | | | | | | | | | |
| Ratio of total expenses | | | | | | | | | | |
| to average net assets | .92 | | .94 | | .94 | | .93 | | 1.00 | |
| Ratio of net expenses | | | | | | | | | | |
| to average net assets | .92 | | .89 | | .94 | | .93 | | .99 | |
| Ratio of interest and expense related | | | | | | | | | | |
| to floating rate notes issued | | | | | | | | | | |
| to average net assets | .01 | | .01 | | .01 | | .01 | | .07 | |
| Ratio of net investment income | | | | | | | | | | |
| to average net assets | 3.05 | | 3.98 | | 4.38 | | 4.57 | | 4.85 | |
| Portfolio Turnover Rate | 16.55 | | 40.38 | | 21.95 | | 22.61 | | 56.67 | |
| Net Assets, end of period ($ x 1,000) | 226,735 | | 239,859 | | 231,671 | | 268,406 | | 269,846 | |
| |
| a | Based on average shares outstanding at each month end. |
| b | Exclusive of sales charge. |
See notes to financial statements.
FINANCIAL HIGHLIGHTS (continued)
| | | | | | | | | | |
| | | | Year Ended April 30, | | | |
| Class C Shares | 2013 | | 2012 | | 2011 | | 2010 | | 2009 | |
| Per Share Data ($): | | | | | | | | | | |
| Net asset value, beginning of period | 12.84 | | 11.88 | | 12.37 | | 11.66 | | 12.58 | |
| Investment Operations: | | | | | | | | | | |
| Investment income—neta | .30 | | .40 | | .44 | | .46 | | .49 | |
| Net realized and unrealized | | | | | | | | | | |
| gain (loss) on investments | .35 | | .96 | | (.49 | ) | .71 | | (.93 | ) |
| Total from Investment Operations | .65 | | 1.36 | | (.05 | ) | 1.17 | | (.44 | ) |
| Distributions: | | | | | | | | | | |
| Dividends from investment income—net | (.29 | ) | (.40 | ) | (.44 | ) | (.46 | ) | (.48 | ) |
| Dividends from net realized | | | | | | | | | | |
| gain on investments | (.01 | ) | — | | — | | — | | — | |
| Total Distributions | (.30 | ) | (.40 | ) | (.44 | ) | (.46 | ) | (.48 | ) |
| Net asset value, end of period | 13.19 | | 12.84 | | 11.88 | | 12.37 | | 11.66 | |
| Total Return (%)b | 5.12 | | 11.59 | | (.46 | ) | 10.15 | | (3.42 | ) |
| Ratios/Supplemental Data (%): | | | | | | | | | | |
| Ratio of total expenses | | | | | | | | | | |
| to average net assets | 1.68 | | 1.69 | | 1.69 | | 1.69 | | 1.76 | |
| Ratio of net expenses | | | | | | | | | | |
| to average net assets | 1.68 | | 1.63 | | 1.69 | | 1.69 | | 1.75 | |
| Ratio of interest and expense related | | | | | | | | | | |
| to floating rate notes issued | | | | | | | | | | |
| to average net assets | .01 | | .01 | | .01 | | .01 | | .07 | |
| Ratio of net investment income | | | | | | | | | | |
| to average net assets | 2.29 | | 3.23 | | 3.61 | | 3.80 | | 4.12 | |
| Portfolio Turnover Rate | 16.55 | | 40.38 | | 21.95 | | 22.61 | | 56.67 | |
| Net Assets, end of period ($ x 1,000) | 12,433 | | 13,955 | | 12,750 | | 15,476 | | 14,702 | |
| |
| a | Based on average shares outstanding at each month end. |
| b | Exclusive of sales charge. |
See notes to financial statements.
28
| | | | | | | | | | |
| | | | Year Ended April 30, | | | |
| Class Z Shares | 2013 | | 2012 | | 2011 | | 2010 | | 2009 | |
| Per Share Data ($): | | | | | | | | | | |
| Net asset value, beginning of period | 12.81 | | 11.85 | | 12.34 | | 11.65 | | 12.56 | |
| Investment Operations: | | | | | | | | | | |
| Investment income—neta | .40 | | .50 | | .54 | | .56 | | .58 | |
| Net realized and unrealized | | | | | | | | | | |
| gain (loss) on investments | .36 | | .96 | | (.50 | ) | .69 | | (.91 | ) |
| Total from Investment Operations | .76 | | 1.46 | | .04 | | 1.25 | | (.33 | ) |
| Distributions: | | | | | | | | | | |
| Dividends from investment income—net | (.40 | ) | (.50 | ) | (.53 | ) | (.56 | ) | (.58 | ) |
| Dividends from net realized | | | | | | | | | | |
| gain on investments | (.01 | ) | — | | — | | — | | — | |
| Total Distributions | (.41 | ) | (.50 | ) | (.53 | ) | (.56 | ) | (.58 | ) |
| Net asset value, end of period | 13.16 | | 12.81 | | 11.85 | | 12.34 | | 11.65 | |
| Total Return (%) | 5.97 | | 12.51 | | .34 | | 10.87 | | (2.59 | ) |
| Ratios/Supplemental Data (%): | | | | | | | | | | |
| Ratio of total expenses | | | | | | | | | | |
| to average net assets | .87 | | .89 | | .88 | | .88 | | .94 | |
| Ratio of net expenses | | | | | | | | | | |
| to average net assets | .87 | | .84 | | .88 | | .88 | | .94 | |
| Ratio of interest and expense related | | | | | | | | | | |
| to floating rate notes issued | | | | | | | | | | |
| to average net assets | .01 | | .01 | | .01 | | .01 | | .07 | |
| Ratio of net investment income | | | | | | | | | | |
| to average net assets | 3.10 | | 4.03 | | 4.44 | | 4.62 | | 4.90 | |
| Portfolio Turnover Rate | 16.55 | | 40.38 | | 21.95 | | 22.61 | | 56.67 | |
| Net Assets, end of period ($ x 1,000) | 250,499 | | 252,082 | | 239,092 | | 263,072 | | 247,849 | |
| a Based on average shares outstanding at each month end. | | | | | | | | | |
| See notes to financial statements. | | | | | | | | | | |
NOTES TO FINANCIAL STATEMENTS
NOTE 1—Significant Accounting Policies:
Dreyfus Municipal Bond Opportunity Fund (the “fund”) is registered under the Investment Company Act of 1940, as amended (the “Act”), as a diversified open-end management investment company. The fund’s investment objective is to maximize current income exempt from federal income tax to the extent consistent with the preservation of capital.The Dreyfus Corporation (the “Manager” or “Dreyfus”), a wholly-owned subsidiary of The Bank of New York Mellon Corporation (“BNY Mellon”), serves as the fund’s investment adviser.
MBSC Securities Corporation (the “Distributor”), a wholly-owned subsidiary of the Manager, is the distributor of the fund’s shares.The fund is authorized to issue an unlimited number of $.001 par value shares of Beneficial Interest in each of the following classes of shares: Class A, Class C and Class Z. Class A shares generally are subject to a sales charge imposed at the time of purchase. Class C shares are subject to a contingent deferred sales charge (“CDSC”) imposed on Class C shares redeemed within one year of purchase. Class Z shares are sold at net asset value per share generally only to shareholders of the fund who received Class Z shares in exchange for their shares of a Dreyfus-managed fund as a result of the reorganization of such Dreyfus-managed fund, and who continue to maintain accounts with the fund at the time of purchase. Class Z shares generally are not available for new accounts. Other differences between the classes include the services offered to and the expenses borne by each class, the allocation of certain transfer agency costs and certain voting rights. Income, expenses (other than expenses attributable to a specific class), and realized and unrealized gains or losses on investments are allocated to each class of shares based on its relative net assets.
The Financial Accounting Standards Board (“FASB”) Accounting Standards Codification is the exclusive reference of authoritative U.S. generally accepted accounting principles (“GAAP”) recognized by the FASB to be applied by nongovernmental entities. Rules and interpretive releases of the Securities and Exchange Commission (“SEC”) under
30
authority of federal laws are also sources of authoritative GAAP for SEC registrants. The fund’s financial statements are prepared in accordance with GAAP, which may require the use of management estimates and assumptions.Actual results could differ from those estimates.
The fund enters into contracts that contain a variety of indemnifications. The fund’s maximum exposure under these arrangements is unknown.The fund does not anticipate recognizing any loss related to these arrangements.
(a) Portfolio valuation: The fair value of a financial instrument is the amount that would be received to sell an asset or paid to transfer a liability in an orderly transaction between market participants at the measurement date (i.e., the exit price). GAAP establishes a fair value hierarchy that prioritizes the inputs of valuation techniques used to measure fair value.This hierarchy gives the highest priority to unadjusted quoted prices in active markets for identical assets or liabilities (Level 1 measurements) and the lowest priority to unobservable inputs (Level 3 measurements).
Additionally, GAAP provides guidance on determining whether the volume and activity in a market has decreased significantly and whether such a decrease in activity results in transactions that are not orderly. GAAP requires enhanced disclosures around valuation inputs and techniques used during annual and interim periods.
Various inputs are used in determining the value of the fund’s investments relating to fair value measurements.These inputs are summarized in the three broad levels listed below:
Level 1—unadjusted quoted prices in active markets for identical investments.
Level 2—other significant observable inputs (including quoted prices for similar investments, interest rates, prepayment speeds, credit risk, etc.).
Level 3—significant unobservable inputs (including the fund’s own assumptions in determining the fair value of investments).
NOTES TO FINANCIAL STATEMENTS (continued)
The inputs or methodology used for valuing securities are not necessarily an indication of the risk associated with investing in those securities.
Changes in valuation techniques may result in transfers in or out of an assigned level within the disclosure hierarchy. Valuation techniques used to value the fund’s investments are as follows:
Investments in securities are valued each business day by an independent pricing service (the “Service”) approved by the fund’s Board ofTrustees (the “Board”). Investments for which quoted bid prices are readily available and are representative of the bid side of the market in the judgment of the Service are valued at the mean between the quoted bid prices (as obtained by the Service from dealers in such securities) and asked prices (as calculated by the Service based upon its evaluation of the market for such securities). Other investments (which constitute a majority of the portfolio securities) are carried at fair value as determined by the Service, based on methods which include consideration of the following: yields or prices of municipal securities of comparable quality, coupon, maturity and type; indications as to values from dealers; and general market conditions.All of the preceding securities are categorized within Level 2 of the fair value hierarchy. Financial futures on municipal securities are valued at the last sales price on the securities exchange on which such securities are primarily traded or at the last sales price on the national securities market on each business day. These securities are generally categorized within Level 1 of the fair value hierarchy.
The Service’s procedures are reviewed by Dreyfus under the general supervision of the Board.
When market quotations or official closing prices are not readily available, or are determined not to reflect accurately fair value, such as when the value of a security has been significantly affected by events after the close of the exchange or market on which the security is principally traded, but before the fund calculates its net asset value, the fund may value these investments at fair value as determined in accordance with the procedures approved by the Board. Certain factors may be considered when fair valuing investments such as: fundamental analytical data, the nature and duration of restrictions on disposition, an evaluation of
32
the forces that influence the market in which the securities are purchased and sold, and public trading in similar securities of the issuer or comparable issuers.These securities are either categorized as Level 2 or 3 of the fair value hierarchy depending on the relevant inputs used.
For restricted securities where observable inputs are limited, assumptions about market activity and risk are used and are categorized within Level 3 of the fair value hierarchy.
The following is a summary of the inputs used as of April 30, 2013 in valuing the fund’s investments:
| | | | | | |
| | | Level 2—Other | | Level 3— | | |
| | Level 1— | Significant | | Significant | | |
| | Unadjusted | Observable | | Unobservable | | |
| | Quoted Prices | Inputs | | Inputs | Total | |
| Assets ($) | | | | | | |
| Investments in Securities: | | | | | |
| Municipal Bonds | — | 488,930,395 | | 64,474 | 488,994,869 | |
| Liabilities ($) | | | | | | |
| Floating Rate Notes† | — | (4,845,000 | ) | — | (4,845,000 | ) |
| |
| † | Certain of the fund’s liabilities are held at carrying amount, which approximates fair value for |
| | financial reporting purposes. |
At April 30, 2013, there were no transfers between Level 1 and Level 2 of the fair value hierarchy.
The following is a reconciliation of Level 3 assets for which significant unobservable inputs were used to determine fair value:
| |
| | Municipal Bonds ($) |
| Balance as of 4/30/2012 | 58,048 |
| Realized gain (loss) | — |
| Change in unrealized appreciation (depreciation) | 6,426 |
| Purchases | — |
| Sales | — |
| Transfers into Level 3 | — |
| Transfers out of Level 3 | — |
| Balance as of 4/30/2013 | 64,474 |
| The amount of total gains (losses) for the period | |
| included in earnings attributable to the change in | |
| unrealized gains (losses) relating to investments | |
| still held at 4/30/2013 | 6,426 |
NOTES TO FINANCIAL STATEMENTS (continued)
(b) Securities transactions and investment income: Securities transactions are recorded on a trade date basis. Realized gains and losses from securities transactions are recorded on the identified cost basis. Interest income, adjusted for accretion of discount and amortization of premium on investments, is earned from settlement date and recognized on the accrual basis. Securities purchased or sold on a when issued or delayed delivery basis may be settled a month or more after the trade date.
(c) Dividends to shareholders: It is the policy of the fund to declare dividends daily from investment income-net. Such dividends are paid monthly. Dividends from net realized capital gains, if any, are normally declared and paid annually, but the fund may make distributions on a more frequent basis to comply with the distribution requirements of the Internal Revenue Code of 1986, as amended (the “Code”).To the extent that net realized capital gains can be offset by capital loss carryovers, it is the policy of the fund not to distribute such gains. Income and capital gain distributions are determined in accordance with income tax regulations, which may differ from GAAP.
(d) Federal income taxes: It is the policy of the fund to continue to qualify as a regulated investment company, which can distribute tax-exempt dividends, by complying with the applicable provisions of the Code, and to make distributions of income and net realized capital gain sufficient to relieve it from substantially all federal income and excise taxes.
As of and during the period ended April 30, 2013, the fund did not have any liabilities for any uncertain tax positions.The fund recognizes interest and penalties, if any, related to uncertain tax positions as income tax expense in the Statement of Operations. During the period, the fund did not incur any interest or penalties.
Each tax year in the four-year period ended April 30, 2013 remains subject to examination by the Internal Revenue Service and state taxing authorities.
34
At April 30, 2013, the components of accumulated earnings on a tax basis were as follows: undistributed tax-exempt income $474,028, undistributed ordinary income $128,013, accumulated capital losses $29,346,026 and unrealized appreciation $44,480,518.
Under the Regulated Investment Company Modernization Act of 2010 (the “2010 Act”), the fund is permitted to carry forward capital losses incurred in taxable years beginning after December 22, 2010 (“post-enactment losses”) for an unlimited period. Furthermore, post-enactment capital loss carryovers retain their character as either short-term or long-term capital losses rather than short-term as they were under previous statute. The 2010 Act requires post-enactment losses to be utilized before the utilization of losses incurred in taxable years prior to the effective date of the 2010 Act (“pre-enactment losses”).As a result of this ordering rule, pre-enactment losses may be more likely to expire unused.
The accumulated capital loss carryover is available for federal income tax purposes to be applied against future net realized capital gains, if any, realized subsequent to April 30, 2013. If not applied, $5,368,748 of the carryover expires in fiscal year 2017, $20,082,904 expires in fiscal year 2018 and $3,894,374 expires in fiscal year 2019.
The tax character of distributions paid to shareholders during the fiscal periods ended April 30, 2013 and April 30, 2012 were as follows: tax-exempt income $15,129,390 and $19,582,136 and ordinary income $260,492 and $0, respectively.
During the period ended April 30, 2013, as a result of permanent book to tax differences, primarily due to the tax treatment for amortization adjustments, the fund decreased accumulated undistributed investment income-net by $188,905, increased accumulated net realized gain (loss) on investments by $158,814 and increased paid-in capital by $30,091.
NOTES TO FINANCIAL STATEMENTS (continued)
(e) New Accounting Pronouncement: In January 2013, FASB issued Accounting Standards Update No. 2013-01 (“ASU 2013-01”), “Clarifying the Scope of Disclosures about Offsetting Assets and Liabilities”, replaced Accounting Standards Update No. 2011-11 (“ASU 2011-11”), “Disclosures about Offsetting Assets and Liabilities”. ASU 2013-01 is effective for fiscal years beginning on or after January 1, 2013, and interim periods within those annual periods. ASU 2011-11 was intended to enhance disclosure requirements on the offsetting of financial assets and liabilities. ASU 2013-01 limits the scope of the new balance sheet offsetting disclosures to derivatives, repurchase agreements, and securities lending transactions to the extent that they are (1) offset in the financial statements or (2) subject to an enforceable master netting arrangement or similar agreement. Management is currently evaluating the application of ASU 2013-01 and its impact on the fund’s financial statements.
NOTE 2—Bank Lines of Credit:
The fund participates with other Dreyfus-managed funds in a $210 million unsecured credit facility led by Citibank, N.A. and a $300 million unsecured credit facility provided by The Bank of New York Mellon, a subsidiary of BNY Mellon and an affiliate of Dreyfus (each, a “Facility”), each to be utilized primarily for temporary or emergency purposes, including the financing of redemptions. Prior to October 10, 2012, the unsecured credit facility with Citibank, N.A. was $225 million. In connection therewith, the fund has agreed to pay its pro rata portion of commitment fees for each Facility. Interest is charged to the fund based on rates determined pursuant to the terms of the respective Facility at the time of borrowing. During the period ended April 30, 2013, the fund did not borrow under the Facilities.
NOTE 3—Management Fee and Other Transactions With Affiliates:
(a) Pursuant to a management agreement with the Manager, the management fee is computed at the annual rate of .55% of the value of the fund’s average daily net assets and is payable monthly.
36
During the period ended April 30, 2013, the Distributor retained $9,896 from commissions earned on sales of the fund’s Class A shares and $2,192 from CDSCs on redemptions of the fund’s Class C shares.
(b) Under the Distribution Plan adopted pursuant to Rule 12b-1 under the Act, Class C shares pay the Distributor for distributing its shares at an annual rate of .75% of the value of its average daily net assets. During the period ended April 30, 2013, Class C shares were charged $96,939, pursuant to the Distribution Plan.
(c) Under the Shareholder Services Plan, Class A and Class C shares pay the Distributor at an annual rate of .25% of the value of the average daily net assets of Class A and Class C shares and Class Z shares pay the Distributor at an annual rate of .20% of the value of the average daily net assets of Class Z shares, for the provision of certain services. The services provided may include personal services relating to shareholder accounts, such as answering shareholder inquiries regarding the fund and providing reports and other information, and services related to the maintenance of shareholder accounts. The Distributor may make payments to Service Agents (securities dealers, financial institutions or other industry professionals) with respect to these services.The Distributor determines the amounts to be paid to Service Agents. During the period ended April 30, 2013, Class A, Class C and Class Z shares were charged $589,608, $32,313 and $506,202, respectively, pursuant to the Shareholder Services Plan.
The fund has arrangements with the transfer agent and the custodian whereby the fund may receive earnings credits when positive cash balances are maintained, which are used to offset transfer agency and custody fees. For financial reporting purposes, the fund includes net earnings credits as an expense offset in the Statement of Operations.
The fund compensates Dreyfus Transfer, Inc., a wholly-owned subsidiary of the Manager, under a transfer agency agreement for providing transfer agency services for the fund and, since May 29, 2012, cash
NOTES TO FINANCIAL STATEMENTS (continued)
management services related to fund subscriptions and redemptions. During the period ended April 30, 2013, the fund was charged $175,927 for transfer agency services and $5,277 for cash management services. Cash management fees were partially offset by earnings credits of $771.These fees are included in Shareholder servicing costs in the Statement of Operations.
The fund compensatesThe Bank of NewYork Mellon under a custody agreement for providing custodial services for the fund. During the period ended April 30, 2013, the fund was charged $43,981 pursuant to the custody agreement.
Prior to May 29, 2012, the fund compensated The Bank of NewYork Mellon under a cash management agreement for performing cash management services related to fund subscriptions and redemptions. Subsequent to May 29, 2012,The Bank of NewYork Mellon has continued to provide shareholder redemption draft processing services. During the period ended April 30, 2013, the fund was charged $4,461 pursuant to the cash management agreement, which is included in Shareholder servicing costs in the Statement of Operations.These fees were partially offset by earnings credits of $95.
During the period ended April 30, 2013, the fund was charged $8,414 for services performed by the Chief Compliance Officer and his staff.
The components of “Due to The Dreyfus Corporation and affiliates” in the Statement of Assets and Liabilities consist of: management fees $221,019, Distribution Plan fees $7,514, Shareholder Services Plan fees $90,186, custodian fees $11,167, Chief Compliance Officer fees $3,054 and transfer agency fees $39,730.
(d) Each Board member also serves as a Board member of other funds within the Dreyfus complex. Annual retainer fees and attendance fees are allocated to each fund based on net assets.
38
NOTE 4—Securities Transactions:
The aggregate amount of purchases and sales of investment securities, excluding short-term securities and financial futures, during the period ended April 30, 2013, amounted to $81,751,165 and $105,209,232, respectively.
Inverse Floater Securities: The fund participates in secondary inverse floater structures in which fixed-rate, tax-exempt municipal bonds are transferred to a trust.The trust subsequently issues two or more variable rate securities that are collateralized by the cash flows of the fixed-rate, tax-exempt municipal bonds. One or more of these variable rate securities pays interest based on a short-term floating rate set by a remarketing agent at predetermined intervals.A residual interest tax-exempt security is also created by the trust, which is transferred to the fund, and is paid interest based on the remaining cash flow of the trust, after payment of interest on the other securities and various expenses of the trust.
The fund accounts for the transfer of bonds to the trust as secured borrowings, with the securities transferred remaining in the fund’s investments, and the related floating rate certificate securities reflected as fund liabilities in the Statement of Assets and Liabilities.
The average amount of borrowings outstanding under the inverse floater structure during the period ended April 30, 2013, was approximately $4,845,000, with a related weighted average annualized interest rate of .81%.
Derivatives: A derivative is a financial instrument whose performance is derived from the performance of another asset. Each type of derivative instrument that was held by the fund during the period ended April 30, 2013 is discussed below.
NOTES TO FINANCIAL STATEMENTS (continued)
Financial Futures: In the normal course of pursuing its investment objective, the fund is exposed to market risk, including interest rate risk as a result of changes in value of underlying financial instruments.The fund invests in financial futures in order to manage its exposure to or protect against changes in the market.A financial futures contract represents a commitment for the future purchase or a sale of an asset at a specified date. Upon entering into such contracts, these investments require initial margin deposits with a counterparty, which consist of cash or cash equivalents.The amount of these deposits is determined by the exchange or Board of Trade on which the contract is traded and is subject to change.Accordingly, variation margin payments are received or made to reflect daily unrealized gains or losses which are recorded in the Statement of Operations.When the contracts are closed, the fund recognizes a realized gain or loss which is reflected in the Statement of Operations.There is minimal counterparty credit risk to the fund with financial futures since they are exchange traded, and the exchange’s clearinghouse guarantees the financial futures against default. At April 30, 2013, there were no financial futures outstanding.
At April 30, 2013, the cost of investments for federal income tax purposes was $439,669,351; accordingly, accumulated net unrealized appreciation on investments was $44,480,518, consisting of $44,711,913 gross unrealized appreciation and $231,395 gross unrealized depreciation.
NOTE 5—Other:
The sales charge may be reduced or waived for certain purchases of Class A shares. Effective April 1, 2013, pursuant to new/modified front-end sales charge waivers, Class A shares of the fund may be purchased at net asset value without payment of a sales charge by (a) investors who participate in a self-directed investment brokerage account program offered by financial intermediaries that have entered
40
into an agreement with the fund’s Distributor (financial intermediaries offering self-directed investment brokerage accounts may or may not charge their customers a transaction fee) and (b) investors who purchase Class A shares directly through the fund’s Distributor, and either (i) have, or whose spouse or minor children have, beneficially owned shares and continuously maintained an open account with the Distributor in a Dreyfus-managed fund since on or before February 28, 2006, or (ii) such purchase is for a self-directed investment account that may or may not be subject to a transaction fee.
|
| REPORT OF INDEPENDENT REGISTERED |
| PUBLIC ACCOUNTING FIRM |
Shareholders and Board of Trustees Dreyfus Municipal Bond Opportunity Fund
We have audited the accompanying statement of assets and liabilities of Dreyfus Municipal Bond Opportunity Fund, including the statement of investments, as of April 30, 2013, and the related statement of operations for the year then ended, the statement of changes in net assets for each of the two years in the period then ended, and the financial highlights for each of the five years in the period then ended. These financial statements and financial highlights are the responsibility of the Fund’s management. Our responsibility is to express an opinion on these financial statements and financial highlights based on our audits.
We conducted our audits in accordance with the standards of the Public Company Accounting Oversight Board (United States). Those standards require that we plan and perform the audit to obtain reasonable assurance about whether the financial statements and financial highlights are free of material misstatement. We were not engaged to perform an audit of the Fund’s internal control over financial reporting. Our audits included consideration of internal control over financial reporting as a basis for designing audit procedures that are appropriate in the circumstances, but not for the purpose of expressing an opinion on the effectiveness of the Fund’s internal control over financial reporting. Accordingly, we express no such opinion. An audit also includes examining, on a test basis, evidence supporting the amounts and disclosures in the financial statements and financial highlights, assessing the accounting principles used and significant estimates made by management, and evaluating the overall financial statement presentation. Our procedures included confirmation of securities owned as of April 30, 2013 by correspondence with the custodian and others.We believe that our audits provide a reasonable basis for our opinion.
In our opinion, the financial statements and financial highlights referred to above present fairly, in all material respects, the financial position of Dreyfus Municipal Bond Opportunity Fund at April 30, 2013, the results of its operations for the year then ended, the changes in its net assets for each of the two years in the period then ended, and the financial highlights for each of the five years in the period then ended, in conformity with U.S. generally accepted accounting principles.

New York, New York
June 25, 2013
42
IMPORTANT TAX INFORMATION (Unaudited)
In accordance with federal tax law, the fund hereby reports all the dividends paid from investment income-net during the fiscal year ended April 30, 2013 as “exempt-interest dividends” (not generally subject to regular federal income tax). Where required by federal tax law rules, shareholders will receive notification of their portion of the Fund’s taxable ordinary dividends (if any), capital gains distributions (if any) and tax-exempt dividends paid for the 2013 calendar year on Form 1099-DIV which will be mailed in early 2014. Also, the fund hereby reports $.0068 per share as a short-term capital gain distribution paid on December 13, 2012.
BOARD MEMBERS INFORMATION (Unaudited)
|
| Joseph S. DiMartino (69) |
| Chairman of the Board (1995) |
| Principal Occupation During Past 5Years: |
| • Corporate Director and Trustee |
| Other Public Company Board Memberships During Past 5Years: |
| • CBIZ (formerly, Century Business Services, Inc.), a provider of outsourcing functions for small |
| and medium size companies, Director (1997-present) |
| • Sunair Services Corporation, a provider of certain outdoor-related services to homes and |
| businesses, Director (2005-2009) |
| • The Newark Group, a provider of a national market of paper recovery facilities, paperboard |
| mills and paperboard converting plants, Director (2000-2010) |
| No. of Portfolios for which Board Member Serves: 139 |
| ——————— |
| Clifford L. Alexander, Jr. (79) |
| Board Member (1994) |
| Principal Occupation During Past 5Years: |
| • President of Alexander & Associates, Inc., a management consulting firm ( January 1981-present) |
| No. of Portfolios for which Board Member Serves: 39 |
| ——————— |
| Francine J. Bovich (61) |
| Board Member (2012)† |
| Principal Occupation During Past 5Years: |
| • Trustee,The Bradley Trusts, private trust funds (2011-present) |
| • Managing Director, Morgan Stanley Investment Management (1993-2010) |
| No. of Portfolios for which Board Member Serves: 38 |
| ——————— |
| Peggy C. Davis (70) |
| Board Member (1990) |
| Principal Occupation During Past 5Years: |
| • Shad Professor of Law, New York University School of Law (1983-present) |
| No. of Portfolios for which Board Member Serves: 56 |
44
|
| Diane Dunst (73) |
| Board Member (2007) |
| Principal Occupation During Past 5Years: |
| • President of Huntting House Antiques |
| No. of Portfolios for which Board Member Serves: 14 |
| ——————— |
| Nathan Leventhal (70) |
| Board Member (1989) |
| Principal Occupation During Past 5Years: |
| • Chairman of the Avery-Fisher Artist Program (November 1997-present) |
| • Commissioner, NYC Planning Commission (March 2007-November 2011) |
| Other Public Company Board Memberships During Past 5Years: |
| • Movado Group, Inc., Director (2003-present) |
| No. of Portfolios for which Board Member Serves: 37 |
| ——————— |
| Robin A. Melvin (49) |
| Board Member (2012)† |
| Principal Occupation During Past 5Years: |
| • Director, Boisi Family Foundation, a private family foundation that supports youth-serving orga- |
| nizations that promote the self sufficiency of youth from disadvantaged circumstances (1995-2012) |
| • Board Member, Illinois Mentoring Partnership, non-profit organization dedicated to increasing |
| the quantity and quality of mentoring service in Illinois (April 2013-present) |
| No. of Portfolios for which Board Member Serves: 90 |
| ——————— |
† Board Member of the fund as of November 7, 2012.
Once elected all Board Members serve for an indefinite term, but achieve Emeritus status upon reaching age 80.The address of the Board Members and Officers is c/o The Dreyfus Corporation, 200 Park Avenue, NewYork, NewYork 10166.Additional information about the Board Members is available in the fund’s Statement of Additional Information which can be obtained from Dreyfus free of charge by calling this toll free number: 1-800-DREYFUS.
David W. Burke, Emeritus Board Member
Ernest Kafka, Emeritus Board Member
Jay I. Meltzer, Emeritus Board Member
Daniel Rose, Emeritus Board Member
Sander Vanocur, Emeritus Board Member
OFFICERS OF THE FUND (Unaudited)
BRADLEY J. SKAPYAK, President since January 2010.
Chief Operating Officer and a director of the Manager since June 2009; from April 2003 to June 2009, Mr. Skapyak was the head of the Investment Accounting and Support Department of the Manager. He is an officer of 68 investment companies (comprised of 139 portfolios) managed by the Manager. He is 54 years old and has been an employee of the Manager since February 1988.
JOHN PAK, Chief Legal Officer since March 2013.
Chief Legal Officer of the Manager and Associate General Counsel and Managing Director of BNY Mellon since August 2012; from March 2005 to July 2012, Managing Director of Deutsche Bank, Deputy Global Head of Deutsche Asset Management Legal and Regional Head of Deutsche Asset Management Americas Legal. He is an officer of 69 investment companies (comprised of 165 portfolios) managed by the Manager. He is 44 years old and has been an employee of the Manager since August 2012.
JANETTE E. FARRAGHER, Vice President and Secretary since December 2011.
Assistant General Counsel of BNY Mellon, and an officer of 69 investment companies (comprised of 165 portfolios) managed by the Manager. She is 50 years old and has been an employee of the Manager since February 1984.
KIESHA ASTWOOD, Vice President and Assistant Secretary since January 2010.
Counsel of BNY Mellon, and an officer of 69 investment companies (comprised of 165 portfolios) managed by the Manager. She is 40 years old and has been an employee of the Manager since July 1995.
JAMES BITETTO, Vice President and Assistant Secretary since August 2005.
Senior Counsel of BNY Mellon and Secretary of the Manager, and an officer of 69 investment companies (comprised of 165 portfolios) managed by the Manager. He is 46 years old and has been an employee of the Manager since December 1996.
JONI LACKS CHARATAN, Vice President and Assistant Secretary since August 2005.
Senior Counsel of BNY Mellon, and an officer of 69 investment companies (comprised of 165 portfolios) managed by the Manager. She is 57 years old and has been an employee of the Manager since October 1988.
JOSEPH M. CHIOFFI, Vice President and Assistant Secretary since August 2005.
Senior Counsel of BNY Mellon, and an officer of 69 investment companies (comprised of 165 portfolios) managed by the Manager. He is 51 years old and has been an employee of the Manager since June 2000.
JOHN B. HAMMALIAN, Vice President and Assistant Secretary since August 2005.
Senior Managing Counsel of BNY Mellon, and an officer of 69 investment companies (comprised of 165 portfolios) managed by the Manager. He is 49 years old and has been an employee of the Manager since February 1991.
ROBERT R. MULLERY, Vice President and Assistant Secretary since August 2005.
Managing Counsel of BNY Mellon, and an officer of 69 investment companies (comprised of 165 portfolios) managed by the Manager. He is 61 years old and has been an employee of the Manager since May 1986.
46
JEFF PRUSNOFSKY, Vice President and Assistant Secretary since August 2005.
Senior Managing Counsel of BNY Mellon, and an officer of 69 investment companies (comprised of 165 portfolios) managed by the Manager. He is 47 years old and has been an employee of the Manager since October 1990.
JAMES WINDELS, Treasurer since November 2001.
Director – Mutual Fund Accounting of the Manager, and an officer of 69 investment companies (comprised of 165 portfolios) managed by the Manager. He is 54 years old and has been an employee of the Manager since April 1985.
RICHARD CASSARO, Assistant Treasurer since January 2008.
Senior Accounting Manager – Money Market and Municipal Bond Funds of the Manager, and an officer of 69 investment companies (comprised of 165 portfolios) managed by the Manager. He is 54 years old and has been an employee of the Manager since September 1982.
GAVIN C. REILLY, Assistant Treasurer since December 2005.
Tax Manager of the Investment Accounting and Support Department of the Manager, and an officer of 69 investment companies (comprised of 165 portfolios) managed by the Manager. He is 44 years old and has been an employee of the Manager since April 1991.
ROBERT S. ROBOL, Assistant Treasurer since August 2005.
Senior Accounting Manager – Fixed Income Funds of the Manager, and an officer of 69 investment companies (comprised of 165 portfolios) managed by the Manager. He is 49 years old and has been an employee of the Manager since October 1988.
ROBERT SALVIOLO, Assistant Treasurer since July 2007.
Senior Accounting Manager – Equity Funds of the Manager, and an officer of 69 investment companies (comprised of 165 portfolios) managed by the Manager. He is 46 years old and has been an employee of the Manager since June 1989.
ROBERT SVAGNA, Assistant Treasurer since August 2005.
Senior Accounting Manager – Equity Funds of the Manager, and an officer of 69 investment companies (comprised of 165 portfolios) managed by the Manager. He is 46 years old and has been an employee of the Manager since November 1990.
JOSEPH W. CONNOLLY, Chief Compliance Officer since October 2004.
Chief Compliance Officer of the Manager and The Dreyfus Family of Funds (69 investment companies, comprised of 165 portfolios). He is 55 years old and has served in various capacities with the Manager since 1980, including manager of the firm’s Fund Accounting Department from 1997 through October 2001.
MATTHEW D. CONNOLLY, Anti-Money Laundering Compliance Officer since April 2012.
Anti-Money Laundering Compliance Officer of the Distributor since October 2011; from March 2010 to September 2011, Global Head, KYC Reviews and Director, UBS Investment Bank; until March 2010,AML Compliance Officer and Senior Vice President, Citi Global Wealth Management. He is an officer of 64 investment companies (comprised of 160 portfolios) managed by the Manager. He is 40 years old and has been an employee of the Distributor since October 2011.
For More Information
Telephone Call your financial representative or 1-800-DREYFUS
Mail The Dreyfus Family of Funds, 144 Glenn Curtiss Boulevard, Uniondale, NY 11556-0144
The fund files its complete schedule of portfolio holdings with the Securities and Exchange Commission (“SEC”) for the first and third quarters of each fiscal year on Form N-Q. The fund's Forms N-Q are available on the SEC’s website at http://www.sec.gov and may be reviewed and copied at the SEC’s Public Reference Room in Washington, DC. Information on the operation of the Public Reference Room may be obtained by calling 1-800-SEC-0330.
Information regarding how the fund voted proxies relating to portfolio securities for the most recent 12-month period ended June 30 is available on the SEC’s website at http://www.sec.gov and without charge, upon request, by calling 1-800-DREYFUS.

Item 2. Code of Ethics.
The Registrant has adopted a code of ethics that applies to the Registrant's principal executive officer, principal financial officer, principal accounting officer or controller, or persons performing similar functions. There have been no amendments to, or waivers in connection with, the Code of Ethics during the period covered by this Report.
Item 3. Audit Committee Financial Expert.
The Registrant's Board has determined that Joseph S. DiMartino, a member of the Audit Committee of the Board, is an audit committee financial expert as defined by the Securities and Exchange Commission (the "SEC"). Mr. DiMartino is "independent" as defined by the SEC for purposes of audit committee financial expert determinations.
Item 4. Principal Accountant Fees and Services.
(a) Audit Fees. The aggregate fees billed for each of the last two fiscal years (the "Reporting Periods") for professional services rendered by the Registrant's principal accountant (the "Auditor") for the audit of the Registrant's annual financial statements or services that are normally provided by the Auditor in connection with the statutory and regulatory filings or engagements for the Reporting Periods, were $ 31,401 in 2012 and $32,149 in 2013.
(b) Audit-Related Fees. The aggregate fees billed in the Reporting Periods for assurance and related services by the Auditor that are reasonably related to the performance of the audit of the Registrant's financial statements and are not reported under paragraph (a) of this Item 4 were $12,000 in 2012 and $6,000 in 2013. These services consisted of one or more of the following: (i) agreed upon procedures related to compliance with Internal Revenue Code section 817(h); (ii) security counts required by Rule 17f-2 under the Investment Company Act of 1940, as amended; (iii) advisory services as to the accounting or disclosure treatment of Registrant transactions or events; and (iv) advisory services to the accounting or disclosure treatment of the actual or potential impact to the Registrant of final or proposed rules, standards or interpretations by the Securities and Exchange Commission, the Financial Accounting Standards Boards or other regulatory or standard-setting bodies.
The aggregate fees billed in the Reporting Periods for non-audit assurance and related services by the Auditor to the Registrant's investment adviser (not including any sub-investment adviser whose role is primarily portfolio management and is subcontracted with or overseen by another investment adviser), and any entity controlling, controlled by or under common control with the investment adviser that provides ongoing services to the Registrant ("Service Affiliates"), that were reasonably related to the performance of the annual audit of the Service Affiliate, which required pre-approval by the Audit Committee were $0 in 2012 and $0 in 2013.
(c) Tax Fees. The aggregate fees billed in the Reporting Periods for professional services rendered by the Auditor for tax compliance, tax advice, and tax planning ("Tax Services") were $2,933 in 2012 and $3,293 in 2013. These services consisted of: (i) review or preparation of U.S. federal, state, local and excise tax returns; (ii) U.S. federal, state and local tax planning, advice and assistance regarding statutory, regulatory or administrative developments; and (iii) tax advice regarding tax qualification matters and/or treatment of various financial instruments held or proposed to be acquired or held. The aggregate fees billed in the Reporting Periods for Tax Services by the Auditor to Service Affiliates, which required pre-approval by the Audit Committee were $0 in 2012 and $0 in 2013.
(d) All Other Fees. The aggregate fees billed in the Reporting Periods for products and services provided by the Auditor, other than the services reported in paragraphs (a) through (c) of this Item, were $900 in 2012 and $0 in 2013. These services consisted of a review of the Registrant's anti-money laundering program.
The aggregate fees billed in the Reporting Periods for Non-Audit Services by the Auditor to Service Affiliates, other than the services reported in paragraphs (b) through (c) of this Item, which required pre-approval by the Audit Committee, were $0 in 2012 and $200,000 in 2013.
(e)(1) Audit Committee Pre-Approval Policies and Procedures. The Registrant's Audit Committee has established policies and procedures (the "Policy") for pre-approval (within specified fee limits) of the Auditor's engagements for non-audit services to the Registrant and Service Affiliates without specific case-by-case consideration. The pre-approved services in the Policy can include pre-approved audit services, pre-approved audit-related services, pre-approved tax services and pre-approved all other services. Pre-approval considerations include whether the proposed services are compatible with maintaining the Auditor's independence. Pre-approvals pursuant to the Policy are considered annually.
(e)(2) Note: None of the services described in paragraphs (b) through (d) of this Item 4 were approved by the Audit Committee pursuant to paragraph (c)(7)(i)(C) of Rule 2-01 of Regulation S-X.
(f) None of the hours expended on the principal accountant's engagement to audit the registrant's financial statements for the most recent fiscal year were attributed to work performed by persons other than the principal account's full-time, permanent employees.
Non-Audit Fees. The aggregate non-audit fees billed by the Auditor for services rendered to the Registrant, and rendered to Service Affiliates, for the Reporting Periods were $35,337,885 in 2012 and $46,010,490 in 2013.
Auditor Independence. The Registrant's Audit Committee has considered whether the provision of non-audit services that were rendered to Service Affiliates, which were not pre-approved (not requiring pre-approval), is compatible with maintaining the Auditor's independence.
Item 5. Audit Committee of Listed Registrants.
Not applicable. [CLOSED-END FUNDS ONLY]
Item 6. Investments.
(a) Not applicable.
Item 7. Disclosure of Proxy Voting Policies and Procedures for Closed-End Management Investment Companies.
Not applicable. [CLOSED-END FUNDS ONLY]
Item 8. Portfolio Managers of Closed-End Management Investment Companies.
Not applicable. [CLOSED-END FUNDS ONLY, beginning with reports for periods ended on and after December 31, 2005]
Item 9. Purchases of Equity Securities by Closed-End Management Investment Companies and Affiliated Purchasers.
Not applicable. [CLOSED-END FUNDS ONLY]
Item 10. Submission of Matters to a Vote of Security Holders.
There have been no material changes to the procedures applicable to Item 10.
Item 11. Controls and Procedures.
(a) The Registrant's principal executive and principal financial officers have concluded, based on their evaluation of the Registrant's disclosure controls and procedures as of a date within 90 days of the filing date of this report, that the Registrant's disclosure controls and procedures are reasonably designed to ensure that information required to be disclosed by the Registrant on Form N-CSR is recorded, processed, summarized and reported within the required time periods and that information required to be disclosed by the Registrant in the reports that it files or submits on Form N-CSR is accumulated and communicated to the Registrant's management, including its principal executive and principal financial officers, as appropriate to allow timely decisions regarding required disclosure.
(b) There were no changes to the Registrant's internal control over financial reporting that occurred during the second fiscal quarter of the period covered by this report that have materially affected, or are reasonably likely to materially affect, the Registrant's internal control over financial reporting.
Item 12. Exhibits.
(a)(1) Code of ethics referred to in Item 2.
(a)(2) Certifications of principal executive and principal financial officers as required by Rule 30a-2(a) under the Investment Company Act of 1940.
(a)(3) Not applicable.
(b) Certification of principal executive and principal financial officers as required by Rule 30a-2(b) under the Investment Company Act of 1940.
SIGNATURES
Pursuant to the requirements of the Securities Exchange Act of 1934 and the Investment Company Act of 1940, the Registrant has duly caused this Report to be signed on its behalf by the undersigned, thereunto duly authorized.
Dreyfus Municipal Bond Opportunity Fund
By: /s/ Bradley J. Skapyak |
Bradley J. Skapyak, President |
Date: | June 17, 2013 |
|
Pursuant to the requirements of the Securities Exchange Act of 1934 and the Investment Company Act of 1940, this Report has been signed below by the following persons on behalf of the Registrant and in the capacities and on the dates indicated. |
|
By: /s/ Bradley J. Skapyak |
Bradley J. Skapyak, President |
Date: | June 17, 2013 |
|
By: /s/ James Windels |
James Windels, Treasurer |
Date: | June 17, 2013 |
|
EXHIBIT INDEX
(a)(1) Code of ethics referred to in Item 2.
(a)(2) Certifications of principal executive and principal financial officers as required by Rule 30a-2(a) under the Investment Company Act of 1940. (EX-99.CERT)
(b) Certification of principal executive and principal financial officers as required by Rule 30a-2(b) under the Investment Company Act of 1940. (EX-99.906CERT)