UNITED STATES
|
SECURITIES AND EXCHANGE COMMISSION
|
Washington, D.C. 20549
|
FORM N-CSR
|
| CERTIFIED SHAREHOLDER REPORT OF |
REGISTERED MANAGEMENT INVESTMENT COMPANIES
|
| Investment Company Act file number 811-4777 |
|
| MFS SERIES TRUST I |
|
(Exact name of registrant as specified in charter)
|
| 500 Boylston Street, Boston, Massachusetts 02116 |
|
(Address of principal executive offices) (Zip code)
|
| Susan S. Newton |
| Massachusetts Financial Services Company |
| 500 Boylston Street |
| Boston, Massachusetts 02116 |
|
(Name and address of agents for service)
|
| Registrant’s telephone number, including area code: (617) 954-5000 |
|
Date of fiscal year end: August 31 |
|
Date of reporting period: February 28, 2006
|
ITEM 1. REPORTS TO STOCKHOLDERS.
NOT FDIC INSURED MAY LOSE VALUE NO BANK OR CREDIT UNION GUARANTEE NOT A DEPOSIT
NOT INSURED BY ANY FEDERAL GOVERNMENT AGENCY OR NCUA/NCUSIF |
|
MFS® Cash Reserve Fund
The fund seeks to provide as high a level of current income as is considered consistent with the preservation of capital and liquidity.
This report is prepared for the general information of shareholders. It is authorized for distribution to prospective investors only when preceded or accompanied by a current prospectus.
| TABLE OF CONTENTS | | |
|
| LETTER FROM THE CEO | 1 |
|
| PORTFOLIO COMPOSITION | 2 |
|
| PERFORMANCE SUMMARY | 3 |
|
| EXPENSE TABLE | 6 |
|
| PORTFOLIO OF INVESTMENTS | 8 |
|
| FINANCIAL STATEMENTS | 10 |
|
| NOTES TO FINANCIAL STATEMENTS | 23 |
|
| BOARD REVIEW OF INVESTMENT | |
| ADVISORY AGREEMENT | 31 |
|
| PROXY VOTING POLICIES AND | |
| INFORMATION | 31 |
|
| QUARTERLY PORTFOLIO DISCLOSURE | 31 |
|
| CONTACT INFORMATION | BACK COVER |
LETTER FROM THE CEO

Dear Shareholders,
It has been said that change is the only constant in life. As investors have seen, that theme is still accurate today as we recently have experienced shifting economic cycles because of natural disasters and political instability around the globe. Markets worldwide have fluctuated in the past year as devastating hurricanes had a dramatic effect on the international economy, particularly on oil prices. We witnessed political unrest in the Middle East, highlighted by instability in Iraq, and in Africa, the usually stable Nigeria also experienced violence. As a result, energy prices have bounced up and down, with crude oil prices at one point topping a record $70 per barrel.
Such cycles are not uncommon and in fact have almost become the norm in our everyday lives. What does all of this mean to you as an investor? In times like these, it helps to know that you’re working with a seasoned investment professional who has experience to guide you through difficult times. At MFS®, we believe our investment management team has the knowledge and confidence to navigate through difficult cycles and at the same time see through adversity to find investment opportunities for our clients and shareholders.
Our investment management process, honed over 80 years, combines a unique concept of teamwork with our unwavering focus on the long term. We firmly believe that the best way to realize long-term financial goals – be it a college education, a comfortable retirement, or a secure family legacy – is to follow a three-pronged approach that focuses on longer time horizons. Allocate holdings across the major asset classes – including stocks, bonds, and cash. Diversify within each class to take advantage of different market segments and investing styles. Rebalance assets regularly to maintain a desired asset allocation. Of course, these strategies cannot guarantee a profit or protect against a loss. This long-term approach requires diligence and patience, two traits that in our experience are essential to capitalizing on the many opportunities the financial markets can offer – through both up and down economic cycles.
Respectfully,

Robert J. Manning
Chief Executive Officer and Chief Investment Officer
MFS Investment Management®
April 17, 2006
The opinions expressed in this letter are those of MFS, and no forecasts can be guaranteed.
SEMIANNUAL REPORT 1
PORTFOLIO COMPOSITION

| Short term credit quality (r) | |
| Average Credit Quality | |
| Short-Term Bonds (a) | A-1 |
|
| All holdings are rated A-1 | |
| Maturity breakdown (b) | |
| 0 – 29 days | 50.1% |
|
| 30 – 59 days | 9.5% |
|
| 60 – 89 days | 40.9% |
|
| 90 – 366 days | 0.6% |
|
| Other Assets Less Liabilities | -1.1% |
|
| (b) | For purposes of this graphical presentation, the bond component includes both accrued interest amounts |
| | and the equivalent exposure from any derivative holdings, if applicable. |
| (r) | Each security is assigned a rating from Moody’s Investors Service. If not rated by Moody’s, the rating will |
| | be that assigned by Standard & Poor’s. Likewise, if not assigned a rating by Standard & Poor’s, it will be |
| | based on the rating assigned by Fitch, Inc. If not rated by any of the three agencies, the security is |
| | considered Not Rated. U.S. Treasuries and U.S. Agency securities are included in the ‘‘A-1’’-rating |
| | category. Percentages are based on the total market value of investments as of 2/28/06. |
| (a) | The Average Credit Quality is based upon a market weighted average of portfolio holdings that are rated |
| | by public rating agencies. |
From time to time ‘‘Other Assets Less Liabilities,’’ may be negative due to timing of cash receipts.
Percentages are based on net assets as of 2/28/06, unless otherwise noted.
The portfolio is actively managed, and current holdings may be different.
2 SEMIANNUAL REPORT
PERFORMANCE SUMMARY THROUGH 2/28/06
Total returns as well as the current 7-day yield have been provided for the applicable time periods. Performance results reflect the percentage change in net asset value, including the reinvestment of any dividends and capital gains distributions. (See Notes to Performance Summary.)
An investment in the portfolio is not insured or guaranteed by the Federal Deposit Insurance Corporation or any other government agency. Although the portfolio seeks to preserve the value of your investment at $1.00 per share, it is possible to lose money by investing in the portfolio.
Performance data shown represents past performance and is no guarantee of future results. Investment return and principal value fluctuate so your shares, when sold, may be worth more or less than the original cost; current performance may be lower or higher than quoted. For most recent month-end performance, please visit mfs.com. The performance shown does not reflect the deduction of taxes, if any, that a shareholder would pay on fund distributions or the redemption of fund shares.
| | | 6 month | 6 month | | |
| | | total return | total return | | Current |
| | | without | with | Current | 7-day yield |
| Class | | Inception | sales charge | sales charge | 7-day yield | without waiver |
| A | | 9/07/93 | 1.81% | N/A | 4.04% | 3.64% |
|
| B | | 12/29/86 | 1.31% | -2.69% | 3.05% | 2.65% |
|
| C | | 4/01/96 | 1.31% | 0.31% | 3.05% | 2.65% |
|
| R1 | | 4/01/05 | 1.25% | N/A | 2.94% | 2.44% |
|
| R2 | | 4/01/05 | 1.42% | N/A | 3.29% | 2.74% |
|
| R3 | | 4/01/05 | 1.48% | N/A | 3.39% | 2.89% |
|
| R4 | | 4/01/05 | 1.61% | N/A | 3.64% | 3.24% |
|
| R5 | | 4/01/05 | 1.76% | N/A | 3.95% | 3.55% |
|
| 529 A | 7/31/02 | 1.69% | N/A | 3.79% | 3.04% |
|
| 529 B | 7/31/02 | 1.19% | -2.81% | 2.79% | 2.39% |
|
| 529 C | 7/31/02 | 1.19% | 0.19% | 2.80% | 2.40% |
|
Class A, R1, R2, R3, R4, R5 and 529A shares have no sales charge. Please see Notes to Performance Summary for more details.
Yields quoted are based on the latest seven days ended as of February 28, 2006, with dividends annualized. The yield quotation more closely reflects the current earnings of the fund than the total return quotation.
Periods less than one year are actual not annualized.
SEMIANNUAL REPORT 3
Performance Summary – continued
Notes to Performance Summary
Class A and 529A shares have no sales charge. Class B and 529B results, including sales charge, reflect the deduction of the applicable contingent deferred sales charge (CDSC), which declines over six years from 4% to 0%. Class C and 529C results, including sales charge (assuming redemption within one year from the end of the calendar month of purchase), reflect the deduction of the 1% CDSC. Class R1, R2, R3, R4, and R5 shares have no initial sales charge or CDSC and are only available to certain retirement plans. Class 529 shares are only available in conjunction with qualified tuition programs, such as the MFS 529 Savings Plan. There also is an additional annual fee, which is detailed in the program description, on qualified tuition programs. If this fee was reflected, the performance for Class 529 shares would have been lower. This annual fee is waived for Oregon residents and for those accounts with assets of $25,000 or more.
Performance for Class R4, R5 and Class 529A shares includes the performance of the fund’s class A shares prior to their offering. Performance for Class C, R1, R2, R3, 529B, and 529C shares includes the performance of the fund’s Class B shares prior to their offering.
For reporting periods ending prior to March 31, 2004, when quoting performance for the fund’s Class 529A shares, the performance of these share classes included the performance of the fund’s Class B shares, rather than Class A shares. The blending methodology changed for reporting periods ending on or after March 31, 2004, because Class A shares now has a 10 year performance history, and share class performance is being blended to Class A shares based upon the similarity of share class operating expenses. This change in blending methodology results in better performance for Class 529A shares than it had under the prior blending methodology. For a transitional period lasting until December 31, 2007, performance for Class 529A shares under the prior methodology is available at mfs.com. This blended class performance has been adjusted to take into account differences in sales loads, if any, applicable to these share classes, but has not been adjusted to take into account differences in class specific operating expenses (such as Rule 12b-1 fees). Compared to performance these share classes would have experienced had they been offered for the entire period, the use of blended performance generally results in higher performance for share classes with higher operating expenses than the share class to which it is blended, and lower performance for share classes with lower operating expenses than the share class to which it is blended.
Performance results reflect any applicable expense subsidies, waivers, and adjustments in effect during the periods shown. Subsidies and fee waivers
4 SEMIANNUAL REPORT
Performance Summary – continued
may be imposed to enhance a portfolio’s yield during periods when the portfolio’s operating expenses have a significant impact on the portfolio’s yield due to lower interest rates. Without such subsidies, waivers, and adjustments the portfolio’s performance results would be less favorable. Please see the prospectus and financial statements for complete details.
Key Risk Considerations
The portfolio’s yield changes daily and is based on changes in interest rates and market conditions, and in response to other economic, political, or financial developments. The value of the portfolios investments may fluctuate in response to many factors including the performance and valuation of the issuer and general market conditions. Municipal instruments can be volatile and significantly affected by adverse tax, legislative or political changes and the financial condition of the issuers of municipal instruments. Foreign investments can be more volatile than U.S. investments. As with any fixed-income security, securities issued by certain U.S. government agencies or instrumentalities are subject to the risk that the issuer will default on principal and interest payments. Investors should note that many U.S. government securities in which the portfolio may invest are not supported by the full faith and the credit of the United States Government (including securities issued by government sponsored enterprises and by certain U.S. federal agencies and instrumentalities) and involve increased credit risk.
Although the portfolio seeks to preserve the value of your investment at $1.00 per share, it is possible to lose money by investing in the portfolio.
Please see the prospectus for further information regarding these and other risks considerations.
SEMIANNUAL REPORT 5
EXPENSE TABLE
Fund Expenses Borne by the Shareholders During the Period, September 1, 2005 through February 28, 2006.
As a shareholder of the fund, you incur two types of costs: (1) transaction costs, including sales charges (loads) on certain purchase or redemption payments and redemption fees on certain exchanges and redemptions, and (2) ongoing costs, including management fees; distribution and service (12b-1) fees; and other fund expenses. This example is intended to help you understand your ongoing costs (in dollars) of investing in the fund and to compare these costs with the ongoing costs of investing in other mutual funds.
The example is based on an investment of $1,000 invested at the beginning of the period and held for the entire period September 1, 2005 through February 28, 2006.
Actual Expenses
The first line for each share class in the following table provides information about actual account values and actual expenses. You may use the information in this line, together with the amount you invested, to estimate the expenses that you paid over the period. Simply divide your account value by $1,000 (for example, an $8,600 account value divided by $1,000 = 8.6), then multiply the result by the number in the first line under the heading entitled ‘‘Expenses Paid During Period’’ to estimate the expenses you paid on your account during this period.
Hypothetical Example for Comparison Purposes
The second line for each share class in the following table provides information about hypothetical account values and hypothetical expenses based on the fund’s actual expense ratio and an assumed rate of return of 5% per year before expenses, which is not the fund’s actual return. The hypothetical account values and expenses may not be used to estimate the actual ending account balance or expenses you paid for the period. You may use this information to compare the ongoing costs of investing in the fund and other funds. To do so, compare this 5% hypothetical example with the 5% hypothetical examples that appear in the shareholder reports of the other funds.
Please note that the expenses shown in the table are meant to highlight your ongoing costs only and do not reflect any transactional costs, such as sales charges (loads) or redemption fees. Therefore, the second line for each share class in the table is useful in comparing ongoing costs only, and will not help you determine the relative total costs of owning different funds. In addition, if these transactional costs were included, your costs would have been higher.
6 SEMIANNUAL REPORT
Expense Table – continued
| | | | | | Expenses |
| | | Annualized | Beginning | Ending | Paid During |
| | | Expense | Account Value | Account Value | Period(p) |
| Share Class | | Ratio | 9/01/05 | 2/28/06 | 9/01/05-2/28/06 |
|
A
| Actual | 0.51% | $1,000.00 | $1,018.10 | $2.55 |
|
| Hypothetical(h) | 0.51% | $1,000.00 | $1,022.27 | $2.56 |
|
B
| Actual | 1.51% | $1,000.00 | $1,013.10 | $7.54 |
|
| Hypothetical(h) | 1.51% | $1,000.00 | $1,017.31 | $7.55 |
|
C
| Actual | 1.51% | $1,000.00 | $1,013.10 | $7.54 |
|
| Hypothetical(h) | 1.51% | $1,000.00 | $1,017.31 | $7.55 |
|
R1
| Actual | 1.63% | $1,000.00 | $1,012.50 | $8.13 |
|
| Hypothetical(h) | 1.63% | $1,000.00 | $1,016.71 | $8.15 |
|
R2
| Actual | 1.29% | $1,000.00 | $1,014.20 | $6.44 |
|
| Hypothetical(h) | 1.29% | $1,000.00 | $1,018.40 | $6.46 |
|
R3
| Actual | 1.18% | $1,000.00 | $1,014.80 | $5.89 |
|
| Hypothetical(h) | 1.18% | $1,000.00 | $1,018.94 | $5.91 |
|
R4
| Actual | 0.93% | $1,000.00 | $1,016.10 | $4.65 |
|
| Hypothetical(h) | 0.93% | $1,000.00 | $1,020.18 | $4.66 |
|
R5
| Actual | 0.61% | $1,000.00 | $1,017.60 | $3.05 |
|
| Hypothetical(h) | 0.61% | $1,000.00 | $1,021.77 | $3.06 |
|
529A
| Actual | 0.76% | $1,000.00 | $1,016.90 | $3.80 |
|
| Hypothetical(h) | 0.76% | $1,000.00 | $1,021.03 | $3.81 |
|
529B
| Actual | 1.76% | $1,000.00 | $1,011.90 | $8.78 |
|
| Hypothetical(h) | 1.76% | $1,000.00 | $1,016.07 | $8.80 |
|
529C
| Actual | 1.76% | $1,000.00 | $1,011.90 | $8.78 |
|
| Hypothetical(h) | 1.76% | $1,000.00 | $1,016.07 | $8.80 |
|
| (h) | 5% class return per year before expenses. |
| (p) | Expenses paid is equal to each class’ annualized expense ratio, as shown above, multiplied by the average |
| account value over the period, multiplied by the number of days in the period, divided by the number of |
| days in the year. Expenses paid do not include any applicable sales charges (loads) or redemption fees. If |
| these transaction costs had been included, your costs would have been higher. |
Effective October 1, 2005 the fund’s Class R1, Class R2, and Class R3 retirement plan administration and services fee was reduced (as described in Note 3 of the Notes to the Financial Statements). Had this fee reduction been in effect throughout the entire six month period, the annualized expense ratio would have been 1.61%, 1.27%, and 1.16% for Class R1, Class R2, and Class R3, respectively, and the actual expenses paid during the period would have been approximately $8.03, $6.34, and $5.80 for Class R1, Class R2, and Class R3 respectively.
SEMIANNUAL REPORT 7
| PORTFOLIO OF INVESTMENTS (unaudited) – 2/28/06 | | | | | |
| The Portfolio of Investments is a complete list of all securities owned by your fund. | | | |
| It is categorized by broad-based asset classes. | | | | | |
| Certificates of Deposit - 16.6% | | | | | |
|
| Issuer | | Shares/Par | | | Value ($) |
|
| Banks & Credit Companies - 16.6% | | | | | |
|
| Barclays Bank NY PLC, 4.455%, due 3/28/06 | $ | 13,934,000 | | $ | 13,934,000 |
| Caylon, NY, 4.73%, due 5/22/06 | | 10,714,000 | | | 10,714,000 |
| Citibank N.A., 4.715%, due 5/17/06 | | 6,275,000 | | | 6,275,000 |
| Credit Suisse First Boston, NY, 4.46%, due 3/13/06 | | 15,103,000 | | | 15,103,000 |
| Royal Bank of Canada, NY, 4.7125%, due 5/19/06 | | 14,335,000 | | | 14,334,671 |
|
| Total Certificates of Deposit, at Amortized Cost and Value | | | | $ | 60,360,671 |
|
| Commercial Paper - 84.5% (y) | | | | | |
|
| Banks & Credit Companies - 23.1% | | | | | |
|
| Abbey National North America LLC, 4.37%, due 3/06/06 | $ | 15,670,000 | | $ | 15,660,487 |
| Depfa Bank PLC, 4.49%, due 4/11/06 (t) | | 2,713,000 | | | 2,699,127 |
| Depfa Bank PLC, 4.595%, due 5/03/06 (t) | | 3,507,000 | | | 3,478,799 |
| Depfa Bank PLC, 4.61%, due 5/03/06 (t) | | 8,234,000 | | | 8,167,572 |
| HBOS Treasury Services PLC, 4.655%, due 5/17/06 | | 15,027,000 | | | 14,877,383 |
| ING America Insurance Holdings, Inc., 4.64%, due 5/15/06 | | 10,369,000 | | | 10,268,766 |
| Svenska Handelsbanken, Inc., 4.395%, due 3/09/06 | | 14,179,000 | | | 14,165,152 |
| UBS Finance Delaware LLC, 4.625%, due 5/10/06 | | 15,075,000 | | | 14,939,430 |
| |
|
| | | | | $ | 84,256,716 |
|
| Financial Institutions - 57.4% | | | | | |
|
| Alpine Securitization Corp., 4.64%, due 5/01/06 (t) | $ | 4,636,000 | | $ | 4,599,551 |
| American General Finance Corp., 4.56%, due 5/01/06 | | 4,790,000 | | | 4,752,989 |
| American General Finance Corp., 4.625%, due 5/11/06 | | 10,218,000 | | | 10,124,796 |
| Barton Capital LLC, 4.47%, due 3/07/06 (t) | | 9,653,000 | | | 9,645,809 |
| Barton Capital LLC, 4.4%, due 3/09/06 (t) | | 5,435,000 | | | 5,429,686 |
| CAFCO LLC, 4.64%, due 5/04/06 (t) | | 14,871,000 | | | 14,748,331 |
| CRC Funding LLC, 4.43%, due 3/06/06 (t) | | 14,029,000 | | | 14,020,368 |
| CRC Funding LLC, 4.58%, due 4/12/06 (t) | | 922,000 | | | 917,073 |
| Ciesco LLC, 4.385%, due 3/06/06 (t) | | 411,000 | | | 410,750 |
| Ciesco LLC, 4.6%, due 4/18/06 (t) | | 14,567,000 | | | 14,477,656 |
| Citibank Credit Card Issuance Trust, 4.44%, due 3/16/06 (t) | | 10,000,000 | | | 9,981,500 |
| Citibank Credit Card Issuance Trust, 4.59%, due 4/10/06 (t) | | 4,982,000 | | | 4,956,592 |
| Edison Asset Securitization LLC, 4.6%, due 5/04/06 (t) | | 15,087,000 | | | 14,963,622 |
| Govco, Inc., 4.6%, due 5/04/06 (t) | | 15,054,000 | | | 14,930,892 |
| Jupiter Securitization Corp., 4.56%, due 3/01/06 (t) | | 14,684,000 | | | 14,684,000 |
| Kitty Hawk Funding Corp., 4.39%, due 3/20/06 (t) | | 15,695,000 | | | 15,658,636 |
| Old Line Funding LLC, 4.46%, due 3/02/06 (t) | | 4,612,000 | | | 4,611,429 |
| Park Avenue Receivable Co. LLC, 4.56%, due 3/01/06 (t) | | 13,522,000 | | | 13,522,000 |
| Ranger Funding Co. LLC, 4.5%, due 3/07/06 (t) | | 5,000,000 | | | 4,996,250 |
| Ranger Funding Co. LLC, 4.44%, due 3/21/06 (t) | | 2,599,000 | | | 2,592,589 |
|
| 8 SEMIANNUAL REPORT | | | | | |
| Portfolio of Investments (unaudited) – continued | | | | | | |
| Issuer | | Shares/Par | | | Value ($) | |
|
| Commercial Paper - continued | | | | | | |
|
| Financial Institutions - continued | | | | | | |
|
| Scaldis Capital LLC, 4.6%, due 4/27/06 (t) | $ | 2,500,000 | | $ | 2,481,792 | |
| Scaldis Capital LLC, 4.58%, due 4/28/06 (t) | | 9,114,000 | | | 9,046,749 | |
| Scaldis Capital LLC, 4.72%, due 5/31/06 (t) | | 2,500,000 | | | 2,470,172 | |
| Thunder Bay Funding LLC, 4.49%, due 3/10/06 (t) | | 659,000 | | | 658,260 | |
| Thunder Bay Funding LLC, 4.405%, due 3/21/06 (t) | | 14,452,000 | | | 14,416,633 | |
| |
|
| | | | | | $ | 209,098,125 | |
|
| Insurance - 4.0% | | | | | | |
|
| MetLife, Inc., 4.38%, due 3/20/06 (t) | $ | 12,761,000 | | $ | 12,731,501 | |
| MetLife, Inc., 4.68%, due 5/11/06 (t) | | 2,007,000 | | | 1,988,475 | |
| |
|
| | | | | | $ | 14,719,976 | |
|
| Total Commercial Paper, at Amortized Cost and Value | | | | $ | 308,074,817 | |
|
| Total Investments, at Amortized Cost and Value | | | | $ | 368,435,488 | |
|
| Other Assets, Less Liabilities - (1.1)% | | | | | (4,127,258 | ) |
|
| Net Assets - 100.0% | | | | $ | 364,308,230 | |
|
| (y) | The rate shown represents an annualized yield at time of purchase. | | | | | | |
| (t) | Security exempt from registration with the U.S. Securities and Exchange Commission under Section 4(2) of | |
| | the Securities Act of 1933. | | | | | | |
See Notes to Financial Statements | | | | | | |
|
| | | |
SEMIANNUAL REPORT 9 | |
| FINANCIAL STATEMENTS | Statement of Assets and Liabilities (unaudited) | |
| This statement represents your fund’s balance sheet, which details the assets | | |
| and liabilities composing the total value of the fund. | | |
| At 2/28/06 | | |
| Assets | | |
|
| Investments, at amortized cost and value | $368,435,488 | |
| Cash | 808 | |
| Receivable for fund shares sold | 497,832 | |
| Interest receivable | 230,632 | |
| Other assets | 1,644 | |
|
| Total assets | | $369,166,404 |
|
| Liabilities | | |
|
| Distributions payable | $39,926 | |
| Payable for fund shares reacquired | 4,537,791 | |
| Payable to affiliates | | |
| Management fee | 2,990 | |
| Shareholder servicing costs | 72,629 | |
| Distribution and service fees | 14,852 | |
| Administrative services fee | 205 | |
| Program manager fees | 35 | |
| Retirement plan administration and services fees | 23 | |
| Payable for independent trustees’ compensation | 32,642 | |
| Accrued expenses and other liabilities | 157,081 | |
|
| Total liabilities | | $4,858,174 |
|
| Net assets | | $364,308,230 |
|
| Net assets consist of: | | |
|
| Paid-in capital | $364,309,041 | |
| Accumulated net realized gain (loss) on investments | (1,256) | |
| Undistributed net investment income | 445 | |
|
| Net assets | | $364,308,230 |
|
| Shares of beneficial interest outstanding | | 364,309,041 |
|
| 10 SEMIANNUAL REPORT | | |
| Statement of Assets and Liabilities (unaudited) – continued | | |
| Class A shares | | |
|
| Net assets | $91,705,702 | |
| Shares outstanding | 91,705,893 | |
|
| Net asset value, offering price, and redemption price per share | | $1.00 |
|
| Class B shares | | |
|
| Net assets | $224,892,053 | |
| Shares outstanding | 224,892,563 | |
|
| Net asset value and offering price per share | | $1.00 |
|
| Class C shares | | |
|
| Net assets | $41,145,494 | |
| Shares outstanding | 41,145,593 | |
|
| Net asset value and offering price per share | | $1.00 |
|
| Class R1 shares | | |
|
| Net assets | $788,005 | |
| Shares outstanding | 788,006 | |
|
| Net asset value, offering price, and redemption price per share | | $1.00 |
|
| Class R2 shares | | |
|
| Net assets | $959,850 | |
| Shares outstanding | 959,852 | |
|
| Net asset value, offering price, and redemption price per share | | $1.00 |
|
| Class R3 shares | | |
|
| Net assets | $1,954,538 | |
| Shares outstanding | 1,954,541 | |
|
| Net asset value, offering price, and redemption price per share | | $1.00 |
|
| Class R4 shares | | |
|
| Net assets | $221,107 | |
| Shares outstanding | 221,107 | |
|
| Net asset value, offering price, and redemption price per share | | $1.00 |
|
| Class R5 shares | | |
|
| Net assets | $51,419 | |
| Shares outstanding | 51,420 | |
|
| Net asset value, offering price, and redemption price per share | | $1.00 |
|
| | SEMIANNUAL REPORT 11 |
| Statement of Assets and Liabilities (unaudited) – continued | | |
| Class 529A shares | | |
| Net assets | $1,703,589 | |
| Shares outstanding | 1,703,592 | |
|
| Net asset value, offering price, and redemption price per share | | $1.00 |
|
| Class 529B shares | | |
|
| Net assets | $339,731 | |
| Shares outstanding | 339,731 | |
|
| Net asset value and offering price per share | | $1.00 |
|
| Class 529C shares | | |
|
| Net assets | $546,742 | |
| Shares outstanding | 546,743 | |
|
| Net asset value and offering price per share | | $1.00 |
|
| A contingent deferred sales charge may be imposed on redemptions of Class B, Class C, Class 529B and | |
| Class 529C shares. | | |
| See Notes to Financial Statements | | |
|
12 SEMIANNUAL REPORT | | |
| FINANCIAL STATEMENTS | Statement of Operations (unaudited) | |
| This statement describes how much your fund earned in investment income and accrued in | |
| expenses. It also describes any gains and/or losses generated by fund operations. | | |
| Six months ended 2/28/06 | | |
| Net investment income | | |
|
| Interest income | | $8,343,226 |
|
| Expenses | | |
| Management fee | $1,117,315 | |
| Distribution and service fees | 1,525,627 | |
| Program manager fees | 3,194 | |
| Shareholder servicing costs | 461,732 | |
| Administrative services fee | 23,256 | |
| Retirement plan administration and services fees | 5,081 | |
| Independent trustees’ compensation | 9,867 | |
| Custodian fee | 66,606 | |
| Shareholder communications | 41,323 | |
| Auditing fees | 16,780 | |
| Legal fees | 4,368 | |
| Registration fees | 83,911 | |
| Miscellaneous | 12,387 | |
|
| Total expenses | | $3,371,447 |
|
| Fees paid indirectly | (11,625) | |
| Reduction of expenses by investment adviser and distributor | (818,528) | |
|
| Net expenses | | $2,541,294 |
|
| Net investment income | | $5,801,932 |
|
| Net realized gain (loss) on investment transactions | | $(811) |
|
| Change in net assets from operations | | $5,801,121 |
|
| See Notes to Financial Statements | | |
| |
| | SEMIANNUAL REPORT 13 |
| FINANCIAL STATEMENTS | Statements of Changes in Net Assets | |
| These statements describe the increases and/or decreases in net assets resulting | |
| from operations, any distributions, and any shareholder transactions. | |
| | Six months ended | Year ended |
| | 2/28/06 | 8/31/05 |
| | (unaudited) | |
| Change in net assets | | |
|
| From operations | | |
|
| Net investment income | $5,801,932 | $6,156,757 |
| Net realized gain (loss) on investments | (811) | — |
|
| Change in net assets from operations | $5,801,121 | $6,156,757 |
|
| Distributions declared to shareholders | | |
|
| From net investment income | | |
| Class A | $(1,776,240) | $(1,959,377) |
| Class B | (3,323,581) | (3,531,863) |
| Class C | (617,405) | (621,592) |
| Class R1 | (7,759) | (532) |
| Class R2 | (12,381) | (1,029) |
| Class R3 | (22,977) | (2,891) |
| Class R4 | (2,124) | (466) |
| Class R5 | (891) | (528) |
| Class 529A | (27,704) | (30,067) |
| Class 529B | (4,013) | (3,064) |
| Class 529C | (6,857) | (5,348) |
|
| Total distributions declared to shareholders | $(5,801,932) | $(6,156,757) |
|
| Change in net assets from fund share transactions | $(58,442,685) | $(190,979,377) |
|
| Total change in net assets | $(58,443,496) | $(190,979,377) |
|
| Net assets | | |
|
| At beginning of period | 422,751,726 | 613,731,103 |
| At end of period (including undistributed net investment | | |
| income of $445 and $445, respectively) | $364,308,230 | $422,751,726 |
|
| See Notes to Financial Statements | | |
|
14 SEMIANNUAL REPORT | | |
| FINANCIAL STATEMENTS | Financial Highlights | | | | |
| The financial highlights table is intended to help you understand the fund’s financial performance for the |
| semiannual period and the past 5 fiscal years (or life of a particular share class, if shorter). Certain information |
| reflects financial results for a single fund share. The total returns in the table represent the rate by which an |
| investor would have earned (or lost) on an investment in the fund share class (assuming reinvestment of all |
| distributions) held for the entire period. | | | | | | | |
| Six months | | | | | | |
| | ended | | Years ended 8/31 |
| Class A | 2/28/06 | | 2005 | 2004 | 2003 | 2002 | 2001 |
| (unaudited) | | | | | | |
| Net asset value, beginning of period | $1.00 | | $1.00 | $1.00 | $1.00 | $1.00 | $1.00 |
|
| Income (loss) from | | | | | | | |
| investment operations | | | | | | | |
|
| Net investment income (d) | $0.02 | | $0.02 | $0.01 | $0.01 | $0.01 | $0.05 |
| Net realized gain (loss) on | | | | | | | |
| investments | (0.00) | (w) | — | — | — | — | — |
|
| Total from investment operations | $0.02 | | $0.02 | $0.01 | $0.01 | $0.01 | $0.05 |
|
| Less distributions declared | | | | | | | |
| to shareholders | | | | | | | |
|
| From net investment income | $(0.02) | | $(0.02) | $(0.01) | $(0.01) | $(0.01) | $(0.05) |
|
| Net asset value, end of period | $1.00 | | $1.00 | $1.00 | $1.00 | $1.00 | $1.00 |
|
| Total return (%) (r) | 1.81 | (n) | 2.11 | 0.58 | 0.69 | 1.49 | 4.85 |
|
| Ratios (%) (to average net assets) | | | | | | | |
| and Supplemental data: | | | | | | | |
|
| Expenses before expense reductions (f) | 0.91 | (a) | 0.90 | 0.79 | 0.81 | 0.91 | 0.90 |
| Expenses after expense reductions (f) | 0.51 | (a) | 0.50 | 0.55 | 0.71 | 0.81 | 0.80 |
| Net investment income | 3.62 | (a) | 2.10 | 0.58 | 0.70 | 1.44 | 4.82 |
| Net assets at end of period | | | | | | | |
| (000 Omitted) | $91,706 | | $91,165 | $101,287 | $214,275 | $242,230 | $107,346 |
|
| See Notes to Financial Statements | | | | | | |
| Financial Highlights – continued | | | | | | | | | | | | | | | | |
| Six months | | | | | | | | | | | | | | | | |
| | | ended | | | Years ended 8/31 |
| Class B | | 2/28/06 | | | 2005 | | | 2004 | | | 2003 | | | 2002 | | | 2001 | |
| (unaudited) | | | | | | | | | | | | | | | | |
| Net asset value, beginning | | | | | | | | | | | | | | | | | | |
| of period | | $1.00 | | | $1.00 | | | $1.00 | | | $1.00 | | | $1.00 | | | $1.00 | |
|
| Income (loss) from | | | | | | | | | | | | | | | | | | |
| investment operations | | | | | | | | | | | | | | | | | | |
|
| Net investment income (d) | | $0.01 | | | $0.01 | | | $0.00 | (w) | | $0.00 | (w) | | $0.00 | (w) | | $0.04 | |
| Net realized gain (loss) on | | | | | | | | | | | | | | | | | | |
| investments | | (0.00) | (w) | | — | | | — | | | — | | | — | | | — | |
|
| Total from investment | | | | | | | | | | | | | | | | | | |
| operations | $ | $0.01 | | $ | $0.01 | | $ | $0.00 | (w) | $ | $0.00 | (w) | $ | $0.00 | (w) | $ | $0.04 | |
|
| Less distributions declared | | | | | | | | | | | | | | | | | | |
| to shareholders | | | | | | | | | | | | | | | | | | |
|
| From net investment | | | | | | | | | | | | | | | | | | |
| income | | $(0.01) | | | $(0.01) | | | $(0.00) | (w) | | $(0.00) | (w) | | $(0.00) | (w) | | $(0.04) | |
|
| Net asset value, end of period | | $1.00 | | | $1.00 | | | $1.00 | | | $1.00 | | | $1.00 | | | $1.00 | |
|
| Total return (%) (t)(r) | | 1.31 | (n) | | 1.10 | | | 0.06 | | | 0.06 | | | 0.49 | | | 3.81 | |
|
| Ratios (%) (to average net assets) | | | | | | | | | | | | | | | | |
| and Supplemental data: | | | | | | | | | | | | | | | | | | |
|
| Expenses before expense | | | | | | | | | | | | | | | | | | |
| reductions (f) | | 1.91 | (a) | | 1.89 | | | 1.80 | | | 1.81 | | | 1.91 | | | 1.90 | |
| Expenses after expense | | | | | | | | | | | | | | | | | | |
| reductions (f) | | 1.51 | (a) | | 1.49 | | | 1.07 | | | 1.35 | | | 1.81 | | | 1.80 | |
| Net investment income | | 2.61 | (a) | | 1.03 | | | 0.06 | | | 0.06 | | | 0.50 | | | 3.65 | |
| Net assets at end of period | | | | | | | | | | | | | | | | | | |
| (000 Omitted) | | $224,892 | | | $280,361 | | | $429,844 | | | $647,269 | | | $741,638 | | | $514,324 | |
|
| See Notes to Financial Statements | | | | | | | | | | | | | | | | |
|
16 SEMIANNUAL REPORT | | | | | | | | | | | | | | | | | | |
| Financial Highlights – continued | | | | | | | | | |
| Six months | | | | | | | | | |
| | ended | | Years ended 8/31 |
| Class C | 2/28/06 | | 2005 | 2004 | | 2003 | | 2002 | | 2001 |
| (unaudited) | | | | | | | | | |
| Net asset value, beginning | | | | | | | | | | |
| of period | $1.00 | | $1.00 | $1.00 | | $1.00 | | $1.00 | | $1.00 |
|
| Income (loss) from | | | | | | | | | | |
| investment operations | | | | | | | | | | |
|
| Net investment income (d) | $0.01 | | $0.01 | $0.00 | (w) | $0.00 | (w) | $0.00 | (w) | $0.04 |
| Net realized gain (loss) on | | | | | | | | | | |
| investments | (0.00) | (w) | — | — | | — | | — | | — |
|
| Total from investment operations | $0.01 | | $0.01 | $0.00 | (w) | $0.00 | (w) | $0.00 | (w) | $0.04 |
|
| Less distributions declared | | | | | | | | | | |
| to shareholders | | | | | | | | | | |
|
| From net investment income | $(0.01) | | $(0.01) | $(0.00) | (w) | $(0.00) | (w) | $(0.00) | (w) | $(0.04) |
|
| Net asset value, end of period | $1.00 | | $1.00 | $1.00 | | $1.00 | | $1.00 | | $1.00 |
|
| Total return (%) (t)(r) | 1.31 | (n) | 1.10 | 0.06 | | 0.06 | | 0.49 | | 3.80 |
|
| Ratios (%) (to average net assets) | | | | | | | | | |
| and Supplemental data: | | | | | | | | | | |
|
| Expenses before expense | | | | | | | | | | |
| reductions (f) | 1.91 | (a) | 1.89 | 1.79 | | 1.81 | | 1.91 | | 1.90 |
| Expenses after expense | | | | | | | | | | |
| reductions (f) | 1.51 | (a) | 1.49 | 1.07 | | 1.36 | | 1.81 | | 1.80 |
| Net investment income | 2.61 | (a) | 1.03 | 0.06 | | 0.06 | | 0.50 | | 3.77 |
| Net assets at end of period | | | | | | | | | | |
| (000 Omitted) | $41,145 | | $46,483 | $80,482 | | $159,715 | | $159,254 | | $125,200 |
|
| See Notes to Financial Statements | | | | | | | | | |
|
| | | | | | | SEMIANNUAL REPORT 17 |
| Financial Highlights – continued | | | | |
| | Six months | | Year | |
| | ended | | ended | |
| Class R1 | 2/28/06 | | 8/31/05(i) | |
| | (unaudited) | | | |
| Net asset value, beginning of period | $1.00 | | $1.00 | |
| |
| Income (loss) from investment operations | | | | |
| |
| Net investment income (d) | $0.01 | | $0.01 | |
| Net realized gain (loss) on investments | (0.00) | (w) | — | |
| |
| Total from investment operations | $0.01 | | $0.01 | |
| |
| Less distributions declared to shareholders | | | | |
| |
| From net investment income | $(0.01) | | $(0.01) | |
| |
| Net asset value, end of period | $1.00 | | $1.00 | |
| |
| Total return (%) (r) | 1.25 | (n) | 0.59 | (n) |
| |
| Ratios (%) (to average net assets) | | | | |
| and Supplemental data: | | | | |
| |
| Expenses before expense reductions (f) | 2.12 | (a) | 2.24 | (a) |
| Expenses after expense reductions (f) | 1.63 | (a) | 1.84 | (a) |
| Net investment income | 2.62 | (a) | 1.52 | (a) |
| Net assets at end of period (000 Omitted) | $788 | | $258 | |
| |
| | Six months | | Year | |
| | ended | | ended | |
| Class R2 | 2/28/06 | | 8/31/05(i) | |
| | (unaudited) | | | |
| Net asset value, beginning of period | $1.00 | | $1.00 | |
| |
| Income (loss) from investment operations | | | | |
| |
| Net investment income (d) | $0.01 | | $0.01 | |
| Net realized gain (loss) on investments | (0.00) | (w) | — | |
| |
| Total from investment operations | $0.01 | | $0.01 | |
| |
| Less distributions declared to shareholders | | | | |
| |
| From net investment income | $(0.01) | | $(0.01) | |
| |
| Net asset value, end of period | $1.00 | | $1.00 | |
| |
| Total return (%) (r) | 1.42 | (n) | 0.72 | (n) |
| |
| Ratios (%) (to average net assets) | | | | |
| and Supplemental data: | | | | |
| |
| Expenses before expense reductions (f) | 1.82 | (a) | 1.93 | (a) |
| Expenses after expense reductions (f) | 1.29 | (a) | 1.53 | (a) |
| Net investment income | 2.90 | (a) | 1.97 | (a) |
| Net assets at end of period (000 Omitted) | $960 | | $604 | |
| |
| See Notes to Financial Statements | | | | |
| |
18 SEMIANNUAL REPORT | | | | |
| Financial Highlights – continued | | | | |
| | Six months | | Year | |
| | ended | | ended | |
| Class R3 | 2/28/06 | | 8/31/05(i) | |
| | (unaudited) | | | |
| Net asset value, beginning of period | $1.00 | | $1.00 | |
| |
| Income (loss) from investment operations | | | | |
| |
| Net investment income (d) | $0.02 | | $0.01 | |
| Net realized gain (loss) on investments�� | (0.00) | (w) | — | |
| |
| Total from investment operations | $0.02 | | $0.01 | |
| |
| Less distributions declared to shareholders | | | | |
| |
| From net investment income | $(0.02) | | $(0.01) | |
| |
| Net asset value, end of period | $1.00 | | $1.00 | |
| |
| Total return (%) (r) | 1.48 | (n) | 0.78 | (n) |
| |
| Ratios (%) (to average net assets) | | | | |
| and Supplemental data: | | | | |
| |
| Expenses before expense reductions (f) | 1.67 | (a) | 1.83 | (a) |
| Expenses after expense reductions (f) | 1.18 | (a) | 1.43 | (a) |
| Net investment income | 3.01 | (a) | 2.10 | (a) |
| Net assets at end of period (000 Omitted) | $1,955 | | $1,179 | |
| |
| | Six months | | Year | |
| | ended | | ended | |
| Class R4 | 2/28/06 | | 8/31/05(i) | |
| | (unaudited) | | | |
| Net asset value, beginning of period | $1.00 | | $1.00 | |
| |
| Income (loss) from investment operations | | | | |
| |
| Net investment income (d) | $0.02 | | $0.01 | |
| Net realized gain (loss) on investments | (0.00) | (w) | — | |
| |
| Total from investment operations | $0.02 | | $0.01 | |
| |
| Less distributions declared to shareholders | | | | |
| |
| From net investment income | $(0.02) | | $(0.01) | |
| |
| Net asset value, end of period | $1.00 | | $1.00 | |
| |
| Total return (%) (r) | 1.61 | (n) | 0.93 | (n) |
| |
| Ratios (%) (to average net assets) | | | | |
| and Supplemental data: | | | | |
| |
| Expenses before expense reductions (f) | 1.33 | (a) | 1.38 | (a) |
| Expenses after expense reductions (f) | 0.93 | (a) | 0.98 | (a) |
| Net investment income | 3.34 | (a) | 2.21 | (a) |
| Net assets at end of period (000 Omitted) | $221 | | $51 | |
| |
| See Notes to Financial Statements | | | | |
| |
| | SEMIANNUAL REPORT 19 | |
| Financial Highlights – continued | | | | | | | | | |
| | | | | Six months | | Year | |
| | | | | | | ended | | ended | |
| Class R5 | | | | 2/28/06 | | 8/31/05(i) | |
| | | | | (unaudited) | | | |
| Net asset value, beginning of period | | | | | | $1.00 | | $1.00 | |
| |
| Income (loss) from investment operations | | | | | | | | | |
| |
| Net investment income (d) | | | | | | $0.02 | | $0.01 | |
| Net realized gain (loss) on investments | | | | | | (0.00) | (w) | — | |
| |
| Total from investment operations | | | | | | $0.02 | | $0.01 | |
| |
| Less distributions declared to shareholders | | | | | | | | | |
| |
| From net investment income | | | | | | $(0.02) | | $(0.01) | |
| |
| Net asset value, end of period | | | | | | $1.00 | | $1.00 | |
| |
| Total return (%) (r) | | | | | | 1.76 | (n) | 1.06 | (n) |
| |
| Ratios (%) (to average net assets) | | | | | | | | | |
| and Supplemental data: | | | | | | | | | |
| |
| Expenses before expense reductions (f) | | | | | | 1.01 | (a) | 1.08 | (a) |
| Expenses after expense reductions (f) | | | | | | 0.61 | (a) | 0.68 | (a) |
| Net investment income | | | | | | 3.53 | (a) | 2.51 | (a) |
| Net assets at end of period (000 Omitted) | | | | | | $51 | | $51 | |
| |
| Six months | | | | | | | | |
| | ended | | Years ended 8/31 | |
| Class 529A | 2/28/06 | | 2005 | 2004 | | 2003 | | 2002(i) | |
| (unaudited) | | | | | | | | |
| Net asset value, beginning of period | $1.00 | | $1.00 | $1.00 | | $1.00 | | $1.00 | |
| |
| Income (loss) from investment operations | | | | | | | | | |
| |
| Net investment income (d) | $0.02 | | $0.02 | $0.00 | (w) | $0.00(w) | | $0.00(w) | |
| Net realized gain (loss) on investments | (0.00) | (w) | — | — | | — | | — | |
| |
| Total from investment operations | $0.02 | | $0.02 | $0.00 | (w) | $0.00 | (w) | $0.00 | (w) |
| |
| Less distributions declared to shareholders | | | | | | | | | |
| |
| From net investment income | $(0.02) | | $(0.02) | $(0.00) | (w) | $(0.00) | (w) | $(0.00) | (w) |
| |
| Net asset value, end of period | $1.00 | | $1.00 | $1.00 | | $1.00 | | $1.00 | |
| |
| Total return (%) (r) | 1.69 | (n) | 1.86 | 0.33 | | 0.45 | | 0.08 | (n) |
| |
| Ratios (%) (to average net assets) | | | | | | | | | |
| and Supplemental data: | | | | | | | | | |
| |
| Expenses before expense reductions (f) | 1.51 | (a) | 1.50 | 1.39 | | 1.41 | | 1.26 | (a) |
| Expenses after expense reductions (f) | 0.76 | (a) | 0.75 | 0.80 | | 0.96 | | 1.16 | (a) |
| Net investment income | 3.38 | (a) | 1.93 | 0.34 | | 0.33 | | 1.04 | (a) |
| Net assets at end of period (000 Omitted) | $1,704 | | $1,650 | $1,140 | | $1,164 | | $30 | |
| |
| See Notes to Financial Statements | | | | | | | | | |
| |
20 SEMIANNUAL REPORT | | | | | | | | | |
| Financial Highlights – continued | | | | | | | | | | | | | | | |
| | | Six months | | | | | | | | | | | | | |
| | | ended | | | Years ended 8/31 | |
| Class 529B | | 2/28/06 | | | 2005 | | | 2004 | | | 2003 | | | 2002(i) | |
| | | (unaudited) | | | | | | | | | | | | | |
| Net asset value, beginning of period | | $1.00 | | | $1.00 | | | $1.00 | | | $1.00 | | | $1.00 | |
|
| Income (loss) from investment operations | | | | | | | | | | | | | |
|
| Net investment income (d) | | $0.01 | | | $0.01 | | | $0.00 | (w) | | $0.00 | (w) | | $0.00 | (w) |
| Net realized gain (loss) on investments | | (0.00) | (w) | | — | | | — | | | — | | | — | |
|
| Total from investment operations | | $0.01 | | | $0.01 | | | $0.00 | (w) | | $0.00 | (w) | | $0.00 | (w) |
|
| Less distributions declared to shareholders | | | | | | | | | | | | | |
|
| From net investment income | | $(0.01) | | | $(0.01) | | | $(0.00) | | (w) | $(0.00) | (w) | | $(0.00) | (w) |
|
| Net asset value, end of period | | $1.00 | | | $1.00 | | | $1.00 | | | $1.00 | | | $1.00 | |
|
| Total return (%) (t)(r) | | 1.19 | (n) | | 0.87 | | | 0.06 | | | 0.07 | | | 0.02 | (n) |
|
| Ratios (%) (to average net assets) | | | | | | | | | | | | | | | |
| and Supplemental data: | | | | | | | | | | | | | | | |
|
| Expenses before expense reductions (f) | | 2.16 | (a) | | 2.13 | | | 2.03 | | | 2.06 | | | 2.16 | (a) |
| Expenses after expense reductions (f) | | 1.76 | (a) | | 1.73 | | | 1.08 | | | 1.25 | | | 2.06 | (a) |
| Net investment income | | 2.38 | (a) | | 0.87 | | | 0.07 | | | 0.06 | | | 0.23 | (a) |
| Net assets at end of period (000 Omitted) | | $340 | | | $340 | | | $339 | | | $253 | | | $5 | |
|
| See Notes to Financial Statements | | | | | | | | | | | | | | | |
|
| | | | | | | | | SEMIANNUAL REPORT 21 | |
| Financial Highlights – continued | | | | | | | | | | | | | | | |
| | | | Six months | | | | | | | | | | | | | |
| | | | ended | | | Years ended 8/31 | |
| Class 529C | | 2/28/06 | | | 2005 | | | 2004 | | | 2003 | | | 2002(i) | |
| | | | (unaudited) | | | | | | | | | | | | | |
| Net asset value, beginning of period | | $1.00 | | | $1.00 | | | $1.00 | | | $1.00 | | | $1.00 | |
|
|
| Income (loss) from investment operations | | | | | | | | | | | | | |
|
|
| | Net investment income (d) | | $0.01 | | | $0.01 | | | $0.00 | (w) | | $0.00 | (w) | | $0.00 | (w) |
| | Net realized gain (loss) on investments | | (0.00) | (w) | | — | | | — | �� | | — | | | — | |
|
|
| Total from investment operations | | $0.01 | | | $0.01 | | | $0.00 | (w) | | $0.00 | (w) | | $0.00 | (w) |
|
|
| Less distributions declared to shareholders | | | | | | | | | | | | | |
|
|
| | From net investment income | | $(0.01) | | | $(0.01) | | | $(0.00) | (w) | | $(0.00) | (w) | | $(0.00) | (w) |
|
|
| Net asset value, end of period | | $1.00 | | | $1.00 | | | $1.00 | | | $1.00 | | | $1.00 | |
|
|
| Total return (%) (t)(r) | | 1.19 | (n) | | 0.87 | | | 0.06 | | | 0.07 | | | 0.02 | (n) |
|
|
| Ratios (%) (to average net assets) | | | | | | | | | | | | | | | |
| and Supplemental data: | | | | | | | | | | | | | | | |
|
|
| Expenses before expense reductions (f) | | 2.16 | (a) | | 2.13 | | | 2.03 | | | 2.06 | | | 2.16 | (a) |
| Expenses after expense reductions (f) | | 1.76 | (a) | | 1.73 | | | 1.08 | | | 1.22 | | | 2.06 | (a) |
| Net investment income | | 2.37 | (a) | | 0.85 | | | 0.06 | | | 0.05 | | | 0.23 | (a) |
| Net assets at end of period (000 Omitted) | | $547 | | | $611 | | | $640 | | | 512 | | | $5 | |
|
|
| (a) | Annualized. | | | | | | | | | | | | | | | |
| (n) | Not annualized. | | | | | | | | | | | | | | | |
| (d) | Per share data are based on average shares outstanding. | | | | | | | | | | | | | |
| (f) | Ratios do not reflect reductions from fees paid indirectly. | | | | | | | | | | | | | |
| (w) | Per share amount was less than $0.01. | | | | | | | | | | | | | | | |
| (r) | Certain expenses have been reduced without which performance would have been lower. | | | | |
| (t) | Total returns do not include any applicable sales charges. | | | | | | | | | | | | | |
| (i) | For the period from the class’ inception, July 31, 2002 (Classes 529A, 529B, and 529C), and April 1, 2005 | |
| | (Classes R1, R2, R3, R4, and R5) through the stated period end. | | | | | | | | | | |
|
See Notes to Financial Statements | | | | | | | | | | | | | | | |
| |
|
22 SEMIANNUAL REPORT | | | | | | | | | | | | | | | |
NOTES TO FINANCIAL STATEMENTS (unaudited)
(1) Business and Organization
MFS Cash Reserve Fund (the fund) is a series of MFS Series Trust I (the trust). The trust is organized as a Massachusetts business trust and is registered under the Investment Company Act of 1940, as amended, as an open-end management investment company.
(2) Significant Accounting Policies
General – The preparation of financial statements in conformity with U.S. generally accepted accounting principles requires management to make estimates and assumptions that affect the reported amounts of assets and liabilities, and disclosure of contingent assets and liabilities at the date of the financial statements and the reported amounts of revenues and expenses during the reporting period. Actual results could differ from those estimates.
Investment Valuations – Money market instruments are valued at amortized cost, which approximates market value. Amortized cost involves valuing an instrument at its cost as adjusted for amortization of premium or accretion of discount rather than its current market value. Each money market fund’s use of amortized cost is subject to the fund’s compliance with Rule 2a-7 of the Investment Company Act of 1940. The amortized cost value of an instrument can be different from the market value of an instrument.
Repurchase Agreements – The fund may enter into repurchase agreements with institutions that the fund’s investment adviser has determined are creditworthy. Each repurchase agreement is recorded at cost. The fund requires that the securities collateral in a repurchase transaction be transferred to the custodian in a manner sufficient to enable the fund to obtain those securities in the event of a default under the repurchase agreement. The fund monitors, on a daily basis, the value of the collateral to ensure that its value, including accrued interest, is greater than amounts owed to the fund under each such repurchase agreement. The fund, along with other affiliated entities of Massachusetts Financial Services Company (MFS), may utilize a joint trading account for the purpose of entering into one or more repurchase agreements.
Investment Transactions and Income – Investment transactions are recorded on the trade date. Interest income is recorded on the accrual basis. All premium and discount is amortized and accreted for financial statement purposes and tax reporting purposes in accordance with generally accepted accounting principles and federal tax regulations, respectively.
Fees Paid Indirectly – The fund’s custody fee is reduced according to an arrangement that measures the value of cash deposited with the custodian by the fund. This amount, for the six months ended February 28, 2006, is shown as a reduction of total expenses on the Statement of Operations.
Tax Matters and Distributions – The fund intends to continue to qualify as a regulated investment company, as defined under Subchapter M of the Internal Revenue Code, and to distribute all of its taxable income, including realized capital gains. Accordingly, no provision for federal income tax is required in
SEMIANNUAL REPORT 23
Notes to Financial Statements (unaudited) – continued
the financial statements. Foreign taxes, if any, have been accrued by the fund in the accompanying financial statements.
Distributions to shareholders are recorded on the ex-dividend date. Income and capital gain distributions are determined in accordance with income tax regulations, which may differ from generally accepted accounting principles. Certain capital accounts in the financial statements are periodically adjusted for permanent differences in order to reflect their tax character. These adjustments have no impact on net assets or net asset value per share. Temporary differences which arise from recognizing certain items of income, expense, gain or loss in different periods for financial statement and tax purposes will reverse at some time in the future. Distributions in excess of net investment income or net realized gains are temporary overdistributions for financial statement purposes resulting from differences in the recognition or classification of income for financial statement and tax purposes. During the year ended August 31, 2005, there were no adjustments due to differences between book and tax accounting.
The tax character of distributions declared to shareholders is as follows:
| | | August 31, 2005 | | August 31, 2004 |
| Ordinary income | | $6,156,757 | | $968,695 |
The federal tax cost and the tax basis components of distributable earnings were as follows:
| As of February 28, 2006 | | | |
| Tax cost of investments | | $368,435,488 | |
| As of August 31, 2005 | | | |
| Undistributed ordinary income | | $63,714 | |
| Capital loss carryforwards | | (445 | ) |
| Other temporary differences | | (63,269 | ) |
As of August 31, 2005, the fund had available capital loss carryforwards to offset future realized gains. Such losses expire as follows:
| August 31, 2012 | | $(441 | ) |
| August 31, 2013 | | (4 | ) |
|
| Total | | | | $(445 | ) |
Multiple Classes of Shares of Beneficial Interest – The fund offers multiple classes of shares, which differ in their respective distribution and service fees. All shareholders bear the common expenses of the fund based on the value of settled shares outstanding of each class, without distinction between share classes. Dividends are declared separately for each class. Differences in per share dividend rates are generally due to differences in separate class expenses. Class B and Class 529B shares will convert to Class A and Class 529A shares, respectively, approximately eight years after purchase.
24 SEMIANNUAL REPORT
Notes to Financial Statements (unaudited) – continued
(3) Transactions with Affiliates
Investment Adviser – The fund has an investment advisory agreement with Massachusetts Financial Services Company (MFS) to provide overall investment advisory and administrative services, and general office facilities.
The management fee is computed daily and paid monthly at an annual rate of 0.55% of the fund’s average daily net assets.
As part of a settlement agreement with the New York Attorney General concerning market timing and related matters, MFS has agreed to reduce the management fee to 0.15% of the fund’s average daily net assets for the period March 1, 2004 through February 28, 2009. For the six months ended February 28, 2006, this waiver amounted to $812,922 and is reflected as a reduction of total expenses in the Statement of Operations. The management fee incurred for the six months ended February 28, 2006 was equivalent to an annual effective rate of 0.15% of the fund’s average daily net assets.
Distributor – The Board of Trustees has adopted a distribution plan for certain class shares pursuant to Rule 12b-1 of the Investment Company Act of 1940.
The fund’s distribution plan provides that the fund will pay MFD for services provided by MFD and financial intermediaries in connection with the distribution and servicing of certain share classes. One component of the plan is a distribution fee paid to MFD and another component of the plan is a service fee paid to MFD. MFD may subsequently pay all, or a portion, of the distribution and/or service fees to financial intermediaries.
Distribution Fee Plan Table:
| | | | | | | | | Total | | | Annual | | | Distribution |
| | | | Distribution | | Service | | | Distribution | | | Effective | | | and Service |
| | | | Fee Rate | | Fee Rate | | Plan (1) | | Rate (2) | | | Fee |
| Class A | | 0.10 | % | 0.25 | % | | 0.35 | % | | 0.00 | % | | $— |
| Class B | | 0.75 | % | 0.25 | % | | 1.00 | % | | 1.00 | % | | 1,273,843 |
| Class C | | 0.75 | % | 0.25 | % | | 1.00 | % | | 1.00 | % | | 235,967 |
| Class R1 | 0.50 | % | 0.25 | % | | 0.75 | % | | 0.75 | % | | 2,234 |
| Class R2 | | 0.25 | % | 0.25 | % | | 0.50 | % | | 0.50 | % | | 2,142 |
| Class R3 | 0.25 | % | 0.25 | % | | 0.50 | % | | 0.50 | % | | 3,834 |
| Class R4 | | 0.00 | % | 0.25 | % | | 0.25 | % | | 0.25 | % | | 160 |
| Class 529 A | 0.25 | % | 0.25 | % | | 0.50 | % | | 0.00 | % | | 2,868 |
| Class 529 B | 0.75 | % | 0.25 | % | | 1.00 | % | | 1.00 | % | | 1,687 |
| Class 529 C | 0.75 | % | 0.25 | % | | 1.00 | % | | 1.00 | % | | 2,892 |
|
| Total Distribution and Service Fees | | | | | | | | | | $ | 1,525,627 |
| (1) | | In accordance with the distribution plan for certain classes, the fund pays distribution and/or service fees |
| | up to these annual percentage rates of each class’ average daily net assets. |
| (2) | | The annual effective rates represent actual fees incurred under the distribution plan for the six months |
| | ended February 28, 2006 based on each class’ average daily net assets. Payment of the 0.25% annual |
| | Class A service fee is not yet implemented and will commence on such date as the fund’s Board of |
| | Trustees may determine. Payment of the 0.10% annual Class A distribution fee is not yet implemented and |
| | will commence on such date as the fund’s Board of Trustees may determine. 0.10% of the Class 529A |
| | distribution fee is currently being waived under a contractual waiver arrangement and payment of 0.15% |
| | of the Class 529A distribution fee is not yet implemented. The distribution fee will be imposed on such |
| | date as the fund’s Board of Trustees may determine. For the six months ended February 28, 2006, this |
|
| |
SEMIANNUAL REPORT 25 |
Notes to Financial Statements (unaudited) – continued
waiver amounted to $819 and is reflected as a reduction of total expenses in the Statement of Operations. 0.25% of the Class 529A service fee is currently being waived under a contractual waiver arrangement. For the six months ended February 28, 2006, this waiver amounted to $2,049 and is reflected as a reduction of total expenses in the Statement of Operations.
Certain Class A, Class C and Class 529C shares are subject to a contingent deferred sales charge in the event of a shareholder redemption within 12 months of purchase. Class B and Class 529B shares are subject to a contingent deferred sales charge in the event of a shareholder redemption within six years of purchase. All contingent deferred sales charges are paid to MFD and during the six months ended February 28, 2006, were as follows:
| | | Amount |
| Class A | | $— |
| Class B | | $436,040 |
| Class C | | $7,016 |
| Class 529B | | $153 |
| Class 529C | | $— |
The fund has entered into and may from time to time enter into contracts with program managers and other parties which administer the tuition programs through which an investment in the fund’s 529 share classes is made. The fund has entered into an agreement with MFD pursuant to which MFD receives an annual fee of up to 0.35% from the fund based solely upon the value of the fund’s 529 share classes attributable to tuition programs to which MFD, or a third party which contracts with MFD, provides administrative services. The current fee has been established at 0.25% annually of average net assets of the fund’s 529 share classes. The fee may only be increased with the approval of the Board of Trustees who oversees the fund. The services provided by MFD, or a third party with which MFD contracts, include recordkeeping and tax reporting and account services, as well as services designed to maintain the program’s compliance with the Internal Revenue Code and other regulatory requirements. Program manager fees for the six months ended February 28, 2006, were as follows:
| | | | | Amount |
| Class 529A | | | $2,049 |
| Class 529B | | | $422 |
| Class 529C | | | $723 |
|
| Total Program Manager Fees | | | $3,194 |
Shareholder Servicing Agent – The fund pays a portion of shareholder servicing costs to MFS Service Center, Inc. (MFSC), a wholly-owned subsidiary of MFS. MFSC receives a fee from the fund, for its services as shareholder servicing agent, set periodically under the supervision of the fund’s Board of Trustees. For the six months ended February 28, 2006, the fee was $198,264 which equated to 0.1000% annually of the fund’s average daily net assets. MFSC also receives payment from the fund for out-of-pocket and sub-accounting expenses paid by MFSC on behalf of the fund. For the six months ended February 28, 2006, these costs amounted to $91,037.
26 SEMIANNUAL REPORT
Notes to Financial Statements (unaudited) – continued
Administrator – MFS provides certain financial, legal, shareholder communications, compliance, and other administrative services to certain funds for which MFS acts as investment adviser. Under an administrative services agreement, the funds may partially reimburse MFS the costs incurred to provide these services, subject to review and approval by the Board of Trustees. Each fund is charged a fixed amount plus a fee based on calendar year average net assets. Effective July 1, 2005, the fund’s annual fixed amount is $10,000.
The administrative services fee incurred for the six months ended February 28, 2006 was equivalent to an annual effective rate of 0.0100% of the fund’s average daily net assets.
In addition to the administrative services provided by MFS to the fund as described above, MFS is responsible for providing certain retirement plan administration and services with respect to certain shares. These services include various administrative, recordkeeping, and communication/educational services with respect to the retirement plans which invest in these shares, and may be provided directly by MFS or by a third party. MFS may subsequently pay all, or a portion, of the retirement plan administration and services fee to affiliated or unaffiliated third parties. For the six months ended February 28, 2006, the fund paid MFS an annual retirement plan administration and services fee up to the following annual percentage rates of each class’ average daily net assets:
| | | | Annual | |
| | | | Effective | Total |
| | | Fee Rate | Rate(1) | Amount |
| Class R1 | 0.45% | 0.36% | $1,337 |
| Class R2 | 0.40% | 0.27% | 1,712 |
| Class R3 | 0.25% | 0.16% | 1,912 |
| Class R4 | 0.15% | 0.15% | 95 |
| Class R5 | 0.10% | 0.10% | 25 |
|
| Total Retirement Plan Administration and Services Fees | | | $5,081 |
(1) Effective October 1, 2005, MFS has contractually agreed to waive a portion of the retirement plan | |
| administration and services fee equal to 0.10% for Class R1 shares, 0.15% for Class R2 shares, and 0.10% |
| for Class R3 shares. This agreement will continue until at least September 30, 2007. For the six months |
| ended February 28, 2006, this waiver amounted to $1,475 and is reflected as a reduction of total expenses |
| in the Statement of Operations. | | | |
Trustees’ and Officers’ Compensation – The fund pays compensation to Independent Trustees in the form of a retainer, attendance fees, and additional compensation to Board and Committee chairpersons. The fund does not pay compensation directly to Trustees who are officers of the investment adviser, or to officers of the fund, all of whom receive remuneration for their services to the fund from MFS. Certain officers and Trustees of the fund are officers or directors of MFS, MFD, and MFSC. The fund has an unfunded, defined benefit plan for retired Independent Trustees which resulted in a pension expense of $3,719. This amount is included in Independent trustees’ compensation for the six months ended February 28, 2006. The deferred liability for retirement
SEMIANNUAL REPORT 27
Notes to Financial Statements (unaudited) – continued
benefits payable to retired Trustees amounted to $31,541 at February 28, 2006, and is included in payable for independent trustees’ compensation.
Other – This fund and certain other MFS funds (the funds) have entered into a services agreement (the Agreement) which provides for payment of fees by the funds to Tarantino LLC in return for the provision of services of an Independent Chief Compliance Officer (ICCO) for the funds. The ICCO is an officer of the funds and the sole member of Tarantino LLC. The funds can terminate the Agreement with Tarantino LLC at any time under the terms of the Agreement. For the six months ended February 28, 2006, the fee paid to Tarantino LLC was $1,749. MFS has agreed to reimburse the fund for a portion of the payments made by the funds to Tarantino LLC in the amount of $1,263 which is shown as a reduction of total expenses in the Statement of Operations. Additionally, MFS has agreed to bear all expenses associated with office space, other administrative support, and supplies provided to the ICCO.
(4) Portfolio Securities
Purchases and sales of money market investments, exclusive of securities subject to repurchase agreements, aggregated $3,166,829,565 and $3,229,143,694 respectively.
(5) Shares of Beneficial Interest
The fund’s Declaration of Trust permits the Trustees to issue an unlimited number of full and fractional shares of beneficial interest. Transactions in fund shares were as follows:
| | | Six months ended | Year ended |
| | | 2/28/06 | 8/31/05(i) |
| | | Shares & Amount | Shares & Amount |
| Shares sold | | |
| Class A | $59,178,297 | $104,034,506 |
| Class B | 68,763,735 | 176,379,353 |
| Class C | 27,266,597 | 63,564,664 |
| Class R1 | 1,088,620 | 258,123 |
| Class R2 | 392,784 | 602,796 |
| Class R3 | 1,799,989 | 1,396,398 |
| Class R4 | 257,622 | 50,351 |
| Class R5 | — | 50,000 |
| Class 529A | 257,326 | 1,245,514 |
| Class 529B | 6,840 | 34,497 |
| Class 529C | 43,493 | 228,402 |
|
| | | $159,055,303 | $347,844,604 |
|
28 SEMIANNUAL REPORT | | |
| Notes to Financial Statements (unaudited) – continued | |
| | | Six months ended | Year ended |
| | | 2/28/06 | 8/31/05(i) |
| | | Shares & Amount | Shares & Amount |
| Shares issued to shareholders in reinvestment | | |
| of distributions | | |
| Class A | $1,540,042 | $1,774,925 |
| Class B | 3,082,513 | 3,276,541 |
| Class C | 559,822 | 565,746 |
| Class R1 | 7,392 | 532 |
| Class R2 | 12,331 | 1,030 |
| Class R3 | 21,968 | 2,853 |
| Class R4 | 2,048 | 465 |
| Class R5 | 892 | 528 |
| Class 529A | 27,678 | 29,689 |
| Class 529B | 4,011 | 3,062 |
| Class 529C | 6,853 | 5,296 |
|
| | | $5,265,550 | $5,660,667 |
| Shares reacquired | | |
| Class A | $(60,177,463) | $(115,931,387) |
| Class B | (127,314,729) | (329,138,495) |
| Class C | (33,163,623) | (98,129,128) |
| Class R1 | (566,176) | (485) |
| Class R2 | (49,064) | (25) |
| Class R3 | (1,046,497) | (220,170) |
| Class R4 | (89,133) | (246) |
| Class 529A | (231,492) | (764,907) |
| Class 529B | (11,181) | (36,419) |
| Class 529C | (114,180) | (263,386) |
|
| | | $(222,763,538) | $(544,484,648) |
|
| | |
SEMIANNUAL REPORT 29 |
| Notes to Financial Statements (unaudited) – continued | |
| | | Six months ended | Year ended |
| | | 2/28/06 | 8/31/05(i) |
| | | Shares & Amount | Shares & Amount |
| Net change | | |
| Class A | $540,876 | $(10,121,956) |
| Class B | (55,468,481) | (149,482,601) |
| Class C | (5,337,204) | (33,998,718) |
| Class R1 | 529,836 | 258,170 |
| Class R2 | 356,051 | 603,801 |
| Class R3 | 775,460 | 1,179,081 |
| Class R4 | 170,537 | 50,570 |
| Class R5 | 892 | 50,528 |
| Class 529A | 53,512 | 510,296 |
| Class 529B | (330) | 1,140 |
| Class 529C | (63,834) | (29,688) |
|
| | | $(58,442,685) | $(190,979,377) |
| (i) For the period from the class’ inception, April 1, 2005 (Classes R1, R2, R3, R4, and R5) through |
| the stated period end. | | |
(6) Line of Credit
The fund and other affiliated funds participate in a $1 billion unsecured line of credit provided by a syndication of banks under a credit agreement. Borrowings may be made for temporary financing needs. Interest is charged to each fund, based on its borrowings, at a rate equal to the Federal Reserve funds rate plus 0.35% . In addition, a commitment fee, based on the average daily, unused portion of the line of credit, is allocated among the participating funds at the end of each calendar quarter. The commitment fee allocated to the fund for the six months ended February 28, 2006 was $599, and is included in miscellaneous expense on the Statement of Operations. The fund had no significant borrowings during the six months ended February 28, 2006.
30 SEMIANNUAL REPORT
BOARD REVIEW OF INVESTMENT ADVISORY AGREEMENT
A discussion regarding the Board’s most recent review and renewal of the Fund’s investment advisory agreement is available by clicking on the fund’s name under ‘‘Select a fund’’ on the MFS Web site (mfs.com).
PROXY VOTING POLICIES AND INFORMATION
A general description of the MFS funds’ proxy voting policies and procedures is available without charge, upon request, by calling 1-800-225-2606, by visiting the Proxy Voting section of mfs.com or by visiting the SEC’s Web site at http://www.sec.gov.
Information regarding how the fund voted proxies relating to portfolio securities during the most recent twelve-month period ended June 30 is available without charge by visiting the Proxy Voting section of mfs.com or by visiting the SEC’s Web site at http://www.sec.gov.
QUARTERLY PORTFOLIO DISCLOSURE
The trust will file a complete schedule of portfolio holdings with the Securities and Exchange Commission (the Commission) for the first and third quarters of each fiscal year on Form N-Q. The trust’s Form N-Q may be reviewed and copied at the:
Public Reference Room
Securities and Exchange Commission
Washington, D.C. 20549-0102
Information on the operation of the Public Reference Room may be obtained by calling the Commission at 1-800-SEC-0330. The trust’s Form N-Q is available on the EDGAR database on the Commission’s Internet Web site at http://www.sec.gov, and copies of this information may be obtained, upon payment of a duplicating fee, by electronic request at the following e-mail address: publicinfo@sec.gov or by writing the Public Reference Section at the above address.
A shareholder can also obtain the quarterly portfolio holdings report at mfs.com.
SEMIANNUAL REPORT 31
LETTER FROM THE CEO

Dear Shareholders,
It has been said that change is the only constant in life. As investors have seen, that theme is still accurate today as we recently have experienced shifting economic cycles because of natural disasters and political instability around the globe.
Markets worldwide have fluctuated in the past year as devastating hurricanes had a dramatic effect on the international economy, particularly on oil prices. We witnessed political unrest in the Middle East, highlighted by instability in Iraq, and in Africa, the usually stable Nigeria also experienced violence. As a result, energy prices have bounced up and down, with crude oil prices at one point topping a record $70 per barrel.
Such cycles are not uncommon and in fact have almost become the norm in our everyday lives. What does all of this mean to you as an investor? In times like these, it helps to know that you’re working with a seasoned investment professional who has experience to guide you through difficult times. At MFS®, we believe our investment management team has the knowledge and confidence to navigate through difficult cycles and at the same time see through adversity to find investment opportunities for our clients and shareholders.
Our investment management process, honed over 80 years, combines a unique concept of teamwork with our unwavering focus on the long term. We firmly believe that the best way to realize long-term financial goals – be it a college education, a comfortable retirement, or a secure family legacy – is to follow a three-pronged approach that focuses on longer time horizons. Allocate holdings across the major asset classes – including stocks, bonds, and cash. Diversify within each class to take advantage of different market segments and investing styles. Rebalance assets regularly to maintain a desired asset allocation. Of course, these strategies cannot guarantee a profit or protect against a loss. This long-term approach requires diligence and patience, two traits that in our experience are essential to capitalizing on the many opportunities the financial markets can offer – through both up and down economic cycles.
Respectfully,

Robert J. Manning
Chief Executive Officer and Chief Investment Officer
MFS Investment Management®
April 17, 2006
The opinions expressed in this letter are those of MFS, and no forecasts can be guaranteed.
|
SEMIANNUAL REPORT 1
PORTFOLIO COMPOSITION

| Top ten holdings | |
| Bank of America Corp. | 2.8% |
|
|
| Exxon Mobil Corp. | 2.2% |
|
|
| General Electric Co. | 2.0% |
|
|
| Altria Group, Inc. | 2.0% |
|
|
| Wyeth | 2.0% |
|
|
| Amerada Hess Corp. | 2.0% |
|
|
| SanDisk Corp. | 1.8% |
|
|
| Sprint Nextel Corp. | 1.7% |
|
|
| Chevron Corp. | 1.7% |
|
|
| Golden West Financial Corp. | 1.5% |
|
|
| Equity market sectors | |
| Financial Services | 21.5% |
|
|
| Technology | 15.2% |
|
|
| Health Care | 13.4% |
|
|
| Energy | 9.1% |
|
|
| Industrial Goods & Services | 6.9% |
|
|
| Utilities & Communications | 6.4% |
|
|
| Consumer Staples | 6.2% |
|
|
| Retailing | 5.9% |
|
|
| Basic Materials | 5.5% |
|
|
| Leisure | 4.6% |
|
|
| Transportation | 1.8% |
|
|
| Autos & Housing | 1.5% |
|
|
| Special Products & Services | 1.3% |
|
|
Percentages are based on net assets as of 2/28/06.
The portfolio is actively managed, and current holdings may be different.
2 SEMIANNUAL REPORT
|
EXPENSE TABLE
Fund Expenses Borne by the Shareholders During the Period,
September 1, 2005 through February 28, 2006.
As a shareholder of the fund, you incur two types of costs: (1) transaction costs, including sales charges (loads) on certain purchase or redemption payments and redemption fees on certain exchanges and redemptions, and (2) ongoing costs, including management fees; distribution and service (12b-1) fees; and other fund expenses. This example is intended to help you understand your ongoing costs (in dollars) of investing in the fund and to compare these costs with the ongoing costs of investing in other mutual funds.
The example is based on an investment of $1,000 invested at the beginning of the period and held for the entire period September 1, 2005 through February 28, 2006.
Actual Expenses
The first line for each share class in the following table provides information about actual account values and actual expenses. You may use the information in this line, together with the amount you invested, to estimate the expenses that you paid over the period. Simply divide your account value by $1,000 (for example, an $8,600 account value divided by $1,000 = 8.6), then multiply the result by the number in the first line under the heading entitled ‘‘Expenses Paid During Period’’ to estimate the expenses you paid on your account during this period.
Hypothetical Example for Comparison Purposes
The second line for each share class in the following table provides information about hypothetical account values and hypothetical expenses based on the fund’s actual expense ratio and an assumed rate of return of 5% per year before expenses, which is not the fund’s actual return. The hypothetical account values and expenses may not be used to estimate the actual ending account balance or expenses you paid for the period. You may use this information to compare the ongoing costs of investing in the fund and other funds. To do so, compare this 5% hypothetical example with the 5% hypothetical examples that appear in the shareholder reports of the other funds.
Please note that the expenses shown in the table are meant to highlight your ongoing costs only and do not reflect any transactional costs, such as sales charges (loads) or redemption fees. Therefore, the second line for each share class in the table is useful in comparing ongoing costs only, and will not help you determine the relative total costs of owning different funds. In addition, if these transactional costs were included, your costs would have been higher.
SEMIANNUAL REPORT 3
Expense Table – continued
| | | | | | Expenses |
| | | Annualized | Beginning | Ending | Paid During |
| | | Expense | Account Value | Account Value | Period (p) |
| Share Class | | Ratio | 9/01/05 | 2/28/06 | 9/01/05-2/28/06 |
| A | Actual | 1.38% | $1,000.00 | $1,056.10 | $ 7.04 |
| Hypothetical (h) | 1.38% | $1,000.00 | $1,017.95 | $ 6.90 |
| B | Actual | 2.03% | $1,000.00 | $1,052.30 | $10.33 |
| Hypothetical (h) | 2.03% | $1,000.00 | $1,014.73 | $10.14 |
| C | Actual | 2.03% | $1,000.00 | $1,051.90 | $10.33 |
| Hypothetical (h) | 2.03% | $1,000.00 | $1,014.73 | $10.14 |
| I | Actual | 1.04% | $1,000.00 | $1,057.50 | $ 5.31 |
| Hypothetical (h) | 1.04% | $1,000.00 | $1,019.64 | $ 5.21 |
| R | Actual | 1.53% | $1,000.00 | $1,055.20 | $ 7.80 |
| Hypothetical (h) | 1.53% | $1,000.00 | $1,017.21 | $ 7.65 |
| R1 | Actual | 2.17% | $1,000.00 | $1,051.80 | $11.04 |
| Hypothetical (h) | 2.17% | $1,000.00 | $1,014.03 | $10.84 |
| R2 | Actual | 1.80% | $1,000.00 | $1,053.50 | $ 9.16 |
| Hypothetical (h) | 1.80% | $1,000.00 | $1,015.87 | $ 9.00 |
| R3 | Actual | 1.70% | $1,000.00 | $1,054.20 | $ 8.66 |
| Hypothetical (h) | 1.70% | $1,000.00 | $1,016.36 | $ 8.50 |
| R4 | Actual | 1.44% | $1,000.00 | $1,054.90 | $ 7.34 |
| Hypothetical (h) | 1.44% | $1,000.00 | $1,017.65 | $ 7.20 |
| R5 | Actual | 1.14% | $1,000.00 | $1,057.20 | $ 5.81 |
| Hypothetical (h) | 1.14% | $1,000.00 | $1,019.14 | $ 5.71 |
| (h) | 5% class return per year before expenses. |
| (p) | Expenses paid is equal to each class’ annualized expense ratio, as shown above, multiplied by the average account value over the period, multiplied by the number of days in the period, divided by the number of days in the year. Expenses paid do not include any applicable sales charges (loads) or redemption fees. If these transaction costs had been included, your costs would have been higher. |
| |
Effective October 1, 2005 the fund’s Class R1, Class R2, and Class R3 retirement plan administration and services fee was reduced (as described in Note 3 of the Notes to the Financial Statements). Had this fee reduction been in effect through the entire six month period, the annualized expense ratio would have been 2.15%, 1.78%, and 1.68% for Class R1, Class R2, and Class R3, respectively, and the actual expenses paid during the period would have been approximately $10.94, $9.06, and $8.56 for Class R1, Class R2, and Class R3, respectively.
4 SEMIANNUAL REPORT
PORTFOLIO OF INVESTMENTS (unaudited) – 2/28/06
The Portfolio of Investments is a complete list of all securities owned by your fund. It is categorized by broad-based asset classes.
| Stocks - 99.3% | | | |
|
|
|
|
| Issuer | Shares/Par | | Value ($) |
|
|
|
|
| Aerospace - 2.8% | | | |
|
|
|
|
| KVH Industries, Inc. (l)(n) | 50,060 | $ | 525,630 |
| Lockheed Martin Corp. | 23,520 | | 1,713,902 |
| Northrop Grumman Corp. | 23,490 | | 1,505,709 |
| United Technologies Corp. | 56,010 | | 3,276,585 |
| |
|
|
| | | $ | 7,021,826 |
|
|
|
|
| Automotive - 0.7% | | | |
|
|
|
|
| Harley-Davidson, Inc. | 15,340 | $ | 805,503 |
| Johnson Controls, Inc. | 12,050 | | 858,804 |
| |
|
|
| | | $ | 1,664,307 |
|
|
|
|
| Banks & Credit Companies - 13.0% | | | |
|
|
|
|
| American Express Co. | 70,990 | $ | 3,824,941 |
| Bank of America Corp. | 152,054 | | 6,971,676 |
| Bank of New York Co., Inc. | 39,100 | | 1,338,784 |
| Capital One Financial Corp. | 29,080 | | 2,547,408 |
| Countrywide Financial Corp. | 100,700 | | 3,472,136 |
| Golden West Financial Corp. | 54,350 | | 3,860,481 |
| PNC Financial Services Group, Inc. | 48,560 | | 3,416,196 |
| SLM Corp. | 59,690 | | 3,367,113 |
| SunTrust Banks, Inc. | 26,530 | | 1,919,976 |
| Zions Bancorporation | 20,040 | | 1,653,701 |
| |
|
|
| | | $ | 32,372,412 |
|
|
|
| Biotechnology - 1.6% | | | |
|
|
|
|
| Amgen, Inc. (n) | 21,920 | $ | 1,654,741 |
| Gilead Sciences, Inc. (n) | 18,610 | | 1,158,845 |
| Neurochem, Inc. (n) | 74,250 | | 1,115,235 |
| |
|
|
| | | $ | 3,928,821 |
|
|
|
|
| Broadcast & Cable TV - 2.5% | | | |
|
|
|
|
| ADVO, Inc. (l) | 34,200 | $ | 1,099,530 |
| CBS Corp., ‘‘B’’ | 18,570 | | 454,222 |
| Sirius Satellite Radio, Inc. (l)(n) | 87,298 | | 446,093 |
| Viacom, Inc., ‘‘B’’ (n) | 11,880 | | 474,725 |
| Walt Disney Co. | 79,700 | | 2,230,803 |
| XM Satellite Radio Holdings, Inc., ‘‘A’’ (n) | 66,610 | | 1,471,415 |
| |
|
|
| | | $ | 6,176,788 |
|
|
|
|
| Brokerage & Asset Managers - 2.8% | | | |
|
|
|
|
| Affiliated Managers Group, Inc. (l)(n) | 7,050 | $ | 693,932 |
| Franklin Resources, Inc. | 4,880 | | 501,078 |
| Goldman Sachs Group, Inc. | 17,310 | | 2,445,730 |
SEMIANNUAL REPORT 5
Portfolio of Investments (unaudited) – continued
| Issuer | Shares/Par | | | Value ($) |
|
|
|
|
| Stocks - continued | | | | |
|
|
|
|
| Brokerage & Asset Managers - continued | | | | |
|
|
|
|
| Legg Mason, Inc. | 15,860 | | $ | 2,071,157 |
| MarketAxess Holdings, Inc. (l)(n) | 90,600 | | | 1,191,390 |
| | |
|
|
| | | | $ | 6,903,287 |
|
|
|
|
| Business Services - 1.1% | | | | |
|
|
|
|
| Accenture Ltd., ‘‘A’’ | 58,780 | | $ | 1,919,755 |
| Getty Images, Inc. (n) | 6,560 | | | 531,557 |
| Monster Worldwide, Inc. (n) | 8,260 | | | 404,410 |
| | |
|
|
| | | | $ | 2,855,722 |
|
|
|
|
| Chemicals - 3.1% | | | | |
|
|
|
|
| E.I. du Pont de Nemours & Co. | 27,590 | | $ | 1,110,222 |
| Monsanto Co. | 44,470 | | | 3,730,144 |
| Rohm & Haas Co. | 17,000 | | | 845,750 |
| Scotts Miracle-Gro Co. | 44,050 | | | 2,109,555 |
| | |
|
|
| | | | $ | 7,795,671 |
|
|
|
|
| Computer Software - 3.5% | | | | |
|
|
|
|
| Adobe Systems, Inc. | 32,170 | | $ | 1,242,405 |
| MicroStrategy, Inc., ‘‘A’’ (n) | 37,470 | | | 3,435,250 |
| Oracle Corp. (n) | 102,450 | | | 1,272,429 |
| TIBCO Software, Inc. (n) | 318,620 | | | 2,762,435 |
| | |
|
|
| | | | $ | 8,712,519 |
|
|
|
|
| Computer Software - Systems - 2.5% | | | | |
|
|
|
|
| Apple Computer, Inc. (n) | 28,600 | | $ | 1,960,244 |
| Dell, Inc. (n) | 87,210 | | | 2,529,090 |
| International Business Machines Corp. | 14,890 | | | 1,194,774 |
| PAR Technology Corp. (l)(n) | 35,100 | | | 631,800 |
| | |
|
|
| | | | $ | 6,315,908 |
|
|
|
|
| Construction - 0.7% | | | | |
|
|
|
|
| D.R. Horton, Inc. | 17,490 | | $ | 596,584 |
| Masco Corp. | 33,410 | | | 1,042,058 |
| | |
|
|
| | | | $ | 1,638,642 |
|
|
|
|
| Consumer Goods & Services - 2.0% | | | | |
|
|
|
|
| Avon Products, Inc. | 72,600 | | $ | 2,094,510 |
| Estee Lauder Cos., Inc., ‘‘A’’ | 59,740 | | | 2,235,471 |
| ITT Educational Services, Inc. (n) | 9,370 | | | 580,940 |
| | |
|
|
| | | | $ | 4,910,921 |
|
|
|
|
| Electrical Equipment - 3.1% | | | | |
|
|
|
|
| General Electric Co. | 154,990 | | $ | 5,094,521 |
| Rockwell Automation, Inc. | 23,700 | | | 1,615,629 |
| Tyco International Ltd. | 44,940 | | | 1,159,003 |
| | |
|
|
| | | | $ | 7,869,153 |
|
|
|
|
6 SEMIANNUAL REPORT
Portfolio of Investments (unaudited) – continued
| Issuer | Shares/Par | | | Value ($) |
|
|
|
|
| Stocks - continued | | | | |
|
|
|
|
| Electronics - 3.7% | | | | |
|
|
|
|
| Applied Materials, Inc. | 47,460 | | $ | 870,416 |
| Intel Corp. | 157,200 | | | 3,238,320 |
| SanDisk Corp. (n) | 73,750 | | | 4,450,075 |
| Varian Semiconductor Equipment Associates, Inc. (n) | 13,850 | | | 653,166 |
| | |
|
|
| | | | $ | 9,211,977 |
|
| |
|
|
| Energy - Independent - 1.4% | | | | |
|
|
|
|
| Anadarko Petroleum Corp. | 15,400 | | $ | 1,527,064 |
| Apache Corp. | 23,270 | | | 1,557,228 |
| Western Refining, Inc. (n) | 32,500 | | | 527,800 |
| | |
|
|
| | | | $ | 3,612,092 |
|
|
|
|
| Energy - Integrated - 5.9% | | | | |
|
|
|
|
| Amerada Hess Corp. | 36,060 | | $ | 4,987,459 |
| Chevron Corp. | 74,330 | | | 4,198,158 |
| Exxon Mobil Corp. | 92,852 | | | 5,512,623 |
| | |
|
|
| | | $ | 14,698,240 |
|
|
|
| Food & Drug Stores - 0.9% | | | | |
|
|
|
|
| CVS Corp. | 57,430 | | $ | 1,626,992 |
| Kroger Co. (n) | 30,590 | | | 613,024 |
| | |
|
|
| | | | $ | 2,240,016 |
|
|
|
|
| Food & Non-Alcoholic Beverages - 2.4% | | | | |
|
| |
|
|
| Coca-Cola Co. | 44,010 | | $ | 1,847,100 |
| Diamond Foods, Inc. (l) | 34,490 | | | 710,494 |
| General Mills, Inc. | 12,360 | | | 608,730 |
| PepsiCo, Inc. | 49,559 | | | 2,929,432 |
| | |
|
|
| | | | $ | 6,095,756 |
|
|
|
|
| Forest & Paper Products - 0.5% | | | | |
|
|
|
|
| Abitibi-Consolidated, Inc. | 336,440 | | $ | 1,174,176 |
|
|
|
|
| Furniture & Appliances - 0.1% | | | | |
|
|
|
|
| Tempur-Pedic International, Inc. (l)(n) | 29,840 | | $ | 352,112 |
|
|
|
|
| Gaming & Lodging - 0.8% | | | | |
|
|
|
|
| Boyd Gaming Corp. | 5,630 | | $ | 246,200 |
| Carnival Corp. | 4,600 | | | 237,590 |
| Hilton Hotels Corp. | 10,190 | | | 246,598 |
| International Game Technology | 8,630 | | | 308,695 |
| Starwood Hotels & Resorts Worldwide, Inc. | 3,160 | | | 200,660 |
| Station Casinos, Inc. | 11,160 | | | 763,902 |
| | |
|
|
| | | | $ | 2,003,645 |
|
|
|
|
SEMIANNUAL REPORT 7
Portfolio of Investments (unaudited) – continued
| Issuer | Shares/Par | | | Value ($) |
|
|
|
|
| Stocks - continued | | | | |
|
|
|
|
| General Merchandise - 1.9% | | | | |
|
|
|
|
| Kohl’s Corp. (n) | 21,180 | | $ | 1,018,970 |
| Wal-Mart Stores, Inc. | 80,490 | | | 3,651,026 |
| | |
|
|
| | | | $ | 4,669,996 |
|
|
|
|
| Health Maintenance Organizations - 1.6% | | | | |
|
|
|
|
| Health Net, Inc. (n) | 42,620 | | $ | 2,043,629 |
| WellPoint, Inc. (n) | 25,280 | | | 1,941,251 |
| | |
|
|
| | | | $ | 3,984,880 |
|
|
|
|
| Insurance - 4.9% | | | | |
|
|
|
|
| Ace Ltd. | 50,350 | | $ | 2,806,006 |
| Chubb Corp. | 22,590 | | | 2,162,993 |
| Genworth Financial, Inc., ‘‘A’’ | 80,130 | | | 2,549,737 |
| MetLife, Inc. | 30,600 | | | 1,533,672 |
| St. Paul Travelers Cos., Inc. | 45,430 | | | 1,952,581 |
| XL Capital Ltd., ‘‘A’’ | 17,830 | | | 1,204,417 |
| | |
|
|
| | | $ | 12,209,406 |
|
|
|
| Internet - 1.2% | | | | |
|
|
|
|
| Google, Inc., ‘‘A’’ (n) | 5,410 | | $ | 1,961,774 |
| Yahoo!, Inc. (n) | 28,880 | | | 925,893 |
| | |
|
|
| | | | $ | 2,887,667 |
|
|
|
|
| Leisure & Toys - 0.3% | | | | |
|
|
|
|
| Activision, Inc. (n) | 24,080 | | $ | 301,000 |
| Electronic Arts, Inc. (n) | 8,770 | | | 455,777 |
| | |
|
|
| | | | $ | 756,777 |
|
|
|
|
| Machinery & Tools - 0.8% | | | | |
|
|
|
|
| Caterpillar, Inc. | 15,310 | | $ | 1,118,855 |
| Illinois Tool Works, Inc. | 10,730 | | | 921,063 |
| | |
|
|
| | | | $ | 2,039,918 |
|
|
|
|
| Medical & Health Technology & Services - 1.0% | | | | |
|
|
|
|
| Allion Healthcare, Inc. (l)(n) | 38,140 | | $ | 631,217 |
| Caremark Rx, Inc. (n) | 40,030 | | | 1,991,493 |
| | |
|
|
| | | | $ | 2,622,710 |
|
|
|
|
| Medical Equipment - 3.2% | | | | |
|
|
|
|
| Aspect Medical Systems, Inc. (l)(n) | 22,520 | | $ | 603,311 |
| C.R. Bard, Inc. | 24,480 | | | 1,603,195 |
| DENTSPLY International, Inc. | 32,020 | | | 1,824,820 |
| Medtronic, Inc. | 38,720 | | | 2,088,944 |
| Millipore Corp. (n) | 9,450 | | | 655,169 |
| Zimmer Holdings, Inc. (n) | 18,360 | | | 1,270,145 |
| | |
|
|
| | | | $ | 8,045,584 |
|
|
|
|
8 SEMIANNUAL REPORT
Portfolio of Investments (unaudited) – continued
| Issuer | Shares/Par | | | Value ($) |
|
|
|
|
| Stocks - continued | | | | |
|
|
|
|
| Metals & Mining - 0.9% | | | | |
|
|
|
|
| Aber Diamond Corp. (a) | 11,490 | | $ | 433,490 |
| Companhia Vale do Rio Doce, ADR | 37,310 | | | 1,732,303 |
| | |
|
|
| | | | $ | 2,165,793 |
|
|
|
|
| Natural Gas - Pipeline - 0.5% | | | | |
|
|
|
|
| Williams Cos., Inc. | 61,700 | | $ | 1,330,869 |
|
|
|
|
| Network & Telecom - 2.5% | | | | |
|
|
|
|
| Corning, Inc. (n) | 56,230 | | $ | 1,372,574 |
| Juniper Networks, Inc. (n) | 144,640 | | | 2,659,930 |
| NICE Systems Ltd., ADR (n) | 20,500 | | | 1,067,230 |
| Research In Motion Ltd. (n) | 14,720 | | | 1,038,202 |
| | |
|
|
| | | | $ | 6,137,936 |
|
|
|
|
| Oil Services - 1.8% | | | | |
|
|
|
|
| GlobalSantaFe Corp. | 32,560 | | $ | 1,801,870 |
| Hercules Offshore, Inc. (l)(n) | 17,430 | | | 529,872 |
| National Oilwell Varco, Inc. (n) | 14,130 | | | 860,234 |
| Noble Corp. | 10,550 | | | 779,751 |
| Transocean, Inc. (n) | 8,340 | | | 618,661 |
| | |
|
|
| | | | $ | 4,590,388 |
|
|
|
|
| Personal Computers & Peripherals - 1.8% | | | | |
|
|
|
|
| EMC Corp. (n) | 177,120 | | $ | 2,483,222 |
| M-Systems Flash Disk Pioneers Ltd. (l)(n) | 19,970 | | | 539,190 |
| Network Appliance, Inc. (l)(n) | 40,960 | | | 1,358,234 |
| | |
|
|
| | | | $ | 4,380,646 |
|
|
|
|
| Pharmaceuticals - 6.0% | | | | |
|
|
|
|
| Abbott Laboratories | 45,180 | | $ | 1,996,052 |
| Allergan, Inc. | 14,840 | | | 1,606,578 |
| Eli Lilly & Co. | 59,600 | | | 3,314,952 |
| Johnson & Johnson | 50,820 | | | 2,929,773 |
| Wyeth | 101,210 | | | 5,040,258 |
| | |
|
|
| | | $ | 14,887,613 |
|
|
|
| Pollution Control - 0.2% | | | | |
|
|
|
|
| Waste Management, Inc. | 12,980 | | $ | 431,715 |
|
|
|
|
| Printing & Publishing - 0.2% | | | | |
|
|
|
|
| Washington Post Co., ‘‘B’’ (l) | 560 | | $ | 421,260 |
|
|
|
|
| Railroad & Shipping - 1.2% | | | | |
|
|
|
|
| Norfolk Southern Corp. | 59,060 | | $ | 3,022,691 |
|
|
|
|
SEMIANNUAL REPORT 9
Portfolio of Investments (unaudited) – continued
| Issuer | Shares/Par | | | Value ($) |
|
|
|
|
| Stocks - continued | | | | |
|
|
|
|
| Real Estate - 0.8% | | | | |
|
|
|
|
| Boston Properties, Inc. | 18,890 | | $ | 1,599,416 |
| HomeBanc Corp. (l) | 59,400 | | | 516,780 |
| | |
|
|
| | | | $ | 2,116,196 |
|
|
|
|
| Restaurants - 0.8% | | | | |
|
|
|
|
| P.F. Chang’s China Bistro, Inc. (l)(n) | 41,680 | | $ | 2,014,811 |
|
|
|
|
| Specialty Chemicals - 1.0% | | | | |
|
|
|
|
| Praxair, Inc. | 46,060 | | $ | 2,486,319 |
|
| |
|
|
| Specialty Stores - 3.1% | | | | |
|
|
|
|
| A.C. Moore Arts & Crafts, Inc. (l)(n) | 24,770 | | $ | 445,860 |
| Aeropostale, Inc. (n) | 22,410 | | | 642,943 |
| Home Depot, Inc. | 59,840 | | | 2,522,256 |
| PETsMART, Inc. | 95,240 | | | 2,472,430 |
| Urban Outfitters, Inc. (n) | 25,350 | | | 712,335 |
| Williams-Sonoma, Inc. (n) | 23,320 | | | 944,227 |
| | |
|
|
| | | | $ | 7,740,051 |
|
|
|
|
| Telecommunications - Wireless - 0.5% | | | | |
|
|
|
|
| Vodafone Group PLC, ADR | 64,392 | | $ | 1,244,053 |
|
|
|
|
| Telephone Services - 2.3% | | | | |
|
| |
|
|
| CenturyTel, Inc. (l) | 22,480 | | $ | 808,830 |
| Sprint Nextel Corp. | 176,310 | | | 4,236,729 |
| Syniverse Holdings, Inc. (l)(n) | 43,320 | | | 619,476 |
| | |
|
|
| | | | $ | 5,665,035 |
|
|
|
|
| Tobacco - 2.0% | | | | |
|
|
|
|
| Altria Group, Inc. | 70,230 | | $ | 5,049,537 |
|
|
|
|
| Trucking - 0.6% | | | | |
|
|
|
|
| CNF, Inc. | 29,180 | | $ | 1,464,252 |
|
| |
|
|
| Utilities - Electric Power - 3.1% | | | | |
|
|
|
|
| AES Corp. (n) | 21,210 | | $ | 366,933 |
| CMS Energy Corp. (l)(n) | 86,620 | | | 1,219,610 |
| Constellation Energy Group, Inc. | 22,910 | | | 1,345,729 |
| Dominion Resources, Inc. | 8,400 | | | 630,840 |
| Exelon Corp. | 24,710 | | | 1,411,188 |
| NRG Energy, Inc. (n) | 25,920 | | | 1,121,040 |
| PPL Corp. | 22,220 | | | 706,596 |
| TXU Corp. | 16,850 | | | 882,772 |
| | |
|
|
| | | | $ | 7,684,708 |
|
|
|
|
| Total Stocks (Identified Cost, $226,597,673) | | | $ | 247,604,802 |
|
|
|
10 SEMIANNUAL REPORT
| Portfolio of Investments (unaudited) – continued | | | | |
Short-Term Obligation - 0.6% | | | | |
|
|
|
|
| Issuer | Shares/Par | | | Value ($) |
|
|
|
|
| General Electric Capital Corp., 4.56%, due 3/01/06, | | | | |
| at Amortized Cost (y) | $ 1,436,000 | | $ | 1,436,000 |
|
|
|
|
| Collateral for Securities Loaned - 4.9% | | | | |
|
|
|
|
| Navigator Securities Lending Prime Portfolio, at Cost and | | | | |
| Net Asset Value | 12,204,828 | | $ | 12,204,828 |
|
|
|
|
| Total Investments (Identified Cost, $240,238,501) (k) | | | $261,245,630 |
|
|
|
| Other Assets, Less Liabilities - (4.8)% | | | | (11,962,639) |
|
|
|
|
| Net Assets - 100.0% | | | $ | 249,282,991 |
|
|
|
| (a) | SEC Rule 144A restriction. |
| (n) | Non-income producing security. |
| (l) | All or a portion of this security is on loan. |
| (y) | The rate shown represents an annualized yield at time of purchase. |
| (k) | As of February 28, 2006, the fund had one security representing $433,490 and 0.17% of net assets that |
| | was fair valued in accordance with the policies adopted by the Board of Trustees. |
The following abbreviation is used in the Portfolio of Investments and is defined: |
| ADR American Depository Receipt |
See Notes to Financial Statements
SEMIANNUAL REPORT 11
FINANCIAL STATEMENTS | Statement of Assets and Liabilities (unaudited)
This statement represents your fund’s balance sheet, which details the assets and liabilities composing the total value of the fund.
At 2/28/06
| Assets | | |
|
|
|
| Investments, at value, including $11,883,885 of securities on loan | | |
| (identified cost, $240,238,501) | $261,245,630 | |
| Cash | 590 | |
| Receivable for investments sold | 1,002,910 | |
| Receivable for fund shares sold | 309,358 | |
| Interest and dividends receivable | 327,267 | |
| Due from investment adviser | 26,376 | |
| Other assets | 720 | |
|
|
|
| Total assets | | $262,912,851 |
|
|
|
| Liabilities | | |
|
|
|
| Payable for investments purchased | $1,006,169 | |
| Payable for fund shares reacquired | 249,515 | |
| Collateral for securities loaned, at value | 12,204,828 | |
| Payable to affiliates | | |
| Management fee | 4,496 | |
| Shareholder servicing costs | 28,092 | |
| Distribution and service fees | 3,883 | |
| Administrative services fee | 96 | |
| Retirement plan administration and services fees | 18 | |
| Payable for independent trustees’ compensation | 37,853 | |
| Accrued expenses and other liabilities | 94,910 | |
|
|
|
| Total liabilities | | $13,629,860 |
|
|
|
| Net assets | | $249,282,991 |
|
|
|
| Net assets consist of: | | |
|
|
|
| Paid-in capital | $219,726,193 | |
| Unrealized appreciation (depreciation) on investments and | | |
| translation of assets and liabilities in foreign currencies | 21,007,179 | |
| Accumulated net realized gain (loss) on investments and foreign | | |
| currency transactions | 8,708,332 | |
| Accumulated net investment loss | (158,713) | |
|
|
|
| Net assets | | $249,282,991 |
|
|
|
| Shares of beneficial interest outstanding | | 14,062,152 |
|
|
|
| Class A shares | | |
|
|
|
| Net assets | $154,338,778 | |
| Shares outstanding | 8,548,119 | |
|
|
|
| Net asset value per share | | $18.06 |
|
|
|
| Offering price per share (100/94.25 of net asset value per share) | | $19.16 |
|
|
|
12 SEMIANNUAL REPORT
Statement of Assets and Liabilities (unaudited) – continued
| Class B shares | | |
|
|
|
| Net assets | $62,384,512 | |
| Shares outstanding | 3,648,301 | |
|
|
|
| Net asset value and offering price per share | | $17.10 |
|
|
|
| Class C shares | | |
|
|
|
| Net assets | $19,076,891 | |
| Shares outstanding | 1,119,984 | |
|
|
|
| Net asset value and offering price per share | | $17.03 |
|
|
|
| Class I shares | | |
|
|
|
| Net assets | $4,008,110 | |
| Shares outstanding | 215,942 | |
|
|
|
| Net asset value, offering price, and redemption price per share | | $18.56 |
|
|
|
| Class R shares | | |
|
|
|
| Net assets | $5,909,101 | |
| Shares outstanding | 329,011 | |
|
|
|
| Net asset value, offering price, and redemption price per share | | $17.96 |
|
|
|
| Class R1 shares | | |
|
|
|
| Net assets | $177,856 | |
| Shares outstanding | 10,421 | |
|
|
|
| Net asset value, offering price, and redemption price per share | | $17.07 |
|
|
|
| Class R2 shares | | |
|
|
|
| Net assets | $667,585 | |
| Shares outstanding | 38,985 | |
|
|
|
| Net asset value, offering price, and redemption price per share | | $17.12 |
|
|
|
| Class R3 shares | | |
|
|
|
| Net assets | $1,229,191 | |
| Shares outstanding | 68,762 | |
|
|
|
| Net asset value, offering price, and redemption price per share | | $17.88 |
|
|
|
| Class R4 shares | | |
|
|
|
| Net assets | $1,435,390 | |
| Shares outstanding | 79,556 | |
|
|
|
| Net asset value, offering price, and redemption price per share | | $18.04 |
|
|
|
| Class R5 shares | | |
|
|
|
| Net assets | $55,577 | |
| Shares outstanding | 3,071 | |
|
|
|
| Net asset value, offering price, and redemption price per share | | $18.10 |
|
|
|
On sales of $50,000 or more, the offering price of Class A shares is reduced. A contingent deferred sales charge may be imposed on redemptions of Class A, Class B and Class C shares.
See Notes to Financial Statements
SEMIANNUAL REPORT 13
FINANCIAL STATEMENTS | Statement of Operations (unaudited)
This statement describes how much your fund earned in investment income and accrued in expenses. It also describes any gains and/or losses generated by fund operations.
Six months ended 2/28/06
| Net investment loss | | |
|
|
|
| Income | | |
| Dividends | $1,761,835 | |
| Interest | 71,110 | |
| Foreign taxes withheld | (4,739) | |
|
|
|
| Total investment income | | $1,828,206 |
|
|
|
| Expenses | | |
| Management fee | $793,632 | |
| Distribution and service fees | 702,239 | |
| Shareholder servicing costs | 213,545 | |
| Administrative services fee | 16,018 | |
| Retirement plan administration and services fees | 2,359 | |
| Independent trustees’ compensation | 6,125 | |
| Custodian fee | 42,448 | |
| Shareholder communications | 34,520 | |
| Auditing fees | 25,422 | |
| Legal fees | 4,881 | |
| Registration fees | 102,378 | |
| Miscellaneous | 19,741 | |
|
|
|
| Total expenses | | $1,963,308 |
|
|
|
| Fees paid indirectly | (10,953) | |
| Reduction of expenses by investment adviser | (1,427) | |
|
|
|
| Net expenses | | $1,950,928 |
|
|
|
| Net investment loss | | $(122,722) |
|
|
|
| Realized and unrealized gain (loss) on investments | | |
|
|
|
| Realized gain (loss) (identified cost basis) | | |
| Investment transactions | $13,339,545 | |
| Foreign currency transactions | 80 | |
|
|
|
| Net realized gain (loss) on investments and foreign | | |
| currency transactions | | $13,339,625 |
|
|
|
| Change in unrealized appreciation (depreciation) | | |
| Investments | $(170,121) | |
| Translation of assets and liabilities in foreign currencies | (56) | |
|
|
|
| Net unrealized gain (loss) on investments and foreign | | |
| currency translation | | $(170,177) |
|
|
|
| Net realized and unrealized gain (loss) on investments and | | |
| foreign currency | | $13,169,448 |
|
|
|
| Change in net assets from operations | | $13,046,726 |
|
|
|
| See Notes to Financial Statements | | |
14 SEMIANNUAL REPORT | | |
FINANCIAL STATEMENTS | Statements of Changes in Net Assets
These statements describe the increases and/or decreases in net assets resulting from operations, any distributions, and any shareholder transactions.
| | Six months ended | Year ended |
| | 2/28/06 | 8/31/05 |
| | (unaudited) | |
| Change in net assets | | |
|
|
|
| From operations | | |
|
|
|
| Net investment loss | $(122,722) | $(243,156) |
| Net realized gain (loss) on investments and foreign | | |
| currency transactions | 13,339,625 | 17,758,149 |
| Net unrealized gain (loss) on investments and foreign | | |
| currency translation | (170,177) | 9,020,319 |
|
|
|
| Change in net assets from operations | $13,046,726 | $26,535,312 |
|
|
|
| Distributions declared to shareholders | | |
|
|
|
| From net realized gain on investments and foreign currency | | |
| transactions | | |
| Class A | $(6,566,880) | $— |
| Class B | (3,172,185) | — |
| Class C | (835,667) | — |
| Class I | (151,657) | — |
| Class R | (292,512) | — |
| Class R1 | (6,519) | — |
| Class R2 | (2,469) | — |
| Class R3 | (54,898) | — |
| Class R4 | (2,358) | — |
| Class R5 | (2,358) | — |
|
|
|
| Total distributions declared to shareholders | $(11,087,503) | $— |
|
|
|
| Change in net assets from fund share transactions | $6,311,250 | $53,568,852 |
|
|
|
| Redemption fees | $— | $2,690 |
|
|
|
| Total change in net assets | $8,270,473 | $80,106,854 |
|
|
|
| Net assets | | |
|
|
|
| At beginning of period | 241,012,518 | 160,905,664 |
| At end of period (including accumulated net investment loss of | |
| $158,713 and $35,991, respectively) | $249,282,991 | $241,012,518 |
|
|
|
See Notes to Financial Statements
SEMIANNUAL REPORT 15
FINANCIAL STATEMENTS | Financial Highlights
The financial highlights table is intended to help you understand the fund’s financial performance for the semiannual period and the past 5 fiscal years (or life of a particular share class, if shorter). Certain information reflects results for a single fund share. The total returns in the table represent the rate by which an investor would have earned (or lost) on an investment in the fund share class (assuming reinvestment of all distributions) held for the entire period.
| | | | | | |
| Six months | | | |
| | ended | Years ended 8/31 |
| Class A | 2/28/06 | 2005 | 2004 | 2003 | 2002 | 2001 |
| (unaudited) | | | | | |
| Net asset value, beginning of period | $17.88 | $15.35 | $13.97 | $12.51 | $15.15 | $18.82 |
|
|
|
|
|
|
|
| Income (loss) from | | | | | | |
| investment operations | | | | | | |
|
|
|
|
|
|
|
| Net investment income (d) | $0.01 | $0.03 | $0.03 | $0.04 | $0.00(w) | $0.02 |
| Net realized and unrealized | | | | | | |
| gain (loss) on investments and | | | | | | |
| foreign currency | 0.97 | 2.50 | 1.35 | 1.42 | (2.38) | (3.69) |
|
|
|
|
|
|
|
| Total from investment operations | $0.98 | $2.53 | $1.38 | $1.46 | $(2.38) | $(3.67) |
|
|
|
|
|
|
|
| Less distributions declared | | | | | | |
| to shareholders | | | | | | |
|
|
|
|
|
|
|
| From net realized gain on | | | | | | |
| investments and foreign | | | | | | |
| currency transactions | $(0.80) | $— | $— | $— | $(0.26) | $— |
|
|
|
|
|
|
|
| Net asset value, end of period | $18.06 | $17.88 | $15.35 | $13.97 | $12.51 | $15.15 |
|
|
|
|
|
|
|
| Total return (%) (t)(s)(r) | 5.61(n) | 16.48 | 9.88(b) | 11.67 | (16.00) | (19.50) |
|
|
|
|
|
|
|
| Ratios (%) (to average net assets) | | | | | | |
| and Supplemental data: | | | | | | |
|
|
|
|
|
|
|
| Expenses before expense reductions (f) | 1.38(a) | 1.41 | 1.38 | 1.47 | 1.37 | 1.32 |
| Expenses after expense reductions (f) | 1.38(a) | 1.41 | 1.38 | 1.47 | 1.37 | 1.32 |
| Net investment income | 0.13(a) | 0.17 | 0.22 | 0.29 | 0.03 | 0.12 |
| Portfolio turnover | 60 | 81 | 116 | 121 | 100 | 78 |
| Net assets at end of period | | | | | | |
| (000 Omitted) | $154,339 | $141,808 | $67,415 | $53,704 | $50,366 | $63,319 |
|
|
|
|
|
|
|
| See Notes to Financial Statements | | | | | |
16 SEMIANNUAL REPORT
Financial Highlights – continued
| | | | | | | | | | |
| Six months | | | | | | |
| | ended | | Years ended 8/31 |
| Class B | 2/28/06 | | 2005 | | 2004 | | 2003 | | 2002 | | 2001 |
| (unaudited) | | | | | | | | | | |
| Net asset value, beginning of period | $17.03 | | $14.71 | | $13.48 | | $12.14 | | $14.81 | | $18.52 |
|
| Income (loss) from | | | | | | | | | | | |
| investment operations | | | | | | | | | | | |
|
| Net investment loss (d) | $(0.04) | | $(0.08) | | $(0.06) | | $(0.04) | | $(0.09) | | $(0.09) |
| Net realized and unrealized gain (loss) | | | | | | | | | | | |
| on investments and foreign currency | 0.91 | | 2.40 | | 1.29 | | 1.38 | | (2.32) | | (3.62) |
|
| Total from investment operations | $0.87 | | $2.32 | | $1.23 | | $1.34 | | $(2.41) | | $(3.71) |
|
| Less distributions declared | | | | | | | | | | | |
| to shareholders | | | | | | | | | | | |
|
| From net realized gain on investments | | | | | | | | | | | |
| and foreign currency transactions | $(0.80) | | $— | | $— | | $— | | $(0.26) | | $— |
|
| Net asset value, end of period | $17.10 | | $17.03 | | $14.71 | | $13.48 | | $12.14 | | $14.81 |
|
| Total return (%) (t)(s)(r) | 5.23(n) | | 15.77 | | 9.12(b) | | 11.04 | | (16.57) | | (20.03) |
|
| Ratios (%) (to average net assets) | | | | | | | | | | | |
| and Supplemental data: | | | | | | | | | | | |
|
| Expenses before expense reductions (f) | 2.03 | (a) | 2.06 | | 2.02 | | 2.12 | | 2.02 | | 1.97 |
| Expenses after expense reductions (f) | 2.03 | (a) | 2.06 | | 2.02 | | 2.12 | | 2.02 | | 1.97 |
| Net investment loss | (0.52) | (a) | (0.47) | | (0.43) | | (0.36) | | (0.62) | | (0.53) |
| Portfolio turnover | 60 | | 81 | | 116 | | 121 | | 100 | | 78 |
| Net assets at end of period | | | | | | | | | | | |
| (000 Omitted) | $62,385 | | $71,088 | | $73,395 | | $75,007 | | $73,146 | | $91,455 |
|
| See Notes to Financial Statements | | | | | | | | | | | |
SEMIANNUAL REPORT 17
Financial Highlights – continued
| | | | | | | | | | | |
| Six months | | | | | | |
| | ended | | Years ended 8/31 |
| Class C | 2/28/06 | | 2005 | | 2004 | | 2003 | | 2002 | | 2001 |
| (unaudited) | | | | | | | | | | |
| Net asset value, beginning of period | $16.97 | | $14.66 | | $13.43 | | $12.10 | | $14.76 | | $18.46 |
|
| Income (loss) from | | | | | | | | | | | |
| investment operations | | | | | | | | | | | |
|
| Net investment loss (d) | $(0.04) | | $(0.08) | | $(0.06) | | $(0.04) | | $(0.09) | | $(0.09) |
| Net realized and unrealized gain (loss) | | | | | | | | | | | |
| on investments and foreign currency | 0.90 | | 2.39 | | 1.29 | | 1.37 | | (2.31) | | (3.61) |
|
| Total from investment operations | $0.86 | | $2.31 | | $1.23 | | $1.33 | | $(2.40) | | $(3.70) |
|
| Less distributions declared | | | | | | | | | | | |
| to shareholders | | | | | | | | | | | |
|
| From net realized gain on investments | | | | | | | | | | | |
| and foreign currency transactions | $(0.80) | | $— | | $— | | $— | | $(0.26) | | $— |
|
| Net asset value, end of period | $17.03 | | $16.97 | | $14.66 | | $13.43 | | $12.10 | | $14.76 |
|
| Total return (%) (t)(s)(r) | 5.19 | (n) | 15.76 | | 9.16 | (b) | 10.99 | | (16.56) | | (20.04) |
|
| Ratios (%) (to average net assets) | | | | | | | | | | | |
| and Supplemental data: | | | | | | | | | | | |
|
| Expenses before expense reductions (f) | 2.03 | (a) | 2.06 | | 2.02 | | 2.12 | | 2.02 | | 1.97 |
| Expenses after expense reductions (f) | 2.03 | (a) | 2.06 | | 2.02 | | 2.12 | | 2.02 | | 1.97 |
| Net investment loss | (0.53) | (a) | (0.48) | | (0.43) | | (0.35) | | (0.62) | | (0.52) |
| Portfolio turnover | 60 | | 81 | | 116 | | 121 | | 100 | | 78 |
| Net assets at end of period | | | | | | | | | | | |
| (000 Omitted) | $19,077 | | $17,898 | | $15,990 | | $15,325 | | $17,521 | | $22,081 |
|
| See Notes to Financial Statements | | | | | | | | | | | |
18 SEMIANNUAL REPORT
Financial Highlights – continued
| | | | | | | | | | |
| Six months | | | | | | |
| | ended | | Years ended 8/31 |
| Class I | 2/28/06 | | 2005 | | 2004 | | 2003 | | 2002 | | 2001 |
| (unaudited) | | | | | | | | | | |
| Net asset value, beginning of period | $18.33 | | $15.68 | | $14.22 | | $12.69 | | $15.31 | | $18.95 |
|
| Income (loss) from | | | | | | | | | | | |
| investment operations | | | | | | | | | | | |
|
| Net investment income (d) | $0.04 | | $0.09 | | $0.09 | | $0.08 | | $0.06 | | $0.08 |
| Net realized and unrealized gain (loss) | | | | | | | | | | | |
| on investments and foreign currency | 0.99 | | 2.56 | | 1.37 | | 1.45 | | (2.42) | | (3.72) |
|
| Total from investment operations | $1.03 | | $2.65 | | $1.46 | | $1.53 | | $(2.36) | | $(3.64) |
|
| Less distributions declared | | | | | | | | | | | |
| to shareholders | | | | | | | | | | | |
|
| From net realized gain on investments | | | | | | | | | | | |
| and foreign currency transactions | $(0.80) | | $— | | $— | | $— | | $(0.26) | | $— |
|
| Net asset value, end of period | $18.56 | | $18.33 | | $15.68 | | $14.22 | | $12.69 | | $15.31 |
|
| Total return (%) (s)(r) | 5.75 | (n) | 16.90 | | 10.27 | (b) | 12.06 | | (15.70) | | (19.21) |
|
| Ratios (%) (to average net assets) | | | | | | | | | | | |
| and Supplemental data: | | | | | | | | | | | |
|
| Expenses before expense reductions (f) | 1.04 | (a) | 1.09 | | 1.03 | | 1.12 | | 1.02 | | 0.97 |
| Expenses after expense reductions (f) | 1.04 | (a) | 1.09 | | 1.03 | | 1.12 | | 1.02 | | 0.97 |
| Net investment income | 0.47 | (a) | 0.51 | | 0.56 | | 0.65 | | 0.38 | | 0.47 |
| Portfolio turnover | 60 | | 81 | | 116 | | 121 | | 100 | | 78 |
| Net assets at end of period | | | | | | | | | | | |
| (000 Omitted) | $4,008 | | $3,170 | | $460 | | $398 | | $428 | | $486 |
|
| See Notes to Financial Statements | | | | | | | | | | | |
SEMIANNUAL REPORT 19
Financial Highlights – continued
| | Six months | | | | | | | |
| | ended | | Years ended 8/31 | |
| Class R | 2/28/06 | | 2005 | | 2004 | | 2003(i) | |
| | (unaudited) | | | | | | | |
| Net asset value, beginning of period | $17.80 | | $15.31 | | $13.96 | | $11.98 | |
| |
| Income (loss) from investment operations | | | | | | | | |
| |
| Net investment income (loss) (d) | $(0.00) | (w) | $0.00 | (w) | $0.02 | | $(0.00) | (w) |
| Net realized and unrealized gain on investments | | | | | | | |
| and foreign currency | 0.96 | | 2.49 | | 1.33 | | 1.98(g) | |
| |
| Total from investment operations | $0.96 | | $2.49 | | $1.35 | | $1.98 | |
| |
| Less distributions declared to shareholders | | | | | | | | |
| |
| From net realized gain on investments and | | | | | | | | |
| foreign transactions | $(0.80) | | $— | | $— | | $— | |
| |
| Net asset value, end of period | $17.96 | | $17.80 | | $15.31 | | $13.96 | |
| |
| Total return (%) (s)(r) | 5.52 | (n) | 16.26 | | 9.67 | (b) | 16.53 | (n) |
| |
| Ratios (%) (to average net assets) | | | | | | | | | |
| and Supplemental data: | | | | | | | | |
| |
| Expenses before expense reductions (f) | 1.53 | (a) | 1.56 | | 1.49 | | 1.74 | (a) |
| Expenses after expense reductions (f) | 1.53 | (a) | 1.56 | | 1.49 | | 1.74 | (a) |
| Net investment income (loss) | (0.02) | (a) | 0.03 | | 0.13 | | (0.04) | (a) |
| Portfolio turnover | 60 | | 81 | | 116 | | 121 | |
| Net assets at end of period (000 Omitted) | $5,909 | | $5,888 | | $3,030 | | $17 | |
| |
| See Notes to Financial Statements | | | | | | | | |
20 SEMIANNUAL REPORT
Financial Highlights – continued
| | | Six months | | Year | |
| | | ended | | ended | |
| Class R1 | | 2/28/06 | | 8/31/05(i) | |
| | | (unaudited) | | | |
| Net asset value, beginning of period | | $17.01 | | $16.25 | |
| |
| Income (loss) from investment operations | | | | | |
| |
| Net investment loss (d) | | $(0.06) | | $(0.04) | |
| Net realized and unrealized gain on investments and foreign currency | | 0.92 | | 0.80 | (g) |
| |
| Total from investment operations | | $0.86 | | $0.76 | |
| |
| Less distributions declared to shareholders | | | | | |
| |
| From net realized gain on investments and foreign currency transactions | | $(0.80) | | $— | |
| |
| Net asset value, end of period | | $17.07 | | $17.01 | |
| |
| Total return (%) (s)(r) | | 5.18 | (n) | 4.68 | (n) |
| |
| Ratios (%) (to average net assets) | | | | | |
| and Supplemental data: | | | | | |
| |
| Expenses before expense reductions (f) | | 2.26 | (a) | 2.23 | (a) |
| Expenses after expense reductions (f) | | 2.17 | (a) | 2.23 | (a) |
| Net investment loss | | (0.67) | (a) | (0.63) | (a) |
| Portfolio turnover | | 60 | | 81 | |
| Net assets at end of period (000 Omitted) | | $178 | | $55 | |
| |
| | | Six months | | Year | |
| | | ended | | ended | |
| Class R2 | | 2/28/06 | | 8/31/05(i) | |
| | | (unaudited) | | | |
| Net asset value, beginning of period | | $17.03 | | $16.25 | |
| |
| Income (loss) from investment operations | | | | | |
| |
| Net investment loss (d) | | $(0.06) | | $(0.02) | |
| Net realized and unrealized gain on investments and foreign currency | | 0.95 | | 0.80 | (g) |
| |
| Total from investment operations | | $0.89 | | $0.78 | |
| |
| Less distributions declared to shareholders | | | | | |
| |
| From net realized gain on investments and foreign currency transactions | | $(0.80) | | $— | |
| |
| Net asset value, end of period | | $17.12 | | $17.03 | |
| |
| Total return (%) (s)(r) | | 5.35 | (n) | 4.80 | (n) |
| |
| Ratios (%) (to average net assets) | | | | | |
| and Supplemental data: | | | | | |
| |
| Expenses before expense reductions (f) | | 1.94 | (a) | 1.93 | (a) |
| Expenses after expense reductions (f) | | 1.80 | (a) | 1.93 | (a) |
| Net investment loss | | (0.65) | (a) | (0.33) | (a) |
| Portfolio turnover | | 60 | | 81 | |
| Net assets at end of period (000 Omitted) | | $668 | | $52 | |
| |
| See Notes to Financial Statements | | | | | |
| |
| | | SEMIANNUAL REPORT 21 | |
Financial Highlights – continued
| | | Six months | | | | | |
| | | ended | | Years ended 8/31 | |
| Class R3 | | 2/28/06 | | 2005 | | 2004(i) | |
| | | (unaudited) | | | | | |
| Net asset value, beginning of period | | $17.74 | | $15.29 | | $14.57 | |
| |
| Income (loss) from investment operations | | | | | | | |
| |
| Net investment income (loss) (d) | | $(0.02) | | $(0.04) | | $0.03 | |
| Net realized and unrealized gain on investments and | | | | | | | |
| foreign currency | | 0.96 | | 2.49 | | 0.69 | (g) |
| |
| Total from investment operations | | $0.94 | | $2.45 | | $0.72 | |
| |
| Less distributions declared to shareholders | | | | | | | |
| |
| From net realized gain on investments and foreign | | | | | | | |
| currency transactions | | $(0.80) | | $— | | $— | |
| |
| Net asset value, end of period | | $17.88 | | $17.74 | | $15.29 | |
| |
| Total return (%) (s)(r) | | 5.42 | (n) | 16.02 | | 4.94 | (b)(n) |
| |
| Ratios (%) (to average net assets) | | | | | | | |
| and Supplemental data: | | | | | | | |
| |
| Expenses before expense reductions (f) | | 1.79 | (a) | 1.81 | | 1.80 | (a) |
| Expenses after expense reductions (f) | | 1.70 | (a) | 1.81 | | 1.80 | (a) |
| Net investment income (loss) | | (0.18) | (a) | (0.22) | | 0.27 | (a) |
| Portfolio turnover | | 60 | | 81 | | 116 | |
| Net assets at end of period (000 Omitted) | | $1,229 | | $948 | | $616 | |
| |
| | | Six months | | Year | |
| | | ended | | ended | |
| Class R4 | | 2/28/06 | | 8/31/05(i) | |
| | | (unaudited) | | | |
| Net asset value, beginning of period | | $17.88 | | $17.02 | |
| |
| Income (loss) from investment operations | | | | | |
| |
| Net investment income (loss) (d) | | $(0.04) | | $0.01 | |
| Net realized and unrealized gain on investments and foreign currency | | 1.00 | | 0.85 | (g) |
| |
| Total from investment operations | | $0.96 | | $0.86 | |
| |
| Less distributions declared to shareholders | | | | | |
| |
| From net realized gain on investments and foreign currency transactions | | $(0.80) | | $— | |
| |
| Net asset value, end of period | | $18.04 | | $17.88 | |
| |
| Total return (%) (s)(r) | | 5.49 | (n) | 5.05 | (n) |
| |
| Ratios (%) (to average net assets) | | | | | |
| and Supplemental data: | | | | | |
| |
| Expenses before expense reductions (f) | | 1.44 | (a) | 1.43 | (a) |
| Expenses after expense reductions (f) | | 1.44 | (a) | 1.43 | (a) |
| Net investment income (loss) | | (0.58) | (a) | 0.17 | (a) |
| Portfolio turnover | | 60 | | 81 | |
| Net assets at end of period (000 Omitted) | | $1,435 | | $53 | |
| |
| See Notes to Financial Statements | | | | | |
| |
22 SEMIANNUAL REPORT | | | | | |
Financial Highlights – continued
| | | Six months | | Year | |
| | | ended | | ended | |
| Class R5 | | 2/28/06 | | 8/31/05(i) | |
| | | (unaudited) | | | |
| Net asset value, beginning of period | | $17.90 | | $17.02 | |
| |
| Income (loss) from investment operations | | | | | |
| |
| Net investment income (d) | | $0.03 | | $0.03 | |
| Net realized and unrealized gain on investments and foreign currency | | 0.97 | | 0.85 | (g) |
| |
| Total from investment operations | | $1.00 | | $0.88 | |
| |
| Less distributions declared to shareholders | | | | | |
| |
| From net realized gain on investments and foreign currency transactions | | $(0.80) | | $— | |
| |
| Net asset value, end of period | | $18.10 | | $17.90 | |
| |
| Total return (%) (s)(r) | | 5.72 | (n) | 5.17 | (n) |
| |
| Ratios (%) (to average net assets) | | | | | |
| and Supplemental data: | | | | | |
| |
| Expenses before expense reductions (f) | | 1.14 | (a) | 1.13 | (a) |
| Expenses after expense reductions (f) | | 1.14 | (a) | 1.13 | (a) |
| Net investment income | | 0.37 | (a) | 0.47 | (a) |
| Portfolio turnover | | 60 | | 81 | |
| Net assets at end of period (000 Omitted) | | $56 | | $53 | |
| |
Any redemption fees charged by the fund during the 2004 and 2005 fiscal years resulted in a per share impact of less than $0.01.
| (i) | For the period from the class’ inception, December 31, 2002 (Class R), October 31, 2003 (Class R3) and April 1, 2005 (Classes R1, R2, R4, and R5) through the stated period end. |
| (r) | Certain expenses have been reduced without which performance would have been lower. |
| (a) | Annualized. |
| (n) | Not annualized. |
| (w) | Per share amount was less than $0.01. |
| (d) | Per share data are based on average shares outstanding. |
| (f) | Ratios do not reflect reductions from fees paid indirectly. |
| (g) | The per share amount is not in accordance with the net realized and unrealized gain/loss for the period because of the timing of sales of fund shares and the amount of per share realized and unrealized gains and losses at such time. |
| (b) | The fund’s net asset value and total return calculation include a non-recurring accrual recorded as a result of an administrative proceeding regarding disclosure of brokerage allocation practices in connection with fund sales. The non-recurring accrual did not have a material impact on the net asset value per share based on the shares outstanding on the day the proceeds were recorded. |
| (t) | Total returns do not include any applicable sales charges. |
| (s) | From time to time the fund may receive proceeds from litigation settlements, without which performance would be lower. |
See Notes to Financial Statements
&nbs p; SEMIANNUAL REPORT 23
NOTES TO FINANCIAL STATEMENTS (unaudited)
(1) Business and Organization
MFS Core Equity Fund (the fund) is a series of MFS Series Trust I (the trust). The trust is organized as a Massachusetts business trust and is registered under the Investment Company Act of 1940, as amended, as an open-end management investment company.
(2) Significant Accounting Policies
General – The preparation of financial statements in conformity with U.S. generally accepted accounting principles requires management to make estimates and assumptions that affect the reported amounts of assets and liabilities, and disclosure of contingent assets and liabilities at the date of the financial statements and the reported amounts of revenues and expenses during the reporting period. Actual results could differ from those estimates. The fund can invest in foreign securities, including securities of emerging market issuers. Investments in foreign securities are vulnerable to the effects of changes in the relative values of the local currency and the U.S. dollar and to the effects of changes in each country’s legal, political, and economic environment. The markets of emerging markets countries are generally more volatile than the markets of developed countries with more mature economies. All of the risks of investing in foreign securities previously described are heightened when investing in emerging markets countries.
Investment Valuations – Equity securities, including restricted equity securities, are generally valued at the last sale or official closing price as reported by an independent pricing service on the market or exchange on which they are primarily traded. For securities for which there were no sales during the day, equity securities are generally valued at the last quoted bid price as reported by an independent pricing service on the market or exchange on which they are primarily traded. Short-term instruments with a maturity at issuance of 365 days or less are generally valued at amortized cost, which approximates market value. Open-end investment companies are generally valued at their net asset value per share. Securities and other assets generally valued on the basis of information from an independent pricing service may also be valued on the basis of information from brokers and dealers. The values of foreign securities and other assets and liabilities expressed in foreign currencies are converted to U.S. dollars based upon exchange rates provided by an independent source. When pricing-service information or market quotations are not readily available, securities are priced at fair value as determined under the direction of the Board of Trustees. For example, in valuing securities that trade principally on foreign markets, events reasonably determined to be significant (such as certain movements in the U.S. securities market, or other regional and local developments) may occur between the time that foreign markets close (where the security is principally traded) and the fund’s valuation time that may impact the value of securities traded in these foreign markets. In these cases, the fund may utilize information from an external vendor or other sources to adjust closing market prices of foreign equity securities to reflect what it believes to be the fair value of the securities as of the fund’s valuation time. Fair valuation of foreign equity securities may occur frequently based on an assessment that events which occur on a fairly regular basis (such as U.S. market movements) are significant.
24 SEMIANNUAL REPORT
Notes to Financial Statements (unaudited) – continued
Repurchase Agreements – The fund may enter into repurchase agreements with institutions that the fund’s investment adviser has determined are creditworthy. Each repurchase agreement is recorded at cost. The fund requires that the securities collateral in a repurchase transaction be transferred to the custodian in a manner sufficient to enable the fund to obtain those securities in the event of a default under the repurchase agreement. The fund monitors, on a daily basis, the value of the collateral to ensure that its value, including accrued interest, is greater than amounts owed to the fund under each such repurchase agreement. The fund, along with other affiliated entities of Massachusetts Financial Services Company (MFS), may utilize a joint trading account for the purpose of entering into one or more repurchase agreements.
Foreign Currency Translation – Purchases and sales of foreign investments, income, and expenses are converted into U.S. dollars based upon currency exchange rates prevailing on the respective dates of such transactions. Gains and losses attributable to foreign currency exchange rates on sales of securities are recorded for financial statement purposes as net realized gains and losses on investments. Gains and losses attributable to foreign exchange rate movements on income and expenses are recorded for financial statement purposes as foreign currency transaction gains and losses. That portion of both realized and unrealized gains and losses on investments that results from fluctuations in foreign currency exchange rates is not separately disclosed.
Security Loans – State Street Bank and Trust Company (‘‘State Street’’), as lending agent, may loan the securities of the fund to certain qualified institutions (the ‘‘Borrowers’’) approved by the fund. The loans are collateralized at all times by cash and/or U.S. Treasury securities in an amount at least equal to the market value of the securities loaned. State Street provides the fund with indemnification against Borrower default. The fund bears the risk of loss with respect to the investment of cash collateral. On loans collateralized by cash, the cash collateral is invested in a money market fund or short-term securities. A portion of the income generated upon investment of the collateral is remitted to the Borrowers, and the remainder is allocated between the fund and the lending agent. On loans collateralized by U.S. Treasury securities, a fee is received from the Borrower, and is allocated between the fund and the lending agent. Income from securities lending is included in interest income on the Statement of Operations. The dividend and interest income earned on the securities loaned is accounted for in the same manner as other dividend and interest income.
Short Term Fees – For purchases made on or after July 1, 2004 and before April 1, 2005, the fund charged a 2% redemption fee (which was retained by the fund) on proceeds from Class A, Class B, Class C, and Class I shares redeemed or exchanged within 5 business days following their acquisition (either by purchase or exchange). Effective April 1, 2005, the fund no longer
SEMIANNUAL REPORT 25
Notes to Financial Statements (unaudited) – continued
charges a redemption fee. See the fund’s prospectus for details. Any redemption fees charged are accounted for as an addition to paid-in capital.
Investment Transactions and Income – Investment transactions are recorded on the trade date. Interest income is recorded on the accrual basis. All premium and discount is amortized or accreted for financial statement purposes in accordance with U.S. generally accepted accounting principles. All discount is accreted for tax reporting purposes as required by federal income tax regulations. Dividends received in cash are recorded on the ex-dividend date. Certain dividends from foreign securities will be recorded when the fund is informed of the dividend if such information is obtained subsequent to the ex-dividend date. Dividend and interest payments received in additional securities are recorded on the ex-dividend or ex-interest date in an amount equal to the value of the security on such date.
The fund may receive proceeds from litigation settlements involving its portfolio holdings. Any proceeds received are reflected in realized gain/loss in the Statement of Operations, or in unrealized gain/loss if the security is still held by the fund.
Fees Paid Indirectly – The fund’s custody fee is reduced according to an arrangement that measures the value of cash deposited with the custodian by the fund. During the six months ended February 28, 2006, the fund’s custodian fees were reduced by $5,972 under this arrangement. The fund has entered into a commission recapture agreement, under which certain brokers will credit the fund a portion of the commissions generated, to offset certain expenses of the fund. For the six months ended February 28, 2006, the fund’s custodian expenses were reduced by $4,981 under this agreement. These amounts are shown as a reduction of total expenses on the Statement of Operations. Effective January 1, 2006, the commission recapture agreement was terminated.
Tax Matters and Distributions – The fund intends to continue to qualify as a regulated investment company, as defined under Subchapter M of the Internal Revenue Code, and to distribute all of its taxable income, including realized capital gains. Accordingly, no provision for federal income tax is required in the financial statements. Foreign taxes, if any, have been accrued by the fund in the accompanying financial statements.
Distributions to shareholders are recorded on the ex-dividend date. Income and capital gain distributions are determined in accordance with income tax regulations, which may differ from generally accepted accounting principles. Certain capital accounts in the financial statements are periodically adjusted for permanent differences in order to reflect their tax character. These adjustments have no impact on net assets or net asset value per share. Temporary differences which arise from recognizing certain items of income, expense, gain or loss in different periods for financial statement and tax purposes will reverse at some time in the future. Distributions in excess of net investment income or net realized gains are temporary overdistributions for financial statement purposes resulting from differences in the recognition or
26 SEMIANNUAL REPORT
Notes to Financial Statements (unaudited) – continued
classification of income for financial statement and tax purposes. Book/tax differences primarily relate to net operating losses, foreign currency transactions, real estate investment trusts, wash sale loss deferrals, and treating a portion of the proceeds from redemptions as a distribution for tax purposes.
The tax character of distributions declared during the current period will be determined at fiscal year end. The fund declared no distributions for the years ended August 31, 2005 and August 31, 2004.
The federal tax cost and the tax basis components of distributable earnings were as follows:
| As of February 28, 2006 | |
| Cost of investments(1) | $240,603,183 |
|
|
| Gross appreciation | $27,301,288 |
| Gross depreciation | (6,658,841) |
|
|
| Net unrealized appreciation (depreciation) | $20,642,447 |
As of August 31, 2005 | |
| Undistributed long-term capital gain | $6,815,148 |
| Other temporary differences | (35,885) |
| Net unrealized appreciation (depreciation) | 20,818,312 |
| (1) | Aggregate cost includes prior fiscal year end tax adjustments. |
| |
Multiple Classes of Shares of Beneficial Interest – The fund offers multiple classes of shares, which differ in their respective distribution and service fees. All shareholders bear the common expenses of the fund based on daily net assets of each class, without distinction between share classes. Dividends are declared separately for each class. Differences in per share dividend rates are generally due to differences in separate class expenses. Class B shares will convert to Class A shares approximately eight years after purchase.
(3) Transactions with Affiliates
Investment Adviser – The fund has an investment advisory agreement with Massachusetts Financial Services Company (MFS) to provide overall investment advisory and administrative services, and general office facilities. The management fee is computed daily and paid monthly at the following annual rates:
| | First $500 million of average daily net assets | 0.65% | |
| Average daily net assets in excess of $500 million | 0.55% | |
| |
The management fee incurred for the six months ended February 28, 2006 was equivalent to an annual effective rate of 0.65% of the fund’s average daily net assets.
Distributor – MFS Fund Distributors, Inc. (MFD), a wholly owned subsidiary of MFS, as distributor, received $10,849 for the six months ended February 28, 2006, as its portion of the initial sales charge on sales of Class A shares of the fund.
SEMIANNUAL REPORT 27
Notes to Financial Statements (unaudited) – continued
The Board of Trustees has adopted a distribution plan for certain class shares pursuant to Rule 12b-1 of the Investment Company Act of 1940.
The fund’s distribution plan provides that the fund will pay MFD for services provided by MFD and financial intermediaries in connection with the distribution and servicing of certain share classes. One component of the plan is a distribution fee paid to MFD and another component of the plan is a service fee paid to MFD. MFD may subsequently pay all, or a portion, of the distribution and/or service fees to financial intermediaries.
| Distribution Fee Plan Table: | | | | |
| | | | | Total | Annual | Distribution |
| | | Distribution | Service | Distribution | Effective | and Service |
| | | Fee Rate | Fee Rate | Plan(1) | Rate(2) | Fee |
| Class A | 0.10% | 0.25% | 0.35% | 0.35% | $258,675 |
| Class B | 0.75% | 0.25% | 1.00% | 1.00% | 332,149 |
| Class C | 0.75% | 0.25% | 1.00% | 1.00% | 91,311 |
| Class R | 0.25% | 0.25% | 0.50% | 0.50% | 15,918 |
| Class R1 | | 0.50% | 0.25% | 0.75% | 0.75% | 430 |
| Class R2 | | 0.25% | 0.25% | 0.50% | 0.50% | 581 |
| Class R3 | | 0.25% | 0.25% | 0.50% | 0.50% | 2,889 |
| Class R4 | | — | 0.25% | 0.25% | 0.25% | 286 |
|
|
|
|
|
|
|
| Total Distribution and Service Fees | | | | $702,239 |
| (1) | In accordance with the distribution plan for certain classes, the fund pays distribution and/or service fees up to these annual percentage rates of each class’ average daily net assets. |
| (2) | The annual effective rates represent actual fees incurred under the distribution plan for the six months ended February 28, 2006 based on each class’ average daily net assets. |
| |
Certain Class A and Class C shares are subject to a contingent deferred sales charge in the event of a shareholder redemption within 12 months of purchase. Class B shares are subject to a contingent deferred sales charge in the event of a shareholder redemption within six years of purchase. All contingent deferred sales charges are paid to MFD and during the six months ended February 28, 2006, were as follows:
| | Amount |
| Class A | $909 |
| Class B | $62,823 |
| Class C | $530 |
Shareholder Servicing Agent – The fund pays a portion of shareholder servicing costs to MFS Service Center, Inc. (MFSC), a wholly-owned subsidiary of MFS. MFSC receives a fee from the fund, for its services as shareholder servicing agent, set periodically under the supervision of the fund’s Board of Trustees. For the six months ended February 28, 2006, the fee was $118,677, which equated to 0.0972% annually of the fund’s average daily net assets. MFSC also receives payment from the fund for out-of-pocket and sub-accounting expenses paid by MFSC on behalf of the fund. For the six months ended February 28, 2006, these costs amounted to $60,435.
Administrator – MFS provides certain financial, legal, shareholder communications, compliance, and other administrative services to certain
28 SEMIANNUAL REPORT
Notes to Financial Statements (unaudited) – continued
funds for which MFS acts as investment adviser. Under an administrative services agreement, the funds may partially reimburse MFS the costs incurred to provide these services, subject to review and approval by the Board of Trustees. Each fund is charged a fixed amount plus a fee based on calendar year average net assets. The fund’s annual fixed amount is $10,000.
The administrative services fee incurred for the six months ended February 28, 2006 was equivalent to an annual effective rate of 0.0131% of the fund’s average daily net assets.
In addition to the administrative services provided by MFS to the fund as described above, MFS is responsible for providing certain retirement plan administration and services with respect to certain shares. These services include various administrative, recordkeeping, and communication/educational services with respect to the retirement plans which invest in these shares, and may be provided directly by MFS or by a third party. MFS may subsequently pay all, or a portion, of the retirement plan administration and services fee to affiliated or unaffiliated third parties. For the six months ended February 28, 2006, the fund paid MFS an annual retirement plan administration and services fee up to the following annual percentage rates of each class’ average daily net assets:
| | | | Annual | |
| | | | Effective | Total |
| | | Fee Rate | Rate(1) | Amount |
| Class R1 | | 0.45% | 0.36% | $258 |
| Class R2 | | 0.40% | 0.26% | 462 |
| Class R3 | | 0.25% | 0.16% | 1,441 |
| Class R4 | | 0.15% | 0.15% | 171 |
| Class R5 | | 0.10% | 0.10% | 27 |
|
|
|
|
|
| Total Retirement Plan Administration and Services Fees | | | $2,359 |
| (1) | Effective October 1, 2005, MFS has contractually agreed to waive a portion of the retirement plan administration and services fee equal to 0.10% for Class R1 shares, 0.15% for Class R2 shares, and 0.10% for Class R3 shares. This agreement will continue until at least September 30, 2007. For the six months ended February 28, 2006, this waiver amounted to $713 and is reflected as a reduction of total expenses in the Statement of Operations. |
| |
Trustees’ and Officers’ Compensation – The fund pays compensation to Independent Trustees in the form of a retainer, attendance fees, and additional compensation to Board and Committee chairpersons. The fund does not pay compensation directly to Trustees who are officers of the investment adviser, or to officers of the fund, all of whom receive remuneration for their services to the fund from MFS. Certain officers and Trustees of the fund are officers or directors of MFS, MFD, and MFSC.
The fund has an unfunded, defined benefit plan for retired Independent Trustees which resulted in a pension expense of $1,473. The fund also has an unfunded retirement benefit deferral plan for certain current Independent Trustees which resulted in a net decrease of $223. Both amounts are included in Independent trustees’ compensation for the six months ended February 28, 2006. The deferred liability for retirement benefits payable to
SEMIANNUAL REPORT 29
Notes to Financial Statements (unaudited) – continued
retired Trustees and certain current Trustees amounted to $13,823 and $21,949, respectively, at February 28, 2006, and is included in payable for independent trustees’ compensation.
Other – This fund and certain other MFS funds (the funds) have entered into a services agreement (the Agreement) which provides for payment of fees by the funds to Tarantino LLC in return for the provision of services of an Independent Chief Compliance Officer (ICCO) for the funds. The ICCO is an officer of the funds and the sole member of Tarantino LLC. The funds can terminate the Agreement with Tarantino LLC at any time under the terms of the Agreement. For the six months ended February 28, 2006, the fee paid to Tarantino LLC was $952. MFS has agreed to reimburse the fund for a portion of the payments made by the funds to Tarantino LLC in the amount of $714, which is shown as a reduction of total expenses in the Statement of Operations. Additionally, MFS has agreed to bear all expenses associated with office space, other administrative support, and supplies provided to the ICCO.
(4) Portfolio Securities
Purchases and sales of investments, other than U.S. government securities, purchased option transactions, and short-term obligations, aggregated $146,450,557 and $149,538,842, respectively.
(5) Shares of Beneficial Interest
The fund’s Declaration of Trust permits the Trustees to issue an unlimited number of full and fractional shares of beneficial interest. Transactions in fund shares were as follows:
| | | | | Six months ended 2/28/06 | | Year ended 8/31/05(i) |
| | | | | Shares | | Amount | | Shares | | Amount |
| Shares sold | | | | | | | | |
| Class A | | 1,360,286 | | $24,464,328 | | 5,204,906 | | $90,048,226 |
| Class B | | 625,403 | | 10,782,687 | | 1,321,624 | | 21,946,642 |
| Class C | | 164,514 | | 2,804,594 | | 338,243 | | 5,567,632 |
| Class I | | 47,086 | | 867,790 | | 164,757 | | 2,901,520 |
| Class R | | 93,395 | | 1,669,619 | | 252,058 | | 4,402,599 |
| Class R1 | | | | 6,814 | | 116,657 | | 3,214 | | 52,371 |
| Class R2 | | | | 35,983 | | 616,591 | | 3,077 | | 50,000 |
| Class R3 | | | | 21,911 | | 388,807 | | 22,723 | | 393,385 |
| Class R4 | | | | 153,722 | | 2,783,474 | | 2,938 | | 50,000 |
| Class R5 | | | | — | | — | | 2,938 | | 50,000 |
|
| | | | | 2,509,114 | | $44,494,547 | | 7,316,478 | | $125,462,375 |
|
30 SEMIANNUAL REPORT | | | | | | | | |
Notes to Financial Statements (unaudited) – continued
| | | | | Six months ended 2/28/06 | | Year ended 8/31/05(i) |
| | | | | Shares | | Amount | | Shares | | Amount |
| Shares issued to shareholders in | | | | | | | | |
| reinvestment of distributions | | | | | | | | |
| Class A | | 355,190 | | $6,254,889 | | — | | $— |
| Class B | | 171,176 | | 2,860,358 | | — | | — |
| Class C | | 42,450 | | 706,372 | | — | | — |
| Class I | | 6,859 | | 124,080 | | — | | — |
| Class R | | 16,688 | | 292,512 | | — | | — |
| Class R1 | | | | 395 | | 6,519 | | — | | — |
| Class R2 | | | | 148 | | 2,469 | | — | | — |
| Class R3 | | | | 3,146�� | | 54,898 | | — | | — |
| Class R4 | | | | 134 | | 2,358 | | — | | — |
| Class R5 | | | | 133 | | 2,358 | | — | | — |
|
| | | | | 596,319 | | $10,306,813 | | — | | $— |
| Shares reacquired | | | | | | | | |
| Class A | | (1,097,659) | | $(19,776,354) | | (1,666,274) | | $(28,481,139) |
| Class B | | (1,322,651) | | (22,525,550) | | (2,135,925) | | (34,776,369) |
| Class C | | (141,889) | | (2,410,032) | | (374,082) | | (6,036,198) |
| Class I | | (10,972) | | (202,247) | | (21,124) | | (370,848) |
| Class R | | (111,776) | | (2,000,590) | | (119,291) | | (2,072,962) |
| Class R1 | | | | (2) | | (45) | | — | | — |
| Class R2 | | | | (223) | | (3,795) | | — | | — |
| Class R3 | | | | (9,749) | | (172,305) | | (9,547) | | (156,007) |
| Class R4 | | | | (77,238) | | (1,399,192) | | — | | — |
| Class R5 | | | | — | | — | | — | | — |
|
| | | | | (2,772,159) | | $(48,490,110) | | (4,326,243) | | $(71,893,523) |
| Net change | | | | | | | | |
| Class A | | 617,817 | | $10,942,863 | | 3,538,632 | | $61,567,087 |
| Class B | | (526,072) | | (8,882,505) | | (814,301) | | (12,829,727) |
| Class C | | 65,075 | | 1,100,934 | | (35,839) | | (468,566) |
| Class I | | 42,973 | | 789,623 | | 143,633 | | 2,530,672 |
| Class R | | (1,693) | | (38,459) | | 132,767 | | 2,329,637 |
| Class R1 | | | | 7,207 | | 123,131 | | 3,214 | | 52,371 |
| Class R2 | | | | 35,908 | | 615,265 | | 3,077 | | 50,000 |
| Class R3 | | | | 15,308 | | 271,400 | | 13,176 | | 237,378 |
| Class R4 | | | | 76,618 | | 1,386,640 | | 2,938 | | 50,000 |
| Class R5 | | | | 133 | | 2,358 | | 2,938 | | 50,000 |
|
| | | | | 333,274 | | $6,311,250 | | 2,990,235 | | $53,568,852 |
| (i) | For the period from the class’ inception, April 1, 2005 (Classes R1, R2, R4, and R5) through the stated period end. |
| |
SEMIANNUAL REPORT 31
Notes to Financial Statements (unaudited) – continued
(6) Line of Credit
The fund and other affiliated funds participate in a $1 billion unsecured line of credit provided by a syndication of banks under a credit agreement. Borrowings may be made for temporary financing needs. Interest is charged to each fund, based on its borrowings, at a rate equal to the Federal Reserve funds rate plus 0.35% . In addition, a commitment fee, based on the average daily, unused portion of the line of credit, is allocated among the participating funds at the end of each calendar quarter. The commitment fee allocated to the fund for the six months ended February 28, 2006 was $1,369, and is included in miscellaneous expense on the Statement of Operations. The fund had no significant borrowings during the six months ended February 28, 2006.
32 SEMIANNUAL REPORT
BOARD REVIEW OF INVESTMENT ADVISORY AGREEMENT
A discussion regarding the Board’s most recent review and renewal of the Fund’s investment advisory agreement is available by clicking on the fund’s name under ‘‘Select a fund’’ on the MFS Web site (mfs.com).
PROXY VOTING POLICIES AND INFORMATION
A general description of the MFS funds’ proxy voting policies and procedures is available without charge, upon request, by calling 1-800-225-2606, by visiting the Proxy Voting section of mfs.com or by visiting the SEC’s Web site at http://www.sec.gov.
Information regarding how the fund voted proxies relating to portfolio securities during the most recent twelve-month period ended June 30 is available without charge by visiting the Proxy Voting section of mfs.com or by visiting the SEC’s Web site at http://www.sec.gov.
QUARTERLY PORTFOLIO DISCLOSURE
The trust will file a complete schedule of portfolio holdings with the Securities and Exchange Commission (the Commission) for the first and third quarters of each fiscal year on Form N-Q. The trust’s Form N-Q may be reviewed and copied at the:
Public Reference Room
Securities and Exchange Commission
Washington, D.C. 20549-0102
Information on the operation of the Public Reference Room may be obtained by calling the Commission at 1-800-SEC-0330. The trust’s Form N-Q is available on the EDGAR database on the Commission’s Internet Web site at http://www.sec.gov, and copies of this information may be obtained, upon payment of a duplicating fee, by electronic request at the following e-mail address: publicinfo@sec.gov or by writing the Public Reference Section at the above address.
A shareholder can also obtain the quarterly portfolio holdings report at mfs.com.
SEMIANNUAL REPORT 33

LETTER FROM THE CEO

Dear Shareholders,
It has been said that change is the only constant in life. As investors have seen, that theme is still accurate today as we recently have experienced shifting economic cycles because of natural disasters and political instability around the globe.
Markets worldwide have fluctuated in the past year as devastating hurricanes had a dramatic effect on the international economy, particularly on oil prices. We witnessed political unrest in the Middle East, highlighted by instability in Iraq, and in Africa, the usually stable Nigeria also experienced violence. As a result, energy prices have bounced up and down, with crude oil prices at one point topping a record $70 per barrel.
Such cycles are not uncommon and in fact have almost become the norm in our everyday lives. What does all of this mean to you as an investor? In times like these, it helps to know that you’re working with a seasoned investment professional who has experience to guide you through difficult times. At MFS®, we believe our investment management team has the knowledge and confidence to navigate through difficult cycles and at the same time see through adversity to find investment opportunities for our clients and shareholders.
Our investment management process, honed over 80 years, combines a unique concept of teamwork with our unwavering focus on the long term. We firmly believe that the best way to realize long-term financial goals – be it a college education, a comfortable retirement, or a secure family legacy – is to follow a three-pronged approach that focuses on longer time horizons. Allocate holdings across the major asset classes – including stocks, bonds, and cash. Diversify within each class to take advantage of different market segments and investing styles. Rebalance assets regularly to maintain a desired asset allocation. Of course, these strategies cannot guarantee a profit or protect against a loss. This long-term approach requires diligence and patience, two traits that in our experience are essential to capitalizing on the many opportunities the financial markets can offer – through both up and down economic cycles.
Respectfully,

Robert J. Manning
Chief Executive Officer and Chief Investment Officer
MFS Investment Management®
April 17, 2006
The opinions expressed in this letter are those of MFS, and no forecasts can be guaranteed.
SEMIANNUAL REPORT 1
PORTFOLIO COMPOSITION

| Top 10 holdings | | |
| Samsung Electronics Co. Ltd. | | 3.9% |
|
| Adobe Systems, Inc. | | 3.9% |
|
| Gilead Sciences, Inc. | | 3.7% |
|
| Allergan, Inc. | | 3.3% |
|
| Electronic Arts, Inc. | | 3.0% |
|
| QUALCOMM, Inc. | | 3.0% |
|
| National Oilwell Varco, Inc. | | 2.7% |
|
| Noble Corp. | | 2.6% |
|
| Juniper Networks, Inc. | | 2.5% |
|
| Google, Inc. | | 2.5% |
|
| Equity market sectors | | |
| Technology | | 28.2% |
|
| Health Care | | 23.0% |
|
| Leisure | | 10.1% |
|
| Special Products & Services | | 9.0% |
|
| Financial Services | | 8.3% |
|
| Energy | | 6.2% |
|
| Utilities & Communications | | 3.5% |
|
| Retailing | | 2.9% |
|
| Autos & Housing | | 2.1% |
|
| Consumer Staples | | 1.5% |
|
| Transportation | | 1.1% |
|
| Basic Materials | | 1.1% |
|
Percentages are based on net assets as of 2/28/06.
The portfolio is actively managed, and current holdings may be different.
2 SEMIANNUAL REPORT
EXPENSE TABLE
Fund Expenses Borne by the Shareholders During the Period, September 1, 2005 through February 28, 2006.
As a shareholder of the fund, you incur two types of costs: (1) transaction costs, including sales charges (loads) on certain purchase or redemption payments and redemption fees on certain exchanges and redemptions, and (2) ongoing costs, including management fees; distribution and service (12b-1) fees; and other fund expenses. This example is intended to help you understand your ongoing costs (in dollars) of investing in the fund and to compare these costs with the ongoing costs of investing in other mutual funds.
The example is based on an investment of $1,000 invested at the beginning of the period and held for the entire period September 1, 2005 through February 28, 2006.
Actual Expenses
The first line for each share class in the following table provides information about actual account values and actual expenses. You may use the information in this line, together with the amount you invested, to estimate the expenses that you paid over the period. Simply divide your account value by $1,000 (for example, an $8,600 account value divided by $1,000 = 8.6), then multiply the result by the number in the first line under the heading entitled ‘‘Expenses Paid During Period’’ to estimate the expenses you paid on your account during this period.
Hypothetical Example for Comparison Purposes
The second line for each share class in the following table provides information about hypothetical account values and hypothetical expenses based on the fund’s actual expense ratio and an assumed rate of return of 5% per year before expenses, which is not the fund’s actual return. The hypothetical account values and expenses may not be used to estimate the actual ending account balance or expenses you paid for the period. You may use this information to compare the ongoing costs of investing in the fund and other funds. To do so, compare this 5% hypothetical example with the 5% hypothetical examples that appear in the shareholder reports of the other funds.
Please note that the expenses shown in the table are meant to highlight your ongoing costs only and do not reflect any transactional costs, such as sales charges (loads) or redemption fees. Therefore, the second line for each share class in the table is useful in comparing ongoing costs only, and will not help you determine the relative total costs of owning different funds. In addition, if these transactional costs were included, your costs would have been higher.
SEMIANNUAL REPORT 3
| Expense Table – continued | | | | | | | | |
|
| | | | | | | | | Expenses |
| | | Annualized | | Beginning | | Ending | | Paid During |
| | | Expense | | Account Value | | Account Value | | Period (p) |
| Share Class | | Ratio | | 9/01/05 | | 2/28/06 | | 9/01/05-2/28/06 |
|
| A | Actual | | 1.28% | | $1,000.00 | | $1,051.20 | | $6.51 |
|
| Hypothetical (h) | | 1.28% | | $1,000.00 | | $1,018.45 | | $6.41 |
|
| B | Actual | | 1.93% | | $1,000.00 | | $1,048.10 | | $9.80 |
|
| Hypothetical (h) | | 1.93% | | $1,000.00 | | $1,015.22 | | $9.64 |
|
| C | Actual | | 1.93% | | $1,000.00 | | $1,047.40 | | $9.80 |
|
| Hypothetical (h) | | 1.93% | | $1,000.00 | | $1,015.22 | | $9.64 |
|
| I | Actual | | 0.94% | | $1,000.00 | | $1,053.10 | | $4.79 |
|
| Hypothetical (h) | | 0.94% | | $1,000.00 | | $1,020.13 | | $4.71 |
|
| R | Actual | | 1.43% | | $1,000.00 | | $1,050.90 | | $7.27 |
|
| Hypothetical (h) | | 1.43% | | $1,000.00 | | $1,017.70 | | $7.15 |
|
| R1 | Actual | | 2.05% | | $1,000.00 | | $1,047.00 | | $10.40 |
|
| Hypothetical (h) | | 2.05% | | $1,000.00 | | $1,014.63 | | $10.24 |
|
| R2 | Actual | | 1.71% | | $1,000.00 | | $1,049.20 | | $8.69 |
|
| Hypothetical (h) | | 1.71% | | $1,000.00 | | $1,016.31 | | $8.55 |
|
| R3 | Actual | | 1.60% | | $1,000.00 | | $1,049.50 | | $8.13 |
|
| Hypothetical (h) | | 1.60% | | $1,000.00 | | $1,016.86 | | $8.00 |
|
| R4 | Actual | | 1.34% | | $1,000.00 | | $1,051.20 | | $6.82 |
|
| Hypothetical (h) | | 1.34% | | $1,000.00 | | $1,018.15 | | $6.71 |
|
| Actual | | 1.04% | | $1,000.00 | | $1,052.20 | | $5.29 |
|
|
| R5 | | | | | | | | |
| Hypothetical (h) | | 1.04% | | $1,000.00 | | $1,019.64 | | $5.21 |
|
| 529A | Actual | | 1.54% | | $1,000.00 | | $1,049.90 | | $7.83 |
|
| Hypothetical (h) | | 1.54% | | $1,000.00 | | $1,017.16 | | $7.70 |
|
| 529B | Actual | | 2.19% | | $1,000.00 | | $1,046.70 | | $11.11 |
|
| Hypothetical (h) | | 2.19% | | $1,000.00 | | $1,013.93 | | $10.94 |
|
| 529C | Actual | | 2.19% | | $1,000.00 | | $1,046.10 | | $11.11 |
|
| Hypothetical (h) | | 2.19% | | $1,000.00 | | $1,013.93 | | $10.94 |
|
| (h) | 5% class return per year before expenses. |
| |
| (p) | Expenses paid is equal to each class’ annualized expense ratio, as shown above, multiplied by the average account value over the period, multiplied by the number of days in the period, divided by the number of days in the year. Expenses paid do not include any applicable sales charges (loads) or redemption fees. If these transaction costs had been included, your costs would have been higher. |
| |
Effective October 1, 2005 the fund’s Class R1, Class R2, and Class R3 retirement plan administration and services fee was reduced (as described in Note 3 of the Notes to the Financial Statements). Had this fee reduction been in effect throughout the entire six month period, the annualized expense ratio would have been 2.03%, 1.69%, and 1.58% for Class R1, Class R2, and Class R3, respectively, and the actual expenses paid during the period would have been approximately $10.30, $8.59 and $8.03 for Class R1, Class R2, and Class R3, respectively.
4 SEMIANNUAL REPORT
| PORTFOLIO OF INVESTMENTS (unaudited) – 2/28/06 | | | | |
| The Portfolio of Investments is a complete list of all securities owned by your fund. | | | |
| It is categorized by broad-based asset classes. | | | | |
| Stocks - 97.0% | | | | |
|
| Issuer | Shares/Par | | | Value ($) |
|
| Automotive - 2.1% | | | | |
|
| Harman International Industries, Inc. (l) | 317,900 | | $ | 35,080,265 |
|
| Banks & Credit Companies - 1.1% | | | | |
|
| SLM Corp. | 329,400 | | $ | 18,581,454 |
|
| Biotechnology - 7.8% | | | | |
|
| Celgene Corp. (n) | 778,400 | | $ | 29,579,200 |
| Genentech, Inc. (n) | 145,900 | | | 12,502,171 |
| Genzyme Corp. (n) | 358,980 | | | 24,891,673 |
| Gilead Sciences, Inc. (n) | 980,860 | | | 61,078,152 |
| |
|
| | | | $ | 128,051,196 |
|
| Broadcast & Cable TV - 2.2% | | | | |
|
| Grupo Televisa S.A., ADR | 452,260 | | $ | 35,484,320 |
|
| Brokerage & Asset Managers - 7.2% | | | | |
|
| Charles Schwab Corp. | 1,097,700 | | $ | 17,793,717 |
| Chicago Mercantile Exchange Holdings, Inc. | 57,000 | | | 24,259,200 |
| Franklin Resources, Inc. | 262,300 | | | 26,932,964 |
| Goldman Sachs Group, Inc. | 127,200 | | | 17,972,088 |
| Legg Mason, Inc. (l) | 237,700 | | | 31,041,243 |
| |
|
| | | | $ | 117,999,212 |
|
| Business Services - 7.3% | | | | |
|
| Amdocs Ltd. (n) | 740,290 | | $ | 24,518,405 |
| Cognizant Technology Solutions Corp., ‘‘A’’ (n) | 326,200 | | | 18,792,382 |
| First Data Corp. | 596,000 | | | 26,897,480 |
| Getty Images, Inc. (n) | 360,030 | | | 29,173,231 |
| Monster Worldwide, Inc. (l)(n) | 421,500 | | | 20,636,640 |
| |
|
| | | | $ | 120,018,138 |
|
| Computer Software - 3.9% | | | | |
|
| Adobe Systems, Inc. | 1,641,516 | | $ | 63,395,348 |
|
| Computer Software - Systems - 0.9% | | | | |
|
| Apple Computer, Inc. (n) | 206,800 | | $ | 14,174,072 |
|
| Consumer Goods & Services - 1.7% | | | | |
|
| eBay, Inc. (n) | 718,400 | | $ | 28,779,104 |
|
| | SEMIANNUAL REPORT 5 |
| Portfolio of Investments (unaudited) – continued | | | | |
| Issuer | Shares/Par | | | Value ($) |
|
| Stocks - continued | | | | |
|
| Electronics - 7.7% | | | | |
|
| Intel Corp. | 773,900 | | $ | 15,942,340 |
| Marvell Technology Group Ltd. (n) | 457,100 | | | 27,983,662 |
| Samsung Electronics Co. Ltd., GDR | 181,520 | | | 64,212,700 |
| SanDisk Corp. (n) | 297,200 | | | 17,933,048 |
| |
|
| | | | $ | 126,071,750 |
|
| Food & Drug Stores - 1.1% | | | | |
|
| Walgreen Co. (l) | 391,700 | | $ | 17,571,662 |
|
| Food & Non-Alcoholic Beverages - 1.5% | | | | |
|
| PepsiCo, Inc. | 420,210 | | $ | 24,838,613 |
|
| Gaming & Lodging - 2.3% | | | | |
|
| International Game Technology | 622,300 | | $ | 22,259,671 |
| Las Vegas Sands Corp. (l)(n) | 305,500 | | | 16,298,425 |
| |
|
| | | | $ | 38,558,096 |
|
| Health Maintenance Organizations - 2.5% | | | | |
|
| UnitedHealth Group, Inc. | 275,900 | | $ | 16,065,657 |
| WellPoint, Inc. (n) | 319,800 | | | 24,557,442 |
| |
|
| | | | $ | 40,623,099 |
|
| Internet - 4.5% | | | | |
|
| Google, Inc., ‘‘A’’ (n) | 111,300 | | $ | 40,359,606 |
| Yahoo!, Inc. (l)(n) | 1,038,400 | | | 33,291,104 |
| |
|
| | | | $ | 73,650,710 |
|
| Leisure & Toys - 3.7% | | | | |
|
| Activision, Inc. (n) | 952,800 | | $ | 11,910,000 |
| Electronic Arts, Inc. (n) | 954,930 | | | 49,627,712 |
| |
|
| | | | $ | 61,537,712 |
|
| Medical Equipment - 6.0% | | | | |
|
| Advanced Medical Optics, Inc. (l)(n) | 477,340 | | $ | 21,232,083 |
| Cytyc Corp. (n) | 1,143,600 | | | 32,969,988 |
| Millipore Corp. (n) | 301,700 | | | 20,916,861 |
| St. Jude Medical, Inc. (n) | 527,250 | | | 24,042,600 |
| |
|
| | | | $ | 99,161,532 |
|
| Metals & Mining - 1.1% | | | | |
|
| BHP Billiton Ltd., ADR (l) | 495,500 | | $ | 17,882,595 |
|
| Network & Telecom - 9.5% | | | | |
|
| Corning, Inc. (n) | 1,205,810 | | $ | 29,433,822 |
| Juniper Networks, Inc. (n) | 2,256,000 | | | 41,487,840 |
| Nokia Corp., ADR | 1,900,900 | | | 35,318,722 |
| QUALCOMM, Inc. | 1,047,000 | | | 49,428,870 |
| |
|
| | | | $ | 155,669,254 |
|
| 6 SEMIANNUAL REPORT | | | | |
| Portfolio of Investments (unaudited) – continued | | | | | |
| Issuer | | Shares/Par | | | Value ($) |
|
| Stocks - continued | | | | | |
|
| Oil Services - 6.2% | | | | | |
|
| GlobalSantaFe Corp. | | 282,000 | | $ | 15,605,880 |
| National Oilwell Varco, Inc. (n) | | 716,700 | | | 43,632,696 |
| Noble Corp. | | 569,300 | | | 42,076,963 |
| |
|
| | | | | $ | 101,315,539 |
|
| Personal Computers & Peripherals - 1.7% | | | | | |
|
| EMC Corp. (n) | | 1,957,470 | | $ | 27,443,729 |
|
| Pharmaceuticals - 6.7% | | | | | |
|
| Allergan, Inc. (l) | | 498,900 | | $ | 54,010,914 |
| Roche Holding AG (l) | | 262,180 | | | 38,806,643 |
| Teva Pharmaceutical Industries Ltd., ADR | | 405,400 | | | 17,022,746 |
| |
|
| | | | | $ | 109,840,303 |
|
| Restaurants - 1.9% | | | | | |
|
| Starbucks Corp. (n) | | 853,100 | | $ | 30,984,592 |
|
| Specialty Stores - 1.8% | | | | | |
|
| Best Buy Co., Inc. | | 535,100 | | $ | 28,820,486 |
|
| Telecommunications - Wireless - 1.5% | | | | | |
|
| America Movil S.A. de C.V., ‘‘L’’, ADR | | 704,900 | | $ | 24,481,177 |
|
| Telephone Services - 2.0% | | | | | |
|
| American Tower Corp., ‘‘A’’ (n) | | 1,038,000 | | $ | 33,039,540 |
|
| Trucking - 1.1% | | | | | |
|
| FedEx Corp. | | 169,600 | | $ | 18,187,904 |
|
| Total Stocks (Identified Cost, $1,487,039,155) | | | | | $1,591,241,402 |
|
| Convertible Bonds - 0% | | | | | |
|
| Electronics - 0% | | | | | |
|
| Candescent Technologies Corp., 8%, 2003 (a)(d) | $ | 10,000,000 | | $ | 0 |
|
| Total Convertible Bonds (Identified Cost, $—) | | | | $ | 0 |
|
| Short-Term Obligations - 3.2% | | | | | |
|
| General Electric Capital Corp., 4.56%, due 3/01/06, at | | | | | |
| Amortized Cost and Value (y) | $ | 51,981,000 | | $ | 51,981,000 |
|
| | | SEMIANNUAL REPORT 7 |
| Portfolio of Investments (unaudited) – continued | | | | | | |
| Issuer | | Shares/Par | | | Value ($) | |
|
| Collateral for Securities Loaned - 6.2% | | | | | | |
|
| Navigator Securities Lending Prime Portfolio, at Cost and Net | | | | | | |
| Asset Value | | 102,340,179 | | $ | 102,340,179 | |
|
| Total Investments (Identified Cost, $1,641,360,334) (k) | | | | $ | 1,745,562,581 | |
|
| Other Assets, Less Liabilities - (6.4)% | | | | | (105,602,419 | ) |
|
| Net Assets - 100.0% | | | | $ | 1,639,960,162 | |
|
| (k) | | As of February 28, 2006 the fund had one security that was fair valued, aggregating $0 and | |
| | | 0.0% of net assets in accordance with the policies adopted by the Board of Trustees. | |
| (n) | | Non-income producing security. | | | | | | |
| (l) | | All or a portion of this security is on loan. | | | | | | |
| (a) | | SEC Rule 144A restriction. | | | | | | |
| (y) | | The rate shown represents an annualized yield at time of purchase. | | | | | | |
| (d) | | Non-income producing security - in default. | | | | | | |
| The following abbreviations are used in the Portfolio of Investments and are defined: | | | | |
| ADR American Depository Receipt | | | | | | |
| GDR Global Depository Receipt | | | | | | |
See Notes to Financial Statements | | | | | | |
|
8 SEMIANNUAL REPORT | | | | | | |
| FINANCIAL STATEMENTS | Statement of Assets and Liabilities (unaudited) | |
| This statement represents your fund’s balance sheet, which details the assets | |
| and liabilities composing the total value of the fund. | | |
| At 2/28/06 | | |
| Assets | | |
|
| Investments, at value, including $99,079,505 of securities on | | |
| loan (identified cost, $1,641,360,334) | $1,745,562,581 | |
| Cash | 372 | |
| Receivable for investments sold | 4,252,962 | |
| Receivable for fund shares sold | 1,991,665 | |
| Interest and dividends receivable | 259,302 | |
| Other assets | 7,566 | |
|
| Total assets | | $1,752,074,448 |
|
| Liabilities | | |
|
| Payable for investments purchased | $6,836,437 | |
| Payable for fund shares reacquired | 2,264,937 | |
| Collateral for securities loaned, at value | 102,340,179 | |
| Payable to affiliates | | |
| Management fee | 29,629 | |
| Shareholder servicing costs | 237,280 | |
| Distribution and service fees | 16,264 | |
| Administrative services fee | 418 | |
| Program manager fees | 7 | |
| Retirement plan administration and service fees | 9 | |
| Payable for independent trustees’ compensation | 68,565 | |
| Accrued expenses and other liabilities | 320,561 | |
|
| Total liabilities | | $112,114,286 |
|
| Net assets | | $1,639,960,162 |
|
| Net assets consist of: | | |
|
| Paid-in capital | $2,922,978,597 | |
| Unrealized appreciation (depreciation) on investments and | | |
| translation of assets and liabilities in foreign currencies | 104,202,247 | |
| Accumulated net realized gain (loss) on investments and | | |
| foreign currency transactions | (1,379,732,509) | |
| Accumulated net investment loss | (7,488,173) | |
|
| Net assets | | $1,639,960,162 |
|
| Shares of beneficial interest outstanding | | 83,292,457 |
|
| | SEMIANNUAL REPORT 9 |
| Statement of Assets and Liabilities (unaudited) – continued | | |
| Class A shares | | |
|
| Net assets | $482,083,299 | |
| Shares outstanding | 24,451,417 | |
|
| Net asset value per share | | $19.72 |
|
| Offering price per share (100/94.25 x net asset value per share) | | $20.92 |
|
| Class B shares | | |
|
| Net assets | $331,730,155 | |
| Shares outstanding | 17,703,180 | |
|
| Net asset value and offering price per share | | $18.74 |
|
| Class C shares | | |
|
| Net assets | $80,637,214 | |
| Shares outstanding | 4,295,132 | |
|
| Net asset value and offering price per share | | $18.77 |
|
| Class I shares | | |
|
| Net assets | $739,049,614 | |
| Shares outstanding | 36,510,561 | |
|
| Net asset value, offering price, and redemption price | | |
| per share | | $20.24 |
|
| Class R shares | | |
|
| Net assets | $3,731,960 | |
| Shares outstanding | 190,144 | |
|
| Net asset value, offering price, and redemption price | | |
| per share | | $19.63 |
|
| Class R1 shares | | |
|
| Net assets | $217,245 | |
| Shares outstanding | 11,609 | |
|
| Net asset value, offering price, and redemption price | | |
| per share | | $18.71 |
|
| Class R2 shares | | |
|
| Net assets | $352,704 | |
| Shares outstanding | 18,792 | |
|
| Net asset value, offering price, and redemption price | | |
| per share | | $18.77 |
|
| Class R3 shares | | |
|
| Net assets | $998,762 | |
| Shares outstanding | 51,163 | |
|
| Net asset value, offering price, and redemption price | | |
| per share | | $19.52 |
|
| 10 SEMIANNUAL REPORT | | |
| Statement of Assets and Liabilities (unaudited) – continued | | |
| Class R4 shares | | |
|
| Net assets | $54,804 | |
| Shares outstanding | 2,781 | |
|
| Net asset value, offering price, and redemption price | | |
| per share | | $19.71 |
|
| Class R5 shares | | |
|
| Net assets | $54,955 | |
| Shares outstanding | 2,780 | |
|
| Net asset value, offering price, and redemption price | | |
| per share | | $19.76 |
|
| Class 529A shares | | |
|
| Net assets | $577,174 | |
| Shares outstanding | 29,506 | |
|
| Net asset value per share | | $19.56 |
|
| Offering price per share (100/94.25 x net asset value per share) | | $20.75 |
|
| Class 529B shares | | |
|
| Net assets | $164,392 | |
| Shares outstanding | 8,843 | |
|
| Net asset value and offering price per share | | $18.59 |
|
| Class 529C shares | | |
|
| Net assets | $307,884 | |
| Shares outstanding | 16,549 | |
|
| Net asset value and offering price per share | | $18.60 |
|
| Shares outstanding are rounded for presentation purposes. | | |
| On sales of $50,000 or more, the offering price of Class A and Class 529A shares is reduced. A contingent |
| deferred sales charge may be imposed on redemptions of Class A, Class B, Class C, Class 529B and |
| Class 529C shares. | | |
See Notes to Financial Statements | | |
|
| FINANCIAL STATEMENTS | Statement of Operations (unaudited) | |
| This statement describes how much your fund earned in investment income and accrued in | |
| expenses. It also describes any gains and/or losses generated by fund operations. | |
| Six months ended 2/28/06 | | |
| Net investment loss | | |
|
| Income | | |
| Dividends | $3,821,600 | |
| Interest | 776,259 | |
| Foreign taxes withheld | (19,075) | |
|
| Total investment income | | $4,578,784 |
|
| Expenses | | |
| Management fee | $6,093,344 | |
| Distribution and service fees | 3,103,823 | |
| Program manager fees | 1,259 | |
| Shareholder servicing costs | 1,618,651 | |
| Administrative services fee | 78,632 | |
| Retirement plan administration and services fees | 2,318 | |
| Independent trustees’ compensation | 28,457 | |
| Custodian fee | 208,044 | |
| Shareholder communications | 198,354 | |
| Auditing fees | 11,680 | |
| Legal fees | 12,464 | |
| Miscellaneous | 150,267 | |
|
| Total expenses | | $11,507,293 |
|
| Fees paid indirectly | (68,847) | |
| Reduction of expenses by investment adviser | (817,967) | |
|
| Net expenses | | $10,620,479 |
|
| Net investment loss | | $(6,041,695) |
|
| Realized and unrealized gain (loss) on investments | | |
|
| Realized gain (loss) (identified cost basis) | | |
| Investment transactions | $14,684,738 | |
| Foreign currency transactions | 2,771 | |
|
| Net realized gain (loss) on investments and foreign | | |
| currency transactions | | $14,687,509 |
|
| Change in unrealized appreciation (depreciation) on investments | | $73,022,174 |
|
| Net realized and unrealized gain (loss) on investments and | | |
| foreign currency | | $87,709,683 |
|
| Change in net assets from operations | | $81,667,988 |
|
| See Notes to Financial Statements | | |
|
12 SEMIANNUAL REPORT | | |
| FINANCIAL STATEMENTS | Statements of Changes in Net Assets | |
| These statements describe the increases and/or decreases in net assets resulting | |
| from operations, any distributions, and any shareholder transactions. | |
| | Six months ended | Year ended |
| | 2/28/06 | 8/31/05 |
| | (unaudited) | |
| Change in net assets | | |
|
| From operations | | |
|
| Net investment loss | $(6,041,695) | $(923,238) |
| Net realized gain (loss) on investments and foreign | | |
| currency transactions | 14,687,509 | 62,251,745 |
| Net unrealized gain (loss) on investments and foreign | | |
| currency translation | 73,022,174 | 125,826,686 |
|
| Change in net assets from operations | $81,667,988 | $187,155,193 |
|
| Change in net assets from fund share transactions | $(70,261,902) | $(77,169,494) |
|
| Redemption fees | $— | $755 |
|
| Total change in net assets | $11,406,086 | $109,986,454 |
|
| Net assets | | |
|
| At beginning of period | 1,628,554,076 | 1,518,567,622 |
| At end of period (including accumulated net investment | | |
| loss of $7,488,173 and $1,446,478, respectively) | $1,639,960,162 | $1,628,554,076 |
|
| See Notes to Financial Statements | | |
|
| | SEMIANNUAL REPORT 13 |
| FINANCIAL STATEMENTS | Financial Highlights | | | | | | | |
| The financial highlights table is intended to help you understand the fund’s financial performance for the |
| semiannual period and the past 5 fiscal years (or life of a particular share class, if shorter). Certain information |
| reflects financial results for a single fund share. The total returns in the table represent the rate by which an |
| investor would have earned (or lost) on an investment in the fund share class (assuming reinvestment of all |
| distributions) held for the entire period. | | | | | | | | | |
| Six months | | | | | | | | | |
| | ended | | Years ended 8/31 |
| Class A | 2/28/06 | | 2005 | 2004 | | 2003 | | 2002 | | 2001 |
| (unaudited) | | | | | | | | | |
| Net asset value, beginning of | | | | | | | | | | |
| period | $18.76 | | $16.62 | $16.57 | | $14.03 | | $19.22 | | $39.19 |
|
| Income (loss) from | | | | | | | | | | |
| investment operations | | | | | | | | | | |
|
| Net investment income (loss) (d) | $(0.07) | | $0.01 | $(0.08) | | $(0.07) | | $(0.13) | | $(0.17) |
| Net realized and unrealized | | | | | | | | | | |
| gain (loss) on investments and | | | | | | | | | | |
| foreign currency | 1.03 | | 2.13 | 0.13 | | 2.61 | | (4.97) | | (15.53) |
|
| Total from investment operations | $0.96 | | $2.14 | $0.05 | | $2.54 | | $(5.10) | | $(15.70) |
|
| Less distributions declared | | | | | | | | | | |
| to shareholders | | | | | | | | | | |
|
| From net realized gain on | | | | | | | | | | |
| investments and foreign | | | | | | | | | | |
| currency transactions | $— | | $— | $— | | $— | | $(0.09) | | $(4.27) |
|
| Net asset value, end of period | $19.72 | | $18.76 | $16.62 | | $16.57 | | $14.03 | | $19.22 |
|
| Total return (%) (t)(s)(r) | 5.12 | (n) | 12.88 | 0.30 | (b) | 18.10 | (j) | (26.70) | | (42.93) |
|
| Ratios (%) (to average net assets) | | | | | | | | | |
| and Supplemental data: | | | | | | | | | | |
|
| Expenses before expense reductions (f) 1.38(a) | | 1.38 | 1.37 | | 1.41 | | 1.45 | | 1.37 |
| Expenses after expense reductions (f) 1.28(a) | | 1.28 | 1.32 | | 1.41 | | 1.45 | | 1.37 |
| Net investment income (loss) | (0.71) | (a) | 0.05 | (0.46) | | (0.46) | | (0.74) | | (0.67) |
| Portfolio turnover | 100 | | 69 | 80 | | 72 | | 116 | | 104 |
| Net assets at end of period | | | | | | | | | | |
| (000 Omitted) | $482,083 | | $518,618 | $563,761 | | $673,767 | | $731,283 | | $984,529 |
|
| See Notes to Financial Statements | | | | | | | | | |
|
14 SEMIANNUAL REPORT | | | | | | | | | | |
| Financial Highlights – continued | | | | | | | | |
| Six months | | | | | | | | |
| | ended | | Years ended 8/31 |
| Class B | 2/28/06 | | 2005 | 2004 | | 2003 | | 2002 | 2001 |
| (unaudited) | | | | | | | | |
| Net asset value, beginning of | | | | | | | | | | |
| period | $17.88 | | $15.95 | $16.00 | | $13.65 | | $18.80 | $38.45 |
|
| Income (loss) from | | | | | | | | | | |
| investment operations | | | | | | | | | | |
|
| Net investment loss (d) | $(0.12) | | $(0.10) | $(0.19) | | $(0.16) | | $(0.24) | $(0.33) |
| Net realized and unrealized | | | | | | | | | | |
| gain (loss) on investments and | | | | | | | | | | |
| foreign currency | | 0.98 | | 2.03 | 0.14 | | 2.51 | | (4.82) | (15.23) |
|
| Total from investment operations | | $0.86 | | $1.93 | $(0.05) | | $2.35 | | $(5.06) | $(15.56) |
|
| Less distributions declared | | | | | | | | | | |
| to shareholders | | | | | | | | | | |
|
| From net realized gain on | | | | | | | | | | |
| investments and foreign | | | | | | | | | | |
| currency transactions | | $— | | $— | $— | | $— | | $(0.09) | $(4.09) |
|
| Net asset value, end of period | $18.74 | | $17.88 | $15.95 | | $16.00 | | $13.65 | $18.80 |
|
| Total return (%) (t)(s)(r) | | 4.81 | (n) | 12.10 | (0.31) | (b) | 17.22 | (j) | (27.08) | (43.32) |
|
| Ratios (%) (to average net assets) | | | | | | | | | |
| and Supplemental data: | | | | | | | | | | |
|
| Expenses before expense reductions (f) | 2.03 | (a) | 2.02 | 2.02 | | 2.06 | | 2.10 | 2.02 |
| Expenses after expense reductions (f) | 1.93 | (a) | 1.92 | 1.97 | | 2.06 | | 2.10 | 2.02 |
| Net investment loss | | (1.36) | (a) | (0.60) | (1.10) | | (1.12) | | (1.39) | (1.32) |
| Portfolio turnover | | 100 | | 69 | 80 | | 72 | | 116 | 104 |
| Net assets at end of period | | | | | | | | | | |
| (000 Omitted) | $331,730 | | $381,085 | $427,364 | | $505,090 | | $490,326 | $820,848 |
|
| See Notes to Financial Statements | | | | | | | | |
|
| | | | | | | | SEMIANNUAL REPORT 15 |
| Financial Highlights – continued | | | | | | | | | |
| Six months | | | | | | | | | |
| | ended | | Years ended 8/31 |
| Class C | 2/28/06 | | 2005 | 2004 | | 2003 | | 2002 | | 2001 |
| (unaudited) | | | | | | | | | |
| Net asset value, beginning of | | | | | | | | | | |
| period | $17.92 | | $15.98 | $16.03 | | $13.67 | | $18.84 | | $38.54 |
|
| Income (loss) from | | | | | | | | | | |
| investment operations | | | | | | | | | | |
|
| Net investment loss (d) | $(0.12) | | $(0.10) | $(0.19) | | $(0.16) | | $(0.24) | | $(0.34) |
| Net realized and unrealized | | | | | | | | | | |
| gain (loss) on investments and | | | | | | | | | | |
| foreign currency | 0.97 | | 2.04 | 0.14 | | 2.52 | | (4.84) | | (15.25) |
|
| Total from investment operations | $0.85 | | $1.94 | $(0.05) | | $2.36 | | $(5.08) | | $(15.59) |
|
| Less distributions declared | | | | | | | | | | |
| to shareholders | | | | | | | | | | |
|
| From net realized gain on | | | | | | | | | | |
| investments and foreign currency | | | | | | | | | | |
| transactions | $— | | $— | $— | | $— | | $(0.09) | | $(4.11) |
|
| Net asset value, end of period | $18.77 | | $17.92 | $15.98 | | $16.03 | | $13.67 | | $18.84 |
|
| Total return (%) (t)(s)(r) | 4.74 | (n) | 12.14 | (0.31) | (b) | 17.26 | (j) | (27.13) | | (43.29) |
|
| Ratios (%) (to average net assets) | | | | | | | | | | |
| and Supplemental data: | | | | | | | | | | |
|
| Expenses before expense reductions (f) 2.03(a) | | 2.02 | 2.02 | | 2.06 | | 2.10 | | 2.02 |
| Expenses after expense reductions (f) | 1.93 | (a) | 1.92 | 1.97 | | 2.06 | | 2.10 | | 2.02 |
| Net investment loss | (1.36) | (a) | (0.58) | (1.10) | | (1.12) | | (1.39) | | (1.32) |
| Portfolio turnover | 100 | | 69 | 80 | | 72 | | 116 | | 104 |
| Net assets at end of period | | | | | | | | | | |
| (000 Omitted) | $80,637 | | $89,290 | $114,023 | | $141,307 | | $148,930 | | $270,903 |
|
| See Notes to Financial Statements | | | | | | | | | |
|
16 SEMIANNUAL REPORT | | | | | | | | | | |
| Financial Highlights – continued | | | | | | | | | | | |
| | Six months | | | | | | | | | | |
| | | ended | | Years ended 8/31 |
| Class I | | 2/28/06 | | 2005 | | 2004 | | 2003 | | 2002 | | 2001 |
| | (unaudited) | | | | | | | | | | |
| Net asset value, beginning of | | | | | | | | | | | | |
| period | | $19.22 | | $16.97 | | $16.86 | | $14.24 | | $19.41 | | $39.53 |
|
| Income (loss) from | | | | | | | | | | | | |
| investment operations | | | | | | | | | | | | |
|
| Net investment income (loss) (d) | $(0.04) | | $0.07 | | $(0.01) | | $(0.01) | | $(0.07) | | $(0.08) |
| Net realized and unrealized gain | | | | | | | | | | | |
| (loss) on investments and foreign | | | | | | | | | | | |
| currency | | 1.06 | | 2.18 | | 0.12 | | 2.63 | | (5.01) | | (15.68) |
|
| Total from investment operations | | $1.02 | | $2.25 | | $0.11 | | $2.62 | | $(5.08) | | $(15.76) |
|
| Less distributions declared | | | | | | | | | | | | |
| to shareholders | | | | | | | | | | | | |
|
| From net realized gain on | | | | | | | | | | | | |
| investments and foreign currency | | | | | | | | | | | |
| transactions | | $— | | $— | | $— | | $— | | $(0.09) | | $(4.36) |
|
| Net asset value, end of period | | $20.24 | | $19.22 | | $16.97 | | $16.86 | | $14.24 | | $19.41 |
|
| Total return (%) (s)(r) | | 5.31 | (n) | 13.26 | | 0.65 | (b) | 18.40 | (j) | (26.37) | | (42.73) |
|
| Ratios (%) (to average net assets) | | | | | | | | | | | |
| and Supplemental data: | | | | | | | | | | | | |
|
| Expenses before expense reductions (f) | 1.04 | (a) | 1.01 | | 1.01 | | 1.06 | | 1.10 | | 1.02 |
| Expenses after expense reductions (f) | 0.94 | (a) | 0.91 | | 0.96 | | 1.06 | | 1.10 | | 1.02 |
| Net investment income (loss) | | (0.37) | (a) | 0.35 | | (0.06) | | (0.10) | | (0.39) | | (0.32) |
| Portfolio turnover | | 100 | | 69 | | 80 | | 72 | | 116 | | 104 |
| Net assets at end of period | | | | | | | | | | | | |
| (000 Omitted) | $739,050 | | $633,593 | | $405,006 | | $163,758 | | $26,193 | | $28,455 |
|
| See Notes to Financial Statements | | | | | | | | | | |
|
| | | | | | | | | SEMIANNUAL REPORT 17 |
| Financial Highlights – continued | | | | | | | | |
| | Six months | | | | | | | |
| | ended | | Years ended 8/31 | |
| Class R | 2/28/06 | | 2005 | | 2004 | | 2003(i) | |
| | (unaudited) | | | | | | | |
| Net asset value, beginning of period | $18.68 | | $16.58 | | $16.55 | | $13.92 | |
| |
| Income (loss) from investment operations | | | | | | | | |
| |
| Net investment loss (d) | $(0.08) | | $(0.03) | | $(0.09) | | $(0.06) | |
| Net realized and unrealized gain (loss) on investments | | | | | | | |
| and foreign currency | 1.03 | | 2.13 | | 0.12 | | 2.69 | |
| |
| Total from investment operations | $0.95 | | $2.10 | | $0.03 | | $2.63 | |
| |
| Net asset value, end of period | $19.63 | | $18.68 | | $16.58 | | $16.55 | |
| |
| Total return (%) (s)(r) | 5.09 | (n) | 12.67 | | 0.18 | (b) | 18.89 | (j)(n) |
| |
| Ratios (%) (to average net assets) | | | | | | | | |
| and Supplemental data: | | | | | | | | |
| |
| Expenses before expense reductions (f) | 1.53 | (a) | 1.53 | | 1.49 | | 1.60 | (a) |
| Expenses after expense reductions (f) | 1.43 | (a) | 1.43 | | 1.44 | | 1.60 | (a) |
| Net investment loss | (0.86) | (a) | (0.16) | | (0.52) | | (0.60) | (a) |
| Portfolio turnover | 100 | | 69 | | 80 | | 72 | |
| Net assets at end of period (000 Omitted) | $3,732 | | $3,784 | | $1,982 | | $221 | |
| |
| | Six months | | Year | |
| | ended | | ended | |
| Class R1 | 2/28/06 | | 8/31/05(i) | |
| | (unaudited) | | | |
| Net asset value, beginning of period | $17.87 | | $17.19 | |
| |
| Income (loss) from investment operations | | | | |
| |
| Net investment loss (d) | $(0.13) | | $(0.08) | |
| Net realized and unrealized gain (loss) on investments and foreign currency | 0.97 | | 0.76 | |
| |
| Total from investment operations | $0.84 | | $0.68 | |
| |
| Net asset value, end of period | $18.71 | | $17.87 | |
| |
| Total return (%) (s)(r) | 4.70 | (n) | 3.96 | (n) |
| |
| Ratios (%) (to average net assets) | | | | |
| and Supplemental data: | | | | |
| |
| Expenses before expense reductions (f) | 2.23 | (a) | 2.23 | (a) |
| Expenses after expense reductions (f) | 2.05 | (a) | 2.13 | (a) |
| Net investment loss | (1.48) | (a) | (1.06) | (a) |
| Portfolio turnover | 100 | | 69 | |
| Net assets at end of period (000 Omitted) | $217 | | $204 | |
| |
| See Notes to Financial Statements | | | | |
| |
18 SEMIANNUAL REPORT | | | | |
| Financial Highlights – continued | | | | |
| | Six months | | Year | |
| | ended | | ended | |
| Class R2 | 2/28/06 | | 8/31/05(i) | |
| | (unaudited) | | | |
| Net asset value, beginning of period | $17.89 | | $17.19 | |
| |
| Income (loss) from investment operations | | | | |
| |
| Net investment loss (d) | $(0.11) | | $(0.05) | |
| Net realized and unrealized gain (loss) on investments and foreign currency | 0.99 | | 0.75 | |
| |
| Total from investment operations | $0.88 | | $0.70 | |
| |
| Net asset value, end of period | $18.77 | | $17.89 | |
| |
| Total return (%) (s)(r) | 4.92 | (n) | 4.07 | (n) |
| |
| Ratios (%) (to average net assets) | | | | |
| and Supplemental data: | | | | |
| |
| Expenses before expense reductions (f) | 1.95 | (a) | 1.95 | (a) |
| Expenses after expense reductions (f) | 1.71 | (a) | 1.85 | (a) |
| Net investment loss | (1.13) | (a) | (0.80) | (a) |
| Portfolio turnover | 100 | | 69 | |
| Net assets at end of period (000 Omitted) | $353 | | $133 | |
| |
| | Six months | | | | | |
| | ended | | Years ended 8/31 | |
| Class R3 | 2/28/06 | | 2005 | | 2004(i) | |
| | (unaudited) | | | | | |
| Net asset value, beginning of period | $18.60 | | $16.55 | | $16.99 | |
| |
| Income (loss) from investment operations | | | | | | |
| |
| Net investment loss (d) | $(0.10) | | $(0.10) | | $(0.10) | |
| Net realized and unrealized gain (loss) on investments | | | | | | |
| and foreign currency | 1.02 | | 2.15 | | (0.34) | |
| |
| Total from investment operations | $0.92 | | $2.05 | | $(0.44) | |
| |
| Net asset value, end of period | $19.52 | | $18.60 | | $16.55 | |
| |
| Total return (%) (s)(r) | 4.95 | (n) | 12.39 | | (2.59) | (b)(n) |
| |
| Ratios (%) (to average net assets) | | | | | | |
| and Supplemental data: | | | | | | |
| |
| Expenses before expense reductions (f) | 1.79 | (a) | 1.78 | | 1.71 | (a) |
| Expenses after expense reductions (f) | 1.60 | (a) | 1.68 | | 1.66 | (a) |
| Net investment loss | (1.02) | (a) | (0.53) | | (0.74) | (a) |
| Portfolio turnover | 100 | | 69 | | 80 | |
| Net assets at end of period (000 Omitted) | $999 | | $822 | | $309 | |
| |
| See Notes to Financial Statements | | | | | | |
| |
| | | | SEMIANNUAL REPORT 19 |
| Financial Highlights – continued | | | | |
| | Six months | | Year | |
| | ended | | ended | |
| Class R4 | 2/28/06 | | 8/31/05(i) | |
| | (unaudited) | | | |
| Net asset value, beginning of period | $18.75 | | $17.98 | |
| |
| Income (loss) from investment operations | | | | |
| |
| Net investment loss (d) | $(0.07) | | $(0.03) | |
| Net realized and unrealized gain (loss) on investments and foreign currency | 1.03 | | 0.80 | |
| |
| Total from investment operations | $0.96 | | $0.77 | |
| |
| Net asset value, end of period | $19.71 | | $18.75 | |
| |
| Total return (%) (s)(r) | 5.12 | (n) | 4.28 | (n) |
| |
| Ratios (%) (to average net assets) | | | | |
| and Supplemental data: | | | | |
| |
| Expenses before expense reductions (f) | 1.44 | (a) | 1.45 | (a) |
| Expenses after expense reductions (f) | 1.34 | (a) | 1.35 | (a) |
| Net investment loss | (0.77) | (a) | (0.37) | (a) |
| Portfolio turnover | 100 | | 69 | |
| Net assets at end of period (000 Omitted) | $55 | | $52 | |
| |
| Six months | | Year | |
| | ended | | ended | |
| Class R5 | 2/28/06 | | 8/31/05(i) | |
| | (unaudited) | | | |
| Net asset value, beginning of period | $18.78 | | $17.98 | |
| |
| Income (loss) from investment operations | | | | |
| |
| Net investment loss (d) | $(0.04) | | $(0.01) | |
| Net realized and unrealized gain (loss) on investments and foreign currency | 1.02 | | 0.81 | |
| |
| Total from investment operations | $0.98 | | $0.80 | |
| |
| Net asset value, end of period | $19.76 | | $18.78 | |
| |
| Total return (%) (s)(r) | 5.22 | (n) | 4.45 | (n) |
| |
| Ratios (%) (to average net assets) | | | | |
| and Supplemental data: | | | | |
| |
| Expenses before expense reductions (f) | 1.14 | (a) | 1.15 | (a) |
| Expenses after expense reductions (f) | 1.04 | (a) | 1.05 | (a) |
| Net investment loss | (0.47) | (a) | (0.07) | (a) |
| Portfolio turnover | 100 | | 69 | |
| Net assets at end of period (000 Omitted) | $55 | | $52 | |
| |
| See Notes to Financial Statements | | | | |
| |
20 SEMIANNUAL REPORT | | | | |
| Financial Highlights – continued | | | | | | | | | | |
| | Six months | | | | | | | | | |
| | ended | | Years ended 8/31 | |
| Class 529A | 2/28/06 | | 2005 | | 2004 | | 2003 | | 2002(i) | |
| | (unaudited) | | | | | | | | | |
| Net asset value, beginning of period | $18.63 | | $16.55 | | $16.52 | | $14.03 | | $13.89 | |
| |
| Income (loss) from investment operations | | | | | | | | | |
| |
| Net investment loss (d) | $(0.09) | | $(0.04) | | $(0.12) | | $(0.10) | | $(0.01) | |
| Net realized and unrealized gain (loss) on | | | | | | | | | | |
| investments and foreign currency | 1.02 | | 2.12 | | 0.15 | | 2.59 | | 0.15 | |
| |
| Total from investment operations | $0.93 | | $2.08 | | $0.03 | | $2.49 | | $0.14 | |
| |
| Net asset value, end of period | $19.56 | | $18.63 | | $16.55 | | $16.52 | | $14.03 | |
| |
| Total return (%) (t)(s)(r) | 4.99 | (n) | 12.57 | | 0.18 | (b) | 17.75(j) | | 1.01 | (n) |
| |
| Ratios (%) (to average net assets) | | | | | | | | | | |
| and Supplemental data: | | | | | | | | | | |
| |
| Expenses before expense reductions (f) | 1.64 | (a) | 1.62 | | 1.61 | | 1.67 | | 1.70 | (a) |
| Expenses after expense reductions (f) | 1.54 | (a) | 1.52 | | 1.56 | | 1.67 | | 1.70 | (a) |
| Net investment loss | (0.96) | (a) | (0.25) | | (0.68) | | (0.69) | | (0.74) | (a) |
| Portfolio turnover | 100 | | 69 | | 80 | | 72 | | 116 | |
| Net assets at end of period (000 Omitted) | $577 | | $481 | | $394 | | $225 | | $5 | |
| |
| | Six months | | | | | | | | | |
| | ended | | Years ended 8/31 | |
| Class 529B | 2/28/06 | | 2005 | | 2004 | | 2003 | | 2002(i) | |
| | (unaudited) | | | | | | | | | |
| Net asset value, beginning of period | $17.76 | | $15.88 | | $15.97 | | $13.65 | | $13.52 | |
| |
| Income (loss) from investment operations | | | | | | | | | |
| |
| Net investment loss (d) | $(0.15) | | $(0.15) | | $(0.22) | | $(0.19) | | $(0.02) | |
| Net realized and unrealized gain (loss) on | | | | | | | | | | |
| investments and foreign currency | 0.98 | | 2.03 | | 0.13 | | 2.51 | | 0.15 | |
| |
| Total from investment operations | $0.83 | | $1.88 | | $(0.09) | | $2.32 | | $0.13 | |
| |
| Net asset value, end of period | $18.59 | | $17.76 | | $15.88 | | $15.97 | | $13.65 | |
| |
| Total return (%) (t)(s)(r) | 4.67 | (n) | 11.84 | | (0.56) | (b) | 17.00 | (j) | 0.96 | (n) |
| |
| Ratios (%) (to average net assets) | | | | | | | | | | |
| and Supplemental data: | | | | | | | | | | |
| |
| Expenses before expense reductions (f) | 2.29 | (a) | 2.27 | | 2.25 | | 2.33 | | 2.35 | (a) |
| Expenses after expense reductions (f) | 2.19 | (a) | 2.17 | | 2.20 | | 2.33 | | 2.35 | (a) |
| Net investment loss | (1.60) | (a) | (0.88) | | (1.31) | | (1.37) | | (1.39) | (a) |
| Portfolio turnover | 100 | | 69 | | 80 | | 72 | | 116 | |
| Net assets at end of period (000 Omitted) | $164 | | $151 | | $143 | | $79 | | $5 | |
| |
| See Notes to Financial Statements | | | | | | | | | | |
| |
| | | | | | SEMIANNUAL REPORT 21 | |
| Financial Highlights – continued | | | | | | | | | | |
| | Six months | | | | | | | | | |
| | ended | | Years ended 8/31 | |
| Class 529C | 2/28/06 | | 2005 | | 2004 | | 2003 | | 2002(i) | |
| | (unaudited) | | | | | | | | | |
| Net asset value, beginning of period | $17.78 | | $15.90 | | $15.99 | | $13.67 | | $13.54 | |
| |
| Income (loss) from investment operations | | | | | | | | | |
| |
| Net investment loss (d) | $(0.15) | | $(0.16) | | $(0.22) | | $(0.19) | | $(0.02) | |
| Net realized and unrealized gain (loss) on | | | | | | | | | | |
| investments and foreign currency | 0.97 | | 2.04 | | 0.13 | | 2.51 | | 0.15 | |
| |
| Total from investment operations | $0.82 | | $1.88 | | $(0.09) | | $2.32 | | $0.13 | |
| |
| Net asset value, end of period | $18.60 | | $17.78 | | $15.90 | | $15.99 | | $13.67 | |
| |
| Total return (%) (t)(s)(r) | 4.61 | (n) | 11.82 | | (0.56) | (b) | 16.97 | (j) | 0.96 | (n) |
| |
| Ratios (%) (to average net assets) | | | | | | | | | | |
| and Supplemental data: | | | | | | | | | | |
| |
| Expenses before expense reductions (f) | 2.29 | (a) | 2.27 | | 2.25 | | 2.30 | | 2.35 | (a) |
| Expenses after expense reductions (f) | 2.19 | (a) | 2.17 | | 2.20 | | 2.30 | | 2.35 | (a) |
| Net investment loss | (1.61) | (a) | (0.91) | | (1.29) | | (1.35) | | (1.38) | (a) |
| Portfolio turnover | 100 | | 69 | | 80 | | 72 | | 116 | |
| Net assets at end of period (000 Omitted) | $308 | | $290 | | $221 | | $58 | | $5 | |
| |
| Any redemption fees charged by the fund during the 2004 and 2005 fiscal years resulted in a per share |
| impact of less than $0.01. |
| (i) | For the period from the class’ inception, December 31, 2002 (Class R), July 31, 2002 (Classes 529A, 529B, |
| | and 529C), October 31, 2003 (Class R3) and April 1, 2005 (Classes R1, R2, R4, and R5) through the |
| | stated period end. |
| (r) | Certain expenses have been reduced without which performance would have been lower. |
| (n) | Not annualized. |
| (a) | Annualized. |
| (d) | Per share data are based on average shares outstanding. |
| (f) | Ratios do not reflect reductions from fees paid indirectly. |
| (t) | Total returns do not include any applicable sales charges. |
| (s) | From time to time the fund may receive proceeds from litigation settlements, without which performance |
| | would be lower. |
| (b) | The fund’s net asset value and total return calculation included a non-recurring accrual recorded as a result |
| | of an administrative proceeding regarding disclosure of brokerage allocation practices in connection with |
| | fund sales. The non-recurring accrual did not have a material impact on the net asset value per share |
| | based on the shares outstanding on the day the proceeds were recorded. |
| (j) | The fund’s net asset value and total return calculation include proceeds received on March 26, 2003 for |
| | the partial payment of a non-recurring litigation settlement from Cendant Corporation, recorded as a |
| | realized gain on investment transactions. The proceeds resulted in an increase in the net asset value of |
| | $0.01 per share based on shares outstanding on the day the proceeds were received. Excluding the effect |
| | of this payment from the ending net asset value per share, the Class A, Class B, Class C, Class I, Class R, |
| | Class 529A, Class 529B and Class 529C total returns for the year ended August 31, 2003 would |
| | have been lower by approximately 0.08%, 0.09%, 0.08%, 0.09%, 0.08%, 0.09%, 0.09% and |
| | 0.09%, respectively. |
See Notes to Financial Statements |
22 SEMIANNUAL REPORT
NOTES TO FINANCIAL STATEMENTS (unaudited)
(1) Business and Organization
MFS Strategic Growth Fund (the fund) is a series of MFS Series Trust I (the trust). The trust is organized as a Massachusetts business trust and is registered under the Investment Company Act of 1940, as amended, as an open-end management investment company.
(2) Significant Accounting Policies
General – The preparation of financial statements in conformity with U.S. generally accepted accounting principles requires management to make estimates and assumptions that affect the reported amounts of assets and liabilities, and disclosure of contingent assets and liabilities at the date of the financial statements and the reported amounts of revenues and expenses during the reporting period. Actual results could differ from those estimates. The fund can invest in foreign securities, including securities of emerging market issuers. Investments in foreign securities are vulnerable to the effects of changes in the relative values of the local currency and the U.S. dollar and to the effects of changes in each country’s legal, political, and economic environment. The markets of emerging markets countries are generally more volatile than the markets of developed countries with more mature economies. All of the risks of investing in foreign securities previously described are heightened when investing in emerging markets countries.
Investment Valuations – Equity securities, including restricted equity securities, are generally valued at the last sale or official closing price as reported by an independent pricing service on the market or exchange on which they are primarily traded. For securities for which there were no sales during the day, equity securities are generally valued at the last quoted bid price as reported by an independent pricing service on the market or exchange on which they are primarily traded. Short-term instruments with a maturity at issuance of 365 days or less are generally valued at amortized cost, which approximates market value. Open-end investment companies are generally valued at their net asset value per share. Securities and other assets generally valued on the basis of information from an independent pricing service may also be valued on the basis of information from brokers and dealers. The values of foreign securities and other assets and liabilities expressed in foreign currencies are converted to U.S. dollars based upon exchange rates provided by an independent source. When pricing-service information or market quotations are not readily available, securities are priced at fair value as determined under the direction of the Board of Trustees. For example, in valuing securities that trade principally on foreign markets, events reasonably determined to be significant (such as certain movements in the U.S. securities market, or other regional and local developments) may occur between the time that foreign markets close (where the security is principally traded) and the fund’s valuation time that may impact the value of securities traded in these foreign markets. In these cases, the fund may utilize information from an external vendor or other sources to adjust closing market prices of foreign equity securities to reflect what it believes to be the fair value of the securities as of the fund’s valuation time. Fair valuation of foreign equity securities may
SEMIANNUAL REPORT 23
Notes to Financial Statements (unaudited) – continued
occur frequently based on an assessment that events which occur on a fairly regular basis (such as U.S. market movements) are significant.
Repurchase Agreements – The fund may enter into repurchase agreements with institutions that the fund’s investment adviser has determined are creditworthy. Each repurchase agreement is recorded at cost. The fund requires that the securities collateral in a repurchase transaction be transferred to the custodian in a manner sufficient to enable the fund to obtain those securities in the event of a default under the repurchase agreement. The fund monitors, on a daily basis, the value of the collateral to ensure that its value, including accrued interest, is greater than amounts owed to the fund under each such repurchase agreement. The fund, along with other affiliated entities of Massachusetts Financial Services Company (MFS), may utilize a joint trading account for the purpose of entering into one or more repurchase agreements.
Foreign Currency Translation – Purchases and sales of foreign investments, income, and expenses are converted into U.S. dollars based upon currency exchange rates prevailing on the respective dates of such transactions. Gains and losses attributable to foreign currency exchange rates on sales of securities are recorded for financial statement purposes as net realized gains and losses on investments. Gains and losses attributable to foreign exchange rate movements on income and expenses are recorded for financial statement purposes as foreign currency transaction gains and losses. That portion of both realized and unrealized gains and losses on investments that results from fluctuations in foreign currency exchange rates is not separately disclosed.
Security Loans – State Street Bank and Trust Company (‘‘State Street’’), as lending agent, may loan the securities of the fund to certain qualified institutions (the ‘‘Borrowers’’) approved by the fund. The loans are collateralized at all times by cash and/or U.S. Treasury securities in an amount at least equal to the market value of the securities loaned. State Street provides the fund with indemnification against Borrower default. The fund bears the risk of loss with respect to the investment of cash collateral. On loans collateralized by cash, the cash collateral is invested in a money market fund or short-term securities. A portion of the income generated upon investment of the collateral is remitted to the Borrowers, and the remainder is allocated between the fund and the lending agent. On loans collateralized by U.S. Treasury securities, a fee is received from the Borrower, and is allocated between the fund and the lending agent. Income from securities lending is included in interest income on the Statement of Operations. The dividend and interest income earned on the securities loaned is accounted for in the same manner as other dividend and interest income.
Short Term Fees – For purchases made on or after July 1, 2004 and before April 1, 2005, the fund charged a 2% redemption fee (which was retained by the fund) on proceeds from Class A, Class B, Class C, and Class I shares redeemed or exchanged within 5 business days following their acquisition (either by purchase or exchange). Effective April 1, 2005, the fund no longer
24 SEMIANNUAL REPORT
Notes to Financial Statements (unaudited) – continued
charges a redemption fee. See the fund’s prospectus for details. Any redemption fees charged are accounted for as an addition to paid-in capital.
Investment Transactions and Income – Investment transactions are recorded on the trade date. Interest income is recorded on the accrual basis. All premium and discount is amortized or accreted for financial statement purposes in accordance with U.S. generally accepted accounting principles. All discount is accreted for tax reporting purposes as required by federal income tax regulations. Dividends received in cash are recorded on the ex-dividend date. Certain dividends from foreign securities will be recorded when the fund is informed of the dividend if such information is obtained subsequent to the ex-dividend date. Dividend and interest payments received in additional securities are recorded on the ex-dividend or ex-interest date in an amount equal to the value of the security on such date.
The fund may receive proceeds from litigation settlements involving its portfolio holdings. Any proceeds received are reflected in realized gain/loss in the Statement of Operations, or in unrealized gain/loss if the security is still held by the fund.
Fees Paid Indirectly – The fund’s custody fee is reduced according to an arrangement that measures the value of cash deposited with the custodian by the fund. During the six months ended February 28, 2006, the fund’s custodian fees were reduced by $61,016 under this arrangement. The fund has entered into a commission recapture agreement, under which certain brokers will credit the fund a portion of the commissions generated, to offset certain expenses of the fund. For the six months ended February 28, 2006, the fund’s custodian expenses were reduced by $7,831 under this agreement. These amounts are shown as a reduction of total expenses on the Statement of Operations. Effective January 1, 2006, the commission recapture agreement was terminated.
Tax Matters and Distributions – The fund intends to continue to qualify as a regulated investment company, as defined under Subchapter M of the Internal Revenue Code, and to distribute all of its taxable income, including realized capital gains. Accordingly, no provision for federal income tax is required in the financial statements. Foreign taxes, if any, have been accrued by the fund in the accompanying financial statements.
Distributions to shareholders are recorded on the ex-dividend date. Income and capital gain distributions are determined in accordance with income tax regulations, which may differ from generally accepted accounting principles. Certain capital accounts in the financial statements are periodically adjusted for permanent differences in order to reflect their tax character. These adjustments have no impact on net assets or net asset value per share. Temporary differences which arise from recognizing certain items of income, expense, gain or loss in different periods for financial statement and tax purposes will reverse at some time in the future. Distributions in excess of net investment income or net realized gains are temporary overdistributions for
SEMIANNUAL REPORT 25
Notes to Financial Statements (unaudited) – continued
financial statement purposes resulting from differences in the recognition or classification of income for financial statement and tax purposes.
Book/tax differences primarily relate to net operating losses, foreign currency transactions, defaulted bonds and wash sales.
The fund declared no distributions for the years ended August 31, 2005 and August 31, 2004.
The federal tax cost and the tax basis components of distributable earnings were as follows:
| As of February 28, 2006 | |
| Cost of investments(1) | $1,645,637,761 |
|
| Gross appreciation | $133,752,938 |
| Gross depreciation | (33,828,118) |
|
| Net unrealized appreciation (depreciation) | $99,924,820 |
| As of August 31, 2005 | |
| Capital loss carryforwards | $(1,380,142,592) |
| Other temporary differences | (1,446,478) |
| Net unrealized appreciation (depreciation) | 16,902,647 |
(1) Aggregate cost includes prior fiscal year end tax adjustments.
As of August 31, 2005, the fund had available capital loss carryforwards to offset future realized gains. Such losses expire as follows:
| August 31, 2009 | $(186,542,212) |
| August 31, 2010 | (863,824,612) |
| August 31, 2011 | (299,742,793) |
| August 31, 2012 | (30,032,975) |
|
| Total | | | $(1,380,142,592) |
The availability of a portion of the capital loss carryforwards, which were acquired on June 10, 2005 in connection with the MFS Managed Sectors Fund merger, may be limited in a given year.
Multiple Classes of Shares of Beneficial Interest – The fund offers multiple classes of shares, which differ in their respective distribution and service fees. All shareholders bear the common expenses of the fund based on daily net assets of each class, without distinction between share classes. Dividends are declared separately for each class. Differences in per share dividend rates are generally due to differences in separate class expenses. Class B and Class 529B shares will convert to Class A and Class 529A shares, respectively, approximately eight years after purchase.
(3) Transactions with Affiliates
Investment Adviser – The fund has an investment advisory agreement with Massachusetts Financial Services Company (MFS) to provide overall investment advisory and administrative services, and general office facilities. The management fee is computed daily and paid monthly at an annual rate of 0.75% of the fund’s average daily net assets. As part of a settlement
26 SEMIANNUAL REPORT
Notes to Financial Statements (unaudited) – continued
agreement with the New York Attorney General concerning market timing and related matters, MFS has agreed to reduce the management fee to 0.65% of the fund’s average daily net assets for the period March 1, 2004 through February 28, 2009. For the six months ended February 28, 2006, this waiver amounted to $812,335 and is reflected as a reduction of total expenses in the Statement of Operations.
The management fee incurred for the six months ended February 28, 2006 was equivalent to an annual effective rate of 0.65% of the fund’s average daily net assets.
Distributor – MFS Fund Distributors, Inc. (MFD), a wholly owned subsidiary of MFS, as distributor, received $28,050 and $470 for the six months ended February 28, 2006, as its portion of the initial sales charge on sales of Class A and Class 529A shares of the fund, respectively.
The Board of Trustees has adopted a distribution plan for certain class shares pursuant to Rule 12b-1 of the Investment Company Act of 1940.
The fund’s distribution plan provides that the fund will pay MFD for services provided by MFD and financial intermediaries in connection with the distribution and servicing of certain share classes. One component of the plan is a distribution fee paid to MFD and another component of the plan is a service fee paid to MFD. MFD may subsequently pay all, or a portion, of the distribution and/or service fees to financial intermediaries.
| Distribution Fee Plan Table: | | | | |
| | | | | Total | Annual | Distribution |
| | | Distribution | Service | Distribution | Effective | and Service |
| | | Fee Rate | Fee Rate | Plan(1) | Rate(2) | Fee |
| Class A | 0.10% | 0.25% | 0.35% | 0.35% | $875,022 |
| Class B | 0.75% | 0.25% | 1.00% | 1.00% | 1,789,169 |
| Class C | 0.75% | 0.25% | 1.00% | 1.00% | 422,930 |
| Class R | 0.25% | 0.25% | 0.50% | 0.50% | 9,434 |
| Class R1 | 0.50% | 0.25% | 0.75% | 0.75% | 780 |
| Class R2 | 0.25% | 0.25% | 0.50% | 0.50% | 684 |
| Class R3 | 0.25% | 0.25% | 0.50% | 0.50% | 2,484 |
| Class R4 | — | 0.25% | 0.25% | 0.25% | 66 |
| Class 529A | 0.25% | 0.25% | 0.50% | 0.35% | 959 |
| Class 529B | 0.75% | 0.25% | 1.00% | 1.00% | 800 |
| Class 529C | 0.75% | 0.25% | 1.00% | 1.00% | 1,495 |
|
| Total Distribution and Service Fees | | | | $3,103,823 |
| (1) | In accordance with the distribution plan for certain classes, the fund pays distribution and/or service fees up to these annual percentage rates of each
class’ average daily net assets. |
| |
| (2) | The annual effective rates represent actual fees incurred under the distribution plan for the six months ended February 28, 2006 based on each class’
average daily net assets. 0.10% of the Class 529A distribution fee is currently being paid by the fund. Payment of the remaining 0.15% of the Class
529A distribution fee is not yet implemented and will commence on such date as the fund’s Board of Trustees may determine. |
| |
Certain Class A, Class C and Class 529C shares are subject to a contingent deferred sales charge in the event of a shareholder redemption within 12
SEMIANNUAL REPORT 27
Notes to Financial Statements (unaudited) – continued
months of purchase. Class B and Class 529B shares are subject to a contingent deferred sales charge in the event of a shareholder redemption within six years of purchase. All contingent deferred sales charges are paid to MFD and during the six months ended February 28, 2006, were as follows:
| | Amount |
| Class A | $13,630 |
| Class B | 281,758 |
| Class C�� | 2,372 |
| Class 529B | 61 |
| Class 529C | — |
The fund has entered into and may from time to time enter into contracts with program managers and other parties which administer the tuition programs through which an investment in the fund’s 529 share classes is made. The fund has entered into an agreement with MFD pursuant to which MFD receives an annual fee of up to 0.35% from the fund based solely upon the value of the fund’s 529 share classes attributable to tuition programs to which MFD, or a third party which contracts with MFD, provides administrative services. The current fee has been established at 0.25% annually of average net assets of the fund’s 529 share classes. The fee may only be increased with the approval of the Board of Trustees who oversees the fund. The services provided by MFD, or a third party with which MFD contracts, include recordkeeping and tax reporting and account services, as well as services designed to maintain the program’s compliance with the Internal Revenue Code and other regulatory requirements. Program manager fees for the six months ended February 28, 2006, were as follows:
| | | Amount |
| Class 529A | $685 |
| Class 529B | 200 |
| Class 529C | 374 |
|
| Total Program Manager Fees | $1,259 |
Shareholder Servicing Agent – The fund pays a portion of shareholder servicing costs to MFS Service Center, Inc. (MFSC), a wholly-owned subsidiary of MFS. MFSC receives a fee from the fund, for its services as shareholder servicing agent, set periodically under the supervision of the fund’s Board of Trustees. For the six months ended February 28, 2006, the fee was $789,537, which equated to 0.0972% annually of the fund’s average daily net assets. MFSC also receives payment from the fund for out-of-pocket and sub-accounting expenses paid by MFSC on behalf of the fund. For the six months ended February 28, 2006, these costs amounted to $545,937.
Administrator – MFS provides certain financial, legal, shareholder communications, compliance, and other administrative services to certain funds for which MFS acts as investment adviser. Under an administrative services agreement, the funds may partially reimburse MFS the costs incurred to provide these services, subject to review and approval by the Board of Trustees. Each fund is charged a fixed amount plus a fee based on calendar
28 SEMIANNUAL REPORT
Notes to Financial Statements (unaudited) – continued
year average net assets. Effective July 1, 2005, the fund’s annual fixed amount is $10,000. The administrative services fee incurred for the six months ended February 28, 2006 was equivalent to an annual effective rate of 0.0097% of the fund’s average daily net assets.
In addition to the administrative services provided by MFS to the fund as described above, MFS is responsible for providing certain retirement plan administration and services with respect to certain shares. These services include various administrative, recordkeeping, and communication/educational services with respect to the retirement plans which invest in these shares, and may be provided directly by MFS or by a third party. MFS may subsequently pay all, or a portion, of the retirement plan administration and services fee to affiliated or unaffiliated third parties. For the six months ended February 28, 2006, the fund paid MFS an annual retirement plan administration and services fee up to the following annual percentage rates of each class’ average daily net assets:
| | | | Annual | |
| | | | Effective | Total |
| | | Fee Rate | Rate(1) | Amount |
| Class R1 | 0.45% | 0.37% | $466 |
| Class R2 | 0.40% | 0.26% | 545 |
| Class R3 | 0.25% | 0.16% | 1,240 |
| Class R4 | 0.15% | 0.15% | 40 |
| Class R5 | 0.10% | 0.10% | 27 |
|
| Total Retirement Plan Administration and Services Fees | | | $2,318 |
| (1) | Effective October 1, 2005, MFS has contractually agreed to waive a portion of the retirement plan administration and services fee equal to 0.10% for Class R1 shares, 0.15% for Class R2 shares, and 0.10% for Class R3 shares. This agreement will continue until at least September 30, 2007. For the six months ended February 28, 2006, this waiver amounted to $699 and is reflected as a reduction of total expenses in the Statement of Operations. |
| |
Trustees’ and Officers’ Compensation – The fund pays compensation to Independent Trustees in the form of a retainer, attendance fees, and additional compensation to Board and Committee chairpersons. The fund does not pay compensation directly to Trustees who are officers of the investment adviser, or to officers of the fund, all of whom receive remuneration for their services to the fund from MFS. Certain officers and Trustees of the fund are officers or directors of MFS, MFD, and MFSC. The fund has an unfunded, defined benefit plan for retired Independent Trustees which resulted in a pension expense of $1,623. The fund also has an unfunded retirement benefit deferral plan for certain current Independent Trustees which resulted in an expense of $3,498. Both amounts are included in Independent trustees’ compensation for the six months ended February 28, 2006. The deferred liability for retirement benefits payable to retired Trustees and certain current Trustees amounted to $14,084 and $47,242, respectively at February 28, 2006, and is included in payable for independent trustees’ compensation.
Deferred Trustee Compensation – Under a Deferred Compensation Plan (the Plan) Independent Trustees previously were allowed to elect to defer receipt of all or a portion of their annual compensation. Trustees are no longer allowed
SEMIANNUAL REPORT 29
Notes to Financial Statements (unaudited) – continued
to defer compensation under the Plan. Amounts previously deferred are treated as though equivalent dollar amounts had been invested in shares of the fund or other MFS funds selected by the Trustee. Deferred amounts represent an unsecured obligation of the fund until distributed in accordance with the Plan. Included in other assets and payable for independent trustees’ compensation is $3,820 of Deferred Trustees’ Compensation.
Other – This fund and certain other MFS funds (the funds) have entered into a services agreement (the Agreement) which provides for payment of fees by the funds to Tarantino LLC in return for the provision of services of an Independent Chief Compliance Officer (ICCO) for the funds. The ICCO is an officer of the funds and the sole member of Tarantino LLC. The funds can terminate the Agreement with Tarantino LLC at any time under the terms of the Agreement. For the six months ended February 28, 2006, the fee paid to Tarantino LLC was $7,064. MFS has agreed to reimburse the fund for a portion of the payments made by the funds to Tarantino LLC in the amount of $4,933, which is shown as a reduction of total expenses in the Statement of Operations. Additionally, MFS has agreed to bear all expenses associated with office space, other administrative support, and supplies provided to the ICCO.
(4) Portfolio Securities
Purchases and sales of investments, other than U.S. government securities, purchased option transactions, and short-term obligations, aggregated $1,600,146,331 and $1,701,057,955 respectively.
(5) Shares of Beneficial Interest
The fund’s Declaration of Trust permits the Trustees to issue an unlimited number of full and fractional shares of beneficial interest. Transactions in fund shares were as follows:
| | | Six months ended 2/28/06 | Year ended 8/31/05(i) |
| | | Shares | Amount | Shares | Amount |
| Shares sold | | | | |
| Class A | 2,066,423 | $39,763,109 | 4,757,164 | $85,935,893 |
| Class B | 443,246 | 8,133,563 | 1,575,957 | 27,392,859 |
| Class C | 126,915 | 2,342,924 | 333,948 | 5,798,886 |
| Class I | 3,804,124 | 75,102,882 | 9,423,324 | 174,295,462 |
| Class J (c) | — | — | 22,747 | 391,281 |
| Class R | 13,586 | 259,952 | 181,581 | 3,303,225 |
| Class R1 | 935 | 17,185 | 11,518 | 205,511 |
| Class R2 | 15,918 | 288,111 | 8,385 | 149,704 |
| Class R3 | 16,138 | 301,472 | 44,189 | 809,232 |
| Class R4 | — | — | 2,781 | 50,000 |
| Class R5 | — | — | 2,780 | 50,000 |
| Class 529A | 4,719 | 87,080 | 4,173 | 75,144 |
| Class 529B | 958 | 17,091 | 1,599 | 27,649 |
| Class 529C | 1,034 | 18,820 | 5,138 | 89,910 |
|
| | | 6,493,996 | $126,332,189 | 16,375,284 | $298,574,756 |
|
30 SEMIANNUAL REPORT | | | | |
| Notes to Financial Statements (unaudited) – continued | | |
| Six months ended 2/28/06 | Year ended 8/31/05 |
| Shares | Amount | Shares | Amount |
| Shares issued in connection with | | | |
| acquisition of MFS Managed Sectors Fund | | | |
| Class A | | 7,801,545 | $143,704,457 |
| Class B | | 1,752,230 | 30,821,723 |
| Class C | | 51,143 | 901,145 |
| Class I | | 112,114 | 2,114,473 |
|
| | | 9,717,032 | $177,541,798 |
| | | Six months ended 2/28/06 | Year ended 8/31/05(i) |
| | | Shares | Amount | Shares | Amount |
| Shares reacquired | | | | |
| Class A | (5,266,719) | $(101,394,072) | (18,826,189) | $(339,752,339) |
| Class B | (4,049,853) | (74,300,048) | (8,809,726) | (152,957,259) |
| Class C | (815,478) | (15,000,062) | (2,536,107) | (43,995,123) |
| Class I | (255,142) | (5,076,664) | (435,238) | (8,147,845) |
| Class J (c) | — | — | (360,973) | (6,137,743) |
| Class R | (25,935) | (503,340) | (98,637) | (1,804,140) |
| Class R1 | (732) | (13,446) | (112) | (2,057) |
| Class R2 | (4,569) | (79,942) | (942) | (17,054) |
| Class R3 | (9,163) | (181,618) | (18,704) | (347,920) |
| Class 529A | (1,019) | (19,609) | (2,182) | (38,496) |
| Class 529B | (590) | (10,710) | (2,154) | (37,584) |
| Class 529C | (794) | (14,580) | (2,714) | (48,488) |
|
| | | (10,429,994) | $(196,594,091) | (31,093,678) | $(553,286,048) |
| Net change | | | | |
| Class A | (3,200,296) | $(61,630,963) | (6,267,480) | $(110,111,989) |
| Class B | (3,606,607) | (66,166,485) | (5,481,539) | (94,742,677) |
| Class C | (688,563) | (12,657,138) | (2,151,016) | (37,295,092) |
| Class I | 3,548,982 | 70,026,218 | 9,100,200 | 168,262,090 |
| Class J (c) | — | — | (338,226) | (5,746,462) |
| Class R | (12,349) | (243,388) | 82,944 | 1,499,085 |
| Class R1 | 203 | 3,739 | 11,406 | 203,454 |
| Class R2 | 11,349 | 208,169 | 7,443 | 132,650 |
| Class R3 | 6,975 | 119,854 | 25,485 | 461,312 |
| Class R4 | — | — | 2,781 | 50,000 |
| Class R5 | — | — | 2,780 | 50,000 |
| Class 529A | 3,700 | 67,471 | 1,991 | 36,648 |
| Class 529B | 368 | 6,381 | (555) | (9,935) |
| Class 529C | 240 | 4,240 | 2,424 | 41,422 |
|
| | | (3,935,998) | $(70,261,902) | (5,001,362) | $(77,169,494) |
(c) Class J shares closed on April 15, 2005.
(i) For the period from the class’ inception, April 1, 2005 (Classes R1, R2, R4, and R5) through the stated period end.
SEMIANNUAL REPORT 31
Notes to Financial Statements (unaudited) – continued
The fund is one of several mutual funds in which the MFS funds-of-funds may invest. The MFS funds-of-funds do not invest in the underlying MFS funds for the purpose of exercising management or control. At the end of the period, the MFS Conservative Allocation Fund, the MFS Moderate Allocation Fund, the MFS Growth Allocation Fund, and the MFS Aggressive Growth Allocation Fund were the owners of record of approximately 2%, 11%, 19%, and 12%, respectively, of the value of outstanding voting shares. In addition, the MFS Lifetime 2010 Fund, the MFS Lifetime 2020 Fund, the MFS Lifetime 2030 Fund and the MFS Lifetime 2040 Fund were all the owners of record of less than 1% of the value of outstanding voting shares.
(6) Line of Credit
The fund and other affiliated funds participate in a $1 billion unsecured line of credit provided by a syndication of banks under a credit agreement. Borrowings may be made for temporary financing needs. Interest is charged to each fund, based on its borrowings, at a rate equal to the Federal Reserve funds rate plus 0.35% . In addition, a commitment fee, based on the average daily, unused portion of the line of credit, is allocated among the participating funds at the end of each calendar quarter. The commitment fee allocated to the fund for the six months ended February 28, 2006 was $5,520, and is included in miscellaneous expense on the Statement of Operations. The fund had no significant borrowings during the six months ended February 28, 2006.
(7) Acquisitions
At close of business on June 10, 2005, the fund acquired all of the assets and liabilities of MFS Managed Sectors Fund. The acquisition was accomplished by a tax-free exchange of 9,717,032 shares of the fund (valued at $177,541,798) for all of the assets and liabilities of MFS Managed Sectors Fund. MFS Managed Sectors Fund then converted all of its outstanding shares for the shares of the fund and distributed those shares to its shareholders. MFS Managed Sectors Fund’s net assets on that date were $177,541,798, including $23,232,000 of unrealized appreciation, $538,133 of accumulated net investment loss, and $282,661,889 of accumulated net realized loss on investments and foreign currency transactions. These assets were combined with those of the fund. The aggregate net assets of the fund after the acquisition were $1,626,560,058.
32 SEMIANNUAL REPORT
BOARD REVIEW OF INVESTMENT ADVISORY AGREEMENT
A discussion regarding the Board’s most recent review and renewal of the Fund’s investment advisory agreement is available by clicking on the fund’s name under ‘‘Select a fund’’ on the MFS Web site (mfs.com).
PROXY VOTING POLICIES AND INFORMATION
A general description of the MFS funds’ proxy voting policies and procedures is available without charge, upon request, by calling 1-800-225-2606, by visiting the Proxy Voting section of mfs.com or by visiting the SEC’s Web site at http://www.sec.gov.
Information regarding how the fund voted proxies relating to portfolio securities during the most recent twelve-month period ended June 30 is available without charge by visiting the Proxy Voting section of mfs.com or by visiting the SEC’s Web site at http://www.sec.gov.
QUARTERLY PORTFOLIO DISCLOSURE
The trust will file a complete schedule of portfolio holdings with the Securities and Exchange Commission (the Commission) for the first and third quarters of each fiscal year on Form N-Q. The trust’s Form N-Q may be reviewed and copied at the:
Public Reference Room
Securities and Exchange Commission
Washington, D.C. 20549-0102
Information on the operation of the Public Reference Room may be obtained by calling the Commission at 1-800-SEC-0330. The trust’s Form N-Q is available on the EDGAR database on the Commission’s Internet Web site at http://www.sec.gov, and copies of this information may be obtained, upon payment of a duplicating fee, by electronic request at the following e-mail address: publicinfo@sec.gov or by writing the Public Reference Section at the above address.
A shareholder can also obtain the quarterly portfolio holdings report at mfs.com.
SEMIANNUAL REPORT 33
LETTER FROM THE CEO

Dear Shareholders,
It has been said that change is the only constant in life. As investors have seen, that theme is still accurate today as we recently have experienced shifting economic cycles because of natural disasters and political instability around the globe.
Markets worldwide have fluctuated in the past year as devastating hurricanes had a dramatic effect on the international economy, particularly on oil prices. We witnessed political unrest in the Middle East, highlighted by instability in Iraq, and in Africa, the usually stable Nigeria also experienced violence. As a result, energy prices have bounced up and down, with crude oil prices at one point topping a record $70 per barrel.
Such cycles are not uncommon and in fact have almost become the norm in our everyday lives. What does all of this mean to you as an investor? In times like these, it helps to know that you’re working with a seasoned investment professional who has experience to guide you through difficult times. At MFS®, we believe our investment management team has the knowledge and confidence to navigate through difficult cycles and at the same time see through adversity to find investment opportunities for our clients and shareholders.
Our investment management process, honed over 80 years, combines a unique concept of teamwork with our unwavering focus on the long term. We firmly believe that the best way to realize long-term financial goals – be it a college education, a comfortable retirement, or a secure family legacy – is to follow a three-pronged approach that focuses on longer time horizons. Allocate holdings across the major asset classes – including stocks, bonds, and cash. Diversify within each class to take advantage of different market segments and investing styles. Rebalance assets regularly to maintain a desired asset allocation. Of course, these strategies cannot guarantee a profit or protect against a loss. This long-term approach requires diligence and patience, two traits that in our experience are essential to capitalizing on the many opportunities the financial markets can offer – through both up and down economic cycles.
Respectfully,

Robert J. Manning
Chief Executive Officer and Chief Investment Officer
MFS Investment Management®
April 17, 2006
The opinions expressed in this letter are those of MFS, and no forecasts can be guaranteed.
SEMIANNUAL REPORT 1
PORTFOLIO COMPOSITION
Portfolio structure
Stocks 98.1%
Cash & Other
Net Assets 1.9%
|

| Top ten holdings | |
| Intel Corp. | 6.1% |
|
|
| MicroStrategy, Inc., ‘‘A’’ | 5.5% |
|
|
| Juniper Networks, Inc. | 5.4% |
|
|
| Oracle Corp. | 4.1% |
|
|
| Cisco Systems, Inc. | 3.8% |
|
|
| Equinix, Inc. | 3.7% |
|
|
| SanDisk Corp. | 3.5% |
|
|
| EMC Corp. | 3.5% |
|
|
| Nortel Networks Corp. | 3.0% |
|
|
| Corning, Inc. | 3.0% |
|
|
| Top five equity industries | |
| Computer Software | 23.8% |
|
|
| Network & Telecom | 23.4% |
|
|
| Electronics | 22.1% |
|
|
| Business Services | 9.5% |
|
|
| Internet | 6.5% |
|
|
Percentages are based on net assets as of 2/28/06.
The portfolio is actively managed, and current holdings may be different.
Fund Expenses Borne by the Shareholders During the Period, September 1, 2005 through February 28, 2006.
As a shareholder of the fund, you incur two types of costs: (1) transaction costs, including sales charges (loads) on certain purchase or redemption payments and redemption fees on certain exchanges and redemptions, and (2) ongoing costs, including management fees; distribution and service (12b-1) fees; and other fund expenses. This example is intended to help you understand your ongoing costs (in dollars) of investing in the fund and to compare these costs with the ongoing costs of investing in other mutual funds.
The example is based on an investment of $1,000 invested at the beginning of the period and held for the entire period September 1, 2005 through February 28, 2006.
The first line for each share class in the following table provides information about actual account values and actual expenses. You may use the information in this line, together with the amount you invested, to estimate the expenses that you paid over the period. Simply divide your account value by $1,000 (for example, an $8,600 account value divided by $1,000 = 8.6), then multiply the result by the number in the first line under the heading entitled ‘‘Expenses Paid During Period’’ to estimate the expenses you paid on your account during this period.
Hypothetical Example for Comparison Purposes
The second line for each share class in the following table provides information about hypothetical account values and hypothetical expenses based on the fund’s actual expense ratio and an assumed rate of return of 5% per year before expenses, which is not the fund’s actual return. The hypothetical account values and expenses may not be used to estimate the actual ending account balance or expenses you paid for the period. You may use this information to compare the ongoing costs of investing in the fund and other funds. To do so, compare this 5% hypothetical example with the 5% hypothetical examples that appear in the shareholder reports of the other funds.
Please note that the expenses shown in the table are meant to highlight your ongoing costs only and do not reflect any transactional costs, such as sales charges (loads) or redemption fees. Therefore, the second line for each share class in the table is useful in comparing ongoing costs only, and will not help you determine the relative total costs of owning different funds. In addition, if these transactional costs were included, your costs would have been higher.
SEMIANNUAL REPORT 3
Expense Table – continued
|
|
| | | | | Expenses |
| | Annualized | Beginning | Ending | Paid During |
| | Expense | Account Value | Account Value | Period (p) |
| Share Class | | Ratio | 9/01/05 | 2/28/06 | 9/01/05-2/28/06 |
|
| Actual | 1.50% | $1,000.00 | $1,167.40 | $ 8.06 |
| A | |
|
|
|
|
| Hypothetical (h) | 1.50% | $1,000.00 | $1,017.36 | $ 7.50 |
|
|
|
|
|
| Actual | 2.15% | $1,000.00 | $1,163.70 | $11.53 |
| B | |
|
|
|
|
| Hypothetical (h) | 2.15% | $1,000.00 | $1,014.13 | $10.74 |
|
|
|
|
|
| Actual | 2.15% | $1,000.00 | $1,162.80 | $11.53 |
| C | |
|
|
|
|
| Hypothetical (h) | 2.15% | $1,000.00 | $1,014.13 | $10.74 |
|
|
|
|
|
| Actual | 1.15% | $1,000.00 | $1,169.20 | $ 6.19 |
| I | |
|
|
|
|
| Hypothetical (h) | 1.15% | $1,000.00 | $1,019.09 | $ 5.76 |
|
|
|
|
|
| Actual | 1.65% | $1,000.00 | $1,165.90 | $ 8.86 |
| R | |
|
|
|
|
| Hypothetical (h) | 1.65% | $1,000.00 | $1,016.61 | $ 8.25 |
|
|
|
|
|
| Actual | 2.25% | $1,000.00 | $1,162.60 | $12.06 |
| R1 | |
|
|
|
|
| Hypothetical (h) | 2.25% | $1,000.00 | $1,013.64 | $11.23 |
|
|
|
|
|
| Actual | 1.90% | $1,000.00 | $1,164.70 | $10.20 |
| R2 | |
|
|
|
|
| Hypothetical (h) | 1.90% | $1,000.00 | $1,015.37 | $ 9.49 |
|
|
|
|
|
| Actual | 1.80% | $1,000.00 | $1,164.40 | $ 9.66 |
| R3 | |
|
|
|
|
| Hypothetical (h) | 1.80% | $1,000.00 | $1,015.87 | $ 9.00 |
|
|
|
|
|
| Actual | 1.55% | $1,000.00 | $1,166.10 | $ 8.32 |
| R4 | |
|
|
|
|
| Hypothetical (h) | 1.55% | $1,000.00 | $1,017.11 | $ 7.75 |
|
|
|
|
|
| Actual | 1.25% | $1,000.00 | $1,168.20 | $ 6.72 |
| R5 | |
|
|
|
|
| Hypothetical (h) | 1.25% | $1,000.00 | $1,018.60 | $ 6.26 |
|
|
|
|
|
| (h) | 5% class return per year before expenses. |
| (p) | Expenses paid is equal to each class’ annualized expense ratio, as shown above, multiplied by the average account value over the period, multiplied by the number of days in the period, divided by the number of days in the year. Expenses paid do not include any applicable sales charges (loads) or redemption fees. If these transaction costs had been included, your costs would have been higher. |
Effective October 1, 2005 the fund’s Class R1, Class R2, and Class R3 retirement plan administration and services fee was reduced (as described in Note 3 of the Notes to the Financial Statements). Had this fee reduction been in effect throughout the entire six month period, the annualized expense ratio would have been 2.23%, 1.88%, and 1.78% for Class R1, Class R2, and Class R3, respectively, and the actual expenses paid during the period would have been approximately $11.96, $10.09, and $9.55 for Class R1, Class R2, and Class R3, respectively.
4 SEMIANNUAL REPORT
| PORTFOLIO OF INVESTMENTS (unaudited) – 2/28/06 | | | | |
| The Portfolio of Investments is a complete list of all securities owned by your fund. | | | |
| It is categorized by broad-based asset classes. | | | | |
| Stocks - 98.1% | | | | |
|
|
|
|
| Issuer | Shares/Par | | | Value ($) |
|
|
|
|
| Banks & Credit Companies - 0.8% | | | | |
|
|
|
|
| Euronet Worldwide, Inc. (n) | 25,500 | | $ | 894,030 |
|
|
|
|
| Broadcast & Cable TV - 1.6% | | | | |
|
|
|
|
| XM Satellite Radio Holdings, Inc., ‘‘A’’ (l)(n) | 85,000 | | $ | 1,877,650 |
|
|
|
|
| Business Services - 9.5% | | | | |
|
|
|
|
| Cognizant Technology Solutions Corp., ‘‘A’’ (n) | 58,500 | | $ | 3,370,185 |
| Corporate Executive Board Co. | 17,800 | | | 1,780,000 |
| First Data Corp. | 73,500 | | | 3,317,055 |
| Ultimate Software Group, Inc. (l)(n) | 112,100 | | | 2,623,140 |
| | |
|
|
| | | $ | 11,090,380 |
|
|
|
| Computer Software - 23.8% | | | | |
|
|
|
|
| Adobe Systems, Inc. | 88,550 | | $ | 3,419,801 |
| McAfee, Inc. (l)(n) | 137,100 | | | 3,188,946 |
| MicroStrategy, Inc., ‘‘A’’ (n) | 69,660 | | | 6,386,429 |
| Opsware, Inc. (l)(n) | 253,330 | | | 1,993,707 |
| Oracle Corp. (n) | 385,518 | | | 4,788,133 |
| Symantec Corp. (n) | 182,301 | | | 3,079,064 |
| TIBCO Software, Inc. (n) | 378,960 | | | 3,285,583 |
| Witness Systems, Inc. (l)(n) | 67,200 | | | 1,574,496 |
| | |
|
|
| | | $ | 27,716,159 |
|
|
|
| Computer Software - Systems - 3.9% | | | | |
|
|
|
|
| Dell, Inc. (n) | 59,800 | | $ | 1,734,200 |
| LG.Philips LCD Co. Ltd. (n) | 62,410 | | | 2,785,709 |
| | |
|
|
| | | | $ | 4,519,909 |
|
|
|
|
| Electronics - 22.1% | | | | |
|
|
|
|
| ARM Holdings PLC | 669,600 | | $ | 1,616,704 |
| Delta Electronics | 791,000 | | | 1,885,934 |
| Intel Corp. | 344,600 | | | 7,098,760 |
| Marvell Technology Group Ltd. (n) | 33,300 | | | 2,038,626 |
| Samsung Electronics Co. Ltd., GDR | 7,675 | | | 2,715,031 |
| SanDisk Corp. (n) | 68,170 | | | 4,113,378 |
| SigmaTel, Inc. (n) | 108,700 | | | 1,168,525 |
| Tessera Technologies, Inc. (n) | 62,700 | | | 1,958,121 |
| Xilinx, Inc. | 113,500 | | | 3,096,280 |
| | |
|
|
| | | $ | 25,691,359 |
|
|
|
| Internet - 6.5% | | | | |
|
|
|
|
| Equinix, Inc. (l)(n) | 81,800 | | $ | 4,289,592 |
| Google, Inc., ‘‘A’’ (n) | 9,190 | | | 3,332,478 |
| | |
|
|
| | | | $ | 7,622,070 |
|
|
|
|
| | SEMIANNUAL REPORT 5 |
| Portfolio of Investments (unaudited) – continued | | | | |
Issuer | Shares/Par | | | Value ($) |
|
|
|
|
| Stocks - continued | | | | |
|
|
|
|
| Machinery & Tools - 2.2% | | | | |
|
|
|
|
| Cognex Corp. | 91,440 | | $ | 2,515,514 |
|
|
|
|
| Network & Telecom - 23.4% | | | | |
|
|
|
|
| Cisco Systems, Inc. (n) | 217,633 | | $ | 4,404,892 |
| Corning, Inc. (n) | 141,500 | | | 3,454,015 |
| Extreme Networks, Inc. (l)(n) | 465,100 | | | 2,153,413 |
| F5 Networks, Inc. (l)(n) | 42,400 | | | 2,875,568 |
| Juniper Networks, Inc. (n) | 343,410 | | | 6,315,310 |
| NICE Systems Ltd., ADR (n) | 45,900 | | | 2,389,554 |
| Nortel Networks Corp. (n) | 1,208,600 | | | 3,456,596 |
| Redback Networks, Inc. (l)(n) | 20,800 | | | 394,160 |
| Research In Motion Ltd. (n) | 25,000 | | | 1,763,250 |
| | |
|
|
| | | | $ | 27,206,758 |
|
|
|
|
| Personal Computers & Peripherals - 3.5% | | | | |
|
|
|
|
| EMC Corp. (n) | 291,340 | | $ | 4,084,587 |
|
|
|
|
| Telephone Services - 0.8% | | | | |
|
|
|
|
| Terremark Worldwide, Inc. (n) | 164,300 | | $ | 883,934 |
|
| |
|
|
| Total Stocks (Identified Cost, $106,549,883) | | | $ | 114,102,350 |
|
|
|
| Short-Term Obligation - 1.9% | | | | |
|
|
|
|
| General Electric Capital Corp., 4.56%, due 3/01/06, | | | | |
| at Amortized Cost and Value (y) | $ 2,255,000 | | $ | 2,255,000 |
|
|
|
|
| Collateral for Securities Loaned - 11.7% | | | | |
|
|
|
|
| Navigator Securities Lending Prime Portfolio, at Cost and | | | | |
| Net Asset Value | 13,549,676 | | $ | 13,549,676 |
|
|
|
|
| | | $ | 129,907,026 |
|
|
|
| Other Assets, Less Liabilities - (11.7)% | | | | (13,579,689) |
|
|
|
|
| Net Assets - 100.0% | | | $ | 116,327,337 |
|
|
|
| (n) | Non-income producing security. |
| (l) | All or a portion of this security is on loan. |
| (y) | The rate shown represents an annualized yield at time of purchase. |
| (k) | As of February 28, 2006 the fund had two securities that were fair valued, aggregating, $4,671,643 and 4.0% of net assets in accordance with the policies adopted by the Board of Trustees. |
The following abbreviations are used in the Portfolio of Investments and are defined:
ADR American Depository Receipt
GDR Global Depository Receipt
See Notes to Financial Statements
|
6 SEMIANNUAL REPORT
FINANCIAL STATEMENTS | Statement of Assets and Liabilities (unaudited)
| This statement represents your fund’s balance sheet, which details the assets | | |
| and liabilities composing the total value of the fund. | | |
At 2/28/06 | | |
Assets | | |
|
|
| Investments, at value, including $13,196,520 of securities on loan | | |
| (identified cost, $122,354,559) | $129,907,026 | |
| Cash | 728 | |
| Foreign currency, at value (identified cost, $50,653) | 51,530 | |
| Receivable for investments sold | 4,706,421 | |
| Receivable for fund shares sold | 109,627 | |
| Interest and dividends receivable | 38,741 | |
| Receivable from investment adviser | 65,206 | |
| Other assets | 16 | |
|
|
| Total assets | | $134,879,295 |
|
|
| Liabilities | | |
|
|
| Payable for investments purchased | $4,521,817 | |
| Payable for fund shares reacquired | 283,562 | |
| Collateral for securities loaned, at value | 13,549,676 | |
| Payable to affiliates | | |
| Management fee | 2,413 | |
| Shareholder servicing costs | 37,031 | |
| Distribution and service fees | 2,643 | |
| Administrative services fee | 63 | |
| Retirement plan administration and services fees | 6 | |
| Payable for independent trustees’ compensation | 48,742 | |
| Accrued expenses and other liabilities | 106,005 | |
|
|
| Total liabilities | | $18,551,958 |
|
|
| Net assets | | $116,327,337 |
|
|
| Net assets consist of: | | |
|
|
| Paid-in capital | $437,908,785 | |
| Unrealized appreciation (depreciation) on investments and | | |
| translation of assets and liabilities in foreign currencies | 7,553,344 | |
| Accumulated net realized gain (loss) on investments and foreign | | |
| currency transactions | (328,264,613) | |
| Accumulated net investment loss | (870,179) | |
|
|
| Net assets | | $116,327,337 |
|
|
| Shares of beneficial interest outstanding | | 11,479,771 |
|
|
| Class A shares | | |
|
|
| Net assets | $50,583,636 | |
| Shares outstanding | 4,901,741 | |
|
|
| Net asset value per share | | $10.32 |
|
|
| Offering price per share (100÷94.25 x net asset value per share) | | $10.95 |
|
|
| | | SEMIANNUAL REPORT 7 |
| Statement of Assets and Liabilities (unaudited) – continued | | |
Class B shares | | |
|
|
|
| Net assets | $45,003,144 | |
| Shares outstanding | 4,523,222 | |
|
|
|
| Net asset value and offering price per share | | $9.95 |
|
|
|
| Class C shares | | |
|
|
|
| Net assets | $13,159,893 | |
| Shares outstanding | 1,324,834 | |
|
|
|
| Net asset value and offering price per share | | $9.93 |
|
|
|
| Class I shares | | |
|
|
|
| Net assets | $3,714,122 | |
| Shares outstanding | 351,366 | |
|
|
|
| Net asset value, offering price, and redemption price per share | | $10.57 |
|
|
|
| Class R shares | | |
|
|
|
| Net assets | $2,735,558 | |
| Shares outstanding | 266,747 | |
|
|
|
| Net asset value, offering price, and redemption price per share | | $10.26 |
|
|
|
| Class R1 shares | | |
|
|
|
| Net assets | $129,140 | |
| Shares outstanding | 12,992 | |
|
|
|
| Net asset value, offering price, and redemption price per share | | $9.94 |
|
|
|
| Class R2 shares | | |
|
|
|
| Net assets | $366,399 | |
| Shares outstanding | 36,749 | |
|
|
|
| Net asset value, offering price, and redemption price per share | | $9.97 |
|
|
|
| Class R3 shares | | |
|
|
|
| Net assets | $510,333 | |
| Shares outstanding | 50,014 | |
|
|
|
| Net asset value, offering price, and redemption price per share | | $10.20 |
|
|
|
| Class R4 shares | | |
|
|
|
| Net assets | $62,470 | |
| Shares outstanding | 6,053 | |
|
|
|
| Net asset value, offering price, and redemption price per share | | $10.32 |
|
|
|
| Class R5 shares | | |
|
|
|
| Net assets | $62,642 | |
| Shares outstanding | 6,053 | |
|
|
|
| Net asset value, offering price, and redemption price per share | | $10.35 |
|
|
|
On sales of $50,000 or more, the offering price of Class A shares is reduced. A contingent deferred sales charge may be imposed on redemptions of Class A, Class B and Class C shares.
See Notes to Financial Statements
8 SEMIANNUAL REPORT
FINANCIAL STATEMENTS | Statement of Operations (unaudited)
This statement describes how much your fund earned in investment income and accrued in expenses. It also describes any gains and/or
losses generated by fund operations.
| Six months ended 2/28/06 | | |
| Net investment loss | | |
|
|
| Income | | |
| Dividends | $117,734 | |
| Interest | 42,974 | |
| Foreign taxes withheld | (9,105) | |
|
|
| Total investment income | | $151,603 |
|
|
| Expenses | | |
| Management fee | $422,837 | |
| Distribution and service fees | 377,826 | |
| Shareholder servicing costs | 190,159 | |
| Administrative services fee | 10,052 | |
| Retirement plan administration and services fees | 1,381 | |
| Independent trustees’ compensation | 8,824 | |
| Custodian fee | 27,283 | |
| Shareholder communications | 41,621 | |
| Auditing fees | 21,680 | |
| Legal fees | 2,100 | |
| Registration fees | 112,219 | |
| Miscellaneous | 12,272 | |
|
|
| Total expenses | | $1,228,254 |
|
|
| Fees paid indirectly | (3,704) | |
| Reduction of expenses by investment adviser | (202,768) | |
|
|
| Net expenses | | $1,021,782 |
|
|
| Net investment loss | | $(870,179) |
|
| Realized and unrealized gain (loss) on investments | | |
|
|
| Realized gain (loss) (identified cost basis) | | |
| Investment transactions | $13,903,048 | |
| Foreign currency transactions | (18,493) | |
|
|
| Net realized gain (loss) on investments and foreign | | |
| currency transactions | | $13,884,555 |
|
|
| Change in unrealized appreciation (depreciation) | | |
| Investments | $4,284,172 | |
| Translation of assets and liabilities in foreign currencies | 16,828 | |
|
|
| Net unrealized gain (loss) on investments and foreign | | |
| currency translation | | $4,301,000 |
|
|
| Net realized and unrealized gain (loss) on investments and | | |
| foreign currency | | $18,185,555 |
|
|
| Change in net assets from operations | | $17,315,376 |
|
|
| See Notes to Financial Statements | | |
| | |
| | | SEMIANNUAL REPORT 9 |
| FINANCIAL STATEMENTS | Statements of Changes in Net Assets | |
These statements describe the increases and/or decreases in net assets resulting | |
| from operations, any distributions, and any shareholder transactions. | | |
Six months ended | Year ended |
| | 2/28/06 | 8/31/05 |
| | (unaudited) | |
| Change in net assets | | |
|
|
|
| From operations | | |
|
|
|
| Net investment loss | $(870,179) | $(1,187,631) |
| Net realized gain (loss) on investments and foreign | | |
| currency transactions | 13,884,555 | 26,313,940 |
| Net unrealized gain (loss) on investments and foreign | | |
| currency translation | 4,301,000 | (3,585,555) |
|
|
|
| Change in net assets from operations | $17,315,376 | $21,540,754 |
|
|
|
| Change in net assets from fund share transactions | $(12,226,774) | $(67,156,944) |
|
|
|
| Redemption fees | $— | $4,244 |
|
|
|
| Total change in net assets | $5,088,602 | $(45,611,946) |
|
|
|
| Net assets | | |
|
|
|
| At beginning of period | 111,238,735 | 156,850,681 |
| At end of period (including accumulated net investment loss of | | |
| $870,179 and $0, respectively) | $116,327,337 | $111,238,735 |
|
|
|
| See Notes to Financial Statements | | |
10 SEMIANNUAL REPORT
FINANCIAL STATEMENTS | Financial Highlights
The financial highlights table is intended to help you understand the fund’s financial performance for the semiannual period and the past 5 fiscal years (or life of a particular share class, if shorter). Certain information reflects financial results for a single fund share. The total returns in the table represent the rate by which an investor would have earned (or lost) on an investment in the fund share class (assuming reinvestment of all distributions) held for the entire period.
| Six months | | | | | | | | | | | |
| | ended | | Years ended 8/31 | |
| Class A | 2/28/06 | | 2005 | | 2004 | | 2003 | | 2002 | | 2001 | |
| (unaudited) | | | | | | | | | | | |
| Net asset value, beginning of period | $8.84 | | $7.70 | | $8.30 | | $6.25 | | $10.70 | | $28.03 | |
| Income (loss) from | | | | | | | | | | | | |
| investment operations | |
| Net investment loss (d) | $(0.06 | ) | $(0.05 | ) | $(0.10 | ) | $(0.07 | ) | $(0.11 | ) | $(0.14 | ) |
| Net realized and unrealized | | | | | | | | | | | | |
| gain (loss) on investments and | | | | | | | | | | | | |
| foreign currency | 1.54 | | 1.19 | | (0.50 | ) | 2.12 | | (4.34 | ) | (16.69 | ) |
| Total from investment operations | $1.48 | | $1.14 | | $(0.60 | ) | $2.05 | | $(4.45 | ) | $(16.83 | ) |
| Less distributions declared | | | | | | | | | | | | |
| to shareholders | |
| From net realized gain on | | | | | | | | | | | | |
| investments and foreign | | | | | | | | | | | | |
| currency transactions | $— | | $— | | $— | | $— | | $— | | $(0.50 | ) |
| From paid-in capital | — | | — | | — | | — | | — | | (0.00 | )(w) |
| Total distributions declared to | | | | | | | | | | | | |
| shareholders | $— | | $— | | $— | | $— | | $— | | $(0.50 | ) |
| Net asset value, end of period | $10.32 | | $8.84 | | $7.70 | | $8.30 | | $6.25 | | $10.70 | |
| Total return (%) (t)(s)(r) | 16.74 | (n) | 14.81 | | (7.23 | )(b) | 32.80 | | (41.53 | ) | (61.02 | ) |
| Ratios (%) (to average net assets) | | | | | | | | | | | | |
| and Supplemental data: | |
| Expenses before expense reductions (f) | 1.86 | (a) | 1.79 | | 1.60 | | 1.76 | | 1.74 | | 1.55 | |
| Expenses after expense reductions (f) | 1.50 | (a) | 1.51 | | 1.50 | | 1.52 | | 1.51 | | 1.52 | |
| Net investment loss | (1.22 | )(a) | (0.56 | ) | (1.10 | ) | (1.05 | ) | (1.22 | ) | (0.87 | ) |
| Portfolio turnover | 105 | | 163 | | 141 | | 162 | | 210 | | 413 | |
| Net assets at end of period | | | | | | | | | | | | |
| (000 Omitted) | $50,584 | | $48,945 | | $75,786 | | $101,059 | | $53,142 | | $66,358 | |
See Notes to Financial Statements
| | | | | | | | | | | | |
| | | | | | | | | | | | |
| | | | | | | | SEMIANNUAL REPORT 11 | |
| Financial Highlights – continued | | | | | | | | | | | | |
| Six months | | | | | | | | | | | |
| | ended | | Years ended 8/31 | |
| Class B | 2/28/06 | | 2005 | | 2004 | | 2003 | | 2002 | | 2001 | |
| (unaudited) | | | | | | | | | | | |
| Net asset value, beginning of period | $8.55 | | $7.50 | | $8.13 | | $6.16 | | $10.61 | | $27.95 | |
| Income (loss) from | | | | | | | | | | | | |
| investment operations | |
| Net investment loss (d) | $(0.09 | ) | $(0.10 | ) | $(0.15 | ) | $(0.11 | ) | $(0.17 | ) | $(0.25 | ) |
| Net realized and unrealized gain (loss) | | | | | | | | | | | | |
| on investments and foreign currency | 1.49 | | 1.15 | | (0.48 | ) | 2.08 | | (4.28 | ) | (16.64 | ) |
| Total from investment operations | $1.40 | | $1.05 | | $(0.63 | ) | $1.97 | | $(4.45 | ) | $(16.89 | ) |
| Less distributions declared | | | | | | | | | | | | |
| to shareholders | |
| From net realized gain on investments | | | | | | | | | | | | |
| and foreign currency transactions | $— | | $— | | $— | | $— | | $— | | $(0.45 | ) |
| From paid-in capital | — | | — | | — | | — | | — | | (0.00 | )(w) |
| Total distributions declared to | | | | | | | | | | | | |
| shareholders | $— | | $— | | $— | | $— | | $— | | $(0.45 | ) |
| Net asset value, end of period | $9.95 | | $8.55 | | $7.50 | | $8.13 | | $6.16 | | $10.61 | |
| Total return (%) (t)(s)(r) | 16.37 | (n) | 14.00 | | (7.75 | )(b) | 31.98 | | (41.94 | ) | (61.28 | ) |
| Ratios (%) (to average net assets) | | | | | | | | | | | | |
| and Supplemental data: | |
| Expenses before expense reductions (f) | 2.51 | (a) | 2.44 | | 2.25 | | 2.42 | | 2.39 | | 2.20 | |
| Expenses after expense reductions (f) | 2.15 | (a) | 2.16 | | 2.15 | | 2.18 | | 2.16 | | 2.17 | |
| Net investment loss | (1.87 | )(a) | (1.24 | ) | (1.74 | ) | (1.71 | ) | (1.87 | ) | (1.52 | ) |
| Portfolio turnover | 105 | | 163 | | 141 | | 162 | | 210 | | 413 | |
| Net assets at end of period | | | | | | | | | | | | |
| (000 Omitted) | $45,003 | | $43,765 | | $50,896 | | $61,353 | | $25,997 | | $44,369 | |
See Notes to Financial Statements | | | | | | | | | | | | |
| | | | | | | | | | | | |
12 SEMIANNUAL REPORT | | | | | | | | | | | | |
| Financial Highlights – continued | | | | | | | | | | | | |
| Six months | | | | | | | | | | | |
| | ended | | Years ended 8/31 | |
| Class C | 2/28/06 | | 2005 | | 2004 | | 2003 | | 2002 | | 2001 | |
| (unaudited) | | | | | | | | | | | |
| Net asset value, beginning of period | $8.54 | | $7.48 | | $8.12 | | $6.16 | | $10.61 | | $27.95 | |
| Income (loss) from | | | | | | | | | | | | |
| investment operations | |
| Net investment loss (d) | $(0.09 | ) | $(0.10 | ) | $(0.15 | ) | $(0.11 | ) | $(0.17 | ) | $(0.25 | ) |
| Net realized and unrealized gain (loss) | | | | | | | | | | | | |
| on investments and foreign currency | 1.48 | | 1.16 | | (0.49 | ) | 2.07 | | (4.28 | ) | (16.64 | ) |
| Total from investment operations | $1.39 | | $1.06 | | $(0.64 | ) | $1.96 | | $(4.45 | ) | $(16.89 | ) |
| Less distributions declared | | | | | | | | | | | | |
| to shareholders | |
| From net realized gain on investments | | | | | | | | | | | | |
| and foreign currency transactions | $— | | $— | | $— | | $— | | $— | | $(0.45 | ) |
| From paid-in capital | — | | — | | — | | — | | — | | (0.00 | )(w) |
| Total distributions declared to | | | | | | | | | | | | |
| shareholders | $— | | $— | | $— | | $— | | $— | | $(0.45 | ) |
| Net asset value, end of period | $9.93 | | $8.54 | | $7.48 | | $8.12 | | $6.16 | | $10.61 | |
| Total return (%) (t)(s)(r) | 16.28 | (n) | 14.17 | | (7.88 | )(b) | 31.82 | | (41.94 | ) | (61.27 | ) |
| Ratios (%) (to average net assets) | | | | | | | | | | | | |
| and Supplemental data: | | | | | | | | | | | | |
| Expenses before expense reductions (f) | 2.51 | (a) | 2.44 | | 2.25 | | 2.42 | | 2.39 | | 2.20 | |
| Expenses after expense reductions (f) | 2.15 | (a) | 2.16 | | 2.15 | | 2.18 | | 2.16 | | 2.17 | |
| Net investment loss | (1.87 | )(a) | (1.22 | ) | (1.74 | ) | (1.71 | ) | (1.87 | ) | (1.52 | ) |
| Portfolio turnover | 105 | | 163 | | 141 | | 162 | | 210 | | 413 | |
| Net assets at end of period | | | | | | | | | | | | |
| (000 Omitted) | $13,160 | | $12,414 | | $15,367 | | $20,210 | | $10,476 | | $17,298 | |
See Notes to Financial Statements | | | | | | | | | | | | |
| | | | | | | | | | | | |
| | | | | | | | SEMIANNUAL REPORT 13 | |
| Financial Highlights – continued | | | | | | | | | | | | |
| Six months | | | | | | | | | | | |
| | ended | | Years ended 8/31 | |
| Class I | 2/28/06 | | 2005 | | 2004 | | 2003 | | 2002 | | 2001 | |
| (unaudited) | | | | | | | | | | | |
| Net asset value, beginning of period | $9.04 | | $7.85 | | $8.43 | | $6.33 | | $10.79 | | $28.08 | |
| Income (loss) from | | | | | | | | | | | | |
| investment operations | |
| Net investment income (loss) (d) | $(0.04 | ) | $0.01 | | $(0.06 | ) | $(0.05 | ) | $(0.08 | ) | $(0.09 | ) |
| Net realized and unrealized gain (loss) | | | | | | | | | | | | |
| on investments and foreign currency | 1.57 | | 1.18 | | (0.52 | ) | 2.15 | | (4.38 | ) | (16.68 | ) |
| Total from investment operations | $1.53 | | $1.19 | | $(0.58 | ) | $2.10 | | $(4.46 | ) | $(16.77 | ) |
| Less distributions declared | | | | | | | | | | | | |
| to shareholders | |
| From net realized gain on investments | | | | | | | | | | | | |
| and foreign currency transactions | $— | | $— | | $— | | $— | | $— | | $(0.52 | ) |
| From paid-in capital | — | | — | | — | | — | | — | | (0.00 | )(w) |
| Total distributions declared to | | | | | | | | | | | | |
| shareholders | $— | | $— | | $— | | $— | | $— | | $(0.52 | ) |
| Net asset value, end of period | $10.57 | | $9.04 | | $7.85 | | $8.43 | | $6.33 | | $10.79 | |
| Total return (%) (s)(r) | 16.92 | (n) | 15.16 | | (6.88 | )(b) | 33.18 | | (41.33 | ) | (60.69 | ) |
| Ratios (%) (to average net assets) | | | | | | | | | | | | |
| and Supplemental data: | |
| Expenses before expense reductions (f) | 1.51 | (a) | 1.44 | | 1.26 | | 1.41 | | 1.39 | | 1.20 | |
| Expenses after expense reductions (f) | 1.15 | (a) | 1.16 | | 1.16 | | 1.17 | | 1.16 | | 1.17 | |
| Net investment income (loss) | (0.87 | )(a) | 0.17 | | (0.70 | ) | (0.71 | ) | (0.87 | ) | (0.53 | ) |
| Portfolio turnover | 105 | | 163 | | 141 | | 162 | | 210 | | 413 | |
| Net assets at end of period | | | | | | | | | | | | |
| (000 Omitted) | $3,714 | | $3,384 | | $13,404 | | $4,179 | | $3,045 | | $5,357 | |
See Notes to Financial Statements | | | | | | | | | | | | |
| | | | | | | | | | | | |
| 14 SEMIANNUAL REPORT | | | | | | | | | | | | |
| Financial Highlights – continued | | | | | | | |
| | Six months | | | | | | |
| | ended | | Years ended 8/31 | |
| Class R | 2/28/06 | | 2005 | 2004 | | 2003(i) | |
| | (unaudited) | | | | | | |
| Net asset value, beginning of period | $8.80 | | $7.67 | $8.28 | | $6.16 | |
| | | | | |
| Income (loss) from investment operations | |
| Net investment loss (d) | $(0.06 | ) | $(0.07) | $(0.10 | ) | $(0.08 | ) |
| Net realized and unrealized gain (loss) on investments and | | | | | | |
| foreign currency | 1.52 | | 1.20 | (0.51 | ) | 2.20 | |
| Total from investment operations | $1.46 | | $1.13 | $(0.61 | ) | $2.12 | |
| Net asset value, end of period | $10.26 | | $8.80 | $7.67 | | $8.28 | |
| Total return (%) (s)(r) | 16.59 | (n) | 14.73 | (7.37 | )(b) | 34.42 | (n) |
| Ratios (%) (to average net assets) | | | | | | | |
| and Supplemental data: | |
| Expenses before expense reductions (f) | 2.01 | (a) | 1.94 | 1.76 | | 1.88 | (a) |
| Expenses after expense reductions (f) | 1.65 | (a) | 1.66 | 1.66 | | 1.64 | (a) |
| Net investment loss | (1.37 | )(a) | (0.79) | (1.21 | ) | (1.22 | )(a) |
| Portfolio turnover | 105 | | 163 | 141 | | 162 | |
| Net assets at end of period (000 Omitted) | $2,736 | | $2,283 | $1,266 | | $173 | |
| | | | | | |
| | | | Six months | | Year | |
| | | | | ended | | ended | |
| Class R1 | | | 2/28/06 | | 8/31/05(i) | |
| | | | (unaudited) | | | |
| Net asset value, beginning of period | | | | $8.55 | | $8.01 | |
| Income (loss) from investment operations | |
| Net investment loss (d) | | | | $(0.09 | ) | $(0.07 | ) |
| Net realized and unrealized gain (loss) on investments and foreign currency | 1.48 | | 0.61 | (g) |
| Total from investment operations | | | | $1.39 | | $0.54 | |
| Net asset value, end of period | | | | $9.94 | | $8.55 | |
| Total return (%) (s)(r) | | | | 16.26 | (n) | 6.74 | (n) |
| Ratios (%) (to average net assets) | | | | | | | |
| and Supplemental data: | |
| Expenses before expense reductions (f) | | | | 2.70 | (a) | 2.62 | (a) |
| Expenses after expense reductions (f) | | | | 2.25 | (a) | 2.34 | (a) |
| Net investment loss | | | | (1.99 | )(a) | (1.90 | )(a) |
| Portfolio turnover | | | | 105 | | 163 | |
| Net assets at end of period (000 Omitted) | | | | $129 | | $64 | |
| See Notes to Financial Statements | | | | | | | |
| | | | | | | |
| | | | SEMIANNUAL REPORT 15 | |
| Financial Highlights – continued | | | | | | |
| | | | Six months | | Year | |
| | | | ended | | ended | |
| Class R2 | | | 2/28/06 | | 8/31/05(i) | |
| | (unaudited) | | | |
| Net asset value, beginning of period | | | $8.56 | | $8.01 | |
| Income (loss) from investment operations | |
| Net investment loss (d) | | | $(0.08 | ) | $(0.05 | ) |
| Net realized and unrealized gain (loss) on investments and foreign currency | | 1.49 | | 0.60 | (g) |
| Total from investment operations | | | $1.41 | | $0.55 | |
| Net asset value, end of period | | | $9.97 | | $8.56 | |
| Total return (%) (s)(r) | | | 16.47 | (n) | 6.87 | (n) |
| Ratios (%) (to average net assets) | | | | | | |
| and Supplemental data: | |
| Expenses before expense reductions (f) | | | 2.40 | (a) | 2.32 | (a) |
| Expenses after expense reductions (f) | | | 1.90 | (a) | 2.04 | (a) |
| Net investment loss | | | (1.63 | )(a) | (1.60 | )(a) |
| Portfolio turnover | | | 105 | | 163 | |
| Net assets at end of period (000 Omitted) | | | $366 | | $85 | |
| | | | | | |
| |
Six months | | | | | |
| | ended | | Years ended 8/31 | |
| Class R3 | 2/28/06 | | 2005 | | 2004(i) | |
| | (unaudited) | | | | | |
| Net asset value, beginning of period | $8.76 | | $7.66 | | $8.79 | |
| Income (loss) from investment operations | |
| Net investment loss (d) | $(0.08 | ) | $(0.09 | ) | $(0.09 | ) |
| Net realized and unrealized gain (loss) on investments and | | | | | | |
| foreign currency | 1.52 | | 1.19 | | (1.04 | ) |
| Total from investment operations | $1.44 | | $1.10 | | $(1.13 | ) |
| Net asset value, end of period | $10.20 | | $8.76 | | $7.66 | |
| Total return (%) (s)(r) | 16.44 | (n) | 14.36 | | (12.86 | )(b)(n) |
| Ratios (%) (to average net assets) | | | | | | |
| and Supplemental data: | |
| Expenses before expense reductions (f) | 2.25 | (a) | 2.19 | | 2.01 | (a) |
| Expenses after expense reductions (f) | 1.80 | (a) | 1.91 | | 1.91 | (a) |
| Net investment loss | (1.53 | )(a) | (1.07 | ) | (1.47 | )(a) |
| Portfolio turnover | 105 | | 163 | | 141 | |
| Net assets at end of period (000 Omitted) | $510 | | $192 | | $132 | |
See Notes to Financial Statements | | | | | | |
16 SEMIANNUAL REPORT | | | | | | |
| Financial Highlights – continued | | | | |
| | Six months | | Year | |
| | ended | | ended | |
| Class R4 | 2/28/06 | | 8/31/05(i) | |
| | (unaudited) | | | |
| Net asset value, beginning of period | $8.85 | | $8.26 | |
| Income (loss) from investment operations | |
| Net investment loss (d) | $(0.06 | ) | $(0.04 | ) |
| Net realized and unrealized gain (loss) on investments and foreign currency | 1.53 | | 0.63 | (g) |
| Total from investment operations | $1.47 | | $0.59 | |
| Net asset value, end of period | $10.32 | | $8.85 | |
| Total return (%) (s)(r) | 16.61 | (n) | 7.14 | (n) |
| Ratios (%) (to average net assets) | | | | |
| and Supplemental data: | |
| Expenses before expense reductions (f) | 1.91 | (a) | 1.82 | (a) |
| Expenses after expense reductions (f) | 1.55 | (a) | 1.54 | (a) |
| Net investment loss | (1.27 | )(a) | (1.10 | )(a) |
| Portfolio turnover | 105 | | 163 | |
| Net assets at end of period (000 Omitted) | $62 | | $54 | |
See Notes to Financial Statements | | | | |
|
SEMIANNUAL REPORT 17
| |
| Financial Highlights – continued | | | | |
| | Six months | | Year | |
| | ended | | ended | |
| Class R5 | 2/28/06 | | 8/31/05(i) | |
| | (unaudited) | | | |
| Net asset value, beginning of period | $8.86 | | $8.26 | |
| Income (loss) from investment operations | | | | |
| Net investment loss (d) | $(0.05 | ) | $(0.03 | ) |
| Net realized and unrealized gain (loss) on investments and foreign currency | 1.54 | | 0.63 | (g) |
| Total from investment operations | $1.49 | | $0.60 | |
| Net asset value, end of period | $10.35 | | $8.86 | |
| Total return (%) (s)(r) | 16.82 | (n) | 7.26 | (n) |
| Ratios (%) (to average net assets) | | | | |
| and Supplemental data: | | | | |
| Expenses before expense reductions (f) | 1.61 | (a) | 1.52 | (a) |
| Expenses after expense reductions (f) | 1.25 | (a) | 1.24 | (a) |
| Net investment loss | (0.97 | )(a) | (0.79 | )(a) |
| Portfolio turnover | 105 | | 163 | |
| Net assets at end of period (000 Omitted) | $63 | | $54 | |
Any redemption fees charged by the fund during the 2004 and 2005 fiscal years resulted in a per share impact of less than $0.01.
| (a) | Annualized. |
| (n) | Not annualized. |
| (w) | Per share amount was less than $0.01. |
| (d) | Per share data are based on average shares outstanding. |
| (f) | Ratios do not reflect reductions from fees paid indirectly. |
| (r) | Certain expenses have been reduced without which performance would have been lower. |
| (s) | From time to time the fund may receive proceeds from litigation settlements, without which performance would be lower. |
| (t) | Total returns do not include any applicable sales charges. |
| (i) | For the period from the class’ inception, December 31, 2002 (Class R), October 31, 2003 (Class R3) and April 1, 2005 (Classes R1, R2, R4, and R5) through the stated period end. |
| (g) | The per share amount is not in accordance with the net realized and unrealized gain/loss for the period because of the timing of sales of fund shares and the amount of per share realized and unrealized gains and losses at such time. |
| (b) | The fund’s net asset value and total return calculation include a non-recurring accrual recorded as a result of an administrative proceeding regarding disclosure of brokerage allocation practices in connection with fund sales. The non-recurring accrual did not have a material impact on the net asset value per share based on the shares outstanding on the day the proceeds were recorded. |
| |
See Notes to Financial Statements
|
18 SEMIANNUAL REPORT
NOTES TO FINANCIAL STATEMENTS (unaudited)
(1) Business and Organization
|
MFS Technology Fund (the fund) is a series of MFS Series Trust I (the trust). The trust is organized as a Massachusetts business trust and is registered under the Investment Company Act of 1940, as amended, as an open-end management investment company.
(2) Significant Accounting Policies
|
General – The preparation of financial statements in conformity with U.S. generally accepted accounting principles requires management to make estimates and assumptions that affect the reported amounts of assets and liabilities, and disclosure of contingent assets and liabilities at the date of the financial statements and the reported amounts of revenues and expenses during the reporting period. Actual results could differ from those estimates. The fund can invest in foreign securities, including securities of emerging market issuers. Investments in foreign securities are vulnerable to the effects of changes in the relative values of the local currency and the U.S. dollar and to the effects of changes in each country’s legal, political, and economic environment. The markets of emerging markets countries are generally more volatile than the markets of developed countries with more mature economies. All of the risks of investing in foreign securities previously described are heightened when investing in emerging markets countries.
Investment Valuations – Equity securities, including restricted equity securities, are generally valued at the last sale or official closing price as reported by an independent pricing service on the market or exchange on which they are primarily traded. For securities for which there were no sales during the day, equity securities are generally valued at the last quoted bid price as reported by an independent pricing service on the market or exchange on which they are primarily traded. Short-term instruments with a maturity at issuance of 365 days or less are generally valued at amortized cost, which approximates market value. Open-end investment companies are generally valued at their net asset value per share. Securities and other assets generally valued on the basis of information from an independent pricing service may also be valued on the basis of information from brokers and dealers. The values of foreign securities and other assets and liabilities expressed in foreign currencies are converted to U.S. dollars based upon exchange rates provided by an independent source. When pricing-service information or market quotations are not readily available, securities are priced at fair value as determined under the direction of the Board of Trustees. For example, in valuing securities that trade principally on foreign markets, events reasonably determined to be significant (such as certain movements in the U.S. securities market, or other regional and local developments) may occur between the time that foreign markets close (where the security is principally traded) and the fund’s valuation time that may impact the value of securities traded in these foreign markets. In these cases, the fund may utilize information from an external vendor or other sources to adjust closing market prices of foreign equity securities to reflect what it believes to be the fair value of the securities as of the fund’s valuation time. Fair valuation of foreign equity securities may
Notes to Financial Statements (unaudited) – continued
occur frequently based on an assessment that events which occur on a fairly regular basis (such as U.S. market movements) are significant.
Repurchase Agreements – The fund may enter into repurchase agreements with institutions that the fund’s investment adviser has determined are creditworthy. Each repurchase agreement is recorded at cost. The fund requires that the securities collateral in a repurchase transaction be transferred to the custodian in a manner sufficient to enable the fund to obtain those securities in the event of a default under the repurchase agreement. The fund monitors, on a daily basis, the value of the collateral to ensure that its value, including accrued interest, is greater than amounts owed to the fund under each such repurchase agreement. The fund, along with other affiliated entities of Massachusetts Financial Services Company (MFS), may utilize a joint trading account for the purpose of entering into one or more repurchase agreements.
Foreign Currency Translation – Purchases and sales of foreign investments, income, and expenses are converted into U.S. dollars based upon currency exchange rates prevailing on the respective dates of such transactions. Gains and losses attributable to foreign currency exchange rates on sales of securities are recorded for financial statement purposes as net realized gains and losses on investments. Gains and losses attributable to foreign exchange rate movements on income and expenses are recorded for financial statement purposes as foreign currency transaction gains and losses. That portion of both realized and unrealized gains and losses on investments that results from fluctuations in foreign currency exchange rates is not separately disclosed.
Security Loans – State Street Bank and Trust Company (‘‘State Street’’), as lending agent, may loan the securities of the fund to certain qualified institutions (the ‘‘Borrowers’’) approved by the fund. The loans are collateralized at all times by cash and/or U.S. Treasury securities in an amount at least equal to the market value of the securities loaned. State Street provides the fund with indemnification against Borrower default. The fund bears the risk of loss with respect to the investment of cash collateral. On loans collateralized by cash, the cash collateral is invested in a money market fund or short-term securities. A portion of the income generated upon investment of the collateral is remitted to the Borrowers, and the remainder is allocated between the fund and the lending agent. On loans collateralized by U.S. Treasury securities, a fee is received from the Borrower, and is allocated between the fund and the lending agent. Income from securities lending is included in interest income on the Statement of Operations. The dividend and interest income earned on the securities loaned is accounted for in the same manner as other dividend and interest income.
Short Term Fees – For purchases made on or after July 1, 2004 and before April 1, 2005, the fund charged a 2% redemption fee (which was retained by the fund) on proceeds from Class A, Class B, Class C, and Class I shares redeemed or exchanged within 5 business days following their acquisition (either by purchase or exchange). The fund no longer charges a redemption
20 SEMIANNUAL REPORT
Notes to Financial Statements (unaudited) – continued
fee. See the fund’s prospectus for details. Any redemption fees charged are accounted for as an addition to paid-in capital.
Investment Transactions and Income – Investment transactions are recorded on the trade date. Interest income is recorded on the accrual basis. All premium and discount is amortized or accreted for financial statement purposes in accordance with U.S. generally accepted accounting principles. All discount is accreted for tax reporting purposes as required by federal income tax regulations. Dividends received in cash are recorded on the ex-dividend date. Certain dividends from foreign securities will be recorded when the fund is informed of the dividend if such information is obtained subsequent to the ex-dividend date. Dividend and interest payments received in additional securities are recorded on the ex-dividend or ex-interest date in an amount equal to the value of the security on such date.
The fund may receive proceeds from litigation settlements involving its portfolio holdings. Any proceeds received are reflected in realized gain/loss in the Statement of Operations, or in unrealized gain/loss if the security is still held by the fund.
Fees Paid Indirectly – The fund’s custody fee is reduced according to an arrangement that measures the value of cash deposited with the custodian by the fund. During the six months ended February 28, 2006, the fund’s custodian fees were reduced by $1,861 under this arrangement. The fund has entered into a commission recapture agreement, under which certain brokers will credit the fund a portion of the commissions generated, to offset certain expenses of the fund. For the six months ended February 28, 2006, the fund’s custodian expenses were reduced by $1,843 under this agreement. These amounts are shown as a reduction of total expenses on the Statement of Operations. Effective January 1, 2006, the commission recapture agreement was terminated.
Tax Matters and Distributions – The fund intends to continue to qualify as a regulated investment company, as defined under Subchapter M of the Internal Revenue Code, and to distribute all of its taxable income, including realized capital gains. Accordingly, no provision for federal income tax is required in the financial statements. Foreign taxes, if any, have been accrued by the fund in the accompanying financial statements.
Distributions to shareholders are recorded on the ex-dividend date. Income and capital gain distributions are determined in accordance with income tax regulations, which may differ from generally accepted accounting principles. Certain capital accounts in the financial statements are periodically adjusted for permanent differences in order to reflect their tax character. These adjustments have no impact on net assets or net asset value per share. Temporary differences which arise from recognizing certain items of income, expense, gain or loss in different periods for financial statement and tax purposes will reverse at some time in the future. Distributions in excess of net investment income or net realized gains are temporary overdistributions for financial statement purposes resulting from differences in the recognition or
SEMIANNUAL REPORT 21
Notes to Financial Statements (unaudited) – continued
classification of income for financial statement and tax purposes. Book/tax differences primarily relate to foreign currency transactions, wash sales, non-taxable distributions, and net operating losses.
The fund declared no distributions for the years ended August 31, 2005 and August 31, 2004.
The federal tax cost and the tax basis components of distributable earnings were as follows:
| | As of February 28, 2006 | | |
| Cost of investments(1) | $122,978,695 | |
| Gross appreciation | $11,456,439 | |
| Gross depreciation | (4,528,108 | ) |
| Net unrealized appreciation (depreciation) | $6,928,331 | |
| As of August 31, 2005 | | |
| Capital loss carryforwards | $(341,525,032 | ) |
| Net unrealized appreciation (depreciation) | 2,644,159 | |
| Other temporary differences | (15,951 | ) |
(1) Aggregate cost includes prior fiscal year end tax adjustments.
As of August 31, 2005, the fund had available capital loss carryforwards to offset future realized gains. Such losses expire as follows:
| | August 31, 2007 | $(1,684,872 | ) |
| August 31, 2008 | (7,671,099 | ) |
| August 31, 2009 | (113,374,272 | ) |
| August 31, 2010 | (139,439,925 | ) |
| August 31, 2011 | (74,891,618 | ) |
| August 31, 2012 | (4,463,246 | ) |
| Total | $(341,525,032 | ) |
Multiple Classes of Shares of Beneficial Interest – The fund offers multiple classes of shares, which differ in their respective distribution and service fees. All shareholders bear the common expenses of the fund based on daily net assets of each class, without distinction between share classes. Dividends are declared separately for each class. Differences in per share dividend rates are generally due to differences in separate class expenses. Class B shares will convert to Class A shares approximately eight years after purchase.
(3) Transactions with Affiliates
|
Investment Adviser – The fund has an investment advisory agreement with Massachusetts Financial Services Company (MFS) to provide overall investment advisory and administrative services, and general office facilities.
22 SEMIANNUAL REPORT
Notes to Financial Statements (unaudited) – continued
The management fee is computed daily and paid monthly at an annual rate of 0.75% of the fund’s average daily net assets. The investment adviser has contractually agreed to reduce its management fee to 0.70% of average daily net assets in excess of $1 billion. This management fee reduction amounted to $0.
The management fee incurred for the six months ended February 28, 2006 was equivalent to an annual effective rate of 0.75% of the fund’s average daily net assets.
The investment adviser has contractually agreed to pay a portion of the fund’s operating expenses, exclusive of management, distribution and service, retirement plan administration and services, and certain other fees and expenses, such that operating expenses do not exceed 0.40% annually of the fund’s average daily net assets. This contractual fee arrangement will continue until January 1, 2007. For the six months ended February 28, 2006, this reduction amounted to $201,995 and is reflected as a reduction of total expenses in the Statement of Operations.
Distributor – MFS Fund Distributors, Inc. (MFD), a wholly owned subsidiary of MFS, as distributor, received $3,213 for the six months ended February 28, 2006, as its portion of the initial sales charge on sales of Class A shares of the fund.
The Board of Trustees has adopted a distribution plan for certain class shares pursuant to Rule 12b-1 of the Investment Company Act of 1940.
The fund’s distribution plan provides that the fund will pay MFD for services provided by MFD and financial intermediaries in connection with the distribution and servicing of certain share classes. One component of the plan is a distribution fee paid to MFD and another component of the plan is a service fee paid to MFD. MFD may subsequently pay all, or a portion, of the distribution and/or service fees to financial intermediaries.
| Distribution Fee Plan Table: | | | | |
| | | | | Total | Annual | Distribution |
| | | Distribution | Service | Distribution | Effective | and Service |
| | | Fee Rate | Fee Rate | Plan(1) | Rate(2) | Fee |
| Class A | 0.10% | 0.25% | 0.35% | 0.35% | $86,173 |
| Class B | 0.75% | 0.25% | 1.00% | 1.00% | 219,992 |
| Class C | 0.75% | 0.25% | 1.00% | 1.00% | 63,192 |
| Class R | 0.25% | 0.25% | 0.50% | 0.50% | 6,276 |
| Class | R1 | 0.50% | 0.25% | 0.75% | 0.75% | 411 |
| Class | R2 | 0.25% | 0.25% | 0.50% | 0.50% | 702 |
| Class | R3 | 0.25% | 0.25% | 0.50% | 0.50% | 1,008 |
| Class | R4 | — | 0.25% | 0.25% | 0.25% | 72 |
|
|
|
|
|
|
|
| Total Distribution and Service Fees | | | | $377,826 |
| (1) | In accordance with the distribution plan for certain classes, the fund pays distribution and/or service fees up to these annual percentage rates of each class’ average daily net assets. |
| (2) | The annual effective rates represent actual fees incurred under the distribution plan for the six months ended February 28, 2006 based on each class’ average daily net assets. |
| |
SEMIANNUAL REPORT 23
Notes to Financial Statements (unaudited) – continued
Certain Class A and Class C shares are subject to a contingent deferred sales charge in the event of a shareholder redemption within 12 months of purchase. Class B shares are subject to a contingent deferred sales charge in the event of a shareholder redemption within six years of purchase. All contingent deferred sales charges are paid to MFD and during the six months ended February 28, 2006, were as follows:
| | Amount |
| Class A | $2,224 |
| Class B | $57,187 |
| Class C | $1,397 |
Shareholder Servicing Agent – The fund pays a portion of shareholder servicing costs to MFS Service Center, Inc. (MFSC), a wholly-owned subsidiary of MFS. MFSC receives a fee from the fund, for its services as shareholder servicing agent, set periodically under the supervision of the fund’s Board of Trustees. For the six months ended February 28, 2006, the fee was $54,811, which equated to 0.0972% annually of the fund’s average daily net assets. MFSC also receives payment from the fund for out-of-pocket and sub-accounting expenses paid by MFSC on behalf of the fund. For the six months ended February 28, 2006, these costs amounted to $74,398.
Administrator – MFS provides certain financial, legal, shareholder communications, compliance, and other administrative services to certain funds for which MFS acts as investment adviser. Under an administrative services agreement, the funds may partially reimburse MFS the costs incurred to provide these services, subject to review and approval by the Board of Trustees. Each fund is charged a fixed amount plus a fee based on calendar year average net assets. Effective July 1, 2005, the fund’s annual fixed amount is $10,000.
The administrative services fee incurred for the six months ended February 28, 2006 was equivalent to an annual effective rate of 0.0178% of the fund’s average daily net assets.
In addition to the administrative services provided by MFS to the fund as described above, MFS is responsible for providing certain retirement plan administration and services with respect to certain shares. These services include various administrative, recordkeeping, and communication/educational services with respect to the retirement plans which invest in these shares, and may be provided directly by MFS or by a third party. MFS may subsequently pay all, or a portion, of the retirement plan administration and services fee to affiliated or unaffiliated third parties. For the six months ended February 28, 2006, the fund paid MFS an annual retirement plan
24 SEMIANNUAL REPORT
Notes to Financial Statements (unaudited) – continued
administration and services fee up to the following annual percentage rates of each class’ average daily net assets:
| | | | Annual | |
| | | | Effective | Total |
| | | Fee Rate | Rate(1) | Amount |
| Class R1 | 0.45% | 0.36% | $246 |
| Class R2 | 0.40% | 0.26% | 560 |
| Class R3 | 0.25% | 0.16% | 503 |
| Class R4 | 0.15% | 0.15% | 43 |
| Class R5 | 0.10% | 0.10% | 29 |
|
|
|
|
|
| Total Retirement Plan Administration and Services Fees | | | $1,381 |
| (1) | Effective October 1, 2005, MFS has contractually agreed to waive a portion of the retirement plan administration and services fee equal to 0.10% for Class R1 shares, 0.15% for Class R2 shares, and 0.10% for Class R3 shares. This agreement will continue until at least September 30, 2007. For the six months ended February 28, 2006, this waiver amounted to $432 and is reflected as a reduction of total expenses in the Statement of Operations. |
| |
Trustees’ and Officers’ Compensation – The fund pays compensation to Independent Trustees in the form of a retainer, attendance fees, and additional compensation to Board and Committee chairpersons. The fund does not pay compensation directly to Trustees who are officers of the investment adviser, or to officers of the fund, all of whom receive remuneration for their services to the fund from MFS. Certain officers and Trustees of the fund are officers or directors of MFS, MFD, and MFSC. The fund has an unfunded, defined benefit plan for retired Independent Trustees which resulted in a pension expense of $344. The fund also has an unfunded retirement benefit deferral plan for certain current Independent Trustees which resulted in an expense of $4,975. Both amounts are included in Independent trustees’ compensation for the six months ended February 28, 2006. The deferred liability for retirement benefits payable to retired Trustees and certain current Trustees amounted to $3,326 and $44,300, respectively, at February 28, 2006, and is included in payable for independent trustees’ compensation.
Other – This fund and certain other MFS funds (the funds) have entered into a services agreement (the Agreement) which provides for payment of fees by the funds to Tarantino LLC in return for the provision of services of an Independent Chief Compliance Officer (ICCO) for the funds. The ICCO is an officer of the funds and the sole member of Tarantino LLC. The funds can terminate the Agreement with Tarantino LLC at any time under the terms of the Agreement. For the six months ended February 28, 2006, the fee paid to Tarantino LLC was $472. MFS has agreed to reimburse the fund for a portion of the payments made by the funds to Tarantino LLC in the amount of $341, which is shown as a reduction of total expenses in the Statement of Operations. Additionally, MFS has agreed to bear all expenses associated with office space, other administrative support, and supplies provided to the ICCO.
Purchases and sales of investments, other than U.S. government securities, purchased option transactions, and short-term obligations, aggregated $117,798,887 and $132,320,062, respectively.
Notes to Financial Statements (unaudited) – continued
(5) Shares of Beneficial Interest
|
The fund’s Declaration of Trust permits the Trustees to issue an unlimited number of full and fractional shares of beneficial interest. Transactions in fund shares were as follows:
| | | Six months ended 2/28/06 | | Year ended 8/31/05(i) | |
| | | Shares | | Amount | | Shares | | Amount | |
| Shares sold | | | | | | | | |
| Class A | 441,730 | | $4,262,649 | | 1,841,301 | | $15,794,906 | |
| Class B | 237,294 | | 2,196,934 | | 601,987 | | 5,034,688 | |
| Class C | 111,143 | | 1,039,165 | | 230,424 | | 1,904,542 | |
| Class I | 42,554 | | 429,192 | | 153,317 | | 1,351,997 | |
| Class R | 35,893 | | 345,680 | | 203,930 | | 1,740,254 | |
| Class R1 | 6,134 | | 53,883 | | 7,503 | | 61,010 | |
| Class R2 | 26,851 | | 239,714 | | 9,983 | | 82,697 | |
| Class R3 | 39,101 | | 357,116 | | 11,651 | | 100,006 | |
| Class R4 | — | | — | | 6,053 | | 50,000 | |
| Class R5 | — | | — | | 6,053 | | 50,000 | |
| | | 940,700 | | $8,924,333 | | 3,072,202 | | $26,170,100 | |
| Shares reacquired | | | | | | | | |
| Class A | (1,074,185 | ) | $(10,264,116 | ) | (6,148,566 | ) | $(52,768,987 | ) |
| Class B | (830,321 | ) | (7,644,505 | ) | (2,275,531 | ) | (18,989,310 | ) |
| Class C | (239,781 | ) | (2,208,458 | ) | (830,211 | ) | (6,910,220 | ) |
| Class I | (65,414 | ) | (641,471 | ) | (1,486,367 | ) | (13,661,239 | ) |
| Class R | (28,727 | ) | (281,171 | ) | (109,402 | ) | (937,454 | ) |
| Class R1 | (644 | ) | (5,891 | ) | (1 | ) | (17 | ) |
| Class R2 | (85 | ) | (856 | ) | — | | — | |
| Class R3 | (10,987 | ) | (104,639 | ) | (7,034 | ) | (59,817 | ) |
| | | (2,250,144 | ) | $(21,151,107 | ) | (10,857,112 | ) | $(93,327,044 | ) |
| Net change | | | | | | | | |
| Class A | (632,455 | ) | $(6,001,467 | ) | (4,307,265 | ) | $(36,974,081 | ) |
| Class B | (593,027 | ) | (5,447,571 | ) | (1,673,544 | ) | (13,954,622 | ) |
| Class C | (128,638 | ) | (1,169,293 | ) | (599,787 | ) | (5,005,678 | ) |
| Class I | (22,860 | ) | (212,279 | ) | (1,333,050 | ) | (12,309,242 | ) |
| Class R | 7,166 | | 64,509 | | 94,528 | | 802,800 | |
| Class R1 | 5,490 | | 47,992 | | 7,502 | | 60,993 | |
| Class R2 | 26,766 | | 238,858 | | 9,983 | | 82,697 | |
| Class R3 | 28,114 | | 252,477 | | 4,617 | | 40,189 | |
| Class R4 | — | | — | | 6,053 | | 50,000 | |
| Class R5 | — | | — | | 6,053 | | 50,000 | |
| | | (1,309,444 | ) | $(12,226,774 | ) | (7,784,910 | ) | $(67,156,944 | ) |
| (i) | For the period from the class’ inception, April 1, 2005 (Classes R1, R2, R4, and R5) through the stated period end. |
| |
26 SEMIANNUAL REPORT
Notes to Financial Statements (unaudited) – continued
The fund and other affiliated funds participate in a $1 billion unsecured line of credit provided by a syndication of banks under a credit agreement. Borrowings may be made for temporary financing needs. Interest is charged to each fund, based on its borrowings, at a rate equal to the Federal Reserve funds rate plus 0.35% . In addition, a commitment fee, based on the average daily, unused portion of the line of credit, is allocated among the participating funds at the end of each calendar quarter. The commitment fee allocated to the fund for the six months ended February 28, 2006 was $376, and is included in miscellaneous expense on the Statement of Operations. The fund had no significant borrowings during the six months ended February 28, 2006.
SEMIANNUAL REPORT 27
BOARD REVIEW OF INVESTMENT ADVISORY AGREEMENT
A discussion regarding the Board’s most recent review and renewal of the Fund’s investment advisory agreement is available by clicking on the fund’s name under ‘‘Select a fund’’ on the MFS Web site (mfs.com).
PROXY VOTING POLICIES AND INFORMATION
A general description of the MFS funds’ proxy voting policies and procedures is available without charge, upon request, by calling 1-800-225-2606, by visiting the Proxy Voting section of mfs.com or by visiting the SEC’s Web site at http://www.sec.gov.
Information regarding how the fund voted proxies relating to portfolio securities during the most recent twelve-month period ended June 30 is available without charge by visiting the Proxy Voting section of mfs.com or by visiting the SEC’s Web site at http://www.sec.gov.
QUARTERLY PORTFOLIO DISCLOSURE
|
The trust will file a complete schedule of portfolio holdings with the Securities and Exchange Commission (the Commission) for the first and third quarters of each fiscal year on Form N-Q. The trust’s Form N-Q may be reviewed and copied at the:
Public Reference Room
Securities and Exchange Commission
Washington, D.C. 20549-0102
Information on the operation of the Public Reference Room may be obtained by calling the Commission at 1-800-SEC-0330. The trust’s Form N-Q is available on the EDGAR database on the Commission’s Internet Web site at http://www.sec.gov, and copies of this information may be obtained, upon payment of a duplicating fee, by electronic request at the following e-mail address: publicinfo@sec.gov or by writing the Public Reference Section at the above address.
A shareholder can also obtain the quarterly portfolio holdings report at mfs.com.
28 SEMIANNUAL REPORT

LETTER FROM THE CEO

Dear Shareholders,
It has been said that change is the only constant in life. As investors have seen, that theme is still accurate today as we recently have experienced shifting economic cycles because of natural disasters and political instability around the globe.
Markets worldwide have fluctuated in the past year as devastating hurricanes had a dramatic effect on the international economy, particularly on oil prices. We witnessed political unrest in the Middle East, highlighted by instability in Iraq, and in Africa, the usually stable Nigeria also experienced violence. As a result, energy prices have bounced up and down, with crude oil prices at one point topping a record $70 per barrel.
Such cycles are not uncommon and in fact have almost become the norm in our everyday lives. What does all of this mean to you as an investor? In times like these, it helps to know that you’re working with a seasoned investment professional who has experience to guide you through difficult times. At MFS®, we believe our investment management team has the knowledge and confidence to navigate through difficult cycles and at the same time see through adversity to find investment opportunities for our clients and shareholders.
Our investment management process, honed over 80 years, combines a unique concept of teamwork with our unwavering focus on the long term. We firmly believe that the best way to realize long-term financial goals – be it a college education, a comfortable retirement, or a secure family legacy – is to follow a three-pronged approach that focuses on longer time horizons. Allocate holdings across the major asset classes – including stocks, bonds, and cash. Diversify within each class to take advantage of different market segments and investing styles. Rebalance assets regularly to maintain a desired asset allocation. Of course, these strategies cannot guarantee a profit or protect against a loss. This long-term approach requires diligence and patience, two traits that in our experience are essential to capitalizing on the many opportunities the financial markets can offer – through both up and down economic cycles.
Respectfully,

Robert J. Manning
Chief Executive Officer and Chief Investment Officer
MFS Investment Management®
April 17, 2006
The opinions expressed in this letter are those of MFS, and no forecasts can be guaranteed.
SEMIANNUAL REPORT 1
PORTFOLIO COMPOSITION
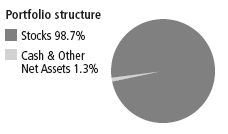
| Top ten holdings | | |
| Bank of America Corp. | | 4.5% |
|
| Altria Group, Inc. | | 3.2% |
|
| Citigroup, Inc. | | 3.1% |
|
| Lockheed Martin Corp. | | 3.1% |
|
| Goldman Sachs Group, Inc. | | 3.0% |
|
| MetLife, Inc. | | 2.6% |
|
| Dominion Resources, Inc. | | 2.6% |
|
| Johnson & Johnson | | 2.6% |
|
| Sprint Nextel Corp. | | 2.5% |
|
| Northrop Grumman Corp. | | 2.3% |
|
| Equity market sectors | | |
| Financial Services | | 28.7% |
|
| Industrial Goods & Services | | 11.6% |
|
| Energy | | 11.3% |
|
| Utilities & Communications | | 10.7% |
|
| Consumer Staples | | 8.7% |
|
| Basic Materials | | 7.3% |
|
| Health Care | | 7.2% |
|
| Leisure | | 3.3% |
|
| Autos & Housing | | 2.6% |
|
| Technology | | 2.1% |
|
| Transportation | | 1.9% |
|
| Retailing | | 1.8% |
|
| Special Products & Services | | 1.5% |
|
Percentages are based on net assets as of 2/28/06.
The portfolio is actively managed, and current holdings may be different.
2 SEMIANNUAL REPORT
EXPENSE TABLE
Fund Expenses Borne by the Shareholders During the Period, September 1, 2005 through February 28, 2006.
As a shareholder of the fund, you incur two types of costs: (1) transaction costs, including sales charges (loads) on certain purchase or redemption payments and redemption fees on certain exchanges and redemptions, and (2) ongoing costs, including management fees; distribution and service (12b-1) fees; and other fund expenses. This example is intended to help you understand your ongoing costs (in dollars) of investing in the fund and to compare these costs with the ongoing costs of investing in other mutual funds.
The example is based on an investment of $1,000 invested at the beginning of the period and held for the entire period September 1, 2005 through February 28, 2006.
Actual Expenses
The first line for each share class in the following table provides information about actual account values and actual expenses. You may use the information in this line, together with the amount you invested, to estimate the expenses that you paid over the period. Simply divide your account value by $1,000 (for example, an $8,600 account value divided by $1,000=8.6), then multiply the result by the number in the first line under the heading entitled ‘‘Expenses Paid During Period’’ to estimate the expenses you paid on your account during this period.
Hypothetical Example for Comparison Purposes
The second line for each share class in the following table provides information about hypothetical account values and hypothetical expenses based on the fund’s actual expense ratio and an assumed rate of return of 5% per year before expenses, which is not the fund’s actual return. The hypothetical account values and expenses may not be used to estimate the actual ending account balance or expenses you paid for the period. You may use this information to compare the ongoing costs of investing in the fund and other funds. To do so, compare this 5% hypothetical example with the 5% hypothetical examples that appear in the shareholder reports of the other funds.
Please note that the expenses shown in the table are meant to highlight your ongoing costs only and do not reflect any transactional costs, such as sales charges (loads) or redemption fees. Therefore, the second line for each share class in the table is useful in comparing ongoing costs only, and will not help you determine the relative total costs of owning different funds. In addition, if these transactional costs were included, your costs would have been higher.
SEMIANNUAL REPORT 3
Expense Table – continued
| | | | | | | Expenses |
| | | | Annualized | Beginning | Ending | Paid During |
| | | | Expense | Account Value | Account Value | Period(p) |
| Share Class | | | Ratio | 9/01/05 | 2/28/06 | 9/01/05-2/28/06 |
|
A
| | Actual | 1.19% | $1,000.00 | $1,066.00 | $ 6.10 |
|
|
| | Hypothetical(h) | 1.19% | $1,000.00 | $1,018.89 | $ 5.96 |
|
B
| | Actual | 1.83% | $1,000.00 | $1,062.60 | $ 9.36 |
|
|
| | Hypothetical(h) | 1.83% | $1,000.00 | $1,015.72 | $ 9.15 |
|
C
| | Actual | 1.84% | $1,000.00 | $1,062.70 | $ 9.41 |
|
|
| | Hypothetical(h) | 1.84% | $1,000.00 | $1,015.67 | $ 9.20 |
|
I
| | Actual | 0.84% | $1,000.00 | $1,067.90 | $ 4.31 |
|
|
| | Hypothetical(h) | 0.84% | $1,000.00 | $1,020.63 | $ 4.21 |
|
R
| | Actual | 1.34% | $1,000.00 | $1,065.40 | $ 6.86 |
|
|
| | Hypothetical(h) | 1.34% | $1,000.00 | $1,018.15 | $ 6.71 |
|
R1
| | Actual | 1.96% | $1,000.00 | $1,062.20 | $10.02 |
|
|
| | Hypothetical(h) | 1.96% | $1,000.00 | $1,015.08 | $ 9.79 |
|
R2
| | Actual | 1.61% | $1,000.00 | $1,064.30 | $ 8.24 |
|
|
| | Hypothetical(h) | 1.61% | $1,000.00 | $1,016.81 | $ 8.05 |
|
R3
| | Actual | 1.50% | $1,000.00 | $1,064.60 | $ 7.68 |
|
|
| | Hypothetical(h) | 1.50% | $1,000.00 | $1,017.36 | $ 7.50 |
|
R4
| | Actual | 1.24% | $1,000.00 | $1,065.90 | $ 6.35 |
|
|
| | Hypothetical(h) | 1.24% | $1,000.00 | $1,018.65 | $ 6.21 |
|
R5
| | Actual | 0.95% | $1,000.00 | $1,067.30 | $ 4.87 |
|
|
| | Hypothetical(h) | 0.95% | $1,000.00 | $1,020.08 | $ 4.76 |
|
529A
| | Actual | 1.44% | $1,000.00 | $1,064.60 | $ 7.37 |
|
|
| | Hypothetical(h) | 1.44% | $1,000.00 | $1,017.65 | $ 7.20 |
|
529B
| | Actual | 2.09% | $1,000.00 | $1,061.50 | $10.68 |
|
|
| | Hypothetical(h) | 2.09% | $1,000.00 | $1,014.43 | $10.44 |
|
529C
| | Actual | 2.09% | $1,000.00 | $1,061.50 | $10.68 |
|
|
| | Hypothetical(h) | 2.09% | $1,000.00 | $1,014.43 | $10.44 |
|
| (h) | 5% class return per year before expenses. |
| (p) | Expenses paid is equal to each class’ annualized expense ratio, as shown above, multiplied by the average account value over the period, multiplied by the number of days in the period, divided by the number of days in the year. Expenses paid do not include any applicable sales charges (loads) or redemption fees. If these transaction costs had been included, your costs would have been higher. |
| |
Effective October 1, 2005 the fund’s Class R1, Class R2, and Class R3 retirement plan administration and services fee was reduced (as described in Note 3 of the Notes to the Financial Statements). Had this fee reduction been in effect throughout the entire six month period, the annualized expense ratio would have been 1.94%, 1.59%, and 1.48% for Class R1, Class R2, and Class R3, respectively, and the actual expenses paid during the period would have been approximately $9.92, $8.14, and $7.58 for Class R1, Class R2, and Class R3, respectively.
4 SEMIANNUAL REPORT
| PORTFOLIO OF INVESTMENTS (unaudited) – 2/28/06 | | | | | |
| The Portfolio of Investments is a complete list of all securities owned by your fund. | | | |
| It is categorized by broad-based asset classes. | | | | | |
| Stocks - 98.7% | | | | | |
|
| Issuer | | Shares/Par | | | Value ($) |
|
| Aerospace - 6.8% | | | | | |
|
| Lockheed Martin Corp. | | 3,378,260 | | $ | 246,173,806 |
| Northrop Grumman Corp. | | 2,857,540 | | | 183,168,314 |
| United Technologies Corp. | | 1,915,670 | | | 112,066,695 |
| |
|
| | | | | $ | 541,408,815 |
|
| Alcoholic Beverages - 0.9% | | | | | |
|
| Diageo PLC | | 4,783,909 | | $ | 73,586,710 |
|
| Automotive - 0.2% | | | | | |
|
| Johnson Controls, Inc. (l) | | 223,690 | | $ | 15,942,386 |
|
| Banks & Credit Companies - 16.1% | | | | | |
|
| American Express Co. | | 1,456,650 | | $ | 78,484,302 |
| Bank of America Corp. | | 7,812,875 | | | 358,220,319 |
| Bank of New York Co., Inc. | | 501,300 | | | 17,164,512 |
| Citigroup, Inc. | | 5,410,850 | | | 250,901,114 |
| Fannie Mae | | 2,241,770 | | | 122,579,984 |
| Freddie Mac (l) | | 619,770 | | | 41,766,300 |
| PNC Financial Services Group, Inc. | | 1,687,640 | | | 118,725,474 |
| SunTrust Banks, Inc. | | 2,225,650 | | | 161,070,291 |
| UBS AG (l) | | 761,185 | | | 80,941,275 |
| Wells Fargo & Co. | | 884,120 | | | 56,760,504 |
| |
|
| | | | | $1,286,614,075 |
|
| Broadcast & Cable TV - 1.8% | | | | | |
|
| CBS Corp., ‘‘B’’ | | 1,475,321 | | $ | 36,086,352 |
| Viacom, Inc., ‘‘B’’ (n) | | 1,476,111 | | | 58,985,396 |
| Walt Disney Co. | | 1,847,210 | | | 51,703,408 |
| |
|
| | | | | $ | 146,775,156 |
|
| Brokerage & Asset Managers - 6.0% | | | | | |
|
| Ameriprise Financial, Inc. | | 180,852 | | $ | 8,225,149 |
| Franklin Resources, Inc. | | 399,780 | | | 41,049,410 |
| Goldman Sachs Group, Inc. | | 1,683,750 | | | 237,897,037 |
| Lehman Brothers Holdings, Inc. | | 430,000 | | | 62,758,500 |
| Mellon Financial Corp. | | 2,147,040 | | | 77,486,674 |
| Merrill Lynch & Co., Inc. | | 655,300 | | | 50,595,713 |
| |
|
| | | | | $ | 478,012,483 |
|
| Business Services - 1.5% | | | | | |
|
| Accenture Ltd., ‘‘A’’ (l) | | 3,666,930 | | $ | 119,761,934 |
|
| | | SEMIANNUAL REPORT 5 |
| Portfolio of Investments (unaudited) – continued | | | | | |
| Issuer | | Shares/Par | | | Value ($) |
|
| Stocks - continued | | | | | |
|
| Chemicals - 4.5% | | | | | |
|
| Dow Chemical Co. | | 1,535,790 | | $ | 66,085,044 |
| E.I. du Pont de Nemours & Co. | | 2,065,590 | | | 83,119,342 |
| Nalco Holding Co. (n) | | 993,590 | | | 17,387,825 |
| PPG Industries, Inc. | | 1,772,640 | | | 107,475,163 |
| Syngenta AG | | 593,680 | | | 83,930,944 |
| |
|
| | | | | $ | 357,998,318 |
|
| Computer Software - 0.8%�� | | | | | |
|
| Oracle Corp. (n) | | 3,720,250 | | $ | 46,205,505 |
| Symantec Corp. (l)(n) | | 1,244,590 | | | 21,021,125 |
| |
|
| | | | | $ | 67,226,630 |
|
| Construction - 2.4% | | | | | |
|
| Masco Corp. (l) | | 5,374,510 | | $ | 167,630,967 |
| Sherwin-Williams Co. | | 541,330 | | | 24,657,582 |
| |
|
| | | | | $ | 192,288,549 |
|
| Consumer Goods & Services - 0.5% | | | | | |
|
| Kimberly-Clark Corp. | | 687,030 | | $ | 40,658,435 |
|
| Containers - 0.3% | | | | | |
|
| Smurfit-Stone Container Corp. (l)(n) | | 1,560,510 | | $ | 20,473,891 |
|
| Electrical Equipment - 1.7% | | | | | |
|
| Cooper Industries Ltd., ‘‘A’’ | | 851,750 | | $ | 71,291,475 |
| Tyco International Ltd. | | 679,220 | | | 17,517,084 |
| W.W. Grainger, Inc. | | 610,650 | | | 45,212,526 |
| |
|
| | | | | $ | 134,021,085 |
|
| Electronics - 0.8% | | | | | |
|
| Analog Devices, Inc. (l) | | 593,860 | | $ | 22,649,820 |
| Intel Corp. | | 1,915,960 | | | 39,468,776 |
| |
|
| | | | | $ | 62,118,596 |
|
| Energy - Independent - 1.5% | | | | | |
|
| Apache Corp. (l) | | 384,600 | | $ | 25,737,432 |
| Devon Energy Corp. (l) | | 960,320 | | | 56,303,562 |
| EOG Resources, Inc. | | 581,830 | | | 39,215,342 |
| |
|
| | | | | $ | 121,256,336 |
|
| Energy - Integrated - 9.3% | | | | | |
|
| Amerada Hess Corp. (l) | | 492,400 | | $ | 68,103,844 |
| BP PLC, ADR (l) | | 1,524,180 | | | 101,236,036 |
| Chevron Corp. | | 1,007,104 | | | 56,881,234 |
| ConocoPhillips (l) | | 2,935,830 | | | 178,968,197 |
| Exxon Mobil Corp. | | 2,734,140 | | | 162,325,892 |
| TOTAL S.A., ADR (l) | | 1,394,190 | | | 175,849,185 |
| |
|
| | | | | $ | 743,364,388 |
|
| 6 SEMIANNUAL REPORT | | | | | |
| Portfolio of Investments (unaudited) – continued | | | | | |
| Issuer | | Shares/Par | | | Value ($) |
|
| Stocks - continued | | | | | |
|
| Food & Non-Alcoholic Beverages - 4.1% | | | | | |
|
| Archer Daniels Midland Co. (l) | | 1,570,655 | | $ | 49,821,177 |
| H.J. Heinz Co. (l) | | 1,073,050 | | | 40,636,403 |
| Kellogg Co. | | 2,470,220 | | | 109,455,448 |
| Nestle S.A. (l) | | 153,527 | | | 45,208,428 |
| PepsiCo, Inc. | | 650,536 | | | 38,453,183 |
| Sara Lee Corp. | | 2,580,940 | | | 45,605,210 |
| |
|
| | | | | $ | 329,179,849 |
|
| Forest & Paper Products - 1.1% | | | | | |
|
| Bowater, Inc. (l) | | 566,740 | | $ | 14,746,575 |
| International Paper Co. (l) | | 2,307,640 | | | 75,621,363 |
| |
|
| | | | | $ | 90,367,938 |
|
| General Merchandise - 0.2% | | | | | |
|
| Federated Department Stores, Inc. (l) | | 220,470 | | $ | 15,662,189 |
|
| Health Maintenance Organizations - 0.4% | | | | | |
|
| CIGNA Corp. | | 281,480 | | $ | 34,551,670 |
|
| Insurance - 6.6% | | | | | |
|
| Allstate Corp. | | 3,117,790 | | $ | 170,792,536 |
| Chubb Corp. | | 516,150 | | | 49,421,362 |
| Hartford Financial Services Group, Inc. | | 934,675 | | | 76,998,526 |
| Lincoln National Corp. (l) | | 464,710 | | | 26,381,587 |
| MetLife, Inc. | | 4,118,860 | | | 206,437,263 |
| |
|
| | | | | $ | 530,031,274 |
|
| Leisure & Toys - 0.4% | | | | | |
|
| Hasbro, Inc. (l) | | 1,429,010 | | $ | 28,994,613 |
|
| Machinery & Tools - 3.1% | | | | | |
|
| Deere & Co. (l) | | 2,196,596 | | $ | 167,534,377 |
| Finning International, Inc. | | 277,240 | | | 9,145,433 |
| Illinois Tool Works, Inc. (l) | | 788,010 | | | 67,642,778 |
| |
|
| | | | | $ | 244,322,588 |
|
| Medical Equipment - 0.2% | | | | | |
|
| Baxter International, Inc. | | 386,120 | | $ | 14,614,642 |
|
| Network & Telecom - 0.5% | | | | | |
|
| Cisco Systems, Inc. (n) | | 2,126,630 | | $ | 43,042,991 |
|
| Oil Services - 0.5% | | | | | |
|
| Noble Corp. | | 528,380 | | $ | 39,052,566 |
|
| | | SEMIANNUAL REPORT 7 |
| Portfolio of Investments (unaudited) – continued | | | | | |
| Issuer | | Shares/Par | | | Value ($) |
|
| Stocks - continued | | | | | |
|
| Pharmaceuticals - 6.6% | | | | | |
|
| Abbott Laboratories | | 1,827,860 | | $ | 80,754,855 |
| Eli Lilly & Co. | | 288,690 | | | 16,056,938 |
| Johnson & Johnson | | 3,559,120 | | | 205,183,268 |
| Merck & Co., Inc. | | 3,563,350 | | | 124,218,381 |
| Wyeth | | 2,082,400 | | | 103,703,520 |
| |
|
| | | | | $ | 529,916,962 |
|
| Printing & Publishing - 1.1% | | | | | |
|
| Reed Elsevier PLC | | 5,941,620 | | $ | 53,730,944 |
| Tribune Co. (l) | | 1,108,644 | | | 33,924,506 |
| |
|
| | | | | $ | 87,655,450 |
|
| Railroad & Shipping - 1.7% | | | | | |
|
| Burlington Northern Santa Fe Corp. | | 1,410,310 | | $ | 110,906,778 |
| Norfolk Southern Corp. | | 526,260 | | | 26,933,987 |
| |
|
| | | | | $ | 137,840,765 |
|
| Specialty Chemicals - 1.4% | | | | | |
|
| Air Products & Chemicals, Inc. (l) | | 947,388 | | $ | 60,784,414 |
| Praxair, Inc. | | 895,660 | | | 48,347,727 |
| |
|
| | | | | $ | 109,132,141 |
|
| Specialty Stores - 1.6% | | | | | |
|
| Gap, Inc. (l) | | 4,412,030 | | $ | 81,799,036 |
| Home Depot, Inc. | | 573,110 | | | 24,156,587 |
| Lowe’s Cos., Inc. | | 347,180 | | | 23,670,732 |
| |
|
| | | | | $ | 129,626,355 |
|
| Telecommunications - Wireless - 1.1% | | | | | |
|
| Vodafone Group PLC | | 44,659,490 | | $ | 85,477,661 |
|
| Telephone Services - 4.0% | | | | | |
|
| Sprint Nextel Corp. | | 8,236,090 | | $ | 197,913,243 |
| Verizon Communications, Inc. | | 3,578,770 | | | 120,604,549 |
| |
|
| | | | | $ | 318,517,792 |
|
| Tobacco - 3.2% | | | | | |
|
| Altria Group, Inc. | | 3,564,650 | | $ | 256,298,335 |
|
| Trucking - 0.2% | | | | | |
|
| CNF, Inc. | | 330,230 | | $ | 16,570,941 |
|
| 8 SEMIANNUAL REPORT | | | | | |
| Portfolio of Investments (unaudited) – continued | | | | | | | | |
| Issuer | | | | | | Shares/Par | | | Value ($) | |
|
| Stocks - continued | | | | | | | | | | |
|
| Utilities - Electric Power - 5.6% | | | | | | | | |
|
| Dominion Resources, Inc. | | | | | | 2,740,370 | | $ | 205,801,787 | |
| Entergy Corp. | | | | | | 424,680 | | | 30,793,547 | |
| Exelon Corp. (l) | | | | | | 500,520 | | | 28,584,697 | |
| FPL Group, Inc. (l) | | | | | | 1,432,010 | | | 60,044,179 | |
| PPL Corp. | | | | | | 1,323,280 | | | 42,080,304 | |
| Public Service Enterprise Group, Inc. | | | | 532,430 | | | 36,945,318 | |
| TXU Corp. | | | | | | 801,100 | | | 41,969,629 | |
| | | | | | | | | | | $ | 446,219,461 | |
|
| Total Stocks (Identified Cost, $6,374,678,056) | | | | | | $ | 7,888,583,970 | |
|
| Warrants - 0% | | | | | | | | | | |
|
| | | | | Strike | | | | | | | | |
| | | | | Price | | 1st Exercise | | | | | | |
|
| Syngenta AG (Chemicals) (n) | | | | | | | | | | |
| (Identified Cost, $234,377) | | CHF 234.00 | | 5/23/06 | | 593,680 | | $ | 734,169 | |
|
| Collateral for Securities Loaned - 3.4% | | | | | | | | |
|
| Navigator Securities Lending Prime Portfolio, at Cost and | | | | | | |
| Net Asset Value | | | | | | 273,346,025 | | $ | 273,346,025 | |
|
| Short-Term Obligations - 1.0% (y) | | | | | | | | |
|
| Edison Asset Securitization LLC, 4.58%, due 4/17/06 (t) | | $ | | 908,000 | | $ | 902,571 | |
|
| General Electric Capital Corp., 4.56%, due 3/01/06 | | | | 78,131,000 | | | 78,131,000 | |
|
| Total Short-Term Obligations, at Amortized Cost and Value | | | | $ | 79,033,571 | |
|
| Total Investments (Identified Cost, $6,727,292,029) | | | | | | $ | 8,241,697,735 | |
|
| Other Assets, Less Liabilities - (3.1)% | | | | | | | (250,027,843 | ) |
|
| Net Assets - 100.0% | | | | | | | | $ | 7,991,669,892 | |
|
| (n) | | Non-income producing security. | | | | | | | | | | |
| (l) | | All or a portion of this security is on loan. | | | | | | | | |
| (y) | | The rate shown represents an annualized yield at time of purchase. | | | | | | |
| (t) | | Security exempt from registration with the U.S. Securities and Exchange Commission under Section 4(2) o fthe Securities Act of 1933. | |
| Abbreviations indicate amounts shown in currencies other than the U.S. dollar. All amounts are stated in | |
| U.S. dollars unless otherwise indicated. A list of abbreviations is shown below: | | | | | | |
| CHF | | Swiss Franc | | | | | | | | | | |
| The following abbreviation is used in the Portfolio of Investments and is defined: | | | | |
| ADR American Depository Receipt | | | | | | | | | | |
See Notes to Financial Statements | | | | | | | | |
|
| | | | | | | | | SEMIANNUAL REPORT 9 | |
| FINANCIAL STATEMENTS | Statement of Assets and Liabilities (unaudited) | |
| This statement represents your fund’s balance sheet, which details the assets | |
| and liabilities composing the total value of the fund. | | | |
| At 2/28/06 | | | |
| Assets | | | |
|
| Investments, at value, including $266,664,557 of securities on | | | |
| loan (identified cost, $6,727,292,029) | | $8,241,697,735 | |
| Cash | | 2,138 | |
| Receivable for investments sold | | 16,668,342 | |
| Receivable for fund shares sold | | 20,319,315 | |
| Interest and dividends receivable | | 16,588,585 | |
|
| Total assets | | | $8,295,276,115 |
|
| Liabilities | | | |
|
| Payable for investments purchased | | $9,007,627 | |
| Payable for fund shares reacquired | | 19,516,192 | |
| Collateral for securities loaned, at value | | 273,346,025 | |
| Payable to affiliates | | | |
| Management fee | | 131,861 | |
| Shareholder servicing costs | | 791,368 | |
| Distribution and service fees | | 104,986 | |
| Administrative services fee | | 788 | |
| Program manager fees | | 37 | |
| Retirement plan administration and services fees | | 263 | |
| Payable for independent trustees’ compensation | | 20,987 | |
| Accrued expenses and other liabilities | | 686,089 | |
|
| Total liabilities | | | $303,606,223 |
|
| Net assets | | | $7,991,669,892 |
|
| Net assets consist of: | | | |
|
| Paid-in capital | | $6,354,234,656 | |
| Unrealized appreciation (depreciation) on investments and | | | |
| translation of assets and liabilities in foreign currencies | | 1,514,400,755 | |
| Accumulated net realized gain (loss) on investments and | | | |
| foreign currency transactions | | 116,346,826 | |
| Undistributed net investment income | | 6,687,655 | |
|
| Net assets | | | $7,991,669,892 |
|
| Shares of beneficial interest outstanding | | | 332,858,622 |
|
| 10 SEMIANNUAL REPORT | | | |
| Statement of Assets and Liabilities (unaudited) – continued | | |
| Class A shares | | |
| Net assets | $4,670,756,197 | |
| Shares outstanding | 194,286,127 | |
|
| Net asset value per share | | $24.04 |
|
| Offering price per share (100/94.25 x net asset value per share) | | $25.51 |
|
| Class B shares | | |
|
| Net assets | $1,209,694,228 | |
| Shares outstanding | 50,650,172 | |
|
| Net asset value and offering price per share | | $23.88 |
|
| Class C shares | | |
|
| Net assets | $877,548,638 | |
| Shares outstanding | 36,782,265 | |
|
| Net asset value and offering price per share | | $23.86 |
|
| Class I shares | | |
|
| Net assets | $1,036,999,120 | |
| Shares outstanding | 42,944,344 | |
|
| Net asset value, offering price, and redemption price | | |
| per share | | $24.15 |
|
| Class R shares | | |
|
| Net assets | $114,264,163 | |
| Shares outstanding | 4,763,525 | |
|
| Net asset value, offering price, and redemption price | | |
| per share | | $23.99 |
|
| Class R1 shares | | |
|
| Net assets | $1,955,412 | |
| Shares outstanding | 82,143 | |
|
| Net asset value, offering price, and redemption price | | |
| per share | | $23.81 |
|
| Class R2 shares | | |
|
| Net assets | $940,444 | |
| Shares outstanding | 39,388 | |
|
| Net asset value, offering price, and redemption price | | |
| per share | | $23.88 |
|
| Class R3 shares | | |
|
| Net assets | $15,008,116 | |
| Shares outstanding | 627,203 | |
|
| Net asset value, offering price, and redemption price | | |
| per share | | $23.93 |
|
| | | SEMIANNUAL REPORT 11 |
| Statement of Assets and Liabilities (unaudited) – continued | | | | |
| Class R4 shares | | | | |
|
| Net assets | | $8,485,885 | | |
| Shares outstanding | | 353,063 | | |
|
| Net asset value, offering price, and redemption price | | | | |
| per share | | | | $24.03 |
|
| Class R5 shares | | | | |
|
| Net assets | | $50,632,549 | | |
| Shares outstanding | | 2,104,644 | | |
|
| Net asset value, offering price, and redemption price | | | | |
| per share | | | | $24.06 |
|
| Class 529A shares | | | | |
|
| Net assets | | $3,394,006 | | |
| Shares outstanding | | 141,811 | | |
|
| Net asset value per share | | | | $23.93 |
|
| Offering price per share (100/94.25 x net asset value per share) | | | | $25.39 |
|
| Class 529B shares | | | | |
|
| Net assets | | $808,566 | | |
| Shares outstanding | | 34,074 | | |
|
| Net asset value and offering price per share | | | | $23.73 |
|
| Class 529C shares | | | | |
|
| Net assets | | $1,182,568 | | |
| Shares outstanding | | 49,863 | | |
|
| Net asset value and offering price per share | | | | $23.72 |
|
Shares outstanding are rounded for presentation purposes.
On sales of $50,000 or more, the offering price of Class A and Class 529A shares are reduced. A contingent deferred sales charge may be imposed on redemptions of Class A, Class B, Class C, Class 529B, and Class 529C shares.
See Notes to Financial Statements
12 SEMIANNUAL REPORT
| FINANCIAL STATEMENTS | Statement of Operations (unaudited) | |
| This statement describes how much your fund earned in investment income and accrued in | |
| expenses. It also describes any gains and/or losses generated by fund operations. | |
| Six months ended 2/28/06 | | | |
| Net investment income | | | |
|
| Income | | | |
| Dividends | | $83,935,608 | |
| Interest | | 2,499,760 | |
| Foreign taxes withheld | | (384,112) | |
|
| Total investment income | | | $86,051,256 |
|
| Expenses | | | |
| Management fee | | $23,255,349 | |
| Distribution and service fees | | 18,710,987 | |
| Program manager fees | | 6,174 | |
| Shareholder servicing costs | | 7,247,790 | |
| Administrative services fee | | 182,118 | |
| Retirement plan administration and services fees | | 39,907 | |
| Independent trustees’ compensation | | 49,878 | |
| Custodian fee | | 741,367 | |
| Shareholder communications | | 357,506 | |
| Auditing fees | | 21,680 | |
| Legal fees | | 57,076 | |
| Miscellaneous | | 402,719 | |
|
| Total expenses | | | $51,072,551 |
|
| Fees paid indirectly | | $(204,259) | |
| Reduction of expenses by investment adviser | | (114,559) | |
|
| Net expenses | | | $50,753,733 |
|
| Net investment income | | | $35,297,523 |
|
| Realized and unrealized gain (loss) on investments | | | |
|
| Realized gain (loss) (identified cost basis) | | | |
| Investment transactions | | $197,580,476 | |
| Foreign currency transactions | | (36,197) | |
|
| Net realized gain (loss) on investments and foreign | | | |
| currency transactions | | | $197,544,279 |
|
| Change in unrealized appreciation (depreciation) | | | |
| Investments | | $266,208,514 | |
| Translation of assets and liabilities in foreign currencies | | (2,368) | |
|
| Net unrealized gain (loss) on investments and foreign | | | |
| currency translation | | | $266,206,146 |
|
| Net realized and unrealized gain (loss) on investments and | | | |
| foreign currency | | | $463,750,425 |
|
| Change in net assets from operations | | | $499,047,948 |
|
| See Notes to Financial Statements | | | |
| |
| | | SEMIANNUAL REPORT 13 |
| FINANCIAL STATEMENTS | Statements of Changes in Net Assets | | |
| These statements describe the increases and/or decreases in net assets resulting | | |
| from operations, any distributions, and any shareholder transactions. | | |
| | | | | Six months ended | | Year ended |
| | | | | 2/28/06 | | 8/31/05 |
| | | | | (unaudited) | | |
| Change in net assets | | | | |
|
| From operations | | | | |
|
| Net investment income | | $35,297,523 | | $75,352,542 |
| Net realized gain (loss) on investments and foreign | | | | |
| currency transactions | | 197,544,279 | | 375,822,875 |
| Net unrealized gain (loss) on investments and foreign | | | | |
| currency translation | | 266,206,146 | | 503,440,230 |
|
| Change in net assets from operations | | $499,047,948 | | $954,615,647 |
|
| Distributions declared to shareholders | | | | |
|
| From net investment income | | | | |
| Class A | | $(30,261,047) | | $(46,363,055) |
| Class B | | (4,293,456) | | (7,662,195) |
| Class C | | (3,056,806) | | (5,049,720) |
| Class I | | (7,626,496) | | (10,452,013) |
| Class R | | (580,229) | | (695,925) |
| Class R1 | | (5,311) | | (235) |
| Class R2 | | (3,869) | | (89) |
| Class R3 | | (65,652) | | (25,014) |
| Class R4 | | (12,696) | | (145) |
| Class R5 | | (205,277) | | (180) |
| Class 529A | | (16,641) | | (21,518) |
| Class 529B | | (1,743) | | (2,457) |
| Class 529C | | (2,851) | | (3,600) |
| From net realized gain on investments and foreign | | | | |
| currency transactions | | | | |
| Class A | | (217,446,760) | | — |
| Class B | | (58,304,573) | | — |
| Class C | | (41,125,028) | | — |
| Class I | | (44,433,140) | | — |
| Class R | | (5,057,671) | | — |
| Class R1 | | (65,732) | | — |
| Class R2 | | (32,165) | | — |
| Class R3 | | (644,654) | | — |
| Class R4 | | (108,618) | | — |
| Class R5 | | (2,214,112) | | — |
| Class 529A | | (147,960) | | — |
| Class 529B | | (34,246) | | — |
| Class 529C | | (54,564) | | — |
|
| Total distributions declared to shareholders | | $(415,801,297) | | $(70,276,146) |
|
| 14 SEMIANNUAL REPORT | | | | |
| Statements of Changes in Net Assets – continued | | | | |
| | | Six months ended | | Year ended |
| | | 2/28/06 | | 8/31/05 |
| | | (unaudited) | | |
|
| Change in net assets from fund share transactions | | $228,763,567 | | $662,205,274 |
|
| Redemption fees | | $— | | $15,186 |
|
| Total change in net assets | | $312,010,218 | | $1,546,559,961 |
|
| Net assets | | | | |
|
| At beginning of period | | 7,679,659,674 | | 6,133,099,713 |
| At end of period (including undistributed net investment | | | | |
| income of $6,687,655 and $17,522,206, respectively) | | $7,991,669,892 | | $7,679,659,674 |
|
| See Notes to Financial Statements | | | | |
|
| | | SEMIANNUAL REPORT 15 |
| FINANCIAL STATEMENTS | Financial Highlights | | | | | | |
| The financial highlights table is intended to help you understand the fund’s financial performance for the |
| semiannual period and the past 5 fiscal years (or life of a particular share class, if shorter). Certain information |
| reflects financial results for a single fund share. The total returns in the table represent the rate by which an |
| investor would have earned (or lost) on an investment in the fund share class (assuming reinvestment of all |
| distributions) held for the entire period. | | | | | | | | | | |
| | |
Six months | | | | | | | | | | |
| | | | | ended | | Years ended 8/31 |
| Class A | | | | 2/28/06 | | 2005 | | 2004 | | 2003 | | 2002 | | 2001 |
| | | (unaudited) | | | | | | | | | | |
| Net asset value, | | | | | | | | | | | | | | |
| beginning of period | | | | $23.81 | | $20.88 | | $18.03 | | $17.21 | | $19.28 | | $19.38 |
|
| Income (loss) from | | | | | | | | | | | | | | |
| investment operations | | | | | | | | | | | | | | |
|
| Net investment income (d) | | $0.12 | | $0.28 | | $0.23 | | $0.24 | | $0.20 | | $0.20 |
| Net realized and | | | | | | | | | | | | | | |
| unrealized gain (loss) | | | | | | | | | | | | | | |
| on investments and | | | | | | | | | | | | | | |
| foreign currency | | | | 1.41 | | 2.91 | | 2.84 | | 0.81 | | (2.05) | | 0.44 |
|
| Total from investment | | | | | | | | | | | | | | |
| operations | | | | $1.53 | | $3.19 | | $3.07 | | $1.05 | | $(1.85) | | $0.64 |
|
| Less distributions declared | | | | | | | | | | | | |
| to shareholders | | | | | | | | | | | | | | |
|
| From net investment | | | | | | | | | | | | | | |
| income | | | | $(0.16) | | $(0.26) | | $(0.22) | | $(0.23) | | $(0.15) | | $(0.19) |
| From net realized gain | | | | | | | | | | | | |
| on investments and | | | | | | | | | | | | | | |
| foreign currency | | | | | | | | | | | | | | |
| transactions | | | | (1.14) | | — | | — | | — | | (0.07) | | (0.55) |
|
| Total distributions declared | | | | | | | | | | | | |
| to shareholders | | | | $(1.30) | | $(0.26) | | $(0.22) | | $(0.23) | | $(0.22) | | $(0.74) |
|
| Net asset value, | | | | | | | | | | | | | | |
| end of period | | | | $24.04 | | $23.81 | | $20.88 | | $18.03 | | $17.21 | | $19.28 |
|
| Total return (%) (t)(s)(r) | | | | 6.60 | (n) | 15.36 | | 17.13 | (b) | 6.22 | | (9.64) | | 3.19 |
|
| Ratios (%) (to average net assets) | | | | | | | | | | |
| and Supplemental data: | | | | | | | | | | | | |
|
| Expenses before expense | | | | | | | | | | | | | | |
| reductions (f) | | | | 1.19 | (a) | 1.16 | | 1.18 | | 1.20 | | 1.25 | | 1.21 |
| Expenses after expense | | | | | | | | | | | | | | |
| reductions (f) | | | | 1.19 | (a) | 1.16 | | 1.18 | | 1.20 | | 1.25 | | 1.21 |
| Net investment income | | | | 1.04 | (a) | 1.23 | | 1.14 | | 1.41 | | 1.05 | | 1.00 |
| Portfolio turnover | | | | 11 | | 24 | | 42 | | 55 | | 48 | | 63 |
| Net assets at end of | | | | | | | | | | | | | | |
| period (000 Omitted) | | $4,670,756 | | $4,554,484 | | $3,527,854 | | $3,039,085 | | $1,820,568 | | $981,373 |
|
| See Notes to Financial Statements | | | | | | | | | | |
|
| 16 SEMIANNUAL REPORT | | | | | | | | | | | | |
| Financial Highlights – continued | | | | | | | | | | |
| | | Six months | | | | | | | | | | |
| | | ended | | Years ended 8/31 |
| Class B | | 2/28/06 | | 2005 | | 2004 | | 2003 | | 2002 | | 2001 |
| | | (unaudited) | | | | | | | | | | |
| Net asset value, | | | | | | | | | | | | |
| beginning of period | | $23.66 | | $20.77 | | $17.94 | | $17.13 | | $19.19 | | $19.30 |
|
| Income (loss) from | | | | | | | | | | | | |
| investment operations | | | | | | | | | | | | |
|
| Net investment income (d) | | $0.05 | | $0.13 | | $0.10 | | $0.12 | | $0.07 | | $0.07 |
| Net realized and | | | | | | | | | | | | |
| unrealized gain (loss) | | | | | | | | | | | | |
| on investments and | | | | | | | | | | | | |
| foreign currency | | 1.39 | | 2.90 | | 2.83 | | 0.81 | | (2.02) | | 0.45 |
|
| Total from investment | | | | | | | | | | | | |
| operations | | $1.44 | | $3.03 | | $2.93 | | $0.93 | | $(1.95) | | $0.52 |
|
| Less distributions declared | | | | | | | | | | | | |
| to shareholders | | | | | | | | | | | | |
|
| From net investment | | | | | | | | | | | | |
| income | | $(0.08) | | $(0.14) | | $(0.10) | | $(0.12) | | $(0.04) | | $(0.08) |
| From net realized gain on | | | | | | | | | | | | |
| investments and foreign | | | | | | | | | | | | |
| currency transactions | | (1.14) | | — | | — | | — | | (0.07) | | (0.55) |
|
| Total distributions declared | | | | | | | | | | | | |
| to shareholders | | $(1.22) | | $(0.14) | | $(0.10) | | $(0.12) | | $(0.11) | | $(0.63) |
|
| Net asset value, | | | | | | | | | | | | |
| end of period | | $23.88 | | $23.66 | | $20.77 | | $17.94 | | $17.13 | | $19.19 |
|
| Total return (%) (t)(s)(r) | | 6.26 | (n) | 14.61 | | 16.35 | (b) | 5.50 | | (10.20) | | 2.55 |
|
| Ratios (%) (to average net assets) | | | | | | | | | | |
| and Supplemental data: | | | | | | | | | | | | |
|
| Expenses before expense | | | | | | | | | | | | |
| reductions (f) | | 1.83 | (a) | 1.81 | | 1.82 | | 1.85 | | 1.90 | | 1.86 |
| Expenses after expense | | | | | | | | | | | | |
| reductions (f) | | 1.83 | (a) | 1.81 | | 1.82 | | 1.85 | | 1.90 | | 1.86 |
| Net investment income | | 0.39 | (a) | 0.58 | | 0.49 | | 0.76 | | 0.40 | | 0.35 |
| Portfolio turnover | | 11 | | 24 | | 42 | | 55 | | 48 | | 63 |
| Net assets at end of period | | | | | | | | | | | | |
| (000 Omitted) | | $1,209,694 | | $1,262,029 | | $1,199,074 | | $1,069,389 | | $923,330 | | $698,338 |
|
| See Notes to Financial Statements | | | | | | | | | | |
|
| | | | | | | | | SEMIANNUAL REPORT 17 |
| Financial Highlights – continued | | | | | | | | | | |
| | | Six months | | | | | | | | | | |
| | | ended | | Years ended 8/31 |
| Class C | | 2/28/06 | | 2005 | | 2004 | | 2003 | | 2002 | | 2001 |
| | | (unaudited) | | | | | | | | | | |
| Net asset value, | | | | | | | | | | | | |
| beginning of period | | $23.64 | | $20.75 | | $17.93 | | $17.12 | | $19.18 | | $19.30 |
|
| Income (loss) from | | | | | | | | | | | | |
| investment operations | | | | | | | | | | | | |
|
| Net investment income (d) | | $0.05 | | $0.13 | | $0.10 | | $0.12 | | $0.07 | | $0.07 |
| Net realized and unrealized | | | | | | | | | | | | |
| gain (loss) on investments and | | | | | | | | | | | | |
| foreign currency | | 1.40 | | 2.90 | | 2.82 | | 0.81 | | (2.02) | | 0.44 |
|
| Total from investment operations | | $1.45 | | $3.03 | | $2.92 | | $0.93 | | $(1.95) | | $0.51 |
|
| Less distributions declared | | | | | | | | | | | | |
| to shareholders | | | | | | | | | | | | |
|
| From net investment income | | $(0.09) | | $(0.14) | | $(0.10) | | $(0.12) | | $(0.04) | | $(0.08) |
| From net realized gain on | | | | | | | | | | | | |
| investments and foreign | | | | | | | | | | | | |
| currency transactions | | (1.14) | | — | | — | | — | | (0.07) | | (0.55) |
|
| Total distributions declared | | | | | | | | | | | | |
| to shareholders | | $(1.23) | | $(0.14) | | $(0.10) | | $(0.12) | | $(0.11) | | $(0.63) |
|
| Net asset value, end of period | | $23.86 | | $23.64 | | $20.75 | | $17.93 | | $17.12 | | $19.18 |
|
| Total return (%) (t)(s)(r) | | 6.27 | (n) | 14.63 | | 16.32 | (b) | 5.52 | | (10.21) | | 2.52 |
|
| Ratios (%) (to average net assets) | | | | | | | | | | |
| and Supplemental data: | | | | | | | | | | | | |
|
| Expenses before expense | | | | | | | | | | | | |
| reductions (f) | | 1.84 | (a) | 1.81 | | 1.82 | | 1.85 | | 1.90 | | 1.86 |
| Expenses after expense | | | | | | | | | | | | |
| reductions (f) | | 1.84 | (a) | 1.81 | | 1.82 | | 1.85 | | 1.90 | | 1.86 |
| Net investment income | | 0.39 | (a) | 0.58 | | 0.49 | | 0.76 | | 0.40 | | 0.35 |
| Portfolio turnover | | 11 | | 24 | | 42 | | 55 | | 48 | | 63 |
| Net assets at end of period | | | | | | | | | | | | |
| (000 Omitted) | | $877,549 | | $863,486 | | $761,669 | | $648,318 | | $473,537 | | $366,154 |
|
| See Notes to Financial Statements | | | | | | | | | | |
|
18 SEMIANNUAL REPORT | | | | | | | | | | | | |
| Financial Highlights – continued | | | | | | | | | | | | |
| Six months | | | | | | | | | | |
| | | ended | | Years ended 8/31 |
| Class I | | 2/28/06 | | 2005 | | 2004 | | 2003 | | 2002 | | 2001 |
| (unaudited) | | | | | | | | | | |
| Net asset value, beginning of period | | $23.91 | | $20.95 | | $18.10 | | $17.27 | | $19.35 | | $19.47 |
|
| Income (loss) from | | | | | | | | | | | | |
| investment operations | | | | | | | | | | | | |
|
| Net investment income (d) | | $0.17 | | $0.37 | | $0.30 | | $0.30 | | $0.27 | | $0.28 |
| Net realized and unrealized | | | | | | | | | | | | |
| gain (loss) on investments and | | | | | | | | | | | | |
| foreign currency | | 1.41 | | 2.91 | | 2.84 | | 0.82 | | (2.06) | | 0.44 |
|
| Total from investment operations | | $1.58 | | $3.28 | | $3.14 | | $1.12 | | $(1.79) | | $0.72 |
|
| Less distributions declared | | | | | | | | | | | | |
| to shareholders | | | | | | | | | | | | |
|
| From net investment income | | $(0.20) | | $(0.32) | | $(0.29) | | $(0.29) | | $(0.22) | | $(0.29) |
| From net realized gain on | | | | | | | | | | | | |
| investments and foreign | | | | | | | | | | | | |
| currency transactions | | (1.14) | | — | | — | | — | | (0.07) | | (0.55) |
|
| Total distributions declared | | | | | | | | | | | | |
| to shareholders | | $(1.34) | | $(0.32) | | $(0.29) | | $(0.29) | | $(0.29) | | $(0.84) |
|
| Net asset value, end of period | | $24.15 | | $23.91 | | $20.95 | | $18.10 | | $17.27 | | $19.35 |
|
| Total return (%) (s)(r) | | 6.79 | (n) | 15.78 | | 17.47 | (b) | 6.61 | | (9.35) | | 3.58 |
|
| Ratios (%) (to average net assets) | | | | | | | | | | | | |
| and Supplemental data: | | | | | | | | | | | | |
|
| Expenses before expense reductions (f) | | 0.84 | (a) | 0.81 | | 0.83 | | 0.85 | | 0.90 | | 0.86 |
| Expenses after expense reductions (f) | | 0.84 | (a) | 0.81 | | 0.83 | | 0.85 | | 0.90 | | 0.86 |
| Net investment income | | 1.40 | (a) | 1.59 | | 1.50 | | 1.76 | | 1.40 | | 1.35 |
| Portfolio turnover | | 11 | | 24 | | 42 | | 55 | | 48 | | 63 |
| Net assets at end of period | | | | | | | | | | | | |
| (000 Omitted) | | $1,036,999 | | $899,654 | | $593,364 | | $296,961 | | $76,932 | | $45,849 |
|
| See Notes to Financial Statements | | | | | | | | | | |
|
| | | | | | | | | SEMIANNUAL REPORT 19 |
| Financial Highlights – continued | | | | | | | | | |
| | | Six months | | | | | | | |
| | | ended | | Years ended 8/31 | |
| Class R | | 2/28/06 | | 2005 | | 2004 | | 2003(i) | |
| | | (unaudited) | | | | | | | |
| Net asset value, beginning of period | | $23.76 | | $20.84 | | $18.01 | | $16.53 | |
| |
| Income (loss) from investment operations | | | | | | | | | |
| |
| Net investment income (d) | | $0.11 | | $0.25 | | $0.21 | | $0.15 | |
| Net realized and unrealized gain (loss) on investments | | | | | | | | | |
| and foreign currency | | 1.40 | | 2.90 | | 2.82 | | 1.45 | |
| |
| Total from investment operations | | $1.51 | | $3.15 | | $3.03 | | $1.60 | |
| |
| Less distributions declared to shareholders | | | | | | | | | |
| |
| From net investment income | | $(0.14) | | $(0.23) | | $(0.20) | | $(0.12) | |
| From net realized gain on investments and foreign | | | | | | | | | |
| currency transactions | | (1.14) | | — | | — | | — | |
| |
| Total distributions declared to shareholders | | $(1.28) | | $(0.23) | | $(0.20) | | $(0.12) | |
| |
| Net asset value, end of period | | $23.99 | | $23.76 | | $20.84 | | $18.01 | |
| |
| Total return (%) (s)(r) | | 6.54 | (n) | 15.21 | | 16.92 | (b) | 9.76 | (n) |
| |
| Ratios (%) (to average net assets) | | | | | | | | | |
| and Supplemental data: | | | | | | | | | |
| |
| Expenses before expense reductions (f) | | 1.34 | (a) | 1.31 | | 1.33 | | 1.42 | (a) |
| Expenses after expense reductions (f) | | 1.34 | (a) | 1.31 | | 1.33 | | 1.42 | (a) |
| Net investment income | | 0.93 | (a) | 1.10 | | 1.02 | | 1.26 | (a) |
| Portfolio turnover | | 11 | | 24 | | 42 | | 55 | |
| Net assets at end of period (000 Omitted) | | $114,264 | | $85,302 | | $47,970 | | $14,583 | |
| |
| See Notes to Financial Statements | | | | | | | | | |
| |
20 SEMIANNUAL REPORT | | | | | | | | | |
| Financial Highlights – continued | | | | | |
| | | Six months | | Year | |
| | | ended | | ended | |
| Class R1 | | 2/28/06 | | 8/31/05(i) | |
| | | (unaudited) | | | |
| Net asset value, beginning of period | | $23.63 | | $23.17 | |
| |
| Income (loss) from investment operations | | | | | |
| |
| Net investment income (d) | | $0.04 | | $0.09 | |
| Net realized and unrealized gain (loss) on investments and foreign currency | | 1.39 | | 0.42 | (g) |
| |
| Total from investment operations | | $1.43 | | $0.51 | |
| |
| Less distributions declared to shareholders | | | | | |
| |
| From net investment income | | $(0.11) | | $(0.05) | |
| From net realized gain on investments and foreign currency transactions | | (1.14) | | — | |
| |
| Total distributions declared to shareholders | | $(1.25) | | $(0.05) | |
| |
| Net asset value, end of period | | $23.81 | | $23.63 | |
| |
| Total return (%) (s)(r) | | 6.22 | (n) | 2.21 | (n) |
| |
| Ratios (%) (to average net assets) | | | | | |
| and Supplemental data: | | | | | |
| |
| Expenses before expense reductions (f) | | 2.05 | (a) | 2.04 | (a) |
| Expenses after expense reductions (f) | | 1.96 | (a) | 2.04 | (a) |
| Net investment income | | 0.35 | (a) | 0.89 | (a) |
| Portfolio turnover | | 11 | | 24 | |
| Net assets at end of period (000 Omitted) | | $1,955 | | $574 | |
| |
| | | Six months | | Year | |
| | | ended | | ended | |
| Class R2 | | 2/28/06 | | 8/31/05(i) | |
| | | (unaudited) | | | |
| Net asset value, beginning of period | | $23.67 | | $23.17 | |
| |
| Income (loss) from investment operations | | | | | |
| |
| Net investment income (d) | | $0.07 | | $0.11 | |
| Net realized and unrealized gain (loss) on investments and foreign currency | | 1.41 | | 0.43 | (g) |
| |
| Total from investment operations | | $1.48 | | $0.54 | |
| |
| Less distributions declared to shareholders | | | | | |
| |
| From net investment income | | $(0.13) | | $(0.04) | |
| From net realized gain on investments and foreign currency transactions | | (1.14) | | — | |
| |
| Total distributions declared to shareholders | | $(1.27) | | $(0.04) | |
| |
| Net asset value, end of period | | $23.88 | | $23.67 | |
| |
| Total return (%) (s)(r) | | 6.43 | (n) | 2.34 | (n) |
| |
| Ratios (%) (to average net assets) | | | | | |
| and Supplemental data: | | | | | |
| |
| Expenses before expense reductions (f) | | 1.73 | (a) | 1.73 | (a) |
| Expenses after expense reductions (f) | | 1.61 | (a) | 1.73 | (a) |
| Net investment income | | 0.60 | (a) | 1.49 | (a) |
| Portfolio turnover | | 11 | | 24 | |
| Net assets at end of period (000 Omitted) | | $940 | | $732 | |
| |
| See Notes to Financial Statements | | | | | |
| |
| | | SEMIANNUAL REPORT 21 | |
| Financial Highlights – continued | | | | | | | |
| | | Six months | | | | | |
| | | ended | | Years ended 8/31 | |
| Class R3 | | 2/28/06 | | 2005 | | 2004(i) | |
| | | (unaudited) | | | | | |
| Net asset value, beginning of period | | $23.71 | | $20.84 | | $18.73 | |
| |
| Income (loss) from investment operations | | | | | | | |
| |
| Net investment income (d) | | $0.09 | | $0.21 | | $0.11 | |
| Net realized and unrealized gain (loss) on investments and | | | | | | | |
| foreign currency | | 1.40 | | 2.88 | | 2.12 | |
| |
| Total from investment operations | | $1.49 | | $3.09 | | $2.23 | |
| |
| Less distributions declared to shareholders | | | | | | | |
| |
| From net investment income | | $(0.13) | | $(0.22) | | $(0.12) | |
| From net realized gain on investments and foreign | | | | | | | |
| currency transactions | | (1.14) | | — | | — | |
| |
| Total distributions declared to shareholders | | $(1.27) | | $(0.22) | | $(0.12) | |
| |
| Net asset value, end of period | | $23.93 | | $23.71 | | $20.84 | |
| |
| Total return (%) (s)(r) | | 6.46 | (n) | 14.91 | | 11.93 | (b)(n) |
| |
| Ratios (%) (to average net assets) | | | | | | | |
| and Supplemental data: | | | | | | | |
| |
| Expenses before expense reductions (f) | | 1.59 | (a) | 1.57 | | 1.59 | (a) |
| Expenses after expense reductions (f) | | 1.50 | (a) | 1.57 | | 1.59 | (a) |
| Net investment income | | 0.76 | (a) | 0.93 | | 0.80 | (a) |
| Portfolio turnover | | 11 | | 24 | | 42 | |
| Net assets at end of period (000 Omitted) | | $15,008 | | $8,316 | | $414 | |
| |
| See Notes to Financial Statements | | | | | | | |
| |
22 SEMIANNUAL REPORT | | | | | | | |
| Financial Highlights – continued | | | | | |
| | | Six months | | Year | |
| | | ended | | ended | |
| Class R4 | | 2/28/06 | | 8/31/05(i) | |
| | | (unaudited) | | | |
| Net asset value, beginning of period | | $23.81 | | $23.29 | |
| |
| Income (loss) from investment operations | | | | | |
| |
| Net investment income (d) | | $0.13 | | $0.15 | |
| Net realized and unrealized gain (loss) on investments and foreign currency | | 1.40 | | 0.44(g) | |
| |
| Total from investment operations | | $1.53 | | $0.59 | |
| |
| Less distributions declared to shareholders | | | | | |
| |
| From net investment income | | $(0.17) | | $(0.07) | |
| From net realized gain on investments and foreign currency transactions | | (1.14) | | — | |
| |
| Total distributions declared to shareholders | | $(1.31) | | $(0.07) | |
| |
| Net asset value, end of period | | $24.03 | | $23.81 | |
| |
| Total return (%) (s)(r) | | 6.59(n) | | 2.53(n) | |
| |
| Ratios (%) (to average net assets) | | | | | |
| and Supplemental data: | | | | | |
| |
| Expenses before expense reductions (f) | | 1.24(a) | | 1.23(a) | |
| Expenses after expense reductions (f) | | 1.24(a) | | 1.23(a) | |
| Net investment income | | 1.14(a) | | 1.94(a) | |
| Portfolio turnover | | 11 | | 24 | |
| Net assets at end of period (000 Omitted) | | $8,486 | | $400 | |
| |
| | | Six months | | Year | |
| | | ended | | ended | |
| Class R5 | | 2/28/06 | | 8/31/05(i) | |
| | | (unaudited) | | | |
| Net asset value, beginning of period | | $23.83 | | $23.29 | |
| |
| Income (loss) from investment operations | | | | | |
| |
| Net investment income (d) | | $0.18 | | $0.15 | |
| Net realized and unrealized gain (loss) on investments and foreign currency | | 1.38 | | 0.47 | (g) |
| |
| Total from investment operations | | $1.56 | | $0.62 | |
| |
| Less distributions declared to shareholders | | | | | |
| |
| From net investment income | | $(0.19) | | $(0.08) | |
| From net realized gain on investments and foreign currency transactions | | (1.14) | | — | |
| |
| Total distributions declared to shareholders | | $(1.33) | | $(0.08) | |
| |
| Net asset value, end of period | | $24.06 | | $23.83 | |
| |
| Total return (%) (s)(r) | | 6.73 | (n) | 2.68 | (n) |
| |
| Ratios (%) (to average net assets) | | | | | |
| and Supplemental data: | | | | | |
| |
| Expenses before expense reductions (f) | | 0.95 | (a) | 0.92 | (a) |
| Expenses after expense reductions (f) | | 0.95 | (a) | 0.92 | (a) |
| Net investment income | | 1.52 | (a) | 1.57 | (a) |
| Portfolio turnover | | 11 | | 24 | |
| Net assets at end of period (000 Omitted) | | $50,633 | | $51 | |
| |
| See Notes to Financial Statements | | | | | |
| |
| | | SEMIANNUAL REPORT 23 | |
| Financial Highlights – continued | | | | | | | | | | | |
| Six months | |
| | | ended | | Years ended 8/31 | |
| Class 529A | | 2/28/06 | | 2005 | | 2004 | | 2003 | | 2002(i) | |
| | (unaudited) | | | | | | | | | |
| Net asset value, beginning of period | | $23.71 | | $20.80 | | $18.00 | | $17.21 | | $16.84 | |
| |
| Income (loss) from investment operations | | | | | | | | | | | |
| |
| Net investment income (d) | | $0.09 | | $0.23 | | $0.18 | | $0.20 | | $0.03 | |
| Net realized and unrealized gain (loss) on | | | | | | | | | | | |
| investments and foreign currency | | 1.40 | | 2.90 | | 2.80 | | 0.81 | | 0.34 | |
| |
| Total from investment operations | | $1.49 | | $3.13 | | $2.98 | | $1.01 | | $0.37 | |
| |
| Less distributions declared to shareholders | | | | | | | | | | | |
| |
| From net investment income | | $(0.13) | | $(0.22) | | $(0.18) | | $(0.22) | | $— | |
| From net realized gain on investments and | | | | | | | | | | | |
| foreign currency transactions | | (1.14) | | — | | — | | — | | — | |
| |
| Total distributions declared to shareholders | | $(1.27) | | $(0.22) | | $(0.18) | | $(0.22) | | $— | |
| |
| Net asset value, end of period | | $23.93 | | $23.71 | | $20.80 | | $18.00 | | $17.21 | |
| |
| Total return (%) (t)(s)(r) | | 6.46 | (n) | 15.09 | | 16.63 | (b) | 5.98 | | 2.20 | (n) |
| |
| Ratios (%) (to average net assets) | | | | | | | | | | | |
| and Supplemental data: | | | | | | | | | | | |
| |
| Expenses before expense reductions (f) | | 1.44 | (a) | 1.41 | | 1.43 | | 1.48 | | 1.50 | (a) |
| Expenses after expense reductions (f) | | 1.44 | (a) | 1.41 | | 1.43 | | 1.48 | | 1.50 | (a) |
| Net investment income | | 0.80 | (a) | 0.99 | | 0.91 | | 1.20 | | 2.23 | (a) |
| Portfolio turnover | | 11 | | 24 | | 42 | | 55 | | 48 | |
| Net assets at end of period (000 Omitted) | | $3,394 | | $2,914 | | $1,673 | | $806 | | $10 | |
| |
| See Notes to Financial Statements | | | | | | | | | | | |
| |
24 SEMIANNUAL REPORT | | | | | | | | | | | |
| Financial Highlights – continued | | | | | | | | | | | |
| Six months | | | | | | | | | |
| | | ended | | Years ended 8/31 | |
| Class 529B | | 2/28/06 | | 2005 | | 2004 | | 2003 | | 2002(i) | |
| (unaudited) | |
| Net asset value, beginning of period | | $23.52 | | $20.67 | | $17.87 | | $17.12 | | $16.76 | |
| |
| Income (loss) from investment operations | | | | | | | | | | | |
| |
| Net investment income (d) | | $0.02 | | $0.08 | | $0.05 | | $0.09 | | $0.02 | |
| Net realized and unrealized gain (loss) on | | | | | | | | | | | |
| investments and foreign currency | | 1.39 | | 2.87 | | 2.81 | | 0.80 | | 0.34 | |
| |
| Total from investment operations | | $1.41 | | $2.95 | | $2.86 | | $0.89 | | $0.36 | |
| |
| Less distributions declared to shareholders | | | | | | | | | | | |
| |
| From net investment income | | $(0.06) | | $(0.10) | | $(0.06) | | $(0.14) | | $— | |
| From net realized gain on investments and | | | | | | | | | | | |
| foreign currency transactions | | (1.14) | | — | | — | | — | | — | |
| |
| Total distributions declared to shareholders | | $(1.20) | | $(0.10) | | $(0.06) | | $(0.14) | | $— | |
| |
| Net asset value, end of period | | $23.73 | | $23.52 | | $20.67 | | $17.87 | | $17.12 | |
| |
| Total return (%) (t)(s)(r) | | 6.15 | (n) | 14.32 | | 16.03 | (b) | 5.29 | | 2.15 | (n) |
| |
| Ratios (%) (to average net assets) | | | | | | | | | | | |
| and Supplemental data: | | | | | | | | | | | |
| |
| Expenses before expense reductions (f) | | 2.09 | (a) | 2.06 | | 2.07 | | 2.13 | | 2.15 | (a) |
| Expenses after expense reductions (f) | | 2.09 | (a) | 2.06 | | 2.07 | | 2.13 | | 2.15 | (a) |
| Net investment income | | 0.15 | (a) | 0.34 | | 0.27 | | 0.52 | | 1.33 | (a) |
| Portfolio turnover | | 11 | | 24 | | 42 | | 55 | | 48 | |
| Net assets at end of period (000 Omitted) | | $809 | | $655 | | $439 | | $181 | | $6 | |
| |
| See Notes to Financial Statements | | | | | | | | | | | |
| |
| | | | | | | SEMIANNUAL REPORT 25 | |
| Financial Highlights – continued | | | | | | | | | | | |
| Six months | | | | | | | | | |
| | | ended | | Years ended 8/31 | |
| Class 529C | | 2/28/06 | | 2005 | | 2004 | | 2003 | | 2002(i) | |
| (unaudited) | | | | | | | | | |
| Net asset value, beginning of period | | $23.51 | | $20.66 | | $17.86 | | $17.11 | | $16.75 | |
| |
| Income (loss) from investment operations | | | | | | | | | | | |
| |
| Net investment income (d) | | $0.02 | | $0.08 | | $0.05 | | $0.09 | | $0.02 | |
| Net realized and unrealized gain (loss) on | | | | | | | | | | | |
| investments and foreign currency | | 1.39 | | 2.87 | | 2.81 | | 0.80 | | 0.34 | |
| |
| Total from investment operations | | $1.41 | | $2.95 | | $2.86 | | $0.89 | | $0.36 | |
| |
| Less distributions declared to shareholders | | | | | | | | | | | |
| |
| From net investment income | | $(0.06) | | $(0.10) | | $(0.06) | | $(0.14) | | $— | |
| From net realized gain on investments and | | | | | | | | | | | |
| foreign currency transactions | | (1.14) | | — | | — | | — | | — | |
| |
| Total distributions declared to shareholders | | $(1.20) | | $(0.10) | | $(0.06) | | $(0.14) | | $— | |
| |
| Net asset value, end of period | | $23.72 | | $23.51 | | $20.66 | | $17.86 | | $17.11 | |
| |
| Total return (%) (t)(s)(r) | | 6.15 | (n) | 14.32 | | 16.03 | (b) | 5.31 | | 2.15 | (n) |
| |
| Ratios (%) (to average net assets) | | | | | | | | | | | |
| and Supplemental data: | | | | | | | | | | | |
| |
| Expenses before expense reductions (f) | | 2.09 | (a) | 2.06 | | 2.07 | | 2.13 | | 2.15 | (a) |
| Expenses after expense reductions (f) | | 2.09 | (a) | 2.06 | | 2.07 | | 2.13 | | 2.15 | (a) |
| Net investment income | | 0.15 | (a) | 0.36 | | 0.26 | | 0.55 | | 1.75 | (a) |
| Portfolio turnover | | 11 | | 24 | | 42 | | 55 | | 48 | |
| Net assets at end of period (000 Omitted) | | $1,183 | | $1,062 | | $643 | | $352 | | $21 | |
| |
| Any redemption fees charged by the fund during the 2004 and 2005 fiscal years resulted in a per share |
| impact of less than $0.01. |
| (i) | | For the period from the class’ inception, December 31, 2002 (Class R), July 31, 2002 (Classes 529A, 529B, |
| | | and 529C), October 31, 2003 (Class R3) and April 1, 2005 (Classes R1, R2, R4, and R5) through the |
| | | stated period end. |
(a) | | Annualized. |
| (n) | | Not annualized. |
| (d) | | Per share data are based on average shares outstanding. |
| (f) | | Ratios do not reflect reductions from fees paid indirectly. |
| (t) | | Total returns do not include any applicable sales charges. |
| (r) | | Certain expenses have been reduced without which performance would have been lower. |
| (s) | | From time to time the fund may receive proceeds from litigation settlements, without which performance |
| | | would be lower. |
| (g) | | The per share amount is not in accordance with the net realized and unrealized gain/loss for the period |
| | | because of the timing of sales of fund shares and the amount of per share realized and unrealized gains |
| | | and losses at such time. |
| (b) | | The fund’s net asset value and total return calculation include a non-recurring accrual recorded as a result |
| | | of an administrative proceeding regarding disclosure of brokerage allocation practices in connection with |
| | | fund sales. The non-recurring accrual did not have a material impact on the net asset value per share |
| | | based on the shares outstanding on the day the proceeds were recorded. |
See Notes to Financial Statements |
|
26 SEMIANNUAL REPORT |
NOTES TO FINANCIAL STATEMENTS (unaudited)
(1) Business and Organization
MFS Value Fund (the fund) is a series of MFS Series Trust I (the trust). The trust is organized as a Massachusetts business trust and is registered under the Investment Company Act of 1940, as amended, as an open-end management investment company.
(2) Significant Accounting Policies
General – The preparation of financial statements in conformity with U.S. generally accepted accounting principles requires management to make estimates and assumptions that affect the reported amounts of assets and liabilities, and disclosure of contingent assets and liabilities at the date of the financial statements and the reported amounts of revenues and expenses during the reporting period. Actual results could differ from those estimates. The fund can invest in foreign securities. Investments in foreign securities are vulnerable to the effects of changes in the relative values of the local currency and the U.S. dollar and to the effects of changes in each country’s legal, political, and economic environment.
Investment Valuations – Equity securities, including restricted equity securities, are generally valued at the last sale or official closing price as reported by an independent pricing service on the market or exchange on which they are primarily traded. For securities for which there were no sales during the day, equity securities are generally valued at the last quoted bid price as reported by an independent pricing service on the market or exchange on which they are primarily traded. Short-term instruments with a maturity at issuance of 365 days or less are generally valued at amortized cost, which approximates market value. Open-end investment companies are generally valued at their net asset value per share. Securities and other assets generally valued on the basis of information from an independent pricing service may also be valued on the basis of information from brokers and dealers. The values of foreign securities and other assets and liabilities expressed in foreign currencies are converted to U.S. dollars based upon exchange rates provided by an independent source. When pricing-service information or market quotations are not readily available, securities are priced at fair value as determined under the direction of the Board of Trustees. For example, in valuing securities that trade principally on foreign markets, events reasonably determined to be significant (such as certain movements in the U.S. securities market, or other regional and local developments) may occur between the time that foreign markets close (where the security is principally traded) and the fund’s valuation time that may impact the value of securities traded in these foreign markets. In these cases, the fund may utilize information from an external vendor or other sources to adjust closing market prices of foreign equity securities to reflect what it believes to be the fair value of the securities as of the fund’s valuation time. Fair valuation of foreign equity securities may occur frequently based on an assessment that events which occur on a fairly regular basis (such as U.S. market movements) are significant.
SEMIANNUAL REPORT 27
Notes to Financial Statements (unaudited) – continued
Repurchase Agreements – The fund may enter into repurchase agreements with institutions that the fund’s investment adviser has determined are creditworthy. Each repurchase agreement is recorded at cost. The fund requires that the securities collateral in a repurchase transaction be transferred to the custodian in a manner sufficient to enable the fund to obtain those securities in the event of a default under the repurchase agreement. The fund monitors, on a daily basis, the value of the collateral to ensure that its value, including accrued interest, is greater than amounts owed to the fund under each such repurchase agreement. The fund, along with other affiliated entities of Massachusetts Financial Services Company (MFS), may utilize a joint trading account for the purpose of entering into one or more repurchase agreements.
Foreign Currency Translation – Purchases and sales of foreign investments, income, and expenses are converted into U.S. dollars based upon currency exchange rates prevailing on the respective dates of such transactions. Gains and losses attributable to foreign currency exchange rates on sales of securities are recorded for financial statement purposes as net realized gains and losses on investments. Gains and losses attributable to foreign exchange rate movements on income and expenses are recorded for financial statement purposes as foreign currency transaction gains and losses. That portion of both realized and unrealized gains and losses on investments that results from fluctuations in foreign currency exchange rates is not separately disclosed.
Security Loans – State Street Bank and Trust Company (‘‘State Street’’), as lending agent, may loan the securities of the fund to certain qualified institutions (the ‘‘Borrowers’’) approved by the fund. The loans are collateralized at all times by cash and/or U.S. Treasury securities in an amount at least equal to the market value of the securities loaned. State Street provides the fund with indemnification against Borrower default. The fund bears the risk of loss with respect to the investment of cash collateral. On loans collateralized by cash, the cash collateral is invested in a money market fund or short-term securities. A portion of the income generated upon investment of the collateral is remitted to the Borrowers, and the remainder is allocated between the fund and the lending agent. On loans collateralized by U.S. Treasury securities, a fee is received from the Borrower, and is allocated between the fund and the lending agent. Income from securities lending is included in interest income on the Statement of Operations. The dividend and interest income earned on the securities loaned is accounted for in the same manner as other dividend and interest income.
Short Term Fees – For purchases made on or after July 1, 2004 and before April 1, 2005, the fund charged a 2% redemption fee (which was retained by the fund) on proceeds from Class A, Class B, Class C, and Class I shares redeemed or exchanged within 5 business days following their acquisition (either by purchase or exchange). Effective April 1, 2005, the fund no longer charges a redemption fee. See the fund’s prospectus for details. Any redemption fees charged are accounted for as an addition to paid-in capital.
28 SEMIANNUAL REPORT
Notes to Financial Statements (unaudited) – continued
Investment Transactions and Income – Investment transactions are recorded on the trade date. Interest income is recorded on the accrual basis. All premium and discount is amortized or accreted for financial statement purposes in accordance with U.S. generally accepted accounting principles. All discount is accreted for tax reporting purposes as required by federal income tax regulations. Dividends received in cash are recorded on the ex-dividend date. Certain dividends from foreign securities will be recorded when the fund is informed of the dividend if such information is obtained subsequent to the ex-dividend date. Dividend and interest payments received in additional securities are recorded on the ex-dividend or ex-interest date in an amount equal to the value of the security on such date.
The fund may receive proceeds from litigation settlements involving its portfolio holdings. Any proceeds received are reflected in realized gain/loss in the Statement of Operations, or in unrealized gain/loss if the security is still held by the fund.
Fees Paid Indirectly – The fund’s custody fee is reduced according to an arrangement that measures the value of cash deposited with the custodian by the fund. During the six months ended February 28, 2006, the fund’s custodian fees were reduced by $196,367 under this arrangement. The fund has entered into a commission recapture agreement, under which certain brokers will credit the fund a portion of the commissions generated, to offset certain expenses of the fund. For the six months ended February 28, 2006, the fund’s custodian expenses were reduced by $7,892 under this agreement. These amounts are shown as a reduction of total expenses on the Statement of Operations. Effective January 1, 2006, the commission recapture agreement was terminated.
Tax Matters and Distributions – The fund intends to continue to qualify as a regulated investment company, as defined under Subchapter M of the Internal Revenue Code, and to distribute all of its taxable income, including realized capital gains. Accordingly, no provision for federal income tax is required in the financial statements. Foreign taxes, if any, have been accrued by the fund in the accompanying financial statements.
Distributions to shareholders are recorded on the ex-dividend date. Income and capital gain distributions are determined in accordance with income tax regulations, which may differ from generally accepted accounting principles. Certain capital accounts in the financial statements are periodically adjusted for permanent differences in order to reflect their tax character. These adjustments have no impact on net assets or net asset value per share. Temporary differences which arise from recognizing certain items of income, expense, gain or loss in different periods for financial statement and tax purposes will reverse at some time in the future. Distributions in excess of net investment income or net realized gains are temporary overdistributions for financial statement purposes resulting from differences in the recognition or classification of income for financial statement and tax purposes.
SEMIANNUAL REPORT 29
Notes to Financial Statements (unaudited) – continued
Book/tax differences primarily relate to foreign currency transactions, and treating a portion of the proceeds from redemptions as a distribution for tax purposes.
The tax character of distributions declared to shareholders is as follows:
| | | August 31, 2005 | | August 31, 2004 |
| Ordinary income | | $70,276,146 | | $54,471,492 |
The federal tax cost and the tax basis components of distributable earnings were as follows:
| As of February 28, 2006 | | |
| Cost of investments(1) | | $6,749,571,355 |
|
| Gross appreciation | | $1,702,941,255 |
| Gross depreciation | | (210,814,875) |
|
| Net unrealized appreciation (depreciation) | | $1,492,126,380 |
As of August 31, 2005 | | |
| Undistributed ordinary income | | $17,533,434 |
| Undistributed long-term capital gain | | 310,751,096 |
| Other temporary differences | | (13,811) |
| Net unrealized appreciation (depreciation) | | 1,225,917,866 |
(1) Aggregate cost includes prior fiscal year end tax adjustments.
Multiple Classes of Shares of Beneficial Interest – The fund offers multiple classes of shares, which differ in their respective distribution and service fees. All shareholders bear the common expenses of the fund based on daily net assets of each class, without distinction between share classes. Dividends are declared separately for each class. Differences in per share dividend rates are generally due to differences in separate class expenses. Class B and Class 529B shares will convert to Class A and Class 529A shares, respectively, approximately eight years after purchase.
(3) Transactions with Affiliates
Investment Adviser – The fund has an investment advisory agreement with MFS to provide overall investment advisory and administrative services, and general office facilities.
The management fee is computed daily and paid monthly at an annual rate of 0.60% of the fund’s average daily net assets. The investment adviser has contractually agreed to reduce its management fee to 0.55% of average daily net assets in excess of $7.5 billion. This management fee reduction amounted to $78,357, which is shown as a reduction of total expenses in the Statement of Operations.
The management fee incurred for the six months ended February 28, 2006 was equivalent to an annual effective rate of 0.60% of the fund’s average daily net assets.
Distributor – MFS Fund Distributors, Inc. (MFD), a wholly owned subsidiary of MFS, as distributor, received $163,550 and $2,299 for the six months ended
30 SEMIANNUAL REPORT
Notes to Financial Statements (unaudited) – continued
February 28, 2006, as its portion of the initial sales charge on sales of Class A and Class 529A shares of the fund, respectively.
The Board of Trustees has adopted a distribution plan for certain class shares pursuant to Rule 12b-1 of the Investment Company Act of 1940.
The fund’s distribution plan provides that the fund will pay MFD for services provided by MFD and financial intermediaries in connection with the distribution and servicing of certain share classes. One component of the plan is a distribution fee paid to MFD and another component of the plan is a service fee paid to MFD. MFD may subsequently pay all, or a portion, of the distribution and/or service fees to financial intermediaries.
| Distribution Fee Plan Table: | | | | | | | | |
| | | | | | | | | Total | | Annual | | Distribution |
| | | | | Distribution | | Service | | Distribution | | Effective | | and Service |
| | | | | Fee Rate | | Fee Rate | | Plan(1) | | Rate(2) | | Fee |
| Class A | | 0.10% | | 0.25% | | 0.35% | | 0.35% | | $7,984,389 |
| Class B | | 0.75% | | 0.25% | | 1.00% | | 1.00% | | 6,112,364 |
| Class C | | 0.75% | | 0.25% | | 1.00% | | 1.00% | | 4,304,119 |
| Class R | | 0.25% | | 0.25% | | 0.50% | | 0.50% | | 253,106 |
| Class R1 | | 0.50% | | 0.25% | | 0.75% | | 0.75% | | 4,860 |
| Class R2 | | 0.25% | | 0.25% | | 0.50% | | 0.50% | | 1,892 |
| Class R3 | | 0.25% | | 0.25% | | 0.50% | | 0.50% | | 31,590 |
| Class R4 | | — | | 0.25% | | 0.25% | | 0.25% | | 4,040 |
| Class 529A | | 0.25% | | 0.25% | | 0.50% | | 0.35% | | 5,421 |
| Class 529B | | 0.75% | | 0.25% | | 1.00% | | 1.00% | | 3,579 |
| Class 529C | | 0.75% | | 0.25% | | 1.00% | | 1.00% | | 5,627 |
|
| Total Distribution and Service Fees | | | | | | | | $18,710,987 |
| |
|
| (1) | In accordance with the distribution plan for certain classes, the fund pays distribution and/or service fees up to these annual percentage rates of each class’ average daily net assets. |
| (2) | The annual effective rates represent actual fees incurred under the distribution plan for the six months ended February 28, 2006 based on each class’ average daily net assets. 0.10% of the Class 529A distribution fee is currently being paid by the fund. Payment of the remaining 0.15% of the Class 529A distribution fee is not yet implemented and will commence on such date as the fund’s Board of Trustees may determine. |
| |
Certain Class A, Class C and Class 529C shares are subject to a contingent deferred sales charge in the event of a shareholder redemption within 12 months of purchase. Class B and Class 529B shares are subject to a contingent deferred sales charge in the event of a shareholder redemption within six years of purchase. All contingent deferred sales charges are paid to MFD and during the six months ended February 28, 2006, were as follows:
| | | Amount |
| Class A | | $29,730 |
| Class B | | $1,018,734 |
| Class C | | $35,395 |
| Class 529B | | $19 |
| Class 529C | | $— |
The fund has entered into and may from time to time enter into contracts with program managers and other parties which administer the tuition
SEMIANNUAL REPORT 31
Notes to Financial Statements (unaudited) – continued
programs through which an investment in the fund’s 529 share classes is made. The fund has entered into an agreement with MFD pursuant to which MFD receives an annual fee of up to 0.35% from the fund based solely upon the value of the fund’s 529 share classes attributable to tuition programs to which MFD, or a third party which contracts with MFD, provides administrative services. The current fee has been established at 0.25% annually of average net assets of the fund’s 529 share classes. The fee may only be increased with the approval of the Board of Trustees who oversees the fund. The services provided by MFD, or a third party with which MFD contracts, include recordkeeping and tax reporting and account services, as well as services designed to maintain the program’s compliance with the Internal Revenue Code and other regulatory requirements. Program manager fees for the six months ended February 28, 2006, were as follows:
| | | | | Amount |
| Class 529A | | $3,872 |
| Class 529B | | 895 |
| Class 529C | | 1,407 |
|
| Total Program Manager Fees | | $6,174 |
| | |
Shareholder Servicing Agent – The fund pays a portion of shareholder servicing costs to MFS Service Center, Inc. (MFSC), a wholly-owned subsidiary of MFS. MFSC receives a fee from the fund, for its services as shareholder servicing agent, set periodically under the supervision of the fund’s Board of Trustees. For the six months ended February 28, 2006, the fee was $3,766,449, which equated to 0.0972% annually of the fund’s average daily net assets. MFSC also receives payment from the fund for out-of-pocket and sub-accounting expenses paid by MFSC on behalf of the fund. For the six months ended February 28, 2006, these costs amounted to $2,941,095.
Administrator – MFS provides certain financial, legal, shareholder communications, compliance, and other administrative services to certain funds for which MFS acts as investment adviser. Under an administrative services agreement, the funds may partially reimburse MFS the costs incurred to provide these services, subject to review and approval by the Board of Trustees. Each fund is charged a fixed amount plus a fee based on calendar year average net assets. Effective July 1, 2005, the fund’s annual fixed amount is $10,000.
The administrative services fee incurred for the six months ended February 28, 2006 was equivalent to an annual effective rate of 0.0047% of the fund’s average daily net assets.
In addition to the administrative services provided by MFS to the fund as described above, MFS is responsible for providing certain retirement plan administration and services with respect to certain shares. These services include various administrative, recordkeeping, and communication/educational services with respect to the retirement plans which invest in these shares, and may be provided directly by MFS or by a third party. MFS may subsequently pay all, or a portion, of the retirement plan administration and services
32 SEMIANNUAL REPORT
Notes to Financial Statements (unaudited) – continued
fee to affiliated or unaffiliated third parties. For the six months ended February 28, 2006, the fund paid MFS an annual retirement plan administration and services fee up to the following annual percentage rates of each class’ average daily net assets:
| | | | | | | Annual | | |
| | | | | | | Effective | | Total |
| | | | | Fee Rate | | Rate(1) | | Amount |
| Class R1 | | 0.45% | | 0.36% | | $2,911 |
| Class R2 | | 0.40% | | 0.28% | | 1,510 |
| Class R3 | | 0.25% | | 0.16% | | 15,753 |
| Class R4 | | 0.15% | | 0.15% | | 2,424 |
| Class R5 | | 0.10% | | 0.10% | | 17,309 |
|
| Total Retirement Plan Administration and Services Fees | | | | | | $39,907 |
| |
|
| (1) | Effective October 1, 2005, MFS has contractually agreed to waive a portion of the retirement plan administration and services fee equal to 0.10% for Class R1 shares, 0.15% for Class R2 shares, and 0.10% for Class R3 shares. This agreement will continue until at least September 30, 2007. For the six months ended February 28, 2006, this waiver amounted to $6,576 and is reflected as a reduction of total expenses in the Statement of Operations. |
Trustees’ and Officers’ Compensation – The fund pays compensation to Independent Trustees in the form of a retainer, attendance fees, and additional compensation to Board and Committee chairpersons. The fund does not pay compensation directly to Trustees who are officers of the investment adviser, or to officers of the fund, all of whom receive remuneration for their services to the fund from MFS. Certain officers and Trustees of the fund are officers or directors of MFS, MFD, and MFSC. The fund has an unfunded, defined benefit plan for retired Independent Trustees which resulted in a pension expense of $756. This amount is included in Independent trustees’ compensation for the six months ended February 28, 2006. The deferred liability for retirement benefits payable to retired Trustees amounted to $10,819 at February 28, 2006, and is included in payable for independent trustees’ compensation.
Other – This fund and certain other MFS funds (the funds) have entered into a services agreement (the Agreement) which provides for payment of fees by the funds to Tarantino LLC in return for the provision of services of an Independent Chief Compliance Officer (ICCO) for the funds. The ICCO is an officer of the funds and the sole member of Tarantino LLC. The funds can terminate the Agreement with Tarantino LLC at any time under the terms of the Agreement. For the six months ended February 28, 2006, the fee paid to Tarantino LLC was $31,041. MFS has agreed to reimburse the fund for a portion of the payments made by the funds to Tarantino LLC in the amount of $29,626, which is shown as a reduction of total expenses in the Statement of Operations. Additionally, MFS has agreed to bear all expenses associated with office space, other administrative support, and supplies provided to the ICCO.
SEMIANNUAL REPORT 33
Notes to Financial Statements (unaudited) – continued
(4) Portfolio Securities
Purchases and sales of investments, other than U.S. government securities, purchased option transactions, and short-term obligations, aggregated $858,935,474 and $937,442,674, respectively.
(5) Shares of Beneficial Interest
The fund’s Declaration of Trust permits the Trustees to issue an unlimited number of full and fractional shares of beneficial interest. Transactions in fund shares were as follows:
| | | | | Six months ended 2/28/06 | | Year ended 8/31/05(i) |
| | | | | Shares | | Amount | | Shares | | Amount |
| Shares sold | | | | | | | | |
| Class A | | 27,399,229 | | $650,132,357 | | 67,622,518 | | $1,551,532,325 |
| Class B | | 2,089,664 | | 49,212,105 | | 7,612,220 | | 172,399,903 |
| Class C | | 2,917,925 | | 68,549,403 | | 6,816,382 | | 154,637,648 |
| Class I | | 4,315,311 | | 102,712,578 | | 10,315,188 | | 235,628,710 |
| Class R | | 1,508,927 | | 35,204,703 | | 2,089,842 | | 47,454,343 |
| Class R1 | | 61,672 | | 1,454,971 | | 24,912 | | 587,129 |
| Class R2 | | 12,857 | | 301,905 | | 31,006 | | 733,871 |
| Class R3 | | 499,166 | | 11,777,516 | | 427,084 | | 9,909,445 |
| Class R4 | | 380,683 | | 9,044,816 | | 16,787 | | 398,880 |
| Class R5 | | 2,231,808 | | 52,055,125 | | 2,147 | | 50,000 |
| Class 529A | | 17,318 | | 408,982 | | 59,455 | | 1,361,336 |
| Class 529B | | 4,809 | | 111,725 | | 8,352 | | 188,972 |
| Class 529C | | 4,445 | | 103,965 | | 16,465 | | 377,276 |
|
| | | | | 41,443,814 | | $981,070,151 | | 95,042,358 | | $2,175,259,838 |
| Shares issued to shareholders in | | | | | | |
| reinvestment of distributions | | | | | | | | |
| Class A | | 8,607,977 | | $201,109,077 | | 1,675,437 | | $37,750,899 |
| Class B | | 2,193,892 | | 50,990,371 | | 274,776 | | 6,154,187 |
| Class C | | 1,208,993 | | 28,063,225 | | 143,635 | | 3,216,693 |
| Class I | | 2,123,408 | | 49,811,229 | | 445,520 | | 10,091,634 |
| Class R | | 226,558 | | 5,282,634 | | 28,217 | | 638,219 |
| Class R1 | | 3,070 | | 71,117 | | 10 | | 235 |
| Class R2 | | 1,554 | | 36,034 | | 4 | | 89 |
| Class R3 | | 30,529 | | 710,277 | | 1,089 | | 25,006 |
| Class R4 | | 5,194 | | 121,314 | | 6 | | 145 |
| Class R5 | | 123 | | 2,875 | | 7 | | 180 |
| Class 529A | | 7,072 | | 164,559 | | 951 | | 21,439 |
| Class 529B | | 1,558 | | 35,989 | | 110 | | 2,457 |
| Class 529C | | 2,487 | | 57,415 | | 161 | | 3,597 |
|
| | | | | 14,412,415 | | $336,456,116 | | 2,569,923 | | $57,904,780 |
|
34 SEMIANNUAL REPORT | | | | | | | | |
| Notes to Financial Statements (unaudited) – continued | | | | |
| | | | | Six months ended 2/28/06 | | Year ended 8/31/05(i) |
| | | | | Shares | | Amount | | Shares | | Amount |
| Shares reacquired | | | | | | | | |
| Class A | | (33,023,489) | | $(781,736,164) | | (46,979,425) | | $(1,074,415,928) |
| Class B | | (6,972,849) | | (164,743,329) | | (12,281,886) | | (279,614,054) |
| Class C | | (3,874,143) | | (91,387,729) | | (7,135,699) | | (161,831,639) |
| Class I | | (1,125,789) | | (26,851,068) | | (1,453,062) | | (33,305,489) |
| Class R | | (562,291) | | (13,346,855) | | (829,372) | | (19,020,335) |
| Class R1 | | (6,884) | | (161,320) | | (637) | | (15,038) |
| Class R2 | | (5,948) | | (137,377) | | (85) | | (1,994) |
| Class R3 | | (253,222) | | (5,954,751) | | (97,308) | | (2,238,363) |
| Class R4 | | (49,607) | | (1,173,074) | | — | | — |
| Class R5 | | (129,441) | | (3,085,102) | | — | | — |
| Class 529A | | (5,486) | | (130,081) | | (17,903) | | (414,122) |
| Class 529B | | (154) | | (3,580) | | (1,826) | | (43,149) |
| Class 529C | | (2,223) | | (52,270) | | (2,618) | | (59,233) |
|
| | | | | (46,011,526) | | $(1,088,762,700) | | (68,799,821) | | $(1,570,959,344) |
| Net change | | | | | | | | |
| Class A | | 2,983,717 | | $69,505,270 | | 22,318,530 | | $514,867,296 |
| Class B | | (2,689,293) | | (64,540,853) | | (4,394,890) | | (101,059,964) |
| Class C | | 252,775 | | 5,224,899 | | (175,682) | | (3,977,298) |
| Class I | | 5,312,930 | | 125,672,739 | | 9,307,646 | | 212,414,855 |
| Class R | | 1,173,194 | | 27,140,482 | | 1,288,687 | | 29,072,227 |
| Class R1 | | 57,858 | | 1,364,768 | | 24,285 | | 572,326 |
| Class R2 | | 8,463 | | 200,562 | | 30,925 | | 731,966 |
| Class R3 | | 276,473 | | 6,533,042 | | 330,865 | | 7,696,088 |
| Class R4 | | 336,270 | | 7,993,056 | | 16,793 | | 399,025 |
| Class R5 | | 2,102,490 | | 48,972,898 | | 2,154 | | 50,180 |
| Class 529A | | 18,904 | | 443,460 | | 42,503 | | 968,653 |
| Class 529B | | 6,213 | | 144,134 | | 6,636 | | 148,280 |
| Class 529C | | 4,709 | | 109,110 | | 14,008 | | 321,640 |
|
| | | | | 9,844,703 | | $228,763,567 | | 28,812,460 | | $662,205,274 |
(i) For the period from the class’ inception, April 1, 2005 (Classes R1, R2, R4, and R5) through the stated period end.
The fund is one of several mutual funds in which the MFS funds-of-funds may invest. The MFS funds-of-funds do not invest in the underlying MFS funds for the purpose of exercising management or control. At the end of the period, the MFS Moderate Allocation Fund, MFS Growth Allocation Fund, MFS Conservative Allocation Fund, and MFS Aggressive Growth Allocation Fund were the owners of record of approximately 4%, 4%. 1% and 2% respectively, of the value of outstanding voting shares. In addition, the MFS Lifetime Retirement Income Fund, the MFS Lifetime 2010 Fund, the MFS Lifetime 2020 Fund, the MFS Lifetime 2030 Fund, and the MFS Lifetime 2040
SEMIANNUAL REPORT 35
Notes to Financial Statements (unaudited) – continued
Fund were all the owners of record of less than 1% of the value of outstanding voting shares.
(6) Line of Credit
The fund and other affiliated funds participate in a $1 billion unsecured line of credit provided by a syndication of banks under a credit agreement. Borrowings may be made for temporary financing needs. Interest is charged to each fund, based on its borrowings, at a rate equal to the Federal Reserve funds rate plus 0.35% . In addition, a commitment fee, based on the average daily, unused portion of the line of credit, is allocated among the participating funds at the end of each calendar quarter. The commitment fee allocated to the fund for the six months ended February 28, 2006 was $24,931, and is included in miscellaneous expense on the Statement of Operations. The fund had no significant borrowings during the six months ended February 28, 2006.
36 SEMIANNUAL REPORT
BOARD REVIEW OF INVESTMENT ADVISORY AGREEMENT
A discussion regarding the Board’s most recent review and renewal of the Fund’s investment advisory agreement is available by clicking on the fund’s name under ‘‘Select a fund’’ on the MFS Web site (mfs.com).
PROXY VOTING POLICIES AND INFORMATION
A general description of the MFS funds’ proxy voting policies and procedures is available without charge, upon request, by calling 1-800-225-2606, by visiting the Proxy Voting section of mfs.com or by visiting the SEC’s Web site at http://www.sec.gov.
Information regarding how the fund voted proxies relating to portfolio securities during the most recent twelve-month period ended June 30 is available without charge by visiting the Proxy Voting section of mfs.com or by visiting the SEC’s Web site at http://www.sec.gov.
QUARTERLY PORTFOLIO DISCLOSURE
The trust will file a complete schedule of portfolio holdings with the Securities and Exchange Commission (the Commission) for the first and third quarters of each fiscal year on Form N-Q. The trust’s Form N-Q may be reviewed and copied at the:
Public Reference Room
Securities and Exchange Commission
Washington, D.C. 20549-0102
Information on the operation of the Public Reference Room may be obtained by calling the Commission at 1-800-SEC-0330. The trust’s Form N-Q is available on the EDGAR database on the Commission’s Internet Web site at http://www.sec.gov, and copies of this information may be obtained, upon payment of a duplicating fee, by electronic request at the following e-mail address: publicinfo@sec.gov or by writing the Public Reference Section at the above address.
A shareholder can also obtain the quarterly portfolio holdings report at mfs.com.
SEMIANNUAL REPORT 37
LETTER FROM THE CEO

Dear Shareholders,
It has been said that change is the only constant in life. As investors have seen, that theme is still accurate today as we recently have experienced shifting economic cycles because of natural disasters and political instability around the globe.
Markets worldwide have fluctuated in the past year as devastating hurricanes had a dramatic effect on the international economy, particularly on oil prices. We witnessed political unrest in the Middle East, highlighted by instability in Iraq, and in Africa, the usually stable Nigeria also experienced violence. As a result, energy prices have bounced up and down, with crude oil prices at one point topping a record $70 per barrel.
Such cycles are not uncommon and in fact have almost become the norm in our everyday lives. What does all of this mean to you as an investor? In times like these, it helps to know that you’re working with a seasoned investment professional who has experience to guide you through difficult times. At MFS®, we believe our investment management team has the knowledge and confidence to navigate through difficult cycles and at the same time see through adversity to find investment opportunities for our clients and shareholders.
Our investment management process, honed over 80 years, combines a unique concept of teamwork with our unwavering focus on the long term. We firmly believe that the best way to realize long-term financial goals – be it a college education, a comfortable retirement, or a secure family legacy – is to follow a three-pronged approach that focuses on longer time horizons. Allocate holdings across the major asset classes – including stocks, bonds, and cash. Diversify within each class to take advantage of different market segments and investing styles. Rebalance assets regularly to maintain a desired asset allocation. Of course, these strategies cannot guarantee a profit or protect against a loss. This long-term approach requires diligence and patience, two traits that in our experience are essential to capitalizing on the many opportunities the financial markets can offer – through both up and down economic cycles.
Respectfully,

Robert J. Manning
Chief Executive Officer and Chief Investment Officer
MFS Investment Management®
April 17, 2006
The opinions expressed in this letter are those of MFS, and no forecasts can be guaranteed.
SEMIANNUAL REPORT 1
PORTFOLIO COMPOSITION
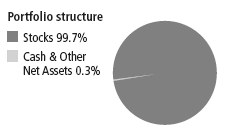
| Top 10 holdings | | |
NICE Systems Ltd., ADR | | 2.8% |
|
| Aspect Medical Systems, Inc. | | 2.5% |
|
| Conceptus, Inc. | | 2.2% |
|
| MicroStrategy, Inc., ‘‘A’’ | | 2.1% |
|
| Advanced Medical Optics, Inc. | | 2.1% |
|
| Medicis Pharmaceutical Corp., ‘‘A’’ | | 2.0% |
|
| Strayer Education, Inc. | | 2.0% |
|
| Activision, Inc. | | 1.9% |
|
| Thoratec Corp. | | 1.9% |
|
| A.C. Moore Arts & Crafts, Inc. | | 1.8% |
|
| Equity market sectors | | |
Health Care | | 29.7% |
|
| Technology | | 20.9% |
|
| Leisure | | 11.9% |
|
| Special Products & Services | | 9.3% |
|
| Retailing | | 8.7% |
|
| Financial Services | | 7.2% |
|
| Industrial Goods & Services | | 5.6% |
|
| Energy | | 2.7% |
|
| Consumer Staples | | 2.3% |
|
| Basic Materials | | 1.0% |
|
| Utilities & Communications | | 0.4% |
|
Percentages are based on net assets as of 2/28/06.
The portfolio is actively managed, and current holdings may be different.
2 SEMIANNUAL REPORT
EXPENSE TABLE
Fund Expenses Borne by the Shareholders During the Period, September 1, 2005 through February 28, 2006.
As a shareholder of the fund, you incur two types of costs: (1) transaction costs, including sales charges (loads) on certain purchase or redemption payments and redemption fees on certain exchanges and redemptions, and (2) ongoing costs, including management fees; distribution and service (12b-1) fees; and other fund expenses. This example is intended to help you understand your ongoing costs (in dollars) of investing in the fund and to compare these costs with the ongoing costs of investing in other mutual funds.
The example is based on an investment of $1,000 invested at the beginning of the period and held for the entire period September 1, 2005 through February 28, 2006.
Actual Expenses
The first line for each share class in the following table provides information about actual account values and actual expenses. You may use the information in this line, together with the amount you invested, to estimate the expenses that you paid over the period. Simply divide your account value by $1,000 (for example, an $8,600 account value divided by $1,000 = 8.6), then multiply the result by the number in the first line under the heading entitled ‘‘Expenses Paid During Period’’ to estimate the expenses you paid on your account during this period.
Hypothetical Example for Comparison Purposes
The second line for each share class in the following table provides information about hypothetical account values and hypothetical expenses based on the fund’s actual expense ratio and an assumed rate of return of 5% per year before expenses, which is not the fund’s actual return. The hypothetical account values and expenses may not be used to estimate the actual ending account balance or expenses you paid for the period. You may use this information to compare the ongoing costs of investing in the fund and other funds. To do so, compare this 5% hypothetical example with the 5% hypothetical examples that appear in the shareholder reports of the other funds.
Please note that the expenses shown in the table are meant to highlight your ongoing costs only and do not reflect any transactional costs, such as sales charges (loads) or redemption fees. Therefore, the second line for each share class in the table is useful in comparing ongoing costs only, and will not help you determine the relative total costs of owning different funds. In addition, if these transactional costs were included, your costs would have been higher.
SEMIANNUAL REPORT 3
Expense Table – continued
| | | | | | Expenses |
| | | Annualized | Beginning | Ending | Paid During |
| | | Expense | Account Value | Account Value | Period(p) |
| Share Class | | Ratio | 9/01/05 | 2/28/06 | 9/01/05-2/28/06 |
|
A
| Actual | 1.50% | $1,000.00 | $1,088.40 | $7.77 |
|
| Hypothetical(h) | 1.50% | $1,000.00 | $1,017.36 | $7.50 |
|
B
| Actual | 2.16% | $1,000.00 | $1,084.60 | $11.16 |
|
| Hypothetical(h) | 2.16% | $1,000.00 | $1,014.08 | $10.79 |
|
C
| Actual | 2.17% | $1,000.00 | $1,084.50 | $11.22 |
|
| Hypothetical(h) | 2.17% | $1,000.00 | $1,014.03 | $10.84 |
|
I
| Actual | 1.18% | $1,000.00 | $1,090.10 | $6.12 |
|
| Hypothetical(h) | 1.18% | $1,000.00 | $1,018.94 | $5.91 |
|
R
| Actual | 1.67% | $1,000.00 | $1,087.60 | $8.64 |
|
| Hypothetical(h) | 1.67% | $1,000.00 | $1,016.51 | $8.35 |
|
R1
| Actual | 2.30% | $1,000.00 | $1,084.10 | $11.89 |
|
| Hypothetical(h) | 2.30% | $1,000.00 | $1,013.39 | $11.48 |
|
R2
| Actual | 1.95% | $1,000.00 | $1,086.50 | $10.09 |
|
| Hypothetical(h) | 1.95% | $1,000.00 | $1,015.12 | $9.74 |
|
R3
| Actual | 1.85% | $1,000.00 | $1,086.70 | $9.57 |
|
| Hypothetical(h) | 1.85% | $1,000.00 | $1,015.62 | $9.25 |
|
R4
| Actual | 1.57% | $1,000.00 | $1,088.50 | $8.13 |
|
| Hypothetical(h) | 1.57% | $1,000.00 | $1,017.01 | $7.85 |
|
R5
| Actual | 1.27% | $1,000.00 | $1,089.60 | $6.58 |
|
| Hypothetical(h) | 1.27% | $1,000.00 | $1,018.50 | $6.36 |
|
529A
| Actual | 1.76% | $1,000.00 | $1,087.30 | $9.11 |
|
| Hypothetical(h) | 1.76% | $1,000.00 | $1,016.07 | $8.80 |
|
529B
| Actual | 2.42% | $1,000.00 | $1,084.00 | $12.50 |
|
| Hypothetical(h) | 2.42% | $1,000.00 | $1,012.79 | $12.08 |
|
529C
| Actual | 2.42% | $1,000.00 | $1,084.00 | $12.50 |
|
| Hypothetical(h) | 2.42% | $1,000.00 | $1,012.79 | $12.08 |
|
| (h) | 5% class return per year before expenses. |
| (p) | Expenses paid is equal to each class’ annualized expense ratio, as shown above, multiplied by the average account value over the period, multiplied by the number of days in the period, divided by the number of days in the year. Expenses paid do not include any applicable sales charges (loads) or redemption fees. If these transaction costs had been included, your costs would have been higher. |
Effective October 1, 2005 the fund’s Class R1, Class R2, and Class R3 retirement plan administration and services fee was reduced (as described in Note 3 of the Notes to the Financial Statements). Had this fee reduction been in effect throughout the entire six month period, the annualized expense ratio would have been 2.28%, 1.93%, and 1.83% for Class R1, Class R2, and Class R3, respectively, and the actual expenses paid during the period would have been approximately $11.78, $9.99, and $9.47 for Class R1, Class R2, and Class R3, respectively.
4 SEMIANNUAL REPORT
| PORTFOLIO OF INVESTMENTS (unaudited) – 2/28/06 | | | | | |
| The Portfolio of Investments is a complete list of all securities owned by your fund. | | | |
| It is categorized by broad-based asset classes. | | | | | |
| Stocks - 99.7% | | | | | |
|
| Issuer | | Shares/Par | | | Value ($) |
|
| Apparel Manufacturers - 0.1% | | | | | |
|
| Maidenform Brands, Inc. (l)(n) | | 52,380 | | $ | 507,038 |
|
| Banks & Credit Companies - 6.4% | | | | | |
|
| BankAtlantic Bancorp, Inc. (l) | | 255,400 | | $ | 3,486,210 |
| BankUnited Financial Corp., ‘‘A’’ (l) | | 258,460 | | | 7,221,372 |
| Commerce Bancorp, Inc. (l) | | 281,060 | | | 9,322,760 |
| Euronet Worldwide, Inc. (l)(n) | | 300,210 | | | 10,525,363 |
| Investors Financial Services Corp. | | 312,430 | | | 14,093,717 |
| MetroCorp Bancshares, Inc. | | 15,560 | | | 386,666 |
| Nelnet, Inc., ‘‘A’’ (l)(n) | | 67,590 | | | 2,801,605 |
| Signature Bank (n) | | 391,960 | | | 12,699,504 |
| |
|
| | | | | $ | 60,537,197 |
|
| Biotechnology - 1.6% | | | | | |
|
| Advanced Life Sciences Holdings (n) | | 278,920 | | $ | 976,220 |
| DUSA Pharmaceuticals, Inc. (l)(n) | | 162,240 | | | 1,176,240 |
| Gen-Probe, Inc. (l)(n) | | 197,430 | | | 9,863,603 |
| Keryx Biopharmaceuticals, Inc. (l)(n) | | 212,300 | | | 3,621,838 |
| |
|
| | | | | $ | 15,637,901 |
|
| Brokerage & Asset Managers - 0.8% | | | | | |
|
| MarketAxess Holdings, Inc. (l)(n) | | 219,280 | | $ | 2,883,532 |
| Thomas Weisel Partners Group LLC (n) | | 229,780 | | | 4,910,399 |
| |
|
| | | | | $ | 7,793,931 |
|
| Business Services - 5.7% | | | | | |
|
| Bright Horizons Family Solutions, Inc. (l)(n) | | 206,023 | | $ | 6,903,831 |
| Corporate Executive Board Co. | | 97,150 | | | 9,715,000 |
| CoStar Group, Inc. (l)(n) | | 175,560 | | | 9,060,652 |
| TALX Corp. | | 223,950 | | | 7,157,442 |
| Ultimate Software Group, Inc. (l)(n) | | 539,440 | | | 12,622,896 |
| Universal Technical Institute, Inc. (l)(n) | | 264,680 | | | 8,154,791 |
| |
|
| | | | | $ | 53,614,612 |
|
| Chemicals - 0.9% | | | | | |
|
| Nalco Holding Co. (l)(n) | | 470,900 | | $ | 8,240,750 |
|
| Computer Software - 9.2% | | | | | |
|
| Blackbaud, Inc. | | 390,730 | | $ | 7,150,359 |
| MicroStrategy, Inc., ‘‘A’’ (n) | | 214,930 | | | 19,704,782 |
| NAVTEQ Corp. (l)(n) | | 164,540 | | | 7,619,847 |
| Open Solutions, Inc. (l)(n) | | 427,280 | | | 11,600,652 |
|
| | | SEMIANNUAL REPORT 5 |
| Portfolio of Investments (unaudited) – continued | | | | | |
| Issuer | | Shares/Par | | | Value ($) |
|
| Stocks - continued | | | | | |
|
| Computer Software - continued | | | | | |
|
| Opsware, Inc. (l)(n) | | 2,182,540 | | $ | 17,176,590 |
| TIBCO Software, Inc. (n) | | 1,909,620 | | | 16,556,405 |
| Witness Systems, Inc. (n) | | 300,900 | | | 7,050,087 |
| |
|
| | | | | $ | 86,858,722 |
|
| Computer Software - Systems - 1.0% | | | | | |
|
| Neoware Systems, Inc. (l)(n) | | 315,473 | | $ | 7,738,553 |
| PAR Technology Corp. (l)(n) | | 89,976 | | | 1,619,568 |
| |
|
| | | | | $ | 9,358,121 |
|
| Consumer Goods & Services - 4.5% | | | | | |
|
| Central Garden & Pet Co. (n) | | 155,505 | | $ | 8,453,252 |
| ITT Educational Services, Inc. (n) | | 222,240 | | | 13,778,880 |
| PlanetOut, Inc. (n) | | 241,110 | | | 2,266,434 |
| Strayer Education, Inc. (l) | | 193,050 | | | 18,596,507 |
| |
|
| | | | | $ | 43,095,073 |
|
| Electrical Equipment - 1.5% | | | | | |
|
| MSC Industrial Direct Co., Inc., ‘‘A’’ (l) | | 299,630 | | $ | 14,193,473 |
|
| Electronics - 5.0% | | | | | |
|
| ARM Holdings PLC | | 6,185,920 | | $ | 14,935,486 |
| Entegris, Inc. (l)(n) | | 964,586 | | | 10,089,570 |
| Kronos, Inc. (n) | | 268,540 | | | 11,012,825 |
| SanDisk Corp. (n) | | 167,900 | | | 10,131,086 |
| Stratasys, Inc. (n) | | 60,500 | | | 1,661,935 |
| |
|
| | | | | $ | 47,830,902 |
|
| Energy - Independent - 1.2% | | | | | |
|
| EXCO Resources, Inc. (n) | | 918,300 | | $ | 11,754,240 |
|
| Engineering - Construction - 2.4% | | | | | |
|
| InfraSource Services, Inc. (l)(n) | | 665,560 | | $ | 11,893,557 |
| Quanta Services, Inc. (l)(n) | | 761,720 | | | 10,427,947 |
| |
|
| | | | | $ | 22,321,504 |
|
| Food & Non-Alcoholic Beverages - 1.4% | | | | | |
|
| Diamond Foods, Inc. | | 352,810 | | $ | 7,267,886 |
| United Natural Foods, Inc. (l)(n) | | 166,310 | | | 5,531,471 |
| |
|
| | | | | $ | 12,799,357 |
|
| Gaming & Lodging - 2.1% | | | | | |
|
| Four Seasons Hotels, Inc. (l) | | 92,500 | | $ | 5,241,050 |
| WMS Industries, Inc. (l)(n) | | 501,600 | | | 14,571,480 |
| |
|
| | | | | $ | 19,812,530 |
|
| 6 SEMIANNUAL REPORT | | | | | |
| Portfolio of Investments (unaudited) – continued | | | | | |
| Issuer | | Shares/Par | | | Value ($) |
|
| Stocks - continued | | | | | |
|
| General Merchandise - 0.4% | | | | | |
|
| 99 Cents Only Stores (l)(n) | | 328,370 | | $ | 3,736,851 |
|
| Internet - 0.9% | | | | | |
|
| Equinix, Inc. (l)(n) | | 170,660 | | $ | 8,949,410 |
|
| Leisure & Toys - 5.1% | | | | | |
|
| Activision, Inc. (n) | | 1,443,650 | | $ | 18,045,625 |
| Take-Two Interactive Software, Inc. (l)(n) | | 498,380 | | | 7,764,760 |
| THQ, Inc. (l)(n) | | 712,534 | | | 17,100,816 |
| Ubisoft Entertainment S.A. (n) | | 128,260 | | | 4,998,423 |
| |
|
| | | | | $ | 47,909,624 |
|
| Machinery & Tools - 1.7% | | | | | |
|
| Cognex Corp. | | 596,870 | | $ | 16,419,894 |
|
| Medical & Health Technology & Services - 2.8% | | | | | |
|
| Allion Healthcare, Inc. (l)(n) | | 351,340 | | $ | 5,814,677 |
| Healthcare Services Group, Inc. (l) | | 466,130 | | | 8,604,760 |
| VCA Antech, Inc. (l)(n) | | 166,540 | | | 4,654,793 |
| WebMD Health Corp. (l)(n) | | 196,600 | | | 7,305,656 |
| |
|
| | | | | $ | 26,379,886 |
|
| Medical Equipment - 21.3% | | | | | |
|
| Advanced Medical Optics, Inc. (l)(n) | | 442,560 | | $ | 19,685,069 |
| Aspect Medical Systems, Inc. (l)(n) | | 871,740 | | | 23,353,915 |
| Atricure, Inc. (n) | | 415,050 | | | 3,029,865 |
| Conceptus, Inc. (l)(n) | | 1,439,450 | | | 20,627,318 |
| Cyberonics, Inc. (l)(n) | | 619,380 | | | 16,828,555 |
| Cytyc Corp. (n) | | 567,255 | | | 16,353,962 |
| Fisher Scientific International, Inc. (l)(n) | | 104,300 | | | 7,109,088 |
| IDEXX Laboratories, Inc. (n) | | 146,915 | | | 11,544,581 |
| Immucor, Inc. (l)(n) | | 231,890 | | | 6,914,960 |
| Merit Medical Systems, Inc. (l)(n) | | 754,770 | | | 10,755,472 |
| Millipore Corp. (n) | | 204,540 | | | 14,180,758 |
| MWI Veterinary Supply, Inc. (l)(n) | | 360,810 | | | 10,950,583 |
| NeuroMetrix, Inc. (l)(n) | | 197,080 | | | 7,079,114 |
| NUCRYST Pharmaceuticals Corp. (n) | | 64,220 | | | 664,677 |
| NxStage Medical, Inc. (n) | | 139,210 | | | 1,968,429 |
| ResMed, Inc. (n) | | 151,040 | | | 6,130,714 |
| Thoratec Corp. (l)(n) | | 892,580 | | | 17,958,710 |
| Ventana Medical Systems, Inc. (l)(n) | | 183,680 | | | 6,662,074 |
| |
|
| | | | | $ | 201,797,844 |
|
| Network & Telecom - 2.8% | | | | | |
|
| NICE Systems Ltd., ADR (n) | | 515,925 | | $ | 26,859,055 |
|
| | | SEMIANNUAL REPORT 7 |
| Portfolio of Investments (unaudited) – continued | | | | | |
| Issuer | | Shares/Par | | | Value ($) |
|
| Stocks - continued | | | | | |
|
| Oil Services - 1.5% | | | | | |
|
| Atwood Oceanics, Inc. (n) | | 53,200 | | $ | 4,797,576 |
| Dresser-Rand Group, Inc. (n) | | 190,700 | | | 4,822,803 |
| Natural Gas Services Group, Inc. (n) | | 253,100 | | | 4,998,725 |
| |
|
| | | | | $ | 14,619,104 |
|
| Personal Computers & Peripherals - 2.0% | | | | | |
|
| M-Systems Flash Disk Pioneers Ltd. (l)(n) | | 354,190 | | $ | 9,563,130 |
| Nuance Communications, Inc. (l)(n) | | 882,059 | | | 9,438,031 |
| |
|
| | | | | $ | 19,001,161 |
|
| Pharmaceuticals - 4.0% | | | | | |
|
| Auxilium Pharmaceuticals, Inc. (l)(n) | | 659,272 | | $ | 4,812,686 |
| Endo Pharmaceuticals Holdings, Inc. (n) | | 346,100 | | | 10,909,072 |
| Medicis Pharmaceutical Corp., ‘‘A’’ | | 677,100 | | | 19,256,724 |
| PRA International (l)(n) | | 126,970 | | | 3,345,660 |
| |
|
| | | | | $ | 38,324,142 |
|
| Printing & Publishing - 0.8% | | | | | |
|
| Morningstar, Inc. (l)(n) | | 129,936 | | $ | 5,539,172 |
| Playboy Enterprises, Inc.,’’B’’ (l)(n) | | 174,000 | | | 2,411,640 |
| |
|
| | | | | $ | 7,950,812 |
|
| Restaurants - 3.9% | | | | | |
|
| Chipotle Mexican Grill, Inc., ‘‘A’’ (l)(n) | | 275,250 | | $ | 12,551,400 |
| P.F. Chang’s China Bistro, Inc. (l)(n) | | 303,550 | | | 14,673,607 |
| Red Robin Gourmet Burgers, Inc. (l)(n) | | 248,480 | | | 9,936,715 |
| |
|
| | | | | $ | 37,161,722 |
|
| Specialty Chemicals - 0.1% | | | | | |
|
| NuCO2, Inc. (n) | | 25,255 | | $ | 756,387 |
|
| Specialty Stores - 8.2% | | | | | |
|
| A.C. Moore Arts & Crafts, Inc. (l)(n) | | 972,210 | | $ | 17,499,780 |
| Aeropostale, Inc. (n) | | 399,090 | | | 11,449,892 |
| CarMax, Inc. (l)(n) | | 179,950 | | | 5,654,029 |
| Celebrate Express, Inc. (n) | | 214,230 | | | 2,553,622 |
| Dick’s Sporting Goods, Inc. (l)(n) | | 155,720 | | | 5,901,788 |
| Hibbett Sporting Goods, Inc. (n) | | 175,890 | | | 5,642,551 |
| Hot Topic, Inc. (l)(n) | | 471,380 | | | 6,212,788 |
| Monro Muffler Brake, Inc. | | 151,180 | | | 5,469,692 |
| Tuesday Morning Corp. (l) | | 342,400 | | | 7,536,224 |
| Urban Outfitters, Inc. (n) | | 346,200 | | | 9,728,220 |
| |
|
| | | | | $ | 77,648,586 |
|
| 8 SEMIANNUAL REPORT | | | | | |
| Portfolio of Investments (unaudited) – continued | | | | | |
| Issuer | | Shares/Par | | | Value ($) |
|
| Stocks - continued | | | | | |
|
| Telephone Services - 0.4% | | | | | |
|
| Terremark Worldwide, Inc. (l)(n) | | 618,440 | | $ | 3,327,207 |
|
| Total Stocks (Identified Cost, $824,549,937) | | | | $ | 945,197,036 |
|
| Short-Term Obligation - 0.9% | | | | | |
|
| General Electric Capital Corp., 4.56%, due 3/01/06, | | | | | |
| at Amortized Cost and Value (y) | | $ 8,753,000 | | $ | 8,753,000 |
|
| Collateral for Securities Loaned - 16.3% | | | | | |
|
| Navigator Securities Lending Prime Portfolio, at Cost and | | | | | |
| Net Asset Value | | 153,978,583 | | $ | 153,978,583 |
|
| Total Investments (Identified Cost, $987,281,520) | | | | $ | 1,107,928,619 |
|
| Other Assets, Less Liabilities - (16.9)% | | | | | (160,061,992) |
|
| Net Assets - 100.0% | | | | $ | 947,866,627 |
|
| (n) | | Non-income producing security. | | | | | |
| (l) | | All or a portion of this security is on loan. | | | | | |
| (y) | | The rate shown represents an annualized yield at time of purchase. | | | | | |
| The following abbreviation is used in the Portfolio of Investments and is defined: | | | |
| ADR American Depository Receipt | | | | | |
See Notes to Financial Statements | | | | | |
|
| | | | | SEMIANNUAL REPORT 9 |
| FINANCIAL STATEMENTS | Statement of Assets and Liabilities (unaudited) | |
| This statement represents your fund’s balance sheet, which details the assets | |
| and liabilities composing the total value of the fund. | | | |
| At 2/28/06 | | | |
| Assets | | | |
|
| Investments, at value, including $150,261,572 of securities on | | | |
| loan (identified cost, $987,281,520) | | $1,107,928,619 | |
| Cash | | 395 | |
| Receivable for investments sold | | 17,008,699 | |
| Receivable for fund shares sold | | 1,031,048 | |
| Interest and dividends receivable | | 95,109 | |
| Other assets | | 274 | |
|
| Total assets | | | $1,126,064,144 |
|
| Liabilities | | | |
|
| Payable for investments purchased | | $19,356,601 | |
| Payable for fund shares reacquired | | 4,452,855 | |
| Collateral for securities loaned, at value | | 153,978,583 | |
| Payable to affiliates | | | |
| Management fee | | 21,110 | |
| Shareholder servicing costs | | 130,490 | |
| Distribution and service fees | | 11,637 | |
| Administrative services fee | | 732 | |
| Program manager fees | | 16 | |
| Retirement plan administration and services fees | | 203 | |
| Payable for independent trustees’ compensation | | 15,797 | |
| Accrued expenses and other liabilities | | 229,493 | |
|
| Total liabilities | | | $178,197,517 |
|
| Net assets | | | $947,866,627 |
|
| Net assets consist of: | | | |
|
| Paid-in capital | | $1,057,468,641 | |
| Unrealized appreciation (depreciation) on investments and | | | |
| translation of assets and liabilities in foreign currencies | | 120,647,406 | |
| Accumulated net realized gain (loss) on investments and | | | |
| foreign currency transactions | | (223,986,234) | |
| Accumulated net investment loss | | (6,263,186) | |
|
| Net assets | | | $947,866,627 |
|
| Shares of beneficial interest outstanding | | | 52,079,226 |
|
| 10 SEMIANNUAL REPORT | | | |
| Statement of Assets and Liabilities (unaudited) – continued | | |
| Class A shares | | |
|
| Net assets | $497,123,910 | |
| Shares outstanding | 27,107,949 | |
|
| Net asset value per share | | $18.34 |
|
| Offering price per share (100/94.25 x net asset value per share) | | $19.46 |
|
| Class B shares | | |
|
| Net assets | $185,973,164 | |
| Shares outstanding | 10,583,957 | |
|
| Net asset value and offering price per share | | $17.57 |
|
| Class C shares | | |
|
| Net assets | $56,905,553 | |
| Shares outstanding | 3,234,430 | |
|
| Net asset value and offering price per share | | $17.59 |
|
| Class I shares | | |
|
| Net assets | $120,844,037 | |
| Shares outstanding | 6,404,877 | |
|
| Net asset value, offering price, and redemption price | | |
| per share | | $18.87 |
|
| Class R shares | | |
|
| Net assets | $15,335,433 | |
| Shares outstanding | 840,031 | |
|
| Net asset value, offering price, and redemption price | | |
| per share | | $18.26 |
|
| Class R1 shares | | |
|
| Net assets | $651,309 | |
| Shares outstanding | 37,129 | |
|
| Net asset value, offering price, and redemption price | | |
| per share | | $17.54 |
|
| Class R2 shares | | |
|
| Net assets | $223,429 | |
| Shares outstanding | 12,704 | |
|
| Net asset value, offering price, and redemption price | | |
| per share | | $17.59 |
|
| Class R3 shares | | |
|
| Net assets | $2,553,714 | |
| Shares outstanding | 140,517 | |
|
| Net asset value, offering price, and redemption price | | |
| per share | | $18.17 |
|
| | |
SEMIANNUAL REPORT 11 |
| Statement of Assets and Liabilities (unaudited) – continued | | |
| Class R4 shares | | |
|
| Net assets | $1,533,047 | |
| Shares outstanding | 83,656 | |
|
| Net asset value, offering price, and redemption price | | |
| per share | | $18.33 |
|
| Class R5 shares | | |
|
| Net assets | $64,466,810 | |
| Shares outstanding | 3,508,574 | |
|
| Net asset value, offering price, and redemption price | | |
| per share | | $18.37 |
|
| Class 529A shares | | |
|
| Net assets | $1,696,984 | |
| Shares outstanding | 93,308 | |
|
| Net asset value per share | | $18.19 |
|
| Offering price per share (100/94.25 x net asset value per share) | | $19.30 |
|
| Class 529B shares | | |
|
| Net assets | $190,300 | |
| Shares outstanding | 10,925 | |
|
| Net asset value and offering price per share | | $17.42 |
|
| Class 529C shares | | |
|
| Net assets | $368,937 | |
| Shares outstanding | 21,169 | |
|
| Net asset value and offering price per share | | $17.43 |
|
| On sales of $50,000 or more, the offering price of Class A and Class 529A shares is reduced. A contingent |
| deferred sales charge may be imposed on redemptions of Class A, Class B, Class C, Class 529B, and |
| Class 529C shares. | | |
See Notes to Financial Statements | | |
|
| 12 SEMIANNUAL REPORT | | |
| FINANCIAL STATEMENTS | Statement of Operations (unaudited) | |
| This statement describes how much your fund earned in investment income and accrued in | |
| expenses. It also describes any gains and/or losses generated by fund operations. | |
| Six months ended 2/28/06 | | | |
| Net investment loss | | | |
|
| Income | | | |
| Dividends | | $1,088,725 | |
| Income on securities loaned | | 169,616 | |
| Interest | | 92,939 | |
| Foreign taxes withheld | | (15,110) | |
|
| Total investment income | | | $1,336,170 |
|
| Expenses | | | |
| Management fee | | $4,200,955 | |
| Distribution and service fees | | 2,218,367 | |
| Program manager fees | | 2,666 | |
| Shareholder servicing costs | | 1,154,926 | |
| Administrative services fee | | 47,421 | |
| Retirement plan administration and services fees | | 15,040 | |
| Independent trustees’ compensation | | 13,734 | |
| Custodian fee | | 131,542 | |
| Shareholder communications | | 81,917 | |
| Auditing fees | | 21,680 | |
| Legal fees | | 9,634 | |
| Miscellaneous | | 218,258 | |
|
| Total expenses | | | $8,116,140 |
|
| Fees paid indirectly | | (58,213) | |
| Reduction of expenses by investment adviser | | (471,307) | |
|
| Net expenses | | | $7,586,620 |
|
| Net investment loss | | | $(6,250,450) |
|
| Realized and unrealized gain (loss) on investments | | | |
|
| Realized gain (loss) (identified cost basis) | | | |
| Investment transactions | | $46,853,037 | |
| Foreign currency transactions | | (29,266) | |
|
| Net realized gain (loss) on investments and foreign | | | |
| currency transactions | | | $46,823,771 |
|
| Change in unrealized appreciation (depreciation) | | | |
| Investments | | $37,100,708 | |
| Translation of assets and liabilities in foreign currencies | | 133 | |
|
| Net unrealized gain (loss) on investments and foreign | | | |
| currency translation | | | $37,100,841 |
|
| Net realized and unrealized gain (loss) on investments and | | | |
| foreign currency | | | $83,924,612 |
|
| Change in net assets from operations | | | $77,674,162 |
|
| See Notes to Financial Statements | | | |
| |
| | | SEMIANNUAL REPORT 13 |
| FINANCIAL STATEMENTS | Statements of Changes in Net Assets | | |
| These statements describe the increases and/or decreases in net assets resulting | | |
| from operations, any distributions, and any shareholder transactions. | | |
| | | Six months ended | | Year ended |
| | | 2/28/06 | | 8/31/05 |
| | | (unaudited) | | |
| Change in net assets | | | | |
|
| From operations | | | | |
|
| Net investment loss | | $(6,250,450) | | $(13,154,686) |
| Net realized gain (loss) on investments and foreign | | | | |
| currency transactions | | 46,823,771 | | 148,915,854 |
| Net unrealized gain (loss) on investments and foreign | | | | |
| currency translation | | 37,100,841 | | 113,723,737 |
|
| Change in net assets from operations | | $77,674,162 | | $249,484,905 |
|
| Change in net assets from fund share transactions | | $(124,608,593) | | $(489,681,518) |
|
| Redemption fees | | $10,176 | | $12,723 |
|
| Total change in net assets | | $(46,924,255) | | $(240,183,890) |
|
| Net assets | | | | |
|
| At beginning of period | | 994,790,882 | | 1,234,974,772 |
| At end of period (including accumulated net investment loss | | | | |
| of $6,263,186 and $12,736, respectively) | | $947,866,627 | | $994,790,882 |
|
| See Notes to Financial Statements | | | | |
|
14 SEMIANNUAL REPORT | | | | |
| FINANCIAL STATEMENTS | Financial Highlights | | | | | | |
| The financial highlights table is intended to help you understand the fund’s financial performance for the |
| semiannual period and the past 5 fiscal years (or life of a particular share class, if shorter). Certain information |
| reflects financial results for a single fund share. The total returns in the table represent the rate by which an |
| investor would have earned (or lost) on an investment in the fund share class (assuming reinvestment of all |
| distributions) held for the entire period. | | | | | | | | | | |
| Six months | | | | | | | | | | |
| | | ended | | Years ended 8/31 |
| Class A | | 2/28/06 | | 2005 | | 2004 | | 2003 | | 2002 | | 2001 |
| (unaudited) | | | | | | | | | | |
| Net asset value, | | | | | | | | | | | | |
| beginning of period | | $16.85 | | $13.53 | | $14.57 | | $11.99 | | $16.17 | | $25.00 |
|
| Income (loss) from | | | | | | | | | | | | |
| investment operations | | | | | | | | | | | | |
|
| Net investment loss (d) | | $(0.10) | | $(0.16) | | $(0.18) | | $(0.13) | | $(0.18) | | $(0.20) |
| Net realized and | | | | | | | | | | | | |
| unrealized | | | | | | | | | | | | |
| gain (loss) on | | | | | | | | | | | | |
| investments and | | | | | | | | | | | | |
| foreign currency | | 1.59 | | 3.48 | | (0.86) | | 2.71 | | (4.00) | | (5.02) |
|
| Total from investment | | | | | | | | | | | | |
| operations | | $1.49 | | $3.32 | | $(1.04) | | $2.58 | | $(4.18) | | $(5.22) |
|
| Less distributions declared | | | | | | | | | | |
| to shareholders | | | | | | | | | | | | |
|
| From net realized gain | | | | | | | | | | | | |
| on investments and | | | | | | | | | | | | |
| foreign currency | | | | | | | | | | | | |
| transactions | | $— | | $— | | $— | | $— | | $(0.00) | (w) | $(3.53) |
| From paid-in capital | | — | | — | | — | | — | | — | | (0.08) |
|
| Total distributions | | | | | | | | | | | | |
| declared to | | | | | | | | | | | | |
| shareholders | | $— | | $— | | $— | | $— | | $(0.00) | (w) | $(3.61) |
|
| Redemption fees added to | | | | | | | | | | | | |
| paid-in capital (d) | | $0.00 | (w) | $0.00 | (w) | $0.00 | (w) | $— | | $— | | $— |
|
| Net asset value, end of | | | | | | | | | | | | |
| period | | $18.34 | | $16.85 | | $13.53 | | $14.57 | | $11.99 | | $16.17 |
|
| Total return (%) (t)(s)(r) | | 8.84 | (n) | 24.54 | | (7.14) | (b) | 21.52 | | (25.85) | | (22.37) |
|
| Ratios (%) (to average net assets) | | | | | | | | | | |
| and Supplemental data: | | | | | | | | | | | | |
|
| Expenses before expense | | | | | | | | | | | | |
| reductions (f) | | 1.60 | (a) | 1.57 | | 1.51 | | 1.58 | | 1.58 | | 1.52 |
| Expenses after expense | | | | | | | | | | | | |
| reductions (f) | | 1.50 | (a) | 1.47 | | 1.51 | | 1.58 | | 1.58 | | 1.52 |
| Net investment loss | | (1.20) | (a) | (1.05) | | (1.20) | | (1.11) | | (1.21) | | (1.06) |
| Portfolio turnover | | 51 | | 112 | | 122 | | 104 | | 102 | | 49 |
| Net assets at end of | | | | | | | | | | | | |
| period (000 Omitted) | | $497,124 | | $603,396 | | $824,708 | | $1,004,473 | | $822,193 | | $1,050,554 |
|
| See Notes to Financial Statements | | | | | | | | |
|
| | | | | | | | | | | SEMIANNUAL REPORT 15 |
| Financial Highlights – continued | | | | | | | | | | |
| | | Six months | | | | | | | | | | |
| | | ended | | Years ended 8/31 |
| Class B | | 2/28/06 | | 2005 | | 2004 | | 2003 | | 2002 | | 2001 |
| | | (unaudited) | | | | | | | | | | |
| Net asset value, beginning of | | | | | | | | | | | | |
| period | | $16.20 | | $13.09 | | $14.19 | | $11.75 | | $15.95 | | $24.71 |
|
| Income (loss) from | | | | | | | | | | | | |
| investment operations | | | | | | | | | | | | |
|
| Net investment loss (d) | | $(0.15) | | $(0.25) | | $(0.27) | | $(0.21) | | $(0.28) | | $(0.32) |
| Net realized and unrealized | | | | | | | | | | | | |
| gain (loss) on investments | | | | | | | | | | | | |
| and foreign currency | | 1.52 | | 3.36 | | (0.83) | | 2.65 | | (3.92) | | (4.97) |
|
| Total from investment | | | | | | | | | | | | |
| operations | | $1.37 | | $3.11 | | $(1.10) | | $2.44 | | $(4.20) | | $(5.29) |
|
| Less distributions declared | | | | | | | | | | | | |
| to shareholders | | | | | | | | | | | | |
|
| From net realized gain on | | | | | | | | | | | | |
| investments and foreign | | | | | | | | | | | | |
| currency transactions | | $— | | $— | | $— | | $— | | $(0.00) | (w) | $(3.39) |
| From paid-in capital | | — | | — | | — | | — | | — | | (0.08) |
|
| Total distributions declared to | | | | | | | | | | | | |
| shareholders | | $— | | $— | | $— | | $— | | $(0.00) | (w) | $(3.47) |
|
| Redemption fees added to | | | | | | | | | | | | |
| paid-in capital (d) | | $0.00 | (w) | $0.00 | (w) | $0.00 | (w) | $— | | $— | | $— |
|
| Net asset value, end of period | | $17.57 | | $16.20 | | $13.09 | | $14.19 | | $11.75 | | $15.95 |
|
| Total return (%) (t)(s)(r) | | 8.46 | (n) | 23.76 | | (7.75) | (b) | 20.77 | | (26.33) | | (22.92) |
|
| Ratios (%) (to average net assets) | | | | | | | | | | |
| and Supplemental data: | | | | | | | | | | | | |
|
| Expenses before expense | | | | | | | | | | | | |
| reductions (f) | | 2.26 | (a) | 2.22 | | 2.15 | | 2.23 | | 2.23 | | 2.17 |
| Expenses after expense | | | | | | | | | | | | |
| reductions (f) | | 2.16 | (a) | 2.12 | | 2.15 | | 2.23 | | 2.23 | | 2.17 |
| Net investment loss | | (1.87) | (a) | (1.70) | | (1.84) | | (1.76) | | (1.86) | | (1.70) |
| Portfolio turnover | | 51 | | 112 | | 122 | | 104 | | 102 | | 49 |
| Net assets at end of period | | | | | | | | | | | | |
| (000 Omitted) | | $185,973 | | $203,722 | | $231,653 | | $271,580 | | $232,792 | | $352,886 |
|
| See Notes to Financial Statements | | | | | | | | | | |
|
16 SEMIANNUAL REPORT | | | | | | | | | | | | |
| Financial Highlights – continued | | | | | | | | | | |
| | | Six months | | | | | | | | | | |
| | | ended | | Years ended 8/31 |
| Class C | | 2/28/06 | | 2005 | | 2004 | | 2003 | | 2002 | | 2001 |
| | | (unaudited) | | | | | | | | | | |
| Net asset value, beginning of | | | | | | | | | | | | |
| period | | $16.22 | | $13.10 | | $14.21 | | $11.77 | | $15.97 | | $24.73 |
|
| Income (loss) from | | | | | | | | | | | | |
| investment operations | | | | | | | | | | | | |
|
| Net investment loss (d) | | $(0.15) | | $(0.25) | | $(0.27) | | $(0.21) | | $(0.28) | | $(0.32) |
| Net realized and unrealized | | | | | | | | | | | | |
| gain (loss) on investments | | | | | | | | | | | | |
| and foreign currency | | 1.52 | | 3.37 | | (0.84) | | 2.65 | | (3.92) | | (4.97) |
|
| Total from investment | | | | | | | | | | | | |
| operations | | $1.37 | | $3.12 | | $(1.11) | | $2.44 | | $(4.20) | | $(5.29) |
|
| Less distributions declared | | | | | | | | | | | | |
| to shareholders | | | | | | | | | | | | |
|
| From net realized gain on | | | | | | | | | | | | |
| investments and foreign | | | | | | | | | | | | |
| currency transactions | | $— | | $— | | $— | | $— | | $(0.00) | (w) | $(3.39) |
| From paid-in capital | | — | | — | | — | | — | | — | | (0.08) |
|
| Total distributions declared to | | | | | | | | | | | | |
| shareholders | | $— | | $— | | $— | | $— | | $(0.00) | (w) | $(3.47) |
|
| Redemption fees added to | | | | | | | | | | | | |
| paid-in capital (d) | | $0.00 | (w) | $0.00 | (w) | $0.00 | (w) | $— | | $— | | $— |
|
| Net asset value, end of period | | $17.59 | | $16.22 | | $13.10 | | $14.21 | | $11.77 | | $15.97 |
|
| Total return (%) (t)(s)(r) | | 8.45 | (n) | 23.82 | | (7.81) | (b) | 20.73 | | (26.34) | | (22.87) |
|
| Ratios (%) (to average net assets) | | | | | | | | | | |
| and Supplemental data: | | | | | | | | | | | | |
|
| Expenses before expense | | | | | | | | | | | | |
| reductions (f) | | 2.27 | (a) | 2.22 | | 2.15 | | 2.23 | | 2.23 | | 2.17 |
| Expenses after expense | | | | | | | | | | | | |
| reductions (f) | | 2.17 | (a) | 2.12 | | 2.15 | | 2.23 | | 2.23 | | 2.17 |
| Net investment loss | | (1.87) | (a) | (1.70) | | (1.84) | | (1.76) | | (1.86) | | (1.70) |
| Portfolio turnover | | 51 | | 112 | | 122 | | 104 | | 102 | | 49 |
| Net assets at end of period | | | | | | | | | | | | |
| (000 Omitted) | | $56,906 | | $58,454 | | $67,102 | | $84,391 | | $87,271 | | $136,530 |
|
| See Notes to Financial Statements | | | | | | | | | | |
|
| | | | | | | | | | | SEMIANNUAL REPORT 17 |
| Financial Highlights – continued | | | | | | | | | | |
| | | Six months | | | | | | | | | | |
| | | ended | | Years ended 8/31 |
| Class I | | 2/28/06 | | 2005 | | 2004 | | 2003 | | 2002 | | 2001 |
| | | (unaudited) | | | | | | | | | | |
| Net asset value, beginning of | | | | | | | | | | | | |
| period | | $17.31 | | $13.85 | | $14.86 | | $12.19 | | $16.37 | | $25.26 |
|
| Income (loss) from | | | | | | | | | | | | |
| investment operations | | | | | | | | | | | | |
|
| Net investment loss (d) | | $(0.08) | | $(0.11) | | $(0.13) | | $(0.09) | | $(0.13) | | $(0.13) |
| Net realized and unrealized | | | | | | | | | | | | |
| gain (loss) on investments | | | | | | | | | | | | |
| and foreign currency | | 1.64 | | 3.57 | | (0.88) | | 2.76 | | (4.05) | | (5.09) |
|
| Total from investment | | | | | | | | | | | | |
| operations | | $1.56 | | $3.46 | | $(1.01) | | $2.67 | | $(4.18) | | $(5.22) |
|
| Less distributions declared | | | | | | | | | | | | |
| to shareholders | | | | | | | | | | | | |
|
| From net realized gain on | | | | | | | | | | | | |
| investments and foreign | | | | | | | | | | | | |
| currency transactions | | $— | | $— | | $— | | $— | | $(0.00) | (w) | $(3.59) |
| From paid-in capital | | — | | — | | — | | — | | — | | (0.08) |
|
| Total distributions declared to | | | | | | | | | | | | |
| shareholders | | $— | | $— | | $— | | $— | | $(0.00) | (w) | $(3.67) |
|
| Redemption fees added to | | | | | | | | | | | | |
| paid-in capital (d) | | $0.00 | (w) | $0.00 | (w) | $0.00 | (w) | $— | | $— | | $— |
|
| Net asset value, end of period | | $18.87 | | $17.31 | | $13.85 | | $14.86 | | $12.19 | | $16.37 |
|
| Total return (%) (s)(r) | | 9.01 | (n) | 24.98 | | (6.80) | (b) | 21.90 | | (25.58) | | (22.09) |
|
| Ratios (%) (to average net assets) | | | | | | | | | | |
| and Supplemental data: | | | | | | | | | | | | |
|
| Expenses before expense | | | | | | | | | | | | |
| reductions (f) | | 1.28 | (a) | 1.23 | | 1.16 | | 1.23 | | 1.23 | | 1.17 |
| Expenses after expense | | | | | | | | | | | | |
| reductions (f) | | 1.18 | (a) | 1.13 | | 1.16 | | 1.23 | | 1.23 | | 1.17 |
| Net investment loss | | (0.88) | (a) | (0.70) | | (0.84) | | (0.75) | | (0.86) | | (0.71) |
| Portfolio turnover | | 51 | | 112 | | 122 | | 104 | | 102 | | 49 |
| Net assets at end of period | | | | | | | | | | | | |
| (000 Omitted) | | $120,844 | | $107,842 | | $103,031 | | $90,872 | | $47,641 | | $52,121 |
|
| See Notes to Financial Statements | | | | | | | | | | |
|
| 18 SEMIANNUAL REPORT | | | | | | | | | | | | |
| Financial Highlights – continued | | | | | | | | | |
| | | Six months | | | | | | | |
| | | ended | | Years ended 8/31 | |
| Class R | | 2/28/06 | | 2005 | | 2004 | | 2003(i) | |
| | | (unaudited) | | | | | | | |
| Net asset value, beginning of period | | $16.79 | | $13.50 | | $14.57 | | $11.38 | |
| |
| Income (loss) from investment operations | | | | | | | | | |
| |
| Net investment loss (d) | | $(0.12) | | $(0.18) | | $(0.20) | | $(0.11) | |
| Net realized and unrealized gain (loss) on investments | | | | | | | |
| and foreign currency | | 1.59 | | 3.47 | | (0.87) | | 3.30 | |
| |
| Total from investment operations | | $1.47 | | $3.29 | | $(1.07) | | $3.19 | |
| |
| Redemption fees added to paid-in capital (d) | | $0.00 | (w) | $0.00 | (w) | $0.00 | (w) | $— | |
| |
| Net asset value, end of period | | $18.26 | | $16.79 | | $13.50 | | $14.57 | |
| |
| Total return (%) (s)(r) | | 8.76 | (n) | 24.37 | | (7.34) | (b) | 28.03 | (n) |
| |
| Ratios (%) (to average net assets) | | | | | | | | | |
| and Supplemental data: | | | | | | | | | |
| |
| Expenses before expense reductions (f) | | 1.77 | (a) | 1.73 | | 1.66 | | 1.78 | (a) |
| Expenses after expense reductions (f) | | 1.67 | (a) | 1.63 | | 1.66 | | 1.78 | (a) |
| Net investment loss | | (1.37) | (a) | (1.17) | | (1.32) | | (1.26) | (a) |
| Portfolio turnover | | 51 | | 112 | | 122 | | 104 | |
| Net assets at end of period (000 Omitted) | | $15,335 | | $16,926 | | $7,262 | | $1,824 | |
| |
| | | | | Six months | | Year | |
| | | | | | | ended | | ended | |
| Class R1 | | | | 2/28/06 | | 8/31/05(i) | |
| | | | | (unaudited) | | | |
| Net asset value, beginning of period | | | | | | $16.18 | | $14.50 | |
| |
| Income (loss) from investment operations | | | | | | | | | |
| |
| Net investment loss (d) | | | | | | $(0.17) | | $(0.10) | |
| Net realized and unrealized gain (loss) on investments | | | | | | | |
| and foreign currency | | | | | | 1.53 | | 1.78 | |
| |
| Total from investment operations | | | | | | $1.36 | | $1.68 | |
| |
| Redemption fees added to paid-in capital (d) | | | | | | $0.00 | (w) | $0.00 | (w) |
| |
| Net asset value, end of period | | | | | | $17.54 | | $16.18 | |
| |
| Total return (%) (s)(r) | | | | | | 8.41 | (n) | 11.59 | (n) |
| |
| Ratios (%) (to average net assets) | | | | | | | | | |
| and Supplemental data: | | | | | | | | | |
| |
| Expenses before expense reductions (f) | | | | | | 2.49 | (a) | 2.43 | (a) |
| Expenses after expense reductions (f) | | | | | | 2.30 | (a) | 2.33 | (a) |
| Net investment loss | | | | | | (2.01) | (a) | (1.69) | (a) |
| Portfolio turnover | | | | | | 51 | | 112 | |
| Net assets at end of period (000 Omitted) | | | | | | $651 | | $206 | |
| |
| See Notes to Financial Statements | | | | | | | | | |
| |
| | | | | SEMIANNUAL REPORT 19 | |
| Financial Highlights – continued | | | | | |
| | | Six months | | Year | |
| | | ended | | ended | |
| Class R2 | | 2/28/06 | | 8/31/05(i) | |
| | | (unaudited) | | | |
| Net asset value, beginning of period | | $16.19 | | $14.50 | |
| |
| Income (loss) from investment operations | | | | | |
| |
| Net investment loss (d) | | $(0.13) | | $(0.08) | |
| Net realized and unrealized gain (loss) on investments | | | | | |
| and foreign currency | | 1.53 | | 1.77 | |
| |
| Total from investment operations | | $1.40 | | $1.69 | |
| |
| Redemption fees added to paid-in capital (d) | | $0.00 | (w) | $0.00 | (w) |
| |
| Net asset value, end of period | | $17.59 | | $16.19 | |
| |
| Total return (%) (s)(r) | | 8.65 | (n) | 11.66 | (n) |
| |
| Ratios (%) (to average net assets) | | | | | |
| and Supplemental data: | | | | | |
| |
| Expenses before expense reductions (f) | | 2.17 | (a) | 2.12 | (a) |
| Expenses after expense reductions (f) | | 1.95 | (a) | 2.02 | (a) |
| Net investment loss | | (1.66) | (a) | (1.02) | (a) |
| Portfolio turnover | | 51 | | 112 | |
| Net assets at end of period (000 Omitted) | | $223 | | $135 | |
| |
| | | Six months | | | | | |
| | | ended | | Years ended 8/31 | |
| Class R3 | | 2/28/06 | | 2005 | | 2004(i) | |
| | | (unaudited) | | | | | |
| Net asset value, beginning of period | | $16.72 | | $13.47 | | $15.35 | |
| |
| Income (loss) from investment operations | | | | | | | |
| |
| Net investment loss (d) | | $(0.13) | | $(0.22) | | $(0.11) | |
| Net realized and unrealized gain (loss) on investments | | | | | | | |
| and foreign currency | | 1.58 | | 3.47 | | (1.77) | |
| |
| Total from investment operations | | $1.45 | | $3.25 | | $(1.88) | |
| |
| Redemption fees added to paid-in capital (d) | | $0.00 | (w) | $0.00 | (w) | $0.00 | (w) |
| |
| Net asset value, end of period | | $18.17 | | $16.72 | | $13.47 | |
| |
| Total return (%) (s)(r) | | 8.67 | (n) | 24.13 | | (12.25) | (b)(n) |
| |
| Ratios (%) (to average net assets) | | | | | | | |
| and Supplemental data: | | | | | | | |
| |
| Expenses before expense reductions (f) | | 2.04 | (a) | 1.98 | | 1.73 | (a) |
| Expenses after expense reductions (f) | | 1.85 | (a) | 1.88 | | 1.73 | (a) |
| Net investment loss | | (1.56) | (a) | (1.42) | | (1.23) | (a) |
| Portfolio turnover | | 51 | | 112 | | 122 | |
| Net assets at end of period (000 Omitted) | | $2,554 | | $1,573 | | $454 | |
| |
| See Notes to Financial Statements | | | | | | | |
| |
20 SEMIANNUAL REPORT | | | | | | | |
| Financial Highlights – continued | | | | | |
| | | Six months | | Year | |
| | | ended | | ended | |
| Class R4 | | 2/28/06 | | 8/31/05(i) | |
| | | (unaudited) | | | |
| Net asset value, beginning of period | | $16.84 | | $15.04 | |
| |
| Income (loss) from investment operations | | | | | |
| |
| Net investment loss (d) | | $(0.11) | | $(0.04) | |
| Net realized and unrealized gain (loss) on investments | | | | | |
| and foreign currency | | 1.60 | | 1.84 | |
| |
| Total from investment operations | | $1.49 | | $1.80 | |
| |
| Redemption fees added to paid-in capital (d) | | $0.00 | (w) | $0.00 | (w) |
| |
| Net asset value, end of period | | $18.33 | | $16.84 | |
| |
| Total return (%) (s)(r) | | 8.85 | (n) | 11.97 | (n) |
| |
| Ratios (%) (to average net assets) | | | | | |
| and Supplemental data: | | | | | |
| |
| Expenses before expense reductions (f) | | 1.67 | (a) | 1.63 | (a) |
| Expenses after expense reductions (f) | | 1.57 | (a) | 1.53 | (a) |
| Net investment loss | | (1.27) | (a) | (0.66) | (a) |
| Portfolio turnover | | 51 | | 112 | |
| Net assets at end of period (000 Omitted) | | $1,533 | | $334 | |
| |
| | | Six months | | Year | |
| | | ended | | ended | |
| Class R5 | | 2/28/06 | | 8/31/05(i) | |
| | | (unaudited) | | | |
| Net asset value, beginning of period | | $16.86 | | $15.04 | |
| |
| Income (loss) from investment operations | | | | | |
| |
| Net investment loss (d) | | $(0.07) | | $(0.04) | |
| Net realized and unrealized gain (loss) on investments | | | | | |
| and foreign currency | | 1.58 | | 1.86 | |
| |
| Total from investment operations | | $1.51 | | $1.82 | |
| |
| Redemption fees added to paid-in capital (d) | | $0.00 | (w) | $0.00 | (w) |
| |
| Net asset value, end of period | | $18.37 | | $16.86 | |
| |
| Total return (%) (s)(r) | | 8.96 | (n) | 12.10 | (n) |
| |
| Ratios (%) (to average net assets) | | | | | |
| and Supplemental data: | | | | | |
| |
| Expenses before expense reductions (f) | | 1.37 | (a) | 1.32 | (a) |
| Expenses after expense reductions (f) | | 1.27 | (a) | 1.22 | (a) |
| Net investment loss | | (0.96) | (a) | (0.67) | (a) |
| Portfolio turnover | | 51 | | 112 | |
| Net assets at end of period (000 Omitted) | | $64,467 | | $56 | |
| |
| See Notes to Financial Statements | | | | | |
| |
| | | SEMIANNUAL REPORT 21 | |
| Financial Highlights – continued | | | | | | | | | | | |
| | | Six months | | | | | | | | | |
| | | ended | | Years ended 8/31 | |
| Class 529A | | 2/28/06 | | 2005 | | 2004 | | 2003 | | 2002(i) | |
| (unaudited) | | | | | | | | | |
| Net asset value, beginning of period | | $16.73 | | $13.47 | | $14.53 | | $11.99 | | $11.95 | |
| |
| Income (loss) from investment operations | | | | | | | | | |
| |
| Net investment loss (d) | | $(0.12) | | $(0.20) | | $(0.21) | | $(0.16) | | $(0.01) | |
| Net realized and unrealized gain (loss) on | | | | | | | | | | | |
| investments and foreign currency | | 1.58 | | 3.46 | | (0.85) | | 2.70 | | 0.05 | |
| |
| Total from investment operations | | $1.46 | | $3.26 | | $(1.06) | | $2.54 | | $0.04 | |
| |
| Redemption fees added to paid-in capital (d) | | $0.00 | (w) | $0.00 | (w) | $0.00 | (w) | $— | | $— | |
| |
| Net asset value, end of period | | $18.19 | | $16.73 | | $13.47 | | $14.53 | | $11.99 | |
| |
| Total return (%) (t)(s)(r) | | 8.73 | (n) | 24.20 | | (7.30) | (b) | 21.18 | | 0.33 | (n) |
| |
| Ratios (%) (to average net assets) | | | | | | | | | | | |
| and Supplemental data: | | | | | | | | | | | |
| |
| Expenses before expense reductions (f) | | 1.86 | (a) | 1.83 | | 1.75 | | 1.84 | | 1.83 | (a) |
| Expenses after expense reductions (f) | | 1.76 | (a) | 1.73 | | 1.75 | | 1.84 | | 1.83 | (a) |
| Net investment loss | | (1.47) | (a) | (1.27) | | (1.43) | | (1.35) | | (1.20) | (a) |
| Portfolio turnover | | 51 | | 112 | | 122 | | 104 | | 102 | |
| Net assets at end of period (000 Omitted) | | $1,697 | | $1,637 | | $390 | | $180 | | $10 | |
| |
| | | Six months | | | | | | | | | |
| | | ended | | Years ended 8/31 | |
| Class 529B | | 2/28/06 | | 2005 | | 2004 | | 2003 | | 2002(i) | |
| (unaudited) | | | | | | | | | |
| Net asset value, beginning of period | | $16.07 | | $13.02 | | $14.15 | | $11.75 | | $11.71 | |
| |
| Income (loss) from investment operations | | | | | | | | | |
| |
| Net investment loss (d) | | $(0.17) | | $(0.28) | | $(0.30) | | $(0.24) | | $(0.02) | |
| Net realized and unrealized gain (loss) on | | | | | | | | | | | |
| investments and foreign currency | | 1.52 | | 3.33 | | (0.83) | | 2.64 | | 0.06 | |
| |
| Total from investment operations | | $1.35 | | $3.05 | | $(1.13) | | $2.40 | | $0.04 | |
| |
| Redemption fees added to paid-in capital (d) | | $0.00 | (w) | $0.00 | (w) | $0.00 | (w) | $— | | $— | |
| |
| Net asset value, end of period | | $17.42 | | $16.07 | | $13.02 | | $14.15 | | $11.75 | |
| |
| Total return (%) (t)(s)(r) | | 8.40 | (n) | 23.43 | | (7.99) | (b) | 20.43 | | 0.34 | (n) |
| |
| Ratios (%) (to average net assets) | | | | | | | | | | | |
| and Supplemental data: | | | | | | | | | | | |
| |
| Expenses before expense reductions (f) | | 2.52 | (a) | 2.47 | | 2.40 | | 2.49 | | 2.48 | (a) |
| Expenses after expense reductions (f) | | 2.42 | (a) | 2.37 | | 2.40 | | 2.49 | | 2.48 | (a) |
| Net investment loss | | (2.12) | (a) | (1.93) | | (2.07) | | (1.99) | | (1.87) | (a) |
| Portfolio turnover | | 51 | | 112 | | 122 | | 104 | | 102 | |
| Net assets at end of period (000 Omitted) | | $190 | | $177 | | $135 | | $84 | | $6 | |
| |
| See Notes to Financial Statements | | | | | | | | | | | |
| |
22 SEMIANNUAL REPORT | | | | | | | | | | | |
| Financial Highlights – continued | | | | | | | | | | | |
| | | | Six months | | | | | | | | | |
| | | | ended | | Years ended 8/31 | |
| Class 529C | | 2/28/06 | | 2005 | | 2004 | | 2003 | | 2002(i) | |
| | (unaudited) | | | | | | | | | |
| Net asset value, beginning of period | | $16.08 | | $13.03 | | $14.16 | | $11.77 | | $11.73 | |
| |
| Income (loss) from investment operations | | | | | | | | | |
| |
| | Net investment loss (d) | | $(0.17) | | $(0.28) | | $(0.31) | | $(0.24) | | $(0.02) | |
| | Net realized and unrealized gain (loss) on | | | | | | | | | | | |
| | investments and foreign currency | | 1.52 | | 3.33 | | (0.82) | | 2.63 | | 0.06 | |
| |
| Total from investment operations | | $1.35 | | $3.05 | | $(1.13) | | $2.39 | | $0.04 | |
| |
| Redemption fees added to paid-in capital (d) | | $0.00 | (w) | $0.00 | (w) | $0.00 | (w) | $— | | $— | |
| |
| Net asset value, end of period | | $17.43 | | $16.08 | | $13.03 | | $14.16 | | $11.77 | |
| |
| Total return (%) (t)(s)(r) | | 8.40 | (n) | 23.41 | | (7.98) | (b) | 20.31 | | 0.34 | (n) |
| |
| Ratios (%) (to average net assets) | | | | | | | | | | | |
| and Supplemental data: | | | | | | | | | | | |
| |
| Expenses before expense reductions (f) | | 2.52 | (a) | 2.47 | | 2.40 | | 2.50 | | 2.48 | (a) |
| Expenses after expense reductions (f) | | 2.42 | (a) | 2.37 | | 2.40 | | 2.50 | | 2.48 | (a) |
| Net investment loss | | (2.12) | (a) | (1.93) | | (2.08) | | (1.99) | | (1.88) | (a) |
| Portfolio turnover | | 51 | | 112 | | 122 | | 104 | | 102 | |
| Net assets at end of period (000 Omitted) | | $369 | | $333 | | $240 | | $147 | | $5 | |
| |
| (i) | For the period from the class’ inception, December 31, 2002 (Class R), July 31, 2002 (Classes 529A, 529B, | |
| | and 529C), October 31, 2003 (Class R3) and April 1, 2005 (Classes R1, R2, R4, and R5) through the | |
| | stated period end. | | | | | | | | | | | |
| (r) | Certain expenses have been reduced without which performance would have been lower. | | | |
| (a) | Annualized. | | | | | | | | | | | |
| (n) | Not annualized. | | | | | | | | | | | |
| (w) | Per share amount was less than $0.01. | | | | | | | | | | | |
| (d) | Per share data are based on average shares outstanding. | | | | | | | | | |
| (f) | Ratios do not reflect reductions from fees paid indirectly. | | | | | | | | | |
| (b) | The fund’s net asset value and total return calculation include a non-recurring accrual recorded as a result | |
| | of an administrative proceeding regarding disclosure of brokerage allocation practices in connection with | |
| | fund sales. The non-recurring accrual did not have a material impact on the net asset value per share | |
| | based on the shares outstanding on the day the proceeds were recorded. | | | | | | | |
| (t) | Total returns do not include any applicable sales charges. | | | | | | | | | |
| (s) | From time to time the fund may receive proceeds from litigation settlements, without which performance | |
| | would be lower. | | | | | | | | | | | |
See Notes to Financial Statements | | | | | | | | | | | |
| |
| | | | | | | | SEMIANNUAL REPORT 23 | |
NOTES TO FINANCIAL STATEMENTS (unaudited)
(1) Business and Organization
MFS New Discovery Fund (the fund) is a series of MFS Series Trust I (the trust). The trust is organized as a Massachusetts business trust and is registered under the Investment Company Act of 1940, as amended, as an open-end management investment company.
(2) Significant Accounting Policies
General – The preparation of financial statements in conformity with U.S. generally accepted accounting principles requires management to make estimates and assumptions that affect the reported amounts of assets and liabilities, and disclosure of contingent assets and liabilities at the date of the financial statements and the reported amounts of revenues and expenses during the reporting period. Actual results could differ from those estimates.
The fund can invest in foreign securities, including securities of emerging market issuers. Investments in foreign securities are vulnerable to the effects of changes in the relative values of the local currency and the U.S. dollar and to the effects of changes in each country’s legal, political, and economic environment. The markets of emerging markets countries are generally more volatile than the markets of developed countries with more mature economies. All of the risks of investing in foreign securities previously described are heightened when investing in emerging markets countries.
Investment Valuations – Equity securities, including restricted equity securities, are generally valued at the last sale or official closing price as reported by an independent pricing service on the market or exchange on which they are primarily traded. For securities for which there were no sales during the day, equity securities are generally valued at the last quoted bid price as reported by an independent pricing service on the market or exchange on which they are primarily traded. Short-term instruments with a maturity at issuance of 365 days or less are generally valued at amortized cost, which approximates market value. Open-end investment companies are generally valued at their net asset value per share. Securities and other assets generally valued on the basis of information from an independent pricing service may also be valued on the basis of information from brokers and dealers. The values of foreign securities and other assets and liabilities expressed in foreign currencies are converted to U.S. dollars based upon exchange rates provided by an independent source. When pricing-service information or market quotations are not readily available, securities are priced at fair value as determined under the direction of the Board of Trustees. For example, in valuing securities that trade principally on foreign markets, events reasonably determined to be significant (such as certain movements in the U.S. securities market, or other regional and local developments) may occur between the time that foreign markets close (where the security is principally traded) and the fund’s valuation time that may impact the value of securities traded in these foreign markets. In these cases, the fund may utilize information from an external vendor or other sources to adjust closing market prices of foreign equity securities to reflect what it believes to be the fair value of the securities
24 SEMIANNUAL REPORT
Notes to Financial Statements (unaudited) – continued
as of the fund’s valuation time. Fair valuation of foreign equity securities may occur frequently based on an assessment that events which occur on a fairly regular basis (such as U.S. market movements) are significant.
Repurchase Agreements – The fund may enter into repurchase agreements with institutions that the fund’s investment adviser has determined are creditworthy. Each repurchase agreement is recorded at cost. The fund requires that the securities collateral in a repurchase transaction be transferred to the custodian in a manner sufficient to enable the fund to obtain those securities in the event of a default under the repurchase agreement. The fund monitors, on a daily basis, the value of the collateral to ensure that its value, including accrued interest, is greater than amounts owed to the fund under each such repurchase agreement. The fund, along with other affiliated entities of Massachusetts Financial Services Company (MFS), may utilize a joint trading account for the purpose of entering into one or more repurchase agreements.
Foreign Currency Translation – Purchases and sales of foreign investments, income, and expenses are converted into U.S. dollars based upon currency exchange rates prevailing on the respective dates of such transactions. Gains and losses attributable to foreign currency exchange rates on sales of securities are recorded for financial statement purposes as net realized gains and losses on investments. Gains and losses attributable to foreign exchange rate movements on income and expenses are recorded for financial statement purposes as foreign currency transaction gains and losses. That portion of both realized and unrealized gains and losses on investments that results from fluctuations in foreign currency exchange rates is not separately disclosed.
Security Loans – State Street Bank and Trust Company (‘‘State Street’’), as lending agent, may loan the securities of the fund to certain qualified institutions (the ‘‘Borrowers’’) approved by the fund. The loans are collateralized at all times by cash and/or U.S. Treasury securities in an amount at least equal to the market value of the securities loaned. State Street provides the fund with indemnification against Borrower default. The fund bears the risk of loss with respect to the investment of cash collateral. On loans collateralized by cash, the cash collateral is invested in a money market fund or short-term securities. A portion of the income generated upon investment of the collateral is remitted to the Borrowers, and the remainder is allocated between the fund and the lending agent. On loans collateralized by U.S. Treasury securities, a fee is received from the Borrower, and is allocated between the fund and the lending agent. The dividend and interest income earned on the securities loaned is accounted for in the same manner as other dividend and interest income.
Short Term Fees – For purchases made on or after July 1, 2004 and before April 1, 2005, the fund charged a 2% redemption fee on proceeds from Class A, Class B, Class C, and Class I shares redeemed or exchanged within 5 business days following their acquisition. Due to systems limitations associated with the transition from applying a 30 calendar day redemption fee to a
SEMIANNUAL REPORT 25
Notes to Financial Statements (unaudited) – continued
5 business day redemption fee, the fund did not impose redemption fees with respect to purchases made in June 2004 followed by redemptions made in July 2004. Effective April 1, 2005, the fund charges a 1% redemption fee on proceeds from Class A, Class B, Class C, and Class I shares redeemed or exchanged within 30 calendar days following their acquisition. Due to systems limitations associated with the transition from applying a 5 business day redemption fee to a 30 calendar day redemption fee, the fund did not impose redemption fees with respect to purchases made in March 2005 followed by redemptions made in April 2005. The fund may change the redemption fee period in the future, including in connection with Securities and Exchange Commission rule developments. See the fund’s prospectus for details. Any redemption fees are accounted for as an addition to paid-in capital.
Investment Transactions and Income – Investment transactions are recorded on the trade date. Interest income is recorded on the accrual basis. All premium and discount is amortized or accreted for financial statement purposes in accordance with U.S. generally accepted accounting principles. All discount is accreted for tax reporting purposes as required by federal income tax regulations. Dividends received in cash are recorded on the ex-dividend date. Certain dividends from foreign securities will be recorded when the fund is informed of the dividend if such information is obtained subsequent to the ex-dividend date. Dividend and interest payments received in additional securities are recorded on the ex-dividend or ex-interest date in an amount equal to the value of the security on such date.
The fund may receive proceeds from litigation settlements involving its portfolio holdings. Any proceeds received are reflected in realized gain/loss in the Statement of Operations, or in unrealized gain/loss if the security is still held by the fund.
Fees Paid Indirectly – The fund’s custody fee is reduced according to an arrangement that measures the value of cash deposited with the custodian by the fund. During the six months ended February 28, 2006, the fund’s custodian fees were reduced by $29,789 under this arrangement. The fund has entered into a commission recapture agreement, under which certain brokers will credit the fund a portion of the commissions generated, to offset certain expenses of the fund. For the six months ended February 28, 2006, the fund’s custodian expenses were reduced by $28,424 under this agreement. These amounts are shown as a reduction of total expenses on the Statement of Operations. Effective January 1, 2006, the commission recapture agreement was terminated.
Tax Matters and Distributions – The fund intends to continue to qualify as a regulated investment company, as defined under Subchapter M of the Internal Revenue Code, and to distribute all of its taxable income, including realized capital gains. Accordingly, no provision for federal income tax is required in the financial statements. Foreign taxes, if any, have been accrued by the fund in the accompanying financial statements.
26 SEMIANNUAL REPORT
Notes to Financial Statements (unaudited) – continued
Distributions to shareholders are recorded on the ex-dividend date. Income and capital gain distributions are determined in accordance with income tax regulations, which may differ from generally accepted accounting principles. Certain capital accounts in the financial statements are periodically adjusted for permanent differences in order to reflect their tax character. These adjustments have no impact on net assets or net asset value per share. Temporary differences which arise from recognizing certain items of income, expense, gain or loss in different periods for financial statement and tax purposes will reverse at some time in the future. Distributions in excess of net investment income or net realized gains are temporary overdistributions for financial statement purposes resulting from differences in the recognition or classification of income for financial statement and tax purposes.
Book/tax differences primarily relate to net operating losses, foreign currency transactions, and wash sale loss deferrals.
The fund declared no distributions for the years ended August 31, 2005 and August 31, 2004.
The federal tax cost and the tax basis components of distributable earnings were as follows:
| As of February 28, 2006 | | |
| Cost of investments(1) | | $988,394,639 |
|
| Gross appreciation | | $154,141,160 |
| Gross depreciation | | (34,607,180) |
|
| Net unrealized appreciation (depreciation) | | $119,533,980 |
As of August 31, 2005 | | |
| Capital loss carryforwards | | $(269,696,886) |
| Other temporary differences | | (12,562) |
| Net unrealized appreciation (depreciation) | | 82,433,272 |
(1) Aggregate cost includes prior fiscal year end tax adjustments.
As of August 31, 2005, the fund had available capital loss carryforwards to offset future realized gains. Such losses expire as follows:
| August 31, 2011 | | $(269,696,886) |
Multiple Classes of Shares of Beneficial Interest – The fund offers multiple classes of shares, which differ in their respective distribution and service fees. All shareholders bear the common expenses of the fund based on daily net assets of each class, without distinction between share classes. Dividends are declared separately for each class. Differences in per share dividend rates are generally due to differences in separate class expenses. Class B and Class 529B shares will convert to Class A and Class 529A shares, respectively, approximately eight years after purchase.
(3) Transactions with Affiliates
Investment Adviser – The fund has an investment advisory agreement with Massachusetts Financial Services Company (MFS) to provide overall investment advisory and administrative services, and general office facilities.
SEMIANNUAL REPORT 27
Notes to Financial Statements (unaudited) – continued
The management fee is computed daily and paid monthly at an annual rate of 0.90% of the fund’s average daily net assets. The investment adviser has contractually agreed to reduce its management fee to 0.80% for the first $1.5 billion of average daily net assets and 0.75% of average daily net assets in excess of $1.5 billion. This management fee reduction amounted to $466,816, which is shown as a reduction of total expenses in the Statement of Operations. The management fee incurred for the six months ended February 28, 2006 was equivalent to an annual effective rate of 0.80% of the fund’s average daily net assets.
Distributor – MFS Fund Distributors, Inc. (MFD), a wholly owned subsidiary of MFS, as distributor, received $19,941 and $391 for the six months ended February 28, 2006, as its portion of the initial sales charge on sales of Class A and Class 529A shares of the fund, respectively.
The Board of Trustees has adopted a distribution plan for certain class shares pursuant to Rule 12b-1 of the Investment Company Act of 1940.
The fund’s distribution plan provides that the fund will pay MFD for services provided by MFD and financial intermediaries in connection with the distribution and servicing of certain share classes. One component of the plan is a distribution fee paid to MFD and another component of the plan is a service fee paid to MFD. MFD may subsequently pay all, or a portion, of the distribution and/or service fees to financial intermediaries.
| Distribution Fee Plan Table: | | | | | | | | |
| | | | | | | | | Total | | Annual | | Distribution |
| | | | | Distribution | | Service | | Distribution | | Effective | | and Service |
| | | | | Fee Rate | | Fee Rate | | Plan(1) | | Rate(2) | | Fee |
| Class A | | 0.10% | | 0.25% | | 0.35% | | 0.35% | | $934,740 |
| Class B | | 0.75% | | 0.25% | | 1.00% | | 1.00% | | 948,302 |
| Class C | | 0.75% | | 0.25% | | 1.00% | | 1.00% | | 281,003 |
| Class R | | 0.25% | | 0.25% | | 0.50% | | 0.50% | | 40,652 |
| Class R1 | | 0.50% | | 0.25% | | 0.75% | | 0.75% | | 1,810 |
| Class R2 | | 0.25% | | 0.25% | | 0.50% | | 0.50% | | 360 |
| Class R3 | | 0.25% | | 0.25% | | 0.50% | | 0.50% | | 5,040 |
| Class R4 | | — | | 0.25% | | 0.25% | | 0.25% | | 1,039 |
| Class 529A | | 0.25% | | 0.25% | | 0.50% | | 0.35% | | 2,824 |
| Class 529B | | 0.75% | | 0.25% | | 1.00% | | 1.00% | | 897 |
| Class 529C | | 0.75% | | 0.25% | | 1.00% | | 1.00% | | 1,700 |
|
| Total Distribution and Service Fees | | | | | | | | $2,218,367 |
| (1) | In accordance with the distribution plan for certain classes, the fund pays distribution and/or service fees up to these annual percentage rates of each class’ average daily net assets. |
| (2) | The annual effective rates represent actual fees incurred under the distribution plan for the six months ended February 28, 2006 based on each class’ average daily net assets. 0.10% of the Class 529A distribution fee is currently being paid by the fund. Payment of the remaining 0.15% of the Class 529A distribution fee is not yet implemented and will commence on such date as the fund’s Board of Trustees may determine. |
Certain Class A, Class C and Class 529C shares are subject to a contingent deferred sales charge in the event of a shareholder redemption within 12 months of purchase. Class B and Class 529B shares are subject to a contingent deferred sales charge in the event of a shareholder redemption within six
28 SEMIANNUAL REPORT
Notes to Financial Statements (unaudited) – continued
years of purchase. All contingent deferred sales charges are paid to MFD and during the six months ended February 28, 2006, were as follows:
| | | Amount |
| Class A | | $20,939 |
| Class B | | 95,205 |
| Class C | | 3,027 |
| Class 529B | | — |
| Class 529C | | — |
The fund has entered into and may from time to time enter into contracts with program managers and other parties which administer the tuition programs through which an investment in the fund’s 529 share classes is made. The fund has entered into an agreement with MFD pursuant to which MFD receives an annual fee of up to 0.35% from the fund based solely upon the value of the fund’s 529 share classes attributable to tuition programs to which MFD, or a third party which contracts with MFD, provides administrative services. The current fee has been established at 0.25% annually of average net assets of the fund’s 529 share classes. The fee may only be increased with the approval of the Board of Trustees who oversees the fund. The services provided by MFD, or a third party with which MFD contracts, include recordkeeping and tax reporting and account services, as well as services designed to maintain the program’s compliance with the Internal Revenue Code and other regulatory requirements. Program manager fees for the six months ended February 28, 2006, were as follows:
| | | | | Amount |
| Class 529A | | $2,017 |
| Class 529B | | 224 |
| Class 529C | | 425 |
|
| Total Program Manager Fees | | $2,666 |
Shareholder Servicing Agent – The fund pays a portion of shareholder servicing costs to MFS Service Center, Inc. (MFSC), a wholly-owned subsidiary of MFS. MFSC receives a fee from the fund, for its services as shareholder servicing agent, set periodically under the supervision of the fund’s Board of Trustees. For the six months ended February 28, 2006, the fee was $454,414, which equated to 0.0974% annually of the fund’s average daily net assets. MFSC also receives payment from the fund for out-of-pocket and sub-accounting expenses paid by MFSC on behalf of the fund. For the six months ended February 28, 2006, these costs amounted to $461,492.
Administrator – MFS provides certain financial, legal, shareholder communications, compliance, and other administrative services to certain funds for which MFS acts as investment adviser. Under an administrative services agreement, the funds may partially reimburse MFS the costs incurred to provide these services, subject to review and approval by the Board of Trustees. Each fund is charged a fixed amount plus a fee based on calendar year average net assets. Effective July 1, 2005, the fund’s annual fixed amount is $10,000. The administrative services fee incurred for the six months ended
SEMIANNUAL REPORT 29
Notes to Financial Statements (unaudited) – continued
February 28, 2006 was equivalent to an annual effective rate of 0.0102% of the fund’s average daily net assets.
In addition to the administrative services provided by MFS to the fund as described above, MFS is responsible for providing certain retirement plan administration and services with respect to certain shares. These services include various administrative, recordkeeping, and communication/educational services with respect to the retirement plans which invest in these shares, and may be provided directly by MFS or by a third party. MFS may subsequently pay all, or a portion, of the retirement plan administration and services fee to affiliated or unaffiliated third parties. For the six months ended February 28, 2006, the fund paid MFS an annual retirement plan administration and services fee up to the following annual percentage rates of each class’ average daily net assets:
| | | | | | | Annual | | |
| | | | | | | Effective | | Total |
| | | | | Fee Rate | | Rate(1) | | Amount |
| Class R1 | | 0.45% | | 0.36% | | $1,084 |
| Class R2 | | 0.40% | | 0.28% | | 287 |
| Class R3 | | 0.25% | | 0.16% | | 2,513 |
| Class R4 | | 0.15% | | 0.15% | | 624 |
| Class R5 | | 0.10% | | 0.10% | | 10,532 |
|
| Total Retirement Plan Administration and Services Fees | | | | | | $15,040 |
| (1) | Effective October 1, 2005, MFS has contractually agreed to waive a portion of the retirement plan administration and services fee equal to 0.10% for Class R1 shares, 0.15% for Class R2 shares, and 0.10% for Class R3 shares. This agreement will continue until at least September 30, 2007. For the six months ended February 28, 2006, this waiver amounted to $1,184 and is reflected as a reduction of total expenses in the Statement of Operations. |
Trustees’ and Officers’ Compensation – The fund pays compensation to Independent Trustees in the form of a retainer, attendance fees, and additional compensation to Board and Committee chairpersons. The fund does not pay compensation directly to Trustees who are officers of the investment adviser, or to officers of the fund, all of whom receive remuneration for their services to the fund from MFS. Certain officers and Trustees of the fund are officers or directors of MFS, MFD, and MFSC. The fund has an unfunded, defined benefit plan for retired Independent Trustees which resulted in a pension expense of $752. This amount is included in Independent trustees’ compensation for the six months ended February 28, 2006. The deferred liability for retirement benefits payable to retired Trustees amounted to $12,234 at February 28, 2006, and is included in payable for independent trustees’ compensation.
Other – This fund and certain other MFS funds (the funds) have entered into a services agreement (the Agreement) which provides for payment of fees by the funds to Tarantino LLC in return for the provision of services of an Independent Chief Compliance Officer (ICCO) for the funds. The ICCO is an officer of the funds and the sole member of Tarantino LLC. The funds can terminate the Agreement with Tarantino LLC at any time under the terms of the Agreement. For the six months ended February 28, 2006, the fee paid to
30 SEMIANNUAL REPORT
Notes to Financial Statements (unaudited) – continued
Tarantino LLC was $3,898. MFS has agreed to reimburse the fund for a portion of the payments made by the funds to Tarantino LLC in the amount of $3,307, which is shown as a reduction of total expenses in the Statement of Operations. Additionally, MFS has agreed to bear all expenses associated with office space, other administrative support, and supplies provided to the ICCO.
(4) Portfolio Securities
Purchases and sales of investments, other than U.S. government securities, purchased option transactions, and short-term obligations, aggregated $480,316,638 and $512,954,174, respectively.
(5) Shares of Beneficial Interest
The fund’s Declaration of Trust permits the Trustees to issue an unlimited number of full and fractional shares of beneficial interest. Transactions in fund shares were as follows:
| | | | | Six months ended 2/28/06 | | Year ended 8/31/05(i) |
| | | | | Shares | | Amount | | Shares | | Amount |
| Shares sold | | | | | | | | |
| Class A | | 3,921,277 | | $67,110,767 | | 11,949,697 | | $183,836,975 |
| Class B | | 573,406 | | 9,499,740 | | 1,638,877 | | 24,312,243 |
| Class C | | 204,881 | | 3,377,240 | | 597,878 | | 8,856,962 |
| Class I | | 595,271 | | 10,444,419 | | 2,114,298 | | 33,670,053 |
| Class R | | 125,019 | | 2,137,414 | | 823,683 | | 12,721,175 |
| Class R1 | | 32,660 | | 525,246 | | 14,762 | | 221,653 |
| Class R2 | | 8,651 | | 145,120 | | 8,365 | | 136,805 |
| Class R3 | | 83,485 | | 1,420,917 | | 91,932 | | 1,476,280 |
| Class R4 | | 72,693 | | 1,263,444 | | 19,816 | | 323,940 |
| Class R5 | | 3,730,852 | | 64,755,128 | | 3,325 | | 50,000 |
| Class 529A | | 5,169 | | 88,145 | | 90,426 | | 1,445,550 |
| Class 529B | | 628 | | 9,785 | | 1,657 | | 24,184 |
| Class 529C | | 2,026 | | 32,886 | | 6,597 | | 99,344 |
|
| | | | | 9,356,018 | | $160,810,251 | | 17,361,313 | | $267,175,164 |
|
| | | | | | | | |
SEMIANNUAL REPORT 31 |
| Notes to Financial Statements (unaudited) – continued | | | | |
| | | | | Six months ended 2/28/06 | | Year ended 8/31/05(i) |
| | | | | Shares | | Amount | | Shares | | Amount |
| Shares reacquired | | | | | | | | |
| Class A | | (12,624,594) | | $(215,821,979) | | (37,108,405) | | $(566,755,888) |
| Class B | | (2,566,968) | | (42,322,864) | | (6,760,662) | | (100,122,589) |
| Class C | | (574,744) | | (9,473,484) | | (2,114,075) | | (31,372,384) |
| Class I | | (422,077) | | (7,442,794) | | (3,323,601) | | (52,205,115) |
| Class R | | (293,250) | | (5,073,710) | | (353,416) | | (5,455,149) |
| Class R1 | | (8,260) | | (139,668) | | (2,033) | | (32,078) |
| Class R2 | | (4,312) | | (68,134) | | — | | — |
| Class R3 | | (37,016) | | (642,778) | | (31,541) | | (507,609) |
| Class R4 | | (8,853) | | (155,631) | | — | | — |
| Class R5 | | (225,603) | | (4,074,127) | | — | | — |
| Class 529A | | (9,724) | | (165,504) | | (21,518) | | (328,291) |
| Class 529B | | (747) | | (12,139) | | (961) | | (14,285) |
| Class 529C | | (1,589) | | (26,032) | | (4,267) | | (63,294) |
|
| | | | | (16,777,737) | | $(285,418,844) | | (49,720,479) | | $(756,856,682) |
| Net change | | | | | | | | |
| Class A | | (8,703,317) | | $(148,711,212) | | (25,158,708) | | $(382,918,913) |
| Class B | | (1,993,562) | | (32,823,124) | | (5,121,785) | | (75,810,346) |
| Class C | | (369,863) | | (6,096,244) | | (1,516,197) | | (22,515,422) |
| Class I | | 173,194 | | 3,001,625 | | (1,209,303) | | (18,535,062) |
| Class R | | (168,231) | | (2,936,296) | | 470,267 | | 7,266,026 |
| Class R1 | | 24,400 | | 385,578 | | 12,729 | | 189,575 |
| Class R2 | | 4,339 | | 76,986 | | 8,365 | | 136,805 |
| Class R3 | | 46,469 | | 778,139 | | 60,391 | | 968,671 |
| Class R4 | | 63,840 | | 1,107,813 | | 19,816 | | 323,940 |
| Class R5 | | 3,505,249 | | 60,681,001 | | 3,325 | | 50,000 |
| Class 529A | | (4,555) | | (77,359) | | 68,908 | | 1,117,259 |
| Class 529B | | (119) | | (2,354) | | 696 | | 9,899 |
| Class 529C | | 437 | | 6,854 | | 2,330 | | 36,050 |
|
| | | | | (7,421,719) | | $(124,608,593) | | (32,359,166) | | $(489,681,518) |
| (i) | For the period from the class’ inception, April 1, 2005 (Classes R1, R2, R4, and R5) through the stated period end. |
| |
The fund is one of several mutual funds in which the MFS funds-of-funds may invest. The MFS funds-of-funds do not invest in the underlying MFS funds for the purpose of exercising management or control. At the end of the period, the MFS Aggressive Growth Allocation Fund was the owner of record of approximately 5% of the value of outstanding voting shares. In addition, the MFS Lifetime 2030 Fund and the MFS Lifetime 2040 Fund were all the owners of record of less than 1% of the value of outstanding voting shares.
32 SEMIANNUAL REPORT
Notes to Financial Statements (unaudited) – continued
(6) Line of Credit
The fund and other affiliated funds participate in a $1 billion unsecured line of credit provided by a syndication of banks under a credit agreement. Borrowings may be made for temporary financing needs. Interest is charged to each fund, based on its borrowings, at a rate equal to the Federal Reserve funds rate plus 0.35% . In addition, a commitment fee, based on the average daily, unused portion of the line of credit, is allocated among the participating funds at the end of each calendar quarter. The commitment fee allocated to the fund for the six months ended February 28, 2006 was $3,026, and is included in miscellaneous expense on the Statement of Operations. The fund had no significant borrowings during the six months ended February 28, 2006.
SEMIANNUAL REPORT 33
BOARD REVIEW OF INVESTMENT ADVISORY AGREEMENT
A discussion regarding the Board’s most recent review and renewal of the Fund’s investment advisory agreement is available by clicking on the fund’s name under ‘‘Select a fund’’ on the MFS Web site (mfs.com).
PROXY VOTING POLICIES AND INFORMATION
A general description of the MFS funds’ proxy voting policies and procedures is available without charge, upon request, by calling 1-800-225-2606, by visiting the Proxy Voting section of mfs.com or by visiting the SEC’s Web site at http://www.sec.gov.
Information regarding how the fund voted proxies relating to portfolio securities during the most recent twelve-month period ended June 30 is available without charge by visiting the Proxy Voting section of mfs.com or by visiting the SEC’s Web site at http://www.sec.gov.
QUARTERLY PORTFOLIO DISCLOSURE
The trust will file a complete schedule of portfolio holdings with the Securities and Exchange Commission (the Commission) for the first and third quarters of each fiscal year on Form N-Q. The trust’s Form N-Q may be reviewed and copied at the:
Public Reference Room
Securities and Exchange Commission
Washington, D.C. 20549-0102
Information on the operation of the Public Reference Room may be obtained by calling the Commission at 1-800-SEC-0330. The trust’s Form N-Q is available on the EDGAR database on the Commission’s Internet Web site at http://www.sec.gov, and copies of this information may be obtained, upon payment of a duplicating fee, by electronic request at the following e-mail address: publicinfo@sec.gov or by writing the Public Reference Section at the above address.
A shareholder can also obtain the quarterly portfolio holdings report at mfs.com.
34 SEMIANNUAL REPORT
LETTER FROM THE CEO

Dear Shareholders,
It has been said that change is the only constant in life. As investors have seen, that theme is still accurate today as we recently have experienced shifting economic cycles because of natural disasters and political instability around the globe.
Markets worldwide have fluctuated in the past year as devastating hurricanes had a dramatic effect on the international economy, particularly on oil prices. We witnessed political unrest in the Middle East, highlighted by instability in Iraq, and in Africa, the usually stable Nigeria also experienced violence. As a result, energy prices have bounced up and down, with crude oil prices at one point topping a record $70 per barrel.
Such cycles are not uncommon and in fact have almost become the norm in our everyday lives. What does all of this mean to you as an investor? In times like these, it helps to know that you’re working with a seasoned investment professional who has experience to guide you through difficult times. At MFS®, we believe our investment management team has the knowledge and confidence to navigate through difficult cycles and at the same time see through adversity to find investment opportunities for our clients and shareholders.
Our investment management process, honed over 80 years, combines a unique concept of teamwork with our unwavering focus on the long term. We firmly believe that the best way to realize long-term financial goals – be it a college education, a comfortable retirement, or a secure family legacy – is to follow a three-pronged approach that focuses on longer time horizons. Allocate holdings across the major asset classes – including stocks, bonds, and cash. Diversify within each class to take advantage of different market segments and investing styles. Rebalance assets regularly to maintain a desired asset allocation. Of course, these strategies cannot guarantee a profit or protect against a loss. This long-term approach requires diligence and patience, two traits that in our experience are essential to capitalizing on the many opportunities the financial markets can offer – through both up and down economic cycles.
Respectfully,

Robert J. Manning
Chief Executive Officer and Chief Investment Officer
MFS Investment Management®
April 17, 2006
The opinions expressed in this letter are those of MFS, and no forecasts can be guaranteed.
SEMIANNUAL REPORT 1
PORTFOLIO COMPOSITION
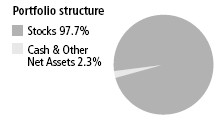
| Top ten holdings | |
| General Electric Co. | 2.8% |
|
|
| Cisco Systems, Inc. | 2.6% |
|
|
| Procter & Gamble Co. | 2.5% |
|
|
| Weatherford International Ltd. | 2.3% |
|
|
| Microsoft Corp. | 2.2% |
|
|
| QUALCOMM, Inc. | 2.2% |
|
|
| EMC Corp. | 2.1% |
|
|
| Corning, Inc. | 2.0% |
|
|
| American International Group, Inc. | 2.0% |
|
|
| SLM Corp. | 1.9% |
|
|
| Equity market sectors | |
| Health Care | 23.8% |
|
|
| Technology | 22.4% |
|
|
| Financial Services | 9.9% |
|
|
| Retailing | 7.8% |
|
|
| Industrial Goods & Services | 6.9% |
|
|
| Leisure | 6.1% |
|
|
| Consumer Staples | 4.8% |
|
|
| Special Products & Services | 4.2% |
|
|
| Energy | 3.9% |
|
|
| Basic Materials | 3.3% |
|
|
| Transportation | 2.1% |
|
|
| Utilities & Communications | 1.6% |
|
|
| Autos & Housing | 0.9% |
|
|
Percentages are based on net assets as of 2/28/06.
The portfolio is actively managed, and current holdings may be different.
2 SEMIANNUAL REPORT
Fund Expenses Borne by the Shareholders During the Period,
September 1, 2005 through February 28, 2006.
As a shareholder of the fund, you incur two types of costs: (1) transaction costs, including sales charges (loads) on certain purchase or redemption payments and redemption fees on certain exchanges and redemptions, and (2) ongoing costs, including management fees; distribution and service (12b-1) fees; and other fund expenses. This example is intended to help you understand your ongoing costs (in dollars) of investing in the fund and to compare these costs with the ongoing costs of investing in other mutual funds.
The example is based on an investment of $1,000 invested at the beginning of the period and held for the entire period September 1, 2005 through February 28, 2006.
The first line for each share class in the following table provides information about actual account values and actual expenses. You may use the information in this line, together with the amount you invested, to estimate the expenses that you paid over the period. Simply divide your account value by $1,000 (for example, an $8,600 account value divided by $1,000 = 8.6), then multiply the result by the number in the first line under the heading entitled ‘‘Expenses Paid During Period’’ to estimate the expenses you paid on your account during this period.
Hypothetical Example for Comparison Purposes
The second line for each share class in the following table provides information about hypothetical account values and hypothetical expenses based on the fund’s actual expense ratio and an assumed rate of return of 5% per year before expenses, which is not the fund’s actual return. The hypothetical account values and expenses may not be used to estimate the actual ending account balance or expenses you paid for the period. You may use this information to compare the ongoing costs of investing in the fund and other funds. To do so, compare this 5% hypothetical example with the 5% hypothetical examples that appear in the shareholder reports of the other funds.
Please note that the expenses shown in the table are meant to highlight your ongoing costs only and do not reflect any transactional costs, such as sales charges (loads) or redemption fees. Therefore, the second line for each share class in the table is useful in comparing ongoing costs only, and will not help you determine the relative total costs of owning different funds. In addition, if these transactional costs were included, your costs would have been higher.
SEMIANNUAL REPORT 3
| Expense Table – continued
| | | | |
| |
|
|
|
|
|
| | | | | Expenses |
| | Annualized | Beginning | Ending | Paid During |
| | Expense | Account Value | Account Value | Period(p) |
| Share Class | Ratio | 9/01/05 | 2/28/06 | 9/01/05-2/28/06 |
|
| Actual | 1.37% | $1,000.00 | $1,071.90 | $ 7.04 |
| A |
|
|
|
|
|
| Hypothetical(h) | 1.37% | $1,000.00 | $1,018.00 | $ 6.85 |
|
|
|
|
|
| Actual | 2.02% | $1,000.00 | $1,068.30 | $10.36 |
| B |
|
|
|
|
|
| Hypothetical(h) | 2.02% | $1,000.00 | $1,014.78 | $10.09 |
|
|
|
|
|
| Actual | 2.01% | $1,000.00 | $1,069.00 | $10.31 |
| C |
|
|
|
|
|
| Hypothetical(h) | 2.01% | $1,000.00 | $1,014.83 | $10.04 |
|
|
|
|
|
| Actual | 1.03% | $1,000.00 | $1,074.50 | $ 5.30 |
| I |
|
|
|
|
|
| Hypothetical(h) | 1.03% | $1,000.00 | $1,019.69 | $ 5.16 |
|
|
|
|
|
| Actual | 1.53% | $1,000.00 | $1,071.00 | $ 7.86 |
| R |
|
|
|
|
|
| Hypothetical(h) | 1.53% | $1,000.00 | $1,017.21 | $ 7.65 |
|
|
|
|
|
| Actual | 2.15% | $1,000.00 | $1,067.80 | $11.02 |
| R1 |
|
|
|
|
|
| Hypothetical(h) | 2.15% | $1,000.00 | $1,014.13 | $10.74 |
|
|
|
|
|
| Actual | 1.79% | $1,000.00 | $1,069.50 | $ 9.18 |
| R2 |
|
|
|
|
|
| Hypothetical(h) | 1.79% | $1,000.00 | $1,015.92 | $ 8.95 |
|
|
|
|
|
| Actual | 1.69% | $1,000.00 | $1,070.10 | $ 8.67 |
| R3 |
|
|
|
|
|
| Hypothetical(h) | 1.69% | $1,000.00 | $1,016.41 | $ 8.45 |
|
|
|
|
|
| Actual | 1.43% | $1,000.00 | $1,072.00 | $ 7.35 |
| R4 |
|
|
|
|
|
| Hypothetical(h) | 1.43% | $1,000.00 | $1,017.70 | $ 7.15 |
|
|
|
|
|
| Actual | 1.12% | $1,000.00 | $1,073.70 | $ 5.76 |
| R5 |
|
|
|
|
|
| Hypothetical(h) | 1.12% | $1,000.00 | $1,019.24 | $ 5.61 |
|
|
|
|
|
| (h) | 5% class return per year before expenses. |
| (p) | Expenses paid is equal to each class’ annualized expense ratio, as shown above, multiplied by the average account value over the period, multiplied by the number of days in the period, divided by the number of days in the year. Expenses paid do not include any applicable sales charges (loads) or redemption fees. If these transaction costs had been included, your costs would have been higher. |
| |
Effective October 1, 2005 the fund’s Class R1, Class R2, and Class R3 retirement plan administration and services fee was reduced (as described in Note 3 of the Notes to the Financial Statements). Had this fee reduction been in effect throughout the entire six month period, the annualized expense ratio would have been 2.13%, 1.77%, and 1.67% for Class R1, Class R2, and Class R3, respectively, and the actual expenses paid during the period would have been approximately $10.92, $9.08, and $8.57 for Class R1, Class R2, and Class R3, respectively.
4 SEMIANNUAL REPORT
| PORTFOLIO OF INVESTMENTS (unaudited) – 2/28/06 | | | | |
The Portfolio of Investments is a complete list of all securities owned by your fund. | | | |
| It is categorized by broad-based asset classes. | | | | |
Stocks - 97.7% | | | | |
|
|
|
|
| Issuer | Shares/Par | | | Value ($) |
|
|
|
|
| Aerospace - 2.1% | | | | |
|
|
|
|
| Northrop Grumman Corp. | 37,000 | | $ | 2,371,700 |
| United Technologies Corp. | 275,800 | | | 16,134,300 |
| | |
|
|
| | | | $ | 18,506,000 |
|
|
|
|
| Apparel Manufacturers - 1.6% | | | | |
|
|
|
|
| Nike, Inc., ‘‘B’’ | 163,100 | | $ | 14,153,818 |
|
|
|
|
| Automotive - 0.9% | | | | |
|
|
|
|
| Harman International Industries, Inc. (l) | 75,000 | | $ | 8,276,250 |
|
|
|
|
| Banks & Credit Companies - 5.1% | | | | |
|
|
|
|
| American Express Co. | 253,580 | | $ | 13,662,890 |
| SLM Corp. | 300,600 | | | 16,956,846 |
| UBS AG (l) | 143,678 | | | 15,278,126 |
| | |
|
|
| | | | $ | 45,897,862 |
|
|
|
|
| Biotechnology - 6.3% | | | | |
|
|
|
|
| Amgen, Inc. (n) | 214,140 | | $ | 16,165,429 |
| Celgene Corp. (n) | 245,400 | | | 9,325,200 |
| Genentech, Inc. (n) | 42,500 | | | 3,641,825 |
| Genzyme Corp. (n) | 219,430 | | | 15,215,276 |
| Gilead Sciences, Inc. (n) | 151,670 | | | 9,444,491 |
| ImClone Systems, Inc. (l)(n) | 67,600 | | | 2,595,164 |
| | |
|
|
| | | | $ | 56,387,385 |
|
|
|
|
| Broadcast & Cable TV - 0.5% | | | | |
|
|
|
|
| Grupo Televisa S.A., ADR | 40,600 | | $ | 3,185,476 |
| Univision Communications, Inc., ‘‘A’’ (l)(n) | 40,000 | | | 1,338,000 |
| | |
|
|
| | | | $ | 4,523,476 |
|
|
|
|
| Brokerage & Asset Managers - 2.5% | | | | |
|
|
|
|
| Affiliated Managers Group, Inc. (l)(n) | 24,400 | | $ | 2,401,692 |
| Chicago Mercantile Exchange Holdings, Inc. | 13,400 | | | 5,703,040 |
| Franklin Resources, Inc. | 23,900 | | | 2,454,052 |
| Morgan Stanley | 204,800 | | | 12,218,368 |
| | |
|
|
| | | | $ | 22,777,152 |
|
|
|
|
| Business Services - 3.2% | | | | |
|
|
|
|
| Accenture Ltd., ‘‘A’’ | 168,950 | | $ | 5,517,907 |
| Amdocs Ltd. (n) | 404,500 | | | 13,397,040 |
| First Data Corp. | 181,600 | | | 8,195,608 |
| Monster Worldwide, Inc. (n) | 35,000 | | | 1,713,600 |
| | |
|
|
| | | | $ | 28,824,155 |
|
|
|
|
| | SEMIANNUAL REPORT 5 |
| Portfolio of Investments (unaudited) – continued | | | | |
Issuer | Shares/Par | | | Value ($) |
|
|
|
|
| Stocks - continued | | | | |
|
|
|
|
| Chemicals - 2.5% | | | | |
|
|
|
|
| 3M Co. | 107,900 | | $ | 7,940,361 |
| Monsanto Co. | 168,500 | | | 14,133,780 |
| | |
|
|
| | | | $ | 22,074,141 |
|
|
|
|
| Computer Software - 4.4% | | | | |
|
|
|
|
| Adobe Systems, Inc. | 318,200 | | $ | 12,288,884 |
| Microsoft Corp. | 741,600 | | | 19,949,040 |
| Oracle Corp. (n) | 564,700 | | | 7,013,574 |
| | |
|
|
| | | | $ | 39,251,498 |
|
|
|
|
| Computer Software - Systems - 1.7% | | | | |
|
|
|
|
| Apple Computer, Inc. (n) | 77,500 | | $ | 5,311,850 |
| Dell, Inc. (n) | 339,700 | | | 9,851,300 |
| | |
|
|
| | | | $ | 15,163,150 |
|
|
|
|
| Conglomerates - 0.5% | | | | |
|
|
|
|
| Textron, Inc. | 53,600 | | $ | 4,722,696 |
|
|
|
|
| Consumer Goods & Services - 4.0% | | | | |
|
|
|
|
| Colgate-Palmolive Co. | 171,000 | | $ | 9,316,080 |
| eBay, Inc. (n) | 107,200 | | | 4,294,432 |
| Procter & Gamble Co. | 370,200 | | | 22,186,086 |
| | |
|
|
| | | | $ | 35,796,598 |
|
|
|
|
| Electrical Equipment - 4.1% | | | | |
|
|
|
|
| Danaher Corp. | 78,200 | | $ | 4,737,356 |
| General Electric Co. | 750,600 | | | 24,672,222 |
| Rockwell Automation, Inc. | 109,200 | | | 7,444,164 |
| | |
|
|
| | | | $ | 36,853,742 |
|
|
|
|
| Electronics - 4.7% | | | | |
|
|
|
|
| Analog Devices, Inc. | 57,300 | | $ | 2,185,422 |
| Applied Materials, Inc. | 133,300 | | | 2,444,722 |
| Intel Corp. | 500,000 | | | 10,300,000 |
| Marvell Technology Group Ltd. (n) | 79,700 | | | 4,879,234 |
| Samsung Electronics Co. Ltd. | 12,770 | | | 8,949,688 |
| SanDisk Corp. (n) | 80,200 | | | 4,839,268 |
| Texas Instruments, Inc. | 75,000 | | | 2,238,750 |
| Xilinx, Inc. | 214,600 | | | 5,854,288 |
| | |
|
|
| | | | $ | 41,691,372 |
|
|
|
|
| Food & Drug Stores - 1.3% | | | | |
|
|
|
|
| CVS Corp. | 397,800 | | $ | 11,269,674 |
|
|
|
|
| Food & Non-Alcoholic Beverages - 1.3% | | | | |
|
|
|
|
| PepsiCo, Inc. | 199,220 | | $ | 11,775,894 |
|
|
|
|
| 6 SEMIANNUAL REPORT | | | | |
| Portfolio of Investments (unaudited) – continued | | | | |
| Issuer | Shares/Par | | | Value ($) |
|
|
|
|
| Stocks - continued | | | | |
|
|
|
|
| Gaming & Lodging - 4.6% | | | | |
|
|
|
|
| Carnival Corp. | 95,510 | | $ | 4,933,092 |
| Harrah’s Entertainment, Inc. | 182,300 | | | 13,111,016 |
| International Game Technology | 249,100 | | | 8,910,307 |
| Las Vegas Sands Corp. (l)(n) | 74,200 | | | 3,958,570 |
| Starwood Hotels & Resorts Worldwide, Inc. | 120,200 | | | 7,632,700 |
| Wynn Resorts Ltd. (l)(n) | 40,000 | | | 2,658,000 |
| | |
|
|
| | | | $ | 41,203,685 |
|
|
|
|
| General Merchandise - 3.0% | | | | |
|
|
|
|
| Kohl’s Corp. (n) | 186,360 | | $ | 8,965,780 |
| Target Corp. | 133,760 | | | 7,276,544 |
| Wal-Mart Stores, Inc. | 244,090 | | | 11,071,922 |
| | |
|
|
| | | | $ | 27,314,246 |
|
|
|
|
| Health Maintenance Organizations - 1.7% | | | | |
|
|
|
|
| UnitedHealth Group, Inc. | 77,700 | | $ | 4,524,471 |
| WellPoint, Inc. (n) | 138,660 | | | 10,647,701 |
| | |
|
|
| | | | $ | 15,172,172 |
|
|
|
|
| Insurance - 2.3% | | | | |
|
|
|
|
| Ace Ltd. | 59,500 | | $ | 3,315,935 |
| American International Group, Inc. | 266,100 | | | 17,658,396 |
| | |
|
|
| | | | $ | 20,974,331 |
|
|
|
|
| Internet - 1.4% | | | | |
|
|
|
|
| Google, Inc., ‘‘A’’ (n) | 31,445 | | $ | 11,402,586 |
| Yahoo!, Inc. (n) | 41,710 | | | 1,337,223 |
| | |
|
|
| | | | $ | 12,739,809 |
|
|
|
|
| Leisure & Toys - 1.0% | | | | |
|
|
|
|
| Electronic Arts, Inc. (n) | 171,430 | | $ | 8,909,217 |
|
|
|
|
| Machinery & Tools - 0.7% | | | | |
|
|
|
|
| Caterpillar, Inc. | 90,500 | | $ | 6,613,740 |
|
|
|
|
| Medical & Health Technology & Services - 1.0% | | | | |
|
|
|
|
| Caremark Rx, Inc. (n) | 89,700 | | $ | 4,462,575 |
| Quest Diagnostics Inc. | 89,200 | | | 4,716,004 |
| | |
|
|
| | | | $ | 9,178,579 |
|
|
|
|
| Medical Equipment - 6.2% | | | | |
|
|
|
|
| Advanced Medical Optics, Inc. (n) | 252,800 | | $ | 11,244,544 |
| Alcon, Inc. | 12,600 | | | 1,451,016 |
| C.R. Bard, Inc. | 100,200 | | | 6,562,098 |
| DENTSPLY International, Inc. | 160,600 | | | 9,152,594 |
|
|
|
|
| | SEMIANNUAL REPORT 7 |
| Portfolio of Investments (unaudited) – continued | | | | |
| Issuer | Shares/Par | | | Value ($) |
|
|
|
|
| Stocks - continued | | | | |
|
|
|
|
| Medical Equipment - continued | | | | |
|
|
|
|
| Medtronic, Inc. | 166,360 | | $ | 8,975,122 |
| Patterson Companies, Inc. (n) | 130,000 | | | 4,685,200 |
| St. Jude Medical, Inc. (n) | 185,100 | | | 8,440,560 |
| Zimmer Holdings, Inc. (n) | 67,300 | | | 4,655,814 |
| | |
|
|
| | | | $ | 55,166,948 |
|
|
|
|
| Network & Telecom - 8.1% | | | | |
|
|
|
|
| Cisco Systems, Inc. (n) | 1,164,700 | | $ | 23,573,528 |
| Corning, Inc. (n) | 748,120 | | | 18,261,609 |
| Juniper Networks, Inc. (l)(n) | 297,700 | | | 5,474,703 |
| Nokia Corp., ADR | 324,200 | | | 6,023,636 |
| QUALCOMM, Inc. | 411,660 | | | 19,434,469 |
| | |
|
|
| | | | $ | 72,767,945 |
|
|
|
|
| Oil Services - 3.9% | | | | |
|
|
|
|
| GlobalSantaFe Corp. | 264,710 | | $ | 14,649,051 |
| Weatherford International Ltd. (n) | 475,000 | | | 20,482,000 |
| | |
|
|
| | | | $ | 35,131,051 |
|
|
|
|
| Personal Computers & Peripherals - 2.1% | | | | |
|
|
|
|
| EMC Corp. (n) | 1,347,350 | | $ | 18,889,847 |
|
|
|
|
| Pharmaceuticals - 8.6% | | | | |
|
|
|
|
| Abbott Laboratories | 269,200 | | $ | 11,893,256 |
| Allergan, Inc. | 63,200 | | | 6,842,032 |
| Eli Lilly & Co. | 137,060 | | | 7,623,277 |
| Johnson & Johnson | 224,920 | | | 12,966,638 |
| Roche Holding AG (l) | 73,000 | | | 10,805,115 |
| Sanofi-Aventis (l) | 30,000 | | | 2,556,690 |
| Teva Pharmaceutical Industries Ltd., ADR (l) | 223,200 | | | 9,372,168 |
| Wyeth | 292,390 | | | 14,561,022 |
| | |
|
|
| | | | $ | 76,620,198 |
|
|
|
|
| Railroad & Shipping - 0.4% | | | | |
|
|
|
|
| Norfolk Southern Corp. | 73,300 | | $ | 3,751,494 |
|
|
|
|
| Specialty Chemicals - 0.8% | | | | |
|
|
|
|
| Praxair, Inc. | 134,200 | | $ | 7,244,116 |
|
|
|
|
| Specialty Stores - 1.9% | | | | |
|
|
|
|
| Home Depot, Inc. | 344,300 | | $ | 14,512,245 |
| Urban Outfitters, Inc. (n) | 82,500 | | | 2,318,250 |
| | |
|
|
| | | | $ | 16,830,495 |
|
|
|
|
| Telecommunications - Wireless - 1.3% | | | | |
|
|
|
|
| America Movil S.A. de C.V., ‘‘L’’, ADR | 328,400 | | $ | 11,405,332 |
|
|
|
|
| 8 SEMIANNUAL REPORT | | | | |
| Portfolio of Investments (unaudited) – continued | | | | |
Issuer | Shares/Par | | | Value ($) |
|
|
|
|
| Stocks - continued | | | | |
|
|
|
|
| Trucking - 1.7% | | | | |
|
|
|
|
| FedEx Corp. | 139,560 | | $ | 14,966,414 |
|
| Utilities - Electric Power - 0.3% | | | | |
|
|
|
|
| AES Corp. (n) | 143,900 | | $ | 2,489,470 |
|
|
|
|
| Total Stocks (Identified Cost, $848,865,500) | | $ | 875,313,952 |
|
|
|
| Collateral for Securities Loaned - 4.6% | | | | |
|
|
|
|
| Navigator Securities Lending Prime Portfolio, at Cost and | | | | |
| Net Asset Value | 41,325,167 | | $ | 41,325,167 |
|
|
|
|
| Repurchase Agreement - 1.3% | | | | |
|
|
|
|
| Goldman Sachs, 4.55%, dated 2/28/06, due 3/01/06, total to be | | | | |
| received $12,172,538 (secured by various U.S. Treasury and Federal | | | | |
| Agency obligations in a jointly traded account), at Cost | $12,171,000 | | $ | 12,171,000 |
|
|
|
|
| Total Investments (Identified Cost, $902,361,667) (k) | | $ | 928,810,119 |
|
|
|
| Other Assets, Less Liabilities - (3.6)% | | | | (32,523,572) |
|
|
|
|
| Net Assets - 100.0% | | $ | 896,286,547 |
|
|
|
| (n) | Non-income producing security. |
| (l) | All or a portion of this security is on loan. |
| (k) | As of February 28, 2006, the fund had one security that was fair valued, aggregating $8,949,688 and 1.0% of net assets, in accordance with the policies adopted by the Board of Trustees. |
The following abbreviation is used in the Portfolio of Investments and is defined:
ADR American Depository Receipt
See Notes to Financial Statements
|
SEMIANNUAL REPORT 9
| FINANCIAL STATEMENTS | Statement of Assets and Liabilities (unaudited) | |
This statement represents your fund’s balance sheet, which details the assets | |
| and liabilities composing the total value of the fund. | | |
At 2/28/06 | | |
| Assets | | |
|
|
|
| Investments, at value, including $39,671,714 of securities on | | |
| loan (identified cost, $902,361,667) | $928,810,119 | |
| Cash | 333 | |
| Receivable for investments sold | 27,134,056 | |
| Receivable for fund shares sold | 778,080 | |
| Interest and dividends receivable | 894,399 | |
| Other assets | 4,271 | |
|
|
|
| Total assets | | $957,621,258 |
|
|
|
| Liabilities | | |
|
|
|
| Payable for investments purchased | $16,226,869 | |
| Payable for fund shares reacquired | 3,363,533 | |
| Collateral for securities loaned, at value | 41,325,167 | |
| Payable to affiliates | | |
| Management fee | 16,134 | |
| Shareholder servicing costs | 181,769 | |
| Distribution and service fees | 13,535 | |
| Administrative services fee | 272 | |
| Retirement plan administration and services fees | 17 | |
| Payable for independent trustees’ compensation | 50,351 | |
| Accrued expenses and other liabilities | 157,064 | |
|
|
|
| Total liabilities | | $61,334,711 |
|
|
|
| Net assets | | $896,286,547 |
|
|
|
| Net assets consist of: | | |
|
|
|
| Paid-in capital | $1,107,979,067 | |
| Unrealized appreciation (depreciation) on investments and | | |
| translation of assets and liabilities in foreign currencies | 26,442,959 | |
| Accumulated net realized gain (loss) on investments and foreign | | |
| currency transactions | (235,540,605) | |
| Accumulated net investment loss | (2,594,874) | |
|
|
|
| Net assets | | $896,286,547 |
|
|
|
| Shares of beneficial interest outstanding | | 50,296,143 |
|
|
|
| Class A shares | | |
|
|
|
| Net assets | $615,381,572 | |
| Shares outstanding | 34,132,682 | |
|
|
|
| Net asset value per share | | $18.03 |
|
|
|
| Offering price per share (100÷94.25 x net asset value per share) | | $19.13 |
|
|
|
| Class B shares | | |
|
|
|
| Net assets | $193,397,439 | |
| Shares outstanding | 11,147,487 | |
|
|
|
| Net asset value and offering price per share | | $17.35 |
|
|
|
| 10 SEMIANNUAL REPORT | | |
| Statement of Assets and Liabilities (unaudited) – continued | | |
Class C shares | | |
|
|
|
| Net assets | $75,010,728 | |
| Shares outstanding | 4,323,580 | |
|
|
|
| Net asset value and offering price per share | | $17.35 |
|
|
|
| Class I shares | | |
|
|
|
| Net assets | $3,707,914 | |
| Shares outstanding | 200,911 | |
|
|
|
| Net asset value, offering price, and redemption price per share | | $18.46 |
|
|
|
| Class R shares | | |
|
|
|
| Net assets | $6,496,491 | |
| Shares outstanding | 361,674 | |
|
|
|
| Net asset value, offering price, and redemption price per share | | $17.96 |
|
|
|
| Class R1 shares | | |
|
|
|
| Net assets | $191,110 | |
| Shares outstanding | 11,028 | |
|
|
|
| Net asset value, offering price, and redemption price per share | | $17.33 |
|
|
|
| Class R2 shares | | |
|
|
|
| Net assets | $794,297 | |
| Shares outstanding | 45,710 | |
|
|
|
| Net asset value, offering price, and redemption price per share | | $17.38 |
|
|
|
| Class R3 shares | | |
|
|
|
| Net assets | $1,192,033 | |
| Shares outstanding | 66,700 | |
|
|
|
| Net asset value, offering price, and redemption price per share | | $17.87 |
|
|
|
| Class R4 shares | | |
|
|
|
| Net assets | $57,965 | |
| Shares outstanding | 3,217 | |
|
|
|
| Net asset value, offering price, and redemption price per share | | $18.02 |
|
|
|
| Class R5 shares | | |
|
|
|
| Net assets | $56,998 | |
| Shares outstanding | 3,154 | |
|
|
|
| Net asset value, offering price, and redemption price per share | | $18.07 |
|
|
|
On sales of $50,000 or more, the offering price of Class A shares is reduced. A contingent deferred sales charge may be imposed on redemptions of Class A, Class B, and Class C shares.
See Notes to Financial Statements
SEMIANNUAL REPORT 11
| FINANCIAL STATEMENTS | Statement of Operations (unaudited) | |
This statement describes how much your fund earned in investment income and accrued in | |
| expenses. It also describes any gains and/or losses generated by fund operations. | |
Six months ended 2/28/06 | | |
| Net investment loss | | |
|
|
|
| Income | | |
| Dividends | $3,893,651 | |
| Interest | 630,478 | |
| Foreign taxes withheld | (11,387) | |
|
|
|
| Total investment income | | $4,512,742 |
|
|
|
| Expenses | | |
| Management fee | $3,427,205 | |
| Distribution and service fees | 2,503,548 | |
| Shareholder servicing costs | 1,381,007 | |
| Administrative services fee | 46,326 | |
| Retirement plan administration and services fees | 2,960 | |
| Independent trustees’ compensation | 15,292 | |
| Custodian fee | 64,316 | |
| Shareholder communications | 63,583 | |
| Auditing fees | 11,680 | |
| Legal fees | 3,928 | |
| Miscellaneous | 88,699 | |
|
|
|
| Total expenses | | $7,608,544 |
|
|
|
| Fees paid indirectly | (82,983) | |
| Reduction of expenses by investment adviser | (461,656) | |
|
|
|
| Net expenses | | $7,063,905 |
|
|
|
| Net investment loss | | $(2,551,163) |
|
|
|
| Realized and unrealized gain (loss) on investments | | |
|
|
|
| Realized gain (loss) (identified cost basis) | | |
| Investment transactions | $89,578,735 | |
| Foreign currency transactions | 19,997 | |
|
|
|
| Net realized gain (loss) on investments and foreign | | |
| currency transactions | | $89,598,732 |
|
|
|
| Change in unrealized appreciation (depreciation) | | |
| Investments | $(23,720,455) | |
| Translation of assets and liabilities in foreign currencies | 6,815 | |
|
|
|
| Net unrealized gain (loss) on investments and foreign | | |
| currency translation | | $(23,713,640) |
|
|
|
| Net realized and unrealized gain (loss) on investments and | | |
| foreign currency | | $65,885,092 |
|
|
|
| Change in net assets from operations | | $63,333,929 |
|
|
|
See Notes to Financial Statements | | |
| | |
12 SEMIANNUAL REPORT | | |
| FINANCIAL STATEMENTS | Statements of Changes in Net Assets | |
These statements describe the increases and/or decreases in net assets resulting | |
| from operations, any distributions, and any shareholder transactions. | | |
| Six months ended | Year ended |
| | 2/28/06 | 8/31/05 |
| | (unaudited) | |
| Change in net assets | | |
|
|
|
| From operations | | |
|
|
|
| Net investment loss | $(2,551,163) | $(2,104,858) |
| Net realized gain (loss) on investments and foreign | | |
| currency transactions | 89,598,732 | 152,520,859 |
| Net unrealized gain (loss) on investments and foreign | | |
| currency translation | (23,713,640) | (56,264,736) |
|
|
|
| Change in net assets from operations | $63,333,929 | $94,151,265 |
|
|
|
| Change in net assets from fund share transactions | $(94,069,869) | $191,397,865 |
|
|
|
| Redemption fees | $— | $3,489 |
|
|
|
| Total change in net assets | $(30,735,940) | $285,552,619 |
|
|
|
| Net assets | | |
|
|
|
| At beginning of period | 927,022,487 | 641,469,868 |
| At end of period (including accumulated net investment loss of | | |
| $2,594,874 and $43,711, respectively) | $896,286,547 | $927,022,487 |
|
|
|
| See Notes to Financial Statements | | |
SEMIANNUAL REPORT 13
FINANCIAL STATEMENTS | Financial Highlights
The financial highlights table is intended to help you understand the fund’s financial performance for the semiannual period and the past 5 fiscal years (or life of a particular share class, if shorter). Certain information reflects financial results for a single fund share. The total returns in the table represent the rate by which an investor would have earned (or lost) on an investment in the fund share class (assuming reinvestment of all distributions) held for the entire period.
| | Six months | | | | | | | | | | | |
| | ended | | Years ended 8/31 | |
| Class A | 2/28/06 | | 2005 | | 2004 | | 2003 | | 2002 | | 2001 | |
| | (unaudited) | | | | | | | | | | | |
| Net asset value, beginning of | | | | | | | | | | | | |
| period | $16.82 | | $14.71 | | $14.41 | | $13.22 | | $16.89 | | $27.51 | |
| |
| Income (loss) from | | | | | | | | | | | | |
| investment operations | | | | | | | | | | | | |
| |
| Net investment loss (d) | $(0.03 | ) | $(0.01 | ) | $(0.07 | ) | $(0.07 | ) | $(0.12 | ) | $(0.11 | ) |
| Net realized and unrealized | | | | | | | | | | | | |
| gain (loss) on investments | | | | | | | | | | | | |
| and foreign currency | 1.24 | | 2.12 | | 0.37 | | 1.26 | | (3.55 | ) | (9.73 | ) |
| |
| Total from investment | | | | | | | | | | | | |
| operations | $1.21 | | $2.11 | | $0.30 | | $1.19 | | $(3.67 | ) | $(9.84 | ) |
| |
| Less distributions declared | | | | | | | | | | | | |
| to shareholders | | | | | | | | | | | | |
| |
| From net realized gain on | | | | | | | | | | | | |
| investments and foreign | | | | | | | | | | | | |
| currency transactions | $— | | $— | | $— | | $— | | $— | | $(0.78 | ) |
| |
| Net asset value, end of period | $18.03 | | $16.82 | | $14.71 | | $14.41 | | $13.22 | | $16.89 | |
| |
| Total return (%) (t)(s)(r) | 7.19 | (n) | 14.34 | | 2.08 | (b) | 9.00 | | (21.73 | ) | (36.57 | ) |
| |
| Ratios (%) (to average net assets) | | | | | | | | | | | |
| and Supplemental data: | | | | | | | | | | | | |
| |
| Expenses before expense | | | | | | | | | | | | |
| reductions (f) | 1.47 | (a) | 1.38 | | 1.41 | | 1.42 | | 1.43 | | 1.57 | |
| Expenses after expense | | | | | | | | | | | | |
| reductions (f) | 1.37 | (a) | 1.28 | | 1.36 | | 1.42 | | 1.47 | (e) | 1.52 | |
| Net investment loss | (0.36 | )(a) | (0.08 | ) | (0.47 | ) | (0.52 | ) | (0.76 | ) | (0.56 | ) |
| Portfolio turnover | 123 | | 184 | | 261 | | 312 | | 257 | | 283 | |
| Net assets at end of period | | | | | | | | | | | | |
| (000 Omitted) | $615,382 | | $632,209 | | $404,511 | | $496,271 | | $417,986 | | $111,062 | |
| |
| See Notes to Financial Statements | | | | | | | | | | | |
| | | | | | | | | | | |
| 14 SEMIANNUAL REPORT | | | | | | | | | | | | |
| Financial Highlights – continued | | | | | | | | |
| | Six months | | | | | | | | |
| | ended | | Years ended 8/31 |
| Class B | 2/28/06 | | 2005 | 2004 | | 2003 | 2002 | | 2001 |
| | (unaudited) | | | | | | | | |
| Net asset value, beginning of | | | | | | | | | |
| period | $16.24 | | $14.30 | $14.09 | | $13.01 | $16.72 | | $27.41 |
|
| Income (loss) from | | | | | | | | | |
| investment operations | | | | | | | | | |
|
| Net investment loss (d) | $(0.08 | ) | $(0.11) | $(0.16 | ) | $(0.15) | $(0.22 | ) | $(0.23) |
| Net realized and unrealized | | | | | | | | | |
| gain (loss) on investments | | | | | | | | | |
| and foreign currency | 1.19 | | 2.05 | 0.37 | | 1.23 | (3.49 | ) | (9.70) |
|
| Total from investment | | | | | | | | | |
| operations | $1.11 | | $1.94 | $0.21 | | $1.08 | $(3.71 | ) | $(9.93) |
|
| Less distributions declared | | | | | | | | | |
| to shareholders | | | | | | | | | |
|
| From net realized gain on | | | | | | | | | |
| investments and foreign | | | | | | | | | |
| currency transactions | $— | | $— | $— | | $— | $— | | $(0.76) |
|
| Net asset value, end of period | $17.35 | | $16.24 | $14.30 | | $14.09 | $13.01 | | $16.72 |
|
| Total return (%) (t)(s)(r) | 6.83 | (n) | 13.57 | 1.49 | (b) | 8.22 | (22.13 | ) | (37.01) |
|
| Ratios (%) (to average net assets) | | | | | | | | |
| and Supplemental data: | | | | | | | | | |
|
| Expenses before expense | | | | | | | | | |
| reductions (f) | 2.12 | (a) | 2.03 | 2.05 | | 2.07 | 2.08 | | 2.22 |
| Expenses after expense | | | | | | | | | |
| reductions (f) | 2.02 | (a) | 1.93 | 2.00 | | 2.07 | 2.12 | (e) | 2.17 |
| Net investment loss | (1.01 | )(a) | (0.73) | (1.11 | ) | (1.18) | (1.41 | ) | (1.20) |
| Portfolio turnover | 123 | | 184 | 261 | | 312 | 257 | | 283 |
| Net assets at end of period | | | | | | | | | |
| (000 Omitted) | $193,397 | | $201,513 | $138,226 | | $155,602 | $114,619 | | $68,839 |
|
| See Notes to Financial Statements | | | | | | | | |
| | | | | | | | |
| | | | | | | SEMIANNUAL REPORT 15 |
| Financial Highlights – continued | | | | | | | | |
| |
Six months | | | | | | | | |
| | ended | | Years ended 8/31 |
| Class C | 2/28/06 | | 2005 | 2004 | | 2003 | 2002 | | 2001 |
| | (unaudited) | | | | | | | | |
| Net asset value, beginning of | | | | | | | | | |
| period | $16.23 | | $14.30 | $14.10 | | $13.02 | $16.73 | | $27.43 |
|
| Income (loss) from | | | | | | | | | |
| investment operations | | | | | | | | | |
|
| Net investment loss (d) | $(0.08 | ) | $(0.11) | $(0.16 | ) | $(0.15) | $(0.22 | ) | $(0.23) |
| Net realized and unrealized | | | | | | | | | |
| gain (loss) on investments | | | | | | | | | |
| and foreign currency | 1.20 | | 2.04 | 0.36 | | 1.23 | (3.49 | ) | (9.70) |
|
| Total from investment | | | | | | | | | |
| operations | $1.12 | | $1.93 | $0.20 | | $1.08 | $(3.71 | ) | $(9.93) |
|
| Less distributions declared | | | | | | | | | |
| to shareholders | | | | | | | | | |
|
| From net realized gain on | | | | | | | | | |
| investments and foreign | | | | | | | | | |
| currency transactions | $— | | $— | $— | | $— | $— | | $(0.77) |
|
| Net asset value, end of period | $17.35 | | $16.23 | $14.30 | | $14.10 | $13.02 | | $16.73 |
|
| Total return (%) (t)(s)(r) | 6.90 | (n) | 13.50 | 1.42 | (b) | 8.29 | (22.18 | ) | (36.99) |
|
| Ratios (%) (to average net assets) | | | | | | | | |
| and Supplemental data: | | | | | | | | | |
|
| Expenses before expense | | | | | | | | | |
| reductions (f) | 2.11 | (a) | 2.03 | 2.05 | | 2.07 | 2.08 | | 2.22 |
| Expenses after expense | | | | | | | | | |
| reductions (f) | 2.01 | (a) | 1.93 | 2.00 | | 2.07 | 2.12 | (e) | 2.17 |
| Net investment loss | (1.01 | )(a) | (0.69) | (1.12 | ) | (1.18) | (1.41 | ) | (1.20) |
| Portfolio turnover | 123 | | 184 | 261 | | 312 | 257 | | 283 |
| Net assets at end of period | | | | | | | | | |
| (000 Omitted) | $75,011 | | $82,182 | $91,225 | | $110,786 | $82,441 | | $45,879 |
|
| See Notes to Financial Statements | | | | | | | | |
| | | | | | | | |
| 16 SEMIANNUAL REPORT | | | | | | | | | |
| Financial Highlights – continued | | | | | | | | | |
Six months | | | | | | | | |
| | ended | | Years ended 8/31 |
| Class I | 2/28/06 | | 2005 | 2004 | | 2003 | 2002 | | 2001 |
| (unaudited) | | | | | | | | |
| Net asset value, beginning of period | $17.18 | | $14.98 | $14.63 | | $13.37 | $17.01 | | $27.63 |
|
| Income (loss) from | | | | | | | | | |
| investment operations | | | | | | | | | |
|
| Net investment income (loss) (d) | $(0.00 | )(w) | $0.05 | $(0.02 | ) | $(0.02) | $(0.06 | ) | $(0.03) |
| Net realized and unrealized | | | | | | | | | |
| gain (loss) on investments and | | | | | | | | | |
| foreign currency | 1.28 | | 2.15 | 0.37 | | 1.28 | (3.58 | ) | (9.80) |
|
| Total from investment operations | $1.28 | | $2.20 | $0.35 | | $1.26 | $(3.64 | ) | $(9.83) |
|
| Less distributions declared | | | | | | | | | |
| to shareholders | | | | | | | | | |
|
| From net realized gain on | | | | | | | | | |
| investments and foreign currency | | | | | | | | | |
| transactions | $— | | $— | $— | | $— | $— | | $(0.79) |
|
| Net asset value, end of period | $18.46 | | $17.18 | $14.98 | | $14.63 | $13.37 | | $17.01 |
|
| Total return (%) (s)(r) | 7.45 | (n) | 14.69 | 2.39 | (b) | 9.42 | (21.40 | ) | (36.39) |
|
| Ratios (%) (to average net assets) | | | | | | | | | |
| and Supplemental data: | | | | | | | | | |
|
| Expenses before expense reductions (f) | 1.13 | (a) | 1.02 | 1.06 | | 1.07 | 1.08 | | 1.20 |
| Expenses after expense reductions (f) | 1.03 | (a) | 0.92 | 1.01 | | 1.07 | 1.12 | (e) | 1.15 |
| Net investment income (loss) | (0.02 | )(a) | 0.32 | (0.11 | ) | (0.16) | (0.39 | ) | (0.14) |
| Portfolio turnover | 123 | | 184 | 261 | | 312 | 257 | | 283 |
| Net assets at end of period | | | | | | | | | |
| (000 Omitted) | $3,708 | | $3,816 | $4,136 | | $4,317 | $4,403 | | $7,381 |
|
| See Notes to Financial Statements | | | | | | | | |
| | | | |
SEMIANNUAL REPORT 17 |
| | | | | | | |
| Financial Highlights – continued | | | | | | | |
| | Six months | | | | | | |
| | ended | | Years ended 8/31 | |
| Class R | 2/28/06 | | 2005 | 2004 | | 2003(i) | |
| | (unaudited) | | | | | | |
| Net asset value, beginning of period | $16.77 | | $14.69 | $14.41 | | $12.35 | |
| |
| Income (loss) from investment operations | | | | | | | |
| |
| Net investment loss (d) | $(0.04 | ) | $(0.04) | $(0.09 | ) | $(0.08 | ) |
| Net realized and unrealized gain (loss) on investments | | | | | | |
| and foreign currency | 1.23 | | 2.12 | 0.37 | | 2.14 | (g) |
| |
| Total from investment operations | $1.19 | | $2.08 | $0.28 | | $2.06 | |
| |
| Net asset value, end of period | $17.96 | | $16.77 | $14.69 | | $14.41 | |
| |
| Total return (%) (s)(r) | 7.10 | (n) | 14.16 | 1.94 | (b) | 16.68 | (n) |
| |
| Ratios (%) (to average net assets) | | | | | | | |
| and Supplemental data: | | | | | | | |
| |
| Expenses before expense reductions (f) | 1.63 | (a) | 1.54 | 1.56 | | 1.65 | (a) |
| Expenses after expense reductions (f) | 1.53 | (a) | 1.44 | 1.51 | | 1.65 | (a) |
| Net investment loss | (0.51 | )(a) | (0.25) | (0.60 | ) | (0.82 | )(a) |
| Portfolio turnover | 123 | | 184 | 261 | | 312 | |
| Net assets at end of period (000 Omitted) | $6,496 | | $5,904 | $3,266 | | $1,869 | |
| |
| | | | | Six months | | Year | |
| | | | | ended | | ended | |
| Class R1 | | | | 2/28/06 | | 8/31/05(i) | |
| | | | (unaudited) | | | |
| Net asset value, beginning of period | | | | $16.23 | | $15.35 | |
| |
| Income (loss) from investment operations | | | | | | | |
| |
| Net investment loss (d) | | | | $(0.10 | ) | $(0.08 | ) |
| Net realized and unrealized gain (loss) on investments | | | | | | |
| and foreign currency | | | | 1.20 | | 0.96 | (g) |
| |
| Total from investment operations | | | | $1.10 | | $0.88 | |
| |
| Net asset value, end of period | | | | $17.33 | | $16.23 | |
| |
| Total return (%) (s)(r) | | | | 6.78 | (n) | 5.73 | (n) |
| |
| Ratios (%) (to average net assets) | | | | | | | |
| and Supplemental data: | | | | | | | |
| |
| Expenses before expense reductions (f) | | | | 2.34 | (a) | 2.35 | (a) |
| Expenses after expense reductions (f) | | | | 2.15 | (a) | 2.25 | (a) |
| Net investment loss | | | | (1.13 | )(a) | (1.21 | )(a) |
| Portfolio turnover | | | | 123 | | 184 | |
| Net assets at end of period (000 Omitted) | | | | $191 | | $80 | |
| |
| See Notes to Financial Statements | | | | | | | |
| | | | | | | |
| 18 SEMIANNUAL REPORT | | | | | | | |
| Financial Highlights – continued | | | | | | |
| | | |
Six months | | Year | |
| | | | ended | | ended | |
| Class R2 | | | 2/28/06 | | 8/31/05(i) | |
| | | | (unaudited) | | | |
| Net asset value, beginning of period | | | $16.25 | | $15.35 | |
| |
| Income (loss) from investment operations | | | | | | |
| |
| Net investment loss (d) | | | $(0.07 | ) | $(0.04 | ) |
| Net realized and unrealized gain (loss) on investments | | | | | | |
| and foreign currency | | | 1.20 | | 0.94 | (g) |
| |
| Total from investment operations | | | $1.13 | | $0.90 | |
| |
| Net asset value, end of period | | | $17.38 | | $16.25 | |
| |
| Total return (%) (s)(r) | | | 6.95 | (n) | 5.86 | (n) |
| |
| Ratios (%) (to average net assets) | | | | | | |
| and Supplemental data: | | | | | | |
| |
| Expenses before expense reductions (f) | | | 2.02 | (a) | 2.04 | (a) |
| Expenses after expense reductions (f) | | | 1.79 | (a) | 1.94 | (a) |
| Net investment loss | | | (0.79 | )(a) | (0.67 | )(a) |
| Portfolio turnover | | | 123 | | 184 | |
| Net assets at end of period (000 Omitted) | | | $794 | | $437 | |
| |
| | Six months | | | | | |
| | ended | | Years ended 8/31 | |
| Class R3 | 2/28/06 | | 2005 | | 2004(i) | |
| | (unaudited) | | | | | |
| Net asset value, beginning of period | $16.70 | | $14.67 | | $14.63 | |
| |
| Income (loss) from investment operations | | | | | | |
| |
| Net investment loss (d) | $(0.06 | ) | $(0.06 | ) | $(0.06 | ) |
| Net realized and unrealized gain (loss) on investments | | | | | | |
| and foreign currency | 1.23 | | 2.09 | | 0.10 | (g) |
| |
| Total from investment operations | $1.17 | | $2.03 | | $0.04 | |
| |
| Net asset value, end of period | $17.87 | | $16.70 | | $14.67 | |
| |
| Total return (%) (s)(r) | 7.01 | (n) | 13.84 | | 0.27 | (b)(n) |
| |
| Ratios (%) (to average net assets) | | | | | | |
| and Supplemental data: | | | | | | |
| |
| Expenses before expense reductions (f) | 1.88 | (a) | 1.82 | | 1.95 | (a) |
| Expenses after expense reductions (f) | 1.69 | (a) | 1.72 | | 1.90 | (a) |
| Net investment loss | (0.66 | )(a) | (0.48 | ) | (0.48 | )(a) |
| Portfolio turnover | 123 | | 184 | | 261 | |
| Net assets at end of period (000 Omitted) | $1,192 | | $774 | | $105 | |
| |
| See Notes to Financial Statements | | | | | | |
| | | | | | |
| | | | SEMIANNUAL REPORT 19 | |
| Financial Highlights – continued | | | | |
| | Six months | | Year | |
| | ended | | ended | |
| Class R4 | 2/28/06 | | 8/31/05(i) | |
| | (unaudited) | | | |
| Net asset value, beginning of period | $16.81 | | $15.85 | |
| |
| Income (loss) from investment operations | | | | |
| |
| Net investment loss (d) | $(0.04 | ) | $(0.03 | ) |
| Net realized and unrealized gain (loss) on investments | | | | |
| and foreign currency | 1.25 | | 0.99 | (g) |
| |
| Total from investment operations | $1.21 | | $0.96 | |
| |
| Net asset value, end of period | $18.02 | | $16.81 | |
| |
| Total return (%) (s)(r) | 7.20 | (n) | 6.06 | (n) |
| |
| Ratios (%) (to average net assets) | | | | |
| and Supplemental data: | | | | |
| |
| Expenses before expense reductions (f) | 1.53 | (a) | 1.56 | (a) |
| Expenses after expense reductions (f) | 1.43 | (a) | 1.46 | (a) |
| Net investment loss | (0.41 | )(a) | (0.41 | )(a) |
| Portfolio turnover | 123 | | 184 | |
| Net assets at end of period (000 Omitted) | $58 | | $53 | |
| |
| | Six months | | Year | |
| | ended | | ended | |
| Class R5 | 2/28/06 | | 8/31/05(i) | |
| | (unaudited) | | | |
| Net asset value, beginning of period | $16.83 | | $15.85 | |
| |
| Income (loss) from investment operations | | | | |
| |
| Net investment loss (d) | $(0.01 | ) | $(0.01 | ) |
| Net realized and unrealized gain (loss) on investments | | | | |
| and foreign currency | 1.25 | | 0.99 | (g) |
| |
| Total from investment operations | $1.24 | | $0.98 | |
| |
| Net asset value, end of period | $18.07 | | $16.83 | |
| |
| Total return (%) (s)(r) | 7.37 | (n) | 6.18 | (n) |
| |
| Ratios (%) (to average net assets) | | | | |
| and Supplemental data: | | | | |
| |
| Expenses before expense reductions (f) | 1.22 | (a) | 1.26 | (a) |
| Expenses after expense reductions (f) | 1.12 | (a) | 1.16 | (a) |
| Net investment loss | (0.11 | )(a) | (0.11 | )(a) |
| Portfolio turnover | 123 | | 184 | |
| Net assets at end of period (000 Omitted) | $57 | | $53 | |
| |
| See Notes to Financial Statements | | | | |
| | | | |
| 20 SEMIANNUAL REPORT | | | | |
Financial Highlights – continued
|
Any redemption fees charged by the fund during the 2004 and 2005 fiscal years resulted in a per share impact of less than $0.01.
| (i) | For the period from the class’ inception, December 31, 2002 (Class R), October 31, 2003 (Class R3) and April 1, 2005 (Classes R1, R2, R4, and R5) through the stated period end. |
| (r) | Certain expenses have been reduced without which performance would have been lower. |
| (a) | Annualized. |
| (n) | Not annualized. |
| (w) | Per share amount was less than $0.01. |
| (d) | Per share data are based on average shares outstanding. |
| (f) | Ratios do not reflect reductions from fees paid indirectly. |
| (g) | The per share amount is not in accordance with the net realized and unrealized gain/loss for the period because of the timing of sales of fund shares and the amount of per share realized and unrealized gains and losses at such time. |
| (e) | Ratio includes a reimbursement fee for expenses borne by MFS in prior years under the then existing expense reimbursement agreement. |
| (b) | The fund’s net asset value and total return calculation include a non-recurring accrual recorded as a result of an administrative proceeding regarding disclosure of brokerage allocation practices in connection with fund sales. The non-recurring accrual resulted in an increase in the net asset value of $0.01 per share based on shares outstanding on the day the proceeds were recorded. |
| (t) | Total returns do not include any applicable sales charges. |
| (s) | From time to time the fund may receive proceeds from litigation settlements, without which performance would be lower. |
| |
See Notes to Financial Statements
|
SEMIANNUAL REPORT 21
NOTES TO FINANCIAL STATEMENTS (unaudited)
| (1) Business and Organization |
MFS Core Growth Fund (the fund) is a series of MFS Series Trust I (the trust). The trust is organized as a Massachusetts business trust and is registered under the Investment Company Act of 1940, as amended, as an open-end management investment company.
| (2) Significant Accounting Policies |
General – The preparation of financial statements in conformity with U.S. generally accepted accounting principles requires management to make estimates and assumptions that affect the reported amounts of assets and liabilities, and disclosure of contingent assets and liabilities at the date of the financial statements and the reported amounts of revenues and expenses during the reporting period. Actual results could differ from those estimates. The fund can invest in foreign securities. Investments in foreign securities are vulnerable to the effects of changes in the relative values of the local currency and the U.S. dollar and to the effects of changes in each country’s legal, political, and economic environment.
Investment Valuations – Equity securities, including restricted equity securities, are generally valued at the last sale or official closing price as reported by an independent pricing service on the market or exchange on which they are primarily traded. For securities for which there were no sales during the day, equity securities are generally valued at the last quoted bid price as reported by an independent pricing service on the market or exchange on which they are primarily traded. Short-term instruments with a maturity at issuance of 365 days or less are generally valued at amortized cost, which approximates market value. Open-end investment companies are generally valued at their net asset value per share. Securities and other assets generally valued on the basis of information from an independent pricing service may also be valued on the basis of information from brokers and dealers. The values of foreign securities and other assets and liabilities expressed in foreign currencies are converted to U.S. dollars based upon exchange rates provided by an independent source. When pricing-service information or market quotations are not readily available, securities are priced at fair value as determined under the direction of the Board of Trustees. For example, in valuing securities that trade principally on foreign markets, events reasonably determined to be significant (such as certain movements in the U.S. securities market, or other regional and local developments) may occur between the time that foreign markets close (where the security is principally traded) and the fund’s valuation time that may impact the value of securities traded in these foreign markets. In these cases, the fund may utilize information from an external vendor or other sources to adjust closing market prices of foreign equity securities to reflect what it believes to be the fair value of the securities as of the fund’s valuation time. Fair valuation of foreign equity securities may occur frequently based on an assessment that events which occur on a fairly regular basis (such as U.S. market movements) are significant.
22 SEMIANNUAL REPORT
Notes to Financial Statements (unaudited) – continued
Repurchase Agreements – The fund may enter into repurchase agreements with institutions that the fund’s investment adviser has determined are creditworthy. Each repurchase agreement is recorded at cost. The fund requires that the securities collateral in a repurchase transaction be transferred to the custodian in a manner sufficient to enable the fund to obtain those securities in the event of a default under the repurchase agreement. The fund monitors, on a daily basis, the value of the collateral to ensure that its value, including accrued interest, is greater than amounts owed to the fund under each such repurchase agreement. The fund, along with other affiliated entities of Massachusetts Financial Services Company (MFS), may utilize a joint trading account for the purpose of entering into one or more repurchase agreements.
Foreign Currency Translation – Purchases and sales of foreign investments, income, and expenses are converted into U.S. dollars based upon currency exchange rates prevailing on the respective dates of such transactions. Gains and losses attributable to foreign currency exchange rates on sales of securities are recorded for financial statement purposes as net realized gains and losses on investments. Gains and losses attributable to foreign exchange rate movements on income and expenses are recorded for financial statement purposes as foreign currency transaction gains and losses. That portion of both realized and unrealized gains and losses on investments that results from fluctuations in foreign currency exchange rates is not separately disclosed.
Security Loans – State Street Bank and Trust Company (‘‘State Street’’), as lending agent, may loan the securities of the fund to certain qualified institutions (the ‘‘Borrowers’’) approved by the fund. The loans are collateralized at all times by cash and/or U.S. Treasury securities in an amount at least equal to the market value of the securities loaned. State Street provides the fund with indemnification against Borrower default. The fund bears the risk of loss with respect to the investment of cash collateral. On loans collateralized by cash, the cash collateral is invested in a money market fund or short-term securities. A portion of the income generated upon investment of the collateral is remitted to the Borrowers, and the remainder is allocated between the fund and the lending agent. On loans collateralized by U.S. Treasury securities, a fee is received from the Borrower, and is allocated between the fund and the lending agent. Income from securities lending is included in interest income on the Statement of Operations. The dividend and interest income earned on the securities loaned is accounted for in the same manner as other dividend and interest income.
Short Term Fees – For purchases made on or after July 1, 2004 and before April 1, 2005, the fund charged a 2% redemption fee (which was retained by the fund) on proceeds from Class A, Class B, Class C, and Class I shares redeemed or exchanged within 5 business days following their acquisition (either by purchase or exchange). Effective April 1, 2005, the fund no longer charges a redemption fee. See the fund’s prospectus for details. Any redemption fees charged are accounted for as an addition to paid-in capital.
SEMIANNUAL REPORT 23
Notes to Financial Statements (unaudited) – continued
Investment Transactions and Income – Investment transactions are recorded on the trade date. Interest income is recorded on the accrual basis. All premium and discount is amortized or accreted for financial statement purposes in accordance with U.S. generally accepted accounting principles. All discount is accreted for tax reporting purposes as required by federal income tax regulations. Dividends received in cash are recorded on the ex-dividend date. Certain dividends from foreign securities will be recorded when the fund is informed of the dividend if such information is obtained subsequent to the ex-dividend date. Dividend and interest payments received in additional securities are recorded on the ex-dividend or ex-interest date in an amount equal to the value of the security on such date.
The fund may receive proceeds from litigation settlements involving its portfolio holdings. Any proceeds received are reflected in realized gain/loss in the Statement of Operations, or in unrealized gain/loss if the security is still held by the fund.
Fees Paid Indirectly – The fund’s custody fee is reduced according to an arrangement that measures the value of cash deposited with the custodian by the fund. During the six months ended February 28, 2006, the fund’s custodian fees were reduced by $30,018 under this arrangement. The fund has entered into a commission recapture agreement, under which certain brokers will credit the fund a portion of the commissions generated, to offset certain expenses of the fund. For the six months ended February 28, 2006, the fund’s custodian expenses were reduced by $52,965 under this agreement. These amounts are shown as a reduction of total expenses on the Statement of Operations. Effective January 1, 2006, the commission recapture agreement was terminated.
Tax Matters and Distributions – The fund intends to continue to qualify as a regulated investment company, as defined under Subchapter M of the Internal Revenue Code, and to distribute all of its taxable income, including realized capital gains. Accordingly, no provision for federal income tax is required in the financial statements. Foreign taxes, if any, have been accrued by the fund in the accompanying financial statements.
Distributions to shareholders are recorded on the ex-dividend date. Income and capital gain distributions are determined in accordance with income tax regulations, which may differ from generally accepted accounting principles. Certain capital accounts in the financial statements are periodically adjusted for permanent differences in order to reflect their tax character. These adjustments have no impact on net assets or net asset value per share. Temporary differences which arise from recognizing certain items of income, expense, gain or loss in different periods for financial statement and tax purposes will reverse at some time in the future. Distributions in excess of net investment income or net realized gains are temporary overdistributions for financial statement purposes resulting from differences in the recognition or classification of income for financial statement and tax purposes. Book/tax differences primarily relate to foreign currency transactions, net operating
24 SEMIANNUAL REPORT
Notes to Financial Statements (unaudited) – continued
losses, capital loss carryforward assumed as a result of the acquisition, and wash sales.
The fund declared no distributions for the years ended August 31, 2005 and August 31, 2004.
The federal tax cost and the tax basis components of distributable earnings were as follows:
| As of February 28, 2006 | |
| Cost of investments (1) | $910,630,903 |
|
|
| Gross appreciation | $40,541,157 |
| Gross depreciation | (22,361,941) |
|
|
| Net unrealized appreciation (depreciation) | $18,179,216 |
| As of August 31, 2005 | |
| Capital loss carryforwards | $(316,413,027) |
| Unrealized appreciation (depreciation) | 41,899,671 |
| Other temporary differences | (513,093) |
| (1) Aggregate cost includes prior fiscal year end tax adjustments. | |
As of August 31, 2005, the fund had available capital loss carryforwards to offset future realized gains. Such losses expire as follows:
| August 31, 2008 | $(82,754,624) |
| August 31, 2009 | (161,321,462) |
| August 31, 2010 | (25,708,026) |
| August 31, 2011 | (46,628,915) |
|
|
| Total | $(316,413,027) |
The availabilty of a portion of the capital loss carryforwards, which were acquired on June 3, 2005 in connection with the MFS Large Cap Growth Fund merger, may be limited in a given year.
Multiple Classes of Shares of Beneficial Interest – The fund offers multiple classes of shares, which differ in their respective distribution and service fees. All shareholders bear the common expenses of the fund based on daily net assets of each class, without distinction between share classes. Dividends are declared separately for each class. Differences in per share dividend rates are generally due to differences in separate class expenses. Class B shares will convert to Class A shares approximately eight years after purchase.
| (3) Transactions with Affiliates |
Investment Adviser – The fund has an investment advisory agreement with MFS to provide overall investment advisory and administrative services, and general office facilities. The management fee is computed daily and paid monthly at an annual rate of 0.75% of the fund’s average daily net assets.
As part of a settlement agreement with the New York Attorney General concerning market timing and related matters, MFS has agreed to reduce the management fee to 0.65% of the fund’s average daily net assets for the period March 1, 2004 through February 28, 2009. For the six months ended
SEMIANNUAL REPORT 25
Notes to Financial Statements (unaudited) – continued
February 28, 2006, this waiver amounted to $456,985 and is reflected as a reduction of total expenses in the Statement of Operations.
The management fee incurred for the six months ended February 28, 2006 was equivalent to an annual effective rate of 0.65% of the fund’s average daily net assets.
Distributor – MFS Fund Distributors, Inc. (MFD), a wholly owned subsidiary of MFS, as distributor, received $22,368 for the six months ended February 28, 2006, as its portion of the initial sales charge on sales of Class A shares of the fund.
The Board of Trustees has adopted a distribution plan for certain class shares pursuant to Rule 12b-1 of the Investment Company Act of 1940.
The fund’s distribution plan provides that the fund will pay MFD for services provided by MFD and financial intermediaries in connection with the distribution and servicing of certain share classes. One component of the plan is a distribution fee paid to MFD and another component of the plan is a service fee paid to MFD. MFD may subsequently pay all, or a portion, of the distribution and/or service fees to financial intermediaries.
| Distribution Fee Plan Table: | | | | |
| | | | | Total | Annual | Distribution |
| | | Distribution | Service | Distribution | Effective | and Service |
| | | Fee Rate | Fee Rate | Plan(1) | Rate(2) | Fee |
| Class A | 0.10% | 0.25% | 0.35% | 0.35% | $1,092,368 |
| Class B | 0.75% | 0.25% | 1.00% | 1.00% | 986,164 |
| Class C | 0.75% | 0.25% | 1.00% | 1.00% | 404,845 |
| Class R | 0.25% | 0.25% | 0.50% | 0.50% | 15,282 |
| Class R1 | 0.50% | 0.25% | 0.75% | 0.75% | 639 |
| Class R2 | 0.25% | 0.25% | 0.50% | 0.50% | 1,398 |
| Class R3 | 0.25% | 0.25% | 0.50% | 0.50% | 2,783 |
| Class R4 | — | 0.25% | 0.25% | 0.25% | 69 |
|
|
|
|
|
|
|
| Total Distribution and Service Fees | | | | $2,503,548 |
| (1) | In accordance with the distribution plan for certain classes, the fund pays distribution and/or service fees up to these annual percentage rates of each class’ average daily net assets. |
| (2) | The annual effective rates represent actual fees incurred under the distribution plan for the six months ended February 28, 2006 based on each class’ average daily net assets. |
| |
Certain Class A and Class C shares are subject to a contingent deferred sales charge in the event of a shareholder redemption within 12 months of purchase. Class B shares are subject to a contingent deferred sales charge in the event of a shareholder redemption within six years of purchase. All contingent deferred sales charges are paid to MFD and during the six months ended February 28, 2006, were as follows:
| | Amount |
| Class A | $10,142 |
| Class B | $213,809 |
| Class C | $2,061 |
Shareholder Servicing Agent – The fund pays a portion of shareholder servicing costs to MFS Service Center, Inc. (MFSC), a wholly-owned subsidiary
Notes to Financial Statements (unaudited) – continued
of MFS. MFSC receives a fee from the fund, for its services as shareholder servicing agent, set periodically under the supervision of the fund’s Board of Trustees. For the six months ended February 28, 2006, the fee was $443,835, which equated to 0.0971% annually of the fund’s average daily net assets. MFSC also receives payment from the fund for out-of-pocket and sub-accounting expenses paid by MFSC on behalf of the fund. For the six months ended February 28, 2006, these costs amounted to $733,218.
Administrator – MFS provides certain financial, legal, shareholder communications, compliance, and other administrative services to certain funds for which MFS acts as investment adviser. Under an administrative services agreement, the funds may partially reimburse MFS the costs incurred to provide these services, subject to review and approval by the Board of Trustees. Each fund is charged a fixed amount plus a fee based on calendar year average net assets. Effective July 1, 2005, the fund’s annual fixed amount is $10,000.
The administrative services fee incurred for the six months ended February 28, 2006 was equivalent to an annual effective rate of 0.0101% of the fund’s average daily net assets.
In addition to the administrative services provided by MFS to the fund as described above, MFS is responsible for providing certain retirement plan administration and services with respect to certain shares. These services include various administrative, recordkeeping, and communication/educational services with respect to the retirement plans which invest in these shares, and may be provided directly by MFS or by a third party. MFS may subsequently pay all, or a portion, of the retirement plan administration and services fee to affiliated or unaffiliated third parties. For the six months ended February 28, 2006, the fund paid MFS an annual retirement plan administration and services fee up to the following annual percentage rates of each class’ average daily net assets:
| | | | Annual | |
| | | | Effective | Total |
| | | Fee Rate | Rate(1) | Amount |
| Class R1 | 0.45% | 0.36% | $383 |
| Class R2 | 0.40% | 0.27% | 1,116 |
| Class R3 | 0.25% | 0.16% | 1,393 |
| Class R4 | 0.15% | 0.15% | 41 |
| Class R5 | 0.10% | 0.10% | 27 |
|
|
|
|
|
| Total Retirement Plan Administration and Services Fees | | | $2,960 |
| (1) | Effective October 1, 2005, MFS has contractually agreed to waive a portion of the retirement plan administration and services fee equal to 0.10% for Class R1 shares, 0.15% for Class R2 shares, and 0.10% for Class R3 shares. This agreement will continue until at least September 30, 2007. For the six months ended February 28, 2006, this waiver amounted to $925 and is reflected as a reduction of total expenses in the Statement of Operations. |
| |
Trustees’ and Officers’ Compensation – The fund pays compensation to Independent Trustees in the form of a retainer, attendance fees, and additional compensation to Board and Committee chairpersons. The fund does not pay
SEMIANNUAL REPORT 27
Notes to Financial Statements (unaudited) – continued
compensation directly to Trustees who are officers of the investment adviser, or to officers of the fund, all of whom receive remuneration for their services to the fund from MFS. Certain officers and Trustees of the fund are officers or directors of MFS, MFD, and MFSC. The fund has an unfunded, defined benefit plan for retired Independent Trustees which resulted in a pension expense of $429. The fund also has an unfunded retirement benefit deferral plan for certain current Independent Trustees which resulted in an expense of $3,148. Both amounts are included in Independent trustees’ compensation for the six months ended February 28, 2006. The deferred liability for retirement benefits payable to retired Trustees and certain current Trustees amounted to $3,786 and $42,959, respectively, at February 28, 2006, and is included in payable for independent trustees’ compensation.
Other – This fund and certain other MFS funds (the funds) have entered into a services agreement (the Agreement) which provides for payment of fees by the funds to Tarantino LLC in return for the provision of services of an Independent Chief Compliance Officer (ICCO) for the funds. The ICCO is an officer of the funds and the sole member of Tarantino LLC. The funds can terminate the Agreement with Tarantino LLC at any time under the terms of the Agreement. For the six months ended February 28, 2006, the fee paid to Tarantino LLC was $4,053. MFS has agreed to reimburse the fund for a portion of the payments made by the funds to Tarantino LLC in the amount of $3,746, which is shown as a reduction of total expenses in the Statement of Operations. Additionally, MFS has agreed to bear all expenses associated with office space, other administrative support, and supplies provided to the ICCO.
Purchases and sales of investments, other than U.S. government securities, purchased option transactions, and short-term obligations, aggregated $1,091,689,673 and $1,175,383,216, respectively.
28 SEMIANNUAL REPORT
Notes to Financial Statements (unaudited) – continued
(5) Shares of Beneficial Interest
|
The fund’s Declaration of Trust permits the Trustees to issue an unlimited number of full and fractional shares of beneficial interest. Transactions in fund shares were as follows:
| | | Six months ended 2/28/06 | Year ended 8/31/05(i) |
| | | Shares | Amount | Shares | Amount |
| Shares sold | | | | |
| Class A | 3,704,287 | $64,824,161 | 6,045,043 | $96,257,424 |
| Class B | 483,663 | 8,183,818 | 824,699 | 12,849,738 |
| Class C | 252,173 | 4,247,156 | 733,441 | 11,311,540 |
| Class I | 21,860 | 394,908 | 36,183 | 585,957 |
| Class R | 42,597 | 751,440 | 216,408 | 3,447,630 |
| Class R1 | 6,643 | 110,441 | 5,484 | 84,854 |
| Class R2 | 32,502 | 556,480 | 26,881 | 437,516 |
| Class R3 | 36,427 | 619,442 | 42,062 | 697,441 |
| Class R4 | 63 | 1,111 | 3,154 | 50,000 |
| Class R5 | — | — | 3,154 | 50,000 |
|
|
|
|
|
|
| | | 4,580,215 | $79,688,957 | 7,936,509 | $125,772,100 |
| Shares issued in connection with | | | | |
| acquisition of MFS Large Cap Growth Fund | | | |
| Class A | | | 15,966,412 | $260,252,510 |
| Class B | | | 4,980,471 | 78,492,230 |
| Class I | | | 2,991 | 49,763 |
|
|
|
|
|
| | | | | 20,949,874 | $338,794,503 |
| Shares reacquired | | | | |
| Class A | (7,163,736) | $(125,465,520) | (11,909,431) | $(190,911,285) |
| Class B | (1,748,376) | (29,514,099) | (3,061,054) | (47,687,100) |
| Class C | (990,960) | (16,923,840) | (2,051,435) | (31,628,141) |
| Class I | (43,029) | (754,482) | (93,157) | (1,502,028) |
| Class R | (33,052) | (575,280) | (86,556) | (1,385,040) |
| Class R1 | (533) | (8,738) | (566) | (9,209) |
| Class R2 | (13,671) | (236,804) | (2) | (39) |
| Class R3 | (16,092) | (280,063) | (2,868) | (45,896) |
| Class R4 | — | — | — | — |
| Class R5 | — | — | — | — |
|
|
|
|
|
|
| | | (10,009,449) | $(173,758,826) | (17,205,069) | $(273,168,738) |
|
|
|
|
|
|
| | | | | SEMIANNUAL REPORT 29 |
| Notes to Financial Statements (unaudited) – continued | | |
| | | Six months ended 2/28/06 | Year ended 8/31/05(i) |
| | | Shares | Amount | Shares | Amount |
| Net change | | | | |
| Class A | (3,459,449) | $(60,641,359) | 10,102,024 | $165,598,649 |
| Class B | (1,264,713) | (21,330,281) | 2,744,116 | 43,654,868 |
| Class C | (738,787) | (12,676,684) | (1,317,994) | (20,316,601) |
| Class I | (21,169) | (359,574) | (53,983) | (866,308) |
| Class R | 9,545 | 176,160 | 129,852 | 2,062,590 |
| Class R1 | 6,110 | 101,703 | 4,918 | 75,645 |
| Class R2 | 18,831 | 319,676 | 26,879 | 437,477 |
| Class R3 | 20,335 | 339,379 | 39,194 | 651,545 |
| Class R4 | 63 | 1,111 | 3,154 | 50,000 |
| Class R5 | — | — | 3,154 | 50,000 |
|
|
|
|
|
|
| | | (5,429,234) | $(94,069,869) | 11,681,314 | $191,397,865 |
| ((i) | For the period from the class’ inception, April 1, 2005 (Classes R1, R2, R4, and R5) through the stated period end. |
| |
The fund and other affiliated funds participate in a $1 billion unsecured line of credit provided by a syndication of banks under a credit agreement. Borrowings may be made for temporary financing needs. Interest is charged to each fund, based on its borrowings, at a rate equal to the Federal Reserve funds rate plus 0.35% . In addition, a commitment fee, based on the average daily, unused portion of the line of credit, is allocated among the participating funds at the end of each calendar quarter. The commitment fee allocated to the fund for the six months ended February 28, 2006 was $2,906, and is included in miscellaneous expense on the Statement of Operations. The fund had no significant borrowings during the six months ended February 28, 2006.
On June 6, 2005, the fund acquired all of the assets and liabilities of MFS Large Cap Growth Fund. The acquisition was accomplished by a tax-free exchange of 20,949,874 shares of the fund for the net assets of MFS Large Cap Growth Fund as of the close of business on June 3, 2005. MFS Large Cap Growth Fund’s net assets on June 3, 2005 were $338,794,503, including $39,750,917 of unrealized appreciation, $1,382,225 of accumulated net investment loss, and $300,727,128 of accumulated net realized loss on investments and foreign currency transactions. The aggregate net assets of the fund after the acquisition were $960,823,462.
30 SEMIANNUAL REPORT
BOARD REVIEW OF INVESTMENT ADVISORY AGREEMENT
A discussion regarding the Board’s most recent review and renewal of the Fund’s investment advisory agreement is available by clicking on the fund’s name under ‘‘Select a fund’’ on the MFS Web site (mfs.com).
PROXY VOTING POLICIES AND INFORMATION
A general description of the MFS funds’ proxy voting policies and procedures is available without charge, upon request, by calling 1-800-225-2606, by visiting the Proxy Voting section of mfs.com or by visiting the SEC’s Web site at http://www.sec.gov.
Information regarding how the fund voted proxies relating to portfolio securities during the most recent twelve-month period ended June 30 is available without charge by visiting the Proxy Voting section of mfs.com or by visiting the SEC’s Web site at http://www.sec.gov.
| QUARTERLY PORTFOLIO DISCLOSURE |
The trust will file a complete schedule of portfolio holdings with the Securities and Exchange Commission (the Commission) for the first and third quarters of each fiscal year on Form N-Q. The trust’s Form N-Q may be reviewed and copied at the:
Public Reference Room
Securities and Exchange Commission
Washington, D.C. 20549-0102
Information on the operation of the Public Reference Room may be obtained by calling the Commission at 1-800-SEC-0330. The trust’s Form N-Q is available on the EDGAR database on the Commission’s Internet Web site at http://www.sec.gov, and copies of this information may be obtained, upon payment of a duplicating fee, by electronic request at the following e-mail address: publicinfo@sec.gov or by writing the Public Reference Section at the above address.
A shareholder can also obtain the quarterly portfolio holdings report at mfs.com.
SEMIANNUAL REPORT 31
LETTER FROM THE CEO

Dear Shareholders,
It has been said that change is the only constant in life. As investors have seen, that theme is still accurate today as we recently have experienced shifting economic cycles because of natural disasters and political instability around the globe.
Markets worldwide have fluctuated in the past year as devastating hurricanes had a dramatic effect on the international economy, particularly on oil prices. We witnessed political unrest in the Middle East, highlighted by instability in Iraq, and in Africa, the usually stable Nigeria also experienced violence. As a result, energy prices have bounced up and down, with crude oil prices at one point topping a record $70 per barrel.
Such cycles are not uncommon and in fact have almost become the norm in our everyday lives. What does all of this mean to you as an investor? In times like these, it helps to know that you’re working with a seasoned investment professional who has experience to guide you through difficult times. At MFS®, we believe our investment management team has the knowledge and confidence to navigate through difficult cycles and at the same time see through adversity to find investment opportunities for our clients and shareholders.
Our investment management process, honed over 80 years, combines a unique concept of teamwork with our unwavering focus on the long term. We firmly believe that the best way to realize long-term financial goals – be it a college education, a comfortable retirement, or a secure family legacy – is to follow a three-pronged approach that focuses on longer time horizons. Allocate holdings across the major asset classes – including stocks, bonds, and cash. Diversify within each class to take advantage of different market segments and investing styles. Rebalance assets regularly to maintain a desired asset allocation. Of course, these strategies cannot guarantee a profit or protect against a loss. This long-term approach requires diligence and patience, two traits that in our experience are essential to capitalizing on the many opportunities the financial markets can offer – through both up and down economic cycles.
Respectfully,

Robert J. Manning
Chief Executive Officer and Chief Investment Officer
MFS Investment Management®
April 17, 2006
The opinions expressed in this letter are those of MFS, and no forecasts can be guaranteed.
SEMIANNUAL REPORT 1
PORTFOLIO COMPOSITION
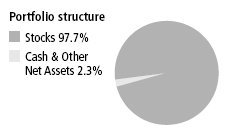
| Top ten holdings | | |
| Samsung Electronics Co. Ltd. | | 3.5% |
|
| TOTAL S.A. | | 3.0% |
|
| GlaxoSmithKline PLC | | 2.2% |
|
| Nestle S.A. | | 2.2% |
|
| Roche Holding AG | | 2.1% |
|
| UBS AG | | 1.9% |
|
| Tesco PLC | | 1.9% |
|
| Royal Bank of Scotland Group PLC | | 1.7% |
|
| AXA | | 1.6% |
|
| BNP Paribas | | 1.6% |
|
| Equity sectors | | |
| Financial Services | | 28.4% |
|
| Basic Materials | | 14.6% |
|
| Utilities & Communications | | 9.1% |
|
| Energy | | 8.4% |
|
| Technology | | 8.2% |
|
| Autos & Housing | | 6.8% |
|
| Health Care | | 6.8% |
|
| Consumer Staples | | 5.8% |
|
| Retailing | | 5.1% |
|
| Leisure | | 3.5% |
|
| Transportation | | 1.0% |
|
Country weightings | | |
| Great Britain | | 18.8% |
|
| Japan | | 16.9% |
|
| France | | 12.9% |
|
| Switzerland | | 8.1% |
|
| South Korea | | 7.0% |
|
| Italy | | 4.6% |
|
| Brazil | | 4.5% |
|
| Germany | | 4.4% |
|
| Mexico | | 3.1% |
|
| Other Countries | | 19.7% |
|
Percentages are based on net assets as of 2/28/06.
The portfolio is actively managed, and current holdings may be different.
2 SEMIANNUAL REPORT
EXPENSE TABLE
Fund Expenses Borne by the Shareholders During the Period,
September 1, 2005 through February 28, 2006.
As a shareholder of the fund, you incur two types of costs: (1) transaction costs, including sales charges (loads) on certain purchase or redemption payments and redemption fees on certain exchanges and redemptions, and (2) ongoing costs, including management fees; distribution and service (12b-1) fees; and other fund expenses. This example is intended to help you understand your ongoing costs (in dollars) of investing in the fund and to compare these costs with the ongoing costs of investing in other mutual funds.
The example is based on an investment of $1,000 invested at the beginning of the period and held for the entire period September 1, 2005 through February 28, 2006.
Actual Expenses
The first line for each share class in the following table provides information about actual account values and actual expenses. You may use the information in this line, together with the amount you invested, to estimate the expenses that you paid over the period. Simply divide your account value by $1,000 (for example, an $8,600 account value divided by $1,000 = 8.6), then multiply the result by the number in the first line under the heading entitled ‘‘Expenses Paid During Period’’ to estimate the expenses you paid on your account during this period.
Hypothetical Example for Comparison Purposes
The second line for each share class in the following table provides information about hypothetical account values and hypothetical expenses based on the fund’s actual expense ratio and an assumed rate of return of 5% per year before expenses, which is not the fund’s actual return. The hypothetical account values and expenses may not be used to estimate the actual ending account balance or expenses you paid for the period. You may use this information to compare the ongoing costs of investing in the fund and other funds. To do so, compare this 5% hypothetical example with the 5% hypothetical examples that appear in the shareholder reports of the other funds.
Please note that the expenses shown in the table are meant to highlight your ongoing costs only and do not reflect any transactional costs, such as sales charges (loads) or redemption fees. Therefore, the second line for each share class in the table is useful in comparing ongoing costs only, and will not help you determine the relative total costs of owning different funds. In addition, if these transactional costs were included, your costs would have been higher.
SEMIANNUAL REPORT 3
Expense Table – continued
| | | | | | | | | | | Expenses |
| | | | | Annualized | | Beginning | | Ending | | Paid During |
| | | | | Expense | | Account Value | | Account Value | | Period (p) |
| Share Class | | | | Ratio | | 9/01/05 | | 2/28/06 | | 9/01/05-2/28/06 |
|
A
| | Actual | | 1.50% | | $1,000.00 | | $1,190.10 | | $ 8.15 |
|
|
| | Hypothetical (h) | | 1.50% | | $1,000.00 | | $1,017.36 | | $ 7.50 |
|
B
| | Actual | | 2.14% | | $1,000.00 | | $1,186.30 | | $11.60 |
|
|
| | Hypothetical (h) | | 2.14% | | $1,000.00 | | $1,014.18 | | $10.69 |
|
C
| | Actual | | 2.15% | | $1,000.00 | | $1,186.20 | | $11.65 |
|
|
| | Hypothetical (h) | | 2.15% | | $1,000.00 | | $1,014.13 | | $10.74 |
|
I
| | Actual | | 1.15% | | $1,000.00 | | $1,191.50 | | $ 6.25 |
|
|
| | Hypothetical (h) | | 1.15% | | $1,000.00 | | $1,019.09 | | $ 5.76 |
|
R
| | Actual | | 1.65% | | $1,000.00 | | $1,188.90 | | $ 8.95 |
|
|
| | Hypothetical (h) | | 1.65% | | $1,000.00 | | $1,016.61 | | $ 8.25 |
|
R1
| | Actual | | 2.27% | | $1,000.00 | | $1,184.80 | | $12.30 |
|
|
| | Hypothetical (h) | | 2.27% | | $1,000.00 | | $1,013.54 | | $11.33 |
|
R2
| | Actual | | 1.92% | | $1,000.00 | | $1,187.30 | | $10.41 |
|
|
| | Hypothetical (h) | | 1.92% | | $1,000.00 | | $1,015.27 | | $ 9.59 |
|
R3
| | Actual | | 1.83% | | $1,000.00 | | $1,188.30 | | $ 9.93 |
|
|
| | Hypothetical (h) | | 1.83% | | $1,000.00 | | $1,015.72 | | $ 9.15 |
|
R4
| | Actual | | 1.55% | | $1,000.00 | | $1,189.40 | | $ 8.41 |
|
|
| | Hypothetical (h) | | 1.55% | | $1,000.00 | | $1,017.11 | | $ 7.75 |
|
R5
| | Actual | | 1.25% | | $1,000.00 | | $1,191.20 | | $ 6.79 |
|
|
| | Hypothetical (h) | | 1.25% | | $1,000.00 | | $1,018.60 | | $ 6.26 |
|
529A
| | Actual | | 1.75% | | $1,000.00 | | $1,188.30 | | $ 9.50 |
|
|
| | Hypothetical (h) | | 1.75% | | $1,000.00 | | $1,016.12 | | $ 8.75 |
|
529B
| | Actual | | 2.40% | | $1,000.00 | | $1,184.70 | | $13.00 |
|
|
| | Hypothetical (h) | | 2.40% | | $1,000.00 | | $1,012.89 | | $11.98 |
|
529C
| | Actual | | 2.39% | | $1,000.00 | | $1,183.80 | | $12.94 |
|
|
| | Hypothetical (h) | | 2.39% | | $1,000.00 | | $1,012.94 | | $11.93 |
|
| (h) | 5% class return per year before expenses. |
| (p) | Expenses paid is equal to each class’ annualized expense ratio, as shown above, multiplied by the average account value over the period, multiplied by the number of days in the period, divided by the number of days in the year. Expenses paid do not include any applicable sales charges (loads) or redemption fees. If these transaction costs had been included, your costs would have been higher. |
Effective October 1, 2005 the fund’s Class R1, Class R2, and Class R3 retirement plan administration and services fees were reduced (as described in Note 3 of the Notes to the Financial Statements). Had this fee reduction been in effect throughout the entire six month period, the annualized expense ratio would have been 2.25%, 1.90%, and 1.81% for Class R1, Class R2, and Class R3, respectively, and the actual expenses paid during the period would have been approximately $12.19, $10.31, and $9.82 for Class R1, Class R2, and Class R3, respectively.
4 SEMIANNUAL REPORT
| PORTFOLIO OF INVESTMENTS (unaudited) – 2/28/06 | | | | | |
The Portfolio of Investments is a complete list of all securities owned by your fund. | | | |
| It is categorized by broad-based asset classes. | | | | | |
Stocks - 97.7% | | | | | |
|
| Issuer | | Shares/Par | | | Value ($) |
|
| Airlines - 0.4% | | | | | |
|
| Grupo Aeroportuario del Pacifico S.A. de C.V., ADR (n) | | 58,160 | | $ | 1,675,008 |
| Grupo Aeroportuario del Sureste S.A. de C.V., ADR (l) | | 274,520 | | | 9,262,305 |
| |
|
| | | | | $ | 10,937,313 |
|
| Alcoholic Beverages - 1.3% | | | | | |
|
| Diageo PLC | | 2,352,980 | | $ | 36,193,844 |
|
| Apparel Manufacturers - 1.0% | | | | | |
|
| Burberry Group PLC | | 2,495,120 | | $ | 20,088,298 |
| LVMH Moet Hennessy Louis Vuitton S.A. | | 89,700 | | | 8,163,773 |
| |
|
| | | | | $ | 28,252,071 |
|
| Automotive - 4.2% | | | | | |
|
| Bayerische Motoren Werke AG | | 570,390 | | $ | 27,464,165 |
| Compagnie Generale des Etablissements Michelin (l) | | 45,150 | | | 2,759,220 |
| Continental AG | | 157,026 | | | 16,092,409 |
| Hyundai Mobis | | 247,620 | | | 20,823,714 |
| Nissan Motor Co. Ltd. (l) | | 2,347,300 | | | 27,051,562 |
| Toyota Motor Corp. | | 375,400 | | | 20,097,897 |
| |
|
| | | | | $ | 114,288,967 |
|
| Banks & Credit Companies - 22.5% | | | | | |
|
| AEON Credit Service Co. Ltd. (l) | | 545,200 | | $ | 15,453,321 |
| Aiful Corp. | | 330,300 | | | 22,214,867 |
| Akbank T.A.S. | | 1,582,510 | | | 16,053,214 |
| Banco Bilbao Vizcaya Argentaria S.A. | | 2,113,950 | | | 43,096,419 |
| Banco Nossa Caixa S.A. | | 218,690 | | | 4,940,030 |
| Bank of Cyprus Public Co. Ltd. | | 989,420 | | | 8,455,754 |
| BNP Paribas (l) | | 476,130 | | | 44,129,155 |
| Credit Agricole S.A. (l) | | 874,331 | | | 31,996,806 |
| DEPFA Bank PLC (l) | | 680,120 | | | 11,308,247 |
| Erste Bank der oesterreichischen Sparkassen AG | | 385,430 | | | 23,462,501 |
| Erste Bank der oesterreichischen Sparkassen AG (n) | | 50,158 | | | 3,001,810 |
| Hana Financial, Inc. | | 280,600 | | | 11,931,801 |
| HSBC Holdings PLC | | 2,080,716 | | | 35,586,407 |
| Mitsubishi Tokyo Financial Group, Inc. | | 1,424 | | | 21,775,379 |
| ORIX Corp. (l) | | 163,700 | | | 42,836,634 |
| OTP Bank Ltd., GDR | | 326,140 | | | 24,427,886 |
| Royal Bank of Scotland Group PLC | | 1,371,511 | | | 45,974,562 |
| Shinhan Financial Group Co. Ltd. | | 707,420 | | | 27,866,957 |
| Shinsei Bank Ltd. | | 3,867,000 | | | 26,121,659 |
| | |
SEMIANNUAL REPORT 5 |
| Portfolio of Investments (unaudited) – continued | | | | | |
Issuer | | Shares/Par | | | Value ($) |
|
| Stocks - continued | | | | | |
|
| Banks & Credit Companies - continued | | | | | |
|
| Sumitomo Mitsui Financial Group, Inc. (l) | | 1,623 | | $ | 17,651,541 |
| Takefuji Corp. | | 351,150 | | | 22,577,461 |
| Turkiye Vakiflar Bankasi T.A.O. (n) | | 2,370,560 | | | 15,616,857 |
| UBS AG (l) | | 492,791 | | | 52,401,364 |
| Unibanco - Uniao de Bancos Brasileiros S.A., ADR | | 117,340 | | | 10,320,053 |
| UniCredito Italiano S.p.A. (l) | | 4,240,380 | | | 30,899,329 |
| |
|
| | | | | $ | 610,100,014 |
|
| Broadcast & Cable TV - 2.8% | | | | | |
|
| Grupo Televisa S.A., ADR | | 316,480 | | $ | 24,831,021 |
| Nippon Television Network Corp. | | 80,440 | | | 11,742,607 |
| WPP Group PLC | | 3,507,100 | | | 40,798,707 |
| |
|
| | | | | $ | 77,372,335 |
|
| Brokerage & Asset Managers - 0.2% | | | | | |
|
| Singapore Exchange Ltd. | | 2,702,000 | | $ | 6,324,776 |
|
| Chemicals - 1.3% | | | | | |
|
| Hanwha Chemical Corp. (n) | | 624,970 | | $ | 8,542,868 |
| Syngenta AG | | 189,154 | | | 26,741,466 |
| |
|
| | | | | $ | 35,284,334 |
|
| Computer Software - Systems - 0.6% | | | | | |
|
| Capgemini S.A. (l) | | 352,890 | | $ | 17,459,126 |
|
| Conglomerates - 0.8% | | | | | |
|
| Siemens AG (l) | | 223,810 | | $ | 20,569,741 |
|
| Construction - 2.6% | | | | | |
|
| CEMEX S.A. de C.V., ADR | | 426,500 | | $ | 26,340,640 |
| Consorcio ARA S.A. de C.V. | | 1,155,340 | | | 4,915,024 |
| Geberit AG | | 14,890 | | | 13,537,397 |
| Italcementi S.p.A. | | 916,810 | | | 13,087,875 |
| Italcementi S.p.A. - Ordinary (l) | | 442,760 | | | 9,079,254 |
| Urbi Desarrollos Urbanos S.A. de C.V. (n) | | 483,440 | | | 3,706,575 |
| |
|
| | | | | $ | 70,666,765 |
|
| Consumer Goods & Services - 1.7% | | | | | |
|
| Natura Cosmeticos S.A. | | 60,240 | | $ | 3,517,664 |
| Reckitt Benckiser PLC | | 808,730 | | | 28,827,831 |
| Uni-Charm Corp. (l) | | 275,200 | | | 13,726,256 |
| |
|
| | | | | $ | 46,071,751 |
|
| Electrical Equipment - 1.3% | | | | | |
|
| Schneider Electric S.A. (l) | | 332,553 | | $ | 34,037,183 |
|
6 SEMIANNUAL REPORT | | | | | |
| Portfolio of Investments (unaudited) – continued | | | | | |
Issuer | | Shares/Par | | | Value ($) |
|
| Stocks - continued | | | | | |
|
| Electronics - 7.3% | | | | | |
|
| Konica Minolta Holdings, Inc. | | 950,500 | | $ | 11,853,113 |
| Nippon Electric Glass Co. Ltd. (l) | | 451,000 | | | 10,849,929 |
| Ricoh Co. Ltd. | | 600,000 | | | 11,128,850 |
| Royal Philips Electronics N.V. | | 1,125,890 | | | 36,714,301 |
| Samsung Electronics Co. Ltd. | | 137,100 | | | 96,084,743 |
| Taiwan Semiconductor Manufacturing Co. Ltd. | | 17,536,000 | | | 32,679,192 |
| |
|
| | | | | $ | 199,310,128 |
|
| Energy - Independent - 2.1% | | | | | |
|
| Canadian Natural Resources Ltd. | | 121,190 | | $ | 6,617,437 |
| CNOOC Ltd. | | 34,098,500 | | | 28,331,086 |
| Norsk Hydro A.S.A. (l) | | 177,480 | | | 20,763,361 |
| |
|
| | | | | $ | 55,711,884 |
|
| Energy - Integrated - 5.7% | | | | | |
|
| BG Group PLC | | 1,473,270 | | $ | 17,268,157 |
| LUKOIL, ADR (l) | | 172,690 | | | 13,797,931 |
| Petroleo Brasileiro S.A., ADR | | 146,560 | | | 12,829,862 |
| Statoil A.S.A. (l) | | 1,185,390 | | | 30,250,757 |
| TOTAL S.A. (l) | | 324,300 | | | 81,674,787 |
| |
|
| | | | | $ | 155,821,494 |
|
| Food & Drug Stores - 2.1% | | | | | |
|
| Sundrug Co. Ltd. (l) | | 130,900 | | $ | 6,645,301 |
| Tesco PLC | | 8,652,969 | | | 51,356,358 |
| |
|
| | | | | $ | 58,001,659 |
|
| Food & Non-Alcoholic Beverages - 2.5% | | | | | |
|
| Nestle S.A. | | 198,567 | | $ | 58,471,161 |
| Nong Shim Co. Ltd. | | 27,480 | | | 8,074,556 |
| |
|
| | | | | $ | 66,545,717 |
|
| Forest & Paper Products - 1.3% | | | | | |
|
| Aracruz Celulose S.A., ADR (l) | | 468,880 | | $ | 23,045,452 |
| Votorantim Celulose e Papel S.A., ADR | | 851,373 | | | 12,566,265 |
| |
|
| | | | | $ | 35,611,717 |
|
| Insurance - 4.7% | | | | | |
|
| Assicurazioni Generali S.p.A. (l) | | 1,135,450 | | $ | 40,780,149 |
| Aviva PLC | | 3,029,740 | | | 41,975,390 |
| AXA (l) | | 1,251,750 | | | 44,284,771 |
| |
|
| | | | | $ | 127,040,310 |
|
| Internet - 0.1% | | | | | |
|
| Universo Online S.A., IPS (n) | | 372,100 | | $ | 2,751,104 |
|
| Leisure & Toys - 0.7% | | | | | |
|
| Nintendo Co. Ltd. (l) | | 123,200 | | $ | 18,196,016 |
|
| | |
SEMIANNUAL REPORT 7 |
| Portfolio of Investments (unaudited) – continued | | | | | |
Issuer | | Shares/Par | | | Value ($) |
|
| Stocks - continued | | | | | |
|
| Machinery & Tools - 0.5% | | | | | |
|
| Fanuc Ltd. | | 151,700 | | $ | 12,791,624 |
|
| Metals & Mining - 7.0% | | | | | |
|
| Aber Diamond Corp. | | 142,510 | | $ | 5,376,554 |
| Aluminum Corp. of China Ltd. | | 12,186,000 | | | 12,487,024 |
| Arcelor S.A. (l) | | 1,014,030 | | | 37,109,197 |
| BHP Billiton PLC | | 2,552,100 | | | 43,021,078 |
| Companhia Siderurgica Nacional S.A., ADR (l) | | 487,650 | | | 14,371,046 |
| Companhia Vale do Rio Doce, ADR | | 844,560 | | | 39,212,921 |
| POSCO | | 70,330 | | | 16,536,035 |
| Ternium S.A., ADR (n) | | 308,010 | | | 7,253,636 |
| Umicore | | 110,300 | | | 15,706,324 |
| |
|
| | | | | $ | 191,073,815 |
|
| Natural Gas - Distribution - 0.5% | | | | | |
|
| Tokyo Gas Co. Ltd. (l) | | 2,992,390 | | $ | 13,608,421 |
|
| Network & Telecom - 0.2% | | | | | |
|
| TomTom N.V. (n) | | 209,140 | | $ | 6,465,401 |
|
| Oil Services - 0.6% | | | | | |
|
| Saipem S.p.A. | | 381,950 | | $ | 8,124,054 |
| Vallourec S.A. (l) | | 9,430 | | | 7,389,329 |
| |
|
| | | | | $ | 15,513,383 |
|
| Pharmaceuticals - 6.8% | | | | | |
|
| Astellas Pharma, Inc. | | 866,200 | | $ | 33,389,884 |
| AstraZeneca PLC | | 728,820 | | | 33,721,996 |
| GlaxoSmithKline PLC | | 2,329,640 | | | 59,152,006 |
| Roche Holding AG (l) | | 393,410 | | | 58,230,686 |
| |
|
| | | | | $ | 184,494,572 |
|
| Real Estate - 1.0% | | | | | |
|
| K.K. DaVinci Advisors (n) | | 19,740 | | $ | 27,078,429 |
| Leopalace21 Corp. | | 1,500 | | | 53,616 |
| |
|
| | | | | $ | 27,132,045 |
|
| Specialty Chemicals - 2.4% | | | | | |
|
| Asahi Glass Co. Ltd. (l) | | 2,012,000 | | $ | 28,314,562 |
| Kaneka Corp. (l) | | 1,999,000 | | | 26,329,837 |
| Lonza Group AG | | 148,220 | | | 9,634,300 |
| |
|
| | | | | $ | 64,278,699 |
|
8 SEMIANNUAL REPORT | | | | | |
| Portfolio of Investments (unaudited) – continued | | | | | | | |
Issuer | | | | Shares/Par | | | Value ($) |
|
| Stocks - continued | | | | | | | |
|
| Specialty Stores - 2.0% | | | | | | | |
|
| Grupo Elektra S.A. de C.V. | | | | 883,710 | | $ | 10,053,391 |
| NEXT PLC | | | | 963,040 | | | 27,902,341 |
| Yamada Denki Co. Ltd. (l) | | | | 152,300 | | | 16,285,485 |
| |
|
| | | | | | | $ | 54,241,217 |
|
| Telecommunications - Wireless - 1.6% | | | | | | | |
|
| America Movil S.A. de C.V., ‘‘L’’, ADR | | | | 164,510 | | $ | 5,713,432 |
| PT Indosat Tbk. | | | | 12,569,000 | | | 7,186,197 |
| Vodafone Group PLC | | | | 16,030,160 | | | 30,681,510 |
| |
|
| | | | | | | $ | 43,581,139 |
|
| Telephone Services - 3.8% | | | | | | | |
|
| FastWeb S.p.A. (l)(n) | | | | 502,275 | | $ | 24,268,374 |
| Singapore Telecommunications Ltd. | | | | 14,218,000 | | | 22,802,326 |
| Telefonica S.A. | | | | 2,172,521 | | | 33,554,971 |
| Telenor A.S.A. | | | | 2,041,880 | | | 22,115,646 |
| |
|
| | | | | | | $ | 102,741,317 |
|
| Tobacco - 0.3% | | | | | | | |
|
| Swedish Match AB (l) | | | | 583,910 | | $ | 7,827,558 |
|
| Trucking - 0.6% | | | | | | | |
|
| TNT N.V. | | | | 482,180 | | $ | 15,717,718 |
|
| Utilities - Electric Power - 3.2% | | | | | | | |
|
| E.ON AG (l) | | | | 396,380 | | $ | 43,948,019 |
| Suez S.A. (l) | | | | 1,144,158 | | | 42,185,434 |
| |
|
| | | | | | | $ | 86,133,453 |
|
| Total Stocks (Identified Cost, $2,158,022,733) | | | | | | $2,652,148,611 |
|
| Warrants - 0% | | | | | | | |
|
| Strike | | First | | | | | |
| Price | | Exercise | | | | | |
|
| Syngenta AG (n) (identified Cost, $117,304) CHF 234 | | 5/23/06 | | 188,354 | | $ | 232,926 |
|
| Short-Term Obligations - 1.9% | | | | | | | |
|
| Abbey National North America LLC, 4.56%, due 3/01/06, | | | | | | | |
| at Amortized Cost and Value (y) | | $ | | 49,627,000 | | $ | 49,627,000 |
|
| | | | |
SEMIANNUAL REPORT 9 |
| Portfolio of Investments (unaudited) – continued | | | | |
Collateral for Securities Loaned - 20.4% | | | | |
|
| Issuer | | Shares/Par | | Value ($) |
|
| Navigator Securities Lending Prime Portfolio, at Cost and | | | | |
| Net Asset Value | | 554,047,225 | | $ | | 554,047,225 |
|
| Total Investments (Identified Cost, $2,761,814,262) (k) | | | | $ | | 3,256,055,762 |
|
| Other Assets, Less Liabilities - (20.0)% | | | | (541,854,025) |
|
| Net Assets - 100.0% | | | | $ | | 2,714,201,737 |
|
| (n) | | Non-income producing security. |
| (l) | | All or a portion of this security is on loan. |
| (y) | | The rate shown represents an annualized yield at time of purchase. |
| (k) | | As of February 28, 2006, the fund had 37 securities that were fair valued, aggregating $597,374,322 and |
| | | 22.0% of net assets in accordance with the policies adopted by the Board of Trustees. |
The following abbreviations are used in the Portfolio of Investments and are defined: |
| ADR | | American Depository Receipt |
| GDR | | Global Depository Receipt |
| IPS | | | | International Preference Stock |
Abbreviations indicate amounts shown in currencies other than the U.S. Dollar. All amounts are stated in U.S. |
| dollars unless otherwise indicated. A list of abbreviations is shown below. |
| CHF | | | | Swiss Franc |
See Notes to Financial Statements |
10 SEMIANNUAL REPORT
| FINANCIAL STATEMENTS | Statement of Assets and Liabilities (unaudited) | |
This statement represents your fund’s balance sheet, which details the assets | |
| and liabilities composing the total value of the fund. | | | |
At 2/28/06 | | | |
Assets | | | |
|
| Investments, at value, including $528,033,434 of securities on | | | |
| loan (identified cost, $2,761,814,262) | | $3,256,055,762 | |
| Cash | | 799 | |
| Foreign currency, at value (identified cost, $671,133) | | 690,813 | |
| Receivable for investments sold | | 41,468,614 | |
| Receivable for fund shares sold | | 11,354,376 | |
| Interest and dividends receivable | | 3,459,812 | |
| Other assets | | 17 | |
|
| Total assets | | | $3,313,030,193 |
|
| Liabilities | | | |
|
| Payable for investments purchased | | $39,863,442 | |
| Payable for fund shares reacquired | | 3,898,444 | |
| Collateral for securities loaned, at value | | 554,047,225 | |
| Payable to affiliates | | | |
| Management fee | | 60,532 | |
| Shareholder servicing costs | | 216,210 | |
| Distribution and service fees | | 20,393 | |
| Administrative services fee | | 793 | |
| Program manager fees | | 12 | |
| Retirement plan administration and services fees | | 313 | |
| Payable for independent trustees’ compensation | | 33,704 | |
| Accrued expenses and other liabilities | | 687,388 | |
|
| Total liabilities | | | $598,828,456 |
|
| Net assets | | | $2,714,201,737 |
|
| Net assets consist of: | | | |
|
| Paid-in capital | | $2,107,691,249 | |
| Unrealized appreciation (depreciation) on investments and | | | |
| translation of assets and liabilities in foreign currencies | | 494,283,227 | |
| Accumulated net realized gain (loss) on investments and | | | |
| foreign currency transactions | | 118,559,053 | |
| Accumulated distributions in excess of net investment income | | (6,331,792) | |
|
| Net assets | | | $2,714,201,737 |
|
| Shares of beneficial interest outstanding | | | 148,622,800 |
|
| | |
SEMIANNUAL REPORT 11 |
| Statement of Assets and Liabilities (unaudited) – continued | | | | |
Class A shares | | | | |
|
| Net assets | | $1,121,767,413 | | |
| Shares outstanding | | 61,684,863 | | |
|
| Net asset value per share | | | | $18.19 |
|
| Offering price per share (100/94.25 x net asset value per share) | | | | $19.30 |
|
| Class B shares�� | | | | |
|
| Net assets | | $173,043,076 | | |
| Shares outstanding | | 9,894,546 | | |
|
| Net asset value and offering price per share | | | | $17.49 |
|
| Class C shares | | | | |
|
| Net assets | | $139,718,590 | | |
| Shares outstanding | | 8,017,047 | | |
|
| Net asset value and offering price per share | | | | $17.43 |
|
| Class I shares | | | | |
|
| Net assets | | $1,111,946,155 | | |
| Shares outstanding | | 59,772,358 | | |
|
| Net asset value, offering price, and redemption price per share | | | | $18.60 |
|
| Class R shares | | | | |
|
| Net assets | | $59,624,667 | | |
| Shares outstanding | | 3,301,076 | | |
|
| Net asset value, offering price, and redemption price per share | | | | $18.06 |
|
| Class R1 shares | | | | |
|
| Net assets | | $566,538 | | |
| Shares outstanding | | 32,615 | | |
|
| Net asset value, offering price, and redemption price per share | | | | $17.37 |
|
| Class R2 shares | | | | |
|
| Net assets | | $197,101 | | |
| Shares outstanding | | 11,311 | | |
|
| Net asset value, offering price, and redemption price per share | | | | $17.43 |
|
| Class R3 shares | | | | |
|
| Net assets | | $6,236,812 | | |
| Shares outstanding | | 348,309 | | |
|
| Net asset value, offering price, and redemption price per share | | | | $17.91 |
|
| Class R4 shares | | | | |
|
| Net assets | | $2,676,013 | | |
| Shares outstanding | | 147,448 | | |
|
| Net asset value, offering price, and redemption price per share | | | | $18.15 |
|
| Class R5 shares | | | | |
|
| Net assets | | $96,514,187 | | |
| Shares outstanding | | 5,305,463 | | |
|
| Net asset value, offering price, and redemption price per share | | | | $18.19 |
|
12 SEMIANNUAL REPORT | | | | |
| Statement of Assets and Liabilities (unaudited) – continued | | |
Class 529A shares | | |
|
| Net assets | $1,127,115 | |
| Shares outstanding | 62,448 | |
|
| Net asset value per share | | $18.05 |
|
| Offering price per share (100/94.25 x net asset value per share) | | $19.15 |
|
| Class 529B shares | | |
|
| Net assets | $239,113 | |
| Shares outstanding | 13,806 | |
|
| Net asset value and offering price per share | | $17.32 |
|
| Class 529C shares | | |
|
| Net assets | $544,957 | |
| Shares outstanding | 31,510 | |
|
| Net asset value and offering price per share | | $17.29 |
|
| On sales of $50,000 or more, the offering price of Class A and Class 529A shares is reduced. A contingent |
| deferred sales charge may be imposed on redemptions of Class A, Class B, Class C, Class 529B, and |
| Class 529C shares. | | |
See Notes to Financial Statements | | |
|
| | |
SEMIANNUAL REPORT 13 |
| FINANCIAL STATEMENTS | Statement of Operations (unaudited) | | |
This statement describes how much your fund earned in investment income and accrued in | | |
| expenses. It also describes any gains and/or losses generated by fund operations. | | |
Six months ended 2/28/06 | | | | |
Net investment loss | | | | |
|
| Income | | | | |
| Dividends | | $14,251,115 | | |
| Interest | | 1,249,860 | | |
| Foreign taxes withheld | | (1,040,163) | | |
|
| Total investment income | | | | $14,460,812 |
|
| Expenses | | | | |
| Management fee | | $9,652,154 | | |
| Distribution and service fees | | 3,304,784 | | |
| Program manager fees | | 1,991 | | |
| Shareholder servicing costs | | 1,958,086 | | |
| Administrative services fee | | 107,093 | | |
| Retirement plan administration and services fees | | 22,636 | | |
| Independent trustees’ compensation | | 25,479 | | |
| Custodian fee | | 1,177,817 | | |
| Shareholder communications | | 105,076 | | |
| Auditing fees | | 22,945 | | |
| Legal fees | | 23,745 | | |
| Miscellaneous | | 267,520 | | |
|
| Total expenses | | | | $16,669,326 |
|
| Fees paid indirectly | | (84,175) | | |
| Reduction of expenses by investment adviser | | (8,893) | | |
|
| Net expenses | | | | $16,576,258 |
|
| Net investment loss | | | | $(2,115,446) |
|
| Realized and unrealized gain (loss) on investments | | | | |
|
| Realized gain (loss) (identified cost basis) | | | | |
| Investment transactions (net of $119,480 country tax) | | $184,623,538 | | |
| Foreign currency transactions | | (1,123,219) | | |
|
| Net realized gain (loss) on investments and foreign | | | | |
| currency transactions | | | | $183,500,319 |
|
| Change in unrealized appreciation (depreciation) | | | | |
| Investments (net of $57,340 decrease in deferred country tax) | | $232,317,847 | | |
| Translation of assets and liabilities in foreign currencies | | 37,735 | | |
|
| Net unrealized gain (loss) on investments and foreign | | | | |
| currency translation | | | | $232,355,582 |
|
| Net realized and unrealized gain (loss) on investments and | | | | |
| foreign currency | | | | $415,855,901 |
|
| Change in net assets from operations | | | | $413,740,455 |
|
| See Notes to Financial Statements | | | | |
|
14 SEMIANNUAL REPORT | | | | |
| FINANCIAL STATEMENTS | Statements of Changes in Net Assets | | |
These statements describe the increases and/or decreases in net assets resulting | | |
| from operations, any distributions, and any shareholder transactions. | | |
| | | | |
Six months ended | | Year ended |
| | | | | 2/28/06 | | 8/31/05 |
| | | | | (unaudited) | | |
| Change in net assets | | | | |
|
| From operations | | | | |
|
| Net investment income (loss) | | $(2,115,446) | | $14,478,147 |
| Net realized gain (loss) on investments and foreign | | | | |
| currency transactions | | 183,500,319 | | 145,187,506 |
| Net unrealized gain (loss) on investments and foreign | | | | |
| currency translation | | 232,355,582 | | 171,427,529 |
|
| Change in net assets from operations | | $413,740,455 | | $331,093,182 |
|
| Distributions declared to shareholders | | | | |
|
| From net investment income | | | | |
| Class A | | $(7,372,365) | | $(3,826,893) |
| Class B | | (226,370) | | (10,565) |
| Class C | | (254,257) | | (77,330) |
| Class I | | (9,060,373) | | (4,400,339) |
| Class R | | (303,000) | | (170,724) |
| Class R1 | | (2,859) | | — |
| Class R2 | | (1,155) | | — |
| Class R3 | | (29,271) | | (4,202) |
| Class R4 | | (1,034) | | — |
| Class R5 | | (523) | | — |
| Class 529A | | (4,962) | | (2,107) |
| Class 529B | | (79) | | (115) |
| Class 529C | | (10) | | (151) |
| From net realized gain on investments and foreign | | | | |
| currency transactions | | | | |
| Class A | | (80,787,061) | | (30,675,820) |
| Class B | | (12,159,865) | | (5,867,774) |
| Class C | | (9,704,848) | | (3,969,467) |
| Class I | | (70,748,663) | | (23,687,787) |
| Class R | | (3,873,528) | | (1,210,411) |
| Class R1 | | (33,799) | | — |
| Class R2 | | (13,584) | | — |
| Class R3 | | (346,752) | | (24,101) |
| Class R4 | | (9,270) | | — |
| Class R5 | | (4,369) | | — |
| Class 529A | | (70,615) | | (18,925) |
| Class 529B | | (15,904) | | (6,169) |
| Class 529C | | (39,146) | | (14,528) |
|
| Total distributions declared to shareholders | | $(195,063,662) | | $(73,967,408) |
|
| | | | |
SEMIANNUAL REPORT 15 |
| Statements of Changes in Net Assets – continued | | | | |
| | |
Six months ended | | Year ended |
| | | 2/28/06 | | 8/31/05 |
| | | (unaudited) | | |
| Change in net assets from fund share transactions | | $385,801,242 | | $577,345,880 |
|
| Redemption fees | | $— | | $3,533 |
|
| Total change in net assets | | $604,478,035 | | $834,475,187 |
|
| Net assets | | | | |
|
| At beginning of period | | 2,109,723,702 | | 1,275,248,515 |
| At end of period (including accumulated distributions in | | | | |
| excess of net investment income of $6,331,792 and | | | | |
| undistributed net investment income of $13,039,912) | | $2,714,201,737 | | $2,109,723,702 |
|
| See Notes to Financial Statements | | | | |
|
16 SEMIANNUAL REPORT | | | | |
| FINANCIAL STATEMENTS | Financial Highlights | | | | | | | | | |
The financial highlights table is intended to help you understand the fund’s financial performance for the | |
| semiannual period and the past 5 fiscal years (or life of a particular share class, if shorter). Certain information | |
| reflects financial results for a single fund share. The total returns in the table represent the rate by which an | |
| investor would have earned (or lost) on an investment in the fund share class (assuming reinvestment of all | |
| distributions) held for the entire period. | | | | | | | | | | | |
| | | Six months | | | | | | | | | | | |
| | | ended | | Years ended 8/31 | |
| Class A | | 2/28/06 | | 2005 | | 2004 | | 2003 | | 2002 | | 2001 | |
| (unaudited) | | | | | | | | | | | |
| Net asset value, beginning | | | | | | | | | | | | | |
| of period | | $16.65 | | $14.25 | | $11.53 | | $10.78 | | $12.25 | | $16.19 | |
| |
| Income (loss) from | | | | | | | | | | | | | |
| investment operations | | | | | | | | | | | | | |
| |
| Net investment income (loss) (d) $(0.02) | | $0.12 | | $0.10 | | $0.04 | | $(0.00) | (w) | $(0.00) | (w) |
| Net realized and unrealized | | | | | | | | | | | | | |
| gain (loss) on investments | | | | | | | | | | | | | |
| and foreign currency | | 3.04 | | 3.04 | | 2.63 | | 0.71 | | (1.47) | | (3.44) | |
| |
| Total from investment | | | | | | | | | | | | | |
| operations | | $3.02 | | $3.16 | | $2.73 | | $0.75 | | $(1.47) | | $(3.44) | |
| |
| Less distributions declared | | | | | | | | | | | | | |
| to shareholders | | | | | | | | | | | | | |
| |
| From net investment income | | $(0.12) | | $(0.08) | | $(0.01) | | $— | | $— | | $(0.09) | |
| From net realized gain on | | | | | | | | | | | | | |
| investments and foreign | | | | | | | | | | | | | |
| currency transactions | | (1.36) | | (0.68) | | — | | — | | — | | (0.41) | |
| |
| Total distributions declared to | | | | | | | | | | | | | |
| shareholders | | $(1.48) | | $(0.76) | | $(0.01) | | $— | | $— | | $(0.50) | |
| |
| Net asset value, end of period | | $18.19 | | $16.65 | | $14.25 | | $11.53 | | $10.78 | | $12.25 | |
| |
| Total return (%) (t)(s)(r) | | 19.01 | (n) | 22.67 | | 23.65 | | 6.96 | | (12.00) | | (21.76) | |
| |
| Ratios (%) (to average net assets) | | | | | | | | | | | |
| and Supplemental data: | | | | | | | | | | | | | |
| |
| Expenses before expense | | | | | | | | | | | | | |
| reductions (f) | | 1.50 | (a) | 1.52 | | 1.61 | | 1.80 | | 1.86 | | 1.84 | |
| Expenses after expense | | | | | | | | | | | | | |
| reductions (f) | | 1.50 | (a) | 1.55 | (e) | 1.67 | (e) | 1.75 | | 1.77 | | 1.76 | |
| Net investment income (loss) | | (0.25) | (a) | 0.80 | | 0.75 | | 0.36 | | (0.02) | | (0.02) | |
| Portfolio turnover | | 42 | | 79 | | 102 | | 96 | | 153 | | 131 | |
| Net assets at end of period | | | | | | | | | | | | | |
| (000 Omitted) | | $1,121,767 | | $958,878 | | $593,574 | | $387,732 | | $313,418 | | $240,231 | |
| |
| See Notes to Financial Statements | | | | | | | | | | | |
| |
| | | | | | | | | | | SEMIANNUAL REPORT 17 | |
| Financial Highlights – continued | | | | | | | | | | | | |
Six months | | | | | | | | | | |
| | | ended | | Years ended 8/31 |
| Class B | | 2/28/06 | | 2005 | | 2004 | | 2003 | | 2002 | | 2001 |
| (unaudited) | | | | | | | | | | |
| Net asset value, beginning | | | | | | | | | | | | |
| of period | | $16.02 | | $13.76 | | $11.19 | | $10.54 | | $12.04 | | $15.98 |
|
| Income (loss) from | | | | | | | | | | | | |
| investment operations | | | | | | | | | | | | |
|
| Net investment income (loss) (d) | | $(0.07) | | $0.01 | | $0.02 | | $(0.03) | | $(0.08) | | $(0.10) |
| Net realized and unrealized gain | | | | | | | | | | | | |
| (loss) on investments and foreign | | | | | | | | | | | | |
| currency | | 2.93 | | 2.93 | | 2.55 | | 0.68 | | (1.42) | | (3.39) |
|
| Total from investment operations | | $2.86 | | $2.94 | | $2.57 | | $0.65 | | $(1.50) | | $(3.49) |
|
| Less distributions declared | | | | | | | | | | | | |
| to shareholders | | | | | | | | | | | | |
|
| From net investment income | | $(0.03) | | $(0.00) | (w) | $— | | $— | | $— | | $(0.04) |
| From net realized gain on | | | | | | | | | | | | |
| investments and foreign currency | | | | | | | | | | | | |
| transactions | | (1.36) | | (0.68) | | — | | — | | — | | (0.41) |
|
| Total distributions declared to | | | | | | | | | | | | |
| shareholders | | $(1.39) | | $(0.68) | | $— | | $— | | $— | | $(0.45) |
|
| Net asset value, end of period | | $17.49 | | $16.02 | | $13.76 | | $11.19 | | $10.54 | | $12.04 |
|
| Total return (%) (t)(s)(r) | | 18.63 | (n) | 21.77 | | 22.97 | | 6.17 | | (12.46) | | (22.27) |
|
| Ratios (%) (to average net assets) | | | | | | | | | | | | |
| and Supplemental data: | | | | | | | | | | | | |
|
| Expenses before expense reductions (f) | | 2.14 | (a) | 2.17 | | 2.25 | | 2.45 | | 2.51 | | 2.49 |
| Expenses after expense reductions (f) | | 2.14 | (a) | 2.20 | (e) | 2.31 | (e) | 2.40 | | 2.42 | | 2.41 |
| Net investment income (loss) | | (0.89) | (a) | 0.08 | | 0.12 | | (0.32) | | (0.69) | | (0.71) |
| Portfolio turnover | | 42 | | 79 | | 102 | | 96 | | 153 | | 131 |
| Net assets at end of period | | | | | | | | | | | | |
| (000 Omitted) | | $173,043 | | $141,515 | | $116,165 | | $88,177 | | $82,659 | | $82,135 |
|
| See Notes to Financial Statements | | | | | | | | | | |
|
18 SEMIANNUAL REPORT | | | | | | | | | | | | |
| Financial Highlights – continued | | | | | | | | | | | | |
| | | Six months | | | | | | | | | | |
| | | ended | | Years ended 8/31 |
| Class C | | 2/28/06 | | 2005 | | 2004 | | 2003 | | 2002 | | 2001 |
| | | (unaudited) | | | | | | | | | | |
| Net asset value, beginning | | | | | | | | | | | | |
| of period | | $15.98 | | $13.73 | | $11.17 | | $10.52 | | $12.02 | | $15.97 |
|
| Income (loss) from | | | | | | | | | | | | |
| investment operations | | | | | | | | | | | | |
|
| Net investment income (loss) (d) | | $(0.07) | | $0.02 | | $0.02 | | $(0.03) | | $(0.08) | | $(0.09) |
| Net realized and unrealized gain | | | | | | | | | | | | |
| (loss) on investments and foreign | | | | | | | | | | | | |
| currency | | 2.92 | | 2.92 | | 2.54 | | 0.68 | | (1.42) | | (3.40) |
|
| Total from investment operations | | $2.85 | | $2.94 | | $2.56 | | $0.65 | | $(1.50) | | $(3.49) |
|
| Less distributions declared | | | | | | | | | | | | |
| to shareholders | | | | | | | | | | | | |
|
| From net investment income | | $(0.04) | | $(0.01) | | $— | | $— | | $— | | $(0.05) |
| From net realized gain on | | | | | | | | | | | | |
| investments and foreign currency | | | | | | | | | | | | |
| transactions | | (1.36) | | (0.68) | | — | | — | | — | | (0.41) |
|
| Total distributions declared to | | | | | | | | | | | | |
| shareholders | | $(1.40) | | $(0.69) | | $— | | $— | | $— | | $(0.46) |
|
| Net asset value, end of period | | $17.43 | | $15.98 | | $13.73 | | $11.17 | | $10.52 | | $12.02 |
|
| Total return (%) (t)(s)(r) | | 18.62 | (n) | 21.84 | | 22.92 | | 6.18 | | (12.48) | | (22.27) |
|
| Ratios (%) (to average net assets) | | | | | | | | | | | | |
| and Supplemental data: | | | | | | | | | | | | |
|
| Expenses before expense reductions (f) | | 2.15 | (a) | 2.17 | | 2.25 | | 2.45 | | 2.51 | | 2.49 |
| Expenses after expense reductions (f) | | 2.15 | (a) | 2.20 | (e) | 2.31 | (e) | 2.40 | | 2.42 | | 2.41 |
| Net investment income (loss) | | (0.90) | (a) | 0.13 | | 0.15 | | (0.32) | | (0.09) | | (0.10) |
| Portfolio turnover | | 42 | | 79 | | 102 | | 96 | | 153 | | 131 |
| Net assets at end of period | | | | | | | | | | | | |
| (000 Omitted) | | $139,719 | | $109,347 | | $75,580 | | $46,022 | | $43,046 | | $47,375 |
|
| See Notes to Financial Statements | | | | | | | | | | |
|
| | | | | | | | |
SEMIANNUAL REPORT 19 |
| Financial Highlights – continued | | | | | | | | | | | | |
| | |
Six months | | | | | | | | | | |
| | | | | ended | | | | Years ended 8/31 | | |
| Class I | | | | 2/28/06 | | 2005 | | 2004 | | 2003 | | 2002 | | 2001 |
| | | (unaudited) | | | | | | | | | | |
| Net asset value, beginning | | | | | | | | | | | | | | |
| of period | | | | $17.02 | | $14.54 | | $11.75 | | $10.95 | | $12.39 | | $16.33 |
|
| Income (loss) from | | | | | | | | | | | | | | |
| investment operations | | | | | | | | | | | | | | |
|
| Net investment income (d) | | | | $0.01 | | $0.19 | | $0.16 | | $0.10 | | $0.04 | | $0.03 |
| Net realized and unrealized gain | | | | | | | | | | | | |
| (loss) on investments and foreign | | | | | | | | | | | | |
| currency | | | | 3.10 | | 3.10 | | 2.66 | | 0.70 | | (1.48) | | (3.46) |
|
| Total from investment operations | | | | $3.11 | | $3.29 | | $2.82 | | $0.80 | | $(1.44) | | $(3.43) |
|
| Less distributions declared | | | | | | | | | | | | | | |
| to shareholders | | | | | | | | | | | | | | |
|
| From net investment income | | | | $(0.17) | | $(0.13) | | $(0.03) | | $— | | $— | | $(0.10) |
| From net realized gain on | | | | | | | | | | | | | | |
| investments and foreign currency | | | | | | | | | | | | |
| transactions | | | | (1.36) | | (0.68) | | — | | — | | — | | (0.41) |
|
| Total distributions declared to | | | | | | | | | | | | | | |
| shareholders | | | | $(1.53) | | $(0.81) | | $(0.03) | | $— | | $— | | $(0.51) |
|
| Net asset value, end of period | | | | $18.60 | | $17.02 | | $14.54 | | $11.75 | | $10.95 | | $12.39 |
|
| Total return (%) (s)(r) | | | | 19.15 | (n) | 23.09 | | 24.05 | | 7.31 | | (11.62) | | (21.49) |
|
| Ratios (%) (to average net assets) | | | | | | | | | | | | |
| and Supplemental data: | | | | | | | | | | | | | | |
|
| Expenses before expense reductions (f) | | 1.15 | (a) | 1.17 | | 1.26 | | 1.45 | | 1.51 | | 1.49 |
| Expenses after expense reductions (f) | | 1.15 | (a) | 1.20 | (e) | 1.32 | (e) | 1.40 | | 1.42 | | 1.41 |
| Net investment income | | | | 0.10 | (a) | 1.18 | | 1.18 | | 0.95 | | 0.38 | | 0.25 |
| Portfolio turnover | | | | 42 | | 79 | | 102 | | 96 | | 153 | | 131 |
| Net assets at end of period | | | | | | | | | | | | | | |
| (000 Omitted) | | $1,111,946 | | $851,484 | | $469,181 | | $232,328 | | $18,207 | | $10,150 |
|
| See Notes to Financial Statements | | | | | | | | | | |
|
20 SEMIANNUAL REPORT | | | | | | | | | | | | | | |
| Financial Highlights – continued | | | | | | | | | |
| | | Six months | | | | | | | |
| | | ended | | Years ended 8/31 | |
| Class R | | 2/28/06 | | 2005 | | 2004 | | 2003(i) | |
| | | (unaudited) | | | | | | | |
| Net asset value, beginning of period | | $16.54 | | $14.20 | | $11.52 | | $10.32 | |
| |
| Income (loss) from investment operations | | | | | | | | | |
| |
| Net investment income (loss) (d) | | $(0.03) | | $0.11 | | $0.09 | | $(0.01) | |
| Net realized and unrealized gain (loss) on investments | | | | | | | | | |
| and foreign currency | | 3.02 | | 3.01 | | 2.61 | | 1.21 | |
| |
| Total from investment operations | | $2.99 | | $3.12 | | $2.70 | | $1.20 | |
| |
| Less distributions declared to shareholders | | | | | | | | | |
| |
| From net investment income | | $(0.11) | | $(0.10) | | $(0.02) | | $— | |
| From net realized gain on investments and foreign | | | | | | | | | |
| currency transactions | | (1.36) | | (0.68) | | — | | — | |
| |
| Total distributions declared to shareholders | | $(1.47) | | $(0.78) | | $(0.02) | | $— | |
| |
| Net asset value, end of period | | $18.06 | | $16.54 | | $14.20 | | $11.52 | |
| |
| Total return (%) (s)(r) | | 18.89 | (n) | 22.40 | | 23.50 | | 11.63 | (n) |
| |
| Ratios (%) (to average net assets) | | | | | | | | | |
| and Supplemental data: | | | | | | | | | |
| |
| Expenses before expense reductions (f) | | 1.65 (a) | | 1.66 | | 1.75 | | 1.95 | (a) |
| Expenses after expense reductions (f) | | 1.65 (a) | | 1.69 | (e) | 1.81 | (e) | 1.90 | (a) |
| Net investment income (loss) | | (0.40)(a) | | 0.73 | | 0.69 | | (0.09) | (a) |
| Portfolio turnover | | 42 | | 79 | | 102 | | 96 | |
| Net assets at end of period (000 Omitted) | | $59,625 | | $44,300 | | $19,596 | | $4,810 | |
| |
| See Notes to Financial Statements | | | | | | | | | |
| |
| | | | |
SEMIANNUAL REPORT 21 | |
| Financial Highlights – continued | | | | | |
Six months | | Year | |
| | | ended | | ended | |
| Class R1 | | 2/28/06 | | 8/31/05(i) | |
| (unaudited) | | | |
| Net asset value, beginning of period | | $16.02 | | $15.07 | |
| |
| Income (loss) from investment operations | | | | | |
| |
| Net investment income (loss) (d) | | $(0.09) | | $0.03 | |
| Net realized and unrealized gain (loss) on investments and foreign currency | | 2.92 | | 0.92 | |
| |
| Total from investment operations | | $2.83 | | $0.95 | |
| |
| Less distributions declared to shareholders | | | | | |
| |
| From net investment income | | $(0.12) | | $— | |
| From net realized gain on investments and foreign currency transactions | | (1.36) | | — | |
| |
| Total distributions declared to shareholders | | $(1.48) | | $— | |
| |
| Net asset value, end of period | | $17.37 | | $16.02 | |
| |
| Total return (%) (s)(r) | | 18.48 | (n) | 6.30 | (n) |
| |
| Ratios (%) (to average net assets) | | | | | |
| and Supplemental data: | | | | | |
| |
| Expenses before expense reductions (f) | | 2.36 | (a) | 2.36 | (a) |
| Expenses after expense reductions (f) | | 2.27 | (a) | 2.39 | (a)(e) |
| Net investment income (loss) | | (1.05) | (a) | 0.46 | (a) |
| Portfolio turnover | | 42 | | 79 | |
| Net assets at end of period (000 Omitted) | | $567 | | $171 | |
| |
| Six months | | Year | |
| | | ended | | ended | |
| Class R2 | | 2/28/06 | | 8/31/05(i) | |
| (unaudited) | | | |
| Net asset value, beginning of period | | $16.04 | | $15.07 | |
| |
| Income (loss) from investment operations | | | | | |
| |
| Net investment income (loss) (d) | | $(0.05) | | $0.06 | |
| Net realized and unrealized gain (loss) on investments and foreign currency | | 2.92 | | 0.91 | |
| |
| Total from investment operations | | $2.87 | | $0.97 | |
| |
| Less distributions declared to shareholders | | | | | |
| |
| From net investment income | | $(0.12) | | $— | |
| From net realized gain on investments and foreign currency transactions | | (1.36) | | — | |
| |
| Total distributions declared to shareholders | | $(1.48) | | $— | |
| |
| Net asset value, end of period | | $17.43 | | $16.04 | |
| |
| Total return (%) (s)(r) | | 18.73 | (n) | 6.44 | (n) |
| |
| Ratios (%) (to average net assets) | | | | | |
| and Supplemental data: | | | | | |
| |
| Expenses before expense reductions (f) | | 2.04 | (a) | 2.04 | (a) |
| Expenses after expense reductions (f) | | 1.92 | (a) | 2.07 | (a)(e) |
| Net investment income (loss) | | (0.66) | (a) | 1.12 | (a) |
| Portfolio turnover | | 42 | | 79 | |
| Net assets at end of period (000 Omitted) | | $197 | | $178 | |
| |
| See Notes to Financial Statements | | | | | |
| |
22 SEMIANNUAL REPORT | | | | | |
| Financial Highlights – continued | | | | | | | |
| | | Six months | | | | | |
| | | ended | | Years ended 8/31 | |
| Class R3 | | 2/28/06 | | 2005 | | 2004(i) | |
| | | (unaudited) | | | | | |
| Net asset value, beginning of period | | $16.43 | | $14.16 | | $12.71 | |
| |
| Income (loss) from investment operations | | | | | | | |
| |
| Net investment income (loss) (d) | | $(0.05) | | $0.11 | | $0.02 | |
| Net realized and unrealized gain (loss) on investments and | | | | | | | |
| foreign currency | | 3.01 | | 2.96 | | 1.46 | |
| |
| Total from investment operations | | $2.96 | | $3.07 | | $1.48 | |
| |
| Less distributions declared to shareholders | | | | | | | |
| |
| From net investment income | | $(0.12) | | $(0.12) | | $(0.03) | |
| From net realized gain on investments and foreign | | | | | | | |
| currency transactions | | (1.36) | | (0.68) | | — | |
| |
| Total distributions declared to shareholders | | $(1.48) | | $(0.80) | | $(0.03) | |
| |
| Net asset value, end of period | | $17.91 | | $16.43 | | $14.16 | |
| |
| Total return (%) (s)(r) | | 18.83 | (n) | 22.13 | | 11.69 | (n) |
| |
| Ratios (%) (to average net assets) | | | | | | | |
| and Supplemental data: | | | | | | | |
| |
| Expenses before expense reductions (f) | | 1.92 | (a) | 1.92 | | 2.01 | (a) |
| Expenses after expense reductions (f) | | 1.83 | (a) | 1.95 | (e) | 2.07 | (a)(e) |
| Net investment income (loss) | | (0.57) | (a) | 0.74 | | 0.18 | (a) |
| Portfolio turnover | | 42 | | 79 | | 102 | |
| Net assets at end of period (000 Omitted) | | $6,237 | | $2,357 | | $431 | |
| |
| See Notes to Financial Statements | | | | | | | |
| |
| | | | |
SEMIANNUAL REPORT 23 |
| Financial Highlights – continued | | | | | |
| Six months | | Year | |
| | | ended | | ended | |
| Class R4 | | 2/28/06 | | 8/31/05(i) | |
| (unaudited) | | | |
| Net asset value, beginning of period | | $16.65 | | $15.62 | |
| |
| Income (loss) from investment operations | | | | | |
| |
| Net investment income (loss) (d) | | $(0.01) | | $0.12 | |
| Net realized and unrealized gain (loss) on investments and foreign currency | | 3.02 | | 0.91 | |
| |
| Total from investment operations | | $3.01 | | $1.03 | |
| |
| Less distributions declared to shareholders | | | | | |
| |
| From net investment income | | $(0.15) | | $— | |
| From net realized gain on investments and foreign currency transactions | | (1.36) | | — | |
| |
| Total distributions declared to shareholders | | $(1.51) | | $— | |
| |
| Net asset value, end of period | | $18.15 | | $16.65 | |
| |
| Total return (%) (s)(r) | | 18.94 | (n) | 6.59 | (n) |
| |
| Ratios (%) (to average net assets) | | | | | |
| and Supplemental data: | | | | | |
| |
| Expenses before expense reductions (f) | | 1.55 | (a) | 1.55 | (a) |
| Expenses after expense reductions (f) | | 1.55 | (a) | 1.58 | (a)(e) |
| Net investment income (loss) | | (0.20) | (a) | 1.79 | (a) |
| Portfolio turnover | | 42 | | 79 | |
| Net assets at end of period (000 Omitted) | | $2,676 | | $53 | |
| |
| Six months | | Year | |
| | | ended | | ended | |
| Class R5 | | 2/28/06 | | 8/31/05(i) | |
| (unaudited) | | | |
| Net asset value, beginning of period | | $16.67 | | $15.62 | |
| |
| Income (loss) from investment operations | | | | | |
| |
| Net investment income (d) | | $0.00 | (w) | $0.14 | |
| Net realized and unrealized gain (loss) on investments and foreign currency | | 3.04 | | 0.91 | |
| |
| Total from investment operations | | $3.04 | | $1.05 | |
| |
| Less distributions declared to shareholders | | | | | |
| |
| From net investment income | | $(0.16) | | $— | |
| From net realized gain on investments and foreign currency transactions | | (1.36) | | — | |
| |
| Total distributions declared to shareholders | | $(1.52) | | $— | |
| |
| Net asset value, end of period | | $18.19 | | $16.67 | |
| |
| Total return (%) (s)(r) | | 19.12 | (n) | 6.72 | (n) |
| |
| Ratios (%) (to average net assets) | | | | | |
| and Supplemental data: | | | | | |
| |
| Expenses before expense reductions (f) | | 1.25 | (a) | 1.25 | (a) |
| Expenses after expense reductions (f) | | 1.25 | (a) | 1.28 | (a)(e) |
| Net investment income | | 0.04 | (a) | 2.09 | (a) |
| Portfolio turnover | | 42 | | 79 | |
| Net assets at end of period (000 Omitted) | | $96,514 | | $53 | |
| |
| See Notes to Financial Statements | | | | | |
| |
24 SEMIANNUAL REPORT | | | | | |
| Financial Highlights – continued | | | | | | | | | | | |
| Six months | | | | | | | | | |
| | | ended | | Years ended 8/31 | |
| Class 529A | | 2/28/06 | | 2005 | | 2004 | | 2003 | | 2002(i) | |
| (unaudited) | | | | | | | | | |
| Net asset value, beginning of period | | $16.53 | | $14.18 | | $11.50 | | $10.78 | | $10.66 | |
| |
| Income (loss) from investment operations | | | | | | | | | | | |
| |
| Net investment income (loss) (d) | | $(0.04) | | $0.10 | | $0.08 | | $0.03 | | $(0.00) | (w) |
| Net realized and unrealized gain (loss) on | | | | | | | | | | | |
| investments and foreign currency | | 3.02 | | 3.01 | | 2.61 | | 0.69 | | 0.12 | |
| |
| Total from investment operations | | $2.98 | | $3.11 | | $2.69 | | $0.72 | | $0.12 | |
| |
| Less distributions declared to shareholders | | | | | | | | | | | |
| |
| From net investment income | | $(0.10) | | $(0.08) | | $(0.01) | | $— | | $— | |
| From net realized gain on investments and | | | | | | | | | | | |
| foreign currency transactions | | (1.36) | | (0.68) | | — | | — | | — | |
| |
| Total distributions declared to shareholders | | $(1.46) | | $(0.76) | | $(0.01) | | $— | | $— | |
| |
| Net asset value, end of period | | $18.05 | | $16.53 | | $14.18 | | $11.50 | | $10.78 | |
| |
| Total return (%) (t)(s)(r) | | 18.83 | (n) | 22.35 | | 23.39 | | 6.68 | | 1.13 | (n) |
| |
| Ratios (%) (to average net assets) | | | | | | | | | | | |
| and Supplemental data: | | | | | | | | | | | |
| |
| Expenses before expense reductions (f) | | 1.75 | (a) | 1.76 | | 1.85 | | 2.05 | | 2.11 | (a) |
| Expenses after expense reductions (f) | | 1.75 | (a) | 1.79 | (e) | 1.91 | (e) | 2.00 | | 2.02 | (a) |
| Net investment income (loss) | | (0.51) | (a) | 0.65 | | 0.62 | | 0.30 | | (0.20) | (a) |
| Portfolio turnover | | 42 | | 79 | | 102 | | 96 | | 153 | |
| Net assets at end of period (000 Omitted) | | $1,127 | | $760 | | $332 | | $112 | | $11 | |
| |
| See Notes to Financial Statements | | | | | | | | | | | |
| |
| | | | | | | SEMIANNUAL REPORT 25 | |
| Financial Highlights – continued | | | | | | | | | | | | |
| Six months | | | | | | | | | | |
| | | ended | | Years ended 8/31 | | |
| Class 529B | | 2/28/06 | | 2005 | | 2004 | | 2003 | | 2002(i) | | |
| (unaudited) | | | | | | | | | | |
| Net asset value, beginning of period | | $15.88 | | $13.68 | | $11.17 | | $10.54 | | $10.42 | | |
| | |
| Income (loss) from investment operations | | | | | | | | | | | | |
| | |
| Net investment loss (d) | | $(0.09) | | $(0.02) | | $(0.00) | (w) | $(0.05) | | $(0.00) | (w) | |
| Net realized and unrealized gain (loss) on | | | | | | | | | | | | |
| investments and foreign currency | | 2.90 | | 2.91 | | 2.51 | | 0.68 | | 0.12 | | |
| | |
| Total from investment operations | | $2.81 | | $2.89 | | $2.51 | | $0.63 | | $0.12 | | |
| | |
| Less distributions declared to shareholders | | | | | | | | | | | | |
| | |
| From net investment income | | $(0.01) | | $(0.01) | | $— | | $— | | $— | | |
| From net realized gain on investments and | | | | | | | | | | | | |
| foreign currency transactions | | (1.36) | | (0.68) | | — | | — | | — | | |
| | |
| Total distributions declared to shareholders | | $(1.37) | | $(0.69) | | $— | | $— | | $— | | |
| | |
| Net asset value, end of period | | $17.32 | | $15.88 | | $13.68 | | $11.17 | | $10.54 | | |
| | |
| Total return (%) (t)(s)(r) | | 18.47 | (n) | 21.54 | | 22.47 | | 5.98 | | 1.15 | (n) | |
| | |
| Ratios (%) (to average net assets) | | | | | | | | | | | | |
| and Supplemental data: | | | | | | | | | | | | |
| | |
| Expenses before expense reductions (f) | | 2.40 | (a) | 2.42 | | 2.50 | | 2.70 | | 2.76 | (a) | |
| Expenses after expense reductions (f) | | 2.40 | (a) | 2.45 | (e) | 2.56 | (e) | 2.65 | | 2.67 | (a) | |
| Net investment loss | | (1.15) | (a) | (0.13) | | (0.03) | | (0.43) | | (0.45) | (a) | |
| Portfolio turnover | | 42 | | 79 | | 102 | | 96 | | 153 | | |
| Net assets at end of period (000 Omitted) | | $239 | | $174 | | $110 | | $41 | | $5 | | |
| | |
| See Notes to Financial Statements | | | | | | | | | | | | |
| | |
26 SEMIANNUAL REPORT | | | | | | | | | | | | |
| Financial Highlights – continued | | | | | | | | | | | |
| Six months | | | | | | | | | |
| | | ended | | Years ended 8/31 | |
| Class 529C | | 2/28/06 | | 2005 | | 2004 | | 2003 | | 2002(i) | |
| (unaudited) | | | | | | | | | |
| Net asset value, beginning of period | | $15.86 | | $13.66 | | $11.14 | | $10.52 | | $10.40 | |
| |
| Income (loss) from investment operations | | | | | | | | | | | |
| |
| Net investment loss (d) | | $(0.09) | | $(0.01) | | $(0.00) | (w) | $(0.04) | | $(0.00) | (w) |
| Net realized and unrealized gain (loss) on | | | | | | | | | | | |
| investments and foreign currency | | 2.88 | | 2.90 | | 2.52 | | 0.66 | | 0.12 | |
| |
| Total from investment operations | | $2.79 | | $2.89 | | $2.52 | | $0.62 | | $0.12 | |
| |
| Less distributions declared to shareholders | | | | | | | | | | | |
| |
| From net investment income | | $(0.00) | (w) | $(0.01) | | $— | | $— | | $— | |
| From net realized gain on investments and | | | | | | | | | | | |
| foreign currency transactions | | (1.36) | | (0.68) | | — | | — | | — | |
| |
| Total distributions declared to shareholders | | $(1.36) | | $(0.69) | | $— | | $— | | $— | |
| |
| Net asset value, end of period | | $17.29 | | $15.86 | | $13.66 | | $11.14 | | $10.52 | |
| |
| Total return (%) (t)(s)(r) | | 18.38 | (n) | 21.53 | | 22.62 | | 5.89 | | 1.15 | (n) |
| |
| Ratios (%) (to average net assets) | | | | | | | | | | | |
| and Supplemental data: | | | | | | | | | | | |
| |
| Expenses before expense reductions (f) | | 2.39 | (a) | 2.42 | | 2.49 | | 2.70 | | 2.76 | (a) |
| Expenses after expense reductions (f) | | 2.39 | (a) | 2.45 | (e) | 2.55 | (e) | 2.65 | | 2.67 | (a) |
| Net investment loss | | (1.14) | (a) | (0.07) | | (0.02) | | (0.36) | | (0.45) | (a) |
| Portfolio turnover | | 42 | | 79 | | 102 | | 96 | | 153 | |
| Net assets at end of period (000 Omitted) | | $545 | | $454 | | $280 | | $81 | | $5 | |
| |
| Any redemption fees charged by the fund during the 2004 and 2005 fiscal years resulted in a per share |
| impact of less than $0.01. |
| (i) | | For the period from the class’ inception, December 31, 2002 (Class R), July 31, 2002 (Classes 529A, 529B, |
| | | and 529C), October 31, 2003 (Class R3) and April 1, 2005 (Classes R1, R2, R4, and R5) through the |
| | | stated period end. |
| (a) | | Annualized. |
| (n) | | Not annualized. |
| (w) | | Per share amount was less than $0.01. |
| (d) | | Per share data are based on average shares outstanding. |
| (e) | | Ratio includes a reimbursement fee for expenses borne by MFS in prior years under the then existing |
| | | expense reimbursement agreement. |
| (f) | | Ratios do not reflect reductions from fees paid indirectly. |
| (r) | | Certain expenses have been reduced without which performance would have been lower. |
| (s) | | From time to time the fund may receive proceeds from litigation settlements, without which performance |
| | | would be lower. |
| (t) | | Total returns do not include any applicable sales charges. |
See Notes to Financial Statements |
|
| | |
SEMIANNUAL REPORT 27 |
NOTES TO FINANCIAL STATEMENTS (unaudited)
(1) Business and Organization
MFS Research International Fund (the fund) is a series of MFS Series Trust I (the trust). The trust is organized as a Massachusetts business trust and is registered under the Investment Company Act of 1940, as amended, as an open-end management investment company.
(2) Significant Accounting Policies
General – The preparation of financial statements in conformity with U.S. generally accepted accounting principles requires management to make estimates and assumptions that affect the reported amounts of assets and liabilities, and disclosure of contingent assets and liabilities at the date of the financial statements and the reported amounts of revenues and expenses during the reporting period. Actual results could differ from those estimates.
The fund can invest in foreign securities, including securities of emerging market issuers. Investments in foreign securities are vulnerable to the effects of changes in the relative values of the local currency and the U.S. dollar and to the effects of changes in each country’s legal, political, and economic environment. The markets of emerging markets countries are generally more volatile than the markets of developed countries with more mature economies. All of the risks of investing in foreign securities previously described are heightened when investing in emerging markets countries.
Investment Valuations – Equity securities, including restricted equity securities, are generally valued at the last sale or official closing price as reported by an independent pricing service on the market or exchange on which they are primarily traded. For securities for which there were no sales during the day, equity securities are generally valued at the last quoted bid price as reported by an independent pricing service on the market or exchange on which they are primarily traded. Short-term instruments with a maturity at issuance of 365 days or less are generally valued at amortized cost, which approximates market value. Open-end investment companies are generally valued at their net asset value per share. Securities and other assets generally valued on the basis of information from an independent pricing service may also be valued on the basis of information from brokers and dealers. The values of foreign securities and other assets and liabilities expressed in foreign currencies are converted to U.S. dollars based upon exchange rates provided by an independent source. When pricing-service information or market quotations are not readily available, securities are priced at fair value as determined under the direction of the Board of Trustees. For example, in valuing securities that trade principally on foreign markets, events reasonably determined to be significant (such as certain movements in the U.S. securities market, or other regional and local developments) may occur between the time that foreign markets close (where the security is principally traded) and the fund’s valuation time that may impact the value of securities traded in these foreign markets. In these cases, the fund may utilize information from an external vendor or other sources to adjust closing market prices of foreign equity securities to reflect what it believes to be the fair value of the securities
28 SEMIANNUAL REPORT
Notes to Financial Statements (unaudited) – continued
as of the fund’s valuation time. Fair valuation of foreign equity securities may occur frequently based on an assessment that events which occur on a fairly regular basis (such as U.S. market movements) are significant.
Repurchase Agreements – The fund may enter into repurchase agreements with institutions that the fund’s investment adviser has determined are creditworthy. Each repurchase agreement is recorded at cost. The fund requires that the securities collateral in a repurchase transaction be transferred to the custodian in a manner sufficient to enable the fund to obtain those securities in the event of a default under the repurchase agreement. The fund monitors, on a daily basis, the value of the collateral to ensure that its value, including accrued interest, is greater than amounts owed to the fund under each such repurchase agreement. The fund, along with other affiliated entities of Massachusetts Financial Services Company (MFS), may utilize a joint trading account for the purpose of entering into one or more repurchase agreements.
Foreign Currency Translation – Purchases and sales of foreign investments, income, and expenses are converted into U.S. dollars based upon currency exchange rates prevailing on the respective dates of such transactions. Gains and losses attributable to foreign currency exchange rates on sales of securities are recorded for financial statement purposes as net realized gains and losses on investments. Gains and losses attributable to foreign exchange rate movements on income and expenses are recorded for financial statement purposes as foreign currency transaction gains and losses. That portion of both realized and unrealized gains and losses on investments that results from fluctuations in foreign currency exchange rates is not separately disclosed.
Security Loans – State Street Bank and Trust Company (‘‘State Street’’), as lending agent, may loan the securities of the fund to certain qualified institutions (the ‘‘Borrowers’’) approved by the fund. The loans are collateralized at all times by cash and/or U.S. Treasury securities in an amount at least equal to the market value of the securities loaned. State Street provides the fund with indemnification against Borrower default. The fund bears the risk of loss with respect to the investment of cash collateral. On loans collateralized by cash, the cash collateral is invested in a money market fund or short-term securities. A portion of the income generated upon investment of the collateral is remitted to the Borrowers, and the remainder is allocated between the fund and the lending agent. On loans collateralized by U.S. Treasury securities, a fee is received from the Borrower, and is allocated between the fund and the lending agent. Income from securities lending is included in interest income on the Statement of Operations. The dividend and interest income earned on the securities loaned is accounted for in the same manner as other dividend and interest income.
Short Term Fees – For purchases made on or after July 1, 2004 and before April 1, 2005, the fund charged a 2% redemption fee on proceeds from Class A, Class B, Class C, and Class I shares redeemed or exchanged within 5 business days following their acquisition. Due to systems limitations associated with the transition from applying a 30 calendar day redemption fee to a 5
SEMIANNUAL REPORT 29
Notes to Financial Statements (unaudited) – continued
business day redemption fee, the fund did not impose redemption fees with respect to purchases made in June 2004 followed by redemptions made in July 2004. Effective April 1, 2005, the fund no longer charges a redemption fee. See the fund’s prospectus for details. Any redemption fees charged are accounted for as an addition to paid-in capital.
Investment Transactions and Income – Investment transactions are recorded on the trade date. Interest income is recorded on the accrual basis. All premium and discount is amortized or accreted for financial statement purposes in accordance with U.S. generally accepted accounting principles. All discount is accreted for tax reporting purposes as required by federal income tax regulations. Dividends received in cash are recorded on the ex-dividend date. Certain dividends from foreign securities will be recorded when the fund is informed of the dividend if such information is obtained subsequent to the ex-dividend date. Dividend and interest payments received in additional securities are recorded on the ex-dividend or ex-interest date in an amount equal to the value of the security on such date.
The fund may receive proceeds from litigation settlements involving its portfolio holdings. Any proceeds received are reflected in realized gain/loss in the Statement of Operations, or in unrealized gain/loss if the security is still held by the fund.
Fees Paid Indirectly – The fund’s custody fee is reduced according to an arrangement that measures the value of cash deposited with the custodian by the fund. During the six months ended February 28, 2006, the fund’s custodian fees were reduced by $56,102 under this arrangement. The fund has entered into a commission recapture agreement, under which certain brokers will credit the fund a portion of the commissions generated, to offset certain expenses of the fund. For the six months ended February 28, 2006, the fund’s custodian expenses were reduced by $28,073 under this agreement. These amounts are shown as a reduction of total expenses on the Statement of Operations. Effective January 1, 2006, the commission recapture agreement was terminated.
Tax Matters and Distributions – The fund intends to continue to qualify as a regulated investment company, as defined under Subchapter M of the Internal Revenue Code, and to distribute all of its taxable income, including realized capital gains. Accordingly, no provision for federal income tax is required in the financial statements. Foreign taxes, if any, have been accrued by the fund in the accompanying financial statements.
Distributions to shareholders are recorded on the ex-dividend date. Income and capital gain distributions are determined in accordance with income tax regulations, which may differ from generally accepted accounting principles. Certain capital accounts in the financial statements are periodically adjusted for permanent differences in order to reflect their tax character. These adjustments have no impact on net assets or net asset value per share. Temporary differences which arise from recognizing certain items of income, expense, gain or loss in different periods for financial statement and tax
30 SEMIANNUAL REPORT
Notes to Financial Statements (unaudited) – continued
purposes will reverse at some time in the future. Distributions in excess of net investment income or net realized gains are temporary overdistributions for financial statement purposes resulting from differences in the recognition or classification of income for financial statement and tax purposes.
Book/tax differences primarily relate to foreign currency transactions, wash sales, foreign taxes, passive foreign investment companies and by treating a portion of the proceeds from redemptions as a distribution from realized gains for tax purposes.
The tax character of distributions made during the current period will be determined at fiscal year end. The tax character of distributions declared to shareholders is as follows:
| | | 8/31/05 | | 8/31/04 |
| Ordinary income (including any | | | | |
| short-term capital gains) | | $8,492,426 | | $1,055,994 |
| Long-term capital gain | | 65,474,982 | | — |
|
| Total distributions | | $73,967,408 | | $1,055,994 |
The federal tax cost and the tax basis components of distributable earnings were as follows:
| As of February 28, 2006 | | |
| Cost of investments(1) | | $2,763,915,502 |
|
| Gross appreciation | | $510,164,737 |
| Gross depreciation | | (18,024,477) |
|
| Net unrealized appreciation (depreciation) | | $492,140,260 |
| As of August 31, 2005 | | |
| Undistributed ordinary income | | $79,481,267 |
| Undistributed long-term capital gain | | 50,399,955 |
| Other temporary differences | | (173,306) |
| Net unrealized appreciation (depreciation) | | 258,125,779 |
(1) Aggregate cost includes prior fiscal year end tax adjustments.
Multiple Classes of Shares of Beneficial Interest – The fund offers multiple classes of shares, which differ in their respective distribution and service fees. All shareholders bear the common expenses of the fund based on daily net assets of each class, without distinction between share classes. Dividends are declared separately for each class. Differences in per share dividend rates are generally due to differences in separate class expenses. Class B and Class 529B shares will convert to Class A and Class 529A shares, respectively, approximately eight years after purchase.
SEMIANNUAL REPORT 31
Notes to Financial Statements (unaudited) – continued
(3) Transactions with Affiliates
Investment Adviser – The fund has an investment advisory agreement with Massachusetts Financial Services Company (MFS) to provide overall investment advisory and administrative services, and general office facilities.
The management fee is computed daily and paid monthly at the following annual rates:
| First $1.0 billion of average daily net assets | | 0.90% |
| Next $1.0 billion of average daily net assets | | 0.80% |
| Average daily net assets in excess of $2.0 billion | | 0.70% |
The management fee incurred for the six months ended February 28, 2006 was equivalent to an annual effective rate of 0.83% of the fund’s average daily net assets.
The investment adviser has contractually agreed to pay a portion of the fund’s operating expenses, exclusive of management, distribution and service, retirement plan administration and services, program manager, and certain other fees and expenses, such that operating expenses do not exceed 0.40% annually of the fund’s average daily net assets. This contractual fee arrangement will continue until January 1, 2007. For the six months ended February 28, 2006, the fund’s actual operating expenses did not exceed the limit and therefore, the investment adviser did not pay any portion of the fund’s expenses.
Distributor – MFS Fund Distributors, Inc. (MFD), a wholly owned subsidiary of MFS, as distributor, received $61,113 and $986 for the six months ended February 28, 2006, as its portion of the initial sales charge on sales of Class A and Class 529A shares of the fund, respectively.
The Board of Trustees has adopted a distribution plan for certain class shares pursuant to Rule 12b-1 of the Investment Company Act of 1940.
The fund’s distribution plan provides that the fund will pay MFD for services provided by MFD and financial intermediaries in connection with the distribution and servicing of certain share classes. One component of the plan is a distribution fee paid to MFD and another component of the plan is a service fee paid to MFD. MFD may subsequently pay all, or a portion, of the distribution and/or service fees to financial intermediaries.
32 SEMIANNUAL REPORT
Notes to Financial Statements (unaudited) – continued
| Distribution Fee Plan Table: | | | | | | | | |
| | | | | | | | | Total | | Annual | | Distribution |
| | | | | Distribution | | Service | | Distribution | | Effective | | and Service |
| | | | | Fee Rate | | Fee Rate | | Plan(1) | | Rate(2) | | Fee |
| Class A | | 0.10% | | 0.25% | | 0.35% | | 0.35% | | $1,792,895 |
| Class B | | 0.75% | | 0.25% | | 1.00% | | 1.00% | | 763,456 |
| Class C | | 0.75% | | 0.25% | | 1.00% | | 1.00% | | 604,316 |
| Class R | | 0.25% | | 0.25% | | 0.50% | | 0.50% | | 125,331 |
| Class R1 | | 0.50% | | 0.25% | | 0.75% | | 0.75% | | 1,504 |
| Class R2 | | 0.25% | | 0.25% | | 0.50% | | 0.50% | | 439 |
| Class R3 | | 0.25% | | 0.25% | | 0.50% | | 0.50% | | 11,092 |
| Class R4 | | — | | 0.25% | | 0.25% | | 0.25% | | 723 |
| Class 529A | | 0.25% | | 0.25% | | 0.50% | | 0.35% | | 1,581 |
| Class 529B | | 0.75% | | 0.25% | | 1.00% | | 1.00% | | 989 |
| Class 529C | | 0.75% | | 0.25% | | 1.00% | | 1.00% | | 2,458 |
|
| Total Distribution and Service Fees | | | | | | | | $3,304,784 |
| (1) | In accordance with the distribution plan for certain classes, the fund pays distribution and/or service fees up to these annual percentage rates of each class’ average daily net assets. |
| (2) | The annual effective rates represent actual fees incurred under the distribution plan for the six months ended February 28, 2006 based on each class’ average daily net assets. 0.10% of the Class 529A distribution fee is currently being paid by the fund. Payment of the remaining 0.15% of the Class 529A distribution fee is not yet implemented and will commence on such date as the fund’s Board of Trustees may determine. |
| |
Certain Class A, Class C and Class 529C shares are subject to a contingent deferred sales charge in the event of a shareholder redemption within 12 months of purchase. Class B and Class 529B shares are subject to a contingent deferred sales charge in the event of a shareholder redemption within six years of purchase. All contingent deferred sales charges are paid to MFD and during the six months ended February 28, 2006, were as follows:
| | | Amount |
| Class A | | $25,624 |
| Class B | | 84,049 |
| Class C | | 9,005 |
| Class 529B | | — |
| Class 529C | | — |
The fund has entered into and may from time to time enter into contracts with program managers and other parties which administer the tuition programs through which an investment in the fund’s 529 share classes is made. The fund has entered into an agreement with MFD pursuant to which MFD receives an annual fee of up to 0.35% from the fund based solely upon the value of the fund’s 529 share classes attributable to tuition programs to which MFD, or a third party which contracts with MFD, provides administrative services. The current fee has been established at 0.25% annually of average net assets of the fund’s 529 share classes. The fee may only be increased with the approval of the Board of Trustees who oversees the fund. The services provided by MFD, or a third party with which MFD contracts, include recordkeeping and tax reporting and account services, as well as services designed to maintain the program’s compliance with the
SEMIANNUAL REPORT 33
Notes to Financial Statements (unaudited) – continued
Internal Revenue Code and other regulatory requirements. Program manager fees for the six months ended February 28, 2006, were as follows:
| | | | | Amount |
| Class 529A | | $1,129 |
| Class 529B | | | | 247 |
| Class 529C | | | | 615 |
|
| Total Program Manager Fees | | $1,991 |
Shareholder Servicing Agent – The fund pays a portion of shareholder servicing costs to MFS Service Center, Inc. (MFSC), a wholly-owned subsidiary of MFS. MFSC receives a fee from the fund, for its services as shareholder servicing agent, set periodically under the supervision of the fund’s Board of Trustees. For the six months ended February 28, 2006, the fee was $1,135,609, which equated to 0.0974% annually of the fund’s average daily net assets. MFSC also receives payment from the fund for out-of-pocket and sub-accounting expenses paid by MFSC on behalf of the fund. For the six months ended February 28, 2006, these costs amounted to $680,857.
Administrator – MFS provides certain financial, legal, shareholder communications, compliance, and other administrative services to certain funds for which MFS acts as investment adviser. Under an administrative services agreement, the funds may partially reimburse MFS the costs incurred to provide these services, subject to review and approval by the Board of Trustees. Each fund is charged a fixed amount plus a fee based on calendar year average net assets. Effective July 1, 2005, the fund’s annual fixed amount is $10,000. The administrative services fee incurred for the six months ended February 28, 2006 was equivalent to an annual effective rate of 0.0092% of the fund’s average daily net assets.
In addition to the administrative services provided by MFS to the fund as described above, MFS is responsible for providing certain retirement plan administration and services with respect to certain shares. These services include various administrative, recordkeeping, and communication/educational services with respect to the retirement plans which invest in these shares, and may be provided directly by MFS or by a third party. MFS may subsequently pay all, or a portion, of the retirement plan administration and services fee to affiliated or unaffiliated third parties. For the six months ended February 28, 2006, the fund paid MFS an annual retirement plan
34 SEMIANNUAL REPORT
Notes to Financial Statements (unaudited) – continued
administration and services fee up to the following annual percentage rates of each class’ average daily net assets:
| | | | | | | Annual | | |
| | | | | | | Effective | | Total |
| | | | | Fee Rate | | Rate(1) | | Amount |
| Class R1 | | | | 0.45% | | 0.36% | | $905 |
| Class R2 | | | | 0.40% | | 0.28% | | 350 |
| Class R3 | | | | 0.25% | | 0.16% | | 5,529 |
| Class R4 | | | | 0.15% | | 0.15% | | 434 |
| Class R5 | | | | 0.10% | | 0.10% | | 15,418 |
|
| Total Retirement Plan Administration and Services Fees | | | | | | $22,636 |
| (1) | Effective October 1, 2005, MFS has contractually agreed to waive a portion of the retirement plan administration and services fee equal to 0.10% for Class R1 shares, 0.15% for Class R2 shares, and 0.10% for Class R3 shares. This agreement will continue until at least September 30, 2007. For the six months ended February 28, 2006, this waiver amounted to $2,218 and is reflected as a reduction of total expenses in the Statement of Operations. |
| |
Trustees’ and Officers’ Compensation – The fund pays compensation to Independent Trustees in the form of a retainer, attendance fees, and additional compensation to Board and Committee chairpersons. The fund does not pay compensation directly to Trustees who are officers of the investment adviser, or to officers of the fund, all of whom receive remuneration for their services to the fund from MFS. Certain officers and Trustees of the fund are officers or directors of MFS, MFD, and MFSC.
The fund has an unfunded, defined benefit plan for retired Independent Trustees which resulted in a pension expense of $346. The fund also has an unfunded retirement benefit deferral plan for certain current Independent Trustees which resulted in an expense of $3,105. Both amounts are included in Independent trustees’ compensation for the six months ended February 28, 2006. The deferred liability for retirement benefits payable to retired Trustees and certain current Trustees amounted to $3,327 and $25,692, respectively, at February 28, 2006, and is included in payable for independent trustees’ compensation.
Other – This fund and certain other MFS funds (the funds) have entered into a services agreement (the Agreement) which provides for payment of fees by the funds to Tarantino LLC in return for the provision of services of an Independent Chief Compliance Officer (ICCO) for the funds. The ICCO is an officer of the funds and the sole member of Tarantino LLC. The funds can terminate the Agreement with Tarantino LLC at any time under the terms of the Agreement. For the six months ended February 28, 2006, the fee paid to Tarantino LLC was $8,777. MFS has agreed to reimburse the fund for a portion of the payments made by the funds to Tarantino LLC in the amount of $6,675, which is shown as a reduction of total expenses in the Statement of Operations. Additionally, MFS has agreed to bear all expenses associated with office space, other administrative support, and supplies provided to the ICCO.
SEMIANNUAL REPORT 35
Notes to Financial Statements (unaudited) – continued
(4) Portfolio Securities
Purchases and sales of investments, other than U.S. government securities, purchased option transactions, and short-term obligations, aggregated $1,127,814,156 and $968,483,067, respectively.
(5) Shares of Beneficial Interest
The fund’s Declaration of Trust permits the Trustees to issue an unlimited number of full and fractional shares of beneficial interest. Transactions in fund shares were as follows:
| | | | | Six months ended 2/28/06 | | Year ended 8/31/05(i) |
| | | | | Shares | | Amount | | Shares | | Amount |
| Shares sold | | | | | | | | |
| Class A | | 12,967,956 | | $225,386,265 | | 28,794,080 | | $449,353,092 |
| Class B | | 1,675,657 | | 28,205,916 | | 2,362,199 | | 35,339,373 |
| Class C | | 1,540,486 | | 25,800,745 | | 2,336,111 | | 34,976,257 |
| Class I | | 7,356,185 | | 131,728,993 | | 19,429,388 | | 307,426,523 |
| Class R | | 807,775 | | 14,006,572 | | 1,840,882 | | 28,392,688 |
| Class R1 | | | | 24,961 | | 416,973 | | 10,752 | | 164,313 |
| Class R2 | | | | 1,032 | | 17,362 | | 11,113 | | 173,543 |
| Class R3 | | | | 333,363 | | 5,658,386 | | 133,725 | | 2,068,055 |
| Class R4 | | | | 144,093 | | 2,557,510 | | 3,201 | | 50,000 |
| Class R5 | | | | 5,533,817 | | 94,095,652 | | 3,201 | | 50,000 |
| Class 529A | | | | 15,340 | | 263,154 | | 25,961 | | 402,042 |
| Class 529B | | | | 1,947 | | 32,341 | | 3,708 | | 53,775 |
| Class 529C | | | | 2,579 | | 42,601 | | 8,456 | | 126,224 |
|
| | | | | 30,405,191 | | $528,212,470 | | 54,962,777 | | $858,575,885 |
| Shares issued to shareholders in | | | | | | | | |
| reinvestment of distributions | | | | | | | | |
| Class A | | 3,732,226 | | $62,253,510 | | 1,587,913 | | $24,279,191 |
| Class B | | 649,117 | | 10,424,819 | | 340,629 | | 5,034,486 |
| Class C | | 441,717 | | 7,067,480 | | 208,302 | | 3,070,381 |
| Class I | | 4,619,694 | | 78,765,784 | | 1,781,510 | | 27,773,750 |
| Class R | | 234,852 | | 3,891,493 | | 86,925 | | 1,321,265 |
| Class R1 | | | | 2,327 | | 33,799 | | — | | — |
| Class R2 | | | | 922 | | 14,739 | | — | | — |
| Class R3 | | | | 22,921 | | 376,023 | | 1,871 | | 28,303 |
| Class R4 | | | | 619 | | 10,304 | | — | | — |
| Class R5 | | | | 293 | | 4,892 | | — | | — |
| Class 529A | | | | 4,564 | | 75,577 | | 1,383 | | 21,032 |
| Class 529B | | | | 1,005 | | 15,983 | | 428 | | 6,284 |
| Class 529C | | | | 2,464 | | 39,156 | | 1,002 | | 14,679 |
|
| | | | | 9,712,721 | | $162,973,559 | | 4,009,963 | | $61,549,371 |
|
36 SEMIANNUAL REPORT | | | | | | | | |
Notes to Financial Statements (unaudited) – continued
| | | | | Six months ended 2/28/06 | | Year ended 8/31/05(i) |
| | | | | Shares | | Amount | | Shares | | Amount |
| Shares reacquired | | | | | | | | |
| Class A | | (12,604,847) | | $(216,747,056) | | (14,437,115) | | $(224,139,499) |
| Class B | | (1,261,683) | | (21,162,492) | | (2,316,453) | | (34,824,715) |
| Class C | | (807,346) | | (13,481,331) | | (1,206,741) | | (17,997,574) |
| Class I | | (2,234,632) | | (39,804,568) | | (3,443,470) | | (55,618,095) |
| Class R | | (419,548) | | (7,277,481) | | (630,288) | | (9,740,922) |
| Class R1 | | | | (5,353) | | (88,882) | | (72) | | (1,129) |
| Class R2 | | | | (1,756) | | (28,630) | | — | | — |
| Class R3 | | | | (151,387) | | (2,573,582) | | (22,619) | | (345,295) |
| Class R4 | | | | (465) | | (8,325) | | — | | — |
| Class R5 | | | | (231,848) | | (4,114,940) | | — | | — |
| Class 529A | | | | (3,466) | | (60,185) | | (4,742) | | (74,061) |
| Class 529B | | | | (76) | | (1,285) | | (1,242) | | (18,403) |
| Class 529C | | | | (2,187) | | (36,030) | | (1,323) | | (19,683) |
|
| | | | | (17,724,594) | | $(305,384,787) | | (22,064,065) | | $(342,779,376) |
| Net change | | | | | | | | |
| Class A | | 4,095,335 | | $70,892,719 | | 15,944,878 | | $249,492,784 |
| Class B | | 1,063,091 | | 17,468,243 | | 386,375 | | 5,549,144 |
| Class C | | 1,174,857 | | 19,386,894 | | 1,337,672 | | 20,049,064 |
| Class I | | 9,741,247 | | 170,690,209 | | 17,767,428 | | 279,582,178 |
| Class R | | 623,079 | | 10,620,584 | | 1,297,519 | | 19,973,031 |
| Class R1 | | | | 21,935 | | 361,890 | | 10,680 | | 163,184 |
| Class R2 | | | | 198 | | 3,471 | | 11,113 | | 173,543 |
| Class R3 | | | | 204,897 | | 3,460,827 | | 112,977 | | 1,751,063 |
| Class R4 | | | | 144,247 | | 2,559,489 | | 3,201 | | 50,000 |
| Class R5 | | | | 5,302,262 | | 89,985,604 | | 3,201 | | 50,000 |
| Class 529A | | | | 16,438 | | 278,546 | | 22,602 | | 349,013 |
| Class 529B | | | | 2,876 | | 47,039 | | 2,894 | | 41,656 |
| Class 529C | | | | 2,856 | | 45,727 | | 8,135 | | 121,220 |
|
| | | | | 22,393,318 | | $385,801,242 | | 36,908,675 | | $577,345,880 |
| (i) | For the period from the class’ inception, April 1, 2005 (Classes R1, R2, R4, and R5) through the stated period end. |
| |
The fund is one of several mutual funds in which the MFS funds-of-funds may invest. The MFS funds-of-funds do not invest in the underlying MFS funds for the purpose of exercising management or control. At the end of the period, the MFS International Diversification Fund, the MFS Conservative Allocation Fund, the MFS Moderate Allocation Fund, the MFS Growth Allocation Fund, and the MFS Aggressive Growth Allocation Fund were the owners of record of approximately 11%, 1%, 7%, 12%, and 4%, respectively, of the value of outstanding voting shares. In addition, the MFS Lifetime 2010 Fund, the MFS Lifetime 2020 Fund, the MFS Lifetime 2030 Fund, and the MFS Lifetime 2040 Fund were all the owners of record of less than 1% of the value of outstanding voting shares.
SEMIANNUAL REPORT 37
Notes to Financial Statements (unaudited) – continued
(6) Line of Credit
The fund and other affiliated funds participate in a $1 billion unsecured line of credit provided by a syndication of banks under a credit agreement. Borrowings may be made for temporary financing needs. Interest is charged to each fund, based on its borrowings, at a rate equal to the Federal Reserve funds rate plus 0.35% . In addition, a commitment fee, based on the average daily, unused portion of the line of credit, is allocated among the participating funds at the end of each calendar quarter. The commitment fee allocated to the fund for the six months ended February 28, 2006 was $7,486, and is included in miscellaneous expense on the Statement of Operations. The fund had no significant borrowings during the six months ended February 28, 2006.
38 SEMIANNUAL REPORT
BOARD REVIEW OF INVESTMENT ADVISORY AGREEMENT
A discussion regarding the Board’s most recent review and renewal of the Fund’s investment advisory agreement is available by clicking on the fund’s name under ‘‘Select a fund’’ on the MFS Web site (mfs.com).
PROXY VOTING POLICIES AND INFORMATION
A general description of the MFS funds’ proxy voting policies and procedures is available without charge, upon request, by calling 1-800-225-2606, by visiting the Proxy Voting section of mfs.com or by visiting the SEC’s Web site at http://www.sec.gov.
Information regarding how the fund voted proxies relating to portfolio securities during the most recent twelve-month period ended June 30 is available without charge by visiting the Proxy Voting section of mfs.com or by visiting the SEC’s Web site at http://www.sec.gov.
QUARTERLY PORTFOLIO DISCLOSURE
The trust will file a complete schedule of portfolio holdings with the Securities and Exchange Commission (the Commission) for the first and third quarters of each fiscal year on Form N-Q. The trust’s Form N-Q may be reviewed and copied at the:
Public Reference Room
Securities and Exchange Commission
Washington, D.C. 20549-0102
Information on the operation of the Public Reference Room may be obtained by calling the Commission at 1-800-SEC-0330. The trust’s Form N-Q is available on the EDGAR database on the Commission’s Internet Web site at http://www.sec.gov, and copies of this information may be obtained, upon payment of a duplicating fee, by electronic request at the following e-mail address: publicinfo@sec.gov or by writing the Public Reference Section at the above address.
A shareholder can also obtain the quarterly portfolio holdings report at mfs.com.
SEMIANNUAL REPORT 39

ITEM 2. CODE OF ETHICS.
The Registrant has not amended any provision in its Code of Ethics (the “Code”) that relates to any element of the Code’s definition enumerated in paragraph (b) of Item 2 of this Form N-CSR.
ITEM 3. AUDIT COMMITTEE FINANCIAL EXPERT.
Not applicable for semi-annual reports.
ITEM 4. PRINCIPAL ACCOUNTANT FEES AND SERVICES.
Not applicable for semi-annual reports.
ITEM 5. AUDIT COMMITTEE OF LISTED REGISTRANTS.
Not applicable to the Registrant.
ITEM 6. SCHEDULE OF INVESTMENTS
A schedule of investments for each series of the Registrant is included as part of the report to shareholders of such series under Item 1 of this Form N-CSR.
ITEM 7. DISCLOSURE OF PROXY VOTING POLICIES AND PROCEDURES FOR CLOSED-END MANAGEMENT INVESTMENT COMPANIES.
Not applicable to the Registrant.
ITEM 8. PORTFOLIO MANAGERS OF CLOSED-END MANAGEMENT INVESTMENT COMPANIES.
Not applicable to the Registrant.
ITEM 9. PURCHASES OF EQUITY SECURITIES BY CLOSED-END MANAGEMENT INVESTMENT COMPANY AND AFFILIATED PURCHASERS.
Not applicable to the Registrant.
ITEM 10. SUBMISSION OF MATTERS TO A VOTE OF SECURITY HOLDERS.
There were no material changes to the procedures by which shareholders may send recommendations to the Board for nominees to the Registrant’s Board since the Registrant last provided disclosure as to such procedures in response to the requirements of Item 7(d)(2)(ii)(G) of Schedule 14A or this Item.
ITEM 11. CONTROLS AND PROCEDURES.
|
| (a) | Based upon their evaluation of the effectiveness of the registrant’s disclosure controls and procedures (as defined in Rule 30a-3(c)
under the Investment Company Act of 1940 (the “Act”)) as conducted within 90 days of the filing date of this Form N-CSR, the
registrant’s principal financial officer and principal executive officer have concluded that those disclosure controls and procedures
provide reasonable assurance that the material information required to be disclosed by the registrant on this report is
recorded, processed, summarized and reported within the time periods specified in the Securities and Exchange
Commission’s rules and forms. |
|
|
|
| (b) | There were no changes in the registrant’s internal controls over financial reporting (as defined in Rule 30a-3(d) under the Act)
that occurred during the second fiscal quarter of the period covered by the report that have materially affected, or are reasonably
likely to materially affect, the registrant’s internal control over financial reporting. |
| |
| |
| ITEM 12. EXHIBITS. |
| (a) | File the exhibits listed below as part of this Form. Letter or number the exhibits in the sequence indicated.
|
| | (1) Any code of ethics, or amendment thereto, that is the subject of the disclosure required by Item 2, to the extent that the
registrant intends to satisfy the Item 2 requirements through filing of an exhibit.
|
| | (2) A separate certification for each principal executive officer and principal financial officer of the registrant as required
by Rule 30a-2 under the Act (17 CFR 270.30a-2): Attached hereto.
|
| (b) | If the report is filed under Section 13(a) or 15(d) of the Exchange Act, provide the certifications required by Rule 30a-2(b)
under the Act (17 CFR 270.30a-2(b)), Rule 13a-14(b) or Rule 15d-14(b) under the Exchange Act (17 CFR 240.13a-14(b) or
240.15d-14(b)) and Section 1350 of Chapter 63 of Title 18 of the United States Code (18 U.S.C. 1350) as an exhibit. A
certification furnished pursuant to this paragraph will not be deemed “filed” for the purposes of Section 18 of the
Exchange Act (15 U.S.C. 78r), or otherwise subject to the liability of that section. Such certification will
not be deemed to be incorporated by reference into any filing under the Securities Act of 1933 or the Exchange Act,
except to the extent that the registrant specifically incorporates it by reference: Attached hereto. |
| |
| |
| |
| |
| |
Notice
A copy of the Amended and Restated Declaration of Trust of the Registrant is on file with the Secretary of State of the Commonwealth of Massachusetts and notice is hereby given that this instrument is executed on behalf of the Registrant by an officer of the Registrant as an officer and not individually and the obligations of or arising out of this instrument are not binding upon any of the Trustees or shareholders individually, but are binding only upon the assets and property of the respective constituent series of the Registrant.
SIGNATURES
Pursuant to the requirements of the Securities Exchange Act of 1934 and the Investment Company Act of 1940, the registrant has duly caused this report to be signed on its behalf by the undersigned, thereunto duly authorized.
| (Registrant) | MFS SERIES TRUST I |
By (Signature and Title)* | | MARIA F. DWYER |
| Maria F. Dwyer, President |
Date: April 24, 2006 | |
Pursuant to the requirements of the Securities Exchange Act of 1934 and the Investment Company Act of 1940, this report has been signed below by the following persons on behalf of the registrant and in the capacities and on the dates indicated.
| By (Signature and Title)* | MARIA F. DWYER |
| | Maria F. Dwyer, President (Principal Executive Officer) |
Date: April 24, 2006 | |
By (Signature and Title)* | TRACY ATKINSON |
| | Tracy Atkinson, Treasurer (Principal Financial Officer and |
| | Accounting Officer) |
Date: April 24, 2006 | |
* Print name and title of each signing officer under his or her signature. |
Exhibit A
Persons Covered by this Code of Ethics
Funds’ Principal Executive Officer: Maria F. Dwyer
Funds’ Principal Financial Officer: Tracy Atkinson