UNITED STATES
SECURITIES AND EXCHANGE COMMISSION
Washington, D.C. 20549
FORM N-CSR
CERTIFIED SHAREHOLDER REPORT OF
REGISTERED MANAGEMENT INVESTMENT COMPANIES
Investment Company Act file number 811-4777
MFS SERIES TRUST I
(Exact name of registrant as specified in charter)
500 Boylston Street, Boston, Massachusetts 02116
(Address of principal executive offices) (Zip code)
Susan S. Newton
Massachusetts Financial Services Company
500 Boylston Street
Boston, Massachusetts 02116
(Name and address of agents for service)
Registrant’s telephone number, including area code: (617) 954-5000
Date of fiscal year end: August 31
Date of reporting period: February 29, 2008
| ITEM 1. | REPORTS TO STOCKHOLDERS. |

MFS® Value Fund
The report is prepared for the general information of shareholders. It is authorized for distribution to prospective investors only when preceded or accompanied by a current prospectus.
NOT FDIC INSURED Ÿ MAY LOSE VALUE Ÿ
NO BANK OR CREDIT UNION GUARANTEE Ÿ NOT A DEPOSIT Ÿ
NOT INSURED BY ANY FEDERAL GOVERNMENT AGENCY OR
NCUA/NCUSIF
2/29/08
EIF-SEM

LETTER FROM THE CEO
Dear Shareholders:
Many of our MFS® fund shareholders have been justifiably concerned, as have most investors around the world, about the state of the global economy. As we enter 2008 we see the market volatility that began in the third quarter of 2007 has intensified.
We here at MFS, and those before us who guided the firm with the same disciplined investment process, have weathered many major economic disruptions over our eight-plus decades of managing clients’ investments. We have managed money through the Great Depression, 14 recessions, as well as numerous market crises caused by wars, political upheavals, and terrorist attacks. MFS remains in business because our investors believe in the integrity of our long-term investment strategy and its proven results.
Worries over market volatility are valid, and investors cannot always expect to see the kind of returns stocks have delivered in the bull markets of past years. Yet we believe our strategy of ADR — allocating across the major asset classes, diversifying within each class, and regularly rebalancing your portfolio to maintain your desired allocation — can help you pursue the highest investment returns while minimizing the effects of market fluctuations.
MFS is a world leader in domestic and global investing. Our team approach is research driven, globally integrated, and balanced. We have 176 investment management professionals located in the Americas, Europe, and Asia who focus on the fundamentals of each security and then integrate our sophisticated quantitative approach.* This collaborative process allows us to find opportunities in any market environment.
I personally would like to thank you for your continued business. We want you to be confident that we are constantly managing our fund offerings with you in mind, while adding new products that can help you to choose what fits your unique financial goals.
Respectfully,

Robert J. Manning
Chief Executive Officer and Chief Investment Officer
MFS Investment Management®
April 15, 2008
* as of 12/31/07
The opinions expressed in this letter are subject to change, may not be relied upon for investment advice, and no forecasts can be guaranteed.
1
PORTFOLIO COMPOSITION

| | |
| Top ten holdings | | |
| Lockheed Martin Corp. | | 4.1% |
| Altria Group, Inc. | | 3.2% |
| Allstate Corp. | | 3.1% |
| Exxon Mobil Corp. | | 3.0% |
| TOTAL S.A., ADR | | 2.8% |
| MetLife, Inc. | | 2.5% |
| Johnson & Johnson | | 2.3% |
| Bank of America Corp. | | 2.2% |
| AT&T, Inc. | | 2.0% |
| Bank of New York Mellon Corp. | | 1.8% |
| | |
| Equity sectors | | |
| Financial Services | | 24.1% |
| Energy | | 14.9% |
| Industrial Goods & Services | | 10.2% |
| Consumer Staples | | 9.8% |
| Health Care | | 9.1% |
| Utilities & Communications | | 8.1% |
| Technology | | 5.8% |
| Retailing | | 4.6% |
| Leisure | | 3.5% |
| Basic Materials | | 3.2% |
| Autos & Housing | | 2.9% |
| Special Products & Services | | 1.3% |
| Transportation | | 1.0% |
Percentages are based on net assets as of 2/29/08.
The portfolio is actively managed and current holdings may be different.
2
EXPENSE TABLE
Fund expenses borne by the shareholders during the period, September 1, 2007 through February 29, 2008
As a shareholder of the fund, you incur two types of costs: (1) transaction costs, including sales charges (loads) on certain purchase or redemption payments, and (2) ongoing costs, including management fees; distribution and service (12b-1) fees; and other fund expenses. This example is intended to help you understand your ongoing costs (in dollars) of investing in the fund and to compare these costs with the ongoing costs of investing in other mutual funds.
The example is based on an investment of $1,000 invested at the beginning of the period and held for the entire period September 1, 2007 through February 29, 2008.
Actual Expenses
The first line for each share class in the following table provides information about actual account values and actual expenses. You may use the information in this line, together with the amount you invested, to estimate the expenses that you paid over the period. Simply divide your account value by $1,000 (for example, an $8,600 account value divided by $1,000 = 8.6), then multiply the result by the number in the first line under the heading entitled “Expenses Paid During Period” to estimate the expenses you paid on your account during this period.
The actual expenses include the payment of a portion of the transfer-agent-related expenses of MFS funds that invest in the fund. For further information, please see the Notes to the Financial Statements.
Hypothetical Example for Comparison Purposes
The second line for each share class in the following table provides information about hypothetical account values and hypothetical expenses based on the fund’s actual expense ratio and an assumed rate of return of 5% per year before expenses, which is not the fund’s actual return. The hypothetical account values and expenses may not be used to estimate the actual ending account balance or expenses you paid for the period. You may use this information to compare the ongoing costs of investing in the fund and other funds. To do so, compare this 5% hypothetical example with the 5% hypothetical examples that appear in the shareholder reports of the other funds.
Please note that the expenses shown in the table are meant to highlight your ongoing costs only and do not reflect any transactional costs, such as sales charges (loads). Therefore, the second line for each share class in the table is useful in comparing ongoing costs only, and will not help you determine the relative total costs of owning different funds. In addition, if these transactional costs were included, your costs would have been higher.
3
Expense Table – continued
| | | | | | | | | | |
Share
Class | | | | Annualized
Expense
Ratio | | Beginning
Account Value
9/01/07 | | Ending
Account Value
2/29/08 | | Expenses
Paid During
Period (p)
9/01/07-2/29/08 |
| A | | Actual | | 1.09% | | $1,000.00 | | $932.59 | | $5.24 |
| | Hypothetical (h) | | 1.09% | | $1,000.00 | | $1,019.44 | | $5.47 |
| B | | Actual | | 1.74% | | $1,000.00 | | $929.82 | | $8.35 |
| | Hypothetical (h) | | 1.74% | | $1,000.00 | | $1,016.21 | | $8.72 |
| C | | Actual | | 1.74% | | $1,000.00 | | $929.55 | | $8.35 |
| | Hypothetical (h) | | 1.74% | | $1,000.00 | | $1,016.21 | | $8.72 |
| I | | Actual | | 0.74% | | $1,000.00 | | $934.63 | | $3.56 |
| | Hypothetical (h) | | 0.74% | | $1,000.00 | | $1,021.18 | | $3.72 |
| W | | Actual | | 0.84% | | $1,000.00 | | $933.93 | | $4.04 |
| | Hypothetical (h) | | 0.84% | | $1,000.00 | | $1,020.69 | | $4.22 |
| R | | Actual | | 1.24% | | $1,000.00 | | $932.23 | | $5.96 |
| | Hypothetical (h) | | 1.24% | | $1,000.00 | | $1,018.70 | | $6.22 |
| R1 | | Actual | | 1.84% | | $1,000.00 | | $929.32 | | $8.83 |
| | Hypothetical (h) | | 1.84% | | $1,000.00 | | $1,015.71 | | $9.22 |
| R2 | | Actual | | 1.38% | | $1,000.00 | | $931.37 | | $6.63 |
| | Hypothetical (h) | | 1.38% | | $1,000.00 | | $1,018.00 | | $6.92 |
| R3 | | Actual | | 1.34% | | $1,000.00 | | $931.61 | | $6.44 |
| | Hypothetical (h) | | 1.34% | | $1,000.00 | | $1,018.20 | | $6.72 |
| R4 | | Actual | | 1.09% | | $1,000.00 | | $932.73 | | $5.24 |
| | Hypothetical (h) | | 1.09% | | $1,000.00 | | $1,019.44 | | $5.47 |
| R5 | | Actual | | 0.81% | | $1,000.00 | | $934.27 | | $3.90 |
| | Hypothetical (h) | | 0.81% | | $1,000.00 | | $1,020.84 | | $4.07 |
| 529A | | Actual | | 1.34% | | $1,000.00 | | $931.72 | | $6.44 |
| | Hypothetical (h) | | 1.34% | | $1,000.00 | | $1,018.20 | | $6.72 |
| 529B | | Actual | | 1.99% | | $1,000.00 | | $928.59 | | $9.54 |
| | Hypothetical (h) | | 1.99% | | $1,000.00 | | $1,014.97 | | $9.97 |
| 529C | | Actual | | 1.99% | | $1,000.00 | | $928.56 | | $9.54 |
| | Hypothetical (h) | | 1.99% | | $1,000.00 | | $1,014.97 | | $9.97 |
| (h) | 5% class return per year before expenses. |
| (p) | Expenses paid is equal to each class’ annualized expense ratio, as shown above, multiplied by the average account value over the period, multiplied by the number of days in the period, divided by the number of days in the year. Expenses paid do not include any applicable sales charges (loads). If these transaction costs had been included, your costs would have been higher. |
Effective January 1, 2008 the fund’s Class R2, Class R3, Class R4, and Class R5 retirement plan administration and service fee was terminated (as described in Note 3 of the Notes to the Financial
4
Expense Table – continued
Statements). Had this fee change been in effect throughout the entire six month period, the annualized expense ratios would have been 1.21%, 1.24%, 0.99% and 0.74% for Class R2, Class R3, Class R4 and Class R5 shares respectively. The actual expenses paid during the period would have been approximately $5.83, $5.97, $4.77, and $3.57 and the hypothetical expenses paid during the period would have been approximately $6.09, $6.24, $4.99 and $3.73 for Class R2, Class R3, Class R4 and Class R5 shares, respectively.
Effective March 1, 2008 the fund’s Class R1 retirement plan administration and service fee was terminated and the Class R1 distribution fee was increased (as described in Note 3 of the Notes to the Financial Statements). Had these fee changes been in effect throughout the entire six month period, the annualized expense ratio would have been 1.74%. The actual expenses paid during the period would have been approximately $8.37 and the hypothetical expenses paid during the period would have been approximately $8.75.
Effective April 1, 2008 the fund’s Class 529A, 529B, and 529C shares program manager fee was reduced (as described in Note 3 of the Notes to Financial Statements). Had this fee change been in effect throughout the entire six month period, the annualized expense ratio would have been 1.19%, 1.84% and 1.84% for Class 529A, 529B and 529C shares, respectively. The actual expenses paid during the period would have been approximately $5.74, $8.85 and $8.85 and the hypothetical expenses paid during the period would have been approximately $5.99, $9.25 and $9.25 for Class 529A, Class 529B and Class 529C shares, respectively.
The actual expenses include the payment of a portion of the transfer-agent-related expenses of MFS funds that invest in the fund. For further information, please see the Notes to the Financial Statements.
5
PORTFOLIO OF INVESTMENTS
2/29/08 (unaudited)
The Portfolio of Investments is a complete list of all securities owned by your fund. It is categorized by broad-based asset classes.
| | | | | |
| Common Stocks - 98.5% | | | | | |
| Issuer | | Shares/Par | | Value ($) |
| | | | | |
| Aerospace - 7.7% | | | | | |
| | | | | |
| Lockheed Martin Corp. | | 3,918,570 | | $ | 404,396,416 |
| Northrop Grumman Corp. | | 1,959,080 | | | 154,003,279 |
| Raytheon Co. | | 434,240 | | | 28,156,122 |
| United Technologies Corp. | | 2,405,860 | | | 169,637,189 |
| | | | | |
| | | | | $ | 756,193,006 |
| Alcoholic Beverages - 1.1% | | | | | |
| Diageo PLC | | 5,390,689 | | $ | 110,141,720 |
| | |
| Apparel Manufacturers - 1.5% | | | | | |
| NIKE, Inc., “B” | | 2,463,560 | | $ | 148,306,312 |
| | |
| Automotive - 0.5% | | | | | |
| Johnson Controls, Inc. | | 1,404,630 | | $ | 46,156,142 |
| | |
| Broadcasting - 2.3% | | | | | |
| Omnicom Group, Inc. | | 1,831,000 | | $ | 81,790,770 |
| Walt Disney Co. | | 3,098,660 | | | 100,427,571 |
| WPP Group PLC | | 3,436,270 | | | 40,393,150 |
| | | | | |
| | | | | $ | 222,611,491 |
| Brokerage & Asset Managers - 3.7% | | | | | |
| Franklin Resources, Inc. | | 986,220 | | $ | 93,069,581 |
| Goldman Sachs Group, Inc. | | 858,550 | | | 145,635,837 |
| Lehman Brothers Holdings, Inc. | | 972,370 | | | 49,581,146 |
| Merrill Lynch & Co., Inc. | | 1,443,270 | | | 71,528,461 |
| | | | | |
| | | | | $ | 359,815,025 |
| Business Services - 1.3% | | | | | |
| Accenture Ltd., “A” | | 3,661,690 | | $ | 129,074,573 |
| | |
| Chemicals - 2.1% | | | | | |
| 3M Co. | | 449,830 | | $ | 35,266,672 |
| Dow Chemical Co. | | 881,240 | | | 33,213,936 |
| PPG Industries, Inc. | | 2,244,090 | | | 139,088,698 |
| | | | | |
| | | | | $ | 207,569,306 |
6
Portfolio of Investments (unaudited) – continued
| | | | | |
| Issuer | | Shares/Par | | Value ($) |
| | | | | |
| Common Stocks - continued | | | | | |
| Computer Software - 1.7% | | | | | |
| Oracle Corp. (a) | | 8,798,880 | | $ | 165,418,944 |
| | |
| Computer Software - Systems - 2.4% | | | | | |
| Hewlett-Packard Co. | | 1,886,420 | | $ | 90,114,283 |
| International Business Machines Corp. | | 1,227,220 | | | 139,731,269 |
| | | | | |
| | | | | $ | 229,845,552 |
| Construction - 2.4% | | | | | |
| Masco Corp. | | 6,314,150 | | $ | 118,011,464 |
| Sherwin-Williams Co. | | 754,110 | | | 39,047,816 |
| Toll Brothers, Inc. (a)(l) | | 3,632,390 | | | 77,042,992 |
| | | | | |
| | | | | $ | 234,102,272 |
| Consumer Goods & Services - 1.4% | | | | | |
| Procter & Gamble Co. | | 2,118,920 | | $ | 140,230,126 |
| | |
| Containers - 0.1% | | | | | |
| Smurfit-Stone Container Corp. (a) | | 1,528,180 | | $ | 12,149,031 |
| | |
| Electrical Equipment - 1.3% | | | | | |
| Rockwell Automation, Inc. | | 1,017,720 | | $ | 55,679,461 |
| W.W. Grainger, Inc. | | 962,780 | | | 70,918,375 |
| | | | | |
| | | | | $ | 126,597,836 |
| Electronics - 1.6% | | | | | |
| Intel Corp. | | 7,995,720 | | $ | 159,514,614 |
| | |
| Energy - Independent - 3.9% | | | | | |
| Apache Corp. | | 1,084,310 | | $ | 124,381,200 |
| Devon Energy Corp. | | 1,561,020 | | | 160,347,974 |
| EOG Resources, Inc. | | 790,330 | | | 94,041,367 |
| | | | | |
| | | | | $ | 378,770,541 |
| Energy - Integrated - 11.0% | | | | | |
| Chevron Corp. | | 984,544 | | $ | 85,320,583 |
| ConocoPhillips | | 1,633,160 | | | 135,078,664 |
| Exxon Mobil Corp. | | 3,337,860 | | | 290,427,199 |
| Hess Corp. | | 1,915,460 | | | 178,482,563 |
| Marathon Oil Corp. | | 1,243,070 | | | 66,081,601 |
| Royal Dutch Shell PLC, ADR | | 698,210 | | | 49,887,105 |
| TOTAL S.A., ADR | | 3,620,407 | | | 272,942,484 |
| | | | | |
| | | | | $ | 1,078,220,199 |
7
Portfolio of Investments (unaudited) – continued
| | | | | |
| Issuer | | Shares/Par | | Value ($) |
| | | | | |
| Common Stocks - continued | | | | | |
| Food & Beverages - 4.1% | | | | | |
| General Mills, Inc. | | 1,472,770 | | $ | 82,460,392 |
| Kellogg Co. | | 2,214,729 | | | 112,331,055 |
| Nestle S.A. | | 276,520 | | | 131,982,967 |
| PepsiCo, Inc. | | 994,396 | | | 69,170,186 |
| | | | | |
| | | | | $ | 395,944,600 |
| Food & Drug Stores - 1.0% | | | | | |
| CVS Caremark Corp. | | 2,545,267 | | $ | 102,777,881 |
| | |
| Gaming & Lodging - 1.2% | | | | | |
| Royal Caribbean Cruises Ltd. (l) | | 3,445,590 | | $ | 120,630,106 |
| | |
| General Merchandise - 1.3% | | | | | |
| Macy’s, Inc. | | 5,168,960 | | $ | 127,569,933 |
| | |
| Health Maintenance Organizations - 1.9% | | | | | |
| UnitedHealth Group, Inc. | | 1,580,820 | | $ | 73,476,514 |
| WellPoint, Inc. (a) | | 1,626,060 | | | 113,954,285 |
| | | | | |
| | | | | $ | 187,430,799 |
| Insurance - 8.8% | | | | | |
| Allstate Corp. | | 6,241,091 | | $ | 297,887,273 |
| Aon Corp. | | 585,400 | | | 24,358,494 |
| Chubb Corp. | | 1,165,020 | | | 59,299,518 |
| Genworth Financial, Inc., “A” | | 3,734,770 | | | 86,571,969 |
| Hartford Financial Services Group, Inc. | | 1,173,565 | | | 82,032,194 |
| MetLife, Inc. | | 4,225,360 | | | 246,169,474 |
| Prudential Financial, Inc. | | 843,300 | | | 61,535,601 |
| | | | | |
| | | | | $ | 857,854,523 |
| Machinery & Tools - 1.2% | | | | | |
| Eaton Corp. | | 366,920 | | $ | 29,584,760 |
| Ingersoll-Rand Co. Ltd., “A” | | 1,484,010 | | | 62,120,659 |
| Timken Co. | | 756,640 | | | 22,797,563 |
| | | | | |
| | | | | $ | 114,502,982 |
| Major Banks - 7.4% | | | | | |
| Bank of America Corp. | | 5,415,795 | | $ | 215,223,693 |
| Bank of New York Mellon Corp. | | 4,075,658 | | | 178,799,116 |
| PNC Financial Services Group, Inc. | | 1,533,040 | | | 94,174,647 |
| State Street Corp. | | 1,490,860 | | | 117,107,053 |
| SunTrust Banks, Inc. | | 1,949,020 | | | 113,296,533 |
| | | | | |
| | | | | $ | 718,601,042 |
8
Portfolio of Investments (unaudited) – continued
| | | | | |
| Issuer | | Shares/Par | | Value ($) |
| | | | | |
| Common Stocks - continued | | | | | |
| Network & Telecom - 0.1% | | | | | |
| Cisco Systems, Inc. (a) | | 426,840 | | $ | 10,402,091 |
| | |
| Other Banks & Diversified Financials - 4.2% | | | | | |
| American Express Co. | | 1,297,940 | | $ | 54,902,862 |
| Citigroup, Inc. | | 4,777,070 | | | 113,264,330 |
| Fannie Mae | | 3,820,450 | | | 105,635,443 |
| UBS AG | | 4,107,603 | | | 134,316,834 |
| | | | | |
| | | | | $ | 408,119,469 |
| Pharmaceuticals - 7.2% | | | | | |
| Abbott Laboratories | | 792,420 | | $ | 42,434,091 |
| GlaxoSmithKline PLC | | 2,134,770 | | | 46,831,761 |
| Johnson & Johnson | | 3,697,590 | | | 229,102,676 |
| Merck & Co., Inc. | | 3,363,520 | | | 149,003,936 |
| Pfizer, Inc. | | 2,791,660 | | | 62,198,185 |
| Wyeth | | 3,910,370 | | | 170,570,339 |
| | | | | |
| | | | | $ | 700,140,988 |
| Railroad & Shipping - 1.0% | | | | | |
| Burlington Northern Santa Fe Corp. | | 972,110 | | $ | 85,331,816 |
| Norfolk Southern Corp. | | 220,230 | | | 11,647,965 |
| | | | | |
| | | | | $ | 96,979,781 |
| Specialty Chemicals - 1.0% | | | | | |
| Air Products & Chemicals, Inc. | | 686,128 | | $ | 62,664,070 |
| Praxair, Inc. | | 468,810 | | | 37,636,067 |
| | | | | |
| | | | | $ | 100,300,137 |
| Specialty Stores - 0.8% | | | | | |
| Advance Auto Parts, Inc. | | 581,240 | | $ | 19,494,790 |
| Staples, Inc. | | 2,528,800 | | | 56,265,800 |
| | | | | |
| | | | | $ | 75,760,590 |
| Telecommunications - Wireless - 1.0% | | | | | |
| Vodafone Group PLC | | 30,064,673 | | $ | 96,545,720 |
| | |
| Telephone Services - 3.2% | | | | | |
| AT&T, Inc. | | 5,698,450 | | $ | 198,477,014 |
| Embarq Corp. | | 1,484,249 | | | 62,249,403 |
| Verizon Communications, Inc. | | 1,398,300 | | | 50,786,256 |
| | | | | |
| | | | | $ | 311,512,673 |
| Tobacco - 3.2% | | | | | |
| Altria Group, Inc. | | 4,223,090 | | $ | 308,876,803 |
9
Portfolio of Investments (unaudited) – continued
| | | | | | |
| Issuer | | Shares/Par | | Value ($) |
| | | | | | |
| Common Stocks - continued | | | | | | |
| Utilities - Electric Power - 3.9% | | | | | | |
| Dominion Resources, Inc. | | | 2,823,380 | | $ | 112,765,797 |
| Entergy Corp. | | | 711,050 | | | 73,053,277 |
| FPL Group, Inc. | | | 1,278,550 | | | 77,083,780 |
| PG&E Corp. | | | 962,090 | | | 36,232,309 |
| PPL Corp. | | | 654,600 | | | 29,705,748 |
| Public Service Enterprise Group, Inc. | | | 1,096,700 | | | 48,364,470 |
| | | | | | |
| | | | | | $ | 377,205,381 |
| Total Common Stocks (Identified Cost, $8,228,012,914) | | | | | $ | 9,615,872,189 |
| | |
| Repurchase Agreements - 1.5% | | | | | | |
| Merrill Lynch, 3.2%, dated 2/29/08, due 3/03/08, total to be received $146,940,174 (secured by U.S. Treasury and Federal Agency obligations and Mortgage Backed securities in a jointly traded account), at Cost | | $ | 146,901,000 | | $ | 146,901,000 |
| | |
| Collateral for Securities Loaned - 1.4% | | | | | | |
Navigator Securities Lending Prime Portfolio,
at Cost and Net Asset Value | | | 133,969,658 | | $ | 133,969,658 |
| Total Investments (Identified Cost, $8,508,883,572) | | | | | $ | 9,896,742,847 |
| | |
| Other Assets, Less Liabilities - (1.4)% | | | | | | (139,685,377) |
| Net Assets - 100.0% | | | | | $ | 9,757,057,470 |
| (a) | Non-income producing security. |
| (l) | All or a portion of this security is on loan. |
The following abbreviations are used in this report and are defined:
| ADR | | American Depository Receipt |
See Notes to Financial Statements
10
Financial Statements
STATEMENT OF ASSETS AND LIABILITIES
At 2/29/08 (unaudited)
This statement represents your fund’s balance sheet, which details the assets and liabilities comprising the total value of the fund.
| | | | |
| Assets | | | | |
| Investments, at value, including $131,134,140 of securities on loan (identified cost, $8,508,883,572) | | $9,896,742,847 | | |
| Cash | | 396 | | |
| Foreign currency, at value (identified cost, $13) | | 14 | | |
| Receivable for fund shares sold | | 31,672,439 | | |
| Interest and dividends receivable | | 20,427,787 | | |
| Other assets | | 115,882 | | |
| Total assets | | | | $9,948,959,365 |
| Liabilities | | | | |
| Payable for investments purchased | | 23,712,528 | | |
| Payable for fund shares reacquired | | 31,075,376 | | |
| Collateral for securities loaned, at value | | 133,969,658 | | |
| Payable to affiliates | | | | |
Management fee | | 319,824 | | |
Shareholder servicing costs | | 2,186,932 | | |
Distribution and service fees | | 223,517 | | |
Administrative services fee | | 6,712 | | |
Program manager fees | | 137 | | |
Retirement plan administration and services fees | | 414 | | |
| Payable for independent trustees’ compensation | | 25,145 | | |
| Accrued expenses and other liabilities | | 381,652 | | |
| Total liabilities | | | | $191,901,895 |
| Net assets | | | | $9,757,057,470 |
| Net assets consist of: | | | | |
| Paid-in capital | | $8,275,018,962 | | |
| Unrealized appreciation (depreciation) on investments and translation of assets and liabilities in foreign currencies | | 1,387,867,968 | | |
| Accumulated net realized gain (loss) on investments and foreign currency transactions | | 86,638,595 | | |
| Undistributed net investment income | | 7,531,945 | | |
| Net assets | | | | $9,757,057,470 |
| Shares of beneficial interest outstanding | | | | 402,148,194 |
11
Statement of Assets and Liabilities (unaudited) – continued
| | | | |
| Class A shares: | | | | |
Net assets | | $5,715,340,680 | | |
Shares outstanding | | 235,374,558 | | |
Net asset value per share | | | | $24.28 |
Offering price per share (100 / 94.25 × net asset value per share) | | | | $25.76 |
| Class B shares: | | | | |
Net assets | | $805,368,489 | | |
Shares outstanding | | 33,392,879 | | |
Net asset value and offering price per share | | | | $24.12 |
| Class C shares: | | | | |
Net assets | | $972,195,366 | | |
Shares outstanding | | 40,384,084 | | |
Net asset value and offering price per share | | | | $24.07 |
| Class I shares | | | | |
Net assets | | $1,508,272,171 | | |
Shares outstanding | | 61,800,268 | | |
Net asset value, offering price, and redemption price per share | | | | $24.41 |
| Class W shares | | | | |
Net assets | | $215,889,299 | | |
Shares outstanding | | 8,893,082 | | |
Net asset value, offering price, and redemption price per share | | | | $24.28 |
| Class R shares: | | | | |
Net assets | | $55,327,596 | | |
Shares outstanding | | 2,282,894 | | |
Net asset value, offering price, and redemption price per share | | | | $24.24 |
| Class R1 shares: | | | | |
Net assets | | $21,070,183 | | |
Shares outstanding | | 879,812 | | |
Net asset value, offering price, and redemption price per share | | | | $23.95 |
| Class R2 shares | | | | |
Net assets | | $27,024,145 | | |
Shares outstanding | | 1,122,226 | | |
Net asset value, offering price, and redemption price per share | | | | $24.08 |
| Class R3 shares | | | | |
Net assets | | $124,944,345 | | |
Shares outstanding | | 5,178,162 | | |
Net asset value, offering price, and redemption price per share | | | | $24.13 |
12
Statement of Assets and Liabilities (unaudited) – continued
| | | | |
| Class R4 shares | | | | |
Net assets | | $151,892,142 | | |
Shares outstanding | | 6,264,301 | | |
Net asset value, offering price, and redemption price per share | | | | $24.25 |
| Class R5 shares | | | | |
Net assets | | $150,011,073 | | |
Shares outstanding | | 6,171,551 | | |
Net asset value, offering price, and redemption price per share | | | | $24.31 |
| Class 529A shares | | | | |
Net assets | | $5,774,638 | | |
Shares outstanding | | 239,129 | | |
Net asset value per share | | | | $24.15 |
Offering price per share (100 / 94.25 × net asset value per share) | | | | $25.62 |
| Class 529B shares | | | | |
Net assets | | $1,649,548 | | |
Shares outstanding | | 69,033 | | |
Net asset value and offering price per share | | | | $23.90 |
| Class 529C shares | | | | |
Net assets | | $2,297,795 | | |
Shares outstanding | | 96,215 | | |
Net asset value and offering price per share | | | | $23.88 |
On sales of $50,000 or more, the offering prices of Class A and Class 529A shares are reduced. A contingent deferred sales charge may be imposed on redemptions of Class A, Class B, Class C, Class 529B, and Class 529C shares.
See Notes to Financial Statements
13
Financial Statements
STATEMENT OF OPERATIONS
Six months ended 2/29/08 (unaudited)
This statement describes how much your fund earned in investment income and accrued in expenses. It also describes any gains and/or losses generated by fund operations.
| | | | | | |
| Net investment income | | | | | | |
| Income | | | | | | |
Dividends | | $112,425,388 | | | | |
Interest | | 3,207,745 | | | | |
Foreign taxes withheld | | (941,532 | ) | | | |
| Total investment income | | | | | $114,691,601 | |
| Expenses | | | | | | |
Management fee | | $30,929,933 | | | | |
Distribution and service fees | | 21,565,034 | | | | |
Program manager fees | | 13,079 | | | | |
Shareholder servicing costs | | 6,564,468 | | | | |
Administrative services fee | | 378,191 | | | | |
Retirement plan administration and services fees | | 235,709 | | | | |
Independent trustees’ compensation | | 64,160 | | | | |
Custodian fee | | 421,684 | | | | |
Shareholder communications | | 264,059 | | | | |
Auditing fees | | 23,685 | | | | |
Legal fees | | 88,815 | | | | |
Miscellaneous | | 357,797 | | | | |
| Total expenses | | | | | $60,906,614 | |
Fees paid indirectly | | (4,981 | ) | | | |
Reduction of expenses by investment adviser | | (884,416 | ) | | | |
| Net expenses | | | | | $60,017,217 | |
| Net investment income | | | | | $54,674,384 | |
| Realized and unrealized gain (loss) on investments | | | | | | |
| Realized gain (loss) (identified cost basis) | | | | | | |
Investment transactions | | $283,435,793 | | | | |
Foreign currency transactions | | 104,892 | | | | |
Net realized gain (loss) on investments
and foreign currency transactions | | | | | $283,540,685 | |
| Change in unrealized appreciation (depreciation) | | | | | | |
Investments | | $(1,032,771,069 | ) | | | |
Translation of assets and liabilities in foreign currencies | | 12,073 | | | | |
Net unrealized gain (loss) on investments
and foreign currency translation | | | | | $(1,032,758,996 | ) |
Net realized and unrealized gain (loss) on investments
and foreign currency | | | | | $(749,218,311 | ) |
| Change in net assets from operations | | | | | $(694,543,927 | ) |
See Notes to Financial Statements
14
Financial Statements
STATEMENTS OF CHANGES IN NET ASSETS
These statements describe the increases and/or decreases in net assets resulting from operations, any distributions, and any shareholder transactions.
| | | | | | |
| | | Six months ended
2/29/08
(unaudited) | | | Year ended
8/31/07 | |
| | | |
| Change in net assets | | | | |
| From operations | | | | | | |
| Net investment income | | $54,674,384 | | | $97,833,887 | |
Net realized gain (loss) on investments and
foreign currency transactions | | 283,540,685 | | | 644,464,792 | |
Net unrealized gain (loss) on investments and
foreign currency translation | | (1,032,758,996 | ) | | 651,116,538 | |
| Change in net assets from operations | | $(694,543,927 | ) | | $1,393,415,217 | |
| Distributions declared to shareholders | | | | | | |
| From net investment income | | | | | | |
Class A | | $(39,491,325 | ) | | $(74,843,923 | ) |
Class B | | (2,758,583 | ) | | (7,854,264 | ) |
Class C | | (3,237,535 | ) | | (6,903,771 | ) |
Class I | | (12,625,098 | ) | | (22,163,116 | ) |
Class W | | (831,659 | ) | | (379,376 | ) |
Class R | | (328,649 | ) | | (1,172,262 | ) |
Class R1 | | (63,359 | ) | | (55,300 | ) |
Class R2 | | (67,075 | ) | | (73,907 | ) |
Class R3 | | (580,039 | ) | | (607,901 | ) |
Class R4 | | (941,369 | ) | | (984,911 | ) |
Class R5 | | (1,178,307 | ) | | (1,457,291 | ) |
Class 529A | | (32,076 | ) | | (56,466 | ) |
Class 529B | | (3,200 | ) | | (7,521 | ) |
Class 529C | | (4,494 | ) | | (10,543 | ) |
| From net realized gain on investments | | | | | | |
Class A | | (422,791,205 | ) | | (161,744,414 | ) |
Class B | | (65,938,831 | ) | | (34,846,208 | ) |
Class C | | (73,497,065 | ) | | (28,334,762 | ) |
Class I | | (106,851,483 | ) | | (37,523,913 | ) |
Class W | | (8,514,237 | ) | | (415,807 | ) |
Class R | | (3,981,123 | ) | | (3,323,744 | ) |
Class R1 | | (1,493,207 | ) | | (202,116 | ) |
Class R2 | | (1,069,576 | ) | | (177,924 | ) |
Class R3 | | (8,461,563 | ) | | (1,332,483 | ) |
Class R4 | | (11,062,481 | ) | | (1,724,464 | ) |
Class R5 | | (11,042,447 | ) | | (1,986,525 | ) |
Class 529A | | (431,704 | ) | | (129,843 | ) |
Class 529B | | (125,712 | ) | | (31,527 | ) |
Class 529C | | (174,133 | ) | | (45,316 | ) |
| Total distributions declared to shareholders | | $(777,577,535 | ) | | $(388,389,598 | ) |
| Change in net assets from fund share transactions | | $817,626,072 | | | $1,030,845,190 | |
| Total change in net assets | | $(654,495,390 | ) | | $2,035,870,809 | |
| Net assets | | | | | | |
| At beginning of period | | 10,411,552,860 | | | 8,375,682,051 | |
| At end of period (including undistributed net investment income of $7,531,945 and $15,000,329, respectively) | | $9,757,057,470 | | | $10,411,552,860 | |
See Notes to Financial Statements
15
Financial Statements
FINANCIAL HIGHLIGHTS
The financial highlights table is intended to help you understand the fund’s financial performance for the semiannual period and the past 5 fiscal years (or life of a particular share class, if shorter). Certain information reflects financial results for a single fund share. The total returns in the table represent the rate by which an investor would have earned (or lost) on an investment in the fund share class (assuming reinvestment of all distributions) held for the entire period.
| | | | | | | | | | | | | | | | | | |
| | | Six months
ended
2/29/08 (unaudited) | | | Years ended 8/31 | |
| Class A | | | 2007 | | | 2006 | | | 2005 | | | 2004 | | | 2003 | |
| | | | | | | | | | | | | | | | | |
Net asset value, beginning
of period | | $28.11 | | | $25.20 | | | $23.81 | | | $20.88 | | | $18.03 | | | $17.21 | |
Income (loss) from
investment operations | | | | | | | | | | | | | | | | | | |
Net investment income (d) | | $0.15 | | | $0.30 | | | $0.34 | | | $0.28 | | | $0.23 | | | $0.24 | |
Net realized and unrealized
gain (loss) on investments and
foreign currency | | (1.86 | ) | | 3.77 | | | 2.48 | | | 2.91 | | | 2.84 | | | 0.81 | |
| Total from investment operations | | $(1.71 | ) | | $4.07 | | | $2.82 | | | $3.19 | | | $3.07 | | | $1.05 | |
Less distributions declared
to shareholders | | | | | | | | | | | | | | | | | | |
From net investment income | | $(0.18 | ) | | $(0.36 | ) | | $(0.29 | ) | | $(0.26 | ) | | $(0.22 | ) | | $(0.23 | ) |
From net realized gain
on investments | | (1.94 | ) | | (0.80 | ) | | (1.14 | ) | | — | | | — | | | — | |
Total distributions declared
to shareholders | | $(2.12 | ) | | $(1.16 | ) | | $(1.43 | ) | | $(0.26 | ) | | $(0.22 | ) | | $(0.23 | ) |
| Net asset value, end of period | | $24.28 | | | $28.11 | | | $25.20 | | | $23.81 | | | $20.88 | | | $18.03 | |
| Total return (%) (r)(s)(t) | | (6.74 | )(n) | | 16.42 | | | 12.36 | | | 15.36 | | | 17.13 | (b) | | 6.22 | |
Ratios (%) (to average net
assets) and Supplemental data: | | | | | | | | | | | | | | | | | | |
Expenses before
expense reductions (f) | | 1.11 | (a) | | 1.13 | | | 1.17 | | | 1.16 | | | 1.18 | | | 1.20 | |
Expenses after
expense reductions (f) | | 1.09 | (a) | | 1.11 | | | 1.16 | | | 1.16 | | | 1.18 | | | N/A | |
| Net investment income | | 1.13 | (a) | | 1.10 | | | 1.40 | | | 1.23 | | | 1.14 | | | 1.41 | |
| Portfolio turnover | | 14 | | | 26 | | | 26 | | | 24 | | | 42 | | | 55 | |
Net assets at end of period
(000 Omitted) | | $5,715,341 | | | $6,239,176 | | | $4,929,525 | | | $4,554,484 | | | $3,527,854 | | | $3,039,085 | |
See Notes to Financial Statements
16
Financial Highlights – continued
| | | | | | | | | | | | | | | | | | |
| | | Six months
ended
2/29/08 (unaudited) | | | Years ended 8/31 | |
| Class B | | | 2007 | | | 2006 | | | 2005 | | | 2004 | | | 2003 | |
| | | | | | | | | | | | | | | | | |
Net asset value, beginning
of period | | $27.92 | | | $25.04 | | | $23.66 | | | $20.77 | | | $17.94 | | | $17.13 | |
Income (loss) from
investment operations | | | | | | | | | | | | | | | | | | |
Net investment income (d) | | $0.07 | | | $0.12 | | | $0.17 | | | $0.13 | | | $0.10 | | | $0.12 | |
Net realized and unrealized
gain (loss) on investments and
foreign currency | | (1.85 | ) | | 3.74 | | | 2.49 | | | 2.90 | | | 2.83 | | | 0.81 | |
| Total from investment operations | | $(1.78 | ) | | $3.86 | | | $2.66 | | | $3.03 | | | $2.93 | | | $0.93 | |
Less distributions declared
to shareholders | | | | | | | | | | | | | | | | | | |
From net investment income | | $(0.08 | ) | | $(0.18 | ) | | $(0.14 | ) | | $(0.14 | ) | | $(0.10 | ) | | $(0.12 | ) |
From net realized gain
on investments | | (1.94 | ) | | (0.80 | ) | | (1.14 | ) | | — | | | — | | | — | |
Total distributions declared
to shareholders | | $(2.02 | ) | | $(0.98 | ) | | $(1.28 | ) | | $(0.14 | ) | | $(0.10 | ) | | $(0.12 | ) |
| Net asset value, end of period | | $24.12 | | | $27.92 | | | $25.04 | | | $23.66 | | | $20.77 | | | $17.94 | |
| Total return (%) (r)(s)(t) | | (7.02 | )(n) | | 15.64 | | | 11.66 | | | 14.61 | | | 16.35 | (b) | | 5.50 | |
Ratios (%) (to average net
assets) and Supplemental data: | | | | | | | | | | | | | | | | | | |
Expenses before
expense reductions (f) | | 1.76 | (a) | | 1.78 | | | 1.82 | | | 1.81 | | | 1.82 | | | 1.85 | |
Expenses after
expense reductions (f) | | 1.74 | (a) | | 1.76 | | | 1.81 | | | 1.81 | | | 1.82 | | | N/A | |
| Net investment income | | 0.48 | (a) | | 0.44 | | | 0.72 | | | 0.58 | | | 0.49 | | | 0.76 | |
| Portfolio turnover | | 14 | | | 26 | | | 26 | | | 24 | | | 42 | | | 55 | |
Net assets at end of period
(000 Omitted) | | $805,368 | | | $1,049,401 | | | $1,139,651 | | | $1,262,029 | | | $1,199,074 | | | $1,069,389 | |
See Notes to Financial Statements
17
Financial Highlights – continued
| | | | | | | | | | | | | | | | | | |
| | | Six months
ended
2/29/08 (unaudited) | | | Years ended 8/31 | |
| Class C | | | 2007 | | | 2006 | | | 2005 | | | 2004 | | | 2003 | |
| | | | | | | | | | | | | | | | | |
Net asset value, beginning
of period | | $27.88 | | | $25.01 | | | $23.64 | | | $20.75 | | | $17.93 | | | $17.12 | |
Income (loss) from
investment operations | | | | | | | | | | | | | | | | | | |
Net investment income (d) | | $0.06 | | | $0.12 | | | $0.18 | | | $0.13 | | | $0.10 | | | $0.12 | |
Net realized and unrealized
gain (loss) on investments and
foreign currency | | (1.84 | ) | | 3.74 | | | 2.47 | | | 2.90 | | | 2.82 | | | 0.81 | |
| Total from investment operations | | $(1.78 | ) | | $3.86 | | | $2.65 | | | $3.03 | | | $2.92 | | | $0.93 | |
Less distributions declared
to shareholders | | | | | | | | | | | | | | | | | | |
From net investment income | | $(0.09 | ) | | $(0.19 | ) | | $(0.14 | ) | | $(0.14 | ) | | $(0.10 | ) | | $(0.12 | ) |
From net realized gain
on investments | | (1.94 | ) | | (0.80 | ) | | (1.14 | ) | | — | | | — | | | — | |
Total distributions declared
to shareholders | | $(2.03 | ) | | $(0.99 | ) | | $(1.28 | ) | | $(0.14 | ) | | $(0.10 | ) | | $(0.12 | ) |
| Net asset value, end of period | | $24.07 | | | $27.88 | | | $25.01 | | | $23.64 | | | $20.75 | | | $17.93 | |
| Total return (%) (r)(s)(t) | | (7.04 | )(n) | | 15.66 | | | 11.65 | | | 14.63 | | | 16.32 | (b) | | 5.52 | |
Ratios (%) (to average net
assets) and Supplemental data: | | | | | | | | | | | | | | | | | | |
Expenses before
expense reductions (f) | | 1.76 | (a) | | 1.78 | | | 1.82 | | | 1.81 | | | 1.82 | | | 1.85 | |
Expenses after
expense reductions (f) | | 1.74 | (a) | | 1.76 | | | 1.81 | | | 1.81 | | | 1.82 | | | N/A | |
| Net investment income | | 0.48 | (a) | | 0.45 | | | 0.74 | | | 0.58 | | | 0.49 | | | 0.76 | |
| Portfolio turnover | | 14 | | | 26 | | | 26 | | | 24 | | | 42 | | | 55 | |
Net assets at end of period
(000 Omitted) | | $972,195 | | | $1,052,467 | | | $881,538 | | | $863,486 | | | $761,669 | | | $648,318 | |
See Notes to Financial Statements
18
Financial Highlights – continued
| | | | | | | | | | | | | | | | | | |
| | | Six months
ended
2/29/08 (unaudited) | | | Years ended 8/31 | |
| Class I | | | 2007 | | | 2006 | | | 2005 | | | 2004 | | | 2003 | |
| | | | | | | | | | | | | | | | | |
Net asset value, beginning
of period | | $28.24 | | | $25.32 | | | $23.91 | | | $20.95 | | | $18.10 | | | $17.27 | |
Income (loss) from
investment operations | | | | | | | | | | | | | | | | | | |
Net investment income (d) | | $0.20 | | | $0.40 | | | $0.43 | | | $0.37 | | | $0.30 | | | $0.30 | |
Net realized and unrealized
gain (loss) on investments and
foreign currency | | (1.86 | ) | | 3.77 | | | 2.49 | | | 2.91 | | | 2.84 | | | 0.82 | |
| Total from investment operations | | $(1.66 | ) | | $4.17 | | | $2.92 | | | $3.28 | | | $3.14 | | | $1.12 | |
Less distributions declared
to shareholders | | | | | | | | | | | | | | | | | | |
From net investment income | | $(0.23 | ) | | $(0.45 | ) | | $(0.37 | ) | | $(0.32 | ) | | $(0.29 | ) | | $(0.29 | ) |
From net realized gain
on investments | | (1.94 | ) | | (0.80 | ) | | (1.14 | ) | | — | | | — | | | — | |
Total distributions declared
to shareholders | | $(2.17 | ) | | $(1.25 | ) | | $(1.51 | ) | | $(0.32 | ) | | $(0.29 | ) | | $(0.29 | ) |
| Net asset value, end of period | | $24.41 | | | $28.24 | | | $25.32 | | | $23.91 | | | $20.95 | | | $18.10 | |
| Total return (%) (r)(s) | | (6.54 | )(n) | | 16.78 | | | 12.78 | | | 15.78 | | | 17.47 | (b) | | 6.61 | |
Ratios (%) (to average net
assets) and Supplemental data: | | | | | | | | | | | | | | | | | | |
Expenses before
expense reductions (f) | | 0.76 | (a) | | 0.78 | | | 0.82 | | | 0.81 | | | 0.83 | | | 0.85 | |
Expenses after
expense reductions (f) | | 0.74 | (a) | | 0.76 | | | 0.81 | | | 0.81 | | | 0.83 | | | N/A | |
| Net investment income | | 1.49 | (a) | | 1.45 | | | 1.77 | | | 1.59 | | | 1.50 | | | 1.76 | |
| Portfolio turnover | | 14 | | | 26 | | | 26 | | | 24 | | | 42 | | | 55 | |
Net assets at end of period
(000 Omitted) | | $1,508,272 | | | $1,529,643 | | | $1,162,665 | | | $899,654 | | | $593,364 | | | $296,961 | |
See Notes to Financial Statements
19
Financial Highlights – continued
| | | | | | | | | |
| | | Six months
ended
2/29/08 (unaudited) | | | Years ended 8/31 | |
| Class W | | | 2007 | | | 2006 (i) | |
| | | | | | | | |
Net asset value, beginning
of period | | $28.11 | | | $25.20 | | | $25.04 | |
Income (loss) from
investment operations | | | | | | | | | |
Net investment income (d) | | $0.18 | | | $0.37 | | | $0.24 | |
Net realized and unrealized
gain (loss) on investments and
foreign currency | | (1.85 | ) | | 3.77 | | | 0.02 | (g) |
| Total from investment operations | | $(1.67 | ) | | $4.14 | | | $0.26 | |
Less distributions declared
to shareholders | | | | | | | | | |
From net investment income | | $(0.22 | ) | | $(0.43 | ) | | $(0.10 | ) |
From net realized gain
on investments | | (1.94 | ) | | (0.80 | ) | | — | |
Total distributions declared
to shareholders | | $(2.16 | ) | | $(1.23 | ) | | $(0.10 | ) |
| Net asset value, end of period | | $24.28 | | | $28.11 | | | $25.20 | |
| Total return (%) (r)(s) | | (6.61 | )(n) | | 16.73 | | | 1.05 | (n) |
Ratios (%) (to average net
assets) and Supplemental data: | | | | | | | | | |
Expenses before
expense reductions (f) | | 0.86 | (a) | | 0.88 | | | 0.92 | (a) |
Expenses after
expense reductions (f) | | 0.84 | (a) | | 0.86 | | | 0.91 | (a) |
| Net investment income | | 1.41 | (a) | | 1.37 | | | 3.32 | (a) |
| Portfolio turnover | | 14 | | | 26 | | | 26 | |
Net assets at end of period
(000 Omitted) | | $215,889 | | | $69,115 | | | $8,952 | |
See Notes to Financial Statements
20
Financial Highlights – continued
| | | | | | | | | | | | | | | | | | |
| | | Six months
ended
2/29/08 (unaudited) | | | Years ended 8/31 | |
| Class R | | | 2007 | | | 2006 | | | 2005 | | | 2004 | | | 2003 (i) | |
| | | | | | | | | | | | | | | | | |
Net asset value, beginning
of period | | $28.05 | | | $25.15 | | | $23.76 | | | $20.84 | | | $18.01 | | | $16.53 | |
Income (loss) from
investment operations | | | | | | | | | | | | | | | | | | |
Net investment income (d) | | $0.13 | | | $0.26 | | | $0.30 | | | $0.25 | | | $0.21 | | | $0.15 | |
Net realized and unrealized
gain (loss) on investments and
foreign currency | | (1.85 | ) | | 3.75 | | | 2.49 | | | 2.90 | | | 2.82 | | | 1.45 | |
| Total from investment operations | | $(1.72 | ) | | $4.01 | | | $2.79 | | | $3.15 | | | $3.03 | | | $1.60 | |
Less distributions declared
to shareholders | | | | | | | | | | | | | | | | | | |
From net investment income | | $(0.15 | ) | | $(0.31 | ) | | $(0.26 | ) | | $(0.23 | ) | | $(0.20 | ) | | $(0.12 | ) |
From net realized gain
on investments | | (1.94 | ) | | (0.80 | ) | | (1.14 | ) | | — | | | — | | | — | |
Total distributions declared
to shareholders | | $(2.09 | ) | | $(1.11 | ) | | $(1.40 | ) | | $(0.23 | ) | | $(0.20 | ) | | $(0.12 | ) |
| Net asset value, end of period | | $24.24 | | | $28.05 | | | $25.15 | | | $23.76 | | | $20.84 | | | $18.01 | |
| Total return (%) (r)(s) | | (6.78 | )(n) | | 16.22 | | | 12.22 | | | 15.21 | | | 16.92 | (b) | | 9.76 | (n) |
Ratios (%) (to average net
assets) and Supplemental data: | | | | | | | | | | | | | | | | | | |
Expenses before
expense reductions (f) | | 1.26 | (a) | | 1.28 | | | 1.31 | | | 1.31 | | | 1.33 | | | 1.42 | (a) |
Expenses after
expense reductions (f) | | 1.24 | (a) | | 1.26 | | | 1.31 | | | 1.31 | | | 1.33 | | | N/A | |
| Net investment income | | 1.00 | (a) | | 0.94 | | | 1.24 | | | 1.10 | | | 1.02 | | | 1.26 | (a) |
| Portfolio turnover | | 14 | | | 26 | | | 26 | | | 24 | | | 42 | | | 55 | |
Net assets at end of period
(000 Omitted) | | $55,328 | | | $67,300 | | | $101,162 | | | $85,302 | | | $47,970 | | | $14,583 | |
See Notes to Financial Statements
21
Financial Highlights – continued
| | | | | | | | | | | | |
| | | Six months
ended
2/29/08 (unaudited) | | | Years ended 8/31 | |
| Class R1 | | | 2007 | | | 2006 | | | 2005 (i) | |
| | | | | | | | | | | |
Net asset value, beginning
of period | | $27.76 | | | $24.93 | | | $23.63 | | | $23.17 | |
Income (loss) from
investment operations | | | | | | | | | | | | |
Net investment income (d) | | $0.05 | | | $0.10 | | | $0.22 | | | $0.09 | |
Net realized and unrealized
gain (loss) on investments and
foreign currency | | (1.83 | ) | | 3.72 | | | 2.39 | | | 0.42 | (g) |
| Total from investment operations | | $(1.78 | ) | | $3.82 | | | $2.61 | | | $0.51 | |
Less distributions declared
to shareholders | | | | | | | | | | | | |
From net investment income | | $(0.09 | ) | | $(0.19 | ) | | $(0.17 | ) | | $(0.05 | ) |
From net realized gain
on investments | | (1.94 | ) | | (0.80 | ) | | (1.14 | ) | | — | |
Total distributions declared
to shareholders | | $(2.03 | ) | | $(0.99 | ) | | $(1.31 | ) | | $(0.05 | ) |
| Net asset value, end of period | | $23.95 | | | $27.76 | | | $24.93 | | | $23.63 | |
| Total return (%) (r)(s) | | (7.07 | )(n) | | 15.55 | | | 11.51 | | | 2.21 | (n) |
Ratios (%) (to average net
assets) and Supplemental data: | | | | | | | | | | | | |
Expenses before
expense reductions (f) | | 1.86 | (a) | | 1.92 | | | 2.02 | | | 2.04 | (a) |
Expenses after
expense reductions (f) | | 1.84 | (a) | | 1.86 | | | 1.92 | | | 2.04 | (a) |
| Net investment income | | 0.36 | (a) | | 0.36 | | | 0.93 | | | 0.89 | (a) |
| Portfolio turnover | | 14 | | | 26 | | | 26 | | | 24 | |
Net assets at end of period
(000 Omitted) | | $21,070 | | | $15,823 | | | $4,639 | | | $574 | |
See Notes to Financial Statements
22
Financial Highlights – continued
| | | | | | | | | | | | |
| | | Six months
ended
2/29/08 (unaudited) | | | Years ended 8/31 | |
| Class R2 | | | 2007 | | | 2006 | | | 2005 (i) | |
| | | | | | | | | | | |
Net asset value, beginning
of period | | $27.88 | | | $25.03 | | | $23.67 | | | $23.17 | |
Income (loss) from
investment operations | | | | | | | | | | | | |
Net investment income (d) | | $0.11 | | | $0.19 | | | $0.30 | | | $0.11 | |
Net realized and unrealized
gain (loss) on investments and
foreign currency | | (1.84 | ) | | 3.74 | | | 2.42 | | | 0.43 | (g) |
| Total from investment operations | | $(1.73 | ) | | $3.93 | | | $2.72 | | | $0.54 | |
Less distributions declared
to shareholders | | | | | | | | | | | | |
From net investment income | | $(0.13 | ) | | $(0.28 | ) | | $(0.22 | ) | | $(0.04 | ) |
From net realized gain
on investments | | (1.94 | ) | | (0.80 | ) | | (1.14 | ) | | — | |
Total distributions declared
to shareholders | | $(2.07 | ) | | $(1.08 | ) | | $(1.36 | ) | | $(0.04 | ) |
| Net asset value, end of period | | $24.08 | | | $27.88 | | | $25.03 | | | $23.67 | |
| Total return (%) (r)(s) | | (6.86 | )(n) | | 15.92 | | | 11.96 | | | 2.34 | (n) |
Ratios (%) (to average net
assets) and Supplemental data: | | | | | | | | | | | | |
Expenses before
expense reductions (f) | | 1.40 | (a) | | 1.59 | | | 1.71 | | | 1.73 | (a) |
Expenses after
expense reductions (f) | | 1.38 | (a) | | 1.51 | | | 1.57 | | | 1.73 | (a) |
| Net investment income | | 0.79 | (a) | | 0.71 | | | 1.33 | | | 1.49 | (a) |
| Portfolio turnover | | 14 | | | 26 | | | 26 | | | 24 | |
Net assets at end of period
(000 Omitted) | | $27,024 | | | $12,743 | | | $4,520 | | | $732 | |
See Notes to Financial Statements
23
Financial Highlights – continued
| | | | | | | | | | | | | | | |
| | | Six months
ended
2/29/08 (unaudited) | | | Years ended 8/31 | |
| Class R3 | | | 2007 | | | 2006 | | | 2005 | | | 2004 (i) | |
| | | | | | | | | | | | | | |
Net asset value, beginning
of period | | $27.94 | | | $25.07 | | | $23.71 | | | $20.84 | | | $18.73 | |
Income (loss) from
investment operations | | | | | | | | | | | | | | | |
Net investment income (d) | | $0.12 | | | $0.22 | | | $0.31 | | | $0.21 | | | $0.11 | |
Net realized and unrealized
gain (loss) on investments and
foreign currency | | (1.85 | ) | | 3.75 | | | 2.43 | | | 2.88 | | | 2.12 | |
| Total from investment operations | | $(1.73 | ) | | $3.97 | | | $2.74 | | | $3.09 | | | $2.23 | |
Less distributions declared
to shareholders | | | | | | | | | | | | | | | |
From net investment income | | $(0.14 | ) | | $(0.30 | ) | | $(0.24 | ) | | $(0.22 | ) | | $(0.12 | ) |
From net realized gain
on investments | | (1.94 | ) | | (0.80 | ) | | (1.14 | ) | | — | | | — | |
Total distributions declared
to shareholders | | $(2.08 | ) | | $(1.10 | ) | | $(1.38 | ) | | $(0.22 | ) | | $(0.12 | ) |
| Net asset value, end of period | | $24.13 | | | $27.94 | | | $25.07 | | | $23.71 | | | $20.84 | |
| Total return (%) (r)(s) | | (6.84 | )(n) | | 16.07 | | | 12.03 | | | 14.91 | | | 11.93 | (b)(n) |
Ratios (%) (to average net
assets) and Supplemental data: | | | | | | | | | | | | | | | |
Expenses before
expense reductions (f) | | 1.36 | (a) | | 1.47 | | | 1.56 | | | 1.57 | | | 1.59 | (a) |
Expenses after
expense reductions (f) | | 1.34 | (a) | | 1.41 | | | 1.47 | | | 1.57 | | | 1.59 | (a) |
| Net investment income | | 0.88 | (a) | | 0.81 | | | 1.27 | | | 0.93 | | | 0.80 | (a) |
| Portfolio turnover | | 14 | | | 26 | | | 26 | | | 24 | | | 42 | |
Net assets at end of period
(000 Omitted) | | $124,944 | | | $98,970 | | | $30,001 | | | $8,316 | | | $414 | |
See Notes to Financial Statements
24
Financial Highlights – continued
| | | | | | | | | | | | |
| | | Six months
ended
2/29/08 (unaudited) | | | Years ended 8/31 | |
| Class R4 | | | 2007 | | | 2006 | | | 2005 (i) | |
| | | | | | | | | | | |
Net asset value, beginning
of period | | $28.07 | | | $25.17 | | | $23.81 | | | $23.29 | |
Income (loss) from
investment operations | | | | | | | | | | | | |
Net investment income (d) | | $0.15 | | | $0.30 | | | $0.42 | | | $0.15 | |
Net realized and unrealized
gain (loss) on investments and
foreign currency | | (1.85 | ) | | 3.75 | | | 2.39 | | | 0.44 | (g) |
| Total from investment operations | | $(1.70 | ) | | $4.05 | | | $2.81 | | | $0.59 | |
Less distributions declared
to shareholders | | | | | | | | | | | | |
From net investment income | | $(0.18 | ) | | $(0.35 | ) | | $(0.31 | ) | | $(0.07 | ) |
From net realized gain
on investments | | (1.94 | ) | | (0.80 | ) | | (1.14 | ) | | — | |
Total distributions declared
to shareholders | | $(2.12 | ) | | $(1.15 | ) | | $(1.45 | ) | | $(0.07 | ) |
| Net asset value, end of period | | $24.25 | | | $28.07 | | | $25.17 | | | $23.81 | |
| Total return (%) (r)(s) | | (6.73 | ) (n) | | 16.38 | | | 12.33 | | | 2.53 | (n) |
Ratios (%) (to average net
assets) and Supplemental data: | | | | | | | | | | | | |
Expenses before
expense reductions (f) | | 1.11 | (a) | | 1.18 | | | 1.22 | | | 1.23 | (a) |
Expenses after
expense reductions (f) | | 1.09 | (a) | | 1.16 | | | 1.22 | | | 1.23 | (a) |
| Net investment income | | 1.13 | (a) | | 1.07 | | | 1.80 | | | 1.94 | (a) |
| Portfolio turnover | | 14 | | | 26 | | | 26 | | | 24 | |
Net assets at end of period
(000 Omitted) | | $151,892 | | | $128,909 | | | $46,731 | | | $400 | |
See Notes to Financial Statements
25
Financial Highlights – continued
| | | | | | | | | | | | |
| | | Six months
ended
2/29/08 (unaudited) | | | Years ended 8/31 | |
| Class R5 | | | 2007 | | | 2006 | | | 2005 (i) | |
| | | | | | | | | | | |
Net asset value, beginning
of period | | $28.13 | | | $25.22 | | | $23.83 | | | $23.29 | |
Income (loss) from
investment operations | | | | | | | | | | | | |
Net investment income (d) | | $0.19 | | | $0.39 | | | $0.45 | | | $0.15 | |
Net realized and unrealized
gain (loss) on investments and
foreign currency | | (1.85 | ) | | 3.75 | | | 2.43 | | | 0.47 | (g) |
| Total from investment operations | | $(1.66 | ) | | $4.14 | | | $2.88 | | | $0.62 | |
Less distributions declared
to shareholders | | | | | | | | | | | | |
From net investment income | | $(0.22 | ) | | $(0.43 | ) | | $(0.35 | ) | | $(0.08 | ) |
From net realized gain
on investments | | (1.94 | ) | | (0.80 | ) | | (1.14 | ) | | — | |
Total distributions declared
to shareholders | | $(2.16 | ) | | $(1.23 | ) | | $(1.49 | ) | | $(0.08 | ) |
| Net asset value, end of period | | $24.31 | | | $28.13 | | | $25.22 | | | $23.83 | |
| Total return (%) (r)(s) | | (6.57 | )(n) | | 16.70 | | | 12.64 | | | 2.68 | (n) |
Ratios (%) (to average net
assets) and Supplemental data: | | | | | | | | | | | | |
Expenses before
expense reductions (f) | | 0.83 | (a) | | 0.88 | | | 0.92 | | | 0.92 | (a) |
Expenses after
expense reductions (f) | | 0.81 | (a) | | 0.86 | | | 0.91 | | | 0.92 | (a) |
| Net investment income | | 1.43 | (a) | | 1.39 | | | 1.80 | | | 1.57 | (a) |
| Portfolio turnover | | 14 | | | 26 | | | 26 | | | 24 | |
Net assets at end of period
(000 Omitted) | | $150,011 | | | $137,524 | | | $60,124 | | | $51 | |
See Notes to Financial Statements
26
Financial Highlights – continued
| | | | | | | | | | | | | | | | | | |
| | | Six months
ended
2/29/08 (unaudited) | | | Years ended 8/31 | |
| Class 529A | | | 2007 | | | 2006 | | | 2005 | | | 2004 | | | 2003 | |
| | | | | | | | | | | | | | | | | |
Net asset value, beginning
of period | | $27.96 | | | $25.09 | | | $23.71 | | | $20.80 | | | $18.00 | | | $17.21 | |
Income (loss) from
investment operations | | | | | | | | | | | | | | | | | | |
Net investment income (d) | | $0.12 | | | $0.23 | | | $0.28 | | | $0.23 | | | $0.18 | | | $0.20 | |
Net realized and unrealized
gain (loss) on investments and
foreign currency | | (1.85 | ) | | 3.74 | | | 2.48 | | | 2.90 | | | 2.80 | | | 0.81 | |
| Total from investment operations | | $(1.73 | ) | | $3.97 | | | $2.76 | | | $3.13 | | | $2.98 | | | $1.01 | |
Less distributions declared
to shareholders | | | | | | | | | | | | | | | | | | |
From net investment income | | $(0.14 | ) | | $(0.30 | ) | | $(0.24 | ) | | $(0.22 | ) | | $(0.18 | ) | | $(0.22 | ) |
From net realized gain
on investments | | (1.94 | ) | | (0.80 | ) | | (1.14 | ) | | — | | | — | | | — | |
Total distributions declared
to shareholders | | $(2.08 | ) | | $(1.10 | ) | | $(1.38 | ) | | $(0.22 | ) | | $(0.18 | ) | | $(0.22 | ) |
| Net asset value, end of period | | $24.15 | | | $27.96 | | | $25.09 | | | $23.71 | | | $20.80 | | | $18.00 | |
| Total return (%) (r)(s)(t) | | (6.83 | )(n) | | 16.09 | | | 12.11 | | | 15.09 | | | 16.63 | (b) | | 5.98 | |
Ratios (%) (to average net
assets) and Supplemental data: | | | | | | | | | | | | | | | | | | |
Expenses before
expense reductions (f) | | 1.36 | (a) | | 1.38 | | | 1.42 | | | 1.41 | | | 1.43 | | | 1.48 | |
Expenses after
expense reductions (f) | | 1.34 | (a) | | 1.36 | | | 1.41 | | | 1.41 | | | 1.43 | | | N/A | |
| Net investment income | | 0.88 | (a) | | 0.85 | | | 1.18 | | | 0.99 | | | 0.91 | | | 1.20 | |
| Portfolio turnover | | 14 | | | 26 | | | 26 | | | 24 | | | 42 | | | 55 | |
Net assets at end of period
(000 Omitted) | | $5,775 | | | $6,194 | | | $3,947 | | | $2,914 | | | $1,673 | | | $806 | |
See Notes to Financial Statements
27
Financial Highlights – continued
| | | | | | | | | | | | | | | | | | |
| | | Six months
ended
2/29/08 (unaudited) | | | Years ended 8/31 | |
| Class 529B | | | 2007 | | | 2006 | | | 2005 | | | 2004 | | | 2003 | |
| | | | | | | | | | | | | | | | | |
Net asset value, beginning
of period | | $27.69 | | | $24.87 | | | $23.52 | | | $20.67 | | | $17.87 | | | $17.12 | |
Income (loss) from
investment operations | | | | | | | | | | | | | | | | | | |
Net investment income (d) | | $0.03 | | | $0.06 | | | $0.13 | | | $0.08 | | | $0.05 | | | $0.09 | |
Net realized and unrealized
gain (loss) on investments and
foreign currency | | (1.83 | ) | | 3.71 | | | 2.45 | | | 2.87 | | | 2.81 | | | 0.80 | |
| Total from investment operations | | $(1.80 | ) | | $3.77 | | | $2.58 | | | $2.95 | | | $2.86 | | | $0.89 | |
Less distributions declared
to shareholders | | | | | | | | | | | | | | | | | | |
From net investment income | | $(0.05 | ) | | $(0.15 | ) | | $(0.09 | ) | | $(0.10 | ) | | $(0.06 | ) | | $(0.14 | ) |
From net realized gain
on investments | | (1.94 | ) | | (0.80 | ) | | (1.14 | ) | | — | | | — | | | — | |
Total distributions declared
to shareholders | | $(1.99 | ) | | $(0.95 | ) | | $(1.23 | ) | | $(0.10 | ) | | $(0.06 | ) | | $(0.14 | ) |
| Net asset value, end of period | | $23.90 | | | $27.69 | | | $24.87 | | | $23.52 | | | $20.67 | | | $17.87 | |
| Total return (%) (r)(s)(t) | | (7.14 | )(n) | | 15.37 | | | 11.39 | | | 14.32 | | | 16.03 | (b) | | 5.29 | |
Ratios (%) (to average net
assets) and Supplemental data: | | | | | | | | | | | | | | | | | | |
Expenses before
expense reductions (f) | | 2.01 | (a) | | 2.03 | | | 2.06 | | | 2.06 | | | 2.07 | | | 2.13 | |
Expenses after
expense reductions (f) | | 1.99 | (a) | | 2.01 | | | 2.06 | | | 2.06 | | | 2.07 | | | N/A | |
| Net investment income | | 0.23 | (a) | | 0.20 | | | 0.53 | | | 0.34 | | | 0.27 | | | 0.52 | |
| Portfolio turnover | | 14 | | | 26 | | | 26 | | | 24 | | | 42 | | | 55 | |
Net assets at end of period
(000 Omitted) | | $1,650 | | | $1,823 | | | $946 | | | $655 | | | $439 | | | $181 | |
See Notes to Financial Statements
28
Financial Highlights – continued
| | | | | | | | | | | | | | | | | | |
| | | Six months
ended
2/29/08 (unaudited) | | | Years ended 8/31 | |
| Class 529C | | | 2007 | | | 2006 | | | 2005 | | | 2004 | | | 2003 | |
| | | | | | | | | | | | | | | | | |
Net asset value, beginning
of period | | $27.67 | | | $24.86 | | | $23.51 | | | $20.66 | | | $17.86 | | | $17.11 | |
Income (loss) from
investment operations | | | | | | | | | | | | | | | | | | |
Net investment income (d) | | $0.03 | | | $0.06 | | | $0.12 | | | $0.08 | | | $0.05 | | | $0.09 | |
Net realized and unrealized
gain (loss) on investments and
foreign currency | | (1.83 | ) | | 3.70 | | | 2.46 | | | 2.87 | | | 2.81 | | | 0.80 | |
| Total from investment operations | | $(1.80 | ) | | $3.76 | | | $2.58 | | | $2.95 | | | $2.86 | | | $0.89 | |
Less distributions declared
to shareholders | | | | | | | | | | | | | | | | | | |
From net investment income | | $(0.05 | ) | | $(0.15 | ) | | $(0.09 | ) | | $(0.10 | ) | | $(0.06 | ) | | $(0.14 | ) |
From net realized gain
on investments | | (1.94 | ) | | (0.80 | ) | | (1.14 | ) | | — | | | — | | | — | |
Total distributions declared
to shareholders | | $(1.99 | ) | | $(0.95 | ) | | $(1.23 | ) | | $(0.10 | ) | | $(0.06 | ) | | $(0.14 | ) |
| Net asset value, end of period | | $23.88 | | | $27.67 | | | $24.86 | | | $23.51 | | | $20.66 | | | $17.86 | |
| Total return (%) (r)(s)(t) | | (7.14 | )(n) | | 15.34 | | | 11.39 | | | 14.32 | | | 16.03 | (b) | | 5.31 | |
Ratios (%) (to average net
assets) and Supplemental data: | | | | | | | | | | | | | | | | | | |
Expenses before
expense reductions (f) | | 2.01 | (a) | | 2.03 | | | 2.06 | | | 2.06 | | | 2.07 | | | 2.13 | |
Expenses after
expense reductions (f) | | 1.99 | (a) | | 2.01 | | | 2.06 | | | 2.06 | | | 2.07 | | | N/A | |
| Net investment income | | 0.23 | (a) | | 0.20 | | | 0.51 | | | 0.36 | | | 0.26 | | | 0.55 | |
| Portfolio turnover | | 14 | | | 26 | | | 26 | | | 24 | | | 42 | | | 55 | |
Net assets at end of period
(000 Omitted) | | $2,298 | | | $2,463 | | | $1,279 | | | $1,062 | | | $643 | | | $352 | |
Any redemption fees charged by the fund during the 2004 and 2005 fiscal years resulted in a per share impact of less than $0.01.
| (b) | The fund’s net asset value and total return calculation include a non-recurring accrual recorded as a result of an administrative proceeding regarding disclosure of brokerage allocation practices in connection with fund sales. The non-recurring accrual did not have a material impact on the net asset value per share based on the shares outstanding on the day the proceeds were recorded. |
| (d) | Per share data are based on average shares outstanding. |
| (f) | Ratios do not reflect reductions from fees paid indirectly, if applicable. |
| (g) | The per share amount is not in accordance with the net realized and unrealized gain/loss for the period because of the timing of sales of fund shares and the per share amount of realized and unrealized gains and losses at such time. |
| (i) | For the period from the class’ inception, December 31, 2002 (Class R), October 31, 2003 (Class R3), April 1, 2005 (Classes R1, R2, R4, and R5) and May 1, 2006 (Class W) through the stated period end. |
| (r) | Certain expenses have been reduced without which performance would have been lower. |
| (s) | From time to time the fund may receive proceeds from litigation settlements, without which performance would be lower. |
| (t) | Total returns do not include any applicable sales charges |
See Notes to Financial Statements
29
NOTES TO FINANCIAL STATEMENTS
(unaudited)
| (1) | | Business and Organization |
MFS Value Fund (the fund) is a series of MFS Series Trust I (the trust). The trust is organized as a Massachusetts business trust and is registered under the Investment Company Act of 1940, as amended, as an open-end management investment company.
| (2) | | Significant Accounting Policies |
General – The preparation of financial statements in conformity with U.S. generally accepted accounting principles requires management to make estimates and assumptions that affect the reported amounts of assets and liabilities, and disclosure of contingent assets and liabilities at the date of the financial statements and the reported amounts of revenues and expenses during the reporting period. Actual results could differ from those estimates. The fund can invest in foreign securities. Investments in foreign securities are vulnerable to the effects of changes in the relative values of the local currency and the U.S. dollar and to the effects of changes in each country’s legal, political, and economic environment.
Investment Valuations – Equity securities, including restricted equity securities, are generally valued at the last sale or official closing price as reported by an independent pricing service on the market or exchange on which they are primarily traded. For securities for which there were no sales reported that day, equity securities are generally valued at the last quoted daily bid quotation as reported by an independent pricing service on the market or exchange on which they are primarily traded. For securities held short for which there were no sales reported for the day, the position is generally valued at the last quoted daily ask quotation as reported by an independent pricing service on the market or exchange on which such securities are primarily traded. Short-term instruments with a maturity at issuance of 60 days or less may be valued at amortized cost, which approximates market value. Open-end investment companies are generally valued at net asset value per share. Securities and other assets generally valued on the basis of information from an independent pricing service may also be valued at a broker-dealer bid quotation. The values of foreign securities and other assets and liabilities expressed in foreign currencies are converted to U.S. dollars using the mean of bid and asked prices for rates reported by an independent pricing service.
The Board of Trustees has delegated primary responsibility for determining or causing to be determined the value of the fund’s investments (including any fair valuation) to the adviser pursuant to valuation policies and procedures approved by the Board. If the adviser determines that reliable market quotations are not readily available, investments are valued at fair value as determined in good faith by the adviser in accordance with such procedures
30
Notes to Financial Statements (unaudited) – continued
under the oversight of the Board of Trustees. Under the fund’s valuation policies and procedures, market quotations are not considered to be readily available for many types of debt instruments and certain types of derivatives. These investments are generally valued at fair value based on information from independent pricing services. In addition, investments may be valued at fair value if the adviser determines that an investment’s value has been materially affected by events occurring after the close of the exchange or market on which the investment is principally traded (such as foreign exchange or market) and prior to the determination of the fund’s net asset value, or after the halting of trading of a specific security where trading does not resume prior to the close of the exchange or market on which the security is principally traded. Events that occur on a frequent basis after foreign markets close (such as developments in foreign markets and significant movements in the U.S. markets) and prior to the determination of the fund’s net asset value may be deemed to have a material affect on the value of securities traded in foreign markets. Accordingly, the fund’s foreign equity securities may often be valued at fair value. The adviser may rely on independent pricing services or other information (such as the correlation with price movements of similar securities in the same or other markets; the type, cost and investment characteristics of the security; the business and financial condition of the issuer; and trading and other market data) to assist in determining whether to fair value and at what value to fair value an investment. The value of an investment for purposes of calculating the fund’s net asset value can differ depending on the source and method used to determine value. When fair valuation is used, the value of investments used to determine the fund’s net asset value may differ from quoted or published prices for the same investments.
In September 2006, FASB Statement No. 157, Fair Value Measurements (the “Statement”) was issued, and is effective for fiscal years beginning after November 15, 2007 and for all interim periods within those fiscal years. This Statement provides a single definition of fair value, a hierarchy for measuring fair value and expanded disclosures about fair value measurements. Management is evaluating the application of the Statement to the fund, and believes the impact will be limited to expanded disclosures resulting from the adoption of this Statement in the fund’s financial statements.
Repurchase Agreements – The fund may enter into repurchase agreements with institutions that the fund’s investment adviser has determined are creditworthy. Each repurchase agreement is recorded at cost. The fund requires that the securities collateral in a repurchase transaction be transferred to the custodian in a manner sufficient to enable the fund to obtain those securities in the event of a default under the repurchase agreement. The fund monitors, on a daily basis, the value of the collateral to ensure that its value, including
31
Notes to Financial Statements (unaudited) – continued
accrued interest, is greater than amounts owed to the fund under each such repurchase agreement. The fund and other funds managed by Massachusetts Financial Services Company (MFS), may utilize a joint trading account for the purpose of entering into one or more repurchase agreements.
Foreign Currency Translation – Purchases and sales of foreign investments, income, and expenses are converted into U.S. dollars based upon currency exchange rates prevailing on the respective dates of such transactions. Gains and losses attributable to foreign currency exchange rates on sales of securities are recorded for financial statement purposes as net realized gains and losses on investments. Gains and losses attributable to foreign exchange rate movements on income and expenses are recorded for financial statement purposes as foreign currency transaction gains and losses. That portion of both realized and unrealized gains and losses on investments that results from fluctuations in foreign currency exchange rates is not separately disclosed.
Security Loans – State Street Bank and Trust Company (“State Street”), as lending agent, may loan the securities of the fund to certain qualified institutions (the “Borrowers”) approved by the fund. The loans are collateralized at all times by cash and/or U.S. Treasury and federal agency obligations in an amount at least equal to the market value of the securities loaned. State Street provides the fund with indemnification against Borrower default. The fund bears the risk of loss with respect to the investment of cash collateral. On loans collateralized by cash, the cash collateral is invested in a money market fund or short-term securities. A portion of the income generated upon investment of the collateral is remitted to the Borrowers, and the remainder is allocated between the fund and the lending agent. On loans collateralized by U.S. Treasury and/or federal agency obligations, a fee is received from the Borrower, and is allocated between the fund and the lending agent. Net income from securities lending is included in interest income on the Statement of Operations. The dividend and interest income earned on the securities loaned is accounted for in the same manner as other dividend and interest income.
Indemnifications – Under the fund’s organizational documents, its officers and trustees may be indemnified against certain liabilities and expenses arising out of the performance of their duties to the fund. Additionally, in the normal course of business, the fund enters into agreements with service providers that may contain indemnification clauses. The fund’s maximum exposure under these agreements is unknown as this would involve future claims that may be made against the fund that have not yet occurred.
Investment Transactions and Income – Investment transactions are recorded on the trade date. Interest income is recorded on the accrual basis. All premium and discount is amortized or accreted for financial statement
32
Notes to Financial Statements (unaudited) – continued
purposes in accordance with U.S. generally accepted accounting principles. Dividends received in cash are recorded on the ex-dividend date. Certain dividends from foreign securities will be recorded when the fund is informed of the dividend if such information is obtained subsequent to the ex-dividend date. Dividend and interest payments received in additional securities are recorded on the ex-dividend or ex-interest date in an amount equal to the value of the security on such date.
The fund may receive proceeds from litigation settlements. Any proceeds received from litigation involving portfolio holdings are reflected in the Statement of Operations in realized gain/loss if the security has been disposed of by the fund or in unrealized gain/loss if the security is still held by the fund. Any other proceeds from litigation not related to portfolio holdings are reflected as other income in the Statement of Operations.
Fees Paid Indirectly – The fund’s custody fee may be reduced according to an arrangement that measures the value of cash deposited with the custodian by the fund. This amount, for the six months ended February 29, 2008, is shown as a reduction of total expenses on the Statement of Operations.
Tax Matters and Distributions – The fund intends to qualify as a regulated investment company, as defined under Subchapter M of the Internal Revenue Code, and to distribute all of its taxable income, including realized capital gains. As a result, no provision for federal income tax is required. The fund adopted the provisions of FASB Interpretation No. 48, Accounting for Uncertainty in Income Taxes (“the Interpretation”) on September 1, 2007. The Interpretation prescribes a minimum threshold for financial statement recognition of the benefit of a tax position taken or expected to be taken in a tax return. There was no impact resulting from the adoption of this Interpretation on the fund’s financial statements. Each of the fund’s federal tax returns for the prior three fiscal years remains subject to examination by the Internal Revenue Service. It is the fund’s policy to record interest and penalty charges on underpaid taxes associated with its tax positions as interest expense and miscellaneous expense, respectively. No such charges were recorded in the current financial statements. Foreign taxes, if any, have been accrued by the fund in the accompanying financial statements.
Distributions to shareholders are recorded on the ex-dividend date. Income and capital gain distributions are determined in accordance with income tax regulations, which may differ from U.S. generally accepted accounting principles. Certain capital accounts in the financial statements are periodically adjusted for permanent differences in order to reflect their tax character. These adjustments have no impact on net assets or net asset value per share. Temporary differences which arise from recognizing certain items of income, expense, gain or loss in different periods for financial statement and tax
33
Notes to Financial Statements (unaudited) – continued
purposes will reverse at some time in the future. Distributions in excess of net investment income or net realized gains are temporary overdistributions for financial statement purposes resulting from differences in the recognition or classification of income or distributions for financial statement and tax purposes.
Book/tax differences primarily relate to wash sale loss deferrals and treating a portion of the proceeds from redemptions as a distribution for tax purposes.
The tax character of distributions made during the current period will be determined at fiscal year end. The tax character of distributions declared to shareholders is as follows:
| | |
| | | 8/31/07 |
Ordinary income (including any
short-term capital gains) | | $125,426,306 |
| Long-term capital gain | | 262,963,292 |
| Total distributions | | $388,389,598 |
The federal tax cost and the tax basis components of distributable earnings were as follows:
| | | |
| As of 2/29/08 | | | |
| Cost of investments | | $8,525,676,858 | |
| Gross appreciation | | 1,989,218,110 | |
| Gross depreciation | | (618,152,121 | ) |
| Net unrealized appreciation (depreciation) | | $1,371,065,989 | |
| |
| As of 8/31/07 | | | |
| Undistributed ordinary income | | $70,525,120 | |
| Undistributed long-term capital gain | | 479,810,679 | |
| Other temporary differences | | (12,886 | ) |
| Net unrealized appreciation (depreciation) | | 2,403,837,057 | |
The aggregate cost above includes prior fiscal year end tax adjustments.
Multiple Classes of Shares of Beneficial Interest – The fund offers multiple classes of shares, which differ in their respective distribution and service fees. All shareholders bear the common expenses of the fund based on daily net assets of each class, without distinction between share classes. Dividends are declared separately for each class. Differences in per share dividend rates are generally due to differences in separate class expenses. Class B and Class 529B shares will convert to Class A and Class 529A shares, respectively, approximately eight years after purchase.
34
Notes to Financial Statements (unaudited) – continued
| (3) | | Transactions with Affiliates |
Investment Adviser – The fund has an investment advisory agreement with MFS to provide overall investment management and related administrative services and facilities to the fund. The management fee is computed daily and paid monthly at an annual rate of 0.60% of the fund’s average daily net assets.
The investment adviser had agreed in writing to reduce its management fee to 0.55% of average daily net assets in excess of $7.5 billion. This written agreement terminated on November 30, 2007. Effective December 1, 2007, the investment adviser has agreed in writing to reduce its management fee to:
| | | |
| From $7.5 to $10 billion of average daily net assets | | 0.53 | % |
| Next $2.5 billion of average daily net assets | | 0.50 | % |
| Average daily net assets in excess of $12.5 billion | | 0.45 | % |
This written agreement will continue through November 30, 2012. This management fee reduction amounted to $861,471, which is shown as a reduction of total expenses in the Statement of Operations.
The management fee incurred for the six months ended February 29, 2008 was equivalent to an annual effective rate of 0.58% of the fund’s average daily net assets.
Distributor – MFS Fund Distributors, Inc. (MFD), a wholly-owned subsidiary of MFS, as distributor, received $223,477 and $1,499 for the six months ended February 29, 2008, as its portion of the initial sales charge on sales of Class A and Class 529A shares of the fund, respectively.
The Board of Trustees has adopted a distribution plan for certain class shares pursuant to Rule 12b-1 of the Investment Company Act of 1940.
The fund’s distribution plan provides that the fund will pay MFD for services provided by MFD and financial intermediaries in connection with the distribution and servicing of certain share classes. One component of the plan is a distribution fee paid to MFD and another component of the plan is a service fee paid to MFD. MFD may subsequently pay all, or a portion, of the distribution and/or service fees to financial intermediaries.
35
Notes to Financial Statements (unaudited) – continued
Distribution Plan Fee Table:
| | | | | | | | | | |
| | | Distribution
Fee Rate | | Service
Fee Rate | | Total
Distribution
Plan (d) | | Annual
Effective
Rate (e) | | Distribution
and Service
Fee |
| Class A | | 0.10% | | 0.25% | | 0.35% | | 0.35% | | $10,691,633 |
| Class B | | 0.75% | | 0.25% | | 1.00% | | 1.00% | | 4,782,397 |
| Class C | | 0.75% | | 0.25% | | 1.00% | | 1.00% | | 5,233,508 |
| Class W | | 0.10% | | — | | 0.10% | | 0.10% | | 63,438 |
| Class R | | 0.25% | | 0.25% | | 0.50% | | 0.50% | | 149,750 |
| Class R1 (c) | | 0.50% | | 0.25% | | 0.75% | | 0.75% | | 76,824 |
| Class R2 | | 0.25% | | 0.25% | | 0.50% | | 0.50% | | 46,748 |
| Class R3 | | 0.25% | | 0.25% | | 0.50% | | 0.50% | | 296,490 |
| Class R4 | | — | | 0.25% | | 0.25% | | 0.25% | | 192,093 |
| Class 529A | | 0.25% | | 0.25% | | 0.50% | | 0.35% | | 10,857 |
| Class 529B | | 0.75% | | 0.25% | | 1.00% | | 1.00% | | 8,987 |
| Class 529C | | 0.75% | | 0.25% | | 1.00% | | 1.00% | | 12,309 |
| Total Distribution and Service Fees | | | | | | $21,565,034 |
| (c) | Effective March 1, 2008, the distribution fee rate for Class R1 shares will be 0.75% and the total distribution plan rate will be 1.00%. |
| (d) | In accordance with the distribution plan for certain classes, the fund pays distribution and/or service fees up to these annual percentage rates of each class’ average daily net assets. |
| (e) | The annual effective rates represent actual fees incurred under the distribution plan for the six months ended February 29, 2008 based on each class’ average daily net assets. 0.10% of the Class 529A distribution fee is currently being paid by the fund. Payment of the remaining 0.15% of the Class 529A distribution fee is not yet in effect and will be implemented on such date as the fund’s Board of Trustees may determine. |
Certain Class A, Class C and Class 529C shares are subject to a contingent deferred sales charge in the event of a shareholder redemption within 12 months of purchase. Class B and Class 529B shares are subject to a contingent deferred sales charge in the event of a shareholder redemption within six years of purchase. All contingent deferred sales charges are paid to MFD and during the six months ended February 29, 2008, were as follows:
| | |
| | | Amount |
| Class A | | $4,552 |
| Class B | | $366,531 |
| Class C | | $58,115 |
| Class 529B | | $279 |
| Class 529C | | $235 |
The fund has entered into and may from time to time enter into contracts with program managers and other parties which administer the tuition programs through which an investment in the fund’s 529 share classes is made. The fund has entered into an agreement with MFD pursuant to which MFD receives an annual fee of up to 0.35% of the average daily net assets attributable to each 529 share class. The fee is based on average daily net assets and is currently established at 0.25% annually of average daily net assets of the fund’s 529
36
Notes to Financial Statements (unaudited) – continued
share classes. Effective April 1, 2008, the fee will be 0.10%. The fee may only be increased with the approval of the Board of Trustees who oversees the fund. The services provided by MFD, or a third party with which MFD contracts, include recordkeeping and tax reporting and account services, as well as services designed to maintain the program’s compliance with the Internal Revenue Code and other regulatory requirements. Program manager fees for the six months ended February 29, 2008, were as follows:
| | |
| | | Amount |
| Class 529A | | $7,755 |
| Class 529B | | 2,247 |
| Class 529C | | 3,077 |
| Total Program Manager Fees | | $13,079 |
Shareholder Servicing Agent – MFS Service Center, Inc. (MFSC), a wholly-owned subsidiary of MFS, receives a fee from the fund for its services as shareholder servicing agent calculated as a percentage of the average daily net assets of the fund as determined periodically under the supervision of the fund’s Board of Trustees. For the six months ended February 29, 2008, the fee was $1,714,405, which equated to 0.0333% annually of the fund’s average daily net assets. MFSC also receives payment from the fund for out-of-pocket expenses, sub-accounting and other shareholder servicing costs which may be paid to affiliated and unaffiliated service providers. For the six months ended February 29, 2008, these out-of-pocket expenses, sub-accounting and other shareholder servicing costs amounted to $4,266,125. The fund may also pay shareholder servicing related costs directly to non-related parties.
Under a Special Servicing Agreement among MFS, each MFS fund which invests in other MFS funds (“MFS fund-of-funds”) and each underlying fund in which a MFS fund-of-funds invests (“underlying funds”), each underlying fund may pay a portion of each MFS fund-of-fund’s transfer agent-related expenses, including sub-accounting fees payable to financial intermediaries, to the extent such payments do not exceed the benefits realized or expected to be realized by the underlying fund from the investment in the underlying fund by the MFS fund-of-fund. For the six months ended February 29, 2008, these costs for the fund amounted to $502,198 and are reflected in the shareholder servicing costs on the Statement of Operations.
Administrator – MFS provides certain financial, legal, shareholder communications, compliance, and other administrative services to the fund. Under an administrative services agreement, the fund partially reimburses MFS the costs incurred to provide these services. The fund is charged a fixed amount plus a fee based on average daily net assets. The fund’s annual fixed amount is $17,500.
37
Notes to Financial Statements (unaudited) – continued
The administrative services fee incurred for the six months ended February 29, 2008 was equivalent to an annual effective rate of 0.0073% of the fund’s average daily net assets.
In addition to the administrative services provided by MFS to the fund as described above, MFS is responsible for providing certain retirement plan administration and services with respect to certain shares. These services include various administrative, recordkeeping, and communication/educational services with respect to the retirement plans which invest in these shares, and may be provided directly by MFS or by a third party. MFS may subsequently pay all, or a portion, of the retirement plan administration and services fee to affiliated or unaffiliated third parties. For the six months ended February 29, 2008, the fund paid MFS an annual retirement plan administration and services fee up to the following annual percentage rates of each class’ average daily net assets:
| | | | | | | | |
| | | Beginning
of period
through
12/31/07 | | Effective
1/1/08 | | Annual Effective
Rate (g) | | Total
Amount |
Class R1 | | 0.35% | | 0.35% | | 0.35% | | $35,851 |
Class R2 | | 0.25% | | — | | 0.13% | | 12,476 |
Class R3 | | 0.15% | | — | | 0.10% | | 58,160 |
Class R4 | | 0.15% | | — | | 0.10% | | 77,240 |
Class R5 | | 0.10% | | — | | 0.07% | | 51,982 |
| Total Retirement Plan Administration and Services Fees | | $235,709 |
| (g) | Effective January 1, 2008, the annual retirement plan administration and services fee was eliminated for Class R2, Class R3, Class R4, and Class R5 shares. Effective March 1, 2008, the annual retirement plan administration and services fee will be eliminated for Class R1 shares. |
Trustees’ and Officers’ Compensation – The fund pays compensation to independent trustees in the form of a retainer, attendance fees, and additional compensation to Board and Committee chairpersons. The fund does not pay compensation directly to trustees or officers of the fund who are also officers of the investment adviser, all of whom receive remuneration for their services to the fund from MFS. Certain officers and trustees of the fund are officers or directors of MFS, MFD, and MFSC.
The fund has an unfunded, defined benefit plan for certain retired independent trustees which resulted in a pension expense of $550. This amount is included in independent trustees’ compensation for the six months ended February 29, 2008. The liability for deferred retirement benefits payable to certain retired independent trustees amounted to $9,055 at February 29, 2008, and is included in payable for independent trustees’ compensation.
Other – This fund and certain other MFS funds (the funds) have entered into a services agreement (the Agreement) which provides for payment of fees by the
38
Notes to Financial Statements (unaudited) – continued
funds to Tarantino LLC in return for the provision of services of an Independent Chief Compliance Officer (ICCO) for the funds. The ICCO is an officer of the funds and the sole member of Tarantino LLC. The funds can terminate the Agreement with Tarantino LLC at any time under the terms of the Agreement. For the six months ended February 29, 2008, the fee paid by the fund to Tarantino LLC was $41,348 and is included in miscellaneous expense on the Statement of Operations. MFS has agreed to reimburse the fund for a portion of the payments made by the fund to Tarantino LLC in the amount of $22,945, which is shown as a reduction of total expenses in the Statement of Operations. Additionally, MFS has agreed to bear all expenses associated with office space, other administrative support, and supplies provided to the ICCO.
Purchases and sales of investments, other than U.S. government securities, purchased option transactions, and short-term obligations, aggregated $1,530,402,537 and $1,468,771,501, respectively.
| (5) | | Shares of Beneficial Interest |
The fund’s Declaration of Trust permits the Trustees to issue an unlimited number of full and fractional shares of beneficial interest. Transactions in fund shares were as follows:
| | | | | | | | |
| | | Six months ended
2/29/08 | | Year ended
8/31/07 |
| | | Shares | | Amount | | Shares | | Amount |
| Shares sold | | | | | | | | |
Class A | | 49,476,846 | | $1,346,740,544 | | 82,897,137 | | $2,284,935,155 |
Class B | | 1,141,766 | | 30,610,833 | | 4,097,957 | | 110,802,297 |
Class C | | 4,669,570 | | 125,177,624 | | 7,629,570 | | 207,679,463 |
Class I | | 9,482,935 | | 256,531,361 | | 12,095,417 | | 335,715,810 |
Class W | | 6,733,256 | | 175,845,760 | | 2,226,482 | | 62,441,031 |
Class R | | 1,183,391 | | 32,512,293 | | 1,032,032 | | 28,054,647 |
Class R1 | | 386,248 | | 10,605,931 | | 699,966 | | 19,124,968 |
Class R2 | | 727,762 | | 19,117,400 | | 576,831 | | 15,856,845 |
Class R3 | | 2,134,947 | | 58,404,868 | | 4,004,768 | | 109,306,754 |
Class R4 | | 2,292,700 | | 63,848,594 | | 5,573,616 | | 153,833,399 |
Class R5 | | 3,565,405 | | 100,666,831 | | 3,481,769 | | 95,988,445 |
Class 529A | | 13,303 | | 354,608 | | 76,026 | | 2,073,352 |
Class 529B | | 3,624 | | 95,149 | | 30,024 | | 813,107 |
Class 529C | | 8,005 | | 215,046 | | 46,425 | | 1,253,885 |
| | 81,819,758 | | $2,220,726,842 | | 124,468,020 | | $3,427,879,158 |
39
Notes to Financial Statements (unaudited) – continued
| | | | | | | | | | | | |
| | | Six months ended
2/29/08 | | | Year ended
8/31/07 | |
| | | Shares | | | Amount | | | Shares | | | Amount | |
| Shares issued to shareholders in reinvestment of distributions | | | | | | | | | | | | |
Class A | | 13,713,219 | | | $365,755,793 | | | 7,002,269 | | | $186,811,539 | |
Class B | | 2,138,999 | | | 56,651,058 | | | 1,327,246 | | | 35,109,854 | |
Class C | | 1,767,481 | | | 46,725,327 | | | 834,009 | | | 22,045,467 | |
Class I | | 4,155,286 | | | 111,391,305 | | | 2,113,899 | | | 56,679,995 | |
Class W | | 320,920 | | | 8,549,053 | | | 25,338 | | | 685,714 | |
Class R | | 128,157 | | | 3,412,771 | | | 157,270 | | | 4,176,605 | |
Class R1 | | 59,173 | | | 1,556,566 | | | 9,740 | | | 257,416 | |
Class R2 | | 42,908 | | | 1,134,128 | | | 9,477 | | | 251,790 | |
Class R3 | | 340,533 | | | 9,022,349 | | | 72,416 | | | 1,930,007 | |
Class R4 | | 450,946 | | | 12,003,850 | | | 101,166 | | | 2,708,973 | |
Class R5 | | 244,997 | | | 6,536,719 | | | 12,968 | | | 364,151 | |
Class 529A | | 17,485 | | | 463,780 | | | 7,005 | | | 186,245 | |
Class 529B | | 4,913 | | | 128,912 | | | 1,484 | | | 39,048 | |
Class 529C | | 6,813 | | | 178,627 | | | 2,123 | | | 55,859 | |
| | 23,391,830 | | | $623,510,238 | | | 11,676,410 | | | $311,302,663 | |
| Shares reacquired | | | | | | | | | | | | |
Class A | | (49,783,459 | ) | | $(1,372,431,934 | ) | | (63,526,514 | ) | | $(1,756,904,603 | ) |
Class B | | (7,471,666 | ) | | (201,490,864 | ) | | (13,355,675 | ) | | (365,457,041 | ) |
Class C | | (3,802,716 | ) | | (101,513,690 | ) | | (5,960,195 | ) | | (162,740,623 | ) |
Class I | | (5,995,661 | ) | | (165,687,391 | ) | | (5,977,035 | ) | | (167,400,144 | ) |
Class W | | (620,144 | ) | | (15,993,422 | ) | | (147,993 | ) | | (4,084,628 | ) |
Class R | | (1,427,731 | ) | | (40,159,194 | ) | | (2,812,920 | ) | | (77,996,184 | ) |
Class R1 | | (135,582 | ) | | (3,546,455 | ) | | (325,820 | ) | | (8,841,369 | ) |
Class R2 | | (105,453 | ) | | (2,735,849 | ) | | (309,910 | ) | | (8,484,016 | ) |
Class R3 | | (839,171 | ) | | (22,305,058 | ) | | (1,731,828 | ) | | (47,281,104 | ) |
Class R4 | | (1,072,207 | ) | | (28,892,612 | ) | | (2,938,269 | ) | | (80,696,299 | ) |
Class R5 | | (2,527,258 | ) | | (71,166,270 | ) | | (990,264 | ) | | (27,530,499 | ) |
Class 529A | | (13,160 | ) | | (347,883 | ) | | (18,872 | ) | | (514,741 | ) |
Class 529B | | (5,343 | ) | | (137,634 | ) | | (3,710 | ) | | (102,409 | ) |
Class 529C | | (7,624 | ) | | (202,752 | ) | | (10,964 | ) | | (302,971 | ) |
| | (73,807,175 | ) | | $(2,026,611,008 | ) | | (98,109,969 | ) | | $(2,708,336,631 | ) |
40
Notes to Financial Statements (unaudited) – continued
| | | | | | | | | | | | |
| | | Six months ended
2/29/08 | | | Year ended
8/31/07 | |
| | | Shares | | | Amount | | | Shares | | | Amount | |
| Net change | | | | | | | | | | | | |
Class A | | 13,406,606 | | | $340,064,403 | | | 26,372,892 | | | $714,842,091 | |
Class B | | (4,190,901 | ) | | (114,228,973 | ) | | (7,930,472 | ) | | (219,544,890 | ) |
Class C | | 2,634,335 | | | 70,389,261 | | | 2,503,384 | | | 66,984,307 | |
Class I | | 7,642,560 | | | 202,235,275 | | | 8,232,281 | | | 224,995,661 | |
Class W | | 6,434,032 | | | 168,401,391 | | | 2,103,827 | | | 59,042,117 | |
Class R | | (116,183 | ) | | (4,234,130 | ) | | (1,623,618 | ) | | (45,764,932 | ) |
Class R1 | | 309,839 | | | 8,616,042 | | | 383,886 | | | 10,541,015 | |
Class R2 | | 665,217 | | | 17,515,679 | | | 276,398 | | | 7,624,619 | |
Class R3 | | 1,636,309 | | | 45,122,159 | | | 2,345,356 | | | 63,955,657 | |
Class R4 | | 1,671,439 | | | 46,959,832 | | | 2,736,513 | | | 75,846,073 | |
Class R5 | | 1,283,144 | | | 36,037,280 | | | 2,504,473 | | | 68,822,097 | |
Class 529A | | 17,628 | | | 470,505 | | | 64,159 | | | 1,744,856 | |
Class 529B | | 3,194 | | | 86,427 | | | 27,798 | | | 749,746 | |
Class 529C | | 7,194 | | | 190,921 | | | 37,584 | | | 1,006,773 | |
| | 31,404,413 | | | $817,626,072 | | | 38,034,461 | | | $1,030,845,190 | |
The fund is one of several mutual funds in which the MFS funds-of-funds may invest. The MFS funds-of-funds do not invest in the underlying MFS funds for the purpose of exercising management or control. At the end of the period, the MFS Conservative Allocation Fund, MFS Moderate Allocation Fund, MFS Growth Allocation Fund and MFS Aggressive Growth Allocation Fund were the owners of record of approximately 1%, 3%, 4% and 2% respectively, of the value of outstanding voting shares. In addition, the MFS Lifetime Retirement Income Fund, MFS Lifetime 2010 Fund, MFS Lifetime 2020 Fund, MFS Lifetime 2030 and the MFS Lifetime 2040 Fund were each the owners of record of less than 1% of the value of outstanding voting shares.
The fund and other funds managed by MFS participate in a $1 billion unsecured committed line of credit provided by a syndication of banks under a credit agreement. In addition, the fund and other funds managed by MFS have established uncommitted borrowing arrangements with certain banks. Borrowings may be made for temporary financing needs. Interest is charged to each fund, based on its borrowings, generally at a rate equal to the Federal Reserve funds rate plus 0.30%. In addition, a commitment fee, based on the average daily, unused portion of the committed line of credit, is allocated among the participating funds at the end of each calendar quarter. For the six months ended February 29, 2008, the fund’s commitment fee and interest expense were $26,592 and $0, respectively, and are included in miscellaneous expense on the Statement of Operations.
41
Notes to Financial Statements (unaudited) – continued
The fund’s investment adviser, MFS, was the subject of an administrative proceeding concerning market timing which resulted in the Securities and Exchange Commission (the “SEC”) entering an order approving a settlement with MFS and two of its former officers (the “Settlement Order”). Under the terms of the Settlement Order, MFS transferred $175 million in disgorgement and $50 million in penalty (the “Payments”) to a Fair Fund established by the SEC, from which settlement funds will be distributed to current and former shareholders of the fund and certain other affected MFS retail funds. The Payments will be distributed to shareholders in accordance with a plan developed by an independent distribution consultant (the “IDC”) in consultation with MFS and the Board of Trustees of the MFS retail funds. The plan was approved in July 2007 by the SEC. Pursuant to the distribution plan, after the distributions to eligible shareholders have been made, residual amounts, if any, may be available for distribution to the fund and certain other affected MFS retail funds. Payments made by third parties into other settlement funds to remediate harm caused by the third party’s late or excessive trading in certain MFS funds may also become part of the residual amounts. At this time, the residual amounts, if any, cannot be reasonably estimated and the fund has not accrued an estimate for any amounts to be received.
On October 23, 2007 the Board of Trustees approved, on or about April 18, 2008, the conversion of Class R shares and Class R2 shares into Class R3 shares. After the conversion, Class R3, Class R4, and Class R5 will be renamed Class R2, Class R3, and Class R4, respectively.
42
RESULTS OF SHAREHOLDER MEETING
(unaudited)
At a special meeting of shareholders of MFS Value Fund, which was held on February 15, 2008, the following actions were taken:
Item 1. To approve an amendment to the current Master Distribution Plan adopted pursuant to Rule 12b-1 under the Investment Company Act of 1940, as amended, with respect to Class R1 Shares of the fund.
| | |
| | | Number of Dollars |
| For | | 13,965,439.54 |
| Against | | 0.00 |
Abstain | | 764,534.52 |
43
BOARD REVIEW OF INVESTMENT ADVISORY AGREEMENT
A discussion regarding the Board’s most recent review and renewal of the Fund’s investment advisory agreement is available by clicking on the fund’s name under “Select a fund” on the MFS Web site (mfs.com).
PROXY VOTING POLICIES AND INFORMATION
A general description of the MFS funds’ proxy voting policies and procedures is available without charge, upon request, by calling 1-800-225-2606, by visiting the Proxy Voting section of mfs.com or by visiting the SEC’s Web site at http://www.sec.gov.
Information regarding how the fund voted proxies relating to portfolio securities during the most recent twelve-month period ended June 30 is available without charge by visiting the Proxy Voting section of mfs.com or by visiting the SEC’s Web site at http://www.sec.gov.
QUARTERLY PORTFOLIO DISCLOSURE
The fund will file a complete schedule of portfolio holdings with the Securities and Exchange Commission (the Commission) for the first and third quarters of each fiscal year on Form N-Q. The fund’s Form N-Q may be reviewed and copied at the:
Public Reference Room
Securities and Exchange Commission
100 F Street, NE, Room 1580
Washington, D.C. 20549
Information on the operation of the Public Reference Room may be obtained by calling the Commission at 1-800-SEC-0330. The fund’s Form N-Q is available on the EDGAR database on the Commission’s Internet Web site at http://www.sec.gov, and copies of this information may be obtained, upon payment of a duplicating fee, by electronic request at the following e-mail address: publicinfo@sec.gov or by writing the Public Reference Section at the above address.
A shareholder can also obtain the quarterly portfolio holdings report at mfs.com.
44

MFS® Technology Fund
The report is prepared for the general information of shareholders. It is authorized for distribution to prospective investors only when preceded or accompanied by a current prospectus.
NOT FDIC INSURED Ÿ MAY LOSE VALUE Ÿ
NO BANK OR CREDIT UNION GUARANTEE Ÿ NOT A DEPOSIT Ÿ
NOT INSURED BY ANY FEDERAL GOVERNMENT AGENCY OR
NCUA/NCUSIF
2/29/08
SCT-SEM

LETTER FROM THE CEO
Dear Shareholders:
Many of our MFS® fund shareholders have been justifiably concerned, as have most investors around the world, about the state of the global economy. As we enter 2008 we see the market volatility that began in the third quarter of 2007 has intensified.
We here at MFS, and those before us who guided the firm with the same disciplined investment process, have weathered many major economic disruptions over our eight-plus decades of managing clients’ investments. We have managed money through the Great Depression, 14 recessions, as well as numerous market crises caused by wars, political upheavals, and terrorist attacks. MFS remains in business because our investors believe in the integrity of our long-term investment strategy and its proven results.
Worries over market volatility are valid, and investors cannot always expect to see the kind of returns stocks have delivered in the bull markets of past years. Yet we believe our strategy of ADR — allocating across the major asset classes, diversifying within each class, and regularly rebalancing your portfolio to maintain your desired allocation — can help you pursue the highest investment returns while minimizing the effects of market fluctuations.
MFS is a world leader in domestic and global investing. Our team approach is research driven, globally integrated, and balanced. We have 176 investment management professionals located in the Americas, Europe, and Asia who focus on the fundamentals of each security and then integrate our sophisticated quantitative approach.* This collaborative process allows us to find opportunities in any market environment.
I personally would like to thank you for your continued business. We want you to be confident that we are constantly managing our fund offerings with you in mind, while adding new products that can help you to choose what fits your unique financial goals.
Respectfully,

Robert J. Manning
Chief Executive Officer and Chief Investment Officer
MFS Investment Management®
April 15, 2008
* as of 12/31/07
The opinions expressed in this letter are subject to change, may not be relied upon for investment advice, and no forecasts can be guaranteed.
1
PORTFOLIO COMPOSITION
Portfolio structure (i)
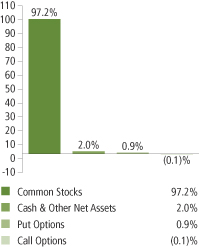
| | |
| Top ten holdings (i) | | |
| Salesforce.com, Inc. | | 6.4% |
| Flextronics International Ltd. | | 6.3% |
| International Business Machines Corp. | | 6.0% |
| Intel Corp. | | 5.8% |
| MSC Software Corp. | | 4.6% |
| MicroStrategy, Inc., “A” | | 4.5% |
| Research in Motion Ltd. | | 4.2% |
| Google, Inc., “A” | | 3.7% |
| Take-Two Interactive Software, Inc. | | 3.4% |
| Activision, Inc. | | 3.0% |
| | |
| Top five industries (i) | | |
| Electronics | | 28.3% |
| Computer Software | | 23.6% |
| Computer Software - Systems | | 13.3% |
| Network & Telecom | | 10.7% |
| Internet | | 8.9% |
| (i) | For purposes of this presentation, the bond component includes accrued interest amounts and may be positively or negatively impacted by the equivalent exposure from any derivative holdings, if applicable. |
Percentages are based on net assets as of 02/29/08.
The portfolio is actively managed and current holdings may be different.
2
EXPENSE TABLE
Fund expenses borne by the shareholders during the period, September 1, 2007 through February 29, 2008
As a shareholder of the fund, you incur two types of costs: (1) transaction costs, including sales charges (loads) on certain purchase or redemption payments, and (2) ongoing costs, including management fees; distribution and service (12b-1) fees; and other fund expenses. This example is intended to help you understand your ongoing costs (in dollars) of investing in the fund and to compare these costs with the ongoing costs of investing in other mutual funds.
The example is based on an investment of $1,000 invested at the beginning of the period and held for the entire period September 1, 2007 through February 29, 2008.
Actual Expenses
The first line for each share class in the following table provides information about actual account values and actual expenses. You may use the information in this line, together with the amount you invested, to estimate the expenses that you paid over the period. Simply divide your account value by $1,000 (for example, an $8,600 account value divided by $1,000 = 8.6), then multiply the result by the number in the first line under the heading entitled “Expenses Paid During Period” to estimate the expenses you paid on your account during this period.
Hypothetical Example for Comparison Purposes
The second line for each share class in the following table provides information about hypothetical account values and hypothetical expenses based on the fund’s actual expense ratio and an assumed rate of return of 5% per year before expenses, which is not the fund’s actual return. The hypothetical account values and expenses may not be used to estimate the actual ending account balance or expenses you paid for the period. You may use this information to compare the ongoing costs of investing in the fund and other funds. To do so, compare this 5% hypothetical example with the 5% hypothetical examples that appear in the shareholder reports of the other funds.
Please note that the expenses shown in the table are meant to highlight your ongoing costs only and do not reflect any transactional costs, such as sales charges (loads). Therefore, the second line for each share class in the table is useful in comparing ongoing costs only, and will not help you determine the relative total costs of owning different funds. In addition, if these transactional costs were included, your costs would have been higher.
3
Expense Table – continued
| | | | | | | | | | |
Share
Class | | | | Annualized
Expense
Ratio | | Beginning
Account Value
9/01/07 | | Ending
Account Value
2/29/08 | | Expenses
Paid During
Period (p)
9/01/07-2/29/08 |
| A | | Actual | | 1.50% | | $1,000.00 | | $934.03 | | $7.21 |
| | Hypothetical (h) | | 1.50% | | $1,000.00 | | $1,017.40 | | $7.52 |
| B | | Actual | | 2.15% | | $1,000.00 | | $930.93 | | $10.32 |
| | Hypothetical (h) | | 2.15% | | $1,000.00 | | $1,014.17 | | $10.77 |
| C | | Actual | | 2.15% | | $1,000.00 | | $930.82 | | $10.32 |
| | Hypothetical (h) | | 2.15% | | $1,000.00 | | $1,014.17 | | $10.77 |
| I | | Actual | | 1.15% | | $1,000.00 | | $935.95 | | $5.54 |
| | Hypothetical (h) | | 1.15% | | $1,000.00 | | $1,019.14 | | $5.77 |
| R | | Actual | | 1.65% | | $1,000.00 | | $933.49 | | $7.93 |
| | Hypothetical (h) | | 1.65% | | $1,000.00 | | $1,016.66 | | $8.27 |
| R1 | | Actual | | 2.25% | | $1,000.00 | | $930.71 | | $10.80 |
| | Hypothetical (h) | | 2.25% | | $1,000.00 | | $1,013.67 | | $11.26 |
| R2 | | Actual | | 1.82% | | $1,000.00 | | $932.14 | | $8.74 |
| | Hypothetical (h) | | 1.82% | | $1,000.00 | | $1,015.81 | | $9.12 |
| R3 | | Actual | | 1.75% | | $1,000.00 | | $933.03 | | $8.41 |
| | Hypothetical (h) | | 1.75% | | $1,000.00 | | $1,016.16 | | $8.77 |
| R4 | | Actual | | 1.50% | | $1,000.00 | | $933.98 | | $7.21 |
| | Hypothetical (h) | | 1.50% | | $1,000.00 | | $1,017.40 | | $7.52 |
| R5 | | Actual | | 1.22% | | $1,000.00 | | $935.22 | | $5.87 |
| | Hypothetical (h) | | 1.22% | | $1,000.00 | | $1,018.80 | | $6.12 |
| (h) | 5% class return per year before expenses. |
| (p) | Expenses paid is equal to each class’ annualized expense ratio, as shown above, multiplied by the average account value over the period, multiplied by the number of days in the period, divided by the number of days in the year. Expenses paid do not include any applicable sales charges (loads). If these transaction costs had been included, your costs would have been higher. |
Effective January 1, 2008 the fund’s Class R2, Class R3, Class R4, and Class R5 retirement plan administration and service fee was terminated (as described in Note 3 of the Notes to the Financial Statements). Had this fee change been in effect throughout the entire six month period, the annualized expense ratios would have been 1.65%, 1.65%, 1.40% and 1.15% for Class R2, Class R3, Class R4 and Class R5 shares, respectively. The actual expenses paid during the period would have been approximately $7.96, $7.96, $6.75, and $5.55 and the hypothetical expenses paid during the period would have been approximately $8.30, $8.30, $7.04 and $5.79 for Class R2, Class R3, Class R4 and Class R5 shares, respectively.
Effective March 1, 2008 the fund’s Class R1 retirement plan administration and service fee was terminated and the Class R1 distribution fee was increased (as described in Note 3 of the Notes to the Financial Statements). Had these fee changes been in effect throughout the entire six month period, the annualized expense ratio would have been 2.15%. The actual expenses paid during the period would have been approximately $10.35 and the hypothetical expenses paid during the period would have been approximately $10.80.
4
PORTFOLIO OF INVESTMENTS
2/29/08 (unaudited)
The Portfolio of Investments is a complete list of all securities owned by your fund. It is categorized by broad-based asset classes.
| | | | | |
| Common Stocks - 97.2% | | | | | |
| Issuer | | Shares/Par | | Value ($) |
| | | | | |
| Broadcasting - 2.5% | | | | | |
| XM Satellite Radio Holdings, Inc., “A” (a)(l) | | 252,153 | | $ | 2,975,405 |
| | |
| Business Services - 1.3% | | | | | |
| Amdocs Ltd. (a) | | 48,500 | | $ | 1,503,500 |
| | |
| Computer Software - 23.6% | | | | | |
| Akamai Technologies, Inc. (a)(l) | | 65,800 | | $ | 2,313,528 |
| MicroStrategy, Inc., “A” (a)(l) | | 79,400 | | | 5,281,688 |
| MSC Software Corp. (a)(l) | | 427,487 | | | 5,416,260 |
| Oracle Corp. (a) | | 145,400 | | | 2,733,520 |
| Salesforce.com, Inc. (a)(l) | | 125,603 | | | 7,501,011 |
| TIBCO Software, Inc. (a)(l) | | 171,500 | | | 1,209,075 |
| VeriSign, Inc. (a) | | 92,856 | | | 3,231,389 |
| | | | | |
| | | | | $ | 27,686,471 |
| Computer Software - Systems - 13.3% | | | | | |
| EMC Corp. (a)(l) | | 197,593 | | $ | 3,070,595 |
| Hewlett-Packard Co. | | 51,000 | | | 2,436,270 |
| International Business Machines Corp. | | 61,770 | | | 7,033,132 |
| Network Appliance, Inc. (a) | | 140,703 | | | 3,041,999 |
| | | | | |
| | | | | $ | 15,581,996 |
| Electronics - 28.3% | | | | | |
| Flextronics International Ltd. (a) | | 724,762 | | $ | 7,349,087 |
| Hittite Microwave Corp. (a) | | 25,600 | | | 847,616 |
| Intel Corp. | | 343,966 | | | 6,862,122 |
| Intersil Corp., “A” | | 99,400 | | | 2,313,038 |
| Marvell Technology Group Ltd. (a)(l) | | 274,206 | | | 3,101,270 |
| National Semiconductor Corp. | | 197,780 | | | 3,257,437 |
| Nintendo Co. Ltd. | | 7,020 | | | 3,483,029 |
| Samsung Electronics Co. Ltd., GDR | | 11,749 | | | 3,429,362 |
| SanDisk Corp. (a)(l) | | 110,216 | | | 2,595,587 |
| | | | | |
| | | | | $ | 33,238,548 |
5
Portfolio of Investments (unaudited) – continued
| | | | | | |
| Issuer | | Shares/Par | | Value ($) |
| | | | | | |
| Common Stocks - continued | | | | | | |
| Internet - 8.9% | | | | | | |
| Google, Inc., “A” (a) | | | 9,105 | | $ | 4,290,094 |
| NHN Corp. (a) | | | 5,095 | | | 1,132,036 |
| Omniture, Inc. (a) | | | 64,600 | | | 1,484,508 |
| Tencent Holdings Ltd. | | | 573,600 | | | 3,545,366 |
| | | | | | |
| | | | | | $ | 10,452,004 |
| Leisure & Toys - 7.5% | | | | | | |
| Activision, Inc. (a) | | | 130,700 | | $ | 3,561,575 |
| Take-Two Interactive Software, Inc. (a)(l) | | | 149,900 | | | 3,972,350 |
| THQ, Inc. (a)(l) | | | 69,700 | | | 1,304,087 |
| | | | | | |
| | | | | | $ | 8,838,012 |
| Network & Telecom - 10.7% | | | | | | |
| F5 Networks, Inc. (a) | | | 64,500 | | $ | 1,429,320 |
| Foundry Networks, Inc. (a) | | | 101,900 | | | 1,209,553 |
| Nokia Corp., ADR | | | 91,800 | | | 3,305,718 |
| Research in Motion Ltd. (a) | | | 47,781 | | | 4,959,668 |
| Sonus Networks, Inc. (a)(l) | | | 480,980 | | | 1,596,854 |
| | | | | | |
| | | | | | $ | 12,501,113 |
| Telephone Services - 1.1% | | | | | | |
| Global Crossing Ltd. (a)(l) | | | 64,100 | | $ | 1,237,771 |
| Total Common Stocks (Identified Cost, $130,099,708) | | | | | $ | 114,014,820 |
| | |
| Issue/Expiration Date/Strike Price | | Number of
Contracts | | |
| Put Options Purchased - 0.9% | | | | | | |
| Texas Instruments, Inc. - March 2008 @ $30 (a) | | | 4,552 | | $ | 405,128 |
| Qualcomm, Inc. - March 2008 @ $42.50 (a) | | | 1,214 | | | 179,672 |
| Broadcom Corp. - March 2008 @ $25 (a) | | | 811 | | | 470,380 |
| Total Put Options Purchased (Premiums Paid, $1,095,912) | | | | | $ | 1,055,180 |
| | |
| Issuer | | Shares/Par | | |
| Short-Term Obligations - 1.8% | | | | | | |
General Electric Capital Corp., 3.13%, due 3/03/08,
at Amortized Cost and Value (y) | | $ | 2,074,000 | | $ | 2,073,639 |
| | |
| Collateral for Securities Loaned - 17.1% | | | | | | |
Navigator Securities Lending Prime Portfolio,
at Cost and Net Asset Value | | | 20,109,893 | | $ | 20,109,893 |
| Total Investments (Identified Cost, $153,379,152) (k) | | | | | $ | 137,253,532 |
6
Portfolio of Investments (unaudited) – continued
| | | | | | | |
| Issue/Expiration Date/Strike Price | | Number of
Contracts | | | Value ($) | |
| | | | | | | |
| Call Options Written - (0.1)% | | | | | | | |
| XM Satellite Radio Holdings, Inc. - March 2008 @ $16 (a) | | (1,703 | ) | | $ | (51,090 | ) |
| F5 Networks, Inc. - April 2008 @ $25 (a) | | (645 | ) | | | (70,950 | ) |
| Total Call Options Written (Premiums Received, $164,570) | | | | | $ | (122,040 | ) |
| | |
| Other Assets, Less Liabilities - (16.9)% | | | | | | (19,800,074) | |
| Net Assets - 100.0% | | | | | $ | 117,331,418 | |
| (a) | Non-income producing security. |
| (k) | As of February 29, 2008, the fund had nine securities that were fair valued, aggregating $12,522,933 and 9.12% of market value, in accordance with the policies adopted by the Board of Trustees. |
| (l) | All or a portion of this security is on loan. |
| (y) | The rate shown represents an annualized yield at time of purchase. |
The following abbreviations are used in this report and are defined:
| ADR | | American Depository Receipt |
| GDR | | Global Depository Receipt |
See Notes to Financial Statements
7
Financial Statements
STATEMENT OF ASSETS AND LIABILITIES
At 2/29/08 (unaudited)
This statement represents your fund’s balance sheet, which details the assets and liabilities comprising the total value of the fund
| | | | | |
| Assets | | | | | |
| Investments, at value, including $20,100,161 of securities on loan (identified cost, $153,379,152) | | $137,253,532 | | | |
| Foreign currency, at value (identified cost, $33) | | 32 | | | |
| Receivable for investments sold | | 4,212,049 | | | |
| Receivable for fund shares sold | | 287,484 | | | |
| Interest and dividends receivable | | 103,361 | | | |
| Receivable from investment adviser | | 15,981 | | | |
| Other assets | | 2,532 | | | |
| Total assets | | | | | $141,874,971 |
| Liabilities | | | | | |
| Payable to custodian | | $369,095 | | | |
| Payable for investments purchased | | 3,598,550 | | | |
| Payable for fund shares reacquired | | 133,739 | | | |
| Collateral for securities loaned, at value (c) | | 20,109,893 | | | |
Written options outstanding, at value (premiums
received, $164,570) | | 122,040 | | | |
| Payable to affiliates | | | | | |
Management fee | | 4,951 | | | |
Shareholder servicing costs | | 54,791 | | | |
Distribution and service fees | | 4,072 | | | |
Administrative services fee | | 143 | | | |
Retirement plan administration and services fees | | 37 | | | |
| Payable for independent trustees’ compensation | | 57,675 | | | |
| Accrued expenses and other liabilities | | 88,567 | | | |
| Total liabilities | | | | | $24,543,553 |
| Net assets | | | | | $117,331,418 |
| Net assets consist of: | | | | | |
| Paid-in capital | | $416,277,270 | | | |
Unrealized appreciation (depreciation) on investments and
translation of assets and liabilities in foreign currencies | | (16,079,127 | ) | | |
Accumulated net realized gain (loss) on investments and foreign
currency transactions | | (282,111,013 | ) | | |
| Accumulated net investment loss | | (755,712 | ) | | |
| Net assets | | | | | $117,331,418 |
| Shares of beneficial interest outstanding | | | | | 9,623,265 |
| (c) | Non-cash collateral not included. |
8
Statement of Assets and Liabilities (unaudited) – continued
| | | | |
| Class A shares | | | | |
Net assets | | $50,886,605 | | |
Shares outstanding | | 4,083,157 | | |
Net asset value per share | | | | $12.46 |
Offering price per share (100 / 94.25 × net asset value per share) | | | | $13.22 |
| Class B shares | | | | |
Net assets | | $31,436,603 | | |
Shares outstanding | | 2,650,165 | | |
Net asset value and offering price per share | | | | $11.86 |
| Class C shares | | | | |
Net assets | | $15,983,093 | | |
Shares outstanding | | 1,349,710 | | |
Net asset value and offering price per share | | | | $11.84 |
| Class I shares | | | | |
Net assets | | $4,575,355 | | |
Shares outstanding | | 355,778 | | |
Net asset value, offering price, and redemption price per share | | | | $12.86 |
| Class R shares | | | | |
Net assets | | $1,254,678 | | |
Shares outstanding | | 101,594 | | |
Net asset value, offering price, and redemption price per share | | | | $12.35 |
| Class R1 shares | | | | |
Net assets | | $1,867,153 | | |
Shares outstanding | | 157,941 | | |
Net asset value, offering price, and redemption price per share | | | | $11.82 |
| Class R2 shares | | | | |
Net assets | | $1,738,283 | | |
Shares outstanding | | 145,431 | | |
Net asset value, offering price, and redemption price per share | | | | $11.95 |
| Class R3 shares | | | | |
Net assets | | $7,346,384 | | |
Shares outstanding | | 599,334 | | |
Net asset value, offering price, and redemption price per share | | | | $12.26 |
| Class R4 shares | | | | |
Net assets | | $2,167,220 | | |
Shares outstanding | | 174,102 | | |
Net asset value, offering price, and redemption price per share | | | | $12.45 |
| Class R5 shares | | | | |
Net assets | | $76,044 | | |
Shares outstanding | | 6,053 | | |
Net asset value, offering price, and redemption price per share | | | | $12.56 |
On sales of $50,000 or more, the offering price of Class A shares is reduced. A contingent deferred sales charge may be imposed on redemptions of Class A, Class B, and Class C shares.
See Notes to Financial Statements
9
Financial Statements
STATEMENT OF OPERATIONS
Six months ended 2/29/08 (unaudited)
This statement describes how much your fund earned in investment income and accrued in expenses. It also describes any gains and/or losses generated by fund operations.
| | | | | | |
| Net Investment loss | | | | | | |
| Income | | | | | | |
Dividends | | $253,879 | | | | |
Income on securities loaned | | 90,718 | | | | |
Interest | | 75,630 | | | | |
| Total investment income | | | | | $420,227 | |
| Expenses | | | | | | |
Management fee | | $495,497 | | | | |
Distribution and service fees | | 410,600 | | | | |
Shareholder servicing costs | | 185,611 | | | | |
Administrative services fee | | 14,529 | | | | |
Retirement plan administration and services fees | | 8,875 | | | | |
Independent trustees’ compensation | | 1,369 | | | | |
Custodian fee | | 33,047 | | | | |
Shareholder communications | | 27,975 | | | | |
Auditing fees | | 23,423 | | | | |
Legal fees | | 1,270 | | | | |
Registration fees | | 68,903 | | | | |
Miscellaneous | | 11,020 | | | | |
| Total expenses | | | | | $1,282,119 | |
Fees paid indirectly | | (4,176 | ) | | | |
Reduction of expenses by investment adviser | | (102,004 | ) | | | |
| Net expenses | | | | | $1,175,939 | |
| Net investment loss | | | | | $(755,712 | ) |
| Realized and unrealized gain (loss) on investments | | | | | | |
| Realized gain (loss) (identified cost basis) | | | | | | |
Investment transactions | | $7,522,285 | | | | |
Written option transactions | | 284,408 | | | | |
Foreign currency transactions | | (8,404 | ) | | | |
Net realized gain (loss) on investments
and foreign currency transactions | | | | | $7,798,289 | |
| Change in unrealized appreciation (depreciation) | | | | | | |
Investments | | $(16,179,364 | ) | | | |
Written options | | 42,530 | | | | |
Translation of assets and liabilities in foreign currencies | | 3,732 | | | | |
Net unrealized gain (loss) on investments and foreign
currency translation | | | | | $(16,133,102 | ) |
Net realized and unrealized gain (loss) on investments
and foreign currency | | | | | $(8,334,813 | ) |
| Change in net assets from operations | | | | | $(9,090,525 | ) |
See Notes to Financial Statements
10
Financial Statements
STATEMENTS OF CHANGES IN NET ASSETS
These statements describe the increases and/or decreases in net assets resulting from operations, any distributions, and any shareholder transactions.
| | | | | | |
| | | Six months ended
2/29/08
(unaudited) | | | Year ended 8/31/07 | |
| Change in net assets | | | | |
| From operations | | | | | | |
| Net investment loss | | $(755,712 | ) | | $(1,356,650 | ) |
Net realized gain (loss) on investments and foreign
currency transactions | | 7,798,289 | | | 30,957,159 | |
| Net unrealized gain (loss) on investments and foreign currency translation | | (16,133,102 | ) | | 1,794,428 | |
| Change in net assets from operations | | $(9,090,525 | ) | | $31,394,937 | |
| Change in net assets from fund share transactions | | $(393,428 | ) | | $(6,670,719 | ) |
| Total change in net assets | | $(9,483,953 | ) | | $24,724,218 | |
| Net assets | | | | | | |
| At beginning of period | | 126,815,371 | | | 102,091,153 | |
At end of period (including accumulated net investment
loss of $755,712 and $0, respectively) | | $117,331,418 | | | $126,815,371 | |
See Notes to Financial Statements
11
Financial Statements
FINANCIAL HIGHLIGHTS
The financial highlights table is intended to help you understand the fund’s financial performance for the semiannual period and the past 5 fiscal years (or life of a particular share class, if shorter). Certain information reflects financial results for a single fund share. The total returns in the table represent the rate by which an investor would have earned (or lost) on an investment in the fund share class (assuming reinvestment of all distributions) held for the entire period.
| | | | | | | | | | | | | | | | | | |
| | | Six months
ended
2/29/08 (unaudited) | | | Years ended 8/31 | |
| Class A | | | 2007 | | | 2006 | | | 2005 | | | 2004 | | | 2003 | |
| | | | | | | | | | | | | | | | | |
| Net asset value, beginning of period | | $13.34 | | | $10.13 | | | $8.84 | | | $7.70 | | | $8.30 | | | $6.25 | |
Income (loss) from
investment operations | | | | | | | | | | | | | | | | | | |
Net investment loss (d) | | $(0.06 | ) | | $(0.10 | ) | | $(0.11 | ) | | $(0.05 | ) | | $(0.10 | ) | | $(0.07 | ) |
Net realized and unrealized
gain (loss) on investments
and foreign currency | | (0.82 | ) | | 3.31 | | | 1.40 | | | 1.19 | | | (0.50 | ) | | 2.12 | |
| Total from investment operations | | $(0.88 | ) | | $3.21 | | | $1.29 | | | $1.14 | | | $(0.60 | ) | | $2.05 | |
| Net asset value, end of period | | $12.46 | | | $13.34 | | | $10.13 | | | $8.84 | | | $7.70 | | | $8.30 | |
| Total return (%) (r)(s)(t) | | (6.60 | )(n) | | 31.69 | | | 14.59 | | | 14.81 | | | (7.23 | )(b) | | 32.80 | |
Ratios (%) (to average net assets)
and Supplemental data: | | | | | | | | | | | | | | | | | | |
| Expenses before expense reductions (f) | | 1.66 | (a) | | 1.70 | | | 1.79 | | | 1.79 | | | 1.60 | | | 1.76 | |
| Expenses after expense reductions (f) | | 1.50 | (a) | | 1.50 | | | 1.50 | | | 1.51 | | | 1.50 | | | 1.52 | |
| Net investment loss | | (0.86 | )(a) | | (0.82 | ) | | (1.13 | ) | | (0.56 | ) | | (1.10 | ) | | (1.05 | ) |
| Portfolio turnover | | 117 | | | 266 | | | 217 | | | 163 | | | 141 | | | 162 | |
Net assets at end of period
(000 Omitted) | | $50,887 | | | $56,598 | | | $43,313 | | | $48,945 | | | $75,786 | | | $101,059 | |
See Notes to Financial Statements
12
Financial Highlights – continued
| | | | | | | | | | | | | | | | | | |
| | | Six months
ended
2/29/08 (unaudited) | | | Years ended 8/31 | |
| Class B | | | 2007 | | | 2006 | | | 2005 | | | 2004 | | | 2003 | |
| | | | | | | | | | | | | | | | | |
| Net asset value, beginning of period | | $12.74 | | | $9.73 | | | $8.55 | | | $7.50 | | | $8.13 | | | $6.16 | |
Income (loss) from
investment operations | | | | | | | | | | | | | | | | | | |
Net investment loss (d) | | $(0.10 | ) | | $(0.17 | ) | | $(0.17 | ) | | $(0.10 | ) | | $(0.15 | ) | | $(0.11 | ) |
Net realized and unrealized
gain (loss) on investments
and foreign currency | | (0.78 | ) | | 3.18 | | | 1.35 | | | 1.15 | | | (0.48 | ) | | 2.08 | |
| Total from investment operations | | $(0.88 | ) | | $3.01 | | | $1.18 | | | $1.05 | | | $(0.63 | ) | | $1.97 | |
| Net asset value, end of period | | $11.86 | | | $12.74 | | | $9.73 | | | $8.55 | | | $7.50 | | | $8.13 | |
| Total return (%) (r)(s)(t) | | (6.91 | )(n) | | 30.94 | | | 13.80 | | | 14.00 | | | (7.75 | )(b) | | 31.98 | |
Ratios (%) (to average net assets)
and Supplemental data: | | | | | | | | | | | | | | | | | | |
| Expenses before expense reductions (f) | | 2.31 | (a) | | 2.36 | | | 2.44 | | | 2.44 | | | 2.25 | | | 2.42 | |
| Expenses after expense reductions (f) | | 2.15 | (a) | | 2.15 | | | 2.15 | | | 2.16 | | | 2.15 | | | 2.18 | |
| Net investment loss | | (1.52 | )(a) | | (1.47 | ) | | (1.79 | ) | | (1.24 | ) | | (1.74 | ) | | (1.71 | ) |
| Portfolio turnover | | 117 | | | 266 | | | 217 | | | 163 | | | 141 | | | 162 | |
Net assets at end of period
(000 Omitted) | | $31,437 | | | $38,540 | | | $39,025 | | | $43,765 | | | $50,896 | | | $61,353 | |
See Notes to Financial Statements
13
Financial Highlights – continued
| | | | | | | | | | | | | | | | | | |
| | | Six months
ended
2/29/08 (unaudited) | | | Years ended 8/31 | |
| Class C | | | 2007 | | | 2006 | | | 2005 | | | 2004 | | | 2003 | |
| | | | | | | | | | | | | | | | | |
| Net asset value, beginning of period | | $12.72 | | | $9.72 | | | $8.54 | | | $7.48 | | | $8.12 | | | $6.16 | |
Income (loss) from
investment operations | | | | | | | | | | | | | | | | | | |
Net investment loss (d) | | $(0.10 | ) | | $(0.17 | ) | | $(0.17 | ) | | $(0.10 | ) | | $(0.15 | ) | | $(0.11 | ) |
Net realized and unrealized
gain (loss) on investments
and foreign currency | | (0.78 | ) | | 3.17 | | | 1.35 | | | 1.16 | | | (0.49 | ) | | 2.07 | |
| Total from investment operations | | $(0.88 | ) | | $3.00 | | | $1.18 | | | $1.06 | | | $(0.64 | ) | | $1.96 | |
| Net asset value, end of period | | $11.84 | | | $12.72 | | | $9.72 | | | $8.54 | | | $7.48 | | | $8.12 | |
| Total return (%) (r)(s)(t) | | (6.92 | )(n) | | 30.86 | | | 13.82 | | | 14.17 | | | (7.88 | )(b) | | 31.82 | |
Ratios (%) (to average net assets)
and Supplemental data: | | | | | | | | | | | | | | | | | | |
| Expenses before expense reductions (f) | | 2.31 | (a) | | 2.35 | | | 2.44 | | | 2.44 | | | 2.25 | | | 2.42 | |
| Expenses after expense reductions (f) | | 2.15 | (a) | | 2.15 | | | 2.15 | | | 2.16 | | | 2.15 | | | 2.18 | |
| Net investment loss | | (1.51 | )(a) | | (1.46 | ) | | (1.78 | ) | | (1.22 | ) | | (1.74 | ) | | (1.71 | ) |
| Portfolio turnover | | 117 | | | 266 | | | 217 | | | 163 | | | 141 | | | 162 | |
Net assets at end of period
(000 Omitted) | | $15,983 | | | $16,064 | | | $11,659 | | | $12,414 | | | $15,367 | | | $20,210 | |
See Notes to Financial Statements
14
Financial Highlights – continued
| | | | | | | | | | | | | | | | | |
| | | Six months
ended
2/29/08 (unaudited) | | | Years ended 8/31 | |
| Class I | | | 2007 | | | 2006 | | | 2005 | | 2004 | | | 2003 | |
| | | | | | | | | | | | | | | | |
| Net asset value, beginning of period | | $13.74 | | | $10.39 | | | $9.04 | | | $7.85 | | $8.43 | | | $6.33 | |
Income (loss) from
investment operations | | | | | | | | | | | | | | | | | |
Net investment income (loss) (d) | | $(0.04 | ) | | $(0.06 | ) | | $(0.08 | ) | | $0.01 | | $(0.06 | ) | | $(0.05 | ) |
Net realized and unrealized
gain (loss) on investments
and foreign currency | | (0.84 | ) | | 3.41 | | | 1.43 | | | 1.18 | | (0.52 | ) | | 2.15 | |
| Total from investment operations | | $(0.88 | ) | | $3.35 | | | $1.35 | | | $1.19 | | $(0.58 | ) | | $2.10 | |
| Net asset value, end of period | | $12.86 | | | $13.74 | | | $10.39 | | | $9.04 | | $7.85 | | | $8.43 | |
| Total return (%) (r)(s) | | (6.40 | )(n) | | 32.24 | | | 14.93 | | | 15.16 | | (6.88 | )(b) | | 33.18 | |
Ratios (%) (to average net assets)
and Supplemental data: | | | | | | | | | | | | | | | | | |
| Expenses before expense reductions (f) | | 1.31 | (a) | | 1.35 | | | 1.43 | | | 1.44 | | 1.26 | | | 1.41 | |
| Expenses after expense reductions (f) | | 1.15 | (a) | | 1.15 | | | 1.15 | | | 1.16 | | 1.16 | | | 1.17 | |
| Net investment income (loss) | | (0.50 | )(a) | | (0.47 | ) | | (0.78 | ) | | 0.17 | | (0.70 | ) | | (0.71 | ) |
| Portfolio turnover | | 117 | | | 266 | | | 217 | | | 163 | | 141 | | | 162 | |
Net assets at end of period
(000 Omitted) | | $4,575 | | | $4,180 | | | $3,492 | | | $3,384 | | $13,404 | | | $4,179 | |
See Notes to Financial Statements
15
Financial Highlights – continued
| | | | | | | | | | | | | | | | | | |
| | | Six months
ended
2/29/08 (unaudited) | | | Years ended 8/31 | |
| Class R | | | 2007 | | | 2006 | | | 2005 | | | 2004 | | | 2003 (i) | |
| | | | | | | | | | | | | | | | | |
| Net asset value, beginning of period | | $13.23 | | | $10.06 | | | $8.80 | | | $7.67 | | | $8.28 | | | $6.16 | |
Income (loss) from
investment operations | | | | | | | | | | | | | | | | | | |
Net investment loss (d) | | $(0.07 | ) | | $(0.12 | ) | | $(0.13 | ) | | $(0.07 | ) | | $(0.10 | ) | | $(0.08 | ) |
Net realized and unrealized
gain (loss) on investments
and foreign currency | | (0.81 | ) | | 3.29 | | | 1.39 | | | 1.20 | | | (0.51 | ) | | 2.20 | |
| Total from investment operations | | $(0.88 | ) | | $3.17 | | | $1.26 | | | $1.13 | | | $(0.61 | ) | | $2.12 | |
| Net asset value, end of period | | $12.35 | | | $13.23 | | | $10.06 | | | $8.80 | | | $7.67 | | | $8.28 | |
| Total return (%) (r)(s) | | (6.65 | )(n) | | 31.51 | | | 14.32 | | | 14.73 | | | (7.37 | )(b) | | 34.42 | (n) |
Ratios (%) (to average net assets)
and Supplemental data: | | | | | | | | | | | | | | | | | | |
| Expenses before expense reductions (f) | | 1.81 | (a) | | 1.87 | | | 1.93 | | | 1.94 | | | 1.76 | | | 1.88 | (a) |
| Expenses after expense reductions (f) | | 1.65 | (a) | | 1.65 | | | 1.65 | | | 1.66 | | | 1.66 | | | 1.64 | (a) |
| Net investment loss | | (1.02 | )(a) | | (0.99 | ) | | (1.28 | ) | | (0.79 | ) | | (1.21 | ) | | (1.22 | )(a) |
| Portfolio turnover | | 117 | | | 266 | | | 217 | | | 163 | | | 141 | | | 162 | |
Net assets at end of period
(000 Omitted) | | $1,255 | | | $2,043 | | | $3,047 | | | $2,283 | | | $1,266 | | | $173 | |
See Notes to Financial Statements
16
Financial Highlights – continued
| | | | | | | | | | | | |
| | | Six months
ended
2/29/08 (unaudited) | | | Years ended 8/31 | |
| Class R1 | | | 2007 | | | 2006 | | | 2005 (i) | |
| | | | | | | | | | | |
| Net asset value, beginning of period | | $12.70 | | | $9.72 | | | $8.55 | | | $8.01 | |
Income (loss) from
investment operations | | | | | | | | | | | | |
Net investment loss (d) | | $(0.10 | ) | | $(0.19 | ) | | $(0.18 | ) | | $(0.07 | ) |
Net realized and unrealized
gain (loss) on investments
and foreign currency | | (0.78 | ) | | 3.17 | | | 1.35 | | | 0.61 | (g) |
| Total from investment operations | | $(0.88 | ) | | $2.98 | | | $1.17 | | | $0.54 | |
| Net asset value, end of period | | $11.82 | | | $12.70 | | | $9.72 | | | $8.55 | |
| Total return (%) (r)(s) | | (6.93 | )(n) | | 30.66 | | | 13.68 | | | 6.74 | (n) |
Ratios (%) (to average net assets)
and Supplemental data: | | | | | | | | | | | | |
| Expenses before expense reductions (f) | | 2.41 | (a) | | 2.48 | | | 2.63 | | | 2.62 | (a) |
| Expenses after expense reductions (f) | | 2.25 | (a) | | 2.25 | | | 2.25 | | | 2.34 | (a) |
| Net investment loss | | (1.60 | )(a) | | (1.63 | ) | | (1.88 | ) | | (1.90 | )(a) |
| Portfolio turnover | | 117 | | | 266 | | | 217 | | | 163 | |
Net assets at end of period
(000 Omitted) | | $1,867 | | | $1,235 | | | $213 | | | $64 | |
See Notes to Financial Statements
17
Financial Highlights – continued
| | | | | | | | | | | | |
| | | Six months
ended
2/29/08 (unaudited) | | | Years ended 8/31 | |
| Class R2 | | | 2007 | | | 2006 | | | 2005 (i) | |
| | | | | | | | | | | |
| Net asset value, beginning of period | | $12.82 | | | $9.77 | | | $8.56 | | | $8.01 | |
Income (loss) from
investment operations | | | | | | | | | | | | |
Net investment loss (d) | | $(0.08 | ) | | $(0.14 | ) | | $(0.15 | ) | | $(0.05 | ) |
Net realized and unrealized
gain (loss) on investments
and foreign currency | | (0.79 | ) | | 3.19 | | | 1.36 | | | 0.60 | (g) |
| Total from investment operations | | $(0.87 | ) | | $3.05 | | | $1.21 | | | $0.55 | |
| Net asset value, end of period | | $11.95 | | | $12.82 | | | $9.77 | | | $8.56 | |
| Total return (%) (r)(s) | | (6.79 | )(n) | | 31.22 | | | 14.14 | | | 6.87 | (n) |
Ratios (%) (to average net assets)
and Supplemental data: | | | | | | | | | | | | |
| Expenses before expense reductions (f) | | 1.97 | (a) | | 2.13 | | | 2.33 | | | 2.32 | (a) |
| Expenses after expense reductions (f) | | 1.82 | (a) | | 1.90 | | | 1.90 | | | 2.04 | (a) |
| Net investment loss | | (1.16 | )(a) | | (1.16 | ) | | (1.52 | ) | | (1.60 | )(a) |
| Portfolio turnover | | 117 | | | 266 | | | 217 | | | 163 | |
Net assets at end of period
(000 Omitted) | | $1,738 | | | $1,237 | | | $367 | | | $85 | |
See Notes to Financial Statements
18
Financial Highlights – continued
| | | | | | | | | | | | | | | |
| | | Six months
ended
2/29/08 (unaudited) | | | Years ended 8/31 | |
| Class R3 | | | 2007 | | | 2006 | | | 2005 | | | 2004 (i) | |
| | | | | | | | | | | | | | |
| Net asset value, beginning of period | | $13.14 | | | $10.00 | | | $8.76 | | | $7.66 | | | $8.79 | |
Income (loss) from
investment operations | | | | | | | | | | | | | | | |
Net investment loss (d) | | $(0.07 | ) | | $(0.13 | ) | | $(0.14 | ) | | $(0.09 | ) | | $(0.09 | ) |
Net realized and unrealized
gain (loss) on investments
and foreign currency | | (0.81 | ) | | 3.27 | | | 1.38 | | | 1.19 | | | (1.04 | ) |
| Total from investment operations | | $(0.88 | ) | | $3.14 | | | $1.24 | | | $1.10 | | | $(1.13 | ) |
| Net asset value, end of period | | $12.26 | | | $13.14 | | | $10.00 | | | $8.76 | | | $7.66 | |
| Total return (%) (r)(s) | | (6.70 | )(n) | | 31.40 | | | 14.16 | | | 14.36 | | | (12.86 | )(b)(n) |
Ratios (%) (to average net assets)
and Supplemental data: | | | | | | | | | | | | | | | |
| Expenses before expense reductions (f) | | 1.91 | (a) | | 1.98 | | | 2.18 | | | 2.19 | | | 2.01 | (a) |
| Expenses after expense reductions (f) | | 1.75 | (a) | | 1.80 | | | 1.80 | | | 1.91 | | | 1.91 | (a) |
| Net investment loss | | (1.10 | )(a) | | (1.07 | ) | | (1.41 | ) | | (1.07 | ) | | (1.47 | )(a) |
| Portfolio turnover | | 117 | | | 266 | | | 217 | | | 163 | | | 141 | |
Net assets at end of period
(000 Omitted) | | $7,346 | | | $5,292 | | | $800 | | | $192 | | | $132 | |
See Notes to Financial Statements
19
Financial Highlights – continued
| | | | | | | | | | | | |
| | | Six months
ended
2/29/08 (unaudited) | | | Years ended 8/31 | |
| Class R4 | | | 2007 | | | 2006 | | | 2005 (i) | |
| | | | | | | | | | | |
| Net asset value, beginning of period | | $13.33 | | | $10.12 | | | $8.85 | | | $8.26 | |
Income (loss) from
investment operations | | | | | | | | | | | | |
Net investment loss (d) | | $(0.06 | ) | | $(0.10 | ) | | $(0.14 | ) | | $(0.04 | ) |
Net realized and unrealized
gain (loss) on investments
and foreign currency | | (0.82 | ) | | 3.31 | | | 1.41 | | | 0.63 | (g) |
| Total from investment operations | | $(0.88 | ) | | $3.21 | | | $1.27 | | | $0.59 | |
| Net asset value, end of period | | $12.45 | | | $13.33 | | | $10.12 | | | $8.85 | |
| Total return (%) (r)(s) | | (6.60 | )(n) | | 31.72 | | | 14.35 | | | 7.14 | (n) |
Ratios (%) (to average net assets)
and Supplemental data: | | | | | | | | | | | | |
| Expenses before expense reductions (f) | | 1.66 | (a) | | 1.70 | | | 1.84 | | | 1.82 | (a) |
| Expenses after expense reductions (f) | | 1.50 | (a) | | 1.55 | | | 1.55 | | | 1.54 | (a) |
| Net investment loss | | (0.84 | )(a) | | (0.76 | ) | | (1.18 | ) | | (1.10 | )(a) |
| Portfolio turnover | | 117 | | | 266 | | | 217 | | | 163 | |
Net assets at end of period
(000 Omitted) | | $2,167 | | | $1,547 | | | $113 | | | $54 | |
See Notes to Financial Statements
20
Financial Highlights – continued
| | | | | | | | | | | | |
| | | Six months
ended
2/29/08 (unaudited) | | | Years ended 8/31 | |
| Class R5 | | | 2007 | | | 2006 | | | 2005 (i) | |
| | | | | | | | | | | |
| Net asset value, beginning of period | | $13.43 | | | $10.17 | | | $8.86 | | | $8.26 | |
Income (loss) from
investment operations | | | | | | | | | | | | |
Net investment loss (d) | | $(0.04 | ) | | $(0.07 | ) | | $(0.09 | ) | | $(0.03 | ) |
Net realized and unrealized
gain (loss) on investments
and foreign currency | | (0.83 | ) | | 3.33 | | | 1.40 | | | 0.63 | (g) |
| Total from investment operations | | $(0.87 | ) | | $3.26 | | | $1.31 | | | $0.60 | |
| Net asset value, end of period | | $12.56 | | | $13.43 | | | $10.17 | | | $8.86 | |
| Total return (%) (r)(s) | | (6.48 | )(n) | | 32.06 | | | 14.79 | | | 7.26 | (n) |
Ratios (%) (to average net assets)
and Supplemental data: | | | | | | | | | | | | |
| Expenses before expense reductions (f) | | 1.37 | (a) | | 1.45 | | | 1.53 | | | 1.52 | (a) |
| Expenses after expense reductions (f) | | 1.22 | (a) | | 1.25 | | | 1.25 | | | 1.24 | (a) |
| Net investment loss | | (0.58 | )(a) | | (0.56 | ) | | (0.88 | ) | | (0.79 | )(a) |
| Portfolio turnover | | 117 | | | 266 | | | 217 | | | 163 | |
Net assets at end of period
(000 Omitted) | | $76 | | | $81 | | | $62 | | | $54 | |
Any redemption fees charged by the fund during the 2004 and 2005 fiscal years resulted in a per share impact of less than $0.01.
| (b) | The fund’s net asset value and total return calculation include a non-recurring accrual recorded as a result of an administrative proceeding regarding disclosure of brokerage allocation practices in connection with fund sales. The non-recurring accrual did not have a material impact on the net asset value per share based on the shares outstanding on the day the proceeds were recorded. |
| (d) | Per share data are based on average shares outstanding. |
| (f) | Ratios do not reflect reductions from fees paid indirectly, if applicable. |
| (g) | The per share amount is not in accordance with the net realized and unrealized gain/loss for the period because of the timing of sales of fund shares and the per share amount of realized and unrealized gains and losses at such time. |
| (i) | For the period from the class’ inception, December 31, 2002 (Class R), October 31, 2003 (Class R3), and April 1, 2005 (Classes R1, R2, R4, and R5) through the stated period end. |
| (r) | Certain expenses have been reduced without which performance would have been lower. |
| (s) | From time to time the fund may receive proceeds from litigation settlements, without which performance would be lower. Excluding the effect of the proceeds received from a non-recurring litigation against Global Research Analyst II, the Class A, Class B, Class C, Class I, Class R, Class R1, Class R2, Class R3, Class R4, and Class R5 total returns for the year ended August 31, 2007 would have each been lower by approximately 0.56% |
| (t) | Total returns do not include any applicable sales charges. |
See Notes to Financial Statements
21
NOTES TO FINANCIAL STATEMENTS
(unaudited)
| (1) | | Business and Organization |
MFS Technology Fund (the fund) is a series of MFS Series Trust I (the trust). The trust is organized as a Massachusetts business trust and is registered under the Investment Company Act of 1940, as amended, as an open-end management investment company.
| (2) | | Significant Accounting Policies |
General – The preparation of financial statements in conformity with U.S. generally accepted accounting principles requires management to make estimates and assumptions that affect the reported amounts of assets and liabilities, and disclosure of contingent assets and liabilities at the date of the financial statements and the reported amounts of revenues and expenses during the reporting period. Actual results could differ from those estimates. The fund can invest in foreign securities, including securities of emerging market issuers. Investments in foreign securities are vulnerable to the effects of changes in the relative values of the local currency and the U.S. dollar and to the effects of changes in each country’s legal, political, and economic environment. The markets of emerging markets countries are generally more volatile than the markets of developed countries with more mature economies. All of the risks of investing in foreign securities previously described are heightened when investing in emerging markets countries.
Investment Valuations – Equity securities, including restricted equity securities, are generally valued at the last sale or official closing price as reported by an independent pricing service on the market or exchange on which they are primarily traded. For securities for which there were no sales reported that day, equity securities are generally valued at the last quoted daily bid quotation as reported by an independent pricing service on the market or exchange on which they are primarily traded. For securities held short for which there were no sales reported for the day, the position is generally valued at the last quoted daily ask quotation as reported by an independent pricing service on the market or exchange on which such securities are primarily traded. Short-term instruments with a maturity at issuance of 60 days or less may be valued at amortized cost, which approximates market value. Exchange-traded options are generally valued at the last sale or official closing price as reported by an independent pricing service on the exchange on which such options are primarily traded. Exchange-traded options for which there were no sales reported that day are generally valued at the last daily bid quotation as reported by an independent pricing service on the exchange on which such options are primarily traded. Options not traded on an exchange are generally valued at a broker-dealer bid quotation. Foreign currency options are generally
22
Notes to Financial Statements (unaudited) – continued
valued using an external pricing model that uses market data from an independent source. Open-end investment companies are generally valued at net asset value per share. Securities and other assets generally valued on the basis of information from an independent pricing service may also be valued at a broker-dealer bid quotation. Values obtained from pricing services can utilize both dealer-supplied valuations and electronic data processing techniques, which take into account factors such as institutional-size trading in similar groups of securities, yield, quality, coupon rate, maturity, type of issue, trading characteristics, and other market data. The values of foreign securities and other assets and liabilities expressed in foreign currencies are converted to U.S. dollars using the mean of bid and asked prices for rates reported by an independent pricing service.
The Board of Trustees has delegated primary responsibility for determining or causing to be determined the value of the fund’s investments (including any fair valuation) to the adviser pursuant to valuation policies and procedures approved by the Board. If the adviser determines that reliable market quotations are not readily available, investments are valued at fair value as determined in good faith by the adviser in accordance with such procedures under the oversight of the Board of Trustees. Under the fund’s valuation policies and procedures, market quotations are not considered to be readily available for many types of debt instruments and certain types of derivatives. These investments are generally valued at fair value based on information from independent pricing services. In addition, investments may be valued at fair value if the adviser determines that an investment’s value has been materially affected by events occurring after the close of the exchange or market on which the investment is principally traded (such as foreign exchange or market) and prior to the determination of the fund’s net asset value, or after the halting of trading of a specific security where trading does not resume prior to the close of the exchange or market on which the security is principally traded. Events that occur on a frequent basis after foreign markets close (such as developments in foreign markets and significant movements in the U.S. markets) and prior to the determination of the fund’s net asset value may be deemed to have a material affect on the value of securities traded in foreign markets. Accordingly, the fund’s foreign equity securities may often be valued at fair value. The adviser may rely on independent pricing services or other information (such as the correlation with price movements of similar securities in the same or other markets; the type, cost and investment characteristics of the security; the business and financial condition of the issuer; and trading and other market data) to assist in determining whether to fair value and at what value to fair value an investment. The value of an investment for purposes of calculating the fund’s net asset value can differ depending on the source and method used to
23
Notes to Financial Statements (unaudited) – continued
determine value. When fair valuation is used, the value of investments used to determine the fund’s net asset value may differ from quoted or published prices for the same investments.
In September 2006, FASB Statement No. 157, Fair Value Measurements (the “Statement”) was issued, and is effective for fiscal years beginning after November 15, 2007 and for all interim periods within those fiscal years. This Statement provides a single definition of fair value, a hierarchy for measuring fair value and expanded disclosures about fair value measurements. Management is evaluating the application of the Statement to the fund, and believes the impact will be limited to expanded disclosures resulting from the adoption of this Statement in the fund’s financial statements.
Repurchase Agreements – The fund may enter into repurchase agreements with institutions that the fund’s investment adviser has determined are creditworthy. Each repurchase agreement is recorded at cost. The fund requires that the securities collateral in a repurchase transaction be transferred to the custodian in a manner sufficient to enable the fund to obtain those securities in the event of a default under the repurchase agreement. The fund monitors, on a daily basis, the value of the collateral to ensure that its value, including accrued interest, is greater than amounts owed to the fund under each such repurchase agreement. The fund and other funds managed by Massachusetts Financial Services Company (MFS), may utilize a joint trading account for the purpose of entering into one or more repurchase agreements.
Foreign Currency Translation – Purchases and sales of foreign investments, income, and expenses are converted into U.S. dollars based upon currency exchange rates prevailing on the respective dates of such transactions. Gains and losses attributable to foreign currency exchange rates on sales of securities are recorded for financial statement purposes as net realized gains and losses on investments. Gains and losses attributable to foreign exchange rate movements on income and expenses are recorded for financial statement purposes as foreign currency transaction gains and losses. That portion of both realized and unrealized gains and losses on investments that results from fluctuations in foreign currency exchange rates is not separately disclosed.
Derivative Risk – The fund may invest in derivatives for hedging or non-hedging purposes. While hedging can reduce or eliminate losses, it can also reduce or eliminate gains. When the fund uses derivatives as an investment to gain market exposure, or for hedging purposes, gains and losses from derivative instruments may be substantially greater than the derivative’s original cost. Cash that has been segregated on behalf of certain derivative contracts will be reported separately on the Statement of Assets and Liabilities as restricted cash. Derivative instruments include written options and purchased options.
24
Notes to Financial Statements (unaudited) – continued
Written Options – The fund may write call or put options in exchange for a premium. The premium is initially recorded as a liability, which is subsequently adjusted to the current value of the option contract. When a written option expires, the fund realizes a gain equal to the amount of the premium received. The difference between the premium and the amount paid on effecting a closing transaction is considered a realized gain or loss. When a written call option is exercised, the premium received is offset against the proceeds to determine the realized gain or loss. When a written put option is exercised, the premium reduces the cost basis of the security purchased by the fund. The fund, as writer of an option, may have no control over whether the underlying securities may be sold (call) or purchased (put) and, as a result, bears the market risk of an unfavorable change in the price of the securities underlying the written option. In general, written call options may serve as a partial hedge against decreases in value in the underlying securities to the extent of the premium received.
Written Option Transactions
| | | | | | |
| | | Number
of contracts | | | Premiums
received | |
| Outstanding, beginning of period | | — | | | $— | |
| Options written | | 12,849 | | | 1,493,104 | |
| Options closed | | (5,581 | ) | | (980,901 | ) |
| Options expired | | (4,920 | ) | | (347,633 | ) |
| Outstanding, end of period | | 2,348 | | | $164,570 | |
Purchased Options – The fund may purchase call or put options for a premium. Purchasing call options may be a hedge against an anticipated increase in the dollar cost of securities to be acquired or to increase the fund’s exposure to the underlying instrument. Purchasing put options may hedge against a decline in the value of portfolio securities. The premium paid is included as an investment in the Statement of Assets and Liabilities and is subsequently adjusted to the current value of the option. Premiums paid for purchased options which have expired are treated as realized losses on investments in the Statement of Operations. Premiums paid for purchased options which are exercised or closed are added to the amount paid or offset against the proceeds on the underlying security or financial instrument to determine the realized gain or loss. The risk of loss associated with purchased options is limited to the premium paid.
Security Loans – State Street Bank and Trust Company (“State Street”), as lending agent, may loan the securities of the fund to certain qualified institutions (the “Borrowers”) approved by the fund. The loans are collateralized at all times by cash and/or U.S. Treasury and federal agency obligations in an amount at least equal to the market value of the securities loaned. State Street provides the fund with indemnification against Borrower
25
Notes to Financial Statements (unaudited) – continued
default. The fund bears the risk of loss with respect to the investment of cash collateral. On loans collateralized by cash, the cash collateral is invested in a money market fund or short-term securities. A portion of the income generated upon investment of the collateral is remitted to the Borrowers, and the remainder is allocated between the fund and the lending agent. On loans collateralized by U.S. Treasury and/or federal agency obligations, a fee is received from the Borrower, and is allocated between the fund and the lending agent. The dividend and interest income earned on the securities loaned is accounted for in the same manner as other dividend and interest income.
At February 29, 2008, the value of securities loaned was $20,100,161. These loans were collateralized by cash of $20,109,893 and U.S. Treasury obligations of $596,821.
Indemnifications – Under the fund’s organizational documents, its officers and trustees may be indemnified against certain liabilities and expenses arising out of the performance of their duties to the fund. Additionally, in the normal course of business, the fund enters into agreements with service providers that may contain indemnification clauses. The fund’s maximum exposure under these agreements is unknown as this would involve future claims that may be made against the fund that have not yet occurred.
Investment Transactions and Income – Investment transactions are recorded on the trade date. Interest income is recorded on the accrual basis. All premium and discount is amortized or accreted for financial statement purposes in accordance with U.S. generally accepted accounting principles. Dividends received in cash are recorded on the ex-dividend date. Certain dividends from foreign securities will be recorded when the fund is informed of the dividend if such information is obtained subsequent to the ex-dividend date. Dividend and interest payments received in additional securities are recorded on the ex-dividend or ex-interest date in an amount equal to the value of the security on such date.
The fund may receive proceeds from litigation settlements. Any proceeds received from litigation involving portfolio holdings are reflected in the Statement of Operations in realized gain/loss if the security has been disposed of by the fund or in unrealized gain/loss if the security is still held by the fund. Any other proceeds from litigation not related to portfolio holdings are reflected as other income in the Statement of Operations.
Fees Paid Indirectly – The fund’s custody fee may be reduced according to an arrangement that measures the value of cash deposited with the custodian by the fund. This amount, for the six months ended February 29, 2008, is shown as a reduction of total expenses on the Statement of Operations.
26
Notes to Financial Statements (unaudited) – continued
Tax Matters and Distributions – The fund intends to qualify as a regulated investment company, as defined under Subchapter M of the Internal Revenue Code, and to distribute all of its taxable income, including realized capital gains. As a result, no provision for federal income tax is required. The fund adopted the provisions of FASB Interpretation No. 48, Accounting for Uncertainty in Income Taxes (“the Interpretation”) on September 1, 2007. The Interpretation prescribes a minimum threshold for financial statement recognition of the benefit of a tax position taken or expected to be taken in a tax return. There was no impact resulting from the adoption of this Interpretation on the fund’s financial statements. Each of the fund’s federal tax returns for the prior three fiscal years remains subject to examination by the Internal Revenue Service. It is the fund’s policy to record interest and penalty charges on underpaid taxes associated with its tax positions as interest expense and miscellaneous expense, respectively. No such charges were recorded in the current financial statements. Foreign taxes, if any, have been accrued by the fund in the accompanying financial statements.
Distributions to shareholders are recorded on the ex-dividend date. Income and capital gain distributions are determined in accordance with income tax regulations, which may differ from U.S. generally accepted accounting principles. Certain capital accounts in the financial statements are periodically adjusted for permanent differences in order to reflect their tax character. These adjustments have no impact on net assets or net asset value per share. Temporary differences which arise from recognizing certain items of income, expense, gain or loss in different periods for financial statement and tax purposes will reverse at some time in the future. Distributions in excess of net investment income or net realized gains are temporary overdistributions for financial statement purposes resulting from differences in the recognition or classification of income or distributions for financial statement and tax purposes.
Book/tax differences primarily relate to net operating losses, wash sale loss deferrals, derivative transactions and foreign currency transactions.
The fund declared no distributions for the year ended August 31, 2007.
27
Notes to Financial Statements (unaudited) – continued
The federal tax cost and the tax basis components of distributable earnings were as follows:
| | | |
| As of 2/29/08 | | | |
| Cost of investments | | $153,520,026 | |
| Gross appreciation | | $3,539,901 | |
| Gross depreciation | | (19,806,395 | ) |
| Net unrealized appreciation (depreciation) | | $(16,266,494 | ) |
| |
| As of 8/31/07 | | | |
| Capital loss carryforwards | | $(290,006,147 | ) |
| Other temporary differences | | 237,950 | |
| Net unrealized appreciation (depreciation) | | (87,130 | ) |
The aggregate cost above includes prior fiscal year end tax adjustments.
As of August 31, 2007, the fund had capital loss carryforwards available to offset future realized gains. Such losses expire as follows:
| | | |
| 8/31/08 | | $(5,483,255 | ) |
| 8/31/09 | | (113,374,272 | ) |
| 8/31/10 | | (91,793,756 | ) |
| 8/31/11 | | (74,891,618 | ) |
| 8/31/12 | | (4,463,246 | ) |
| | $(290,006,147 | ) |
The availability of a portion of the capital loss carryforwards, which were acquired on August 22, 2003 in connection with the MFS Global Telecommunications Fund merger, may be limited in a given year.
Multiple Classes of Shares of Beneficial Interest – The fund offers multiple classes of shares, which differ in their respective distribution and service fees. All shareholders bear the common expenses of the fund based on daily net assets of each class, without distinction between share classes. Dividends are declared separately for each class. Differences in per share dividend rates are generally due to differences in separate class expenses. Class B shares will convert to Class A shares approximately eight years after purchase.
| (3) | | Transactions with Affiliates |
Investment Adviser – The fund has an investment advisory agreement with MFS to provide overall investment management and related administrative services and facilities to the fund. The management fee is computed daily and paid monthly at an annual rate of 0.75% of the fund’s average daily net assets.
The investment adviser has agreed in writing to reduce its management fee to 0.70% of average daily net assets in excess of $1 billion. This written agreement may be rescinded only upon consent of the fund’s Board of Trustees. For the six
28
Notes to Financial Statements (unaudited) – continued
months ended February 29, 2008, the fund’s average daily net assets did not exceed $1 billion and therefore, the management fee was not reduced.
The investment adviser has agreed in writing to pay a portion of the fund’s operating expenses, exclusive of management, distribution and service, retirement plan administration and services, and certain other fees and expenses, such that operating expenses do not exceed 0.40% annually of the fund’s average daily net assets. This written agreement will continue through December 31, 2008 unless changed or rescinded by the fund’s Board of Trustees. For the six months ended February 29, 2008, this reduction amounted to $101,711 and is reflected as a reduction of total expenses in the Statement of Operations.
Distributor – MFS Fund Distributors, Inc. (MFD), a wholly-owned subsidiary of MFS, as distributor, received $15,687 for the six months ended February 29, 2008, as its portion of the initial sales charge on sales of Class A shares of the fund.
The Board of Trustees has adopted a distribution plan for certain class shares pursuant to Rule 12b-1 of the Investment Company Act of 1940.
The fund’s distribution plan provides that the fund will pay MFD for services provided by MFD and financial intermediaries in connection with the distribution and servicing of certain share classes. One component of the plan is a distribution fee paid to MFD and another component of the plan is a service fee paid to MFD. MFD may subsequently pay all, or a portion, of the distribution and/or service fees to financial intermediaries.
Distribution Plan Fee Table:
| | | | | | | | | | |
| | | Distribution
Fee Rate | | Service
Fee Rate | | Total
Distribution
Plan (d) | | Annual
Effective
Rate (e) | | Distribution
and Service
Fee |
| Class A | | 0.10% | | 0.25% | | 0.35% | | 0.35% | | $102,667 |
| Class B | | 0.75% | | 0.25% | | 1.00% | | 1.00% | | 184,385 |
| Class C | | 0.75% | | 0.25% | | 1.00% | | 1.00% | | 88,909 |
| Class R | | 0.25% | | 0.25% | | 0.50% | | 0.50% | | 3,540 |
| Class R1 (c) | | 0.50% | | 0.25% | | 0.75% | | 0.75% | | 6,353 |
| Class R2 | | 0.25% | | 0.25% | | 0.50% | | 0.50% | | 4,108 |
| Class R3 | | 0.25% | | 0.25% | | 0.50% | | 0.50% | | 18,306 |
| Class R4 | | — | | 0.25% | | 0.25% | | 0.25% | | 2,332 |
| Total Distribution and Service Fees | | | | | | | | $410,600 |
| (c) | Effective March 1, 2008, the distribution fee rate for Class R1 shares will be 0.75% and the total distribution plan rate will be 1.00%. |
| (d) | In accordance with the distribution plan for certain classes, the fund pays distribution and/or service fees up to these annual percentage rates of each class’ average daily net assets. |
| (e) | The annual effective rates represent actual fees incurred under the distribution plan for the six months ended February 29, 2008 based on each class’ average daily net assets. |
29
Notes to Financial Statements (unaudited) – continued
Certain Class A and Class C shares are subject to a contingent deferred sales charge in the event of a shareholder redemption within 12 months of purchase. Class B shares are subject to a contingent deferred sales charge in the event of a shareholder redemption within six years of purchase. All contingent deferred sales charges are paid to MFD and during the six months ended February 29, 2008, were as follows:
| | |
| | | Amount |
| Class A | | $120 |
| Class B | | $10,581 |
| Class C | | $1,671 |
Shareholder Servicing Agent – MFS Service Center, Inc. (MFSC), a wholly-owned subsidiary of MFS, receives a fee from the fund for its services as shareholder servicing agent calculated as a percentage of the average daily net assets of the fund as determined periodically under the supervision of the fund’s Board of Trustees. For the six months ended February 29, 2008, the fee was $48,208, which equated to 0.0730% annually of the fund’s average daily net assets. MFSC also receives payment from the fund for out-of-pocket expenses, sub-accounting and other shareholder servicing costs which may be paid to affiliated and unaffiliated service providers. For the six months ended February 29, 2008, these out-of-pocket expenses, sub-accounting and other shareholder servicing costs amounted to $137,403. The fund may also pay shareholder servicing related costs directly to non-related parties.
Administrator – MFS provides certain financial, legal, shareholder communications, compliance, and other administrative services to the fund. Under an administrative services agreement, the fund partially reimburses MFS the costs incurred to provide these services. The fund is charged a fixed amount plus a fee based on average daily net assets. The fund’s annual fixed amount is $17,500.
The administrative services fee incurred for the six months ended February 29, 2008 was equivalent to an annual effective rate of 0.0220% of the fund’s average daily net assets.
In addition to the administrative services provided by MFS to the fund as described above, MFS is responsible for providing certain retirement plan administration and services with respect to certain shares. These services include various administrative, recordkeeping, and communication/educational services with respect to the retirement plans which invest in these shares, and may be provided directly by MFS or by a third party. MFS may subsequently pay all, or a portion, of the retirement plan administration and services fee to affiliated or unaffiliated third parties. For the six months ended February 29, 2008, the fund paid MFS an annual retirement plan administration and
30
Notes to Financial Statements (unaudited) – continued
services fee up to the following annual percentage rates of each class’ average daily net assets:
| | | | | | | | |
| | | Beginning
of period
through
12/31/07 | | Effective
1/1/08 | | Annual
Effective
Rate (g) | | Total
Amount |
Class R1 | | 0.35% | | 0.35% | | 0.35% | | $2,966 |
Class R2 | | 0.25% | | — | | 0.17% | | 1,358 |
Class R3 | | 0.15% | | — | | 0.10% | | 3,640 |
Class R4 | | 0.15% | | — | | 0.09% | | 882 |
Class R5 | | 0.10% | | — | | 0.07% | | 29 |
| Total Retirement Plan Administration and Services Fees | | $8,875 |
| (g) | Effective January 1, 2008, the annual retirement plan administration and services fee was eliminated for Class R2, Class R3, Class R4, and Class R5 shares. Effective March 1, 2008 the annual retirement plan administration and services fee will be eliminated for Class R1 shares. |
Trustees’ and Officers’ Compensation – The fund pays compensation to independent trustees in the form of a retainer, attendance fees, and additional compensation to Board and Committee chairpersons. The fund does not pay compensation directly to trustees or officers of the fund who are also officers of the investment adviser, all of whom receive remuneration for their services to the fund from MFS. Certain officers and trustees of the fund are officers or directors of MFS, MFD, and MFSC.
The fund has an unfunded, defined benefit plan for certain retired independent trustees which resulted in a pension expense of $264. The fund also has an unfunded retirement benefit deferral plan for certain independent trustees which resulted in a net decrease in expense of $1,630. Both amounts are included in independent trustees’ compensation for the six months ended February 29, 2008. The liability for deferred retirement benefits payable to certain independent trustees under both plans amounted to $56,852 at February 29, 2008, and is included in payable for independent trustees’ compensation.
Other – This fund and certain other MFS funds (the funds) have entered into a services agreement (the Agreement) which provides for payment of fees by the funds to Tarantino LLC in return for the provision of services of an Independent Chief Compliance Officer (ICCO) for the funds. The ICCO is an officer of the funds and the sole member of Tarantino LLC. The funds can terminate the Agreement with Tarantino LLC at any time under the terms of the Agreement. For the six months ended February 29, 2008, the fee paid by the fund to Tarantino LLC was $541 and is included in miscellaneous expense on the Statement of Operations. MFS has agreed to reimburse the fund for a portion of the payments made by the fund to Tarantino LLC in the amount of $293, which is shown as a reduction of total expenses in the Statement of
31
Notes to Financial Statements (unaudited) – continued
Operations. Additionally, MFS has agreed to bear all expenses associated with office space, other administrative support, and supplies provided to the ICCO.
Purchases and sales of investments, other than U.S. government securities, purchased option transactions, and short-term obligations, aggregated $152,780,644 and $149,815,959, respectively.
| (5) | | Shares of Beneficial Interest |
The fund’s Declaration of Trust permits the Trustees to issue an unlimited number of full and fractional shares of beneficial interest. Transactions in fund shares were as follows:
| | | | | | | | | | | | |
| | | Six months ended
2/29/08 | | | Year ended
8/31/07 | |
| | | Shares | | | Amount | | | Shares | | | Amount | |
| Shares sold | | | | | | | | | | | | |
Class A | | 1,756,061 | | | $24,706,420 | | | 3,442,780 | | | $41,496,726 | |
Class B | | 181,062 | | | 2,371,995 | | | 421,660 | | | 4,813,524 | |
Class C | | 317,778 | | | 4,209,258 | | | 437,671 | | | 5,063,349 | |
Class I | | 445,622 | | | 6,592,288 | | | 165,126 | | | 2,024,322 | |
Class R | | 52,363 | | | 721,624 | | | 110,132 | | | 1,325,272 | |
Class R1 | | 66,480 | | | 878,097 | | | 117,084 | | | 1,353,781 | |
Class R2 | | 68,316 | | | 883,586 | | | 102,083 | | | 1,194,966 | |
Class R3 | | 311,198 | | | 4,218,668 | | | 524,754 | | | 6,394,355 | |
Class R4 | | 67,432 | | | 909,562 | | | 154,810 | | | 1,893,456 | |
| | 3,266,312 | | | $45,491,498 | | | 5,476,100 | | | $65,559,751 | |
| Shares reacquired | | | | | | | | | | | | |
Class A | | (1,914,963 | ) | | $(26,481,002 | ) | | (3,477,640 | ) | | $(42,197,715 | ) |
Class B | | (555,980 | ) | | (7,314,406 | ) | | (1,406,387 | ) | | (16,189,416 | ) |
Class C | | (231,069 | ) | | (2,885,397 | ) | | (374,649 | ) | | (4,293,791 | ) |
Class I | | (394,039 | ) | | (5,826,202 | ) | | (196,959 | ) | | (2,409,326 | ) |
Class R | | (105,155 | ) | | (1,461,468 | ) | | (258,793 | ) | | (3,124,742 | ) |
Class R1 | | (5,731 | ) | | (72,852 | ) | | (41,812 | ) | | (475,041 | ) |
Class R2 | | (19,379 | ) | | (253,568 | ) | | (43,177 | ) | | (516,713 | ) |
Class R3 | | (114,621 | ) | | (1,458,277 | ) | | (202,048 | ) | | (2,403,309 | ) |
Class R4 | | (9,453 | ) | | (131,754 | ) | | (49,880 | ) | | (620,417 | ) |
| | (3,350,390 | ) | | $(45,884,926 | ) | | (6,051,345 | ) | | $(72,230,470 | ) |
32
Notes to Financial Statements (unaudited) – continued
| | | | | | | | | | | | |
| | | Six months ended
2/29/08 | | | Year ended
8/31/07 | |
| | | Shares | | | Amount | | | Shares | | | Amount | |
| Net change | | | | | | | | | | | | |
Class A | | (158,902 | ) | | $(1,774,582 | ) | | (34,860 | ) | | $(700,989 | ) |
Class B | | (374,918 | ) | | (4,942,411 | ) | | (984,727 | ) | | (11,375,892 | ) |
Class C | | 86,709 | | | 1,323,861 | | | 63,022 | | | 769,558 | |
Class I | | 51,583 | | | 766,086 | | | (31,833 | ) | | (385,004 | ) |
Class R | | (52,792 | ) | | (739,844 | ) | | (148,661 | ) | | (1,799,470 | ) |
Class R1 | | 60,749 | | | 805,245 | | | 75,272 | | | 878,740 | |
Class R2 | | 48,937 | | | 630,018 | | | 58,906 | | | 678,253 | |
Class R3 | | 196,577 | | | 2,760,391 | | | 322,706 | | | 3,991,046 | |
Class R4 | | 57,979 | | | 777,808 | | | 104,930 | | | 1,273,039 | |
| | (84,078 | ) | | $(393,428 | ) | | (575,245 | ) | | $(6,670,719 | ) |
The fund and other funds managed by MFS participate in a $1 billion unsecured committed line of credit provided by a syndication of banks under a credit agreement. In addition, the fund and other funds managed by MFS have established uncommitted borrowing arrangements with certain banks. Borrowings may be made for temporary financing needs. Interest is charged to each fund, based on its borrowings, generally at a rate equal to the Federal Reserve funds rate plus 0.30%. In addition, a commitment fee, based on the average daily, unused portion of the committed line of credit, is allocated among the participating funds at the end of each calendar quarter. For the six months ended February 29, 2008, the fund’s commitment fee and interest expense were $339 and $0, respectively, and are included in miscellaneous expense on the Statement of Operations.
On October 23, 2007 the Board of Trustees approved, on or about April 18, 2008, the conversion of Class R shares and Class R2 shares into Class R3 shares. After the conversion, Class R3, Class R4, and Class R5 will be renamed Class R2, Class R3, and Class R4, respectively.
33
RESULTS OF SHAREHOLDER MEETING
(unaudited)
At a special meeting of shareholders of MFS Technology Fund, which was held on February 15, 2008, the following actions were taken:
Item 1. To approve an amendment to the current Master Distribution Plan adopted pursuant to Rule 12b-1 under the Investment Company Act of 1940, as amended, with respect to Class R1 Shares of the fund.
| | |
| | | Number of Dollars |
| For | | 975,815.69 |
| Against | | 2,919.56 |
| Abstain | | 678,549.65 |
34
BOARD REVIEW OF INVESTMENT ADVISORY AGREEMENT
A discussion regarding the Board’s most recent review and renewal of the Fund’s investment advisory agreement is available by clicking on the fund’s name under “Select a fund” on the MFS Web site (mfs.com).
PROXY VOTING POLICIES AND INFORMATION
A general description of the MFS funds’ proxy voting policies and procedures is available without charge, upon request, by calling 1-800-225-2606, by visiting the Proxy Voting section of mfs.com or by visiting the SEC’s Web site at http://www.sec.gov.
Information regarding how the fund voted proxies relating to portfolio securities during the most recent twelve-month period ended June 30 is available without charge by visiting the Proxy Voting section of mfs.com or by visiting the SEC’s Web site at http://www.sec.gov.
QUARTERLY PORTFOLIO DISCLOSURE
The fund will file a complete schedule of portfolio holdings with the Securities and Exchange Commission (the Commission) for the first and third quarters of each fiscal year on Form N-Q. The fund’s Form N-Q may be reviewed and copied at the:
Public Reference Room
Securities and Exchange Commission
100 F Street, NE, Room 1580
Washington, D.C. 20549
Information on the operation of the Public Reference Room may be obtained by calling the Commission at 1-800-SEC-0330. The fund’s Form N-Q is available on the EDGAR database on the Commission’s Internet Web site at http://www.sec.gov, and copies of this information may be obtained, upon payment of a duplicating fee, by electronic request at the following e-mail address: publicinfo@sec.gov or by writing the Public Reference Section at the above address.
A shareholder can also obtain the quarterly portfolio holdings report at mfs.com.
35


MFS® Research International Fund
The report is prepared for the general information of shareholders. It is authorized for distribution to prospective investors only when preceded or accompanied by a current prospectus.
NOT FDIC INSURED Ÿ MAY LOSE VALUE Ÿ
NO BANK OR CREDIT UNION GUARANTEE Ÿ NOT A DEPOSIT Ÿ
NOT INSURED BY ANY FEDERAL GOVERNMENT AGENCY OR
NCUA/NCUSIF
2/29/08
RIF-SEM

LETTER FROM THE CEO
Dear Shareholders:
Many of our MFS® fund shareholders have been justifiably concerned, as have most investors around the world, about the state of the global economy. As we enter 2008 we see the market volatility that began in the third quarter of 2007 has intensified.
We here at MFS, and those before us who guided the firm with the same disciplined investment process, have weathered many major economic disruptions over our eight-plus decades of managing clients’ investments. We have managed money through the Great Depression, 14 recessions, as well as numerous market crises caused by wars, political upheavals, and terrorist attacks. MFS remains in business because our investors believe in the integrity of our long-term investment strategy and its proven results.
Worries over market volatility are valid, and investors cannot always expect to see the kind of returns stocks have delivered in the bull markets of past years. Yet we believe our strategy of ADR — allocating across the major asset classes, diversifying within each class, and regularly rebalancing your portfolio to maintain your desired allocation — can help you pursue the highest investment returns while minimizing the effects of market fluctuations.
MFS is a world leader in domestic and global investing. Our team approach is research driven, globally integrated, and balanced. We have 176 investment management professionals located in the Americas, Europe, and Asia who focus on the fundamentals of each security and then integrate our sophisticated quantitative approach.* This collaborative process allows us to find opportunities in any market environment.
I personally would like to thank you for your continued business. We want you to be confident that we are constantly managing our fund offerings with you in mind, while adding new products that can help you to choose what fits your unique financial goals.
Respectfully,

Robert J. Manning
Chief Executive Officer and Chief Investment Officer
MFS Investment Management®
April 15, 2008
* as of 12/31/07
The opinions expressed in this letter are subject to change, may not be relied upon for investment advice, and no forecasts can be guaranteed.
1
PORTFOLIO COMPOSITION
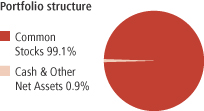
| | |
| Top ten holdings | | |
| E.ON AG | | 2.9% |
| Nestle S.A. | | 2.8% |
| BHP Billiton PLC | | 2.6% |
| Total S.A. | | 2.5% |
| Royal Dutch Shell PLC, “A” | | 2.1% |
| UniCredito Italiano S.p.A. | | 2.0% |
| Roche Holding AG | | 1.9% |
| Barclays PLC | | 1.9% |
| Telefonica S.A. | | 1.9% |
| WPP Group PLC | | 1.8% |
| | |
| Equity sectors | | |
| Financial Services | | 25.0% |
| Utilities & Communications | | 10.8% |
| Energy | | 9.5% |
| Basic Materials | | 8.6% |
| Health Care | | 7.2% |
| Consumer Staples | | 7.1% |
| Technology | | 6.0% |
| Industrial Goods & Services | | 5.7% |
| Autos & Housing | | 5.0% |
| Retailing | | 4.5% |
| Special Products & Services | | 4.0% |
| Leisure | | 3.0% |
| Transportation | | 2.7% |
| |
| Country weightings | | |
| Japan | | 15.5% |
| United Kingdom | | 15.4% |
| Germany | | 12.3% |
| France | | 10.6% |
| Switzerland | | 8.9% |
| Italy | | 4.2% |
| Netherlands | | 4.0% |
| Brazil | | 2.8% |
| Norway | | 2.7% |
| Other Countries | | 23.6% |
Percentages are based on net assets as of 2/29/08.
The portfolio is actively managed and current holdings may be different.
2
EXPENSE TABLE
Fund expenses borne by the shareholders during the period, September 1, 2007 through February 29, 2008
As a shareholder of the fund, you incur two types of costs: (1) transaction costs, including sales charges (loads) on certain purchase or redemption payments, and (2) ongoing costs, including management fees; distribution and service (12b-1) fees; and other fund expenses. This example is intended to help you understand your ongoing costs (in dollars) of investing in the fund and to compare these costs with the ongoing costs of investing in other mutual funds.
The example is based on an investment of $1,000 invested at the beginning of the period and held for the entire period September 1, 2007 through February 29, 2008.
Actual Expenses
The first line for each share class in the following table provides information about actual account values and actual expenses. You may use the information in this line, together with the amount you invested, to estimate the expenses that you paid over the period. Simply divide your account value by $1,000 (for example, an $8,600 account value divided by $1,000 = 8.6), then multiply the result by the number in the first line under the heading entitled “Expenses Paid During Period” to estimate the expenses you paid on your account during this period.
The actual expenses include the payment of a portion of the transfer-agent-related expenses of MFS funds that invest in the fund. For further information, please see the Notes to the Financial Statements.
Hypothetical Example for Comparison Purposes
The second line for each share class in the following table provides information about hypothetical account values and hypothetical expenses based on the fund’s actual expense ratio and an assumed rate of return of 5% per year before expenses, which is not the fund’s actual return. The hypothetical account values and expenses may not be used to estimate the actual ending account balance or expenses you paid for the period. You may use this information to compare the ongoing costs of investing in the fund and other funds. To do so, compare this 5% hypothetical example with the 5% hypothetical examples that appear in the shareholder reports of the other funds.
Please note that the expenses shown in the table are meant to highlight your ongoing costs only and do not reflect any transactional costs, such as sales charges (loads). Therefore, the second line for each share class in the table is useful in comparing ongoing costs only, and will not help you determine the relative total costs of owning different funds. In addition, if these transactional costs were included, your costs would have been higher.
3
Expense Table – continued
| | | | | | | | | | |
Share
Class | | | | Annualized
Expense Ratio | | Beginning
Account Value
9/01/07 | | Ending Account Value
2/29/08 | | Expenses Paid During
Period (p) 9/01/07-2/29/08 |
| A | | Actual | | 1.32% | | $1,000.00 | | $964.89 | | $6.45 |
| | Hypothetical (h) | | 1.32% | | $1,000.00 | | $1,018.30 | | $6.62 |
| B | | Actual | | 1.97% | | $1,000.00 | | $961.84 | | $9.61 |
| | Hypothetical (h) | | 1.97% | | $1,000.00 | | $1,015.07 | | $9.87 |
| C | | Actual | | 1.97% | | $1,000.00 | | $961.40 | | $9.61 |
| | Hypothetical (h) | | 1.97% | | $1,000.00 | | $1,015.07 | | $9.87 |
| I | | Actual | | 0.97% | | $1,000.00 | | $966.10 | | $4.74 |
| | Hypothetical (h) | | 0.97% | | $1,000.00 | | $1,020.04 | | $4.87 |
| W | | Actual | | 1.07% | | $1,000.00 | | $965.61 | | $5.23 |
| | Hypothetical (h) | | 1.07% | | $1,000.00 | | $1,019.54 | | $5.37 |
| R | | Actual | | 1.47% | | $1,000.00 | | $964.15 | | $7.18 |
| | Hypothetical (h) | | 1.47% | | $1,000.00 | | $1,017.55 | | $7.37 |
| R1 | | Actual | | 2.07% | | $1,000.00 | | $960.95 | | $10.09 |
| | Hypothetical (h) | | 2.07% | | $1,000.00 | | $1,014.57 | | $10.37 |
| R2 | | Actual | | 1.62% | | $1,000.00 | | $963.17 | | $7.91 |
| | Hypothetical (h) | | 1.62% | | $1,000.00 | | $1,016.81 | | $8.12 |
| R3 | | Actual | | 1.57% | | $1,000.00 | | $963.54 | | $7.66 |
| | Hypothetical (h) | | 1.57% | | $1,000.00 | | $1,017.06 | | $7.87 |
| R4 | | Actual | | 1.32% | | $1,000.00 | | $964.65 | | $6.45 |
| | Hypothetical (h) | | 1.32% | | $1,000.00 | | $1,018.30 | | $6.62 |
| R5 | | Actual | | 1.03% | | $1,000.00 | | $965.81 | | $5.03 |
| | Hypothetical (h) | | 1.03% | | $1,000.00 | | $1,019.74 | | $5.17 |
| 529A | | Actual | | 1.57% | | $1,000.00 | | $963.78 | | $7.67 |
| | Hypothetical (h) | | 1.57% | | $1,000.00 | | $1,017.06 | | $7.87 |
| 529B | | Actual | | 2.22% | | $1,000.00 | | $960.19 | | $10.82 |
| | Hypothetical (h) | | 2.22% | | $1,000.00 | | $1,013.82 | | $11.12 |
| 529C | | Actual | | 2.22% | | $1,000.00 | | $960.64 | | $10.82 |
| | Hypothetical (h) | | 2.22% | | $1,000.00 | | $1,013.82 | | $11.12 |
| (h) | 5% class return per year before expenses. |
| (p) | Expenses paid is equal to each class’ annualized expense ratio, as shown above, multiplied by the average account value over the period, multiplied by the number of days in the period, divided by the number of days in the year. Expenses paid do not include any applicable sales charges (loads). If these transaction costs had been included, your costs would have been higher. |
4
Expense Table – continued
Effective January 1, 2008 the fund’s Class R2, Class R3, Class R4, and Class R5 retirement plan administration and service fee were terminated (as described in Note 3 of the Notes to the Financial Statements). Had this fee change been in effect throughout the entire six month period, the annualized expense ratios would have been 1.45%, 1.47%, 1.22% and 0.96% for Class R2, Class R3, Class R4 and Class R5 shares respectively. Actual expenses paid during the period would have been approximately $7.10, $7.20, $5.98, and $4.71 and the hypothetical expenses paid during the period would have been approximately $7.29, $7.39, $6.14 and $4.84 for Class R2, Class R3, Class R4 and Class R5 shares, respectively.
Effective March 1, 2008 the fund’s Class R1 retirement plan administration and service fee were terminated and the Class R1 distribution fee was increased (as described in Note 3 of the Notes to the Financial Statements). Had these fee changes been in effect throughout the entire six month period, the annualized expense ratio would have been 1.97%. The actual expenses paid during the period would have been approximately $9.64 and the hypothetical expenses paid during the period would have been approximately $9.90.
Effective April 1, 2008 the fund’s Class 529A, 529B, and 529C shares program manager fee was reduced (as described in Note 3 of the Notes to Financial Statements). Had this fee change been in effect throughout the entire six month period, the annualized expense ratio would have been 1.42%, 2.07% and 2.07% for Class 529A, 529B and 529C shares, respectively. The actual expenses paid during the period would have been approximately $6.96, $10.12 and $10.13 and the hypothetical expenses paid during the period would have been approximately $7.14, $10.40 and $10.40 for Class 529A, Class 529B and Class 529C shares, respectively.
5
PORTFOLIO OF INVESTMENTS
2/29/08 (unaudited)
The Portfolio of Investments is a complete list of all securities owned by your fund. It is categorized by broad-based asset classes.
| | | | | |
| Common Stocks - 99.1% | | | | | |
| Issuer | | Shares/Par | | Value ($) |
| | | | | |
| Aerospace - 0.7% | | | | | |
| Finmeccanica S.p.A. (l) | | 1,082,110 | | $ | 33,279,238 |
| | |
| Alcoholic Beverages - 1.8% | | | | | |
| Diageo PLC | | 1,562,130 | | $ | 31,917,197 |
| Heineken N.V. | | 954,230 | | | 53,841,826 |
| | | | | |
| | | | | $ | 85,759,023 |
| Apparel Manufacturers - 3.7% | | | | | |
| Adidas AG (l) | | 1,320,920 | | $ | 82,929,615 |
| Billabong International Ltd. (l) | | 1,366,846 | | | 15,879,967 |
| LVMH Moet Hennessy Louis Vuitton S.A. (l) | | 695,100 | | | 71,576,600 |
| | | | | |
| | | | | $ | 170,386,182 |
| Automotive - 3.3% | | | | | |
| Bayerische Motoren Werke AG (l) | | 764,600 | | $ | 41,883,855 |
| Bridgestone Corp. | | 2,322,500 | | | 38,011,805 |
| Compagnie Generale des Etablissements Michelin (l) | | 370,940 | | | 36,561,280 |
| Yamaha Motor Co. Ltd. | | 1,906,100 | | | 37,836,428 |
| | | | | |
| | | | | $ | 154,293,368 |
| Biotechnology - 0.5% | | | | | |
| Actelion Ltd. (a)(l) | | 427,747 | | $ | 22,316,857 |
| | |
| Broadcasting - 3.0% | | | | | |
| Antena 3 de Television S.A. (l) | | 1,169,445 | | $ | 16,116,336 |
| Grupo Televisa S.A., ADR | | 1,645,130 | | | 36,192,860 |
| WPP Group PLC | | 7,294,190 | | | 85,742,771 |
| | | | | |
| | | | | $ | 138,051,967 |
| Brokerage & Asset Managers - 1.2% | | | | | |
| Nomura Holdings, Inc. | | 3,543,600 | | $ | 55,466,952 |
| | |
| Business Services - 2.6% | | | | | |
| Bunzl PLC | | 1,684,850 | | $ | 23,154,420 |
| Intertek Group PLC | | 1,085,300 | | | 19,224,346 |
| JFE Shoji Holdings, Inc. | | 1,542,000 | | | 9,991,362 |
| Mitsubishi Corp. | | 1,022,700 | | | 31,148,149 |
6
Portfolio of Investments (unaudited) – continued
| | | | | |
| Issuer | | Shares/Par | | Value ($) |
| | | | | |
| Common Stocks - continued | | | | | |
| Business Services - continued | | | | | |
| Mitsui & Co. Ltd. | | 1,126,000 | | $ | 24,401,452 |
| Satyam Computer Services Ltd. | | 1,189,510 | | | 12,703,969 |
| | | | | |
| | | | | $ | 120,623,698 |
| Chemicals - 0.3% | | | | | |
| Makhteshim-Agan Industries Ltd. (a) | | 1,706,940 | | $ | 14,270,989 |
| | |
| Computer Software - 1.2% | | | | | |
| SAP AG (l) | | 787,150 | | $ | 37,507,051 |
| Trend Micro, Inc. | | 582,000 | | | 19,969,585 |
| | | | | |
| | | | | $ | 57,476,636 |
| Computer Software - Systems - 0.2% | | | | | |
| HCL Technologies Ltd. | | 1,382,090 | | $ | 9,387,241 |
| | |
| Conglomerates - 1.4% | | | | | |
| Siemens AG | | 525,520 | | $ | 67,125,684 |
| | |
| Construction - 1.7% | | | | | |
| CRH PLC | | 838,700 | | $ | 31,211,461 |
| Geberit AG (l) | | 326,978 | | | 48,012,245 |
| | | | | |
| | | | | $ | 79,223,706 |
| Consumer Goods & Services - 2.3% | | | | | |
| Kao Corp. | | 1,548,000 | | $ | 47,699,456 |
| Kimberly-Clark de Mexico S.A. de C.V., “A” | | 5,211,050 | | | 21,521,824 |
| Reckitt Benckiser Group PLC | | 733,670 | | | 39,718,422 |
| | | | | |
| | | | | $ | 108,939,702 |
| Electrical Equipment - 2.1% | | | | | |
| LS Industrial Systems Co. Ltd. | | 309,321 | | $ | 18,068,607 |
| OMRON Corp. | | 1,644,100 | | | 36,576,171 |
| Schneider Electric S.A. (l) | | 365,070 | | | 41,547,277 |
| | | | | |
| | | | | $ | 96,192,055 |
| Electronics - 4.4% | | | | | |
| ARM Holdings PLC | | 1,850,205 | | $ | 3,300,571 |
| Funai Electric Co. Ltd. (l) | | 191,600 | | | 5,391,643 |
| Hoya Corp. (l) | | 475,600 | | | 12,083,527 |
| Konica Minolta Holdings, Inc. | | 1,666,000 | | | 23,627,559 |
| Nippon Electric Glass Co. Ltd. | | 886,000 | | | 12,830,597 |
| Ricoh Co. Ltd. | | 2,771,000 | | | 44,489,142 |
| Royal Philips Electronics N.V. | | 897,760 | | | 35,109,636 |
7
Portfolio of Investments (unaudited) – continued
| | | | | |
| Issuer | | Shares/Par | | Value ($) |
| | | | | |
| Common Stocks - continued | | | | | |
| Electronics - continued | | | | | |
| Samsung Electronics Co. Ltd. | | 44,320 | | $ | 26,018,652 |
| Taiwan Semiconductor Manufacturing Co. Ltd. | | 10,333,000 | | | 20,201,185 |
| Venture Corp. Ltd. | | 2,980,000 | | | 21,440,132 |
| | | | | |
| | | | | $ | 204,492,644 |
| Energy - Independent - 1.4% | | | | | |
| INPEX Holdings, Inc. | | 2,813 | | $ | 31,413,349 |
| OMV AG | | 163,280 | | | 11,798,177 |
| PTT Public Co. Ltd. | | 2,186,000 | | | 23,752,566 |
| | | | | |
| | | | | $ | 66,964,092 |
| Energy - Integrated - 7.6% | | | | | |
| OAO Gazprom, ADR | | 737,660 | | $ | 37,279,954 |
| Petroleo Brasileiro S.A., ADR | | 301,900 | | | 35,424,946 |
| Royal Dutch Shell PLC, “A” | | 2,691,490 | | | 96,418,409 |
| Statoil A.S.A. | | 2,280,520 | | | 69,799,384 |
| TOTAL S.A. (l) | | 1,516,230 | | | 114,572,005 |
| | | | | |
| | | | | $ | 353,494,698 |
| Food & Beverages - 3.0% | | | | | |
| Nestle S.A. | | 271,942 | | $ | 129,797,888 |
| Nong Shim Co. Ltd. | | 43,442 | | | 8,847,169 |
| | | | | |
| | | | | $ | 138,645,057 |
| Insurance - 2.5% | | | | | |
| AXA (l) | | 2,373,800 | | $ | 80,096,865 |
| Old Mutual PLC | | 15,245,190 | | | 37,634,221 |
| | | | | |
| | | | | $ | 117,731,086 |
| Internet - 0.2% | | | | | |
| Universo Online S.A., IPS (a) | | 1,657,100 | | $ | 8,330,830 |
| | |
| Machinery & Tools - 2.9% | | | | | |
| Bucyrus International, Inc., “A” (l) | | 658,373 | | $ | 65,758,295 |
| Glory LTD. | | 1,029,600 | | | 23,300,429 |
| Komatsu Ltd. (l) | | 1,855,400 | | | 47,112,962 |
| | | | | |
| | | | | $ | 136,171,686 |
| Major Banks - 14.5% | | | | | |
| Australia & New Zealand Banking Group Ltd. | | 2,240,730 | | $ | 45,198,590 |
| Bank of Communications Ltd. | | 28,193,000 | | | 33,426,464 |
| Barclays PLC | | 9,270,720 | | | 87,175,067 |
| BNP Paribas | | 732,763 | | | 65,869,911 |
8
Portfolio of Investments (unaudited) – continued
| | | | | |
| Issuer | | Shares/Par | | Value ($) |
| | | | | |
| Common Stocks - continued | | | | | |
| Major Banks - continued | | | | | |
| BOC Hong Kong Holdings Ltd. | | 18,594,000 | | $ | 44,807,491 |
| Credit Agricole S.A. (l) | | 1,092,624 | | | 29,730,009 |
| DBS Group Holdings Ltd. | | 3,766,000 | | | 45,855,603 |
| Deutsche Postbank AG (l) | | 202,720 | | | 19,536,292 |
| Erste Bank der Oesterreichischen Sparkassen AG (l) | | 791,188 | | | 45,734,214 |
| Royal Bank of Scotland Group PLC | | 4,314,810 | | | 32,540,524 |
| Standard Bank Group Ltd. | | 1,482,734 | | | 18,653,220 |
| Standard Chartered PLC | | 1,090,852 | | | 35,881,283 |
| Sumitomo Mitsui Financial Group, Inc. | | 5,796 | | | 41,668,589 |
| Unibanco - Uniao de Bancos Brasileiros S.A., ADR | | 263,560 | | | 35,744,007 |
| UniCredito Italiano S.p.A. (l) | | 12,632,720 | | | 92,711,231 |
| | | | | |
| | | | | $ | 674,532,495 |
| Metals & Mining - 4.6% | | | | | |
| BHP Billiton PLC | | 3,683,270 | | $ | 118,808,364 |
| Companhia Vale do Rio Doce | | 1,303,300 | | | 45,217,553 |
| Steel Authority of India Ltd. | | 8,173,417 | | | 50,982,989 |
| | | | | |
| | | | | $ | 215,008,906 |
| Natural Gas - Distribution - 1.0% | | | | | |
| Gaz de France (l) | | 435,881 | | $ | 25,026,336 |
| Tokyo Gas Co. Ltd. (l) | | 4,240,390 | | | 19,014,015 |
| | | | | |
| | | | | $ | 44,040,351 |
| Oil Services - 0.5% | | | | | |
| Saipem S.p.A. (l) | | 607,590 | | $ | 24,771,765 |
| | |
| Other Banks & Diversified Financials - 5.8% | | | | | |
| Aeon Credit Service Co. Ltd. | | 1,576,500 | | $ | 22,878,612 |
| Anglo Irish Bank Corp. PLC | | 3,621,553 | | | 51,232,188 |
| Bank of Cyprus Public Co. Ltd. | | 2,563,337 | | | 30,886,057 |
| CSU Cardsystem S.A. (a) | | 1,513,220 | | | 4,492,896 |
| Fortis S.A./N.V. | | 1,556,300 | | | 34,308,998 |
| Fortis S.A./N.V. (a) | | 1,067,260 | | | 16,214 |
| Macquarie Group Ltd. (l) | | 683,870 | | | 33,290,922 |
| UBS AG | | 1,388,046 | | | 45,388,501 |
| Unione di Banche Italiane ScpA | | 1,970,207 | | | 46,285,373 |
| | | | | |
| | | | | $ | 268,779,761 |
| Pharmaceuticals - 6.7% | | | | | |
| Astellas Pharma, Inc. | | 759,800 | | $ | 33,302,584 |
| Bayer AG (l) | | 649,480 | | | 49,488,387 |
| Merck KGaA | | 503,030 | | | 62,496,832 |
| Novartis AG (l) | | 1,626,410 | | | 79,829,595 |
9
Portfolio of Investments (unaudited) – continued
| | | | | |
| Issuer | | Shares/Par | | Value ($) |
| | | | | |
| Common Stocks - continued | | | | | |
| Pharmaceuticals - continued | | | | | |
| Roche Holding AG (l) | | 450,690 | | $ | 88,392,941 |
| | | | | |
| | | | | $ | 313,510,339 |
| Precious Metals & Minerals - 0.5% | | | | | |
| Paladin Resources Ltd. (a)(l) | | 4,346,574 | | $ | 24,202,116 |
| | |
| Railroad & Shipping - 1.1% | | | | | |
| East Japan Railway Co. | | 6,307 | | $ | 50,567,058 |
| | |
| Real Estate - 1.0% | | | | | |
| CapitaLand Ltd. | | 10,767,000 | | $ | 47,453,287 |
| | |
| Specialty Chemicals - 3.2% | | | | | |
| Akzo Nobel N.V. | | 990,820 | | $ | 72,606,319 |
| Linde AG (l) | | 577,980 | | | 76,673,117 |
| | | | | |
| | | | | $ | 149,279,436 |
| Specialty Stores - 0.8% | | | | | |
| Kingfisher PLC | | 8,341,310 | | $ | 21,487,951 |
| NEXT PLC | | 571,350 | | | 14,489,530 |
| | | | | |
| | | | | $ | 35,977,481 |
| Telecommunications - Wireless - 3.2% | | | | | |
| America Movil S.A.B. de C.V., “L”, ADR | | 644,740 | | $ | 38,980,980 |
| MTN Group Ltd. | | 857,970 | | | 13,498,640 |
| Rogers Communications, Inc., “B” | | 701,910 | | | 27,739,386 |
| Vodafone Group PLC | | 20,745,510 | | | 66,619,391 |
| | | | | |
| | | | | $ | 146,838,397 |
| Telephone Services - 3.1% | | | | | |
| Telefonica S.A. | | 2,981,810 | | $ | 86,374,163 |
| Telenor A.S.A. | | 2,699,470 | | | 55,337,791 |
| | | | | |
| | | | | $ | 141,711,954 |
| Trucking - 1.6% | | | | | |
| TNT N.V. | | 571,830 | | $ | 22,531,306 |
| Yamato Holdings Co. Ltd. (l) | | 3,443,000 | | | 50,357,175 |
| | | | | |
| | | | | $ | 72,888,481 |
| Utilities - Electric Power - 3.5% | | | | | |
| E.ON AG (l) | | 709,400 | | $ | 133,394,072 |
| SUEZ S.A. | | 463,878 | | | 29,479,679 |
| | | | | |
| | | | | $ | 162,873,751 |
| Total Common Stocks (Identified Cost, $4,358,160,813) | | | | $ | 4,611,058,969 |
10
Portfolio of Investments (unaudited) – continued
| | | | | | |
| Short-Term Obligations - 0.5% | | | | | | |
| Issuer | | Shares/Par | | Value ($) |
| | | | | | |
Deutsche Bank Financial LLC, 3.1%, due 3/03/08,
at Amortized Cost and Value (y) | | $ | 22,286,000 | | $ | 22,282,162 |
| | |
| Collateral for Securities Loaned - 9.3% | | | | | | |
Navigator Securities Lending Prime Portfolio,
at Cost and Net Asset Value | | | 433,247,888 | | $ | 433,247,888 |
| Total Investments (Identified Cost, $4,813,690,863) (k) | | | | | $ | 5,066,589,019 |
| | |
| Other Assets, Less Liabilities - (8.9)% | | | | | | (416,086,068) |
| Net Assets - 100.0% | | | | | $ | 4,650,502,951 |
| (a) | Non-income producing security. |
| (k) | As of February 29, 2008, the fund had 99 securities that were fair valued, aggregating $4,230,606,658 and 83.50% of market value, in accordance with the policies adopted by the Board of Trustees. |
| (l) | All or a portion of this security is on loan. |
| (y) | The rate shown represents an annualized yield at time of purchase. |
The following abbreviations are used in this report and are defined:
| ADR | | American Depository Receipt |
| IPS | | International Preference Stock |
See Notes to Financial Statements
11
Financial Statements
STATEMENT OF ASSETS AND LIABILITIES
At 2/29/08 (unaudited)
This statement represents your fund’s balance sheet, which details the assets and liabilities comprising the total value of the fund.
| | | | | |
| Assets | | | | | |
| Investments, at value including $425,172,944 of securities on loan (identified cost, $4,813,690,863) | | $5,066,589,019 | | | |
| Cash | | 754,374 | | | |
| Foreign currency, at value (identified cost, $19,147,214) | | 20,153,419 | | | |
| Receivable for investments sold | | 39,788,215 | | | |
| Receivable for fund shares sold | | 12,082,045 | | | |
| Interest and dividends receivable | | 9,219,793 | | | |
| Other assets | | 60,230 | | | |
| Total assets | | | | | $5,148,647,095 |
| Liabilities | | | | | |
| Payable for investments purchased | | $49,368,778 | | | |
| Payable for fund shares reacquired | | 10,907,285 | | | |
| Collateral for securities loaned, at value (c) | | 433,247,888 | | | |
| Payable to affiliates | | | | | |
Management fee | | 199,890 | | | |
Shareholder servicing costs | | 756,149 | | | |
Distribution and service fees | | 57,993 | | | |
Administrative services fee | | 3,235 | | | |
Program manager fees | | 52 | | | |
Retirement plan administration and services fees | | 169 | | | |
| Payable for independent trustees’ compensation | | 42,872 | | | |
| Accrued expenses and other liabilities | | 3,559,833 | | | |
| Total liabilities | | | | | $498,144,144 |
| Net assets | | | | | $4,650,502,951 |
| Net assets consist of | | | | | |
| Paid-in capital | | $4,337,977,339 | | | |
| Unrealized appreciation (depreciation) on investments and translation of assets and liabilities in foreign currencies (net of $2,451,084 deferred country tax) | | 251,697,697 | | | |
| Accumulated net realized gain (loss) on investments and foreign currency transactions | | 70,877,373 | | | |
| Accumulated distributions in excess of net investment income | | (10,049,458 | ) | | |
| Net assets | | | | | $4,650,502,951 |
| Shares of beneficial interest outstanding | | | | | 259,091,596 |
12
Statement of Assets and Liabilities (unaudited) – continued
| | | | |
| Class A shares | | | | |
Net assets | | $1,743,161,546 | | |
Shares outstanding | | 98,003,698 | | |
Net asset value per share | | | | $17.79 |
Offering price per share (100 / 94.25 × net asset value per share) | | | | $18.88 |
| Class B shares | | | | |
Net assets | | $144,415,855 | | |
Shares outstanding | | 8,517,024 | | |
Net asset value and offering price per share | | | | $16.96 |
| Class C shares | | | | |
Net assets | | $191,081,541 | | |
Shares outstanding | | 11,351,581 | | |
Net asset value and offering price per share | | | | $16.83 |
| Class I shares | | | | |
Net assets | | $2,205,319,820 | | |
Shares outstanding | | 120,435,833 | | |
Net asset value, offering price, and redemption price per share | | | | $18.31 |
| Class W shares | | | | |
Net assets | | $11,550,738 | | |
Shares outstanding | | 650,401 | | |
Net asset value, offering price, and redemption price per share | | | | $17.76 |
| Class R shares | | | | |
Net assets | | $53,509,366 | | |
Shares outstanding | | 3,029,078 | | |
Net asset value, offering price, and redemption price per share | | | | $17.67 |
| Class R1 shares | | | | |
Net assets | | $8,418,599 | | |
Shares outstanding | | 506,203 | | |
Net asset value, offering price, and redemption price per share | | | | $16.63 |
| Class R2 shares | | | | |
Net assets | | $11,481,986 | | |
Shares outstanding | | 686,242 | | |
Net asset value, offering price, and redemption price per share | | | | $16.73 |
| Class R3 shares | | | | |
Net assets | | $44,835,121 | | |
Shares outstanding | | 2,580,410 | | |
Net asset value, offering price, and redemption price per share | | | | $17.38 |
13
Statement of Assets and Liabilities (unaudited) – continued
| | | | |
| Class R4 shares | | | | |
Net assets | | $67,894,674 | | |
Shares outstanding | | 3,838,912 | | |
Net asset value, offering price, and redemption price per share | | | | $17.69 |
| Class R5 shares | | | | |
Net assets | | $165,154,675 | | |
Shares outstanding | | 9,277,972 | | |
Net asset value, offering price, and redemption price per share | | | | $17.80 |
| Class 529A shares | | | | |
Net assets | | $2,083,453 | | |
Shares outstanding | | 118,406 | | |
Net asset value per share | | | | $17.60 |
Offering price per share (100 / 94.25 × net asset value per share) | | | | $18.67 |
| Class 529B shares | | | | |
Net assets | | $707,106 | | |
Shares outstanding | | 42,492 | | |
Net asset value and offering price per share | | | | $16.64 |
| Class 529C shares | | | | |
Net assets | | $888,471 | | |
Shares outstanding | | 53,344 | | |
Net asset value and offering price per share | | | | $16.66 |
On sales of $50,000 or more, the offering prices of Class A and Class 529A shares are reduced. A contingent deferred sales charge may be imposed on redemptions of Class A, Class B, Class C, Class 529B, and Class 529C shares.
| (c) | Non-cash collateral is not included. |
See Notes to Financial Statements
14
Financial Statements
STATEMENT OF OPERATIONS
Six months ended 2/29/08 (unaudited)
This statement describes how much your fund earned in investment income and accrued in expenses.
It also describes any gains and/or losses generated by fund operations.
| | | | | | |
| Net investment income | | | | | | |
| Income | | | | | | |
Dividends | | $33,098,512 | | | | |
Income on securities loaned | | 1,877,543 | | | | |
Interest | | 570,659 | | | | |
Foreign taxes withheld | | (2,299,087 | ) | | | |
| Total investment income | | | | | $33,247,627 | |
| Expenses | | | | | | |
Management fee | | $18,594,370 | | | | |
Distribution and service fees | | 5,535,124 | | | | |
Program manager fees | | 4,641 | | | | |
Shareholder servicing costs | | 3,002,247 | | | | |
Administrative services fee | | 273,989 | | | | |
Retirement plan administration and services fees | | 141,264 | | | | |
Independent trustees’ compensation | | 29,428 | | | | |
Custodian fee | | 1,246,373 | | | | |
Shareholder communications | | 113,013 | | | | |
Auditing fees | | 25,298 | | | | |
Legal fees | | 36,314 | | | | |
Miscellaneous | | 269,449 | | | | |
| Total expenses | | | | | $29,271,510 | |
Reduction of expenses by investment adviser | | (10,844 | ) | | | |
| Net expenses | | | | | $29,260,666 | |
| Net investment income | | | | | $3,986,961 | |
| Realized and unrealized gain (loss) on investments | | | | | | |
| Realized gain (loss) (identified cost basis) | | | | | | |
Investment transactions (net of $5,127,081 country tax) | | $144,176,782 | | | | |
Foreign currency transactions | | (649,837 | ) | | | |
Net realized gain (loss) on investments
and foreign currency transactions | | | | | $143,526,945 | |
| Change in unrealized appreciation (depreciation) | | | | | | |
Investments (net of $142,879 decrease in deferred country tax) | | $(312,878,752 | ) | | | |
Translation of assets and liabilities in foreign currencies | | 1,534,701 | | | | |
Net unrealized gain (loss) on investments
and foreign currency translation | | | | | $(311,344,051 | ) |
Net realized and unrealized gain (loss) on investments
and foreign currency | | | | | $(167,817,106 | ) |
| Change in net assets from operations | | | | | $(163,830,145 | ) |
See Notes to Financial Statements
15
Financial Statements
STATEMENTS OF CHANGES IN NET ASSETS
These statements describe the increases and/or decreases in net assets resulting from operations, any distributions, and any shareholder transactions.
| | | | | | |
| Change in net assets | | Six months ended
2/29/08
(unaudited) | | | Year ended
8/31/07 | |
| From operations | | | | | | |
| Net investment income | | $3,986,961 | | | $59,454,793 | |
| Net realized gain (loss) on investments and foreign currency transactions | | 143,526,945 | | | 519,267,288 | |
| Net unrealized gain (loss) on investments and foreign currency translation | | (311,344,051 | ) | | 91,823,518 | |
| Change in net assets from operations | | $(163,830,145 | ) | | $670,545,599 | |
| Distributions declared to shareholders | | | | | | |
| From net investment income | | | | | | |
Class A | | $(24,604,311 | ) | | $(16,967,603 | ) |
Class B | | (1,030,603 | ) | | (1,072,793 | ) |
Class C | | (1,739,242 | ) | | (1,096,339 | ) |
Class I | | (37,355,589 | ) | | (24,753,020 | ) |
Class W | | (216,508 | ) | | (24,752 | ) |
Class R | | (604,448 | ) | | (787,598 | ) |
Class R1 | | (96,196 | ) | | (19,857 | ) |
Class R2 | | (122,398 | ) | | (14,104 | ) |
Class R3 | | (573,074 | ) | | (173,134 | ) |
Class R4 | | (977,680 | ) | | (225,637 | ) |
Class R5 | | (2,945,015 | ) | | (2,054,416 | ) |
Class 529A | | (24,040 | ) | | (17,590 | ) |
Class 529B | | (3,843 | ) | | (2,810 | ) |
Class 529C | | (5,236 | ) | | (3,613 | ) |
| From net realized gain on investments | | | | | | |
Class A | | (174,293,391 | ) | | (141,613,840 | ) |
Class B | | (16,827,896 | ) | | (19,000,322 | ) |
Class C | | (21,468,759 | ) | | (17,352,910 | ) |
Class I | | (210,826,466 | ) | | (163,196,758 | ) |
Class W | | (1,264,835 | ) | | (166,668 | ) |
Class R | | (5,573,100 | ) | | (7,397,422 | ) |
Class R1 | | (852,985 | ) | | (244,118 | ) |
Class R2 | | (882,123 | ) | | (125,262 | ) |
Class R3 | | (4,444,628 | ) | | (1,606,783 | ) |
Class R4 | | (6,702,136 | ) | | (1,723,640 | ) |
Class R5 | | (17,627,647 | ) | | (14,271,300 | ) |
Class 529A | | (205,867 | ) | | (171,280 | ) |
Class 529B | | (62,050 | ) | | (44,384 | ) |
Class 529C | | (95,300 | ) | | (75,790 | ) |
| Total distributions declared to shareholders | | $(531,425,366 | ) | | $(414,203,743 | ) |
16
Statements of Changes in Net Assets – continued
| | | | | |
| | | Six months ended
2/29/08
(unaudited) | | | Year ended
8/31/07 |
| Change in net assets from fund share transactions | | $563,278,690 | | | $1,060,147,793 |
| Total change in net assets | | $(131,976,821 | ) | | $1,316,489,649 |
| Net assets | | | | | |
| At beginning of period | | 4,782,479,772 | | | 3,465,990,123 |
| At end of period (including accumulated distributions in excess of net investment income of $10,049,458 and undistributed net investment income of $56,261,764) | | $4,650,502,951 | | | $4,782,479,772 |
See Notes to Financial Statements
17
Financial Statements
FINANCIAL HIGHLIGHTS
The financial highlights table is intended to help you understand the fund’s financial performance for the semiannual period and the past 5 fiscal years (or life of a particular share class, if shorter). Certain information reflects financial results for a single fund share. The total returns in the table represent the rate by which an investor would have earned (or lost) on an investment in the fund share class (assuming reinvestment of all distributions) held for the entire period.
| | | | | | | | | | | | | | | | | |
| | | Six months
ended
2/29/08 (unaudited) | | | Years ended 8/31 |
| Class A | | | 2007 | | | 2006 | | | 2005 | | | 2004 | | | 2003 |
| | | | | | | | | | | | | | | | |
Net asset value, beginning
of period | | $20.56 | | | $19.44 | | | $16.65 | | | $14.25 | | | $11.53 | | | $10.78 |
Income (loss) from
investment operations | | | | | | | | | | | | | | | | | |
Net investment income (d) | | $ 0.00 | (w) | | $0.26 | | | $0.19 | | | $0.12 | | | $0.10 | | | $0.04 |
Net realized and unrealized
gain (loss) on investments and
foreign currency | | (0.50 | ) | | 3.03 | | | 4.08 | | | 3.04 | | | 2.63 | | | 0.71 |
| Total from investment operations | | $(0.50 | ) | | $3.29 | | | $4.27 | | | $3.16 | | | $2.73 | | | $0.75 |
Less distributions declared
to shareholders | | | | | | | | | | | | | | | | | |
From net investment income | | $(0.28 | ) | | $(0.23 | ) | | $(0.12 | ) | | $(0.08 | ) | | $(0.01 | ) | | $— |
From net realized gain
on investments | | (1.99 | ) | | (1.94 | ) | | (1.36 | ) | | (0.68 | ) | | — | | | — |
Total distributions declared
to shareholders | | $(2.27 | ) | | $(2.17 | ) | | $(1.48 | ) | | $(0.76 | ) | | $(0.01 | ) | | $— |
| Net asset value, end of period | | $17.79 | | | $20.56 | | | $19.44 | | | $16.65 | | | $14.25 | | | $11.53 |
| Total return (%) (r)(s)(t) | | (3.51 | )(n) | | 17.82 | | | 27.18 | | | 22.67 | | | 23.65 | | | 6.96 |
Ratios (%) (to average net
assets) and Supplemental data: | | | | | | | | | | | | | | | | | |
Expenses before
expense reductions (f) | | 1.32 | (a) | | 1.34 | | | 1.43 | | | 1.52 | | | 1.61 | | | 1.80 |
Expenses after
expense reductions (f) | | 1.32 | (a) | | 1.34 | | | 1.43 | | | 1.55 | (e) | | 1.67 | (e) | | 1.75 |
| Net investment income | | 0.05 | (a) | | 1.28 | | | 1.06 | | | 0.80 | | | 0.75 | | | 0.36 |
| Portfolio turnover | | 33 | | | 66 | | | 85 | | | 79 | | | 102 | | | 96 |
Net assets at end of period
(000 Omitted) | | $1,743,162 | | | $1,813,833 | | | $1,344,754 | | | $958,878 | | | $593,574 | | | $387,732 |
See Notes to Financial Statements
18
Financial Highlights – continued
| | | | | | | | | | | | | | | | | | |
| | | Six months
ended
2/29/08 (unaudited) | | | Years ended 8/31 | |
| Class B | | | 2007 | | | 2006 | | | 2005 | | | 2004 | | | 2003 | |
| | | | | | | | | | | | | | | | | |
Net asset value, beginning
of period | | $19.61 | | | $18.63 | | | $16.02 | | | $13.76 | | | $11.19 | | | $10.54 | |
Income (loss) from
investment operations | | | | | | | | | | | | | | | | | | |
Net investment income (loss) (d) | | $(0.06 | ) | | $0.11 | | | $0.07 | | | $0.01 | | | $0.02 | | | $(0.03 | ) |
Net realized and unrealized
gain (loss) on investments and
foreign currency | | (0.48 | ) | | 2.92 | | | 3.93 | | | 2.93 | | | 2.55 | | | 0.68 | |
| Total from investment operations | | $(0.54 | ) | | $3.03 | | | $4.00 | | | $2.94 | | | $2.57 | | | $0.65 | |
Less distributions declared
to shareholders | | | | | | | | | | | | | | | | | | |
From net investment income | | $(0.12 | ) | | $(0.11 | ) | | $(0.03 | ) | | $(0.00 | )(w) | | $— | | | $— | |
From net realized gain
on investments | | (1.99 | ) | | (1.94 | ) | | (1.36 | ) | | (0.68 | ) | | — | | | — | |
Total distributions declared
to shareholders | | $(2.11 | ) | | $(2.05 | ) | | $(1.39 | ) | | $(0.68 | ) | | $— | | | $— | |
| Net asset value, end of period | | $16.96 | | | $19.61 | | | $18.63 | | | $16.02 | | | $13.76 | | | $11.19 | |
| Total return (%) (r)(s)(t) | | (3.82 | )(n) | | 17.08 | | | 26.36 | | | 21.77 | | | 22.97 | | | 6.17 | |
Ratios (%) (to average net
assets) and Supplemental data: | | | | | | | | | | | | | | | | | | |
Expenses before
expense reductions (f) | | 1.97 | (a) | | 1.99 | | | 2.08 | | | 2.17 | | | 2.25 | | | 2.45 | |
Expenses after
expense reductions (f) | | 1.97 | (a) | | 1.99 | | | 2.08 | | | 2.20 | (e) | | 2.31 | (e) | | 2.40 | |
| Net investment income (loss) | | (0.61 | )(a) | | 0.55 | | | 0.40 | | | 0.08 | | | 0.12 | | | (0.32 | ) |
| Portfolio turnover | | 33 | | | 66 | | | 85 | | | 79 | | | 102 | | | 96 | |
Net assets at end of period
(000 Omitted) | | $144,416 | | | $185,670 | | | $184,341 | | | $141,515 | | | $116,165 | | | $88,177 | |
See Notes to Financial Statements
19
Financial Highlights – continued
| | | | | | | | | | | | | | | | | | |
| | | Six months
ended
2/29/08 (unaudited) | | | Years ended 8/31 | |
| Class C | | | 2007 | | | 2006 | | | 2005 | | | 2004 | | | 2003 | |
| | | | | | | | | | | | | | | | | |
Net asset value, beginning
of period | | $19.52 | | | $18.57 | | | $15.98 | | | $13.73 | | | $11.17 | | | $10.52 | |
Income (loss) from
investment operations | | | | | | | | | | | | | | | | | | |
Net investment income (loss) (d) | | $(0.06 | ) | | $0.12 | | | $0.07 | | | $0.02 | | | $0.02 | | | $(0.03 | ) |
Net realized and unrealized
gain (loss) on investments and
foreign currency | | (0.48 | ) | | 2.89 | | | 3.92 | | | 2.92 | | | 2.54 | | | 0.68 | |
| Total from investment operations | | $(0.54 | ) | | $3.01 | | | $3.99 | | | $2.94 | | | $2.56 | | | $0.65 | |
Less distributions declared
to shareholders | | | | | | | | | | | | | | | | | | |
From net investment income | | $(0.16 | ) | | $(0.12 | ) | | $(0.04 | ) | | $(0.01 | ) | | $— | | | $— | |
From net realized gain
on investments | | (1.99 | ) | | (1.94 | ) | | (1.36 | ) | | (0.68 | ) | | — | | | — | |
Total distributions declared
to shareholders | | $(2.15 | ) | | $(2.06 | ) | | $(1.40 | ) | | $(0.69 | ) | | $— | | | $— | |
| Net asset value, end of period | | $16.83 | | | $19.52 | | | $18.57 | | | $15.98 | | | $13.73 | | | $11.17 | |
| Total return (%) (r)(s)(t) | | (3.86 | )(n) | | 17.05 | | | 26.38 | | | 21.84 | | | 22.92 | | | 6.18 | |
Ratios (%) (to average net
assets) and Supplemental data: | | | | | | | | | | | | | | | | | | |
Expenses before
expense reductions (f) | | 1.97 | (a) | | 1.99 | | | 2.08 | | | 2.17 | | | 2.25 | | | 2.45 | |
Expenses after
expense reductions (f) | | 1.97 | (a) | | 1.99 | | | 2.08 | | | 2.20 | (e) | | 2.31 | (e) | | 2.40 | |
| Net investment income (loss) | | (0.61 | )(a) | | 0.62 | | | 0.41 | | | 0.13 | | | 0.15 | | | (0.32 | ) |
| Portfolio turnover | | 33 | | | 66 | | | 85 | | | 79 | | | 102 | | | 96 | |
Net assets at end of period
(000 Omitted) | | $191,082 | | | $200,491 | | | $158,564 | | | $109,347 | | | $75,580 | | | $46,022 | |
See Notes to Financial Statements
20
Financial Highlights – continued
| | | | | | | | | | | | | | | | | |
| | | Six months
ended
2/29/08 (unaudited) | | | Years ended 8/31 |
| Class I | | | 2007 | | | 2006 | | | 2005 | | | 2004 | | | 2003 |
| | | | | | | | | | | | | | | | |
Net asset value, beginning
of period | | $21.14 | | | $19.92 | | | $17.02 | | | $14.54 | | | $11.75 | | | $10.95 |
Income (loss) from
investment operations | | | | | | | | | | | | | | | | | |
Net investment income (d) | | $0.04 | | | $0.34 | | | $0.26 | | | $0.19 | | | $0.16 | | | $0.10 |
Net realized and unrealized
gain (loss) on investments and
foreign currency | | (0.53 | ) | | 3.11 | | | 4.17 | | | 3.10 | | | 2.66 | | | 0.70 |
| Total from investment operations | | $(0.49 | ) | | $3.45 | | | $4.43 | | | $3.29 | | | $2.82 | | | $0.80 |
Less distributions declared
to shareholders | | | | | | | | | | | | | | | | | |
From net investment income | | $(0.35 | ) | | $(0.29 | ) | | $(0.17 | ) | | $(0.13 | ) | | $(0.03 | ) | | $— |
From net realized gain
on investments | | (1.99 | ) | | (1.94 | ) | | (1.36 | ) | | (0.68 | ) | | — | | | — |
Total distributions declared
to shareholders | | $(2.34 | ) | | $(2.23 | ) | | $(1.53 | ) | | $(0.81 | ) | | $(0.03 | ) | | $— |
| Net asset value, end of period | | $18.31 | | | $21.14 | | | $19.92 | | | $17.02 | | | $14.54 | | | $11.75 |
| Total return (%) (r)(s) | | (3.39 | )(n) | | 18.27 | | | 27.61 | | | 23.09 | | | 24.05 | | | 7.31 |
Ratios (%) (to average net
assets) and Supplemental data: | | | | | | | | | | | | | | | | | |
Expenses before
expense reductions (f) | | 0.97 | (a) | | 0.99 | | | 1.08 | | | 1.17 | | | 1.26 | | | 1.45 |
Expenses after
expense reductions (f) | | 0.97 | (a) | | 0.99 | | | 1.08 | | | 1.20 | (e) | | 1.32 | (e) | | 1.40 |
| Net investment income | | 0.40 | (a) | | 1.64 | | | 1.41 | | | 1.18 | | | 1.18 | | | 0.95 |
| Portfolio turnover | | 33 | | | 66 | | | 85 | | | 79 | | | 102 | | | 96 |
Net assets at end of period
(000 Omitted) | | $2,205,320 | | | $2,210,257 | | | $1,565,596 | | | $851,484 | | | $469,181 | | | $232,328 |
See Notes to Financial Statements
21
Financial Highlights – continued
| | | | | | | | | |
| | | Six months
ended
2/29/08 (unaudited) | | | Years ended 8/31 | |
| Class W | | | 2007 | | | 2006 (i) | |
| | | | | | | | |
Net asset value, beginning
of period | | $20.57 | | | $19.45 | | | $19.54 | |
Income (loss) from
investment operations | | | | | | | | | |
Net investment income (d) | | $0.03 | | | $0.35 | | | $0.04 | |
Net realized and unrealized
gain (loss) on investments and
foreign currency | | (0.51 | ) | | 3.00 | | | (0.13 | )(g) |
| Total from investment operations | | $(0.48 | ) | | $3.35 | | | $(0.09 | ) |
Less distributions declared
to shareholders | | | | | | | | | |
From net investment income | | $(0.34 | ) | | $(0.29 | ) | | $— | |
From net realized gain
on investments | | (1.99 | ) | | (1.94 | ) | | — | |
Total distributions declared
to shareholders | | $(2.33 | ) | | $(2.23 | ) | | $— | |
| Net asset value, end of period | | $17.76 | | | $20.57 | | | $19.45 | |
| Total return (%) (r)(s) | | (3.44 | )(n) | | 18.15 | | | (0.46 | )(n) |
Ratios (%) (to average net
assets) and Supplemental data: | | | | | | | | | |
Expenses before
expense reductions (f) | | 1.07 | (a) | | 1.10 | | | 1.20 | (a) |
Expenses after
expense reductions (f) | | 1.07 | (a) | | 1.10 | | | 1.20 | (a) |
| Net investment income | | 0.27 | (a) | | 1.78 | | | 1.02 | (a) |
| Portfolio turnover | | 33 | | | 66 | | | 85 | |
Net assets at end of period
(000 Omitted) | | $11,551 | | | $10,272 | | | $1,033 | |
See Notes to Financial Statements
22
Financial Highlights – continued
| | | | | | | | | | | | | | | | | | |
| | | Six months
ended
2/29/08 (unaudited) | | | Years ended 8/31 | |
| Class R | | | 2007 | | | 2006 | | | 2005 | | | 2004 | | | 2003 (i) | |
| | | | | | | | | | | | | | | | | |
Net asset value, beginning
of period | | $20.39 | | | $19.29 | | | $16.54 | | | $14.20 | | | $11.52 | | | $10.32 | |
Income (loss) from
investment operations | | | | | | | | | | | | | | | | | | |
Net investment income (loss) (d) | | $(0.01 | ) | | $0.22 | | | $0.17 | | | $0.11 | | | $0.09 | | | $(0.01 | ) |
Net realized and unrealized
gain (loss) on investments and
foreign currency | | (0.50 | ) | | 3.03 | | | 4.05 | | | 3.01 | | | 2.61 | | | 1.21 | |
| Total from investment operations | | $(0.51 | ) | | $3.25 | | | $4.22 | | | $3.12 | | | $2.70 | | | $1.20 | |
Less distributions declared
to shareholders | | | | | | | | | | | | | | | | | | |
From net investment income | | $(0.22 | ) | | $(0.21 | ) | | $(0.11 | ) | | $(0.10 | ) | | $(0.02 | ) | | $— | |
From net realized gain
on investments | | (1.99 | ) | | (1.94 | ) | | (1.36 | ) | | (0.68 | ) | | — | | | — | |
Total distributions declared
to shareholders | | $(2.21 | ) | | $(2.15 | ) | | $(1.47 | ) | | $(0.78 | ) | | $(0.02 | ) | | $— | |
| Net asset value, end of period | | $17.67 | | | $20.39 | | | $19.29 | | | $16.54 | | | $14.20 | | | $11.52 | |
| Total return (%) (r)(s) | | (3.58 | )(n) | | 17.70 | | | 26.98 | | | 22.40 | | | 23.50 | | | 11.63 | (n) |
Ratios (%) (to average net
assets) and Supplemental data: | | | | | | | | | | | | | | | | | | |
Expenses before
expense reductions (f) | | 1.47 | (a) | | 1.49 | | | 1.58 | | | 1.66 | | | 1.75 | | | 1.95 | (a) |
Expenses after
expense reductions (f) | | 1.47 | (a) | | 1.49 | | | 1.58 | | | 1.69 | (e) | | 1.81 | (e) | | 1.90 | (a) |
| Net investment income (loss) | | (0.10 | )(a) | | 1.11 | | | 0.95 | | | 0.73 | | | 0.69 | | | (0.09 | )(a) |
| Portfolio turnover | | 33 | | | 66 | | | 85 | | | 79 | | | 102 | | | 96 | |
Net assets at end of period
(000 Omitted) | | $53,509 | | | $69,152 | | | $69,507 | | | $44,300 | | | $19,596 | | | $4,810 | |
See Notes to Financial Statements
23
Financial Highlights – continued
| | | | | | | | | | | | |
| | | Six months
ended
2/29/08 (unaudited) | | | Years ended 8/31 | |
| Class R1 | | | 2007 | | | 2006 | | | 2005 (i) | |
| | | | | | | | | | | |
Net asset value, beginning
of period | | $19.38 | | | $18.49 | | | $16.02 | | | $15.07 | |
Income (loss) from
investment operations | | | | | | | | | | | | |
Net investment income (loss) (d) | | $(0.07 | ) | | $0.12 | | | $0.11 | | | $0.03 | |
Net realized and unrealized
gain (loss) on investments and
foreign currency | | (0.47 | ) | | 2.87 | | | 3.84 | | | 0.92 | |
| Total from investment operations | | $(0.54 | ) | | $2.99 | | | $3.95 | | | $0.95 | |
Less distributions declared
to shareholders | | | | | | | | | | | | |
From net investment income | | $(0.22 | ) | | $(0.16 | ) | | $(0.12 | ) | | $— | |
From net realized gain
on investments | | (1.99 | ) | | (1.94 | ) | | (1.36 | ) | | — | |
Total distributions declared
to shareholders | | $(2.21 | ) | | $(2.10 | ) | | $(1.48 | ) | | $— | |
| Net asset value, end of period | | $16.63 | | | $19.38 | | | $18.49 | | | $16.02 | |
| Total return (%) (r)(s) | | (3.90 | )(n) | | 17.00 | | | 26.12 | | | 6.30 | (n) |
Ratios (%) (to average net
assets) and Supplemental data: | | | | | | | | | | | | |
Expenses before
expense reductions (f) | | 2.07 | (a) | | 2.14 | | | 2.26 | | | 2.36 | (a) |
Expenses after
expense reductions (f) | | 2.07 | (a) | | 2.09 | | | 2.16 | | | 2.39 | (a)(e) |
| Net investment income (loss) | | (0.71 | )(a) | | 0.64 | | | 0.65 | | | 0.46 | (a) |
| Portfolio turnover | | 33 | | | 66 | | | 85 | | | 79 | |
Net assets at end of period
(000 Omitted) | | $8,419 | | | $5,441 | | | $2,027 | | | $171 | |
See Notes to Financial Statements
24
Financial Highlights – continued
| | | | | | | | | | | | |
| | | Six months
ended
2/29/08 (unaudited) | | | Years ended 8/31 | |
| Class R2 | | | 2007 | | | 2006 | | | 2005 (i) | |
| | | | | | | | | | | |
Net asset value, beginning
of period | | $19.49 | | | $18.59 | | | $16.04 | | | $15.07 | |
Income (loss) from
investment operations | | | | | | | | | | | | |
Net investment income (loss) (d) | | $(0.02 | ) | | $0.19 | | | $0.14 | | | $0.06 | |
Net realized and unrealized
gain (loss) on investments and
foreign currency | | (0.47 | ) | | 2.87 | | | 3.89 | | | 0.91 | |
| Total from investment operations | | $(0.49 | ) | | $3.06 | | | $4.03 | | | $0.97 | |
Less distributions declared
to shareholders | | | | | | | | | | | | |
From net investment income | | $(0.28 | ) | | $(0.22 | ) | | $(0.12 | ) | | $— | |
From net realized gain
on investments | | (1.99 | ) | | (1.94 | ) | | (1.36 | ) | | — | |
Total distributions declared
to shareholders | | $(2.27 | ) | | $(2.16 | ) | | $(1.48 | ) | | $— | |
| Net asset value, end of period | | $16.73 | | | $19.49 | | | $18.59 | | | $16.04 | |
| Total return (%) (r)(s) | | (3.68 | )(n) | | 17.34 | | | 26.63 | | | 6.44 | (n) |
Ratios (%) (to average net
assets) and Supplemental data: | | | | | | | | | | | | |
Expenses before
expense reductions (f) | | 1.62 | (a) | | 1.80 | | | 1.96 | | | 2.04 | (a) |
Expenses after
expense reductions (f) | | 1.62 | (a) | | 1.75 | | | 1.82 | | | 2.07 | (a)(e) |
| Net investment income (loss) | | (0.26 | )(a) | | 1.03 | | | 0.83 | | | 1.12 | (a) |
| Portfolio turnover | | 33 | | | 66 | | | 85 | | | 79 | |
Net assets at end of period
(000 Omitted) | | $11,482 | | | $5,073 | | | $1,021 | | | $178 | |
See Notes to Financial Statements
25
Financial Highlights – continued
| | | | | | | | | | | | | | | |
| | | Six months
ended
2/29/08 (unaudited) | | | Years ended 8/31 | |
| Class R3 | | | 2007 | | | 2006 | | | 2005 | | | 2004 (i) | |
| | | | | | | | | | | | | | |
Net asset value, beginning
of period | | $20.14 | | | $19.11 | | | $16.43 | | | $14.16 | | | $12.71 | |
Income (loss) from
investment operations | | | | | | | | | | | | | | | |
Net investment income (loss) (d) | | $(0.02 | ) | | $0.22 | | | $0.15 | | | $0.11 | | | $0.02 | |
Net realized and unrealized
gain (loss) on investments and
foreign currency | | (0.49 | ) | | 2.96 | | | 4.01 | | | 2.96 | | | 1.46 | |
| Total from investment operations | | $(0.51 | ) | | $3.18 | | | $4.16 | | | $3.07 | | | $1.48 | |
Less distributions declared
to shareholders | | | | | | | | | | | | | | | |
From net investment income | | $(0.26 | ) | | $(0.21 | ) | | $(0.12 | ) | | $(0.12 | ) | | $(0.03 | ) |
From net realized gain
on investments | | (1.99 | ) | | (1.94 | ) | | (1.36 | ) | | (0.68 | ) | | — | |
Total distributions declared
to shareholders | | $(2.25 | ) | | $(2.15 | ) | | $(1.48 | ) | | $(0.80 | ) | | $(0.03 | ) |
| Net asset value, end of period | | $17.38 | | | $20.14 | | | $19.11 | | | $16.43 | | | $14.16 | |
| Total return (%) (r)(s) | | (3.65 | )(n) | | 17.50 | | | 26.79 | | | 22.13 | | | 11.69 | (n) |
Ratios (%) (to average net
assets) and Supplemental data: | | | | | | | | | | | | | | | |
Expenses before
expense reductions (f) | | 1.57 | (a) | | 1.69 | | | 1.82 | | | 1.92 | | | 2.01 | (a) |
Expenses after
expense reductions (f) | | 1.57 | (a) | | 1.64 | | | 1.73 | | | 1.95 | (e) | | 2.07 | (a)(e) |
| Net investment income (loss) | | (0.21 | )(a) | | 1.13 | | | 0.83 | | | 0.74 | | | 0.18 | (a) |
| Portfolio turnover | | 33 | | | 66 | | | 85 | | | 79 | | | 102 | |
Net assets at end of period
(000 Omitted) | | $44,835 | | | $36,143 | | | $13,799 | | | $2,357 | | | $431 | |
See Notes to Financial Statements
26
Financial Highlights – continued
| | | | | | | | | | | | |
| | | Six months
ended
2/29/08 (unaudited) | | | Years ended 8/31 | |
| Class R4 | | | 2007 | | | 2006 | | | 2005 (i) | |
| | | | | | | | | | | |
Net asset value, beginning
of period | | $20.47 | | | $19.39 | | | $16.65 | | | $15.62 | |
Income (loss) from
investment operations | | | | | | | | | | | | |
Net investment income (d) | | $0.00 | (w) | | $0.31 | | | $0.25 | | | $0.12 | |
Net realized and unrealized
gain (loss) on investments and
foreign currency | | (0.50 | ) | | 2.96 | | | 4.00 | | | 0.91 | |
| Total from investment operations | | $(0.50 | ) | | $3.27 | | | $4.25 | | | $1.03 | |
Less distributions declared
to shareholders | | | | | | | | | | | | |
From net investment income | | $(0.29 | ) | | $(0.25 | ) | | $(0.15 | ) | | $— | |
From net realized gain
on investments | | (1.99 | ) | | (1.94 | ) | | (1.36 | ) | | — | |
Total distributions declared
to shareholders | | $(2.28 | ) | | $(2.19 | ) | | $(1.51 | ) | | $— | |
| Net asset value, end of period | | $17.69 | | | $20.47 | | | $19.39 | | | $16.65 | |
| Total return (%) (r)(s) | | (3.53 | )(n) | | 17.78 | | | 27.07 | | | 6.59 | (n) |
Ratios (%) (to average net
assets) and Supplemental data: | | | | | | | | | | | | |
Expenses before
expense reductions (f) | | 1.32 | (a) | | 1.39 | | | 1.47 | | | 1.55 | (a) |
Expenses after
expense reductions (f) | | 1.32 | (a) | | 1.39 | | | 1.47 | | | 1.58 | (a)(e) |
| Net investment income | | 0.04 | (a) | | 1.54 | | | 1.42 | | | 1.79 | (a) |
| Portfolio turnover | | 33 | | | 66 | | | 85 | | | 79 | |
Net assets at end of period
(000 Omitted) | | $67,895 | | | $64,332 | | | $12,796 | | | $53 | |
See Notes to Financial Statements
27
Financial Highlights – continued
| | | | | | | | | | | | |
| | | Six months
ended
2/29/08 (unaudited) | | | Years ended 8/31 | |
| Class R5 | | | 2007 | | | 2006 | | | 2005 (i) | |
| | | | | | | | | | | |
Net asset value, beginning
of period | | $20.60 | | | $19.47 | | | $16.67 | | | $15.62 | |
Income (loss) from
investment operations | | | | | | | | | | | | |
Net investment income (d) | | $0.03 | | | $0.32 | | | $0.33 | | | $0.14 | |
Net realized and unrealized
gain (loss) on investments and
foreign currency | | (0.51 | ) | | 3.03 | | | 3.99 | | | 0.91 | |
| Total from investment operations | | $(0.48 | ) | | $3.35 | | | $4.32 | | | $1.05 | |
Less distributions declared
to shareholders | | | | | | | | | | | | |
From net investment income | | $(0.33 | ) | | $(0.28 | ) | | $(0.16 | ) | | $— | |
From net realized gain
on investments | | (1.99 | ) | | (1.94 | ) | | (1.36 | ) | | — | |
Total distributions declared
to shareholders | | $(2.32 | ) | | $(2.22 | ) | | $(1.52 | ) | | $— | |
| Net asset value, end of period | | $17.80 | | | $20.60 | | | $19.47 | | | $16.67 | |
| Total return (%) (r)(s) | | (3.42 | )(n) | | 18.13 | | | 27.50 | | | 6.72 | (n) |
Ratios (%) (to average net
assets) and Supplemental data: | | | | | | | | | | | | |
Expenses before
expense reductions (f) | | 1.04 | (a) | | 1.09 | | | 1.17 | | | 1.25 | (a) |
Expenses after
expense reductions (f) | | 1.03 | (a) | | 1.09 | | | 1.17 | | | 1.28 | (a)(e) |
| Net investment income | | 0.32 | (a) | | 1.56 | | | 1.82 | | | 2.09 | (a) |
| Portfolio turnover | | 33 | | | 66 | | | 85 | | | 79 | |
Net assets at end of period
(000 Omitted) | | $165,155 | | | $178,238 | | | $109,993 | | | $53 | |
See Notes to Financial Statements
28
Financial Highlights – continued
| | | | | | | | | | | | | | | | | |
| | | Six months
ended
2/29/08 (unaudited) | | | Years ended 8/31 |
| Class 529A | | | 2007 | | | 2006 | | | 2005 | | | 2004 | | | 2003 |
| | | | | | | | | | | | | | | | |
Net asset value, beginning
of period | | $20.34 | | | $19.27 | | | $16.53 | | | $14.18 | | | $11.50 | | | $10.78 |
Income (loss) from
investment operations | | | | | | | | | | | | | | | | | |
Net investment income (loss) (d) | | $(0.02 | ) | | $0.20 | | | $0.16 | | | $0.10 | | | $0.08 | | | $0.03 |
Net realized and unrealized
gain (loss) on investments and
foreign currency | | (0.50 | ) | | 3.01 | | | 4.04 | | | 3.01 | | | 2.61 | | | 0.69 |
| Total from investment operations | | $(0.52 | ) | | $3.21 | | | $4.20 | | | $3.11 | | | $2.69 | | | $0.72 |
Less distributions declared
to shareholders | | | | | | | | | | | | | | | | | |
From net investment income | | $(0.23 | ) | | $(0.20 | ) | | $(0.10 | ) | | $(0.08 | ) | | $(0.01 | ) | | $— |
From net realized gain
on investments | | (1.99 | ) | | (1.94 | ) | | (1.36 | ) | | (0.68 | ) | | — | | | — |
Total distributions declared
to shareholders | | $(2.22 | ) | | $(2.14 | ) | | $(1.46 | ) | | $(0.76 | ) | | $(0.01 | ) | | $— |
| Net asset value, end of period | | $17.60 | | | $20.34 | | | $19.27 | | | $16.53 | | | $14.18 | | | $11.50 |
| Total return (%) (r)(s)(t) | | (3.62 | )(n) | | 17.51 | | | 26.86 | | | 22.35 | | | 23.39 | | | 6.68 |
Ratios (%) (to average net
assets) and Supplemental data: | | | | | | | | | | | | | | | | | |
Expenses before
expense reductions (f) | | 1.57 | (a) | | 1.59 | | | 1.68 | | | 1.76 | | | 1.85 | | | 2.05 |
Expenses after
expense reductions (f) | | 1.57 | (a) | | 1.59 | | | 1.68 | | | 1.79 | (e) | | 1.91 | (e) | | 2.00 |
| Net investment income (loss) | | (0.20 | )(a) | | 1.01 | | | 0.88 | | | 0.65 | | | 0.62 | | | 0.30 |
| Portfolio turnover | | 33 | | | 66 | | | 85 | | | 79 | | | 102 | | | 96 |
Net assets at end of period
(000 Omitted) | | $2,083 | | | $2,060 | | | $1,552 | | | $760 | | | $332 | | | $112 |
See Notes to Financial Statements
29
Financial Highlights – continued
| | | | | | | | | | | | | | | | | | |
| | | Six months
ended
2/29/08 (unaudited) | | | Years ended 8/31 | |
| Class 529B | | | 2007 | | | 2006 | | | 2005 | | | 2004 | | | 2003 | |
| | | | | | | | | | | | | | | | | |
Net asset value, beginning
of period | | $19.31 | | | $18.43 | | | $15.88 | | | $13.68 | | | $11.17 | | | $10.54 | |
Income (loss) from
investment operations | | | | | | | | | | | | | | | | | | |
Net investment income (loss) (d) | | $(0.08 | ) | | $0.08 | | | $0.03 | | | $(0.02 | ) | | $(0.00 | )(w) | | $(0.05 | ) |
Net realized and unrealized
gain (loss) on investments and
foreign currency | | (0.48 | ) | | 2.86 | | | 3.89 | | | 2.91 | | | 2.51 | | | 0.68 | |
| Total from investment operations | | $(0.56 | ) | | $2.94 | | | $3.92 | | | $2.89 | | | $2.51 | | | $0.63 | |
Less distributions declared
to shareholders | | | | | | | | | | | | | | | | | | |
From net investment income | | $(0.12 | ) | | $(0.12 | ) | | $(0.01 | ) | | $(0.01 | ) | | $— | | | $— | |
From net realized gain
on investments | | (1.99 | ) | | (1.94 | ) | | (1.36 | ) | | (0.68 | ) | | — | | | — | |
Total distributions declared
to shareholders | | $(2.11 | ) | | $(2.06 | ) | | $(1.37 | ) | | $(0.69 | ) | | $— | | | $— | |
| Net asset value, end of period | | $16.64 | | | $19.31 | | | $18.43 | | | $15.88 | | | $13.68 | | | $11.17 | |
| Total return (%) (r)(s)(t) | | (3.98 | )(n) | | 16.78 | | | 26.06 | | | 21.54 | | | 22.47 | | | 5.98 | |
Ratios (%) (to average net
assets) and Supplemental data: | | | | | | | | | | | | | | | | | | |
Expenses before
expense reductions (f) | | 2.22 | (a) | | 2.24 | | | 2.33 | | | 2.42 | | | 2.50 | | | 2.70 | |
Expenses after
expense reductions (f) | | 2.22 | (a) | | 2.24 | | | 2.33 | | | 2.45 | (e) | | 2.56 | (e) | | 2.65 | |
| Net investment income (loss) | | (0.84 | )(a) | | 0.42 | | | 0.15 | | | (0.13 | ) | | (0.03 | ) | | (0.43 | ) |
| Portfolio turnover | | 33 | | | 66 | | | 85 | | | 79 | | | 102 | | | 96 | |
Net assets at end of period
(000 Omitted) | | $707 | | | $581 | | | $356 | | | $174 | | | $110 | | | $41 | |
See Notes to Financial Statements
30
Financial Highlights – continued
| | | | | | | | | | | | | | | | | | |
| | | Six months
ended
2/29/08 (unaudited) | | | Years ended 8/31 | |
| Class 529C | | | 2007 | | | 2006 | | | 2005 | | | 2004 | | | 2003 | |
| | | | | | | | | | | | | | | | | |
Net asset value, beginning
of period | | $19.31 | | | $18.40 | | | $15.86 | | | $13.66 | | | $11.14 | | | $10.52 | |
Income (loss) from
investment operations | | | | | | | | | | | | | | | | | | |
Net investment income (loss) (d) | | $(0.08 | ) | | $0.08 | | | $0.03 | | | $(0.01 | ) | | $(0.00 | )(w) | | $(0.04 | ) |
Net realized and unrealized
gain (loss) on investments and
foreign currency | | (0.47 | ) | | 2.86 | | | 3.87 | | | 2.90 | | | 2.52 | | | 0.66 | |
| Total from investment operations | | $(0.55 | ) | | $2.94 | | | $3.90 | | | $2.89 | | | $2.52 | | | $0.62 | |
Less distributions declared
to shareholders | | | | | | | | | | | | | | | | | | |
From net investment income | | $(0.11 | ) | | $(0.09 | ) | | $(0.00 | )(w) | | $(0.01 | ) | | $— | | | $— | |
From net realized gain
on investments | | (1.99 | ) | | (1.94 | ) | | (1.36 | ) | | (0.68 | ) | | — | | | — | |
Total distributions declared
to shareholders | | $(2.10 | ) | | $(2.03 | ) | | $(1.36 | ) | | $(0.69 | ) | | $— | | | $— | |
| Net asset value, end of period | | $16.66 | | | $19.31 | | | $18.40 | | | $15.86 | | | $13.66 | | | $11.14 | |
| Total return (%) (r)(s)(t) | | (3.94 | )(n) | | 16.79 | | | 25.98 | | | 21.53 | | | 22.62 | | | 5.89 | |
Ratios (%) (to average net
assets) and Supplemental data: | | | | | | | | | | | | | | | | | | |
Expenses before
expense reductions (f) | | 2.22 | (a) | | 2.24 | | | 2.33 | | | 2.42 | | | 2.49 | | | 2.70 | |
Expenses after
expense reductions (f) | | 2.22 | (a) | | 2.24 | | | 2.33 | | | 2.45 | (e) | | 2.55 | (e) | | 2.65 | |
| Net investment income (loss) | | (0.86 | )(a) | | 0.40 | | | 0.16 | | | (0.07 | ) | | (0.02 | ) | | (0.36 | ) |
| Portfolio turnover | | 33 | | | 66 | | | 85 | | | 79 | | | 102 | | | 96 | |
Net assets at end of period
(000 Omitted) | | $888 | | | $938 | | | $650 | | | $454 | | | $280 | | | $81 | |
Any redemption fees charged by the fund during the 2004 and 2005 fiscal years resulted in a per share impact of less than $0.01.
| (d) | Per share data are based on average shares outstanding. |
| (e) | Ratio includes a reimbursement fee for expenses borne by MFS in prior years under the then existing expense reimbursement agreement. |
| (f) | Ratios do not reflect reductions from fees paid indirectly, if applicable. |
| (g) | The per share amount is not in accordance with the net realized and unrealized gain/loss for the period because of the timing of sales of fund shares and the per share amount of realized and unrealized gains and losses at such time. |
| (i) | For the period from the class’ inception, December 31, 2002 (Class R), October 31, 2003 (Class R3), April 1, 2005 (Classes R1, R2, R4, and R5) and May 1, 2006 (Class W) through the stated period end. |
| (r) | Certain expenses have been reduced without which performance would have been lower. |
| (s) | From time to time the fund may receive proceeds from litigation settlements, without which performance would be lower. |
| (t) | Total returns do not include any applicable sales charges. |
| (w) | Per share amount was less than $0.01. |
See Notes to Financial Statements
31
NOTES TO FINANCIAL STATEMENTS
(unaudited)
| (1) | | Business and Organization |
MFS Research International Fund (the fund) is a series of MFS Series Trust I (the trust). The trust is organized as a Massachusetts business trust and is registered under the Investment Company Act of 1940, as amended, as an open-end management investment company.
| (2) | | Significant Accounting Policies |
General – The preparation of financial statements in conformity with U.S. generally accepted accounting principles requires management to make estimates and assumptions that affect the reported amounts of assets and liabilities, and disclosure of contingent assets and liabilities at the date of the financial statements and the reported amounts of revenues and expenses during the reporting period. Actual results could differ from those estimates. The fund can invest in foreign securities, including securities of emerging market issuers. Investments in foreign securities are vulnerable to the effects of changes in the relative values of the local currency and the U.S. dollar and to the effects of changes in each country’s legal, political, and economic environment. The markets of emerging markets countries are generally more volatile than the markets of developed countries with more mature economies. All of the risks of investing in foreign securities previously described are heightened when investing in emerging markets countries.
Investment Valuations – Equity securities, including restricted equity securities, are generally valued at the last sale or official closing price as reported by an independent pricing service on the market or exchange on which they are primarily traded. For securities for which there were no sales reported that day, equity securities are generally valued at the last quoted daily bid quotation as reported by an independent pricing service on the market or exchange on which they are primarily traded. For securities held short for which there were no sales reported for the day, the position is generally valued at the last quoted daily ask quotation as reported by an independent pricing service on the market or exchange on which such securities are primarily traded. Short-term instruments with a maturity at issuance of 60 days or less may be valued at amortized cost, which approximates market value. Open-end investment companies are generally valued at net asset value per share. Securities and other assets generally valued on the basis of information from an independent pricing service may also be valued at a broker-dealer bid quotation. Values obtained from pricing services can utilize both dealer-supplied valuations and electronic data processing techniques, which take into account factors such as institutional-size trading in similar groups of securities, yield, quality, coupon rate, maturity, type of issue, trading characteristics, and other
32
Notes to Financial Statements (unaudited) – continued
market data. The values of foreign securities and other assets and liabilities expressed in foreign currencies are converted to U.S. dollars using the mean of bid and asked prices for rates reported by an independent pricing service.
The Board of Trustees has delegated primary responsibility for determining or causing to be determined the value of the fund’s investments (including any fair valuation) to the adviser pursuant to valuation policies and procedures approved by the Board. If the adviser determines that reliable market quotations are not readily available, investments are valued at fair value as determined in good faith by the adviser in accordance with such procedures under the oversight of the Board of Trustees. Under the fund’s valuation policies and procedures, market quotations are not considered to be readily available for many types of debt instruments and certain types of derivatives. These investments are generally valued at fair value based on information from independent pricing services. In addition, investments may be valued at fair value if the adviser determines that an investment’s value has been materially affected by events occurring after the close of the exchange or market on which the investment is principally traded (such as foreign exchange or market) and prior to the determination of the fund’s net asset value, or after the halting of trading of a specific security where trading does not resume prior to the close of the exchange or market on which the security is principally traded. Events that occur on a frequent basis after foreign markets close (such as developments in foreign markets and significant movements in the U.S. markets) and prior to the determination of the fund’s net asset value may be deemed to have a material affect on the value of securities traded in foreign markets. Accordingly, the fund’s foreign equity securities may often be valued at fair value. The adviser may rely on independent pricing services or other information (such as the correlation with price movements of similar securities in the same or other markets; the type, cost and investment characteristics of the security; the business and financial condition of the issuer; and trading and other market data) to assist in determining whether to fair value and at what value to fair value an investment. The value of an investment for purposes of calculating the fund’s net asset value can differ depending on the source and method used to determine value. When fair valuation is used, the value of investments used to determine the fund’s net asset value may differ from quoted or published prices for the same investments.
In September 2006, FASB Statement No. 157, Fair Value Measurements (the “Statement”) was issued, and is effective for fiscal years beginning after November 15, 2007 and for all interim periods within those fiscal years. This Statement provides a single definition of fair value, a hierarchy for measuring fair value and expanded disclosures about fair value measurements.
33
Notes to Financial Statements (unaudited) – continued
Management is evaluating the application of the Statement to the fund, and believes the impact will be limited to expanded disclosures resulting from the adoption of this Statement in the fund’s financial statements.
Repurchase Agreements – The fund may enter into repurchase agreements with institutions that the fund’s investment adviser has determined are creditworthy. Each repurchase agreement is recorded at cost. The fund requires that the securities collateral in a repurchase transaction be transferred to the custodian in a manner sufficient to enable the fund to obtain those securities in the event of a default under the repurchase agreement. The fund monitors, on a daily basis, the value of the collateral to ensure that its value, including accrued interest, is greater than amounts owed to the fund under each such repurchase agreement. The fund and other funds managed by Massachusetts Financial Services Company (MFS), may utilize a joint trading account for the purpose of entering into one or more repurchase agreements.
Foreign Currency Translation – Purchases and sales of foreign investments, income, and expenses are converted into U.S. dollars based upon currency exchange rates prevailing on the respective dates of such transactions. Gains and losses attributable to foreign currency exchange rates on sales of securities are recorded for financial statement purposes as net realized gains and losses on investments. Gains and losses attributable to foreign exchange rate movements on income and expenses are recorded for financial statement purposes as foreign currency transaction gains and losses. That portion of both realized and unrealized gains and losses on investments that results from fluctuations in foreign currency exchange rates is not separately disclosed.
Security Loans – State Street Bank and Trust Company (“State Street”), as lending agent, may loan the securities of the fund to certain qualified institutions (the “Borrowers”) approved by the fund. The loans are collateralized at all times by cash and/or U.S. Treasury and federal agency obligations in an amount at least equal to the market value of the securities loaned. State Street provides the fund with indemnification against Borrower default. The fund bears the risk of loss with respect to the investment of cash collateral. On loans collateralized by cash, the cash collateral is invested in a money market fund or short-term securities. A portion of the income generated upon investment of the collateral is remitted to the Borrowers, and the remainder is allocated between the fund and the lending agent. On loans collateralized by U.S. Treasury and/or federal agency obligations, a fee is received from the Borrower, and is allocated between the fund and the lending agent. Net income from securities lending is included in interest income on the Statement of Operations. The dividend and interest income earned on the securities loaned is accounted for in the same manner as other dividend and interest income.
34
Notes to Financial Statements (unaudited) – continued
At February 29, 2008, the value of securities loaned was $425,172,944. These loans were collateralized by cash of $433,247,888 and U.S. Treasury obligations of $12,099,957.
Indemnifications – Under the fund’s organizational documents, its officers and trustees may be indemnified against certain liabilities and expenses arising out of the performance of their duties to the fund. Additionally, in the normal course of business, the fund enters into agreements with service providers that may contain indemnification clauses. The fund’s maximum exposure under these agreements is unknown as this would involve future claims that may be made against the fund that have not yet occurred.
Investment Transactions and Income – Investment transactions are recorded on the trade date. Interest income is recorded on the accrual basis. All premium and discount is amortized or accreted for financial statement purposes in accordance with U.S. generally accepted accounting principles. Dividends received in cash are recorded on the ex-dividend date. Certain dividends from foreign securities will be recorded when the fund is informed of the dividend if such information is obtained subsequent to the ex-dividend date. Dividend and interest payments received in additional securities are recorded on the ex-dividend or ex-interest date in an amount equal to the value of the security on such date.
The fund may receive proceeds from litigation settlements. Any proceeds received from litigation involving portfolio holdings are reflected in the Statement of Operations in realized gain/loss if the security has been disposed of by the fund or in unrealized gain/loss if the security is still held by the fund. Any other proceeds from litigation not related to portfolio holdings are reflected as other income in the Statement of Operations.
Fees Paid Indirectly – The fund’s custody fee may be reduced according to an arrangement that measures the value of cash deposited with the custodian by the fund. For the six months ended February 29, 2008, custody fees were not reduced.
Tax Matters and Distributions – The fund intends to qualify as a regulated investment company, as defined under Subchapter M of the Internal Revenue Code, and to distribute all of its taxable income, including realized capital gains. As a result, no provision for federal income taxes is required. The fund adopted the provisions of FASB Interpretation No. 48, Accounting for Uncertainty in Income Taxes (“the Interpretation”) on September 1, 2007. The Interpretation prescribes a minimum threshold for financial statement recognition of the benefit of a tax position taken or expected to be taken in a tax return. There was no impact resulting from the adoption of this Interpretation on the fund’s financial statements. Each of the fund’s federal tax returns for the prior three fiscal years remains subject to examination by the Internal Revenue Service. It is the fund’s policy to record interest and penalty
35
Notes to Financial Statements (unaudited) – continued
charges on underpaid taxes associated with its taxes positions as interest expense and miscellaneous expense, respectively. No such charges were recorded in the current financial statements. Foreign taxes, if any, have been accrued by the fund in the accompanying financial statements.
Distributions to shareholders are recorded on the ex-dividend date. Income and capital gain distributions are determined in accordance with income tax regulations, which may differ from U.S. generally accepted accounting principles. Certain capital accounts in the financial statements are periodically adjusted for permanent differences in order to reflect their tax character. These adjustments have no impact on net assets or net asset value per share. Temporary differences which arise from recognizing certain items of income, expense, gain or loss in different periods for financial statement and tax purposes will reverse at some time in the future. Distributions in excess of net investment income or net realized gains are temporary overdistributions for financial statement purposes resulting from differences in the recognition or classification of income or distributions for financial statement and tax purposes.
Book/tax differences primarily relate to passive foreign investment companies, wash sale loss deferrals, foreign currency transactions, treating a portion of the proceeds from redemptions as a distribution for tax purposes, and foreign taxes.
The tax character of distributions made during the current period will be determined at fiscal year end. The tax character of distributions declared to shareholders is as follows:
| | |
| | | 8/31/07 |
Ordinary income (including any
short-term capital gains) | | $214,389,394 |
| Long-term capital gain | | 199,814,349 |
| Total distributions | | $414,203,743 |
The federal tax cost and the tax basis components of distributable earnings were as follows:
| | | |
| As of 2/29/08 | | | |
| Cost of investments | | $4,817,605,770 | |
| Gross appreciation | | 572,717,498 | |
| Gross depreciation | | (323,734,249 | ) |
| Net unrealized appreciation (depreciation) | | $248,983,249 | |
| |
| As of 8/31/07 | | | |
| Undistributed ordinary income | | 197,395,067 | |
| Undistributed long-term capital gain | | 251,952,279 | |
| Other temporary differences | | (3,571,103 | ) |
| Net unrealized appreciation (depreciation) | | 562,004,880 | |
The aggregate cost above includes prior fiscal year end tax adjustments.
36
Notes to Financial Statements (unaudited) – continued
Multiple Classes of Shares of Beneficial Interest – The fund offers multiple classes of shares, which differ in their respective distribution and service fees. All shareholders bear the common expenses of the fund based on daily net assets of each class, without distinction between share classes. Dividends are declared separately for each class. Differences in per share dividend rates are generally due to differences in separate class expenses. Class B and Class 529B shares will convert to Class A and Class 529A shares, respectively, approximately eight years after purchase.
| (3) | | Transactions with Affiliates |
Investment Adviser – The fund has an investment advisory agreement with MFS to provide overall investment management and related administrative services and facilities to the fund.
The management fee is computed daily and paid monthly at the following annual rates:
| | | |
| First $1.0 billion of average daily net assets | | 0.90 | % |
| Next $1.0 billion of average daily net assets | | 0.80 | % |
| Average daily net assets in excess of $2.0 billion | | 0.70 | % |
The management fee incurred for the six months ended February 29, 2008 was equivalent to an annual effective rate of 0.76% of the fund’s average daily net assets.
The investment adviser has agreed in writing to pay a portion of the fund’s operating expenses, exclusive of management, distribution and service, retirement plan administration and services, program manager, and certain other fees and expenses, such that operating expenses do not exceed 0.40% annually of the fund’s average daily net assets. This written agreement will continue through December 31, 2008 unless changed or rescinded by the fund’s Board of Trustees. For the six months ended February 29, 2008, the fund’s actual operating expenses did not exceed the limit and therefore, the investment adviser did not pay any portion of the fund’s expenses.
Distributor – MFS Fund Distributors, Inc. (MFD), a wholly-owned subsidiary of MFS, as distributor, received $81,551 and $1,310 for the six months ended February 29, 2008, as its portion of the initial sales charge on sales of Class A and Class 529A shares of the fund, respectively.
The Board of Trustees has adopted a distribution plan for certain class shares pursuant to Rule 12b-1 of the Investment Company Act of 1940.
The fund’s distribution plan provides that the fund will pay MFD for services provided by MFD and financial intermediaries in connection with the distribution and servicing of certain share classes. One component of the plan is a distribution fee paid to MFD and another component of the plan is a service fee paid to MFD. MFD may subsequently pay all, or a portion, of the distribution and/or service fees to financial intermediaries.
37
Notes to Financial Statements (unaudited) – continued
Distribution Plan Fee Table:
| | | | | | | | | | |
| | | Distribution
Fee Rate | | Service
Fee Rate | | Total
Distribution
Plan (d) | | Annual
Effective
Rate (e) | | Distribution
and Service
Fee |
| Class A | | 0.10% | | 0.25% | | 0.35% | | 0.35% | | $3,211,876 |
| Class B | | 0.75% | | 0.25% | | 1.00% | | 1.00% | | 857,592 |
| Class C | | 0.75% | | 0.25% | | 1.00% | | 1.00% | | 1,047,191 |
| Class W | | 0.10% | | — | | 0.10% | | 0.10% | | 6,167 |
| Class R | | 0.25% | | 0.25% | | 0.50% | | 0.50% | | 151,492 |
| Class R1 (c) | | 0.50% | | 0.25% | | 0.75% | | 0.75% | | 29,597 |
| Class R2 | | 0.25% | | 0.25% | | 0.50% | | 0.50% | | 22,934 |
| Class R3 | | 0.25% | | 0.25% | | 0.50% | | 0.50% | | 109,258 |
| Class R4 | | — | | 0.25% | | 0.25% | | 0.25% | | 87,375 |
| Class 529A | | 0.25% | | 0.25% | | 0.50% | | 0.35% | | 3,727 |
| Class 529B | | 0.75% | | 0.25% | | 1.00% | | 1.00% | | 3,200 |
| Class 529C | | 0.75% | | 0.25% | | 1.00% | | 1.00% | | 4,715 |
| Total Distribution and Service Fees | | $5,535,124 |
| (c) | Effective March 1, 2008, the distribution fee rate for Class R1 shares will be 0.75% and the total distribution plan rate will be 1.00%. |
| (d) | In accordance with the distribution plan for certain classes, the fund pays distribution and/or service fees up to these annual percentage rates of each class’ average daily net assets. |
| (e) | The annual effective rates represent actual fees incurred under the distribution plan for the six months ended February 29, 2008 based on each class’ average daily net assets. 0.10% of the Class 529A distribution fee is currently being paid by the fund. Payment of the remaining 0.15% of the Class 529A distribution fee is not yet in effect and will be implemented on such date as the fund’s Board of Trustees may determine. |
Certain Class A, Class C and Class 529C shares are subject to a contingent deferred sales charge in the event of a shareholder redemption within 12 months of purchase. Class B and Class 529B shares are subject to a contingent deferred sales charge in the event of a shareholder redemption within six years of purchase. All contingent deferred sales charges are paid to MFD and during the six months ended February 29, 2008, were as follows:
| | |
| | | Amount |
| Class A | | $1,605 |
| Class B | | 81,506 |
| Class C | | 13,011 |
| Class 529B | | — |
| Class 529C | | — |
The fund has entered into and may from time to time enter into contracts with program managers and other parties which administer the tuition programs through which an investment in the fund’s 529 share classes is made. The fund has entered into an agreement with MFD pursuant to which MFD receives an annual fee of up to 0.35% of the average daily net assets attributable to each 529 share class. The fee is based on average daily net assets and is currently established at 0.25% annually of average daily net assets of the fund’s 529
38
Notes to Financial Statements (unaudited) – continued
share classes. Effective April 1, 2008, the fee will be 0.10%. The fee may only be increased with the approval of the Board of Trustees who oversees the fund. The services provided by MFD, or a third party with which MFD contracts, include recordkeeping and tax reporting and account services, as well as services designed to maintain the program’s compliance with the Internal Revenue Code and other regulatory requirements. Program manager fees for the six months ended February 29, 2008, were as follows:
| | |
| | | Amount |
| Class 529A | | $2,662 |
| Class 529B | | 800 |
| Class 529C | | 1,179 |
| Total Program Manager Fees | | $4,641 |
Shareholder Servicing Agent – MFS Service Center, Inc. (MFSC), a wholly-owned subsidiary of MFS, receives a fee from the fund for its services as shareholder servicing agent calculated as a percentage of the average daily net assets of the fund as determined periodically under the supervision of the fund’s Board of Trustees. For the six months ended February 29, 2008, the fee was $739,381, which equated to 0.0303% annually of the fund’s average daily net assets. MFSC also receives payment from the fund for out-of-pocket expenses, sub-accounting and other shareholder servicing costs which may be paid to affiliated and unaffiliated service providers. For the six months ended February 29, 2008, these out-of-pocket expenses, sub-accounting and other shareholder servicing costs amounted to $1,484,185. The fund may also pay shareholder servicing related costs directly to non-related parties.
Effective May 1, 2007, under a Special Servicing Agreement among MFS, each MFS fund which invests in other MFS funds (“MFS fund-of-funds”) and each underlying fund in which a MFS fund-of-funds invests (“underlying funds”), each underlying fund may pay a portion of each MFS fund-of-fund’s transfer agent-related expenses, including sub-accounting fees payable to financial intermediaries, to the extent such payments do not exceed the benefits realized or expected to be realized by the underlying fund from the investment in the underlying fund by the MFS fund-of-fund. For the six months ended February 29, 2008, these costs for the fund amounted to $668,069 and are reflected in the shareholder servicing costs on the Statement of Operations.
Administrator – MFS provides certain financial, legal, shareholder communications, compliance, and other administrative services to the fund. Under an administrative services agreement, the fund partially reimburses MFS the costs incurred to provide these services. The fund is charged a fixed amount plus a fee based on average daily net assets. The fund’s annual fixed amount is $17,500. The administrative services fee incurred for the six months ended February 29, 2008 was equivalent to an annual effective rate of 0.0112% of the fund’s average daily net assets.
39
Notes to Financial Statements (unaudited) – continued
In addition to the administrative services provided by MFS to the fund as described above, MFS is responsible for providing certain retirement plan administration and services with respect to certain shares. These services include various administrative, recordkeeping, and communication/educational services with respect to the retirement plans which invest in these shares, and may be provided directly by MFS or by a third party. MFS may subsequently pay all, or a portion, of the retirement plan administration and services fee to affiliated or unaffiliated third parties. For the six months ended February 29, 2008, the fund paid MFS an annual retirement plan administration and services fee up to the following annual percentage rates of each class’ average daily net assets:
| | | | | | | | |
| | | Beginning
of period
through
12/31/07 | | Effective
1/1/08 | | Annual
Effective
Rate (g) | | Total
Amount |
Class R1 | | 0.35% | | 0.35% | | 0.35% | | $13,812 |
Class R2 | | 0.25% | | — | | 0.15% | | 6,857 |
Class R3 | | 0.15% | | — | | 0.10% | | 21,762 |
Class R4 | | 0.15% | | — | | 0.10% | | 35,591 |
Class R5 | | 0.10% | | — | | 0.07% | | 63,242 |
| Total Retirement Plan Administration and Services Fees | | $141,264 |
| (g) | Effective January 1, 2008, the annual retirement plan administration and services fee was eliminated for Class R2, Class R3, Class R4, and Class R5 shares. Effective March 1, 2008, the annual retirement plan administration and services fee will be eliminated for Class R1 shares. |
Trustees’ and Officers’ Compensation – The fund pays compensation to independent trustees in the form of a retainer, attendance fees, and additional compensation to Board and Committee chairpersons. The fund does not pay compensation directly to trustees or officers of the fund who are also officers of the investment adviser, all of whom receive remuneration for their services to the fund from MFS. Certain officers and trustees of the fund are officers or directors of MFS, MFD, and MFSC.
The fund has an unfunded, defined benefit plan for certain retired independent trustees which resulted in an expense of $268. The fund also has an unfunded retirement benefit deferral plan for certain independent trustees which resulted in a net decrease in expense of $4,337. Both amounts are included in independent trustees’ compensation for the six months ended February 29, 2008. The liability for deferred retirement benefits payable to certain independent trustees under both plans amounted to $31,147 at February 29, 2008, and is included in payable for independent trustees’ compensation.
Other – This fund and certain other MFS funds (the funds) have entered into a services agreement (the Agreement) which provides for payment of fees by the funds to Tarantino LLC in return for the provision of services of an Independent Chief Compliance Officer (ICCO) for the funds. The ICCO is an officer of the
40
Notes to Financial Statements (unaudited) – continued
funds and the sole member of Tarantino LLC. The funds can terminate the Agreement with Tarantino LLC at any time under the terms of the Agreement. For the six months ended February 29, 2008, the fee paid by the fund to Tarantino LLC was $19,597 and is included in miscellaneous expense on the Statement of Operations. MFS has agreed to reimburse the fund for a portion of the payments made by the fund to Tarantino LLC in the amount of $10,844, which is shown as a reduction of total expenses in the Statement of Operations. Additionally, MFS has agreed to bear all expenses associated with office space, other administrative support, and supplies provided to the ICCO.
Purchases and sales of investments, other than U.S. government securities, purchased option transactions, and short-term obligations, aggregated $1,708,452,769 and $1,616,288,257 respectively.
| (5) | | Shares of Beneficial Interest |
The fund’s Declaration of Trust permits the Trustees to issue an unlimited number of full and fractional shares of beneficial interest. Transactions in fund shares were as follows:
| | | | | | | | |
| | | Six months ended
2/29/08 | | Year ended
8/31/07 |
| | | Shares | | Amount | | Shares | | Amount |
| Shares sold | | | | | | | | |
Class A | | 24,302,420 | | $490,589,439 | | 41,290,726 | | $828,064,496 |
Class B | | 755,345 | | 14,481,649 | | 2,473,005 | | 47,089,337 |
Class C | | 2,126,978 | | 40,848,875 | | 3,435,528 | | 65,446,773 |
Class I | | 10,810,618 | | 221,089,810 | | 22,548,390 | | 461,671,400 |
Class W | | 299,490 | | 5,967,470 | | 494,011 | | 10,111,792 |
Class R | | 905,230 | | 18,148,195 | | 1,997,921 | | 39,719,864 |
Class R1 | | 247,947 | | 4,839,111 | | 338,647 | | 6,374,881 |
Class R2 | | 416,115 | | 7,986,128 | | 299,623 | | 5,755,095 |
Class R3 | | 945,872 | | 19,172,837 | | 2,178,813 | | 42,475,221 |
Class R4 | | 908,276 | | 18,448,780 | | 3,750,623 | | 74,887,435 |
Class R5 | | 1,654,409 | | 33,056,712 | | 5,937,198 | | 122,889,097 |
Class 529A | | 12,588 | | 245,681 | | 22,711 | | 448,508 |
Class 529B | | 9,759 | | 176,405 | | 9,906 | | 186,302 |
Class 529C | | 2,551 | | 48,642 | | 17,209 | | 324,653 |
| | 43,397,598 | | $875,099,734 | | 84,794,311 | | $1,705,444,854 |
41
Notes to Financial Statements (unaudited) – continued
| | | | | | | | | | | | |
| | | Six months ended
2/29/08 | | | Year ended
8/31/07 | |
| | | Shares | | | Amount | | | Shares | | | Amount | |
| Shares issued to shareholders in reinvestment of distributions | | | | | | | | | | | | |
Class A | | 6,971,061 | | | $137,469,349 | | | 5,693,646 | | | $108,520,893 | |
Class B | | 794,912 | | | 14,968,201 | | | 925,952 | | | 16,907,887 | |
Class C | | 787,794 | | | 14,723,865 | | | 693,004 | | | 12,598,814 | |
Class I | | 11,742,365 | | | 238,252,551 | | | 9,490,387 | | | 185,442,163 | |
Class W | | 71,572 | | | 1,408,544 | | | 9,678 | | | 184,179 | |
Class R | | 252,655 | | | 4,949,508 | | | 395,201 | | | 7,477,210 | |
Class R1 | | 51,391 | | | 949,181 | | | 14,617 | | | 263,975 | |
Class R2 | | 54,123 | | | 1,004,521 | | | 7,691 | | | 139,366 | |
Class R3 | | 260,390 | | | 5,017,702 | | | 95,132 | | | 1,779,917 | |
Class R4 | | 391,627 | | | 7,679,816 | | | 102,687 | | | 1,948,996 | |
Class R5 | | 1,043,238 | | | 20,572,662 | | | 856,467 | | | 16,324,252 | |
Class 529A | | 11,618 | | | 226,793 | | | 9,998 | | | 188,870 | |
Class 529B | | 3,563 | | | 65,893 | | | 2,620 | | | 47,194 | |
Class 529C | | 5,435 | | | 100,536 | | | 4,406 | | | 79,403 | |
| | 22,441,744 | | | $447,389,122 | | | 18,301,486 | | | $351,903,119 | |
| Shares reacquired | | | | | | | | | | | | |
Class A | | (21,480,259 | ) | | $(438,733,044 | ) | | (27,955,365 | ) | | $(564,150,425 | ) |
Class B | | (2,500,003 | ) | | (47,920,123 | ) | | (3,825,976 | ) | | (73,747,481 | ) |
Class C | | (1,833,222 | ) | | (33,354,753 | ) | | (2,398,809 | ) | | (46,114,718 | ) |
Class I | | (6,682,258 | ) | | (141,532,576 | ) | | (6,070,791 | ) | | (124,341,917 | ) |
Class W | | (220,141 | ) | | (3,797,459 | ) | | (57,320 | ) | | (1,161,073 | ) |
Class R | | (1,520,878 | ) | | (31,371,346 | ) | | (2,604,111 | ) | | (52,324,973 | ) |
Class R1 | | (73,876 | ) | | (1,337,168 | ) | | (182,138 | ) | | (3,391,715 | ) |
Class R2 | | (44,234 | ) | | (817,954 | ) | | (102,033 | ) | | (1,918,796 | ) |
Class R3 | | (420,665 | ) | | (8,100,678 | ) | | (1,201,203 | ) | | (23,239,351 | ) |
Class R4 | | (604,197 | ) | | (11,998,257 | ) | | (1,370,125 | ) | | (27,115,497 | ) |
Class R5 | | (2,073,079 | ) | | (40,024,750 | ) | | (3,790,821 | ) | | (79,261,374 | ) |
Class 529A | | (7,047 | ) | | (142,702 | ) | | (12,022 | ) | | (238,045 | ) |
Class 529B | | (922 | ) | | (16,628 | ) | | (1,755 | ) | | (33,696 | ) |
Class 529C | | (3,193 | ) | | (62,728 | ) | | (8,388 | ) | | (161,119 | ) |
| | (37,463,974 | ) | | $(759,210,166 | ) | | (49,580,857 | ) | | $(997,200,180 | ) |
| Net change | | | | | | | | | | | | |
Class A | | 9,793,222 | | | $189,325,744 | | | 19,029,007 | | | $372,434,964 | |
Class B | | (949,746 | ) | | (18,470,273 | ) | | (427,019 | ) | | (9,750,257 | ) |
Class C | | 1,081,550 | | | 22,217,987 | | | 1,729,723 | | | 31,930,869 | |
Class I | | 15,870,725 | | | 317,809,785 | | | 25,967,986 | | | 522,771,646 | |
Class W | | 150,921 | | | 3,578,555 | | | 446,369 | | | 9,134,898 | |
Class R | | (362,993 | ) | | (8,273,643 | ) | | (210,989 | ) | | (5,127,899 | ) |
Class R1 | | 225,462 | | | 4,451,124 | | | 171,126 | | | 3,247,141 | |
Class R2 | | 426,004 | | | 8,172,695 | | | 205,281 | | | 3,975,665 | |
Class R3 | | 785,597 | | | 16,089,861 | | | 1,072,742 | | | 21,015,787 | |
Class R4 | | 695,706 | | | 14,130,339 | | | 2,483,185 | | | 49,720,934 | |
Class R5 | | 624,568 | | | 13,604,624 | | | 3,002,844 | | | 59,951,975 | |
Class 529A | | 17,159 | | | 329,772 | | | 20,687 | | | 399,333 | |
Class 529B | | 12,400 | | | 225,670 | | | 10,771 | | | 199,800 | |
Class 529C | | 4,793 | | | 86,450 | | | 13,227 | | | 242,937 | |
| | 28,375,368 | | | $ 563,278,690 | | | 53,514,940 | | | $1,060,147,793 | |
42
Notes to Financial Statements (unaudited) – continued
The fund is one of several mutual funds in which the MFS funds-of-funds may invest. The MFS funds-of-funds do not invest in the underlying MFS funds for the purpose of exercising management or control. At the end of the period, the MFS International Diversification Fund, MFS Growth Allocation Fund, MFS Moderate Allocation Fund, and MFS Aggressive Allocation Fund, were the owners of record of approximately 19%, 8%, 5%, and 3%, respectively, of the value of outstanding voting shares. In addition, the MFS Lifetime 2010 Fund, MFS Lifetime 2020 Fund, MFS Lifetime 2030 Fund, MFS Lifetime 2040 Fund, and MFS Conservative Allocation Fund were each the owners of record of less than 1% of the value of outstanding voting shares.
The fund and other funds managed by MFS participate in a $1 billion unsecured committed line of credit provided by a syndication of banks under a credit agreement. In addition, the fund and other funds managed by MFS have established uncommitted borrowing arrangements with certain banks. Borrowings may be made for temporary financing needs. Interest is charged to each fund, based on its borrowings, generally at a rate equal to the Federal Reserve funds rate plus 0.30%. In addition, a commitment fee, based on the average daily, unused portion of the committed line of credit, is allocated among the participating funds at the end of each calendar quarter. For the six months ended February 29, 2008, the fund’s commitment fee and interest expense were $11,835 and $10,678, respectively, and are included in miscellaneous expense on the Statement of Operations.
On October 23, 2007 the Board of Trustees approved, on or about April 18, 2008, the conversion of Class R shares and Class R2 shares into Class R3 shares. After the conversion, Class R3, Class R4, and Class R5 will be renamed Class R2, Class R3, and Class R4, respectively.
43
RESULTS OF SHAREHOLDER MEETING
(unaudited)
At a special meeting of shareholders of MFS Research International Fund, which was held on February 15, 2008, the following actions were taken:
Item 1: To approve an amendment to the current Master Distribution Plan adopted pursuant to Rule 12b-1 under the Investment Company Act of 1940, as amended, with respect to Class R1 Shares of the fund.
| | |
| | | Number of Dollars |
| For | | 4,933,926.29 |
| Against | | 7,225.15 |
| Abstain | | 595,906.29 |
44
BOARD REVIEW OF INVESTMENT ADVISORY AGREEMENT
A discussion regarding the Board’s most recent review and renewal of the Fund’s investment advisory agreement is available by clicking on the fund’s name under “Select a fund” on the MFS Web site (mfs.com).
PROXY VOTING POLICIES AND INFORMATION
A general description of the MFS funds’ proxy voting policies and procedures is available without charge, upon request, by calling 1-800-225-2606, by visiting the Proxy Voting section of mfs.com or by visiting the SEC’s Web site at http://www.sec.gov.
Information regarding how the fund voted proxies relating to portfolio securities during the most recent twelve-month period ended June 30 is available without charge by visiting the Proxy Voting section of mfs.com or by visiting the SEC’s Web site at http://www.sec.gov.
QUARTERLY PORTFOLIO DISCLOSURE
The fund will file a complete schedule of portfolio holdings with the Securities and Exchange Commission (the Commission) for the first and third quarters of each fiscal year on Form N-Q. The fund’s Form N-Q may be reviewed and copied at the:
Public Reference Room
Securities and Exchange Commission
100 F Street, NE, Room 1580
Washington, D.C. 20549
Information on the operation of the Public Reference Room may be obtained by calling the Commission at 1-800-SEC-0330. The fund’s Form N-Q is available on the EDGAR database on the Commission’s Internet Web site at http://www.sec.gov, and copies of this information may be obtained, upon payment of a duplicating fee, by electronic request at the following e-mail address: publicinfo@sec.gov or by writing the Public Reference Section at the above address.
A shareholder can also obtain the quarterly portfolio holdings report at mfs.com.
45


MFS® New Discovery Fund
The report is prepared for the general information of shareholders. It is authorized for distribution to prospective investors only when preceded or accompanied by a current prospectus.
NOT FDIC INSURED Ÿ MAY LOSE VALUE Ÿ
NO BANK OR CREDIT UNION GUARANTEE Ÿ NOT A DEPOSIT Ÿ
NOT INSURED BY ANY FEDERAL GOVERNMENT AGENCY OR
NCUA/NCUSIF
2/29/08
NDF-SEM

LETTER FROM THE CEO
Dear Shareholders:
Many of our MFS® fund shareholders have been justifiably concerned, as have most investors around the world, about the state of the global economy. As we enter 2008 we see the market volatility that began in the third quarter of 2007 has intensified.
We here at MFS, and those before us who guided the firm with the same disciplined investment process, have weathered many major economic disruptions over our eight-plus decades of managing clients’ investments. We have managed money through the Great Depression, 14 recessions, as well as numerous market crises caused by wars, political upheavals, and terrorist attacks. MFS remains in business because our investors believe in the integrity of our long-term investment strategy and its proven results.
Worries over market volatility are valid, and investors cannot always expect to see the kind of returns stocks have delivered in the bull markets of past years. Yet we believe our strategy of ADR — allocating across the major asset classes, diversifying within each class, and regularly rebalancing your portfolio to maintain your desired allocation — can help you pursue the highest investment returns while minimizing the effects of market fluctuations.
MFS is a world leader in domestic and global investing. Our team approach is research driven, globally integrated, and balanced. We have 176 investment management professionals located in the Americas, Europe, and Asia who focus on the fundamentals of each security and then integrate our sophisticated quantitative approach.* This collaborative process allows us to find opportunities in any market environment.
I personally would like to thank you for your continued business. We want you to be confident that we are constantly managing our fund offerings with you in mind, while adding new products that can help you to choose what fits your unique financial goals.
Respectfully,

Robert J. Manning
Chief Executive Officer and Chief Investment Officer
MFS Investment Management®
April 15, 2008
* as of 12/31/07
The opinions expressed in this letter are subject to change, may not be relied upon for investment advice, and no forecasts can be guaranteed.
1
PORTFOLIO COMPOSITION

| | |
| Top ten holdings | | |
| NICE Systems Ltd., ADR | | 2.5% |
| Corporate Executive Board Co. | | 2.3% |
| North American Energy Partners, Inc. | | 2.1% |
| MWI Veterinary Supply, Inc. | | 2.1% |
| Quanta Services, Inc. | | 2.0% |
| IDEXX Laboratories, Inc. | | 1.9% |
| Nuance Communications, Inc. | | 1.9% |
| Panera Bread Co. “A” | | 1.8% |
| Hittite Microwave Corp. | | 1.8% |
| Advanced Medical Optics, Inc. | | 1.7% |
| | |
| Equity sectors | | |
| Health Care | | 23.8% |
| Technology | | 19.3% |
| Leisure | | 11.4% |
| Industrial Goods & Services | | 8.9% |
| Retailing | | 8.1% |
| Special Products & Services | | 7.7% |
| Energy | | 6.3% |
| Basic Materials | | 3.8% |
| Autos & Housing | | 3.6% |
| Consumer Staples | | 3.2% |
| Financial Services | | 2.0% |
| Utilities & Communications | | 0.9% |
| Transportation | | 0.6% |
Percentages are based on net assets as of 2/29/08.
The portfolio is actively managed and current holdings may be different.
2
EXPENSE TABLE
Fund expenses borne by the shareholders during the period, September 1, 2007 through February 29, 2008
As a shareholder of the fund, you incur two types of costs: (1) transaction costs, including sales charges (loads) on certain purchase or redemption payments, and (2) ongoing costs, including management fees; distribution and service (12b-1) fees; and other fund expenses. This example is intended to help you understand your ongoing costs (in dollars) of investing in the fund and to compare these costs with the ongoing costs of investing in other mutual funds.
The example is based on an investment of $1,000 invested at the beginning of the period and held for the entire period September 1, 2007 through February 29, 2008.
Actual Expenses
The first line for each share class in the following table provides information about actual account values and actual expenses. You may use the information in this line, together with the amount you invested, to estimate the expenses that you paid over the period. Simply divide your account value by $1,000 (for example, an $8,600 account value divided by $1,000 = 8.6), then multiply the result by the number in the first line under the heading entitled “Expenses Paid During Period” to estimate the expenses you paid on your account during this period.
The actual expenses include the payment of a portion of the transfer-agent-related expenses of MFS funds that invest in the fund. For further information, please see the Notes to the Financial Statements.
Hypothetical Example for Comparison Purposes
The second line for each share class in the following table provides information about hypothetical account values and hypothetical expenses based on the fund’s actual expense ratio and an assumed rate of return of 5% per year before expenses, which is not the fund’s actual return. The hypothetical account values and expenses may not be used to estimate the actual ending account balance or expenses you paid for the period. You may use this information to compare the ongoing costs of investing in the fund and other funds. To do so, compare this 5% hypothetical example with the 5% hypothetical examples that appear in the shareholder reports of the other funds.
Please note that the expenses shown in the table are meant to highlight your ongoing costs only and do not reflect any transactional costs, such as sales charges (loads). Therefore, the second line for each share class in the table is useful in comparing ongoing costs only, and will not help you determine the relative total costs of owning different funds. In addition, if these transactional costs were included, your costs would have been higher.
3
Expense Table – continued
| | | | | | | | | | |
Share Class | | | | Annualized
Expense
Ratio | | Beginning
Account Value
9/01/07 | | Ending
Account Value
2/29/08 | | Expenses
Paid During
Period (p)
9/01/07-2/29/08 |
| A | | Actual | | 1.56% | | $1,000.00 | | $866.03 | | $7.24 |
| | Hypothetical (h) | | 1.56% | | $1,000.00 | | $1,017.11 | | $7.82 |
| B | | Actual | | 2.20% | | $1,000.00 | | $862.94 | | $10.19 |
| | Hypothetical (h) | | 2.20% | | $1,000.00 | | $1,013.92 | | $11.02 |
| C | | Actual | | 2.21% | | $1,000.00 | | $863.60 | | $10.24 |
| | Hypothetical (h) | | 2.21% | | $1,000.00 | | $1,013.87 | | $11.07 |
| I | | Actual | | 1.21% | | $1,000.00 | | $867.72 | | $5.62 |
| | Hypothetical (h) | | 1.21% | | $1,000.00 | | $1,018.85 | | $6.07 |
| R | | Actual | | 1.69% | | $1,000.00 | | $865.17 | | $7.84 |
| | Hypothetical (h) | | 1.69% | | $1,000.00 | | $1,016.46 | | $8.47 |
| R1 | | Actual | | 2.32% | | $1,000.00 | | $862.94 | | $10.75 |
| | Hypothetical (h) | | 2.32% | | $1,000.00 | | $1,013.33 | | $11.61 |
| R2 | | Actual | | 1.87% | | $1,000.00 | | $864.63 | | $8.67 |
| | Hypothetical (h) | | 1.87% | | $1,000.00 | | $1,015.56 | | $9.37 |
| R3 | | Actual | | 1.81% | | $1,000.00 | | $865.23 | | $8.39 |
| | Hypothetical (h) | | 1.81% | | $1,000.00 | | $1,015.86 | | $9.07 |
| R4 | | Actual | | 1.56% | | $1,000.00 | | $866.34 | | $7.24 |
| | Hypothetical (h) | | 1.56% | | $1,000.00 | | $1,017.11 | | $7.82 |
| R5 | | Actual | | 1.28% | | $1,000.00 | | $867.32 | | $5.94 |
| | Hypothetical (h) | | 1.28% | | $1,000.00 | | $1,018.50 | | $6.42 |
| 529A | | Actual | | 1.81% | | $1,000.00 | | $865.35 | | $8.39 |
| | Hypothetical (h) | | 1.81% | | $1,000.00 | | $1,015.86 | | $9.07 |
| 529B | | Actual | | 2.46% | | $1,000.00 | | $862.27 | | $11.39 |
| | Hypothetical (h) | | 2.46% | | $1,000.00 | | $1,012.63 | | $12.31 |
| 529C | | Actual | | 2.46% | | $1,000.00 | | $861.80 | | $11.39 |
| | Hypothetical (h) | | 2.46% | | $1,000.00 | | $1,012.63 | | $12.31 |
| (h) | 5% class return per year before expenses. |
| (p) | Expenses paid is equal to each class’ annualized expense ratio, as shown above, multiplied by the average account value over the period, multiplied by the number of days in the period, divided by the number of days in the year. Expenses paid do not include any applicable sales charges (loads). If these transaction costs had been included, your costs would have been higher. |
Effective January 1, 2008 the fund’s Class R2, Class R3, Class R4, and Class R5 retirement plan administration and service fee were terminated (as described in Note 3 of the Notes to the Financial Statements). Had this fee change been in effect throughout the entire six month period, the annualized expense ratios would have been 1.70%, 1.71%, 1.46% and 1.21% for Class R2, Class R3, Class R4 and Class R5 shares, respectively.
4
Expense Table – continued
The actual expenses paid during the period would have been approximately $7.91, $7.96, $6.80, and $5.64 and the hypothetical expenses paid during the period would have been approximately $8.55, $8.60, $7.34 and $6.09 for Class R2, Class R3, Class R4 and Class R5 shares, respectively.
Effective March 1, 2008 the fund’s Class R1 retirement plan administration and service fee were terminated and the Class R1 distribution fee was increased (as described in Note 3 of the Notes to the Financial Statements). Had these fee changes been in effect throughout the entire six month period, the annualized expense ratio would have been 2.22%. The actual expenses paid during the period would have been approximately $10.32 and the hypothetical expenses paid during the period would have been approximately $11.15.
Effective April 1, 2008 the fund’s Class 529A, 529B, and 529C shares program manager fee was reduced (as described in Note 3 of the Notes to Financial Statements). Had this fee change been in effect throughout the entire six month period, the annualized expense ratio would have been 1.66%, 2.31% and 2.31% for Class 529A, 529B and 529C shares, respectively. The actual expenses paid during the period would have been approximately $7.73, $10.73 and $10.73 and the hypothetical expenses paid during the period would have been approximately $8.35, $11.60 and $11.60 for Class 529A, Class 529B and Class 529C shares, respectively.
5
PORTFOLIO OF INVESTMENTS
2/29/08 (unaudited)
The Portfolio of Investments is a complete list of all securities owned by your fund. It is categorized by broad-based asset classes.
| | | | | |
| Common Stocks - 99.6% | | | | | |
| Issuer | | Shares/Par | | Value ($) |
| | | | | |
| Airlines - 0.6% | | | | | |
| Allegiant Travel Co. (a) | | 118,180 | | $ | 3,215,672 |
| | |
| Alcoholic Beverages - 0.2% | | | | | |
| Castle Brands, Inc. (a)(l) | | 176,180 | | $ | 315,362 |
| Castle Brands, Inc. (a)(z) | | 277,200 | | | 496,188 |
| | | | | |
| | | | | $ | 811,550 |
| Apparel Manufacturers - 0.9% | | | | | |
| Quiksilver, Inc. (a) | | 552,190 | | $ | 4,969,710 |
| | |
| Automotive - 0.8% | | | | | |
| LKQ Corp. (a) | | 195,680 | | $ | 4,156,243 |
| | |
| Biotechnology - 1.6% | | | | | |
| Millipore Corp. (a) | | 98,670 | | $ | 6,897,033 |
| Nanosphere, Inc. (a) | | 157,410 | | | 1,456,043 |
| | | | | |
| | | | | $ | 8,353,076 |
| Brokerage & Asset Managers - 0.9% | | | | | |
| HFF, Inc., “A” (a)(l) | | 323,660 | | $ | 2,369,191 |
| KBW, Inc. (a)(l) | | 64,300 | | | 1,380,521 |
| Thomas Weisel Partners Group (a) | | 154,330 | | | 1,358,104 |
| | | | | |
| | | | | $ | 5,107,816 |
| Business Services - 6.2% | | | | | |
| Ata, Inc., ADR (a) | | 150,870 | | $ | 1,564,522 |
| Concur Technologies, Inc. (a)(l) | | 78,940 | | | 2,308,206 |
| Constant Contact, Inc. (a)(l) | | 151,050 | | | 2,688,690 |
| Corporate Executive Board Co. (l) | | 300,730 | | | 12,212,645 |
| CoStar Group, Inc. (a)(l) | | 155,680 | | | 6,463,834 |
| Enernoc, Inc. (a)(l) | | 75,200 | | | 1,111,456 |
| iGate Corp. (a)(l) | | 427,928 | | | 3,389,190 |
| Syntel, Inc. (l) | | 129,620 | | | 3,529,553 |
| | | | | |
| | | | | $ | 33,268,096 |
| Chemicals - 0.7% | | | | | |
| Nalco Holding Co. | | 177,880 | | $ | 3,842,208 |
6
Portfolio of Investments (unaudited) – continued
| | | | | |
| Issuer | | Shares/Par | | Value ($) |
| | | | | |
| Common Stocks - continued | | | | | |
| Computer Software - 2.9% | | | | | |
| ACI Worldwide, Inc. (a)(l) | | 480,825 | | $ | 8,491,370 |
| CommVault Systems, Inc. (a) | | 260,850 | | | 3,651,900 |
| Guidance Software, Inc. (a) | | 234,485 | | | 2,527,748 |
| Netsuite, Inc. (a) | | 57,100 | | | 1,200,242 |
| | | | | |
| | | | | $ | 15,871,260 |
| Computer Software - Systems - 0.9% | | | | | |
| Deltek, Inc. (a) | | 216,220 | | $ | 2,778,427 |
| PROS Holdings, Inc. (a) | | 175,960 | | | 2,275,163 |
| | | | | |
| | | | | $ | 5,053,590 |
| Construction - 2.8% | | | | | |
| Dayton Superior Corp. (a)(l) | | 392,240 | | $ | 1,529,736 |
| M.D.C. Holdings, Inc. | | 184,940 | | | 7,745,287 |
| Pulte Homes, Inc. | | 424,590 | | | 5,748,949 |
| | | | | |
| | | | | $ | 15,023,972 |
| Consumer Goods & Services - 3.1% | | | | | |
| Central Garden & Pet Co., “A” (a)(l) | | 1,370,270 | | $ | 6,029,188 |
| Knot, Inc. (a)(l) | | 292,350 | | | 3,376,643 |
| New Oriental Education & Technology Group, Inc., ADR (a)(l) | | 76,630 | | | 4,777,881 |
| Physicians Formula Holdings, Inc. (a) | | 341,750 | | | 2,692,990 |
| | | | | |
| | | | | $ | 16,876,702 |
| Electrical Equipment - 0.5% | | | | | |
| Itron, Inc. (a) | | 30,600 | | $ | 2,917,098 |
| | |
| Electronics - 6.3% | | | | | |
| ARM Holdings PLC | | 4,946,210 | | $ | 8,823,518 |
| ATMI, Inc. (a) | | 147,500 | | | 4,032,650 |
| Hittite Microwave Corp. (a) | | 289,610 | | | 9,588,987 |
| Intersil Corp., “A” | | 274,360 | | | 6,384,357 |
| MathStar, Inc. (a) | | 437,040 | | | 249,113 |
| PLX Technology, Inc. (a)(l) | | 242,750 | | | 1,568,165 |
| Silicon Laboratories, Inc. (a) | | 101,420 | | | 3,138,949 |
| | | | | |
| | | | | $ | 33,785,739 |
| Energy - Independent - 3.2% | | | | | |
| EXCO Resources, Inc. (a) | | 408,790 | | $ | 7,092,507 |
| Goodrich Petroleum Corp. (a)(l) | | 207,550 | | | 5,008,182 |
| Kodiak Oil & Gas Corp. (a) | | 956,040 | | | 2,112,848 |
| Sandridge Energy, Inc. (a) | | 73,710 | | | 2,774,444 |
| | | | | |
| | | | | $ | 16,987,981 |
7
Portfolio of Investments (unaudited) – continued
| | | | | |
| Issuer | | Shares/Par | | Value ($) |
| | | | | |
| Common Stocks - continued | | | | | |
| Engineering - Construction - 4.1% | | | | | |
| North American Energy Partners, Inc. (a) | | 695,160 | | $ | 11,525,753 |
| Quanta Services, Inc. (a)(l) | | 446,569 | | | 10,664,068 |
| | | | | |
| | | | | $ | 22,189,821 |
| Food & Beverages - 1.4% | | | | | |
| Diamond Foods, Inc. | | 248,249 | | $ | 4,071,284 |
| Hain Celestial Group, Inc. (a) | | 126,220 | | | 3,407,940 |
| | | | | |
| | | | | $ | 7,479,224 |
| Food & Drug Stores - 0.4% | | | | | |
| Susser Holdings Corp. (a) | | 82,660 | | $ | 2,002,025 |
| | |
| Forest & Paper Products - 1.2% | | | | | |
| Universal Forest Products, Inc. (l) | | 236,770 | | $ | 6,577,471 |
| | |
| Gaming & Lodging - 2.2% | | | | | |
| Pinnacle Entertainment, Inc. (a) | | 274,700 | | $ | 4,301,802 |
| WMS Industries, Inc. (a)(l) | | 205,530 | | | 7,803,974 |
| | | | | |
| | | | | $ | 12,105,776 |
| General Merchandise - 2.7% | | | | | |
| 99 Cents Only Stores (a)(l) | | 682,770 | | $ | 6,342,933 |
| Stage Stores, Inc. | | 630,615 | | | 7,983,586 |
| | | | | |
| | | | | $ | 14,326,519 |
| Internet - 2.7% | | | | | |
| Dealertrack Holdings, Inc. (a)(l) | | 290,650 | | $ | 5,949,606 |
| Omniture, Inc. (a) | | 128,570 | | | 2,954,539 |
| TechTarget, Inc. (a) | | 469,230 | | | 5,452,453 |
| | | | | |
| | | | | $ | 14,356,598 |
| Leisure & Toys - 1.1% | | | | | |
| THQ, Inc. (a)(l) | | 306,324 | | $ | 5,731,322 |
| | |
| Machinery & Tools - 3.4% | | | | | |
| Bucyrus International, Inc., “A” | | 51,170 | | $ | 5,110,860 |
| Polypore International, Inc. (a) | | 516,260 | | | 9,277,192 |
| Ritchie Bros. Auctioneers, Inc. | | 55,100 | | | 3,945,711 |
| | | | | |
| | | | | $ | 18,333,763 |
| Medical & Health Technology & Services - 6.7% | | | | | |
| Animal Health International, Inc. (a) | | 191,600 | | $ | 2,019,464 |
| Healthcare Services Group, Inc. (l) | | 288,910 | | | 5,714,640 |
8
Portfolio of Investments (unaudited) – continued
| | | | | |
| Issuer | | Shares/Par | | Value ($) |
| | | | | |
| Common Stocks - continued | | | | | |
| Medical & Health Technology & Services - continued | | | | | |
| IDEXX Laboratories, Inc. (a) | | 182,990 | | $ | 10,150,455 |
| Medassets, Inc. (a) | | 215,640 | | | 3,916,022 |
| MWI Veterinary Supply, Inc. (a) | | 318,640 | | | 11,098,231 |
| VCA Antech, Inc. (a) | | 103,840 | | | 3,334,302 |
| | | | | |
| | | | | $ | 36,233,114 |
| Medical Equipment - 15.1% | | | | | |
| ABIOMED, Inc. (a)(l) | | 343,620 | | $ | 4,913,766 |
| Advanced Medical Optics, Inc. (a)(l) | | 408,660 | | | 9,350,141 |
| Align Technology, Inc. (a)(l) | | 314,170 | | | 3,880,000 |
| AngioDynamics, Inc. (a) | | 256,003 | | | 4,244,530 |
| Aspect Medical Systems, Inc. (a)(l) | | 567,243 | | | 7,073,520 |
| AtriCure, Inc. (a) | | 212,740 | | | 2,531,606 |
| Conceptus, Inc. (a)(l) | | 529,150 | | | 9,027,299 |
| Cooper Cos., Inc. | | 151,030 | | | 5,163,716 |
| Dexcom, Inc. (a)(l) | | 284,700 | | | 2,098,239 |
| Immucor, Inc. (a) | | 145,210 | | | 4,327,258 |
| Insulet Corp. (a)(l) | | 179,420 | | | 3,073,465 |
| Mindray Medical International Ltd., ADR | | 110,180 | | | 4,043,606 |
| NxStage Medical, Inc. (a)(l) | | 628,080 | | | 3,718,234 |
| ResMed, Inc. (a)(l) | | 169,530 | | | 6,864,270 |
| Somanetics Corp. (a) | | 133,528 | | | 3,710,743 |
| Thoratec Corp. (a)(l) | | 510,440 | | | 7,406,484 |
| | | | | |
| | | | | $ | 81,426,877 |
| Metals & Mining - 1.9% | | | | | |
| Cameco Corp. | | 110,600 | | $ | 4,341,050 |
| Century Aluminum Co. (a)(l) | | 88,340 | | | 5,841,924 |
| | | | | |
| | | | | $ | 10,182,974 |
| Network & Telecom - 3.8% | | | | | |
| Cavium Networks, Inc. (a) | | 131,470 | | $ | 1,869,503 |
| NICE Systems Ltd., ADR (a) | | 416,938 | | | 13,458,759 |
| Polycom, Inc. (a) | | 184,490 | | | 4,021,882 |
| Sonus Networks, Inc. (a)(l) | | 315,660 | | | 1,047,991 |
| | | | | |
| | | | | $ | 20,398,135 |
| Oil Services - 3.1% | | | | | |
| Dresser-Rand Group, Inc. (a) | | 162,330 | | $ | 5,530,583 |
| Exterran Holdings, Inc. (a)(l) | | 121,950 | | | 8,493,818 |
| Natural Gas Services Group, Inc. (a) | | 131,550 | | | 2,946,720 |
| | | | | |
| | | | | $ | 16,971,121 |
9
Portfolio of Investments (unaudited) – continued
| | | | | |
| Issuer | | Shares/Par | | Value ($) |
| | | | | |
| Common Stocks - continued | | | | | |
| Other Banks & Diversified Financials - 1.1% | | | | | |
| New York Community Bancorp, Inc. (l) | | 209,680 | | $ | 3,424,074 |
| Signature Bank (a) | | 94,450 | | | 2,502,925 |
| | | | | |
| | | | | $ | 5,926,999 |
| Personal Computers & Peripherals - 2.7% | | | | | |
| Mellanox Technologies Ltd. (a) | | 307,240 | | $ | 4,700,772 |
| Nuance Communications, Inc. (a) | | 610,989 | | | 10,050,769 |
| | | | | |
| | | | | $ | 14,751,541 |
| Pharmaceuticals - 0.4% | | | | | |
| Cadence Pharmaceuticals, Inc. (a)(l) | | 160,650 | | $ | 841,806 |
| Synta Pharmaceuticals Corp. (a)(l) | | 130,410 | | | 1,155,433 |
| | | | | |
| | | | | $ | 1,997,239 |
| Pollution Control - 0.9% | | | | | |
| Team, Inc. (a) | | 156,790 | | $ | 4,780,527 |
| | |
| Printing & Publishing - 2.2% | | | | | |
| Innerworkings, Inc. (a)(l) | | 411,920 | | $ | 5,672,138 |
| Morningstar, Inc. (a)(l) | | 38,790 | | | 2,528,720 |
| MSCI, Inc., “A” (a) | | 121,250 | | | 3,604,763 |
| | | | | |
| | | | | $ | 11,805,621 |
| Restaurants - 5.9% | | | | | |
| McCormick & Schmick’s Seafood Restaurant, Inc. (a)(l) | | 466,130 | | $ | 5,052,849 |
| Panera Bread Co., “A” (a)(l) | | 257,000 | | | 9,604,090 |
| Peet’s Coffee & Tea, Inc. (a)(l) | | 128,260 | | | 3,002,567 |
| Red Robin Gourmet Burgers, Inc. (a)(l) | | 275,350 | | | 9,177,416 |
| Texas Roadhouse, Inc., “A” (a)(l) | | 550,430 | | | 5,118,999 |
| | | | | |
| | | | | $ | 31,955,921 |
| Specialty Stores - 4.1% | | | | | |
| Citi Trends, Inc. (a)(l) | | 590,480 | | $ | 8,567,865 |
| Dick’s Sporting Goods, Inc. (a)(l) | | 48,380 | | | 1,334,320 |
| Lumber Liquidators, Inc. (a) | | 504,640 | | | 4,617,456 |
| Monro Muffler Brake, Inc. | | 235,405 | | | 3,943,034 |
| Pier 1 Imports, Inc. (a) | | 234,500 | | | 1,228,780 |
| Zumiez, Inc. (a)(l) | | 145,030 | | | 2,549,627 |
| | | | | |
| | | | | $ | 22,241,082 |
| Telephone Services - 0.9% | | | | | |
| Global Crossing Ltd. (a)(l) | | 256,160 | | $ | 4,946,450 |
| Total Common Stocks (Identified Cost, $640,257,444) | | | | $ | 536,960,833 |
10
Portfolio of Investments (unaudited) – continued
| | | | | | | | | | |
| Warrants - 0.0% | | | | | | | | | | |
| | | | | | | | | | |
| Issuer | | Strike Price | | First Exercise | | Shares/Par | | Value ($) |
| Alcoholic Beverages - 0.0% | | | | | | | | | | |
Castle Brands, Inc.
(1 share for 1 warrant)
(Identified Cost, $155,725) (a)(z) | | $ | 6.57 | | 5/08/07 | | 110,880 | | $ | 754 |
| | |
| Collateral for Securities Loaned - 23.6% | | | | | |
Navigator Securities Lending Prime Portfolio,
at Cost and Net Asset Value | | | | 127,299,217 | | $ | 127,299,217 |
| Total Investments (Identified Cost, $767,712,386) (k) | | | | $ | 664,260,804 |
| | | |
| Other Assets, Less Liabilities - (23.2)% | | | | | | | (125,304,235) |
| Net Assets - 100.0% | | | | | | | | | $ | 538,956,569 |
| (a) | Non-income producing security. |
| (k) | As of February 29, 2008, the fund had three securities that were fair valued, aggregating $9,320,460 and 1.40% of market value, in accordance with the policies adopted by the Board of Trustees. |
| (l) | All or a portion of this security is on loan. |
| (z) | Restricted securities are not registered under the Securities Act of 1933 and are subject to legal restrictions on resale. These securities generally may be resold in transactions exempt from registration or to the public if the securities are subsequently registered. Disposal of these securities may involve time-consuming negotiations and prompt sale at an acceptable price may be difficult. The fund holds the following restricted securities: |
| | | | | | |
| Restricted Securities | | Acquisition
Date | | Acquisition
Cost | | Current
Market
Value |
| Castle Brands, Inc. | | 4/19/07 | | $1,499,159 | | $496,188 |
| Castle Brands, Inc. (warrants) | | 4/18/07 | | 155,725 | | 754 |
| Total Restricted Securities | | | | | | $496,942 |
| % of Net Assets | | | | | | 0.1% |
The following abbreviations are used in this report and are defined:
| ADR | | American Depository Receipt |
See Notes to Financial Statements
11
Financial Statements
STATEMENT OF ASSETS AND LIABILITIES
At 2/29/08 (unaudited)
This statement represents your fund’s balance sheet, which details the assets and liabilities comprising the total value of the fund.
| | | | | |
| Assets | | | | | |
| Investments, at value, including $123,988,127 of securities on loan (identified cost, $767,712,386) | | $664,260,804 | | | |
| Receivable for investments sold | | 11,396,355 | | | |
| Receivable for fund shares sold | | 216,926 | | | |
| Interest and dividends receivable | | 165,792 | | | |
| Other assets | | 8,438 | | | |
| Total assets | | | | | $676,048,315 |
| Liabilities | | | | | |
| Payable to custodian | | $3,552,321 | | | |
| Payable for investments purchased | | 4,212,824 | | | |
| Payable for fund shares reacquired | | 1,403,128 | | | |
| Collateral for securities loaned, at value | | 127,299,217 | | | |
| Payable to affiliates | | | | | |
Management fee | | 24,456 | | | |
Shareholder servicing costs | | 436,575 | | | |
Distribution and service fees | | 11,074 | | | |
Administrative services fee | | 433 | | | |
Program manager fees | | 29 | | | |
Retirement plan administration and services fees | | 91 | | | |
| Payable for independent trustees’ compensation | | 13,078 | | | |
| Accrued expenses and other liabilities | | 138,520 | | | |
| Total liabilities | | | | | $137,091,746 |
| Net assets | | | | | $538,956,569 |
| Net assets consist of: | | | | | |
| Paid-in capital | | $652,158,744 | | | |
| Unrealized appreciation (depreciation) on investments and translation of assets and liabilities in foreign currencies | | (103,451,582 | ) | | |
| Accumulated net realized gain (loss) on investments and foreign currency transactions | | (6,542,981 | ) | | |
| Accumulated net investment loss | | (3,207,612 | ) | | |
| Net assets | | | | | $538,956,569 |
| Shares of beneficial interest outstanding | | | | | 31,524,727 |
12
Statement of Assets and Liabilities (unaudited) – continued
| | | | |
| Class A shares | | | | |
Net assets | | $288,092,129 | | |
Shares outstanding | | 16,794,442 | | |
Net asset value per share | | | | $17.15 |
Offering price per share (100 / 94.25 × net asset value per share) | | | | $18.20 |
| Class B shares | | | | |
Net assets | | $49,496,398 | | |
Shares outstanding | | 3,056,532 | | |
Net asset value and offering price per share | | | | $16.19 |
| Class C shares | | | | |
Net assets | | $31,524,221 | | |
Shares outstanding | | 1,943,967 | | |
Net asset value and offering price per share | | | | $16.22 |
| Class I shares | | | | |
Net assets | | $88,706,342 | | |
Shares outstanding | | 4,984,679 | | |
Net asset value, offering price, and redemption price per share | | | | $17.80 |
| Class R shares | | | | |
Net assets | | $2,060,013 | | |
Shares outstanding | | 121,005 | | |
Net asset value, offering price, and redemption price per share | | | | $17.02 |
| Class R1 shares | | | | |
Net assets | | $4,564,062 | | |
Shares outstanding | | 282,907 | | |
Net asset value, offering price, and redemption price per share | | | | $16.13 |
| Class R2 shares | | | | |
Net assets | | $2,190,533 | | |
Shares outstanding | | 134,402 | | |
Net asset value, offering price, and redemption price per share | | | | $16.30 |
| Class R3 shares | | | | |
Net assets | | $11,276,481 | | |
Shares outstanding | | 667,380 | | |
Net asset value, offering price, and redemption price per share | | | | $16.90 |
| Class R4 shares | | | | |
Net assets | | $4,587,448 | | |
Shares outstanding | | 267,861 | | |
Net asset value, offering price, and redemption price per share | | | | $17.13 |
13
Statement of Assets and Liabilities (unaudited) – continued
| | | | |
| Class R5 shares | | | | |
Net assets | | $54,450,203 | | |
Shares outstanding | | 3,151,119 | | |
Net asset value, offering price, and redemption price per share | | | | $17.28 |
| Class 529A shares | | | | |
Net assets | | $1,527,555 | | |
Shares outstanding | | 90,304 | | |
Net asset value per share | | | | $16.92 |
Offering price per share (100 / 94.25 × net asset value per share) | | | | $17.95 |
| Class 529B shares | | | | |
Net assets | | $211,463 | | |
Shares outstanding | | 13,245 | | |
Net asset value and offering price per share | | | | $15.97 |
| Class 529C shares | | | | |
Net assets | | $269,721 | | |
Shares outstanding | | 16,884 | | |
Net asset value and offering price per share | | | | $15.97 |
On sales of $50,000 or more, the offering prices of Class A and Class 529A shares are reduced. A contingent deferred sales charge may be imposed on redemptions of Class A, Class B, Class C, Class 529B, and Class 529C shares.
See Notes to Financial Statements
14
Financial Statements
STATEMENT OF OPERATIONS
Six months ended 2/29/08 (unaudited)
This statement describes how much your fund earned in investment income and accrued in expenses. It also describes any gains and/or losses generated by fund operations.
| | | | | | |
| Net investment loss | | | | | | |
| Income | | | | | | |
Dividends | | $1,014,270 | | | | |
Income on securities loaned | | 889,521 | | | | |
Interest | | 54,456 | | | | |
Foreign taxes withheld | | (1,408 | ) | | | |
| Total investment income | | | | | $1,956,839 | |
| Expenses | | | | | | |
Management fee | | $2,912,672 | | | | |
Distribution and service fees | | 1,226,431 | | | | |
Program manager fees | | 2,756 | | | | |
Shareholder servicing costs | | 946,775 | | | | |
Administrative services fee | | 50,927 | | | | |
Retirement plan administration and services fees | | 39,151 | | | | |
Independent trustees’ compensation | | 10,193 | | | | |
Custodian fee | | 120,725 | | | | |
Shareholder communications | | 53,891 | | | | |
Auditing fees | | 23,414 | | | | |
Legal fees | | 8,029 | | | | |
Miscellaneous | | 93,599 | | | | |
| Total expenses | | | | | $5,488,563 | |
Fees paid indirectly | | (9,715 | ) | | | |
Reduction of expenses by investment adviser | | (325,103 | ) | | | |
| Net expenses | | | | | $5,153,745 | |
| Net investment loss | | | | | $(3,196,906 | ) |
| Realized and unrealized gain (loss) on investments | | | | | | |
| Realized gain (loss) (identified cost basis) | | | | | | |
Investment transactions | | $30,506,343 | | | | |
Foreign currency transactions | | 217 | | | | |
Net realized gain (loss) on investments
and foreign currency transactions | | | | | $30,506,560 | |
| Change in unrealized appreciation (depreciation) | | | | | | |
Investments | | $(114,360,128 | ) | | | |
Translation of assets and liabilities in foreign currencies | | (81 | ) | | | |
Net unrealized gain (loss) on investments
and foreign currency translation | | | | | $(114,360,209 | ) |
Net realized and unrealized gain (loss) on investments
and foreign currency | | | | | $(83,853,649 | ) |
| Change in net assets from operations | | | | | $(87,050,555 | ) |
See Notes to Financial Statements
15
Financial Statements
STATEMENTS OF CHANGES IN NET ASSETS
These statements describe the increases and/or decreases in net assets resulting from operations, any distributions, and any shareholder transactions.
| | | | | | |
| | | Six months ended 2/29/08 | | | Year ended 8/31/07 | |
| Change in net assets | | (unaudited) | | | | |
| From operations | | | | | | |
| Net investment loss | | $(3,196,906 | ) | | $(8,906,845 | ) |
Net realized gain (loss) on investments and
foreign currency transactions | | 30,506,560 | | | 159,979,677 | |
Net unrealized gain (loss) on investments and
foreign currency translation | | (114,360,209 | ) | | 3,449,318 | |
| Change in net assets from operations | | $(87,050,555 | ) | | $154,522,150 | |
| Distributions declared to shareholders | | | | | | |
| From net realized gain on investments | | | | | | |
Class A | | $(11,841,588 | ) | | $— | |
Class B | | (2,389,728 | ) | | — | |
Class C | | (1,311,756 | ) | | — | |
Class I | | (3,175,368 | ) | | — | |
Class R | | (112,238 | ) | | — | |
Class R1 | | (150,717 | ) | | — | |
Class R2 | | (67,592 | ) | | — | |
Class R3 | | (385,068 | ) | | — | |
Class R4 | | (171,384 | ) | | — | |
Class R5 | | (2,093,044 | ) | | — | |
Class 529A | | (58,223 | ) | | — | |
Class 529B | | (8,357 | ) | | — | |
Class 529C | | (11,443 | ) | | — | |
| Total distributions declared to shareholders | | $(21,776,506 | ) | | $— | |
| Change in net assets from fund share transactions | | $(77,523,174 | ) | | $(219,456,690 | ) |
| Redemption fees | | $— | | | $1,647 | |
| Total change in net assets | | $(186,350,235 | ) | | $(64,932,893 | ) |
| Net assets | | | | | | |
| At beginning of period | | 725,306,804 | | | 790,239,697 | |
At end of period (including accumulated net investment
loss of $3,207,612 and $10,706, respectively) | | $538,956,569 | | | $725,306,804 | |
See Notes to Financial Statements
16
Financial Statements
FINANCIAL HIGHLIGHTS
The financial highlights table is intended to help you understand the fund’s financial performance for the semiannual period and the past 5 fiscal years (or life of a particular share class, if shorter). Certain information reflects financial results for a single fund share. The total returns in the table represent the rate by which an investor would have earned (or lost) on an investment in the fund share class (assuming reinvestment of all distributions) held for the entire period.
| | | | | | | | | | | | | | | | | | |
| | | Six months
ended
2/29/08 (unaudited) | | | Years ended 8/31 | |
| Class A | | | 2007 | | | 2006 | | | 2005 | | | 2004 | | | 2003 | |
| | | | | | | | | | | | | | | | | |
Net asset value, beginning of
period | | $20.48 | | | $16.96 | | | $16.85 | | | $13.53 | | | $14.57 | | | $11.99 | |
Income (loss) from investment
operations | | | | | | | | | | | | | |
Net investment loss (d) | | $(0.09 | ) | | $(0.16 | ) | | $(0.20 | ) | | $(0.16 | ) | | $(0.18 | ) | | $(0.13 | ) |
Net realized and unrealized
gain (loss) on investments
and foreign currency | | (2.58 | ) | | 3.68 | | | 0.31 | | | 3.48 | | | (0.86 | ) | | 2.71 | |
Total from investment
operations | | $(2.67 | ) | | $3.52 | | | $0.11 | | | $3.32 | | | $(1.04 | ) | | $2.58 | |
Less distributions declared to
shareholders | | | | | | | | | | | | | |
From net realized gain on
investments | | $(0.66 | ) | | $— | | | $— | | | $— | | | $— | | | $— | |
Redemption fees added to
paid-in capital (d) | | $— | | | $0.00 | (w) | | $0.00 | (w) | | $0.00 | (w) | | $0.00 | (w) | | $— | |
| Net asset value, end of period | | $17.15 | | | $20.48 | | | $16.96 | | | $16.85 | | | $13.53 | | | $14.57 | |
| Total return (%) (r)(s)(t) | | (13.40 | )(n) | | 20.75 | | | 0.65 | | | 24.54 | | | (7.14 | )(b) | | 21.52 | |
Ratios (%) (to average net assets)
and Supplemental data: | | | | | | | | | | | | | | | | |
Expenses before expense
reductions (f) | | 1.66 | (a) | | 1.57 | | | 1.57 | | | 1.57 | | | 1.51 | | | 1.58 | |
Expenses after expense
reductions (f) | | 1.56 | (a) | | 1.47 | | | 1.47 | | | 1.47 | | | 1.51 | | | N/A | |
| Net investment loss | | (0.95 | )(a) | | (1.04 | ) | | (1.12 | ) | | (1.05 | ) | | (1.20 | ) | | (1.11 | ) |
| Portfolio turnover | | 44 | | | 94 | | | 99 | | | 112 | | | 122 | | | 104 | |
Net assets at end of period
(000 Omitted) | | $288,092 | | | $395,993 | | | $409,471 | | | $603,396 | | | $824,708 | | | $1,004,473 | |
See Notes to Financial Statements
17
Financial Highlights – continued
| | | | | | | | | | | | | | | | | | |
| | | Six months
ended
2/29/08 (unaudited) | | | Years ended 8/31 | |
| Class B | | | 2007 | | | 2006 | | | 2005 | | | 2004 | | | 2003 | |
| | | | | | | | | | | | | | | | | |
Net asset value, beginning of
period | | $19.44 | | | $16.20 | | | $16.20 | | | $13.09 | | | $14.19 | | | $11.75 | |
Income (loss) from investment
operations | | | | | | | | | | | | | |
Net investment loss (d) | | $(0.15 | ) | | $(0.25 | ) | | $(0.30 | ) | | $(0.25 | ) | | $(0.27 | ) | | $(0.21 | ) |
Net realized and unrealized
gain (loss) on investments
and foreign currency | | (2.44 | ) | | 3.49 | | | 0.30 | | | 3.36 | | | (0.83 | ) | | 2.65 | |
Total from investment
operations | | $(2.59 | ) | | $3.24 | | | $— | | | $3.11 | | | $(1.10 | ) | | $2.44 | |
Less distributions declared to
shareholders | | | | | | | | | | | | | |
From net realized gain on
investments | | $(0.66 | ) | | $— | | | $— | | | $— | | | $— | | | $— | |
Redemption fees added to
paid-in capital (d) | | $— | | | $0.00 | (w) | | $0.00 | (w) | | $0.00 | (w) | | $0.00 | (w) | | $— | |
| Net asset value, end of period | | $16.19 | | | $19.44 | | | $16.20 | | | $16.20 | | | $13.09 | | | $14.19 | |
| Total return (%) (r)(s)(t) | | (13.71 | )(n) | | 20.00 | | | 0.00 | | | 23.76 | | | (7.75 | )(b) | | 20.77 | |
Ratios (%) (to average net assets)
and Supplemental data: | | | | | | | | | | | | | |
Expenses before expense
reductions (f) | | 2.30 | (a) | | 2.22 | | | 2.22 | | | 2.22 | | | 2.15 | | | 2.23 | |
Expenses after expense
reductions (f) | | 2.20 | (a) | | 2.12 | | | 2.12 | | | 2.12 | | | 2.15 | | | N/A | |
| Net investment loss | | (1.60 | )(a) | | (1.69 | ) | | (1.77 | ) | | (1.70 | ) | | (1.84 | ) | | (1.76 | ) |
| Portfolio turnover | | 44 | | | 94 | | | 99 | | | 112 | | | 122 | | | 104 | |
Net assets at end of period
(000 Omitted) | | $49,496 | | | $91,922 | | | $132,519 | | | $203,722 | | | $231,653 | | | $271,580 | |
See Notes to Financial Statements
18
Financial Highlights – continued
| | | | | | | | | | | | | | | | | | |
| | | Six months
ended
2/29/08 (unaudited) | | | Years ended 8/31 | |
| Class C | | | 2007 | | | 2006 | | | 2005 | | | 2004 | | | 2003 | |
| | | | | | | | | | | | | | | | | |
Net asset value, beginning of
period | | $19.46 | | | $16.22 | | | $16.22 | | | $13.10 | | | $14.21 | | | $11.77 | |
Income (loss) from investment
operations | | | | | | | | | | |
Net investment loss (d) | | $(0.15 | ) | | $(0.25 | ) | | $(0.30 | ) | | $(0.25 | ) | | $(0.27 | ) | | $(0.21 | ) |
Net realized and unrealized
gain (loss) on investments
and foreign currency | | (2.43 | ) | | 3.49 | | | 0.30 | | | 3.37 | | | (0.84 | ) | | 2.65 | |
Total from investment
operations | | $(2.58 | ) | | $3.24 | | | $— | | | $3.12 | | | $(1.11 | ) | | $2.44 | |
Less distributions declared to
shareholders | | | | | | | | | | | | | |
From net realized gain on
investments | | $(0.66 | ) | | $— | | | $— | | | $— | | | $— | | | $— | |
Redemption fees added to
paid-in capital (d) | | $— | | | $0.00 | (w) | | $0.00 | (w) | | $0.00 | (w) | | $0.00 | (w) | | $— | |
| Net asset value, end of period | | $16.22 | | | $19.46 | | | $16.22 | | | $16.22 | | | $13.10 | | | $14.21 | |
| Total return (%) (r)(s)(t) | | (13.64 | )(n) | | 19.98 | | | 0.00 | | | 23.82 | | | (7.81 | )(b) | | 20.73 | |
Ratios (%) (to average net assets)
and Supplemental data: | | | | | | | | | | | | | | | | |
Expenses before expense
reductions (f) | | 2.31 | (a) | | 2.22 | | | 2.22 | | | 2.22 | | | 2.15 | | | 2.23 | |
Expenses after expense
reductions (f) | | 2.21 | (a) | | 2.12 | | | 2.12 | | | 2.12 | | | 2.15 | | | N/A | |
| Net investment loss | | (1.60 | )(a) | | (1.69 | ) | | (1.77 | ) | | (1.70 | ) | | (1.84 | ) | | (1.76 | ) |
| Portfolio turnover | | 44 | | | 94 | | | 99 | | | 112 | | | 122 | | | 104 | |
Net assets at end of period
(000 Omitted) | | $31,524 | | | $42,296 | | | $47,293 | | | $58,454 | | | $67,102 | | | $84,391 | |
See Notes to Financial Statements
19
Financial Highlights – continued
| | | | | | | | | | | | | | | | | | |
| | | Six months
ended
2/29/08 (unaudited) | | | Years ended 8/31 | |
| Class I | | | 2007 | | | 2006 | | | 2005 | | | 2004 | | | 2003 | |
| | | | | | | | | | | | | | | | | |
Net asset value, beginning of
period | | $21.19 | | | $17.48 | | | $17.31 | | | $13.85 | | | $14.86 | | | $12.19 | |
Income (loss) from investment
operations | | | | | | | | | | |
Net investment loss (d) | | $(0.06 | ) | | $(0.11 | ) | | $(0.14 | ) | | $(0.11 | ) | | $(0.13 | ) | | $(0.09 | ) |
Net realized and unrealized
gain (loss) on investments
and foreign currency | | (2.67 | ) | | 3.82 | | | 0.31 | | | 3.57 | | | (0.88 | ) | | 2.76 | |
Total from investment
operations | | $(2.73 | ) | | $3.71 | | | $0.17 | | | $3.46 | | | $(1.01 | ) | | $2.67 | |
Less distributions declared to
shareholders | | | | | | | | | | | | | |
From net realized gain on
investments | | $(0.66 | ) | | $— | | | $— | | | $— | | | $— | | | $— | |
Redemption fees added to
paid-in capital (d) | | $— | | | $0.00 | (w) | | $0.00 | (w) | | $0.00 | (w) | | $0.00 | (w) | | $— | |
| Net asset value, end of period | | $17.80 | | | $21.19 | | | $17.48 | | | $17.31 | | | $13.85 | | | $14.86 | |
| Total return (%) (r)(s) | | (13.23 | )(n) | | 21.22 | | | 0.98 | | | 24.98 | | | (6.80 | )(b) | | 21.90 | |
Ratios (%) (to average net assets)
and Supplemental data: | | | | | | | | | | | | | | | | |
Expenses before expense
reductions (f) | | 1.31 | (a) | | 1.22 | | | 1.22 | | | 1.23 | | | 1.16 | | | 1.23 | |
Expenses after expense
reductions (f) | | 1.21 | (a) | | 1.12 | | | 1.12 | | | 1.13 | | | 1.16 | | | N/A | |
| Net investment loss | | (0.60 | )(a) | | (0.69 | ) | | (0.77 | ) | | (0.70 | ) | | (0.84 | ) | | (0.75 | ) |
| Portfolio turnover | | 44 | | | 94 | | | 99 | | | 112 | | | 122 | | | 104 | |
Net assets at end of period
(000 Omitted) | | $88,706 | | | $100,245 | | | $119,053 | | | $107,842 | | | $103,031 | | | $90,872 | |
See Notes to Financial Statements
20
Financial Highlights – continued
| | | | | | | | | | | | | | | | | | |
| | | Six months
ended
2/29/08 (unaudited) | | | Years ended 8/31 | |
| Class R | | | 2007 | | | 2006 | | | 2005 | | | 2004 | | | 2003 (i) | |
| | | | | | | | | | | | | | | | | |
Net asset value, beginning of
period | | $20.35 | | | $16.87 | | | $16.79 | | | $13.50 | | | $14.57 | | | $11.38 | |
Income (loss) from investment
operations | | | | | | | | | | | | | | | | |
Net investment loss (d) | | $(0.10 | ) | | $(0.18 | ) | | $(0.22 | ) | | $(0.18 | ) | | $(0.20 | ) | | $(0.11 | ) |
Net realized and unrealized
gain (loss) on investments
and foreign currency | | (2.57 | ) | | 3.66 | | | 0.30 | | | 3.47 | | | (0.87 | ) | | 3.30 | |
Total from investment
operations | | $(2.67 | ) | | $3.48 | | | $0.08 | | | $3.29 | | | $(1.07 | ) | | $3.19 | |
Less distributions declared to
shareholders | | | | | | | | | | | | | | | | |
From net realized gain on
investments | | $(0.66 | ) | | $— | | | $— | | | $— | | | $— | | | $— | |
Redemption fees added to
paid-in capital (d) | | $— | | | $0.00 | (w) | | $0.00 | (w) | | $0.00 | (w) | | $0.00 | (w) | | $— | |
| Net asset value, end of period | | $17.02 | | | $20.35 | | | $16.87 | | | $16.79 | | | $13.50 | | | $14.57 | |
| Total return (%) (r)(s) | | (13.48 | )(n) | | 20.63 | | | 0.48 | | | 24.37 | | | (7.34 | )(b) | | 28.03 | (n) |
Ratios (%) (to average net assets)
and Supplemental data: | | | | | | | | | | | | | | | | |
Expenses before expense
reductions (f) | | 1.79 | (a) | | 1.72 | | | 1.72 | | | 1.73 | | | 1.66 | | | 1.78 | (a) |
Expenses after expense
reductions (f) | | 1.69 | (a) | | 1.62 | | | 1.62 | | | 1.63 | | | 1.66 | | | N/A | |
| Net investment loss | | (1.09 | )(a) | | (1.19 | ) | | (1.27 | ) | | (1.17 | ) | | (1.32 | ) | | (1.26 | )(a) |
| Portfolio turnover | | 44 | | | 94 | | | 99 | | | 112 | | | 122 | | | 104 | |
Net assets at end of period
(000 Omitted) | | $2,060 | | | $7,799 | | | $11,691 | | | $16,926 | | | $7,262 | | | $1,824 | |
See Notes to Financial Statements
21
Financial Highlights – continued
| | | | | | | | | | | | |
| | | Six months
ended
2/29/08 (unaudited) | | | Years ended 8/31 | |
| Class R1 | | | 2007 | | | 2006 | | | 2005 (i) | |
| | | | | | | | | | | |
Net asset value, beginning of
period | | $19.37 | | | $16.16 | | | $16.18 | | | $14.50 | |
Income (loss) from investment
operations | | | | | | | | | | |
Net investment loss (d) | | $(0.16 | ) | | $(0.26 | ) | | $(0.31 | ) | | $(0.10 | ) |
Net realized and unrealized
gain (loss) on investments
and foreign currency | | (2.42 | ) | | 3.47 | | | 0.29 | | | 1.78 | |
Total from investment
operations | | $(2.58 | ) | | $3.21 | | | $(0.02 | ) | | $1.68 | |
Less distributions declared to
shareholders | | | | | | | | | | |
From net realized gain on
investments | | $(0.66 | ) | | $— | | | $— | | | $— | |
Redemption fees added to
paid-in capital (d) | | $— | | | $0.00 | (w) | | $0.00 | (w) | | $0.00 | (w) |
| Net asset value, end of period | | $16.13 | | | $19.37 | | | $16.16 | | | $16.18 | |
| Total return (%) (r)(s) | | (13.71 | )(n) | | 19.86 | | | (0.12 | ) | | 11.59 | (n) |
Ratios (%) (to average net assets)
and Supplemental data: | | | | | | | | | | | | |
Expenses before expense
reductions (f) | | 2.42 | (a) | | 2.37 | | | 2.43 | | | 2.43 | (a) |
Expenses after expense
reductions (f) | | 2.32 | (a) | | 2.22 | | | 2.22 | | | 2.33 | (a) |
| Net investment loss | | (1.70 | )(a) | | (1.79 | ) | | (1.86 | ) | | (1.69 | )(a) |
| Portfolio turnover | | 44 | | | 94 | | | 99 | | | 112 | |
Net assets at end of period
(000 Omitted) | | $4,564 | | | $2,609 | | | $857 | | | $206 | |
See Notes to Financial Statements
22
Financial Highlights – continued
| | | | | | | | | | | | |
| | | Six months
ended
2/29/08 (unaudited) | | | Years ended 8/31 | |
| Class R2 | | | 2007 | | | 2006 | | | 2005 (i) | |
| | | | | | | | | | | |
Net asset value, beginning of
period | | $19.53 | | | $16.23 | | | $16.19 | | | $14.50 | |
Income (loss) from investment
operations | | | | | | | | | | |
Net investment loss (d) | | $(0.12 | ) | | $(0.21 | ) | | $(0.25 | ) | | $(0.08 | ) |
Net realized and unrealized
gain (loss) on investments
and foreign currency | | (2.45 | ) | | 3.51 | | | 0.29 | | | 1.77 | |
Total from investment
operations | | $(2.57 | ) | | $3.30 | | | $0.04 | | | $1.69 | |
Less distributions declared to
shareholders | | | | | | | | | | |
From net realized gain on
investments | | $(0.66 | ) | | $— | | | $— | | | $— | |
Redemption fees added to
paid-in capital (d) | | $— | | | $0.00 | (w) | | $0.00 | (w) | | $0.00 | (w) |
| Net asset value, end of period | | $16.30 | | | $19.53 | | | $16.23 | | | $16.19 | |
| Total return (%) (r)(s) | | (13.54 | )(n) | | 20.33 | | | 0.25 | | | 11.66 | (n) |
Ratios (%) (to average net assets)
and Supplemental data: | | | | | | | | | | | | |
Expenses before expense
reductions (f) | | 1.98 | (a) | | 2.03 | | | 2.12 | | | 2.12 | (a) |
Expenses after expense
reductions (f) | | 1.87 | (a) | | 1.87 | | | 1.88 | | | 2.02 | (a) |
| Net investment loss | | (1.27 | )(a) | | (1.45 | ) | | (1.52 | ) | | (1.02 | )(a) |
| Portfolio turnover | | 44 | | | 94 | | | 99 | | | 112 | |
Net assets at end of period
(000 Omitted) | | $2,191 | | | $1,590 | | | $362 | | | $135 | |
See Notes to Financial Statements
23
Financial Highlights – continued
| | | | | | | | | | | | | | | |
| | | Six months
ended
2/29/08 (unaudited) | | | Years ended 8/31 | |
| Class R3 | | | 2007 | | | 2006 | | | 2005 | | | 2004 (i) | |
| | | | | | | | | | | | | | |
Net asset value, beginning of
period | | $20.21 | | | $16.78 | | | $16.72 | | | $13.47 | | | $15.35 | |
Income (loss) from investment
operations | | | | | | | |
Net investment loss (d) | | $(0.11 | ) | | $(0.20 | ) | | $(0.24 | ) | | $(0.22 | ) | | $(0.11 | ) |
Net realized and unrealized
gain (loss) on investments
and foreign currency | | (2.54 | ) | | 3.63 | | | 0.30 | | | 3.47 | | | (1.77 | ) |
Total from investment
operations | | $(2.65 | ) | | $3.43 | | | $0.06 | | | $3.25 | | | $(1.88 | ) |
Less distributions declared to
shareholders | | | | | | | | | | | | | |
From net realized gain on
investments | | $(0.66 | ) | | $— | | | $— | | | $— | | | $— | |
Redemption fees added to
paid-in capital (d) | | $— | | | $0.00 | (w) | | $0.00 | (w) | | $0.00 | (w) | | $0.00 | (w) |
| Net asset value, end of period | | $16.90 | | | $20.21 | | | $16.78 | | | $16.72 | | | $13.47 | |
| Total return (%) (r)(s) | | (13.48 | )(n) | | 20.44 | | | 0.36 | | | 24.13 | | | (12.25 | )(b)(n) |
Ratios (%) (to average net assets)
and Supplemental data: | | | | | | | | | | | | | |
Expenses before expense
reductions (f) | | 1.91 | (a) | | 1.92 | | | 1.96 | | | 1.98 | | | 1.73 | (a) |
Expenses after expense
reductions (f) | | 1.81 | (a) | | 1.77 | | | 1.77 | | | 1.88 | | | 1.73 | (a) |
| Net investment loss | | (1.20 | )(a) | | (1.34 | ) | | (1.41 | ) | | (1.42 | ) | | (1.23 | )(a) |
| Portfolio turnover | | 44 | | | 94 | | | 99 | | | 112 | | | 122 | |
Net assets at end of period
(000 Omitted) | | $11,276 | | | $8,711 | | | $4,417 | | | $1,573 | | | $454 | |
See Notes to Financial Statements
24
Financial Highlights – continued
| | | | | | | | | | | | |
| | | Six months
ended
2/29/08 (unaudited) | | | Years ended 8/31 | |
| Class R4 | | | 2007 | | | 2006 | | | 2005 (i) | |
| | | | | | | | | | | |
Net asset value, beginning of
period | | $20.45 | | | $16.94 | | | $16.84 | | | $15.04 | |
Income (loss) from investment
operations | | | | |
Net investment loss (d) | | $(0.09 | ) | | $(0.17 | ) | | $(0.21 | ) | | $(0.04 | ) |
Net realized and unrealized
gain (loss) on investments
and foreign currency | | (2.57 | ) | | 3.68 | | | 0.31 | | | 1.84 | |
Total from investment
operations | | $(2.66 | ) | | $3.51 | | | $0.10 | | | $1.80 | |
Less distributions declared to
shareholders | | | | | | | | | | |
From net realized gain on
investments | | $(0.66 | ) | | $— | | | $— | | | $— | |
Redemption fees added to
paid-in capital (d) | | $— | | | $0.00 | (w) | | $0.00 | (w) | | $0.00 | (w) |
| Net asset value, end of period | | $17.13 | | | $20.45 | | | $16.94 | | | $16.84 | |
| Total return (%) (r)(s) | | (13.37 | )(n) | | 20.72 | | | 0.59 | | | 11.97 | (n) |
Ratios (%) (to average net assets)
and Supplemental data: | | | | | | | | | | |
Expenses before expense
reductions (f) | | 1.66 | (a) | | 1.62 | | | 1.62 | | | 1.63 | (a) |
Expenses after expense
reductions (f) | | 1.56 | (a) | | 1.52 | | | 1.52 | | | 1.53 | (a) |
| Net investment loss | | (0.95 | )(a) | | (1.09 | ) | | (1.15 | ) | | (0.66 | )(a) |
| Portfolio turnover | | 44 | | | 94 | | | 99 | | | 112 | |
Net assets at end of period
(000 Omitted) | | $4,587 | | | $4,654 | | | $2,404 | | | $334 | |
See Notes to Financial Statements
25
Financial Highlights – continued
| | | | | | | | | | | | |
| | | Six months
ended
2/29/08
(unaudited) | | | Years ended 8/31 | |
| Class R5 | | | 2007 | | | 2006 | | | 2005 (i) | |
| | | | | | | | | | | |
Net asset value, beginning of
period | | $20.60 | | | $17.01 | | | $16.86 | | | $15.04 | |
Income (loss) from investment
operations | | | | |
Net investment loss (d) | | $(0.07 | ) | | $(0.12 | ) | | $(0.15 | ) | | $(0.04 | ) |
Net realized and unrealized
gain (loss) on investments
and foreign currency | | (2.59 | ) | | 3.71 | | | 0.30 | | | 1.86 | |
Total from investment
operations | | $(2.66 | ) | | $3.59 | | | $0.15 | | | $1.82 | |
Less distributions declared to
shareholders | | | | | | | | | | |
From net realized gain on
investments | | $(0.66 | ) | | $— | | | $— | | | $— | |
Redemption fees added to
paid-in capital (d) | | $— | | | $0.00 | (w) | | $0.00 | (w) | | $0.00 | (w) |
| Net asset value, end of period | | $17.28 | | | $20.60 | | | $17.01 | | | $16.86 | |
| Total return (%) (r)(s) | | (13.27 | )(n) | | 21.11 | | | 0.89 | | | 12.10 | (n) |
Ratios (%) (to average net assets)
and Supplemental data: | | | | | | | | | | |
Expenses before expense
reductions (f) | | 1.38 | (a) | | 1.32 | | | 1.32 | | | 1.32 | (a) |
Expenses after expense
reductions (f) | | 1.28 | (a) | | 1.22 | | | 1.22 | | | 1.22 | (a) |
| Net investment loss | | (0.67 | )(a) | | (0.79 | ) | | (0.84 | ) | | (0.67 | )(a) |
| Portfolio turnover | | 44 | | | 94 | | | 99 | | | 112 | |
Net assets at end of period
(000 Omitted) | | $54,450 | | | $67,212 | | | $59,999 | | | $56 | |
See Notes to Financial Statements
26
Financial Highlights – continued
| | | | | | | | | | | | | | | | | | |
| | | Six months
ended
2/29/08 (unaudited) | | | Years ended 8/31 | |
| Class 529A | | | 2007 | | | 2006 | | | 2005 | | | 2004 | | | 2003 | |
| | | | | | | | | | | | | | | | | |
Net asset value, beginning of
period | | $20.23 | | | $16.79 | | | $16.73 | | | $13.47 | | | $14.53 | | | $11.99 | |
Income (loss) from investment
operations | | | | | | | | | | | | | | | | |
Net investment loss (d) | | $(0.11 | ) | | $(0.21 | ) | | $(0.24 | ) | | $(0.20 | ) | | $(0.21 | ) | | $(0.16 | ) |
Net realized and unrealized
gain (loss) on investments
and foreign currency | | (2.54 | ) | | 3.65 | | | 0.30 | | | 3.46 | | | (0.85 | ) | | 2.70 | |
Total from investment
operations | | $(2.65 | ) | | $3.44 | | | $0.06 | | | $3.26 | | | $(1.06 | ) | | $2.54 | |
Less distributions declared to
shareholders | | | | | | | | | | | | | | | | |
From net realized gain on
investments | | $(0.66 | ) | | $— | | | $— | | | $— | | | $— | | | $— | |
Redemption fees added to
paid-in capital (d) | | $— | | | $0.00 | (w) | | $0.00 | (w) | | $0.00 | (w) | | $0.00 | (w) | | $— | |
| Net asset value, end of period | | $16.92 | | | $20.23 | | | $16.79 | | | $16.73 | | | $13.47 | | | $14.53 | |
| Total return (%) (r)(s)(t) | | (13.46 | )(n) | | 20.49 | | | 0.36 | | | 24.20 | | | (7.30 | )(b) | | 21.18 | |
Ratios (%) (to average net assets)
and Supplemental data: | | | | | | | | | | | | | | | | |
Expenses before expense
reductions (f) | | 1.91 | (a) | | 1.82 | | | 1.83 | | | 1.83 | | | 1.75 | | | 1.84 | |
Expenses after expense
reductions (f) | | 1.81 | (a) | | 1.72 | | | 1.72 | | | 1.73 | | | 1.75 | | | N/A | |
| Net investment loss | | (1.20 | )(a) | | (1.29 | ) | | (1.37 | ) | | (1.27 | ) | | (1.43 | ) | | (1.35 | ) |
| Portfolio turnover | | 44 | | | 94 | | | 99 | | | 112 | | | 122 | | | 104 | |
Net assets at end of period
(000 Omitted) | | $1,528 | | | $1,715 | | | $1,630 | | | $1,637 | | | $390 | | | $180 | |
See Notes to Financial Statements
27
Financial Highlights – continued
| | | | | | | | | | | | | | | | | | |
| | | Six months
ended
2/29/08 (unaudited) | | | Years ended 8/31 | |
| Class 529B | | | 2007 | | | 2006 | | | 2005 | | | 2004 | | | 2003 | |
| | | | | | | | | | | | | | | | | |
Net asset value, beginning of
period | | $19.20 | | | $16.03 | | | $16.07 | | | $13.02 | | | $14.15 | | | $11.75 | |
Income (loss) from investment
operations | | | | | | | | | | | | | | | | |
Net investment loss (d) | | $(0.17 | ) | | $(0.28 | ) | | $(0.33 | ) | | $(0.28 | ) | | $(0.30 | ) | | $(0.24 | ) |
Net realized and unrealized
gain (loss) on investments
and foreign currency | | (2.40 | ) | | 3.45 | | | 0.29 | | | 3.33 | | | (0.83 | ) | | 2.64 | |
Total from investment
operations | | $(2.57 | ) | | $3.17 | | | $(0.04 | ) | | $3.05 | | | $(1.13 | ) | | $2.40 | |
Less distributions declared to
shareholders | | | | | | | | | | | | | | | | |
From net realized gain on
investments | | $(0.66 | ) | | $— | | | $— | | | $— | | | $— | | | $— | |
Redemption fees added to
paid-in capital (d) | | $— | | | $0.00 | (w) | | $0.00 | (w) | | $0.00 | (w) | | $0.00 | (w) | | $— | |
| Net asset value, end of period | | $15.97 | | | $19.20 | | | $16.03 | | | $16.07 | | | $13.02 | | | $14.15 | |
| Total return (%) (r)(s)(t) | | (13.77 | )(n) | | 19.78 | | | (0.25 | ) | | 23.43 | | | (7.99 | )(b) | | 20.43 | |
Ratios (%) (to average net assets)
and Supplemental data: | | | | | | | | | | | | | | | | |
Expenses before expense
reductions (f) | | 2.56 | (a) | | 2.47 | | | 2.47 | | | 2.47 | | | 2.40 | | | 2.49 | |
Expenses after expense
reductions (f) | | 2.46 | (a) | | 2.37 | | | 2.37 | | | 2.37 | | | 2.40 | | | N/A | |
| Net investment loss | | (1.85 | )(a) | | (1.94 | ) | | (2.02 | ) | | (1.93 | ) | | (2.07 | ) | | (1.99 | ) |
| Portfolio turnover | | 44 | | | 94 | | | 99 | | | 112 | | | 122 | | | 104 | |
Net assets at end of period
(000 Omitted) | | $211 | | | $239 | | | $211 | | | $177 | | | $135 | | | $84 | |
See Notes to Financial Statements
28
Financial Highlights – continued
| | | | | | | | | | | | | | | | | | |
| | | Six months
ended
2/29/08 (unaudited) | | | Years ended 8/31 | |
| Class 529C | | | 2007 | | | 2006 | | | 2005 | | | 2004 | | | 2003 | |
| | | | | | | | | | | | | | | | | |
Net asset value, beginning of
period | | $19.21 | | | $16.04 | | | $16.08 | | | $13.03 | | | $14.16 | | | $11.77 | |
Income (loss) from investment
operations | | | | | | | | | | | | | | | | |
Net investment loss (d) | | $(0.17 | ) | | $(0.28 | ) | | $(0.34 | ) | | $(0.28 | ) | | $(0.31 | ) | | $(0.24 | ) |
Net realized and unrealized
gain (loss) on investments
and foreign currency | | (2.41 | ) | | 3.45 | | | 0.30 | | | 3.33 | | | (0.82 | ) | | 2.63 | |
Total from investment
operations | | $(2.58 | ) | | $3.17 | | | $(0.04 | ) | | $3.05 | | | $(1.13 | ) | | $2.39 | |
Less distributions declared to
shareholders | | | | | | | | | | | | | | | | |
From net realized gain on
investments | | $(0.66 | ) | | $— | | | $— | | | $— | | | $— | | | $— | |
Redemption fees added to
paid-in capital (d) | | $— | | | $0.00 | (w) | | $0.00 | (w) | | $0.00 | (w) | | $0.00 | (w) | | $— | |
| Net asset value, end of period | | $15.97 | | | $19.21 | | | $16.04 | | | $16.08 | | | $13.03 | | | $14.16 | |
| Total return (%) (r)(s)(t) | | (13.82 | )(n) | | 19.76 | | | (0.25 | ) | | 23.41 | | | (7.98 | )(b) | | 20.31 | |
Ratios (%) (to average net assets)
and Supplemental data: | | | | | | | | | | | | | | | | |
Expenses before expense
reductions (f) | | 2.56 | (a) | | 2.47 | | | 2.48 | | | 2.47 | | | 2.40 | | | 2.50 | |
Expenses after expense
reductions (f) | | 2.46 | (a) | | 2.37 | | | 2.37 | | | 2.37 | | | 2.40 | | | N/A | |
| Net investment loss | | (1.85 | )(a) | | (1.94 | ) | | (2.02 | ) | | (1.93 | ) | | (2.08 | ) | | (1.99 | ) |
| Portfolio turnover | | 44 | | | 94 | | | 99 | | | 112 | | | 122 | | | 104 | |
Net assets at end of period
(000 Omitted) | | $270 | | | $323 | | | $332 | | | $333 | | | $240 | | | $147 | |
See Notes to Financial Statements
29
Financial Highlights – continued
| (b) | The fund’s net asset value and total return calculation include a non-recurring accrual recorded as a result of an administrative proceeding regarding disclosure of brokerage allocation practices in connection with fund sales. The non-recurring accrual did not have a material impact on the net asset value per share based on the shares outstanding on the day the proceeds were recorded. |
| (d) | Per share data are based on average shares outstanding. |
| (f) | Ratios do not reflect reductions from fees paid indirectly, if applicable. |
| (i) | For the period from the class’ inception, December 31, 2002 (Class R), October 31, 2003 (Class R3), April 1, 2005 (Classes R1, R2, R4, and R5) through the stated period end. |
| (r) | Certain expenses have been reduced without which performance would have been lower. |
| (s) | From time to time the fund may receive proceeds from litigation settlements, without which performance would be lower. |
| (t) | Total returns do not include any applicable sales charges. |
| (w) | Per share amount was less than $0.01. |
See Notes to Financial Statements
30
NOTES TO FINANCIAL STATEMENTS
(unaudited)
| (1) | | Business and Organization |
MFS New Discovery Fund (the fund) is a series of MFS Series Trust I (the trust). The trust is organized as a Massachusetts business trust and is registered under the Investment Company Act of 1940, as amended, as an open-end management investment company.
| (2) | | Significant Accounting Policies |
General – The preparation of financial statements in conformity with U.S. generally accepted accounting principles requires management to make estimates and assumptions that affect the reported amounts of assets and liabilities, and disclosure of contingent assets and liabilities at the date of the financial statements and the reported amounts of revenues and expenses during the reporting period. Actual results could differ from those estimates.
The fund will generally focus on securities of small size companies which may be more volatile than those of larger companies. The fund can invest in foreign securities, including securities of emerging market issuers. Investments in foreign securities are vulnerable to the effects of changes in the relative values of the local currency and the U.S. dollar and to the effects of changes in each country’s legal, political, and economic environment. The markets of emerging markets countries are generally more volatile than the markets of developed countries with more mature economies. All of the risks of investing in foreign securities previously described are heightened when investing in emerging markets countries.
Investment Valuations – Equity securities, including restricted equity securities, are generally valued at the last sale or official closing price as reported by an independent pricing service on the market or exchange on which they are primarily traded. For securities for which there were no sales reported that day, equity securities are generally valued at the last quoted daily bid quotation as reported by an independent pricing service on the market or exchange on which they are primarily traded. For securities held short for which there were no sales reported for the day, the position is generally valued at the last quoted daily ask quotation as reported by an independent pricing service on the market or exchange on which such securities are primarily traded. Short-term instruments with a maturity at issuance of 60 days or less may be valued at amortized cost, which approximates market value. Open-end investment companies are generally valued at net asset value per share. Securities and other assets generally valued on the basis of information from an independent pricing service may also be valued at a broker-dealer bid quotation. Values obtained from pricing services can utilize both dealer-supplied valuations and electronic data processing techniques, which take into account factors such as institutional-size trading in
31
Notes to Financial Statements (unaudited) – continued
similar groups of securities, yield, quality, coupon rate, maturity, type of issue, trading characteristics, and other market data. The values of foreign securities and other assets and liabilities expressed in foreign currencies are converted to U.S. dollars using the mean of bid and asked prices for rates reported by an independent pricing service.
The Board of Trustees has delegated primary responsibility for determining or causing to be determined the value of the fund’s investments (including any fair valuation) to the adviser pursuant to valuation policies and procedures approved by the Board. If the adviser determines that reliable market quotations are not readily available, investments are valued at fair value as determined in good faith by the adviser in accordance with such procedures under the oversight of the Board of Trustees. Under the fund’s valuation policies and procedures, market quotations are not considered to be readily available for many types of debt instruments and certain types of derivatives. These investments are generally valued at fair value based on information from independent pricing services. In addition, investments may be valued at fair value if the adviser determines that an investment’s value has been materially affected by events occurring after the close of the exchange or market on which the investment is principally traded (such as foreign exchange or market) and prior to the determination of the fund’s net asset value, or after the halting of trading of a specific security where trading does not resume prior to the close of the exchange or market on which the security is principally traded. Events that occur on a frequent basis after foreign markets close (such as developments in foreign markets and significant movements in the U.S. markets) and prior to the determination of the fund’s net asset value may be deemed to have a material affect on the value of securities traded in foreign markets. Accordingly, the fund’s foreign equity securities may often be valued at fair value. The adviser may rely on independent pricing services or other information (such as the correlation with price movements of similar securities in the same or other markets; the type, cost and investment characteristics of the security; the business and financial condition of the issuer; and trading and other market data) to assist in determining whether to fair value and at what value to fair value an investment. The value of an investment for purposes of calculating the fund’s net asset value can differ depending on the source and method used to determine value. When fair valuation is used, the value of investments used to determine the fund’s net asset value may differ from quoted or published prices for the same investments.
In September 2006, FASB Statement No. 157, Fair Value Measurements (the “Statement”) was issued, and is effective for fiscal years beginning after November 15, 2007 and for all interim periods within those fiscal years. This Statement provides a single definition of fair value, a hierarchy for measuring
32
Notes to Financial Statements (unaudited) – continued
fair value and expanded disclosures about fair value measurements. Management is evaluating the application of the Statement to the fund, and believes the impact will be limited to expanded disclosures resulting from the adoption of this Statement in the fund’s financial statements.
Repurchase Agreements – The fund may enter into repurchase agreements with institutions that the fund’s investment adviser has determined are creditworthy. Each repurchase agreement is recorded at cost. The fund requires that the securities collateral in a repurchase transaction be transferred to the custodian in a manner sufficient to enable the fund to obtain those securities in the event of a default under the repurchase agreement. The fund monitors, on a daily basis, the value of the collateral to ensure that its value, including accrued interest, is greater than amounts owed to the fund under each such repurchase agreement. The fund and other funds managed by Massachusetts Financial Services Company (MFS), may utilize a joint trading account for the purpose of entering into one or more repurchase agreements.
Foreign Currency Translation – Purchases and sales of foreign investments, income, and expenses are converted into U.S. dollars based upon currency exchange rates prevailing on the respective dates of such transactions. Gains and losses attributable to foreign currency exchange rates on sales of securities are recorded for financial statement purposes as net realized gains and losses on investments. Gains and losses attributable to foreign exchange rate movements on income and expenses are recorded for financial statement purposes as foreign currency transaction gains and losses. That portion of both realized and unrealized gains and losses on investments that results from fluctuations in foreign currency exchange rates is not separately disclosed.
Security Loans – State Street Bank and Trust Company (“State Street”), as lending agent, may loan the securities of the fund to certain qualified institutions (the “Borrowers”) approved by the fund. The loans are collateralized at all times by cash and/or U.S. Treasury and federal agency obligations in an amount at least equal to the market value of the securities loaned. State Street provides the fund with indemnification against Borrower default. The fund bears the risk of loss with respect to the investment of cash collateral. On loans collateralized by cash, the cash collateral is invested in a money market fund or short-term securities. A portion of the income generated upon investment of the collateral is remitted to the Borrowers, and the remainder is allocated between the fund and the lending agent. On loans collateralized by U.S. Treasury and/or federal agency obligations, a fee is received from the Borrower, and is allocated between the fund and the lending agent. Net income from securities lending is included in interest income on the Statement of Operations. The dividend and interest income earned on the securities loaned is accounted for in the same manner as other dividend and interest income.
33
Notes to Financial Statements (unaudited) – continued
Indemnifications – Under the fund’s organizational documents, its officers and trustees may be indemnified against certain liabilities and expenses arising out of the performance of their duties to the fund. Additionally, in the normal course of business, the fund enters into agreements with service providers that may contain indemnification clauses. The fund’s maximum exposure under these agreements is unknown as this would involve future claims that may be made against the fund that have not yet occurred.
Short Term Fees – The fund charged a 1% redemption fee on proceeds from Class A, Class B, Class C, and Class I shares redeemed or exchanged within 30 calendar days following their acquisition. Effective December 1, 2006, the fund no longer charges a redemption fee. Any redemption fees charged are accounted for as an addition to paid-in capital.
Investment Transactions and Income – Investment transactions are recorded on the trade date. Interest income is recorded on the accrual basis. All premium and discount is amortized or accreted for financial statement purposes in accordance with U.S. generally accepted accounting principles. Dividends received in cash are recorded on the ex-dividend date. Certain dividends from foreign securities will be recorded when the fund is informed of the dividend if such information is obtained subsequent to the ex-dividend date. Dividend and interest payments received in additional securities are recorded on the ex-dividend or ex-interest date in an amount equal to the value of the security on such date.
The fund may receive proceeds from litigation settlements. Any proceeds received from litigation involving portfolio holdings are reflected in the Statement of Operations in realized gain/loss if the security has been disposed of by the fund or in unrealized gain/loss if the security is still held by the fund. Any other proceeds from litigation not related to portfolio holdings are reflected as other income in the Statement of Operations.
Fees Paid Indirectly – The fund’s custody fee may be reduced according to an arrangement that measures the value of cash deposited with the custodian by the fund. This amount, for the six months ended February 29, 2008, is shown as a reduction of total expenses on the Statement of Operations.
Tax Matters and Distributions – The fund intends to qualify as a regulated investment company, as defined under Subchapter M of the Internal Revenue Code, and to distribute all of its taxable income, including realized capital gains. As a result, no provision for federal income taxes is required. The fund adopted the provisions of FASB Interpretation No. 48, Accounting for Uncertainty in Income Taxes (“the Interpretation”) on September 1, 2007. The Interpretation prescribes a minimum threshold for financial statement recognition of the benefit of a tax position taken or expected to be taken in a tax return. There was no impact resulting from the adoption of this
34
Notes to Financial Statements (unaudited) – continued
Interpretation on the fund’s financial statements. Each of the fund’s federal tax returns for the prior three fiscal years remains subject to examination by the Internal Revenue Service. It is the fund’s policy to record interest and penalty charges on underpaid taxes associated with its tax positions as interest expense and miscellaneous expense, respectively. No such charges were recorded in the current financial statements. Foreign taxes, if any, have been accrued by the fund in the accompanying financial statements.
Distributions to shareholders are recorded on the ex-dividend date. Income and capital gain distributions are determined in accordance with income tax regulations, which may differ from U.S. generally accepted accounting principles. Certain capital accounts in the financial statements are periodically adjusted for permanent differences in order to reflect their tax character. These adjustments have no impact on net assets or net asset value per share. Temporary differences which arise from recognizing certain items of income, expense, gain or loss in different periods for financial statement and tax purposes will reverse at some time in the future. Distributions in excess of net investment income or net realized gains are temporary overdistributions for financial statement purposes resulting from differences in the recognition or classification of income or distributions for financial statement and tax purposes.
Book/tax differences primarily relate to net operating losses, passive foreign investment companies, and wash sale loss deferrals.
The tax character of distributions made during the current period will be determined at fiscal year end. The fund declared no distributions for the year ended August 31, 2007.
The federal tax cost and the tax basis components of distributable earnings were as follows:
| | | |
| As of 2/28/08 | | | |
| Cost of investments | | $768,816,526 | |
| Gross appreciation | | 28,924,338 | |
| Gross depreciation | | (133,480,060 | ) |
| Net unrealized appreciation (depreciation) | | $(104,555,722 | ) |
| |
| As of 8/31/07 | | | |
| Capital loss carryforwards | | (14,168,895 | ) |
| Other temporary differences | | (10,625 | ) |
| Net unrealized appreciation (depreciation) | | 9,804,406 | |
The aggregate cost above includes prior fiscal year end tax adjustments.
As of August 31, 2007, the fund had capital loss carryforwards available to offset future realized gains. Such losses expire as follows:
35
Notes to Financial Statements (unaudited) – continued
Multiple Classes of Shares of Beneficial Interest – The fund offers multiple classes of shares, which differ in their respective distribution and service fees. All shareholders bear the common expenses of the fund based on daily net assets of each class, without distinction between share classes. Dividends are declared separately for each class. Differences in per share dividend rates are generally due to differences in separate class expenses. Class B and Class 529B shares will convert to Class A and Class 529A shares, respectively, approximately eight years after purchase.
| (3) | | Transactions with Affiliates |
Investment Adviser – The fund has an investment advisory agreement with MFS to provide overall investment management and related administrative services and facilities to the fund.
The management fee is computed daily and paid monthly at an annual rate of 0.90% of the fund’s average daily net assets. As part of a settlement agreement with the New York Attorney General concerning market timing and related matters, MFS has agreed to reduce the management fee to 0.80% for the first $1.5 billion of average daily net assets and 0.75% of average daily net assets in excess of $1.5 billion through February 28, 2009. For the six months ended February 29, 2008, this waiver amounted to $323,630 and is reflected as a reduction of total expenses in the Statement of Operations. The management fee incurred for the six months ended February 29, 2008 was equivalent to an annual effective rate of 0.80% of the fund’s average daily net assets.
Distributor – MFS Fund Distributors, Inc. (MFD), a wholly-owned subsidiary of MFS, as distributor, received $9,513 and $711 for the six months ended February 29, 2008, as its portion of the initial sales charge on sales of Class A and Class 529A shares of the fund, respectively.
The Board of Trustees has adopted a distribution plan for certain class shares pursuant to Rule 12b-1 of the Investment Company Act of 1940.
The fund’s distribution plan provides that the fund will pay MFD for services provided by MFD and financial intermediaries in connection with the distribution and servicing of certain share classes. One component of the plan is a distribution fee paid to MFD and another component of the plan is a service fee paid to MFD. MFD may subsequently pay all, or a portion, of the distribution and/or service fees to financial intermediaries.
36
Notes to Financial Statements (unaudited) – continued
Distribution Plan Fee Table:
| | | | | | | | | | |
| | | Distribution
Fee Rate | | Service
Fee Rate | | Total
Distribution
Plan (d) | | Annual
Effective
Rate (e) | | Distribution
and Service
Fee |
| Class A | | 0.10% | | 0.25% | | 0.35% | | 0.35% | | $611,237 |
| Class B | | 0.75% | | 0.25% | | 1.00% | | 1.00% | | 357,523 |
| Class C | | 0.75% | | 0.25% | | 1.00% | | 1.00% | | 187,335 |
| Class R | | 0.25% | | 0.25% | | 0.50% | | 0.50% | | 9,946 |
| Class R1 (c) | | 0.50% | | 0.25% | | 0.75% | | 0.75% | | 15,192 |
| Class R2 | | 0.25% | | 0.25% | | 0.50% | | 0.50% | | 5,196 |
| Class R3 | | 0.25% | | 0.25% | | 0.50% | | 0.50% | | 28,020 |
| Class R4 | | — | | 0.25% | | 0.25% | | 0.25% | | 6,369 |
| Class 529A | | 0.25% | | 0.25% | | 0.50% | | 0.35% | | 2,912 |
| Class 529B | | 0.75% | | 0.25% | | 1.00% | | 1.00% | | 1,152 |
| Class 529C | | 0.75% | | 0.25% | | 1.00% | | 1.00% | | 1,549 |
| Total Distribution and Service Fees | | | | | | $1,226,431 |
| (c) | Effective March 1, 2008, the distribution fee rate for Class R1 shares will be 0.75% and the total distribution plan rate will be 1.00%. |
| (d) | In accordance with the distribution plan for certain classes, the fund pays distribution and/or service fees up to these annual percentage rates of each class’ average daily net assets. |
| (e) | The annual effective rates represent actual fees incurred under the distribution plan for the six months ended February 29, 2008 based on each class’ average daily net assets. 0.10% of the Class 529A distribution fee is currently being paid by the fund. Payment of the remaining 0.15% of the Class 529A distribution fee is not yet in effect and will be implemented on such date as the fund’s Board of Trustees may determine. |
Certain Class A, Class C and Class 529C shares are subject to a contingent deferred sales charge in the event of a shareholder redemption within 12 months of purchase. Class B and Class 529B shares are subject to a contingent deferred sales charge in the event of a shareholder redemption within six years of purchase. All contingent deferred sales charges are paid to MFD and during the six months ended February 29, 2008, were as follows:
| | |
| | | Amount |
| Class A | | $928 |
| Class B | | 41,576 |
| Class C | | 1,142 |
| Class 529B | | 2 |
| Class 529C | | — |
The fund has entered into and may from time to time enter into contracts with program managers and other parties which administer the tuition programs through which an investment in the fund’s 529 share classes is made. The fund has entered into an agreement with MFD pursuant to which MFD receives an annual fee of up to 0.35% of the average daily net assets attributable to each 529 share class. The fee is based on average daily net assets and is currently established at 0.25% annually of average daily net assets of the fund’s 529 share classes. Effective April 1, 2008, the fee will be 0.10%. The fee may only
37
Notes to Financial Statements (unaudited) – continued
be increased with the approval of the Board of Trustees who oversees the fund. The services provided by MFD, or a third party with which MFD contracts, include recordkeeping and tax reporting and account services, as well as services designed to maintain the program’s compliance with the Internal Revenue Code and other regulatory requirements. Program manager fees for the six months ended February 29, 2008, were as follows:
| | |
| | | Amount |
| Class 529A | | $2,081 |
| Class 529B | | 288 |
| Class 529C | | 387 |
| Total Program Manager Fees | | $2,756 |
Shareholder Servicing Agent – MFS Service Center, Inc. (MFSC), a wholly-owned subsidiary of MFS, receives a fee from the fund for its services as shareholder servicing agent calculated as a percentage of the average daily net assets of the fund as determined periodically under the supervision of the fund’s Board of Trustees. For the six months ended February 29, 2008, the fee was $156,563, which equated to 0.0485% annually of the fund’s average daily net assets. MFSC also receives payment from the fund for out-of-pocket expenses, sub-accounting and other shareholder servicing costs which may be paid to affiliated and unaffiliated service providers. For the six months ended February 29, 2008, these out-of-pocket expenses, sub-accounting and other shareholder servicing costs amounted to $677,088. The fund may also pay shareholder servicing related costs directly to non-related parties.
Effective May 1, 2007, under a Special Servicing Agreement among MFS, each MFS fund which invests in other MFS funds (‘‘MFS fund-of-funds’’) and each underlying fund in which a MFS fund-of-funds invests (‘‘underlying funds’’), each underlying fund may pay a portion of each MFS fund-of-fund’s transfer agent-related expenses, including sub-accounting fees payable to financial intermediaries, to the extent such payments do not exceed the benefits realized or expected to be realized by the underlying fund from the investment in the underlying fund by the MFS fund-of-fund. For the six months ended February 29, 2008, these costs for the fund amounted to $113,124 and are reflected in the shareholder servicing costs on the Statement of Operations.
Administrator – MFS provides certain financial, legal, shareholder communications, compliance, and other administrative services to the fund. Under an administrative services agreement, the fund partially reimburses MFS the costs incurred to provide these services. The fund is charged a fixed amount plus a fee based on average daily net assets. The fund’s annual fixed amount is $17,500. The administrative services fee incurred for the six months ended February 29, 2008 was equivalent to an annual effective rate of 0.0158% of the fund’s average daily net assets.
38
Notes to Financial Statements (unaudited) – continued
In addition to the administrative services provided by MFS to the fund as described above, MFS is responsible for providing certain retirement plan administration and services with respect to certain shares. These services include various administrative, recordkeeping, and communication/educational services with respect to the retirement plans which invest in these shares, and may be provided directly by MFS or by a third party. MFS may subsequently pay all, or a portion, of the retirement plan administration and services fee to affiliated or unaffiliated third parties. For the six months ended February 29, 2008, the fund paid MFS an annual retirement plan administration and services fee up to the following annual percentage rates of each class’ average daily net assets:
| | | | | | | | |
| | | Beginning
of period
through
12/31/07 | | Effective
1/1/08 | | Annual
Effective
Rate (g) | | Total
Amount |
Class R1 | | 0.35% | | 0.35% | | 0.35% | | $7,091 |
Class R2 | | 0.25% | | — | | 0.16% | | 1,660 |
Class R3 | | 0.15% | | — | | 0.10% | | 5,531 |
Class R4 | | 0.15% | | — | | 0.10% | | 2,637 |
Class R5 | | 0.10% | | — | | 0.07% | | 22,232 |
| Total Retirement Plan Administration and Services Fees | | | | | | $39,151 |
| (g) | Effective January 1, 2008, the annual retirement plan administration and services fee was eliminated for Class R2, Class R3, Class R4, and Class R5 shares. Effective March 1, 2008, the annual retirement plan administration and services fee will be eliminated for Class R1 shares. |
Trustees’ and Officers’ Compensation – The fund pays compensation to independent trustees in the form of a retainer, attendance fees, and additional compensation to Board and Committee chairpersons. The fund does not pay compensation directly to trustees or officers of the fund who are also officers of the investment adviser, all of whom receive remuneration for their services to the fund from MFS. Certain officers and trustees of the fund are officers or directors of MFS, MFD, and MFSC.
The fund has an unfunded, defined benefit plan for certain retired independent trustees which resulted in a pension expense of $555. This amount is included in independent trustees’ compensation for the six months ended February 29, 2008. The liability for deferred retirement benefits payable to certain retired independent trustees amounted to $10,185 at February 29, 2008, and is included in payable for independent trustees’ compensation.
Other – This fund and certain other MFS funds (the funds) have entered into a services agreement (the Agreement) which provides for payment of fees by the funds to Tarantino LLC in return for the provision of services of an Independent Chief Compliance Officer (ICCO) for the funds. The ICCO is an officer of the funds and the sole member of Tarantino LLC. The funds can terminate the Agreement with Tarantino LLC at any time under the terms of the Agreement. For the six months ended February 29, 2008, the fee paid by
39
Notes to Financial Statements (unaudited) – continued
the fund to Tarantino LLC was $2,603 and is included in miscellaneous expense on the Statement of Operations. MFS has agreed to reimburse the fund for a portion of the payments made by the fund to Tarantino LLC in the amount of $1,473, which is shown as a reduction of total expenses in the Statement of Operations. Additionally, MFS has agreed to bear all expenses associated with office space, other administrative support, and supplies provided to the ICCO.
Purchases and sales of investments, other than U.S. government securities, purchased option transactions, and short-term obligations, aggregated $288,238,711 and $391,035,761, respectively.
| (5) | | Shares of Beneficial Interest |
The fund’s Declaration of Trust permits the Trustees to issue an unlimited number of full and fractional shares of beneficial interest. Transactions in fund shares were as follows:
| | | | | | | | |
| | | Six months ended
2/29/08 | | Year ended
8/31/07 |
| | | Shares | | Amount | | Shares | | Amount |
| Shares sold | | | | | | | | |
Class A | | 3,967,519 | | $78,989,136 | | 5,563,012 | | $111,684,942 |
Class B | | 156,120 | | 2,913,418 | | 599,714 | | 11,263,960 |
Class C | | 136,676 | | 2,525,945 | | 243,280 | | 4,592,254 |
Class I | | 1,035,010 | | 21,365,460 | | 1,789,894 | | 38,201,060 |
Class R | | 103,716 | | 2,023,575 | | 142,739 | | 2,778,955 |
Class R1 | | 166,914 | | 3,144,904 | | 197,931 | | 3,755,712 |
Class R2 | | 82,912 | | 1,552,988 | | 86,299 | | 1,688,610 |
Class R3 | | 373,698 | | 7,403,673 | | 548,671 | | 11,019,354 |
Class R4 | | 117,539 | | 2,379,258 | | 304,819 | | 6,218,173 |
Class R5 | | 390,261 | | 7,589,281 | | 980,209 | | 19,651,188 |
Class 529A | | 7,948 | | 156,245 | | 9,115 | | 180,050 |
Class 529B | | 1,095 | | 18,965 | | 992 | | 18,369 |
Class 529C | | 823 | | 15,268 | | 4,298 | | 80,869 |
| | 6,540,231 | | $130,078,116 | | 10,470,973 | | $211,133,496 |
40
Notes to Financial Statements (unaudited) – continued
| | | | | | | | | | | | |
| | | Six months ended
2/29/08 | | | Year ended
8/31/07 | |
| | | Shares | | | Amount | | | Shares | | | Amount | |
| Shares issued to shareholders in reinvestment of distributions | | | | | | | | | | | | |
Class A | | 540,398 | | | $10,413,467 | | | — | | | $— | |
Class B | | 122,935 | | | 2,239,884 | | | — | | | — | |
Class C | | 64,835 | | | 1,183,234 | | | — | | | — | |
Class I | | 158,548 | | | 3,167,792 | | | — | | | — | |
Class R | | 4,563 | | | 87,296 | | | — | | | — | |
Class R1 | | 8,299 | | | 150,717 | | | — | | | — | |
Class R2 | | 3,690 | | | 67,592 | | | — | | | — | |
Class R3 | | 20,277 | | | 385,068 | | | — | | | — | |
Class R4 | | 8,908 | | | 171,384 | | | — | | | — | |
Class R5 | | 107,889 | | | 2,093,044 | | | — | | | — | |
Class 529A | | 3,061 | | | 58,223 | | | — | | | — | |
Class 529B | | 465 | | | 8,357 | | | — | | | — | |
Class 529C | | 636 | | | 11,443 | | | — | | | — | |
| | 1,044,504 | | | $20,037,501 | | | — | | | $— | |
| Shares reacquired | | | | | | | | | | | | |
Class A | | (7,045,234 | ) | | $(139,257,184 | ) | | (10,378,331 | ) | | $(206,306,927 | ) |
Class B | | (1,951,928 | ) | | (36,151,270 | ) | | (4,053,017 | ) | | (76,486,862 | ) |
Class C | | (430,677 | ) | | (8,015,521 | ) | | (986,396 | ) | | (18,600,876 | ) |
Class I | | (940,005 | ) | | (19,241,179 | ) | | (3,869,881 | ) | | (79,984,656 | ) |
Class R | | (370,558 | ) | | (7,505,791 | ) | | (452,494 | ) | | (9,009,942 | ) |
Class R1 | | (26,973 | ) | | (481,123 | ) | | (116,297 | ) | | (2,217,569 | ) |
Class R2 | | (33,630 | ) | | (595,374 | ) | | (27,164 | ) | | (523,644 | ) |
Class R3 | | (157,561 | ) | | (2,918,122 | ) | | (380,943 | ) | | (7,628,258 | ) |
Class R4 | | (86,116 | ) | | (1,663,657 | ) | | (219,218 | ) | | (4,423,996 | ) |
Class R5 | | (609,663 | ) | | (11,670,467 | ) | | (1,244,602 | ) | | (24,800,560 | ) |
Class 529A | | (5,482 | ) | | (103,858 | ) | | (21,408 | ) | | (421,946 | ) |
Class 529B | | (750 | ) | | (11,764 | ) | | (1,740 | ) | | (33,317 | ) |
Class 529C | | (1,405 | ) | | (23,481 | ) | | (8,189 | ) | | (151,633 | ) |
| | (11,659,982 | ) | | $(227,638,791 | ) | | (21,759,680 | ) | | $(430,590,186 | ) |
| Net change | | | | | | | | | | | | |
Class A | | (2,537,317 | ) | | $(49,854,581 | ) | | (4,815,319 | ) | | $(94,621,985 | ) |
Class B | | (1,672,873 | ) | | (30,997,968 | ) | | (3,453,303 | ) | | (65,222,902 | ) |
Class C | | (229,166 | ) | | (4,306,342 | ) | | (743,116 | ) | | (14,008,622 | ) |
Class I | | 253,553 | | | 5,292,073 | | | (2,079,987 | ) | | (41,783,596 | ) |
Class R | | (262,279 | ) | | (5,394,920 | ) | | (309,755 | ) | | (6,230,987 | ) |
Class R1 | | 148,240 | | | 2,814,498 | | | 81,634 | | | 1,538,143 | |
Class R2 | | 52,972 | | | 1,025,206 | | | 59,135 | | | 1,164,966 | |
Class R3 | | 236,414 | | | 4,870,619 | | | 167,728 | | | 3,391,096 | |
Class R4 | | 40,331 | | | 886,985 | | | 85,601 | | | 1,794,177 | |
Class R5 | | (111,513 | ) | | (1,988,142 | ) | | (264,393 | ) | | (5,149,372 | ) |
Class 529A | | 5,527 | | | 110,610 | | | (12,293 | ) | | (241,896 | ) |
Class 529B | | 810 | | | 15,558 | | | (748 | ) | | (14,948 | ) |
Class 529C | | 54 | | | 3,230 | | | (3,891 | ) | | (70,764 | ) |
| | (4,075,247 | ) | | $(77,523,174 | ) | | (11,288,707 | ) | | $(219,456,690 | ) |
41
Notes to Financial Statements (unaudited) – continued
The fund is one of several mutual funds in which the MFS funds-of-funds may invest. The MFS funds-of-funds do not invest in the underlying MFS funds for the purpose of exercising management or control. At the end of the period, the MFS Aggressive Growth Allocation Fund was the owner of record of approximately 11% of the value of outstanding voting shares. In addition, the MFS Lifetime 2030 Fund and the MFS Lifetime 2040 Fund were each the owners of record of less than 1% of the value of outstanding voting shares.
The fund and other funds managed by MFS participate in a $1 billion unsecured committed line of credit provided by a syndication of banks under a credit agreement. In addition, the fund and other funds managed by MFS have established uncommitted borrowing arrangements with certain banks. Borrowings may be made for temporary financing needs. Interest is charged to each fund, based on its borrowings, generally at a rate equal to the Federal Reserve funds rate plus 0.30%. In addition, a commitment fee, based on the average daily, unused portion of the committed line of credit, is allocated among the participating funds at the end of each calendar quarter. For the six months ended February 29, 2008, the fund’s commitment fee and interest expense were $2,116 and $0, respectively, and are included in miscellaneous expense on the Statement of Operations.
On October 23, 2007 the Board of Trustees approved, on or about April 18, 2008, the conversion of Class R shares and Class R2 shares into Class R3 shares. After the conversion, Class R3, Class R4, and Class R5 will be renamed Class R2, Class R3, and Class R4, respectively.
42
RESULTS OF SHAREHOLDER MEETING
(unaudited)
At a special meeting of shareholders of MFS New Discovery Fund, which was held on February 15, 2008, the following actions were taken:
Item 1: To approve an amendment to the current Master Distribution Plan adopted pursuant to Rule 12b-1 under the Investment Company Act of 1940, as amended, with respect to Class R1 Shares of the fund.
| | |
| | | Number of Dollars |
| For | | 2,855,175.15 |
| Against | | 0.00 |
| Abstain | | 137,263.12 |
43
BOARD REVIEW OF INVESTMENT ADVISORY AGREEMENT
A discussion regarding the Board’s most recent review and renewal of the Fund’s investment advisory agreement is available by clicking on the fund’s name under “Select a fund” on the MFS Web site (mfs.com).
PROXY VOTING POLICIES AND INFORMATION
A general description of the MFS funds’ proxy voting policies and procedures is available without charge, upon request, by calling 1-800-225-2606, by visiting the Proxy Voting section of mfs.com or by visiting the SEC’s Web site at http://www.sec.gov.
Information regarding how the fund voted proxies relating to portfolio securities during the most recent twelve-month period ended June 30 is available without charge by visiting the Proxy Voting section of mfs.com or by visiting the SEC’s Web site at http://www.sec.gov.
QUARTERLY PORTFOLIO DISCLOSURE
The fund will file a complete schedule of portfolio holdings with the Securities and Exchange Commission (the Commission) for the first and third quarters of each fiscal year on Form N-Q. The fund’s Form N-Q may be reviewed and copied at the:
Public Reference Room
Securities and Exchange Commission
100 F Street, NE, Room 1580
Washington, D.C. 20549
Information on the operation of the Public Reference Room may be obtained by calling the Commission at 1-800-SEC-0330. The fund’s Form N-Q is available on the EDGAR database on the Commission’s Internet Web site at http://www.sec.gov, and copies of this information may be obtained, upon payment of a duplicating fee, by electronic request at the following e-mail address: publicinfo@sec.gov or by writing the Public Reference Section at the above address.
A shareholder can also obtain the quarterly portfolio holdings report at mfs.com.
44


MFS® Core Growth Fund
The report is prepared for the general information of shareholders. It is authorized for distribution to prospective investors only when preceded or accompanied by a current prospectus.
NOT FDIC INSURED Ÿ MAY LOSE VALUE Ÿ
NO BANK OR CREDIT UNION GUARANTEE Ÿ NOT A DEPOSIT Ÿ
NOT INSURED BY ANY FEDERAL GOVERNMENT AGENCY OR
NCUA/NCUSIF
2/29/08
CGF-SEM

LETTER FROM THE CEO
Dear Shareholders:
Many of our MFS® fund shareholders have been justifiably concerned, as have most investors around the world, about the state of the global economy. As we enter 2008 we see the market volatility that began in the third quarter of 2007 has intensified.
We here at MFS, and those before us who guided the firm with the same disciplined investment process, have weathered many major economic disruptions over our eight-plus decades of managing clients’ investments. We have managed money through the Great Depression, 14 recessions, as well as numerous market crises caused by wars, political upheavals, and terrorist attacks. MFS remains in business because our investors believe in the integrity of our long-term investment strategy and its proven results.
Worries over market volatility are valid, and investors cannot always expect to see the kind of returns stocks have delivered in the bull markets of past years. Yet we believe our strategy of ADR — allocating across the major asset classes, diversifying within each class, and regularly rebalancing your portfolio to maintain your desired allocation — can help you pursue the highest investment returns while minimizing the effects of market fluctuations.
MFS is a world leader in domestic and global investing. Our team approach is research driven, globally integrated, and balanced. We have 176 investment management professionals located in the Americas, Europe, and Asia who focus on the fundamentals of each security and then integrate our sophisticated quantitative approach.* This collaborative process allows us to find opportunities in any market environment.
I personally would like to thank you for your continued business. We want you to be confident that we are constantly managing our fund offerings with you in mind, while adding new products that can help you to choose what fits your unique financial goals.
Respectfully,

Robert J. Manning
Chief Executive Officer and Chief Investment Officer
MFS Investment Management®
April 15, 2008
* as of 12/31/07
The opinions expressed in this letter are subject to change, may not be relied upon for investment advice, and no forecasts can be guaranteed.
1
PORTFOLIO COMPOSITION

| | |
| Top ten holdings | | |
| Microsoft Corp. | | 2.6% |
| America Movil S.A.B. de C.V., “L”, ADR | | 1.8% |
| Nestle S.A. | | 1.8% |
| Medtronic, Inc. | | 1.8% |
| International Business Machines Corp. | | 1.7% |
| CVS Caremark Corp. | | 1.7% |
| Genzyme Corp. | | 1.6% |
| Abbott Laboratories | | 1.6% |
| Cisco Systems, Inc. | | 1.6% |
| Becton, Dickinson & Co. | | 1.6% |
| | |
| Equity sectors | | |
| Technology | | 22.3% |
| Health Care | | 17.8% |
| Consumer Staples | | 8.8% |
| Energy | | 8.1% |
| Industrial Goods & Services | | 7.5% |
| Leisure | | 6.8% |
| Retailing | | 6.7% |
| Financial Services | | 5.6% |
| Special Products & Services | | 4.2% |
| Basic Materials | | 3.8% |
| Utilities & Communications | | 3.2% |
| Transportation | | 1.1% |
Percentages are based on net assets as of 2/29/08.
The portfolio is actively managed and current holdings may be different.
2
EXPENSE TABLE
Fund expenses borne by the shareholders during the period, September 1, 2007 through February 29, 2008
As a shareholder of the fund, you incur two types of costs: (1) transaction costs, including sales charges (loads) on certain purchase or redemption payments, and (2) ongoing costs, including management fees; distribution and service (12b-1) fees; and other fund expenses. This example is intended to help you understand your ongoing costs (in dollars) of investing in the fund and to compare these costs with the ongoing costs of investing in other mutual funds.
The example is based on an investment of $1,000 invested at the beginning of the period and held for the entire period September 1, 2007 through February 29, 2008.
Actual Expenses
The first line for each share class in the following table provides information about actual account values and actual expenses. You may use the information in this line, together with the amount you invested, to estimate the expenses that you paid over the period. Simply divide your account value by $1,000 (for example, an $8,600 account value divided by $1,000 = 8.6), then multiply the result by the number in the first line under the heading entitled “Expenses Paid During Period” to estimate the expenses you paid on your account during this period.
The actual expenses include the payment of a portion of the transfer-agent-related expenses of MFS funds that invest in the fund. For further information, please see the Notes to the Financial Statements.
Hypothetical Example for Comparison Purposes
The second line for each share class in the following table provides information about hypothetical account values and hypothetical expenses based on the fund’s actual expense ratio and an assumed rate of return of 5% per year before expenses, which is not the fund’s actual return. The hypothetical account values and expenses may not be used to estimate the actual ending account balance or expenses you paid for the period. You may use this information to compare the ongoing costs of investing in the fund and other funds. To do so, compare this 5% hypothetical example with the 5% hypothetical examples that appear in the shareholder reports of the other funds.
Please note that the expenses shown in the table are meant to highlight your ongoing costs only and do not reflect any transactional costs, such as sales charges (loads). Therefore, the second line for each share class in the table is useful in comparing ongoing costs only, and will not help you determine the relative total costs of owning different funds. In addition, if these transactional costs were included, your costs would have been higher.
3
Expense Table – continued
| | | | | | | | | | |
Share
Class | | | | Annualized
Expense
Ratio | | Beginning
Account Value
9/01/07 | | Ending
Account Value
2/29/08 | | Expenses
Paid During
Period (p)
9/01/07-2/29/08 |
| A | | Actual | | 1.21% | | $1,000.00 | | $978.31 | | $5.95 |
| | Hypothetical (h) | | 1.21% | | $1,000.00 | | $1,018.85 | | $6.07 |
| B | | Actual | | 1.86% | | $1,000.00 | | $974.57 | | $9.13 |
| | Hypothetical (h) | | 1.86% | | $1,000.00 | | $1,015.61 | | $9.32 |
| C | | Actual | | 1.86% | | $1,000.00 | | $974.59 | | $9.13 |
| | Hypothetical (h) | | 1.86% | | $1,000.00 | | $1,015.61 | | $9.32 |
| I | | Actual | | 0.86% | | $1,000.00 | | $979.43 | | $4.23 |
| | Hypothetical (h) | | 0.86% | | $1,000.00 | | $1,020.59 | | $4.32 |
| W | | Actual | | 0.96% | | $1,000.00 | | $978.88 | | $4.72 |
| | Hypothetical (h) | | 0.96% | | $1,000.00 | | $1,020.09 | | $4.82 |
| R | | Actual | | 1.35% | | $1,000.00 | | $977.17 | | $6.64 |
| | Hypothetical (h) | | 1.35% | | $1,000.00 | | $1,018.15 | | $6.77 |
| R1 | | Actual | | 1.97% | | $1,000.00 | | $974.51 | | $9.67 |
| | Hypothetical (h) | | 1.97% | | $1,000.00 | | $1,015.07 | | $9.87 |
| R2 | | Actual | | 1.53% | | $1,000.00 | | $976.28 | | $7.52 |
| | Hypothetical (h) | | 1.53% | | $1,000.00 | | $1,017.26 | | $7.67 |
| R3 | | Actual | | 1.46% | | $1,000.00 | | $977.00 | | $7.18 |
| | Hypothetical (h) | | 1.46% | | $1,000.00 | | $1,017.60 | | $7.32 |
| R4 | | Actual | | 1.21% | | $1,000.00 | | $977.79 | | $5.95 |
| | Hypothetical (h) | | 1.21% | | $1,000.00 | | $1,018.85 | | $6.07 |
| R5 | | Actual | | 0.93% | | $1,000.00 | | $979.43 | | $4.58 |
| | Hypothetical (h) | | 0.93% | | $1,000.00 | | $1,020.24 | | $4.67 |
| (h) | 5% class return per year before expenses. |
| (p) | Expenses paid is equal to each class’ annualized expense ratio, as shown above, multiplied by the average account value over the period, multiplied by the number of days in the period, divided by the number of days in the year. Expenses paid do not include any applicable sales charges (loads). If these transaction costs had been included, your costs would have been higher. |
Effective January 1, 2008 the fund’s Class R2, Class R3, Class R4, and Class R5 retirement plan administration and service fee was terminated (as described in Note 3 of the Notes to the Financial Statements). Had this fee change been in effect throughout the entire six month period, the annualized expense ratios would have been 1.36, 1.36, 1.11 and 0.86 for Class R2, Class R3, Class R4, and Class R5 shares, respectively. The actual expenses paid during the period would have been approximately $6.71, $6.71, $5.48, and $4.25 and the hypothetical expenses paid during the period would have been approximately $6.84, $6.84, $5.59, and $4.33 for Class R2, Class R3, Class R4, and Class R5, respectively.
Effective March 1, 2008 the fund’s Class R1 retirement plan administration and service fee was terminated and the class R1 distribution fee was increased (as described in Note 3 of the Notes to the Financial Statements). Had these fee changes been in effect throughout the entire six month period, the annualized expense ratio would have been 1.87. The actual expenses paid during the period would have been approximately $9.21 and the hypothetical expenses paid during the period would have been approximately $9.40.
4
PORTFOLIO OF INVESTMENTS
2/29/08 (unaudited)
The Portfolio of Investments is a complete list of all securities owned by your fund. It is categorized by broad-based asset classes.
| | | | | |
| Common Stocks - 95.9% | | | | | |
| Issuer | | Shares/Par | | Value ($) |
| | | | | |
| Aerospace - 4.2% | | | | | |
| Boeing Co. | | 259,900 | | $ | 21,517,121 |
| General Dynamics Corp. | | 90,700 | | | 7,423,795 |
| Honeywell International, Inc. | | 73,900 | | | 4,252,206 |
| Lockheed Martin Corp. | | 153,500 | | | 15,841,200 |
| Raytheon Co. | | 329,900 | | | 21,390,716 |
| United Technologies Corp. | | 283,230 | | | 19,970,547 |
| | | | | |
| | | | | $ | 90,395,585 |
| Alcoholic Beverages - 0.8% | | | | | |
| Diageo PLC | | 848,400 | | $ | 17,334,377 |
| | |
| Apparel Manufacturers - 0.8% | | | | | |
| NIKE, Inc., “B” | | 287,020 | | $ | 17,278,604 |
| | |
| Biotechnology - 4.6% | | | | | |
| Celgene Corp. (a) | | 194,900 | | $ | 10,986,513 |
| Genentech, Inc. (a) | | 192,900 | | | 14,612,175 |
| Genzyme Corp. (a) | | 498,410 | | | 35,347,237 |
| Gilead Sciences, Inc. (a) | | 532,620 | | | 25,203,578 |
| Millipore Corp. (a) | | 188,890 | | | 13,203,411 |
| | | | | |
| | | | | $ | 99,352,914 |
| Broadcasting - 2.5% | | | | | |
| News Corp., “A” | | 974,400 | | $ | 17,938,704 |
| Omnicom Group, Inc. | | 371,900 | | | 16,612,773 |
| Walt Disney Co. | | 574,900 | | | 18,632,509 |
| | | | | |
| | | | | $ | 53,183,986 |
| Brokerage & Asset Managers - 1.1% | | | | | |
| CME Group, Inc. | | 17,400 | | $ | 8,931,420 |
| Deutsche Boerse AG | | 65,100 | | | 10,174,494 |
| ICAP PLC | | 314,303 | | | 3,910,008 |
| | | | | |
| | | | | $ | 23,015,922 |
| Business Services - 3.2% | | | | | |
| Amdocs Ltd. (a) | | 786,640 | | $ | 24,385,840 |
| Fidelity National Information Services, Inc. | | 307,400 | | | 12,754,026 |
| Satyam Computer Services Ltd., ADR (l) | | 123,800 | | | 3,092,524 |
| Western Union Co. | | 1,367,300 | | | 28,439,840 |
| | | | | |
| | | | | $ | 68,672,230 |
5
Portfolio of Investments (unaudited) – continued
| | | | | |
| Issuer | | Shares/Par | | Value ($) |
| | | | | |
| Common Stocks - continued | | | | | |
| Cable TV - 0.6% | | | | | |
| Comcast Corp., “A” | | 675,500 | | $ | 13,199,270 |
| | |
| Chemicals - 1.6% | | | | | |
| 3M Co. | | 166,540 | | $ | 13,056,736 |
| Agrium, Inc. | | 116,100 | | | 8,564,697 |
| Monsanto Co. | | 101,340 | | | 11,723,011 |
| | | | | |
| | | | | $ | 33,344,444 |
| Computer Software - 6.6% | | | | | |
| Akamai Technologies, Inc. (a)(l) | | 213,200 | | $ | 7,496,112 |
| Microsoft Corp. | | 2,014,420 | | | 54,832,512 |
| NAVTEQ Corp. (a) | | 78,100 | | | 5,853,595 |
| Oracle Corp. (a) | | 1,406,086 | | | 26,434,417 |
| Salesforce.com, Inc. (a) | | 229,400 | | | 13,699,768 |
| VeriSign, Inc. (a) | | 926,000 | | | 32,224,800 |
| | | | | |
| | | | | $ | 140,541,204 |
| Computer Software - Systems - 5.2% | | | | | |
| Apple Computer, Inc. (a) | | 153,290 | | $ | 19,164,316 |
| EMC Corp. (a) | | 1,063,470 | | | 16,526,324 |
| Hewlett-Packard Co. | | 493,100 | | | 23,555,387 |
| International Business Machines Corp. | | 327,680 | | | 37,309,645 |
| Network Appliance, Inc. (a) | | 681,400 | | | 14,731,868 |
| | | | | |
| | | | | $ | 111,287,540 |
| Conglomerates - 0.4% | | | | | |
| Siemens AG | | 69,400 | | $ | 8,864,596 |
| | |
| Consumer Goods & Services - 3.5% | | | | | |
| Avon Products, Inc. | | 730,330 | | $ | 27,796,360 |
| Estee Lauder Cos., Inc., “A” | | 255,700 | | | 10,887,706 |
| Priceline.com, Inc. (a)(l) | | 59,900 | | | 6,829,798 |
| Procter & Gamble Co. | | 362,290 | | | 23,976,352 |
| Strayer Education, Inc. | | 33,500 | | | 5,215,950 |
| | | | | |
| | | | | $ | 74,706,166 |
| Electrical Equipment - 1.8% | | | | | |
| Danaher Corp. | | 264,480 | | $ | 19,611,192 |
| General Electric Co. | | 306,030 | | | 10,141,834 |
| Tyco Electronics Ltd. | | 261,200 | | | 8,593,480 |
| | | | | |
| | | | | $ | 38,346,506 |
6
Portfolio of Investments (unaudited) – continued
| | | | | |
| Issuer | | Shares/Par | | Value ($) |
| | | | | |
| Common Stocks - continued | | | | | |
| Electronics - 2.8% | | | | | |
| Flextronics International Ltd. (a) | | 730,200 | | $ | 7,404,228 |
| Intel Corp. | | 1,235,290 | | | 24,644,036 |
| Intersil Corp., “A” | | 607,000 | | | 14,124,890 |
| Nintendo Co. Ltd. | | 29,800 | | | 14,785,508 |
| | | | | |
| | | | | $ | 60,958,662 |
| Energy - Independent - 2.7% | | | | | |
| Apache Corp. | | 202,800 | | $ | 23,263,188 |
| Ultra Petroleum Corp. (a) | | 79,790 | | | 6,261,121 |
| XTO Energy, Inc. | | 466,087 | | | 28,762,229 |
| | | | | |
| | | | | $ | 58,286,538 |
| Energy - Integrated - 2.1% | | | | | |
| Hess Corp. | | 310,660 | | $ | 28,947,299 |
| Marathon Oil Corp. | | 299,600 | | | 15,926,736 |
| | | | | |
| | | | | $ | 44,874,035 |
| Engineering - Construction - 0.7% | | | | | |
| Fluor Corp. | | 41,800 | | $ | 5,820,650 |
| Foster Wheeler Ltd. (a) | | 61,400 | | | 4,018,630 |
| Quanta Services, Inc. (a)(l) | | 254,800 | | | 6,084,624 |
| | | | | |
| | | | | $ | 15,923,904 |
| Food & Beverages - 5.1% | | | | | |
| Archer Daniels Midland Co. | | 256,100 | | $ | 11,550,110 |
| Coca-Cola Co. | | 181,200 | | | 10,592,952 |
| General Mills, Inc. | | 439,300 | | | 24,596,407 |
| Nestle S.A. | | 79,246 | | | 37,824,107 |
| PepsiCo, Inc. | | 368,320 | | | 25,620,339 |
| | | | | |
| | | | | $ | 110,183,915 |
| Food & Drug Stores - 1.7% | | | | | |
| CVS Caremark Corp. | | 923,036 | | $ | 37,272,194 |
| | |
| Gaming & Lodging - 1.4% | | | | | |
| International Game Technology | | 254,880 | | $ | 11,507,832 |
| Royal Caribbean Cruises Ltd. (l) | | 556,350 | | | 19,477,814 |
| | | | | |
| | | | | $ | 30,985,646 |
| General Merchandise - 2.4% | | | | | |
| Costco Wholesale Corp. | | 224,100 | | $ | 13,876,272 |
| Kohl’s Corp. (a) | | 351,100 | | | 15,602,884 |
| Wal-Mart Stores, Inc. | | 446,900 | | | 22,161,771 |
| | | | | |
| | | | | $ | 51,640,927 |
7
Portfolio of Investments (unaudited) – continued
| | | | | |
| Issuer | | Shares/Par | | Value ($) |
| | | | | |
| Common Stocks - continued | | | | | |
| Health Maintenance Organizations - 0.4% | | | | | |
| WellPoint, Inc. (a) | | 128,780 | | $ | 9,024,903 |
| | |
| Insurance - 1.5% | | | | | |
| Aflac, Inc. | | 162,440 | | $ | 10,137,880 |
| MetLife, Inc. | | 372,200 | | | 21,684,372 |
| | | | | |
| | | | | $ | 31,822,252 |
| Internet - 1.6% | | | | | |
| Google, Inc., “A” (a) | | 72,855 | | $ | 34,327,819 |
| | |
| Leisure & Toys - 1.1% | | | | | |
| Activision, Inc. (a) | | 834,900 | | $ | 22,751,025 |
| | |
| Machinery & Tools - 0.8% | | | | | |
| Bucyrus International, Inc., “A” | | 172,200 | | $ | 17,199,336 |
| | |
| Major Banks - 3.0% | | | | | |
| Bank of New York Mellon Corp. | | 595,915 | | $ | 26,142,791 |
| JPMorgan Chase & Co. | | 249,300 | | | 10,134,045 |
| State Street Corp. | | 362,350 | | | 28,462,593 |
| | | | | |
| | | | | $ | 64,739,429 |
| Medical & Health Technology & Services - 0.7% | | | | | |
| Laboratory Corp. of America Holdings (a) | | 198,900 | | $ | 15,376,959 |
| | |
| Medical Equipment - 7.6% | | | | | |
| Baxter International, Inc. | | 237,200 | | $ | 13,999,544 |
| Becton, Dickinson & Co. | | 383,500 | | | 34,676,070 |
| C.R. Bard, Inc. | | 122,800 | | | 11,640,212 |
| Medtronic, Inc. | | 765,540 | | | 37,787,054 |
| St. Jude Medical, Inc. (a) | | 408,090 | | | 17,539,708 |
| Synthes, Inc. | | 115,700 | | | 16,188,995 |
| Thermo Fisher Scientific, Inc. (a)(l) | | 538,250 | | | 30,104,323 |
| | | | | |
| | | | | $ | 161,935,906 |
| | |
| Metals & Mining - 0.9% | | | | | |
| Companhia Vale do Rio Doce, ADR | | 560,900 | | $ | 19,541,756 |
| | |
| Network & Telecom - 5.5% | | | | | |
| Cisco Systems, Inc. (a) | | 1,427,280 | | $ | 34,782,814 |
| Corning, Inc. | | 824,300 | | | 19,148,489 |
| Nokia Corp., ADR | | 598,010 | | | 21,534,340 |
8
Portfolio of Investments (unaudited) – continued
| | | | | |
| Issuer | | Shares/Par | | Value ($) |
| | | | | |
| Common Stocks - continued | | | | | |
| Network & Telecom - continued | | | | | |
| QUALCOMM, Inc. | | 333,620 | | $ | 14,135,479 |
| Research in Motion Ltd. (a) | | 272,060 | | | 28,239,828 |
| | | | | |
| | | | | $ | 117,840,950 |
| Oil Services - 3.3% | | | | | |
| Halliburton Co. | | 492,100 | | $ | 18,847,430 |
| Schlumberger Ltd. | | 323,700 | | | 27,983,865 |
| Weatherford International Ltd. (a) | | 349,100 | | | 24,059,972 |
| | | | | |
| | | | | $ | 70,891,267 |
| Personal Computers & Peripherals - 0.6% | | | | | |
| Nuance Communications, Inc. (a) | | 797,200 | | $ | 13,113,940 |
| | |
| Pharmaceuticals - 4.5% | | | | | |
| Abbott Laboratories | | 651,440 | | $ | 34,884,612 |
| Elan Corp. PLC, ADR (a) | | 299,120 | | | 6,810,962 |
| Merck & Co., Inc. | | 481,360 | | | 21,324,248 |
| Merck KGaA | | 35,400 | | | 4,398,123 |
| Roche Holding AG | | 143,360 | | | 28,116,914 |
| | | | | |
| | | | | $ | 95,534,859 |
| Printing & Publishing - 0.4% | | | | | |
| McGraw-Hill Cos., Inc. | | 203,800 | | $ | 8,341,534 |
| | |
| Railroad & Shipping - 1.1% | | | | | |
| Norfolk Southern Corp. | | 107,000 | | $ | 5,659,230 |
| Union Pacific Corp. | | 138,200 | | | 17,241,832 |
| | | | | |
| | | | | $ | 22,901,062 |
| Restaurants - 0.8% | | | | | |
| YUM! Brands, Inc. | | 477,000 | | $ | 16,432,650 |
| | |
| Specialty Chemicals - 1.3% | | | | | |
| Bunge Ltd. | | 38,200 | | $ | 4,234,088 |
| Praxair, Inc. | | 299,930 | | | 24,078,380 |
| | | | | |
| | | | | $ | 28,312,468 |
| Specialty Stores - 1.8% | | | | | |
| Lowe’s Cos., Inc. (l) | | 91,930 | | $ | 2,203,562 |
| Nordstrom, Inc. | | 447,880 | | | 16,584,996 |
| Staples, Inc. | | 924,260 | | | 20,564,785 |
| | | | | |
| | | | | $ | 39,353,343 |
9
Portfolio of Investments (unaudited) – continued
| | | | | | |
| Issuer | | Shares/Par | | Value ($) |
| | | | | | |
| Common Stocks - continued | | | | | | |
| Telecommunications - Wireless - 2.8% | | | | | | |
| America Movil S.A.B. de C.V., “L”, ADR | | | 640,960 | | $ | 38,752,442 |
| Rogers Communications, Inc., “B” | | | 552,400 | | | 21,852,944 |
| | | | | | |
| | | | | | $ | 60,605,386 |
| Utilities - Electric Power - 0.4% | | | | | | |
| AES Corp. (a) | | | 469,090 | | $ | 8,434,238 |
| Total Common Stocks (Identified Cost, $2,107,117,413) | | | | | $ | 2,058,130,247 |
| | |
| Repurchase Agreements - 3.7% | | | | | | |
| Merrill Lynch & Co., 3.20%, dated 2/29/08, due 3/03/08, total to be received $79,144,099 (secured by various U.S. Treasury and Federal Agency obligations and Mortgage Backed securities in a jointly traded account), at Cost | | $ | 79,123,000 | | $ | 79,123,000 |
| | |
| Collateral for Securities Loaned - 1.8% | | | | | | |
Navigator Securities Lending Prime Portfolio,
at Cost and Net Asset Value | | | 40,037,641 | | $ | 40,037,641 |
| Total Investments (Identified Cost, $2,226,278,054) (k) | | | | | $ | 2,177,290,888 |
| | |
| Other Assets, Less Liabilities - (1.4)% | | | | | | (31,073,771) |
| Net Assets - 100.0% | | | | | $ | 2,146,217,117 |
| (a) | Non-income producing security. |
| (k) | As of February 29, 2008, the fund had nine securities that were fair valued, aggregating $141,597,122 and 6.50% of market value, in accordance with the policies adopted by the Board of Trustees. |
| (l) | All or a portion of this security is on loan. |
The following abbreviations are used in this report and are defined:
| ADR | | American Depository Receipt |
See Notes to Financial Statements
10
Financial Statements
STATEMENT OF ASSETS AND LIABILITIES
At 2/29/08 (unaudited)
This statement represents your fund’s balance sheet, which details the assets and liabilities comprising the total value of the fund.
| | | | | |
| Assets | | | | | |
| Investments, at value, including $39,468,757 of securities on loan (identified cost, $2,226,278,054) | | $2,177,290,888 | | | |
| Cash | | 652 | | | |
| Receivable for investments sold | | 67,315,967 | | | |
| Receivable for fund shares sold | | 1,396,590 | | | |
| Interest and dividends receivable | | 1,787,287 | | | |
| Other assets | | 40,855 | | | |
| Total assets | | | | | $2,247,832,239 |
| Liabilities | | | | | |
| Payable for investments purchased | | $55,484,456 | | | |
| Payable for fund shares reacquired | | 4,975,503 | | | |
| Collateral for securities loaned, at value (c) | | 40,037,641 | | | |
| Payable to affiliates | | | | | |
Management fee | | 78,318 | | | |
Shareholder servicing costs | | 527,959 | | | |
Distribution and service fees | | 35,064 | | | |
Administrative services fee | | 1,521 | | | |
Retirement plan administration and services fees | | 51 | | | |
| Payable for independent trustees’ compensation | | 105,820 | | | |
| Accrued expenses and other liabilities | | 368,789 | | | |
| Total liabilities | | | | | $101,615,122 |
| Net assets | | | | | $2,146,217,117 |
| Net assets consist of: | | | | | |
| Paid-in capital | | $3,318,075,242 | | | |
| Unrealized appreciation (depreciation) on investments and translation of assets and liabilities in foreign currencies | | (48,987,128 | ) | | |
| Accumulated net realized gain (loss) on investments and foreign currency transactions | | (1,122,425,979 | ) | | |
| Accumulated net investment loss | | (445,018 | ) | | |
| Net assets | | | | | $2,146,217,117 |
| Shares of beneficial interest outstanding | | | | | 111,387,996 |
11
Statement of Assets and Liabilities (unaudited) – continued
| | | | |
| Class A shares: | | | | |
Net assets | | $804,813,395 | | |
Shares outstanding | | 41,988,073 | | |
Net asset value per share | | | | $19.17 |
Offering price per share (100 / 94.25 × net asset value per share) | | | | $20.34 |
| Class B shares: | | | | |
Net assets | | $235,779,229 | | |
Shares outstanding | | 12,987,433 | | |
Net asset value and offering price per share | | | | $18.15 |
| Class C shares: | | | | |
Net assets | | $97,380,974 | | |
Shares outstanding | | 5,364,234 | | |
Net asset value and offering price per share | | | | $18.15 |
| Class I shares | | | | |
Net assets | | $946,765,772 | | |
Shares outstanding | | 47,836,874 | | |
Net asset value, offering price, and redemption price per share | | | | $19.79 |
| Class W shares | | | | |
Net assets | | $378,107 | | |
Shares outstanding | | 19,628 | | |
Net asset value, offering price, and redemption price per share | | | | $19.26 |
| Class R shares: | | | | |
Net assets | | $1,965,157 | | |
Shares outstanding | | 103,265 | | |
Net asset value, offering price, and redemption price per share | | | | $19.03 |
| Class R1 shares: | | | | |
Net assets | | $2,430,292 | | |
Shares outstanding | | 134,272 | | |
Net asset value, offering price, and redemption price per share | | | | $18.10 |
| Class R2 shares | | | | |
Net assets | | $1,743,959 | | |
Shares outstanding | | 95,386 | | |
Net asset value, offering price, and redemption price per share | | | | $18.28 |
| Class R3 shares | | | | |
Net assets | | $9,283,031 | | |
Shares outstanding | | 491,712 | | |
Net asset value, offering price, and redemption price per share | | | | $18.88 |
12
Statement of Assets and Liabilities (unaudited) – continued
| | | | |
| Class R4 shares | | | | |
Net assets | | $3,643,977 | | |
Shares outstanding | | 190,360 | | |
Net asset value, offering price, and redemption price per share | | | | $19.14 |
| Class R5 shares | | | | |
Net assets | | $42,033,224 | | |
Shares outstanding | | 2,176,759 | | |
Net asset value, offering price, and redemption price per share | | | | $19.31 |
| (c) | Non-cash collateral is not included. |
On sales of $50,000 or more, the offering price of Class A shares is reduced. A contingent deferred sales charge may be imposed on redemptions of Class A, Class B, and Class C shares.
See Notes to Financial Statements
13
Financial Statements
STATEMENT OF OPERATIONS
Six months ended 2/29/08 (unaudited)
This statement describes how much your fund earned in investment income and accrued in expenses. It also describes any gains and/or losses generated by fund operations.
| | | | | | |
| Net investment loss | | | | | | |
| Income | | | | | | |
Dividends | | $11,198,846 | | | | |
Interest | | 2,197,170 | | | | |
Foreign taxes withheld | | (23,760 | ) | | | |
| Total investment income | | | | | $13,372,256 | |
| Expenses | | | | | | |
Management fee | | $8,155,878 | | | | |
Distribution and service fees | | 3,559,958 | | | | |
Shareholder servicing costs | | 1,878,498 | | | | |
Administrative services fee | | 165,587 | | | | |
Retirement plan administration and services fees | | 25,724 | | | | |
Independent trustees’ compensation | | 24,871 | | | | |
Custodian fee | | 191,013 | | | | |
Shareholder communications | | 85,846 | | | | |
Auditing fees | | 23,685 | | | | |
Legal fees | | 22,743 | | | | |
Miscellaneous | | 92,862 | | | | |
| Total expenses | | | | | $14,226,665 | |
Fees paid indirectly | | (10,246 | ) | | | |
Reduction of expenses by investment adviser | | (502,528 | ) | | | |
| Net expenses | | | | | $13,713,891 | |
| Net investment loss | | | | | $(341,635 | ) |
| Realized and unrealized gain (loss) on investments | | | | | | |
| Realized gain (loss) (identified cost basis) | | | | | | |
Investment transactions | | $50,404,478 | | | | |
Foreign currency transactions | | (36,672 | ) | | | |
Net realized gain (loss) on investments
and foreign currency transactions | | | | | $50,367,806 | |
| Change in unrealized appreciation (depreciation) | | | | | | |
Investments | | $(86,971,556 | ) | | | |
Translation of assets and liabilities in foreign currencies | | (69 | ) | | | |
Net unrealized gain (loss) on investments
and foreign currency translation | | | | | $(86,971,625 | ) |
Net realized and unrealized gain (loss) on investments
and foreign currency | | | | | $(36,603,819 | ) |
| Change in net assets from operations | | | | | $(36,945,454 | ) |
See Notes to Financial Statements
14
Financial Statements
STATEMENTS OF CHANGES IN NET ASSETS
These statements describe the increases and/or decreases in net assets resulting from operations, any distributions, and any shareholder transactions.
| | | | | | |
| | | Six months ended
2/29/08 (unaudited) | | | Year ended
8/31/07 | |
| | | |
| Change in net assets | | | | |
| From operations | | | | | | |
| Net investment loss | | $(341,635 | ) | | $(2,457,741 | ) |
Net realized gain (loss) on investments and
foreign currency transactions | | 50,367,806 | | | 264,355,416 | |
Net unrealized gain (loss) on investments and
foreign currency translation | | (86,971,625 | ) | | (139,219,680 | ) |
| Change in net assets from operations | | $(36,945,454 | ) | | $122,677,995 | |
| Distributions declared to shareholders | | | | | | |
| From net realized gain on investments | | | | | | |
Class A | | $(34,441,598 | ) | | $(9,377,980 | ) |
Class B | | (10,938,096 | ) | | (3,077,555 | ) |
Class C | | (4,235,459 | ) | | (1,080,474 | ) |
Class I | | (36,960,658 | ) | | (633,987 | ) |
Class W | | (15,000 | ) | | (1,875 | ) |
Class R | | (77,392 | ) | | (106,755 | ) |
Class R1 | | (115,039 | ) | | (10,327 | ) |
Class R2 | | (73,024 | ) | | (20,208 | ) |
Class R3 | | (378,532 | ) | | (40,449 | ) |
Class R4 | | (130,271 | ) | | (5,764 | ) |
Class R5 | | (1,655,694 | ) | | (670,116 | ) |
| Total distributions declared to shareholders | | $(89,020,763 | ) | | $(15,025,490 | ) |
| Change in net assets from fund share transactions | | $(143,085,998 | ) | | $1,535,385,457 | |
| Total change in net assets | | $(269,052,215 | ) | | $1,643,037,962 | |
| Net assets | | | | | | |
| At beginning of period | | 2,415,269,332 | | | 772,231,370 | |
| At end of period (including accumulated net investment loss of $445,018 and $103,383, respectively) | | $2,146,217,117 | | | $2,415,269,332 | |
See Notes to Financial Statements
15
Financial Statements
FINANCIAL HIGHLIGHTS
The financial highlights table is intended to help you understand the fund’s financial performance for the semiannual period and the past 5 fiscal years (or life of a particular share class, if shorter). Certain information reflects financial results for a single fund share. The total returns in the table represent the rate by which an investor would have earned (or lost) on an investment in the fund share class (assuming reinvestment of all distributions) held for the entire period.
| | | | | | | | | | | | | | | | | | |
| | | Six months
ended
2/29/08 (unaudited) | | | Years ended 8/31 | |
| Class A | | | 2007 | | | 2006 | | | 2005 | | | 2004 | | | 2003 | |
| | | | | | | | | | | | | | | | | |
| Net asset value, beginning of period | | $20.35 | | | $17.70 | | | $16.82 | | | $14.71 | | | $14.41 | | | $13.22 | |
| Income (loss) from investment operations | | | | | | | | | | | | | | | | |
Net investment loss (d) | | $(0.01 | ) | | $(0.02 | ) | | $(0.05 | ) | | $(0.01 | ) | | $(0.07 | ) | | $(0.07 | ) |
Net realized and unrealized gain (loss) on investments and foreign currency | | (0.37 | ) | | 3.01 | | | 0.93 | | | 2.12 | | | 0.37 | | | 1.26 | |
| Total from investment operations | | $(0.38 | ) | | $2.99 | | | $0.88 | | | $2.11 | | | $0.30 | | | $1.19 | |
| Less distributions declared to shareholders | | | | | | | | | | | | | | | | |
From net realized gain on investments | | $(0.80 | ) | | $(0.34 | ) | | $— | | | $— | | | $— | | | $— | |
| Net asset value, end of period | | $19.17 | | | $20.35 | | | $17.70 | | | $16.82 | | | $14.71 | | | $14.41 | |
| Total return (%) (r)(s)(t) | | (2.17 | )(n) | | 17.07 | | | 5.23 | | | 14.34 | | | 2.08 | (b) | | 9.00 | |
| Ratios (%) (to average net assets) and Supplemental data: | | | | | | | | | | | | | | | | | | |
| Expenses before expense reductions (f) | | 1.25 | (a) | | 1.33 | | | 1.44 | | | 1.38 | | | 1.41 | | | 1.42 | |
| Expenses after expense reductions (f) | | 1.21 | (a) | | 1.25 | | | 1.34 | | | 1.28 | | | 1.36 | | | N/A | |
| Net investment loss | | (0.07 | )(a) | | (0.11 | ) | | (0.31 | ) | | (0.08 | ) | | (0.47 | ) | | (0.52 | ) |
| Portfolio turnover | | 127 | | | 329 | | | 245 | | | 184 | | | 261 | | | 312 | |
| Net assets at end of period (000 Omitted) | | $804,813 | | | $935,865 | | | $504,761 | | | $632,209 | | | $404,511 | | | $496,271 | |
See Notes to Financial Statements
16
Financial Highlights – continued
| | | | | | | | | | | | | | | | | | |
| | | Six months
ended
2/29/08 (unaudited) | | | Years ended 8/31 | |
| Class B | | | 2007 | | | 2006 | | | 2005 | | | 2004 | | | 2003 | |
| | | | | | | | | | | | | | | | | |
| Net asset value, beginning of period | | $19.38 | | | $16.98 | | | $16.24 | | | $14.30 | | | $14.09 | | | $13.01 | |
| Income (loss) from investment operations | | | | | | | | | | | | | | | | |
Net investment loss (d) | | $(0.07 | ) | | $(0.14 | ) | | $(0.16 | ) | | $(0.11 | ) | | $(0.16 | ) | | $(0.15 | ) |
Net realized and unrealized gain (loss) on investments and foreign currency | | (0.36 | ) | | 2.88 | | | 0.90 | | | 2.05 | | | 0.37 | | | 1.23 | |
| Total from investment operations | | $(0.43 | ) | | $2.74 | | | $0.74 | | | $1.94 | | | $0.21 | | | $1.08 | |
| Less distributions declared to shareholders | | | | | | | | | | | | | | | | |
From net realized gain on investments | | $(0.80 | ) | | $(0.34 | ) | | $— | | | $— | | | $— | | | $— | |
| Net asset value, end of period | | $18.15 | | | $19.38 | | | $16.98 | | | $16.24 | | | $14.30 | | | $14.09 | |
| Total return (%) (r)(s)(t) | | (2.54 | )(n) | | 16.31 | | | 4.56 | | | 13.57 | | | 1.49 | (b) | | 8.22 | |
| Ratios (%) (to average net assets) and Supplemental data: | | | | | | | | | | | | | | | | | | |
| Expenses before expense reductions (f) | | 1.90 | (a) | | 1.98 | | | 2.09 | | | 2.03 | | | 2.05 | | | 2.07 | |
| Expenses after expense reductions (f) | | 1.86 | (a) | | 1.90 | | | 1.99 | | | 1.93 | | | 2.00 | | | N/A | |
| Net investment loss | | (0.72 | )(a) | | (0.77 | ) | | (0.96 | ) | | (0.73 | ) | | (1.11 | ) | | (1.18 | ) |
| Portfolio turnover | | 127 | | | 329 | | | 245 | | | 184 | | | 261 | | | 312 | |
| Net assets at end of period (000 Omitted) | | $235,779 | | | $303,614 | | | $162,868 | | | $201,513 | | | $138,226 | | | $155,602 | |
See Notes to Financial Statements
17
Financial Highlights – continued
| | | | | | | | | | | | | | | | | | |
| | | Six months
ended
2/29/08 (unaudited) | | | Years ended 8/31 | |
| Class C | | | 2007 | | | 2006 | | | 2005 | | | 2004 | | | 2003 | |
| | | | | | | | | | | | | | | | | |
| Net asset value, beginning of period | | $19.38 | | | $16.98 | | | $16.23 | | | $14.30 | | | $14.10 | | | $13.02 | |
| Income (loss) from investment operations | | | | | | | | | | | | | | | | |
Net investment loss (d) | | $(0.07 | ) | | $(0.14 | ) | | $(0.16 | ) | | $(0.11 | ) | | $(0.16 | ) | | $(0.15 | ) |
Net realized and unrealized gain (loss) on investments and foreign currency | | (0.36 | ) | | 2.88 | | | 0.91 | | | 2.04 | | | 0.36 | | | 1.23 | |
| Total from investment operations | | $(0.43 | ) | | $2.74 | | | $0.75 | | | $1.93 | | | $0.20 | | | $1.08 | |
| Less distributions declared to shareholders | | | | | | | | | | | | | | | | |
From net realized gain on investments | | $(0.80 | ) | | $(0.34 | ) | | $— | | | $— | | | $— | | | $— | |
| Net asset value, end of period | | $18.15 | | | $19.38 | | | $16.98 | | | $16.23 | | | $14.30 | | | $14.10 | |
| Total return (%) (r)(s)(t) | | (2.54 | )(n) | | 16.31 | | | 4.62 | | | 13.50 | | | 1.42 | (b) | | 8.29 | |
Ratios (%) (to average net assets)
and Supplemental data: | | | | | | | | | | | | | | | | | | |
| Expenses before expense reductions (f) | | 1.90 | (a) | | 1.98 | | | 2.09 | | | 2.03 | | | 2.05 | | | 2.07 | |
| Expenses after expense reductions (f) | | 1.86 | (a) | | 1.90 | | | 1.99 | | | 1.93 | | | 2.00 | | | N/A | |
| Net investment loss | | (0.72 | )(a) | | (0.76 | ) | | (0.96 | ) | | (0.69 | ) | | (1.12 | ) | | (1.18 | ) |
| Portfolio turnover | | 127 | | | 329 | | | 245 | | | 184 | | | 261 | | | 312 | |
Net assets at end of period
(000 Omitted) | | $97,381 | | | $108,950 | | | $58,523 | | | $82,182 | | | $91,225 | | | $110,786 | |
See Notes to Financial Statements
18
Financial Highlights – continued
| | | | | | | | | | | | | | | | | |
| | | Six months
ended
2/29/08 (unaudited) | | | Years ended 8/31 | |
| Class I | | | 2007 | | | 2006 | | | 2005 | | 2004 | | | 2003 | |
| | | | | | | | | | | | | | | | |
| Net asset value, beginning of period | | $20.96 | | | $18.15 | | | $17.18 | | | $14.98 | | $14.63 | | | $13.37 | |
| Income (loss) from investment operations | | | | | | | | | | | | | | | |
Net investment income (loss) (d) | | $0.03 | | | $0.01 | | | $0.00 | (w) | | $0.05 | | $(0.02 | ) | | $(0.02 | ) |
Net realized and unrealized gain (loss)
on investments and foreign currency | | (0.40 | ) | | 3.14 | | | 0.97 | | | 2.15 | | 0.37 | | | 1.28 | |
| Total from investment operations | | $(0.37 | ) | | $3.15 | | | $0.97 | | | $2.20 | | $0.35 | | | $1.26 | |
| Less distributions declared to shareholders | | | | | | | | | | | | | | | |
From net realized gain on investments | | $(0.80 | ) | | $(0.34 | ) | | $— | | | $— | | $— | | | $— | |
| Net asset value, end of period | | $19.79 | | | $20.96 | | | $18.15 | | | $17.18 | | $14.98 | | | $14.63 | |
| Total return (%) (r)(s) | | (2.06 | )(n) | | 17.53 | | | 5.65 | | | 14.69 | | 2.39 | (b) | | 9.42 | |
Ratios (%) (to average net assets)
and Supplemental data: | | | | | | | | | | | | | | | | | |
| Expenses before expense reductions (f) | | 0.90 | (a) | | 0.93 | | | 1.06 | | | 1.02 | | 1.06 | | | 1.07 | |
| Expenses after expense reductions (f) | | 0.86 | (a) | | 0.89 | | | 0.96 | | | 0.92 | | 1.01 | | | N/A | |
| Net investment income (loss) | | 0.27 | (a) | | 0.06 | | | 0.03 | | | 0.32 | | (0.11 | ) | | (0.16 | ) |
| Portfolio turnover | | 127 | | | 329 | | | 245 | | | 184 | | 261 | | | 312 | |
Net assets at end of period
(000 Omitted) | | $946,766 | | | $1,010,075 | | | $34,998 | | | $3,816 | | $4,136 | | | $4,317 | |
See Notes to Financial Statements
19
Financial Highlights – continued
| | | | | | | | | |
| | | Six months
ended
2/29/08 (unaudited) | | | Years ended 8/31 | |
| Class W | | | 2007 | | | 2006 (i) | |
| | | | | | | | |
| Net asset value, beginning of period | | $20.43 | | | $17.72 | | | $18.35 | |
| Income (loss) from investment operations | | | | | | | | | |
Net investment income (loss) (d) | | $0.02 | | | $0.05 | | | $(0.00) | (w) |
Net realized and unrealized gain (loss)
on investments and foreign currency | | (0.39 | ) | | 3.00 | | | (0.63 | )(g) |
| Total from investment operations | | $(0.37 | ) | | $3.05 | | | $(0.63 | ) |
| Less distributions declared to shareholders | | | | | | | | | |
From net realized gain on investments | | $(0.80 | ) | | $(0.34 | ) | | $— | |
| Net asset value, end of period | | $19.26 | | | $20.43 | | | $17.72 | |
| Total return (%) (r)(s) | | (2.11 | )(n) | | 17.39 | | | (3.43 | )(n) |
Ratios (%) (to average net assets)
and Supplemental data: | | | | | | | | | |
| Expenses before expense reductions (f) | | 1.00 | (a) | | 1.07 | | | 1.18 | (a) |
| Expenses after expense reductions (f) | | 0.96 | (a) | | 0.99 | | | 1.08 | (a) |
| Net investment income (loss) | | 0.17 | (a) | | 0.27 | | | (0.03 | )(a) |
| Portfolio turnover | | 127 | | | 329 | | | 245 | |
Net assets at end of period
(000 Omitted) | | $378 | | | $373 | | | $97 | |
See Notes to Financial Statements
20
Financial Highlights – continued
| | | | | | | | | | | | | | | | | | |
| | | Six months
ended
2/29/08 (unaudited) | | | Years ended 8/31 | |
| Class R | | | 2007 | | | 2006 | | | 2005 | | | 2004 | | | 2003 (i) | |
| | | | | | | | | | | | | | | | | |
| Net asset value, beginning of period | | $20.23 | | | $17.62 | | | $16.77 | | | $14.69 | | | $14.41 | | | $12.35 | |
| Income (loss) from investment operations | | | | | | | | | | | | | | | | | | |
Net investment loss (d) | | $(0.02 | ) | | $(0.05 | ) | | $(0.08 | ) | | $(0.04 | ) | | $(0.09 | ) | | $(0.08 | ) |
Net realized and unrealized gain (loss) on investments and foreign currency | | (0.38 | ) | | 3.00 | | | 0.93 | | | 2.12 | | | 0.37 | | | 2.14 | (g) |
| Total from investment operations | | $(0.40 | ) | | $2.95 | | | $0.85 | | | $2.08 | | | $0.28 | | | $2.06 | |
| Less distributions declared to shareholders | | | | | | | | | | | | | | | | | | |
From net realized gain on investments | | $(0.80 | ) | | $(0.34 | ) | | $— | | | $— | | | $— | | | $— | |
| Net asset value, end of period | | $19.03 | | | $20.23 | | | $17.62 | | | $16.77 | | | $14.69 | | | $14.41 | |
| Total return (%) (r)(s) | | (2.28 | )(n) | | 16.92 | | | 5.07 | | | 14.16 | | | 1.94 | (b) | | 16.68 | (n) |
Ratios (%) (to average net assets)
and Supplemental data: | | | | | | | | | | | | | | | | | | |
| Expenses before expense reductions (f) | | 1.40 | (a) | | 1.49 | | | 1.59 | | | 1.54 | | | 1.56 | | | 1.65 | (a) |
| Expenses after expense reductions (f) | | 1.35 | (a) | | 1.40 | | | 1.49 | | | 1.44 | | | 1.51 | | | N/A | |
| Net investment loss | | (0.17 | )(a) | | (0.25 | ) | | (0.46 | ) | | (0.25 | ) | | (0.60 | ) | | (0.82 | )(a) |
| Portfolio turnover | | 127 | | | 329 | | | 245 | | | 184 | | | 261 | | | 312 | |
Net assets at end of period
(000 Omitted) | | $1,965 | | | $4,358 | | | $5,735 | | | $5,904 | | | $3,266 | | | $1,869 | |
See Notes to Financial Statements
21
Financial Highlights – continued
| | | | | | | | | | | | |
| | | Six months
ended
2/29/08 (unaudited) | | | Years ended 8/31 | |
| Class R1 | | | 2007 | | | 2006 | | | 2005 (i) | |
| | | | | | | | | | | |
| Net asset value, beginning of period | | $19.33 | | | $16.95 | | | $16.23 | | | $15.35 | |
| Income (loss) from investment operations | | | | | | | | | | | | |
Net investment loss (d) | | $(0.09 | ) | | $(0.15 | ) | | $(0.17 | ) | | $(0.08 | ) |
Net realized and unrealized gain (loss)
on investments and foreign currency | | (0.34 | ) | | 2.87 | | | 0.89 | | | 0.96 | (g) |
| Total from investment operations | | $(0.43 | ) | | $2.72 | | | $0.72 | | | $0.88 | |
| Less distributions declared to shareholders | | | | | | | | | | | | |
From net realized gain on investments | | $(0.80 | ) | | $(0.34 | ) | | $— | | | $— | |
| Net asset value, end of period | | $18.10 | | | $19.33 | | | $16.95 | | | $16.23 | |
| Total return (%) (r)(s) | | (2.55 | )(n) | | 16.22 | | | 4.44 | | | 5.73 | (n) |
Ratios (%) (to average net assets)
and Supplemental data: | | | | | | | | | | | | |
| Expenses before expense reductions (f) | | 2.01 | (a) | | 2.12 | | | 2.28 | | | 2.35 | (a) |
| Expenses after expense reductions (f) | | 1.97 | (a) | | 2.00 | | | 2.09 | | | 2.25 | (a) |
| Net investment loss | | (0.87 | )(a) | | (0.89 | ) | | (1.07 | ) | | (1.21 | )(a) |
| Portfolio turnover | | 127 | | | 329 | | | 245 | | | 184 | |
Net assets at end of period
(000 Omitted) | | $2,430 | | | $1,517 | | | $506 | | | $80 | |
See Notes to Financial Statements
22
Financial Highlights – continued
| | | | | | | | | | | | |
| | | Six months
ended
2/29/08 (unaudited) | | | Years ended 8/31 | |
| Class R2 | | | 2007 | | | 2006 | | | 2005 (i) | |
| | | | | | | | | | | |
| Net asset value, beginning of period | | $19.48 | | | $17.03 | | | $16.25 | | | $15.35 | |
| Income (loss) from investment operations | | | | | | | | | | | | |
Net investment loss (d) | | $(0.04 | ) | | $(0.10 | ) | | $(0.11 | ) | | $(0.04 | ) |
Net realized and unrealized gain (loss)
on investments and foreign currency | | (0.36 | ) | | 2.89 | | | 0.89 | | | 0.94 | (g) |
| Total from investment operations | | $(0.40 | ) | | $2.79 | | | $0.78 | | | $0.90 | |
| Less distributions declared to shareholders | | | | | | | | | | | | |
From net realized gain on investments | | $(0.80 | ) | | $(0.34 | ) | | $— | | | $— | |
| Net asset value, end of period | | $18.28 | | | $19.48 | | | $17.03 | | | $16.25 | |
| Total return (%) (r)(s) | | (2.37 | )(n) | | 16.56 | | | 4.80 | | | 5.86 | (n) |
Ratios (%) (to average net assets)
and Supplemental data: | | | | | | | | | | | | |
| Expenses before expense reductions (f) | | 1.58 | (a) | | 1.83 | | | 1.97 | | | 2.04 | (a) |
| Expenses after expense reductions (f) | | 1.53 | (a) | | 1.65 | | | 1.73 | | | 1.94 | (a) |
| Net investment loss | | (0.40 | )(a) | | (0.54 | ) | | (0.67 | ) | | (0.67 | )(a) |
| Portfolio turnover | | 127 | | | 329 | | | 245 | | | 184 | |
Net assets at end of period
(000 Omitted) | | $1,744 | | | $2,047 | | | $2,598 | | | $437 | |
See Notes to Financial Statements
23
Financial Highlights – continued
| | | | | | | | | | | | | | | |
| | | Six months
ended
2/29/08 (unaudited) | | | Years ended 8/31 | |
| Class R3 | | | 2007 | | | 2006 | | | 2005 | | | 2004 (i) | |
| | | | | | | | | | | | | | |
| Net asset value, beginning of period | | $20.08 | | | $17.52 | | | $16.70 | | | $14.67 | | | $14.63 | |
| Income (loss) from investment operations | | | | | | | | | | | | | | | |
Net investment loss (d) | | $(0.04 | ) | | $(0.07 | ) | | $(0.11 | ) | | $(0.06 | ) | | $(0.06 | ) |
Net realized and unrealized gain (loss)
on investments and foreign currency | | (0.36 | ) | | 2.97 | | | 0.93 | | | 2.09 | | | 0.10 | (g) |
| Total from investment operations | | $(0.40 | ) | | $2.90 | | | $0.82 | | | $2.03 | | | $0.04 | |
| Less distributions declared to shareholders | | | | | | | | | | | | | | | |
From net realized gain on investments | | $(0.80 | ) | | $(0.34 | ) | | $— | | | $— | | | $— | |
| Net asset value, end of period | | $18.88 | | | $20.08 | | | $17.52 | | | $16.70 | | | $14.67 | |
| Total return (%) (r)(s) | | (2.30 | )(n) | | 16.73 | | | 4.91 | | | 13.84 | | | 0.27 | (b)(n) |
Ratios (%) (to average net assets)
and Supplemental data: | | | | | | | | | | | | | | | |
| Expenses before expense reductions (f) | | 1.50 | (a) | | 1.67 | | | 1.85 | | | 1.82 | | | 1.95 | (a) |
| Expenses after expense reductions (f) | | 1.46 | (a) | | 1.54 | | | 1.65 | | | 1.72 | | | 1.90 | (a) |
| Net investment loss | | (0.35 | )(a) | | (0.37 | ) | | (0.60 | ) | | (0.48 | ) | | (0.48 | )(a) |
| Portfolio turnover | | 127 | | | 329 | | | 245 | | | 184 | | | 261 | |
Net assets at end of period
(000 Omitted) | | $9,283 | | | $5,728 | | | $1,804 | | | $774 | | | $105 | |
See Notes to Financial Statements
24
Financial Highlights – continued
| | | | | | | | | | | | |
| | | Six months
ended
2/29/08 (unaudited) | | | Years ended 8/31 | |
| Class R4 | | | 2007 | | | 2006 | | | 2005 (i) | |
| | | | | | | | | | | |
| Net asset value, beginning of period | | $20.33 | | | $17.69 | | | $16.81 | | | $15.85 | |
| Income (loss) from investment operations | | | | | | | | | | | | |
Net investment loss (d) | | $(0.01 | ) | | $(0.03 | ) | | $(0.06 | ) | | $(0.03 | ) |
Net realized and unrealized gain (loss)
on investments and foreign currency | | (0.38 | ) | | 3.01 | | | 0.94 | | | 0.99 | (g) |
| Total from investment operations | | $(0.39 | ) | | $2.98 | | | $0.88 | | | $0.96 | |
| Less distributions declared to shareholders | | | | | | | | | | | | |
From net realized gain on investments | | $(0.80 | ) | | $(0.34 | ) | | $— | | | $— | |
| Net asset value, end of period | | $19.14 | | | $20.33 | | | $17.69 | | | $16.81 | |
| Total return (%) (r)(s) | | (2.22 | )(n) | | 17.02 | | | 5.23 | | | 6.06 | (n) |
Ratios (%) (to average net assets)
and Supplemental data: | | | | | | | | | | | | |
| Expenses before expense reductions (f) | | 1.25 | (a) | | 1.37 | | | 1.48 | | | 1.56 | (a) |
| Expenses after expense reductions (f) | | 1.21 | (a) | | 1.29 | | | 1.38 | | | 1.46 | (a) |
| Net investment loss | | (0.11 | )(a) | | (0.18 | ) | | (0.36 | ) | | (0.41 | )(a) |
| Portfolio turnover | | 127 | | | 329 | | | 245 | | | 184 | |
Net assets at end of period
(000 Omitted) | | $3,644 | | | $1,641 | | | $286 | | | $53 | |
See Notes to Financial Statements
25
Financial Highlights – continued
| | | | | | | | | | | | |
| | | Six months
ended
2/29/08 (unaudited) | | | Years ended 8/31 | |
| Class R5 | | | 2007 | | | 2006 | | | 2005 (i) | |
| | | | | | | | | | | |
| Net asset value, beginning of period | | $20.47 | | | $17.76 | | | $16.83 | | | $15.85 | |
| Income (loss) from investment operations | | | | | | | | | | | | |
Net investment income (loss) (d) | | $0.02 | | | $0.04 | | | $(0.01 | ) | | $(0.01 | ) |
Net realized and unrealized gain (loss)
on investments and foreign currency | | (0.38 | ) | | 3.01 | | | 0.94 | | | 0.99 | (g) |
| Total from investment operations | | $(0.36 | ) | | $3.05 | | | $0.93 | | | $0.98 | |
| Less distributions declared to shareholders | | | | | | | | | | | | |
From net realized gain on investments | | $(0.80 | ) | | $(0.34 | ) | | $— | | | $— | |
| Net asset value, end of period | | $19.31 | | | $20.47 | | | $17.76 | | | $16.83 | |
| Total return (%) (r)(s) | | (2.06 | )(n) | | 17.35 | | | 5.53 | | | 6.18 | (n) |
Ratios (%) (to average net assets)
and Supplemental data: | | | | | | | | | | | | |
| Expenses before expense reductions (f) | | 0.97 | (a) | | 1.08 | | | 1.19 | | | 1.26 | (a) |
| Expenses after expense reductions (f) | | 0.93 | (a) | | 0.99 | | | 1.09 | | | 1.16 | (a) |
| Net investment income (loss) | | 0.20 | (a) | | 0.21 | | | (0.06 | ) | | (0.11 | )(a) |
| Portfolio turnover | | 127 | | | 329 | | | 245 | | | 184 | |
Net assets at end of period
(000 Omitted) | | $42,033 | | | $41,102 | | | $56 | | | $53 | |
Any redemption fees charged by the fund during the 2004 and 2005 fiscal years resulted in a per share impact of less than $0.01.
| (b) | The fund’s net asset value and total return calculation include a non-recurring accrual recorded as a result of an administrative proceeding regarding disclosure of brokerage allocation practices in connection with fund sales. The non-recurring accrual resulted in an increase in the net asset value of $0.01 per share based on shares outstanding on the day the proceeds were recorded. |
| (d) | Per share data are based on average shares outstanding. |
| (f) | Ratios do not reflect reductions from fees paid indirectly, if applicable. |
| (g) | The per share amount is not in accordance with the net realized and unrealized gain/loss for the period because of the timing of sales of fund shares and the per share amount of realized and unrealized gains and losses at such time. |
| (i) | For the period from the class’ inception, December 31, 2002 (Class R), October 31, 2003 (Class R3), April 1, 2005 (Classes R1, R2, R4, and R5) and May 1, 2006 (Class W) through the stated period end. |
| (r) | Certain expenses have been reduced without which performance would have been lower. |
| (s) | From time to time the fund may receive proceeds from litigation settlements, without which performance would be lower. |
| (t) | Total returns do not include any applicable sales charges. |
| (w) | Per share amount was less than $0.01. |
See Notes to Financial Statements
26
NOTES TO FINANCIAL STATEMENTS
(unaudited)
| (1) | | Business and Organization |
MFS Core Growth Fund (the fund) is a series of MFS Series Trust I (the trust). The trust is organized as a Massachusetts business trust and is registered under the Investment Company Act of 1940, as amended, as an open-end management investment company.
| (2) | | Significant Accounting Policies |
General – The preparation of financial statements in conformity with U.S. generally accepted accounting principles requires management to make estimates and assumptions that affect the reported amounts of assets and liabilities, and disclosure of contingent assets and liabilities at the date of the financial statements and the reported amounts of revenues and expenses during the reporting period. Actual results could differ from those estimates. The fund can invest in foreign securities, including securities of emerging market issuers. Investments in foreign securities are vulnerable to the effects of changes in the relative values of the local currency and the U.S. dollar and to the effects of changes in each country’s legal, political, and economic environment. The markets of emerging markets countries are generally more volatile than the markets of developed countries with more mature economies. All of the risks of investing in foreign securities previously described are heightened when investing in emerging markets countries.
Investment Valuations – Equity securities, including restricted equity securities, are generally valued at the last sale or official closing price as reported by an independent pricing service on the market or exchange on which they are primarily traded. For securities for which there were no sales reported that day, equity securities are generally valued at the last quoted daily bid quotation as reported by an independent pricing service on the market or exchange on which they are primarily traded. For securities held short for which there were no sales reported for the day, the position is generally valued at the last quoted daily ask quotation as reported by an independent pricing service on the market or exchange on which such securities are primarily traded. Short-term instruments with a maturity at issuance of 60 days or less may be valued at amortized cost, which approximates market value. Open-end investment companies are generally valued at net asset value per share. Securities and other assets generally valued on the basis of information from an independent pricing service may also be valued at a broker-dealer bid quotation. The values of foreign securities and other assets and liabilities expressed in foreign currencies are converted to U.S. dollars using the mean of bid and asked prices for rates reported by an independent pricing service.
27
Notes to Financial Statements (unaudited) – continued
The Board of Trustees has delegated primary responsibility for determining or causing to be determined the value of the fund’s investments (including any fair valuation) to the adviser pursuant to valuation policies and procedures approved by the Board. If the adviser determines that reliable market quotations are not readily available, investments are valued at fair value as determined in good faith by the adviser in accordance with such procedures under the oversight of the Board of Trustees. Under the fund’s valuation policies and procedures, market quotations are not considered to be readily available for many types of debt instruments and certain types of derivatives. These investments are generally valued at fair value based on information from independent pricing services. In addition, investments may be valued at fair value if the adviser determines that an investment’s value has been materially affected by events occurring after the close of the exchange or market on which the investment is principally traded (such as foreign exchange or market) and prior to the determination of the fund’s net asset value, or after the halting of trading of a specific security where trading does not resume prior to the close of the exchange or market on which the security is principally traded. Events that occur on a frequent basis after foreign markets close (such as developments in foreign markets and significant movements in the U.S. markets) and prior to the determination of the fund’s net asset value may be deemed to have a material affect on the value of securities traded in foreign markets. Accordingly, the fund’s foreign equity securities may often be valued at fair value. The adviser may rely on independent pricing services or other information (such as the correlation with price movements of similar securities in the same or other markets; the type, cost and investment characteristics of the security; the business and financial condition of the issuer; and trading and other market data) to assist in determining whether to fair value and at what value to fair value an investment. The value of an investment for purposes of calculating the fund’s net asset value can differ depending on the source and method used to determine value. When fair valuation is used, the value of investments used to determine the fund’s net asset value may differ from quoted or published prices for the same investments.
In September 2006, FASB Statement No. 157, Fair Value Measurements (the “Statement”) was issued, and is effective for fiscal years beginning after November 15, 2007 and for all interim periods within those fiscal years. This Statement provides a single definition of fair value, a hierarchy for measuring fair value and expanded disclosures about fair value measurements. Management is evaluating the application of the Statement to the fund, and believes the impact will be limited to expanded disclosures resulting from the adoption of this Statement in the fund’s financial statements.
28
Notes to Financial Statements (unaudited) – continued
Repurchase Agreements – The fund may enter into repurchase agreements with institutions that the fund’s investment adviser has determined are creditworthy. Each repurchase agreement is recorded at cost. The fund requires that the securities collateral in a repurchase transaction be transferred to the custodian in a manner sufficient to enable the fund to obtain those securities in the event of a default under the repurchase agreement. The fund monitors, on a daily basis, the value of the collateral to ensure that its value, including accrued interest, is greater than amounts owed to the fund under each such repurchase agreement. The fund and other funds managed by Massachusetts Financial Services Company (MFS), may utilize a joint trading account for the purpose of entering into one or more repurchase agreements.
Foreign Currency Translation – Purchases and sales of foreign investments, income, and expenses are converted into U.S. dollars based upon currency exchange rates prevailing on the respective dates of such transactions. Gains and losses attributable to foreign currency exchange rates on sales of securities are recorded for financial statement purposes as net realized gains and losses on investments. Gains and losses attributable to foreign exchange rate movements on income and expenses are recorded for financial statement purposes as foreign currency transaction gains and losses. That portion of both realized and unrealized gains and losses on investments that results from fluctuations in foreign currency exchange rates is not separately disclosed.
Security Loans – State Street Bank and Trust Company (“State Street”), as lending agent, may loan the securities of the fund to certain qualified institutions (the “Borrowers”) approved by the fund. The loans are collateralized at all times by cash and/or U.S. Treasury and federal agency obligations in an amount at least equal to the market value of the securities loaned. State Street provides the fund with indemnification against Borrower default. The fund bears the risk of loss with respect to the investment of cash collateral. On loans collateralized by cash, the cash collateral is invested in a money market fund or short-term securities. A portion of the income generated upon investment of the collateral is remitted to the Borrowers, and the remainder is allocated between the fund and the lending agent. On loans collateralized by U.S. Treasury and/or federal agency obligations, a fee is received from the Borrower, and is allocated between the fund and the lending agent. Net income from securities lending is included in interest income on the Statement of Operations. The dividend and interest income earned on the securities loaned is accounted for in the same manner as other dividend and interest income. At February 29, 2008, the value of securities loaned was $39,468,757. These loans were collateralized by cash of $40,037,641 and U.S. Treasury obligations of $314,675.
29
Notes to Financial Statements (unaudited) – continued
Indemnifications – Under the fund’s organizational documents, its officers and trustees may be indemnified against certain liabilities and expenses arising out of the performance of their duties to the fund. Additionally, in the normal course of business, the fund enters into agreements with service providers that may contain indemnification clauses. The fund’s maximum exposure under these agreements is unknown as this would involve future claims that may be made against the fund that have not yet occurred.
Investment Transactions and Income – Investment transactions are recorded on the trade date. Interest income is recorded on the accrual basis. All premium and discount is amortized or accreted for financial statement purposes in accordance with U.S. generally accepted accounting principles. Dividends received in cash are recorded on the ex-dividend date. Certain dividends from foreign securities will be recorded when the fund is informed of the dividend if such information is obtained subsequent to the ex-dividend date. Dividend and interest payments received in additional securities are recorded on the ex-dividend or ex-interest date in an amount equal to the value of the security on such date.
The fund may receive proceeds from litigation settlements. Any proceeds received from litigation involving portfolio holdings are reflected in the Statement of Operations in realized gain/loss if the security has been disposed of by the fund or in unrealized gain/loss if the security is still held by the fund. Any other proceeds from litigation not related to portfolio holdings are reflected as other income in the Statement of Operations.
Fees Paid Indirectly – The fund’s custody fee may be reduced according to an arrangement that measures the value of cash deposited with the custodian by the fund. This amount, for the six months ended February 29, 2008, is shown as a reduction of total expenses on the Statement of Operations.
Tax Matters and Distributions – The fund intends to qualify as a regulated investment company, as defined under Subchapter M of the Internal Revenue Code, and to distribute all of its taxable income, including realized capital gains. As a result, no provision for federal income tax is required. The fund adopted the provisions of FASB Interpretation No. 48, Accounting for Uncertainty in Income Taxes (“the Interpretation”) on September 1, 2007. The Interpretation prescribes a minimum threshold for financial statement recognition of the benefit of a tax position taken or expected to be taken in a tax return. There was no impact resulting from the adoption of this Interpretation on the fund’s financial statements. Each of the fund’s federal tax returns for the prior three fiscal years remains subject to examination by the Internal Revenue Service. It is the fund’s policy to record interest and penalty charges on underpaid taxes associated with its tax positions as interest expense and miscellaneous expense, respectively. No such charges were recorded in the
30
Notes to Financial Statements (unaudited) – continued
current financial statements. Foreign taxes, if any, have been accrued by the fund in the accompanying financial statements.
Distributions to shareholders are recorded on the ex-dividend date. Income and capital gain distributions are determined in accordance with income tax regulations, which may differ from U.S. generally accepted accounting principles. Certain capital accounts in the financial statements are periodically adjusted for permanent differences in order to reflect their tax character. These adjustments have no impact on net assets or net asset value per share. Temporary differences which arise from recognizing certain items of income, expense, gain or loss in different periods for financial statement and tax purposes will reverse at some time in the future. Distributions in excess of net investment income or net realized gains are temporary overdistributions for financial statement purposes resulting from differences in the recognition or classification of income or distributions for financial statement and tax purposes.
Book/tax differences primarily relate to net operating losses, wash sale loss deferrals and capital loss carryforward and wash sale loss deferrals assumed as a result of the acquisition of MFS Strategic Growth Fund.
The tax character of distributions made during the current period will be determined at fiscal year end. The tax character of distributions declared to shareholders is as follows:
| | |
| | | 8/31/07 |
Ordinary income (including any
short-term capital gains) | | $5,724,957 |
| Long-term capital gain | | 9,300,515 |
| Total distributions | | $15,025,940 |
The federal tax cost and the tax basis components of distributable earnings were as follows:
| | | |
| As of 2/29/08 | | | |
| Cost of investments | | $2,240,740,745 | |
| Gross appreciation | | 53,913,446 | |
| Gross depreciation | | (117,363,303 | ) |
| Net unrealized appreciation (depreciation) | | $(63,449,857 | ) |
31
Notes to Financial Statements (unaudited) – continued
| | | |
| As of 8/31/07 (x) | | | |
| Undistributed ordinary income | | 86,501,945 | |
| Undistributed long-term capital gain | | 118,658,180 | |
| Capital loss carryforwards | | (1,273,481,752 | ) |
| Other temporary differences | | (1,091,980 | ) |
| Net unrealized appreciation (depreciation) | | 23,521,699 | |
As of August 31, 2007, the fund had capital loss carryforwards available to offset future realized gains. Such losses expire as follows:
| | | |
| 8/31/08 | | $ (113,007,075 | ) |
| 8/31/09 | | (804,990,883 | ) |
| 8/31/10 | | (325,450,819 | ) |
| 8/31/11 | | (30,032,975 | ) |
| | $(1,273,481,752 | ) |
| | (x) | Amounts were revised due to a change in the capital loss carryforwards utilized as of August 31, 2007. |
The availability of a portion of the capital loss carryforwards for MFS Core Growth Fund and the capital loss carryforwards, which were acquired on June 22, 2007 in connection with the MFS Strategic Growth Fund merger, may be limited in a given year.
Multiple Classes of Shares of Beneficial Interest – The fund offers multiple classes of shares, which differ in their respective distribution and service fees. All shareholders bear the common expenses of the fund based on daily net assets of each class, without distinction between share classes. Dividends are declared separately for each class. Differences in per share dividend rates are generally due to differences in separate class expenses. Class B shares will convert to Class A shares approximately eight years after purchase.
| (3) | | Transactions with Affiliates |
Investment Adviser – The fund has an investment advisory agreement with MFS to provide overall investment management and related administrative services and facilities to the fund. The management fee is computed daily and paid monthly at the following annual rates:
| | | |
| First $1 billion of average daily net assets | | 0.75 | % |
| Next $1.5 billion of average daily net assets | | 0.65 | % |
| Average daily net assets in excess of $2.5 billion | | 0.60 | % |
As part of a settlement agreement with the New York Attorney General concerning market timing and related matters, MFS has agreed to reduce the management fee to 0.65% on the first $1 billion of the fund’s average daily net assets for the period March 1, 2004 through February 28, 2009. For the six months ended February 29, 2008, this waiver amounted to $497,268 and is reflected as a reduction of total expenses in the Statement of Operations.
32
Notes to Financial Statements (unaudited) – continued
The management fee incurred for the six months ended February 29, 2008 was equivalent to an annual effective rate of 0.65% of the fund’s average daily net assets.
The investment adviser has agreed in writing to pay a portion of the fund’s operating expenses, exclusive of certain other fees and expenses, such that total annual fund operating expenses do not exceed the following rates annually of the fund’s average daily net assets with respect to each class. At February 29, 2008 the following expense limitations were in place:
| | | | | | | | | | | | | | | | | | | | |
| Class A | | Class B | | Class C | | Class I | | Class R | | Class R1 | | Class R2 | | Class R3 | | Class R4 | | Class R5 | | Class W |
| 1.26% | | 1.91% | | 1.91% | | 0.91% | | 1.41% | | 2.01% (a) | | 1.41% | | 1.41% | | 1.16% | | 0.91% | | 1.01% |
| (a) | Effective March 1, 2008 Class R1’s operating expenses will not exceed 1.66 of the class’ average daily net assets. |
This written agreement will continue through February 28, 2009 unless changed or rescinded by the fund’s Board of Trustees. For the six months ended February 29, 2008, the fund’s actual operating expenses did not exceed the limit and therefore, the investment adviser did not pay any portion of the fund’s expenses.
Distributor – MFS Fund Distributors, Inc. (MFD), a wholly-owned subsidiary of MFS, as distributor, received $34,024 for the six months ended February 29, 2008, as its portion of the initial sales charge on sales of Class A shares of the fund.
The Board of Trustees has adopted a distribution plan for certain class shares pursuant to Rule 12b-1 of the Investment Company Act of 1940.
The fund’s distribution plan provides that the fund will pay MFD for services provided by MFD and financial intermediaries in connection with the distribution and servicing of certain share classes. One component of the plan is a distribution fee paid to MFD and another component of the plan is a service fee paid to MFD. MFD may subsequently pay all, or a portion, of the distribution and/or service fees to financial intermediaries.
Distribution Plan Fee Table:
| | | | | | | | | | |
| | | Distribution
Fee Rate | | Service
Fee Rate | | Total
Distribution
Plan (d) | | Annual
Effective
Rate (e) | | Distribution
and Service
Fee |
| Class A | | 0.10% | | 0.25% | | 0.35% | | 0.35% | | $1,575,900 |
| Class B | | 0.75% | | 0.25% | | 1.00% | | 1.00% | | 1,404,356 |
| Class C | | 0.75% | | 0.25% | | 1.00% | | 1.00% | | 534,007 |
| Class W | | 0.10% | | — | | 0.10% | | 0.10% | | 195 |
| Class R | | 0.25% | | 0.25% | | 0.50% | | 0.50% | | 7,686 |
| Class R1(c) | | 0.50% | | 0.25% | | 0.75% | | 0.75% | | 8,972 |
| Class R2 | | 0.25% | | 0.25% | | 0.50% | | 0.50% | | 4,916 |
| Class R3 | | 0.25% | | 0.25% | | 0.50% | | 0.50% | | 20,268 |
| Class R4 | | — | | 0.25% | | 0.25% | | 0.25% | | 3,658 |
| Total Distribution and Service Fees | | | | | | $3,559,958 |
33
Notes to Financial Statements (unaudited) – continued
| (c) | Effective March 1, 2008, the distribution fee rate for Class R1 shares will be 0.75% and the total distribution plan rate will be 1.00%. |
| (d) | In accordance with the distribution plan for certain classes, the fund pays distribution and/or service fees up to these annual percentage rates of each class’ average daily net assets. |
| (e) | The annual effective rates represent actual fees incurred under the distribution plan for the six months ended February 29, 2008 based on each class’ average daily net assets. |
Certain Class A and Class C shares are subject to a contingent deferred sales charge in the event of a shareholder redemption within 12 months of purchase. Class B shares are subject to a contingent deferred sales charge in the event of a shareholder redemption within six years of purchase. All contingent deferred sales charges are paid to MFD and during the six months ended February 29, 2008, were as follows:
| | |
| | | Amount |
| Class A | | $525 |
| Class B | | 132,376 |
| Class C | | 3,627 |
Shareholder Servicing Agent – MFS Service Center, Inc. (MFSC), a wholly-owned subsidiary of MFS, receives a fee from the fund for its services as shareholder servicing agent calculated as a percentage of the average daily net assets of the fund as determined periodically under the supervision of the fund’s Board of Trustees. For the six months ended February 29, 2008, the fee was $555,395, which equated to 0.0472% annually of the fund’s average daily net assets. MFSC also receives payment from the fund for out-of-pocket expenses, sub-accounting and other shareholder servicing costs which may be paid to affiliated and unaffiliated service providers. For the six months ended February 29, 2008, these out-of-pocket expenses, sub-accounting and other shareholder servicing costs amounted to $762,621. The fund may also pay shareholder servicing related costs directly to non-related parties.
Effective May 1, 2007, under a Special Servicing Agreement among MFS, each MFS fund which invests in other MFS funds (“MFS fund-of-funds”) and each underlying fund in which a MFS fund-of-funds invests (“underlying funds”), each underlying fund may pay a portion of each MFS fund-of-fund’s transfer agent-related expenses, including sub-accounting fees payable to financial intermediaries, to the extent such payments do not exceed the benefits realized or expected to be realized by the underlying fund from the investment in the underlying fund by the MFS fund-of-fund. For the six months ended February 29, 2008, these costs for the fund amounted to $560,482 and are reflected in the shareholder servicing costs on the Statement of Operations.
Administrator – MFS provides certain financial, legal, shareholder communications, compliance, and other administrative services to the fund. Under an administrative services agreement, the fund partially reimburses MFS the costs incurred to provide these services. The fund is charged a fixed
34
Notes to Financial Statements (unaudited) – continued
amount plus a fee based on average daily net assets. The fund’s annual fixed amount is $17,500.
The administrative services fee incurred for the six months ended February 29, 2008 was equivalent to an annual effective rate of 0.0141% of the fund’s average daily net assets.
In addition to the administrative services provided by MFS to the fund as described above, MFS is responsible for providing certain retirement plan administration and services with respect to certain shares. These services include various administrative, recordkeeping, and communication/educational services with respect to the retirement plans which invest in these shares, and may be provided directly by MFS or by a third party. MFS may subsequently pay all, or a portion, of the retirement plan administration and services fee to affiliated or unaffiliated third parties. For the six months ended February 29, 2008, the fund paid MFS an annual retirement plan administration and services fee up to the following annual percentage rates of each class’ average daily net assets:
| | | | | | | | |
| | | Beginning
of Period
through
12/31/07 | | Effective
1/01/08 | | Annual
Effective
Rate (g) | | Total
Amount |
Class R1 | | 0.35% | | 0.35% | | 0.35% | | $4,187 |
Class R2 | | 0.25% | | — | | 0.18% | | 1,734 |
Class R3 | | 0.15% | | — | | 0.09% | | 3,809 |
Class R4 | | 0.15% | | — | | 0.09% | | 1,299 |
Class R5 | | 0.10% | | — | | 0.07% | | 14,695 |
| Total Retirement Plan Administration and Services Fees | | | | | | $25,724 |
| (g) | Effective January 1, 2008, the annual retirement plan administration and services fee was eliminated for Class R2, Class R3, Class R4, and Class R5 shares. Effective March 1, 2008, the annual retirement plan administration and services fee will be eliminated for Class R1 shares. |
Trustees’ and Officers’ Compensation – The fund pays compensation to independent trustees in the form of a retainer, attendance fees, and additional compensation to Board and Committee chairpersons. The fund does not pay compensation directly to trustees or officers of the fund who are also officers of the investment adviser, all of whom receive remuneration for their services to the fund from MFS. Certain officers and trustees of the fund are officers or directors of MFS, MFD, and MFSC.
The fund has an unfunded, defined benefit plan for certain retired independent trustees which resulted in a pension expense of $329. The fund also has an unfunded retirement benefit deferral plan for certain independent trustees which resulted in a net decrease in expense of $2,653. Both amounts are included in independent trustees’ compensation for the six months ended February 29, 2008. The liability for deferred retirement
35
Notes to Financial Statements (unaudited) – continued
benefits payable to certain independent trustees under both plans amounted to $98,732 at February 29, 2008, and is included in payable for independent trustees’ compensation.
Other – This fund and certain other MFS funds (the funds) have entered into a services agreement (the Agreement) which provides for payment of fees by the funds to Tarantino LLC in return for the provision of services of an Independent Chief Compliance Officer (ICCO) for the funds. The ICCO is an officer of the funds and the sole member of Tarantino LLC. The funds can terminate the Agreement with Tarantino LLC at any time under the terms of the Agreement. For the six months ended February 29, 2008, the fee paid by the fund to Tarantino LLC was $9,395 and is included in miscellaneous expense on the Statement of Operations. MFS has agreed to reimburse the fund for a portion of the payments made by the fund to Tarantino LLC in the amount of $5,260, which is shown as a reduction of total expenses in the Statement of Operations. Additionally, MFS has agreed to bear all expenses associated with office space, other administrative support, and supplies provided to the ICCO.
Purchases and sales of investments, other than U.S. government securities, purchased option transactions, and short-term obligations, aggregated $2,917,689,752 and $3,171,367,883, respectively.
| (5) | | Shares of Beneficial Interest |
The fund’s Declaration of Trust permits the Trustees to issue an unlimited number of full and fractional shares of beneficial interest. Transactions in fund shares were as follows:
| | | | | | | | |
| | | Six months ended
2/29/08 | | Year ended
8/31/07 |
| | | Shares | | Amount | | Shares | | Amount |
| Shares sold | | | | | | | | |
Class A | | 5,952,196 | | $124,786,308 | | 13,388,482 | | $265,485,268 |
Class B | | 416,750 | | 8,201,465 | | 1,246,753 | | 23,851,828 |
Class C | | 378,731 | | 7,448,338 | | 460,974 | | 8,552,816 |
Class I | | 2,259,181 | | 47,909,433 | | 1,004,669 | | 21,159,042 |
Class W | | 1,214 | | 25,000 | | 12,717 | | 244,000 |
Class R | | 70,732 | | 1,504,908 | | 172,019 | | 3,447,183 |
Class R1 | | 73,820 | | 1,493,684 | | 90,417 | | 1,725,253 |
Class R2 | | 28,388 | | 581,290 | | 145,455 | | 2,713,258 |
Class R3 | | 248,085 | | 5,216,955 | | 324,455 | | 6,310,010 |
Class R4 | | 114,694 | | 2,424,692 | | 84,633 | | 1,689,361 |
Class R5 | | 318,123 | | 6,639,363 | | 3,219,949 | | 62,277,270 |
| | 9,861,914 | | $206,231,436 | | 20,150,523 | | $397,455,289 |
36
Notes to Financial Statements (unaudited) – continued
| | | | | | | | | | | | |
| | | Six months ended
2/29/08 | | | Year ended
8/31/07 | |
| | | Shares | | | Amount | | | Shares | | | Amount | |
| Shares issued in connection with acquisition of MFS Strategic Growth Fund | | | | | | | | | | | | |
Class A | | | | | | | | 18,077,575 | | | $367,990,280 | |
Class B | | | | | | | | 8,840,345 | | | 171,558,817 | |
Class C | | | | | | | | 2,911,887 | | | 56,507,733 | |
Class I | | | | | | | | 46,332,267 | | | 970,428,170 | |
Class W | | | | | | | | — | | | — | |
Class R | | | | | | | | 7,671 | | | 155,258 | |
Class R1 | | | | | | | | — | | | — | |
Class R2 | | | | | | | | 1,774 | | | 34,596 | |
Class R3 | | | | | | | | — | | | — | |
Class R4 | | | | | | | | 6,710 | | | 136,434 | |
Class R5 | | | | | | | | — | | | — | |
| | | | | | | | 76,178,229 | | | $1,566,811,288 | |
| Shares issued to shareholders in reinvestment of distributions | | | | | | | | | | | | |
Class A | | 1,409,142 | | | $29,141,050 | | | 415,969 | | | $7,845,189 | |
Class B | | 521,430 | | | 10,230,443 | | | 158,310 | | | 2,855,925 | |
Class C | | 170,247 | | | 3,338,549 | | | 43,991 | | | 793,595 | |
Class I | | 1,731,990 | | | 36,960,668 | | | 32,730 | | | 633,987 | |
Class W | | 331 | | | 6,875 | | | 99 | | | 1,875 | |
Class R | | 2,057 | | | 42,245 | | | 4,942 | | | 92,701 | |
Class R1 | | 5,881 | | | 115,039 | | | 573 | | | 10,327 | |
Class R2 | | 3,699 | | | 73,024 | | | 1,117 | | | 20,208 | |
Class R3 | | 18,497 | | | 376,973 | | | 2,169 | | | 40,449 | |
Class R4 | | 6,309 | | | 130,271 | | | 306 | | | 5,764 | |
Class R5 | | 38,194 | | | 795,194 | | | 17,732 | | | 335,669 | |
| | 3,907,777 | | | $81,210,331 | | | 677,938 | | | $12,635,689 | |
| Shares reacquired | | | | | | | | | | | | |
Class A | | (11,353,529 | ) | | $(238,103,443 | ) | | (14,418,252 | ) | | $(278,902,684 | ) |
Class B | | (3,617,842 | ) | | (71,070,961 | ) | | (4,171,632 | ) | | (78,131,818 | ) |
Class C | | (806,832 | ) | | (15,881,791 | ) | | (1,241,897 | ) | | (22,906,664 | ) |
Class I | | (4,354,202 | ) | | (94,878,423 | ) | | (1,097,809 | ) | | (22,425,838 | ) |
Class W | | (183 | ) | | (3,819 | ) | | — | | | — | |
Class R | | (184,944 | ) | | (3,949,004 | ) | | (294,694 | ) | | (5,743,417 | ) |
Class R1 | | (23,911 | ) | | (448,493 | ) | | (42,344 | ) | | (782,282 | ) |
Class R2 | | (41,762 | ) | | (860,580 | ) | | (195,851 | ) | | (3,544,321 | ) |
Class R3 | | (60,082 | ) | | (1,231,114 | ) | | (144,372 | ) | | (2,747,709 | ) |
Class R4 | | (11,358 | ) | | (230,790 | ) | | (27,099 | ) | | (529,757 | ) |
Class R5 | | (187,368 | ) | | (3,869,347 | ) | | (1,233,025 | ) | | (25,802,319 | ) |
| | (20,642,013 | ) | | $(430,527,765 | ) | | (22,866,975 | ) | | $(441,516,809 | ) |
37
Notes to Financial Statements (unaudited) – continued
| | | | | | | | | | | | |
| | | Six months ended
2/29/08 | | | Year ended
8/31/07 | |
| | | Shares | | | Amount | | | Shares | | | Amount | |
| Net change | | | | | | | | | | | | |
Class A | | (3,992,191 | ) | | $(84,176,085 | ) | | 17,463,774 | | | $362,418,053 | |
Class B | | (2,679,662 | ) | | (52,639,053 | ) | | 6,073,776 | | | 120,134,752 | |
Class C | | (257,854 | ) | | (5,094,904 | ) | | 2,174,955 | | | 42,947,480 | |
Class I | | (363,031 | ) | | (10,008,322 | ) | | 46,271,857 | | | 969,795,361 | |
Class W | | 1,362 | | | 28,056 | | | 12,816 | | | 245,875 | |
Class R | | (112,155 | ) | | (2,401,851 | ) | | (110,062 | ) | | (2,048,275 | ) |
Class R1 | | 55,790 | | | 1,160,230 | | | 48,646 | | | 953,298 | |
Class R2 | | (9,675 | ) | | (206,266 | ) | | (47,505 | ) | | (776,259 | ) |
Class R3 | | 206,500 | | | 4,362,814 | | | 182,252 | | | 3,602,750 | |
Class R4 | | 109,645 | | | 2,324,173 | | | 64,550 | | | 1,301,802 | |
Class R5 | | 168,949 | | | 3,565,210 | | | 2,004,656 | | | 36,810,620 | |
| | (6,872,322 | ) | | $(143,085,998 | ) | | 74,139,715 | | | $1,535,385,457 | |
The fund is one of several mutual funds in which the MFS funds-of-funds may invest. The MFS funds-of-funds do not invest in the underlying MFS funds for the purpose of exercising management or control. At the end of the period, the MFS Growth Allocation Fund, MFS Aggressive Growth Allocation Fund, MFS Moderate Allocation Fund, and MFS Conservative Allocation Fund were the owners of record of approximately 18%, 11%, 10% and 2% respectively, of the value of outstanding voting shares. In addition, the MFS Lifetime 2010 Fund, MFS Lifetime 2020 Fund, MFS Lifetime 2030 Fund, and MFS Lifetime 2040 Fund were each the owners of record of less than 1% of the value of outstanding voting shares.
The fund and other funds managed by MFS participate in a $1 billion unsecured committed line of credit provided by a syndication of banks under a credit agreement. In addition, the fund and other funds managed by MFS have established uncommitted borrowing arrangements with certain banks. Borrowings may be made for temporary financing needs. Interest is charged to each fund, based on its borrowings, generally at a rate equal to the Federal Reserve funds rate plus 0.30%. In addition, a commitment fee, based on the average daily, unused portion of the committed line of credit, is allocated among the participating funds at the end of each calendar quarter. For the six months ended February 29, 2008, the fund’s commitment fee and interest expense were $3,562 and $0, respectively, and are included in miscellaneous expense on the Statement of Operations.
On October 23, 2007 the Board of Trustees approved, on or about April 18, 2008, the conversion of Class R shares and Class R2 shares into Class R3 shares. After the conversion, Class R3, Class R4, and Class R5 will be renamed Class R2, Class R3, and Class R4, respectively.
38
RESULTS OF SHAREHOLDER MEETING
(unaudited)
At a special meeting of shareholders of MFS Core Growth Fund, which was held on February 15, 2008, the following actions were taken:
Item 1: To approve an amendment to the current Master Distribution Plan adopted pursuant to Rule 12b-1 under the Investment Company Act of 1940, as amended, with respect to Class R1 Shares of the fund.
| | |
| | | Number of Dollars |
| For | | 1,567,399.96 |
| Against | | 0.00 |
| Abstain | | 174,312.74 |
| Total | | 1,741,712.70 |
39
BOARD REVIEW OF INVESTMENT ADVISORY AGREEMENT
A discussion regarding the Board’s most recent review and renewal of the Fund’s investment advisory agreement is available by clicking on the fund’s name under “Select a fund” on the MFS Web site (mfs.com).
PROXY VOTING POLICIES AND INFORMATION
A general description of the MFS funds’ proxy voting policies and procedures is available without charge, upon request, by calling 1-800-225-2606, by visiting the Proxy Voting section of mfs.com or by visiting the SEC’s Web site at http://www.sec.gov.
Information regarding how the fund voted proxies relating to portfolio securities during the most recent twelve-month period ended June 30 is available without charge by visiting the Proxy Voting section of mfs.com or by visiting the SEC’s Web site at http://www.sec.gov.
QUARTERLY PORTFOLIO DISCLOSURE
The fund will file a complete schedule of portfolio holdings with the Securities and Exchange Commission (the Commission) for the first and third quarters of each fiscal year on Form N-Q. The fund’s Form N-Q may be reviewed and copied at the:
Public Reference Room
Securities and Exchange Commission
100 F Street, NE, Room 1580
Washington, D.C. 20549
Information on the operation of the Public Reference Room may be obtained by calling the Commission at 1-800-SEC-0330. The fund’s Form N-Q is available on the EDGAR database on the Commission’s Internet Web site at http://www.sec.gov, and copies of this information may be obtained, upon payment of a duplicating fee, by electronic request at the following e-mail address: publicinfo@sec.gov or by writing the Public Reference Section at the above address.
A shareholder can also obtain the quarterly portfolio holdings report at mfs.com.
40


MFS® Core Equity Fund
The report is prepared for the general information of shareholders. It is authorized for distribution to prospective investors only when preceded or accompanied by a current prospectus.
NOT FDIC INSURED Ÿ MAY LOSE VALUE Ÿ
NO BANK OR CREDIT UNION GUARANTEE Ÿ NOT A DEPOSIT Ÿ
NOT INSURED BY ANY FEDERAL GOVERNMENT AGENCY OR
NCUA/NCUSIF
2/29/08
RGI-SEM

LETTER FROM THE CEO
Dear Shareholders:
Many of our MFS® fund shareholders have been justifiably concerned, as have most investors around the world, about the state of the global economy. As we enter 2008 we see the market volatility that began in the third quarter of 2007 has intensified.
We here at MFS, and those before us who guided the firm with the same disciplined investment process, have weathered many major economic disruptions over our eight-plus decades of managing clients’ investments. We have managed money through the Great Depression, 14 recessions, as well as numerous market crises caused by wars, political upheavals, and terrorist attacks. MFS remains in business because our investors believe in the integrity of our long-term investment strategy and its proven results.
Worries over market volatility are valid, and investors cannot always expect to see the kind of returns stocks have delivered in the bull markets of past years. Yet we believe our strategy of ADR — allocating across the major asset classes, diversifying within each class, and regularly rebalancing your portfolio to maintain your desired allocation — can help you pursue the highest investment returns while minimizing the effects of market fluctuations.
MFS is a world leader in domestic and global investing. Our team approach is research driven, globally integrated, and balanced. We have 176 investment management professionals located in the Americas, Europe, and Asia who focus on the fundamentals of each security and then integrate our sophisticated quantitative approach.* This collaborative process allows us to find opportunities in any market environment.
I personally would like to thank you for your continued business. We want you to be confident that we are constantly managing our fund offerings with you in mind, while adding new products that can help you to choose what fits your unique financial goals.
Respectfully,

Robert J. Manning
Chief Executive Officer and Chief Investment Officer
MFS Investment Management®
April 15, 2008
* as of 12/31/07
The opinions expressed in this letter are subject to change, may not be relied upon for investment advice, and no forecasts can be guaranteed.
1
PORTFOLIO COMPOSITION

| | |
| Top ten holdings | | |
| Exxon Mobil Corp. | | 4.2% |
| Danaher Corp. | | 2.3% |
| Merck & Co., Inc. | | 2.2% |
| AT&T, Inc. | | 2.0% |
| International Business Machines Corp. | | 2.0% |
| Bank of America Corp. | | 1.9% |
| Altria Group, Inc. | | 1.8% |
| Marathon Oil Corp. | | 1.6% |
| BHP Billiton PLC | | 1.5% |
| JPMorgan Chase & Co. | | 1.5% |
| | |
| Equity sectors | | |
| Financial Services | | 17.7% |
| Technology | | 15.2% |
| Health Care | | 11.9% |
| Energy | | 11.8% |
| Industrial Goods & Services | | 9.3% |
| Utilities & Communications | | 8.0% |
| Consumer Staples | | 7.6% |
| Leisure | | 6.0% |
| Retailing | | 5.6% |
| Basic Materials | | 3.4% |
| Special Products & Services | | 1.7% |
| Autos & Housing | | 0.6% |
| Transportation | | 0.3% |
Percentages are based on net assets as of 2/29/08.
The portfolio is actively managed and current holdings may be different.
2
EXPENSE TABLE
Fund expenses borne by the shareholders during the period, September 1, 2007 through February 29, 2008
As a shareholder of the fund, you incur two types of costs: (1) transaction costs, including sales charges (loads) on certain purchase or redemption payments, and (2) ongoing costs, including management fees; distribution and service (12b-1) fees; and other fund expenses. This example is intended to help you understand your ongoing costs (in dollars) of investing in the fund and to compare these costs with the ongoing costs of investing in other mutual funds.
The example is based on an investment of $1,000 invested at the beginning of the period and held for the entire period September 1, 2007 through February 29, 2008.
Actual Expenses
The first line for each share class in the following table provides information about actual account values and actual expenses. You may use the information in this line, together with the amount you invested, to estimate the expenses that you paid over the period. Simply divide your account value by $1,000 (for example, an $8,600 account value divided by $1,000 = 8.6), then multiply the result by the number in the first line under the heading entitled “Expenses Paid During Period” to estimate the expenses you paid on your account during this period.
Hypothetical Example for Comparison Purposes
The second line for each share class in the following table provides information about hypothetical account values and hypothetical expenses based on the fund’s actual expense ratio and an assumed rate of return of 5% per year before expenses, which is not the fund’s actual return. The hypothetical account values and expenses may not be used to estimate the actual ending account balance or expenses you paid for the period. You may use this information to compare the ongoing costs of investing in the fund and other funds. To do so, compare this 5% hypothetical example with the 5% hypothetical examples that appear in the shareholder reports of the other funds.
Please note that the expenses shown in the table are meant to highlight your ongoing costs only and do not reflect any transactional costs, such as sales charges (loads). Therefore, the second line for each share class in the table is useful in comparing ongoing costs only, and will not help you determine the relative total costs of owning different funds. In addition, if these transactional costs were included, your costs would have been higher.
3
Expense Table – continued
| | | | | | | | | | |
Share
Class | | | | Annualized
Expense
Ratio | | Beginning
Account Value
9/01/07 | | Ending
Account Value
2/29/08 | | Expenses
Paid During
Period (p)
9/01/07-2/29/08 |
| A | | Actual | | 1.15% | | $1,000.00 | | $919.30 | | $5.49 |
| | Hypothetical (h) | | 1.15% | | $1,000.00 | | $1,019.14 | | $5.77 |
| B | | Actual | | 1.79% | | $1,000.00 | | $916.17 | | $8.53 |
| | Hypothetical (h) | | 1.79% | | $1,000.00 | | $1,015.96 | | $8.97 |
| C | | Actual | | 1.80% | | $1,000.00 | | $916.36 | | $8.58 |
| | Hypothetical (h) | | 1.80% | | $1,000.00 | | $1,015.91 | | $9.02 |
| I | | Actual | | 0.80% | | $1,000.00 | | $921.17 | | $3.82 |
| | Hypothetical (h) | | 0.80% | | $1,000.00 | | $1,020.89 | | $4.02 |
| R | | Actual | | 1.28% | | $1,000.00 | | $918.66 | | $6.11 |
| | Hypothetical (h) | | 1.28% | | $1,000.00 | | $1,018.50 | | $6.42 |
| R1 | | Actual | | 1.90% | | $1,000.00 | | $915.82 | | $9.05 |
| | Hypothetical (h) | | 1.90% | | $1,000.00 | | $1,015.42 | | $9.52 |
| R2 | | Actual | | 1.46% | | $1,000.00 | | $917.75 | | $6.96 |
| | Hypothetical (h) | | 1.46% | | $1,000.00 | | $1,017.60 | | $7.32 |
| R3 | | Actual | | 1.40% | | $1,000.00 | | $918.56 | | $6.68 |
| | Hypothetical (h) | | 1.40% | | $1,000.00 | | $1,017.90 | | $7.02 |
| R4 | | Actual | | 1.15% | | $1,000.00 | | $919.71 | | $5.49 |
| | Hypothetical (h) | | 1.15% | | $1,000.00 | | $1,019.14 | | $5.77 |
| R5 | | Actual | | 0.86% | | $1,000.00 | | $920.88 | | $4.11 |
| | Hypothetical (h) | | 0.86% | | $1,000.00 | | $1,020.59 | | $4.32 |
| (h) | 5% class return per year before expenses. |
| (p) | Expenses paid is equal to each class’ annualized expense ratio, as shown above, multiplied by the average account value over the period, multiplied by the number of days in the period, divided by the number of days in the year. Expenses paid do not include any applicable sales charges (loads). If these transaction costs had been included, your costs would have been higher. |
Effective January 1, 2008 the fund’s Class R2, Class R3, Class R4, and Class R5 retirement plan administration and service fee was terminated (as described in Note 3 of the Notes to the Financial Statements). Had this fee change been in effect throughout the entire six month period, the annualized expense ratios would have been 1.29, 1.30, 1.05 and 0.79 for Class R2, Class R3, Class R4, and Class R5 shares, respectively. The actual expenses paid during the period would have been approximately $6.17, $6.22, $5.03, and $3.78 and the hypothetical expenses paid during the period would have been approximately $6.49, $6.54, $5.29, and $3.98 for Class R2, Class R3, Class R4, and Class R5, respectively.
Effective March 1, 2008 the fund’s Class R1 retirement plan administration and service fee was terminated and the class R1 distribution fee was increased (as described in Note 3 of the Notes to the Financial Statements). Had these fee changes been in effect throughout the entire six month period, the annualized expense ratio would have been 1.80. The actual expenses paid during the period would have been approximately $8.60 and the hypothetical expenses paid during the period would have been approximately $9.05.
4
PORTFOLIO OF INVESTMENTS
2/29/08 (unaudited)
The Portfolio of Investments is a complete list of all securities owned by your fund. It is categorized by broad-based asset classes.
| | | | | |
| Common Stocks - 99.1% | | | | | |
| | | | | |
| Issuer | | Shares/Par | | Value ($) |
| | | | | |
| Aerospace - 2.9% | | | | | |
| Lockheed Martin Corp. | | 95,290 | | $ | 9,833,928 |
| Rockwell Collins, Inc. | | 102,500 | | | 6,037,250 |
| United Technologies Corp. | | 207,470 | | | 14,628,710 |
| | | | | |
| | | | | $ | 30,499,888 |
| Airlines - 0.3% | | | | | |
| Southwest Airlines Co. (l) | | 242,680 | | $ | 2,975,257 |
| | |
| Apparel Manufacturers - 0.8% | | | | | |
| NIKE, Inc., “B” | | 93,050 | | $ | 5,601,610 |
| Quiksilver, Inc. (a) | | 298,340 | | | 2,685,060 |
| | | | | |
| | | | | $ | 8,286,670 |
| Biotechnology - 1.3% | | | | | |
| Genzyme Corp. (a) | | 200,251 | | $ | 14,201,801 |
| | |
| Broadcasting - 2.2% | | | | | |
| News Corp., “A” | | 495,530 | | $ | 9,122,707 |
| Omnicom Group, Inc. | | 75,320 | | | 3,364,544 |
| Walt Disney Co. | | 320,880 | | | 10,399,721 |
| | | | | |
| | | | | $ | 22,886,972 |
| Brokerage & Asset Managers - 2.6% | | | | | |
| Affiliated Managers Group, Inc. (a)(l) | | 23,960 | | $ | 2,308,546 |
| Deutsche Boerse AG | | 29,020 | | | 4,535,542 |
| Goldman Sachs Group, Inc. | | 48,310 | | | 8,194,825 |
| ICAP PLC | | 83,890 | | | 1,043,612 |
| Invesco Ltd. | | 88,750 | | | 2,272,888 |
| Merrill Lynch & Co., Inc. | | 122,450 | | | 6,068,622 |
| TD AMERITRADE Holding Corp. (a)(l) | | 183,450 | | | 3,357,135 |
| | | | | |
| | | | | $ | 27,781,170 |
| Business Services - 1.0% | | | | | |
| Amdocs Ltd. (a) | | 82,830 | | $ | 2,567,730 |
| Fidelity National Information Services, Inc. | | 110,500 | | | 4,584,645 |
| Satyam Computer Services Ltd., ADR (l) | | 152,140 | | | 3,800,457 |
| | | | | |
| | | | | $ | 10,952,832 |
5
Portfolio of Investments (unaudited) – continued
| | | | | |
| Issuer | | Shares/Par | | Value ($) |
| | | | | |
| Common Stocks - continued | | | | | |
| Cable TV - 0.7% | | | | | |
| Comcast Corp., “Special A” | | 217,250 | | $ | 4,203,788 |
| Time Warner Cable, Inc. (a) | | 102,630 | | | 2,801,799 |
| | | | | |
| | | | | $ | 7,005,587 |
| Chemicals - 0.9% | | | | | |
| 3M Co. | | 52,760 | | $ | 4,136,384 |
| PPG Industries, Inc. | | 79,630 | | | 4,935,467 |
| | | | | |
| | | | | $ | 9,071,851 |
| Computer Software - 4.1% | | | | | |
| ACI Worldwide, Inc. (a)(l) | | 175,930 | | $ | 3,106,924 |
| CommVault Systems, Inc. (a)(l) | | 199,564 | | | 2,793,896 |
| MicroStrategy, Inc., “A” (a) | | 78,900 | | | 5,248,428 |
| MSC Software Corp. (a)(l) | | 1,131,140 | | | 14,331,544 |
| Oracle Corp. (a) | | 539,760 | | | 10,147,488 |
| VeriSign, Inc. (a) | | 229,125 | | | 7,973,550 |
| | | | | |
| | | | | $ | 43,601,830 |
| Computer Software - Systems - 4.5% | | | | | |
| Cray, Inc. (a) | | 796,600 | | $ | 3,751,986 |
| EMC Corp. (a)(l) | | 485,760 | | | 7,548,710 |
| Hewlett-Packard Co. | | 127,570 | | | 6,094,019 |
| International Business Machines Corp. | | 183,440 | | | 20,886,478 |
| Network Appliance, Inc. (a) | | 416,979 | | | 9,015,086 |
| | | | | |
| | | | | $ | 47,296,279 |
| Construction - 0.6% | | | | | |
| NVR, Inc. (a) | | 3,730 | | $ | 2,016,736 |
| Pulte Homes, Inc. | | 149,650 | | | 2,026,261 |
| Sherwin-Williams Co. | | 50,920 | | | 2,636,638 |
| | | | | |
| | | | | $ | 6,679,635 |
| Consumer Goods & Services - 3.1% | | | | | |
| Colgate-Palmolive Co. | | 102,390 | | $ | 7,790,855 |
| Estee Lauder Cos., Inc., “A” (l) | | 127,860 | | | 5,444,279 |
| New Oriental Education & Technology Group, Inc., ADR (a)(l) | | 121,760 | | | 7,591,736 |
| Procter & Gamble Co. | | 177,950 | | | 11,776,731 |
| | | | | |
| | | | | $ | 32,603,601 |
| Electrical Equipment - 3.4% | | | | | |
| Danaher Corp. | | 331,830 | | $ | 24,605,195 |
| Rockwell Automation, Inc. | | 156,750 | | | 8,575,793 |
6
Portfolio of Investments (unaudited) – continued
| | | | | |
| Issuer | | Shares/Par | | Value ($) |
| | | | | |
| Common Stocks - continued | | | | | |
| Electrical Equipment - continued | | | | | |
| WESCO International, Inc. (a)(l) | | 77,060 | | $ | 3,082,400 |
| | | | | |
| | | | | $ | 36,263,388 |
| Electronics - 3.3% | | | | | |
| Flextronics International Ltd. (a) | | 471,123 | | $ | 4,777,187 |
| Hittite Microwave Corp. (a) | | 81,950 | | | 2,713,365 |
| Intel Corp. | | 623,370 | | | 12,436,232 |
| KLA-Tencor Corp. (l) | | 64,220 | | | 2,697,882 |
| Marvell Technology Group Ltd. (a)(l) | | 361,120 | | | 4,084,267 |
| National Semiconductor Corp. (l) | | 151,150 | | | 2,489,441 |
| PLX Technology, Inc. (a)(l) | | 313,720 | | | 2,026,631 |
| SanDisk Corp. (a)(l) | | 145,310 | | | 3,422,051 |
| | | | | |
| | | | | $ | 34,647,056 |
| Energy - Independent - 1.8% | | | | | |
| Apache Corp. | | 89,000 | | $ | 10,209,190 |
| Peabody Energy Corp. | | 48,760 | | | 2,760,791 |
| XTO Energy, Inc. | | 100,800 | | | 6,220,368 |
| | | | | |
| | | | | $ | 19,190,349 |
| Energy - Integrated - 7.1% | | | | | |
| Exxon Mobil Corp. | | 513,702 | | $ | 44,697,211 |
| Hess Corp. | | 146,280 | | | 13,630,370 |
| Marathon Oil Corp. | | 307,820 | | | 16,363,711 |
| | | | | |
| | | | | $ | 74,691,292 |
| Engineering - Construction - 0.9% | | | | | |
| Fluor Corp. | | 32,650 | | $ | 4,546,513 |
| North American Energy Partners, Inc. (a) | | 275,150 | | | 4,561,987 |
| | | | | |
| | | | | $ | 9,108,500 |
| Food & Beverages - 3.5% | | | | | |
| Dean Foods Co. (l) | | 222,700 | | $ | 4,792,504 |
| Diamond Foods, Inc. | | 121,300 | | | 1,989,320 |
| General Mills, Inc. | | 116,730 | | | 6,535,713 |
| Hain Celestial Group, Inc. (a) | | 136,030 | | | 3,672,810 |
| Kellogg Co. | | 125,850 | | | 6,383,112 |
| PepsiCo, Inc. | | 187,859 | | | 13,067,472 |
| | | | | |
| | | | | $ | 36,440,931 |
| Food & Drug Stores - 1.1% | | | | | |
| CVS Caremark Corp. | | 298,980 | | $ | 12,072,812 |
7
Portfolio of Investments (unaudited) – continued
| | | | | |
| Issuer | | Shares/Par | | Value ($) |
| | | | | |
| Common Stocks - continued | | | | | |
| Gaming & Lodging - 1.0% | | | | | |
| International Game Technology | | 80,570 | | $ | 3,637,736 |
| Melco PBL Entertainment (Macau) Ltd., ADR (a) | | 98,600 | | | 1,191,088 |
| MGM Mirage (a) | | 10,753 | | | 662,277 |
| Penn National Gaming, Inc. (a) | | 25,840 | | | 1,184,247 |
| Royal Caribbean Cruises Ltd. (l) | | 103,440 | | | 3,621,434 |
| | | | | |
| | | | | $ | 10,296,782 |
| General Merchandise - 1.3% | | | | | |
| 99 Cents Only Stores (a)(l) | | 300,930 | | $ | 2,795,640 |
| Kohl’s Corp. (a) | | 57,330 | | | 2,547,745 |
| Macy’s, Inc. | | 185,970 | | | 4,589,740 |
| Stage Stores, Inc. (l) | | 263,865 | | | 3,340,531 |
| | | | | |
| | | | | $ | 13,273,656 |
| Health Maintenance Organizations - 1.2% | | | | | |
| CIGNA Corp. | | 145,550 | | $ | 6,488,619 |
| WellPoint, Inc. (a) | | 81,830 | | | 5,734,646 |
| | | | | |
| | | | | $ | 12,223,265 |
| Insurance - 4.5% | | | | | |
| Allied World Assurance Co. Holdings Ltd. | | 154,520 | | $ | 6,729,346 |
| Chubb Corp. | | 285,510 | | | 14,532,459 |
| Genworth Financial, Inc., “A” | | 179,810 | | | 4,167,996 |
| Hartford Financial Services Group, Inc. | | 158,170 | | | 11,056,083 |
| MetLife, Inc. | | 108,920 | | | 6,345,679 |
| Prudential Financial, Inc. | | 62,590 | | | 4,567,192 |
| | | | | |
| | | | | $ | 47,398,755 |
| Internet - 1.1% | | | | | |
| Google, Inc., “A” (a) | | 22,460 | | $ | 10,582,703 |
| TechTarget, Inc. (a) | | 117,340 | | | 1,363,491 |
| | | | | |
| | | | | $ | 11,946,194 |
| Leisure & Toys - 0.9% | | | | | |
| THQ, Inc. (a)(l) | | 195,380 | | $ | 3,655,560 |
| Ubisoft Entertainment S.A. (a) | | 65,927 | | | 5,527,629 |
| | | | | |
| | | | | $ | 9,183,189 |
| Machinery & Tools - 2.1% | | | | | |
| Bucyrus International, Inc., “A” (l) | | 48,680 | | $ | 4,862,158 |
| Eaton Corp. | | 29,500 | | | 2,378,585 |
| Flowserve Corp. | | 24,510 | | | 2,669,139 |
| Ingersoll-Rand Co. Ltd., “A” | | 192,990 | | | 8,078,561 |
8
Portfolio of Investments (unaudited) – continued
| | | | | |
| Issuer | | Shares/Par | | Value ($) |
| | | | | |
| Common Stocks - continued | | | | | |
| Machinery & Tools - continued | | | | | |
| Timken Co. | | 133,320 | | $ | 4,016,932 |
| | | | | |
| | | | | $ | 22,005,375 |
| Major Banks - 6.8% | | | | | |
| Bank of America Corp. | | 508,190 | | $ | 20,195,471 |
| Bank of New York Mellon Corp. | | 210,188 | | | 9,220,948 |
| JPMorgan Chase & Co. | | 386,170 | | | 15,697,811 |
| State Street Corp. | | 139,790 | | | 10,980,505 |
| UnionBanCal Corp. (l) | | 119,070 | | | 5,545,090 |
| Wells Fargo & Co. | | 349,150 | | | 10,205,655 |
| | | | | |
| | | | | $ | 71,845,480 |
| Medical & Health Technology & Services - 0.5% | | | | | |
| DaVita, Inc. (a) | | 21,010 | | $ | 1,042,726 |
| MWI Veterinary Supply, Inc. (a)(l) | | 135,512 | | | 4,719,883 |
| | | | | |
| | | | | $ | 5,762,609 |
| Medical Equipment - 3.7% | | | | | |
| Advanced Medical Optics, Inc. (a)(l) | | 260,550 | | $ | 5,961,384 |
| Aspect Medical Systems, Inc. (a)(l) | | 394,440 | | | 4,918,667 |
| Boston Scientific Corp. (a) | | 1,069,390 | | | 13,463,620 |
| Conceptus, Inc. (a)(l) | | 246,680 | | | 4,208,361 |
| Cooper Cos., Inc. (l) | | 161,940 | | | 5,536,729 |
| Cyberonics, Inc. (a)(l) | | 204,160 | | | 2,633,664 |
| NxStage Medical, Inc. (a)(l) | | 382,680 | | | 2,265,466 |
| | | | | |
| | | | | $ | 38,987,891 |
| Metals & Mining - 1.5% | | | | | |
| BHP Billiton PLC | | 503,950 | | $ | 16,255,522 |
| | |
| Natural Gas - Distribution - 1.0% | | | | | |
| Questar Corp. (l) | | 101,560 | | $ | 5,611,190 |
| Sempra Energy | | 91,250 | | | 4,848,113 |
| | | | | |
| | | | | $ | 10,459,303 |
| Natural Gas - Pipeline - 0.5% | | | | | |
| Williams Cos., Inc. | | 154,020 | | $ | 5,547,800 |
| | |
| Network & Telecom - 2.2% | | | | | |
| Cisco Systems, Inc. (a) | | 370,290 | | $ | 9,023,967 |
| NICE Systems Ltd., ADR (a)(l) | | 161,904 | | | 5,226,261 |
| Polycom, Inc. (a) | | 156,950 | | | 3,421,510 |
| Research in Motion Ltd. (a) | | 20,670 | | | 2,145,546 |
9
Portfolio of Investments (unaudited) – continued
| | | | | |
| Issuer | | Shares/Par | | Value ($) |
| | | | | |
| Common Stocks - continued | | | | | |
| Network & Telecom - continued | | | | | |
| Sonus Networks, Inc. (a)(l) | | 958,700 | | $ | 3,182,884 |
| | | | | |
| | | | | $ | 23,000,168 |
| Oil Services - 2.9% | | | | | |
| Exterran Holdings, Inc. (a)(l) | | 51,580 | | $ | 3,592,547 |
| Halliburton Co. | | 301,850 | | | 11,560,855 |
| National Oilwell Varco, Inc. (a) | | 44,090 | | | 2,746,807 |
| Natural Gas Services Group, Inc. (a) | | 71,500 | | | 1,601,600 |
| Noble Corp. | | 185,330 | | | 9,108,970 |
| TETRA Technologies, Inc. (a) | | 112,390 | | | 1,930,860 |
| | | | | |
| | | | | $ | 30,541,639 |
| Other Banks & Diversified Financials - 1.9% | | | | | |
| American Express Co. | | 160,530 | | $ | 6,790,419 |
| Euro Dekania Ltd. (a)(z) | | 492,120 | | | 7,065,093 |
| New York Community Bancorp, Inc. (l) | | 355,350 | | | 5,802,866 |
| | | | | |
| | | | | $ | 19,658,378 |
| Pharmaceuticals - 5.2% | | | | | |
| Abbott Laboratories | | 246,650 | | $ | 13,208,108 |
| Merck & Co., Inc. | | 526,160 | | | 23,308,888 |
| Schering-Plough Corp. | | 509,890 | | | 11,064,613 |
| Warner Chilcott Ltd., “A” (a)(l) | | 211,160 | | | 3,562,269 |
| Wyeth | | 76,110 | | | 3,319,918 |
| | | | | |
| | | | | $ | 54,463,796 |
| Real Estate - 1.9% | | | | | |
| Mack-Cali Realty Corp., REIT | | 415,980 | | $ | 14,347,150 |
| Maguire Properties, Inc., REIT (l) | | 244,490 | | | 5,554,813 |
| | | | | |
| | | | | $ | 19,901,963 |
| Restaurants - 1.2% | | | | | |
| Panera Bread Co., “A” (a)(l) | | 120,860 | | $ | 4,516,538 |
| Red Robin Gourmet Burgers, Inc. (a)(l) | | 157,300 | | | 5,242,809 |
| Texas Roadhouse, Inc., “A” (a)(l) | | 284,470 | | | 2,645,571 |
| | | | | |
| | | | | $ | 12,404,918 |
| Specialty Chemicals - 1.0% | | | | | |
| Air Products & Chemicals, Inc. | | 51,440 | | $ | 4,698,015 |
| Praxair, Inc. | | 73,860 | | | 5,929,481 |
| | | | | |
| | | | | $ | 10,627,496 |
10
Portfolio of Investments (unaudited) – continued
| | | | | |
| Issuer | | Shares/Par | | Value ($) |
| | | | | |
| Common Stocks - continued | | | | | |
| Specialty Stores - 2.4% | | | | | |
| CarMax, Inc. (a)(l) | | 173,740 | | $ | 3,189,866 |
| Dick’s Sporting Goods, Inc. (a)(l) | | 202,850 | | | 5,594,603 |
| Ethan Allen Interiors, Inc. (l) | | 61,080 | | | 1,663,819 |
| Nordstrom, Inc. | | 135,700 | | | 5,024,971 |
| PetSmart, Inc. (l) | | 167,820 | | | 3,613,165 |
| Staples, Inc. | | 165,900 | | | 3,691,275 |
| Zumiez, Inc. (a)(l) | | 119,480 | | | 2,100,458 |
| | | | | |
| | | | | $ | 24,878,157 |
| Telecommunications - Wireless - 0.6% | | | | | |
| Rogers Communications, Inc., “B” | | 171,500 | | $ | 6,777,656 |
| | |
| Telephone Services - 2.5% | | | | | |
| AT&T, Inc. | | 618,130 | | $ | 21,529,468 |
| Embarq Corp. | | 90,780 | | | 3,807,313 |
| Qwest Communications International, Inc. (l) | | 283,100 | | | 1,528,740 |
| | | | | |
| | | | | $ | 26,865,521 |
| Tobacco - 1.7% | | | | | |
| Altria Group, Inc. | | 252,540 | | $ | 18,470,776 |
| | |
| Utilities - Electric Power - 3.4% | | | | | |
| American Electric Power Co., Inc. | | 160,560 | | $ | 6,570,115 |
| DPL, Inc. | | 207,360 | | | 5,289,754 |
| Entergy Corp. | | 50,010 | | | 5,138,027 |
| NRG Energy, Inc. (l) | | 181,530 | | | 7,491,743 |
| Public Service Enterprise Group, Inc. | | 140,860 | | | 6,211,926 |
| Westar Energy, Inc. (l) | | 235,090 | | | 5,343,592 |
| | | | | |
| | | | | $ | 36,045,157 |
| Total Common Stocks (Identified Cost, $1,098,142,577) | | | | $ | 1,045,079,147 |
11
Portfolio of Investments (unaudited) – continued
| | | | | |
| Collateral for Securities Loaned - 11.9% | | | | | |
| Issuer | | Shares/Par | | Value ($) |
Navigator Securities Lending Prime Portfolio,
at Cost and Net Asset Value | | 125,406,056 | | $ | 125,406,056 |
| Total Investments (Identified Cost, $1,223,548,633) (k) | | | | $ | 1,170,485,203 |
| | |
| Other Assets, Less Liabilities - (11.0)% | | | | | (115,609,840) |
| Net Assets - 100.0% | | | | $ | 1,054,875,363 |
| (a) | Non-income producing security. |
| (k) | As of February 29, 2008, the fund had five securities that were fair valued, aggregating $34,427,398 and 2.94% of market value, in accordance with the policies adopted by the Board of Trustees. |
| (l) | All or a portion of this security is on loan. |
| (z) | Restricted securities are not registered under the Securities Act of 1933 and are subject to legal restrictions on resale. These securities generally may be resold in transactions exempt from registration or to the public if the securities are subsequently registered. Disposal of these securities may involve time-consuming negotiations and prompt sale at an acceptable price may be difficult. The fund holds the following restricted securities: |
| | | | | | |
| Restricted Securities | | Acquisition
Date | | Acquisition
Cost | | Current
Market
Value |
| Euro Dekania Ltd. | | 3/08/07-6/25/07 | | $7,015,361 | | $7,065,093 |
| % of Net Assets | | | | | | 0.7% |
The following abbreviations are used in this report and are defined:
| ADR | | American Depository Receipt |
| REIT | | Real Estate Investment Trust |
See Notes to Financial Statements
12
Financial Statements
STATEMENT OF ASSETS AND LIABILITIES
At 2/29/08 (unaudited)
This statement represents your fund’s balance sheet, which details the assets and liabilities comprising the total value of the fund.
| | | | | |
| Assets | | | | | |
| Investments, at value, including $127,006,070 of securities on loan (identified cost, $1,223,548,633) | | $1,170,485,203 | | | |
| Receivable for investments sold | | 16,904,127 | | | |
| Receivable for fund shares sold | | 356,502 | | | |
| Interest and dividends receivable | | 1,766,076 | | | |
| Other assets | | 19,158 | | | |
| Total assets | | | | | $1,189,531,066 |
| Liabilities | | | | | |
| Payable to custodian | | $5,420,207 | | | |
| Payable for investments purchased | | 1,055,825 | | | |
| Payable for fund shares reacquired | | 2,216,469 | | | |
| Collateral for securities loaned, at value (c) | | 125,406,056 | | | |
| Payable to affiliates | | | | | |
Management fee | | 35,497 | | | |
Distribution and service fees | | 32,074 | | | |
Administrative services fee | | 784 | | | |
Retirement plan administration and services fees | | 79 | | | |
| Payable for independent trustees’ compensation | | 237,101 | | | |
| Accrued expenses and other liabilities | | 251,611 | | | |
| Total liabilities | | | | | $134,655,703 |
| Net assets | | | | | $1,054,875,363 |
| Net assets consist of: | | | | | |
| Paid-in capital | | $3,408,770,053 | | | |
| Unrealized appreciation (depreciation) on investments and translation of assets and liabilities in foreign currencies | | (53,032,969 | ) | | |
| Accumulated net realized gain (loss) on investments and foreign currency transactions | | (2,302,563,679 | ) | | |
| Undistributed net investment income | | 1,701,958 | | | |
| Net assets | | | | | $1,054,875,363 |
| Shares of beneficial interest outstanding | | | | | 63,898,184 |
13
Statement of Assets and Liabilities (unaudited) – continued
| | | | |
| Class A shares | | | | |
Net assets | | $662,909,675 | | |
Shares outstanding | | 39,193,271 | | |
Net asset value per share | | | | $16.91 |
Offering price per share (100 / 94.25 × net asset value per share) | | | | $17.94 |
| Class B shares | | | | |
Net assets | | $229,480,733 | | |
Shares outstanding | | 14,663,141 | | |
Net asset value and offering price per share | | | | $15.65 |
| Class C shares | | | | |
Net assets | | $87,397,230 | | |
Shares outstanding | | 5,609,771 | | |
Net asset value and offering price per share | | | | $15.58 |
| Class I shares | | | | |
Net assets | | $23,629,461 | | |
Shares outstanding | | 1,342,533 | | |
Net asset value, offering price, and redemption price per share | | | | $17.60 |
| Class R shares | | | | |
Net assets | | $1,890,522 | | |
Shares outstanding | | 112,794 | | |
Net asset value, offering price, and redemption price per share | | | | $16.76 |
| Class R1 shares | | | | |
Net assets | | $3,863,997 | | |
Shares outstanding | | 247,960 | | |
Net asset value, offering price, and redemption price per share | | | | $15.58 |
| Class R2 shares | | | | |
Net assets | | $2,098,249 | | |
Shares outstanding | | 133,031 | | |
Net asset value, offering price, and redemption price per share | | | | $15.77 |
| Class R3 shares | | | | |
Net assets | | $13,947,630 | | |
Shares outstanding | | 839,364 | | |
Net asset value, offering price, and redemption price per share | | | | $16.62 |
| Class R4 shares | | | | |
Net assets | | $29,597,244 | | |
Shares outstanding | | 1,752,765 | | |
Net asset value, offering price, and redemption price per share | | | | $16.89 |
| Class R5 shares | | | | |
Net assets | | $60,622 | | |
Shares outstanding | | 3,554 | | |
Net asset value, offering price, and redemption price per share | | | | $17.06 |
On sales of $50,000 or more, the offering price of Class A shares is reduced. A contingent deferred sales charge may be imposed on redemptions of Class A, Class B, and Class C shares.
| (c) | Non-cash collateral not included. |
See Notes to Financial Statements
14
Financial Statements
STATEMENT OF OPERATIONS
Six months ended 2/29/08 (unaudited)
This statement describes how much your fund earned in investment income and accrued in expenses. It also describes any gains and/or losses generated by fund operations.
| | | | | | |
| Net investment income | | | | | | |
| Income | | | | | | |
Dividends | | $9,478,355 | | | | |
Income on securities loaned | | 519,391 | | | | |
Interest | | 133,197 | | | | |
Foreign taxes withheld | | (13,305 | ) | | | |
| Total investment income | | | | | $10,117,638 | |
| Expenses | | | | | | |
Management fee | | $3,589,687 | | | | |
Distribution and service fees | | 3,352,906 | | | | |
Shareholder servicing costs | | 830,775 | | | | |
Administrative services fee | | 89,771 | | | | |
Retirement plan administration and services fees | | 31,357 | | | | |
Independent trustees’ compensation | | 13,199 | | | | |
Custodian fee | | 118,953 | | | | |
Shareholder communications | | 70,208 | | | | |
Auditing fees | | 23,414 | | | | |
Legal fees | | 11,213 | | | | |
Miscellaneous | | 74,908 | | | | |
| Total expenses | | | | | $8,206,391 | |
Fees paid indirectly | | (5,456 | ) | | | |
Reduction of expenses by investment adviser | | (2,723 | ) | | | |
| Net expenses | | | | | $8,198,212 | |
| Net investment income | | | | | $1,919,426 | |
| Realized and unrealized gain (loss) on investments | | | | | | |
| Realized gain (loss) (identified cost basis) | | | | | | |
Investment transactions | | $(28,502,119 | ) | | | |
Foreign currency transactions | | 5,008 | | | | |
Net realized gain (loss) on investments
and foreign currency transactions | | | | | $(28,497,111 | ) |
| Change in unrealized appreciation (depreciation) | | | | | | |
Investments | | $(68,365,433 | ) | | | |
Translation of assets and liabilities in foreign currencies | | 34,077 | | | | |
Net unrealized gain (loss) on investments
and foreign currency translation | | | | | $(68,331,356 | ) |
Net realized and unrealized gain (loss) on investments
and foreign currency | | | | | $(96,828,467 | ) |
| Change in net assets from operations | | | | | $(94,909,041 | ) |
See Notes to Financial Statements
15
Financial Statements
STATEMENTS OF CHANGES IN NET ASSETS
These statements describe the increases and/or decreases in net assets resulting from operations, any distributions, and any shareholder transactions.
| | | | | | |
| | | Six months ended
2/29/08
(unaudited) | | | Year ended
8/31/07 | |
| Change in net assets | | | | |
| From operations | | | | | | |
| Net investment income | | $1,919,426 | | | $84,182 | |
| Net realized gain (loss) on investments and foreign currency transactions | | (28,497,111 | ) | | 114,285,109 | |
| Net unrealized gain (loss) on investments and foreign currency translation | | (68,331,356 | ) | | (101,717,953 | ) |
| Change in net assets from operations | | $(94,909,041 | ) | | $12,651,338 | |
| Distributions declared to shareholders | | | | | | |
| From net realized gain on investments | | | | | | |
Class A | | $(55,958,980 | ) | | $(10,891,644 | ) |
Class B | | (22,499,641 | ) | | (3,614,424 | ) |
Class C | | (8,053,425 | ) | | (1,273,576 | ) |
Class I | | (1,831,049 | ) | | (376,619 | ) |
Class R | | (183,230 | ) | | (399,070 | ) |
Class R1 | | (329,794 | ) | | (34,465 | ) |
Class R2 | | (159,753 | ) | | (64,230 | ) |
Class R3 | | (1,031,345 | ) | | (96,597 | ) |
Class R4 | | (2,393,639 | ) | | (1,876,812 | ) |
Class R5 | | (4,832 | ) | | (4,256 | ) |
| Total distributions declared to shareholders | | $(92,445,688 | ) | | $(18,631,693 | ) |
| Change in net assets from fund share transactions | | $(36,511,916 | ) | | $1,037,237,225 | |
| Total change in net assets | | $(223,866,645 | ) | | $1,031,256,870 | |
| Net assets | | | | | | |
| At beginning of period | | 1,278,742,008 | | | 247,485,138 | |
| At end of period (including undistributed net investment income of $1,701,958 and accumulated net investment loss of $217,468) | | $1,054,875,363 | | | $1,278,742,008 | |
See Notes to Financial Statements
16
Financial Statements
FINANCIAL HIGHLIGHTS
The financial highlights table is intended to help you understand the fund’s financial performance for the semiannual period and the past 5 fiscal years (or life of a particular share class, if shorter). Certain information reflects financial results for a single fund share. The total returns in the table represent the rate by which an investor would have earned (or lost) on an investment in the fund share class (assuming reinvestment of all distributions) held for the entire period.
| | | | | | | | | | | | | | | | |
| | | Six months
ended
2/29/08 (unaudited) | | | Years ended 8/31 |
| Class A | | | 2007 | | | 2006 | | | 2005 | | 2004 | | | 2003 |
| | | | | | | | | | | | | | | |
| Net asset value, beginning of period | | $19.83 | | | $18.17 | | | $17.88 | | | $15.35 | | $13.97 | | | $12.51 |
| Income (loss) from investment operations | | | | | | | | | | | | | | |
Net investment income (d) | | $0.05 | | | $0.04 | | | $0.03 | | | $0.03 | | $0.03 | | | $0.04 |
Net realized and unrealized
gain (loss) on investments
and foreign currency | | (1.51 | ) | | 3.01 | | | 1.06 | | | 2.50 | | 1.35 | | | 1.42 |
| Total from investment operations | | $(1.46 | ) | | $3.05 | | | $1.09 | | | $2.53 | | $1.38 | | | $1.46 |
| Less distributions declared to shareholders | | | | | | | | | | | | | | |
From net realized gain
on investments | | $(1.46 | ) | | $(1.39 | ) | | $(0.80 | ) | | $— | | $— | | | $— |
| Net asset value, end of period | | $16.91 | | | $19.83 | | | $18.17 | | | $17.88 | | $15.35 | | | $13.97 |
| Total return (%) (r)(s)(t) | | (8.07 | )(n) | | 17.26 | | | 6.25 | | | 16.48 | | 9.88 | (b) | | 11.67 |
Ratios (%) (to average net assets)
and Supplemental data: | | | | | | | | | | | | | | |
| Expenses before expense reductions (f) | | 1.15 | (a) | | 1.26 | | | 1.37 | | | 1.41 | | 1.38 | | | 1.47 |
| Expenses after expense reductions (f) | | 1.15 | (a) | | 1.26 | | | 1.36 | | | 1.41 | | 1.38 | | | N/A |
| Net investment income | | 0.52 | (a) | | 0.22 | | | 0.15 | | | 0.17 | | 0.22 | | | 0.29 |
| Portfolio turnover | | 43 | | | 283 | | | 138 | | | 81 | | 116 | | | 121 |
Net assets at end of period
(000 Omitted) | | $662,910 | | | $766,202 | | | $146,355 | | | $141,808 | | $67,415 | | | $53,704 |
See Notes to Financial Statements
17
Financial Highlights – continued
| | | | | | | | | | | | | | | | | | |
| | | Six months
ended
2/29/08 (unaudited) | | | Years ended 8/31 | |
| Class B | | | 2007 | | | 2006 | | | 2005 | | | 2004 | | | 2003 | |
| | | | | | | | | | | | | | | | | |
| Net asset value, beginning of period | | $18.52 | | | $17.16 | | | $17.03 | | | $14.71 | | | $13.48 | | | $12.14 | |
| Income (loss) from investment operations | | | | | | | | | | | | | | | | |
Net investment loss (d) | | $(0.01 | ) | | $(0.08 | ) | | $(0.09 | ) | | $(0.08 | ) | | $(0.06 | ) | | $(0.04 | ) |
Net realized and unrealized
gain (loss) on investments
and foreign currency | | (1.40 | ) | | 2.83 | | | 1.02 | | | 2.40 | | | 1.29 | | | 1.38 | |
| Total from investment operations | | $(1.41 | ) | | $2.75 | | | $0.93 | | | $2.32 | | | $1.23 | | | $1.34 | |
| Less distributions declared to shareholders | | | | | | | | | | | | | | | | |
From net realized gain
on investments | | $(1.46 | ) | | $(1.39 | ) | | $(0.80 | ) | | $— | | | $— | | | $— | |
| Net asset value, end of period | | $15.65 | | | $18.52 | | | $17.16 | | | $17.03 | | | $14.71 | | | $13.48 | |
| Total return (%) (r)(s)(t) | | (8.38 | )(n) | | 16.49 | | | 5.60 | | | 15.77 | | | 9.12 | (b) | | 11.04 | |
Ratios (%) (to average net assets)
and Supplemental data: | | | | | | | | | | | | | | | | |
| Expenses before expense reductions (f) | | 1.79 | (a) | | 1.90 | | | 2.02 | | | 2.06 | | | 2.02 | | | 2.12 | |
| Expenses after expense reductions (f) | | 1.79 | (a) | | 1.90 | | | 2.02 | | | 2.06 | | | 2.02 | | | N/A | |
| Net investment loss | | (0.13 | )(a) | | (0.46 | ) | | (0.50 | ) | | (0.47 | ) | | (0.43 | ) | | (0.36) | |
| Portfolio turnover | | 43 | | | 283 | | | 138 | | | 81 | | | 116 | | | 121 | |
Net assets at end of period
(000 Omitted) | | $229,481 | | | $325,525 | | | $49,192 | | | $71,088 | | | $73,395 | | | $75,007 | |
See Notes to Financial Statements
18
Financial Highlights – continued
| | | | | | | | | | | | | | | | | | |
| | | Six months
ended
2/29/08 (unaudited) | | | Years ended 8/31 | |
| Class C | | | 2007 | | | 2006 | | | 2005 | | | 2004 | | | 2003 | |
| | | | | | | | | | | | | | | | | |
| Net asset value, beginning of period | | $18.44 | | | $17.09 | | | $16.97 | | | $14.66 | | | $13.43 | | | $12.10 | |
| Income (loss) from investment operations | | | | | | | | | | | | | | | | |
Net investment loss (d) | | $(0.01 | ) | | $(0.08 | ) | | $(0.09 | ) | | $(0.08 | ) | | $(0.06 | ) | | $(0.04 | ) |
Net realized and unrealized
gain (loss) on investments
and foreign currency | | (1.39 | ) | | 2.82 | | | 1.01 | | | 2.39 | | | 1.29 | | | 1.37 | |
| Total from investment operations | | $(1.40 | ) | | $2.74 | | | $0.92 | | | $2.31 | | | $1.23 | | | $1.33 | |
| Less distributions declared to shareholders | | | | | | | | | | | | | | | | |
From net realized gain
on investments | | $(1.46 | ) | | $(1.39 | ) | | $(0.80 | ) | | $— | | | $— | | | $— | |
| Net asset value, end of period | | $15.58 | | | $18.44 | | | $17.09 | | | $16.97 | | | $14.66 | | | $13.43 | |
| Total return (%) (r)(s)(t) | | (8.36 | )(n) | | 16.50 | | | 5.56 | | | 15.76 | | | 9.16 | (b) | | 10.99 | |
Ratios (%) (to average net assets)
and Supplemental data: | | | | | | | | | | | | | | | | |
| Expenses before expense reductions (f) | | 1.80 | (a) | | 1.90 | | | 2.02 | | | 2.06 | | | 2.02 | | | 2.12 | |
| Expenses after expense reductions (f) | | 1.80 | (a) | | 1.90 | | | 2.02 | | | 2.06 | | | 2.02 | | | N/A | |
| Net investment loss | | (0.13 | )(a) | | (0.45 | ) | | (0.50 | ) | | (0.48 | ) | | (0.43 | ) | | (0.35 | ) |
| Portfolio turnover | | 43 | | | 283 | | | 138 | | | 81 | | | 116 | | | 121 | |
Net assets at end of period
(000 Omitted) | | $87,397 | | | $107,948 | | | $16,613 | | | $17,898 | | | $15,990 | | | $15,325 | |
See Notes to Financial Statements
19
Financial Highlights – continued
| | | | | | | | | | | | | | | | |
| | | Six months
ended
2/29/08 (unaudited) | | | Years ended 8/31 |
| Class I | | | 2007 | | | 2006 | | | 2005 | | 2004 | | | 2003 |
| | | | | | | | | | | | | | | |
| Net asset value, beginning of period | | $20.54 | | | $18.72 | | | $18.33 | | | $15.68 | | $14.22 | | | $12.69 |
| Income (loss) from investment operations | | | | | | | | |
Net investment income (d) | | $0.09 | | | $0.11 | | | $0.09 | | | $0.09 | | $0.09 | | | $0.08 |
Net realized and unrealized
gain (loss) on investments
and foreign currency | | (1.57 | ) | | 3.10 | | | 1.10 | | | 2.56 | | 1.37 | | | 1.45 |
| Total from investment operations | | $(1.48 | ) | | $3.21 | | | $1.19 | | | $2.65 | | $1.46 | | | $1.53 |
| Less distributions declared to shareholders | | | | | | | | | | | |
From net realized gain
on investments | | $(1.46 | ) | | $(1.39 | ) | | $(0.80 | ) | | $— | | $— | | | $— |
| Net asset value, end of period | | $17.60 | | | $20.54 | | | $18.72 | | | $18.33 | | $15.68 | | | $14.22 |
| Total return (%) (r)(s) | | (7.88 | )(n) | | 17.63 | | | 6.66 | | | 16.90 | | 10.27 | (b) | | 12.06 |
Ratios (%) (to average net assets)
and Supplemental data: | | | | | | | | | | | | | | |
| Expenses before expense reductions (f) | | 0.80 | (a) | | 0.92 | | | 1.01 | | | 1.09 | | 1.03 | | | 1.12 |
| Expenses after expense reductions (f) | | 0.80 | (a) | | 0.92 | | | 1.01 | | | 1.09 | | 1.03 | | | N/A |
| Net investment income | | 0.88 | (a) | | 0.58 | | | 0.50 | | | 0.51 | | 0.56 | | | 0.65 |
| Portfolio turnover | | 43 | | | 283 | | | 138 | | | 81 | | 116 | | | 121 |
Net assets at end of period
(000 Omitted) | | $23,629 | | | $27,544 | | | $4,763 | | | $3,170 | | $460 | | | $398 |
See Notes to Financial Statements
20
Financial Highlights – continued
| | | | | | | | | | | | | | | | | | |
| | | Six months
ended
2/29/08 (unaudited) | | | Years ended 8/31 | |
| Class R | | | 2007 | | | 2006 | | | 2005 | | | 2004 | | | 2003 (i) | |
| | | | | | | | | | | | | | | | | |
| Net asset value, beginning of period | | $19.68 | | | $18.06 | | | $17.80 | | | $15.31 | | | $13.96 | | | $11.98 | |
| Income (loss) from investment operations | | | | | | | | | | |
Net investment income (loss) (d) | | $0.04 | | | $0.03 | | | $0.00 | (w) | | $0.00 | (w) | | $0.02 | | | $(0.00 | )(w) |
Net realized and unrealized
gain (loss) on investments
and foreign currency | | (1.50 | ) | | 2.98 | | | 1.06 | | | 2.49 | | | 1.33 | | | 1.98 | (g) |
| Total from investment operations | | $(1.46 | ) | | $3.01 | | | $1.06 | | | $2.49 | | | $1.35 | | | $1.98 | |
| Less distributions declared to shareholders | | | | | | | | | | | | | |
From net realized gain
on investments | | $(1.46 | ) | | $(1.39 | ) | | $(0.80 | ) | | $— | | | $— | | | $— | |
| Net asset value, end of period | | $16.76 | | | $19.68 | | | $18.06 | | | $17.80 | | | $15.31 | | | $13.96 | |
| Total return (%) (r)(s) | | (8.13 | )(n) | | 17.14 | | | 6.11 | | | 16.26 | | | 9.67 | (b) | | 16.53 | (n) |
Ratios (%) (to average net assets)
and Supplemental data: | | | | | | | | | | | | | | | | |
| Expenses before expense reductions (f) | | 1.28 | (a) | | 1.45 | | | 1.51 | | | 1.56 | | | 1.49 | | | 1.74 | (a) |
| Expenses after expense reductions (f) | | 1.28 | (a) | | 1.45 | | | 1.51 | | | 1.56 | | | 1.49 | | | N/A | |
| Net investment income (loss) | | 0.41 | (a) | | 0.14 | | | 0.00 | (w) | | 0.03 | | | 0.13 | | | (0.04 | )(a) |
| Portfolio turnover | | 43 | | | 283 | | | 138 | | | 81 | | | 116 | | | 121 | |
Net assets at end of period
(000 Omitted) | | $1,891 | | | $5,933 | | | $5,446 | | | $5,888 | | | $3,030 | | | $17 | |
See Notes to Financial Statements
21
Financial Highlights – continued
| | | | | | | | | | | | |
| | | Six months
ended
2/29/08 (unaudited) | | | Years ended 8/31 | |
| Class R1 | | | 2007 | | | 2006 | | | 2005 (i) | |
| | | | | | | | | | | |
| Net asset value, beginning of period | | $18.45 | | | $17.11 | | | $17.01 | | | $16.25 | |
| Income (loss) from investment operations | | | | | | | | | | |
Net investment loss (d) | | $(0.02 | ) | | $(0.09 | ) | | $(0.10 | ) | | $(0.04 | ) |
Net realized and unrealized
gain (loss) on investments
and foreign currency | | (1.39 | ) | | 2.82 | | | 1.00 | | | 0.80 | (g) |
| Total from investment operations | | $(1.41 | ) | | $2.73 | | | $0.90 | | | $0.76 | |
| Less distributions declared to shareholders | | | | | | | | | | |
From net realized gain
on investments | | $(1.46 | ) | | $(1.39 | ) | | $(0.80 | ) | | $— | |
| Net asset value, end of period | | $15.58 | | | $18.45 | | | $17.11 | | | $17.01 | |
| Total return (%) (r)(s) | | (8.42 | )(n) | | 16.42 | | | 5.43 | | | 4.68 | (n) |
Ratios (%) (to average net assets)
and Supplemental data: | | | | | | | | | | |
| Expenses before expense reductions (f) | | 1.91 | (a) | | 2.05 | | | 2.20 | | | 2.23 | (a) |
| Expenses after expense reductions (f) | | 1.90 | (a) | | 2.02 | | | 2.11 | | | 2.23 | (a) |
| Net investment loss | | (0.25 | )(a) | | (0.51 | ) | | (0.61 | ) | | (0.63 | )(a) |
| Portfolio turnover | | 43 | | | 283 | | | 138 | | | 81 | |
Net assets at end of period
(000 Omitted) | | $3,864 | | | $2,543 | | | $441 | | | $55 | |
See Notes to Financial Statements
22
Financial Highlights – continued
| | | | | | | | | | | | |
| | | Six months
ended
2/29/08 (unaudited) | | | Years ended 8/31 | |
| Class R2 | | | 2007 | | | 2006 | | | 2005 (i) | |
| | | | | | | | | | | |
| Net asset value, beginning of period | | $18.62 | | | $17.20 | | | $17.03 | | | $16.25 | |
| Income (loss) from investment operations | | | | |
Net investment income (loss) (d) | | $0.02 | | | $(0.02 | ) | | $(0.05 | ) | | $(0.02 | ) |
Net realized and unrealized
gain (loss) on investments
and foreign currency | | (1.41 | ) | | 2.83 | | | 1.02 | | | 0.80 | (g) |
| Total from investment operations | | $(1.39 | ) | | $2.81 | | | $0.97 | | | $0.78 | |
| Less distributions declared to shareholders | | | | | | | | | | |
From net realized gain
on investments | | $(1.46 | ) | | $(1.39 | ) | | $(0.80 | ) | | $— | |
| Net asset value, end of period | | $15.77 | | | $18.62 | | | $17.20 | | | $17.03 | |
| Total return (%) (r)(s) | | (8.22 | )(n) | | 16.81 | | | 5.85 | | | 4.80 | (n) |
Ratios (%) (to average net assets)
and Supplemental data: | | | | | | | | | | |
| Expenses before expense reductions (f) | | 1.46 | (a) | | 1.78 | | | 1.90 | | | 1.93 | (a) |
| Expenses after expense reductions (f) | | 1.46 | (a) | | 1.70 | | | 1.75 | | | 1.93 | (a) |
| Net investment income (loss) | | 0.20 | (a) | | (0.11 | ) | | (0.29 | ) | | (0.33 | )(a) |
| Portfolio turnover | | 43 | | | 283 | | | 138 | | | 81 | |
Net assets at end of period
(000 Omitted) | | $2,098 | | | $1,528 | | | $780 | | | $52 | |
See Notes to Financial Statements
23
Financial Highlights – continued
| | | | | | | | | | | | | | | |
| | | Six months
ended
2/29/08 (unaudited) | | | Years ended 8/31 | |
| Class R3 | | | 2007 | | | 2006 | | | 2005 | | | 2004 (i) | |
| | | | | | | | | | | | | | |
| Net asset value, beginning of period | | $19.53 | | | $17.97 | | | $17.74 | | | $15.29 | | | $14.57 | |
| Income (loss) from investment operations | | | | | | | |
Net investment income (loss) (d) | | $0.02 | | | $(0.01 | ) | | $(0.03 | ) | | $(0.04 | ) | | $0.03 | |
Net realized and unrealized
gain (loss) on investments
and foreign currency | | (1.47 | ) | | 2.96 | | | 1.06 | | | 2.49 | | | 0.69 | (g) |
| Total from investment operations | | $(1.45 | ) | | $2.95 | | | $1.03 | | | $2.45 | | | $0.72 | |
| Less distributions declared to shareholders | | | | | | | | | | | | | |
From net realized gain
on investments | | $(1.46 | ) | | $(1.39 | ) | | $(0.80 | ) | | $— | | | $— | |
| Net asset value, end of period | | $16.62 | | | $19.53 | | | $17.97 | | | $17.74 | | | $15.29 | |
| Total return (%) (r)(s) | | (8.14 | )(n) | | 16.88 | | | 5.96 | | | 16.02 | | | 4.94 | (b)(n) |
Ratios (%) (to average net assets)
and Supplemental data: | | | | | | | | | | | | | |
| Expenses before expense reductions (f) | | 1.40 | (a) | | 1.61 | | | 1.77 | | | 1.81 | | | 1.80 | (a) |
| Expenses after expense reductions (f) | | 1.40 | (a) | | 1.58 | | | 1.67 | | | 1.81 | | | 1.80 | (a) |
| Net investment income (loss) | | 0.26 | (a) | | (0.05 | ) | | (0.15 | ) | | (0.22 | ) | | 0.27 | (a) |
| Portfolio turnover | | 43 | | | 283 | | | 138 | | | 81 | | | 116 | |
Net assets at end of period
(000 Omitted) | | $13,948 | | | $9,492 | | | $1,193 | | | $948 | | | $616 | |
See Notes to Financial Statements
24
Financial Highlights – continued
| | | | | | | | | | | | |
| | | Six months
ended
2/29/08 (unaudited) | | | Years ended 8/31 | |
| Class R4 | | | 2007 | | | 2006 | | | 2005 (i) | |
| | | | | | | | | | | |
| Net asset value, beginning of period | | $19.80 | | | $18.15 | | | $17.88 | | | $17.02 | |
| Income (loss) from investment operations | | | | |
Net investment income (d) | | $0.05 | | | $0.05 | | | $0.05 | | | $0.01 | |
Net realized and unrealized
gain (loss) on investments
and foreign currency | | (1.50 | ) | | 2.99 | | | 1.02 | | | 0.85 | (g) |
| Total from investment operations | | $(1.45 | ) | | $3.04 | | | $1.07 | | | $0.86 | |
| Less distributions declared to shareholders | | | | | | | | | | |
From net realized gain
on investments | | $(1.46 | ) | | $(1.39 | ) | | $(0.80 | ) | | $— | |
| Net asset value, end of period | | $16.89 | | | $19.80 | | | $18.15 | | | $17.88 | |
| Total return (%) (r)(s) | | (8.03 | )(n) | | 17.22 | | | 6.14 | | | 5.05 | (n) |
Ratios (%) (to average net assets)
and Supplemental data: | | | | | | | | | | |
| Expenses before expense reductions (f) | | 1.15 | (a) | | 1.36 | | | 1.37 | | | 1.43 | (a) |
| Expenses after expense reductions (f) | | 1.15 | (a) | | 1.36 | | | 1.37 | | | 1.43 | (a) |
| Net investment income | | 0.52 | (a) | | 0.24 | | | 0.27 | | | 0.17 | (a) |
| Portfolio turnover | | 43 | | | 283 | | | 138 | | | 81 | |
Net assets at end of period
(000 Omitted) | | $29,597 | | | $31,963 | | | $22,646 | | | $53 | |
See Notes to Financial Statements
25
Financial Highlights – continued
| | | | | | | | | | | | |
| | | Six months
ended
2/29/08 (unaudited) | | | Years ended 8/31 | |
| Class R5 | | | 2007 | | | 2006 | | | 2005 (i) | |
| | | | | | | | | | | |
| Net asset value, beginning of period | | $19.96 | | | $18.24 | | | $17.90 | | | $17.02 | |
| Income (loss) from investment operations | | | | |
Net investment income (d) | | $0.08 | | | $0.11 | | | $0.07 | | | $0.03 | |
Net realized and unrealized
gain (loss) on investments
and foreign currency | | (1.52 | ) | | 3.00 | | | 1.07 | | | 0.85 | (g) |
| Total from investment operations | | $(1.44 | ) | | $3.11 | | | $1.14 | | | $0.88 | |
| Less distributions declared to shareholders | | | | | | | | | | |
From net realized gain
on investments | | $(1.46 | ) | | $(1.39 | ) | | $(0.80 | ) | | $— | |
| Net asset value, end of period | | $17.06 | | | $19.96 | | | $18.24 | | | $17.90 | |
| Total return (%) (r)(s) | | (7.91 | )(n) | | 17.54 | | | 6.54 | | | 5.17 | (n) |
Ratios (%) (to average net assets)
and Supplemental data: | | | | | | | | | | |
| Expenses before expense reductions (f) | | 0.86 | (a) | | 1.06 | | | 1.12 | | | 1.13 | (a) |
| Expenses after expense reductions (f) | | 0.86 | (a) | | 1.06 | | | 1.12 | | | 1.13 | (a) |
| Net investment income | | 0.81 | (a) | | 0.55 | | | 0.40 | | | 0.47 | (a) |
| Portfolio turnover | | 43 | | | 283 | | | 138 | | | 81 | |
Net assets at end of period
(000 Omitted) | | $61 | | | $66 | | | $56 | | | $53 | |
Any redemption fees charged by the fund during the 2004 and 2005 fiscal years resulted in a per share impact of less than $0.01.
| (b) | The fund’s net asset value and total return calculation include a non-recurring accrual recorded as a result of an administrative proceeding regarding disclosure of brokerage allocation practices in connection with fund sales. The non-recurring accrual did not have a material impact on the net asset value per share based on the shares outstanding on the day the proceeds were recorded. |
| (d) | Per share data are based on average shares outstanding. |
| (f) | Ratios do not reflect reductions from fees paid indirectly, if applicable. |
| (g) | The per share amount is not in accordance with the net realized and unrealized gain/loss for the period because of the timing of sales of fund shares and the per share amount of realized and unrealized gains and losses at such time. |
| (i) | For the period from the class’ inception, December 31, 2002 (Class R), October 31, 2003 (Class R3), and April 1, 2005 (Classes R1, R2, R4, and R5) through the stated period end. |
| (r) | Certain expenses have been reduced without which performance would have been lower. |
| (s) | From time to time the fund may receive proceeds from litigation settlements, without which performance would be lower. |
| (t) | Total returns do not include any applicable sales charges. |
| (w) | Per share amount was less than $0.01. |
See Notes to Financial Statements
26
NOTES TO FINANCIAL STATEMENTS
(unaudited)
| (1) | | Business and Organization |
MFS Core Equity Fund (the fund) is a series of MFS Series Trust I (the trust). The trust is organized as a Massachusetts business trust and is registered under the Investment Company Act of 1940, as amended, as an open-end management investment company.
| (2) | | Significant Accounting Policies |
General – The preparation of financial statements in conformity with U.S. generally accepted accounting principles requires management to make estimates and assumptions that affect the reported amounts of assets and liabilities, and disclosure of contingent assets and liabilities at the date of the financial statements and the reported amounts of revenues and expenses during the reporting period. Actual results could differ from those estimates. The fund can invest in foreign securities, including securities of emerging market issuers. Investments in foreign securities are vulnerable to the effects of changes in the relative values of the local currency and the U.S. dollar and to the effects of changes in each country’s legal, political, and economic environment. The markets of emerging markets countries are generally more volatile than the markets of developed countries with more mature economies. All of the risks of investing in foreign securities previously described are heightened when investing in emerging markets countries.
Investment Valuations – Equity securities, including restricted equity securities, are generally valued at the last sale or official closing price as reported by an independent pricing service on the market or exchange on which they are primarily traded. For securities for which there were no sales reported that day, equity securities are generally valued at the last quoted daily bid quotation as reported by an independent pricing service on the market or exchange on which they are primarily traded. For securities held short for which there were no sales reported for the day, the position is generally valued at the last quoted daily ask quotation as reported by an independent pricing service on the market or exchange on which such securities are primarily traded. Short-term instruments with a maturity at issuance of 60 days or less may be valued at amortized cost, which approximates market value. Open-end investment companies are generally valued at net asset value per share. Securities and other assets generally valued on the basis of information from an independent pricing service may also be valued at a broker-dealer bid quotation. The values of foreign securities and other assets and liabilities expressed in foreign currencies are converted to U.S. dollars using the mean of bid and asked prices for rates reported by an independent pricing service.
27
Notes to Financial Statements (unaudited) – continued
The Board of Trustees has delegated primary responsibility for determining or causing to be determined the value of the fund’s investments (including any fair valuation) to the adviser pursuant to valuation policies and procedures approved by the Board. If the adviser determines that reliable market quotations are not readily available, investments are valued at fair value as determined in good faith by the adviser in accordance with such procedures under the oversight of the Board of Trustees. Under the fund’s valuation policies and procedures, market quotations are not considered to be readily available for many types of debt instruments and certain types of derivatives. These investments are generally valued at fair value based on information from independent pricing services. In addition, investments may be valued at fair value if the adviser determines that an investment’s value has been materially affected by events occurring after the close of the exchange or market on which the investment is principally traded (such as foreign exchange or market) and prior to the determination of the fund’s net asset value, or after the halting of trading of a specific security where trading does not resume prior to the close of the exchange or market on which the security is principally traded. Events that occur on a frequent basis after foreign markets close (such as developments in foreign markets and significant movements in the U.S. markets) and prior to the determination of the fund’s net asset value may be deemed to have a material affect on the value of securities traded in foreign markets. Accordingly, the fund’s foreign equity securities may often be valued at fair value. The adviser may rely on independent pricing services or other information (such as the correlation with price movements of similar securities in the same or other markets; the type, cost and investment characteristics of the security; the business and financial condition of the issuer; and trading and other market data) to assist in determining whether to fair value and at what value to fair value an investment. The value of an investment for purposes of calculating the fund’s net asset value can differ depending on the source and method used to determine value. When fair valuation is used, the value of investments used to determine the fund’s net asset value may differ from quoted or published prices for the same investments.
In September 2006, FASB Statement No. 157, Fair Value Measurements (the “Statement”) was issued, and is effective for fiscal years beginning after November 15, 2007 and for all interim periods within those fiscal years. This Statement provides a single definition of fair value, a hierarchy for measuring fair value and expanded disclosures about fair value measurements. Management is evaluating the application of the Statement to the fund, and believes the impact will be limited to expanded disclosures resulting from the adoption of this Statement in the fund’s financial statements.
28
Notes to Financial Statements (unaudited) – continued
Repurchase Agreements – The fund may enter into repurchase agreements with institutions that the fund’s investment adviser has determined are creditworthy. Each repurchase agreement is recorded at cost. The fund requires that the securities collateral in a repurchase transaction be transferred to the custodian in a manner sufficient to enable the fund to obtain those securities in the event of a default under the repurchase agreement. The fund monitors, on a daily basis, the value of the collateral to ensure that its value, including accrued interest, is greater than amounts owed to the fund under each such repurchase agreement. The fund and other funds managed by Massachusetts Financial Services Company (MFS), may utilize a joint trading account for the purpose of entering into one or more repurchase agreements.
Foreign Currency Translation – Purchases and sales of foreign investments, income, and expenses are converted into U.S. dollars based upon currency exchange rates prevailing on the respective dates of such transactions. Gains and losses attributable to foreign currency exchange rates on sales of securities are recorded for financial statement purposes as net realized gains and losses on investments. Gains and losses attributable to foreign exchange rate movements on income and expenses are recorded for financial statement purposes as foreign currency transaction gains and losses. That portion of both realized and unrealized gains and losses on investments that results from fluctuations in foreign currency exchange rates is not separately disclosed.
Security Loans – State Street Bank and Trust Company (“State Street”), as lending agent, may loan the securities of the fund to certain qualified institutions (the “Borrowers”) approved by the fund. The loans are collateralized at all times by cash and/or U.S. Treasury and federal agency obligations in an amount at least equal to the market value of the securities loaned. State Street provides the fund with indemnification against Borrower default. The fund bears the risk of loss with respect to the investment of cash collateral. On loans collateralized by cash, the cash collateral is invested in a money market fund or short-term securities. A portion of the income generated upon investment of the collateral is remitted to the Borrowers, and the remainder is allocated between the fund and the lending agent. On loans collateralized by U.S. Treasury and/or federal agency obligations, a fee is received from the Borrower, and is allocated between the fund and the lending agent. Net income from securities lending is included in interest income on the Statement of Operations. The dividend and interest income earned on the securities loaned is accounted for in the same manner as other dividend and interest income. At February 29, 2008, the value of securities loaned was $127,006,070. These loans were collateralized by cash of $125,406,056 and U.S. Treasury obligations of $4,977,174.
Indemnifications – Under the fund’s organizational documents, its officers and trustees may be indemnified against certain liabilities and expenses arising
29
Notes to Financial Statements (unaudited) – continued
out of the performance of their duties to the fund. Additionally, in the normal course of business, the fund enters into agreements with service providers that may contain indemnification clauses. The fund’s maximum exposure under these agreements is unknown as this would involve future claims that may be made against the fund that have not yet occurred.
Investment Transactions and Income – Investment transactions are recorded on the trade date. Interest income is recorded on the accrual basis. All premium and discount is amortized or accreted for financial statement purposes in accordance with U.S. generally accepted accounting principles. Dividends received in cash are recorded on the ex-dividend date. Certain dividends from foreign securities will be recorded when the fund is informed of the dividend if such information is obtained subsequent to the ex-dividend date. Dividend and interest payments received in additional securities are recorded on the ex-dividend or ex-interest date in an amount equal to the value of the security on such date.
The fund may receive proceeds from litigation settlements. Any proceeds received from litigation involving portfolio holdings are reflected in the Statement of Operations in realized gain/loss if the security has been disposed of by the fund or in unrealized gain/loss if the security is still held by the fund. Any other proceeds from litigation not related to portfolio holdings are reflected as other income in the Statement of Operations.
Fees Paid Indirectly – The fund’s custody fee may be reduced according to an arrangement that measures the value of cash deposited with the custodian by the fund. This amount, for the six months ended February 29, 2008, is shown as a reduction of total expenses on the Statement of Operations.
Tax Matters and Distributions – The fund intends to qualify as a regulated investment company, as defined under Subchapter M of the Internal Revenue Code, and to distribute all of its taxable income, including realized capital gains. As a result, no provision for federal income tax is required. The fund adopted the provisions of FASB Interpretation No. 48, Accounting for Uncertainty in Income Taxes (“the Interpretation”) on September 1, 2007. The Interpretation prescribes a minimum threshold for financial statement recognition of the benefit of a tax position taken or expected to be taken in a tax return. There was no impact resulting from the adoption of this Interpretation on the fund’s financial statements. Each of the fund’s federal tax returns for the prior three fiscal years remains subject to examination by the Internal Revenue Service. It is the fund’s policy to record interest and penalty charges on underpaid taxes associated with its tax positions as interest expense and miscellaneous expense, respectively. No such charges were recorded in the current financial statements. Foreign taxes, if any, have been accrued by the fund in the accompanying financial statements.
30
Notes to Financial Statements (unaudited) – continued
Distributions to shareholders are recorded on the ex-dividend date. Income and capital gain distributions are determined in accordance with income tax regulations, which may differ from U.S. generally accepted accounting principles. Certain capital accounts in the financial statements are periodically adjusted for permanent differences in order to reflect their tax character. These adjustments have no impact on net assets or net asset value per share. Temporary differences which arise from recognizing certain items of income, expense, gain or loss in different periods for financial statement and tax purposes will reverse at some time in the future. Distributions in excess of net investment income or net realized gains are temporary overdistributions for financial statement purposes resulting from differences in the recognition or classification of income or distributions for financial statement and tax purposes.
Book/tax differences primarily relate to wash sale loss deferrals and capital loss carryforward and wash sale deferrals assumed as a result of the acquisition of MFS Capital Opportunities Fund.
The tax character of distributions made during the current period will be determined at fiscal year end. The tax character of distributions declared to shareholders is as follows:
| | |
| | | 8/31/07 |
Ordinary income (including any
short-term capital gains) | | $5,799,254 |
| Long-term capital gain | | 12,832,439 |
| Total distributions | | $18,631,693 |
The federal tax cost and the tax basis components of distributable earnings were as follows:
| | | |
| As of 2/29/08 | | | |
| Cost of investments | | $1,228,267,118 | |
| Gross appreciation | | 49,204,047 | |
| Gross depreciation | | (106,985,962 | ) |
| Net unrealized appreciation (depreciation) | | $(57,781,915 | ) |
| |
| As of 8/31/07 | | | |
| Undistributed ordinary income | | 17,431,786 | |
| Undistributed long-term capital gain | | 74,982,219 | |
| Capital loss carryforwards | | (2,269,307,497 | ) |
| Other temporary differences | | (229,987 | ) |
| Net unrealized appreciation (depreciation) | | 10,583,518 | |
The aggregate cost above includes prior fiscal year end tax adjustments.
31
Notes to Financial Statements (unaudited) – continued
As of February 29, 2008, the fund had capital loss carryforwards available to offset future realized gains. Such losses expire as follows:
| | | |
| 8/31/08 | | $ (598,681,443 | ) |
| 8/31/09 | | (1,596,472,098 | ) |
| 8/31/10 | | (74,153,956 | ) |
| | $(2,269,307,497 | ) |
The availability of a portion of the capital loss carryforwards, which were acquired on June 22, 2007 in connection with the MFS Capital Opportunities Fund merger, may be limited in a given year.
Multiple Classes of Shares of Beneficial Interest – The fund offers multiple classes of shares, which differ in their respective distribution and service fees. All shareholders bear the common expenses of the fund based on daily net assets of each class, without distinction between share classes. Dividends are declared separately for each class. Differences in per share dividend rates are generally due to differences in separate class expenses. Class B shares will convert to Class A shares approximately eight years after purchase.
| (3) | | Transactions with Affiliates |
Investment Adviser – The fund has an investment advisory agreement with MFS to provide overall investment management and related administrative services and facilities to the fund.
The management fee is computed daily and paid monthly at the following annual rates:
| | | |
| First $500 million of average daily net assets | | 0.65 | % |
| Average daily net assets in excess of $500 million | | 0.55 | % |
The management fee incurred for the six months ended February 29, 2008 was equivalent to an annual effective rate of 0.59% of the fund’s average daily net assets.
The investment adviser has agreed in writing to pay a portion of the fund’s operating expenses, exclusive of certain other fees and expenses, such that total annual fund operating expenses do not exceed the following rates annually of the fund’s average daily net assets with respect to each class. At February 29, 2008, the following expense limitations were in place:
| | | | | | | | | | | | | | | | | | |
| Class A | | Class B | | Class C | | Class I | | Class R | | Class R1 | | Class R2 | | Class R3 | | Class R4 | | Class R5 |
| 1.21% | | 1.86% | | 1.86% | | 0.86% | | 1.36% | | 1.96% (a) | | 1.36% | | 1.36% | | 1.11% | | 0.86% |
| (a) | Effective March 1, 2008 Class R1’s operating expenses will not exceed 1.86% of the class’ average daily net assets. |
This written agreement will continue through February 28, 2009 unless changed or rescinded by the fund’s Board of Trustees. For the six months ended February 29, 2008, the fund’s actual operating expenses did not exceed the limit and therefore, the investment adviser did not pay any portion of the fund’s expenses.
32
Notes to Financial Statements (unaudited) – continued
Distributor – MFS Fund Distributors, Inc. (MFD), a wholly-owned subsidiary of MFS, as distributor, received $24,902 for the six months ended February 29, 2008, as its portion of the initial sales charge on sales of Class A shares of the fund. The Board of Trustees has adopted a distribution plan for certain class shares pursuant to Rule 12b-1 of the Investment Company Act of 1940.
The fund’s distribution plan provides that the fund will pay MFD for services provided by MFD and financial intermediaries in connection with the distribution and servicing of certain share classes. One component of the plan is a distribution fee paid to MFD and another component of the plan is a service fee paid to MFD. MFD may subsequently pay all, or a portion, of the distribution and/or service fees to financial intermediaries.
Distribution Plan Fee Table:
| | | | | | | | | | |
| | | Distribution
Fee Rate | | Service
Fee Rate | | Total
Distribution
Plan (d) | | Annual
Effective
Rate (e) | | Distribution
and Service
Fee |
| Class A | | 0.10% | | 0.25% | | 0.35% | | 0.35% | | $1,304,153 |
| Class B | | 0.75% | | 0.25% | | 1.00% | | 1.00% | | 1,441,207 |
| Class C | | 0.75% | | 0.25% | | 1.00% | | 1.00% | | 506,243 |
| Class R | | 0.25% | | 0.25% | | 0.50% | | 0.50% | | 8,114 |
| Class R1 (c) | | 0.50% | | 0.25% | | 0.75% | | 0.75% | | 14,148 |
| Class R2 | | 0.25% | | 0.25% | | 0.50% | | 0.50% | | 5,072 |
| Class R3 | | 0.25% | | 0.25% | | 0.50% | | 0.50% | | 33,546 |
| Class R4 | | — | | 0.25% | | 0.25% | | 0.25% | | 40,423 |
| Total Distribution and Service Fees | | $3,352,906 |
| (c) | Effective March 1, 2008, the distribution fee rate for Class R1 shares will be 0.75% and the total distribution plan rate will be 1.00%. |
| (d) | In accordance with the distribution plan for certain classes, the fund pays distribution and/or service fees up to these annual percentage rates of each class’ average daily net assets. |
| (e) | The annual effective rates represent actual fees incurred under the distribution plan for the six months ended February 29, 2008 based on each class’ average daily net assets. Assets attributable to Class A shares sold prior to October 1, 1989 with respect to shares that were acquired as part of the reorganization of MFS Capital Opportunities Fund into MFS Core Equity Fund are subject to a service fee of 0.15% annually. |
Certain Class A and Class C shares are subject to a contingent deferred sales charge in the event of a shareholder redemption within 12 months of purchase. Class B shares are subject to a contingent deferred sales charge in the event of a shareholder redemption within six years of purchase. All contingent deferred sales charges are paid to MFD and during the six months ended February 29, 2008, were as follows:
| | |
| | | Amount |
| Class A | | $1,623 |
| Class B | | 85,901 |
| Class C | | 4,357 |
Shareholder Servicing Agent – MFS Service Center, Inc. (MFSC), a wholly-owned subsidiary of MFS, receives a fee from the fund for its services as
33
Notes to Financial Statements (unaudited) – continued
shareholder servicing agent calculated as a percentage of the average daily net assets of the fund as determined periodically under the supervision of the fund’s Board of Trustees. For the six months ended February 29, 2008, the fee was $353,852, which equated to 0.0583% annually of the fund’s average daily net assets. MFSC also receives payment from the fund for out-of-pocket expenses, sub-accounting and other shareholder servicing costs which may be paid to affiliated and unaffiliated service providers. For the six months ended February 29, 2008, these out-of-pocket expenses, sub-accounting and other shareholder servicing costs amounted to $476,923. The fund may also pay shareholder servicing related costs directly to non-related parties.
Administrator – MFS provides certain financial, legal, shareholder communications, compliance, and other administrative services to the fund. Under an administrative services agreement, the fund partially reimburses MFS the costs incurred to provide these services. The fund is charged a fixed amount plus a fee based on average daily net assets. The fund’s annual fixed amount is $17,500.
The administrative services fee incurred for the six months ended February 29, 2008 was equivalent to an annual effective rate of 0.0148% of the fund’s average daily net assets.
In addition to the administrative services provided by MFS to the fund as described above, MFS is responsible for providing certain retirement plan administration and services with respect to certain shares. These services include various administrative, recordkeeping, and communication/educational services with respect to the retirement plans which invest in these shares, and may be provided directly by MFS or by a third party. MFS may subsequently pay all, or a portion, of the retirement plan administration and services fee to affiliated or unaffiliated third parties. For the six months ended February 29, 2008, the fund paid MFS an annual retirement plan administration and services fee up to the following annual percentage rates of each class’ average daily net assets:
| | | | | | | | |
| | | Beginning
of period
through 12/31/07 | | Effective 1/1/08 | | Annual
Effective
Rate (g) | | Total
Amount |
Class R1 | | 0.35% | | 0.35% | | 0.35% | | $6,603 |
Class R2 | | 0.25% | | — | | 0.16% | | 1,652 |
Class R3 | | 0.15% | | — | | 0.10% | | 6,471 |
Class R4 | | 0.15% | | — | | 0.10% | | 16,608 |
Class R5 | | 0.10% | | — | | 0.07% | | 23 |
| Total Retirement Plan Administration and Services Fees | | $31,357 |
| (g) | Effective January 1, 2008, the annual retirement plan administration and services fee was eliminated for Class R2, Class R3, Class R4, and Class R5 shares. Effective March 1, 2008, the annual retirement plan administration and services fee will be eliminated for Class R1 shares. |
34
Notes to Financial Statements (unaudited) – continued
Trustees’ and Officers’ Compensation – The fund pays compensation to independent trustees in the form of a retainer, attendance fees, and additional compensation to Board and Committee chairpersons. The fund does not pay compensation directly to trustees or officers of the fund who are also officers of the investment adviser, all of whom receive remuneration for their services to the fund from MFS. Certain officers and trustees of the fund are officers or directors of MFS, MFD, and MFSC.
The fund has an unfunded, defined benefit plan for certain retired independent trustees which resulted in a pension expense of $684, which is included in independent trustees’ compensation for the six months ended February 29, 2008. The fund also has an unfunded retirement benefit deferral plan for certain independent trustees which resulted in a net decrease in expense of $23,920 which is included in miscellaneous expense for the six months ended February 29, 2008. The liability for deferred retirement benefits payable to certain independent trustees under both plans amounted to $233,459 at February 29, 2008, and is included in payable for independent trustees’ compensation.
Other – This fund and certain other MFS funds (the funds) have entered into a services agreement (the Agreement) which provides for payment of fees by the funds to Tarantino LLC in return for the provision of services of an Independent Chief Compliance Officer (ICCO) for the funds. The ICCO is an officer of the funds and the sole member of Tarantino LLC. The funds can terminate the Agreement with Tarantino LLC at any time under the terms of the Agreement. For the six months ended February 29, 2008, the fee paid by the fund to Tarantino LLC was $4,894 and is included in miscellaneous expense on the Statement of Operations. MFS has agreed to reimburse the fund for a portion of the payments made by the fund to Tarantino LLC in the amount of $2,723, which is shown as a reduction of total expenses in the Statement of Operations. Additionally, MFS has agreed to bear all expenses associated with office space, other administrative support, and supplies provided to the ICCO.
Purchases and sales of investments, other than U.S. government securities, purchased option transactions, and short-term obligations, aggregated $519,799,480 and $651,726,456, respectively.
35
Notes to Financial Statements (unaudited) – continued
| (5) | | Shares of Beneficial Interest |
The fund’s Declaration of Trust permits the Trustees to issue an unlimited number of full and fractional shares of beneficial interest. Transactions in fund shares were as follows:
| | | | | | | | |
| | | Six months ended
2/29/08 | | Year ended
8/31/07 |
| | | Shares | | Amount | | Shares | | Amount |
| Shares sold | | | | | | | | |
Class A | | 6,695,581 | | $132,072,687 | | 7,381,576 | | $149,818,565 |
Class B | | 330,499 | | 5,971,925 | | 1,701,468 | | 32,486,236 |
Class C | | 223,720 | | 3,992,844 | | 292,928 | | 5,442,264 |
Class I | | 1,022,305 | | 21,623,306 | | 961,921 | | 20,405,548 |
Class R | | 129,735 | | 2,538,335 | | 266,922 | | 5,440,639 |
Class R1 | | 136,031 | | 2,520,451 | | 149,688 | | 2,801,842 |
Class R2 | | 50,971 | | 942,302 | | 46,945 | | 860,796 |
Class R3 | | 442,014 | | 8,651,850 | | 524,954 | | 10,284,549 |
Class R4 | | 203,358 | | 3,956,230 | | 830,328 | | 16,026,749 |
Class R5 | | — | | — | | — | | — |
| | 9,234,214 | | $182,269,930 | | 12,156,730 | | $243,567,188 |
| Shares issued in connection with acquisition of MFS Capital Opportunities Fund | | | | | | | | |
Class A | | | | | | 29,207,075 | | $592,904,669 |
Class B | | | | | | 15,751,262 | | 298,888,929 |
Class C | | | | | | 5,090,987 | | 96,202,011 |
Class I | | | | | | 186,848 | | 3,926,430 |
Class R | | | | | | 1,495 | | 30,134 |
Class R1 | | | | | | — | | — |
Class R2 | | | | | | 1,572 | | 29,984 |
Class R3 | | | | | | — | | — |
Class R4 | | | | | | — | | — |
Class R5 | | | | | | — | | — |
| | | | | | 50,239,239 | | $991,982,157 |
| Shares issued to shareholders in reinvestment of distributions | | | | | | | | |
Class A | | 2,764,142 | | $51,882,942 | | 552,563 | | $10,288,726 |
Class B | | 1,200,579 | | 20,890,083 | | 183,403 | | 3,202,212 |
Class C | | 395,196 | | 6,844,787 | | 61,738 | | 1,073,622 |
Class I | | 89,117 | | 1,739,557 | | 16,270 | | 312,870 |
Class R | | 9,846 | | 183,230 | | 21,583 | | 399,070 |
Class R1 | | 19,030 | | 329,794 | | 1,980 | | 34,465 |
Class R2 | | 9,118 | | 159,753 | | 3,664 | | 64,230 |
Class R3 | | 55,899 | | 1,031,345 | | 5,148 | | 94,569 |
Class R4 | | 127,729 | | 2,393,639 | | 100,759 | | 1,873,116 |
Class R5 | | 255 | | 4,832 | | 228 | | 4,256 |
| | 4,670,911 | | $85,459,962 | | 947,336 | | $17,347,136 |
36
Notes to Financial Statements (unaudited) – continued
| | | | | | | | | | | | |
| | | Six months ended
2/29/08 | | | Year ended
8/31/07 | |
| | | Shares | | | Amount | | | Shares | | | Amount | |
| Shares reacquired | | | | | | | | | | | | |
Class A | | (8,898,527 | ) | | $(172,649,674 | ) | | (6,562,526 | ) | | $(129,813,745 | ) |
Class B | | (4,448,861 | ) | | (79,112,365 | ) | | (2,922,613 | ) | | (54,284,021 | ) |
Class C | | (863,481 | ) | | (15,320,493 | ) | | (563,543 | ) | | (10,346,548 | ) |
Class I | | (1,109,582 | ) | | (23,354,846 | ) | | (78,815 | ) | | (1,615,830 | ) |
Class R | | (328,233 | ) | | (6,550,160 | ) | | (290,050 | ) | | (5,664,197 | ) |
Class R1 | | (44,904 | ) | | (757,116 | ) | | (39,628 | ) | | (717,849 | ) |
Class R2 | | (9,146 | ) | | (160,189 | ) | | (15,425 | ) | | (280,707 | ) |
Class R3 | | (144,502 | ) | | (2,686,136 | ) | | (110,566 | ) | | (2,111,539 | ) |
Class R4 | | (192,386 | ) | | (3,650,829 | ) | | (564,466 | ) | | (10,824,820 | ) |
Class R5 | | — | | | — | | | — | | | — | |
| | (16,039,622 | ) | | $(304,241,808 | ) | | (11,147,632 | ) | | $(215,659,256 | ) |
| Net change | | | | | | | | | | | | |
Class A | | 561,196 | | | $11,305,955 | | | 30,578,688 | | | $623,198,215 | |
Class B | | (2,917,783 | ) | | (52,250,357 | ) | | 14,713,520 | | | 280,293,356 | |
Class C | | (244,565 | ) | | (4,482,862 | ) | | 4,882,110 | | | 92,371,349 | |
Class I | | 1,840 | | | 8,017 | | | 1,086,224 | | | 23,029,018 | |
Class R | | (188,652 | ) | | (3,828,595 | ) | | (50 | ) | | 205,646 | |
Class R1 | | 110,157 | | | 2,093,129 | | | 112,040 | | | 2,118,458 | |
Class R2 | | 50,943 | | | 941,866 | | | 36,756 | | | 674,303 | |
Class R3 | | 353,411 | | | 6,997,059 | | | 419,536 | | | 8,267,579 | |
Class R4 | | 138,701 | | | 2,699,040 | | | 366,621 | | | 7,075,045 | |
Class R5 | | 255 | | | 4,832 | | | 228 | | | 4,256 | |
| | (2,134,497 | ) | | $(36,511,916 | ) | | 52,195,673 | | | $1,037,237,225 | |
The fund and other funds managed by MFS participate in a $1 billion unsecured committed line of credit provided by a syndication of banks under a credit agreement. In addition, the fund and other funds managed by MFS have established uncommitted borrowing arrangements with certain banks. Borrowings may be made for temporary financing needs. Interest is charged to each fund, based on its borrowings, generally at a rate equal to the Federal Reserve funds rate plus 0.30%. In addition, a commitment fee, based on the average daily, unused portion of the committed line of credit, is allocated among the participating funds at the end of each calendar quarter. For the six months ended February 29, 2008, the fund’s commitment fee and interest expense were $1,549 and $0, respectively, and are included in miscellaneous expense on the Statement of Operations.
On October 23, 2007 the Board of Trustees approved, on or about April 18, 2008, the conversion of Class R shares and Class R2 shares into Class R3 shares. After the conversion, Class R3, Class R4, and Class R5 will be renamed Class R2, Class R3, and Class R4, respectively.
37
RESULTS OF SHAREHOLDER MEETING
(unaudited)
At a special meeting of shareholders of MFS Core Equity Fund, which was held on February 15, 2008, the following actions were taken:
Item 1: To approve an amendment to the current Master Distribution Plan adopted pursuant to Rule 12b-1 under the Investment Company Act of 1940, as amended, with respect to Class R1 Shares of the Fund.
| | |
| | | Number of Dollars |
| Affirmative | | 2,471,428.78 |
| Against | | 0.00 |
| Abstain | | 215,715.54 |
| Total | | 2,687,144.32 |
38
BOARD REVIEW OF INVESTMENT ADVISORY AGREEMENT
A discussion regarding the Board’s most recent review and renewal of the Fund’s investment advisory agreement is available by clicking on the fund’s name under “Select a fund” on the MFS Web site (mfs.com).
PROXY VOTING POLICIES AND INFORMATION
A general description of the MFS funds’ proxy voting policies and procedures is available without charge, upon request, by calling 1-800-225-2606, by visiting the Proxy Voting section of mfs.com or by visiting the SEC’s Web site at http://www.sec.gov.
Information regarding how the fund voted proxies relating to portfolio securities during the most recent twelve-month period ended June 30 is available without charge by visiting the Proxy Voting section of mfs.com or by visiting the SEC’s Web site at http://www.sec.gov.
QUARTERLY PORTFOLIO DISCLOSURE
The fund will file a complete schedule of portfolio holdings with the Securities and Exchange Commission (the Commission) for the first and third quarters of each fiscal year on Form N-Q. The fund’s Form N-Q may be reviewed and copied at the:
Public Reference Room
Securities and Exchange Commission
100 F Street, NE, Room 1580
Washington, D.C. 20549
Information on the operation of the Public Reference Room may be obtained by calling the Commission at 1-800-SEC-0330. The fund’s Form N-Q is available on the EDGAR database on the Commission’s Internet Web site at http://www.sec.gov, and copies of this information may be obtained, upon payment of a duplicating fee, by electronic request at the following e-mail address: publicinfo@sec.gov or by writing the Public Reference Section at the above address.
A shareholder can also obtain the quarterly portfolio holdings report at mfs.com.
39


MFS® Cash Reserve Fund
The report is prepared for the general information of shareholders. It is authorized for distribution to prospective investors only when preceded or accompanied by a current prospectus.
NOT FDIC INSURED Ÿ MAY LOSE VALUE Ÿ NO BANK OR CREDIT UNION GUARANTEE Ÿ NOT A DEPOSIT Ÿ NOT INSURED BY ANY FEDERAL GOVERNMENT AGENCY OR NCUA/NCUSIF
2/29/08
LMM-SEM

LETTER FROM THE CEO
Dear Shareholders:
Many of our MFS® fund shareholders have been justifiably concerned, as have most investors around the world, about the state of the global economy. As we enter 2008 we see the market volatility that began in the third quarter of 2007 has intensified.
We here at MFS, and those before us who guided the firm with the same disciplined investment process, have weathered many major economic disruptions over our eight-plus decades of managing clients’ investments. We have managed money through the Great Depression, 14 recessions, as well as numerous market crises caused by wars, political upheavals, and terrorist attacks. MFS remains in business because our investors believe in the integrity of our long-term investment strategy and its proven results.
Worries over market volatility are valid, and investors cannot always expect to see the kind of returns stocks have delivered in the bull markets of past years. Yet we believe our strategy of ADR — allocating across the major asset classes, diversifying within each class, and regularly rebalancing your portfolio to maintain your desired allocation — can help you pursue the highest investment returns while minimizing the effects of market fluctuations.
MFS is a world leader in domestic and global investing. Our team approach is research driven, globally integrated, and balanced. We have 176 investment management professionals located in the Americas, Europe, and Asia who focus on the fundamentals of each security and then integrate our sophisticated quantitative approach.* This collaborative process allows us to find opportunities in any market environment.
I personally would like to thank you for your continued business. We want you to be confident that we are constantly managing our fund offerings with you in mind, while adding new products that can help you to choose what fits your unique financial goals.
Respectfully,

Robert J. Manning
Chief Executive Officer and Chief Investment Officer
MFS Investment Management®
April 15, 2008
* as of 12/31/07
The opinions expressed in this letter are subject to change, may not be relied upon for investment advice, and no forecasts can be guaranteed.
1
PORTFOLIO COMPOSITION
Portfolio structure (u)
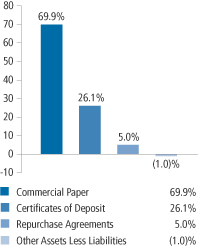
| | |
| Short term credit quality (q) | | |
Average Credit Quality
Short Term Bonds (a) | | A-1 |
| All holdings are rated “A-1” | | |
| | |
| Maturity breakdown (u) | | |
| 0 - 29 days | | 50.6% |
| 30 - 59 days | | 23.6% |
| 60 - 89 days | | 15.3% |
| 90 - 366 days | | 11.5% |
| Other Assets Less Liabilities | | (1.0)% |
| (a) | The average credit quality is based upon a market weighted average of portfolio holdings that are rated by public rating agencies. |
| (q) | Each security is assigned a rating from Moody’s Investors Service. If not rated by Moody’s, the rating will be that assigned by Standard & Poor’s. Likewise, if not assigned a rating by Standard & Poor’s, it will be based on the rating assigned by Fitch, Inc. If not rated by any of the three agencies, the security is considered Not Rated. U.S. Treasuries and U.S. Agency securities are included in the “A-1”-rating category. Percentages are based on the total market value of investments as of 2/29/08. |
| (u) | For purposes of this presentation, accrued interest, where applicable, is included. |
From time to time “Other Assets Less Liabilities” may be negative due to timing of cash receipts.
Percentages are based on net assets as of 2/29/08, unless otherwise noted.
The portfolio is actively managed and current holdings may be different.
2
EXPENSE TABLE
Fund expenses borne by the shareholders during the period, September 1, 2007 through February 29, 2008
As a shareholder of the fund, you incur two types of costs: (1) transaction costs, including sales charges (loads) on certain purchase or redemption payments, and (2) ongoing costs, including management fees; distribution and service (12b-1) fees; and other fund expenses. This example is intended to help you understand your ongoing costs (in dollars) of investing in the fund and to compare these costs with the ongoing costs of investing in other mutual funds.
The example is based on an investment of $1,000 invested at the beginning of the period and held for the entire period September 1, 2007 through February 29, 2008.
Actual expenses
The first line for each share class in the following table provides information about actual account values and actual expenses. You may use the information in this line, together with the amount you invested, to estimate the expenses that you paid over the period. Simply divide your account value by $1,000 (for example, an $8,600 account value divided by $1,000 = 8.6), then multiply the result by the number in the first line under the heading entitled “Expenses Paid During Period” to estimate the expenses you paid on your account during this period.
Hypothetical example for comparison purposes
The second line for each share class in the following table provides information about hypothetical account values and hypothetical expenses based on the fund’s actual expense ratio and an assumed rate of return of 5% per year before expenses, which is not the fund’s actual return. The hypothetical account values and expenses may not be used to estimate the actual ending account balance or expenses you paid for the period. You may use this information to compare the ongoing costs of investing in the fund and other funds. To do so, compare this 5% hypothetical example with the 5% hypothetical examples that appear in the shareholder reports of the other funds.
Please note that the expenses shown in the table are meant to highlight your ongoing costs only and do not reflect any transactional costs, such as sales charges (loads). Therefore, the second line for each share class in the table is useful in comparing ongoing costs only, and will not help you determine the relative total costs of owning different funds. In addition, if these transactional costs were included, your costs would have been higher.
3
Expense Table – continued
| | | | | | | | | | |
Share
Class | | | | Annualized
Expense
Ratio | | Beginning
Account Value
9/01/07 | | Ending Account Value
2/29/08 | | Expenses Paid During
Period (p)
9/01/07-2/29/08 |
| A | | Actual | | 0.45% | | $1,000.00 | | $1,022.06 | | $2.26 |
| | Hypothetical (h) | | 0.45% | | $1,000.00 | | $1,022.63 | | $2.26 |
| B | | Actual | | 1.45% | | $1,000.00 | | $1,017.01 | | $7.27 |
| | Hypothetical (h) | | 1.45% | | $1,000.00 | | $1,017.65 | | $7.27 |
| C | | Actual | | 1.45% | | $1,000.00 | | $1,017.01 | | $7.27 |
| | Hypothetical (h) | | 1.45% | | $1,000.00 | | $1,017.65 | | $7.27 |
| R1 | | Actual | | 1.55% | | $1,000.00 | | $1,016.51 | | $7.77 |
| | Hypothetical (h) | | 1.55% | | $1,000.00 | | $1,017.16 | | $7.77 |
| R2 | | Actual | | 1.10% | | $1,000.00 | | $1,018.68 | | $5.52 |
| | Hypothetical (h) | | 1.10% | | $1,000.00 | | $1,019.39 | | $5.52 |
| R3 | | Actual | | 1.04% | | $1,000.00 | | $1,019.02 | | $5.22 |
| | Hypothetical (h) | | 1.04% | | $1,000.00 | | $1,019.69 | | $5.22 |
| R4 | | Actual | | 0.78% | | $1,000.00 | | $1,020.28 | | $3.92 |
| | Hypothetical (h) | | 0.78% | | $1,000.00 | | $1,020.98 | | $3.92 |
| R5 | | Actual | | 0.51% | | $1,000.00 | | $1,021.72 | | $2.56 |
| | Hypothetical (h) | | 0.51% | | $1,000.00 | | $1,022.33 | | $2.56 |
| 529A | | Actual | | 0.70% | | $1,000.00 | | $1,020.80 | | $3.52 |
| | Hypothetical (h) | | 0.70% | | $1,000.00 | | $1,021.38 | | $3.52 |
| 529B | | Actual | | 1.70% | | $1,000.00 | | $1,015.75 | | $8.52 |
| | Hypothetical (h) | | 1.70% | | $1,000.00 | | $1,016.41 | | $8.52 |
| 529C | | Actual | | 1.70% | | $1,000.00 | | $1,015.75 | | $8.52 |
| | Hypothetical (h) | | 1.70% | | $1,000.00 | | $1,016.41 | | $8.52 |
| (h) | 5% class return per year before expenses. |
| (p) | Expenses paid is equal to each class’ annualized expense ratio, as shown above, multiplied by the average account value over the period, multiplied by the number of days in the period, divided by the number of days in the year. Expenses paid do not include any applicable sales charges (loads). If these transaction costs had been included, your costs would have been higher. |
Effective January 1, 2008 the fund’s Class R2, Class R3, Class R4, and Class R5 retirement plan administration and service fee was terminated (as described in Note 3 of the Notes to the Financial Statements). Had this fee change been in effect throughout the entire six month period, the annualized expense ratios would have been 0.93%, 0.94%, 0.68% and 0.44% for Class R2, Class R3, Class R4, and Class R5 shares, respectively. The actual expenses paid during the period would have been approximately $4.68, $4.73, $3.43, and $2.22 and the hypothetical expenses paid during the period would have been approximately $4.68, $4.73, $3.43, and $2.22 for Class R2, Class R3, Class R4, and Class R5, respectively.
Effective March 1, 2008 the fund’s Class R1 retirement plan administration and service fee was terminated and the Class R1 distribution fee was increased (as described in Note 3 of the Notes to the Financial Statements). Had
4
Expense Table – continued
these fee changes been in effect throughout the entire six month period, the annualized expense ratio would have been 1.45%. The actual expenses paid during the period would have been approximately $7.29 and the hypothetical expenses paid during the period would have been approximately $7.29.
Effective April 1, 2008 the fund’s Class 529A, 529B, and 529C shares program manager fee was reduced (as described in Note 3 of the Notes to the Financial Statements). Had this fee change been in effect throughout the entire six month period, the annualized expense ratio would have been 0.55%, 1.55%, and 1.55% for Class 529A, 529B, and 529C shares, respectively. The actual expenses paid during the period would have been approximately $2.77, $7.80, and $7.80 and the hypothetical expenses paid during the period would have been approximately $2.77, $7.80, and $7.80 for Class 529A, 529B, and 529C shares, respectively.
5
PORTFOLIO OF INVESTMENTS
2/29/08 (unaudited)
The Portfolio of Investments is a complete list of all securities owned by your fund. It is categorized by broad-based asset classes.
| | | | | | |
| Certificates of Deposit - 26.0% | | | | | | |
| Issuer | | Shares/Par | | Value ($) |
| | | | | | |
| Major Banks - 16.3% | | | | | | |
| Barclays Bank PLC, 3.15%, due 4/29/08 | | $ | 22,133,000 | | $ | 22,133,000 |
| BNP Paribas, NY, 3.03%, due 5/20/08 | | | 910,000 | | | 910,000 |
| BNP Paribas, NY, 3.65%, due 7/16/08 | | | 20,185,000 | | | 20,185,000 |
| Royal Bank of Canada, 3.06%, due 3/14/08 | | | 21,270,000 | | | 21,270,000 |
| Societe Generale, NY, 3.16%, due 4/11/08 | | | 21,342,000 | | | 21,342,000 |
| | | | | | |
| | | | | | $ | 85,840,000 |
| Other Banks & Diversified Financials - 9.7% | | | | | | |
| DEPFA Bank PLC, 3.975%, due 4/14/08 | | $ | 10,110,000 | | $ | 10,110,000 |
| Dexia Credit Local, NY, 4.19%, due 3/10/08 | | | 19,992,000 | | | 19,993,382 |
| Fortis Bank, NY, 3.12%, due 3/14/08 | | | 21,270,000 | | | 21,270,000 |
| | | | | | |
| | | | | | $ | 51,373,382 |
| Total Certificates of Deposit, at Amortized Cost and Value | | | | | $ | 137,213,382 |
| | |
| Commercial Paper - 69.9% (y) | | | | | | |
| Automotive - 4.1% | | | | | | |
| Toyota Motor Credit Corp., 2.95%, due 3/20/08 | | $ | 3,244,000 | | $ | 3,238,949 |
| Toyota Motor Credit Corp., 4.68%, due 3/28/08 | | | 18,350,000 | | | 18,285,592 |
| | | | | | |
| | | | | | $ | 21,524,541 |
| Brokerage & Asset Managers - 11.5% | | | | | | |
| Goldman Sachs Group, Inc., 2.9%, due 5/20/08 | | $ | 18,269,000 | | $ | 18,151,266 |
| Merrill Lynch & Co., Inc., 5%, due 3/20/08 | | | 8,095,000 | | | 8,073,638 |
| Merrill Lynch & Co., Inc., 4.63%, due 4/15/08 | | | 8,889,000 | | | 8,837,555 |
| Merrill Lynch & Co., Inc., 3.12%, due 5/02/08 | | | 4,300,000 | | | 4,276,895 |
| Morgan Stanley, 4.8%, due 6/13/08 | | | 18,490,000 | | | 18,233,605 |
| Morgan Stanley, 3.22%, due 6/27/08 | | | 3,032,000 | | | 2,999,999 |
| | | | | | |
| | | | | | $ | 60,572,958 |
| Consumer Goods & Services - 4.1% | | | | | | |
| Procter & Gamble Co., 2.85%, due 3/20/08 (t) | | $ | 21,719,000 | | $ | 21,686,331 |
| | |
| Electrical Equipment - 2.8% | | | | | | |
| General Electric Co., 3.02%, due 3/28/08 | | $ | 12,733,000 | | $ | 12,704,160 |
| General Electric Co., 3.8%, due 3/28/08 | | | 2,093,000 | | | 2,087,035 |
| | | | | | |
| | | | | | $ | 14,791,195 |
6
Portfolio of Investments (unaudited) – continued
| | | | | | |
| Issuer | | Shares/Par | | Value ($) |
| | | | | | |
| Commercial Paper (y) - continued | | | | | | |
| Financial Institutions - 9.8% | | | | | | |
| American Express Credit Corp., 4.42%, due 3/20/08 | | $ | 8,683,000 | | $ | 8,662,744 |
| American Express Credit Corp., 3.05%, due 3/28/08 | | | 12,806,000 | | | 12,776,706 |
| American General Finance Corp., 3.06%, due 3/19/08 | | | 21,467,000 | | | 21,434,155 |
| Cargill, Inc., 4.15%, due 3/05/08 (t) | | | 2,204,000 | | | 2,202,984 |
| General Electric Capital Corp., 4.65%, due 3/27/08 | | | 6,700,000 | | | 6,677,499 |
| | | | | | |
| | | | | | $ | 51,754,088 |
| Food & Beverages - 7.7% | | | | | | |
| Archer Daniels Midland Co., 3.8%, due 4/08/08 (t) | | $ | 2,095,000 | | $ | 2,086,597 |
| Archer Daniels Midland Co., 4.28%, due 4/08/08 (t) | | | 7,376,000 | | | 7,342,677 |
| Archer Daniels Midland Co., 3.02%, due 6/26/08 (t) | | | 11,960,000 | | | 11,842,613 |
| Hershey Foods Corp., 2.85%, due 3/28/08 (t) | | | 19,353,000 | | | 19,311,633 |
| | | | | | |
| | | | | | $ | 40,583,520 |
| Major Banks - 19.4% | | | | | | |
| Abbey National North America LLC, 4.74%, due 4/11/08 | | $ | 12,330,000 | | $ | 12,263,439 |
| Bank of America Corp., 4.37%, due 5/07/08 | | | 18,000,000 | | | 17,853,605 |
| Bank of America Corp., 2.89%, due 5/30/08 | | | 3,998,000 | | | 3,969,114 |
| Bank of Scotland PLC, 3.74%, due 5/16/08 | | | 3,676,000 | | | 3,646,976 |
| JPMorgan Chase & Co., 2.95%, due 4/01/08 | | | 594,000 | | | 592,491 |
| JPMorgan Chase & Co., 3.2%, due 4/22/08 | | | 20,737,000 | | | 20,641,149 |
Natexis Banques Populaires U.S. Financial Co. LLC, 3.07%,
due 5/01/08 | | | 5,850,000 | | | 5,819,569 |
Natexis Banques Populaires U.S. Financial Co. LLC, 3.05%,
due 5/07/08 | | | 15,750,000 | | | 15,660,597 |
| Wells Fargo & Co., 2.97%, due 3/18/08 | | | 19,785,000 | | | 19,757,252 |
| Wells Fargo & Co., 3.17%, due 3/18/08 | | | 1,835,700 | | | 1,832,952 |
| | | | | | |
| | | | | | $ | 102,037,144 |
| Medical Equipment - 0.4% | | | | | | |
| Pfizer, Inc., 4.43%, due 4/29/08 (t) | | $ | 2,200,000 | | $ | 2,184,027 |
| | |
| Other Banks & Diversified Financials - 10.1% | | | | | | |
| Citigroup Funding, Inc., 4.9%, due 3/26/08 | | $ | 15,684,000 | | $ | 15,630,631 |
| Citigroup Funding, Inc., 3.1%, due 4/25/08 | | | 5,682,000 | | | 5,655,089 |
| DEPFA Bank PLC, 3.18%, due 4/25/08 (t) | | | 11,300,000 | | | 11,245,101 |
| Dexia Delaware LLC, 3.01%, due 3/19/08 | | | 1,091,000 | | | 1,089,358 |
| ING America Insurance Holdings, Inc., 4.55%, due 3/10/08 | | | 2,069,000 | | | 2,066,647 |
| UBS Finance Delaware LLC, 3.01%, due 4/30/08 | | | 13,026,000 | | | 12,960,653 |
| UBS Finance Delaware LLC, 3.02%, due 5/27/08 | | | 1,500,000 | | | 1,489,053 |
| UBS Finance Delaware LLC, 3.155%, due 7/22/08 | | | 3,279,000 | | | 3,237,905 |
| | | | | | |
| | | | | | $ | 53,374,437 |
| Total Commercial Paper, at Amortized Cost and Value | | | | | $ | 368,508,241 |
7
Portfolio of Investments (unaudited) – continued
| | | | | | |
| Issuer | | Shares/Par | | Value ($) |
| | | | | | |
| Repurchase Agreements - 5.0% | | | | | | |
| Merrill Lynch & Co., 3.2%, dated 2/29/08, due 3/03/08, total to be received $26,154,973 (secured by various U.S. Treasury and Federal Agency obligations and Mortgage Backed securities in a jointly traded account), at Cost | | $ | 26,148,000 | | $ | 26,148,000 |
| Total Investments, at Amortized Cost and Value | | | | | $ | 531,869,623 |
| | |
| Other Assets, Less Liabilities - (0.9)% | | | | | | (4,970,981) |
| Net Assets - 100.0% | | | | | $ | 526,898,642 |
| (t) | Security exempt from registration with the U.S. Securities and Exchange Commission under Section 4(2) of the Securities Act of 1933. |
| (y) | The rate shown represents an annualized yield at time of purchase. |
See Notes to Financial Statements
8
Financial Statements
STATEMENT OF ASSETS AND LIABILITIES
At 2/29/08 (unaudited)
This statement represents your fund’s balance sheet, which details the assets and liabilities comprising the total value of the fund.
| | | | | |
| Assets | | | | | |
| Investments, at amortized cost and value | | $531,869,623 | | | |
| Cash | | 25 | | | |
| Receivable for fund shares sold | | 3,752,404 | | | |
| Interest receivable | | 424,086 | | | |
| Other assets | | 5,712 | | | |
| Total assets | | | | | $536,051,850 |
| Liabilities | | | | | |
| Distributions payable | | $31,969 | | | |
| Payable for fund shares reacquired | | 8,890,539 | | | |
| Payable to affiliates | | | | | |
Management fee | | 4,347 | | | |
Shareholder servicing costs | | 124,957 | | | |
Distribution and service fees | | 14,327 | | | |
Administrative services fee | | 414 | | | |
Program manager fees | | 71 | | | |
Retirement plan administration and services fees | | 409 | | | |
| Payable for independent trustees’ compensation | | 28,298 | | | |
| Accrued expenses and other liabilities | | 57,877 | | | |
| Total liabilities | | | | | $9,153,208 |
| Net assets | | | | | $526,898,642 |
| Net assets consist of: | | | | | |
| Paid-in capital | | $526,922,887 | | | |
| Accumulated net realized gain (loss) on investments | | (24,245 | ) | | |
| Net assets | | | | | $526,898,642 |
| Shares of beneficial interest outstanding | | | | | 526,922,902 |
9
Statement of Assets and Liabilities (unaudited) – continued
| | | | |
| Class A shares | | | | |
Net assets | | $156,048,229 | | |
Shares outstanding | | 156,055,510 | | |
Net asset value, offering price and redemption price per share | | | | $1.00 |
| Class B shares | | | | |
Net assets | | $115,762,311 | | |
Shares outstanding | | 115,771,545 | | |
Net asset value and offering price per share | | | | $1.00 |
| Class C shares | | | | |
Net assets | | $69,009,131 | | |
Shares outstanding | | 69,012,333 | | |
Net asset value and offering price per share | | | | $1.00 |
| Class R1 shares | | | | |
Net assets | | $21,367,266 | | |
Shares outstanding | | 21,367,775 | | |
Net asset value, offering price, and redemption price per share | | | | $1.00 |
| Class R2 shares | | | | |
Net assets | | $13,548,448 | | |
Shares outstanding | | 13,548,881 | | |
Net asset value, offering price, and redemption price per share | | | | $1.00 |
| Class R3 shares | | | | |
Net assets | | $71,957,390 | | |
Shares outstanding | | 71,959,000 | | |
Net asset value, offering price, and redemption price per share | | | | $1.00 |
| Class R4 shares | | | | |
Net assets | | $69,732,861 | | |
Shares outstanding | | 69,734,470 | | |
Net asset value, offering price, and redemption price per share | | | | $1.00 |
| Class R5 shares | | | | |
Net assets | | $4,278,696 | | |
Shares outstanding | | 4,278,878 | | |
Net asset value, offering price, and redemption price per share | | | | $1.00 |
| Class 529A shares | | | | |
Net assets | | $3,238,834 | | |
Shares outstanding | | 3,238,974 | | |
Net asset value, offering price and redemption price per share | | | | $1.00 |
10
Statement of Assets and Liabilities (unaudited) – continued
| | | | |
| Class 529B shares | | | | |
Net assets | | $466,456 | | |
Shares outstanding | | 466,475 | | |
Net asset value and offering price per share | | | | $1.00 |
| Class 529C shares | | | | |
Net assets | | $1,489,020 | | |
Shares outstanding | | 1,489,061 | | |
Net asset value and offering price per share | | | | $1.00 |
A contingent deferred sales charge may be imposed on redemptions of Class A, Class B, Class C, Class 529B, and Class 529C shares.
See Notes to Financial Statements
11
Financial Statements
STATEMENT OF OPERATIONS
Six months ended 2/29/08 (unaudited)
This statement describes how much your fund earned in investment income and accrued in expenses. It also describes any gains and/or losses generated by fund operations.
| | | | | |
| Net investment income | | | | | |
| Interest income | | | | | $11,149,778 |
| Expenses | | | | | |
Management fee | | $1,277,224 | | | |
Distribution and service fees | | 1,199,554 | | | |
Program manager fees | | 5,298 | | | |
Shareholder servicing costs | | 464,029 | | | |
Administrative services fee | | 37,387 | | | |
Retirement plan administration and services fees | | 87,317 | | | |
Independent trustees’ compensation | | 7,141 | | | |
Custodian fee | | 47,510 | | | |
Shareholder communications | | 31,994 | | | |
Auditing fees | | 11,985 | | | |
Legal fees | | 3,312 | | | |
Miscellaneous | | 88,851 | | | |
| Total expenses | | | | | $3,261,602 |
Fees paid indirectly | | (16 | ) | | |
Reduction of expenses by investment adviser and distributor | | (935,040 | ) | | |
| Net expenses | | | | | $2,326,546 |
| Net investment income | | | | | $8,823,232 |
| Change in net assets from operations | | | | | $8,823,232 |
See Notes to Financial Statements
12
Financial Statements
STATEMENTS OF CHANGES IN NET ASSETS
These statements describe the increases and/or decreases in net assets resulting from operations, any distributions, and any shareholder transactions.
| | | | | | |
| | | Six months ended
2/29/08
| | | Year ended
8/31/07
| |
| Change in net assets | | (unaudited) | | | | |
| From operations | | | | | | |
| Net investment income | | $8,823,232 | | | $16,106,250 | |
| Net realized gain (loss) on investments | | — | | | (22,989 | ) |
| Change in net assets from operations | | $8,823,232 | | | $16,083,261 | |
| Distributions declared to shareholders | | | | | | |
| From net investment income | | | | | | |
Class A | | $(3,059,754 | ) | | $(5,611,214 | ) |
Class B | | (2,098,589 | ) | | (7,009,719 | ) |
Class C | | (895,143 | ) | | (1,743,169 | ) |
Class R1 | | (277,284 | ) | | (175,656 | ) |
Class R2 | | (224,017 | ) | | (147,919 | ) |
Class R3 | | (1,098,666 | ) | | (711,011 | ) |
Class R4 | | (1,015,441 | ) | | (575,671 | ) |
Class R5 | | (74,487 | ) | | (33,784 | ) |
Class 529A | | (60,258 | ) | | (109,027 | ) |
Class 529B | | (5,488 | ) | | (11,220 | ) |
Class 529C | | (14,105 | ) | | (25,406 | ) |
| Total distributions declared to shareholders | | $(8,823,232 | ) | | $(16,153,796 | ) |
| Change in net assets from fund share transactions | | $82,015,292 | | | $40,254,200 | |
| Total change in net assets | | $82,015,292 | | | $40,183,665 | |
| Net assets | | | | | | |
| At beginning of period | | 444,883,350 | | | 404,699,685 | |
| At end of period | | $526,898,642 | | | $444,883,350 | |
See Notes to Financial Statements
13
Financial Statements
FINANCIAL HIGHLIGHTS
The financial highlights table is intended to help you understand the fund’s financial performance for the semiannual period and the past 5 fiscal years (or life of a particular share class, if shorter). Certain information reflects financial results for a single fund share. The total returns in the table represent the rate by which an investor would have earned (or lost) on an investment in the fund share class (assuming reinvestment of all distributions) held for the entire period.
| | | | | | | | | | | | | | | | | | |
| | | Six months
ended
2/29/08 (unaudited) | | | Years ended 8/31 | |
| Class A | | | 2007 | | | 2006 | | | 2005 | | | 2004 | | | 2003 | |
| | | | | | | | | | | | | | | | | |
Net asset value,
beginning of period | | $1.00 | | | $1.00 | | | $1.00 | | | $1.00 | | | $1.00 | | | $1.00 | |
Income (loss) from
investment operations | | | | | | | | | | | | | | | | | | |
Net investment income (d) | | $0.02 | | | $0.05 | | | $0.04 | | | $0.02 | | | $0.01 | | | $0.01 | |
Net realized and unrealized
gain (loss) on investments | | — | | | (0.00 | )(w) | | (0.00 | )(w) | | — | | | — | | | — | |
| Total from investment operations | | $0.02 | | | $0.05 | | | $0.04 | | | $0.02 | | | $0.01 | | | $0.01 | |
Less distributions declared
to shareholders | | | | | | | | | | | | | | | | | | |
From net investment income | | $(0.02 | ) | | $(0.05 | ) | | $(0.04 | ) | | $(0.02 | ) | | $(0.01 | ) | | $(0.01 | ) |
| Net asset value, end of period | | $1.00 | | | $1.00 | | | $1.00 | | | $1.00 | | | $1.00 | | | $1.00 | |
| Total return (%) (r)(t) | | 2.21 | (n) | | 5.06 | | | 4.19 | | | 2.11 | | | 0.58 | | | 0.69 | |
Ratios (%) (to average net assets)
and Supplemental data: | | | | | | | | | | | | | | | | | | |
Expenses before expense
reductions (f) | | 0.85 | (a) | | 0.83 | | | 0.89 | | | 0.90 | | | 0.79 | | | 0.81 | |
Expenses after expense
reductions (f) | | 0.45 | (a) | | 0.43 | | | 0.49 | | | 0.50 | | | 0.55 | | | 0.71 | |
| Net investment income | | 4.36 | (a) | | 4.94 | | | 4.14 | | | 2.10 | | | 0.58 | | | 0.70 | |
Net assets at end of period
(000 Omitted) | | $156,048 | | | $136,204 | | | $114,481 | | | $91,165 | | | $101,287 | | | $214,275 | |
See Notes to Financial Statements
14
Financial Highlights – continued
| | | | | | | | | | | | | | | | | | |
| | | Six months
ended
2/29/08 (unaudited) | | | Years ended 8/31 | |
| Class B | | | 2007 | | | 2006 | | | 2005 | | | 2004 | | | 2003 | |
| | | | | | | | | | | | | | | | | |
Net asset value,
beginning of period | | $1.00 | | | $1.00 | | | $1.00 | | | $1.00 | | | $1.00 | | | $1.00 | |
Income (loss) from
investment operations | | | | | | | | | | | | | | | | | | |
Net investment income (d) | | $0.02 | | | $0.04 | | | $0.03 | | | $0.01 | | | $0.00 | (w) | | $0.00 | (w) |
Net realized and unrealized
gain (loss) on investments | | — | | | (0.00 | )(w) | | (0.00 | )(w) | | — | | | — | | | — | |
| Total from investment operations | | $0.02 | | | $0.04 | | | $0.03 | | | $0.01 | | | $0.00 | (w) | | $0.00 | (w) |
Less distributions declared
to shareholders | | | | | | | | | | | | | | | | | | |
From net investment income | | $(0.02 | ) | | $(0.04 | ) | | $(0.03 | ) | | $(0.01 | ) | | $(0.00 | )(w) | | $(0.00 | )(w) |
| Net asset value, end of period | | $1.00 | | | $1.00 | | | $1.00 | | | $1.00 | | | $1.00 | | | $1.00 | |
| Total return (%) (r)(t) | | 1.70 | (n) | | 4.02 | | | 3.16 | | | 1.10 | | | 0.06 | | | 0.06 | |
Ratios (%) (to average net assets)
and Supplemental data: | | | | | | | | | | | | | | | | | | |
Expenses before expense
reductions (f) | | 1.85 | (a) | | 1.83 | | | 1.89 | | | 1.89 | | | 1.80 | | | 1.81 | |
Expenses after expense
reductions (f) | | 1.45 | (a) | | 1.43 | | | 1.49 | | | 1.49 | | | 1.07 | | | 1.35 | |
| Net investment income | | 3.44 | (a) | | 3.94 | | | 3.09 | | | 1.03 | | | 0.06 | | | 0.06 | |
Net assets at end of period
(000 Omitted) | | $115,762 | | | $154,176 | | | $222,661 | | | $280,361 | | | $429,844 | | | $647,269 | |
See Notes to Financial Statements
15
Financial Highlights – continued
| | | | | | | | | | | | | | | | | | |
| | | Six months
ended
2/29/08 (unaudited) | | | Years ended 8/31 | |
| Class C | | | 2007 | | | 2006 | | | 2005 | | | 2004 | | | 2003 | |
| | | | | | | | | | | | | | | | | |
Net asset value,
beginning of period | | $1.00 | | | $1.00 | | | $1.00 | | | $1.00 | | | $1.00 | | | $1.00 | |
Income (loss) from
investment operations | | | | | | | | | | | | | | | | | | |
Net investment income (d) | | $0.02 | | | $0.04 | | | $0.03 | | | $0.01 | | | $0.00 | (w) | | $0.00 | (w) |
Net realized and unrealized
gain (loss) on investments | | — | | | (0.00 | )(w) | | (0.00 | )(w) | | — | | | — | | | — | |
| Total from investment operations | | $0.02 | | | $0.04 | | | $0.03 | | | $0.01 | | | $0.00 | (w) | | $0.00 | (w) |
Less distributions declared
to shareholders | | | | | | | | | | | | | | | | | | |
From net investment income | | $(0.02 | ) | | $(0.04 | ) | | $(0.03 | ) | | $(0.01 | ) | | $(0.00 | )(w) | | $(0.00 | )(w) |
| Net asset value, end of period | | $1.00 | | | $1.00 | | | $1.00 | | | $1.00 | | | $1.00 | | | $1.00 | |
| Total return (%) (r)(t) | | 1.70 | (n) | | 4.02 | | | 3.15 | | | 1.10 | | | 0.06 | | | 0.06 | |
Ratios (%) (to average net assets)
and Supplemental data: | | | | | | | | | | | | | | | | | | |
Expenses before expense
reductions (f) | | 1.85 | (a) | | 1.83 | | | 1.89 | | | 1.89 | | | 1.79 | | | 1.81 | |
Expenses after expense
reductions (f) | | 1.45 | (a) | | 1.43 | | | 1.49 | | | 1.49 | | | 1.07 | | | 1.36 | |
| Net investment income | | 3.34 | (a) | | 3.94 | | | 3.14 | | | 1.03 | | | 0.06 | | | 0.06 | |
Net assets at end of period
(000 Omitted) | | $69,009 | | | $60,390 | | | $56,456 | | | $46,483 | | | $80,482 | | | $159,715 | |
See Notes to Financial Statements
16
Financial Highlights – continued
| | | | | | | | | | | | |
| | | Six months
ended
2/29/08 (unaudited) | | | Years ended 8/31 | |
| Class R1 | | | 2007 | | | 2006 | | | 2005 (i) | |
| | | | | | | | | | | |
Net asset value,
beginning of period | | $1.00 | | | $1.00 | | | $1.00 | | | $1.00 | |
Income (loss) from
investment operations | | | | | | | | | | | | |
Net investment income (d) | | $0.02 | | | $0.04 | | | $0.03 | | | $0.01 | |
Net realized and unrealized
gain (loss) on investments | | — | | | (0.00 | )(w) | | (0.00 | )(w) | | — | |
| Total from investment operations | | $0.02 | | | $0.04 | | | $0.03 | | | $0.01 | |
Less distributions declared
to shareholders | | | | | | | | | | | | |
From net investment income | | $(0.02 | ) | | $(0.04 | ) | | $(0.03 | ) | | $(0.01 | ) |
| Net asset value, end of period | | $1.00 | | | $1.00 | | | $1.00 | | | $1.00 | |
| Total return (%) (r) | | 1.65 | (n) | | 3.91 | | | 3.04 | | | 0.59 | (n) |
Ratios (%) (to average net assets)
and Supplemental data: | | | | | | | | | | | | |
Expenses before expense
reductions (f) | | 1.95 | (a) | | 1.97 | | | 2.09 | | | 2.24 | (a) |
Expenses after expense
reductions (f) | | 1.55 | (a) | | 1.53 | | | 1.59 | | | 1.84 | (a) |
| Net investment income | | 3.19 | (a) | | 3.82 | | | 3.15 | | | 1.52 | (a) |
Net assets at end of period
(000 Omitted) | | $21,367 | | | $8,538 | | | $898 | | | $258 | |
See Notes to Financial Statements
17
Financial Highlights – continued
| | | | | | | | | | | | |
| | | Six months
ended
2/29/08 (unaudited) | | | Years ended 8/31 | |
| Class R2 | | | 2007 | | | 2006 | | | 2005 (i) | |
| | | | | | | | | | | |
Net asset value,
beginning of period | | $1.00 | | | $1.00 | | | $1.00 | | | $1.00 | |
Income (loss) from
investment operations | | | | | | | | | | | | |
Net investment income (d) | | $0.02 | | | $0.04 | | | $0.03 | | | $0.01 | |
Net realized and unrealized
gain (loss) on investments | | — | | | (0.00 | )(w) | | (0.00 | )(w) | | — | |
| Total from investment operations | | $0.02 | | | $0.04 | | | $0.03 | | | $0.01 | |
Less distributions declared
to shareholders | | | | | | | | | | | | |
From net investment income | | $(0.02 | ) | | $(0.04 | ) | | $(0.03 | ) | | $(0.01 | ) |
| Net asset value, end of period | | $1.00 | | | $1.00 | | | $1.00 | | | $1.00 | |
| Total return (%) (r) | | 1.87 | (n) | | 4.28 | | | 3.40 | | | 0.72 | (n) |
Ratios (%) (to average net assets)
and Supplemental data: | | | | | | | | | | | | |
Expenses before expense
reductions (f) | | 1.50 | (a) | | 1.64 | | | 1.79 | | | 1.93 | (a) |
Expenses after expense
reductions (f) | | 1.10 | (a) | | 1.18 | | | 1.25 | | | 1.53 | (a) |
| Net investment income | | 3.66 | (a) | | 4.17 | | | 3.40 | | | 1.97 | (a) |
Net assets at end of period
(000 Omitted) | | $13,548 | | | $9,596 | | | $1,101 | | | $604 | |
See Notes to Financial Statements
18
Financial Highlights – continued
| | | | | | | | | | | | |
| | | Six months
ended
2/29/08 (unaudited) | | | Years ended 8/31 | |
| Class R3 | | | 2007 | | | 2006 | | | 2005 (i) | |
| | | | | | | | | | | |
Net asset value,
beginning of period | | $1.00 | | | $1.00 | | | $1.00 | | | $1.00 | |
Income (loss) from
investment operations | | | | | | | | | | | | |
Net investment income (d) | | $0.02 | | | $0.04 | | | $0.04 | | | $0.01 | |
Net realized and unrealized
gain (loss) on investments | | — | | | (0.00 | )(w) | | (0.01 | ) | | — | |
| Total from investment operations | | $0.02 | | | $0.04 | | | $0.03 | | | $0.01 | |
Less distributions declared
to shareholders | | | | | | | | | | | | |
From net investment income | | $(0.02 | ) | | $(0.04 | ) | | $(0.03 | ) | | $(0.01 | ) |
| Net asset value, end of period | | $1.00 | | | $1.00 | | | $1.00 | | | $1.00 | |
| Total return (%) (r) | | 1.90 | (n) | | 4.38 | | | 3.51 | | | 0.78 | (n) |
Ratios (%) (to average net assets)
and Supplemental data: | | | | | | | | | | | | |
Expenses before expense
reductions (f) | | 1.44 | (a) | | 1.52 | | | 1.63 | | | 1.83 | (a) |
Expenses after expense
reductions (f) | | 1.04 | (a) | | 1.09 | | | 1.13 | | | 1.43 | (a) |
| Net investment income | | 3.72 | (a) | | 4.28 | | | 3.73 | | | 2.10 | (a) |
Net assets at end of period
(000 Omitted) | | $71,957 | | | $36,027 | | | $4,909 | | | $1,179 | |
See Notes to Financial Statements
19
Financial Highlights – continued
| | | | | | | | | | | | |
| | | Six months
ended
2/29/08 (unaudited) | | | Years ended 8/31 | |
| Class R4 | | | 2007 | | | 2006 | | | 2005 (i) | |
| | | | | | | | | | | |
Net asset value,
beginning of period | | $1.00 | | | $1.00 | | | $1.00 | | | $1.00 | |
Income (loss) from
investment operations | | | | | | | | | | | | |
Net investment income (d) | | $0.02 | | | $0.05 | | | $0.04 | | | $0.01 | |
Net realized and unrealized
gain (loss) on investments | | — | | | (0.00 | )(w) | | (0.00 | )(w) | | — | |
| Total from investment operations | | $0.02 | | | $0.05 | | | $0.04 | | | $0.01 | |
Less distributions declared
to shareholders | | | | | | | | | | | | |
From net investment income | | $(0.02 | ) | | $(0.05 | ) | | $(0.04 | ) | | $(0.01 | ) |
| Net asset value, end of period | | $1.00 | | | $1.00 | | | $1.00 | | | $1.00 | |
| Total return (%) (r) | | 2.03 | (n) | | 4.63 | | | 3.77 | | | 0.93 | (n) |
Ratios (%) (to average net assets)
and Supplemental data: | | | | | | | | | | | | |
Expenses before expense
reductions (f) | | 1.18 | (a) | | 1.23 | | | 1.28 | | | 1.38 | (a) |
Expenses after expense
reductions (f) | | 0.78 | (a) | | 0.83 | | | 0.88 | | | 0.98 | (a) |
| Net investment income | | 3.91 | (a) | | 4.53 | | | 4.06 | | | 2.21 | (a) |
Net assets at end of period
(000 Omitted) | | $69,733 | | | $32,545 | | | $1,019 | | | $51 | |
See Notes to Financial Statements
20
Financial Highlights – continued
| | | | | | | | | | | | |
| | | Six months
ended
2/29/08 (unaudited) | | | Years ended 8/31 | |
| Class R5 | | | 2007 | | | 2006 | | | 2005 (i) | |
| | | | | | | | | | | |
Net asset value,
beginning of period | | $1.00 | | | $1.00 | | | $1.00 | | | $1.00 | |
Income (loss) from
investment operations | | | | | | | | | | | | |
Net investment income (d) | | $0.02 | | | $0.05 | | | $0.04 | | | $0.01 | |
Net realized and unrealized
gain (loss) on investments | | — | | | (0.00 | )(w) | | (0.00 | )(w) | | — | |
| Total from investment operations | | $0.02 | | | $0.05 | | | $0.04 | | | $0.01 | |
Less distributions declared
to shareholders | | | | | | | | | | | | |
From net investment income | | $(0.02 | ) | | $(0.05 | ) | | $(0.04 | ) | | $(0.01 | ) |
| Net asset value, end of period | | $1.00 | | | $1.00 | | | $1.00 | | | $1.00 | |
| Total return (%) (r) | | 2.17 | (n) | | 4.96 | | | 4.09 | | | 1.06 | (n) |
Ratios (%) (to average net assets)
and Supplemental data: | | | | | | | | | | | | |
Expenses before expense
reductions (f) | | 0.91 | (a) | | 0.93 | | | 0.99 | | | 1.08 | (a) |
Expenses after expense
reductions (f) | | 0.51 | (a) | | 0.53 | | | 0.59 | | | 0.68 | (a) |
| Net investment income | | 4.28 | (a) | | 4.80 | | | 4.03 | | | 2.51 | (a) |
Net assets at end of period
(000 Omitted) | | $4,279 | | | $3,717 | | | $53 | | | $51 | |
See Notes to Financial Statements
21
Financial Highlights – continued
| | | | | | | | | | | | | | | | | | |
| | | Six months
ended
2/29/08 (unaudited) | | | Years ended 8/31 | |
| Class 529A | | | 2007 | | | 2006 | | | 2005 | | | 2004 | | | 2003 | |
| | | | | | | | | | | | | | | | | |
Net asset value,
beginning of period | | $1.00 | | | $1.00 | | | $1.00 | | | $1.00 | | | $1.00 | | | $1.00 | |
Income (loss) from
investment operations | | | | | | | | | | | | | | | | | | |
Net investment income (d) | | $0.02 | | | $0.05 | | | $0.04 | | | $0.02 | | | $0.00 | (w) | | $0.00 | (w) |
Net realized and unrealized
gain (loss) on investments | | — | | | (0.00 | )(w) | | (0.00 | )(w) | | — | | | — | | | — | |
| Total from investment operations | | $0.02 | | | $0.05 | | | $0.04 | | | $0.02 | | | $0.00 | (w) | | $0.00 | (w) |
Less distributions declared
to shareholders | | | | | | | | | | | | | | | | | | |
From net investment income | | $(0.02 | ) | | $(0.05 | ) | | $(0.04 | ) | | $(0.02 | ) | | $(0.00 | )(w) | | $(0.00 | )(w) |
| Net asset value, end of period | | $1.00 | | | $1.00 | | | $1.00 | | | $1.00 | | | $1.00 | | | $1.00 | |
| Total return (%) (r) | | 2.08 | (n) | | 4.80 | | | 3.93 | | | 1.86 | | | 0.33 | | | 0.45 | |
Ratios (%) (to average net assets)
and Supplemental data: | | | | | | | | | | | | | | | | | | |
Expenses before expense
reductions (f) | | 1.45 | (a) | | 1.44 | | | 1.49 | | | 1.50 | | | 1.39 | | | 1.41 | |
Expenses after expense
reductions (f) | | 0.70 | (a) | | 0.68 | | | 0.74 | | | 0.75 | | | 0.80 | | | 0.96 | |
| Net investment income | | 4.10 | (a) | | 4.69 | | | 3.92 | | | 1.93 | | | 0.34 | | | 0.33 | |
Net assets at end of period
(000 Omitted) | | $3,239 | | | $2,548 | | | $2,135 | | | $1,650 | | | $1,140 | | | $1,164 | |
See Notes to Financial Statements
22
Financial Highlights – continued
| | | | | | | | | | | | | | | | | | |
| | | Six months
ended
2/29/08 (unaudited) | | | Years ended 8/31 | |
| Class 529B | | | 2007 | | | 2006 | | | 2005 | | | 2004 | | | 2003 | |
| | | | | | | | | | | | | | | | | |
Net asset value,
beginning of period | | $1.00 | | | $1.00 | | | $1.00 | | | $1.00 | | | $1.00 | | | $1.00 | |
Income (loss) from
investment operations | | | | | | | | | | | | | | | | | | |
Net investment income (d) | | $0.02 | | | $0.04 | | | $0.03 | | | $0.01 | | | $0.00 | (w) | | $0.00 | (w) |
Net realized and unrealized
gain (loss) on investments | | — | | | (0.00 | )(w) | | (0.00 | )(w) | | — | | | — | | | — | |
| Total from investment operations | | $0.02 | | | $0.04 | | | $0.03 | | | $0.01 | | | $0.00 | (w) | | $0.00 | (w) |
Less distributions declared
to shareholders | | | | | | | | | | | | | | | | | | |
From net investment income | | $(0.02 | ) | | $(0.04 | ) | | $(0.03 | ) | | $(0.01 | ) | | $(0.00 | )(w) | | $(0.00 | )(w) |
| Net asset value, end of period | | $1.00 | | | $1.00 | | | $1.00 | | | $1.00 | | | $1.00 | | | $1.00 | |
| Total return (%) (r)(t) | | 1.57 | (n) | | 3.77 | | | 2.90 | | | 0.87 | | | 0.06 | | | 0.07 | |
Ratios (%) (to average net assets)
and Supplemental data: | | | | | | | | | | | | | | | | | | |
Expenses before expense
reductions (f) | | 2.10 | (a) | | 2.09 | | | 2.14 | | | 2.13 | | | 2.03 | | | 2.06 | |
Expenses after expense
reductions (f) | | 1.70 | (a) | | 1.69 | | | 1.74 | | | 1.73 | | | 1.08 | | | 1.25 | |
| Net investment income | | 3.06 | (a) | | 3.69 | | | 2.88 | | | 0.87 | | | 0.07 | | | 0.06 | |
Net assets at end of period
(000 Omitted) | | $466 | | | $328 | | | $297 | | | $340 | | | $339 | | | $253 | |
See Notes to Financial Statements
23
Financial Highlights – continued
| | | | | | | | | | | | | | | | | | |
| | | Six months
ended
2/29/08 (unaudited) | | | Years ended 8/31 | |
| Class 529C | | | 2007 | | | 2006 | | | 2005 | | | 2004 | | | 2003 | |
| | | | | | | | | | | | | | | | | |
Net asset value,
beginning of period | | $1.00 | | | $1.00 | | | $1.00 | | | $1.00 | | | $1.00 | | | $1.00 | |
Income (loss) from
investment operations | | | | | | | | | | | | | | | | | | |
Net investment income (d) | | $0.01 | | | $0.04 | | | $0.03 | | | $0.01 | | | $0.00 | (w) | | $0.00 | (w) |
Net realized and unrealized
gain (loss) on investments | | — | | | (0.00 | )(w) | | (0.00 | )(w) | | — | | | — | | | — | |
| Total from investment operations | | $0.01 | | | $0.04 | | | $0.03 | | | $0.01 | | | $0.00 | (w) | | $0.00 | (w) |
Less distributions declared
to shareholders | | | | | | | | | | | | | | | | | | |
From net investment income | | $(0.01 | ) | | $(0.04 | ) | | $(0.03 | ) | | $(0.01 | ) | | $(0.00 | )(w) | | $(0.00 | )(w) |
| Net asset value, end of period | | $1.00 | | | $1.00 | | | $1.00 | | | $1.00 | | | $1.00 | | | $1.00 | |
| Total return (%) (r)(t) | | 1.57 | (n) | | 3.76 | | | 2.90 | | | 0.87 | | | 0.06 | | | 0.07 | |
Ratios (%) (to average net assets)
and Supplemental data: | | | | | | | | | | | | | | | | | | |
Expenses before expense
reductions (f) | | 2.10 | (a) | | 2.09 | | | 2.14 | | | 2.13 | | | 2.03 | | | 2.06 | |
Expenses after expense
reductions (f) | | 1.70 | (a) | | 1.68 | | | 1.74 | | | 1.73 | | | 1.08 | | | 1.22 | |
| Net investment income | | 3.00 | (a) | | 3.69 | | | 2.89 | | | 0.85 | | | 0.06 | | | 0.05 | |
Net assets at end of period
(000 Omitted) | | $1,489 | | | $814 | | | $688 | | | $611 | | | $640 | | | $512 | |
| (d) | Per share data are based on average shares outstanding. |
| (f) | Ratios do not reflect reductions from fees paid indirectly, if applicable. |
| (i) | For the period from the class’ inception, April 1, 2005 (Classes R1, R2, R3, R4, and R5) through the stated period end. |
| (r) | Certain expenses have been reduced without which performance would have been lower. |
| (t) | Total returns do not include any applicable sales charges. |
| (w) | Per share amount was less than $0.01. |
See Notes to Financial Statements
24
NOTES TO FINANCIAL STATEMENTS
(unaudited)
| (1) | | Business and Organization |
MFS Cash Reserve Fund (the fund) is a series of MFS Series Trust I (the trust). The trust is organized as a Massachusetts business trust and is registered under the Investment Company Act of 1940, as amended, as an open-end management investment company.
| (2) | | Significant Accounting Policies |
General – The preparation of financial statements in conformity with U.S. generally accepted accounting principles requires management to make estimates and assumptions that affect the reported amounts of assets and liabilities, and disclosure of contingent assets and liabilities at the date of the financial statements and the reported amounts of revenues and expenses during the reporting period. Actual results could differ from those estimates.
Investment Valuations – Money market instruments are valued at amortized cost, which approximates market value. Amortized cost involves valuing an instrument at its cost as adjusted for amortization of premium or accretion of discount rather than its current market value. Each money market fund’s use of amortized cost is subject to the fund’s compliance with Rule 2a-7 under the Investment Company Act of 1940. The amortized cost value of an instrument can be different from the market value of an instrument.
In September 2006, FASB Statement No. 157, Fair Value Measurements (the “Statement”) was issued, and is effective for fiscal years beginning after November 15, 2007 and for all interim periods within those fiscal years. This Statement provides a single definition of fair value, a hierarchy for measuring fair value and expanded disclosures about fair value measurements. Management is evaluating the application of the Statement to the fund, and believes the impact will be limited to expanded disclosures resulting from the adoption of this Statement in the fund’s financial statements.
Repurchase Agreements – The fund may enter into repurchase agreements with institutions that the fund’s investment adviser has determined are creditworthy. Each repurchase agreement is recorded at cost. The fund requires that the securities collateral in a repurchase transaction be transferred to the custodian in a manner sufficient to enable the fund to obtain those securities in the event of a default under the repurchase agreement. The fund monitors, on a daily basis, the value of the collateral to ensure that its value, including accrued interest, is greater than amounts owed to the fund under each such repurchase agreement. The fund and other funds managed by Massachusetts Financial Services Company (MFS), may utilize a joint trading account for the purpose of entering into one or more repurchase agreements.
25
Notes to Financial Statements (unaudited) – continued
Indemnifications – Under the fund’s organizational documents, its officers and trustees may be indemnified against certain liabilities and expenses arising out of the performance of their duties to the fund. Additionally, in the normal course of business, the fund enters into agreements with service providers that may contain indemnification clauses. The fund’s maximum exposure under these agreements is unknown as this would involve future claims that may be made against the fund that have not yet occurred.
Investment Transactions and Income – Investment transactions are recorded on the trade date. Interest income is recorded on the accrual basis. All premium and discount is amortized and accreted for financial statement purposes and tax reporting purposes in accordance with U.S. generally accepted accounting principles.
Fees Paid Indirectly – The fund’s custody fee may be reduced according to an arrangement that measures the value of cash deposited with the custodian by the fund. This amount, for the six months ended February 29, 2008, is shown as a reduction of total expenses on the Statement of Operations.
Tax Matters and Distributions – The fund intends to qualify as a regulated investment company, as defined under Subchapter M of the Internal Revenue Code, and to distribute all of its taxable income, including realized capital gains. As a result, no provision for federal income tax is required. The fund adopted the provisions of FASB Interpretation No. 48, Accounting for Uncertainty in Income Taxes (“the Interpretation”) on September 1, 2007. The Interpretation prescribes a minimum threshold for financial statement recognition of the benefit of a tax position taken or expected to be taken in a tax return. There was no impact resulting from the adoption of this Interpretation on the fund’s financial statements. Each of the fund’s federal tax returns for the prior three fiscal years remains subject to examination by the Internal Revenue Service. It is the fund’s policy to record interest and penalty charges on underpaid taxes associated with its tax positions as interest expense and miscellaneous expense, respectively. No such charges were recorded in the current financial statements. Foreign taxes, if any, have been accrued by the fund in the accompanying financial statements.
Distributions to shareholders are recorded on the ex-dividend date. Income and capital gain distributions are determined in accordance with income tax regulations, which may differ from U.S. generally accepted accounting principles. Certain capital accounts in the financial statements are periodically adjusted for permanent differences in order to reflect their tax character. These adjustments have no impact on net assets or net asset value per share. Temporary differences which arise from recognizing certain items of income, expense, gain or loss in different periods for financial statement and tax purposes will reverse at some time in the future. Distributions in excess of net
26
Notes to Financial Statements (unaudited) – continued
investment income or net realized gains are temporary overdistributions for financial statement purposes resulting from differences in the recognition or classification of income or distributions for financial statement and tax purposes.
During the year ended August 31, 2007, there were no significant adjustments due to differences between book and tax accounting.
The tax character of distributions made during the current period will be determined at fiscal year end. The tax character of distributions declared to shareholders is as follows:
| | |
| | | 8/31/07 |
| Ordinary income (including any short-term capital gains) | | $16,153,796 |
The federal tax cost and the tax basis components of distributable earnings were as follows:
| | | |
| As of 2/29/08 | | | |
| Cost of investments | | $531,869,623 | |
| |
| As of 8/31/07 | | | |
| Undistributed ordinary income | | $77,688 | |
| Capital loss carryforwards | | (1,256 | ) |
| Post-October capital loss deferral | | (22,989 | ) |
| Other temporary differences | | (77,688 | ) |
The aggregate cost above includes prior fiscal year end tax adjustments.
As of August 31, 2007, the fund had capital loss carryforwards available to offset future realized gains. Such losses expire as follows:
| | | |
| 8/31/12 | | $ (441 | ) |
| 8/31/13 | | (4 | ) |
| 8/31/15 | | (811 | ) |
| | $(1,256 | ) |
Multiple Classes of Shares of Beneficial Interest – The fund offers multiple classes of shares, which differ in their respective distribution and service fees. All shareholders bear the common expenses of the fund based on the value of settled shares outstanding of each class, without distinction between share classes. Dividends are declared separately for each class. Differences in per share dividend rates are generally due to differences in separate class expenses. Class B and Class 529B shares will convert to Class A and Class 529A shares, respectively, approximately eight years after purchase.
| (3) | | Transactions with Affiliates |
Investment Adviser – The fund has an investment advisory agreement with MFS to provide overall investment management and related administrative services and facilities to the fund.
27
Notes to Financial Statements (unaudited) – continued
The management fee is computed daily and paid monthly at an annual rate of 0.55% of the fund’s average daily net assets.
As part of a settlement agreement with the New York Attorney General concerning market timing and related matters, MFS has agreed to reduce the management fee to 0.15% of the fund’s average daily net assets for the period March 1, 2004 through February 28, 2009. For the six months ended February 29, 2008, this waiver amounted to $928,890 and is reflected as a reduction of total expenses in the Statement of Operations.
The management fee incurred for the six months ended February 29, 2008 was equivalent to an annual effective rate of 0.15% of the fund’s average daily net assets.
Distributor – The Board of Trustees has adopted a distribution plan for certain class shares pursuant to Rule 12b-1 of the Investment Company Act of 1940.
The fund’s distribution plan provides that the fund will pay MFS Fund Distributors, Inc. (MFD) for services provided by MFD and financial intermediaries in connection with the distribution and servicing of certain share classes. One component of the plan is a distribution fee paid to MFD and another component of the plan is a service fee paid to MFD. MFD may subsequently pay all, or a portion, of the distribution and/or service fees to financial intermediaries.
Distribution Plan Fee Table:
| | | | | | | | | | |
| | | Distribution
Fee Rate | | Service
Fee Rate | | Total
Distribution
Plan (d) | | Annual
Effective
Rate (e) | | Distribution
and Service
Fee |
| Class A | | 0.10% | | 0.25% | | 0.35% | | 0.00% | | $— |
| Class B | | 0.75% | | 0.25% | | 1.00% | | 1.00% | | 610,969 |
| Class C | | 0.75% | | 0.25% | | 1.00% | | 1.00% | | 268,409 |
| Class R1 (c) | | 0.50% | | 0.25% | | 0.75% | | 0.75% | | 65,274 |
| Class R2 | | 0.25% | | 0.25% | | 0.50% | | 0.50% | | 30,536 |
| Class R3 | | 0.25% | | 0.25% | | 0.50% | | 0.50% | | 147,764 |
| Class R4 | | — | | 0.25% | | 0.25% | | 0.25% | | 64,962 |
| Class 529A | | 0.25% | | 0.25% | | 0.50% | | 0.00% | | 5,144 |
| Class 529B | | 0.75% | | 0.25% | | 1.00% | | 1.00% | | 1,792 |
| Class 529C | | 0.75% | | 0.25% | | 1.00% | | 1.00% | | 4,704 |
| Total Distribution and Service Fees | | | | | | | | $1,199,554 |
| (c) | Effective March 1, 2008, the distribution fee rate for Class R1 shares will be 0.75% and the total distribution plan rate will be 1.00%. |
| (d) | In accordance with the distribution plan for certain classes, the fund pays distribution and/or service fees up to these annual percentage rates of each class’ average daily net assets. |
| (e) | The annual effective rates represent actual fees incurred under the distribution plan for the six months ended February 29, 2008 based on each class’ average daily net assets. Payment of the 0.25% annual Class A service fee is not yet in effect and will be implemented on such date as the fund’s Board of Trustees may determine. Payment of the 0.10% annual Class A distribution fee is not yet in effect and will be implemented on such date as the fund’s Board of Trustees may determine. 0.10% of the Class 529A distribution fee is currently being waived under a written waiver arrangement through December 31, 2008. Payment of the 0.15% of the Class 529A distribution fee is not yet in effect and will be implemented on |
28
Notes to Financial Statements (unaudited) – continued
| | such date as the fund’s Board of Trustees may determine. For the six months ended February 29, 2008, this waiver amounted to $1,470 and is reflected as a reduction of total expenses in the Statement of Operations. 0.25% of the Class 529A service fee is currently being waived under a written waiver arrangement through December 31, 2008. For the six months ended February 29, 2008, this waiver amounted to $3,674 and is reflected as a reduction of total expenses in the Statement of Operations. |
Certain Class A, Class C and Class 529C shares are subject to a contingent deferred sales charge in the event of a shareholder redemption within 12 months of purchase. Class B and Class 529B shares are subject to a contingent deferred sales charge in the event of a shareholder redemption within six years of purchase. All contingent deferred sales charges are paid to MFD and during the six months ended February 29, 2008, were as follows:
| | |
| | | Amount |
| Class A | | $6,222 |
| Class B | | $167,225 |
| Class C | | $15,140 |
| Class 529B | | $— |
| Class 529C | | $— |
The fund has entered into and may from time to time enter into contracts with program managers and other parties which administer the tuition programs through which an investment in the fund’s 529 share classes is made. The fund has entered into an agreement with MFD pursuant to which MFD receives an annual fee of up to 0.35% of the average daily net assets attributable to each 529 share class. The fee is based on average daily net assets and is currently established at 0.25% annually of average daily net assets of the fund’s 529 share classes. Effective April 1, 2008, the fee will be 0.10%. The fee may only be increased with the approval of the Board of Trustees who oversees the fund. The services provided by MFD, or a third party with which MFD contracts, include recordkeeping and tax reporting and account services, as well as services designed to maintain the program’s compliance with the Internal Revenue Code and other regulatory requirements. Program manager fees for the six months ended February 29, 2008, were as follows:
| | |
| | | Amount |
| Class 529A | | $3,674 |
| Class 529B | | 448 |
| Class 529C | | 1,176 |
| Total Program Manager Fees | | $5,298 |
Shareholder Servicing Agent – MFS Service Center, Inc. (MFSC), a wholly-owned subsidiary of MFS, receives a fee from the fund for its services as shareholder servicing agent calculated as a percentage of the average daily net assets of the fund as determined periodically under the supervision of the fund’s Board of Trustees. For the six months ended February 29, 2008, the fee was $140,540, which equated to 0.0605% annually of the fund’s average daily net assets. MFSC also receives payment from the fund for out-of-pocket expenses, sub-accounting and other shareholder
29
Notes to Financial Statements (unaudited) – continued
servicing costs which may be paid to affiliated and unaffiliated service providers. For the six months ended February 29, 2008, these out-of-pocket expenses, sub-accounting and other shareholder servicing costs amounted to $323,489. The fund may also pay shareholder servicing related costs directly to non-related parties.
Administrator – MFS provides certain financial, legal, shareholder communications, compliance, and other administrative services to the fund. Under an administrative services agreement, the fund partially reimburses MFS the costs incurred to provide these services. The fund is charged a fixed amount plus a fee based on average daily net assets. The fund’s annual fixed amount is $17,500.
The administrative services fee incurred for the six months ended February 29, 2008 was equivalent to an annual effective rate of 0.0161% of the fund’s average daily net assets.
In addition to the administrative services provided by MFS to the fund as described above, MFS is responsible for providing certain retirement plan administration and services with respect to certain shares. These services include various administrative, recordkeeping, and communication/educational services with respect to the retirement plans which invest in these shares, and may be provided directly by MFS or by a third party. MFS may subsequently pay all, or a portion, of the retirement plan administration and services fee to affiliated or unaffiliated third parties. For the six months ended February 29, 2008, the fund paid MFS an annual retirement plan administration and services fee up to the following annual percentage rates of each class’ average daily net assets:
| | | | | | | | |
| | | Beginning
of period
through
12/31/07 | | Effective
1/1/08 | | Annual
Effective
Rate (g) | | Total
Amount |
Class R1 | | 0.35% | | 0.35% | | 0.35% | | $30,461 |
Class R2 | | 0.25% | | — | | 0.15% | | 9,226 |
Class R3 | | 0.15% | | — | | 0.09% | | 26,346 |
Class R4 | | 0.15% | | — | | 0.08% | | 20,195 |
Class R5 | | 0.10% | | — | | 0.06% | | 1,089 |
| Total Retirement Plan Administration and Services Fees | | $87,317 |
| (g) | Effective January 1, 2008, the annual retirement plan administration and services fee was eliminated for Class R2, Class R3, Class R4, and Class R5 shares. Effective March 1, 2008 the annual retirement plan administration and services fee will be eliminated for Class R1 shares. |
Trustees’ and Officers’ Compensation – The fund pays compensation to independent trustees in the form of a retainer, attendance fees, and additional compensation to Board and Committee chairpersons. The fund does not pay compensation directly to trustees or officers of the fund who are also officers of the investment adviser, all of whom receive remuneration for their services to the fund from MFS. Certain officers and trustees of the fund are officers or
30
Notes to Financial Statements (unaudited) – continued
directors of MFS, MFD, and MFSC. The fund has an unfunded, defined benefit plan for certain retired independent trustees which resulted in a pension expense of $1,494. This amount is included in independent trustees’ compensation for the six months ended February 29, 2008. The liability for deferred retirement benefits payable to certain retired independent trustees amounted to $26,604 at February 29, 2008, and is included in payable for independent trustees’ compensation.
Other – This fund and certain other MFS funds (the funds) have entered into a services agreement (the Agreement) which provides for payment of fees by the funds to Tarantino LLC in return for the provision of services of an Independent Chief Compliance Officer (ICCO) for the funds. The ICCO is an officer of the funds and the sole member of Tarantino LLC. The funds can terminate the Agreement with Tarantino LLC at any time under the terms of the Agreement. For the six months ended February 29, 2008, the fee paid by the fund to Tarantino LLC was $1,801 and is included in miscellaneous expense on the Statement of Operations. MFS has agreed to reimburse the fund for a portion of the payments made by the fund to Tarantino LLC in the amount of $1,006, which is shown as a reduction of total expenses in the Statement of Operations. Additionally, MFS has agreed to bear all expenses associated with office space, other administrative support, and supplies provided to the ICCO.
Purchases and sales of money market securities, exclusive of securities subject to repurchase agreements, aggregated $2,203,134,359 and $2,105,144,951 respectively.
| (5) | | Shares of Beneficial Interest |
The fund’s Declaration of Trust permits the Trustees to issue an unlimited number of full and fractional shares of beneficial interest. Transactions in fund shares were as follows:
| | | | | | | | |
| | | Six months ended
2/29/08 | | Year ended
8/31/07 |
| | | Shares | | Amount | | Shares | | Amount |
| Shares sold | | | | | | | | |
Class A | | 96,577,944 | | $96,577,944 | | 109,927,782 | | $109,927,782 |
Class B | | 57,020,204 | | 57,020,204 | | 112,273,280 | | 112,273,280 |
Class C | | 47,431,157 | | 47,431,157 | | 60,361,403 | | 60,361,403 |
Class R1 | | 50,563,469 | | 50,563,469 | | 61,618,688 | | 61,618,688 |
Class R2 | | 56,112,220 | | 56,112,220 | | 54,718,434 | | 54,718,434 |
Class R3 | | 131,377,157 | | 131,377,157 | | 151,186,527 | | 151,186,527 |
Class R4 | | 146,247,623 | | 146,247,623 | | 104,892,406 | | 104,892,406 |
Class R5 | | 9,802,443 | | 9,802,443 | | 17,149,069 | | 17,149,069 |
Class 529A | | 1,262,000 | | 1,262,000 | | 1,188,482 | | 1,188,482 |
Class 529B | | 144,783 | | 144,783 | | 101,520 | | 101,520 |
Class 529C | | 850,379 | | 850,379 | | 497,316 | | 497,316 |
| | 597,389,379 | | $597,389,379 | | 673,914,907 | | $673,914,907 |
31
Notes to Financial Statements (unaudited) – continued
| | | | | | | | | | | | |
| | | Six months ended
2/29/08 | | | Year ended
8/31/07 | |
| | | Shares | | | Amount | | | Shares | | | Amount | |
| Shares issued to shareholders in reinvestment of distributions | | | | | | | | | | | | |
Class A | | 2,869,798 | | | $2,869,798 | | | 5,246,094 | | | $5,246,094 | |
Class B | | 1,939,334 | | | 1,939,334 | | | 6,563,810 | | | 6,563,810 | |
Class C | | 827,054 | | | 827,054 | | | 1,624,513 | | | 1,624,513 | |
Class R1 | | 262,450 | | | 262,450 | | | 149,283 | | | 149,283 | |
Class R2 | | 188,417 | | | 188,417 | | | 119,311 | | | 119,311 | |
Class R3 | | 1,056,150 | | | 1,056,150 | | | 643,871 | | | 643,871 | |
Class R4 | | 982,574 | | | 982,574 | | | 539,714 | | | 539,714 | |
Class R5 | | 74,487 | | | 74,487 | | | 28,877 | | | 28,877 | |
Class 529A | | 59,977 | | | 59,977 | | | 108,508 | | | 108,508 | |
Class 529B | | 5,369 | | | 5,369 | | | 11,154 | | | 11,154 | |
Class 529C | | 14,105 | | | 14,105 | | | 25,156 | | | 25,156 | |
| | 8,279,715 | | | $8,279,715 | | | 15,060,291 | | | $15,060,291 | |
| Shares reacquired | | | | | | | | | | | | |
Class A | | (79,603,791 | ) | | $(79,603,791 | ) | | (93,431,093 | ) | | $(93,431,093 | ) |
Class B | | (97,367,860 | ) | | (97,367,860 | ) | | (187,291,191 | ) | | (187,291,191 | ) |
Class C | | (39,639,381 | ) | | (39,639,381 | ) | | (58,042,860 | ) | | (58,042,860 | ) |
Class R1 | | (37,997,301 | ) | | (37,997,301 | ) | | (54,127,011 | ) | | (54,127,011 | ) |
Class R2 | | (52,348,485 | ) | | (52,348,485 | ) | | (46,341,559 | ) | | (46,341,559 | ) |
Class R3 | | (96,504,754 | ) | | (96,504,754 | ) | | (120,708,753 | ) | | (120,708,753 | ) |
Class R4 | | (110,044,054 | ) | | (110,044,054 | ) | | (73,903,225 | ) | | (73,903,225 | ) |
Class R5 | | (9,315,413 | ) | | (9,315,413 | ) | | (13,513,179 | ) | | (13,513,179 | ) |
Class 529A | | (630,879 | ) | | (630,879 | ) | | (884,377 | ) | | (884,377 | ) |
Class 529B | | (12,125 | ) | | (12,125 | ) | | (81,516 | ) | | (81,516 | ) |
Class 529C | | (189,759 | ) | | (189,759 | ) | | (396,234 | ) | | (396,234 | ) |
| | (523,653,802 | ) | | $(523,653,802 | ) | | (648,720,998 | ) | | $(648,720,998 | ) |
| Net change | | | | | | | | | | | | |
Class A | | 19,843,951 | | | $19,843,951 | | | 21,742,783 | | | $21,742,783 | |
Class B | | (38,408,322 | ) | | (38,408,322 | ) | | (68,454,101 | ) | | (68,454,101 | ) |
Class C | | 8,618,830 | | | 8,618,830 | | | 3,943,056 | | | 3,943,056 | |
Class R1 | | 12,828,618 | | | 12,828,618 | | | 7,640,960 | | | 7,640,960 | |
Class R2 | | 3,952,152 | | | 3,952,152 | | | 8,496,186 | | | 8,496,186 | |
Class R3 | | 35,928,553 | | | 35,928,553 | | | 31,121,645 | | | 31,121,645 | |
Class R4 | | 37,186,143 | | | 37,186,143 | | | 31,528,895 | | | 31,528,895 | |
Class R5 | | 561,517 | | | 561,517 | | | 3,664,767 | | | 3,664,767 | |
Class 529A | | 691,098 | | | $691,098 | | | 412,613 | | | $412,613 | |
Class 529B | | 138,027 | | | 138,027 | | | 31,158 | | | 31,158 | |
Class 529C | | 674,725 | | | 674,725 | | | 126,238 | | | 126,238 | |
| | 82,015,292 | | | $82,015,292 | | | 40,254,200 | | | $40,254,200 | |
32
Notes to Financial Statements (unaudited) – continued
The fund and other funds managed by MFS participate in a $1 billion unsecured committed line of credit provided by a syndication of banks under a credit agreement. In addition, the fund and other funds managed by MFS have established uncommitted borrowing arrangements with certain banks. Borrowings may be made for temporary financing needs. Interest is charged to each fund, based on its borrowings, generally at a rate equal to the Federal Reserve funds rate plus 0.30%. In addition, a commitment fee, based on the average daily, unused portion of the committed line of credit, is allocated among the participating funds at the end of each calendar quarter. For the six months ended February 29, 2008, the fund’s commitment fee and interest expense were $1,030 and $0, respectively, and are included in miscellaneous expense on the Statement of Operations.
On October 23, 2007 the Board of Trustees approved, on or about April 18, 2008, the conversion of Class R shares and Class R2 shares into Class R3 shares. After the conversion, Class R3, Class R4, and Class R5 will be renamed Class R2, Class R3, and Class R4, respectively.
33
RESULTS OF SHAREHOLDER MEETING
(unaudited)
At a special meeting of shareholders of MFS Cash Reserve Fund, which was held on February 15, 2008, the following actions were taken:
Item 1: To approve an amendment to the current Master Distribution Plan adopted pursuant to Rule 12b-1 under the Investment Company Act of 1940, as amended, with respect to Class R1 Shares of the Fund.
| | |
| | | Number of Dollars |
| For | | 12,665,313.85 |
| Against | | 1,574.15 |
| Abstain | | 436,256.34 |
34
BOARD REVIEW OF INVESTMENT ADVISORY AGREEMENT
A discussion regarding the Board’s most recent review and renewal of the Fund’s investment advisory agreement is available by clicking on the fund’s name under “Select a fund” on the MFS Web site (mfs.com).
PROXY VOTING POLICIES AND INFORMATION
A general description of the MFS funds’ proxy voting policies and procedures is available without charge, upon request, by calling 1-800-225-2606, by visiting the Proxy Voting section of mfs.com or by visiting the SEC’s Web site at http://www.sec.gov.
Information regarding how the fund voted proxies relating to portfolio securities during the most recent twelve-month period ended June 30 is available without charge by visiting the Proxy Voting section of mfs.com or by visiting the SEC’s Web site at http://www.sec.gov.
QUARTERLY PORTFOLIO DISCLOSURE
The fund will file a complete schedule of portfolio holdings with the Securities and Exchange Commission (the Commission) for the first and third quarters of each fiscal year on Form N-Q. The fund’s Form N-Q may be reviewed and copied at the:
Public Reference Room
Securities and Exchange Commission 100 F Street, NE, Room 1580 Washington, D.C. 20549
Information on the operation of the Public Reference Room may be obtained by calling the Commission at 1-202-551-5850. The fund’s Form N-Q is available on the EDGAR database on the Commission’s Internet Web site at http://www.sec.gov, and copies of this information may be obtained, upon payment of a duplicating fee, by electronic request at the following e-mail address: publicinfo@sec.gov or by writing the Public Reference Section at the above address.
A shareholder can also obtain the quarterly portfolio holdings report at mfs.com.
35

The Registrant has not amended any provision in its Code of Ethics (the “Code”) that relates to any element of the Code’s definition enumerated in paragraph (b) of Item 2 of this Form N-CSR.
| ITEM 3. | AUDIT COMMITTEE FINANCIAL EXPERT. |
Not applicable for semi-annual reports.
| ITEM 4. | PRINCIPAL ACCOUNTANT FEES AND SERVICES. |
Not applicable for semi-annual reports.
| ITEM 5. | AUDIT COMMITTEE OF LISTED REGISTRANTS. |
Not applicable to the Registrant.
| ITEM 6. | SCHEDULE OF INVESTMENTS |
A schedule of investments for each series of the Registrant is included as part of the report to shareholders of such series under Item 1 of this Form N-CSR.
| ITEM 7. | DISCLOSURE OF PROXY VOTING POLICIES AND PROCEDURES FOR CLOSED-END MANAGEMENT INVESTMENT COMPANIES. |
Not applicable to the Registrant.
| ITEM 8. | PORTFOLIO MANAGERS OF CLOSED-END MANAGEMENT INVESTMENT COMPANIES. |
Not applicable to the Registrant.
| ITEM 9. | PURCHASES OF EQUITY SECURITIES BY CLOSED-END MANAGEMENT INVESTMENT COMPANY AND AFFILIATED PURCHASERS. |
Not applicable to the Registrant.
| ITEM 10. | SUBMISSION OF MATTERS TO A VOTE OF SECURITY HOLDERS. |
There were no material changes to the procedures by which shareholders may send recommendations to the Board for nominees to the Registrant’s Board since the Registrant last provided disclosure as to such procedures in response to the requirements of Item 7(d)(2)(ii)(G) or this Item.
| ITEM 11. | CONTROLS AND PROCEDURES. |
| (a) | Based upon their evaluation of the effectiveness of the registrant’s disclosure controls and procedures (as defined in Rule 30a-3(c) under the Investment Company Act of 1940 (the “Act”)) as conducted within 90 days of the filing date of this report on Form N-CSR, the registrant’s principal financial officer and principal executive officer have concluded that those disclosure controls and procedures provide reasonable assurance that the material information required to be disclosed by the registrant on this report is recorded, processed, summarized and reported within the time periods specified in the Securities and Exchange Commission’s rules and forms. |
| (b) | There were no changes in the registrant’s internal controls over financial reporting (as defined in Rule 30a-3(d) under the Act) that occurred during the second fiscal quarter of the period covered by the report that have materially affected, or are reasonably likely to materially affect, the registrant’s internal control over financial reporting. |
| (a) | File the exhibits listed below as part of this form. Letter or number the exhibits in the sequence indicated. |
| | (1) | Any code of ethics, or amendment thereto, that is the subject of the disclosure required by Item 2, to the extent that the registrant intends to satisfy the Item 2 requirements through filing of an exhibit. |
| | (2) | A separate certification for each principal executive officer and principal financial officer of the registrant as required by Rule 30a-2 under the Act (17 CFR 270.30a-2): Attached hereto. |
| (b) | If the report is filed under Section 13(a) or 15(d) of the Exchange Act, provide the certifications required by Rule 30a-2(b) under the Act (17 CFR 270.30a-2(b)), Rule 13a-14(b) or Rule 15d-14(b) under the Exchange Act (17 CFR 240.13a-14(b) or 240.15d-14(b)) and Section 1350 of Chapter 63 of Title 18 of the United States Code (18 U.S.C. 1350) as an exhibit. A certification furnished pursuant to this paragraph will not be deemed “filed” for the purposes of Section 18 of the Exchange Act (15 U.S.C. 78r), or otherwise subject to the liability of that section. Such certification will not be deemed to be incorporated by reference into any filing under the Securities Act of 1933 or the Exchange Act, except to the extent that the registrant specifically incorporates it by reference: Attached hereto. |
Notice
A copy of the Amended and Restated Declaration of Trust, as amended, of the Registrant is on file with the Secretary of State of The Commonwealth of Massachusetts and notice is hereby given that this instrument is executed on behalf of the Registrant by an officer of the Registrant as an officer and not individually and the obligations of or arising out of this instrument are not binding upon any of the Trustees or shareholders individually, but are binding only upon the assets and property of the respective constituent series of the Registrant.
SIGNATURES
Pursuant to the requirements of the Securities Exchange Act of 1934 and the Investment Company Act of 1940, the registrant has duly caused this report to be signed on its behalf by the undersigned, thereunto duly authorized.
| | |
| |
| (Registrant) | | MFS SERIES TRUST I |
| | |
| |
| By (Signature and Title)* | | ROBERT J. MANNING |
| | Robert J. Manning, President |
Date: April 14, 2008
Pursuant to the requirements of the Securities Exchange Act of 1934 and the Investment Company Act of 1940, this report has been signed below by the following persons on behalf of the registrant and in the capacities and on the dates indicated.
| | |
| |
| By (Signature and Title)* | | ROBERT J. MANNING |
| | Robert J. Manning, President (Principal Executive Officer) |
Date: April 14, 2008
| | |
| |
| By (Signature and Title)* | | MARIA F. DWYER |
| | Maria F. Dwyer, Treasurer (Principal Financial Officer and Accounting Officer) |
Date: April 14, 2008
| * | Print name and title of each signing officer under his or her signature. |