UNITED STATES
SECURITIES AND EXCHANGE COMMISSION
Washington, D.C. 20549
FORM N-CSR
CERTIFIED SHAREHOLDER REPORT OF
REGISTERED MANAGEMENT INVESTMENT COMPANIES
Investment Company Act file number 811-4777
MFS SERIES TRUST I
(Exact name of registrant as specified in charter)
500 Boylston Street, Boston, Massachusetts 02116
(Address of principal executive offices) (Zip code)
Susan S. Newton
Massachusetts Financial Services Company
500 Boylston Street
Boston, Massachusetts 02116
(Name and address of agents for service)
Registrant’s telephone number, including area code: (617) 954-5000
Date of fiscal year end: August 31
Date of reporting period: February 28, 2010
| ITEM 1. | REPORTS TO STOCKHOLDERS. |

MFS® Cash Reserve Fund
The report is prepared for the general information of shareholders. It is authorized for distribution to prospective investors only when preceded or accompanied by a current prospectus.
NOT FDIC INSURED Ÿ MAY LOSE VALUE Ÿ
NO BANK GUARANTEE
2/28/10
LMM-SEM

LETTER FROM THE CEO
Dear Shareholders:
After having suffered their biggest declines since the Great Depression, most global markets experienced an impressive resurgence during the latter months of 2009 and the first quarter of 2010. The global economy was able to reap the benefits of two major trends. The first of these was the massive efforts of governments and central banks to increase liquidity in the financial system as they sought to prevent the credit crisis from further affecting the banking system. The second was the move by companies around the world to cut costs and operations to prepare for rapidly changing market conditions. We believe that these moves not only shortened the length of the downturn but also set the stage for the recovery we are seeing today.
Even with the significant market gains of 2009 and the early part of 2010, the recovery is unrolling at a moderate pace, with rebounds in the manufacturing sector and corporate America leading the way. Central bankers are proceeding with caution and have held benchmark interest rates unchanged as they debate the best way to withdraw stimulus measures without disrupting the fragile growth process.
While hurdles remain, we believe that the global economy is on the road to recovery. As always, we continue to be mindful of the many challenges faced at the individual, national, and international levels. It is at times such as these that we want to remind investors of the merits of maintaining a long-term view, adhering to basic investing principles such as asset allocation and diversification, and working closely with advisors to identify and research investment opportunities. At MFS®, we take particular pride in how well mutual funds can help investors by providing the diversification that is important in any type of market climate.
Respectfully,

Robert J. Manning
Chief Executive Officer and Chief Investment Officer
MFS Investment Management®
April 15, 2010
The opinions expressed in this letter are subject to change, may not be relied upon for investment advice, and no forecasts can be guaranteed.
1
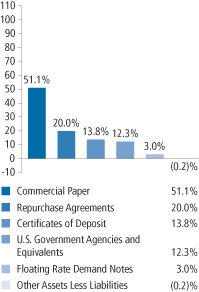
PORTFOLIO COMPOSITION
Portfolio structure (u)
| | |
| Credit quality (a) | | |
| A-1+ | | 3.4% |
| A-1 | | 96.8% |
| Non Rated | | 0.0% |
| Other | | (0.2)% |
| |
| Maturity breakdown (u) | | |
| 0 - 7 days | | 27.4% |
| 8 - 29 days | | 19.7% |
| 30 - 59 days | | 24.3% |
| 60 - 89 days | | 13.9% |
| 90 - 366 days | | 14.9% |
| Other Assets Less Liabilities | | (0.2)% |
| (a) | The Credit Quality table shows the percentage of portfolio assets falling within each rating category. Included in each rating category are short-term debt securities, the ratings of which are based on the short-term credit quality ratings of the securities’ issuers. For repurchase agreements, the credit quality is based on the short-term rating of the counterparty with which MFS trades the repurchase agreement. Each short-term debt security is assigned a rating in accordance with the following ratings hierarchy: If the issuer is rated by Moody’s, then that rating is used; if not rated by Moody’s, then a Standard & Poor’s rating is used; if not rated by S&P, then a Fitch rating is used. Cash and other portfolio assets that are not securities are not included in the categories mentioned above. Ratings are converted to the S&P scale and are subject to change. |
| (u) | For purposes of this presentation, accrued interest, where applicable, is included. |
| | From time to time “Other Assets Less Liabilities” may be negative due to timing of cash receipts. |
| | Percentages are based on net assets as of 2/28/10, unless otherwise noted. |
| | The portfolio is actively managed and current holdings may be different. |
2
MARKET ENVIRONMENT
After having suffered through one of the largest and most concentrated downturns since the 1930s, most asset markets staged a remarkable rebound during 2009. This recovery in global activity, which covers this reporting period, has been led importantly by emerging Asian economies, but broadening to include most of the global economy to varying degrees. Primary drivers of the recovery included an unwinding of the inventory destocking that took place earlier, as well as massive fiscal and monetary stimulus.
During the worst of the credit crisis, policy makers globally loosened monetary and fiscal policy on a massive scale. Having reached their lower bound on policy rates prior to the beginning of the reporting period, several central banks were implementing quantitative easing as a means to further loosen monetary policy to offset the continuing fall in global economic activity. However, by the beginning of the period, there were ever-broadening signs that the global macroeconomic deterioration had passed, which caused the subsequent rise in asset valuations. As most asset prices rebounded during the period and the demand for liquidity waned, the debate concerning the existence of asset bubbles and the need for monetary exit strategies had begun, creating added uncertainty regarding the forward path of policy rates. This changing dynamic caused asset valuations to move broadly sideways during the latter part of the period.
3
EXPENSE TABLE
Fund expenses borne by the shareholders during the period, September 1, 2009 through February 28, 2010
As a shareholder of the fund, you incur two types of costs: (1) transaction costs, including sales charges (loads) on certain purchase or redemption payments, and (2) ongoing costs, including management fees; distribution and service (12b-1) fees; and other fund expenses. This example is intended to help you understand your ongoing costs (in dollars) of investing in the fund and to compare these costs with the ongoing costs of investing in other mutual funds.
The example is based on an investment of $1,000 invested at the beginning of the period and held for the entire period September 1, 2009 through February 28, 2010.
Actual Expenses
The first line for each share class in the following table provides information about actual account values and actual expenses. You may use the information in this line, together with the amount you invested, to estimate the expenses that you paid over the period. Simply divide your account value by $1,000 (for example, an $8,600 account value divided by $1,000 = 8.6), then multiply the result by the number in the first line under the heading entitled “Expenses Paid During Period” to estimate the expenses you paid on your account during this period.
Hypothetical Example for Comparison Purposes
The second line for each share class in the following table provides information about hypothetical account values and hypothetical expenses based on the fund’s actual expense ratio and an assumed rate of return of 5% per year before expenses, which is not the fund’s actual return. The hypothetical account values and expenses may not be used to estimate the actual ending account balance or expenses you paid for the period. You may use this information to compare the ongoing costs of investing in the fund and other funds. To do so, compare this 5% hypothetical example with the 5% hypothetical examples that appear in the shareholder reports of the other funds.
Please note that the expenses shown in the table are meant to highlight your ongoing costs only and do not reflect any transactional costs, such as sales charges (loads). Therefore, the second line for each share class in the table is useful in comparing ongoing costs only, and will not help you determine the relative total costs of owning different funds. In addition, if these transactional costs were included, your costs would have been higher.
4
Expense Table – continued
| | | | | | | | | | |
Share
Class | | | | Annualized
Expense
Ratio | | Beginning
Account Value
9/01/09 | | Ending
Account Value
2/28/10 | | Expenses
Paid During
Period (p)
9/01/09-2/28/10 |
| A | | Actual | | 0.25% | | $1,000.00 | | $1,000.04 | | $1.24 |
| | Hypothetical (h) | | 0.25% | | $1,000.00 | | $1,023.55 | | $1.25 |
| B | | Actual | | 0.25% | | $1,000.00 | | $1,000.04 | | $1.24 |
| | Hypothetical (h) | | 0.25% | | $1,000.00 | | $1,023.55 | | $1.25 |
| C | | Actual | | 0.25% | | $1,000.00 | | $1,000.04 | | $1.24 |
| | Hypothetical (h) | | 0.25% | | $1,000.00 | | $1,023.55 | | $1.25 |
| R1 | | Actual | | 0.25% | | $1,000.00 | | $1,000.04 | | $1.24 |
| | Hypothetical (h) | | 0.25% | | $1,000.00 | | $1,023.55 | | $1.25 |
| R2 | | Actual | | 0.25% | | $1,000.00 | | $1,000.04 | | $1.24 |
| | Hypothetical (h) | | 0.25% | | $1,000.00 | | $1,023.55 | | $1.25 |
| R3 | | Actual | | 0.25% | | $1,000.00 | | $1,000.04 | | $1.24 |
| | Hypothetical (h) | | 0.25% | | $1,000.00 | | $1,023.55 | | $1.25 |
| R4 | | Actual | | 0.25% | | $1,000.00 | | $1,000.04 | | $1.24 |
| | Hypothetical (h) | | 0.25% | | $1,000.00 | | $1,023.55 | | $1.25 |
| 529A | | Actual | | 0.25% | | $1,000.00 | | $1,000.04 | | $1.24 |
| | Hypothetical (h) | | 0.25% | | $1,000.00 | | $1,023.55 | | $1.25 |
| 529B | | Actual | | 0.25% | | $1,000.00 | | $1,000.04 | | $1.24 |
| | Hypothetical (h) | | 0.25% | | $1,000.00 | | $1,023.55 | | $1.25 |
| 529C | | Actual | | 0.25% | | $1,000.00 | | $1,000.04 | | $1.24 |
| | Hypothetical (h) | | 0.25% | | $1,000.00 | | $1,023.55 | | $1.25 |
| (h) | 5% class return per year before expenses. |
| (p) | Expenses paid is equal to each class’ annualized expense ratio, as shown above, multiplied by the average account value over the period, multiplied by the number of days in the period, divided by the number of days in the year. Expenses paid do not include any applicable sales charges (loads). If these transaction costs had been included, your costs would have been higher. |
Expense Changes Impacting the Table
As more fully disclosed in footnote 3 to the financial statements, the expense ratios reported above include additional expense reductions to avoid a negative yield.
5
PORTFOLIO OF INVESTMENTS
2/28/10 (unaudited)
The Portfolio of Investments is a complete list of all securities owned by your fund. It is categorized by broad-based asset classes.
| | | | | | |
| Certificates of Deposit - 13.8% | | | | | | |
| Issuer | | Shares/Par | | Value ($) |
| | | | | | |
| Major Banks - 10.1% | | | | | | |
Abbey National Treasury Services PLC (US Branch),
0.16%, due 4/23/10 | | $ | 7,790,000 | | $ | 7,790,000 |
| Credit Agricole Indosuez/New York Branch, 0.6%, due 5/18/10 | | | 16,000,000 | | | 16,000,000 |
| Credit Suisse New York, 0.88%, due 8/02/10 | | | 16,400,000 | | | 16,400,000 |
| Credit Suisse, New York, 0.82%, due 8/02/10 | | | 2,800,000 | | | 2,800,000 |
| Royal Bank of Canada, 0.24%, due 4/26/10 | | | 11,700,000 | | | 11,700,000 |
| | | | | | |
| | | | | | $ | 54,690,000 |
| Other Banks & Diversified Financials - 3.7% | | | | | | |
| Nordea Bank Finland PLC (New York), 0.83%, due 7/15/10 | | $ | 12,600,000 | | $ | 12,600,000 |
| Nordea Bank Finland PLC (New York), 0.83%, due 7/15/10 | | | 7,200,000 | | | 7,200,000 |
| | | | | | |
| | | | | | $ | 19,800,000 |
| Total Certificates of Deposit, at Amortized Cost and Value | | | | | $ | 74,490,000 |
| | |
| Commercial Paper (y) - 51.1% | | | | | | |
| Electronics - 1.3% | | | | | | |
| Emerson Electric Co., 0.12%, due 4/12/10 (t) | | $ | 7,089,000 | | $ | 7,088,008 |
| | |
| Financial Institutions - 2.0% | | | | | | |
| General Electric Capital Corp., 0.13%, due 3/19/10 | | $ | 10,884,000 | | $ | 10,883,289 |
| | |
| Food & Beverages - 3.0% | | | | | | |
| Coca-Cola Co., 0.11%, due 3/22/10 (t) | | $ | 8,000,000 | | $ | 7,999,487 |
| Coca-Cola Co., 0.22%, due 5/17/10 (t) | | | 8,390,000 | | | 8,386,052 |
| | | | | | |
| | | | | | $ | 16,385,539 |
| Major Banks - 23.0% | | | | | | |
| Australia & New Zealand Banking Group, 0.84%, due 6/25/10 | | $ | 14,560,000 | | $ | 14,520,591 |
| Bank of America Corp., 0.2%, due 3/23/10 | | | 16,789,000 | | | 16,786,948 |
| CBA (Delaware) Finance, Inc., 0.31%, due 3/25/10 | | | 18,320,000 | | | 18,316,214 |
| Goldman Sachs Group, Inc., 0.11%, due 3/19/10 | | | 7,500,000 | | | 7,499,588 |
| JPMorgan Chase & Co., 0.12%, due 3/10/10 | | | 9,555,000 | | | 9,554,713 |
| JPMorgan Chase & Co., 0.15%, due 4/20/10 | | | 1,954,000 | | | 1,953,593 |
| JPMorgan Chase Funding Inc., 0.25%, due 4/19/10 | | | 4,864,000 | | | 4,862,345 |
| Societe Generale North America, Inc., 0.15%, due 3/01/10 | | | 8,183,000 | | | 8,183,000 |
| Societe Generale North America, Inc., 0.18%, due 3/18/10 | | | 7,733,000 | | | 7,732,343 |
| Toronto Dominion HDG USA, 0.35%, due 3/15/10 | | | 7,100,000 | | | 7,099,034 |
6
Portfolio of investments (unaudited) – continued
| | | | | | |
| Issuer | | Shares/Par | | Value ($) |
| | | | | | |
| Commercial Paper (y) - continued | | | | | | |
| Major Banks - continued | | | | | | |
| Toronto Dominion HDG USA, 0.4%, due 3/15/10 | | $ | 9,490,000 | | $ | 9,488,524 |
| Toronto Dominion HDG USA, 0.6%, due 4/09/10 | | | 2,050,000 | | | 2,048,668 |
| Westpac Banking Corp., 0.14%, due 4/28/10 (t) | | | 16,350,000 | | | 16,346,312 |
| | | | | | |
| | | | | | $ | 124,391,873 |
| Medical Equipment - 2.6% | | | | | | |
| Merck & Co., Inc., 0.1%, due 3/15/10 (t) | | $ | 9,368,000 | | $ | 9,367,636 |
| Merck & Co., Inc., 0.11%, due 4/12/10 (t) | | | 1,446,000 | | | 1,445,814 |
| Merck & Co., Inc., 0.12%, due 4/13/10 (t) | | | 3,240,000 | | | 3,239,536 |
| | | | | | |
| | | | | | $ | 14,052,986 |
| Network & Telecom - 1.5% | | | | | | |
| AT&T, Inc., 0.12%, due 4/05/10 (t) | | $ | 8,000,000 | | $ | 7,999,067 |
| | |
| Other Banks & Diversified Financials - 11.7% | | | | | | |
| Bank of Nova Scotia, 0.16%, due 4/20/10 | | $ | 16,483,000 | | $ | 16,479,337 |
| Citigroup Funding, Inc., 0.19%, due 4/05/10 | | | 14,470,000 | | | 14,467,327 |
| Citigroup Funding, Inc., 0.25%, due 3/18/10 | | | 1,885,000 | | | 1,884,777 |
| HSBC USA, Inc., 0.15%, due 4/09/10 | | | 15,679,000 | | | 15,676,452 |
| Rabobank USA Financial Corp., 0.17%, due 4/21/10 | | | 14,721,000 | | | 14,717,455 |
| | | | | | |
| | | | | | $ | 63,225,348 |
| Pharmaceuticals - 4.0% | | | | | | |
| Abbot Laboratories, 0.11%, due 3/30/10 (t) | | $ | 1,613,000 | | $ | 1,612,857 |
| Abbot Laboratories, 0.11%, due 4/12/10 (t) | | | 20,100,000 | | | 20,097,421 |
| | | | | | |
| | | | | | $ | 21,710,278 |
| Tobacco - 2.0% | | | | | | |
| Philip Morris International, Inc., 0.25%, due 7/29/10 (t) | | $ | 10,930,000 | | $ | 10,918,615 |
| Total Commercial Paper, at Amortized Cost and Value | | | | | $ | 276,655,003 |
| |
| U.S. Government Agencies and Equivalents (y) - 12.3% | | | |
| Fannie Mae, 0.05%, due 3/01/10 | | $ | 15,451,000 | | $ | 15,451,000 |
| Fannie Mae, 0.145%, due 5/26/10 | | | 17,230,000 | | | 17,224,032 |
| Federal Home Loan Bank, 0.05%, due 3/08/10 | | | 188,000 | | | 187,998 |
| Federal Home Loan Bank, 0.145%, due 5/26/10 | | | 17,200,000 | | | 17,194,042 |
| Freddie Mac, 0.23%, due 9/01/10 | | | 16,200,000 | | | 16,180,956 |
Total U.S. Government Agencies and Equivalents,
at Amortized Cost and Value | | | | | $ | 66,238,028 |
7
Portfolio of investments (unaudited) – continued
| | | | | | | |
| Issuer | | Shares/Par | | Value ($) | |
| | | | | | | |
| Floating Rate Demand Notes - 3.0% | | | | | | | |
| Industrial Revenue - Other - 3.0% | | | | | | | |
East Baton Rouge, LA, Pollution Control Rev. (Exxon Mobil Corp.),
0.09%, due 3/01/10 | | $ | 9,700,000 | | $ | 9,700,000 | |
Lincoln County, WY, Pollution Control Rev. (Exxon Mobil Corp.),
0.09%, due 3/01/10 | | | 5,300,000 | | | 5,300,000 | |
Lincoln County, WY, Pollution Control Rev. (Exxon Mobil Corp.), “A”,
0.1%, due 3/01/10 | | | 1,300,000 | | | 1,300,000 | |
| Total Floating Rate Demand Notes, at Identified Cost | | | | | $ | 16,300,000 | |
| | |
| Repurchase Agreements - 20.0% | | | | | | | |
| Bank of America Corp., 0.11%, dated 2/26/10, due 3/1/10, total to be received $54,193,497 (secured by U.S. Treasury and Federal Agency obligations and Mortgage Backed securities valued at $55,276,925 in a jointly traded account) | | $ | 54,193,000 | | $ | 54,193,000 | |
| Morgan Stanley, 0.1%, dated 2/26/10, due 3/1/10, total to be received $54,193,452 (secured by U.S. Treasury and Federal Agency obligations and Mortgage Backed securities valued at $55,457,329 in a jointly traded account) | | | 54,193,000 | | | 54,193,000 | |
| Total Repurchase Agreements, at Cost and Value | | | | | $ | 108,386,000 | |
| Total Investments, at Amortized Cost and Value | | | | | $ | 542,069,031 | |
| | |
| Other Assets, Less Liabilities - (0.2)% | | | | | | (1,016,071 | ) |
| Net Assets - 100.0% | | | | | $ | 541,052,960 | |
| (t) | Security exempt from registration with the U.S. Securities and Exchange Commission under Section 4(2) of the Securities Act of 1933. |
| (y) | The rate shown represents an annualized yield at time of purchase. |
The following abbreviations are used in this report and are defined:
| PLC | | Public Limited Company |
See Notes to Financial Statements
8
Financial Statements
STATEMENT OF ASSETS AND LIABILITIES
At 2/28/10 (unaudited)
This statement represents your fund’s balance sheet, which details the assets and liabilities comprising the total value of the fund.
| | | |
| Assets | | | |
Investments, at amortized cost and value | | $433,683,031 | |
Repurchase agreements, at cost and value | | 108,386,000 | |
Total investments, at amortized cost and value | | $542,069,031 | |
Cash | | 877 | |
Receivables for | | | |
Fund shares sold | | 446,661 | |
Interest | | 262,903 | |
Receivable from investment adviser | | 63,613 | |
Other assets | | 6,268 | |
Total assets | | $542,849,353 | |
| Liabilities | | | |
Payable for fund shares reacquired | | $1,440,661 | |
Payable to affiliates | | | |
Shareholder servicing costs | | 267,851 | |
Administrative services fee | | 1,000 | |
Program manager fees | | 136 | |
Payable for independent Trustees’ compensation | | 24,268 | |
Accrued expenses and other liabilities | | 62,477 | |
Total liabilities | | $1,796,393 | |
Net assets | | $541,052,960 | |
| Net assets consist of | | | |
Paid-in capital | | $541,283,558 | |
Accumulated net realized gain (loss) on investments | | (207,598 | ) |
Accumulated distributions in excess of net investment income | | (23,000 | ) |
Net assets | | $541,052,960 | |
Shares of beneficial interest outstanding | | 541,283,160 | |
| | | | | | |
| | | Net assets | | Shares
outstanding | | Net asset value
per share |
Class A | | $155,915,324 | | 155,986,527 | | $1.00 |
Class B | | 80,659,084 | | 80,706,158 | | 1.00 |
Class C | | 52,579,633 | | 52,609,448 | | 1.00 |
Class R1 | | 28,247,006 | | 28,256,658 | | 1.00 |
Class R2 | | 111,370,035 | | 111,407,178 | | 1.00 |
Class R3 | | 94,192,568 | | 94,223,538 | | 1.00 |
Class R4 | | 5,613,433 | | 5,615,145 | | 1.00 |
Class 529A | | 6,677,458 | | 6,679,027 | | 1.00 |
Class 529B | | 1,860,736 | | 1,861,050 | | 1.00 |
Class 529C | | 3,937,683 | | 3,938,431 | | 1.00 |
A contingent deferred sales charge may be imposed on redemptions of Class A, Class B, Class C, Class 529B, and Class 529C shares. Redemption price per share was equal to the net asset value per share for Classes R1, R2, R3, R4, and 529A.
See Notes to Financial Statements
9
Financial Statements
STATEMENT OF OPERATIONS
Six months ended 2/28/10 (unaudited)
This statement describes how much your fund earned in investment income and accrued in expenses. It also describes any gains and/or losses generated by fund operations.
| | | |
| Net investment income | | | |
Interest income | | $710,374 | |
Expenses | | | |
Management fee | | $1,141,519 | |
Distribution and service fees | | 1,402,961 | |
Program manager fees | | 6,431 | |
Shareholder servicing costs | | 633,958 | |
Administrative services fee | | 47,327 | |
Independent Trustees’ compensation | | 12,799 | |
Custodian fee | | 57,272 | |
Shareholder communications | | 22,213 | |
Auditing fees | | 15,370 | |
Legal fees | | 9,229 | |
Miscellaneous | | 91,636 | |
Total expenses | | $3,440,715 | |
Fees paid indirectly | | (282 | ) |
Reduction of expenses by investment adviser and distributor | | (2,730,150 | ) |
Net expenses | | $710,283 | |
Net investment income | | $91 | |
Net realized gain (loss) on investment transactions | | $1,037 | |
Change in net assets from operations | | $1,128 | |
See Notes to Financial Statements
10
Financial Statements
STATEMENTS OF CHANGES IN NET ASSETS
These statements describe the increases and/or decreases in net assets resulting from operations, any distributions, and any shareholder transactions.
| | | | | | |
| Change in net assets | | Six Months Ended
2/28/10
(unaudited) | | | Year Ended
8/31/09 | |
| From operations | | | | | | |
Net investment income | | $91 | | | $1,268,542 | |
Net realized gain (loss) on investments | | 1,037 | | | (184,390 | ) |
Change in net assets from operations | | $1,128 | | | $1,084,152 | |
| Distributions declared to shareholders | | | | | | |
From net investment income | | $(23,091 | ) | | $(1,268,542 | ) |
Change in net assets from fund share transactions | | $(79,711,060 | ) | | $20,458,239 | |
Total change in net assets | | $(79,733,023 | ) | | $20,273,849 | |
| Net assets | | | | | | |
At beginning of period | | 620,785,983 | | | 600,512,134 | |
At end of period (including accumulated distributions in excess of net investment income of $23,000 and $0, respectively) | | $541,052,960 | | | $620,785,983 | |
See Notes to Financial Statements
11
Financial Statements
FINANCIAL HIGHLIGHTS
The financial highlights table is intended to help you understand the fund’s financial performance for the semiannual period and the past 5 fiscal years (or life of a particular share class, if shorter). Certain information reflects financial results for a single fund share. The total returns in the table represent the rate by which an investor would have earned (or lost) on an investment in the fund share class (assuming reinvestment of all distributions) held for the entire period.
| | | | | | | | | | | | | | | | | | |
| | | Six months
ended
2/28/10
(unaudited) | | | Years ended 8/31 | |
| Class A | | | 2009 | | | 2008 | | | 2007 | | | 2006 | | | 2005 | |
| | | | | | | | | | | | | | | | | |
Net asset value, beginning of period | | $1.00 | | | $1.00 | | | $1.00 | | | $1.00 | | | $1.00 | | | $1.00 | |
Income (loss) from
investment operations | | | | | | | | | | | | | | | | | | |
Net investment income (d) | | $0.00 | (w) | | $0.00 | (w) | | $0.03 | | | $0.05 | | | $0.04 | | | $0.02 | |
Net realized and unrealized gain (loss) on investments | | 0.00 | (w) | | (0.00 | )(w) | | — | | | (0.00 | )(w) | | (0.00 | )(w) | | — | |
Total from investment operations | | $0.00 | (w) | | $0.00 | (w) | | $0.03 | | | $0.05 | | | $0.04 | | | $0.02 | |
| Less distributions declared to shareholders | | | | | | | | | | | | | | | | | | |
From net investment income | | $(0.00 | )(w) | | $(0.00 | )(w) | | $(0.03 | ) | | $(0.05 | ) | | $(0.04 | ) | | $(0.02 | ) |
Net asset value, end of period | | $1.00 | | | $1.00 | | | $1.00 | | | $1.00 | | | $1.00 | | | $1.00 | |
Total return (%) (r)(s)(t) | | 0.00 | (n)(w) | | 0.31 | | | 3.43 | | | 5.06 | | | 4.19 | | | 2.11 | |
| Ratios (%) (to average net assets) and Supplemental data: | | | | | | | | | | | | | | | | | | |
Expenses before expense
reductions (f) | | 0.79 | (a) | | 0.72 | | | 0.87 | | | 0.83 | | | 0.89 | | | 0.90 | |
Expenses after expense
reductions (f) | | 0.25 | (a) | | 0.39 | | | 0.47 | | | 0.43 | | | 0.49 | | | 0.50 | |
Net investment income | | 0.00 | (a)(w) | | 0.33 | | | 3.29 | | | 4.94 | | | 4.14 | | | 2.10 | |
Net assets at end of period (000 omitted) | | $155,915 | | | $173,135 | | | $189,684 | | | $136,204 | | | $114,481 | | | $91,165 | |
See Notes to Financial Statements
12
Financial Highlights – continued
| | | | | | | | | | | | | | | | | | |
| | | Six months
ended
2/28/10
(unaudited) | | | Years ended 8/31 | |
| Class B | | | 2009 | | | 2008 | | | 2007 | | | 2006 | | | 2005 | |
| | | | | | | | | | | | | | | | | |
Net asset value, beginning of period | | $1.00 | | | $1.00 | | | $1.00 | | | $1.00 | | | $1.00 | | | $1.00 | |
| Income (loss) from investment operations | | | | | | | | | | | | | | | | | | |
Net investment income (d) | | $0.00 | | | $0.00 | (w) | | $0.02 | | | $0.04 | | | $0.03 | | | $0.01 | |
Net realized and unrealized gain (loss) on investments | | 0.00 | (w) | | (0.00 | )(w) | | — | | | (0.00 | )(w) | | (0.00 | )(w) | | — | |
Total from investment operations | | $0.00 | (w) | | $0.00 | (w) | | $0.02 | | | $0.04 | | | $0.03 | | | $0.01 | |
Less distributions declared to shareholders | | | | | | | | | | | | | | | | | | |
From net investment income | | $(0.00 | )(w) | | $(0.00 | )(w) | | $(0.02 | ) | | $(0.04 | ) | | $(0.03 | ) | | $(0.01 | ) |
Net asset value, end of period | | $1.00 | | | $1.00 | | | $1.00 | | | $1.00 | | | $1.00 | | | $1.00 | |
Total return (%) (r)(s)(t) | | 0.00 | (n)(w) | | 0.10 | | | 2.40 | | | 4.02 | | | 3.16 | | | 1.10 | |
| Ratios (%) (to average net assets) and Supplemental data: | | | | | | | | | | | | | | | | | | |
Expenses before expense
reductions (f) | | 1.71 | (a) | | 1.72 | | | 1.86 | | | 1.83 | | | 1.89 | | | 1.89 | |
Expenses after expense
reductions (f) | | 0.25 | (a) | | 0.60 | | | 1.46 | | | 1.43 | | | 1.49 | | | 1.49 | |
Net investment income | | 0.00 | (a) | | 0.08 | | | 2.44 | | | 3.94 | | | 3.09 | | | 1.03 | |
Net assets at end of period
(000 omitted) | | $80,659 | | | $104,696 | | | $112,707 | | | $154,176 | | | $222,661 | | | $280,361 | |
See Notes to Financial Statements
13
Financial Highlights – continued
| | | | | | | | | | | | | | | | | | |
| | | Six months
ended
2/28/10
(unaudited) | | | Years ended 8/31 | |
| Class C | | | 2009 | | | 2008 | | | 2007 | | | 2006 | | | 2005 | |
| | | | | | | | | | | | | | | | | |
Net asset value, beginning of period | | $1.00 | | | $1.00 | | | $1.00 | | | $1.00 | | | $1.00 | | | $1.00 | |
Income (loss) from
investment operations | | | | | | | | | | | | | | | | | | |
Net investment income (d) | | $0.00 | | | $ 0.00 | (w) | | $0.02 | | | $0.04 | | | $0.03 | | | $0.01 | |
Net realized and unrealized gain (loss) on investments | | 0.00 | (w) | | (0.00 | )(w) | | — | | | (0.00 | )(w) | | (0.00 | )(w) | | — | |
Total from investment operations | | $0.00 | (w) | | $0.00 | (w) | | $0.02 | | | $0.04 | | | $0.03 | | | $0.01 | |
Less distributions declared
to shareholders | | | | | | | | | | | | | | | | | | |
From net investment income | | $(0.00 | )(w) | | $(0.00 | )(w) | | $(0.02 | ) | | $(0.04 | ) | | $(0.03 | ) | | $(0.01 | ) |
Net asset value, end of period | | $1.00 | | | $1.00 | | | $1.00 | | | $1.00 | | | $1.00 | | | $1.00 | |
Total return (%) (r)(s)(t) | | 0.00 | (n)(w) | | 0.10 | | | 2.40 | | | 4.02 | | | 3.15 | | | 1.10 | |
| Ratios (%) (to average net assets) and Supplemental data: | | | | | | | | | | | | | | | | | | |
Expenses before expense
reductions (f) | | 1.71 | (a) | | 1.72 | | | 1.87 | | | 1.83 | | | 1.89 | | | 1.89 | |
Expenses after expense
reductions (f) | | 0.25 | (a) | | 0.60 | | | 1.47 | | | 1.43 | | | 1.49 | | | 1.49 | |
Net investment income | | 0.00 | (a) | | 0.08 | | | 2.18 | | | 3.94 | | | 3.14 | | | 1.03 | |
Net assets at end of period (000 omitted) | | $52,580 | | | $70,005 | | | $79,091 | | | $60,390 | | | $56,456 | | | $46,483 | |
See Notes to Financial Statements
14
Financial Highlights – continued
| | | | | | | | | | | | | | | | | | |
| | | Six months
ended
2/28/10
(unaudited) | | | Years ended 8/31 | |
| Class R1 | | | 2009 | | | 2008 | | | 2007 | | | 2006 | | | 2005 (i) | |
| | | | | | | | | | | | | | | | | |
Net asset value, beginning of period | | $1.00 | | | $1.00 | | | $1.00 | | | $1.00 | | | $1.00 | | | $1.00 | |
Income (loss) from
investment operations | | | | | | | | | | | | | | | | | | |
Net investment income (d) | | $0.00 | | | $0.00 | (w) | | $0.02 | | | $0.04 | | | $0.03 | | | $0.01 | |
Net realized and unrealized gain (loss) on investments | | 0.00 | (w) | | (0.00 | )(w) | | — | | | (0.00 | )(w) | | (0.00 | )(w) | | — | |
Total from investment operations | | $0.00 | (w) | | $0.00 | (w) | | $0.02 | | | $0.04 | | | $0.03 | | | $0.01 | |
Less distributions declared
to shareholders | | | | | | | | | | | | | | | | | | |
From net investment income | | $(0.00 | )(w) | | $(0.00 | )(w) | | $(0.02 | ) | | $(0.04 | ) | | $(0.03 | ) | | $(0.01 | ) |
Net asset value, end of period | | $1.00 | | | $1.00 | | | $1.00 | | | $1.00 | | | $1.00 | | | $1.00 | |
Total return (%) (r)(s) | | 0.00 | (n)(w) | | 0.10 | | | 2.35 | | | 3.91 | | | 3.04 | | | 0.59 | (n) |
| Ratios (%) (to average net assets) and Supplemental data: | | | | | | | | | | | | | | | | | | |
Expenses before expense
reductions (f) | | 1.71 | (a) | | 1.72 | | | 1.91 | | | 1.97 | | | 2.09 | | | 2.24 | (a) |
Expenses after expense
reductions (f) | | 0.25 | (a) | | 0.58 | | | 1.51 | | | 1.53 | | | 1.59 | | | 1.84 | (a) |
Net investment income | | 0.00 | (a) | | 0.09 | | | 2.10 | | | 3.82 | | | 3.15 | | | 1.52 | (a) |
Net assets at end of period
(000 omitted) | | $28,247 | | | $29,457 | | | $27,361 | | | $8,538 | | | $898 | | | $258 | |
See Notes to Financial Statements
15
Financial Highlights – continued
| | | | | | | | | | | | | | | | | | |
| | | Six months
ended
2/28/10 (unaudited) | | | Years ended 8/31 | |
| Class R2 | | | 2009 | | | 2008 | | | 2007 | | | 2006 | | | 2005 (i) | |
| | | | | | | | | | | | | | | | | |
Net asset value, beginning of period | | $1.00 | | | $1.00 | | | $1.00 | | | $1.00 | | | $1.00 | | | $1.00 | |
| Income (loss) from investment operations | | | | | | | | | | | | | | | | | | |
Net investment income (d) | | $0.00 | | | $0.00 | (w) | | $0.03 | | | $0.04 | | | $0.04 | | | $0.01 | |
Net realized and unrealized gain (loss) on investments | | 0.00 | (w) | | (0.00 | )(w) | | — | | | 0.00 | (w) | | (0.01 | ) | | — | |
Total from investment operations | | $0.00 | (w) | | $0.00 | (w) | | $0.03 | | | $0.04 | | | $0.03 | | | $0.01 | |
Less distributions declared
to shareholders | | | | | | | | | | | | | | | | | | |
From net investment income | | $(0.00 | )(w) | | $(0.00 | )(w) | | $(0.03 | ) | | $(0.04 | ) | | $(0.03 | ) | | $(0.01 | ) |
Net asset value, end of period | | $1.00 | | | $1.00 | | | $1.00 | | | $1.00 | | | $1.00 | | | $1.00 | |
Total return (%) (r)(s) | | 0.00 | (n)(w) | | 0.17 | | | 2.86 | | | 4.38 | | | 3.51 | | | 0.78 | (n) |
| Ratios (%) (to average net assets) and Supplemental data: | | | | | | | | | | | | | | | | | | |
Expenses before expense
reductions (f) | | 1.21 | (a) | | 1.22 | | | 1.41 | | | 1.52 | | | 1.63 | | | 1.83 | (a) |
Expenses after expense
reductions (f) | | 0.25 | (a) | | 0.51 | | | 1.01 | | | 1.09 | | | 1.13 | | | 1.43 | (a) |
Net investment income | | 0.00 | (a) | | 0.15 | | | 2.58 | | | 4.28 | | | 3.73 | | | 2.10 | (a) |
Net assets at end of period
(000 omitted) | | $111,370 | | | $120,476 | | | $98,825 | | | $36,027 | | | $4,909 | | | $1,179 | |
See Notes to Financial Statements
16
Financial Highlights – continued
| | | | | | | | | | | | | | | | | | |
| | | Six months
ended
2/28/10
(unaudited) | | | Years ended 8/31 | |
| Class R3 | | | 2009 | | | 2008 | | | 2007 | | | 2006 | | | 2005 (i) | |
| | | | | | | | | | | | | | | | | |
Net asset value, beginning
of period | | $1.00 | | | $1.00 | | | $1.00 | | | $1.00 | | | $1.00 | | | $1.00 | |
| Income (loss) from investment operations | | | | | | | | | | | | | | | | | | |
Net investment income (d) | | $0.00 | | | $0.00 | (w) | | $0.03 | | | $0.05 | | | $0.04 | | | $0.01 | |
Net realized and unrealized gain (loss) on investments | | 0.00 | (w) | | (0.00 | )(w) | | — | | | (0.00 | )(w) | | (0.00 | )(w) | | — | |
Total from investment operations | | $0.00 | (w) | | $0.00 | (w) | | $0.03 | | | $0.05 | | | $0.04 | | | $0.01 | |
Less distributions declared
to shareholders | | | | | | | | | | | | | | | | | | |
From net investment income | | $(0.00 | )(w) | | $(0.00 | )(w) | | $(0.03 | ) | | $(0.05 | ) | | $(0.04 | ) | | $(0.01 | ) |
Net asset value, end of period | | $1.00 | | | $1.00 | | | $1.00 | | | $1.00 | | | $1.00 | | | $1.00 | |
Total return (%) (r)(s) | | 0.00 | (n)(w) | | 0.23 | | | 3.12 | | | 4.63 | | | 3.77 | | | 0.93 | (n) |
| Ratios (%) (to average net assets) and Supplemental data: | | | | | | | | | | | | | | | | | | |
Expenses before expense
reductions (f) | | 0.96 | (a) | | 0.97 | | | 1.15 | | | 1.23 | | | 1.28 | | | 1.38 | (a) |
Expenses after expense
reductions (f) | | 0.25 | (a) | | 0.45 | | | 0.75 | | | 0.83 | | | 0.88 | | | 0.98 | (a) |
Net investment income | | 0.00 | (a) | | 0.20 | | | 2.82 | | | 4.53 | | | 4.06 | | | 2.21 | (a) |
Net assets at end of period
(000 omitted) | | $94,193 | | | $104,062 | | | $82,454 | | | $32,545 | | | $1,019 | | | $51 | |
See Notes to Financial Statements
17
Financial Highlights – continued
| | | | | | | | | | | | | | | | | | |
| | | Six months
ended
2/28/10
(unaudited) | | | Years ended 8/31 | |
| Class R4 | | | 2009 | | | 2008 | | | 2007 | | | 2006 | | | 2005 (i) | |
| | | | | | | | | | | | | | | | | |
Net asset value, beginning
of period | | $1.00 | | | $1.00 | | | $1.00 | | | $1.00 | | | $1.00 | | | $1.00 | |
Income (loss) from
investment operations | | | | | | | | | | | | | | | | | | |
Net investment income (d) | | $0.00 | (w) | | $0.00 | (w) | | $0.03 | | | $0.05 | | | $0.04 | | | $0.01 | |
Net realized and unrealized gain (loss) on investments | | 0.00 | (w) | | (0.00 | )(w) | | — | | | (0.00 | )(w) | | (0.00 | )(w) | | — | |
Total from investment operations | | $0.00 | (w) | | $0.00 | (w) | | $0.03 | | | $0.05 | | | $0.04 | | | $0.01 | |
Less distributions declared
to shareholders | | | | | | | | | | | | | | | | | | |
From net investment income | | $(0.00 | )(w) | | $(0.00 | )(w) | | $(0.03 | ) | | $(0.05 | ) | | $(0.04 | ) | | $(0.01 | ) |
Net asset value, end of period | | $1.00 | | | $1.00 | | | $1.00 | | | $1.00 | | | $1.00 | | | $1.00 | |
Total return (%) (r)(s) | | 0.00 | (n)(w) | | 0.31 | | | 3.39 | | | 4.96 | | | 4.09 | | | 1.06 | (n) |
Ratios (%) (to average net
assets) and Supplemental data: | | | | | | | | | | | | | | | | | | |
Expenses before expense
reductions (f) | | 0.71 | (a) | | 0.72 | | | 0.90 | | | 0.93 | | | 0.99 | | | 1.08 | (a) |
Expenses after expense
reductions (f) | | 0.25 | (a) | | 0.38 | | | 0.50 | | | 0.53 | | | 0.59 | | | 0.68 | (a) |
Net investment income | | 0.00 | (a)(w) | | 0.23 | | | 3.24 | | | 4.80 | | | 4.03 | | | 2.51 | (a) |
Net assets at end of period
(000 omitted) | | $5,613 | | | $5,697 | | | $4,094 | | | $3,717 | | | $53 | | | $51 | |
See Notes to Financial Statements
18
Financial Highlights – continued
| | | | | | | | | | | | | | | | | | |
| | | Six months
ended
2/28/10 (unaudited) | | | Years ended 8/31 | |
| Class 529A | | | 2009 | | | 2008 | | | 2007 | | | 2006 | | | 2005 | |
| | | | | | | | | | | | | | | | | |
Net asset value, beginning of period | | $1.00 | | | $1.00 | | | $1.00 | | | $1.00 | | | $1.00 | | | $1.00 | |
| Income (loss) from investment operations | | | | | | | | | | | | | | | | | | |
Net investment income (d) | | $0.00 | | | $0.00 | (w) | | $0.03 | | | $0.05 | | | $0.04 | | | $0.02 | |
Net realized and unrealized gain (loss) on investments | | 0.00 | (w) | | (0.00 | )(w) | | — | | | (0.00 | )(w) | | (0.00 | )(w) | | — | |
Total from investment operations | | $0.00 | (w) | | $0.00 | (w) | | $0.03 | | | $0.05 | | | $0.04 | | | $0.02 | |
Less distributions declared
to shareholders | | | | | | | | | | | | | | | | | | |
From net investment income | | $(0.00 | )(w) | | $(0.00 | )(w) | | $(0.03 | ) | | $(0.05 | ) | | $(0.04 | ) | | $(0.02 | ) |
Net asset value, end of period | | $1.00 | | | $1.00 | | | $1.00 | | | $1.00 | | | $1.00 | | | $1.00 | |
Total return (%) (r)(s) | | 0.00 | (n)(w) | | 0.28 | | | 3.23 | | | 4.80 | | | 3.93 | | | 1.86 | |
| Ratios (%) (to average net assets) and Supplemental data: | | | | | | | | | | | | | | | | | | |
Expenses before expense
reductions (f) | | 1.06 | (a) | | 1.12 | | | 1.40 | | | 1.44 | | | 1.49 | | | 1.50 | |
Expenses after expense
reductions (f) | | 0.25 | (a) | | 0.40 | | | 0.65 | | | 0.68 | | | 0.74 | | | 0.75 | |
Net investment income | | 0.00 | (a) | | 0.19 | | | 3.05 | | | 4.69 | | | 3.92 | | | 1.93 | |
Net assets at end of period
(000 omitted) | | $6,677 | | | $6,926 | | | $3,777 | | | $2,548 | | | $2,135 | | | $1,650 | |
See Notes to Financial Statements
19
Financial Highlights – continued
| | | | | | | | | | | | | | | | | | |
| | | Six months
ended
2/28/10 (unaudited) | | | Years ended 8/31 | |
| Class 529B | | | 2009 | | | 2008 | | | 2007 | | | 2006 | | | 2005 | |
| | | | | | | | | | | | | | | | | |
Net asset value, beginning
of period | | $1.00 | | | $1.00 | | | $1.00 | | | $1.00 | | | $1.00 | | | $1.00 | |
| Income (loss) from investment operations | | | | | | | | | | | | | | | | | | |
Net investment income (d) | | $0.00 | | | $0.00 | (w) | | $0.02 | | | $0.04 | | | $0.03 | | | $0.01 | |
Net realized and unrealized gain (loss) on investments | | 0.00 | (w) | | (0.00 | )(w) | | — | | | (0.00 | )(w) | | (0.00 | )(w) | | — | |
Total from investment operations | | $0.00 | (w) | | $0.00 | (w) | | $0.02 | | | $0.04 | | | $0.03 | | | $0.01 | |
Less distributions declared
to shareholders | | | | | | | | | | | | | | | | | | |
From net investment income | | $(0.00 | )(w) | | $(0.00 | )(w) | | $(0.02 | ) | | $(0.04 | ) | | $(0.03 | ) | | $(0.01 | ) |
Net asset value, end of period | | $1.00 | | | $1.00 | | | $1.00 | | | $1.00 | | | $1.00 | | | $1.00 | |
Total return (%) (r)(s)(t) | | 0.00 | (n)(w) | | 0.08 | | | 2.21 | | | 3.77 | | | 2.90 | | | 0.87 | |
| Ratios (%) (to average net assets) and Supplemental data: | | | | | | | | | | | | | | | | | | |
Expenses before expense
reductions (f) | | 1.81 | (a) | | 1.83 | | | 2.04 | | | 2.09 | | | 2.14 | | | 2.13 | |
Expenses after expense
reductions (f) | | 0.25 | (a) | | 0.51 | | | 1.64 | | | 1.69 | | | 1.74 | | | 1.73 | |
Net investment income | | 0.00 | (a) | | 0.04 | | | 1.91 | | | 3.69 | | | 2.88 | | | 0.87 | |
Net assets at end of period
(000 omitted) | | $1,861 | | | $1,942 | | | $700 | | | $328 | | | $297 | | | $340 | |
See Notes to Financial Statements
20
Financial Statements – continued
| | | | | | | | | | | | | | | | | | |
| | | Six months
ended
2/28/10 (unaudited) | | | Years ended 8/31 | |
| Class 529C | | | 2009 | | | 2008 | | | 2007 | | | 2006 | | | 2005 | |
| | | | | | | | | | | | | | | | | |
Net asset value, beginning
of period | | $1.00 | | | $1.00 | | | $1.00 | | | $1.00 | | | $1.00 | | | $1.00 | |
Income (loss) from
investment operations | | | | | | | | | | | | | | | | | | |
Net investment income (d) | | $0.00 | | | $0.00 | (w) | | $0.02 | | | $0.04 | | | $0.03 | | | $0.01 | |
Net realized and unrealized gain (loss) on investments | | 0.00 | (w) | | (0.00 | )(w) | | — | | | (0.00 | )(w) | | (0.00 | )(w) | | — | |
Total from investment operations | | $0.00 | (w) | | $0.00 | (w) | | $0.02 | | | $0.04 | | | $0.03 | | | $0.01 | |
Less distributions declared
to shareholders | | | | | | | | | | | | | | | | | | |
From net investment income | | $(0.00 | )(w) | | $(0.00 | )(w) | | $(0.02 | ) | | $(0.04 | ) | | $(0.03 | ) | | $(0.01 | ) |
Net asset value, end of period | | $1.00 | | | $1.00 | | | $1.00 | | | $1.00 | | | $1.00 | | | $1.00 | |
Total return (%) (r)(s)(t) | | 0.00 | (n)(w) | | 0.08 | | | 2.21 | | | 3.76 | | | 2.90 | | | 0.87 | |
| Ratios (%) (to average net assets) and Supplemental data: | | | | | | | | | | | | | | | | | | |
Expenses before expense
reductions (f) | | 1.81 | (a) | | 1.83 | | | 2.04 | | | 2.09 | | | 2.14 | | | 2.13 | |
Expenses after expense
reductions (f) | | 0.25 | (a) | | 0.52 | | | 1.64 | | | 1.68 | | | 1.74 | | | 1.73 | |
Net investment income | | 0.00 | (a) | | 0.04 | | | 1.85 | | | 3.69 | | | 2.89 | | | 0.85 | |
Net assets at end of period
(000 omitted) | | $3,938 | | | $4,391 | | | $1,820 | | | $814 | | | $688 | | | $611 | |
| (d) | Per share data is based on average shares outstanding. |
| (f) | Ratios do not reflect reductions from fees paid indirectly, if applicable. |
| (i) | For the period from the class’ inception, April 1, 2005 (Classes R1, R2, R3, and R4) and through the stated period end. |
| (r) | Certain expenses have been reduced without which performance would have been lower. |
| (s) | From time to time the fund may receive proceeds from litigation settlements, without which performance would be lower. |
| (t) | Total returns do not include any applicable sales charges. |
| (w) | Per share amount was less than $0.01 and 0.01%, respectively. |
See Notes to Financial Statements
21
NOTES TO FINANCIAL STATEMENTS
(unaudited)
| (1) | | Business and Organization |
MFS Cash Reserve Fund (the fund) is a series of MFS Series Trust I (the trust). The trust is organized as a Massachusetts business trust and is registered under the Investment Company Act of 1940, as amended, as an open-end management investment company.
| (2) | | Significant Accounting Policies |
General – The preparation of financial statements in conformity with U.S. generally accepted accounting principles requires management to make estimates and assumptions that affect the reported amounts of assets and liabilities, and disclosure of contingent assets and liabilities at the date of the financial statements and the reported amounts of revenues and expenses during the reporting period. Actual results could differ from those estimates. In the preparation of these financial statements, management has evaluated subsequent events occurring after the date of the fund’s Statement of Assets and Liabilities through the date that the financial statements were issued.
Investment Valuations – Pursuant to procedures approved by the Board of Trustees, investments held by the fund are generally valued at amortized cost, which approximates market value. Amortized cost involves valuing an instrument at its cost as adjusted for amortization of premium or accretion of discount rather than its current market value. The amortized cost value of an instrument can be different from the market value of an instrument.
Various inputs are used in determining the value of the fund’s assets or liabilities. These inputs are categorized into three broad levels. In certain cases, the inputs used to measure fair value may fall into different levels of the fair value hierarchy. In such cases, an investment’s level within the fair value hierarchy is based on the lowest level of input that is significant to the fair value measurement. The fund’s assessment of the significance of a particular input to the fair value measurement in its entirety requires judgment, and considers factors specific to the investment. Level 1 includes unadjusted quoted prices in active markets for identical assets or liabilities. Level 2 includes other significant observable market-based inputs (including quoted prices for similar securities, interest rates, prepayment speed, and credit risk). Level 3 includes unobservable inputs, which may include the adviser’s own assumptions in determining the fair value of investments. Other financial instruments are derivative instruments not reflected in total investments, such as futures, forwards, swap contracts, and written options. The following is a summary of the levels used as of February 28, 2010 in valuing the fund’s assets or liabilities:
| | | | | | | | |
| Investments at Value | | Level 1 | | Level 2 | | Level 3 | | Total |
| Short Term Securities | | $— | | $542,069,031 | | $— | | $542,069,031 |
22
Notes to Financial Statements (unaudited) – continued
For further information regarding security characteristics, see the Portfolio of Investments.
In January 2010, Accounting Standards Update (ASU) No. 2010-06, Improving Disclosures about Fair Value Measurements (the “Update”) was issued, and is effective for interim and annual reporting periods beginning after December 15, 2009. This Update provides for expanded disclosures about fair value measurements. Management has evaluated the application of the Update to the fund, and believes the impact is limited to expanded disclosures resulting from the adoption of this Update in the fund’s financial statements.
Repurchase Agreements – The fund may enter into repurchase agreements with approved counterparties. Each repurchase agreement is recorded at cost. The fund requires that the securities collateral in a repurchase transaction be transferred to a custodian. The fund monitors, on a daily basis, the value of the collateral to ensure that its value, including accrued interest, is greater than amounts owed to the fund under each such repurchase agreement. The fund and other funds managed by MFS may utilize a joint trading account for the purpose of entering into one or more repurchase agreements.
Indemnifications – Under the fund’s organizational documents, its officers and Trustees may be indemnified against certain liabilities and expenses arising out of the performance of their duties to the fund. Additionally, in the normal course of business, the fund enters into agreements with service providers that may contain indemnification clauses. The fund’s maximum exposure under these agreements is unknown as this would involve future claims that may be made against the fund that have not yet occurred.
Investment Transactions and Income – Investment transactions are recorded on the trade date. Interest income is recorded on the accrual basis. All premium and discount is amortized or accreted for financial statement purposes in accordance with U.S. generally accepted accounting principles. The fund may receive proceeds from litigation settlements. Any proceeds received from litigation involving portfolio holdings are reflected in the Statement of Operations in realized gain/loss if the security has been disposed of by the fund or in unrealized gain/loss if the security is still held by the fund. Any other proceeds from litigation not related to portfolio holdings are reflected as other income in the Statement of Operations.
Fees Paid Indirectly – The fund’s custody fee may be reduced according to an arrangement that measures the value of cash deposited with the custodian by the fund. This amount, for the six months ended February 28, 2010, is shown as a reduction of total expenses on the Statement of Operations.
Tax Matters and Distributions – The fund intends to qualify as a regulated investment company, as defined under Subchapter M of the Internal Revenue
23
Notes to Financial Statements (unaudited) – continued
Code, and to distribute all of its taxable income, including realized capital gains. As a result, no provision for federal income tax is required. The fund’s federal tax returns for the prior three fiscal years remain subject to examination by the Internal Revenue Service. Foreign taxes, if any, have been accrued by the fund in the accompanying financial statements.
Distributions to shareholders are recorded on the ex-dividend date. Income and capital gain distributions are determined in accordance with income tax regulations, which may differ from U.S. generally accepted accounting principles. Certain capital accounts in the financial statements are periodically adjusted for permanent differences in order to reflect their tax character. These adjustments have no impact on net assets or net asset value per share. Temporary differences which arise from recognizing certain items of income, expense, gain or loss in different periods for financial statement and tax purposes will reverse at some time in the future. Distributions in excess of net investment income or net realized gains are temporary overdistributions for financial statement purposes resulting from differences in the recognition or classification of income, expenses, or distributions for financial statement and tax purposes.
During the year ended August 31, 2009, there were no significant adjustments due to differences between book and tax accounting.
The tax character of distributions made during the current period will be determined at fiscal year end. The tax character of distributions declared to shareholders for the last fiscal year is as follows:
| | |
| | | 8/31/09 |
Ordinary income (including any
short-term capital gains) | | $1,268,542 |
The federal tax cost and the tax basis components of distributable earnings were as follows:
| | | |
| As of 2/28/10 | | | |
| Cost of investments | | $542,069,031 | |
| |
| As of 8/31/09 | | | |
| Undistributed ordinary income | | $22,689 | |
| Capital loss carryforwards | | (208,635 | ) |
| Other temporary differences | | (22,689 | ) |
The aggregate cost above includes prior fiscal year end tax adjustments, if any.
24
Notes to Financial Statements (unaudited) – continued
As of August 31, 2009, the fund had capital loss carryforwards available to offset future realized gains. Such losses expire as follows:
| | | |
| 8/31/12 | | $(441 | ) |
| 8/31/13 | | (4 | ) |
| 8/31/15 | | (811 | ) |
| 8/31/16 | | (22,989 | ) |
| 8/31/17 | | (184,390 | ) |
| Total | | $(208,635 | ) |
Multiple Classes of Shares of Beneficial Interest – The fund offers multiple classes of shares, which differ in their respective distribution, service, and program manager fees. The fund’s income and common expenses are allocated to shareholders based on the value of settled shares outstanding of each class. The fund’s realized and unrealized gain (loss) are allocated to shareholders based on the daily net assets of each class. Dividends are declared separately for each class. Differences in per share dividend rates are generally due to differences in separate class expenses. Class B and Class 529B shares will convert to Class A and Class 529A shares, respectively, approximately eight years after purchase. The fund’s distributions declared to shareholders as reported on the Statements of Changes in Net Assets are presented by class as follows:
| | | | |
| | | From net investment
income |
| | | Six months ended
2/28/10 | | Year ended
8/31/09 |
| Class A | | $6,632 | | $632,992 |
| Class B | | 3,718 | | 111,198 |
| Class C | | 2,372 | | 78,898 |
| Class R1 | | 1,181 | | 25,840 |
| Class R2 | | 4,471 | | 182,897 |
| Class R3 | | 3,951 | | 207,009 |
| Class R4 | | 228 | | 15,469 |
| Class 529A | | 288 | | 12,012 |
| Class 529B | | 83 | | 621 |
| Class 529C | | 167 | | 1,606 |
| Total | | $23,091 | | $1,268,542 |
| (3) | | Transactions with Affiliates |
Investment Adviser – The fund has an investment advisory agreement with MFS to provide overall investment management and related administrative services and facilities to the fund.
The management fee is computed daily and paid monthly at an annual rate of 0.40% of the fund’s average daily net assets.
25
Notes to Financial Statements (unaudited) – continued
During the six months ended February 28, 2010, MFS voluntarily waived receipt of $1,141,519 of the fund’s management fee in order to avoid a negative yield. This amount is reflected as a reduction of total expenses in the Statement of Operations. The management fee incurred for the six months ended February 28, 2010, was equivalent to an annual effective rate of 0.00% of the fund’s average daily net assets.
To avoid a negative yield for the six months ended February 28, 2010, MFS voluntarily agreed to reduce certain other fund expenses in the amount of $178,059, which is shown as a reduction of total expenses in the Statement of Operations.
Distributor – The Board of Trustees has adopted a distribution plan for certain class shares pursuant to Rule 12b-1 of the Investment Company Act of 1940.
The fund’s distribution plan provides that the fund will pay MFS Fund Distributors, Inc. (MFD), for services provided by MFD and financial intermediaries in connection with the distribution and servicing of certain share classes. One component of the plan is a distribution fee paid to MFD and another component of the plan is a service fee paid to MFD. MFD may subsequently pay all, or a portion, of the distribution and/or service fees to financial intermediaries.
Distribution Plan Fee Table:
| | | | | | | | | | |
| | | Distribution
Fee Rate (d) | | Service
Fee Rate (d) | | Total
Distribution
Plan (d) | | Annual
Effective
Rate (e) | | Distribution
and Service
Fee |
| Class A | | — | | 0.25% | | 0.25% | | 0.00% | | $63,426 |
| Class B | | 0.75% | | 0.25% | | 1.00% | | 0.00% | | 457,397 |
| Class C | | 0.75% | | 0.25% | | 1.00% | | 0.00% | | 296,221 |
| Class R1 | | 0.75% | | 0.25% | | 1.00% | | 0.00% | | 142,628 |
| Class R2 | | 0.25% | | 0.25% | | 0.50% | | 0.00% | | 281,625 |
| Class R3 | | — | | 0.25% | | 0.25% | | 0.00% | | 122,795 |
| Class 529A | | — | | 0.25% | | 0.25% | | 0.00% | | 8,479 |
| Class 529B | | 0.75% | | 0.25% | | 1.00% | | 0.00% | | 9,789 |
| Class 529C | | 0.75% | | 0.25% | | 1.00% | | 0.00% | | 20,601 |
| Total Distribution and Service Fees | | | | | | | | $1,402,961 |
| (d) | In accordance with the distribution plan for certain classes, the fund pays distribution and/or service fees equal to these annual percentage rates of each class’ average daily net assets. The distribution and service fee rates disclosed by class represent the current rates in effect at the end of the reporting period. Any rate changes, if applicable, are detailed below. |
| (e) | The annual effective rates represent actual fees incurred under the distribution plan for the six months ended February 28, 2010 based on each class’ average daily net assets. Effective January 1, 2010, the service fee rate for Class A is 0.25%. MFD has agreed in writing to reduce the Class A service fee rate to 0.00%. This written agreement will continue until modified by the fund’s Board of Trustees, but such agreement will continue until at least December 31, 2010. This reduction amounted to $63,426 which is shown as a reduction of total expenses in the Statements of Operations. Prior to January 1, 2010, payment of the 0.25% annual Class A service fee was not in effect. 0.25% of the Class 529A service fee |
26
Notes to Financial Statements (unaudited) – continued
| | is currently being waived until modified by the fund’s Board of Trustees, but this waiver will remain in effect at least until December 31, 2010. For the six months ended February 28, 2010, this waiver amounted to $8,479 and is reflected as a reduction of total expenses in the Statement of Operations. During the six months ended February 28, 2010, MFD voluntarily waived receipt of $1,331,056 of the fund’s distribution and service fees in order to avoid a negative yield for Class B, Class C, Class R1, Class R2, Class R3, Class 529B, and Class 529C shares. This amount is reflected as a reduction of total expenses in the Statement of Operations. |
Certain Class A shares acquired through an exchange may be subject to a contingent deferred sales charge (CDSC) upon redemption depending on when the shares exchanged were originally purchased. Class C and Class 529C shares are subject to a CDSC in the event of a shareholder redemption within 12 months of purchase. Class B and Class 529B shares are subject to a CDSC in the event of a shareholder redemption within six years of purchase. All contingent deferred sales charges are paid to MFD and during the six months ended February 28, 2010, were as follows:
| | |
| | | Amount |
| Class A | | $— |
| Class B | | 172,151 |
| Class C | | 6,297 |
| Class 529B | | 1,076 |
| Class 529C | | — |
The fund has entered into and may from time to time enter into contracts with program managers and other parties which administer the tuition programs through which an investment in the fund’s 529 share classes is made. The fund has entered into an agreement with MFD pursuant to which MFD receives an annual fee of up to 0.10% of the average daily net assets attributable to each 529 share class. During the six months ended February 28, 2010 MFD voluntarily waived receipt of $6,431 of the fund’s program manager fees, in order to avoid a negative yield for Class 529A, Class 529B, and Class 529C shares. This amount is reflected as a reduction of total expenses in the Statement of Operations. The program manager fees incurred for the six months ended February 28, 2010 were equivalent to an annual effective rate of 0.00% of average daily net assets for Class 529A, Class 529B, and Class 529C shares. The services provided by MFD, or a third party with which MFD contracts, include recordkeeping and tax reporting and account services, as well as services designed to maintain the program’s compliance with the Internal Revenue Code and other regulatory requirements. Program manager fees for the six months ended February 28, 2010, were as follows:
| | |
| | | Amount |
| Class 529A | | $3,392 |
| Class 529B | | 979 |
| Class 529C | | 2,060 |
| Total Program Manager Fees | | $6,431 |
27
Notes to Financial Statements (unaudited) – continued
Shareholder Servicing Agent – MFS Service Center, Inc. (MFSC), a wholly-owned subsidiary of MFS, receives a fee from the fund for its services as shareholder servicing agent calculated as a percentage of the average daily net assets of the fund as determined periodically under the supervision of the fund’s Board of Trustees. For the six months ended February 28, 2010, the fee was $181,377, which equated to 0.0636% annually of the fund’s average daily net assets. MFSC also receives payment from the fund for out-of-pocket expenses, sub-accounting and other shareholder servicing costs which may be paid to affiliated and unaffiliated service providers. For the six months ended February 28, 2010, these out-of-pocket expenses, sub-accounting and other shareholder servicing costs amounted to $452,581.
Administrator – MFS provides certain financial, legal, shareholder communications, compliance, and other administrative services to the fund. Under an administrative services agreement, the fund partially reimburses MFS the costs incurred to provide these services. The fund is charged an annual fixed amount of $17,500 plus a fee based on average daily net assets. The administrative services fee incurred for the six months ended February 28, 2010 was equivalent to an annual effective rate of 0.0166% of the fund’s average daily net assets.
Trustees’ and Officers’ Compensation – The fund pays compensation to independent Trustees in the form of a retainer, attendance fees, and additional compensation to Board and Committee chairpersons. The fund does not pay compensation directly to Trustees or officers of the fund who are also officers of the investment adviser, all of whom receive remuneration for their services to the fund from MFS. Certain officers and Trustees of the fund are officers or directors of MFS, MFD, and MFSC.
Prior to December 31, 2001, the fund had an unfunded defined benefit plan (“DB plan”) for independent Trustees. As of December 31, 2001, the Board took action to terminate the DB plan with respect to then-current and any future independent Trustees, such that the DB Plan covers only certain of those former independent Trustees who retired on or before December 31, 2001. The DB Plan resulted in a pension expense of $1,167 and is included in independent Trustees’ compensation for the six months ended February 28, 2010. The liability for deferred retirement benefits payable to certain independent Trustees under the DB plan amounted to $21,387 at February 28, 2010, and is included in payable for independent Trustees’ compensation on the Statement of Assets and Liabilities.
Other – This fund and certain other funds managed by MFS (the funds) have entered into services agreements (the Agreements) which provide for payment of fees by the funds to Tarantino LLC and Griffin Compliance LLC in return for the provision of services of an Independent Chief Compliance Officer (ICCO)
28
Notes to Financial Statements (unaudited) – continued
and Assistant ICCO, respectively, for the funds. The ICCO and Assistant ICCO are officers of the funds and the sole members of Tarantino LLC and Griffin Compliance LLC, respectively. The funds can terminate the Agreements with Tarantino LLC and Griffin Compliance LLC at any time under the terms of the Agreements. For the six months ended February 28, 2010, the aggregate fees paid by the fund to Tarantino LLC and Griffin Compliance LLC were $3,944 and are included in miscellaneous expense on the Statement of Operations. MFS has agreed to reimburse the fund for a portion of the payments made by the fund in the amount of $1,180, which is shown as a reduction of total expenses in the Statement of Operations. Additionally, MFS has agreed to bear all expenses associated with office space, other administrative support, and supplies provided to the ICCO and Assistant ICCO.
Purchases and sales of money market securities, exclusive of securities subject to repurchase agreements, aggregated $5,594,455,544 and $5,630,612,682, respectively.
| (5) | | Shares of Beneficial Interest |
The fund’s Declaration of Trust permits the Trustees to issue an unlimited number of full and fractional shares of beneficial interest. Transactions in fund shares were as follows:
| | | | | | | | |
| | | Six months ended
2/28/10 | | Year ended
8/31/09 |
| | | Shares | | Amount | | Shares | | Amount |
| Shares sold | | | | | | | | |
Class A | | 40,562,682 | | $40,562,691 | | 161,730,623 | | $161,730,659 |
Class B | | 17,707,206 | | 17,707,206 | | 138,214,631 | | 138,214,631 |
Class C | | 11,895,540 | | 11,895,540 | | 96,716,541 | | 96,716,541 |
Class R1 | | 8,740,726 | | 8,740,726 | | 26,331,930 | | 26,331,930 |
Class R2 | | 29,334,078 | | 29,334,078 | | 112,067,569 | | 112,067,569 |
Class R3 | | 25,501,767 | | 25,501,767 | | 104,847,806 | | 104,847,806 |
Class R4 | | 2,553,099 | | 2,553,099 | | 9,795,915 | | 9,795,915 |
Class 529A | | 1,334,970 | | 1,334,970 | | 6,292,783 | | 6,292,783 |
Class 529B | | 273,049 | | 273,049 | | 1,777,078 | | 1,777,078 |
Class 529C | | 545,763 | | 545,763 | | 4,950,767 | | 4,950,767 |
| | 138,448,880 | | $138,448,889 | | 662,725,643 | | $662,725,679 |
29
Notes to Financial Statements (unaudited) – continued
| | | | | | | | | | | | |
| | | Six months ended
2/28/10 | | | Year ended
8/31/09 | |
| | | Shares | | | Amount | | | Shares | | | Amount | |
| Shares issued to shareholders in reinvestment of distributions | | | | | | | | | | | | |
Class A | | 6,175 | | | $6,175 | | | 595,074 | | | $595,074 | |
Class B | | 3,379 | | | 3,379 | | | 100,373 | | | 100,373 | |
Class C | | 2,155 | | | 2,155 | | | 75,102 | | | 75,102 | |
Class R1 | | 1,173 | | | 1,173 | | | 25,779 | | | 25,779 | |
Class R2 | | 4,413 | | | 4,413 | | | 181,340 | | | 181,340 | |
Class R3 | | 3,908 | | | 3,908 | | | 206,284 | | | 206,284 | |
Class R4 | | 228 | | | 228 | | | 15,425 | | | 15,425 | |
Class 529A | | 283 | | | 283 | | | 11,977 | | | 11,977 | |
Class 529B | | 83 | | | 83 | | | 615 | | | 615 | |
Class 529C | | 167 | | | 167 | | | 1,597 | | | 1,597 | |
| | 21,964 | | | $21,964 | | | 1,213,566 | | | $1,213,566 | |
| Shares reacquired | | | | | | | | | | | | |
Class A | | (57,781,843 | ) | | $(57,781,852 | ) | | (178,817,174 | ) | | $(178,817,175 | ) |
Class B | | (41,743,477 | ) | | (41,743,477 | ) | | (146,292,001 | ) | | (146,292,055 | ) |
Class C | | (29,320,676 | ) | | (29,320,676 | ) | | (105,852,969 | ) | | (105,852,969 | ) |
Class R1 | | (9,951,079 | ) | | (9,951,079 | ) | | (24,253,400 | ) | | (24,253,400 | ) |
Class R2 | | (38,440,226 | ) | | (38,440,226 | ) | | (90,566,134 | ) | | (90,566,134 | ) |
Class R3 | | (35,371,744 | ) | | (35,371,744 | ) | | (83,420,395 | ) | | (83,420,395 | ) |
Class R4 | | (2,636,226 | ) | | (2,636,226 | ) | | (8,207,762 | ) | | (8,207,762 | ) |
Class 529A | | (1,583,465 | ) | | (1,583,465 | ) | | (3,154,669 | ) | | (3,154,669 | ) |
Class 529B | | (354,201 | ) | | (354,201 | ) | | (535,728 | ) | | (535,729 | ) |
Class 529C | | (998,967 | ) | | (998,967 | ) | | (2,380,718 | ) | | (2,380,718 | ) |
| | (218,181,904 | ) | | $(218,181,913 | ) | | (643,480,950 | ) | | $(643,481,006 | ) |
| Net change | | | | | | | | | | | | |
Class A | | (17,212,986 | ) | | $(17,212,986 | ) | | (16,491,477 | ) | | $(16,491,442 | ) |
Class B | | (24,032,892 | ) | | (24,032,892 | ) | | (7,976,997 | ) | | (7,977,051 | ) |
Class C | | (17,422,981 | ) | | (17,422,981 | ) | | (9,061,326 | ) | | (9,061,326 | ) |
Class R1 | | (1,209,180 | ) | | (1,209,180 | ) | | 2,104,309 | | | 2,104,309 | |
Class R2 | | (9,101,735 | ) | | (9,101,735 | ) | | 21,682,775 | | | 21,682,775 | |
Class R3 | | (9,866,069 | ) | | (9,866,069 | ) | | 21,633,695 | | | 21,633,695 | |
Class R4 | | (82,899 | ) | | (82,899 | ) | | 1,603,578 | | | 1,603,578 | |
Class 529A | | (248,212 | ) | | (248,212 | ) | | 3,150,091 | | | 3,150,091 | |
Class 529B | | (81,069 | ) | | (81,069 | ) | | 1,241,965 | | | 1,241,964 | |
Class 529C | | (453,037 | ) | | (453,037 | ) | | 2,571,646 | | | 2,571,646 | |
| | (79,711,060 | ) | | $(79,711,060 | ) | | 20,458,259 | | | $20,458,239 | |
Effective at the close of business February 27, 2009, the sale of fund shares have been suspended except in certain circumstances. Please see the fund’s prospectus for details.
30
Notes to Financial Statements (unaudited) – continued
The fund and certain other funds managed by MFS participate in a $1.1 billion unsecured committed line of credit, subject to a $1 billion sublimit, provided by a syndication of banks under a credit agreement. Borrowings may be made for temporary financing needs. Interest is charged to each fund, based on its borrowings, generally at a rate equal to the higher of the Federal Reserve funds rate or one month LIBOR plus an agreed upon spread. A commitment fee, based on the average daily, unused portion of the committed line of credit, is allocated among the participating funds at the end of each calendar quarter. In addition, the fund and other funds managed by MFS have established unsecured uncommitted borrowing arrangements with certain banks for temporary financing needs. Interest is charged to each fund, based on its borrowings, at a rate equal to the Federal Reserve funds rate plus an agreed upon spread. For the six months ended February 28, 2010, the fund’s commitment fee and interest expense were $6,270 and $0, respectively, and are included in miscellaneous expense on the Statement of Operations.
31
RESULTS OF SHAREHOLDER MEETING
(unaudited)
At a special meeting of shareholders of MFS Series Trust I, which was held on January 28, 2010, the following actions were taken:
Item 1. To elect the following individuals as Trustees:
| | | | |
| | | Number of Dollars |
Nominee | | For | | Withheld Authority |
| Robert E. Butler | | 13,799,428,259.131 | | 298,698,895.701 |
| Lawrence H. Cohn | | 13,775,964,000.646 | | 322,163,154.185 |
| Maureen R. Goldfarb | | 13,797,667,920.487 | | 300,459,234.345 |
| David H. Gunning | | 13,795,139,579.854 | | 302,987,574.978 |
| William R. Gutow | | 13,798,125,706.624 | | 300,001,448.207 |
| Michael Hegarty | | 13,780,926,681.791 | | 317,200,473.041 |
| John P. Kavanaugh | | 13,799,879,923.291 | | 298,247,231.541 |
| Robert J. Manning | | 13,802,393,104.041 | | 295,734,050.791 |
| Robert C. Pozen | | 13,802,480,679.754 | | 295,646,475.078 |
| J. Dale Sherratt | | 13,779,899,981.473 | | 318,227,173.359 |
| Laurie J. Thomsen | | 13,797,678,786.081 | | 300,448,368.750 |
| Robert W. Uek | | 13,798,504,506.307 | | 299,622,648.525 |
32
BOARD REVIEW OF INVESTMENT ADVISORY AGREEMENT
A discussion regarding the Board’s most recent review and renewal of the fund’s Investment Advisory Agreement with MFS is available by clicking on the fund’s name under “Mutual Funds” in the “Products and Performance” section of the MFS Web site (mfs.com).
PROXY VOTING POLICIES AND INFORMATION
A general description of the MFS funds’ proxy voting policies and procedures is available without charge, upon request, by calling 1-800-225-2606, by visiting the Proxy Voting section of mfs.com or by visiting the SEC’s Web site at http://www.sec.gov.
Information regarding how the fund voted proxies relating to portfolio securities during the most recent twelve-month period ended June 30 is available without charge by visiting the Proxy Voting section of mfs.com or by visiting the SEC’s Web site at http://www.sec.gov.
QUARTERLY PORTFOLIO DISCLOSURE
The fund will file a complete schedule of portfolio holdings with the Securities and Exchange Commission (the Commission) for the first and third quarters of each fiscal year on Form N-Q. The fund’s Form N-Q may be reviewed and copied at the:
Public Reference Room
Securities and Exchange Commission
100 F Street, NE, Room 1580
Washington, D.C. 20549
Information on the operation of the Public Reference Room may be obtained by calling the Commission at 1-800-SEC-0330. The fund’s Form N-Q is available on the EDGAR database on the Commission’s Internet Web site at http://www.sec.gov, and copies of this information may be obtained, upon payment of a duplicating fee, by electronic request at the following e-mail address: publicinfo@sec.gov or by writing the Public Reference Section at the above address.
A shareholder can also obtain the quarterly portfolio holdings report at mfs.com.
FURTHER INFORMATION
From time to time, MFS may post important information about the fund or the MFS funds on the MFS web site (mfs.com). This information is available by visiting the “News & Commentary” section of mfs.com or by clicking on the fund’s name under “Mutual Funds” in the “Products and Performance” section of mfs.com.
33
CONTACT US
Web site
mfs.com
MFS TALK
1-800-637-8255
24 hours a day
Account service and literature
Shareholders
1-800-225-2606
Investment professionals
1-800-343-2829
Retirement plan services
1-800-637-1255
Mailing address
MFS Service Center, Inc.
P.O. Box 55824
Boston, MA 02205-5824
Overnight mail
MFS Service Center, Inc.
c/o Boston Financial Data Services
30 Dan Road
Canton, MA 02021-2809

Save paper with eDelivery. MFS® will send you prospectuses, reports, and proxies directly via e-mail so you will get information faster with less mailbox clutter. To sign up: 1. go to mfs.com. 2. log in via MFS® Access. 3. select eDelivery. If you own your MFS fund shares through a financial institution or a retirement plan, MFS® TALK, MFS Access, and eDelivery may not be available to you.


MFS® Core Equity Fund
The report is prepared for the general information of shareholders. It is authorized for distribution to prospective investors only when preceded or accompanied by a current prospectus.
NOT FDIC INSURED Ÿ MAY LOSE VALUE Ÿ
NO BANK GUARANTEE
2/28/10
RGI-SEM

LETTER FROM THE CEO
Dear Shareholders:
After having suffered their biggest declines since the Great Depression, most global markets experienced an impressive resurgence during the latter months of 2009 and the first quarter of 2010. The global economy was able to reap the benefits of two major trends. The first of these was the massive efforts of governments and central banks to increase liquidity in the financial system as they sought to prevent the credit crisis from further affecting the banking system. The second was the move by companies around the world to cut costs and operations to prepare for rapidly changing market conditions. We believe that these moves not only shortened the length of the downturn but also set the stage for the recovery we are seeing today.
Even with the significant market gains of 2009 and the early part of 2010, the recovery is unrolling at a moderate pace, with rebounds in the manufacturing sector and corporate America leading the way. Central bankers are proceeding with caution and have held benchmark interest rates unchanged as they debate the best way to withdraw stimulus measures without disrupting the fragile growth process.
While hurdles remain, we believe that the global economy is on the road to recovery. As always, we continue to be mindful of the many challenges faced at the individual, national, and international levels. It is at times such as these that we want to remind investors of the merits of maintaining a long-term view, adhering to basic investing principles such as asset allocation and diversification, and working closely with advisors to identify and research investment opportunities. At MFS®, we take particular pride in how well mutual funds can help investors by providing the diversification that is important in any type of market climate.
Respectfully,

Robert J. Manning
Chief Executive Officer and Chief Investment Officer
MFS Investment Management®
April 15, 2010
The opinions expressed in this letter are subject to change, may not be relied upon for investment advice, and no forecasts can be guaranteed.
1
PORTFOLIO COMPOSITION
Portfolio structure

| | |
| Top ten holdings | | |
| Johnson & Johnson | | 2.3% |
| Apple, Inc. | | 2.2% |
| Bank of America Corp. | | 2.1% |
| JPMorgan Chase & Co. | | 2.0% |
| Exxon Mobil Corp. | | 1.9% |
| Procter & Gamble Co. | | 1.8% |
| Abbott Laboratories | | 1.8% |
| Chevron Corp. | | 1.8% |
| Intel Corp. | | 1.7% |
| AT&T, Inc. | | 1.6% |
| | |
| Equity sectors | | |
| Technology | | 16.8% |
| Financial Services | | 15.5% |
| Health Care | | 13.1% |
| Energy | | 10.4% |
| Consumer Staples | | 8.0% |
| Retailing | | 7.9% |
| Utilities & Communications | | 7.0% |
| Industrial Goods & Services | | 6.6% |
| Basic Materials | | 4.2% |
| Leisure | | 3.7% |
| Transportation | | 2.8% |
| Special Products & Services | | 2.4% |
| Autos & Housing | | 0.6% |
Percentages are based on net assets as of 2/28/10.
The portfolio is actively managed and current holdings may be different.
2
MARKET ENVIRONMENT
After having suffered through one of the largest and most concentrated downturns since the 1930s, most asset markets staged a remarkable rebound during 2009. This recovery in global activity, which covers this reporting period, has been led importantly by emerging Asian economies, but broadening to include most of the global economy to varying degrees. Primary drivers of the recovery included an unwinding of the inventory destocking that took place earlier, as well as massive fiscal and monetary stimulus.
During the worst of the credit crisis, policy makers globally loosened monetary and fiscal policy on a massive scale. Having reached their lower bound on policy rates prior to the beginning of the reporting period, several central banks were implementing quantitative easing as a means to further loosen monetary policy to offset the continuing fall in global economic activity. However, by the beginning of the period, there were ever-broadening signs that the global macroeconomic deterioration had passed, which caused the subsequent rise in asset valuations. As most asset prices rebounded during the period and the demand for liquidity waned, the debate concerning the existence of asset bubbles and the need for monetary exit strategies had begun, creating added uncertainty regarding the forward path of policy rates. This changing dynamic caused asset valuations to move broadly sideways during the latter part of the period.
3
EXPENSE TABLE
Fund expenses borne by the shareholders during the period, September 1, 2009 through February 28, 2010
As a shareholder of the fund, you incur two types of costs: (1) transaction costs, including sales charges (loads) on certain purchase or redemption payments, and (2) ongoing costs, including management fees; distribution and service (12b-1) fees; and other fund expenses. This example is intended to help you understand your ongoing costs (in dollars) of investing in the fund and to compare these costs with the ongoing costs of investing in other mutual funds.
The example is based on an investment of $1,000 invested at the beginning of the period and held for the entire period September 1, 2009 through February 28, 2010.
Actual Expenses
The first line for each share class in the following table provides information about actual account values and actual expenses. You may use the information in this line, together with the amount you invested, to estimate the expenses that you paid over the period. Simply divide your account value by $1,000 (for example, an $8,600 account value divided by $1,000 = 8.6), then multiply the result by the number in the first line under the heading entitled “Expenses Paid During Period” to estimate the expenses you paid on your account during this period.
Hypothetical Example for Comparison Purposes
The second line for each share class in the following table provides information about hypothetical account values and hypothetical expenses based on the fund’s actual expense ratio and an assumed rate of return of 5% per year before expenses, which is not the fund’s actual return. The hypothetical account values and expenses may not be used to estimate the actual ending account balance or expenses you paid for the period. You may use this information to compare the ongoing costs of investing in the fund and other funds. To do so, compare this 5% hypothetical example with the 5% hypothetical examples that appear in the shareholder reports of the other funds.
Please note that the expenses shown in the table are meant to highlight your ongoing costs only and do not reflect any transactional costs, such as sales charges (loads). Therefore, the second line for each share class in the table is useful in comparing ongoing costs only, and will not help you determine the relative total costs of owning different funds. In addition, if these transactional costs were included, your costs would have been higher.
4
Expense Table – continued
| | | | | | | | | | |
Share
Class | | | | Annualized
Expense
Ratio | | Beginning
Account Value
9/01/09 | | Ending
Account Value
2/28/10 | | Expenses
Paid During
Period (p)
9/01/09-2/28/10 |
| A | | Actual | | 1.22% | | $1,000.00 | | $1,102.68 | | $6.36 |
| | Hypothetical (h) | | 1.22% | | $1,000.00 | | $1,018.74 | | $6.11 |
| B | | Actual | | 1.97% | | $1,000.00 | | $1,097.90 | | $10.25 |
| | Hypothetical (h) | | 1.97% | | $1,000.00 | | $1,015.03 | | $9.84 |
| C | | Actual | | 1.97% | | $1,000.00 | | $1,098.11 | | $10.25 |
| | Hypothetical (h) | | 1.97% | | $1,000.00 | | $1,015.03 | | $9.84 |
| I | | Actual | | 0.97% | | $1,000.00 | | $1,103.24 | | $5.06 |
| | Hypothetical (h) | | 0.97% | | $1,000.00 | | $1,019.98 | | $4.86 |
| R1 | | Actual | | 1.97% | | $1,000.00 | | $1,098.43 | | $10.25 |
| | Hypothetical (h) | | 1.97% | | $1,000.00 | | $1,015.03 | | $9.84 |
| R2 | | Actual | | 1.47% | | $1,000.00 | | $1,101.08 | | $7.66 |
| | Hypothetical (h) | | 1.47% | | $1,000.00 | | $1,017.50 | | $7.35 |
| R3 | | Actual | | 1.22% | | $1,000.00 | | $1,102.55 | | $6.36 |
| | Hypothetical (h) | | 1.22% | | $1,000.00 | | $1,018.74 | | $6.11 |
| R4 | | Actual | | 0.97% | | $1,000.00 | | $1,103.71 | | $5.06 |
| | Hypothetical (h) | | 0.97% | | $1,000.00 | | $1,019.98 | | $4.86 |
| (h) | 5% class return per year before expenses. |
| (p) | Expenses paid is equal to each class’ annualized expense ratio, as shown above, multiplied by the average account value over the period, multiplied by the number of days in the period, divided by the number of days in the year. Expenses paid do not include any applicable sales charges (loads). If these transaction costs had been included, your costs would have been higher. |
Expense Changes Impacting the Table
Changes to the fund’s fee arrangements occurred during the six month period. Had these fee changes been in effect throughout the entire six month period, the annualized expense ratios would have been 1.24%, 1.99%, 1.99%, 0.99%, 1.99%, 1.49%, 1.24% and 0.99% for Classes A, B, C, I, R1, R2, R3 and R4, respectively; the actual expenses paid during the period would have been approximately $6.46, $10.35, $10.35, $5.16, $10.35, $7.76, $6.46 and $5.16 for Classes A, B, C, I, R1, R2, R3 and R4, respectively; and the hypothetical expenses paid during the period would have been approximately $6.21, $9.94, $9.94, $4.96, $9.94, $7.45, $6.21 and $4.96 for Classes A, B, C, I, R1, R2, R3 and R4, respectively. For further information about the fund’s fee arrangements and changes to those fee arrangements, please see Note 3 in the Notes to Financial Statements.
5
PORTFOLIO OF INVESTMENTS
2/28/10 (unaudited)
The Portfolio of Investments is a complete list of all securities owned by your fund. It is categorized by broad-based asset classes.
| | | | | |
| Common Stocks - 98.9% | | | | | |
| Issuer | | Shares/Par | | Value ($) |
| | | | | |
| Aerospace - 2.8% | | | | | |
| Goodrich Corp. | | 66,370 | | $ | 4,355,863 |
| Honeywell International, Inc. | | 75,960 | | | 3,050,554 |
| Lockheed Martin Corp. | | 64,420 | | | 5,009,299 |
| Precision Castparts Corp. | | 23,600 | | | 2,660,900 |
| United Technologies Corp. | | 106,380 | | | 7,302,987 |
| | | | | |
| | | | | $ | 22,379,603 |
| Airlines - 0.3% | | | | | |
| Copa Holdings S.A., “A” | | 17,920 | | $ | 974,669 |
| UAL Corp. (a) | | 69,480 | | | 1,191,582 |
| | | | | |
| | | | | $ | 2,166,251 |
| Alcoholic Beverages - 0.2% | | | | | |
| Boston Beer Co., Inc., “A” (a) | | 40,250 | | $ | 1,904,630 |
| | |
| Apparel Manufacturers - 0.8% | | | | | |
| NIKE, Inc., “B” | | 91,480 | | $ | 6,184,048 |
| | |
| Biotechnology - 2.0% | | | | | |
| Amgen, Inc. (a) | | 143,450 | | $ | 8,120,704 |
| Genzyme Corp. (a) | | 83,951 | | | 4,801,997 |
| Gilead Sciences, Inc. (a) | | 32,780 | | | 1,560,656 |
| Human Genome Sciences, Inc. (a) | | 36,610 | | | 1,030,572 |
| | | | | |
| | | | | $ | 15,513,929 |
| Broadcasting - 1.6% | | | | | |
| CBS Corp., “B” | | 159,360 | | $ | 2,070,086 |
| Discovery Communications, Inc., “A” (a) | | 45,150 | | | 1,406,422 |
| Walt Disney Co. | | 298,320 | | | 9,319,517 |
| | | | | |
| | | | | $ | 12,796,025 |
| Brokerage & Asset Managers - 1.5% | | | | | |
| Affiliated Managers Group, Inc. (a) | | 23,104 | | $ | 1,643,388 |
| Charles Schwab Corp. | | 75,840 | | | 1,388,630 |
| CME Group, Inc. | | 11,490 | | | 3,466,418 |
| Franklin Resources, Inc. | | 21,700 | | | 2,207,324 |
| GFI Group, Inc. | | 327,250 | | | 1,803,148 |
| LaBranche & Co., Inc. (a) | | 343,280 | | | 1,609,983 |
| | | | | |
| | | | | $ | 12,118,891 |
6
Portfolio of Investments (unaudited) – continued
| | | | | |
| Issuer | | Shares/Par | | Value ($) |
| | | | | |
| Common Stocks - continued | | | | | |
| Business Services - 1.6% | | | | | |
| Accenture Ltd., “A” | | 91,740 | | $ | 3,666,848 |
| Dun & Bradstreet Corp. | | 39,090 | | | 2,742,554 |
| MasterCard, Inc., “A” | | 15,500 | | | 3,477,735 |
| Western Union Co. | | 157,360 | | | 2,483,141 |
| | | | | |
| | | | | $ | 12,370,278 |
| Cable TV - 1.1% | | | | | |
| Comcast Corp., “Special A” | | 121,740 | | $ | 1,885,753 |
| DIRECTV Group, Inc., “A” (a) | | 76,170 | | | 2,578,354 |
| Time Warner Cable, Inc. | | 90,046 | | | 4,204,248 |
| | | | | |
| | | | | $ | 8,668,355 |
| Chemicals - 1.6% | | | | | |
| Celanese Corp. | | 161,870 | | $ | 5,048,725 |
| Monsanto Co. | | 103,310 | | | 7,298,851 |
| | | | | |
| | | | | $ | 12,347,576 |
| Computer Software - 4.2% | | | | | |
| Adobe Systems, Inc. (a) | | 255,270 | | $ | 8,845,105 |
| MicroStrategy, Inc., “A” (a) | | 121,460 | | | 10,772,287 |
| Nuance Communications, Inc. (a) | | 208,460 | | | 2,999,739 |
| Oracle Corp. | | 423,820 | | | 10,447,163 |
| | | | | |
| | | | | $ | 33,064,294 |
| Computer Software - Systems - 5.0% | | | | | |
| Apple, Inc. (a) | | 86,450 | | $ | 17,689,399 |
| Compellent Technologies, Inc. (a) | | 183,230 | | | 2,845,562 |
| Dell, Inc. (a) | | 596,510 | | | 7,891,827 |
| Hewlett-Packard Co. | | 212,190 | | | 10,777,130 |
| | | | | |
| | | | | $ | 39,203,918 |
| Construction - 0.6% | | | | | |
| Lennar Corp., “A” | | 172,050 | | $ | 2,823,341 |
| Sherwin-Williams Co. | | 28,870 | | | 1,829,781 |
| | | | | |
| | | | | $ | 4,653,122 |
| Consumer Products - 2.5% | | | | | |
| Church & Dwight Co., Inc. | | 24,370 | | $ | 1,637,177 |
| Kimberly-Clark Corp. | | 64,060 | | | 3,891,004 |
| Procter & Gamble Co. | | 230,740 | | | 14,601,227 |
| | | | | |
| | | | | $ | 20,129,408 |
7
Portfolio of Investments (unaudited) – continued
| | | | | |
| Issuer | | Shares/Par | | Value ($) |
| | | | | |
| Common Stocks - continued | | | | | |
| Consumer Services - 0.8% | | | | | |
| Apollo Group, Inc., “A” (a) | | 21,040 | | $ | 1,259,875 |
| Priceline.com, Inc. (a) | | 4,980 | | | 1,129,265 |
| Strayer Education, Inc. (l) | | 15,950 | | | 3,617,939 |
| | | | | |
| | | | | $ | 6,007,079 |
| Containers - 0.4% | | | | | |
| Owens-Illinois, Inc. (a) | | 98,000 | | $ | 2,904,720 |
| | |
| Electrical Equipment - 2.1% | | | | | |
| AMETEK, Inc. | | 101,880 | | $ | 3,977,395 |
| Danaher Corp. | | 116,460 | | | 8,614,546 |
| Rockwell Automation, Inc. | | 37,520 | | | 2,029,457 |
| Tyco Electronics Ltd. | | 62,540 | | | 1,602,900 |
| | | | | |
| | | | | $ | 16,224,298 |
| Electronics - 4.0% | | | | | |
| First Solar, Inc. (a)(l) | | 28,310 | | $ | 2,998,029 |
| Flextronics International Ltd. (a) | | 173,865 | | | 1,210,100 |
| Hittite Microwave Corp. (a) | | 38,690 | | | 1,614,921 |
| Intel Corp. | | 652,300 | | | 13,391,719 |
| Marvell Technology Group Ltd. (a) | | 68,830 | | | 1,329,796 |
| National Semiconductor Corp. | | 470,840 | | | 6,817,763 |
| PMC-Sierra, Inc. (a) | | 100,930 | | | 837,719 |
| Silicon Laboratories, Inc. (a) | | 16,260 | | | 738,854 |
| Tessera Technologies, Inc. (a) | | 128,610 | | | 2,309,836 |
| | | | | |
| | | | | $ | 31,248,737 |
| Energy - Independent - 4.0% | | | | | |
| Alpha Natural Resources, Inc. (a) | | 24,440 | | $ | 1,124,484 |
| Anadarko Petroleum Corp. | | 59,150 | | | 4,148,189 |
| Apache Corp. | | 69,790 | | | 7,233,036 |
| Denbury Resources, Inc. (a) | | 88,990 | | | 1,252,979 |
| Massey Energy Co. | | 22,180 | | | 955,293 |
| Nexen, Inc. | | 157,130 | | | 3,546,700 |
| Noble Energy, Inc. | | 46,090 | | | 3,347,978 |
| Occidental Petroleum Corp. | | 79,950 | | | 6,384,008 |
| Walter Energy, Inc. | | 9,880 | | | 776,272 |
| XTO Energy, Inc. | | 56,070 | | | 2,562,399 |
| | | | | |
| | | | | $ | 31,331,338 |
| Energy - Integrated - 4.4% | | | | | |
| Chevron Corp. | | 194,290 | | $ | 14,047,167 |
| Exxon Mobil Corp. (s) | | 235,842 | | | 15,329,730 |
8
Portfolio of Investments (unaudited) – continued
| | | | | |
| Issuer | | Shares/Par | | Value ($) |
| | | | | |
| Common Stocks - continued | | | | | |
| Energy - Integrated - continued | | | | | |
| Hess Corp. | | 65,470 | | $ | 3,849,636 |
| Suncor Energy, Inc. | | 52,760 | | | 1,525,292 |
| | | | | |
| | | | | $ | 34,751,825 |
| Engineering - Construction - 1.0% | | | | | |
| Fluor Corp. | | 141,010 | | $ | 6,035,228 |
| North American Energy Partners, Inc. (a) | | 218,920 | | | 2,230,795 |
| | | | | |
| | | | | $ | 8,266,023 |
| Food & Beverages - 3.7% | | | | | |
| General Mills, Inc. | | 126,410 | | $ | 9,102,784 |
| J.M. Smucker Co. | | 52,970 | | | 3,161,250 |
| Kellogg Co. | | 124,250 | | | 6,479,638 |
| PepsiCo, Inc. (s) | | 174,709 | | | 10,914,071 |
| | | | | |
| | | | | $ | 29,657,743 |
| Food & Drug Stores - 0.9% | | | | | |
| Kroger Co. | | 81,980 | | $ | 1,811,758 |
| Walgreen Co. | | 155,280 | | | 5,472,067 |
| | | | | |
| | | | | $ | 7,283,825 |
| Gaming & Lodging - 0.6% | | | | | |
| International Game Technology | | 64,870 | | $ | 1,138,469 |
| Las Vegas Sands Corp. (a) | | 75,410 | | | 1,254,068 |
| Royal Caribbean Cruises Ltd. (a) | | 61,120 | | | 1,727,862 |
| Starwood Hotels & Resorts Worldwide, Inc. | | 25,340 | | | 980,658 |
| | | | | |
| | | | | $ | 5,101,057 |
| General Merchandise - 2.7% | | | | | |
| Dollar General Corp. (a) | | 129,690 | | $ | 3,098,294 |
| Kohl’s Corp. (a) | | 18,500 | | | 995,670 |
| Target Corp. | | 178,040 | | | 9,172,621 |
| Wal-Mart Stores, Inc. | | 145,320 | | | 7,857,452 |
| | | | | |
| | | | | $ | 21,124,037 |
| Health Maintenance Organizations - 0.7% | | | | | |
| WellPoint, Inc. (a) | | 84,550 | | $ | 5,231,108 |
| | |
| Insurance - 3.2% | | | | | |
| ACE Ltd. | | 101,680 | | $ | 5,082,983 |
| Aflac, Inc. | | 64,080 | | | 3,168,756 |
| Allied World Assurance Co. Holdings Ltd. | | 108,970 | | | 5,023,517 |
| Chubb Corp. | | 99,610 | | | 5,026,321 |
9
Portfolio of Investments (unaudited) – continued
| | | | | |
| Issuer | | Shares/Par | | Value ($) |
| | | | | |
| Common Stocks - continued | | | | | |
| Insurance - continued | | | | | |
| MetLife, Inc. | | 54,030 | | $ | 1,966,152 |
| Prudential Financial, Inc. | | 60,820 | | | 3,187,576 |
| Verisk Analytics, Inc., “A” (a) | | 78,030 | | | 2,208,249 |
| | | | | |
| | | | | $ | 25,663,554 |
| Internet - 1.6% | | | | | |
| Google, Inc., “A” (a) | | 24,230 | | $ | 12,764,364 |
| | |
| Machinery & Tools - 0.4% | | | | | |
| Avery Dennison Corp. | | 49,800 | | $ | 1,573,680 |
| RTI International Metals, Inc. (a) | | 64,800 | | | 1,557,144 |
| | | | | |
| | | | | $ | 3,130,824 |
| Major Banks - 6.8% | | | | | |
| Bank of America Corp. | | 981,620 | | $ | 16,353,789 |
| Bank of New York Mellon Corp. | | 103,008 | | | 2,937,788 |
| Goldman Sachs Group, Inc. | | 55,610 | | | 8,694,624 |
| JPMorgan Chase & Co. (s) | | 382,020 | | | 16,033,379 |
| KeyCorp | | 314,740 | | | 2,250,391 |
| State Street Corp. | | 78,340 | | | 3,518,249 |
| SunTrust Banks, Inc. | | 164,380 | | | 3,913,888 |
| | | | | |
| | | | | $ | 53,702,108 |
| Medical & Health Technology & Services - 1.5% | | | | | |
| DaVita, Inc. (a) | | 55,830 | | $ | 3,439,686 |
| Express Scripts, Inc. (a) | | 21,070 | | | 2,022,931 |
| Medco Health Solutions, Inc. (a) | | 29,360 | | | 1,856,726 |
| Patterson Cos., Inc. (a) | | 81,230 | | | 2,410,906 |
| VCA Antech, Inc. (a) | | 88,980 | | | 2,119,504 |
| | | | | |
| | | | | $ | 11,849,753 |
| Medical Equipment - 3.1% | | | | | |
| Becton, Dickinson & Co. | | 55,130 | | $ | 4,292,973 |
| Covidien PLC | | 28,310 | | | 1,390,587 |
| Medtronic, Inc. | | 99,930 | | | 4,336,962 |
| NxStage Medical, Inc. (a) | | 149,270 | | | 1,589,726 |
| NxStage Medical, Inc. (a) | | 342,400 | | | 3,646,560 |
| St. Jude Medical, Inc. (a) | | 114,920 | | | 4,392,242 |
| Thermo Fisher Scientific, Inc. (a) | | 75,710 | | | 3,692,377 |
| Waters Corp. (a) | | 22,700 | | | 1,354,282 |
| | | | | |
| | | | | $ | 24,695,709 |
10
Portfolio of Investments (unaudited) – continued
| | | | | |
| Issuer | | Shares/Par | | Value ($) |
| | | | | |
| Common Stocks - continued | | | | | |
| Metals & Mining - 0.6% | | | | | |
| Steel Dynamics, Inc. | | 126,300 | | $ | 2,062,479 |
| United States Steel Corp. | | 46,460 | | | 2,459,592 |
| | | | | |
| | | | | $ | 4,522,071 |
| Natural Gas - Distribution - 0.5% | | | | | |
| EQT Corp. | | 54,340 | | $ | 2,377,918 |
| South Jersey Industries, Inc. | | 44,210 | | | 1,762,653 |
| | | | | |
| | | | | $ | 4,140,571 |
| Natural Gas - Pipeline - 0.7% | | | | | |
| Aegean Marine Petroleum Network, Inc. | | 91,380 | | $ | 2,618,951 |
| El Paso Corp. | | 75,780 | | | 793,417 |
| Williams Cos., Inc. | | 103,970 | | | 2,239,514 |
| | | | | |
| | | | | $ | 5,651,882 |
| Network & Telecom - 2.0% | | | | | |
| Cisco Systems, Inc. (a) | | 489,530 | | $ | 11,910,265 |
| Juniper Networks, Inc. (a) | | 123,130 | | | 3,445,177 |
| Palm, Inc. (a) | | 99,110 | | | 604,571 |
| | | | | |
| | | | | $ | 15,960,013 |
| Oil Services - 2.0% | | | | | |
| Halliburton Co. | | 219,910 | | $ | 6,630,287 |
| National Oilwell Varco, Inc. | | 76,930 | | | 3,344,147 |
| Schlumberger Ltd. | | 93,300 | | | 5,700,630 |
| | | | | |
| | | | | $ | 15,675,064 |
| Other Banks & Diversified Financials - 1.9% | | | | | |
| American Express Co. | | 66,360 | | $ | 2,534,288 |
| Associated Banc-Corp. | | 231,210 | | | 2,984,921 |
| CIT Group, Inc. (a) | | 31,230 | | | 1,137,709 |
| Euro Dekania Ltd. (z) | | 580,280 | | | 1,382,742 |
| Ocwen Financial Corp. (a) | | 253,880 | | | 2,744,443 |
| Sterling Bancshares, Inc. | | 336,500 | | | 1,588,280 |
| TCF Financial Corp. | | 183,300 | | | 2,646,852 |
| | | | | |
| | | | | $ | 15,019,235 |
| Pharmaceuticals - 5.7% | | | | | |
| Abbott Laboratories | | 259,150 | | $ | 14,066,662 |
| Inverness Medical Innovations, Inc. (a) | | 47,080 | | | 1,837,062 |
| Johnson & Johnson | | 285,670 | | | 17,997,210 |
| Pfizer, Inc. | | 371,936 | | | 6,527,477 |
| Teva Pharmaceutical Industries Ltd., ADR | | 83,770 | | | 5,027,038 |
| | | | | |
| | | | | $ | 45,455,449 |
11
Portfolio of Investments (unaudited) – continued
| | | | | |
| Issuer | | Shares/Par | | Value ($) |
| | | | | |
| Common Stocks - continued | | | | | |
| Pollution Control - 0.3% | | | | | |
| Republic Services, Inc. | | 92,012 | | $ | 2,589,218 |
| | |
| Precious Metals & Minerals - 0.4% | | | | | |
| Goldcorp, Inc. | | 16,420 | | $ | 620,348 |
| Teck Resources Ltd., “B” (a) | | 63,540 | | | 2,337,006 |
| | | | | |
| | | | | $ | 2,957,354 |
| Printing & Publishing - 0.2% | | | | | |
| Moody’s Corp. | | 71,180 | | $ | 1,894,812 |
| | |
| Railroad & Shipping - 1.0% | | | | | |
| Canadian National Railway Co. | | 83,630 | | $ | 4,403,956 |
| Union Pacific Corp. | | 46,590 | | | 3,138,768 |
| | | | | |
| | | | | $ | 7,542,724 |
| Real Estate - 2.1% | | | | | |
| Annaly Mortgage Management, Inc., REIT | | 260,030 | | $ | 4,779,351 |
| Entertainment Property Trust, REIT | | 192,280 | | | 7,348,942 |
| Kilroy Realty Corp., REIT | | 84,620 | | | 2,397,285 |
| Mack-Cali Realty Corp., REIT | | 69,010 | | | 2,314,595 |
| | | | | |
| | | | | $ | 16,840,173 |
| Restaurants - 0.2% | | | | | |
| P.F. Chang’s China Bistro, Inc. (a) | | 44,290 | | $ | 1,879,668 |
| | |
| Specialty Chemicals - 1.2% | | | | | |
| Praxair, Inc. | | 91,100 | | $ | 6,845,254 |
| Rockwood Holdings, Inc. (a) | | 125,770 | | | 3,017,222 |
| | | | | |
| | | | | $ | 9,862,476 |
| Specialty Stores - 3.5% | | | | | |
| Abercrombie & Fitch Co., “A” | | 113,750 | | $ | 4,142,775 |
| Advance Auto Parts, Inc. | | 50,260 | | | 2,050,608 |
| Amazon.com, Inc. (a) | | 35,460 | | | 4,198,464 |
| GameStop Corp., “A” (a) | | 156,280 | | | 2,688,016 |
| Home Depot, Inc. | | 226,290 | | | 7,060,248 |
| Limited Brands, Inc. | | 189,500 | | | 4,189,845 |
| Staples, Inc. | | 129,540 | | | 3,336,950 |
| | | | | |
| | | | | $ | 27,666,906 |
| Telecommunications - Wireless - 0.1% | | | | | |
| Sprint Nextel Corp. (a) | | 199,230 | | $ | 663,436 |
12
Portfolio of Investments (unaudited) – continued
| | | | | |
| Issuer | | Shares/Par | | Value ($) |
| | | | | |
| Common Stocks - continued | | | | | |
| Telephone Services - 2.7% | | | | | |
| American Tower Corp., “A” (a) | | 92,650 | | $ | 3,952,449 |
| AT&T, Inc. | | 521,790 | | | 12,945,610 |
| CenturyTel, Inc. | | 112,040 | | | 3,839,611 |
| Qwest Communications International, Inc. | | 178,500 | | | 813,960 |
| | | | | |
| | | | | $ | 21,551,630 |
| Tobacco - 1.6% | | | | | |
| Lorillard, Inc. | | 22,230 | | $ | 1,623,679 |
| Philip Morris International, Inc. | | 232,280 | | | 11,377,074 |
| | | | | |
| | | | | $ | 13,000,753 |
| Trucking - 1.5% | | | | | |
| Atlas Air Worldwide Holdings, Inc. (a) | | 54,800 | | $ | 2,470,384 |
| Expeditors International of Washington, Inc. | | 142,560 | | | 5,199,163 |
| Landstar System, Inc. | | 97,160 | | | 3,875,712 |
| | | | | |
| | | | | $ | 11,545,259 |
| Utilities - Electric Power - 3.0% | | | | | |
| American Electric Power Co., Inc. | | 130,360 | | $ | 4,382,703 |
| CMS Energy Corp. | | 220,207 | | | 3,362,561 |
| Dominion Resources, Inc. | | 65,050 | | | 2,471,250 |
| NRG Energy, Inc. (a) | | 7,720 | | | 168,605 |
| PG&E Corp. | | 99,060 | | | 4,152,595 |
| PPL Corp. | | 113,690 | | | 3,237,891 |
| Public Service Enterprise Group, Inc. | | 92,200 | | | 2,740,184 |
| Wisconsin Energy Corp. | | 71,980 | | | 3,485,991 |
| | | | | |
| | | | | $ | 24,001,780 |
| Total Common Stocks (Identified Cost, $769,292,934) | | | | $ | 782,858,904 |
| | | | | | | | | | |
| | | | |
| | | Strike Price | | First Exercise | | | | |
| | | | | | | | | | |
| | | | | | | | | | |
| Warrants - 0.1% | | | | | | | | | | |
| Medical Equipment - 0.1% | | | | | | | | | | |
NxStage Medical, Inc.
(1 share for 1 warrant)
(Identified Cost, $187,933) (a) | | $ | 5.50 | | 5/23/08 | | 68,480 | | $ | 436,956 |
| | | | |
| Money Market Funds (v) - 0.9% | | | | | | | | | | |
MFS Institutional Money Market Portfolio, 0.14%,
at Cost and Net Asset Value | | | | 7,759,873 | | $ | 7,759,873 |
13
Portfolio of Investments (unaudited) – continued
| | | | | | |
| Collateral for Securities Loaned - 0.6% | | | | | | |
| Issuer | | Shares/Par | | Value ($) | |
| | | | | | |
Navigator Securities Lending Prime Portfolio,
at Cost and Net Asset Value | | 4,745,407 | | $ | 4,745,407 | |
| Total Investments (Identified Cost, $781,986,147) | | | | $ | 795,801,140 | |
| | |
| Other Assets, Less Liabilities - (0.5)% | | | | | (4,080,080 | ) |
| Net Assets - 100.0% | | | | $ | 791,721,060 | |
| (a) | Non-income producing security. |
| (l) | All or a portion of this security is on loan. |
| (s) | Security or a portion of the security was pledged to cover collateral requirements for securities sold short. At February 28, 2010, the value of securities pledged amounted to $168,175. At February 28, 2010, the fund had no short sales outstanding. |
| (v) | Underlying fund that is available only to investment companies managed by MFS. The rate quoted is the annualized seven-day yield of the fund at period end. |
| (z) | Restricted securities are not registered under the Securities Act of 1933 and are subject to legal restrictions on resale. These securities generally may be resold in transactions exempt from registration or to the public if the securities are subsequently registered. Disposal of these securities may involve time-consuming negotiations and prompt sale at an acceptable price may be difficult. The fund holds the following restricted securities: |
| | | | | | |
| Restricted Securities | | Acquisition
Date | | Cost | | Current
Market
Value |
| Euro Dekania Ltd. | | 3/08/07-6/25/07 | | $8,173,430 | | $1,382,742 |
| % of Net Assets | | | | | | 0.2% |
The following abbreviations are used in this report and are defined:
| ADR | | American Depository Receipt |
| PLC | | Public Limited Company |
| REIT | | Real Estate Investment Trust |
See Notes to Financial Statements
14
Financial Statements
STATEMENT OF ASSETS AND LIABILITIES
At 2/28/10 (unaudited)
This statement represents your fund’s balance sheet, which details the assets and liabilities comprising the total value of the fund.
| | | |
| Assets | | | |
Investments- | | | |
Non-affiliated issuers, at value (identified cost, $774,226,274) | | $788,041,267 | |
Underlying funds, at cost and value | | 7,759,873 | |
Total investments, at value, including $4,725,974 of securities on loan
(identified cost, $781,986,147) | | $795,801,140 | |
Receivables for | | | |
Investments sold | | 11,207,666 | |
Fund shares sold | | 613,300 | |
Dividends | | 1,216,502 | |
Other assets | | 9,372 | |
Total assets | | $808,847,980 | |
| Liabilities | | | |
Payable to custodian | | $370 | |
Payables for | | | |
Investments purchased | | 10,650,446 | |
Fund shares reacquired | | 1,030,380 | |
Collateral for securities loaned, at value | | 4,745,407 | |
Payable to affiliates | | | |
Investment adviser | | 53,139 | |
Shareholder servicing costs | | 384,769 | |
Distribution and service fees | | 33,123 | |
Administrative services fee | | 1,409 | |
Payable for independent Trustees’ compensation | | 135,537 | |
Accrued expenses and other liabilities | | 92,340 | |
Total liabilities | | $17,126,920 | |
Net assets | | $791,721,060 | |
| Net assets consist of | | | |
Paid-in capital | | $1,123,903,905 | |
Unrealized appreciation (depreciation) on investments and translation of assets and liabilities in foreign currencies | | 13,814,993 | |
Accumulated net realized gain (loss) on investments and foreign currency transactions | | (348,544,927 | ) |
Undistributed net investment income | | 2,547,089 | |
Net assets | | $791,721,060 | |
Shares of beneficial interest outstanding | | 52,949,382 | |
| | | | | | |
| | | Net assets | | Shares
outstanding | | Net asset value
per share (a) |
Class A | | $589,073,108 | | 38,836,546 | | $15.17 |
Class B | | 70,123,987 | | 4,989,333 | | 14.05 |
Class C | | 66,404,234 | | 4,760,680 | | 13.95 |
Class I | | 17,030,352 | | 1,080,388 | | 15.76 |
Class R1 | | 3,963,048 | | 284,373 | | 13.94 |
Class R2 | | 16,135,964 | | 1,083,952 | | 14.89 |
Class R3 | | 27,177,511 | | 1,795,391 | | 15.14 |
Class R4 | | 1,812,856 | | 118,719 | | 15.27 |
| (a) | Maximum offering price per share was equal to the net asset value per share for all share classes, except for Class A, for which the maximum offering price per share was $16.10 [100 / 94.25 x $15.17]. On sales of $50,000 or more, the maximum offering price of Class A shares is reduced. A contingent deferred sales charge may be imposed on redemptions of Class A, Class B, and Class C shares. Redemption price per share was equal to the net asset value per share for Classes I, R1, R2, R3, and R4. |
See Notes to Financial Statements
15
Financial Statements
STATEMENT OF OPERATIONS
Six months ended 2/28/10 (unaudited)
This statement describes how much your fund earned in investment income and accrued in expenses. It also describes any gains and/or losses generated by fund operations.
| | | |
| Net investment income | | | |
Income | | | |
Dividends | | $7,051,424 | |
Interest | | 1,021,309 | |
Dividends from underlying funds | | 4,676 | |
Foreign taxes withheld | | (22,044 | ) |
Total investment income | | $8,055,365 | |
Expenses | | | |
Management fee | | $2,413,696 | |
Distribution and service fees | | 1,528,779 | |
Shareholder servicing costs | | 1,123,884 | |
Administrative services fee | | 63,286 | |
Independent Trustees’ compensation | | 26,202 | |
Custodian fee | | 71,689 | |
Shareholder communications | | 55,875 | |
Auditing fees | | 23,089 | |
Legal fees | | 9,481 | |
Miscellaneous | | 105,338 | |
Total expenses | | $5,421,319 | |
Fees paid indirectly | | (1 | ) |
Reduction of expenses by investment adviser | | (55,515 | ) |
Net expenses | | $5,365,803 | |
Net investment income | | $2,689,562 | |
Realized and unrealized gain (loss) on investments
and foreign currency transactions | | | |
Realized gain (loss) (identified cost basis) | | | |
Investment transactions | | $39,184,762 | |
Foreign currency transactions | | 34,586 | |
Net realized gain (loss) on investments
and foreign currency transactions | | $39,219,348 | |
Change in unrealized appreciation (depreciation) | | | |
Investments | | $34,251,502 | |
Translation of assets and liabilities in foreign currencies | | (25,100 | ) |
Net unrealized gain (loss) on investments
and foreign currency translation | | $34,226,402 | |
Net realized and unrealized gain (loss) on investments
and foreign currency | | $73,445,750 | |
Change in net assets from operations | | $76,135,312 | |
See Notes to Financial Statements
16
Financial Statements
STATEMENTS OF CHANGES IN NET ASSETS
These statements describe the increases and/or decreases in net assets resulting from operations, any distributions, and any shareholder transactions.
| | | | | | |
| Change in net assets | | Six months ended
2/28/10
(unaudited) | | | Year ended
8/31/09 | |
| From operations | | | | | | |
Net investment income | | $2,689,562 | | | $5,738,362 | |
Net realized gain (loss) on investments and foreign currency transactions | | 39,219,348 | | | (223,983,510 | ) |
Net unrealized gain (loss) on investments and foreign currency translation | | 34,226,402 | | | 43,205,196 | |
Change in net assets from operations | | $76,135,312 | | | $(175,039,952 | ) |
| Distributions declared to shareholders | | | | | | |
From net investment income | | $(5,590,369 | ) | | $(3,543,509 | ) |
Change in net assets from fund share transactions | | $(44,353,743 | ) | | $(13,414,881 | ) |
Total change in net assets | | $26,191,200 | | | $(191,998,342 | ) |
| Net assets | | | | | | |
At beginning of period | | 765,529,860 | | | 957,528,202 | |
At end of period (including undistributed net investment income of $2,547,089 and $5,447,896, respectively) | | $791,721,060 | | | $765,529,860 | |
See Notes to Financial Statements
17
Financial Statements
FINANCIAL HIGHLIGHTS
The financial highlights table is intended to help you understand the fund’s financial performance for the semiannual period and the past 5 fiscal years (or life of a particular share class, if shorter). Certain information reflects financial results for a single fund share. The total returns in the table represent the rate by which an investor would have earned (or lost) on an investment in the fund share class (assuming reinvestment of all distributions) held for the entire period.
| | | | | | | | | | | | | | | | | |
| | | Six months
ended
2/28/10 (unaudited) | | | Years ended 8/31 |
| Class A | | | 2009 | | | 2008 | | | 2007 | | | 2006 | | | 2005 |
| | | | | | | | | | | | | | | | |
Net asset value, beginning of period | | $13.87 | | | $16.75 | | | $19.83 | | | $18.17 | | | $17.88 | | | $15.35 |
| Income (loss) from investment operations | | | | | | | | | | | | | | | | | |
Net investment income (d) | | $0.06 | | | $0.12 | | | $0.09 | | | $0.04 | | | $0.03 | | | $0.03 |
Net realized and unrealized gain (loss) on investments and foreign currency | | 1.36 | | | (2.92 | ) | | (1.71 | ) | | 3.01 | | | 1.06 | | | 2.50 |
Total from investment operations | | $1.42 | | | $(2.80 | ) | | $(1.62 | ) | | $3.05 | | | $1.09 | | | $2.53 |
| Less distributions declared to shareholders | | | | | | | | | | | | | | | | | |
From net investment income | | $(0.12 | ) | | $(0.08 | ) | | $— | | | $— | | | $— | | | $— |
From net realized gain on investments | | — | | | — | | | (1.46 | ) | | (1.39 | ) | | (0.80 | ) | | — |
Total distributions declared to shareholders | | $(0.12 | ) | | $(0.08 | ) | | $(1.46 | ) | | $(1.39 | ) | | $(0.80 | ) | | $— |
Net asset value, end of period | | $15.17 | | | $13.87 | | | $16.75 | | | $19.83 | | | $18.17 | | | $17.88 |
Total return (%) (r)(s)(t) | | 10.27 | (n) | | (16.55 | ) | | (8.94 | ) | | 17.26 | | | 6.25 | | | 16.48 |
Ratios (%) (to average net assets)
and Supplemental data: | | | | | | | | | | | | | | | |
Expenses before expense reductions (f) | | 1.24 | (a) | | 1.36 | | | 1.24 | | | 1.26 | | | 1.37 | | | 1.41 |
Expenses after expense reductions (f) | | 1.22 | (a) | | 1.21 | | | 1.21 | | | 1.26 | | | 1.36 | | | 1.41 |
Expenses after expense reductions excluding short sale dividend and interest expense (f) | | N/A | | | 1.21 | | | N/A | | | N/A | | | N/A | | | N/A |
Net investment income | | 0.82 | (a) | | 1.03 | | | 0.52 | | | 0.22 | | | 0.15 | | | 0.17 |
Portfolio turnover | | 37 | | | 109 | | | 86 | | | 283 | | | 138 | | | 81 |
Net assets at end of period (000 omitted) | | $589,073 | | | $559,572 | | | $650,476 | | | $766,202 | | | $146,355 | | | $141,808 |
See Notes to Financial Statements
18
Financial Highlights – continued
| | | | | | | | | | | | | | | | | | |
| | | Six months
ended
2/28/10
(unaudited) | | | Years ended 8/31 | |
| Class B | | | 2009 | | | 2008 | | | 2007 | | | 2006 | | | 2005 | |
| | | | | | | | | | | | | | | | | |
Net asset value, beginning of period | | $12.80 | | | $15.45 | | | $18.52 | | | $17.16 | | | $17.03 | | | $14.71 | |
| Income (loss) from investment operations | | | | | | | | | | | | | | | | | | |
Net investment income (loss) (d) | | $0.00 | (w) | | $0.05 | | | $(0.02 | ) | | $(0.08 | ) | | $(0.09 | ) | | $(0.08 | ) |
Net realized and unrealized gain (loss) on investments and foreign currency | | 1.25 | | | (2.70 | ) | | (1.59 | ) | | 2.83 | | | 1.02 | | | 2.40 | |
Total from investment operations | | $1.25 | | | $(2.65 | ) | | $(1.61 | ) | | $2.75 | | | $0.93 | | | $2.32 | |
| Less distributions declared to shareholders | | | | | | | | | | | | | | | | | | |
From net investment income | | $(0.00 | )(w) | | $— | | | $— | | | $— | | | $— | | | $— | |
From net realized gain on investments | | — | | | — | | | (1.46 | ) | | (1.39 | ) | | (0.80 | ) | | — | |
Total distributions declared to shareholders | | $(0.00 | )(w) | | $— | | | $(1.46 | ) | | $(1.39 | ) | | $(0.80 | ) | | $— | |
Net asset value, end of period | | $14.05 | | | $12.80 | | | $15.45 | | | $18.52 | | | $17.16 | | | $17.03 | |
Total return (%) (r)(s)(t) | | 9.79 | (n) | | (17.15 | ) | | (9.55 | ) | | 16.49 | | | 5.60 | | | 15.77 | |
| Ratios (%) (to average net assets) and Supplemental data: | | | | | | | | | | | | | | | | | | |
Expenses before expense
reductions (f) | | 1.99 | (a) | | 2.07 | | | 1.88 | | | 1.90 | | | 2.02 | | | 2.06 | |
Expenses after expense
reductions (f) | | 1.97 | (a) | | 1.90 | | | 1.86 | | | 1.90 | | | 2.02 | | | 2.06 | |
Expenses after expense reductions excluding short sale dividend and interest expense (f) | | N/A | | | 1.90 | | | N/A | | | N/A | | | N/A | | | N/A | |
Net investment income (loss) | | 0.07 | (a) | | 0.42 | | | (0.14 | ) | | (0.46 | ) | | (0.50 | ) | | (0.47 | ) |
Portfolio turnover | | 37 | | | 109 | | | 86 | | | 283 | | | 138 | | | 81 | |
Net assets at end of period
(000 omitted) | | $70,124 | | | $79,608 | | | $162,122 | | | $325,525 | | | $49,192 | | | $71,088 | |
See Notes to Financial Statements
19
Financial Highlights – continued
| | | | | | | | | | | | | | | | | | |
| | | Six months
ended
2/28/10 (unaudited) | | | Years ended 8/31 | |
| Class C | | | 2009 | | | 2008 | | | 2007 | | | 2006 | | | 2005 | |
| | | | | | | | | | | | | | | | | |
Net asset value, beginning of period | | $12.75 | | | $15.38 | | | $18.44 | | | $17.09 | | | $16.97 | | | $14.66 | |
| Income (loss) from investment operations | | | | | | | | �� | | | | | | | | | | |
Net investment income (loss) (d) | | $0.00 | (w) | | $0.04 | | | $(0.02 | ) | | $(0.08 | ) | | $(0.09 | ) | | $(0.08 | ) |
Net realized and unrealized gain (loss) on investments and foreign currency | | 1.25 | | | (2.67 | ) | | (1.58 | ) | | 2.82 | | | 1.01 | | | 2.39 | |
Total from investment operations | | $1.25 | | | $(2.63 | ) | | $(1.60 | ) | | $2.74 | | | $0.92 | | | $2.31 | |
| Less distributions declared to shareholders | | | | | | | | | | | | | | | | | | |
From net investment income | | $(0.05 | ) | | $— | | | $— | | | $— | | | $— | | | $— | |
From net realized gain on investments | | — | | | — | | | (1.46 | ) | | (1.39 | ) | | (0.80 | ) | | — | |
Total distributions declared to shareholders | | $(0.05 | ) | | $— | | | $(1.46 | ) | | $(1.39 | ) | | $(0.80 | ) | | $— | |
Net asset value, end of period | | $13.95 | | | $12.75 | | | $15.38 | | | $18.44 | | | $17.09 | | | $16.97 | |
Total return (%) (r)(s)(t) | | 9.81 | (n) | | (17.10 | ) | | (9.54 | ) | | 16.50 | | | 5.56 | | | 15.76 | |
| Ratios (%) (to average net assets) and Supplemental data: | | | | | | | | | | | | | | | | | | |
Expenses before expense reductions (f) | | 1.99 | (a) | | 2.06 | | | 1.89 | | | 1.90 | | | 2.02 | | | 2.06 | |
Expenses after expense
reductions (f) | | 1.97 | (a) | | 1.91 | | | 1.86 | | | 1.90 | | | 2.02 | | | 2.06 | |
Expenses after expense reductions excluding short sale dividend and interest expense (f) | | N/A | | | 1.91 | | | N/A | | | N/A | | | N/A | | | N/A | |
Net investment income (loss) | | 0.07 | (a) | | 0.34 | | | (0.14 | ) | | (0.45 | ) | | (0.50 | ) | | (0.48 | ) |
Portfolio turnover | | 37 | | | 109 | | | 86 | | | 283 | | | 138 | | | 81 | |
Net assets at end of period (000 omitted) | | $66,404 | | | $63,993 | | | $79,213 | | | $107,948 | | | $16,613 | | | $17,898 | |
See Notes to Financial Statements
20
Financial Highlights – continued
| | | | | | | | | | | | | | | | | |
| | | Six months
ended
2/28/10 (unaudited) | | | Years ended 8/31 |
| Class I | | | 2009 | | | 2008 | | | 2007 | | | 2006 | | | 2005 |
| | | | | | | | | | | | | | | | |
Net asset value, beginning of period | | $14.43 | | | $17.47 | | | $20.54 | | | $18.72 | | | $18.33 | | | $15.68 |
| Income (loss) from investment operations | | | | | | | | | | | | | | | | | |
Net investment income (d) | | $0.08 | | | $0.17 | | | $0.17 | | | $0.11 | | | $0.09 | | | $0.09 |
Net realized and unrealized gain (loss) on investments and foreign currency | | 1.41 | | | (3.06 | ) | | (1.78 | ) | | 3.10 | | | 1.10 | | | 2.56 |
Total from investment operations | | $1.49 | | | $(2.89 | ) | | $(1.61 | ) | | $3.21 | | | $1.19 | | | $2.65 |
| Less distributions declared to shareholders | | | | | | | | | | | | | | | | | |
From net investment income | | $(0.16 | ) | | $(0.15 | ) | | $— | | | $— | | | $— | | | $— |
From net realized gain on investments | | — | | | — | | | (1.46 | ) | | (1.39 | ) | | (0.80 | ) | | — |
Total distributions declared to shareholders | | $(0.16 | ) | | $(0.15 | ) | | $(1.46 | ) | | $(1.39 | ) | | $(0.80 | ) | | $— |
Net asset value, end of period | | $15.76 | | | $14.43 | | | $17.47 | | | $20.54 | | | $18.72 | | | $18.33 |
Total return (%) (r)(s) | | 10.32 | (n) | | (16.29 | ) | | (8.56 | ) | | 17.63 | | | 6.66 | | | 16.90 |
| Ratios (%) (to average net assets) and Supplemental data: | | | | | | | | | | | | | | | | | |
Expenses before expense reductions (f) | | 0.99 | (a) | | 1.06 | | | 0.89 | | | 0.92 | | | 1.01 | | | 1.09 |
Expenses after expense reductions (f) | | 0.97 | (a) | | 0.91 | | | 0.86 | | | 0.92 | | | 1.01 | | | 1.09 |
Expenses after expense reductions excluding short sale dividend and interest expense (f) | | N/A | | | 0.91 | | | N/A | | | N/A | | | N/A | | | N/A |
Net investment income | | 1.07 | (a) | | 1.32 | | | 0.88 | | | 0.58 | | | 0.50 | | | 0.51 |
Portfolio turnover | | 37 | | | 109 | | | 86 | | | 283 | | | 138 | | | 81 |
Net assets at end of period (000 omitted) | | $17,030 | | | $15,766 | | | $17,269 | | | $27,544 | | | $4,763 | | | $3,170 |
See Notes to Financial Statements
21
Financial Highlights – continued
| | | | | | | | | | | | | | | | | | |
| | | Six months
ended
2/28/10 (unaudited) | | | Years ended 8/31 | |
| Class R1 | | | 2009 | | | 2008 | | | 2007 | | | 2006 | | | 2005 (i) | |
| | | | | | | | | | | | | | | | | |
Net asset value, beginning of period | | $12.75 | | | $15.39 | | | $18.45 | | | $17.11 | | | $17.01 | | | $16.25 | |
| Income (loss) from investment operations | | | | | | | | | | | | | | | | | | |
Net investment income (loss) (d) | | $0.00 | (w) | | $0.04 | | | $(0.03 | ) | | $(0.09 | ) | | $(0.10 | ) | | $(0.04 | ) |
Net realized and unrealized gain (loss) on investments and
foreign currency | | 1.25 | | | (2.68 | ) | | (1.57 | ) | | 2.82 | | | 1.00 | | | 0.80 | (g) |
Total from investment operations | | $1.25 | | | $(2.64 | ) | | $(1.60 | ) | | $2.73 | | | $0.90 | | | $0.76 | |
| Less distributions declared to shareholders | | | | | | | | | | | | | | | | | | |
From net investment income | | $(0.06 | ) | | $— | | | $— | | | $— | | | $— | | | $— | |
From net realized gain on investments | | — | | | — | | | (1.46 | ) | | (1.39 | ) | | (0.80 | ) | | — | |
Total distributions declared to shareholders | | $(0.06 | ) | | $— | | | $(1.46 | ) | | $(1.39 | ) | | $(0.80 | ) | | $— | |
Net asset value, end of period | | $13.94 | | | $12.75 | | | $15.39 | | | $18.45 | | | $17.11 | | | $17.01 | |
Total return (%) (r)(s) | | 9.84 | (n) | | (17.15 | ) | | (9.53 | ) | | 16.42 | | | 5.43 | | | 4.68 | (n) |
| Ratios (%) (to average net assets) and Supplemental data: | | | | | | | | | | | | | | | | | | |
Expenses before expense reductions (f) | | 1.99 | (a) | | 2.06 | | | 1.95 | | | 2.05 | | | 2.20 | | | 2.23 | (a) |
Expenses after expense
reductions (f) | | 1.97 | (a) | | 1.91 | | | 1.91 | | | 2.02 | | | 2.11 | | | 2.23 | (a) |
Expenses after expense reductions excluding short sale dividend and interest expense (f) | | N/A | | | 1.91 | | | N/A | | | N/A | | | N/A | | | N/A | |
Net investment income (loss) | | 0.07 | (a) | | 0.32 | | | (0.18 | ) | | (0.51 | ) | | (0.61 | ) | | (0.63 | )(a) |
Portfolio turnover | | 37 | | | 109 | | | 86 | | | 283 | | | 138 | | | 81 | |
Net assets at end of period (000 omitted) | | $3,963 | | | $3,735 | | | $3,663 | | | $2,543 | | | $441 | | | $55 | |
See Notes to Financial Statements
22
Financial Highlights – continued
| | | | | | | | | | | | | | | | | | |
| | | Six months
ended
2/28/10 (unaudited) | | | Years ended 8/31 | |
| Class R2 | | | 2009 | | | 2008 | | | 2007 | | | 2006 | | | 2005 | |
| | | | | | | | | | | | | | | | | |
Net asset value, beginning of period | | $13.62 | | | $16.45 | | | $19.53 | | | $17.97 | | | $17.74 | | | $15.29 | |
| Income (loss) from investment operations | | | | | | | | | | | | | | | | | | |
Net investment income (loss) (d) | | $0.04 | | | $0.10 | | | $0.06 | | | $(0.01 | ) | | $(0.03 | ) | | $(0.04 | ) |
Net realized and unrealized gain (loss) on investments and foreign currency | | 1.33 | | | (2.87 | ) | | (1.68 | ) | | 2.96 | | | 1.06 | | | 2.49 | |
Total from investment operations | | $1.37 | | | $(2.77 | ) | | $(1.62 | ) | | $2.95 | | | $1.03 | | | $2.45 | |
| Less distributions declared to shareholders | | | | | | | | | | | | | | | | | | |
From net investment income | | $(0.10 | ) | | $(0.06 | ) | | $— | | | $— | | | $— | | | $— | |
From net realized gain on investments | | — | | | — | | | (1.46 | ) | | (1.39 | ) | | (0.80 | ) | | — | |
Total distributions declared to shareholders | | $(0.10 | ) | | $(0.06 | ) | | $(1.46 | ) | | $(1.39 | ) | | $(0.80 | ) | | $— | |
Net asset value, end of period | | $14.89 | | | $13.62 | | | $16.45 | | | $19.53 | | | $17.97 | | | $17.74 | |
Total return (%) (r)(s) | | 10.11 | (n) | | (16.71 | ) | | (9.08 | ) | | 16.88 | | | 5.96 | | | 16.02 | |
| Ratios (%) (to average net assets) and Supplemental data: | | | | | | | | | | | | | | | | | | |
Expenses before expense
reductions (f) | | 1.49 | (a) | | 1.56 | | | 1.45 | | | 1.61 | | | 1.77 | | | 1.81 | |
Expenses after expense
reductions (f) | | 1.47 | (a) | | 1.41 | | | 1.41 | | | 1.58 | | | 1.67 | | | 1.81 | |
Expenses after expense reductions excluding short sale dividend and interest expense (f) | | N/A | | | 1.41 | | | N/A | | | N/A | | | N/A | | | N/A | |
Net investment income (loss) | | 0.57 | (a) | | 0.82 | | | 0.34 | | | (0.05 | ) | | (0.15 | ) | | (0.22 | ) |
Portfolio turnover | | 37 | | | 109 | | | 86 | | | 283 | | | 138 | | | 81 | |
Net assets at end of period
(000 omitted) | | $16,136 | | | $15,483 | | | $16,539 | | | $9,492 | | | $1,193 | | | $948 | |
See Notes to Financial Statements
23
Financial Highlights – continued
| | | | | | | | | | | | | | | | | | |
| | | Six months
ended
2/28/10 (unaudited) | | | Years ended 8/31 | |
| Class R3 | | | 2009 | | | 2008 | | | 2007 | | | 2006 | | | 2005 (i) | |
| | | | | | | | | | | | | | | | | |
Net asset value, beginning of period | | $13.85 | | | $16.73 | | | $19.80 | | | $18.15 | | | $17.88 | | | $17.02 | |
| Income (loss) from investment operations | | | | | | | | | | | | | | | | | | |
Net investment income (d) | | $0.06 | | | $0.13 | | | $0.10 | | | $0.05 | | | $0.05 | | | $0.01 | |
Net realized and unrealized gain (loss) on investments and foreign currency | | 1.36 | | | (2.91 | ) | | (1.71 | ) | | 2.99 | | | 1.02 | | | 0.85 | (g) |
Total from investment operations | | $1.42 | | | $(2.78 | ) | | $(1.61 | ) | | $3.04 | | | $1.07 | | | $0.86 | |
| Less distributions declared to shareholders | | | | | | | | | | | | | | | | | | |
From net investment income | | $(0.13 | ) | | $(0.10 | ) | | $— | | | $— | | | $— | | | $— | |
From net realized gain on investments | | — | | | — | | | (1.46 | ) | | (1.39 | ) | | (0.80 | ) | | — | |
Total distributions declared to shareholders | | $(0.13 | ) | | $(0.10 | ) | | $(1.46 | ) | | $(1.39 | ) | | $(0.80 | ) | | $— | |
Net asset value, end of period | | $15.14 | | | $13.85 | | | $16.73 | | | $19.80 | | | $18.15 | | | $17.88 | |
Total return (%) (r)(s) | | 10.25 | (n) | | (16.48 | ) | | (8.90 | ) | | 17.22 | | | 6.14 | | | 5.05 | (n) |
| Ratios (%) (to average net assets) and Supplemental data: | | | | | | | | | | | | | | | | | | |
Expenses before expense
reductions (f) | | 1.24 | (a) | | 1.32 | | | 1.19 | | | 1.36 | | | 1.37 | | | 1.43 | (a) |
Expenses after expense
reductions (f) | | 1.22 | (a) | | 1.16 | | | 1.17 | | | 1.36 | | | 1.37 | | | 1.43 | (a) |
Expenses after expense reductions excluding short sale dividend and interest expense (f) | | N/A | | | 1.16 | | | N/A | | | N/A | | | N/A | | | N/A | |
Net investment income | | 0.82 | (a) | | 1.07 | | | 0.57 | | | 0.24 | | | 0.27 | | | 0.17 | (a) |
Portfolio turnover | | 37 | | | 109 | | | 86 | | | 283 | | | 138 | | | 81 | |
Net assets at end of period (000 omitted) | | $27,178 | | | $25,741 | | | $28,185 | | | $31,963 | | | $22,646 | | | $53 | |
See Notes to Financial Statements
24
Financial Highlights – continued
| | | | | | | | | | | | | | | | | | |
| | | Six months
ended
2/28/10 (unaudited) | | | Years ended 8/31 | |
| Class R4 | | | 2009 | | | 2008 | | | 2007 | | | 2006 | | | 2005 (i) | |
| | | | | | | | | | | | | | | | | |
Net asset value, beginning of period | | $13.98 | | | $16.92 | | | $19.96 | | | $18.24 | | | $17.90 | | | $17.02 | |
| Income (loss) from investment operations | | | | | | | | | | | | | | | | | | |
Net investment income (d) | | $0.08 | | | $0.10 | | | $0.15 | | | $0.11 | | | $0.07 | | | $0.03 | |
Net realized and unrealized gain (loss) on investments and
foreign currency | | 1.37 | | | (2.90 | ) | | (1.73 | ) | | 3.00 | | | 1.07 | | | 0.85 | (g) |
Total from investment operations | | $1.45 | | | $(2.80 | ) | | $(1.58 | ) | | $3.11 | | | $1.14 | | | $0.88 | |
| Less distributions declared to shareholders | | | | | | | | | | | | | | | | | | |
From net investment income | | $(0.16 | ) | | $(0.14 | ) | | $— | | | $— | | | $— | | | $— | |
From net realized gain on investments | | — | | | — | | | (1.46 | ) | | (1.39 | ) | | (0.80 | ) | | — | |
Total distributions declared to shareholders | | $(0.16 | ) | | $(0.14 | ) | | $(1.46 | ) | | $(1.39 | ) | | $(0.80 | ) | | $— | |
Net asset value, end of period | | $15.27 | | | $13.98 | | | $16.92 | | | $19.96 | | | $18.24 | | | $17.90 | |
Total return (%) (r)(s) | | 10.37 | (n) | | (16.28 | ) | | (8.67 | ) | | 17.54 | | | 6.54 | | | 5.17 | (n) |
| Ratios (%) (to average net assets) and Supplemental data: | | | | | | | | | | | | | | | | | | |
Expenses before expense
reductions (f) | | 0.99 | (a) | | 0.96 | | | 0.92 | | | 1.06 | | | 1.12 | | | 1.13 | (a) |
Expenses after expense
reductions (f) | | 0.97 | (a) | | 0.95 | | | 0.90 | | | 1.06 | | | 1.12 | | | 1.13 | (a) |
Expenses after expense reductions excluding short sale dividend and interest expense (f) | | N/A | | | 0.95 | | | N/A | | | N/A | | | N/A | | | N/A | |
Net investment income | | 1.07 | (a) | | 0.75 | | | 0.83 | | | 0.55 | | | 0.40 | | | 0.47 | (a) |
Portfolio turnover | | 37 | | | 109 | | | 86 | | | 283 | | | 138 | | | 81 | |
Net assets at end of period (000 omitted) | | $1,813 | | | $1,633 | | | $60 | | | $66 | | | $56 | | | $53 | |
See Notes to Financial Statements
25
Financial Highlights – continued
Any redemption fees charged by the fund during the 2005 fiscal year resulted in a per share impact of less than $0.01.
| (d) | Per share data is based on average shares outstanding. |
| (f) | Ratios do not reflect reductions from fees paid indirectly, if applicable. |
| (g) | The per share amount varies from the net realized and unrealized gain/loss for the period because of the timing of sales of fund shares and the per share amount of realized and unrealized gains and losses at such time. |
| (i) | For the period from the class’ inception, April 1, 2005 (Classes R1, R3, and R4) through the stated period end. |
| (r) | Certain expenses have been reduced without which performance would have been lower. |
| (s) | From time to time the fund may receive proceeds from litigation settlements, without which performance would be lower. Excluding the effect of the proceeds received from a non-recurring litigation settlement against Enron Corp., the Class A, Class B, Class C, Class I, Class R1, Class R2, Class R3, and Class R4 total returns for the year ended August 31, 2009 would have been lower by approximately 2.41%, 2.40%, 2.42%, 2.40%, 2.40%, 2.36%, 2.40% and 2.40%, respectively. |
| (t) | Total returns do not include any applicable sales charges. |
| (w) | Per share amount was less than $0.01. |
See Notes to Financial Statements
26
NOTES TO FINANCIAL STATEMENTS
(unaudited)
| (1) | | Business and Organization |
MFS Core Equity Fund (the fund) is a series of MFS Series Trust I (the trust). The trust is organized as a Massachusetts business trust and is registered under the Investment Company Act of 1940, as amended, as an open-end management investment company.
| (2) | | Significant Accounting Policies |
General – The preparation of financial statements in conformity with U.S. generally accepted accounting principles requires management to make estimates and assumptions that affect the reported amounts of assets and liabilities, and disclosure of contingent assets and liabilities at the date of the financial statements and the reported amounts of revenues and expenses during the reporting period. Actual results could differ from those estimates. In the preparation of these financial statements, management has evaluated subsequent events occurring after the date of the fund’s Statement of Assets and Liabilities through the date that the financial statements were issued. The fund can invest in foreign securities, including securities of emerging market issuers. Investments in foreign securities are vulnerable to the effects of changes in the relative values of the local currency and the U.S. dollar and to the effects of changes in each country’s legal, political, and economic environment. The markets of emerging markets countries are generally more volatile than the markets of developed countries with more mature economies. All of the risks of investing in foreign securities previously described are heightened when investing in emerging markets countries.
Investment Valuations – Equity securities, including restricted equity securities, are generally valued at the last sale or official closing price as provided by a third-party pricing service on the market or exchange on which they are primarily traded. Equity securities, for which there were no sales reported that day, are generally valued at the last quoted daily bid quotation as provided by a third-party pricing service on the market or exchange on which such securities are primarily traded. Equity securities held short, for which there were no sales reported for that day, are generally valued at the last quoted daily ask quotation as provided by a third-party pricing service on the market or exchange on which such securities are primarily traded. Short-term instruments with a maturity at issuance of 60 days or less generally are valued at amortized cost, which approximates market value. Open-end investment companies are generally valued at net asset value per share. Securities and other assets generally valued on the basis of information from a third-party pricing service may also be valued at a broker/dealer bid quotation. Values obtained from third-party pricing services can utilize both transaction data and
27
Notes to Financial Statements (unaudited) – continued
market information such as yield, quality, coupon rate, maturity, type of issue, trading characteristics, and other market data. The values of foreign securities and other assets and liabilities expressed in foreign currencies are converted to U.S. dollars using the mean of bid and asked prices for rates provided by a third-party pricing service.
The Board of Trustees has delegated primary responsibility for determining or causing to be determined the value of the fund’s investments (including any fair valuation) to the adviser pursuant to valuation policies and procedures approved by the Board. If the adviser determines that reliable market quotations are not readily available, investments are valued at fair value as determined in good faith by the adviser in accordance with such procedures under the oversight of the Board of Trustees. Under the fund’s valuation policies and procedures, market quotations are not considered to be readily available for most types of debt instruments and floating rate loans and many types of derivatives. These investments are generally valued at fair value based on information from third-party pricing services. In addition, investments may be valued at fair value if the adviser determines that an investment’s value has been materially affected by events occurring after the close of the exchange or market on which the investment is principally traded (such as foreign exchange or market) and prior to the determination of the fund’s net asset value, or after the halting of trading of a specific security where trading does not resume prior to the close of the exchange or market on which the security is principally traded. Events that occur on a frequent basis after foreign markets close (such as developments in foreign markets and significant movements in the U.S. markets) and prior to the determination of the fund’s net asset value may be deemed to have a material effect on the value of securities traded in foreign markets. Accordingly, the fund’s foreign equity securities may often be valued at fair value. The adviser generally relies on third-party pricing services or other information (such as the correlation with price movements of similar securities in the same or other markets; the type, cost and investment characteristics of the security; the business and financial condition of the issuer; and trading and other market data) to assist in determining whether to fair value and at what value to fair value an investment. The value of an investment for purposes of calculating the fund’s net asset value can differ depending on the source and method used to determine value. When fair valuation is used, the value of an investment used to determine the fund’s net asset value may differ from quoted or published prices for the same investment. There can be no assurance that the fund could obtain the fair value assigned to an investment if it were to sell the investment at the same time at which the fund determines its net asset value per share.
28
Notes to Financial Statements (unaudited) – continued
Various inputs are used in determining the value of the fund’s assets or liabilities. These inputs are categorized into three broad levels. In certain cases, the inputs used to measure fair value may fall into different levels of the fair value hierarchy. In such cases, an investment’s level within the fair value hierarchy is based on the lowest level of input that is significant to the fair value measurement. The fund’s assessment of the significance of a particular input to the fair value measurement in its entirety requires judgment, and considers factors specific to the investment. Level 1 includes unadjusted quoted prices in active markets for identical assets or liabilities. Level 2 includes other significant observable market-based inputs (including quoted prices for similar securities, interest rates, prepayment speed, and credit risk). Level 3 includes unobservable inputs, which may include the adviser’s own assumptions in determining the fair value of investments. Other financial instruments are derivative instruments not reflected in total investments, such as futures, forwards, swap contracts, and written options. The following is a summary of the levels used as of February 28, 2010 in valuing the fund’s assets or liabilities:
| | | | | | | | |
| Investments at Value | | Level 1 | | Level 2 | | Level 3 | | Total |
| Equity Securities: | | | | | | | | |
United States | | $754,544,848 | | $4,083,516 | | $— | | $758,628,364 |
Canada | | 14,664,096 | | — | | — | | 14,664,096 |
Israel | | 5,027,038 | | — | | — | | 5,027,038 |
Greece | | 2,618,951 | | — | | — | | 2,618,951 |
United Kingdom | | — | | — | | 1,382,742 | | 1,382,742 |
Panama | | 974,669 | | — | | — | | 974,669 |
| Mutual Funds | | 12,505,280 | | — | | — | | 12,505,280 |
| Total Investments | | $790,334,882 | | $4,083,516 | | $1,382,742 | | $795,801,140 |
Country disclosure is based on the country of domicile. For further information regarding security characteristics, see the Portfolio of Investments.
The following is a reconciliation of Level 3 assets for which significant unobservable inputs were used to determine fair value. The table presents the activity of Level 3 securities held at the beginning and the end of the period.
| | |
| | | Equity
Securities |
| Balance as of 8/31/09 | | $1,218,717 |
Accrued discounts/premiums | | — |
Realized gain (loss) | | — |
Change in unrealized appreciation (depreciation) | | 164,025 |
Net purchases (sales) | | — |
Transfers in and/or out of Level 3 | | — |
| Balance as of 2/28/10 | | $1,382,742 |
29
Notes to Financial Statements (unaudited) – continued
The net change in unrealized appreciation (depreciation) from investments still held as level 3 at February 28, 2010 is $164,025.
In January 2010, Accounting Standards Update (ASU) No. 2010-06, Improving Disclosures about Fair Value Measurements (the “Update”) was issued, and is effective for interim and annual reporting periods beginning after December 15, 2009. This Update provides for expanded disclosures about fair value measurements. Management has evaluated the application of the Update to the fund, and believes the impact is limited to expanded disclosures resulting from the adoption of this Update in the fund’s financial statements.
Foreign Currency Translation – Purchases and sales of foreign investments, income, and expenses are converted into U.S. dollars based upon currency exchange rates prevailing on the respective dates of such transactions or on the reporting date for foreign denominated receivables and payables. Gains and losses attributable to foreign currency exchange rates on sales of securities are recorded for financial statement purposes as net realized gains and losses on investments. Gains and losses attributable to foreign exchange rate movements on receivables, payables, income and expenses are recorded for financial statement purposes as foreign currency transaction gains and losses. That portion of both realized and unrealized gains and losses on investments that results from fluctuations in foreign currency exchange rates is not separately disclosed.
Derivatives – The fund may use derivatives for different purposes, including to earn income and enhance returns, to increase or decrease exposure to a particular market, to manage or adjust the risk profile of the fund, or as alternatives to direct investments. Derivatives may be used for hedging or non-hedging purposes. While hedging can reduce or eliminate losses, it can also reduce or eliminate gains. When the fund uses derivatives as an investment to increase market exposure, or for hedging purposes, gains and losses from derivative instruments may be substantially greater than the derivative’s original cost.
Derivative instruments include written options, purchased options, futures contracts, forward foreign currency exchange contracts, and swap agreements. At February 28, 2010, the fund did not have any outstanding derivative instruments.
Short Sales – The fund may enter into short sales whereby it sells a security it does not own in anticipation of a decline in the value of that security. The fund will realize a gain if the security price decreases and a loss if the security price increases between the date of the short sale and the date on which the fund replaces the borrowed security. Losses from short sales can exceed the proceeds of the security sold; and they can also exceed the potential loss from an ordinary buy and sell transaction. The amount of any premium, dividends, or
30
Notes to Financial Statements (unaudited) – continued
interest the fund may be required to pay in connection with a short sale will be recognized as a fund expense. The fund segregates cash or marketable securities in an amount that, when combined with the amount of proceeds from the short sale deposited with the broker, at least equals the current market value of the security sold short. For the six months ended February 28, 2010, the fund did not enter into any such transactions.
Security Loans – State Street Bank and Trust Company (“State Street”), as lending agent, may loan the securities of the fund to certain qualified institutions (the “Borrowers”) approved by the fund. The loans are collateralized by cash and/or U.S. Treasury and federal agency obligations in an amount typically at least equal to the market value of the securities loaned. The market value of the loaned securities is determined at the close of business of the fund and any additional required collateral is delivered to the fund on the next business day. State Street provides the fund with indemnification against Borrower default. The fund bears the risk of loss with respect to the investment of cash collateral. On loans collateralized by cash, the cash collateral is invested in a money market fund or short-term securities. A portion of the income generated upon investment of the collateral is remitted to the Borrowers, and the remainder is allocated between the fund and the lending agent. On loans collateralized by U.S. Treasury and/or federal agency obligations, a fee is received from the Borrower, and is allocated between the fund and the lending agent. Income from securities lending is included in interest income on the Statement of Operations. The dividend and interest income earned on the securities loaned is accounted for in the same manner as other dividend and interest income.
Indemnifications – Under the fund’s organizational documents, its officers and Trustees may be indemnified against certain liabilities and expenses arising out of the performance of their duties to the fund. Additionally, in the normal course of business, the fund enters into agreements with service providers that may contain indemnification clauses. The fund’s maximum exposure under these agreements is unknown as this would involve future claims that may be made against the fund that have not yet occurred.
Investment Transactions and Income – Investment transactions are recorded on the trade date. Interest income is recorded on the accrual basis. All premium and discount is amortized or accreted for financial statement purposes in accordance with U.S. generally accepted accounting principles. Dividends received in cash are recorded on the ex-dividend date. Certain dividends from foreign securities will be recorded when the fund is informed of the dividend if such information is obtained subsequent to the ex-dividend
date. Dividend and interest payments received in additional securities are
31
Notes to Financial Statements (unaudited) – continued
recorded on the ex-dividend or ex-interest date in an amount equal to the value of the security on such date.
The fund may receive proceeds from litigation settlements. Any proceeds received from litigation involving portfolio holdings are reflected in the Statement of Operations in realized gain/loss if the security has been disposed of by the fund or in unrealized gain/loss if the security is still held by the fund. Any other proceeds from litigation not related to portfolio holdings are reflected as other income in the Statement of Operations.
Fees Paid Indirectly – The fund’s custody fee may be reduced according to an arrangement that measures the value of cash deposited with the custodian by the fund. This amount, for the six months ended February 28, 2010, is shown as a reduction of total expenses on the Statement of Operations.
Tax Matters and Distributions – The fund intends to qualify as a regulated investment company, as defined under Subchapter M of the Internal Revenue Code, and to distribute all of its taxable income, including realized capital gains. As a result, no provision for federal income tax is required. The fund’s federal tax returns for the prior three fiscal years remain subject to examination by the Internal Revenue Service. Foreign taxes, if any, have been accrued by the fund in the accompanying financial statements.
Distributions to shareholders are recorded on the ex-dividend date. Income and capital gain distributions are determined in accordance with income tax regulations, which may differ from U.S. generally accepted accounting principles. Certain capital accounts in the financial statements are periodically adjusted for permanent differences in order to reflect their tax character. These adjustments have no impact on net assets or net asset value per share. Temporary differences which arise from recognizing certain items of income, expense, gain or loss in different periods for financial statement and tax purposes will reverse at some time in the future. Distributions in excess of net investment income or net realized gains are temporary overdistributions for financial statement purposes resulting from differences in the recognition or classification of income or distributions for financial statement and tax purposes.
Book/tax differences primarily relate to expiration of capital loss carryforwards, wash sale loss deferrals, and capital loss carryforwards and wash sale loss deferrals assumed as a result of the acquisition of the MFS New Endeavor Fund.
The tax character of distributions made during the current period will be determined at fiscal year end. The tax character of distributions declared to shareholders for the last fiscal year is as follows:
| | |
| | | 8/31/09 |
Ordinary income (including any short-term
capital gains) | | $3,543,509 |
32
Notes to Financial Statements (unaudited) – continued
The federal tax cost and the tax basis components of distributable earnings were as follows:
| | | |
| As of 2/28/10 | | | |
| Cost of investments | | $788,157,131 | |
| Gross appreciation | | 74,579,212 | |
| Gross depreciation | | (66,935,203 | ) |
| Net unrealized appreciation (depreciation) | | $7,644,009 | |
| |
| As of 8/31/09 | | | |
| Undistributed ordinary income | | 5,587,093 | |
| Capital loss carryforwards | | (221,165,513 | ) |
| Post-October capital loss deferral | | (160,427,778 | ) |
| Other temporary differences | | (114,097 | ) |
| Net unrealized appreciation (depreciation) | | (26,607,493 | ) |
The aggregate cost above includes prior fiscal year end tax adjustments.
As of August 31, 2009, the fund had capital loss carryforwards available to offset future realized gains. Such losses expire as follows:
| | | |
| 8/31/10 | | $(74,153,956 | ) |
| 8/31/16 | | (48,648,322 | ) |
| 8/31/17 | | (98,363,235 | ) |
| | $(221,165,513 | ) |
The availability of a portion of the capital loss carryforwards, which were acquired on June 22, 2007 and July 24, 2009, in connection with the acquisition of the MFS Capital Opportunities Fund and the MFS New Endeavor Fund, respectively, may be limited in a given year.
Multiple Classes of Shares of Beneficial Interest – The fund offers multiple classes of shares, which differ in their respective distribution and service fees. The fund’s income, realized and unrealized gain (loss), and common expenses are allocated to shareholders based on the daily net assets of each class. Dividends are declared separately for each class. Differences in per share dividend rates are generally due to differences in separate class expenses. Class B shares will convert to Class A shares approximately eight years after purchase. The fund’s distributions declared to shareholders as reported on the Statements of Changes in Net Assets are presented by class as follows:
33
Notes to Financial Statements (unaudited) – continued
| | | | |
| | | From net investment income |
| | | Six months ended
2/28/10 | | Year ended
8/31/09 |
| Class A | | $4,779,998 | | $3,180,163 |
| Class B | | 17,075 | | — |
| Class C | | 244,298 | | — |
| Class I | | 168,467 | | 141,605 |
| Class R1 | | 17,743 | | — |
| Class R2 | | 114,882 | | 59,248 |
| Class R3 | | 229,697 | | 161,981 |
| Class R4 | | 18,209 | | 512 |
| Total | | $5,590,369 | | $3,543,509 |
| (3) | | Transactions with Affiliates |
Investment Adviser – The fund has an investment advisory agreement with MFS to provide overall investment management and related administrative services and facilities to the fund. The management fee is computed daily and paid monthly at the following annual rates:
| | | |
| First $500 million of average daily net assets | | 0.65 | % |
| Average daily net assets in excess of $500 million | | 0.55 | % |
The management fee incurred for the six months ended February 28, 2010 was equivalent to an annual effective rate of 0.61% of the fund’s average daily net assets.
At the commencement of the period until December 31, 2009, the investment adviser had agreed in writing to pay a portion of the fund’s total annual operating expenses, exclusive of interest, taxes, extraordinary expenses, brokerage and transaction costs, and investment-related expenses, such that total annual fund operating expenses did not exceed the following rates annually of the fund’s average daily net assets.
| | | | | | | | | | | | | | |
| Class A | | Class B | | Class C | | Class I | | Class R1 | | Class R2 | | Class R3 | | Class R4 |
| 1.21% | | 1.96% | | 1.96% | | 0.96% | | 1.96% | | 1.46% | | 1.21% | | 0.96% |
Effective January 1, 2010, the investment adviser has agreed in writing to pay a portion of the fund’s total annual operating expenses, exclusive of interest, taxes, extraordinary expenses, brokerage and transaction costs, and investment related expenses, such that total annual fund operating expenses do not exceed the following rates annually of the fund’s average daily net assets.
| | | | | | | | | | | | | | |
| Class A | | Class B | | Class C | | Class I | | Class R1 | | Class R2 | | Class R3 | | Class R4 |
| 1.26% | | 2.01% | | 2.01% | | 1.01% | | 2.01% | | 1.51% | | 1.26% | | 1.01% |
34
Notes to Financial Statements (unaudited) – continued
This written agreement will continue until modified by the fund’s Board of Trustees, but such agreement will continue at least until December 31, 2010. For the six months ended February 28, 2010, the reductions under these agreements amounted to $53,922 and are reflected as a reduction of total expenses in the Statement of Operations.
Distributor – MFS Fund Distributors, Inc. (MFD), a wholly-owned subsidiary of MFS, as distributor, received $27,353 for the six months ended February 28, 2010, as its portion of the initial sales charge on sales of Class A shares of the fund.
The Board of Trustees has adopted a distribution plan for certain class shares pursuant to Rule 12b-1 of the Investment Company Act of 1940.
The fund’s distribution plan provides that the fund will pay MFD for services provided by MFD and financial intermediaries in connection with the distribution and servicing of certain share classes. One component of the plan is a distribution fee paid to MFD and another component of the plan is a service fee paid to MFD. MFD may subsequently pay all, or a portion, of the distribution and/or service fees to financial intermediaries.
Distribution Plan Fee Table:
| | | | | | | | | | | | | | |
| | | Distribution
Fee Rate (d) | | | Service
Fee Rate (d) | | | Total
Distribution
Plan (d) | | | Annual
Effective
Rate (e) | | | Distribution
and Service
Fee |
| Class A | | — | | | 0.25 | % | | 0.25 | % | | 0.25 | % | | $725,810 |
| Class B | | 0.75 | % | | 0.25 | % | | 1.00 | % | | 1.00 | % | | 379,791 |
| Class C | | 0.75 | % | | 0.25 | % | | 1.00 | % | | 1.00 | % | | 331,199 |
| Class R1 | | 0.75 | % | | 0.25 | % | | 1.00 | % | | 1.00 | % | | 18,885 |
| Class R2 | | 0.25 | % | | 0.25 | % | | 0.50 | % | | 0.50 | % | | 39,744 |
| Class R3 | | — | | | 0.25 | % | | 0.25 | % | | 0.25 | % | | 33,350 |
| Total Distribution and Service Fees | | | | | | | | | $1,528,779 |
| (d) | In accordance with the distribution plan for certain classes, the fund pays distribution and/or service fees equal to these annual percentage rates of each class’ average daily net assets. The distribution and service fee rates disclosed by class represent the current rates in effect at the end of the reporting period. Any rate changes, if applicable, are detailed below. |
| (e) | The annual effective rates represent actual fees incurred under the distribution plan for the six months ended February 28, 2010 based on each class’ average daily net assets. Assets attributable to Class A shares sold prior to October 1, 1989 with respect to shares that were acquired as part of the reorganization of MFS Capital Opportunities Fund into MFS Core Equity are subject to a service fee of 0.15% annually. |
Certain Class A shares purchased on or subsequent to September 1, 2008 are subject to a CDSC in the event of a shareholder redemption within 24 months of purchase. Class C shares are subject to a CDSC in the event of a shareholder redemption within 12 months of purchase. Class B shares are subject to a CDSC in the event of a shareholder redemption within six years of purchase. All
35
Notes to Financial Statements (unaudited) – continued
contingent deferred sales charges are paid to MFD and during the six months ended February 28, 2010, were as follows:
| | |
| | | Amount |
| Class A | | $765 |
| Class B | | 35,326 |
| Class C | | 1,278 |
Shareholder Servicing Agent – MFS Service Center, Inc. (MFSC), a wholly-owned subsidiary of MFS, receives a fee from the fund for its services as shareholder servicing agent calculated as a percentage of the average daily net assets of the fund as determined periodically under the supervision of the fund’s Board of Trustees. For the six months ended February 28, 2010, the fee was $509,950, which equated to 0.1295% annually of the fund’s average daily net assets. MFSC also receives payment from the fund for out-of-pocket expenses, sub-accounting and other shareholder servicing costs which may be paid to affiliated and unaffiliated service providers. For the six months ended February 28, 2010, these out-of-pocket expenses, sub-accounting and other shareholder servicing costs amounted to $613,934.
Administrator – MFS provides certain financial, legal, shareholder communications, compliance, and other administrative services to the fund. Under an administrative services agreement, the fund partially reimburses MFS the costs incurred to provide these services. The fund is charged an annual fixed amount of $17,500 plus a fee based on average daily net assets. The administrative services fee incurred for the six months ended February 28, 2010 was equivalent to an annual effective rate of 0.0161% of the fund’s average daily net assets.
Trustees’ and Officers’ Compensation – The fund pays compensation to independent Trustees in the form of a retainer, attendance fees, and additional compensation to Board and Committee chairpersons. The fund does not pay compensation directly to Trustees or officers of the fund who are also officers of the investment adviser, all of whom receive remuneration for their services to the fund from MFS. Certain officers and Trustees of the fund are officers or directors of MFS, MFD, and MFSC.
Prior to December 31, 2001, the fund had an unfunded defined benefit plan (“DB plan”) for independent Trustees. As of December 31, 2001, the Board took action to terminate the DB plan with respect to then-current and any future independent Trustees, such that the DB Plan covers only certain of those former independent Trustees who retired on or before December 31, 2001. Effective January 1, 2002, accrued benefits under the DB Plan for then current independent Trustees who continued were credited to an unfunded retirement deferral plan (the “Retirement Deferral plan”), which was established for and exists solely with respect to these credited amounts, and is not available for
36
Notes to Financial Statements (unaudited) – continued
other deferrals by these or other independent Trustees. Although the Retirement Deferral plan is unfunded, amounts deferred under the plan are periodically adjusted for investment experience as if they had been invested in shares of the fund. The DB Plan resulted in a pension expense of $5,010 and the Retirement Deferral plan resulted in an expense of $9,170. Both amounts are included in independent Trustees’ compensation for the six months ended February 28, 2010. The liability for deferred retirement benefits payable to certain independent Trustees under both Plans amounted to $132,940 at February 28, 2010, and is included in payable for independent Trustees’ compensation on the Statement of Assets and Liabilities.
Other – This fund and certain other funds managed by MFS (the funds) have entered into services agreements (the Agreements) which provide for payment of fees by the funds to Tarantino LLC and Griffin Compliance LLC in return for the provision of services of an Independent Chief Compliance Officer (ICCO) and Assistant ICCO, respectively, for the funds. The ICCO and Assistant ICCO are officers of the funds and the sole members of Tarantino LLC and Griffin Compliance LLC, respectively. The funds can terminate the Agreements with Tarantino LLC and Griffin Compliance LLC at any time under the terms of the Agreements. For the six months ended February 28, 2010, the aggregate fees paid by the fund to Tarantino LLC and Griffin Compliance LLC were $4,820 and are included in miscellaneous expense on the Statement of Operations. MFS has agreed to reimburse the fund for a portion of the payments made by the fund in the amount of $1,593, which is shown as a reduction of total expenses in the Statement of Operations. Additionally, MFS has agreed to bear all expenses associated with office space, other administrative support, and supplies provided to the ICCO and Assistant ICCO.
The fund may invest in the MFS Institutional Money Market Portfolio which is managed by MFS and seeks a high level of current income consistent with preservation of capital and liquidity. Income earned on this investment is included in dividends from underlying funds on the Statement of Operations. This money market fund does not pay a management fee to MFS.
Purchases and sales of investments, other than U.S. Government securities, purchased option transactions, and short-term obligations, aggregated $285,294,963 and $331,386,392, respectively.
37
Notes to Financial Statements (unaudited) – continued
| (5) | | Shares of Beneficial Interest |
The fund’s Declaration of Trust permits the Trustees to issue an unlimited number of full and fractional shares of beneficial interest. Transactions in fund shares were as follows:
| | | | | | | | |
| | | Six months ended
2/28/10 | | Year ended
8/31/09 |
| | | Shares | | Amount | | Shares | | Amount |
| Shares sold | | | | | | | | |
Class A | | 2,176,343 | | $32,524,100 | | 8,482,415 | | $100,729,655 |
Class B | | 170,194 | | 2,333,599 | | 738,200 | | 8,054,369 |
Class C | | 198,004 | | 2,684,144 | | 297,337 | | 3,281,371 |
Class I | | 35,587 | | 548,482 | | 116,989 | | 1,586,423 |
Class R1 | | 40,438 | | 551,663 | | 115,075 | | 1,324,614 |
Class R2 | | 99,393 | | 1,463,514 | | 339,614 | | 4,100,924 |
Class R3 | | 167,733 | | 2,506,361 | | 425,233 | | 5,161,333 |
Class R4 | | 3,520 | | 52,352 | | 140,923 | | 1,794,179 |
| | 2,891,212 | | $42,664,215 | | 10,655,786 | | $126,032,868 |
| Shares issued in connection with acquisition of MFS New Endeavor Fund | | | | | | | | |
Class A | | — | | $— | | 3,289,862 | | $43,919,660 |
Class B | | — | | — | | 1,088,292 | | 13,418,637 |
Class C | | — | | — | | 761,588 | | 9,354,503 |
Class I | | — | | — | | 89,575 | | 1,243,296 |
Class R1 | | — | | — | | 6,912 | | 84,898 |
Class R2 | | — | | — | | 104,964 | | 1,376,082 |
Class R3 | | — | | — | | 24,998 | | 333,257 |
Class R4 | | — | | — | | 10,154 | | 136,659 |
| | — | | $— | | 5,376,345 | | $69,866,992 |
| Shares issued to shareholders in reinvestment of distributions | | | | | | | | |
Class A | | 292,183 | | $4,347,677 | | 269,553 | | $2,911,168 |
Class B | | 1,182 | | 16,329 | | — | | — |
Class C | | 15,133 | | 207,482 | | — | | — |
Class I | | 10,344 | | 159,905 | | 12,549 | | 140,677 |
Class R1 | | 1,296 | | 17,743 | | — | | — |
Class R2 | | 7,679 | | 112,189 | | 5,425 | | 57,610 |
Class R3 | | 15,468 | | 229,697 | | 15,026 | | 161,981 |
Class R4 | | 215 | | 3,215 | | 47 | | 512 |
| | 343,500 | | $5,094,237 | | 302,600 | | $3,271,948 |
38
Notes to Financial Statements (unaudited) – continued
| | | | | | | | | | | | |
| | | Six months ended
2/28/10 | | | Year ended
8/31/09 | |
| | | Shares | | | Amount | | | Shares | | | Amount | |
| Shares reacquired | | | | | | | | | | | | |
Class A | | (3,961,715 | ) | | $(58,682,154 | ) | | (10,537,901 | ) | | $(123,230,409 | ) |
Class B | | (1,399,936 | ) | | (19,394,566 | ) | | (6,102,644 | ) | | (66,479,026 | ) |
Class C | | (471,813 | ) | | (6,435,132 | ) | | (1,189,587 | ) | | (12,922,363 | ) |
Class I | | (58,149 | ) | | (905,963 | ) | | (115,127 | ) | | (1,598,601 | ) |
Class R1 | | (50,211 | ) | | (680,014 | ) | | (67,217 | ) | | (733,426 | ) |
Class R2 | | (159,892 | ) | | (2,345,649 | ) | | (318,704 | ) | | (3,816,946 | ) |
Class R3 | | (246,005 | ) | | (3,643,048 | ) | | (291,286 | ) | | (3,338,374 | ) |
Class R4 | | (1,779 | ) | | (25,669 | ) | | (37,915 | ) | | (467,544 | ) |
| | (6,349,500 | ) | | $(92,112,195 | ) | | (18,660,381 | ) | | $(212,586,689 | ) |
| Net change | | | | | | | | | | | | |
Class A | | (1,493,189 | ) | | $(21,810,377 | ) | | 1,503,929 | | | $24,330,074 | |
Class B | | (1,228,560 | ) | | (17,044,638 | ) | | (4,276,152 | ) | | (45,006,020 | ) |
Class C | | (258,676 | ) | | (3,543,506 | ) | | (130,662 | ) | | (286,489 | ) |
Class I | | (12,218 | ) | | (197,576 | ) | | 103,986 | | | 1,371,795 | |
Class R1 | | (8,477 | ) | | (110,608 | ) | | 54,770 | | | 676,086 | |
Class R2 | | (52,820 | ) | | (769,946 | ) | | 131,299 | | | 1,717,670 | |
Class R3 | | (62,804 | ) | | (906,990 | ) | | 173,971 | | | 2,318,197 | |
Class R4 | | 1,956 | | | 29,898 | | | 113,209 | | | 1,463,806 | |
| | (3,114,788 | ) | | $(44,353,743 | ) | | (2,325,650 | ) | | $(13,414,881 | ) |
The fund and certain other funds managed by MFS participate in a $1.1 billion unsecured committed line of credit, subject to a $1 billion sublimit, provided by a syndication of banks under a credit agreement. Borrowings may be made for temporary financing needs. Interest is charged to each fund, based on its borrowings, generally at a rate equal to the higher of the Federal Reserve funds rate or one month LIBOR plus an agreed upon spread. A commitment fee, based on the average daily, unused portion of the committed line of credit, is allocated among the participating funds at the end of each calendar quarter. In addition, the fund and other funds managed by MFS have established unsecured uncommitted borrowing arrangements with certain banks for temporary financing needs. Interest is charged to each fund, based on its borrowings, at a rate equal to the Federal Reserve funds rate plus an agreed upon spread. For the six months ended February 28, 2010, the fund’s commitment fee and interest expense were $5,940 and $0, respectively, and are included in miscellaneous expense on the Statement of Operations.
| (7) | | Transactions in Underlying Funds-Affiliated Issuers |
An affiliated issuer may be considered one in which the fund owns 5% or more of the outstanding voting securities, or a company which is under common
39
Notes to Financial Statements (unaudited) – continued
control. For the purposes of this report, the fund assumes the following to be affiliated issuers:
| | | | | | | | | |
| Underlying Funds | | Beginning
Shares/Par
Amount | | Acquisitions
Shares/Par
Amount | | Dispositions
Shares/Par
Amount | | | Ending
Shares/Par
Amount |
MFS Institutional Money Market Portfolio | | 2,482,922 | | 68,168,556 | | (62,891,605 | ) | | 7,759,873 |
| | | | |
| Underlying Funds | | Realized
Gain (Loss) | | Capital Gain
Distributions | | Dividend
Income | | | Ending
Value |
MFS Institutional Money
Market Portfolio | | $— | | $— | | $4,676 | | | $7,759,873 |
At close of business on July 24, 2009, the fund acquired all of the assets and liabilities of MFS New Endeavor Fund. The acquisition was accomplished by a tax-free exchange of 5,376,345 shares of the fund (valued at $69,866,992) for all
of the assets and liabilities of MFS New Endeavor Fund. MFS New Endeavor Fund then distributed the shares of the fund that MFS New Endeavor Fund received from the fund to its shareholders. MFS New Endeavor Fund net assets on that date were $69,866,992, including $4,855,836 of unrealized appreciation, $36,477 of accumulated net investment income, and $51,958,958 of accumulated net realized loss on investments and foreign currency transactions. The aggregate net assets of the fund after the acquisition were $745,938,537.
40
RESULTS OF SHAREHOLDER MEETING
(unaudited)
At a special meeting of shareholders of MFS Series Trust I, which was held on January 28, 2010, the following actions were taken:
Item 1. To elect the following individuals as Trustees:
| | | | |
| | | Number of Dollars |
Nominee | | For | | Withheld Authority |
| Robert E. Butler | | 13,799,428,259.131 | | 298,698,895.701 |
| Lawrence H. Cohn | | 13,775,964,000.646 | | 322,163,154.185 |
| Maureen R. Goldfarb | | 13,797,667,920.487 | | 300,459,234.345 |
| David H. Gunning | | 13,795,139,579.854 | | 302,987,574.978 |
| William R. Gutow | | 13,798,125,706.624 | | 300,001,448.207 |
| Michael Hegarty | | 13,780,926,681.791 | | 317,200,473.041 |
| John P. Kavanaugh | | 13,799,879,923.291 | | 298,247,231.541 |
| Robert J. Manning | | 13,802,393,104.041 | | 295,734,050.791 |
| Robert C. Pozen | | 13,802,480,679.754 | | 295,646,475.078 |
| J. Dale Sherratt | | 13,779,899,981.473 | | 318,227,173.359 |
| Laurie J. Thomsen | | 13,797,678,786.081 | | 300,448,368.750 |
| Robert W. Uek | | 13,798,504,506.307 | | 299,622,648.525 |
41
BOARD REVIEW OF INVESTMENT ADVISORY AGREEMENT
A discussion regarding the Board’s most recent review and renewal of the fund’s Investment Advisory Agreement with MFS is available by clicking on the fund’s name under “Mutual Funds” in the “Products and Performance” section of the MFS Web site (mfs.com).
PROXY VOTING POLICIES AND INFORMATION
A general description of the MFS funds’ proxy voting policies and procedures is available without charge, upon request, by calling 1-800-225-2606, by visiting the Proxy Voting section of mfs.com or by visiting the SEC’s Web site at http://www.sec.gov.
Information regarding how the fund voted proxies relating to portfolio securities during the most recent twelve-month period ended June 30 is available without charge by visiting the Proxy Voting section of mfs.com or by visiting the SEC’s Web site at http://www.sec.gov.
QUARTERLY PORTFOLIO DISCLOSURE
The fund will file a complete schedule of portfolio holdings with the Securities and Exchange Commission (the Commission) for the first and third quarters of each fiscal year on Form N-Q. The fund’s Form N-Q may be reviewed and copied at the:
Public Reference Room
Securities and Exchange Commission
100 F Street, NE, Room 1580
Washington, D.C. 20549
Information on the operation of the Public Reference Room may be obtained by calling the Commission at 1-800-SEC-0330. The fund’s Form N-Q is available on the EDGAR database on the Commission’s Internet Web site at http://www.sec.gov, and copies of this information may be obtained, upon payment of a duplicating fee, by electronic request at the following e-mail address: publicinfo@sec.gov or by writing the Public Reference Section at the above address.
A shareholder can also obtain the quarterly portfolio holdings report at mfs.com.
FURTHER INFORMATION
From time to time, MFS may post important information about the fund or the MFS funds on the MFS web site (mfs.com). This information is available by visiting the “News & Commentary” section of mfs.com or by clicking on the fund’s name under “Mutual Funds” in the “Products and Performance” section of mfs.com.
42
CONTACT US
Web site
mfs.com
MFS TALK
1-800-637-8255
24 hours a day
Account service and literature
Shareholders
1-800-225-2606
Investment professionals
1-800-343-2829
Retirement plan services
1-800-637-1255
Mailing address
MFS Service Center, Inc.
P.O. Box 55824
Boston, MA 02205-5824
Overnight mail
MFS Service Center, Inc.
c/o Boston Financial Data Services
30 Dan Road
Canton, MA 02021-2809

Save paper with eDelivery. MFS® will send you prospectuses, reports, and proxies directly via e-mail so you will get information faster with less mailbox clutter. To sign up: 1. go to mfs.com. 2. log in via MFS® Access. 3. select eDelivery. If you own your MFS fund shares through a financial institution or a retirement plan, MFS® TALK, MFS Access, and eDelivery may not be available to you.


MFS® Core Growth Fund
The report is prepared for the general information of shareholders. It is authorized for distribution to prospective investors only when preceded or accompanied by a current prospectus.
NOT FDIC INSURED Ÿ MAY LOSE VALUE Ÿ
NO BANK GUARANTEE
2/28/10
CGF-SEM

LETTER FROM THE CEO
Dear Shareholders:
After having suffered their biggest declines since the Great Depression, most global markets experienced an impressive resurgence during the latter months of 2009 and the first quarter of 2010. The global economy was able to reap the benefits of two major trends. The first of these was the massive efforts of governments and central banks to increase liquidity in the financial system as they sought to prevent the credit crisis from further affecting the banking system. The second was the move by companies around the world to cut costs and operations to prepare for rapidly changing market conditions. We believe that these moves not only shortened the length of the downturn but also set the stage for the recovery we are seeing today.
Even with the significant market gains of 2009 and the early part of 2010, the recovery is unrolling at a moderate pace, with rebounds in the manufacturing sector and corporate America leading the way. Central bankers are proceeding with caution and have held benchmark interest rates unchanged as they debate the best way to withdraw stimulus measures without disrupting the fragile growth process.
While hurdles remain, we believe that the global economy is on the road to recovery. As always, we continue to be mindful of the many challenges faced at the individual, national, and international levels. It is at times such as these that we want to remind investors of the merits of maintaining a long-term view, adhering to basic investing principles such as asset allocation and diversification, and working closely with advisors to identify and research investment opportunities. At MFS®, we take particular pride in how well mutual funds can help investors by providing the diversification that is important in any type of market climate.
Respectfully,

Robert J. Manning
Chief Executive Officer and Chief Investment Officer
MFS Investment Management®
April 15, 2010
The opinions expressed in this letter are subject to change, may not be relied upon for investment advice, and no forecasts can be guaranteed.
1
PORTFOLIO COMPOSITION
Portfolio structure
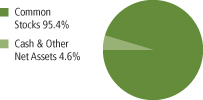
| | |
| Top ten holdings | | |
| Apple, Inc. | | 3.7% |
| Google, Inc., “A” | | 3.2% |
| Cisco Systems, Inc. | | 2.8% |
| Oracle Corp. | | 2.5% |
| Abbott Laboratories | | 1.9% |
| Danaher Corp. | | 1.6% |
| Procter & Gamble Co. | | 1.6% |
| Target Corp. | | 1.6% |
| Philip Morris International, Inc. | | 1.6% |
| Adobe Systems, Inc. | | 1.6% |
| | |
| Equity sectors | | |
| Technology | | 24.0% |
| Health Care | | 16.1% |
| Consumer Staples | | 9.3% |
| Retailing | | 8.9% |
| Leisure | | 7.8% |
| Financial Services | | 7.5% |
| Industrial Goods & Services | | 6.8% |
| Special Products & Services | | 4.2% |
| Energy | | 3.9% |
| Basic Materials | | 3.2% |
| Transportation | | 1.7% |
| Utilities & Communications | | 1.6% |
| Autos & Housing | | 0.4% |
Percentages are based on net assets as of 2/28/10.
The portfolio is actively managed and current holdings may be different.
2
MARKET ENVIRONMENT
After having suffered through one of the largest and most concentrated downturns since the 1930s, most asset markets staged a remarkable rebound during 2009. This recovery in global activity, which covers this reporting period, has been led importantly by emerging Asian economies, but broadening to include most of the global economy to varying degrees. Primary drivers of the recovery included an unwinding of the inventory destocking that took place earlier, as well as massive fiscal and monetary stimulus.
During the worst of the credit crisis, policy makers globally loosened monetary and fiscal policy on a massive scale. Having reached their lower bound on policy rates prior to the beginning of the reporting period, several central banks were implementing quantitative easing as a means to further loosen monetary policy to offset the continuing fall in global economic activity. However, by the beginning of the period, there were ever - broadening signs that the global macroeconomic deterioration had passed, which caused the subsequent rise in asset valuations. As most asset prices rebounded during the period and the demand for liquidity waned, the debate concerning the existence of asset bubbles and the need for monetary exit strategies had begun, creating added uncertainty regarding the forward path of policy rates. This changing dynamic caused asset valuations to move broadly sideways during the latter part of the period.
3
EXPENSE TABLE
Fund expenses borne by the shareholders during the period, September 1, 2009 through February 28, 2010
As a shareholder of the fund, you incur two types of costs: (1) transaction costs, including sales charges (loads) on certain purchase or redemption payments, and (2) ongoing costs, including management fees; distribution and service (12b-1) fees; and other fund expenses. This example is intended to help you understand your ongoing costs (in dollars) of investing in the fund and to compare these costs with the ongoing costs of investing in other mutual funds.
The example is based on an investment of $1,000 invested at the beginning of the period and held for the entire period September 1, 2009 through February 28, 2010.
The expenses include the payment of a portion of the transfer-agent-related expenses of MFS funds that invest in the fund. For further information, please see the Notes to the Financial Statements.
Actual Expenses
The first line for each share class in the following table provides information about actual account values and actual expenses. You may use the information in this line, together with the amount you invested, to estimate the expenses that you paid over the period. Simply divide your account value by $1,000 (for example, an $8,600 account value divided by $1,000 = 8.6), then multiply the result by the number in the first line under the heading entitled “Expenses Paid During Period” to estimate the expenses you paid on your account during this period.
Hypothetical Example for Comparison Purposes
The second line for each share class in the following table provides information about hypothetical account values and hypothetical expenses based on the fund’s actual expense ratio and an assumed rate of return of 5% per year before expenses, which is not the fund’s actual return. The hypothetical account values and expenses may not be used to estimate the actual ending account balance or expenses you paid for the period. You may use this information to compare the ongoing costs of investing in the fund and other funds. To do so, compare this 5% hypothetical example with the 5% hypothetical examples that appear in the shareholder reports of the other funds.
Please note that the expenses shown in the table are meant to highlight your ongoing costs only and do not reflect any transactional costs, such as sales charges (loads). Therefore, the second line for each share class in the table is useful in comparing ongoing costs only, and will not help you determine the relative total costs of owning different funds. In addition, if these transactional costs were included, your costs would have been higher.
4
Expense Table – continued
| | | | | | | | | | |
Share
Class | | | | Annualized
Expense
Ratio | | Beginning
Account Value
9/01/09 | | Ending
Account Value
2/28/10 | | Expenses
Paid During
Period (p)
9/01/09-2/28/10 |
| A | | Actual | | 1.23% | | $1,000.00 | | $1,089.15 | | $6.37 |
| | Hypothetical (h) | | 1.23% | | $1,000.00 | | $1,018.70 | | $6.16 |
| B | | Actual | | 1.98% | | $1,000.00 | | $1,086.00 | | $10.24 |
| | Hypothetical (h) | | 1.98% | | $1,000.00 | | $1,014.98 | | $9.89 |
| C | | Actual | | 1.98% | | $1,000.00 | | $1,086.00 | | $10.24 |
| | Hypothetical (h) | | 1.98% | | $1,000.00 | | $1,014.98 | | $9.89 |
| I | | Actual | | 0.98% | | $1,000.00 | | $1,090.76 | | $5.08 |
| | Hypothetical (h) | | 0.98% | | $1,000.00 | | $1,019.93 | | $4.91 |
| W | | Actual | | 1.07% | | $1,000.00 | | $1,091.01 | | $5.55 |
| | Hypothetical (h) | | 1.07% | | $1,000.00 | | $1,019.49 | | $5.36 |
| R1 | | Actual | | 1.98% | | $1,000.00 | | $1,085.50 | | $10.24 |
| | Hypothetical (h) | | 1.98% | | $1,000.00 | | $1,014.98 | | $9.89 |
| R2 | | Actual | | 1.47% | | $1,000.00 | | $1,087.64 | | $7.61 |
| | Hypothetical (h) | | 1.47% | | $1,000.00 | | $1,017.50 | | $7.35 |
| R3 | | Actual | | 1.23% | | $1,000.00 | | $1,089.37 | | $6.37 |
| | Hypothetical (h) | | 1.23% | | $1,000.00 | | $1,018.70 | | $6.16 |
| R4 | | Actual | | 0.98% | | $1,000.00 | | $1,091.01 | | $5.08 |
| | Hypothetical (h) | | 0.98% | | $1,000.00 | | $1,019.93 | | $4.91 |
| (h) | 5% class return per year before expenses. |
| (p) | Expenses paid is equal to each class’ annualized expense ratio, as shown above, multiplied by the average account value over the period, multiplied by the number of days in the period, divided by the number of days in the year. Expenses paid do not include any applicable sales charges (loads). If these transaction costs had been included, your costs would have been higher. |
5
PORTFOLIO OF INVESTMENTS
2/28/10 (unaudited)
The Portfolio of Investments is a complete list of all securities owned by your fund. It is categorized by broad-based asset classes.
| | | | | |
| Common Stocks - 95.4% | | | | | |
| Issuer | | Shares/Par | | Value ($) |
| | | | | |
| Aerospace - 3.2% | | | | | |
| Goodrich Corp. | | 194,200 | | $ | 12,745,346 |
| Honeywell International, Inc. | | 134,300 | | | 5,393,488 |
| Precision Castparts Corp. | | 113,600 | | | 12,808,400 |
| United Technologies Corp. | | 271,830 | | | 18,661,129 |
| | | | | |
| | | | | $ | 49,608,363 |
| Alcoholic Beverages - 0.7% | | | | | |
| Heineken N.V. | | 211,600 | | $ | 10,392,675 |
| | |
| Apparel Manufacturers - 1.1% | | | | | |
| NIKE, Inc., “B” | | 245,870 | | $ | 16,620,812 |
| | |
| Biotechnology - 3.4% | | | | | |
| Amgen, Inc. (a) | | 211,600 | | $ | 11,978,676 |
| Celgene Corp. (a) | | 160,640 | | | 9,561,293 |
| Genzyme Corp. (a) | | 232,540 | | | 13,301,288 |
| Gilead Sciences, Inc. (a) | | 382,060 | | | 18,189,877 |
| | | | | |
| | | | | $ | 53,031,134 |
| Broadcasting - 1.3% | | | | | |
| Discovery Communications, Inc., “A” (a) | | 147,700 | | $ | 4,600,855 |
| Walt Disney Co. | | 497,130 | | | 15,530,341 |
| | | | | |
| | | | | $ | 20,131,196 |
| Brokerage & Asset Managers - 2.7% | | | | | |
| Charles Schwab Corp. | | 523,370 | | $ | 9,582,905 |
| CME Group, Inc. | | 75,853 | | | 22,884,092 |
| Franklin Resources, Inc. | | 89,000 | | | 9,053,080 |
| | | | | |
| | | | | $ | 41,520,077 |
| Business Services - 3.4% | | | | | |
| Accenture Ltd., “A” | | 323,400 | | $ | 12,926,298 |
| Cognizant Technology Solutions Corp., “A” (a) | | 202,900 | | | 9,765,577 |
| Fidelity National Information Services, Inc. | | 33,900 | | | 764,106 |
| MasterCard, Inc., “A” | | 72,470 | | | 16,260,094 |
| Visa, Inc., “A” | | 160,780 | | | 13,711,318 |
| | | | | |
| | | | | $ | 53,427,393 |
6
Portfolio of Investments (unaudited) – continued
| | | | | |
| Issuer | | Shares/Par | | Value ($) |
| | | | | |
| Common Stocks - continued | | | | | |
| Cable TV - 1.6% | | | | | |
| DIRECTV Group, Inc., “A” (a) | | 414,900 | | $ | 14,044,365 |
| Time Warner Cable, Inc. | | 217,900 | | | 10,173,751 |
| | | | | |
| | | | | $ | 24,218,116 |
| Chemicals - 1.9% | | | | | |
| 3M Co. | | 151,410 | | $ | 12,135,512 |
| Agrium, Inc. | | 23,400 | | | 1,515,150 |
| Monsanto Co. | | 217,140 | | | 15,340,941 |
| | | | | |
| | | | | $ | 28,991,603 |
| Computer Software - 6.7% | | | | | |
| Adobe Systems, Inc. (a) | | 700,650 | | $ | 24,277,523 |
| Autodesk, Inc. (a) | | 59,700 | | | 1,664,436 |
| Intuit, Inc. (a) | | 120,200 | | | 3,889,672 |
| Microsoft Corp. | | 836,830 | | | 23,983,548 |
| Oracle Corp. | | 1,590,416 | | | 39,203,754 |
| VeriSign, Inc. (a) | | 455,800 | | | 11,358,536 |
| | | | | |
| | | | | $ | 104,377,469 |
| Computer Software - Systems - 7.8% | | | | | |
| Apple, Inc. (a) | | 278,540 | | $ | 56,994,855 |
| Dell, Inc. (a) | | 271,800 | | | 3,595,914 |
| EMC Corp. (a) | | 1,352,350 | | | 23,652,601 |
| Hewlett-Packard Co. | | 474,940 | | | 24,122,203 |
| International Business Machines Corp. | | 92,050 | | | 11,705,078 |
| | | | | |
| | | | | $ | 120,070,651 |
| Construction - 0.4% | | | | | |
| Sherwin-Williams Co. | | 95,300 | | $ | 6,040,114 |
| | |
| Consumer Products - 3.6% | | | | | |
| Avon Products, Inc. | | 325,700 | | $ | 9,914,308 |
| Church & Dwight Co., Inc. | | 127,900 | | | 8,592,322 |
| Colgate-Palmolive Co. | | 152,150 | | | 12,619,321 |
| Procter & Gamble Co. | | 387,100 | | | 24,495,688 |
| | | | | |
| | | | | $ | 55,621,639 |
| Consumer Services - 0.8% | | | | | |
| DeVry, Inc. | | 124,200 | | $ | 7,843,230 |
| Priceline.com, Inc. (a) | | 22,630 | | | 5,131,579 |
| | | | | |
| | | | | $ | 12,974,809 |
7
Portfolio of Investments (unaudited) – continued
| | | | | |
| Issuer | | Shares/Par | | Value ($) |
| | | | | |
| Common Stocks - continued | | | | | |
| Electrical Equipment - 2.9% | | | | | |
| Cooper Industries PLC | | 140,800 | | $ | 6,386,688 |
| Danaher Corp. | | 337,510 | | | 24,965,615 |
| Rockwell Automation, Inc. | | 72,700 | | | 3,932,343 |
| Tyco Electronics Ltd. | | 390,270 | | | 10,002,620 |
| | | | | |
| | | | | $ | 45,287,266 |
| Electronics - 2.2% | | | | | |
| Broadcom Corp., “A” | | 253,800 | | $ | 7,949,016 |
| Intel Corp. | | 926,660 | | | 19,024,330 |
| Linear Technology Corp. | | 56,400 | | | 1,532,388 |
| Samsung Electronics Co. Ltd. | | 9,170 | | | 5,881,955 |
| | | | | |
| | | | | $ | 34,387,689 |
| Energy - Independent - 2.0% | | | | | |
| Anadarko Petroleum Corp. | | 150,700 | | $ | 10,568,591 |
| Noble Energy, Inc. | | 76,200 | | | 5,535,168 |
| Occidental Petroleum Corp. | | 85,800 | | | 6,851,130 |
| Southwestern Energy Co. (a) | | 179,800 | | | 7,650,490 |
| | | | | |
| | | | | $ | 30,605,379 |
| Engineering - Construction - 0.1% | | | | | |
| Fluor Corp. | | 50,000 | | $ | 2,140,000 |
| | |
| Entertainment - 0.7% | | | | | |
| DreamWorks Animation, Inc., “A” (a) | | 247,490 | | $ | 10,755,915 |
| | |
| Food & Beverages - 3.4% | | | | | |
| Coca-Cola Co. | | 203,640 | | $ | 10,735,901 |
| Dr Pepper Snapple Group, Inc. | | 80,900 | | | 2,568,575 |
| Mead Johnson Nutrition Co., “A” | | 152,400 | | | 7,208,520 |
| Nestle S.A. | | 204,555 | | | 10,177,766 |
| PepsiCo, Inc. | | 347,360 | | | 21,699,579 |
| | | | | |
| | | | | $ | 52,390,341 |
| Food & Drug Stores - 1.2% | | | | | |
| Walgreen Co. | | 536,800 | | $ | 18,916,832 |
| | |
| Gaming & Lodging - 2.0% | | | | | |
| Carnival Corp. | | 133,900 | | $ | 4,815,044 |
| International Game Technology | | 484,930 | | | 8,510,522 |
| Las Vegas Sands Corp. (a) | | 450,500 | | | 7,491,815 |
| Royal Caribbean Cruises Ltd. (a) | | 345,500 | | | 9,767,285 |
| | | | | |
| | | | | $ | 30,584,666 |
8
Portfolio of Investments (unaudited) – continued
| | | | | |
| Issuer | | Shares/Par | | Value ($) |
| | | | | |
| Common Stocks - continued | | | | | |
| General Merchandise - 3.1% | | | | | |
| Kohl’s Corp. (a) | | 71,400 | | $ | 3,842,748 |
| Target Corp. | | 474,740 | | | 24,458,605 |
| Wal-Mart Stores, Inc. | | 371,010 | | | 20,060,511 |
| | | | | |
| | | | | $ | 48,361,864 |
| Insurance - 1.3% | | | | | |
| Aflac, Inc. | | 256,590 | | $ | 12,688,375 |
| Verisk Analytics, Inc., “A” (a) | | 244,910 | | | 6,930,953 |
| | | | | |
| | | | | $ | 19,619,328 |
| Internet - 3.4% | | | | | |
| Baidu, Inc., ADR (a) | | 5,500 | | $ | 2,852,740 |
| Google, Inc., “A” (a) | | 94,525 | | | 49,795,770 |
| | | | | |
| | | | | $ | 52,648,510 |
| Leisure & Toys - 0.3% | | | | | |
| Hasbro, Inc. | | 128,300 | | $ | 4,590,574 |
| | |
| Machinery & Tools - 0.6% | | | | | |
| Bucyrus International, Inc. | | 129,400 | | $ | 8,095,264 |
| Cummins, Inc. | | 27,600 | | | 1,567,128 |
| | | | | |
| | | | | $ | 9,662,392 |
| Major Banks - 3.2% | | | | | |
| Bank of America Corp. | | 538,600 | | $ | 8,973,076 |
| Bank of New York Mellon Corp. | | 434,100 | | | 12,380,532 |
| Goldman Sachs Group, Inc. | | 29,290 | | | 4,579,491 |
| JPMorgan Chase & Co. | | 273,340 | | | 11,472,080 |
| Morgan Stanley | | 141,100 | | | 3,976,198 |
| State Street Corp. | | 183,378 | | | 8,235,506 |
| | | | | |
| | | | | $ | 49,616,883 |
| Medical & Health Technology & Services - 3.0% | | | | | |
| Express Scripts, Inc. (a) | | 149,690 | | $ | 14,371,737 |
| Lincare Holdings, Inc. (a) | | 209,700 | | | 8,421,552 |
| Medco Health Solutions, Inc. (a) | | 221,050 | | | 13,979,202 |
| Patterson Cos., Inc. (a) | | 325,400 | | | 9,657,872 |
| | | | | |
| | | | | $ | 46,430,363 |
| Medical Equipment - 5.1% | | | | | |
| Baxter International, Inc. | | 375,710 | | $ | 21,389,170 |
| Covidien PLC | | 311,700 | | | 15,310,704 |
| Hologic, Inc. (a) | | 91,300 | | | 1,574,925 |
9
Portfolio of Investments (unaudited) – continued
| | | | | |
| Issuer | | Shares/Par | | Value ($) |
| | | | | |
| Common Stocks - continued | | | | | |
| Medical Equipment - continued | | | | | |
| Medtronic, Inc. | | 355,260 | | $ | 15,418,284 |
| St. Jude Medical, Inc. (a) | | 260,920 | | | 9,972,362 |
| Thermo Fisher Scientific, Inc. (a) | | 306,330 | | | 14,939,714 |
| | | | | |
| | | | | $ | 78,605,159 |
| Network & Telecom - 3.9% | | | | | |
| Cisco Systems, Inc. (a) | | 1,793,440 | | $ | 43,634,395 |
| Juniper Networks, Inc. (a) | | 313,300 | | | 8,766,134 |
| QUALCOMM, Inc. | | 228,640 | | | 8,388,802 |
| | | | | |
| | | | | $ | 60,789,331 |
| Oil Services - 1.9% | | | | | |
| Halliburton Co. | | 231,800 | | $ | 6,988,770 |
| Schlumberger Ltd. | | 355,800 | | | 21,739,380 |
| | | | | |
| | | | | $ | 28,728,150 |
| Other Banks & Diversified Financials - 0.3% | | | | | |
| American Express Co. | | 139,500 | | $ | 5,327,505 |
| | |
| Pharmaceuticals - 4.6% | | | | | |
| Abbott Laboratories | | 528,460 | | $ | 28,684,809 |
| Allergan, Inc. | | 221,720 | | | 12,955,100 |
| Inverness Medical Innovations, Inc. (a) | | 128,200 | | | 5,002,364 |
| Johnson & Johnson | | 72,800 | | | 4,586,400 |
| Shire PLC, ADR | | 127,400 | | | 8,219,848 |
| Teva Pharmaceutical Industries Ltd., ADR | | 198,310 | | | 11,900,583 |
| | | | | |
| | | | | $ | 71,349,104 |
| Precious Metals & Minerals - 0.5% | | | | | |
| Teck Resources Ltd., “B” (a) | | 191,700 | | $ | 7,081,398 |
| | |
| Printing & Publishing - 0.8% | | | | | |
| McGraw-Hill Cos., Inc. | | 290,400 | | $ | 9,931,680 |
| Moody’s Corp. | | 82,400 | | | 2,193,488 |
| | | | | |
| | | | | $ | 12,125,168 |
| Railroad & Shipping - 0.9% | | | | | |
| Union Pacific Corp. | | 210,190 | | $ | 14,160,500 |
| | |
| Restaurants - 1.1% | | | | | |
| McDonald’s Corp. | | 265,540 | | $ | 16,954,729 |
| Starbucks Corp. (a) | | 34,900 | | | 799,559 |
| | | | | |
| | | | | $ | 17,754,288 |
10
Portfolio of Investments (unaudited) – continued
| | | | | |
| Issuer | | Shares/Par | | Value ($) |
| | | | | |
| Common Stocks - continued | | | | | |
| Specialty Chemicals - 0.8% | | | | | |
| Praxair, Inc. | | 167,560 | | $ | 12,590,458 |
| | |
| Specialty Stores - 3.5% | | | | | |
| Amazon.com, Inc. (a) | | 104,390 | | $ | 12,359,776 |
| Limited Brands, Inc. | | 448,000 | | | 9,905,280 |
| Lowe’s Cos., Inc. | | 201,700 | | | 4,782,307 |
| Staples, Inc. | | 657,710 | | | 16,942,610 |
| TJX Cos., Inc. | | 226,880 | | | 9,445,014 |
| | | | | |
| | | | | $ | 53,434,987 |
| Telephone Services - 1.6% | | | | | |
| American Tower Corp., “A” (a) | | 536,990 | | $ | 22,907,993 |
| Virgin Media, Inc. | | 106,800 | | | 1,730,160 |
| | | | | |
| | | | | $ | 24,638,153 |
| Tobacco - 1.6% | | | | | |
| Philip Morris International, Inc. | | 499,320 | | $ | 24,456,694 |
| | |
| Trucking - 0.8% | | | | | |
| FedEx Corp. | | 47,000 | | $ | 3,983,720 |
| J.B. Hunt Transport Services, Inc. | | 72,700 | | | 2,579,396 |
| United Parcel Service, Inc., “B” | | 89,900 | | | 5,280,726 |
| | | | | |
| | | | | $ | 11,843,842 |
| Total Common Stocks (Identified Cost, $1,456,239,156) | | | | $ | 1,475,908,790 |
| | |
| Money Market Funds (v) - 4.4% | | | | | |
MFS Institutional Money Market Portfolio, 0.14%,
at Cost and Net Asset Value | | 68,164,064 | | $ | 68,164,064 |
| Total Investments (Identified Cost, $1,524,403,220) | | | | $ | 1,544,072,854 |
| | |
| Other Assets, Less Liabilities - 0.2% | | | | | 3,519,198 |
| Net Assets - 100.0% | | | | $ | 1,547,592,052 |
| (a) | Non-income producing security. |
| (v) | Underlying fund that is available only to investment companies managed by MFS. The rate quoted is the annualized seven-day yield of the fund at period end. |
The following abbreviations are used in this report and are defined:
| ADR | | American Depository Receipt |
| PLC | | Public Limited Company |
See Notes to Financial Statements
11
Financial Statements
STATEMENT OF ASSETS AND LIABILITIES
At 2/28/10 (unaudited)
This statement represents your fund’s balance sheet, which details the assets and liabilities comprising the total value of the fund.
| | | |
| Assets | | | |
Investments- | | | |
Non-affiliated issuers, at value (identified cost, $1,456,239,156) | | $1,475,908,790 | |
Underlying funds, at cost and value | | 68,164,064 | |
Total investments, at value (identified cost, $1,524,403,220) | | $1,544,072,854 | |
Receivables for | | | |
Investments sold | | 46,291,516 | |
Fund shares sold | | 992,227 | |
Interest and dividends | | 1,913,929 | |
Other assets | | 18,708 | |
Total assets | | $1,593,289,234 | |
| Liabilities | | | |
Payable to custodian | | $40 | |
Payables for | | | |
Investments purchased | | 43,815,367 | |
Fund shares reacquired | | 944,967 | |
Payable to affiliates | | | |
Investment adviser | | 121,042 | |
Shareholder servicing costs | | 592,126 | |
Distribution and service fees | | 34,506 | |
Administrative services fee | | 2,650 | |
Payable for independent Trustees’ compensation | | 81,243 | |
Accrued expenses and other liabilities | | 105,241 | |
Total liabilities | | $45,697,182 | |
Net assets | | $1,547,592,052 | |
| Net assets consist of | | | |
Paid-in capital | | $2,316,259,432 | |
Unrealized appreciation (depreciation) on investments and translation of assets and liabilities in foreign currencies | | 19,669,687 | |
Accumulated net realized gain (loss) on investments and foreign currency transactions | | (787,519,124 | ) |
Accumulated distributions in excess of net investment income | | (817,943 | ) |
Net assets | | $1,547,592,052 | |
Shares of beneficial interest outstanding | | 100,052,560 | |
| | | | | | |
| | | Net assets | | Shares
outstanding | | Net asset value
per share (a) |
Class A | | $583,122,422 | | 38,059,406 | | $15.32 |
Class B | | 85,676,785 | | 6,005,116 | | 14.27 |
Class C | | 64,945,039 | | 4,552,390 | | 14.27 |
Class I | | 732,014,416 | | 46,073,868 | | 15.89 |
Class W | | 1,836,886 | | 118,975 | | 15.44 |
Class R1 | | 2,425,779 | | 170,567 | | 14.22 |
Class R2 | | 28,891,390 | | 1,924,299 | | 15.01 |
Class R3 | | 7,162,482 | | 468,356 | | 15.29 |
Class R4 | | 41,516,853 | | 2,679,583 | | 15.49 |
| (a) | Maximum offering price per share was equal to the net asset value per share for all share classes, except for Class A, for which the maximum offering price per share was $16.25 [100 / 94.25 x $15.32]. On sales of $50,000 or more, the maximum offering price of Class A shares is reduced. A contingent deferred sales charge may be imposed on redemptions of Class A, Class B, and Class C shares. Redemption price per share was equal to the net asset value per share for Classes I, W, R1, R2, R3, and R4. |
See Notes to Financial Statements
12
Financial Statements
STATEMENT OF OPERATIONS
Six months ended 2/28/10 (unaudited)
This statement describes how much your fund earned in investment income and accrued in expenses. It also describes any gains and/or losses generated by fund operations.
| | | |
| Net investment loss | | | |
Income | | | |
Dividends | | $8,572,711 | |
Interest | | 124,720 | |
Dividends from underlying funds | | 37,999 | |
Foreign taxes withheld | | (44,722 | ) |
Total investment income | | $8,690,708 | |
Expenses | | | |
Management fee | | $5,708,142 | |
Distribution and service fees | | 1,608,118 | |
Shareholder servicing costs | | 1,655,355 | |
Administrative services fee | | 123,801 | |
Independent Trustees’ compensation | | 26,447 | |
Custodian fee | | 89,770 | |
Shareholder communications | | 55,735 | |
Auditing fees | | 23,373 | |
Legal fees | | 21,314 | |
Miscellaneous | | 126,028 | |
Total expenses | | $9,438,083 | |
Fees paid indirectly | | (25 | ) |
Reduction of expenses by investment adviser | | (3,215 | ) |
Net expenses | | $9,434,843 | |
Net investment loss | | $(744,135 | ) |
Realized and unrealized gain (loss) on investments
and foreign currency transactions | | | |
| Realized gain (loss) (identified cost basis) | | | |
Investment transactions | | $153,806,023 | |
Foreign currency transactions | | 315 | |
Net realized gain (loss) on investments
and foreign currency transactions | | $153,806,338 | |
| Change in unrealized appreciation (depreciation) | | | |
Investments | | $(11,519,679 | ) |
Translation of assets and liabilities in foreign currencies | | 8,507 | |
Net unrealized gain (loss) on investments
and foreign currency translation | | $(11,511,172 | ) |
Net realized and unrealized gain (loss) on investments
and foreign currency | | $142,295,166 | |
Change in net assets from operations | | $141,551,031 | |
See Notes to Financial Statements
13
Financial Statements
STATEMENTS OF CHANGES IN NET ASSETS
These statements describe the increases and/or decreases in net assets resulting from operations, any distributions, and any shareholder transactions.
| | | | | | |
| Change in net assets | | Six months ended
2/28/10
(unaudited) | | | Year ended
8/31/09 | |
| From operations | | | | | | |
Net investment income (loss) | | $(744,135 | ) | | $2,239,651 | |
Net realized gain (loss) on investments and foreign currency transactions | | 153,806,338 | | | (533,053,534 | ) |
Net unrealized gain (loss) on investments and foreign currency translation | | (11,511,172 | ) | | 68,069,613 | |
Change in net assets from operations | | $141,551,031 | | | $(462,744,270 | ) |
| Distributions declared to shareholders | | | | | | |
From net investment income | | $(2,470,370 | ) | | $(608,615 | ) |
Change in net assets from fund share transactions | | $(184,631,306 | ) | | $(15,231,777 | ) |
Total change in net assets | | $(45,550,645 | ) | | $(478,584,662 | ) |
| Net assets | | | | | | |
At beginning of period | | 1,593,142,697 | | | 2,071,727,359 | |
At end of period (including accumulated distributions in excess of net investment income of $817,943 and undistributed net investment income of $2,396,562) | | $1,547,592,052 | | | $1,593,142,697 | |
See Notes to Financial Statements
14
Financial Statements
FINANCIAL HIGHLIGHTS
The financial highlights table is intended to help you understand the fund’s financial performance for the semiannual period and the past 5 fiscal years (or life of a particular share class, if shorter). Certain information reflects financial results for a single fund share. The total returns in the table represent the rate by which an investor would have earned (or lost) on an investment in the fund share class (assuming reinvestment of all distributions) held for the entire period.
| | | | | | | | | | | | | | | | | | |
| | | Six months
ended
2/28/10
(unaudited) | | | Years ended 8/31 | |
| Class A | | | 2009 | | | 2008 | | | 2007 | | | 2006 | | | 2005 | |
| | | | | | | | | | | | | | | | | |
Net asset value, beginning of period | | $14.07 | | | $18.15 | | | $20.35 | | | $17.70 | | | $16.82 | | | $14.71 | |
| Income (loss) from investment operations | | | | | | | | | | | | | | | | | | |
Net investment income (loss) (d) | | $(0.01 | ) | | $0.01 | | | $(0.01 | ) | | $(0.02 | ) | | $(0.05 | ) | | $(0.01 | ) |
Net realized and unrealized gain (loss) on investments and foreign currency | | 1.26 | | | (4.09 | ) | | (0.31 | ) | | 3.01 | | | 0.93 | | | 2.12 | |
Total from investment operations | | $1.25 | | | $(4.08 | ) | | $(0.32 | ) | | $2.99 | | | $0.88 | | | $2.11 | |
| Less distributions declared to shareholders | | | | | | | | | | | | | | | | | | |
From net investment income | | $(0.00 | )(w) | | $— | | | $— | | | $— | | | $— | | | $— | |
From net realized gain on investments | | — | | | — | | | (1.88 | ) | | (0.34 | ) | | — | | | — | |
Total distributions declared to shareholders | | $(0.00 | )(w) | | $— | | | $(1.88 | ) | | $(0.34 | ) | | $— | | | $— | |
Net asset value, end of period | | $15.32 | | | $14.07 | | | $18.15 | | | $20.35 | | | $17.70 | | | $16.82 | |
Total return (%) (r)(s)(t) | | 8.92 | (n) | | (22.48 | ) | | (2.16 | ) | | 17.07 | | | 5.23 | | | 14.34 | |
Ratios (%) (to average net assets)
and Supplemental data: | | | | | | | | | | | | | | | | | | |
Expenses before expense reductions (f) | | 1.23 | (a) | | 1.33 | | | 1.29 | | | 1.33 | | | 1.44 | | | 1.38 | |
Expenses after expense reductions (f) | | 1.23 | (a) | | 1.25 | | | 1.25 | | | 1.25 | | | 1.34 | | | 1.28 | |
Net investment income (loss) | | (0.14 | )(a) | | 0.08 | | | (0.03 | ) | | (0.11 | ) | | (0.31 | ) | | (0.08 | ) |
Portfolio turnover | | 120 | | | 589 | | | 301 | | | 329 | | | 245 | | | 184 | |
Net assets at end of period (000 omitted) | | $583,122 | | | $553,626 | | | $787,300 | | | $935,865 | | | $504,761 | | | $632,209 | |
See Notes to Financial Statements
15
Financial Highlights – continued
| | | | | | | | | | | | | | | | | | |
| | | Six months
ended
2/28/10
(unaudited) | | | Years ended 8/31 | |
| Class B | | | 2009 | | | 2008 | | | 2007 | | | 2006 | | | 2005 | |
| | | | | | | | | | | | | | | | | |
Net asset value, beginning of period | | $13.14 | | | $17.08 | | | $19.38 | | | $16.98 | | | $16.24 | | | $14.30 | |
| Income (loss) from investment operations | | | | | | | | | | | | | | | | | | |
Net investment loss (d) | | $(0.06 | ) | | $(0.08 | ) | | $(0.13 | ) | | $(0.14 | ) | | $(0.16 | ) | | $(0.11 | ) |
Net realized and unrealized gain (loss) on investments and foreign currency | | 1.19 | | | (3.86 | ) | | (0.29 | ) | | 2.88 | | | 0.90 | | | 2.05 | |
Total from investment operations | | $1.13 | | | $(3.94 | ) | | $(0.42 | ) | | $2.74 | | | $0.74 | | | $1.94 | |
| Less distributions declared to shareholders | | | | | | | | | | | | | | | | | | |
From net realized gain on investments | | $— | | | $— | | | $(1.88 | ) | | $(0.34 | ) | | $— | | | $— | |
Net asset value, end of period | | $14.27 | | | $13.14 | | | $17.08 | | | $19.38 | | | $16.98 | | | $16.24 | |
Total return (%) (r)(s)(t) | | 8.60 | (n) | | (23.07 | ) | | (2.81 | ) | | 16.31 | | | 4.56 | | | 13.57 | |
| Ratios (%) (to average net assets) and Supplemental data: | | | | | | | | | | | | | | | | | | |
Expenses before expense reductions (f) | | 1.98 | (a) | | 2.04 | | | 1.94 | | | 1.98 | | | 2.09 | | | 2.03 | |
Expenses after expense reductions (f) | | 1.98 | (a) | | 1.94 | | | 1.90 | | | 1.90 | | | 1.99 | | | 1.93 | |
Net investment loss | | (0.90 | )(a) | | (0.61 | ) | | (0.67 | ) | | (0.77 | ) | | (0.96 | ) | | (0.73 | ) |
Portfolio turnover | | 120 | | | 589 | | | 301 | | | 329 | | | 245 | | | 184 | |
Net assets at end of period (000 omitted) | | $85,677 | | | $97,066 | | | $192,755 | | | $303,614 | | | $162,868 | | | $201,513 | |
See Notes to Financial Statements
16
Financial Highlights – continued
| | | | | | | | | | | | | | | | | | |
| | | Six months
ended
2/28/10
(unaudited) | | | Years ended 8/31 | |
| Class C | | | 2009 | | | 2008 | | | 2007 | | | 2006 | | | 2005 | |
| | | | | | | | | | | | | | | | | |
Net asset value, beginning of period | | $13.14 | | | $17.08 | | | $19.38 | | | $16.98 | | | $16.23 | | | $14.30 | |
| Income (loss) from investment operations | | | | | | | | | | | | | | | | | | |
Net investment loss (d) | | $(0.06 | ) | | $(0.08 | ) | | $(0.13 | ) | | $(0.14 | ) | | $(0.16 | ) | | $(0.11 | ) |
Net realized and unrealized gain (loss) on investments and foreign currency | | 1.19 | | | (3.86 | ) | | (0.29 | ) | | 2.88 | | | 0.91 | | | 2.04 | |
Total from investment operations | | $1.13 | | | $(3.94 | ) | | $(0.42 | ) | | $2.74 | | | $0.75 | | | $1.93 | |
| Less distributions declared to shareholders | | | | | | | | | | | | | | | | | | |
From net realized gain on investments | | $— | | | $— | | | $(1.88 | ) | | $(0.34 | ) | | $— | | | $— | |
Net asset value, end of period | | $14.27 | | | $13.14 | | | $17.08 | | | $19.38 | | | $16.98 | | | $16.23 | |
Total return (%) (r)(s)(t) | | 8.60 | (n) | | (23.07 | ) | | (2.81 | ) | | 16.31 | | | 4.62 | | | 13.50 | |
Ratios (%) (to average net assets)
and Supplemental data: | | | | | | | | | | | | | | | | | | |
Expenses before expense reductions (f) | | 1.98 | (a) | | 2.03 | | | 1.95 | | | 1.98 | | | 2.09 | | | 2.03 | |
Expenses after expense reductions (f) | | 1.98 | (a) | | 1.94 | | | 1.90 | | | 1.90 | | | 1.99 | | | 1.93 | |
Net investment loss | | (0.89 | )(a) | | (0.62 | ) | | (0.67 | ) | | (0.76 | ) | | (0.96 | ) | | (0.69 | ) |
Portfolio turnover | | 120 | | | 589 | | | 301 | | | 329 | | | 245 | | | 184 | |
Net assets at end of period (000 omitted) | | $64,945 | | | $64,950 | | | $89,252 | | | $108,950 | | | $58,523 | | | $82,182 | |
See Notes to Financial Statements
17
Financial Highlights – continued
| | | | | | | | | | | | | | | | | |
| | | Six months
ended
2/28/10
(unaudited) | | | Years ended 8/31 |
| Class I | | | 2009 | | | 2008 | | | 2007 | | | 2006 | | | 2005 |
| | | | | | | | | | | | | | | | |
Net asset value, beginning of period | | $14.61 | | | $18.81 | | | $20.96 | | | $18.15 | | | $17.18 | | | $14.98 |
| Income (loss) from investment operations | | | | | | | | | | | | | | | | | |
Net investment income (d) | | $0.01 | | | $0.05 | | | $0.07 | | | $0.01 | | | $0.00 | (w) | | $0.05 |
Net realized and unrealized gain (loss) on investments and foreign currency | | 1.32 | | | (4.24 | ) | | (0.34 | ) | | 3.14 | | | 0.97 | | | 2.15 |
Total from investment operations | | $1.33 | | | $(4.19 | ) | | $(0.27 | ) | | $3.15 | | | $0.97 | | | $2.20 |
| Less distributions declared to shareholders | | | | | | | | | | | | | | | | | |
From net investment income | | $(0.05 | ) | | $(0.01 | ) | | $— | | | $— | | | $— | | | $— |
From net realized gain on investments | | — | | | — | | | (1.88 | ) | | (0.34 | ) | | — | | | — |
Total distributions declared to shareholders | | $(0.05 | ) | | $(0.01 | ) | | $(1.88 | ) | | $(0.34 | ) | | $— | | | $— |
Net asset value, end of period | | $15.89 | | | $14.61 | | | $18.81 | | | $20.96 | | | $18.15 | | | $17.18 |
Total return (%) (r)(s) | | 9.08 | (n) | | (22.26 | ) | | (1.84 | ) | | 17.53 | | | 5.65 | | | 14.69 |
| Ratios (%) (to average net assets) and Supplemental data: | | | | | | | | | | | | | | | | | |
Expenses before expense reductions (f) | | 0.98 | (a) | | 1.03 | | | 0.95 | | | 0.93 | | | 1.06 | | | 1.02 |
Expenses after expense reductions (f) | | 0.98 | (a) | | 0.95 | | | 0.90 | | | 0.89 | | | 0.96 | | | 0.92 |
Net investment income | | 0.11 | (a) | | 0.39 | | | 0.32 | | | 0.06 | | | 0.03 | | | 0.32 |
Portfolio turnover | | 120 | | | 589 | | | 301 | | | 329 | | | 245 | | | 184 |
Net assets at end of period (000 omitted) | | $732,014 | | | $810,495 | | | $962,434 | | | $1,010,075 | | | $34,998 | | | $3,816 |
See Notes to Financial Statements
18
Financial Highlights – continued
| | | | | | | | | | | | | | | |
| | | Six months
ended
2/28/10
(unaudited) | | | Years ended 8/31 | |
| Class W | | | 2009 | | | 2008 | | | 2007 | | | 2006 (i) | |
| | | | | | | | | | | | | | |
Net asset value, beginning of period | | $14.19 | | | $18.27 | | | $20.43 | | | $17.72 | | | $18.35 | |
| Income (loss) from investment operations | | | | | | | | | | | | | | | |
Net investment income (loss) (d) | | $(0.00 | )(w) | | $0.01 | | | $0.04 | | | $0.05 | | | $(0.00 | )(w) |
Net realized and unrealized gain (loss)
on investments and foreign currency | | 1.29 | | | (4.09 | ) | | (0.32 | ) | | 3.00 | | | (0.63 | )(g) |
Total from investment operations | | $1.29 | | | $(4.08 | ) | | $(0.28 | ) | | $3.05 | | | $(0.63 | ) |
| Less distributions declared to shareholders | | | | | | | | | | | | | | | |
From net investment income | | $(0.04 | ) | | $— | | | $— | | | $— | | | $— | |
From net realized gain on investments | | — | | | — | | | (1.88 | ) | | (0.34 | ) | | — | |
Total distributions declared to shareholders | | $(0.04 | ) | | $— | | | $(1.88 | ) | | $(0.34 | ) | | $— | |
Net asset value, end of period | | $15.44 | | | $14.19 | | | $18.27 | | | $20.43 | | | $17.72 | |
Total return (%) (r)(s) | | 9.10 | (n) | | (22.33 | ) | | (1.95 | ) | | 17.39 | | | (3.43 | )(n) |
Ratios (%) (to average net assets)
and Supplemental data: | | | | | | | | | | | | | | | |
Expenses before expense reductions (f) | | 1.08 | (a) | | 1.06 | | | 1.05 | | | 1.07 | | | 1.18 | (a) |
Expenses after expense reductions (f) | | 1.07 | (a) | | 1.03 | | | 1.00 | | | 0.99 | | | 1.08 | (a) |
Net investment income (loss) | | (0.05 | )(a) | | 0.07 | | | 0.23 | | | 0.27 | | | (0.03 | )(a) |
Portfolio turnover | | 120 | | | 589 | | | 301 | | | 329 | | | 245 | |
Net assets at end of period
(000 omitted) | | $1,837 | | | $5,331 | | | $343 | | | $373 | | | $97 | |
See Notes to Financial Statements
19
Financial Highlights – continued
| | | | | | | | | | | | | | | | | | |
| | | Six months
ended
2/28/10
(unaudited) | | | Years ended 8/31 | |
| Class R1 | | | 2009 | | | 2008 | | | 2007 | | | 2006 | | | 2005 (i) | |
| | | | | | | | | | | | | | | | | |
Net asset value, beginning of period | | $13.10 | | | $17.03 | | | $19.33 | | | $16.95 | | | $16.23 | | | $15.35 | |
| Income (loss) from investment operations | | | | | | | | | | | | | | | | | | |
Net investment loss (d) | | $(0.06 | ) | | $(0.08 | ) | | $(0.14 | ) | | $(0.15 | ) | | $(0.17 | ) | | $(0.08 | ) |
Net realized and unrealized gain (loss) on investments and foreign currency | | 1.18 | | | (3.85 | ) | | (0.28 | ) | | 2.87 | | | 0.89 | | | 0.96 | (g) |
Total from investment operations | | $1.12 | | | $(3.93 | ) | | $(0.42 | ) | | $2.72 | | | $0.72 | | | $0.88 | |
| Less distributions declared to shareholders | | | | | | | | | | | | | | | | | | |
From net realized gain on investments | | $— | | | $— | | | $(1.88 | ) | | $(0.34 | ) | | $— | | | $— | |
Net asset value, end of period | | $14.22 | | | $13.10 | | | $17.03 | | | $19.33 | | | $16.95 | | | $16.23 | |
Total return (%) (r)(s) | | 8.55 | (n) | | (23.08 | ) | | (2.82 | ) | | 16.22 | | | 4.44 | | | 5.73 | (n) |
Ratios (%) (to average net assets)
and Supplemental data: | | | | | | | | | | | | | | | | | | |
Expenses before expense reductions (f) | | 1.98 | (a) | | 2.03 | | | 2.00 | | | 2.12 | | | 2.28 | | | 2.35 | (a) |
Expenses after expense reductions (f) | | 1.98 | (a) | | 1.94 | | | 1.95 | | | 2.00 | | | 2.09 | | | 2.25 | (a) |
Net investment loss | | (0.89 | )(a) | | (0.62 | ) | | (0.74 | ) | | (0.89 | ) | | (1.07 | ) | | (1.21 | )(a) |
Portfolio turnover | | 120 | | | 589 | | | 301 | | | 329 | | | 245 | | | 184 | |
Net assets at end of period
(000 omitted) | | $2,426 | | | $2,356 | | | $2,552 | | | $1,517 | | | $506 | | | $80 | |
See Notes to Financial Statements
20
Financial Highlights – continued
| | | | | | | | | | | | | | | | | | |
| | | Six months
ended
2/28/10
(unaudited) | | | Years ended 8/31 | |
| Class R2 | | | 2009 | | | 2008 | | | 2007 | | | 2006 | | | 2005 | |
| | | | | | | | | | | | | | | | | |
Net asset value, beginning of period | | $13.81 | | | $17.85 | | | $20.08 | | | $17.52 | | | $16.70 | | | $14.67 | |
| Income (loss) from investment operations | | | | | | | | | | | | | | | | | | |
Net investment loss (d) | | $(0.03 | ) | | $(0.02 | ) | | $(0.05 | ) | | $(0.07 | ) | | $(0.11 | ) | | $(0.06 | ) |
Net realized and unrealized gain (loss) on investments and foreign currency | | 1.24 | | | (4.02 | ) | | (0.30 | ) | | 2.97 | | | 0.93 | | | 2.09 | |
Total from investment operations | | $1.21 | | | $(4.04 | ) | | $(0.35 | ) | | $2.90 | | | $0.82 | | | $2.03 | |
| Less distributions declared to shareholders | | | | | | | | | | | | | | | | | | |
From net investment income | | $(0.01 | ) | | $— | | | $— | | | $— | | | $— | | | $— | |
From net realized gain on investments | | — | | | — | | | (1.88 | ) | | (0.34 | ) | | — | | | — | |
Total distributions declared to shareholders | | $(0.01 | ) | | $— | | | $(1.88 | ) | | $(0.34 | ) | | $— | | | $— | |
Net asset value, end of period | | $15.01 | | | $13.81 | | | $17.85 | | | $20.08 | | | $17.52 | | | $16.70 | |
Total return (%) (r)(s) | | 8.76 | (n) | | (22.63 | ) | | (2.34 | ) | | 16.73 | | | 4.91 | | | 13.84 | |
Ratios (%) (to average net assets)
and Supplemental data: | | | | | | | | | | | | | | | | | | |
Expenses before expense reductions (f) | | 1.48 | (a) | | 1.52 | | | 1.49 | | | 1.67 | | | 1.85 | | | 1.82 | |
Expenses after expense reductions (f) | | 1.47 | (a) | | 1.44 | | | 1.44 | | | 1.54 | | | 1.65 | | | 1.72 | |
Net investment loss | | (0.38 | )(a) | | (0.14 | ) | | (0.24 | ) | | (0.37 | ) | | (0.60 | ) | | (0.48 | ) |
Portfolio turnover | | 120 | | | 589 | | | 301 | | | 329 | | | 245 | | | 184 | |
Net assets at end of period
(000 omitted) | | $28,891 | | | $17,546 | | | $13,471 | | | $5,728 | | | $1,804 | | | $774 | |
See Notes to Financial Statements
21
Financial Highlights – continued
| | | | | | | | | | | | | | | | | | |
| | | Six months
ended
2/28/10
(unaudited) | | | Years ended 8/31 | |
| Class R3 | | | 2009 | | | 2008 | | | 2007 | | | 2006 | | | 2005 (i) | |
| | | | | | | | | | | | | | | | | |
Net asset value, beginning of period | | $14.06 | | | $18.13 | | | $20.33 | | | $17.69 | | | $16.81 | | | $15.85 | |
| Income (loss) from investment operations | | | | | | | | | | | | | | | | | | |
Net investment income (loss) (d) | | $(0.01 | ) | | $0.01 | | | $0.00 | (w) | | $(0.03 | ) | | $(0.06 | ) | | $(0.03 | ) |
Net realized and unrealized gain (loss) on investments and foreign currency | | 1.27 | | | (4.08 | ) | | (0.32 | ) | | 3.01 | | | 0.94 | | | 0.99 | (g) |
Total from investment operations | | $1.26 | | | $(4.07 | ) | | $(0.32 | ) | | $2.98 | | | $0.88 | | | $0.96 | |
| Less distributions declared to shareholders | | | | | | | | | | | | | | | | | | |
From net investment income | | $(0.03 | ) | | $— | | | $— | | | $— | | | $— | | | $— | |
From net realized gain on investments | | — | | | — | | | (1.88 | ) | | (0.34 | ) | | — | | | — | |
Total distributions declared to shareholders | | $(0.03 | ) | | $— | | | $(1.88 | ) | | $(0.34 | ) | | $— | | | $— | |
Net asset value, end of period | | $15.29 | | | $14.06 | | | $18.13 | | | $20.33 | | | $17.69 | | | $16.81 | |
Total return (%) (r)(s) | | 8.94 | (n) | | (22.45 | ) | | (2.16 | ) | | 17.02 | | | 5.23 | | | 6.06 | (n) |
| Ratios (%) (to average net assets) and Supplemental data: | | | | | | | | | | | | | | | | | | |
Expenses before expense reductions (f) | | 1.23 | (a) | | 1.26 | | | 1.25 | | | 1.37 | | | 1.48 | | | 1.56 | (a) |
Expenses after expense reductions (f) | | 1.23 | (a) | | 1.20 | | | 1.20 | | | 1.29 | | | 1.38 | | | 1.46 | (a) |
Net investment income (loss) | | (0.14 | )(a) | | 0.09 | | | 0.02 | | | (0.18 | ) | | (0.36 | ) | | (0.41 | )(a) |
Portfolio turnover | | 120 | | | 589 | | | 301 | | | 329 | | | 245 | | | 184 | |
Net assets at end of period
(000 omitted) | | $7,162 | | | $5,116 | | | $2,848 | | | $1,641 | | | $286 | | | $53 | |
See Notes to Financial Statements
22
Financial Highlights – continued
| | | | | | | | | | | | | | | | | | |
| | | Six months
ended
2/28/10
(unaudited) | | | Years ended 8/31 | |
| Class R4 | | | 2009 | | | 2008 | | | 2007 | | | 2006 | | | 2005 (i) | |
| | | | | | | | | | | | | | | | | |
Net asset value, beginning of period | | $14.24 | | | $18.33 | | | $20.47 | | | $17.76 | | | $16.83 | | | $15.85 | |
| Income (loss) from investment operations | | | | | | | | | | | | | | | | | | |
Net investment income (loss) (d) | | $0.01 | | | $0.05 | | | $0.06 | | | $0.04 | | | $(0.01 | ) | | $(0.01 | ) |
Net realized and unrealized gain (loss) on investments and foreign currency | | 1.29 | | | (4.14 | ) | | (0.32 | ) | | 3.01 | | | 0.94 | | | 0.99 | (g) |
Total from investment operations | | $1.30 | | | $(4.09 | ) | | $(0.26 | ) | | $3.05 | | | $0.93 | | | $0.98 | |
| Less distributions declared to shareholders | | | | | | | | | | | | | | | | | | |
From net investment income | | $(0.05 | ) | | $— | | | $— | | | $— | | | $— | | | $— | |
From net realized gain on investments | | — | | | — | | | (1.88 | ) | | (0.34 | ) | | — | | | — | |
Total distributions declared to shareholders | | $(0.05 | ) | | $— | | | $(1.88 | ) | | $(0.34 | ) | | $— | | | $— | |
Net asset value, end of period | | $15.49 | | | $14.24 | | | $18.33 | | | $20.47 | | | $17.76 | | | $16.83 | |
Total return (%)��(r)(s) | | 9.10 | (n) | | (22.31 | ) | | (1.84 | ) | | 17.35 | | | 5.53 | | | 6.18 | (n) |
| Ratios (%) (to average net assets) and Supplemental data: | | | | | | | | | | | | | | | | | | |
Expenses before expense reductions (f) | | 0.98 | (a) | | 1.01 | | | 0.98 | | | 1.08 | | | 1.19 | | | 1.26 | (a) |
Expenses after expense reductions (f) | | 0.98 | (a) | | 0.96 | | | 0.94 | | | 0.99 | | | 1.09 | | | 1.16 | (a) |
Net investment income (loss) | | 0.11 | (a) | | 0.35 | | | 0.29 | | | 0.21 | | | (0.06 | ) | | (0.11 | )(a) |
Portfolio turnover | | 120 | | | 589 | | | 301 | | | 329 | | | 245 | | | 184 | |
Net assets at end of period
(000 omitted) | | $41,517 | | | $36,655 | | | $20,773 | | | $41,102 | | | $56 | | | $53 | |
Any redemption fees charged by the fund during the 2005 fiscal year resulted in a per share impact of less than $0.01.
| (d) | Per share data is based on average shares outstanding. |
| (f) | Ratios do not reflect reductions from fees paid indirectly, if applicable. |
| (g) | The per share amount varies from the net realized and unrealized gain/loss for the period because of the timing of sales of fund shares and the per share amount of realized and unrealized gains and losses at such time. |
| (i) | For the period from the class’ inception, April 1, 2005 (Classes R1, R3, and R4) and May 1, 2006 (Class W) through the stated period end. |
| (r) | Certain expenses have been reduced without which performance would have been lower. |
| (s) | From time to time the fund may receive proceeds from litigation settlements, without which performance would be lower. |
| (t) | Total returns do not include any applicable sales charges. |
| (w) | Per share amount was less than $0.01. |
See Notes to Financial Statements
23
NOTES TO FINANCIAL STATEMENTS
(unaudited)
| (1) | | Business and Organization |
MFS Core Growth Fund (the fund) is a series of MFS Series Trust I (the trust). The trust is organized as a Massachusetts business trust and is registered under the Investment Company Act of 1940, as amended, as an open-end management investment company.
| (2) | | Significant Accounting Policies |
General – The preparation of financial statements in conformity with U.S. generally accepted accounting principles requires management to make estimates and assumptions that affect the reported amounts of assets and liabilities, and disclosure of contingent assets and liabilities at the date of the financial statements and the reported amounts of revenues and expenses during the reporting period. Actual results could differ from those estimates. In the preparation of these financial statements, management has evaluated subsequent events occurring after the date of the fund’s Statement of Assets and Liabilities through the date that the financial statements were issued. The fund can invest in foreign securities, including securities of emerging market issuers. Investments in foreign securities are vulnerable to the effects of changes in the relative values of the local currency and the U.S. dollar and to the effects of changes in each country’s legal, political, and economic environment. The markets of emerging markets countries are generally more volatile than the markets of developed countries with more mature economies. All of the risks of investing in foreign securities previously described are heightened when investing in emerging markets countries.
Investment Valuations – Equity securities, including restricted equity securities, are generally valued at the last sale or official closing price as provided by a third-party pricing service on the market or exchange on which they are primarily traded. Equity securities, for which there were no sales reported that day, are generally valued at the last quoted daily bid quotation as provided by a third-party pricing service on the market or exchange on which such securities are primarily traded. Equity securities held short, for which there were no sales reported for that day, are generally valued at the last quoted daily ask quotation as provided by a third-party pricing service on the market or exchange on which such securities are primarily traded. Short-term instruments with a maturity at issuance of 60 days or less generally are valued at amortized cost, which approximates market value. Open-end investment companies are generally valued at net asset value per share. Securities and other assets generally valued on the basis of information from a third-party pricing service may also be valued at a broker/dealer bid quotation. Values
obtained from third-party pricing services can utilize both transaction data and
24
Notes to Financial Statements (unaudited) – continued
market information such as yield, quality, coupon rate, maturity, type of issue, trading characteristics, and other market data. The values of foreign securities and other assets and liabilities expressed in foreign currencies are converted to U.S. dollars using the mean of bid and asked prices for rates provided by a third-party pricing service.
The Board of Trustees has delegated primary responsibility for determining or causing to be determined the value of the fund’s investments (including any fair valuation) to the adviser pursuant to valuation policies and procedures approved by the Board. If the adviser determines that reliable market quotations are not readily available, investments are valued at fair value as determined in good faith by the adviser in accordance with such procedures under the oversight of the Board of Trustees. Under the fund’s valuation policies and procedures, market quotations are not considered to be readily available for most types of debt instruments and floating rate loans and many types of derivatives. These investments are generally valued at fair value based on information from third-party pricing services. In addition, investments may be valued at fair value if the adviser determines that an investment’s value has been materially affected by events occurring after the close of the exchange or market on which the investment is principally traded (such as foreign exchange or market) and prior to the determination of the fund’s net asset value, or after the halting of trading of a specific security where trading does not resume prior to the close of the exchange or market on which the security is principally traded. Events that occur on a frequent basis after foreign markets close (such as developments in foreign markets and significant movements in the U.S. markets) and prior to the determination of the fund’s net asset value may be deemed to have a material effect on the value of securities traded in foreign markets. Accordingly, the fund’s foreign equity securities may often be valued at fair value. The adviser generally relies on third-party pricing services or other information (such as the correlation with price movements of similar securities in the same or other markets; the type, cost and investment characteristics of the security; the business and financial condition of the issuer; and trading and other market data) to assist in determining whether to fair value and at what value to fair value an investment. The value of an investment for purposes of calculating the fund’s net asset value can differ depending on the source and method used to determine value. When fair valuation is used, the value of an investment used to determine the fund’s net asset value may differ from quoted or published prices for the same investment. There can be no assurance that the fund could obtain the fair value assigned to an investment if it were to sell the investment at the same time at which the fund determines its net asset value per share.
25
Notes to Financial Statements (unaudited) – continued
Various inputs are used in determining the value of the fund’s assets or liabilities. These inputs are categorized into three broad levels. In certain cases, the inputs used to measure fair value may fall into different levels of the fair value hierarchy. In such cases, an investment’s level within the fair value hierarchy is based on the lowest level of input that is significant to the fair value measurement. The fund’s assessment of the significance of a particular input to the fair value measurement in its entirety requires judgment, and considers factors specific to the investment. Level 1 includes unadjusted quoted prices in active markets for identical assets or liabilities. Level 2 includes other significant observable market-based inputs (including quoted prices for similar securities, interest rates, prepayment speed, and credit risk). Level 3 includes unobservable inputs, which may include the adviser’s own assumptions in determining the fair value of investments. Other financial instruments are derivative instruments not reflected in total investments, such as futures, forwards, swap contracts, and written options. The following is a summary of the levels used as of February 28, 2010 in valuing the fund’s assets or liabilities:
| | | | | | | | |
| Investments at Value | | Level 1 | | Level 2 | | Level 3 | | Total |
| Equity Securities | | $1,475,908,790 | | $— | | $— | | $1,475,908,790 |
| Mutual Funds | | 68,164,064 | | — | | — | | $68,164,064 |
| Total Investments | | $1,544,072,854 | | $— | | $— | | $1,544,072,854 |
For further information regarding security characteristics, see the Portfolio of Investments.
In January 2010, Accounting Standards Update (ASU) No. 2010-06, Improving Disclosures about Fair Value Measurements (the “Update”) was issued, and is effective for interim and annual reporting periods beginning after December 15, 2009. This Update provides for expanded disclosures about fair value measurements. Management has evaluated the application of the Update to the fund, and believes the impact is limited to expanded disclosures resulting from the adoption of this Update in the fund’s financial statements.
Foreign Currency Translation – Purchases and sales of foreign investments, income, and expenses are converted into U.S. dollars based upon currency exchange rates prevailing on the respective dates of such transactions or on the reporting date for foreign denominated receivables and payables. Gains and losses attributable to foreign currency exchange rates on sales of securities are recorded for financial statement purposes as net realized gains and losses on investments. Gains and losses attributable to foreign exchange rate movements on receivables, payables, income and expenses are recorded for financial statement purposes as foreign currency transaction gains and losses. That portion of both realized and unrealized gains and losses on investments that results from fluctuations in foreign currency exchange rates is not separately disclosed.
26
Notes to Financial Statements (unaudited) – continued
Derivatives – The fund may use derivatives for different purposes, including to earn income and enhance returns, to increase or decrease exposure to a particular market, to manage or adjust the risk profile of the fund, or as alternatives to direct investments. Derivatives may be used for hedging or non-hedging purposes. While hedging can reduce or eliminate losses, it can also reduce or eliminate gains. When the fund uses derivatives as an investment to increase market exposure, or for hedging purposes, gains and losses from derivative instruments may be substantially greater than the derivative’s original cost.
Derivative instruments include written options, purchased options, futures contracts, forward foreign currency exchange contracts, and swap agreements. For the six months ended February 28, 2010, the fund did not invest in any derivative instruments.
Security Loans – State Street Bank and Trust Company (“State Street”), as lending agent, may loan the securities of the fund to certain qualified institutions (the “Borrowers”) approved by the fund. The loans are collateralized by cash and/or U.S. Treasury and federal agency obligations in an amount typically at least equal to the market value of the securities loaned. The market value of the loaned securities is determined at the close of business of the fund and any additional required collateral is delivered to the fund on the next business day. State Street provides the fund with indemnification against Borrower default. The fund bears the risk of loss with respect to the investment of cash collateral. On loans collateralized by cash, the cash collateral is invested in a money market fund or short-term securities. A portion of the income generated upon investment of the collateral is remitted to the Borrowers, and the remainder is allocated between the fund and the lending agent. On loans collateralized by U.S. Treasury and/or federal agency obligations, a fee is received from the Borrower, and is allocated between the fund and the lending agent. Income from securities lending is included in interest income on the Statement of Operations. The dividend and interest income earned on the securities loaned is accounted for in the same manner as other dividend and interest income.
Indemnifications – Under the fund’s organizational documents, its officers and Trustees may be indemnified against certain liabilities and expenses arising out of the performance of their duties to the fund. Additionally, in the normal course of business, the fund enters into agreements with service providers that may contain indemnification clauses. The fund’s maximum exposure under these agreements is unknown as this would involve future claims that may be made against the fund that have not yet occurred.
Investment Transactions and Income – Investment transactions are recorded on the trade date. Interest income is recorded on the accrual basis. All
27
Notes to Financial Statements (unaudited) – continued
premium and discount is amortized or accreted for financial statement purposes in accordance with U.S. generally accepted accounting principles. Dividends received in cash are recorded on the ex-dividend date. Certain dividends from foreign securities will be recorded when the fund is informed of the dividend if such information is obtained subsequent to the ex-dividend date. Dividend and interest payments received in additional securities are recorded on the ex-dividend or ex-interest date in an amount equal to the value of the security on such date.
The fund may receive proceeds from litigation settlements. Any proceeds received from litigation involving portfolio holdings are reflected in the Statement of Operations in realized gain/loss if the security has been disposed of by the fund or in unrealized gain/loss if the security is still held by the fund. Any other proceeds from litigation not related to portfolio holdings are reflected as other income in the Statement of Operations.
Fees Paid Indirectly – The fund’s custody fee may be reduced according to an arrangement that measures the value of cash deposited with the custodian by the fund. This amount, for the six months ended February 28, 2010, is shown as a reduction of total expenses on the Statement of Operations.
Tax Matters and Distributions – The fund intends to qualify as a regulated investment company, as defined under Subchapter M of the Internal Revenue Code, and to distribute all of its taxable income, including realized capital gains. As a result, no provision for federal income tax is required. The fund’s federal tax returns for the prior three fiscal years remain subject to examination by the Internal Revenue Service. Foreign taxes, if any, have been accrued by the fund in the accompanying financial statements.
Distributions to shareholders are recorded on the ex-dividend date. Income and capital gain distributions are determined in accordance with income tax regulations, which may differ from U.S. generally accepted accounting principles. Certain capital accounts in the financial statements are periodically adjusted for permanent differences in order to reflect their tax character. These adjustments have no impact on net assets or net asset value per share. Temporary differences which arise from recognizing certain items of income, expense, gain or loss in different periods for financial statement and tax purposes will reverse at some time in the future. Distributions in excess of net investment income or net realized gains are temporary over distributions for financial statement purposes resulting from differences in the recognition or classification of income or distributions for financial statement and tax purposes.
Book/tax differences primarily relate to expiration of capital loss carryforwards and wash sale loss deferrals.
28
Notes to Financial Statements (unaudited) – continued
The tax character of distributions made during the current period will be determined at fiscal year end. The tax character of distributions declared to shareholders for the last fiscal year is as follows:
| | |
| | | 8/31/09 |
Ordinary income (including any
short-term capital gains) | | $608,615 |
The federal tax cost and the tax basis components of distributable earnings were as follows:
| | | |
| As of 2/28/10 | | | |
| Cost of investments | | $1,608,854,640 | |
| Gross appreciation | | 63,147,853 | |
| Gross depreciation | | (127,929,639 | ) |
| Net unrealized appreciation (depreciation) | | $(64,781,786 | ) |
| |
| As of 8/31/09 | | | |
| Undistributed ordinary income | | 2,468,528 | |
| Capital loss carryforwards | | (550,230,537 | ) |
| Post-October capital loss deferral | | (317,586,685 | ) |
| Other temporary differences | | (4,402,592 | ) |
| Net unrealized appreciation (depreciation) | | (37,996,755 | ) |
The aggregate cost above includes prior fiscal year end tax adjustments.
As of August 31, 2009, the fund had capital loss carryforwards available to offset future realized gains. Such losses expire as follows:
| | | |
| 8/31/10 | | $(325,450,819 | ) |
| 8/31/11 | | (30,032,975 | ) |
| 8/31/17 | | (194,746,743 | ) |
| | $(550,230,537 | ) |
The availability of a portion of the capital loss carryforwards of the fund and the capital loss carryforwards that the fund acquired on June 22, 2007 in connection with the MFS Strategic Growth Fund merger, may be limited in a given year.
Multiple Classes of Shares of Beneficial Interest – The fund offers multiple classes of shares, which differ in their respective distribution and service fees. The fund’s income, realized and unrealized gain (loss), and common expenses are allocated to shareholders based on the daily net assets of each class. Dividends are declared separately for each class. Differences in per share dividend rates are generally due to differences in separate class expenses. Class B shares will convert to Class A shares approximately eight years after
29
Notes to Financial Statements (unaudited) – continued
purchase. The fund’s distributions declared to shareholders as reported on the Statements of Changes in Net Assets are presented by class as follows:
| | | | |
| | | From net investment income |
| | | Six months ended
2/28/10 | | Year ended
8/31/09 |
| Class A | | $170,398 | | $— |
| Class I | | 2,137,824 | | 608,615 |
| Class W | | 13,122 | | — |
| Class R2 | | 16,313 | | — |
| Class R3 | | 11,570 | | — |
| Class R4 | | 121,143 | | — |
| Total | | $2,470,370 | | $608,615 |
| (3) | | Transactions with Affiliates |
Investment Adviser – The fund has an investment advisory agreement with MFS to provide overall investment management and related administrative services and facilities to the fund. The management fee is computed daily and paid monthly at the following annual rates:
| | | |
| First $1 billion of average daily net assets | | 0.75 | % |
| Next $1.5 billion of average daily net assets | | 0.65 | % |
| Average daily net assets in excess of $2.5 billion | | 0.60 | % |
The management fee incurred for the six months ended February 28, 2010 was equivalent to an annual effective rate of 0.71% of the fund’s average daily net assets.
The investment adviser has agreed in writing to pay a portion of the fund’s total annual operating expenses, exclusive of interest, taxes, extraordinary expenses, brokerage and transaction costs, and investment-related expenses, such that total annual fund operating expenses do not exceed the following rates annually of the fund’s average daily net assets.
| | | | | | | | | | | | | | | | |
| Class A | | Class B | | Class C | | Class I | | Class W | | Class R1 | | Class R2 | | Class R3 | | Class R4 |
| 1.26% | | 2.01% | | 2.01% | | 1.01% | | 1.11% | | 2.01% | | 1.51% | | 1.26% | | 1.01% |
This written agreement will continue until modified by the fund’s Board of Trustees, but such agreement will continue at least until December 31, 2010. For the six months ended February 28, 2010, the fund’s actual operating expenses did not exceed the limit and therefore, the investment adviser did not pay any portion of the fund’s expenses.
Distributor – MFS Fund Distributors, Inc. (MFD), a wholly-owned subsidiary of MFS, as distributor, received $23,689 for the six months ended February 28, 2010, as its portion of the initial sales charge on sales of Class A shares of the fund.
The Board of Trustees has adopted a distribution plan for certain class shares pursuant to Rule 12b-1 of the Investment Company Act of 1940.
30
Notes to Financial Statements (unaudited) – continued
The fund’s distribution plan provides that the fund will pay MFD for services provided by MFD and financial intermediaries in connection with the distribution and servicing of certain share classes. One component of the plan is a distribution fee paid to MFD and another component of the plan is a service fee paid to MFD. MFD may subsequently pay all, or a portion, of the distribution and/or service fees to financial intermediaries.
Distribution Plan Fee Table:
| | | | | | | | | | |
| | | Distribution
Fee Rate (d) | | Service
Fee Rate (d) | | Total
Distribution
Plan (d) | | Annual
Effective
Rate (e) | | Distribution
and Service
Fee |
| Class A | | — | | 0.25% | | 0.25% | | 0.25% | | $727,514 |
| Class B | | 0.75% | | 0.25% | | 1.00% | | 1.00% | | 468,523 |
| Class C | | 0.75% | | 0.25% | | 1.00% | | 1.00% | | 332,473 |
| Class W | | 0.10% | | — | | 0.10% | | 0.10% | | 2,201 |
| Class R1 | | 0.75% | | 0.25% | | 1.00% | | 1.00% | | 11,963 |
| Class R2 | | 0.25% | | 0.25% | | 0.50% | | 0.50% | | 57,336 |
| Class R3 | | — | | 0.25% | | 0.25% | | 0.25% | | 8,108 |
| Total Distribution and Service Fees | | | | | | | | $1,608,118 |
| (d) | In accordance with the distribution plan for certain classes, the fund pays distribution and/or service fees equal to these annual percentage rates of each class’ average daily net assets. The distribution and service fee rates disclosed by class represent the current rates in effect at the end of the reporting period. Any rate changes, if applicable, are detailed below. |
| (e) | The annual effective rates represent actual fees incurred under the distribution plan for the six months ended February 28, 2010 based on each class’ average daily net assets. |
Certain Class A shares purchased on or subsequent to September 1, 2008 are subject to a CDSC in the event of a shareholder redemption within 24 months of purchase. Class C shares are subject to a CDSC in the event of a shareholder redemption within 12 months of purchase. Class B shares are subject to a CDSC in the event of a shareholder redemption within six years of purchase. All contingent deferred sales charges are paid to MFD and during the six months ended February 28, 2010, were as follows:
| | |
| | | Amount |
| Class A | | $2,512 |
| Class B | | 44,830 |
| Class C | | 2,936 |
Shareholder Servicing Agent – MFS Service Center, Inc. (MFSC), a wholly-owned subsidiary of MFS, receives a fee from the fund for its services as shareholder servicing agent calculated as a percentage of the average daily net assets of the fund as determined periodically under the supervision of the fund’s Board of Trustees. For the six months ended February 28, 2010, the fee was $574,876, which equated to 0.0717% annually of the fund’s average daily net assets. MFSC also receives payment from the fund for out-of-pocket expenses, sub-accounting and other shareholder servicing costs which may be
31
Notes to Financial Statements (unaudited) – continued
paid to affiliated and unaffiliated service providers. For the six months ended February 28, 2010, these out-of-pocket expenses, sub-accounting and other shareholder servicing costs amounted to $673,808.
Under a Special Servicing Agreement among MFS, each MFS fund which invests in other MFS funds (“MFS fund-of-funds”) and certain underlying funds in which a MFS fund-of-funds invests (“underlying funds”), each underlying fund may pay a portion of each MFS fund-of-fund’s transfer agent-related expenses, including sub-accounting fees payable to financial intermediaries, to the extent such payments do not exceed the benefits realized or expected to be realized by the underlying fund from the investment in the underlying fund by the MFS fund-of-fund. For the six months ended February 28, 2010, these costs for the fund amounted to $406,671 and are reflected in the shareholder servicing costs on the Statement of Operations.
Administrator – MFS provides certain financial, legal, shareholder communications, compliance, and other administrative services to the fund. Under an administrative services agreement, the fund partially reimburses MFS the costs incurred to provide these services. The fund is charged an annual fixed amount of $17,500 plus a fee based on average daily net assets. The administrative services fee incurred for the six months ended February 28, 2010 was equivalent to an annual effective rate of 0.0154% of the fund’s average daily net assets.
Trustees’ and Officers’ Compensation – The fund pays compensation to independent Trustees in the form of a retainer, attendance fees, and additional compensation to Board and Committee chairpersons. The fund does not pay compensation directly to Trustees or officers of the fund who are also officers of the investment adviser, all of whom receive remuneration for their services to the fund from MFS. Certain officers and Trustees of the fund are officers or directors of MFS, MFD, and MFSC.
Prior to December 31, 2001, the fund had an unfunded defined benefit plan (“DB plan”) for independent Trustees. As of December 31, 2001, the Board took action to terminate the DB plan with respect to then-current and any future independent Trustees, such that the DB Plan covers only certain of those former independent Trustees who retired on or before December 31, 2001. Effective January 1, 2002, accrued benefits under the DB Plan for then current independent Trustees who continued were credited to an unfunded retirement deferral plan (the “Retirement Deferral plan”), which was established for and exists solely with respect to these credited amounts, and is not available for other deferrals by these or other independent Trustees. Although the Retirement Deferral plan is unfunded, amounts deferred under the plan are periodically adjusted for investment experience as if they had been invested in shares of the fund. The DB Plan resulted in a pension expense of $310 and the
32
Notes to Financial Statements (unaudited) – continued
Retirement Deferral plan resulted in an expense of $5,403. Both amounts are included in independent Trustees’ compensation for the six months ended February 28, 2010. The liability for deferred retirement benefits payable to certain independent Trustees under both Plans amounted to $76,086 at February 28, 2010, and is included in payable for independent Trustees’ compensation on the Statement of Assets and Liabilities.
Other – This fund and certain other funds managed by MFS (the funds) have entered into services agreements (the Agreements) which provide for payment of fees by the funds to Tarantino LLC and Griffin Compliance LLC in return for the provision of services of an Independent Chief Compliance Officer (ICCO) and Assistant ICCO, respectively, for the funds. The ICCO and Assistant ICCO are officers of the funds and the sole members of Tarantino LLC and Griffin Compliance LLC, respectively. The funds can terminate the Agreements with Tarantino LLC and Griffin Compliance LLC at any time under the terms of the Agreements. For the six months ended February 28, 2010, the aggregate fees paid by the fund to Tarantino LLC and Griffin Compliance LLC were $10,177 and are included in miscellaneous expense on the Statement of Operations. MFS has agreed to reimburse the fund for a portion of the payments made by the fund in the amount of $3,215, which is shown as a reduction of total expenses in the Statement of Operations. Additionally, MFS has agreed to bear all expenses associated with office space, other administrative support, and supplies provided to the ICCO and Assistant ICCO.
The fund may invest in the MFS Institutional Money Market Portfolio which is managed by MFS and seeks a high level of current income consistent with preservation of capital and liquidity. Income earned on this investment is included in dividends from underlying funds on the Statement of Operations. This money market fund does not pay a management fee to MFS.
Purchases and sales of investments, other than U.S. Government securities, purchased option transactions, and short-term obligations, aggregated $1,852,941,412 and $2,047,674,995, respectively.
33
Notes to Financial Statements (unaudited) – continued
| (5) | | Shares of Beneficial Interest |
The fund’s Declaration of Trust permits the Trustees to issue an unlimited number of full and fractional shares of beneficial interest. Transactions in fund shares were as follows:
| | | | | | | | | | | | |
| | | Six months ended
2/28/10 | | | Year ended
8/31/09 | |
| | | Shares | | | Amount | | | Shares | | | Amount | |
| Shares sold | | | | | | | | | | | | |
Class A | | 2,678,172 | | | $40,558,685 | | | 10,705,331 | | | $134,898,932 | |
Class B | | 219,942 | | | 3,105,243 | | | 769,827 | | | 9,333,574 | |
Class C | | 185,146 | | | 2,601,770 | | | 1,154,118 | | | 13,746,901 | |
Class I | | 2,703,282 | | | 41,859,221 | | | 22,062,123 | | | 285,103,240 | |
Class W | | 252,780 | | | 3,760,275 | | | 401,398 | | | 5,248,875 | |
Class R1 | | 17,462 | | | 245,994 | | | 60,493 | | | 725,327 | |
Class R2 | | 852,305 | | | 12,584,335 | | | 768,015 | | | 9,682,090 | |
Class R3 | | 150,488 | | | 2,260,501 | | | 261,432 | | | 3,128,788 | |
Class R4 | | 275,399 | | | 4,203,987 | | | 1,765,443 | | | 21,316,135 | |
| | 7,334,976 | | | $111,180,011 | | | 37,948,180 | | | $483,183,862 | |
| | | | |
| Shares issued to shareholders in reinvestment of distributions | | | | | | | | | | | | |
Class A | | 10,171 | | | $155,622 | | | — | | | $— | |
Class B | | — | | | — | | | — | | | — | |
Class C | | — | | | — | | | — | | | — | |
Class I | | 118,243 | | | 1,875,331 | | | 43,893 | | | 556,562 | |
Class W | | 851 | | | 13,122 | | | — | | | — | |
Class R1 | | — | | | — | | | — | | | — | |
Class R2 | | 987 | | | 14,801 | | | — | | | — | |
Class R3 | | 758 | | | 11,570 | | | — | | | — | |
Class R4 | | 7,831 | | | 121,143 | | | — | | | — | |
| | 138,841 | | | $2,191,589 | | | 43,893 | | | $556,562 | |
| | | | |
| Shares reacquired | | | | | | | | | | | | |
Class A | | (3,989,665 | ) | | $(60,161,649 | ) | | (14,718,650 | ) | | $(195,792,193 | ) |
Class B | | (1,600,223 | ) | | (22,779,980 | ) | | (4,669,245 | ) | | (56,616,643 | ) |
Class C | | (574,800 | ) | | (8,118,858 | ) | | (1,437,761 | ) | | (17,545,782 | ) |
Class I | | (12,240,851 | ) | | (192,526,568 | ) | | (17,782,303 | ) | | (219,933,966 | ) |
Class W | | (510,413 | ) | | (7,651,609 | ) | | (44,426 | ) | | (562,577 | ) |
Class R1 | | (26,715 | ) | | (376,578 | ) | | (30,560 | ) | | (365,665 | ) |
Class R2 | | (199,945 | ) | | (2,969,307 | ) | | (251,745 | ) | | (3,208,016 | ) |
Class R3 | | (46,796 | ) | | (713,886 | ) | | (54,562 | ) | | (718,120 | ) |
Class R4 | | (176,955 | ) | | (2,704,471 | ) | | (325,553 | ) | | (4,229,239 | ) |
| | (19,366,363 | ) | | $(298,002,906 | ) | | (39,314,805 | ) | | $(498,972,201 | ) |
34
Notes to Financial Statements (unaudited) – continued
| | | | | | | | | | | | |
| | | Six months ended
2/28/10 | | | Year ended
8/31/09 | |
| | | Shares | | | Amount | | | Shares | | | Amount | |
| Net change | | | | | | | | | | | | |
Class A | | (1,301,322 | ) | | $(19,447,342 | ) | | (4,013,319 | ) | | $(60,893,261 | ) |
Class B | | (1,380,281 | ) | | (19,674,737 | ) | | (3,899,418 | ) | | (47,283,069 | ) |
Class C | | (389,654 | ) | | (5,517,088 | ) | | (283,643 | ) | | (3,798,881 | ) |
Class I | | (9,419,326 | ) | | (148,792,016 | ) | | 4,323,713 | | | 65,725,836 | |
Class W | | (256,782 | ) | | (3,878,212 | ) | | 356,972 | | | 4,686,298 | |
Class R1 | | (9,253 | ) | | (130,584 | ) | | 29,933 | | | 359,662 | |
Class R2 | | 653,347 | | | 9,629,829 | | | 516,270 | | | 6,474,074 | |
Class R3 | | 104,450 | | | 1,558,185 | | | 206,870 | | | 2,410,668 | |
Class R4 | | 106,275 | | | 1,620,659 | | | 1,439,890 | | | 17,086,896 | |
| | (11,892,546 | ) | | $(184,631,306 | ) | | (1,322,732 | ) | | $(15,231,777 | ) |
The fund is one of several mutual funds in which the MFS funds-of-funds may invest. The MFS funds-of-funds do not invest in the underlying MFS funds for the purpose of exercising management or control. At the end of the period, the MFS Growth Allocation Fund, MFS Moderate Allocation Fund, MFS Aggressive Growth Allocation Fund, and MFS Conservative Allocation Fund were the owners of record of approximately 16%, 11%, 8%, and 3%, respectively, of the value of outstanding voting shares of the fund. In addition, the MFS Lifetime 2010 Fund, MFS Lifetime 2020 Fund, MFS Lifetime 2030 Fund, MFS Lifetime 2040 Fund, and the MFS Lifetime Retirement Income Fund were each the owners of record of less than 1% of the value of outstanding voting shares of the fund.
The fund and certain other funds managed by MFS participate in a $1.1 billion unsecured committed line of credit, subject to a $1 billion sublimit, provided by a syndication of banks under a credit agreement. Borrowings may be made for temporary financing needs. Interest is charged to each fund, based on its borrowings, generally at a rate equal to the higher of the Federal Reserve funds rate or one month LIBOR plus an agreed upon spread. A commitment fee, based on the average daily, unused portion of the committed line of credit, is allocated among the participating funds at the end of each calendar quarter. In addition, the fund and other funds managed by MFS have established unsecured uncommitted borrowing arrangements with certain banks for temporary financing needs. Interest is charged to each fund, based on its borrowings, at a rate equal to the Federal Reserve funds rate plus an agreed upon spread. For the six months ended February 28, 2010, the fund’s commitment fee and interest expense were $13,708 and $0, respectively, and are included in miscellaneous expense on the Statement of Operations.
35
Notes to Financial Statements (unaudited) – continued
| (7) | | Transactions in Underlying Funds-Affiliated Issuers |
An affiliated issuer may be considered one in which the fund owns 5% or more of the outstanding voting securities, or a company which is under common control. For the purposes of this report, the fund assumes the following to be affiliated issuers:
| | | | | | | | | |
| Underlying Funds | | Beginning
Shares/Par
Amount | | Acquisitions
Shares/Par
Amount | | Dispositions
Shares/Par
Amount | | | Ending
Shares/Par
Amount |
| MFS Institutional Money Market Portfolio | | 76,236,576 | | 420,786,783 | | (428,859,295 | ) | | 68,164,064 |
| | | | |
| Underlying Funds | | Realized
Gain (Loss) | | Capital Gain
Distributions | | Dividend
Income | | | Ending
Value |
| MFS Institutional Money Market Portfolio | | $— | | $— | | $37,999 | | | $68,164,064 |
36
RESULTS OF SHAREHOLDER MEETING
(unaudited)
At a special meeting of shareholders of MFS Series Trust I, which was held on January 28, 2010, the following actions were taken:
Item 1. To elect the following individuals as Trustees:
| | | | |
| | | Number of Dollars |
Nominee | | For | | Withheld Authority |
| Robert E. Butler | | 13,799,428,259.131 | | 298,698,895.701 |
| Lawrence H. Cohn | | 13,775,964,000.646 | | 322,163,154.185 |
| Maureen R. Goldfarb | | 13,797,667,920.487 | | 300,459,234.345 |
| David H. Gunning | | 13,795,139,579.854 | | 302,987,574.978 |
| William R. Gutow | | 13,798,125,706.624 | | 300,001,448.207 |
| Michael Hegarty | | 13,780,926,681.791 | | 317,200,473.041 |
| John P. Kavanaugh | | 13,799,879,923.291 | | 298,247,231.541 |
| Robert J. Manning | | 13,802,393,104.041 | | 295,734,050.791 |
| Robert C. Pozen | | 13,802,480,679.754 | | 295,646,475.078 |
| J. Dale Sherratt | | 13,779,899,981.473 | | 318,227,173.359 |
| Laurie J. Thomsen | | 13,797,678,786.081 | | 300,448,368.750 |
| Robert W. Uek | | 13,798,504,506.307 | | 299,622,648.525 |
37
BOARD REVIEW OF INVESTMENT ADVISORY AGREEMENT
A discussion regarding the Board’s most recent review and renewal of the fund’s Investment Advisory Agreement with MFS is available by clicking on the fund’s name under “Mutual Funds” in the “Products and Performance” section of the MFS Web site (mfs.com).
PROXY VOTING POLICIES AND INFORMATION
A general description of the MFS funds’ proxy voting policies and procedures is available without charge, upon request, by calling 1-800-225-2606, by visiting the Proxy Voting section of mfs.com or by visiting the SEC’s Web site at http://www.sec.gov.
Information regarding how the fund voted proxies relating to portfolio securities during the most recent twelve-month period ended June 30 is available without charge by visiting the Proxy Voting section of mfs.com or by visiting the SEC’s Web site at http://www.sec.gov.
QUARTERLY PORTFOLIO DISCLOSURE
The fund will file a complete schedule of portfolio holdings with the Securities and Exchange Commission (the Commission) for the first and third quarters of each fiscal year on Form N-Q. The fund’s Form N-Q may be reviewed and copied at the:
Public Reference Room
Securities and Exchange Commission
100 F Street, NE, Room 1580
Washington, D.C. 20549
Information on the operation of the Public Reference Room may be obtained by calling the Commission at 1-800-SEC-0330. The fund’s Form N-Q is available on the EDGAR database on the Commission’s Internet Web site at http://www.sec.gov, and copies of this information may be obtained, upon payment of a duplicating fee, by electronic request at the following e-mail address: publicinfo@sec.gov or by writing the Public Reference Section at the above address.
A shareholder can also obtain the quarterly portfolio holdings report at mfs.com.
FURTHER INFORMATION
From time to time, MFS may post important information about the fund or the MFS funds on the MFS web site (mfs.com). This information is available by visiting the “News & Commentary” section of mfs.com or by clicking on the fund’s name under “Mutual Funds” in the “Products and Performance” section of mfs.com.
38
CONTACT US
Web site
mfs.com
MFS TALK
1-800-637-8255
24 hours a day
Account service and literature
Shareholders
1-800-225-2606
Investment professionals
1-800-343-2829
Retirement plan services
1-800-637-1255
Mailing address
MFS Service Center, Inc.
P.O. Box 55824
Boston, MA 02205-5824
Overnight mail
MFS Service Center, Inc.
c/o Boston Financial Data Services
30 Dan Road
Canton, MA 02021-2809

Save paper with eDelivery. MFS® will send you prospectuses, reports, and proxies directly via e-mail so you will get information faster with less mailbox clutter. To sign up: 1. go to mfs.com. 2. log in via MFS® Access. 3. select eDelivery. If you own your MFS fund shares through a financial institution or a retirement plan, MFS® TALK, MFS Access, and eDelivery may not be available to you.


MFS® New Discovery Fund
The report is prepared for the general information of shareholders. It is authorized for distribution to prospective investors only when preceded or accompanied by a current prospectus.
NOT FDIC INSURED Ÿ MAY LOSE VALUE Ÿ
NO BANK GUARANTEE
2/28/10
NDF-SEM

LETTER FROM THE CEO
Dear Shareholders:
After having suffered their biggest declines since the Great Depression, most global markets experienced an impressive resurgence during the latter months of 2009 and the first quarter of 2010. The global economy was able to reap the benefits of two major trends. The first of these was the massive efforts of governments and central banks to increase liquidity in the financial system as they sought to prevent the credit crisis from further affecting the banking system. The second was the move by companies around the world to cut costs and operations to prepare for rapidly changing market conditions. We believe that these moves not only shortened the length of the downturn but also set the stage for the recovery we are seeing today.
Even with the significant market gains of 2009 and the early part of 2010, the recovery is unrolling at a moderate pace, with rebounds in the manufacturing sector and corporate America leading the way. Central bankers are proceeding with caution and have held benchmark interest rates unchanged as they debate the best way to withdraw stimulus measures without disrupting the fragile growth process.
While hurdles remain, we believe that the global economy is on the road to recovery. As always, we continue to be mindful of the many challenges faced at the individual, national, and international levels. It is at times such as these that we want to remind investors of the merits of maintaining a long-term view, adhering to basic investing principles such as asset allocation and diversification, and working closely with advisors to identify and research investment opportunities. At MFS®, we take particular pride in how well mutual funds can help investors by providing the diversification that is important in any type of market climate.
Respectfully,

Robert J. Manning
Chief Executive Officer and Chief Investment Officer
MFS Investment Management®
April 15, 2010
The opinions expressed in this letter are subject to change, may not be relied upon for investment advice, and no forecasts can be guaranteed.
1
PORTFOLIO COMPOSITION
Portfolio structure

| | |
| Top ten holdings | | |
| Lincare Holdings, Inc. | | 1.8% |
| Hittite Microwave Corp. | | 1.8% |
| CoStar Group, Inc. | | 1.6% |
| Gen-Probe, Inc. | | 1.6% |
| NetLogic Microsystems, Inc. | | 1.6% |
| Silicon Laboratories, Inc. | | 1.5% |
| Bucyrus International, Inc. | | 1.5% |
| Constant Contact, Inc. | | 1.5% |
| MICROS Systems, Inc. | | 1.4% |
| Verisk Analytics, Inc., “A” | | 1.4% |
| | |
| Equity sectors | | |
| Health Care | | 25.9% |
| Technology | | 23.2% |
| Special Products & Services | | 10.3% |
| Financial Services | | 8.7% |
| Industrial Goods & Services | | 7.0% |
| Leisure | | 6.2% |
| Retailing | | 4.5% |
| Basic Materials | | 3.9% |
| Energy | | 3.5% |
| Consumer Staples | | 3.0% |
| Utilities & Communications | | 2.0% |
| Transportation | | 1.3% |
Percentages are based on net assets as of 2/28/10.
The portfolio is actively managed and current holdings may be different.
2
MARKET ENVIRONMENT
After having suffered through one of the largest and most concentrated downturns since the 1930s, most asset markets staged a remarkable rebound during 2009. This recovery in global activity, which covers this reporting period, has been led importantly by emerging Asian economies, but broadening to include most of the global economy to varying degrees. Primary drivers of the recovery included an unwinding of the inventory destocking that took place earlier, as well as massive fiscal and monetary stimulus.
During the worst of the credit crisis, policy makers globally loosened monetary and fiscal policy on a massive scale. Having reached their lower bound on policy rates prior to the beginning of the reporting period, several central banks were implementing quantitative easing as a means to further loosen monetary policy to offset the continuing fall in global economic activity. However, by the beginning of the period, there were ever-broadening signs that the global macroeconomic deterioration had passed, which caused the subsequent rise in asset valuations. As most asset prices rebounded during the period and the demand for liquidity waned, the debate concerning the existence of asset bubbles and the need for monetary exit strategies had begun, creating added uncertainty regarding the forward path of policy rates. This changing dynamic caused asset valuations to move broadly sideways during the latter part of the period.
3
EXPENSE TABLE
Fund expenses borne by the shareholders during the period,
September 1, 2009 through February 28, 2010
As a shareholder of the fund, you incur two types of costs: (1) transaction costs, including sales charges (loads) on certain purchase or redemption payments, and (2) ongoing costs, including management fees; distribution and service (12b-1) fees; and other fund expenses. This example is intended to help you understand your ongoing costs (in dollars) of investing in the fund and to compare these costs with the ongoing costs of investing in other mutual funds.
The example is based on an investment of $1,000 invested at the beginning of the period and held for the entire period September 1, 2009 through February 28, 2010.
The expenses include the payment of a portion of the transfer-agent-related expenses of MFS funds that invest in the fund. For further information, please see the Notes to the Financial Statements.
Actual Expenses
The first line for each share class in the following table provides information about actual account values and actual expenses. You may use the information in this line, together with the amount you invested, to estimate the expenses that you paid over the period. Simply divide your account value by $1,000 (for example, an $8,600 account value divided by $1,000 = 8.6), then multiply the result by the number in the first line under the heading entitled “Expenses Paid During Period” to estimate the expenses you paid on your account during this period.
Hypothetical Example for Comparison Purposes
The second line for each share class in the following table provides information about hypothetical account values and hypothetical expenses based on the fund’s actual expense ratio and an assumed rate of return of 5% per year before expenses, which is not the fund’s actual return. The hypothetical account values and expenses may not be used to estimate the actual ending account balance or expenses you paid for the period. You may use this information to compare the ongoing costs of investing in the fund and other funds. To do so, compare this 5% hypothetical example with the 5% hypothetical examples that appear in the shareholder reports of the other funds.
Please note that the expenses shown in the table are meant to highlight your ongoing costs only and do not reflect any transactional costs, such as sales charges (loads). Therefore, the second line for each share class in the table is useful in comparing ongoing costs only, and will not help you determine the relative total costs of owning different funds. In addition, if these transactional costs were included, your costs would have been higher.
4
Expense Table – continued
| | | | | | | | | | |
Share
Class | | | | Annualized
Expense
Ratio | | Beginning
Account Value
9/01/09 | | Ending
Account Value
2/28/10 | | Expenses
Paid During
Period (p)
9/01/09-2/28/10 |
| A | | Actual | | 1.42% | | $1,000.00 | | $1,155.36 | | $7.59 |
| | Hypothetical (h) | | 1.42% | | $1,000.00 | | $1,017.75 | | $7.10 |
| B | | Actual | | 2.17% | | $1,000.00 | | $1,150.40 | | $11.57 |
| | Hypothetical (h) | | 2.17% | | $1,000.00 | | $1,014.03 | | $10.84 |
| C | | Actual | | 2.17% | | $1,000.00 | | $1,150.20 | | $11.57 |
| | Hypothetical (h) | | 2.17% | | $1,000.00 | | $1,014.03 | | $10.84 |
| I | | Actual | | 1.17% | | $1,000.00 | | $1,156.12 | | $6.25 |
| | Hypothetical (h) | | 1.17% | | $1,000.00 | | $1,018.99 | | $5.86 |
| R1 | | Actual | | 2.17% | | $1,000.00 | | $1,150.99 | | $11.57 |
| | Hypothetical (h) | | 2.17% | | $1,000.00 | | $1,014.03 | | $10.84 |
| R2 | | Actual | | 1.67% | | $1,000.00 | | $1,153.07 | | $8.92 |
| | Hypothetical (h) | | 1.67% | | $1,000.00 | | $1,016.51 | | $8.35 |
| R3 | | Actual | | 1.42% | | $1,000.00 | | $1,154.75 | | $7.59 |
| | Hypothetical (h) | | 1.42% | | $1,000.00 | | $1,017.75 | | $7.10 |
| R4 | | Actual | | 1.17% | | $1,000.00 | | $1,156.52 | | $6.26 |
| | Hypothetical (h) | | 1.17% | | $1,000.00 | | $1,018.99 | | $5.86 |
| 529A | | Actual | | 1.52% | | $1,000.00 | | $1,154.67 | | $8.12 |
| | Hypothetical (h) | | 1.52% | | $1,000.00 | | $1,017.26 | | $7.60 |
| 529B | | Actual | | 2.27% | | $1,000.00 | | $1,150.13 | | $12.10 |
| | Hypothetical (h) | | 2.27% | | $1,000.00 | | $1,013.54 | | $11.33 |
| 529C | | Actual | | 2.27% | | $1,000.00 | | $1,150.03 | | $12.10 |
| | Hypothetical (h) | | 2.27% | | $1,000.00 | | $1,013.54 | | $11.33 |
| (h) | 5% class return per year before expenses. |
| (p) | Expenses paid is equal to each class’ annualized expense ratio, as shown above, multiplied by the average account value over the period, multiplied by the number of days in the period, divided by the number of days in the year. Expenses paid do not include any applicable sales charges (loads). If these transaction costs had been included, your costs would have been higher. |
5
PORTFOLIO OF INVESTMENTS
2/28/10 (unaudited)
The Portfolio of Investments is a complete list of all securities owned by your fund. It is categorized by broad-based asset classes.
| | | | | |
| Common Stocks - 99.5% | | | | | |
| Issuer | | Shares/Par | | Value ($) |
| | | | | |
| Aerospace - 0.8% | | | | | |
| HEICO Corp. | | 77,090 | | $ | 3,673,339 |
| HEICO Corp., “A” | | 50,300 | | | 1,866,130 |
| | | | | |
| | | | | $ | 5,539,469 |
| Apparel Manufacturers - 0.4% | | | | | |
| Stella International Holdings | | 1,215,000 | | $ | 2,507,591 |
| | |
| Biotechnology - 2.2% | | | | | |
| Gen-Probe, Inc. (a) | | 238,670 | | $ | 10,759,244 |
| Human Genome Sciences, Inc. (a) | | 170,770 | | | 4,807,176 |
| | | | | |
| | | | | $ | 15,566,420 |
| Brokerage & Asset Managers - 0.8% | | | | | |
| Penson Worldwide, Inc. (a) | | 517,350 | | $ | 4,868,264 |
| Thomas Weisel Partners Group (a) | | 170,378 | | | 686,623 |
| | | | | |
| | | | | $ | 5,554,887 |
| Business Services - 5.7% | | | | | |
| Concur Technologies, Inc. (a) | | 177,030 | | $ | 6,964,360 |
| Constant Contact, Inc. (a)(l) | | 537,560 | | | 10,036,245 |
| CoStar Group, Inc. (a) | | 287,010 | | | 11,293,844 |
| IFM Investments Ltd., ADR (a) | | 176,440 | | | 1,235,080 |
| Redecard S.A. | | 237,300 | | | 3,453,499 |
| Ultimate Software Group, Inc. (a) | | 198,150 | | | 6,126,798 |
| | | | | |
| | | | | $ | 39,109,826 |
| Chemicals - 1.0% | | | | | |
| Intrepid Potash, Inc. (a) | | 248,120 | | $ | 6,828,262 |
| | |
| Computer Software - 5.6% | | | | | |
| Akamai Technologies, Inc. (a) | | 65,670 | | $ | 1,727,121 |
| Ariba, Inc. (a) | | 350,090 | | | 4,204,581 |
| Autonomy Corp. PLC (a) | | 287,110 | | | 6,698,113 |
| Blackboard, Inc. (a) | | 182,400 | | | 7,128,192 |
| Nuance Communications, Inc. (a) | | 385,589 | | | 5,548,626 |
| Salesforce.com, Inc. (a) | | 52,090 | | | 3,539,516 |
| SolarWinds, Inc. (a) | | 219,630 | | | 4,131,240 |
6
Portfolio of Investments (unaudited) – continued
| | | | | |
| Issuer | | Shares/Par | | Value ($) |
| | | | | |
| Common Stocks - continued | | | | | |
| Computer Software - continued | | | | | |
| SuccessFactors, Inc. (a) | | 335,560 | | $ | 6,076,992 |
| | | | | |
| | | | | $ | 39,054,381 |
| Computer Software - Systems - 2.9% | | | | | |
| Compellent Technologies, Inc. (a) | | 334,040 | | $ | 5,187,641 |
| MICROS Systems, Inc. (a) | | 332,140 | | | 9,977,486 |
| PROS Holdings, Inc. (a) | | 535,200 | | | 4,661,592 |
| | | | | |
| | | | | $ | 19,826,719 |
| Consumer Products - 1.7% | | | | | |
| Colgate-Palmolive (India) Ltd. | | 232,759 | | $ | 3,474,599 |
| Dabur India Ltd. | | 621,690 | | | 2,282,204 |
| Hengan International Group Co. Ltd. | | 355,500 | | | 2,443,386 |
| Natura Cosmeticos S.A. | | 185,010 | | | 3,409,143 |
| | | | | |
| | | | | $ | 11,609,332 |
| Consumer Services - 3.9% | | | | | |
| Anhanguera Educacional Participacoes S.A., IEU (a) | | 410,000 | | $ | 6,003,154 |
| Archipelago Learning, Inc. (a) | | 168,140 | | | 3,055,104 |
| Capella Education Co. (a) | | 81,380 | | | 6,760,237 |
| Ctrip.com International Ltd., ADR (a) | | 117,570 | | | 4,494,701 |
| Strayer Education, Inc. (l) | | 28,330 | | | 6,426,094 |
| | | | | |
| | | | | $ | 26,739,290 |
| Electrical Equipment - 0.5% | | | | | |
| Houston Wire & Cable Co. | | 271,310 | | $ | 3,328,974 |
| | |
| Electronics - 7.5% | | | | | |
| ARM Holdings PLC | | 1,592,480 | | $ | 4,948,697 |
| CEVA, Inc. (a) | | 263,200 | | | 3,076,808 |
| Hittite Microwave Corp. (a) | | 292,110 | | | 12,192,671 |
| NetLogic Microsystems, Inc. (a) | | 198,140 | | | 10,737,207 |
| PMC-Sierra, Inc. (a) | | 611,920 | | | 5,078,936 |
| Silicon Laboratories, Inc. (a) | | 233,390 | | | 10,605,242 |
| Tessera Technologies, Inc. (a) | | 278,450 | | | 5,000,962 |
| | | | | |
| | | | | $ | 51,640,523 |
| Energy - Independent - 2.1% | | | | | |
| Cobalt International Energy, Inc. (a) | | 506,920 | | $ | 6,255,393 |
| EXCO Resources, Inc. | | 420,050 | | | 7,943,146 |
| | | | | |
| | | | | $ | 14,198,539 |
7
Portfolio of Investments (unaudited) – continued
| | | | | |
| Issuer | | Shares/Par | | Value ($) |
| | | | | |
| Common Stocks - continued | | | | | |
| Engineering - Construction - 1.3% | | | | | |
| North American Energy Partners, Inc. (a) | | 885,165 | | $ | 9,019,831 |
| | |
| Food & Beverages - 1.3% | | | | | |
| Mead Johnson Nutrition Co., “A” | | 192,740 | | $ | 9,116,602 |
| | |
| Gaming & Lodging - 2.2% | | | | | |
| International Game Technology | | 337,400 | | $ | 5,921,370 |
| WMS Industries, Inc. (a) | | 240,370 | | | 9,117,234 |
| | | | | |
| | | | | $ | 15,038,604 |
| Health Maintenance Organizations - 0.6% | | | | | |
| OdontoPrev S.A. | | 108,400 | | $ | 3,979,335 |
| | |
| Insurance - 1.4% | | | | | |
| Verisk Analytics, Inc., “A” (a) | | 350,070 | | $ | 9,906,981 |
| | |
| Internet - 3.9% | | | | | |
| Art Technology Group, Inc. (a) | | 421,900 | | $ | 1,674,943 |
| Baidu, Inc., ADR (a) | | 7,730 | | | 4,009,396 |
| GSI Commerce, Inc. (a) | | 174,160 | | | 4,348,775 |
| LogMeIn, Inc. (a) | | 98,770 | | | 1,852,925 |
| Rackspace Hosting, Inc. (a) | | 246,310 | | | 4,884,327 |
| TechTarget, Inc. (a) | | 917,030 | | | 4,796,067 |
| Vocus, Inc. (a) | | 400,150 | | | 5,694,135 |
| | | | | |
| | | | | $ | 27,260,568 |
| Machinery & Tools - 4.4% | | | | | |
| Bucyrus International, Inc. | | 166,120 | | $ | 10,392,467 |
| Duoyuan Global Water, Inc., ADR (a) | | 88,050 | | | 2,217,099 |
| Jain Irrigation Systems Ltd. | | 230,049 | | | 4,151,410 |
| Kennametal, Inc. | | 129,360 | | | 3,369,828 |
| Ritchie Bros. Auctioneers, Inc. (l) | | 257,790 | | | 5,405,856 |
| RTI International Metals, Inc. (a) | | 207,450 | | | 4,985,024 |
| | | | | |
| | | | | $ | 30,521,684 |
| Medical & Health Technology & Services - 11.3% | | | | | |
| Allscripts Healthcare Solutions, Inc. (a) | | 197,470 | | $ | 3,532,738 |
| athenahealth, Inc. (a) | | 131,510 | | | 4,844,828 |
| Cerner Corp. (a) | | 42,460 | | | 3,522,057 |
| DaVita, Inc. (a) | | 140,670 | | | 8,666,679 |
| Diagnosticos da America S.A. | | 812,600 | | | 6,654,943 |
| Fleury S.A. (a) | | 361,100 | | | 3,994,350 |
8
Portfolio of Investments (unaudited) – continued
| | | | | |
| Issuer | | Shares/Par | | Value ($) |
| | | | | |
| Common Stocks - continued | | | | | |
| Medical & Health Technology & Services - continued | | | | | |
| Healthcare Services Group, Inc. | | 396,100 | | $ | 8,698,356 |
| IDEXX Laboratories, Inc. (a) | | 146,910 | | | 7,758,317 |
| IPC The Hospitalist Co., Inc. (a) | | 194,677 | | | 6,436,022 |
| Lincare Holdings, Inc. (a) | | 315,240 | | | 12,660,038 |
| MedAssets, Inc. (a) | | 236,050 | | | 5,110,483 |
| MWI Veterinary Supply, Inc. (a) | | 154,046 | | | 6,346,695 |
| | | | | |
| | | | | $ | 78,225,506 |
| Medical Equipment - 10.9% | | | | | |
| AGA Medical Holdings, Inc. (a) | | 343,340 | | $ | 4,600,756 |
| AtriCure, Inc. (a) | | 91,030 | | | 458,791 |
| Conceptus, Inc. (a) | | 264,760 | | | 5,197,239 |
| DexCom, Inc. (a) | | 815,720 | | | 7,374,109 |
| Edwards Lifesciences Corp. (a) | | 72,910 | | | 6,695,325 |
| Heartware International, Inc. (a) | | 97,660 | | | 3,763,816 |
| Masimo Corp. (a) | | 194,740 | | | 5,392,351 |
| Mindray Medical International Ltd., ADR | | 236,130 | | | 9,010,721 |
| NxStage Medical, Inc. (a) | | 921,861 | | | 9,817,820 |
| Orthovita, Inc. (a) | | 1,160,010 | | | 4,454,438 |
| ResMed, Inc. (a) | | 60,370 | | | 3,445,920 |
| Thoratec Corp. (a) | | 245,710 | | | 7,088,734 |
| Volcano Corp. (a) | | 402,320 | | | 8,283,769 |
| | | | | |
| | | | | $ | 75,583,789 |
| Metals & Mining - 1.6% | | | | | |
| Globe Specialty Metals, Inc. (a) | | 579,040 | | $ | 5,940,950 |
| Iluka Resources Ltd. (a) | | 1,689,780 | | | 5,421,485 |
| | | | | |
| | | | | $ | 11,362,435 |
| Natural Gas - Pipeline - 0.8% | | | | | |
| Aegean Marine Petroleum Network, Inc. | | 186,270 | | $ | 5,338,498 |
| | |
| Network & Telecom - 3.3% | | | | | |
| Ciena Corp. (a) | | 233,380 | | $ | 3,346,669 |
| F5 Networks, Inc. (a) | | 135,010 | | | 7,533,558 |
| Fortinet, Inc. (a) | | 477,610 | | | 8,205,340 |
| Riverbed Technology, Inc. (a) | | 147,220 | | | 4,011,745 |
| | | | | |
| | | | | $ | 23,097,312 |
| Oil Services - 1.4% | | | | | |
| Core Laboratories N.V. | | 22,760 | | $ | 2,822,923 |
| Dresser-Rand Group, Inc. (a) | | 226,760 | | | 7,009,152 |
| | | | | |
| | | | | $ | 9,832,075 |
9
Portfolio of Investments (unaudited) – continued
| | | | | |
| Issuer | | Shares/Par | | Value ($) |
| | | | | |
| Common Stocks - continued | | | | | |
| Other Banks & Diversified Financials - 5.7% | | | | | |
| Associated Banc-Corp. | | 306,260 | | $ | 3,953,817 |
| City National Corp. | | 86,820 | | | 4,334,054 |
| Metro Bancorp, Inc. (a) | | 239,970 | | | 2,908,436 |
| Ocwen Financial Corp. (a) | | 483,790 | | | 5,229,770 |
| PacWest Bancorp | | 129,620 | | | 2,631,286 |
| Signature Bank (a) | | 147,240 | | | 5,481,745 |
| Sterling Bancshares, Inc. | | 943,150 | | | 4,451,668 |
| SVB Financial Group (a) | | 118,190 | | | 5,266,546 |
| TCF Financial Corp. | | 368,900 | | | 5,326,916 |
| | | | | |
| | | | | $ | 39,584,238 |
| Pharmaceuticals - 0.9% | | | | | |
| Eurand N.V. (a) | | 295,360 | | $ | 2,622,797 |
| Genomma Lab Internacional S.A., “B” (a) | | 1,288,900 | | | 3,949,894 |
| | | | | |
| | | | | $ | 6,572,691 |
| Precious Metals & Minerals - 0.8% | | | | | |
| Stillwater Mining Co. (a) | | 508,040 | | $ | 5,766,247 |
| | |
| Printing & Publishing - 2.2% | | | | | |
| MSCI, Inc., “A” (a) | | 318,170 | | $ | 9,538,737 |
| VistaPrint Ltd. (a) | | 99,870 | | | 5,764,496 |
| | | | | |
| | | | | $ | 15,303,233 |
| Real Estate - 0.8% | | | | | |
| Brasil Brokers Participacoes | | 439,300 | | $ | 1,993,338 |
| Chesapeake Lodging Trust (a) | | 179,280 | | | 3,582,014 |
| | | | | |
| | | | | $ | 5,575,352 |
| Restaurants - 1.8% | | | | | |
| McCormick & Schmick’s Seafood Restaurant, Inc. (a) | | 352,210 | | $ | 2,800,070 |
| P.F. Chang’s China Bistro, Inc. (a) | | 162,040 | | | 6,876,978 |
| Peet’s Coffee & Tea, Inc. (a) | | 81,750 | | | 2,972,430 |
| | | | | |
| | | | | $ | 12,649,478 |
| Special Products & Services - 0.7% | | | | | |
| PICO Holdings, Inc. (a) | | 138,090 | | $ | 4,700,584 |
| | |
| Specialty Chemicals - 0.5% | | | | | |
| Asian Paints Ltd. | | 81,463 | | $ | 3,198,004 |
10
Portfolio of Investments (unaudited) – continued
| | | | | |
| Issuer | | Shares/Par | | Value ($) |
| | | | | |
| Common Stocks - continued | | | | | |
| Specialty Stores - 4.1% | | | | | |
| Citi Trends, Inc. (a) | | 195,050 | | $ | 5,800,787 |
| hhgregg, Inc. (a) | | 54,268 | | | 1,132,573 |
| Monro Muffler Brake, Inc. | | 97,830 | | | 3,410,354 |
| Overstock.com, Inc. (a) | | 203,800 | | | 2,508,778 |
| Rue21, Inc. (a) | | 133,970 | | | 3,850,298 |
| Titan Machinery, Inc. (a) | | 538,470 | | | 6,413,178 |
| Vitacost.Com, Inc. (a) | | 313,030 | | | 3,509,066 |
| Zumiez, Inc. (a) | | 143,747 | | | 2,061,332 |
| | | | | |
| | | | | $ | 28,686,366 |
| Telecommunications - Wireless - 1.2% | | | |
| SBA Communications Corp. (a) | | 225,130 | | $ | 7,960,597 |
| | |
| Trucking - 1.3% | | | | | |
| Atlas Air Worldwide Holdings, Inc. (a) | | 115,490 | | $ | 5,206,289 |
| Old Dominion Freight Lines, Inc. (a) | | 112,470 | | | 3,457,328 |
| | | | | |
| | | | | $ | 8,663,617 |
| Total Common Stocks (Identified Cost, $581,000,711) | | | | $ | 688,447,840 |
| | | | | | | | | | | |
| | | | |
| | | Strike Price | | First Exercise | | | | | |
| Warrants - 0.0% | | | | | | | | | | | |
| Alcoholic Beverages - 0.0% | | | | | | | | | | | |
| Castle Brands, Inc. (1 share for 1 warrant) (Identified Cost, $155,725) (a)(z) | | $ | 6.57 | | 5/08/07 | | 110,880 | | $ | 209 | |
| | | | |
| Money Market Funds (v) - 0.7% | | | | | | | | | | | |
MFS Institutional Money Market Portfolio, 0.14%,
at Cost and Net Asset Value | | | | 4,878,237 | | $ | 4,878,237 | |
| | | |
| Collateral for Securities Loaned - 1.0% | | | | | | | | |
Navigator Securities Lending Prime Portfolio,
at Cost and Net Asset Value | | | | 6,822,270 | | $ | 6,822,270 | |
| Total Investments (Identified Cost, $592,856,943) | | | | $ | 700,148,556 | |
| | | |
| Other Assets, Less Liabilities - (1.2)% | | | | | | | (8,410,354 | ) |
| Net Assets - 100.0% | | | | | | | | | $ | 691,738,202 | |
| (a) | Non-income producing security. |
| (l) | All or a portion of this security is on loan. |
| (v) | Underlying fund that is available only to investment companies managed by MFS. The rate quoted is the annualized seven-day yield of the fund at period end. |
11
Portfolio of Investments (unaudited) – continued
| (z) | Restricted securities are not registered under the Securities Act of 1933 and are subject to legal restrictions on resale. These securities generally may be resold in transactions exempt from registration or to the public if the securities are subsequently registered. Disposal of these securities may involve time-consuming negotiations and prompt sale at an acceptable price may be difficult. The fund holds the following restricted security: |
| | | | | | |
| Restricted Security | | Acquisition
Date | | Cost | | Current
Market Value |
| Castle Brands, Inc. (Warrants) | | 4/18/07 | | $155,725 | | $209 |
| % of Net Assets | | | | | | 0.0% |
The following abbreviations are used in this report and are defined:
| ADR | | American Depository Receipt |
| IEU | | International Equity Unit |
| PLC | | Public Limited Company |
See Notes to Financial Statements
12
Financial Statements
STATEMENT OF ASSETS AND LIABILITIES
At 2/28/10 (unaudited)
This statement represents your fund’s balance sheet, which details the assets and liabilities comprising the total value of the fund.
| | | |
| Assets | | | |
Investments- | | | |
Non-affiliated issuers, at value (identified cost, $587,978,706) | | $695,270,319 | |
Underlying funds, at cost and value | | 4,878,237 | |
Total investments, at value, including $6,672,001 of securities on loan (identified cost, $592,856,943) | | $700,148,556 | |
Cash | | 2,350 | |
Receivables for | | | |
Investments sold | | 18,023,824 | |
Fund shares sold | | 1,436,093 | |
Interest and dividends | | 171,264 | |
Other assets | | 7,858 | |
Total assets | | $719,789,945 | |
| Liabilities | | | |
Payables for | | | |
Investments purchased | | $19,294,199 | |
Fund shares reacquired | | 1,196,518 | |
Collateral for securities loaned, at value | | 6,822,270 | |
Payable to affiliates | | | |
Investment adviser | | 60,645 | |
Shareholder servicing costs | | 273,614 | |
Distribution and service fees | | 16,817 | |
Administrative services fee | | 1,247 | |
Program manager fees | | 25 | |
Payable for independent Trustees’ compensation | | 10,258 | |
Accrued expenses and other liabilities | | 376,150 | |
Total liabilities | | $28,051,743 | |
Net assets | | $691,738,202 | |
| Net assets consist of | | | |
Paid-in capital | | $682,340,075 | |
Unrealized appreciation (depreciation) on investments and translation of assets and liabilities in foreign currencies (net of $318,755 deferred country tax) | | 106,971,772 | |
Accumulated net realized gain (loss) on investments and foreign currency transactions | | (94,283,544 | ) |
Accumulated net investment loss | | (3,290,101 | ) |
Net assets | | $691,738,202 | |
Shares of beneficial interest outstanding | | 36,625,317 | |
13
Statement of Assets and Liabilities (unaudited) – continued
| | | | | | |
| | | Net assets | | Shares
outstanding | | Net asset value
per share (a) |
Class A | | $312,300,823 | | 16,668,526 | | $18.74 |
Class B | | 29,125,565 | | 1,669,816 | | 17.44 |
Class C | | 32,371,117 | | 1,853,639 | | 17.46 |
Class I | | 241,620,460 | | 12,356,035 | | 19.55 |
Class R1 | | 5,247,884 | | 302,012 | | 17.38 |
Class R2 | | 13,019,661 | | 708,271 | | 18.38 |
Class R3 | | 4,556,115 | | 243,313 | | 18.73 |
Class R4 | | 51,237,437 | | 2,698,564 | | 18.99 |
Class 529A | | 1,608,983 | | 87,270 | | 18.44 |
Class 529B | | 203,563 | | 11,863 | | 17.16 |
Class 529C | | 446,594 | | 26,008 | | 17.17 |
| (a) | Maximum offering price per share was equal to the net asset value per share for all share classes, except for Classes A and 529A, for which the maximum offering prices per share were $19.88 [100 / 94.25 x $18.74] and $19.56 [100 / 94.25 x $18.44], respectively. On sales of $50,000 or more, the maximum offering prices of Class A and Class 529A shares are reduced. A contingent deferred sales charge may be imposed on redemptions of Class A, Class B, Class C, Class 529B, and Class 529C shares. Redemption price per share was equal to the net asset value per share for Classes I, R1, R2, R3, R4, and 529A. |
See Notes to Financial Statements
14
Financial Statements
STATEMENT OF OPERATIONS
Six months ended 2/28/10 (unaudited)
This statement describes how much your fund earned in investment income and accrued in expenses. It also describes any gains and/or losses generated by fund operations.
| | | |
| Net investment loss | | | |
Income | | | |
Dividends | | $1,072,142 | |
Income on securities loaned | | 168,872 | |
Dividends from underlying funds | | 2,878 | |
Foreign taxes withheld | | (17,151 | ) |
Total investment income | | $1,226,741 | |
Expenses | | | |
Management fee | | $2,904,678 | |
Distribution and service fees | | 713,085 | |
Program manager fees | | 1,086 | |
Shareholder servicing costs | | 880,983 | |
Administrative services fee | | 52,738 | |
Independent Trustees’ compensation | | 8,768 | |
Custodian fee | | 136,884 | |
Shareholder communications | | 26,331 | |
Auditing fees | | 23,089 | |
Legal fees | | 6,528 | |
Miscellaneous | | 78,100 | |
Total expenses | | $4,832,270 | |
Fees paid indirectly | | (7 | ) |
Reduction of expenses by investment adviser | | (324,049 | ) |
Net expenses | | $4,508,214 | |
Net investment loss | | $(3,281,473 | ) |
Realized and unrealized gain (loss) on investments
and foreign currency transactions | | | |
Realized gain (loss) (identified cost basis) | | | |
Investment transactions (net of $8,457 country tax) | | $95,756,294 | |
Foreign currency transactions | | (45,440 | ) |
Net realized gain (loss) on investments
and foreign currency transactions | | $95,710,854 | |
Change in unrealized appreciation (depreciation) | | | |
Investments (net of $243,647 increase in deferred country tax) | | $(733,965 | ) |
Translation of assets and liabilities in foreign currencies | | (1,263 | ) |
Net unrealized gain (loss) on investments
and foreign currency translation | | $(735,228 | ) |
Net realized and unrealized gain (loss) on investments
and foreign currency | | $94,975,626 | |
Change in net assets from operations | | $91,694,153 | |
See Notes to Financial Statements
15
Financial Statements
STATEMENTS OF CHANGES IN NET ASSETS
These statements describe the increases and/or decreases in net assets resulting from operations, any distributions, and any shareholder transactions.
| | | | | | |
| Change in net assets | | Six months ended
2/28/10
(unaudited) | | | Year ended
8/31/09 | |
| From operations | | | | | | |
Net investment loss | | $(3,281,473 | ) | | $(4,048,852 | ) |
Net realized gain (loss) on investments and foreign currency transactions | | 95,710,854 | | | (141,513,340 | ) |
Net unrealized gain (loss) on investments and foreign currency translation | | (735,228 | ) | | 142,730,379 | |
Change in net assets from operations | | $91,694,153 | | | $(2,831,813 | ) |
Change in net assets from fund share transactions | | $(4,044,304 | ) | | $86,060,960 | |
Total change in net assets | | $87,649,849 | | | $83,229,147 | |
| Net assets | | | | | | |
At beginning of period | | 604,088,353 | | | 520,859,206 | |
At end of period (including accumulated net investment loss of $3,290,101 and $8,628, respectively) | | $691,738,202 | | | $604,088,353 | |
See Notes to Financial Statements
16
Financial Statements
FINANCIAL HIGHLIGHTS
The financial highlights table is intended to help you understand the fund’s financial performance for the semiannual period and the past 5 fiscal years (or life of a particular share class, if shorter). Certain information reflects financial results for a single fund share. The total returns in the table represent the rate by which an investor would have earned (or lost) on an investment in the fund share class (assuming reinvestment of all distributions) held for the entire period.
| | | | | | | | | | | | | | | | | | |
| | | Six months
ended
2/28/10 (unaudited) | | | Years ended 8/31 | |
| Class A | | | 2009 | | | 2008 | | | 2007 | | | 2006 | | | 2005 | |
| | | | | | | | | | | | | | | | | |
Net asset value, beginning of period | | $16.22 | | | $17.96 | | | $20.48 | | | $16.96 | | | $16.85 | | | $13.53 | |
| Income (loss) from investment operations | | | | | | | | | | | | | | | | | | |
Net investment loss (d) | | $(0.09 | ) | | $(0.13 | ) | | $(0.16 | ) | | $(0.16 | ) | | $(0.20 | ) | | $(0.16 | ) |
Net realized and unrealized gain (loss) on investments and foreign currency | | 2.61 | | | (1.61 | )(g) | | (1.70 | ) | | 3.68 | | | 0.31 | | | 3.48 | |
Total from investment operations | | $2.52 | | | $(1.74 | ) | | $(1.86 | ) | | $3.52 | | | $0.11 | | | $3.32 | |
| Less distributions declared to shareholders | | | | | | | | | | | | | | | | | | |
From net realized gain on investments | | $— | | | $— | | | $(0.66 | ) | | $— | | | $— | | | $— | |
Redemption fees added to paid-in capital (d) | | $— | | | $— | | | $— | | | $0.00 | (w) | | $0.00 | (w) | | $0.00 | (w) |
Net asset value, end of period | | $18.74 | | | $16.22 | | | $17.96 | | | $20.48 | | | $16.96 | | | $16.85 | |
Total return (%) (r)(s)(t) | | 15.54 | (n) | | (9.69 | ) | | (9.31 | ) | | 20.75 | | | 0.65 | | | 24.54 | |
| Ratios (%) (to average net assets) and Supplemental data: | | | | | | | | | | | | | | | | | | |
Expenses before expense reductions (f) | | 1.52 | (a) | | 1.70 | | | 1.61 | | | 1.57 | | | 1.57 | | | 1.57 | |
Expenses after expense reductions (f) | | 1.42 | (a) | | 1.60 | | | 1.51 | | | 1.47 | | | 1.47 | | | 1.47 | |
Net investment loss | | (1.05 | )(a) | | (1.05 | ) | | (0.86 | ) | | (1.04 | ) | | (1.12 | ) | | (1.05 | ) |
Portfolio turnover | | 77 | | | 150 | | | 95 | | | 94 | | | 99 | | | 112 | |
Net assets at end of period (000 omitted) | | $312,301 | | | $248,658 | | | $282,079 | | | $395,993 | | | $409,471 | | | $603,396 | |
See Notes to Financial Statements
17
Financial Highlights – continued
| | | | | | | | | | | | | | | | | | |
| | | Six months
ended
2/28/10
(unaudited) | | | Years ended 8/31 | |
| Class B | | | 2009 | | | 2008 | | | 2007 | | | 2006 | | | 2005 | |
| | | | | | | | | | | | | | | | | |
Net asset value, beginning of period | | $15.16 | | | $16.90 | | | $19.44 | | | $16.20 | | | $16.20 | | | $13.09 | |
Income (loss) from investment operations | | | | | | | | | | | | | | | | | | |
Net investment loss (d) | | $(0.15 | ) | | $(0.21 | ) | | $(0.27 | ) | | $(0.25 | ) | | $(0.30 | ) | | $(0.25 | ) |
Net realized and unrealized gain (loss) on investments and foreign currency | | 2.43 | | | (1.53 | )(g) | | (1.61 | ) | | 3.49 | | | 0.30 | | | 3.36 | |
Total from investment operations | | $2.28 | | | $(1.74 | ) | | $(1.88 | ) | | $3.24 | | | $0.00 | | | $3.11 | |
| Less distributions declared to shareholders | | | | | | | | | | | | | | | | | | |
From net realized gain on investments | | $— | | | $— | | | $(0.66 | ) | | $— | | | $— | | | $— | |
Redemption fees added to paid-in capital (d) | | $— | | | $— | | | $— | | | $0.00 | (w) | | $0.00 | (w) | | $0.00 | (w) |
Net asset value, end of period | | $17.44 | | | $15.16 | | | $16.90 | | | $19.44 | | | $16.20 | | | $16.20 | |
Total return (%) (r)(s)(t) | | 15.04 | (n) | | (10.30 | ) | | (9.92 | ) | | 20.00 | | | 0.00 | | | 23.76 | |
| Ratios (%) (to average net assets) and Supplemental data: | | | | | | | | | | | | | | | | | | |
Expenses before expense reductions (f) | | 2.27 | (a) | | 2.41 | | | 2.27 | | | 2.22 | | | 2.22 | | | 2.22 | |
Expenses after expense reductions (f) | | 2.17 | (a) | | 2.30 | | | 2.17 | | | 2.12 | | | 2.12 | | | 2.12 | |
Net investment loss | | (1.79 | )(a) | | (1.76 | ) | | (1.53 | ) | | (1.69 | ) | | (1.77 | ) | | (1.70 | ) |
Portfolio turnover | | 77 | | | 150 | | | 95 | | | 94 | | | 99 | | | 112 | |
Net assets at end of period (000 omitted) | | $29,126 | | | $27,582 | | | $38,724 | | | $91,922 | | | $132,519 | | | $203,722 | |
See Notes to Financial Statements
18
Financial Highlights – continued
| | | | | | | | | | | | | | | | | | |
| | | Six months
ended
2/28/10
(unaudited) | | | Years ended 8/31 | |
| Class C | | | 2009 | | | 2008 | | | 2007 | | | 2006 | | | 2005 | |
| | | | | | | | | | | | | | | | | |
Net asset value, beginning of period | | $15.18 | | | $16.93 | | | $19.46 | | | $16.22 | | | $16.22 | | | $13.10 | |
| Income (loss) from investment operations | | | | | | | | | | | | | | | | | | |
Net investment loss (d) | | $(0.15 | ) | | $(0.21 | ) | | $(0.27 | ) | | $(0.25 | ) | | $(0.30 | ) | | $(0.25 | ) |
Net realized and unrealized gain (loss) on investments and foreign currency | | 2.43 | | | (1.54 | )(g) | | (1.60 | ) | | 3.49 | | | 0.30 | | | 3.37 | |
Total from investment operations | | $2.28 | | | $(1.75 | ) | | $(1.87 | ) | | $3.24 | | | $0.00 | | | $3.12 | |
| Less distributions declared to shareholders | | | | | | | | | | | | | | | | | | |
From net realized gain on investments | | $— | | | $— | | | $(0.66 | ) | | $— | | | $— | | | $— | |
Redemption fees added to paid-in capital (d) | | $— | | | $— | | | $— | | | $0.00 | (w) | | $0.00 | (w) | | $0.00 | (w) |
Net asset value, end of period | | $17.46 | | | $15.18 | | | $16.93 | | | $19.46 | | | $16.22 | | | $16.22 | |
Total return (%) (r)(s)(t) | | 15.02 | (n) | | (10.34 | ) | | (9.86 | ) | | 19.98 | | | 0.00 | | | 23.82 | |
| Ratios (%) (to average net assets) and Supplemental data: | | | | | | | | | | | | | | | | | | |
Expenses before expense reductions (f) | | 2.27 | (a) | | 2.40 | | | 2.26 | | | 2.22 | | | 2.22 | | | 2.22 | |
Expenses after expense reductions (f) | | 2.17 | (a) | | 2.30 | | | 2.16 | | | 2.12 | | | 2.12 | | | 2.12 | |
Net investment loss | | (1.80 | )(a) | | (1.75 | ) | | (1.51 | ) | | (1.69 | ) | | (1.77 | ) | | (1.70 | ) |
Portfolio turnover | | 77 | | | 150 | | | 95 | | | 94 | | | 99 | | | 112 | |
Net assets at end of period (000 omitted) | | $32,371 | | | $25,431 | | | $29,661 | | | $42,296 | | | $47,293 | | | $58,454 | |
See Notes to Financial Statements
19
Financial Highlights – continued
| | | | | | | | | | | | | | | | | | |
| | | Six months
ended
2/28/10
(unaudited) | | | Years ended 8/31 | |
| Class I | | | 2009 | | | 2008 | | | 2007 | | | 2006 | | | 2005 | |
| | | | | | | | | | | | | | | | | |
Net asset value, beginning of period | | $16.91 | | | $18.67 | | | $21.19 | | | $17.48 | | | $17.31 | | | $13.85 | |
| Income (loss) from investment operations | | | | | | | | | | | | | | | | | | |
Net investment loss (d) | | $(0.07 | ) | | $(0.10 | ) | | $(0.10 | ) | | $(0.11 | ) | | $(0.14 | ) | | $(0.11 | ) |
Net realized and unrealized gain (loss) on investments and foreign currency | | 2.71 | | | (1.66 | )(g) | | (1.76 | ) | | 3.82 | | | 0.31 | | | 3.57 | |
Total from investment operations | | $2.64 | | | $(1.76 | ) | | $(1.86 | ) | | $3.71 | | | $0.17 | | | $3.46 | |
| Less distributions declared to shareholders | | | | | | | | | | | | | | | | | | |
From net realized gain on investments | | $— | | | $— | | | $(0.66 | ) | | $— | | | $— | | | $— | |
Redemption fees added to paid-in capital (d) | | $— | | | $— | | | $— | | | $0.00 | (w) | | $0.00 | (w) | | $0.00 | (w) |
Net asset value, end of period | | $19.55 | | | $16.91 | | | $18.67 | | | $21.19 | | | $17.48 | | | $17.31 | |
Total return (%) (r)(s) | | 15.61 | (n) | | (9.43 | ) | | (8.99 | ) | | 21.22 | | | 0.98 | | | 24.98 | |
| Ratios (%) (to average net assets) and Supplemental data: | | | | | | | | | | | | | | | | | | |
Expenses before expense reductions (f) | | 1.28 | (a) | | 1.35 | | | 1.26 | | | 1.22 | | | 1.22 | | | 1.23 | |
Expenses after expense reductions (f) | | 1.17 | (a) | | 1.25 | | | 1.16 | | | 1.12 | | | 1.12 | | | 1.13 | |
Net investment loss | | (0.79 | )(a) | | (0.71 | ) | | (0.51 | ) | | (0.69 | ) | | (0.77 | ) | | (0.70 | ) |
Portfolio turnover | | 77 | | | 150 | | | 95 | | | 94 | | | 99 | | | 112 | |
Net assets at end of period (000 omitted) | | $241,620 | | | $238,410 | | | $90,045 | | | $100,245 | | | $119,053 | | | $107,842 | |
See Notes to Financial Statements
20
Financial Highlights – continued
| | | | | | | | | | | | | | | | | | |
| | | Six months
ended
2/28/10 (unaudited) | | | Years ended 8/31 | |
| Class R1 | | | 2009 | | | 2008 | | | 2007 | | | 2006 | | | 2005 (i) | |
| | | | | | | | | | | | | | | | | |
Net asset value, beginning of period | | $15.10 | | | $16.84 | | | $19.37 | | | $16.16 | | | $16.18 | | | $14.50 | |
| Income (loss) from investment operations | | | | | | | | | | | | | | | | | | |
Net investment loss (d) | | $(0.15 | ) | | $(0.21 | ) | | $(0.27 | ) | | $(0.26 | ) | | $(0.31 | ) | | $(0.10 | ) |
Net realized and unrealized
gain (loss) on investments and foreign currency | | 2.43 | | | (1.53 | )(g) | | (1.60 | ) | | 3.47 | | | 0.29 | | | 1.78 | |
Total from investment
operations | | $2.28 | | | $(1.74 | ) | | $(1.87 | ) | | $3.21 | | | $(0.02 | ) | | $1.68 | |
| Less distributions declared to shareholders | | | | | | | | | | | | | | | | | | |
From net realized gain on investments | | $— | | | $— | | | $(0.66 | ) | | $— | | | $— | | | $— | |
Redemption fees added to paid-in capital (d) | | $— | | | $— | | | $— | | | $0.00 | (w) | | $0.00 | (w) | | $0.00 | (w) |
Net asset value, end of period | | $17.38 | | | $15.10 | | | $16.84 | | | $19.37 | | | $16.16 | | | $16.18 | |
Total return (%) (r)(s) | | 15.10 | (n) | | (10.33 | ) | | (9.91 | ) | | 19.86 | | | (0.12 | ) | | 11.59 | (n) |
Ratios (%) (to average net assets) and Supplemental
data: | | | | | | | | | | | | | | | | | | |
Expenses before expense reductions (f) | | 2.27 | (a) | | 2.40 | | | 2.30 | | | 2.37 | | | 2.43 | | | 2.43 | (a) |
Expenses after expense reductions (f) | | 2.17 | (a) | | 2.30 | | | 2.20 | | | 2.22 | | | 2.22 | | | 2.33 | (a) |
Net investment loss | | (1.79 | )(a) | | (1.76 | ) | | (1.54 | ) | | (1.79 | ) | | (1.86 | ) | | (1.69 | )(a) |
Portfolio turnover | | 77 | | | 150 | | | 95 | | | 94 | | | 99 | | | 112 | |
Net assets at end of period (000 omitted) | | $5,248 | | | $4,217 | | | $4,565 | | | $2,609 | | | $857 | | | $206 | |
See Notes to Financial Statements
21
Financial Highlights – continued
| | | | | | | | | | | | | | | | | | |
| | | Six months
ended
2/28/10 (unaudited) | | | Years ended 8/31 | |
| Class R2 | | | 2009 | | | 2008 | | | 2007 | | | 2006 | | | 2005 | |
| | | | | | | | | | | | | | | | | |
Net asset value, beginning of period | | $15.94 | | | $17.68 | | | $20.21 | | | $16.78 | | | $16.72 | | | $13.47 | |
Income (loss) from investment operations | | | | | | | | | | | | | | | | | | |
Net investment loss (d) | | $(0.11 | ) | | $(0.16 | ) | | $(0.19 | ) | | $(0.20 | ) | | $(0.24 | ) | | $(0.22 | ) |
Net realized and unrealized gain (loss) on investments and foreign currency | | 2.55 | | | (1.58 | )(g) | | (1.68 | ) | | 3.63 | | | 0.30 | | | 3.47 | |
Total from investment operations | | $2.44 | | | $(1.74 | ) | | $(1.87 | ) | | $3.43 | | | $0.06 | | | $3.25 | |
| Less distributions declared to shareholders | | | | | | | | | | | | | | | | | | |
From net realized gain on investments | | $— | | | $— | | | $(0.66 | ) | | $— | | | $— | | | $— | |
Redemption fees added to paid-in capital (d) | | $— | | | $— | | | $— | | | $0.00 | (w) | | $0.00 | (w) | | $0.00 | (w) |
Net asset value, end of period | | $18.38 | | | $15.94 | | | $17.68 | | | $20.21 | | | $16.78 | | | $16.72 | |
Total return (%) (r)(s) | | 15.31 | (n) | | (9.84 | ) | | (9.48 | ) | | 20.44 | | | 0.36 | | | 24.13 | |
| Ratios (%) (to average net assets) and Supplemental data: | | | | | | | | | | | | | | | | | | |
Expenses before expense
reductions (f) | | 1.77 | (a) | | 1.90 | | | 1.80 | | | 1.92 | | | 1.96 | | | 1.98 | |
Expenses after expense reductions (f) | | 1.67 | (a) | | 1.80 | | | 1.70 | | | 1.77 | | | 1.77 | | | 1.88 | |
Net investment loss | | (1.29 | )(a) | | (1.26 | ) | | (1.03 | ) | | (1.34 | ) | | (1.41 | ) | | (1.42 | ) |
Portfolio turnover | | 77 | | | 150 | | | 95 | | | 94 | | | 99 | | | 112 | |
Net assets at end of period
(000 omitted) | | $13,020 | | | $11,312 | | | $13,675 | | | $8,711 | | | $4,417 | | | $1,573 | |
See Notes to Financial Statements
22
Financial Highlights – continued
| | | | | | | | | | | | | | | | | | |
| | | Six months
ended
2/28/10 (unaudited) | | | Years ended 8/31 | |
| Class R3 | | | 2009 | | | 2008 | | | 2007 | | | 2006 | | | 2005 (i) | |
| | | | | | | | | | | | | | | | | |
Net asset value, beginning of period | | $16.22 | | | $17.94 | | | $20.45 | | | $16.94 | | | $16.84 | | | $15.04 | |
| Income (loss) from investment operations | | | | | | | | | | | | | | | | | | |
Net investment loss (d) | | $(0.09 | ) | | $(0.13 | ) | | $(0.15 | ) | | $(0.17 | ) | | $(0.21 | ) | | $(0.04 | ) |
Net realized and unrealized
gain (loss) on investments and foreign currency | | 2.60 | | | (1.59 | )(g) | | (1.70 | ) | | 3.68 | | | 0.31 | | | 1.84 | |
Total from investment operations | | $2.51 | | | $(1.72 | ) | | $(1.85 | ) | | $3.51 | | | $0.10 | | | $1.80 | |
| Less distributions declared to shareholders | | | | | | | | | | | | | | | | | | |
From net realized gain on investments | | $— | | | $— | | | $(0.66 | ) | | $— | | | $— | | | $— | |
Redemption fees added to paid-in capital (d) | | $— | | | $— | | | $— | | | $0.00 | (w) | | $0.00 | (w) | | $0.00 | (w) |
Net asset value, end of period | | $18.73 | | | $16.22 | | | $17.94 | | | $20.45 | | | $16.94 | | | $16.84 | |
Total return (%) (r)(s) | | 15.47 | (n) | | (9.59 | ) | | (9.27 | ) | | 20.72 | | | 0.59 | | | 11.97 | (n) |
Ratios (%) (to average net assets) and Supplemental
data: | | | | | | | | | | | | | | | | | | |
Expenses before expense reductions (f) | | 1.53 | (a) | | 1.65 | | | 1.57 | | | 1.62 | | | 1.62 | | | 1.63 | (a) |
Expenses after expense reductions (f) | | 1.42 | (a) | | 1.55 | | | 1.47 | | | 1.52 | | | 1.52 | | | 1.53 | (a) |
Net investment loss | | (1.05 | )(a) | | (1.00 | ) | | (0.82 | ) | | (1.09 | ) | | (1.15 | ) | | (0.66 | )(a) |
Portfolio turnover | | 77 | | | 150 | | | 95 | | | 94 | | | 99 | | | 112 | |
Net assets at end of period (000 omitted) | | $4,556 | | | $3,492 | | | $4,204 | | | $4,654 | | | $2,404 | | | $334 | |
See Notes to Financial Statements
23
Financial Highlights – continued
| | | | | | | | | | | | | | | | | | |
| | | Six months
ended
2/28/10
(unaudited) | | | Years ended 8/31 | |
| Class R4 | | | 2009 | | | 2008 | | | 2007 | | | 2006 | | | 2005 (i) | |
| | | | | | | | | | | | | | | | | |
Net asset value, beginning of period | | $16.42 | | | $18.13 | | | $20.60 | | | $17.01 | | | $16.86 | | | $15.04 | |
| Income (loss) from investment operations | | | | | | | | | | | | | | | | | | |
Net investment loss (d) | | $(0.07 | ) | | $(0.10 | ) | | $(0.10 | ) | | $(0.12 | ) | | $(0.15 | ) | | $(0.04 | ) |
Net realized and unrealized gain (loss) on investments and foreign currency | | 2.64 | | | (1.61 | )(g) | | (1.71 | ) | | 3.71 | | | 0.30 | | | 1.86 | |
Total from investment operations | | $2.57 | | | $(1.71 | ) | | $(1.81 | ) | | $3.59 | | | $0.15 | | | $1.82 | |
| Less distributions declared to shareholders | | | | | | | | | | | | | | | | | | |
From net realized gain on investments | | $— | | | $— | | | $(0.66 | ) | | $— | | | $— | | | $— | |
Redemption fees added to paid-in capital (d) | | $— | | | $— | | | $— | | | $0.00 | (w) | | $0.00 | (w) | | $0.00 | (w) |
Net asset value, end of period | | $18.99 | | | $16.42 | | | $18.13 | | | $20.60 | | | $17.01 | | | $16.86 | |
Total return (%) (r)(s) | | 15.65 | (n) | | (9.43 | ) | | (9.00 | ) | | 21.11 | | | 0.89 | | | 12.10 | (n) |
| Ratios (%) (to average net assets) and Supplemental data: | | | | | | | | | | | | | | | | | | |
Expenses before expense reductions (f) | | 1.27 | (a) | | 1.40 | | | 1.30 | | | 1.32 | | | 1.32 | | | 1.32 | (a) |
Expenses after expense reductions (f) | | 1.17 | (a) | | 1.30 | | | 1.20 | | | 1.22 | | | 1.22 | | | 1.22 | (a) |
Net investment loss | | (0.80 | )(a) | | (0.76 | ) | | (0.55 | ) | | (0.79 | ) | | (0.84 | ) | | (0.67 | )(a) |
Portfolio turnover | | 77 | | | 150 | | | 95 | | | 94 | | | 99 | | | 112 | |
Net assets at end of period (000 omitted) | | $51,237 | | | $42,974 | | | $55,828 | | | $67,212 | | | $59,999 | | | $56 | |
See Notes to Financial Statements
24
Financial Highlights – continued
| | | | | | | | | | | | | | | | | | |
| | | Six months
ended
2/28/10
(unaudited) | | | Years ended 8/31 | |
| Class 529A | | | 2009 | | | 2008 | | | 2007 | | | 2006 | | | 2005 | |
| | | | | | | | | | | | | | | | | |
Net asset value, beginning of period | | $15.97 | | | $17.70 | | | $20.23 | | | $16.79 | | | $16.73 | | | $13.47 | |
| Income (loss) from investment operations | | | | | | | | | | | | | | | | | | |
Net investment loss (d) | | $(0.10 | ) | | $(0.14 | ) | | $(0.19 | ) | | $(0.21 | ) | | $(0.24 | ) | | $(0.20 | ) |
Net realized and unrealized
gain (loss) on investments and foreign currency | | 2.57 | | | (1.59 | )(g) | | (1.68 | ) | | 3.65 | | | 0.30 | | | 3.46 | |
Total from investment
operations | | $2.47 | | | $(1.73 | ) | | $(1.87 | ) | | $3.44 | | | $0.06 | | | $3.26 | |
| Less distributions declared to shareholders | | | | | | | | | | | | | | | | | | |
From net realized gain on investments | | $— | | | $— | | | $(0.66 | ) | | $— | | | $— | | | $— | |
Redemption fees added to paid-in capital (d) | | $— | | | $— | | | $— | | | $0.00 | (w) | | $0.00 | (w) | | $0.00 | (w) |
Net asset value, end of period | | $18.44 | | | $15.97 | | | $17.70 | | | $20.23 | | | $16.79 | | | $16.73 | |
Total return (%) (r)(s)(t) | | 15.47 | (n) | | (9.77 | ) | | (9.48 | ) | | 20.49 | | | 0.36 | | | 24.20 | |
| Ratios (%) (to average net assets) and Supplemental data: | | | | | | | | | | | | | | | | | | |
Expenses before expense reductions (f) | | 1.62 | (a) | | 1.80 | | | 1.80 | | | 1.82 | | | 1.83 | | | 1.83 | |
Expenses after expense reductions (f) | | 1.52 | (a) | | 1.70 | | | 1.70 | | | 1.72 | | | 1.72 | | | 1.73 | |
Net investment loss | | (1.15 | )(a) | | (1.15 | ) | | (1.04 | ) | | (1.29 | ) | | (1.37 | ) | | (1.27 | ) |
Portfolio turnover | | 77 | | | 150 | | | 95 | | | 94 | | | 99 | | | 112 | |
Net assets at end of period (000 omitted) | | $1,609 | | | $1,444 | | | $1,568 | | | $1,715 | | | $1,630 | | | $1,637 | |
See Notes to Financial Statements
25
Financial Highlights – continued
| | | | | | | | | | | | | | | | | | |
| | | Six months
ended
2/28/10
(unaudited) | | | Years ended 8/31 | |
| Class 529B | | | 2009 | | | 2008 | | | 2007 | | | 2006 | | | 2005 | |
| | | | | | | | | | | | | | | | | |
Net asset value, beginning of period | | $14.92 | | | $16.65 | | | $19.20 | | | $16.03 | | | $16.07 | | | $13.02 | |
| Income (loss) from investment operations | | | | | | | | | | | | | | | | | | |
Net investment loss (d) | | $(0.15 | ) | | $(0.22 | ) | | $(0.29 | ) | | $(0.28 | ) | | $(0.33 | ) | | $(0.28 | ) |
Net realized and unrealized gain (loss) on investments and foreign currency | | 2.39 | | | (1.51 | )(g) | | (1.60 | ) | | 3.45 | | | 0.29 | | | 3.33 | |
Total from investment
operations | | $2.24 | | | $(1.73 | ) | | $(1.89 | ) | | $3.17 | | | $(0.04 | ) | | $3.05 | |
| Less distributions declared to shareholders | | | | | | | | | | | | | | | | | | |
From net realized gain on investments | | $— | | | $— | | | $(0.66 | ) | | $— | | | $— | | | $— | |
Redemption fees added to paid-in capital (d) | | $— | | | $— | | | $— | | | $0.00 | (w) | | $0.00 | (w) | | $0.00 | (w) |
Net asset value, end of period | | $17.16 | | | $14.92 | | | $16.65 | | | $19.20 | | | $16.03 | | | $16.07 | |
Total return (%) (r)(s)(t) | | 15.01 | (n) | | (10.39 | ) | | (10.10 | ) | | 19.78 | | | (0.25 | ) | | 23.43 | |
| Ratios (%) (to average net assets) and Supplemental data: | | | | | | | | | | | | | | | | | | |
Expenses before expense reductions (f) | | 2.37 | (a) | | 2.50 | | | 2.45 | | | 2.47 | | | 2.47 | | | 2.47 | |
Expenses after expense reductions (f) | | 2.27 | (a) | | 2.40 | | | 2.35 | | | 2.37 | | | 2.37 | | | 2.37 | |
Net investment loss | | (1.90 | )(a) | | (1.85 | ) | | (1.70 | ) | | (1.94 | ) | | (2.02 | ) | | (1.93 | ) |
Portfolio turnover | | 77 | | | 150 | | | 95 | | | 94 | | | 99 | | | 112 | |
Net assets at end of period (000 omitted) | | $204 | | | $175 | | | $212 | | | $239 | | | $211 | | | $177 | |
See Notes to Financial Statements
26
Financial Highlights – continued
| | | | | | | | | | | | | | | | | | |
| | | Six months
ended
2/28/10
(unaudited) | | | Years ended 8/31 | |
| Class 529C | | | 2009 | | | 2008 | | | 2007 | | | 2006 | | | 2005 | |
| | | | | | | | | | | | | | | | | |
Net asset value, beginning of period | | $14.93 | | | $16.66 | | | $19.21 | | | $16.04 | | | $16.08 | | | $13.03 | |
| Income (loss) from investment operations | | | | | | | | | | | | | | | | | | |
Net investment loss (d) | | $(0.15 | ) | | $(0.22 | ) | | $(0.29 | ) | | $(0.28 | ) | | $(0.34 | ) | | $(0.28 | ) |
Net realized and unrealized
gain (loss) on investments and foreign currency | | 2.39 | | | (1.51 | )(g) | | (1.60 | ) | | 3.45 | | | 0.30 | | | 3.33 | |
Total from investment
operations | | $2.24 | | | $(1.73 | ) | | $(1.89 | ) | | $3.17 | | | $(0.04 | ) | | $3.05 | |
| Less distributions declared to shareholders | | | | | | | | | | | | | | | | | | |
From net realized gain on investments | | $— | | | $— | | | $(0.66 | ) | | $— | | | $— | | | $— | |
Redemption fees added to paid-in capital (d) | | $— | | | $— | | | $— | | | $0.00 | (w) | | $0.00 | (w) | | $0.00 | (w) |
Net asset value, end of period | | $17.17 | | | $14.93 | | | $16.66 | | | $19.21 | | | $16.04 | | | $16.08 | |
Total return (%) (r)(s)(t) | | 15.00 | (n) | | (10.38 | ) | | (10.10 | ) | | 19.76 | | | (0.25 | ) | | 23.41 | |
| Ratios (%) (to average net assets) and Supplemental data: | | | | | | | | | | | | | | | | | | |
Expenses before expense reductions (f) | | 2.37 | (a) | | 2.48 | | | 2.45 | | | 2.47 | | | 2.48 | | | 2.47 | |
Expenses after expense reductions (f) | | 2.27 | (a) | | 2.38 | | | 2.34 | | | 2.37 | | | 2.37 | | | 2.37 | |
Net investment loss | | (1.89 | )(a) | | (1.83 | ) | | (1.70 | ) | | (1.94 | ) | | (2.02 | ) | | (1.93 | ) |
Portfolio turnover | | 77 | | | 150 | | | 95 | | | 94 | | | 99 | | | 112 | |
Net assets at end of period (000 omitted) | | $447 | | | $393 | | | $299 | | | $323 | | | $332 | | | $333 | |
| (d) | Per share data is based on average shares outstanding. |
| (f) | Ratios do not reflect reductions from fees paid indirectly, if applicable. |
| (g) | The per share amount varies from the net realized and unrealized gain/loss for the period because of the timing of sales of fund shares and the per share amount of realized and unrealized gains and losses at such time. |
| (i) | For the period from the class’ inception, April 1, 2005 (Classes R1, R3, and R4) through the stated period end. |
| (r) | Certain expenses have been reduced without which performance would have been lower. |
| (s) | From time to time the fund may receive proceeds from litigation settlements, without which performance would be lower. |
| (t) | Total returns do not include any applicable sales charges. |
| (w) | Per share amount was less than $0.01. |
See Notes to Financial Statements
27
NOTES TO FINANCIAL STATEMENTS
(unaudited)
| (1) | | Business and Organization |
MFS New Discovery Fund (the fund) is a series of MFS Series Trust I (the trust). The trust is organized as a Massachusetts business trust and is registered under the Investment Company Act of 1940, as amended, as an open-end management investment company.
| (2) | | Significant Accounting Policies |
General – The preparation of financial statements in conformity with U.S. generally accepted accounting principles requires management to make estimates and assumptions that affect the reported amounts of assets and liabilities, and disclosure of contingent assets and liabilities at the date of the financial statements and the reported amounts of revenues and expenses during the reporting period. Actual results could differ from those estimates. In the preparation of these financial statements, management has evaluated subsequent events occurring after the date of the fund’s Statement of Assets and Liabilities through the date that the financial statements were issued. The fund will generally focus on securities of small size companies which may be more volatile than those of larger companies. The fund can invest in foreign securities, including securities of emerging market issuers. Investments in foreign securities are vulnerable to the effects of changes in the relative values of the local currency and the U.S. dollar and to the effects of changes in each country’s legal, political, and economic environment. The markets of emerging markets countries are generally more volatile than the markets of developed countries with more mature economies. All of the risks of investing in foreign securities previously described are heightened when investing in emerging markets countries.
Investment Valuations – Equity securities, including restricted equity securities, are generally valued at the last sale or official closing price as provided by a third-party pricing service on the market or exchange on which they are primarily traded. Equity securities, for which there were no sales reported that day, are generally valued at the last quoted daily bid quotation as provided by a third-party pricing service on the market or exchange on which such securities are primarily traded. Equity securities held short, for which there were no sales reported for that day, are generally valued at the last quoted daily ask quotation as provided by a third-party pricing service on the market or exchange on which such securities are primarily traded. Short-term instruments with a maturity at issuance of 60 days or less generally are valued at amortized cost, which approximates market value. Exchange-traded options are generally valued at the last sale or official closing price as provided by a third-party pricing service on the exchange on which such options are
28
Notes to Financial Statements (unaudited) – continued
primarily traded. Exchange-traded options for which there were no sales reported that day are generally valued at the last daily bid quotation as provided by a third-party pricing service on the exchange on which such options are primarily traded. Options not traded on an exchange are generally valued at a broker/dealer bid quotation. Foreign currency options are generally valued using an external pricing model that uses market data from a third-party source. Open-end investment companies are generally valued at net asset value per share. Securities and other assets generally valued on the basis of information from a third-party pricing service may also be valued at a broker/dealer bid quotation. Values obtained from third-party pricing services can utilize both transaction data and market information such as yield, quality, coupon rate, maturity, type of issue, trading characteristics, and other market data. The values of foreign securities and other assets and liabilities expressed in foreign currencies are converted to U.S. dollars using the mean of bid and asked prices for rates provided by a third-party pricing service.
The Board of Trustees has delegated primary responsibility for determining or causing to be determined the value of the fund’s investments (including any fair valuation) to the adviser pursuant to valuation policies and procedures approved by the Board. If the adviser determines that reliable market quotations are not readily available, investments are valued at fair value as determined in good faith by the adviser in accordance with such procedures under the oversight of the Board of Trustees. Under the fund’s valuation policies and procedures, market quotations are not considered to be readily available for most types of debt instruments and floating rate loans and many types of derivatives. These investments are generally valued at fair value based on information from third-party pricing services. In addition, investments may be valued at fair value if the adviser determines that an investment’s value has been materially affected by events occurring after the close of the exchange or market on which the investment is principally traded (such as foreign exchange or market) and prior to the determination of the fund’s net asset value, or after the halting of trading of a specific security where trading does not resume prior to the close of the exchange or market on which the security is principally traded. Events that occur on a frequent basis after foreign markets close (such as developments in foreign markets and significant movements in the U.S. markets) and prior to the determination of the fund’s net asset value may be deemed to have a material effect on the value of securities traded in foreign markets. Accordingly, the fund’s foreign equity securities may often be valued at fair value. The adviser generally relies on third-party pricing services or other information (such as the correlation with price movements of similar securities in the same or other markets; the type, cost and investment characteristics of the security; the business and financial condition of the issuer; and trading and other market data) to assist in
29
Notes to Financial Statements (unaudited) – continued
determining whether to fair value and at what value to fair value an investment. The value of an investment for purposes of calculating the fund’s net asset value can differ depending on the source and method used to determine value. When fair valuation is used, the value of an investment used to determine the fund’s net asset value may differ from quoted or published prices for the same investment. There can be no assurance that the fund could obtain the fair value assigned to an investment if it were to sell the investment at the same time at which the fund determines its net asset value per share.
Various inputs are used in determining the value of the fund’s assets or liabilities. These inputs are categorized into three broad levels. In certain cases, the inputs used to measure fair value may fall into different levels of the fair value hierarchy. In such cases, an investment’s level within the fair value hierarchy is based on the lowest level of input that is significant to the fair value measurement. The fund’s assessment of the significance of a particular input to the fair value measurement in its entirety requires judgment, and considers factors specific to the investment. Level 1 includes unadjusted quoted prices in active markets for identical assets or liabilities. Level 2 includes other significant observable market-based inputs (including quoted prices for similar securities, interest rates, prepayment speed, and credit risk). Level 3 includes unobservable inputs, which may include the adviser’s own assumptions in determining the fair value of investments. Other financial instruments are derivative instruments not reflected in total investments, such as futures, forwards, swap contracts, and written options. The following is a summary of the levels used as of February 28, 2010 in valuing the fund’s assets or liabilities:
| | | | | | | | |
| Investments at Value | | Level 1 | | Level 2 | | Level 3 | | Total |
| Equity Securities: | | | | | | | | |
United States | | $572,766,900 | | $209 | | $— | | $572,767,109 |
Brazil | | 29,487,761 | | — | | — | | 29,487,761 |
China | | 23,410,383 | | — | | — | | 23,410,383 |
Canada | | 14,425,688 | | — | | — | | 14,425,688 |
India | | 13,106,217 | | — | | — | | 13,106,217 |
United Kingdom | | 11,646,810 | | — | | — | | 11,646,810 |
Australia | | 9,185,301 | | — | | — | | 9,185,301 |
Greece | | 5,338,498 | | — | | — | | 5,338,498 |
Mexico | | 3,949,894 | | — | | — | | 3,949,894 |
Other Countries | | 5,130,388 | | — | | — | | 5,130,388 |
| Mutual Funds | | 11,700,507 | | — | | — | | 11,700,507 |
| Total Investments | | $700,148,347 | | $209 | | $— | | $700,148,556 |
For further information regarding security characteristics, see the Portfolio of Investments.
30
Notes to Financial Statements (unaudited) – continued
In January 2010, Accounting Standards Update (ASU) No. 2010-06, Improving Disclosures about Fair Value Measurements (the “Update”) was issued, and is effective for interim and annual reporting periods beginning after December 15, 2009. This Update provides for expanded disclosures about fair value measurements. Management has evaluated the application of the Update to the fund, and believes the impact is limited to expanded disclosures resulting from the adoption of this Update in the fund’s financial statements.
Foreign Currency Translation – Purchases and sales of foreign investments, income, and expenses are converted into U.S. dollars based upon currency exchange rates prevailing on the respective dates of such transactions or on the reporting date for foreign denominated receivables and payables. Gains and losses attributable to foreign currency exchange rates on sales of securities are recorded for financial statement purposes as net realized gains and losses on investments. Gains and losses attributable to foreign exchange rate movements on receivables, payables, income and expenses are recorded for financial statement purposes as foreign currency transaction gains and losses. That portion of both realized and unrealized gains and losses on investments that results from fluctuations in foreign currency exchange rates is not separately disclosed.
Derivatives – The fund may use derivatives for different purposes, including to earn income and enhance returns, to increase or decrease exposure to a particular market, to manage or adjust the risk profile of the fund, or as alternatives to direct investments. Derivatives may be used for hedging or non-hedging purposes. While hedging can reduce or eliminate losses, it can also reduce or eliminate gains. When the fund uses derivatives as an investment to increase market exposure, or for hedging purposes, gains and losses from derivative instruments may be substantially greater than the derivative’s original cost.
Derivative instruments include written options, purchased options, futures contracts, forward foreign currency exchange contracts, and swap agreements. At February 28, 2010, the fund did not have any outstanding derivative instruments.
The following table presents, by major type of derivative contract, the realized gain (loss) on derivatives held by the fund for the six months ended February 28, 2010 as reported in the Statement of Operations:
| | | |
| | | Purchased
Options | |
| Equity Contracts | | $(312,498 | ) |
Derivative counterparty credit risk is managed through formal evaluation of the creditworthiness of all potential counterparties. On certain over-the-counter derivatives, the fund attempts to reduce its exposure to counterparty credit risk
31
Notes to Financial Statements (unaudited) – continued
whenever possible by entering into an International Swaps and Derivatives Association (ISDA) Master Agreement on a bilateral basis with each of the counterparties with whom it undertakes a significant volume of transactions. The ISDA Master Agreement gives each party to the agreement the right to terminate all transactions traded under such agreement if there is a certain deterioration in the credit quality of the other party. The ISDA Master Agreement gives the fund the right, upon an event of default by the applicable counterparty or a termination of the agreement, to close out all transactions traded under such agreement and to net amounts owed under each transaction to one net amount payable by one party to the other. This right to close out and net payments across all transactions traded under the ISDA Master Agreement could result in a reduction of the fund’s credit risk to such counterparty equal to any amounts payable by the fund under the applicable transactions, if any. However, absent an event of default by the counterparty or a termination of the agreement, the ISDA Master Agreement does not result in an offset of reported balance sheet assets and liabilities across transactions between the fund and the applicable counterparty.
Collateral requirements differ by type of derivative. Collateral or margin requirements are set by the broker or exchange clearing house for exchange traded derivatives (i.e., futures and exchange-traded options) while collateral terms are contract specific for over-the-counter traded derivatives (i.e., forwards, swaps and over-the-counter options). For derivatives traded under an ISDA Master Agreement, the collateral requirements are netted across all transactions traded under such agreement and one amount is posted from one party to the other to collateralize such obligations. Cash collateral that has been pledged to cover obligations of the fund under derivative contracts will be reported separately on the Statement of Assets and Liabilities as restricted cash. Securities collateral pledged for the same purpose is noted in the Portfolio of Investments.
Purchased Options – The fund may purchase call or put options for a premium. Purchased options entitle the holder to buy or sell a specified number of shares or units of a particular security, currency or index at a specified price at a specified date or within a specified period of time. Purchasing call options may be used to hedge against an anticipated increase in the dollar cost of securities or currency to be acquired or to increase the fund’s exposure to an underlying instrument. Purchasing put options may hedge against a decline in the value of portfolio securities or currency.
The premium paid is initially recorded as an investment in the Statement of Assets and Liabilities. That investment is subsequently marked-to-market daily with the difference between the premium paid and the market value of the purchased option being recorded as unrealized appreciation or depreciation.
32
Notes to Financial Statements (unaudited) – continued
Premiums paid for purchased options which have expired are treated as realized losses on investments in the Statement of Operations. Upon the exercise or closing of a purchased option, the premium paid is either added to the cost of the security or financial instrument in the case of a call option, or offset against the proceeds on the sale of the underlying security or financial instrument in the case of a put option, in order to determine the realized gain or loss on investments.
The risk in purchasing an option is that the fund pays a premium whether or not the option is exercised. The fund’s maximum risk of loss due to counterparty credit risk is limited to the market value of the option. For over-the-counter options, this risk is mitigated in cases where there is an ISDA Master Agreement between the fund and the counterparty providing for netting as described above and for posting of collateral by the counterparty to the fund to cover the fund’s exposure to the counterparty under such ISDA Master Agreement.
Security Loans – State Street Bank and Trust Company (“State Street”), as lending agent, may loan the securities of the fund to certain qualified institutions (the “Borrowers”) approved by the fund. The loans are collateralized by cash and/or U.S. Treasury and federal agency obligations in an amount typically at least equal to the market value of the securities loaned. The market value of the loaned securities is determined at the close of business of the fund and any additional required collateral is delivered to the fund on the next business day. State Street provides the fund with indemnification against Borrower default. The fund bears the risk of loss with respect to the investment of cash collateral. On loans collateralized by cash, the cash collateral is invested in a money market fund or short-term securities. A portion of the income generated upon investment of the collateral is remitted to the Borrowers, and the remainder is allocated between the fund and the lending agent. On loans collateralized by U.S. Treasury and/or federal agency obligations, a fee is received from the Borrower, and is allocated between the fund and the lending agent. Income from securities lending is separately reported on the Statement of Operations. The dividend and interest income earned on the securities loaned is accounted for in the same manner as other dividend and interest income.
Indemnifications – Under the fund’s organizational documents, its officers and Trustees may be indemnified against certain liabilities and expenses arising out of the performance of their duties to the fund. Additionally, in the normal course of business, the fund enters into agreements with service providers that may contain indemnification clauses. The fund’s maximum exposure under these agreements is unknown as this would involve future claims that may be made against the fund that have not yet occurred.
33
Notes to Financial Statements (unaudited) – continued
Investment Transactions and Income – Investment transactions are recorded on the trade date. Interest income is recorded on the accrual basis. All premium and discount is amortized or accreted for financial statement purposes in accordance with U.S. generally accepted accounting principles. Dividends received in cash are recorded on the ex-dividend date. Certain dividends from foreign securities will be recorded when the fund is informed of the dividend if such information is obtained subsequent to the ex-dividend date. Dividend and interest payments received in additional securities are recorded on the ex-dividend or ex-interest date in an amount equal to the value of the security on such date.
The fund may receive proceeds from litigation settlements. Any proceeds received from litigation involving portfolio holdings are reflected in the Statement of Operations in realized gain/loss if the security has been disposed of by the fund or in unrealized gain/loss if the security is still held by the fund. Any other proceeds from litigation not related to portfolio holdings are reflected as other income in the Statement of Operations.
Fees Paid Indirectly – The fund’s custody fee may be reduced according to an arrangement that measures the value of cash deposited with the custodian by the fund. This amount, for the six months ended February 28, 2010, is shown as a reduction of total expenses on the Statement of Operations.
Tax Matters and Distributions – The fund intends to qualify as a regulated investment company, as defined under Subchapter M of the Internal Revenue Code, and to distribute all of its taxable income, including realized capital gains. As a result, no provision for federal income tax is required. The fund’s federal tax returns for the prior three fiscal years remain subject to examination by the Internal Revenue Service. Foreign taxes, if any, have been accrued by the fund in the accompanying financial statements.
Distributions to shareholders are recorded on the ex-dividend date. Income and capital gain distributions are determined in accordance with income tax regulations, which may differ from U.S. generally accepted accounting principles. Certain capital accounts in the financial statements are periodically adjusted for permanent differences in order to reflect their tax character. These adjustments have no impact on net assets or net asset value per share. Temporary differences which arise from recognizing certain items of income, expense, gain or loss in different periods for financial statement and tax purposes will reverse at some time in the future. Distributions in excess of net investment income or net realized gains are temporary overdistributions for financial statement purposes resulting from differences in the recognition or classification of income or distributions for financial statement and tax purposes.
Book/tax differences primarily relate to net operating losses and wash sale loss deferrals.
34
Notes to Financial Statements (unaudited) – continued
The fund declared no distributions for the year ended August 31, 2009.
The federal tax cost and the tax basis components of distributable earnings were as follows:
| | | |
| As of 2/28/10 | | | |
| Cost of investments | | $614,079,738 | |
| Gross appreciation | | 103,009,724 | |
| Gross depreciation | | (16,940,906 | ) |
| Net unrealized appreciation (depreciation) | | $86,068,818 | |
| |
| As of 8/31/09 | | | |
| Capital loss carryforwards | | (98,381,558 | ) |
| Post-October capital loss deferral | | (70,306,011 | ) |
| Other temporary differences | | (167,593 | ) |
| Net unrealized appreciation (depreciation) | | 86,559,136 | |
The aggregate cost above includes prior fiscal year end tax adjustments.
As of August 31, 2009, the fund had capital loss carryforwards available to offset future realized gains. Such losses expire as follows:
Multiple Classes of Shares of Beneficial Interest – The fund offers multiple classes of shares, which differ in their respective distribution, service, and program manager fees. The fund’s income, realized and unrealized gain (loss), and common expenses are allocated to shareholders based on the daily net assets of each class. Dividends are declared separately for each class. Differences in per share dividend rates are generally due to differences in separate class expenses. Class B and Class 529B shares will convert to Class A and Class 529A shares, respectively, approximately eight years after purchase.
| (3) | | Transactions with Affiliates |
Investment Adviser – The fund has an investment advisory agreement with MFS to provide overall investment management and related administrative services and facilities to the fund. The management fee is computed daily and paid monthly at an annual rate of 0.90% of the fund’s average daily net assets. The investment adviser has agreed in writing to reduce its management fee to 0.80% of average daily net assets for the first $1.5 billion and 0.75% of average daily net assets in excess of $1.5 billion. This written agreement will continue until modified by the fund’s Board of Trustees, but such agreement will continue at least until December 31, 2010. The management fee reduction amounted to $322,742, which is shown as a reduction of total expenses in the Statement of Operations. The management fee incurred for the six months ended February 28, 2010 was equivalent to an annual effective rate of 0.80% of the fund’s average daily net assets.
35
Notes to Financial Statements (unaudited) – continued
Distributor – MFS Fund Distributors, Inc. (MFD), a wholly-owned subsidiary of MFS, as distributor, received $37,501 and $310 for the six months ended February 28, 2010, as its portion of the initial sales charge on sales of Class A and Class 529A shares of the fund, respectively.
The Board of Trustees has adopted a distribution plan for certain class shares pursuant to Rule 12b-1 of the Investment Company Act of 1940.
The fund’s distribution plan provides that the fund will pay MFD for services provided by MFD and financial intermediaries in connection with the distribution and servicing of certain share classes. One component of the plan is a distribution fee paid to MFD and another component of the plan is a service fee paid to MFD. MFD may subsequently pay all, or a portion, of the distribution and/or service fees to financial intermediaries.
Distribution Plan Fee Table:
| | | | | | | | | | |
| | | Distribution
Fee Rate (d) | | Service
Fee Rate (d) | | Total
Distribution
Plan (d) | | Annual
Effective
Rate (e) | | Distribution
and Service
Fee |
| Class A | | — | | 0.25% | | 0.25% | | 0.25% | | $355,975 |
| Class B | | 0.75% | | 0.25% | | 1.00% | | 1.00% | | 146,435 |
| Class C | | 0.75% | | 0.25% | | 1.00% | | 1.00% | | 145,776 |
| Class R1 | | 0.75% | | 0.25% | | 1.00% | | 1.00% | | 24,188 |
| Class R2 | | 0.25% | | 0.25% | | 0.50% | | 0.50% | | 30,638 |
| Class R3 | | — | | 0.25% | | 0.25% | | 0.25% | | 5,031 |
| Class 529A | | — | | 0.25% | | 0.25% | | 0.25% | | 1,941 |
| Class 529B | | 0.75% | | 0.25% | | 1.00% | | 1.00% | | 952 |
| Class 529C | | 0.75% | | 0.25% | | 1.00% | | 1.00% | | 2,149 |
| Total Distribution and Service Fees | | | | | | | | $713,085 |
| (d) | As of February 28, 2010, in accordance with the distribution plan for certain classes, the fund pays distribution and/or service fees equal to these annual percentage rates of each class’ average daily net assets. The distribution and service fee rates disclosed by class represent the current rates in effect at the end of the reporting period. Any rate changes, if applicable, are detailed below. |
| (e) | The annual effective rates represent actual fees incurred under the distribution plan for the six months ended February 28, 2010 based on each class’ average daily net assets. |
Certain Class A shares purchased on or subsequent to September 1, 2008 are subject to a CDSC in the event of a shareholder redemption within 24 months of purchase. Class C and Class 529C shares are subject to a CDSC in the event of a shareholder redemption within 12 months of purchase. Class B and Class 529B shares are subject to a CDSC in the event of a shareholder redemption
36
Notes to Financial Statements (unaudited) – continued
within six years of purchase. All contingent deferred sales charges are paid to MFD and during the six months ended February 28, 2010, were as follows:
| | |
| | | Amount |
| Class A | | $824 |
| Class B | | 14,227 |
| Class C | | 1,200 |
| Class 529B | | — |
| Class 529C | | 6 |
The fund has entered into and may from time to time enter into contracts with program managers and other parties which administer the tuition programs through which an investment in the fund’s 529 share classes is made. The fund has entered into an agreement with MFD pursuant to which MFD receives an annual fee of up to 0.10% of the average daily net assets attributable to each 529 share class. The services provided by MFD, or a third party with which MFD contracts, include recordkeeping and tax reporting and account services, as well as services designed to maintain the program’s compliance with the Internal Revenue Code and other regulatory requirements. Program manager fees for the six months ended February 28, 2010, were as follows:
| | |
| | | Amount |
| Class 529A | | $776 |
| Class 529B | | 95 |
| Class 529C | | 215 |
| Total Program Manager Fees | | $1,086 |
Shareholder Servicing Agent – MFS Service Center, Inc. (MFSC), a wholly-owned subsidiary of MFS, receives a fee from the fund for its services as shareholder servicing agent calculated as a percentage of the average daily net assets of the fund as determined periodically under the supervision of the fund’s Board of Trustees. For the six months ended February 28, 2010, the fee was $306,859, which equated to 0.0950% annually of the fund’s average daily net assets. MFSC also receives payment from the fund for out-of-pocket expenses, sub-accounting and other shareholder servicing costs which may be paid to affiliated and unaffiliated service providers. For the six months ended February 28, 2010, these out-of-pocket expenses, sub-accounting and other shareholder servicing costs amounted to $309,002.
Under a Special Servicing Agreement among MFS, each MFS fund which invests in other MFS funds (“MFS fund-of-funds”) and certain underlying funds in which a MFS fund-of-funds invests (“underlying funds”), each underlying fund may pay a portion of each MFS fund-of-fund’s transfer agent-related expenses, including sub-accounting fees payable to financial intermediaries, to the extent such payments do not exceed the benefits realized or expected to be realized by the underlying fund from the investment in the underlying fund by the MFS fund-of-fund. For the six months ended
37
Notes to Financial Statements (unaudited) – continued
February 28, 2010, these costs for the fund amounted to $265,122 and are reflected in the shareholder servicing costs on the Statement of Operations.
Administrator – MFS provides certain financial, legal, shareholder communications, compliance, and other administrative services to the fund. Under an administrative services agreement, the fund partially reimburses MFS the costs incurred to provide these services. The fund is charged an annual fixed amount of $17,500 plus a fee based on average daily net assets. The administrative services fee incurred for the six months ended February 28, 2010 was equivalent to an annual effective rate of 0.0163% of the fund’s average daily net assets.
Trustees’ and Officers’ Compensation – The fund pays compensation to independent Trustees in the form of a retainer, attendance fees, and additional compensation to Board and Committee chairpersons. The fund does not pay compensation directly to Trustees or officers of the fund who are also officers of the investment adviser, all of whom receive remuneration for their services to the fund from MFS. Certain officers and Trustees of the fund are officers or directors of MFS, MFD, and MFSC.
Prior to December 31, 2001, the fund had an unfunded defined benefit plan (“DB plan”) for independent Trustees. As of December 31, 2001, the Board took action to terminate the DB plan with respect to then-current and any future independent Trustees, such that the DB Plan covers only certain of those former independent Trustees who retired on or before December 31, 2001. The DB Plan resulted in a pension expense of $555 and is included in independent Trustees’ compensation for the six months ended February 28, 2010. The liability for deferred retirement benefits payable to certain independent Trustees under the DB plan amounted to $8,108 at February 28, 2010, and is included in payable for independent Trustees’ compensation on the Statement of Assets and Liabilities.
Other – This fund and certain other funds managed by MFS (the funds) have entered into services agreements (the Agreements) which provide for payment of fees by the funds to Tarantino LLC and Griffin Compliance LLC in return for the provision of services of an Independent Chief Compliance Officer (ICCO) and Assistant ICCO, respectively, for the funds. The ICCO and Assistant ICCO are officers of the funds and the sole members of Tarantino LLC and Griffin Compliance LLC, respectively. The funds can terminate the Agreements with Tarantino LLC and Griffin Compliance LLC at any time under the terms of the Agreements. For the six months ended February 28, 2010, the aggregate fees paid by the fund to Tarantino LLC and Griffin Compliance LLC were $3,782 and are included in miscellaneous expense on the Statement of Operations. MFS has agreed to reimburse the fund for a portion of the payments made by the fund in the amount of $1,307, which is shown as a reduction of total
38
Notes to Financial Statements (unaudited) – continued
expenses in the Statement of Operations. Additionally, MFS has agreed to bear all expenses associated with office space, other administrative support, and supplies provided to the ICCO and Assistant ICCO.
The fund may invest in the MFS Institutional Money Market Portfolio which is managed by MFS and seeks a high level of current income consistent with preservation of capital and liquidity. Income earned on this investment is included in dividends from underlying funds on the Statement of Operations. This money market fund does not pay a management fee to MFS.
Purchases and sales of investments, other than U.S. Government securities, purchased option transactions, and short-term obligations, aggregated $493,235,846 and $502,821,503, respectively.
| (5) | | Shares of Beneficial Interest |
The fund’s Declaration of Trust permits the Trustees to issue an unlimited number of full and fractional shares of beneficial interest. Transactions in fund shares were as follows:
| | | | | | | | |
| | | Six months ended
2/28/10 | | Year ended
8/31/09 |
| | | Shares | | Amount | | Shares | | Amount |
| Shares sold | | | | | | | | |
Class A | | 3,288,496 | | $59,442,307 | | 5,092,115 | | $67,789,677 |
Class B | | 156,882 | | 2,612,901 | | 283,553 | | 3,481,059 |
Class C | | 382,494 | | 6,433,650 | | 292,917 | | 3,733,586 |
Class I | | 814,791 | | 15,252,509 | | 11,902,139 | | 131,963,269 |
Class R1 | | 70,693 | | 1,193,592 | | 84,753 | | 1,035,999 |
Class R2 | | 141,949 | | 2,516,908 | | 202,168 | | 2,534,462 |
Class R3 | | 64,323 | | 1,188,246 | | 97,138 | | 1,134,024 |
Class R4 | | 502,203 | | 9,134,316 | | 1,207,603 | | 16,065,980 |
Class 529A | | 5,023 | | 89,142 | | 16,545 | | 194,126 |
Class 529B | | 1,143 | | 19,104 | | 870 | | 10,451 |
Class 529C | | 1,811 | | 29,470 | | 11,398 | | 116,135 |
| | 5,429,808 | | $97,912,145 | | 19,191,199 | | $228,058,768 |
39
Notes to Financial Statements (unaudited) – continued
| | | | | | | | | | | | |
| | | Six months ended
2/28/10 | | | Year ended
8/31/09 | |
| | | Shares | | | Amount | | | Shares | | | Amount | |
| Shares reacquired | | | | | | | | | | | | |
Class A | | (1,945,778 | ) | | $(34,893,008 | ) | | (5,469,551 | ) | | $(68,073,959 | ) |
Class B | | (306,342 | ) | | (5,200,680 | ) | | (755,302 | ) | | (8,686,607 | ) |
Class C | | (204,244 | ) | | (3,409,126 | ) | | (369,909 | ) | | (4,434,017 | ) |
Class I | | (2,555,213 | ) | | (46,656,587 | ) | | (2,629,148 | ) | | (34,965,721 | ) |
Class R1 | | (47,913 | ) | | (808,420 | ) | | (76,622 | ) | | (872,359 | ) |
Class R2 | | (143,438 | ) | | (2,531,836 | ) | | (265,802 | ) | | (3,150,161 | ) |
Class R3 | | (36,338 | ) | | (663,888 | ) | | (116,127 | ) | | (1,374,215 | ) |
Class R4 | | (420,564 | ) | | (7,593,645 | ) | | (1,670,558 | ) | | (20,216,706 | ) |
Class 529A | | (8,165 | ) | | (146,927 | ) | | (14,695 | ) | | (168,245 | ) |
Class 529B | | (1,011 | ) | | (16,469 | ) | | (1,845 | ) | | (19,040 | ) |
Class 529C | | (2,121 | ) | | (35,863 | ) | | (3,029 | ) | | (36,778 | ) |
| | (5,671,127 | ) | | $(101,956,449 | ) | | (11,372,588 | ) | | $(141,997,808 | ) |
| | | | |
| Net change | | | | | | | | | | | | |
Class A | | 1,342,718 | | | $24,549,299 | | | (377,436 | ) | | $(284,282 | ) |
Class B | | (149,460 | ) | | (2,587,779 | ) | | (471,749 | ) | | (5,205,548 | ) |
Class C | | 178,250 | | | 3,024,524 | | | (76,992 | ) | | (700,431 | ) |
Class I | | (1,740,422 | ) | | (31,404,078 | ) | | 9,272,991 | | | 96,997,548 | |
Class R1 | | 22,780 | | | 385,172 | | | 8,131 | | | 163,640 | |
Class R2 | | (1,489 | ) | | (14,928 | ) | | (63,634 | ) | | (615,699 | ) |
Class R3 | | 27,985 | | | 524,358 | | | (18,989 | ) | | (240,191 | ) |
Class R4 | | 81,639 | | | 1,540,671 | | | (462,955 | ) | | (4,150,726 | ) |
Class 529A | | (3,142 | ) | | (57,785 | ) | | 1,850 | | | 25,881 | |
Class 529B | | 132 | | | 2,635 | | | (975 | ) | | (8,589 | ) |
Class 529C | | (310 | ) | | (6,393 | ) | | 8,369 | | | 79,357 | |
| | (241,319 | ) | | $(4,044,304 | ) | | 7,818,611 | | | $86,060,960 | |
The fund is one of several mutual funds in which the MFS funds-of-funds may invest. The MFS funds-of-funds do not invest in the underlying MFS funds for the purpose of exercising management or control. At the end of the period, the MFS Growth Allocation Fund, MFS Moderate Allocation Fund, MFS Aggressive Growth Allocation Fund, and MFS Conservative Allocation Fund were the owners of record of approximately 12%, 8%, 7%, and 3% respectively, of the value of outstanding voting shares of the fund. In addition, the MFS Lifetime 2010 Fund, MFS Lifetime 2020 Fund, MFS Lifetime 2030 Fund, MFS Lifetime 2040 Fund, and the MFS Lifetime Retirement Income Fund were each the owners of record of less than 1% of the value of outstanding voting shares of the fund.
The fund and certain other funds managed by MFS participate in a $1.1 billion unsecured committed line of credit, subject to a $1 billion sublimit, provided
40
Notes to Financial Statements (unaudited) – continued
by a syndication of banks under a credit agreement. Borrowings may be made for temporary financing needs. Interest is charged to each fund, based on its borrowings, generally at a rate equal to the higher of the Federal Reserve funds rate or one month LIBOR plus an agreed upon spread. A commitment fee, based on the average daily, unused portion of the committed line of credit, is allocated among the participating funds at the end of each calendar quarter. In addition, the fund and other funds managed by MFS have established unsecured uncommitted borrowing arrangements with certain banks for temporary financing needs. Interest is charged to each fund, based on its borrowings, at a rate equal to the Federal Reserve funds rate plus an agreed upon spread. For the six months ended February 28, 2010, the fund’s commitment fee and interest expense were $4,562 and $0, respectively, and are included in miscellaneous expense on the Statement of Operations.
| (7) | | Transactions in Underlying Funds-Affiliated Issuers |
An affiliated issuer may be considered one in which the fund owns 5% or more of the outstanding voting securities, or a company which is under common control. For the purposes of this report, the fund assumes the following to be affiliated issuers:
| | | | | | | | | |
| Underlying Funds | | Beginning
Shares/Par
Amount | | Acquisitions
Shares/Par
Amount | | Dispositions
Shares/Par
Amount | | | Ending
Shares/Par
Amount |
| MFS Institutional Money Market Portfolio | | 4,462,053 | | 101,267,546 | | (100,851,362 | ) | | 4,878,237 |
| | | | |
| Underlying Funds | | Realized
Gain (Loss) | | Capital Gain
Distributions | | Dividend
Income | | | Ending
Value |
| MFS Institutional Money Market Portfolio | | $— | | $— | | $2,878 | | | $4,878,237 |
41
RESULTS OF SHAREHOLDER MEETINGS
(unaudited)
At a special meeting of shareholders of MFS Series Trust I, which was held on January 28, 2010, the following actions were taken:
Item 1. To elect the following individuals as Trustees:
| | | | |
| | | Number of Dollars |
Nominee | | For | | Withheld Authority |
| Robert E. Butler | | 13,799,428,259.131 | | 298,698,895.701 |
| Lawrence H. Cohn | | 13,775,964,000.646 | | 322,163,154.185 |
| Maureen R. Goldfarb | | 13,797,667,920.487 | | 300,459,234.345 |
| David H. Gunning | | 13,795,139,579.854 | | 302,987,574.978 |
| William R. Gutow | | 13,798,125,706.624 | | 300,001,448.207 |
| Michael Hegarty | | 13,780,926,681.791 | | 317,200,473.041 |
| John P. Kavanaugh | | 13,799,879,923.291 | | 298,247,231.541 |
| Robert J. Manning | | 13,802,393,104.041 | | 295,734,050.791 |
| Robert C. Pozen | | 13,802,480,679.754 | | 295,646,475.078 |
| J. Dale Sherratt | | 13,779,899,981.473 | | 318,227,173.359 |
| Laurie J. Thomsen | | 13,797,678,786.081 | | 300,448,368.750 |
| Robert W. Uek | | 13,798,504,506.307 | | 299,622,648.525 |
42
BOARD REVIEW OF INVESTMENT ADVISORY AGREEMENT
A discussion regarding the Board’s most recent review and renewal of the fund’s Investment Advisory Agreement with MFS is available by clicking on the fund’s name under “Mutual Funds” in the “Products and Performance” section of the MFS Web site (mfs.com).
PROXY VOTING POLICIES AND INFORMATION
A general description of the MFS funds’ proxy voting policies and procedures is available without charge, upon request, by calling 1-800-225-2606, by visiting the Proxy Voting section of mfs.com or by visiting the SEC’s Web site at http://www.sec.gov.
Information regarding how the fund voted proxies relating to portfolio securities during the most recent twelve-month period ended June 30 is available without charge by visiting the Proxy Voting section of mfs.com or by visiting the SEC’s Web site at http://www.sec.gov.
QUARTERLY PORTFOLIO DISCLOSURE
The fund will file a complete schedule of portfolio holdings with the Securities and Exchange Commission (the Commission) for the first and third quarters of each fiscal year on Form N-Q. The fund’s Form N-Q may be reviewed and copied at the:
Public Reference Room
Securities and Exchange Commission
100 F Street, NE, Room 1580
Washington, D.C. 20549
Information on the operation of the Public Reference Room may be obtained by calling the Commission at 1-800-SEC-0330. The fund’s Form N-Q is available on the EDGAR database on the Commission’s Internet Web site at http://www.sec.gov, and copies of this information may be obtained, upon payment of a duplicating fee, by electronic request at the following e-mail address: publicinfo@sec.gov or by writing the Public Reference Section at the above address.
A shareholder can also obtain the quarterly portfolio holdings report at mfs.com.
FURTHER INFORMATION
From time to time, MFS may post important information about the fund or the MFS funds on the MFS web site (mfs.com). This information is available by visiting the “News & Commentary” section of mfs.com or by clicking on the fund’s name under “Mutual Funds” in the “Products and Performance” section of mfs.com.
43
CONTACT US
Web site
mfs.com
MFS TALK
1-800-637-8255
24 hours a day
Account service and literature
Shareholders
1-800-225-2606
Investment professionals
1-800-343-2829
Retirement plan services
1-800-637-1255
Mailing address
MFS Service Center, Inc.
P.O. Box 55824
Boston, MA 02205-5824
Overnight mail
MFS Service Center, Inc.
c/o Boston Financial Data Services
30 Dan Road
Canton, MA 02021-2809

Save paper with eDelivery. MFS® will send you prospectuses, reports, and proxies directly via e-mail so you will get information faster with less mailbox clutter. To sign up: 1. go to mfs.com. 2. log in via MFS® Access. 3. select eDelivery. If you own your MFS fund shares through a financial institution or a retirement plan, MFS® TALK, MFS Access, and eDelivery may not be available to you.


MFS® Research International Fund
The report is prepared for the general information of shareholders. It is authorized for distribution to prospective investors only when preceded or accompanied by a current prospectus.
NOT FDIC INSURED Ÿ MAY LOSE VALUE Ÿ
NO BANK GUARANTEE
2/28/10
RIF-SEM

LETTER FROM THE CEO
Dear Shareholders:
After having suffered their biggest declines since the Great Depression, most global markets experienced an impressive resurgence during the latter months of 2009 and the first quarter of 2010. The global economy was able to reap the benefits of two major trends. The first of these was the massive efforts of governments and central banks to increase liquidity in the financial system as they sought to prevent the credit crisis from further affecting the banking system. The second was the move by companies around the world to cut costs and operations to prepare for rapidly changing market conditions. We believe that these moves not only shortened the length of the downturn but also set the stage for the recovery we are seeing today.
Even with the significant market gains of 2009 and the early part of 2010, the recovery is unrolling at a moderate pace, with rebounds in the manufacturing sector and corporate America leading the way. Central bankers are proceeding with caution and have held benchmark interest rates unchanged as they debate the best way to withdraw stimulus measures without disrupting the fragile growth process.
While hurdles remain, we believe that the global economy is on the road to recovery. As always, we continue to be mindful of the many challenges faced at the individual, national, and international levels. It is at times such as these that we want to remind investors of the merits of maintaining a long-term view, adhering to basic investing principles such as asset allocation and diversification, and working closely with advisors to identify and research investment opportunities. At MFS®, we take particular pride in how well mutual funds can help investors by providing the diversification that is important in any type of market climate.
Respectfully,

Robert J. Manning
Chief Executive Officer and Chief Investment Officer
MFS Investment Management®
April 15, 2010
The opinions expressed in this letter are subject to change, may not be relied upon for investment advice, and no forecasts can be guaranteed.
1
PORTFOLIO COMPOSITION
Portfolio structure
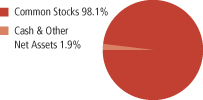
| | |
| Top ten holdings | | |
| Nestle S.A. | | 3.1% |
| HSBC Holdings PLC | | 2.7% |
| Roche Holding AG | | 2.7% |
| BNP Paribas | | 2.6% |
| Vodafone Group PLC | | 2.4% |
| Royal Dutch Shell PLC, “A” | | 2.1% |
| BHP Billiton PLC | | 2.0% |
| E.ON AG | | 1.9% |
| Taiwan Semiconductor Manufacturing Co. Ltd. | | 1.8% |
| Sumitomo Mitsui Financial Group, Inc. | | 1.8% |
| | |
| Global equity sectors | | |
| Financial Services | | 25.1% |
| Capital Goods | | 22.7% |
| Energy | | 13.0% |
| Consumer Staples | | 8.1% |
| Health Care | | 7.9% |
| Technology | | 7.9% |
| Consumer Cyclicals | | 7.5% |
| Telecom/Cable Television | | 5.9% |
| |
| Issuer country weightings | | |
| Japan | | 16.6% |
| United Kingdom | | 15.6% |
| France | | 11.1% |
| Switzerland | | 10.4% |
| Germany | | 8.8% |
| Netherlands | | 7.1% |
| China | | 3.9% |
| United States | | 3.9% |
| Hong Kong | | 3.3% |
| Other Countries | | 19.3% |
Percentages are based on net assets as of 2/28/10.
The portfolio is actively managed and current holdings may be different.
2
MARKET ENVIRONMENT
After having suffered through one of the largest and most concentrated downturns since the 1930s, most asset markets staged a remarkable rebound during 2009. This recovery in global activity, which covers this reporting period, has been led importantly by emerging Asian economies, but broadening to include most of the global economy to varying degrees. Primary drivers of the recovery included an unwinding of the inventory destocking that took place earlier, as well as massive fiscal and monetary stimulus.
During the worst of the credit crisis, policy makers globally loosened monetary and fiscal policy on a massive scale. Having reached their lower bound on policy rates prior to the beginning of the reporting period, several central banks were implementing quantitative easing as a means to further loosen monetary policy to offset the continuing fall in global economic activity. However, by the beginning of the period, there were ever-broadening signs that the global macroeconomic deterioration had passed, which caused the subsequent rise in asset valuations. As most asset prices rebounded during the period and the demand for liquidity waned, the debate concerning the existence of asset bubbles and the need for monetary exit strategies had begun, creating added uncertainty regarding the forward path of policy rates. This changing dynamic caused asset valuations to move broadly sideways during the latter part of the period.
3
EXPENSE TABLE
Fund expenses borne by the shareholders during the period, September 1, 2009 through February 28, 2010
As a shareholder of the fund, you incur two types of costs: (1) transaction costs, including sales charges (loads) on certain purchase or redemption payments, and (2) ongoing costs, including management fees; distribution and service (12b-1) fees; and other fund expenses. This example is intended to help you understand your ongoing costs (in dollars) of investing in the fund and to compare these costs with the ongoing costs of investing in other mutual funds.
The example is based on an investment of $1,000 invested at the beginning of the period and held for the entire period September 1, 2009 through February 28, 2010.
The expenses include the payment of a portion of the transfer-agent-related expenses of MFS funds that invest in the fund. For further information, please see the Notes to the Financial Statements.
Actual Expenses
The first line for each share class in the following table provides information about actual account values and actual expenses. You may use the information in this line, together with the amount you invested, to estimate the expenses that you paid over the period. Simply divide your account value by $1,000 (for example, an $8,600 account value divided by $1,000 = 8.6), then multiply the result by the number in the first line under the heading entitled “Expenses Paid During Period” to estimate the expenses you paid on your account during this period.
Hypothetical Example for Comparison Purposes
The second line for each share class in the following table provides information about hypothetical account values and hypothetical expenses based on the fund’s actual expense ratio and an assumed rate of return of 5% per year before expenses, which is not the fund’s actual return. The hypothetical account values and expenses may not be used to estimate the actual ending account balance or expenses you paid for the period. You may use this information to compare the ongoing costs of investing in the fund and other funds. To do so, compare this 5% hypothetical example with the 5% hypothetical examples that appear in the shareholder reports of the other funds.
Please note that the expenses shown in the table are meant to highlight your ongoing costs only and do not reflect any transactional costs, such as sales charges (loads). Therefore, the second line for each share class in the table is useful in comparing ongoing costs only, and will not help you determine the relative total costs of owning different funds. In addition, if these transactional costs were included, your costs would have been higher.
4
Expense Table – continued
| | | | | | | | | | |
Share
Class | | | | Annualized
Expense
Ratio | | Beginning
Account Value
9/01/09 | | Ending
Account Value
2/28/10 | | Expenses
Paid During
Period (p)
9/01/09-2/28/10 |
| A | | Actual | | 1.22% | | $1,000.00 | | $1,025.99 | | $6.13 |
| | Hypothetical (h) | | 1.22% | | $1,000.00 | | $1,018.74 | | $6.11 |
| B | | Actual | | 1.97% | | $1,000.00 | | $1,022.67 | | $9.88 |
| | Hypothetical (h) | | 1.97% | | $1,000.00 | | $1,015.03 | | $9.84 |
| C | | Actual | | 1.97% | | $1,000.00 | | $1,022.74 | | $9.88 |
| | Hypothetical (h) | | 1.97% | | $1,000.00 | | $1,015.03 | | $9.84 |
| I | | Actual | | 0.97% | | $1,000.00 | | $1,027.37 | | $4.88 |
| | Hypothetical (h) | | 0.97% | | $1,000.00 | | $1,019.98 | | $4.86 |
| W | | Actual | | 1.07% | | $1,000.00 | | $1,026.87 | | $5.38 |
| | Hypothetical (h) | | 1.07% | | $1,000.00 | | $1,019.49 | | $5.36 |
| R1 | | Actual | | 1.97% | | $1,000.00 | | $1,022.48 | | $9.88 |
| | Hypothetical (h) | | 1.97% | | $1,000.00 | | $1,015.03 | | $9.84 |
| R2 | | Actual | | 1.47% | | $1,000.00 | | $1,025.24 | | $7.38 |
| | Hypothetical (h) | | 1.47% | | $1,000.00 | | $1,017.50 | | $7.35 |
| R3 | | Actual | | 1.22% | | $1,000.00 | | $1,026.84 | | $6.13 |
| | Hypothetical (h) | | 1.22% | | $1,000.00 | | $1,018.74 | | $6.11 |
| R4 | | Actual | | 0.97% | | $1,000.00 | | $1,028.21 | | $4.88 |
| | Hypothetical (h) | | 0.97% | | $1,000.00 | | $1,019.98 | | $4.86 |
| 529A | | Actual | | 1.32% | | $1,000.00 | | $1,025.89 | | $6.63 |
| | Hypothetical (h) | | 1.32% | | $1,000.00 | | $1,018.25 | | $6.61 |
| 529B | | Actual | | 2.07% | | $1,000.00 | | $1,022.77 | | $10.38 |
| | Hypothetical (h) | | 2.07% | | $1,000.00 | | $1,014.53 | | $10.34 |
| 529C | | Actual | | 2.07% | | $1,000.00 | | $1,022.22 | | $10.38 |
| | Hypothetical (h) | | 2.07% | | $1,000.00 | | $1,014.53 | | $10.34 |
| (h) | 5% class return per year before expenses. |
| (p) | Expenses paid is equal to each class’ annualized expense ratio, as shown above, multiplied by the average account value over the period, multiplied by the number of days in the period, divided by the number of days in the year. Expenses paid do not include any applicable sales charges (loads). If these transaction costs had been included, your costs would have been higher. |
5
PORTFOLIO OF INVESTMENTS
2/28/10 (unaudited)
The Portfolio of Investments is a complete list of all securities owned by your fund. It is categorized by broad-based asset classes.
| | | | | |
| Common Stocks - 98.1% | | | | | |
| Issuer | | Shares/Par | | Value ($) |
| | | | | |
| Alcoholic Beverages - 1.1% | | | | | |
| Heineken N.V. | | 899,620 | | $ | 44,184,587 |
| | |
| Apparel Manufacturers - 2.1% | | | | | |
| Li & Fung Ltd. | | 4,498,000 | | $ | 20,919,178 |
| LVMH Moet Hennessy Louis Vuitton S.A. | | 598,500 | | | 64,869,833 |
| | | | | |
| | | | | $ | 85,789,011 |
| Automotive - 0.9% | | | | | |
| Bridgestone Corp. | | 2,140,900 | | $ | 37,543,162 |
| | |
| Broadcasting - 1.7% | | | | | |
| Grupo Televisa S.A., ADR | | 538,510 | | $ | 9,940,895 |
| WPP Group PLC | | 6,377,070 | | | 58,731,463 |
| | | | | |
| | | | | $ | 68,672,358 |
| Brokerage & Asset Managers - 3.3% | | | | | |
| Aberdeen Asset Management PLC | | 6,160,730 | | $ | 10,784,171 |
| BM&F Bovespa S.A. | | 3,118,300 | | | 20,430,331 |
| Deutsche Boerse AG | | 561,550 | | | 39,057,539 |
| Hong Kong Exchanges & Clearing Ltd. | | 2,022,800 | | | 33,851,667 |
| Nomura Holdings, Inc. | | 4,171,100 | | | 30,797,924 |
| | | | | |
| | | | | $ | 134,921,632 |
| Business Services - 1.9% | | | | | |
| Mitsubishi Corp. | | 1,779,900 | | $ | 44,474,962 |
| Nomura Research, Inc. | | 1,423,500 | | | 31,227,435 |
| | | | | |
| | | | | $ | 75,702,397 |
| Chemicals - 0.5% | | | | | |
| Monsanto Co. | | 303,170 | | $ | 21,418,961 |
| | |
| Computer Software - Systems - 2.3% | | | | | |
| Acer, Inc. | | 13,443,770 | | $ | 37,725,132 |
| Konica Minolta Holdings, Inc. | | 3,185,000 | | | 32,945,185 |
| Ricoh Co. Ltd. | | 1,669,000 | | | 23,162,553 |
| | | | | |
| | | | | $ | 93,832,870 |
6
Portfolio of Investments (unaudited) – continued
| | | | | |
| Issuer | | Shares/Par | | Value ($) |
| | | | | |
| Common Stocks - continued | | | | | |
| Conglomerates - 5.0% | | | | | |
| Hutchison Whampoa Ltd. | | 4,801,000 | | $ | 34,451,241 |
| Keppel Corp. Ltd. | | 9,588,000 | | | 57,362,937 |
| Siemens AG | | 829,610 | | | 71,155,937 |
| Tomkins PLC | | 14,118,930 | | | 41,463,959 |
| | | | | |
| | | | | $ | 204,434,074 |
| Construction - 0.8% | | | | | |
| Geberit AG | | 134,730 | | $ | 23,064,321 |
| Urbi Desarrollos Urbanos S.A. de C.V. (a) | | 4,101,330 | | | 9,233,962 |
| | | | | |
| | | | | $ | 32,298,283 |
| Consumer Products - 1.7% | | | | | |
| Hengan International Group Co. Ltd. | | 603,000 | | $ | 4,144,477 |
| Kimberly-Clark de Mexico S.A. de C.V., “A” | | 3,999,010 | | | 21,202,414 |
| Reckitt Benckiser Group PLC | | 799,520 | | | 42,034,829 |
| | | | | |
| | | | | $ | 67,381,720 |
| Electrical Equipment - 1.3% | | | | | |
| Legrand S.A. (a) | | 298,350 | | $ | 9,341,681 |
| Schneider Electric S.A. | | 428,363 | | | 45,746,695 |
| | | | | |
| | | | | $ | 55,088,376 |
| Electronics - 2.5% | | | | | |
| Samsung Electronics Co. Ltd. | | 49,966 | | $ | 32,049,922 |
| Taiwan Semiconductor Manufacturing Co. Ltd. | | 39,115,326 | | | 71,711,939 |
| | | | | |
| | | | | $ | 103,761,861 |
| Energy - Independent - 2.0% | | | | | |
| CNOOC Ltd. | | 7,593,000 | | $ | 11,973,270 |
| Cobalt International Energy, Inc. (a) | | 723,110 | | | 8,923,177 |
| INPEX Corp. | | 3,376 | | | 24,699,195 |
| SouthGobi Energy Resources Ltd. (a) | | 107,250 | | | 1,656,664 |
| Talisman Energy, Inc. | | 1,135,400 | | | 20,777,820 |
| Tullow Oil PLC | | 774,239 | | | 14,036,848 |
| | | | | |
| | | | | $ | 82,066,974 |
| Energy - Integrated - 5.6% | | | | | |
| BG Group PLC | | 2,220,980 | | $ | 38,775,984 |
| Exxon Mobil Corp. | | 616,450 | | | 40,069,250 |
| Royal Dutch Shell PLC, “A” | | 3,079,920 | | | 84,063,054 |
| Suncor Energy, Inc. | | 463,060 | | | 13,383,059 |
| TOTAL S.A. | | 903,140 | | | 50,395,596 |
| | | | | |
| | | | | $ | 226,686,943 |
7
Portfolio of Investments (unaudited) – continued
| | | | | |
| Issuer | | Shares/Par | | Value ($) |
| | | | | |
| Common Stocks - continued | | | | | |
| Engineering - Construction - 1.0% | | | | | |
| JGC Corp. | | 2,277,000 | | $ | 42,800,270 |
| | |
| Food & Beverages - 4.5% | | | | | |
| Groupe Danone | | 971,687 | | $ | 56,827,051 |
| Nestle S.A. | | 2,517,981 | | | 125,283,765 |
| | | | | |
| | | | | $ | 182,110,816 |
| Food & Drug Stores - 1.0% | | | | | |
| Lawson, Inc. | | 899,700 | | $ | 39,341,938 |
| | |
| Insurance - 4.4% | | | | | |
| Amlin PLC | | 1,170,592 | | $ | 7,046,856 |
| China Pacific Insurance Co. Ltd. (a) | | 6,986,800 | | | 28,578,538 |
| Hiscox Ltd. | | 3,133,213 | | | 16,988,865 |
| ING Groep N.V. (a) | | 7,236,964 | | | 64,692,912 |
| SNS REAAL Groep N.V. (a) | | 2,307,540 | | | 11,745,029 |
| Zurich Financial Services Ltd. | | 213,530 | | | 51,481,750 |
| | | | | |
| | | | | $ | 180,533,950 |
| Leisure & Toys - 0.2% | | | | | |
| Sankyo Co. Ltd. | | 136,600 | | $ | 6,595,914 |
| | |
| Machinery & Tools - 1.1% | | | | | |
| Beml Ltd. | | 520,794 | | $ | 11,448,883 |
| Glory Ltd. | | 1,458,300 | | | 32,811,545 |
| | | | | |
| | | | | $ | 44,260,428 |
| Major Banks - 11.5% | | | | | |
| Bank of China Ltd. | | 82,063,000 | | $ | 39,857,193 |
| BNP Paribas | | 1,484,992 | | | 107,430,968 |
| Commonwealth Bank of Australia | | 544,820 | | | 26,327,402 |
| Credit Suisse Group AG | | 1,022,280 | | | 45,392,372 |
| HSBC Holdings PLC | | 10,047,690 | | | 110,247,837 |
| Julius Baer Group Ltd. | | 612,274 | | | 19,047,891 |
| KBC Group N.V. (a) | | 446,783 | | | 20,203,708 |
| Sumitomo Mitsui Financial Group, Inc. | | 2,221,000 | | | 71,395,982 |
| Westpac Banking Corp. | | 1,196,020 | | | 28,008,054 |
| | | | | |
| | | | | $ | 467,911,407 |
| Medical Equipment - 1.2% | | | | | |
| Synthes, Inc. | | 414,520 | | $ | 49,429,846 |
8
Portfolio of Investments (unaudited) – continued
| | | | | |
| Issuer | | Shares/Par | | Value ($) |
| | | | | |
| Common Stocks - continued | | | | | |
| Metals & Mining - 2.5% | | | | | |
| BHP Billiton PLC | | 2,699,530 | | $ | 82,612,968 |
| Iluka Resources Ltd. (a) | | 6,480,587 | | | 20,792,296 |
| | | | | |
| | | | | $ | 103,405,264 |
| Natural Gas - Distribution - 1.7% | | | | | |
| GDF SUEZ | | 1,300,426 | | $ | 47,756,462 |
| Tokyo Gas Co. Ltd. | | 5,291,000 | | | 23,047,071 |
| | | | | |
| | | | | $ | 70,803,533 |
| Network & Telecom - 1.2% | | | | | |
| Nokia Oyj | | 3,556,360 | | $ | 47,916,719 |
| | |
| Oil Services - 1.0% | | | | | |
| Noble Corp. | | 474,620 | | $ | 20,057,441 |
| Schlumberger Ltd. | | 317,700 | | | 19,411,470 |
| | | | | |
| | | | | $ | 39,468,911 |
| Other Banks & Diversified Financials - 5.9% | | | | | |
| Aeon Credit Service Co. Ltd. | | 2,652,000 | | $ | 27,163,262 |
| Banco Santander Brasil, ADR | | 2,824,630 | | | 33,782,575 |
| Chiba Bank Ltd. | | 1,717,000 | | | 10,455,254 |
| China Construction Bank | | 65,202,000 | | | 49,307,955 |
| HDFC Bank Ltd., ADR | | 256,290 | | | 31,187,930 |
| ICICI Bank Ltd. | | 1,633,518 | | | 30,900,612 |
| ICICI Bank Ltd., ADR | | 292,530 | | | 11,189,273 |
| Unione di Banche Italiane ScpA | | 3,645,019 | | | 45,388,838 |
| | | | | |
| | | | | $ | 239,375,699 |
| Pharmaceuticals - 6.7% | | | | | |
| Bayer AG | | 681,864 | | $ | 45,188,161 |
| Merck KGaA | | 224,910 | | | 17,701,178 |
| Roche Holding AG | | 653,900 | | | 109,201,452 |
| Sanofi - Aventis | | 973,650 | | | 71,220,404 |
| Santen, Inc. | | 993,600 | | | 31,928,955 |
| | | | | |
| | | | | $ | 275,240,150 |
| Precious Metals & Minerals - 1.6% | | | | | |
| Lihir Gold Ltd. | | 7,120,561 | | $ | 16,910,839 |
| Teck Resources Ltd., “B” (a) | | 1,319,530 | | | 48,532,419 |
| | | | | |
| | | | | $ | 65,443,258 |
| Printing & Publishing - 0.7% | | | | | |
| Reed Elsevier PLC | | 4,037,811 | | $ | 30,291,710 |
9
Portfolio of Investments (unaudited) – continued
| | | | | |
| Issuer | | Shares/Par | | Value ($) |
| | | | | |
| Common Stocks - continued | | | | | |
| Railroad & Shipping - 1.4% | | | | | |
| East Japan Railway Co. | | 803,800 | | $ | 55,368,968 |
| | |
| Specialty Chemicals - 4.1% | | | | | |
| Akzo Nobel N.V. | | 1,187,460 | | $ | 60,383,323 |
| Linde AG | | 628,490 | | | 70,764,741 |
| Symrise AG | | 1,743,898 | | | 37,162,163 |
| | | | | |
| | | | | $ | 168,310,227 |
| Specialty Stores - 1.8% | | | | | |
| Esprit Holdings Ltd. | | 4,726,803 | | $ | 33,705,675 |
| Industria de Diseno Textil S.A. | | 640,100 | | | 37,748,663 |
| | | | | |
| | | | | $ | 71,454,338 |
| Telecommunications - Wireless - 4.0% | | | | | |
| America Movil S.A.B. de C.V., “L”, ADR | | 393,560 | | $ | 17,540,969 |
| KDDI Corp. | | 5,602 | | | 29,887,422 |
| Vivo Participacoes S.A., ADR | | 655,960 | | | 17,750,278 |
| Vodafone Group PLC | | 45,169,420 | | | 97,422,700 |
| | | | | |
| | | | | $ | 162,601,369 |
| Telephone Services - 1.9% | | | | | |
| China Unicom Ltd. | | 21,148,000 | | $ | 25,365,122 |
| Royal KPN N.V. | | 3,373,880 | | | 53,750,320 |
| | | | | |
| | | | | $ | 79,115,442 |
| Tobacco - 0.8% | | | | | |
| Japan Tobacco, Inc. | | 9,236 | | $ | 33,525,916 |
| | |
| Trucking - 2.5% | | | | | |
| TNT N.V. | | 2,030,784 | | $ | 52,566,784 |
| Yamato Holdings Co. Ltd. | | 3,635,800 | | | 48,452,780 |
| | | | | |
| | | | | $ | 101,019,564 |
| Utilities - Electric Power - 2.7% | | | | | |
| CEZ AS | | 435,480 | | $ | 19,913,712 |
| Cheung Kong Infrastructure Holdings Ltd. | | 2,770,000 | | | 10,420,309 |
| E.ON AG | | 2,223,397 | | | 79,183,975 |
| | | | | |
| | | | | $ | 109,517,996 |
| Total Common Stocks (Identified Cost, $3,809,787,631) | | | | $ | 3,999,626,842 |
10
Portfolio of Investments (unaudited) – continued
| | | | | |
| Money Market Funds (v) - 1.2% | | | | | |
| Issuer | | Shares/Par | | Value ($) |
| | | | | |
MFS Institutional Money Market Portfolio, 0.14%,
at Cost and Net Asset Value | | 50,205,162 | | $ | 50,205,162 |
| Total Investments (Identified Cost, $3,859,992,793) | | | | $ | 4,049,832,004 |
| | |
| Other Assets, Less Liabilities - 0.7% | | | | | 27,966,209 |
| Net Assets - 100.0% | | | | $ | 4,077,798,213 |
| (a) | Non-income producing security. |
| (v) | Underlying fund that is available only to investment companies managed by MFS. The rate quoted is the annualized seven-day yield of the fund at period end. |
The following abbreviations are used in this report and are defined:
| ADR | | American Depository Receipt |
| PLC | | Public Limited Company |
See Notes to Financial Statements
11
Financial Statements
STATEMENT OF ASSETS AND LIABILITIES
At 2/28/10 (unaudited)
This statement represents your fund’s balance sheet, which details the assets and liabilities comprising the total value of the fund.
| | | |
| Assets | | | |
Investments- | | | |
Non-affiliated issuers, at value (identified cost, $3,809,787,631) | | $3,999,626,842 | |
Underlying funds, at cost and value | | 50,205,162 | |
Total investments, at value (identified cost, $3,859,992,793) | | $4,049,832,004 | |
Receivables for | | | |
Investments sold | | 3,203,062 | |
Fund shares sold | | 23,805,536 | |
Interest and dividends | | 7,000,792 | |
Other assets | | 43,726 | |
Total assets | | $4,083,885,120 | |
| Liabilities | | | |
Payable to custodian | | $763 | |
Payables for | | | |
Investments purchased | | 539,677 | |
Fund shares reacquired | | 3,695,852 | |
Payable to affiliates | | | |
Investment adviser | | 342,669 | |
Shareholder servicing costs | | 1,062,628 | |
Distribution and service fees | | 65,332 | |
Administrative services fee | | 6,748 | |
Program manager fees | | 30 | |
Payable for independent Trustees’ compensation | | 31,248 | |
Accrued expenses and other liabilities | | 341,960 | |
Total liabilities | | $6,086,907 | |
Net assets | | $4,077,798,213 | |
| Net assets consist of | | | |
Paid-in capital | | $5,159,818,990 | |
Unrealized appreciation (depreciation) on investments and translation of assets and liabilities in foreign currencies | | 189,893,462 | |
Accumulated net realized gain (loss) on investments and foreign currency transactions | | (1,277,778,401 | ) |
Undistributed net investment income | | 5,864,162 | |
Net assets | | $4,077,798,213 | |
Shares of beneficial interest outstanding | | 306,201,852 | |
| | | | | | |
| | | Net assets | | Shares
outstanding | | Net asset value
per share (a) |
Class A | | $1,441,172,651 | | 109,312,724 | | $13.18 |
Class B | | 49,309,840 | | 3,916,892 | | 12.59 |
Class C | | 111,976,963 | | 8,998,986 | | 12.44 |
Class I | | 1,765,589,600 | | 129,893,585 | | 13.59 |
Class W | | 26,504,682 | | 2,016,604 | | 13.14 |
Class R1 | | 6,446,201 | | 525,621 | | 12.26 |
Class R2 | | 71,146,410 | | 5,536,737 | | 12.85 |
Class R3 | | 131,499,091 | | 10,060,457 | | 13.07 |
Class R4 | | 471,453,441 | | 35,727,707 | | 13.20 |
Class 529A | | 1,536,898 | | 117,880 | | 13.04 |
Class 529B | | 471,633 | | 38,418 | | 12.28 |
Class 529C | | 690,803 | | 56,241 | | 12.28 |
| (a) | Maximum offering price per share was equal to the net asset value per share for all share classes, except for Classes A and 529A, for which the maximum offering prices per share were $13.98 [100 / 94.25 x $13.18] and $13.84 [100 / 94.25 x $13.04], respectively. On sales of $50,000 or more, the maximum offering prices of Class A and Class 529A shares are reduced. A contingent deferred sales charge may be imposed on redemptions of Class A, Class B, Class C, Class 529B, and Class 529C shares. Redemption price per share was equal to the net asset value per share for Classes I, W, R1, R2, R3, R4, and 529A. |
See Notes to Financial Statements
12
Financial Statements
STATEMENT OF OPERATIONS
Six months ended 2/28/10 (unaudited)
This statement describes how much your fund earned in investment income and accrued in expenses. It also describes any gains and/or losses generated by fund operations.
| | | |
| Net investment income | | | |
Income | | | |
Dividends | | $30,216,831 | |
Interest | | 566,717 | |
Dividends from underlying funds | | 35,432 | |
Foreign taxes withheld | | (2,586,319 | ) |
Total investment income | | $28,232,661 | |
Expenses | | | |
Management fee | | $15,266,558 | |
Distribution and service fees | | 2,987,431 | |
Program manager fees | | 1,353 | |
Shareholder servicing costs | | 2,305,799 | |
Administrative services fee | | 295,999 | |
Independent Trustees’ compensation | | 38,177 | |
Custodian fee | | 824,300 | |
Shareholder communications | | 97,545 | |
Auditing fees | | 30,136 | |
Legal fees | | 43,042 | |
Miscellaneous | | 204,981 | |
Total expenses | | $22,095,321 | |
Fees paid indirectly | | (21 | ) |
Reduction of expenses by investment adviser | | (7,882 | ) |
Net expenses | | $22,087,418 | |
Net investment income | | $6,145,243 | |
Realized and unrealized gain (loss) on investments
and foreign currency transactions | | | |
Realized gain (loss) (identified cost basis) | | | |
Investment transactions | | $142,765,852 | |
Foreign currency transactions | | 318,784 | |
Net realized gain (loss) on investments
and foreign currency transactions | | $143,084,636 | |
Change in unrealized appreciation (depreciation) | | | |
Investments (net of $274,890 decrease in deferred country tax) | | $(65,738,217 | ) |
Translation of assets and liabilities in foreign currencies | | (146,237 | ) |
Net unrealized gain (loss) on investments
and foreign currency translation | | $(65,884,454 | ) |
Net realized and unrealized gain (loss) on investments
and foreign currency | | $77,200,182 | |
Change in net assets from operations | | $83,345,425 | |
See Notes to Financial Statements
13
Financial Statements
STATEMENTS OF CHANGES IN NET ASSETS
These statements describe the increases and/or decreases in net assets resulting from operations, any distributions, and any shareholder transactions.
| | | | | | |
| Change in net assets | | Six months ended
2/28/10
(unaudited) | | | Year ended
8/31/09 | |
| From operations | | | | | | |
Net investment income | | $6,145,243 | | | $61,282,966 | |
Net realized gain (loss) on investments and foreign currency transactions | | 143,084,636 | | | (1,403,567,923 | ) |
Net unrealized gain (loss) on investments and foreign currency translation | | (65,884,454 | ) | | 499,555,923 | |
Change in net assets from operations | | $83,345,425 | | | $(842,729,034 | ) |
| Distributions declared to shareholders | | | | | | |
From net investment income | | $(59,827,528 | ) | | $(59,328,561 | ) |
From net realized gain on investments | | — | | | (56,492,868 | ) |
Total distributions declared to shareholders | | $(59,827,528 | ) | | $(115,821,429 | ) |
Change in net assets from fund share transactions | | $474,081,529 | | | $127,313,774 | |
Total change in net assets | | $497,599,426 | | | $(831,236,689 | ) |
| Net assets | | | | | | |
At beginning of period | | 3,580,198,787 | | | 4,411,435,476 | |
At end of period (including undistributed net investment income of $5,864,162 and $59,546,447, respectively) | | $4,077,798,213 | | | $3,580,198,787 | |
See Notes to Financial Statements
14
Financial Statements
FINANCIAL HIGHLIGHTS
The financial highlights table is intended to help you understand the fund’s financial performance for the semiannual period and the past 5 fiscal years (or life of a particular share class, if shorter). Certain information reflects financial results for a single fund share. The total returns in the table represent the rate by which an investor would have earned (or lost) on an investment in the fund share class (assuming reinvestment of all distributions) held for the entire period.
| | | | | | | | | | | | | | | | | | |
| | | Six months
ended
2/28/10
(unaudited) | | | Years ended 8/31 | |
| Class A | | | 2009 | | | 2008 | | | 2007 | | | 2006 | | | 2005 | |
| | | | | | | | | | | | | | | | | |
Net asset value, beginning
of period | | $13.03 | | | $16.14 | | | $20.56 | | | $19.44 | | | $16.65 | | | $14.25 | |
Income (loss) from
investment operations | | | | | | | | | | | | | | | | | | |
Net investment income (d) | | $0.01 | | | $0.22 | | | $0.30 | | | $0.26 | | | $0.19 | | | $0.12 | |
Net realized and
unrealized gain (loss)
on investments and
foreign currency | | 0.34 | | | (2.92 | ) | | (2.45 | ) | | 3.03 | | | 4.08 | | | 3.04 | |
Total from investment
operations | | $0.35 | | | $(2.70 | ) | | $(2.15 | ) | | $3.29 | | | $4.27 | | | $3.16 | |
Less distributions declared
to shareholders | | | | | | | | | | | | | | | | | | |
From net investment
income | | $(0.20 | ) | | $(0.20 | ) | | $(0.28 | ) | | $(0.23 | ) | | $(0.12 | ) | | $(0.08 | ) |
From net realized gain on
investments | | — | | | (0.21 | ) | | (1.99 | ) | | (1.94 | ) | | (1.36 | ) | | (0.68 | ) |
Total distributions declared
to shareholders | | $(0.20 | ) | | $(0.41 | ) | | $(2.27 | ) | | $(2.17 | ) | | $(1.48 | ) | | $(0.76 | ) |
Net asset value, end of
period | | $13.18 | | | $13.03 | | | $16.14 | | | $20.56 | | | $19.44 | | | $16.65 | |
Total return (%) (r)(s)(t) | | 2.60 | (n) | | (16.22 | ) | | (12.46 | ) | | 17.82 | | | 27.18 | | | 22.67 | |
Ratios (%) (to average net
assets) and Supplemental
data: | | | | | | | | | | | | | | | | | | |
Expenses before expense
reductions (f) | | 1.22 | (a) | | 1.35 | | | 1.32 | | | 1.34 | | | 1.43 | | | 1.52 | |
Expenses after expense
reductions (f) | | 1.22 | (a) | | 1.35 | | | 1.32 | | | 1.34 | | | 1.43 | | | 1.55 | (e) |
Net investment income | | 0.21 | (a) | | 1.95 | | | 1.57 | | | 1.28 | | | 1.06 | | | 0.80 | |
Portfolio turnover | | 30 | | | 88 | | | 68 | | | 66 | | | 85 | | | 79 | |
Net assets at end of period
(000 omitted) | | $1,441,173 | | | $1,254,399 | | | $1,628,324 | | | $1,813,833 | | | $1,344,754 | | | $958,878 | |
See Notes to Financial Statements
15
Financial Highlights – continued
| | | | | | | | | | | | | | | | | | |
| | | Six months
ended
2/28/10
(unaudited) | | | Years ended 8/31 | |
| Class B | | | 2009 | | | 2008 | | | 2007 | | | 2006 | | | 2005 | |
| | | | | | | | | | | | | | | | | |
Net asset value, beginning
of period | | $12.39 | | | $15.34 | | | $19.61 | | | $18.63 | | | $16.02 | | | $13.76 | |
Income (loss) from
investment operations | | | | | | | | | | | | | | | | | | |
Net investment income
(loss) (d) | | $(0.03 | ) | | $0.13 | | | $0.14 | | | $0.11 | | | $0.07 | | | $0.01 | |
Net realized and
unrealized gain (loss)
on investments and
foreign currency | | 0.32 | | | (2.77 | ) | | (2.30 | ) | | 2.92 | | | 3.93 | | | 2.93 | |
Total from investment
operations | | $0.29 | | | $(2.64 | ) | | $(2.16 | ) | | $3.03 | | | $4.00 | | | $2.94 | |
Less distributions declared
to shareholders | | | | | | | | | | | | | | | | | | |
From net investment
income | | $(0.09 | ) | | $(0.10 | ) | | $(0.12 | ) | | $(0.11 | ) | | $(0.03 | ) | | $(0.00 | )(w) |
From net realized gain on
investments | | — | | | (0.21 | ) | | (1.99 | ) | | (1.94 | ) | | (1.36 | ) | | (0.68 | ) |
Total distributions declared
to shareholders | | $(0.09 | ) | | $(0.31 | ) | | $(2.11 | ) | | $(2.05 | ) | | $(1.39 | ) | | $(0.68 | ) |
Net asset value, end of
period | | $12.59 | | | $12.39 | | | $15.34 | | | $19.61 | | | $18.63 | | | $16.02 | |
Total return (%) (r)(s)(t) | | 2.27 | (n) | | (16.85 | ) | | (13.00 | ) | | 17.08 | | | 26.36 | | | 21.77 | |
Ratios (%) (to average net
assets) and Supplemental
data: | | | | | | | | | | | | | | | | | | |
Expenses before expense
reductions (f) | | 1.97 | (a) | | 2.05 | | | 1.97 | | | 1.99 | | | 2.08 | | | 2.17 | |
Expenses after expense
reductions (f) | | 1.97 | (a) | | 2.05 | | | 1.97 | | | 1.99 | | | 2.08 | | | 2.20 | (e) |
Net investment income (loss) | | (0.51 | )(a) | | 1.25 | | | 0.77 | | | 0.55 | | | 0.40 | | | 0.08 | |
Portfolio turnover | | 30 | | | 88 | | | 68 | | | 66 | | | 85 | | | 79 | |
Net assets at end of period
(000 omitted) | | $49,310 | | | $55,961 | | | $111,389 | | | $185,670 | | | $184,341 | | | $141,515 | |
See Notes to Financial Statements
16
Financial Highlights – continued
| | | | | | | | | | | | | | | | | | |
| | | Six months
ended
2/28/10
(unaudited) | | | Years ended 8/31 | |
| Class C | | | 2009 | | | 2008 | | | 2007 | | | 2006 | | | 2005 | |
| | | | | | | | | | | | | | | | | |
Net asset value, beginning
of period | | $12.27 | | | $15.23 | | | $19.52 | | | $18.57 | | | $15.98 | | | $13.73 | |
Income (loss) from
investment operations | | | | | | | | | | | | | | | | | | |
Net investment income
(loss) (d) | | $(0.03 | ) | | $0.14 | | | $0.15 | | | $0.12 | | | $0.07 | | | $0.02 | |
Net realized and
unrealized gain (loss)
on investments and
foreign currency | | 0.31 | | | (2.77 | ) | | (2.29 | ) | | 2.89 | | | 3.92 | | | 2.92 | |
Total from investment
operations | | $0.28 | | | $(2.63 | ) | | $(2.14 | ) | | $3.01 | | | $3.99 | | | $2.94 | |
Less distributions declared
to shareholders | | | | | | | | | | | | | | | | | | |
From net investment
income | | $(0.11 | ) | | $(0.12 | ) | | $(0.16 | ) | | $(0.12 | ) | | $(0.04 | ) | | $(0.01 | ) |
From net realized gain on
investments | | — | | | (0.21 | ) | | (1.99 | ) | | (1.94 | ) | | (1.36 | ) | | (0.68 | ) |
Total distributions declared
to shareholders | | $(0.11 | ) | | $(0.33 | ) | | $(2.15 | ) | | $(2.06 | ) | | $(1.40 | ) | | $(0.69 | ) |
Net asset value, end of
period | | $12.44 | | | $12.27 | | | $15.23 | | | $19.52 | | | $18.57 | | | $15.98 | |
Total return (%) (r)(s)(t) | | 2.27 | (n) | | (16.88 | ) | | (13.00 | ) | | 17.05 | | | 26.38 | | | 21.84 | |
Ratios (%) (to average net
assets) and Supplemental
data: | | | | | | | | | | | | | | | | | | |
Expenses before expense
reductions (f) | | 1.97 | (a) | | 2.05 | | | 1.97 | | | 1.99 | | | 2.08 | | | 2.17 | |
Expenses after expense
reductions (f) | | 1.97 | (a) | | 2.05 | | | 1.97 | | | 1.99 | | | 2.08 | | | 2.20 | (e) |
Net investment income (loss) | | (0.53 | )(a) | | 1.30 | | | 0.86 | | | 0.62 | | | 0.41 | | | 0.13 | |
Portfolio turnover | | 30 | | | 88 | | | 68 | | | 66 | | | 85 | | | 79 | |
Net assets at end of period
(000 omitted) | | $111,977 | | | $110,142 | | | $168,396 | | | $200,491 | | | $158,564 | | | $109,347 | |
See Notes to Financial Statements
17
Financial Highlights – continued
| | | | | | | | | | | | | | | | | | |
| | | Six months
ended
2/28/10
(unaudited) | | | Years ended 8/31 | |
| Class I | | | 2009 | | | 2008 | | | 2007 | | | 2006 | | | 2005 | |
| | | | | | | | | | | | | | | | | |
Net asset value, beginning
of period | | $13.44 | | | $16.65 | | | $21.14 | | | $19.92 | | | $17.02 | | | $14.54 | |
Income (loss) from
investment operations | | | | | | | | | | | | | | | | | | |
Net investment income (d) | | $0.03 | | | $0.26 | | | $0.37 | | | $0.34 | | | $0.26 | | | $0.19 | |
Net realized and
unrealized gain (loss)
on investments and
foreign currency | | 0.35 | | | (3.01 | ) | | (2.52 | ) | | 3.11 | | | 4.17 | | | 3.10 | |
Total from investment
operations | | $0.38 | | | $(2.75 | ) | | $(2.15 | ) | | $3.45 | | | $4.43 | | | $3.29 | |
Less distributions declared
to shareholders | | | | | | | | | | | | | | | | | | |
From net investment
income | | $(0.23 | ) | | $(0.25 | ) | | $(0.35 | ) | | $(0.29 | ) | | $(0.17 | ) | | $(0.13 | ) |
From net realized gain on
investments | | — | | | (0.21 | ) | | (1.99 | ) | | (1.94 | ) | | (1.36 | ) | | (0.68 | ) |
Total distributions declared
to shareholders | | $(0.23 | ) | | $(0.46 | ) | | $(2.34 | ) | | $(2.23 | ) | | $(1.53 | ) | | $(0.81 | ) |
Net asset value, end of
period | | $13.59 | | | $13.44 | | | $16.65 | | | $21.14 | | | $19.92 | | | $17.02 | |
Total return (%) (r)(s) | | 2.74 | (n) | | (16.00 | ) | | (12.15 | ) | | 18.27 | | | 27.61 | | | 23.09 | |
Ratios (%) (to average net
assets) and Supplemental
data: | | | | | | | | | | | | | | | | | | |
Expenses before expense
reductions (f) | | 0.97 | (a) | | 1.05 | | | 0.97 | | | 0.99 | | | 1.08 | | | 1.17 | |
Expenses after expense
reductions (f) | | 0.97 | (a) | | 1.05 | | | 0.97 | | | 0.99 | | | 1.08 | | | 1.20 | (e) |
Net investment income | | 0.46 | (a) | | 2.31 | | | 1.93 | | | 1.64 | | | 1.41 | | | 1.18 | |
Portfolio turnover | | 30 | | | 88 | | | 68 | | | 66 | | | 85 | | | 79 | |
Net assets at end of period
(000 omitted) | | $1,765,590 | | | $1,456,884 | | | $2,167,218 | | | $2,210,257 | | | $1,565,596 | | | $851,484 | |
See Notes to Financial Statements
18
Financial Highlights – continued
| | | | | | | | | | | | | | | |
| | | Six months
ended
2/28/10
(unaudited) | | | Years ended 8/31 | |
| Class W | | | 2009 | | | 2008 | | | 2007 | | | 2006 (i) | |
| | | | | | | | | | | | | | |
Net asset value, beginning of period | | $13.00 | | | $16.14 | | | $20.57 | | | $19.45 | | | $19.54 | |
| Income (loss) from investment operations | | | | | | | | | | | | | | | |
Net investment income (d) | | $0.02 | | | $0.24 | | | $0.35 | | | $0.35 | | | $0.04 | |
Net realized and unrealized gain (loss) on investments and foreign currency | | 0.34 | | | (2.93 | ) | | (2.45 | ) | | 3.00 | | | (0.13 | )(g) |
Total from investment operations | | $0.36 | | | $(2.69 | ) | | $(2.10 | ) | | $3.35 | | | $(0.09 | ) |
| Less distributions declared to shareholders | | | | | | | | | | | | | | | |
From net investment income | | $(0.22 | ) | | $(0.24 | ) | | $(0.34 | ) | | $(0.29 | ) | | $— | |
From net realized gain on investments | | — | | | (0.21 | ) | | (1.99 | ) | | (1.94 | ) | | — | |
Total distributions declared to shareholders | | $(0.22 | ) | | $(0.45 | ) | | $(2.33 | ) | | $(2.23 | ) | | $— | |
Net asset value, end of period | | $13.14 | | | $13.00 | | | $16.14 | | | $20.57 | | | $19.45 | |
Total return (%) (r)(s) | | 2.69 | (n) | | (16.12 | ) | | (12.25 | ) | | 18.15 | | | (0.46 | )(n) |
| Ratios (%) (to average net assets) and Supplemental data: | | | | | | | | | | | | | | | |
Expenses before expense reductions (f) | | 1.07 | (a) | | 1.14 | | | 1.07 | | | 1.10 | | | 1.20 | (a) |
Expenses after expense reductions (f) | | 1.07 | (a) | | 1.14 | | | 1.07 | | | 1.10 | | | 1.20 | (a) |
Net investment income | | 0.37 | (a) | | 2.25 | | | 1.89 | | | 1.78 | | | 1.02 | (a) |
Portfolio turnover | | 30 | | | 88 | | | 68 | | | 66 | | | 85 | |
Net assets at end of period (000 omitted) | | $26,505 | | | $23,560 | | | $16,633 | | | $10,272 | | | $1,033 | |
See Notes to Financial Statements
19
Financial Highlights – continued
| | | | | | | | | | | | | | | | | | |
| | | Six months
ended
2/28/10
(unaudited) | | | Years ended 8/31 | |
| Class R1 | | | 2009 | | | 2008 | | | 2007 | | | 2006 | | | 2005 (i) | |
| | | | | | | | | | | | | | | | | |
Net asset value, beginning
of period | | $12.10 | | | $15.05 | | | $19.38 | | | $18.49 | | | $16.02 | | | $15.07 | |
Income (loss) from
investment operations | | | | | | | | | | | | | | | | | | |
Net investment income
(loss) (d) | | $(0.03 | ) | | $0.14 | | | $0.16 | | | $0.12 | | | $0.11 | | | $0.03 | |
Net realized and
unrealized gain (loss)
on investments and
foreign currency | | 0.31 | | | (2.74 | ) | | (2.28 | ) | | 2.87 | | | 3.84 | | | 0.92 | |
Total from investment
operations | | $0.28 | | | $(2.60 | ) | | $(2.12 | ) | | $2.99 | | | $3.95 | | | $0.95 | |
Less distributions declared
to shareholders | | | | | | | | | | | | | | | | | | |
From net investment
income | | $(0.12 | ) | | $(0.14 | ) | | $(0.22 | ) | | $(0.16 | ) | | $(0.12 | ) | | $— | |
From net realized gain on
investments | | — | | | (0.21 | ) | | (1.99 | ) | | (1.94 | ) | | (1.36 | ) | | — | |
Total distributions declared
to shareholders | | $(0.12 | ) | | $(0.35 | ) | | $(2.21 | ) | | $(2.10 | ) | | $(1.48 | ) | | $— | |
Net asset value, end of
period | | $12.26 | | | $12.10 | | | $15.05 | | | $19.38 | | | $18.49 | | | $16.02 | |
Total return (%) (r)(s) | | 2.25 | (n) | | (16.87 | ) | | (13.03 | ) | | 17.00 | | | 26.12 | | | 6.30 | (n) |
Ratios (%) (to average net
assets) and Supplemental
data: | | | | | | | | | | | | | | | | | | |
Expenses before expense
reductions (f) | | 1.97 | (a) | | 2.05 | | | 2.02 | | | 2.14 | | | 2.26 | | | 2.36 | (a) |
Expenses after expense
reductions (f) | | 1.97 | (a) | | 2.05 | | | 2.02 | | | 2.09 | | | 2.16 | | | 2.39 | (a)(e) |
Net investment income (loss) | | (0.52 | )(a) | | 1.34 | | | 0.92 | | | 0.64 | | | 0.65 | | | 0.46 | (a) |
Portfolio turnover | | 30 | | | 88 | | | 68 | | | 66 | | | 85 | | | 79 | |
Net assets at end of period
(000 omitted) | | $6,446 | | | $6,311 | | | $8,930 | | | $5,441 | | | $2,027 | | | $171 | |
See Notes to Financial Statements
20
Financial Highlights – continued
| | | | | | | | | | | | | | | | | | |
| | | Six months
ended
2/28/10
(unaudited) | | | Years ended 8/31 | |
| Class R2 | | | 2009 | | | 2008 | | | 2007 | | | 2006 | | | 2005 | |
| | | | | | | | | | | | | | | | | |
Net asset value, beginning
of period | | $12.70 | | | $15.76 | | | $20.14 | | | $19.11 | | | $16.43 | | | $14.16 | |
Income (loss) from
investment operations | | | | | | | | | | | | | | | | | | |
Net investment income (loss) (d) | | $(0.00 | )(w) | | $0.20 | | | $0.36 | | | $0.22 | | | $0.15 | | | $0.11 | |
Net realized and
unrealized gain (loss)
on investments and
foreign currency | | 0.33 | | | (2.87 | ) | | (2.49 | ) | | 2.96 | | | 4.01 | | | 2.96 | |
Total from investment
operations | | $0.33 | | | $(2.67 | ) | | $(2.13 | ) | | $3.18 | | | $4.16 | | | $3.07 | |
Less distributions declared
to shareholders | | | | | | | | | | | | | | | | | | |
From net investment
income | | $(0.18 | ) | | $(0.18 | ) | | $(0.26 | ) | | $(0.21 | ) | | $(0.12 | ) | | $(0.12 | ) |
From net realized gain on
investments | | — | | | (0.21 | ) | | (1.99 | ) | | (1.94 | ) | | (1.36 | ) | | (0.68 | ) |
Total distributions declared
to shareholders | | $(0.18 | ) | | $(0.39 | ) | | $(2.25 | ) | | $(2.15 | ) | | $(1.48 | ) | | $(0.80 | ) |
Net asset value, end of
period | | $12.85 | | | $12.70 | | | $15.76 | | | $20.14 | | | $19.11 | | | $16.43 | |
Total return (%) (r)(s) | | 2.52 | (n) | | (16.45 | ) | | (12.63 | ) | | 17.50 | | | 26.79 | | | 22.13 | |
Ratios (%) (to average net
assets) and Supplemental
data: | | | | | | | | | | | | | | | | | | |
Expenses before expense
reductions (f) | | 1.47 | (a) | | 1.54 | | | 1.51 | | | 1.69 | | | 1.82 | | | 1.92 | |
Expenses after expense
reductions (f) | | 1.47 | (a) | | 1.54 | | | 1.51 | | | 1.64 | | | 1.73 | | | 1.95 | (e) |
Net investment income (loss) | | (0.03 | )(a) | | 1.88 | | | 2.02 | | | 1.13 | | | 0.83 | | | 0.74 | |
Portfolio turnover | | 30 | | | 88 | | | 68 | | | 66 | | | 85 | | | 79 | |
Net assets at end of period
(000 omitted) | | $71,146 | | | $60,790 | | | $96,672 | | | $36,143 | | | $13,799 | | | $2,357 | |
See Notes to Financial Statements
21
Financial Highlights – continued
| | | | | | | | | | | | | | | | | | |
| | | Six months
ended
2/28/10
(unaudited) | | | Years ended 8/31 | |
| Class R3 | | | 2009 | | | 2008 | | | 2007 | | | 2006 | | | 2005 (i) | |
| | | | | | | | | | | | | | | | | |
Net asset value, beginning
of period | | $12.92 | | | $16.06 | | | $20.47 | | | $19.39 | | | $16.65 | | | $15.62 | |
Income (loss) from
investment operations | | | | | | | | | | | | | | | | | | |
Net investment income (d) | | $0.02 | | | $0.23 | | | $0.30 | | | $0.31 | | | $0.25 | | | $0.12 | |
Net realized and
unrealized gain (loss)
on investments and
foreign currency | | 0.34 | | | (2.93 | ) | | (2.43 | ) | | 2.96 | | | 4.00 | | | 0.91 | |
Total from investment
operations | | $0.36 | | | $(2.70 | ) | | $(2.13 | ) | | $3.27 | | | $4.25 | | | $1.03 | |
Less distributions declared
to shareholders | | | | | | | | | | | | | | | | | | |
From net investment
income | | $(0.21 | ) | | $(0.23 | ) | | $(0.29 | ) | | $(0.25 | ) | | $(0.15 | ) | | $— | |
From net realized gain on
investments | | — | | | (0.21 | ) | | (1.99 | ) | | (1.94 | ) | | (1.36 | ) | | — | |
Total distributions declared
to shareholders | | $(0.21 | ) | | $(0.44 | ) | | $(2.28 | ) | | $(2.19 | ) | | $(1.51 | ) | | $— | |
Net asset value, end of
period | | $13.07 | | | $12.92 | | | $16.06 | | | $20.47 | | | $19.39 | | | $16.65 | |
Total return (%) (r)(s) | | 2.68 | (n) | | (16.26 | ) | | (12.42 | ) | | 17.78 | | | 27.07 | | | 6.59 | (n) |
Ratios (%) (to average net
assets) and Supplemental
data: | | | | | | | | | | | | | | | | | | |
Expenses before expense
reductions (f) | | 1.22 | (a) | | 1.29 | | | 1.27 | | | 1.39 | | | 1.47 | | | 1.55 | (a) |
Expenses after expense
reductions (f) | | 1.22 | (a) | | 1.29 | | | 1.27 | | | 1.39 | | | 1.47 | | | 1.58 | (a)(e) |
Net investment income | | 0.23 | (a) | | 2.09 | | | 1.61 | | | 1.54 | | | 1.42 | | | 1.79 | (a) |
Portfolio turnover | | 30 | | | 88 | | | 68 | | | 66 | | | 85 | | | 79 | |
Net assets at end of period
(000 omitted) | | $131,499 | | | $133,545 | | | $62,056 | | | $64,332 | | | $12,796 | | | $53 | |
See Notes to Financial Statements
22
Financial Highlights – continued
| | | | | | | | | | | | | | | | | | |
| | | Six months
ended
2/28/10 (unaudited) | | | Years ended 8/31 | |
| Class R4 | | | 2009 | | | 2008 | | | 2007 | | | 2006 | | | 2005 (i) | |
| | | | | | | | | | | | | | | | | |
Net asset value, beginning
of period | | $13.05 | | | $16.19 | | | $20.60 | | | $19.47 | | | $16.67 | | | $15.62 | |
Income (loss) from
investment operations | | | | | | | | | | | | | | | | | | |
Net investment income (d) | | $0.03 | | | $0.20 | | | $0.34 | | | $0.32 | | | $0.33 | | | $0.14 | |
Net realized and
unrealized gain (loss)
on investments and
foreign currency | | 0.35 | | | (2.88 | ) | | (2.43 | ) | | 3.03 | | | 3.99 | | | 0.91 | |
Total from investment
operations | | $0.38 | | | $(2.68 | ) | | $(2.09 | ) | | $3.35 | | | $4.32 | | | $1.05 | |
Less distributions declared
to shareholders | | | | | | | | | | | | | | | | | | |
From net investment
income | | $(0.23 | ) | | $(0.25 | ) | | $(0.33 | ) | | $(0.28 | ) | | $(0.16 | ) | | $— | |
From net realized gain on
investments | | — | | | (0.21 | ) | | (1.99 | ) | | (1.94 | ) | | (1.36 | ) | | — | |
Total distributions declared
to shareholders | | $(0.23 | ) | | $(0.46 | ) | | $(2.32 | ) | | $(2.22 | ) | | $(1.52 | ) | | $— | |
Net asset value, end of
period | | $13.20 | | | $13.05 | | | $16.19 | | | $20.60 | | | $19.47 | | | $16.67 | |
Total return (%) (r)(s) | | 2.82 | (n) | | (16.03 | ) | | (12.15 | ) | | 18.13 | | | 27.50 | | | 6.72 | (n) |
Ratios (%) (to average net
assets) and Supplemental
data: | | | | | | | | | | | | | | | | | | |
Expenses before expense
reductions (f) | | 0.97 | (a) | | 1.00 | | | 1.01 | | | 1.09 | | | 1.17 | | | 1.25 | (a) |
Expenses after expense
reductions (f) | | 0.97 | (a) | | 1.00 | | | 1.01 | | | 1.09 | | | 1.17 | | | 1.28 | (a)(e) |
Net investment income | | 0.48 | (a) | | 1.72 | | | 1.81 | | | 1.56 | | | 1.82 | | | 2.09 | (a) |
Portfolio turnover | | 30 | | | 88 | | | 68 | | | 66 | | | 85 | | | 79 | |
Net assets at end of period
(000 omitted) | | $471,453 | | | $476,076 | | | $148,343 | | | $178,238 | | | $109,993 | | | $53 | |
See Notes to Financial Statements
23
Financial Highlights – continued
| | | | | | | | | | | | | | | | | | |
| | | Six months
ended
2/28/10 (unaudited) | | | Years ended 8/31 | |
| Class 529A | | | 2009 | | | 2008 | | | 2007 | | | 2006 | | | 2005 | |
| | | | | | | | | | | | | | | | | |
Net asset value, beginning
of period | | $12.88 | | | $15.96 | | | $20.34 | | | $19.27 | | | $16.53 | | | $14.18 | |
Income (loss) from
investment operations | | | | | | | | | | | | | | | | | | |
Net investment income (d) | | $0.01 | | | $0.21 | | | $0.26 | | | $0.20 | | | $0.16 | | | $0.10 | |
Net realized and
unrealized gain (loss)
on investments and
foreign currency | | 0.33 | | | (2.89 | ) | | (2.42 | ) | | 3.01 | | | 4.04 | | | 3.01 | |
Total from investment
operations | | $0.34 | | | $(2.68 | ) | | $(2.16 | ) | | $3.21 | | | $4.20 | | | $3.11 | |
Less distributions declared
to shareholders | | | | | | | | | | | | | | | | | | |
From net investment
income | | $(0.18 | ) | | $(0.19 | ) | | $(0.23 | ) | | $(0.20 | ) | | $(0.10 | ) | | $(0.08 | ) |
From net realized gain on investments | | — | | | (0.21 | ) | | (1.99 | ) | | (1.94 | ) | | (1.36 | ) | | (0.68 | ) |
Total distributions declared
to shareholders | | $(0.18 | ) | | $(0.40 | ) | | $(2.22 | ) | | $(2.14 | ) | | $(1.46 | ) | | $(0.76 | ) |
Net asset value, end of
period | | $13.04 | | | $12.88 | | | $15.96 | | | $20.34 | | | $19.27 | | | $16.53 | |
Total return (%) (r)(s)(t) | | 2.59 | (n) | | (16.32 | ) | | (12.60 | ) | | 17.51 | | | 26.86 | | | 22.35 | |
Ratios (%) (to average net
assets) and Supplemental
data: | | | | | | | | | | | | | | | | | | |
Expenses before expense
reductions (f) | | 1.32 | (a) | | 1.45 | | | 1.51 | | | 1.59 | | | 1.68 | | | 1.76 | |
Expenses after expense
reductions (f) | | 1.32 | (a) | | 1.45 | | | 1.51 | | | 1.59 | | | 1.68 | | | 1.79 | (e) |
Net investment income | | 0.12 | (a) | | 1.90 | | | 1.40 | | | 1.01 | | | 0.88 | | | 0.65 | |
Portfolio turnover | | 30 | | | 88 | | | 68 | | | 66 | | | 85 | | | 79 | |
Net assets at end of period
(000 omitted) | | $1,537 | | | $1,451 | | | $2,017 | | | $2,060 | | | $1,552 | | | $760 | |
See Notes to Financial Statements
24
Financial Highlights – continued
| | | | | | | | | | | | | | | | | | |
| | | Six months
ended
2/28/10
(unaudited) | | | Years ended 8/31 | |
| Class 529B | | | 2009 | | | 2008 | | | 2007 | | | 2006 | | | 2005 | |
| | | | | | | | | | | | | | | | | |
Net asset value, beginning
of period | | $12.11 | | | $15.05 | | | $19.31 | | | $18.43 | | | $15.88 | | | $13.68 | |
Income (loss) from
investment operations | | | | | | | | | | | | | | | | | | |
Net investment income
(loss) (d) | | $(0.04 | ) | | $0.12 | | | $0.15 | | | $0.08 | | | $0.03 | | | $(0.02 | ) |
Net realized and
unrealized gain (loss)
on investments and
foreign currency | | 0.32 | | | (2.74 | ) | | (2.30 | ) | | 2.86 | | | 3.89 | | | 2.91 | |
Total from investment
operations | | $0.28 | | | $(2.62 | ) | | $(2.15 | ) | | $2.94 | | | $3.92 | | | $2.89 | |
Less distributions declared
to shareholders | | | | | | | | | | | | | | | | | | |
From net investment
income | | $(0.11 | ) | | $(0.11 | ) | | $(0.12 | ) | | $(0.12 | ) | | $(0.01 | ) | | $(0.01 | ) |
From net realized gain on
investments | | — | | | (0.21 | ) | | (1.99 | ) | | (1.94 | ) | | (1.36 | ) | | (0.68 | ) |
Total distributions declared
to shareholders | | $(0.11 | ) | | $(0.32 | ) | | $(2.11 | ) | | $(2.06 | ) | | $(1.37 | ) | | $(0.69 | ) |
Net asset value, end of
period | | $12.28 | | | $12.11 | | | $15.05 | | | $19.31 | | | $18.43 | | | $15.88 | |
Total return (%) (r)(s)(t) | | 2.28 | (n) | | (16.99 | ) | | (13.16 | ) | | 16.78 | | | 26.06 | | | 21.54 | |
Ratios (%) (to average net
assets) and Supplemental
data: | | | | | | | | | | | | | | | | | | |
Expenses before expense
reductions (f) | | 2.07 | (a) | | 2.15 | | | 2.16 | | | 2.24 | | | 2.33 | | | 2.42 | |
Expenses after expense
reductions (f) | | 2.07 | (a) | | 2.15 | | | 2.16 | | | 2.24 | | | 2.33 | | | 2.45 | (e) |
Net investment income (loss) | | (0.63 | )(a) | | 1.19 | | | 0.83 | | | 0.42 | | | 0.15 | | | (0.13 | ) |
Portfolio turnover | | 30 | | | 88 | | | 68 | | | 66 | | | 85 | | | 79 | |
Net assets at end of period
(000 omitted) | | $472 | | | $449 | | | $616 | | | $581 | | | $356 | | | $174 | |
See Notes to Financial Statements
25
Financial Highlights – continued
| | | | | | | | | | | | | | | | | | |
| | | Six months
ended
2/28/10 (unaudited) | | | Years ended 8/31 | |
| Class 529C | | | 2009 | | | 2008 | | | 2007 | | | 2006 | | | 2005 | |
| | | | | | | | | | | | | | | | | |
Net asset value, beginning
of period | | $12.12 | | | $15.06 | | | $19.31 | | | $18.40 | | | $15.86 | | | $13.66 | |
Income (loss) from
investment operations | | | | | | | | | | | | | | | | | | |
Net investment income
(loss) (d) | | $(0.04 | ) | | $0.13 | | | $0.13 | | | $0.08 | | | $0.03 | | | $(0.01 | ) |
Net realized and
unrealized gain (loss)
on investments and
foreign currency | | 0.31 | | | (2.75 | ) | | (2.28 | ) | | 2.86 | | | 3.87 | | | 2.90 | |
Total from investment
operations | | $0.27 | | | $(2.62 | ) | | $(2.15 | ) | | $2.94 | | | $3.90 | | | $2.89 | |
Less distributions declared
to shareholders | | | | | | | | | | | | | | | | | | |
From net investment
income | | $(0.11 | ) | | $(0.11 | ) | | $(0.11 | ) | | $(0.09 | ) | | $(0.00 | )(w) | | $(0.01 | ) |
From net realized gain on
investments | | — | | | (0.21 | ) | | (1.99 | ) | | (1.94 | ) | | (1.36 | ) | | (0.68 | ) |
Total distributions declared
to shareholders | | $(0.11 | ) | | $(0.32 | ) | | $(2.10 | ) | | $(2.03 | ) | | $(1.36 | ) | | $(0.69 | ) |
Net asset value, end of
period | | $12.28 | | | $12.12 | | | $15.06 | | | $19.31 | | | $18.40 | | | $15.86 | |
Total return (%) (r)(s)(t) | | 2.22 | (n) | | (16.98 | ) | | (13.16 | ) | | 16.79 | | | 25.98 | | | 21.53 | |
Ratios (%) (to average net
assets) and Supplemental
data: | | | | | | | | | | | | | | | | | | |
Expenses before expense
reductions (f) | | 2.07 | (a) | | 2.15 | | | 2.16 | | | 2.24 | | | 2.33 | | | 2.42 | |
Expenses after expense
reductions (f) | | 2.07 | (a) | | 2.15 | | | 2.16 | | | 2.24 | | | 2.33 | | | 2.45 | (e) |
Net investment income (loss) | | (0.64 | )(a) | | 1.23 | | | 0.73 | | | 0.40 | | | 0.16 | | | (0.07 | ) |
Portfolio turnover | | 30 | | | 88 | | | 68 | | | 66 | | | 85 | | | 79 | |
Net assets at end of period
(000 omitted) | | $691 | | | $631 | | | $843 | | | $938 | | | $650 | | | $454 | |
See Notes to Financial Statements
26
Financial Highlights – continued
Any redemption fees charged by the fund during the 2005 fiscal year resulted in a per share impact of less than $0.01.
| (d) | Per share data is based on average shares outstanding. |
| (e) | Ratio includes a reimbursement fee for expenses borne by MFS in prior years under the then existing expense reimbursement agreement. |
| (f) | Ratios do not reflect reductions from fees paid indirectly, if applicable. |
| (g) | The per share amount varies from the net realized and unrealized gain/loss for the period because of the timing of sales of fund shares and the per share amount of realized and unrealized gains and losses at such time. |
| (i) | For the period from the class’ inception, April 1, 2005 (Classes R1, R3, and R4) and May 1, 2006 (Class W), through the stated period end. |
| (r) | Certain expenses have been reduced without which performance would have been lower. |
| (s) | From time to time the fund may receive proceeds from litigation settlements, without which performance would be lower. |
| (t) | Total returns do not include any applicable sales charges. |
| (w) | Per share amount was less than $0.01. |
See Notes to Financial Statements
27
NOTES TO FINANCIAL STATEMENTS
(unaudited)
| (1) | | Business and Organization |
MFS Research International Fund (the fund) is a series of MFS Series Trust I (the trust). The trust is organized as a Massachusetts business trust and is registered under the Investment Company Act of 1940, as amended, as an open-end management investment company.
| (2) | | Significant Accounting Policies |
General – The preparation of financial statements in conformity with U.S. generally accepted accounting principles requires management to make estimates and assumptions that affect the reported amounts of assets and liabilities, and disclosure of contingent assets and liabilities at the date of the financial statements and the reported amounts of revenues and expenses during the reporting period. Actual results could differ from those estimates. In the preparation of these financial statements, management has evaluated subsequent events occurring after the date of the fund’s Statement of Assets and Liabilities through the date that the financial statements were issued. The fund can invest in foreign securities, including securities of emerging market issuers. Investments in foreign securities are vulnerable to the effects of changes in the relative values of the local currency and the U.S. dollar and to the effects of changes in each country’s legal, political, and economic environment. The markets of emerging markets countries are generally more volatile than the markets of developed countries with more mature economies. All of the risks of investing in foreign securities previously described are heightened when investing in emerging markets countries.
Investment Valuations – Equity securities, including restricted equity securities, are generally valued at the last sale or official closing price as provided by a third-party pricing service on the market or exchange on which they are primarily traded. Equity securities, for which there were no sales reported that day, are generally valued at the last quoted daily bid quotation as provided by a third-party pricing service on the market or exchange on which such securities are primarily traded. Equity securities held short, for which there were no sales reported for that day, are generally valued at the last quoted daily ask quotation as provided by a third-party pricing service on the market or exchange on which such securities are primarily traded. Short-term instruments with a maturity at issuance of 60 days or less generally are valued at amortized cost, which approximates market value. Open-end investment companies are generally valued at net asset value per share. Securities and other assets generally valued on the basis of information from a third-party pricing service may also be valued at a broker/dealer bid quotation. Values obtained from third-party pricing services can utilize both transaction data and
28
Notes to Financial Statements (unaudited) – continued
market information such as yield, quality, coupon rate, maturity, type of issue, trading characteristics, and other market data. The values of foreign securities and other assets and liabilities expressed in foreign currencies are converted to U.S. dollars using the mean of bid and asked prices for rates provided by a third-party pricing service.
The Board of Trustees has delegated primary responsibility for determining or causing to be determined the value of the fund’s investments (including any fair valuation) to the adviser pursuant to valuation policies and procedures approved by the Board. If the adviser determines that reliable market quotations are not readily available, investments are valued at fair value as determined in good faith by the adviser in accordance with such procedures under the oversight of the Board of Trustees. Under the fund’s valuation policies and procedures, market quotations are not considered to be readily available for most types of debt instruments and floating rate loans and many types of derivatives. These investments are generally valued at fair value based on information from third-party pricing services. In addition, investments may be valued at fair value if the adviser determines that an investment’s value has been materially affected by events occurring after the close of the exchange or market on which the investment is principally traded (such as foreign exchange or market) and prior to the determination of the fund’s net asset value, or after the halting of trading of a specific security where trading does not resume prior to the close of the exchange or market on which the security is principally traded. Events that occur on a frequent basis after foreign markets close (such as developments in foreign markets and significant movements in the U.S. markets) and prior to the determination of the fund’s net asset value may be deemed to have a material effect on the value of securities traded in foreign markets. Accordingly, the fund’s foreign equity securities may often be valued at fair value. The adviser generally relies on third-party pricing services or other information (such as the correlation with price movements of similar securities in the same or other markets; the type, cost and investment characteristics of the security; the business and financial condition of the issuer; and trading and other market data) to assist in determining whether to fair value and at what value to fair value an investment. The value of an investment for purposes of calculating the fund’s net asset value can differ depending on the source and method used to determine value. When fair valuation is used, the value of an investment used to determine the fund’s net asset value may differ from quoted or published prices for the same investment. There can be no assurance that the fund could obtain the fair value assigned to an investment if it were to sell the investment at the same time at which the fund determines its net asset value per share.
29
Notes to Financial Statements (unaudited) – continued
Various inputs are used in determining the value of the fund’s assets or liabilities. These inputs are categorized into three broad levels. In certain cases, the inputs used to measure fair value may fall into different levels of the fair value hierarchy. In such cases, an investment’s level within the fair value hierarchy is based on the lowest level of input that is significant to the fair value measurement. The fund’s assessment of the significance of a particular input to the fair value measurement in its entirety requires judgment, and considers factors specific to the investment. Level 1 includes unadjusted quoted prices in active markets for identical assets or liabilities. Level 2 includes other significant observable market-based inputs (including quoted prices for similar securities, interest rates, prepayment speed, and credit risk). Level 3 includes unobservable inputs, which may include the adviser’s own assumptions in determining the fair value of investments. Other financial instruments are derivative instruments not reflected in total investments, such as futures, forwards, swap contracts, and written options. The following is a summary of the levels used as of February 28, 2010 in valuing the fund’s assets or liabilities:
| | | | | | | | |
| Investments at Value | | Level 1 | | Level 2 | | Level 3 | | Total |
| Equity Securities | | $3,999,626,842 | | $— | | $— | | $3,999,626,842 |
| Mutual Funds | | 50,205,162 | | — | | — | | 50,205,162 |
| Total Investments | | $4,049,832,004 | | $— | | $— | | $4,049,832,004 |
For further information regarding security characteristics, see the Portfolio of Investments.
In January 2010, Accounting Standards Update (ASU) No. 2010-06, Improving Disclosures about Fair Value Measurements (the “Update”) was issued, and is effective for interim and annual reporting periods beginning after December 15, 2009. This Update provides for expanded disclosures about fair value measurements. Management has evaluated the application of the Update to the fund, and believes the impact is limited to expanded disclosures resulting from the adoption of this Update in the fund’s financial statements.
Foreign Currency Translation – Purchases and sales of foreign investments, income, and expenses are converted into U.S. dollars based upon currency exchange rates prevailing on the respective dates of such transactions or on the reporting date for foreign denominated receivables and payables. Gains and losses attributable to foreign currency exchange rates on sales of securities are recorded for financial statement purposes as net realized gains and losses on investments. Gains and losses attributable to foreign exchange rate movements on receivables, payables, income and expenses are recorded for financial statement purposes as foreign currency transaction gains and losses. That portion of both realized and unrealized gains and losses on investments that results from fluctuations in foreign currency exchange rates is not separately disclosed.
30
Notes to Financial Statements (unaudited) – continued
Derivatives – The fund may use derivatives for different purposes, including to earn income and enhance returns, to increase or decrease exposure to a particular market, to manage or adjust the risk profile of the fund, or as alternatives to direct investments. Derivatives may be used for hedging or non-hedging purposes. While hedging can reduce or eliminate losses, it can also reduce or eliminate gains. When the fund uses derivatives as an investment to increase market exposure, or for hedging purposes, gains and losses from derivative instruments may be substantially greater than the derivative’s original cost.
Derivative instruments include written options, purchased options, futures contracts, forward foreign currency exchange contracts, and swap agreements. For the six months ended February 28, 2010, the fund did not invest in any derivative instruments.
Security Loans – State Street Bank and Trust Company (“State Street”), as lending agent, may loan the securities of the fund to certain qualified institutions (the “Borrowers”) approved by the fund. The loans are collateralized by cash and/or U.S. Treasury and federal agency obligations in an amount typically at least equal to the market value of the securities loaned. The market value of the loaned securities is determined at the close of business of the fund and any additional required collateral is delivered to the fund on the next business day. State Street provides the fund with indemnification against Borrower default. The fund bears the risk of loss with respect to the investment of cash collateral. On loans collateralized by cash, the cash collateral is invested in a money market fund or short-term securities. A portion of the income generated upon investment of the collateral is remitted to the Borrowers, and the remainder is allocated between the fund and the lending agent. On loans collateralized by U.S. Treasury and/or federal agency obligations, a fee is received from the Borrower, and is allocated between the fund and the lending agent. Income from securities lending is included in interest income on the Statement of Operations. The dividend and interest income earned on the securities loaned is accounted for in the same manner as other dividend and interest income.
Indemnifications – Under the fund’s organizational documents, its officers and Trustees may be indemnified against certain liabilities and expenses arising out of the performance of their duties to the fund. Additionally, in the normal course of business, the fund enters into agreements with service providers that may contain indemnification clauses. The fund’s maximum exposure under these agreements is unknown as this would involve future claims that may be made against the fund that have not yet occurred.
Investment Transactions and Income – Investment transactions are recorded on the trade date. Interest income is recorded on the accrual basis. All
31
Notes to Financial Statements (unaudited) – continued
premium and discount is amortized or accreted for financial statement purposes in accordance with U.S. generally accepted accounting principles. Dividends received in cash are recorded on the ex-dividend date. Certain dividends from foreign securities will be recorded when the fund is informed of the dividend if such information is obtained subsequent to the ex-dividend date. Dividend and interest payments received in additional securities are recorded on the ex-dividend or ex-interest date in an amount equal to the value of the security on such date.
The fund may receive proceeds from litigation settlements. Any proceeds received from litigation involving portfolio holdings are reflected in the Statement of Operations in realized gain/loss if the security has been disposed of by the fund or in unrealized gain/loss if the security is still held by the fund. Any other proceeds from litigation not related to portfolio holdings are reflected as other income in the Statement of Operations.
Fees Paid Indirectly – The fund’s custody fee may be reduced according to an arrangement that measures the value of cash deposited with the custodian by the fund. This amount, for the six months ended February 28, 2010, is shown as a reduction of total expenses on the Statement of Operations.
Tax Matters and Distributions – The fund intends to qualify as a regulated investment company, as defined under Subchapter M of the Internal Revenue Code, and to distribute all of its taxable income, including realized capital gains. As a result, no provision for federal income tax is required. The fund’s federal tax returns for the prior three fiscal years remain subject to examination by the Internal Revenue Service. Foreign taxes, if any, have been accrued by the fund in the accompanying financial statements.
Distributions to shareholders are recorded on the ex-dividend date. Income and capital gain distributions are determined in accordance with income tax regulations, which may differ from U.S. generally accepted accounting principles. Certain capital accounts in the financial statements are periodically adjusted for permanent differences in order to reflect their tax character. These adjustments have no impact on net assets or net asset value per share. Temporary differences which arise from recognizing certain items of income, expense, gain or loss in different periods for financial statement and tax purposes will reverse at some time in the future. Distributions in excess of net investment income or net realized gains are temporary overdistributions for financial statement purposes resulting from differences in the recognition or classification of income or distributions for financial statement and tax purposes.
Book/tax differences primarily relate to wash sale loss deferrals, foreign currency transactions, and foreign taxes.
32
Notes to Financial Statements (unaudited) – continued
The tax character of distributions made during the current period will be determined at fiscal year end.
The tax character of distributions declared to shareholders for the last fiscal year is as follows:
| | |
| | | 8/31/09 |
| Ordinary income (including any short-term capital gains) | | $59,328,561 |
| Long-term capital gain | | 56,492,868 |
| Total distributions | | $115,821,429 |
The federal tax cost and the tax basis components of distributable earnings were as follows:
| | | |
| As of 2/28/10 | | | |
| Cost of investments | | $4,046,001,297 | |
| Gross appreciation | | 223,647,624 | |
| Gross depreciation | | (219,816,917 | ) |
| Net unrealized appreciation (depreciation) | | $3,830,707 | |
| |
| As of 8/31/09 | | | |
| Undistributed ordinary income | | 59,822,798 | |
| Capital loss carryforwards | | (297,223,831 | ) |
| Post-October capital loss deferral | | (933,411,699 | ) |
| Other temporary differences | | (687,911 | ) |
| Net unrealized appreciation (depreciation) | | 65,961,969 | |
The aggregate cost above includes prior fiscal year end tax adjustments.
As of August 31, 2009, the fund had capital loss carryforwards available to offset future realized gains. Such losses expire as follows:
Multiple Classes of Shares of Beneficial Interest – The fund offers multiple classes of shares, which differ in their respective distribution, service, and program manager fees. The fund’s income, realized and unrealized gain (loss), and common expenses are allocated to shareholders based on the daily net assets of each class. Dividends are declared separately for each class. Differences in per share dividend rates are generally due to differences in separate class expenses. Class B and Class 529B shares will convert to Class A and Class 529A shares, respectively, approximately eight years after purchase.
33
Notes to Financial Statements (unaudited) – continued
The fund’s distributions declared to shareholders as reported on the Statements of Changes in Net Assets are presented by class as follows:
| | | | | | | | |
| | | From net investment
income | | From net realized gain on
investments |
| | | Six months ended
2/28/10 | | Year ended
8/31/09 | | Six months ended
2/28/10 | | Year ended
8/31/09 |
| Class A | | $19,942,315 | | $18,819,220 | | $— | | $19,620,196 |
| Class B | | 354,170 | | 601,628 | | — | | 1,302,024 |
| Class C | | 1,018,291 | | 1,165,394 | | — | | 2,082,642 |
| Class I | | 26,352,391 | | 33,473,452 | | — | | 28,589,164 |
| Class W | | 418,964 | | 365,261 | | — | | 320,061 |
| Class R1 | | 60,073 | | 74,958 | | — | | 115,869 |
| Class R2 | | 904,011 | | 761,037 | | — | | 875,827 |
| Class R3 | | 2,141,334 | | 2,027,798 | | — | | 1,828,194 |
| Class R4 | | 8,605,096 | | 2,005,929 | | — | | 1,713,234 |
| Class 529A | | 20,502 | | 23,408 | | — | | 26,124 |
| Class 529B | | 4,205 | | 4,499 | | — | | 8,421 |
| Class 529C | | 6,176 | | 5,977 | | — | | 11,112 |
| Total | | $59,827,528 | | $59,328,561 | | $— | | $56,492,868 |
| (3) | | Transactions with Affiliates |
Investment Adviser – The fund has an investment advisory agreement with MFS to provide overall investment management and related administrative services and facilities to the fund.
The management fee is computed daily and paid monthly at the following annual rates:
| | | |
| First $1.0 billion of average daily net assets | | 0.90 | % |
| Next $1.0 billion of average daily net assets | | 0.80 | % |
| Average daily net assets in excess of $2.0 billion | | 0.70 | % |
The management fee incurred for the six months ended February 28, 2010 was equivalent to an annual effective rate of 0.78% of the fund’s average daily net assets.
The investment adviser has agreed in writing to pay a portion of the fund’s operating expenses, exclusive of management fee, distribution and service fee, program manager fees, interest, taxes, extraordinary expenses, brokerage and transaction costs and investment-related expenses, such that operating expenses do not exceed 0.40% annually of the fund’s average daily net assets. This written agreement will continue until modified by the fund’s Board of Trustees, but such agreement will continue at least until December 31, 2010. For the six months ended February 28, 2010, the fund’s actual operating expenses did not exceed the limit and therefore, the investment adviser did not pay any portion of the fund’s expenses.
34
Notes to Financial Statements (unaudited) – continued
Distributor – MFS Fund Distributors, Inc. (MFD), a wholly-owned subsidiary of MFS, as distributor, received $42,682 and $473 for the six months ended February 28, 2010, as its portion of the initial sales charge on sales of Class A and Class 529A shares of the fund, respectively.
The Board of Trustees has adopted a distribution plan for certain class shares pursuant to Rule 12b-1 of the Investment Company Act of 1940.
The fund’s distribution plan provides that the fund will pay MFD for services provided by MFD and financial intermediaries in connection with the distribution and servicing of certain share classes. One component of the plan is a distribution fee paid to MFD and another component of the plan is a service fee paid to MFD. MFD may subsequently pay all, or a portion, of the distribution and/or service fees to financial intermediaries.
Distribution Plan Fee Table:
| | | | | | | | | | |
| | | Distribution
Fee Rate (d) | | Service
Fee Rate (d) | | Total
Distribution
Plan (d) | | Annual
Effective
Rate (e) | | Distribution
and Service
Fee |
| Class A | | — | | 0.25% | | 0.25% | | 0.25% | | $1,741,574 |
| Class B | | 0.75% | | 0.25% | | 1.00% | | 1.00% | | 274,284 |
| Class C | | 0.75% | | 0.25% | | 1.00% | | 1.00% | | 574,433 |
| Class W | | 0.10% | | — | | 0.10% | | 0.10% | | 13,049 |
| Class R1 | | 0.75% | | 0.25% | | 1.00% | | 1.00% | | 32,708 |
| Class R2 | | 0.25% | | 0.25% | | 0.50% | | 0.50% | | 169,644 |
| Class R3 | | — | | 0.25% | | 0.25% | | 0.25% | | 173,982 |
| Class 529A | | — | | 0.25% | | 0.25% | | 0.25% | | 1,923 |
| Class 529B | | 0.75% | | 0.25% | | 1.00% | | 1.00% | | 2,401 |
| Class 529C | | 0.75% | | 0.25% | | 1.00% | | 1.00% | | 3,433 |
| Total Distribution and Service Fees | | | | | | $2,987,431 |
| (d) | As of February 28, 2010, in accordance with the distribution plan for certain classes, the fund pays distribution and/or service fees equal to these annual percentage rates of each class’ average daily net assets. The distribution and service fee rates disclosed by class represent the current rates in effect at the end of the reporting period. Any rate changes, if applicable, are detailed below. |
| (e) | The annual effective rates represent actual fees incurred under the distribution plan for the six months ended February 28, 2010 based on each class’ average daily net assets. |
Certain Class A shares purchased on or subsequent to September 1, 2008 are subject to a CDSC in the event of a shareholder redemption within 24 months of purchase. Class C and Class 529C shares are subject to a CDSC in the event of a shareholder redemption within 12 months of purchase. Class B and Class 529B shares are subject to a CDSC in the event of a shareholder redemption within six years of purchase.
35
Notes to Financial Statements (unaudited) – continued
All contingent deferred sales charges are paid to MFD and during the six months ended February 28, 2010, were as follows:
| | |
| | | Amount |
| Class A | | $4,420 |
| Class B | | 36,221 |
| Class C | | 4,712 |
| Class 529B | | — |
| Class 529C | | — |
The fund has entered into and may from time to time enter into contracts with program managers and other parties which administer the tuition programs through which an investment in the fund’s 529 share classes is made. The fund has entered into an agreement with MFD pursuant to which MFD receives an annual fee of up to 0.10% of the average daily net assets attributable to each 529 share class. The services provided by MFD, or a third party with which MFD contracts, include recordkeeping and tax reporting and account services, as well as services designed to maintain the program’s compliance with the Internal Revenue Code and other regulatory requirements. Program manager fees for the six months ended February 28, 2010, were as follows:
| | |
| | | Amount |
| Class 529A | | $769 |
| Class 529B | | 240 |
| Class 529C | | 344 |
| Total Program Manager Fees | | $1,353 |
Shareholder Servicing Agent – MFS Service Center, Inc. (MFSC), a wholly-owned subsidiary of MFS, receives a fee from the fund for its services as shareholder servicing agent calculated as a percentage of the average daily net assets of the fund as determined periodically under the supervision of the fund’s Board of Trustees. For the six months ended February 28, 2010, the fee was $299,356, which equated to 0.0152% annually of the fund’s average daily net assets. MFSC also receives payment from the fund for out-of-pocket expenses, sub-accounting and other shareholder servicing costs which may be paid to affiliated and unaffiliated service providers. For the six months ended February 28, 2010, these out-of-pocket expenses, sub-accounting and other shareholder servicing costs amounted to $1,351,295.
Under a Special Servicing Agreement among MFS, each MFS fund which invests in other MFS funds (“MFS fund-of-funds”) and certain underlying funds in which a MFS fund-of-funds invests (“underlying funds”), each underlying fund may pay a portion of each MFS fund-of-fund’s transfer agent-related expenses, including sub-accounting fees payable to financial intermediaries, to the extent such payments do not exceed the benefits realized or expected to be realized by the underlying fund from the investment in the
36
Notes to Financial Statements (unaudited) – continued
underlying fund by the MFS fund-of-fund. For the six months ended February 28, 2010, these costs for the fund amounted to $655,148 and are reflected in the shareholder servicing costs on the Statement of Operations.
Administrator – MFS provides certain financial, legal, shareholder communications, compliance, and other administrative services to the fund. Under an administrative services agreement, the fund partially reimburses MFS the costs incurred to provide these services. The fund is charged an annual fixed amount of $17,500 plus a fee based on average daily net assets. The administrative services fee incurred for the six months ended February 28, 2010 was equivalent to an annual effective rate of 0.0151% of the fund’s average daily net assets.
Trustees’ and Officers’ Compensation – The fund pays compensation to independent Trustees in the form of a retainer, attendance fees, and additional compensation to Board and Committee chairpersons. The fund does not pay compensation directly to Trustees or officers of the fund who are also officers of the investment adviser, all of whom receive remuneration for their services to the fund from MFS. Certain officers and Trustees of the fund are officers or directors of MFS, MFD, and MFSC.
Prior to December 31, 2001, the fund had an unfunded defined benefit plan (“DB plan”) for independent Trustees. As of December 31, 2001, the Board took action to terminate the DB plan with respect to then-current and any future independent Trustees, such that the DB Plan covers only certain of those former independent Trustees who retired on or before December 31, 2001. Effective January 1, 2002, accrued benefits under the DB Plan for then – current independent Trustees who continued were credited to an unfunded retirement deferral plan (the “Retirement Deferral plan”), which was established for and exists solely with respect to these credited amounts, and is not available for other deferrals by these or other independent Trustees. Although the Retirement Deferral plan is unfunded, amounts deferred under the plan are periodically adjusted for investment experience as if they had been invested in shares of the fund. The DB Plan resulted in a pension expense of $253 and the Retirement Deferral plan resulted in an expense of $1,396. Both amounts are included in independent Trustees’ compensation for the six months ended February 28, 2010. The liability for deferred retirement benefits payable to certain independent Trustees under both Plans amounted to $24,112 at February 28, 2010, and is included in payable for independent Trustees’ compensation on the Statement of Assets and Liabilities.
Other – This fund and certain other funds managed by MFS (the funds) have entered into services agreements (the Agreements) which provide for payment of fees by the funds to Tarantino LLC and Griffin Compliance LLC in return for the provision of services of an Independent Chief Compliance Officer (ICCO)
37
Notes to Financial Statements (unaudited) – continued
and Assistant ICCO, respectively, for the funds. The ICCO and Assistant ICCO are officers of the funds and the sole members of Tarantino LLC and Griffin Compliance LLC, respectively. The funds can terminate the Agreements with Tarantino LLC and Griffin Compliance LLC at any time under the terms of the Agreements. For the six months ended February 28, 2010, the aggregate fees paid by the fund to Tarantino LLC and Griffin Compliance LLC were $23,465 and are included in miscellaneous expense on the Statement of Operations. MFS has agreed to reimburse the fund for a portion of the payments made by the fund in the amount of $7,882, which is shown as a reduction of total expenses in the Statement of Operations. Additionally, MFS has agreed to bear all expenses associated with office space, other administrative support, and supplies provided to the ICCO and Assistant ICCO.
The fund may invest in the MFS Institutional Money Market Portfolio which is managed by MFS and seeks a high level of current income consistent with preservation of capital and liquidity. Income earned on this investment is included in dividends from underlying funds on the Statement of Operations. This money market fund does not pay a management fee to MFS.
Purchases and sales of investments, other than U.S. Government securities, purchased option transactions, and short-term obligations, aggregated $1,563,245,511 and $1,168,599,779, respectively.
| (5) | | Shares of Beneficial Interest |
The fund’s Declaration of Trust permits the Trustees to issue an unlimited number of full and fractional shares of beneficial interest. Transactions in fund shares were as follows:
| | | | | | | | |
| | | Six months ended
2/28/10 | | Year ended
8/31/09 |
| | | Shares | | Amount | | Shares | | Amount |
| Shares sold | | | | | | | | |
Class A | | 24,749,482 | | $340,184,869 | | 57,089,748 | | $651,028,968 |
Class B | | 215,699 | | 2,834,481 | | 606,117 | | 6,433,584 |
Class C | | 951,765 | | 12,385,306 | | 1,761,317 | | 18,200,415 |
Class I | | 26,812,446 | | 379,510,326 | | 43,002,783 | | 492,844,984 |
Class W | | 393,410 | | 5,412,256 | | 1,940,854 | | 20,748,533 |
Class R1 | | 82,872 | | 1,042,761 | | 192,747 | | 1,966,129 |
Class R2 | | 1,355,503 | | 18,112,101 | | 2,226,873 | | 23,864,850 |
Class R3 | | 1,634,267 | | 22,476,102 | | 9,161,620 | | 101,894,308 |
Class R4 | | 4,091,521 | | 56,665,377 | | 31,977,909 | | 368,441,033 |
Class 529A | | 10,021 | | 134,468 | | 22,059 | | 238,803 |
Class 529B | | 1,580 | | 20,220 | | 3,547 | | 38,043 |
Class 529C | | 4,966 | | 62,736 | | 12,320 | | 121,927 |
| | 60,303,532 | | $838,841,003 | | 147,997,894 | | $1,685,821,577 |
38
Notes to Financial Statements (unaudited) – continued
| | | | | | | | | | | | |
| | | Six months ended
2/28/10 | | | Year ended
8/31/09 | |
| | | Shares | | | Amount | | | Shares | | | Amount | |
| Shares issued to shareholders in reinvestment of distributions | | | | | | | | | | | | |
Class A | | 1,187,502 | | | $16,435,016 | | | 2,339,975 | | | $25,599,320 | |
Class B | | 22,086 | | | 292,192 | | | 152,830 | | | 1,598,607 | |
Class C | | 44,853 | | | 586,676 | | | 185,169 | | | 1,918,356 | |
Class I | | 1,329,042 | | | 18,952,132 | | | 4,852,081 | | | 54,634,430 | |
Class W | | 27,928 | | | 385,126 | | | 54,152 | | | 590,258 | |
Class R1 | | 4,457 | | | 57,449 | | | 17,083 | | | 174,419 | |
Class R2 | | 56,616 | | | 763,746 | | | 127,339 | | | 1,359,979 | |
Class R3 | | 155,597 | | | 2,134,798 | | | 355,391 | | | 3,855,992 | |
Class R4 | | 619,267 | | | 8,570,656 | | | 339,960 | | | 3,719,163 | |
Class 529A | | 1,498 | | | 20,502 | | | 4,578 | | | 49,532 | |
Class 529B | | 326 | | | 4,205 | | | 1,263 | | | 12,920 | |
Class 529C | | 478 | | | 6,176 | | | 1,669 | | | 17,089 | |
| | 3,449,650 | | | $48,208,674 | | | 8,431,490 | | | $93,530,065 | |
| Shares reacquired | | | | | | | | | | | | |
Class A | | (12,919,714 | ) | | $(176,649,885 | ) | | (63,995,315 | ) | | $(690,563,452 | ) |
Class B | | (838,222 | ) | | (11,071,051 | ) | | (3,502,910 | ) | | (36,143,427 | ) |
Class C | | (971,964 | ) | | (12,605,391 | ) | | (4,029,911 | ) | | (41,401,443 | ) |
Class I | | (6,675,260 | ) | | (94,609,752 | ) | | (69,594,402 | ) | | (733,568,181 | ) |
Class W | | (217,365 | ) | | (3,000,342 | ) | | (1,212,941 | ) | | (12,778,436 | ) |
Class R1 | | (83,229 | ) | | (1,060,010 | ) | | (281,811 | ) | | (2,885,069 | ) |
Class R2 | | (662,282 | ) | | (8,947,292 | ) | | (3,702,118 | ) | | (46,414,385 | ) |
Class R3 | | (2,062,252 | ) | | (28,265,755 | ) | | (3,047,997 | ) | | (32,042,160 | ) |
Class R4 | | (5,463,753 | ) | | (76,650,113 | ) | | (5,002,416 | ) | | (55,566,180 | ) |
Class 529A | | (6,330 | ) | | (85,821 | ) | | (40,306 | ) | | (422,830 | ) |
Class 529B | | (530 | ) | | (6,870 | ) | | (8,701 | ) | | (80,772 | ) |
Class 529C | | (1,224 | ) | | (15,866 | ) | | (17,943 | ) | | (171,533 | ) |
| | (29,902,125 | ) | | $(412,968,148 | ) | | (154,436,771 | ) | | $(1,652,037,868 | ) |
| Net change | | | | | | | | | | | | |
Class A | | 13,017,270 | | | $179,970,000 | | | (4,565,592 | ) | | $(13,935,164 | ) |
Class B | | (600,437 | ) | | (7,944,378 | ) | | (2,743,963 | ) | | (28,111,236 | ) |
Class C | | 24,654 | | | 366,591 | | | (2,083,425 | ) | | (21,282,672 | ) |
Class I | | 21,466,228 | | | 303,852,706 | | | (21,739,538 | ) | | (186,088,767 | ) |
Class W | | 203,973 | | | 2,797,040 | | | 782,065 | | | 8,560,355 | |
Class R1 | | 4,100 | | | 40,200 | | | (71,981 | ) | | (744,521 | ) |
Class R2 | | 749,837 | | | 9,928,555 | | | (1,347,906 | ) | | (21,189,556 | ) |
Class R3 | | (272,388 | ) | | (3,654,855 | ) | | 6,469,014 | | | 73,708,140 | |
Class R4 | | (752,965 | ) | | (11,414,080 | ) | | 27,315,453 | | | 316,594,016 | |
Class 529A | | 5,189 | | | 69,149 | | | (13,669 | ) | | (134,495 | ) |
Class 529B | | 1,376 | | | 17,555 | | | (3,891 | ) | | (29,809 | ) |
Class 529C | | 4,220 | | | 53,046 | | | (3,954 | ) | | (32,517 | ) |
| | 33,851,057 | | | $474,081,529 | | | 1,992,613 | | | $127,313,774 | |
39
Notes to Financial Statements (unaudited) – continued
The fund is one of several mutual funds in which the MFS funds-of-funds may invest. The MFS funds-of-funds do not invest in the underlying MFS funds for the purpose of exercising management or control. At the end of the period, the MFS International Diversification Fund, MFS Growth Allocation Fund, MFS Moderate Allocation Fund, and MFS Aggressive Growth Allocation Fund were the owners of record of approximately 16%, 4%, 3%, and 2%, respectively, of the value of outstanding voting shares of the fund. In addition, the MFS Conservative Allocation Fund, MFS Lifetime 2010 Fund, MFS Lifetime 2020 Fund, MFS Lifetime 2030 Fund, MFS Lifetime 2040 Fund, and MFS Lifetime Retirement Income Fund were each the owners of record of less than 1% of the value of outstanding voting shares of the fund.
The fund and certain other funds managed by MFS participate in a $1.1 billion unsecured committed line of credit, subject to a $1 billion sublimit, provided by a syndication of banks under a credit agreement. Borrowings may be made for temporary financing needs. Interest is charged to each fund, based on its borrowings, generally at a rate equal to the higher of the Federal Reserve funds rate or one month LIBOR plus an agreed upon spread. A commitment fee, based on the average daily, unused portion of the committed line of credit, is allocated among the participating funds at the end of each calendar quarter. In addition, the fund and other funds managed by MFS have established unsecured uncommitted borrowing arrangements with certain banks for temporary financing needs. Interest is charged to each fund, based on its borrowings, at a rate equal to the Federal Reserve funds rate plus an agreed upon spread. For the six months ended February 28, 2010, the fund’s commitment fee and interest expense were $26,848 and $0, respectively, and are included in miscellaneous expense on the Statement of Operations.
| (7) | | Transactions in Underlying Funds-Affiliated Issuers |
An affiliated issuer may be considered one in which the fund owns 5% or more of the outstanding voting securities, or a company which is under common control. For the purposes of this report, the fund assumes the following to be affiliated issuers:
| | | | | | | | | |
| Underlying Funds | | Beginning
Shares/Par
Amount | | Acquisitions
Shares/Par
Amount | | Dispositions
Shares/Par
Amount | | | Ending
Shares/Par
Amount |
MFS Institutional Money
Market Portfolio | | 101,861,738 | | 521,772,345 | | (573,428,921 | ) | | 50,205,162 |
| | | | |
| Underlying Funds | | Realized
Gain (Loss) | | Capital Gain
Distributions | | Dividend
Income | | | Ending
Value |
MFS Institutional Money
Market Portfolio | | $— | | $— | | $35,432 | | | $50,205,162 |
40
RESULTS OF SHAREHOLDER MEETING
(unaudited)
At a special meeting of shareholders of MFS Series Trust I, which was held on January 28, 2010, the following actions were taken:
Item 1. To elect the following individuals as Trustees:
| | | | |
| | | Number of Dollars |
Nominee | | For | | Withheld Authority |
| Robert E. Butler | | 13,799,428,259.131 | | 298,698,895.701 |
| Lawrence H. Cohn | | 13,775,964,000.646 | | 322,163,154.185 |
| Maureen R. Goldfarb | | 13,797,667,920.487 | | 300,459,234.345 |
| David H. Gunning | | 13,795,139,579.854 | | 302,987,574.978 |
| William R. Gutow | | 13,798,125,706.624 | | 300,001,448.207 |
| Michael Hegarty | | 13,780,926,681.791 | | 317,200,473.041 |
| John P. Kavanaugh | | 13,799,879,923.291 | | 298,247,231.541 |
| Robert J. Manning | | 13,802,393,104.041 | | 295,734,050.791 |
| Robert C. Pozen | | 13,802,480,679.754 | | 295,646,475.078 |
| J. Dale Sherratt | | 13,779,899,981.473 | | 318,227,173.359 |
| Laurie J. Thomsen | | 13,797,678,786.081 | | 300,448,368.750 |
| Robert W. Uek | | 13,798,504,506.307 | | 299,622,648.525 |
41
BOARD REVIEW OF INVESTMENT ADVISORY AGREEMENT
A discussion regarding the Board’s most recent review and renewal of the fund’s Investment Advisory Agreement with MFS is available by clicking on the fund’s name under “Mutual Funds” in the “Products and Performance” section of the MFS Web site (mfs.com).
PROXY VOTING POLICIES AND INFORMATION
A general description of the MFS funds’ proxy voting policies and procedures is available without charge, upon request, by calling
1-800-225-2606, by visiting the Proxy Voting section of mfs.com or by visiting the SEC’s Web site at http://www.sec.gov.
Information regarding how the fund voted proxies relating to portfolio securities during the most recent twelve-month period ended June 30 is available without charge by visiting the Proxy Voting section of mfs.com or by visiting the SEC’s Web site at http://www.sec.gov.
QUARTERLY PORTFOLIO DISCLOSURE
The fund will file a complete schedule of portfolio holdings with the Securities and Exchange Commission (the Commission) for the first and third quarters of each fiscal year on Form N-Q. The fund’s Form N-Q may be reviewed and copied at the:
Public Reference Room
Securities and Exchange Commission
100 F Street, NE, Room 1580
Washington, D.C. 20549
Information on the operation of the Public Reference Room may be obtained by calling the Commission at 1-800-SEC-0330. The fund’s Form N-Q is available on the EDGAR database on the Commission’s Internet Web site at http://www.sec.gov, and copies of this information may be obtained, upon payment of a duplicating fee, by electronic request at the following e-mail address: publicinfo@sec.gov or by writing the Public Reference Section at the above address.
A shareholder can also obtain the quarterly portfolio holdings report at mfs.com.
FURTHER INFORMATION
From time to time, MFS may post important information about the fund or the MFS funds on the MFS web site (mfs.com). This information is available by visiting the “News & Commentary” section of mfs.com or by clicking on the fund’s name under “Mutual Funds” in the “Products and Performance” section of mfs.com.
42
CONTACT US
Web site
mfs.com
MFS TALK
1-800-637-8255
24 hours a day
Account service and literature
Shareholders
1-800-225-2606
Investment professionals
1-800-343-2829
Retirement plan services
1-800-637-1255
Mailing address
MFS Service Center, Inc.
P.O. Box 55824
Boston, MA 02205-5824
Overnight mail
MFS Service Center, Inc.
c/o Boston Financial Data Services
30 Dan Road
Canton, MA 02021-2809

Save paper with eDelivery. MFS® will send you prospectuses, reports, and proxies directly via e-mail so you will get information faster with less mailbox clutter. To sign up: 1. go to mfs.com. 2. log in via MFS® Access. 3. select eDelivery. If you own your MFS fund shares through a financial institution or a retirement plan, MFS® TALK, MFS Access, and eDelivery may not be available to you.


MFS® Technology Fund
The report is prepared for the general information of shareholders. It is authorized for distribution to prospective investors only when preceded or accompanied by a current prospectus.
NOT FDIC INSURED Ÿ MAY LOSE VALUE Ÿ
NO BANK GUARANTEE
2/28/10
SCT-SEM

LETTER FROM THE CEO
Dear Shareholders:
After having suffered their biggest declines since the Great Depression, most global markets experienced an impressive resurgence during the latter months of 2009 and the first quarter of 2010. The global economy was able to reap the benefits of two major trends. The first of these was the massive efforts of governments and central banks to increase liquidity in the financial system as they sought to prevent the credit crisis from further affecting the banking system. The second was the move by companies around the world to cut costs and operations to prepare for rapidly changing market conditions. We believe that these moves not only shortened the length of the downturn but also set the stage for the recovery we are seeing today.
Even with the significant market gains of 2009 and the early part of 2010, the recovery is unrolling at a moderate pace, with rebounds in the manufacturing sector and corporate America leading the way. Central bankers are proceeding with caution and have held benchmark interest rates unchanged as they debate the best way to withdraw stimulus measures without disrupting the fragile growth process.
While hurdles remain, we believe that the global economy is on the road to recovery. As always, we continue to be mindful of the many challenges faced at the individual, national, and international levels. It is at times such as these that we want to remind investors of the merits of maintaining a long-term view, adhering to basic investing principles such as asset allocation and diversification, and working closely with advisors to identify and research investment opportunities. At MFS®, we take particular pride in how well mutual funds can help investors by providing the diversification that is important in any type of market climate.
Respectfully,

Robert J. Manning
Chief Executive Officer and Chief Investment Officer
MFS Investment Management®
April 15, 2010
The opinions expressed in this letter are subject to change, may not be relied upon for investment advice, and no forecasts can be guaranteed.
1
PORTFOLIO COMPOSITION
Portfolio structure (i)
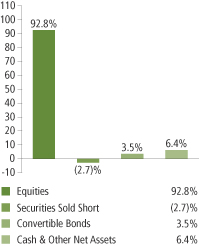
| | |
| Top ten holdings (i) | | |
| Samsung Electronics Co. Ltd., GDR | | 7.0% |
| Oracle Corp. | | 5.0% |
| Apple, Inc. | | 4.6% |
| Google, Inc., “A” | | 4.5% |
| Hewlett-Packard Co. | | 4.4% |
| Intel Corp. | | 4.0% |
| Cisco Systems, Inc. | | 3.6% |
THQ, Inc. | | 3.4% |
Verisign, Inc. | | 3.3% |
| Dell, Inc. | | 3.3% |
| |
| Top five industries (i) | | |
| Computer Software | | 22.1% |
| Computer Systems | | 19.5% |
| Electronics (s) | | 17.9% |
| Network & Telecom (s) | | 9.9% |
| Internet (s) | | 7.9% |
| (i) | For purposes of this presentation, the components include the market value of securities, less any securities sold short, and reflect the impact of the equivalent exposure of derivative positions, if applicable. These amounts may be negative from time to time. The bond component will include any accrued interest amounts, if applicable. Equivalent exposure is a calculated amount that translates the derivative position into a reasonable approximation of the amount of the underlying asset that the portfolio would have to hold at a given point in time to have the same price sensitivity that results from the portfolio’s ownership of the derivative contract. When dealing with derivatives, equivalent exposure is a more representative measure of the potential impact of a position on portfolio performance than market value. |
| (s) | Top five industry percentage includes both Common Stocks and Securities Sold Short. |
Percentages are based on net assets as of 2/28/10.
The portfolio is actively managed and current holdings may be different.
2
MARKET ENVIRONMENT
After having suffered through one of the largest and most concentrated downturns since the 1930s, most asset markets staged a remarkable rebound during 2009. This recovery in global activity, which covers this reporting period, has been led importantly by emerging Asian economies, but broadening to include most of the global economy to varying degrees. Primary drivers of the recovery included an unwinding of the inventory destocking that took place earlier, as well as massive fiscal and monetary stimulus.
During the worst of the credit crisis, policy makers globally loosened monetary and fiscal policy on a massive scale. Having reached their lower bound on policy rates prior to the beginning of the reporting period, several central banks were implementing quantitative easing as a means to further loosen monetary policy to offset the continuing fall in global economic activity. However, by the beginning of the period, there were ever-broadening signs that the global macroeconomic deterioration had passed, which caused the subsequent rise in asset valuations. As most asset prices rebounded during the period and the demand for liquidity waned, the debate concerning the existence of asset bubbles and the need for monetary exit strategies had begun, creating added uncertainty regarding the forward path of policy rates. This changing dynamic caused asset valuations to move broadly sideways during the latter part of the period.
3
EXPENSE TABLE
Fund expenses borne by the shareholders during the period,
September 1, 2009 through February 28, 2010
As a shareholder of the fund, you incur two types of costs: (1) transaction costs, including sales charges (loads) on certain purchase or redemption payments, and (2) ongoing costs, including management fees; distribution and service (12b-1) fees; and other fund expenses. This example is intended to help you understand your ongoing costs (in dollars) of investing in the fund and to compare these costs with the ongoing costs of investing in other mutual funds.
The example is based on an investment of $1,000 invested at the beginning of the period and held for the entire period September 1, 2009 through February 28, 2010.
Actual Expenses
The first line for each share class in the following table provides information about actual account values and actual expenses. You may use the information in this line, together with the amount you invested, to estimate the expenses that you paid over the period. Simply divide your account value by $1,000 (for example, an $8,600 account value divided by $1,000 = 8.6), then multiply the result by the number in the first line under the heading entitled “Expenses Paid During Period” to estimate the expenses you paid on your account during this period.
Hypothetical Example for Comparison Purposes
The second line for each share class in the following table provides information about hypothetical account values and hypothetical expenses based on the fund’s actual expense ratio and an assumed rate of return of 5% per year before expenses, which is not the fund’s actual return. The hypothetical account values and expenses may not be used to estimate the actual ending account balance or expenses you paid for the period. You may use this information to compare the ongoing costs of investing in the fund and other funds. To do so, compare this 5% hypothetical example with the 5% hypothetical examples that appear in the shareholder reports of the other funds.
Please note that the expenses shown in the table are meant to highlight your ongoing costs only and do not reflect any transactional costs, such as sales charges (loads). Therefore, the second line for each share class in the table is useful in comparing ongoing costs only, and will not help you determine the relative total costs of owning different funds. In addition, if these transactional costs were included, your costs would have been higher.
4
Expense Table – continued
| | | | | | | | | | |
Share
Class | | | | Annualized
Expense
Ratio | | Beginning
Account Value
9/01/09 | | Ending
Account Value
2/28/10 | | Expenses
Paid During
Period (p)
9/01/09-2/28/10 |
| A | | Actual | | 1.52% | | $1,000.00 | | $1,062.39 | | $7.77 |
| | Hypothetical (h) | | 1.52% | | $1,000.00 | | $1,017.26 | | $7.60 |
| B | | Actual | | 2.27% | | $1,000.00 | | $1,058.54 | | $11.59 |
| | Hypothetical (h) | | 2.27% | | $1,000.00 | | $1,013.54 | | $11.33 |
| C | | Actual | | 2.28% | | $1,000.00 | | $1,058.65 | | $11.64 |
| | Hypothetical (h) | | 2.28% | | $1,000.00 | | $1,013.49 | | $11.38 |
| I | | Actual | | 1.28% | | $1,000.00 | | $1,063.64 | | $6.55 |
| | Hypothetical (h) | | 1.28% | | $1,000.00 | | $1,018.45 | | $6.41 |
| R1 | | Actual | | 2.27% | | $1,000.00 | | $1,057.75 | | $11.58 |
| | Hypothetical (h) | | 2.27% | | $1,000.00 | | $1,013.54 | | $11.33 |
| R2 | | Actual | | 1.77% | | $1,000.00 | | $1,060.83 | | $9.04 |
| | Hypothetical (h) | | 1.77% | | $1,000.00 | | $1,016.02 | | $8.85 |
| R3 | | Actual | | 1.52% | | $1,000.00 | | $1,062.39 | | $7.77 |
| | Hypothetical (h) | | 1.52% | | $1,000.00 | | $1,017.26 | | $7.60 |
| R4 | | Actual | | 1.33% | | $1,000.00 | | $1,063.34 | | $6.80 |
| | Hypothetical (h) | | 1.33% | | $1,000.00 | | $1,018.20 | | $6.66 |
| (h) | 5% class return per year before expenses. |
| (p) | Expenses paid is equal to each class’ annualized expense ratio, as shown above, multiplied by the average account value over the period, multiplied by the number of days in the period, divided by the number of days in the year. Expenses paid do not include any applicable sales charges (loads). If these transaction costs had been included, your costs would have been higher. |
Expense Changes Impacting the Table
Changes to the fund’s fee arrangements occurred during the six month period. Had these fee changes been in effect throughout the entire six month period, the annualized expense ratios would have been 1.62%, 2.37%, 2.37%, 1.38%, 2.37%, 1.87%, 1.62% and 1.38% for Classes A, B, C, I, R1, R2, R3 and R4, respectively; the actual expenses paid during the period would have been approximately $8.28, $12.09, $12.09, $7.06, $12.09, $9.55, $8.28 and $7.06 for Classes A, B, C, I, R1, R2, R3 and R4, respectively; and the hypothetical expenses paid during the period would have been approximately $8.10, $11.83, $11.83, $6.90, $11.83, $9.35, $8.10 and $6.90 for Classes A, B, C, I, R1, R2, R3 and R4, respectively. For further information about the fund’s fee arrangements and changes to those fee arrangements, please see Note 3 in the Notes to Financial Statements.
5
PORTFOLIO OF INVESTMENTS
2/28/10 (unaudited)
The Portfolio of Investments is a complete list of all securities owned by your fund. It is categorized by broad-based asset classes.
| | | | | |
| Common Stocks - 97.1% | | | | | |
| Issuer | | Shares/Par | | Value ($) |
| | | | | |
| Business Services - 6.3% | | | | | |
| Accenture Ltd., “A” | | 122,800 | | $ | 4,908,315 |
| Cognizant Technology Solutions Corp., “A” (a) | | 45,040 | | | 2,167,775 |
| MasterCard, Inc., “A” | | 14,040 | | | 3,150,155 |
| | | | | |
| | | | | $ | 10,226,245 |
| Computer Software - 21.0% | | | | | |
| Adobe Systems, Inc. (a) | | 91,400 | | $ | 3,167,010 |
| Akamai Technologies, Inc. (a) | | 95,700 | | | 2,516,910 |
| Autodesk, Inc. (a) | | 72,600 | | | 2,024,088 |
| Blue Coat Systems, Inc. (a) | | 118,500 | | | 3,434,130 |
| Cadence Design Systems, Inc. (a) | | 360,300 | | | 2,053,710 |
| MicroStrategy, Inc., “A” (a)(s) | | 47,840 | | | 4,242,930 |
| Oracle Corp. | | 329,000 | | | 8,109,850 |
| Parametric Technology Corp. (a) | | 278,120 | | | 4,842,069 |
| VeriSign, Inc. (a) | | 143,700 | | | 3,581,004 |
| | | | | |
| | | | | $ | 33,971,701 |
| Computer Software - Systems - 19.5% | | | | | |
| 3Par, Inc. (a) | | 262,800 | | $ | 2,425,644 |
| Apple, Inc. (a)(s) | | 36,440 | | | 7,456,353 |
| Compellent Technologies, Inc. (a) | | 157,500 | | | 2,445,975 |
| Dell, Inc. (a)(s) | | 397,850 | | | 5,263,556 |
| EMC Corp. (a) | | 187,900 | | | 3,286,371 |
| Hewlett-Packard Co. | | 138,520 | | | 7,035,431 |
| Nintendo Co. Ltd. | | 6,285 | | | 1,709,814 |
| Telvent GIT S.A. | | 66,000 | | | 1,864,500 |
| | | | | |
| | | | | $ | 31,487,644 |
| Consumer Services - 2.7% | | | | | |
| Ctrip.com International Ltd., ADR (a) | | 60,440 | | $ | 2,310,621 |
| Monster Worldwide, Inc. (a) | | 149,600 | | | 2,086,920 |
| | | | | |
| | | | | $ | 4,397,541 |
| Electrical Equipment - 3.5% | | | | | |
| Nitto Denko Corp. | | 61,800 | | $ | 2,278,069 |
| Tyco Electronics Ltd. | | 127,980 | | | 3,280,127 |
| | | | | |
| | | | | $ | 5,558,196 |
6
Portfolio of Investments (unaudited) – continued
| | | | | | |
| Issuer | | Shares/Par | | Value ($) |
| | | | | |
| Common Stocks - continued | | | | | | |
| Electronics - 18.0% | | | | | | |
| First Solar, Inc. (a)(l) | | | 19,800 | | $ | 2,096,820 |
| Flextronics International Ltd. (a) | | | 290,122 | | | 2,019,249 |
| Intel Corp. | | | 312,600 | | | 6,417,678 |
| National Semiconductor Corp. | | | 227,310 | | | 3,291,449 |
| Samsung Electronics Co. Ltd., GDR | | | 35,241 | | | 11,259,500 |
| Silicon Laboratories, Inc. (a) | | | 71,800 | | | 3,262,592 |
| Stratasys, Inc. (a) | | | 29,500 | | | 777,915 |
| | | | | | |
| | | | | | $ | 29,125,203 |
| Internet - 8.4% | | | | | | |
| Google, Inc., “A” (a) | | | 13,775 | | $ | 7,256,670 |
| OpenTable, Inc. (a) | | | 104,800 | | | 3,571,584 |
| Tencent Holdings Ltd. | | | 142,400 | | | 2,792,175 |
| | | | | | |
| | | | | | $ | 13,620,429 |
| Leisure & Toys - 2.4% | | | | | | |
| THQ, Inc. (a) | | | 626,600 | | $ | 3,797,196 |
| | |
| Medical & Health Technology & Services - 1.8% | | | | | | |
| MedAssets, Inc. (a) | | | 131,400 | | $ | 2,844,810 |
| | |
| Network & Telecom - 10.6% | | | | | | |
| Cisco Systems, Inc. (a) | | | 238,270 | | $ | 5,797,109 |
| Fortinet, Inc. (a) | | | 97,890 | | | 1,681,750 |
| Juniper Networks, Inc. (a) | | | 95,100 | | | 2,660,898 |
| Palm, Inc. (a)(l) | | | 277,700 | | | 1,693,970 |
| Riverbed Technology, Inc. (a) | | | 69,200 | | | 1,885,700 |
| Tellabs, Inc. | | | 499,800 | | | 3,453,618 |
| | | | | | |
| | | | | | $ | 17,173,045 |
| Telephone Services - 2.9% | | | | | | |
| American Tower Corp., “A” (a) | | | 60,800 | | $ | 2,593,728 |
| Qwest Communications International, Inc. | | | 454,200 | | | 2,071,152 |
| | | | | | |
| | | | | | $ | 4,664,880 |
| Total Common Stocks (Identified Cost, $157,651,258) | | | | | $ | 156,866,890 |
| | |
| Convertible Bonds - 3.5% | | | | | | |
| Computer Software - 1.1% | | | | | | |
| Verisign, Inc., 3.25%, 2037 | | $ | 1,960,000 | | $ | 1,734,600 |
7
Portfolio of Investments (unaudited) – continued
| | | | | | | | |
| Issuer | | Shares/Par | | | Value ($) | |
| | | | | | | |
| Convertible Bonds - continued | | | | | | | | |
| Leisure & Toys - 2.4% | | | | | | | | |
| Take-Two Interactive Software, Inc., 4.375%, 2014 | | $ | 1,924,000 | | | $ | 2,190,955 | |
| THQ, Inc., 5%, 2014 (z) | | | 1,760,000 | | | | 1,762,200 | |
| | | | | | | | |
| | | | | | | $ | 3,953,155 | |
| Total Convertible Bonds (Identified Cost, $5,202,583) | | | | | | $ | 5,687,755 | |
| | |
| Money Market Funds (v) - 0.0% | | | | | | | | |
MFS Institutional Money Market Portfolio, 0.14%,
at Cost and Net Asset Value | | | 199 | | | $ | 199 | |
| | |
| Collateral for Securities Loaned - 1.6% | | | | | | | | |
Navigator Securities Lending Prime Portfolio,
at Cost and Net Asset Value | | | 2,598,040 | | | $ | 2,598,040 | |
| | |
| Issuer/Expiration Date/Strike Price | | Number of
Contracts | | | | |
| Call Options Purchased - 0.1% | | | | | | | | |
| Palm, Inc. - May 2010 @ $14 (a) | | | 2,329 | | | $ | 9,316 | |
| First Solar, Inc. - September 2010 @ $140 (a) | | | 569 | | | | 187,770 | |
| Total Call Options Purchased (Premiums Paid, $759,564) | | | | | | $ | 197,086 | |
| | |
| Put Options Purchased - 0.3% | | | | | | | | |
Technology Select Sector SPDR - March 2010 @ $22
(Premiums Paid, $580,410) (a) | | | 6,092 | | | $ | 389,888 | |
| Total Investments (Identified Cost, $166,792,054) | | | | | | $ | 165,739,858 | |
| | |
| Issuer | | Shares/Par | | | | |
| Securities Sold Short - (2.7)% | | | | | | | | |
| Electronics - (0.9)% | | | | | | | | |
| GT Solar International, Inc. (a) | | | (243,100 | ) | | $ | (1,446,445 | ) |
| | |
| Internet - (0.5)% | | | | | | | | |
| Ancestry.com, Inc. (a) | | | (52,800 | ) | | $ | (841,104 | ) |
| | |
| Network & Telecom - (0.7)% | | | | | | | | |
| Motorola, Inc. (a) | | | (174,000 | ) | | $ | (1,176,240 | ) |
| | |
| Telephone Services - (0.5)% | | | | | | | | |
| Level 3 Communications, Inc. (a) | | | (524,900 | ) | | $ | (834,591 | ) |
| Total Securities Sold Short (Proceeds Received, $4,242,515) | | | | | | $ | (4,298,380 | ) |
| | |
| Other Assets, Less Liabilities - 0.1% | | | | | | | 143,023 | |
| Net Assets - 100.0% | | | | | | $ | 161,584,501 | |
8
Portfolio of Investments (unaudited) – continued
| (a) | Non-income producing security. |
| (l) | All or a portion of this security is on loan. |
| (s) | Security or a portion of the security was pledged to cover collateral requirements for securities sold short. At February 28, 2010, the value of the securities pledged amounted to $1,591,898. |
| (v) | Underlying fund that is available only to investment companies managed by MFS. The rate quoted is the annualized seven-day yield of the fund at period end. |
| (z) | Restricted securities are not registered under the Securities Act of 1933 and are subject to legal restrictions on resale. These securities generally may be resold in transactions exempt from registration or to the public if the securities are subsequently registered. Disposal of these securities may involve time-consuming negotiations and prompt sale at an acceptable price may be difficult. The fund holds the following restricted securities: |
| | | | | | |
| Restricted Securities | | Acquisition
Date | | Cost | | Current
Market
Value |
| THQ, Inc., 5%, 2014 | | 7/30/09-12/08/09 | | $1,750,634 | | $1,762,200 |
| % of Net Assets | | | | | | 1.1% |
The following abbreviations are used in this report and are defined:
| ADR | | American Depository Receipt |
| GDR | | Global Depository Receipt |
See Notes to Financial Statements
9
Financial Statements
STATEMENT OF ASSETS AND LIABILITIES
At 2/28/10 (unaudited)
This statement represents your fund’s balance sheet, which details the assets and liabilities comprising the total value of the fund.
| | | |
| Assets | | | |
Investments- | | | |
Non-affiliated issuers, at value (identified cost, $166,791,855) | | $165,739,659 | |
Underlying funds, at cost and value | | 199 | |
Total investments, at value, including $2,496,607 of securities on loan
(identified cost, $166,792,054) | | $165,739,858 | |
Deposits with brokers for securities sold short | | 4,732,285 | |
Receivables for | | | |
Investments sold | | 9,555,710 | |
Fund shares sold | | 282,422 | |
Interest and dividends | | 75,044 | |
Receivable from investment adviser | | 980 | |
Other assets | | 2,372 | |
Total assets | | $180,388,671 | |
| Liabilities | | | |
Payable to custodian | | $1,768,068 | |
Payables for | | | |
Securities sold short, at value (proceeds received, $4,242,515) | | 4,298,380 | |
Investments purchased | | 9,862,035 | |
Fund shares reacquired | | 133,354 | |
Collateral for securities loaned, at value | | 2,598,040 | |
Payable to affiliates | | | |
Investment adviser | | 13,297 | |
Shareholder servicing costs | | 66,060 | |
Distribution and service fees | | 7,534 | |
Administrative services fee | | 376 | |
Payable for independent Trustees’ compensation | | 52,264 | |
Accrued expenses and other liabilities | | 4,762 | |
Total liabilities | | $18,804,170 | |
Net assets | | $161,584,501 | |
| Net assets consist of | | | |
Paid-in capital | | $281,203,149 | |
Unrealized appreciation (depreciation) on investments and translation of assets and liabilities in foreign currencies | | (1,110,726 | ) |
Accumulated net realized gain (loss) on investments and foreign currency transactions | | (117,549,451 | ) |
Accumulated net investment loss | | (958,471 | ) |
Net assets | | $161,584,501 | |
Shares of beneficial interest outstanding | | 13,952,988 | |
| | | | | | |
| | | Net assets | | Shares
outstanding | | Net asset value
per share (a) |
Class A | | $97,294,403 | | 8,280,714 | | $11.75 |
Class B | | 14,352,185 | | 1,301,431 | | 11.03 |
Class C | | 20,250,675 | | 1,839,607 | | 11.01 |
Class I | | 9,711,959 | | 796,297 | | 12.20 |
Class R1 | | 1,648,595 | | 150,012 | | 10.99 |
Class R2 | | 14,438,604 | | 1,254,448 | | 11.51 |
Class R3 | | 3,477,857 | | 296,055 | | 11.75 |
Class R4 | | 410,223 | | 34,424 | | 11.92 |
| (a) | Maximum offering price per share was equal to the net asset value for all share classes, except for Class A, for which the maximum offering price per share was $12.47 [100 / 94.25 x $11.75]. On sales of $50,000 or more, the maximum offering price of Class A shares is reduced. A contingent deferred sales charge may be imposed on redemptions of Class A, Class B, and Class C shares. Redemption price per share was equal to the net asset value per share for Classes I, R1, R2, R3, and R4. |
See Notes to Financial Statements
10
Financial Statements
STATEMENT OF OPERATIONS
Six months ended 2/28/10 (unaudited)
This statement describes how much your fund earned in investment income and accrued in expenses. It also describes any gains and/or losses generated by fund operations.
| | | |
| Net investment loss | | | |
Income | | | |
Dividends | | $281,832 | |
Dividends from underlying funds | | 1,943 | |
Interest | | 119,713 | |
Foreign taxes withheld | | (2,000 | ) |
Total investment income | | $401,488 | |
Expenses | | | |
Management fee | | $598,725 | |
Distribution and service fees | | 342,509 | |
Shareholder servicing costs | | 297,810 | |
Administrative services fee | | 16,804 | |
Independent Trustees’ compensation | | 6,155 | |
Custodian fee | | 22,054 | |
Shareholder communications | | 20,466 | |
Auditing fees | | 25,891 | |
Legal fees | | 1,916 | |
Dividend and interest expense on securities sold short | | 36,199 | |
Miscellaneous | | 68,595 | |
Total expenses | | $1,437,124 | |
Fees paid indirectly | | (1 | ) |
Reduction of expenses by investment adviser | | (79,637 | ) |
Net expenses | | $1,357,486 | |
Net investment loss | | $(955,998 | ) |
Realized and unrealized gain (loss) on investments
and foreign currency transactions | | | |
| Realized gain (loss) (identified cost basis) | | | |
Investment transactions | | $7,481,981 | |
Written option transactions | | (148,669 | ) |
Securities sold short | | 103,093 | |
Foreign currency transactions | | 1,016 | |
Net realized gain (loss) on investments
and foreign currency transactions | | $7,437,421 | |
Change in unrealized appreciation (depreciation) | | | |
Investments | | $1,911,008 | |
Securities sold short | | (55,865 | ) |
Translation of assets and liabilities in foreign currencies | | (2,665 | ) |
Net unrealized gain (loss) on investments
and foreign currency translation | | $1,852,478 | |
Net realized and unrealized gain (loss) on investments
and foreign currency | | $9,289,899 | |
Change in net assets from operations | | $8,333,901 | |
See Notes to Financial Statements
11
Financial Statements
STATEMENTS OF CHANGES IN NET ASSETS
These statements describe the increases and/or decreases in net assets resulting from operations, any distributions, and any shareholder transactions.
| | | | | | |
| Change in net assets | | Six months ended
2/28/10
(unaudited) | | | Year ended
8/31/09 | |
| From operations | | | | | | |
Net investment loss | | $(955,998 | ) | | $(464,160 | ) |
Net realized gain (loss) on investments and foreign
currency transactions | | 7,437,421 | | | (26,058,097 | ) |
Net unrealized gain (loss) on investments and foreign currency translation | | 1,852,478 | | | 16,461,474 | |
Change in net assets from operations | | $8,333,901 | | | $(10,060,783 | ) |
Change in net assets from fund share transactions | | $10,620,556 | | | $27,332,525 | |
Total change in net assets | | $18,954,457 | | | $17,271,742 | |
| Net assets | | | | | | |
At beginning of period | | 142,630,044 | | | 125,358,302 | |
At end of period (including accumulated net investment
loss of $958,471 and $2,473, respectively) | | $161,584,501 | | | $142,630,044 | |
See Notes to Financial Statements
12
Financial Statements
FINANCIAL HIGHLIGHTS
The financial highlights table is intended to help you understand the fund’s financial performance for the semiannual period and the past 5 fiscal years (or life of a particular share class, if shorter). Certain information reflects financial results for a single fund share. The total returns in the table represent the rate by which an investor would have earned (or lost) on an investment in the fund share class (assuming reinvestment of all distributions) held for the entire period.
| | | | | | | | | | | | | | | | | | |
| | | Six months
ended
2/28/10
(unaudited) | | | Years ended 8/31 | |
| Class A | | | 2009 | | | 2008 | | | 2007 | | | 2006 | | | 2005 | |
| | | | | | | | | | | | | | | | | |
Net asset value, beginning of period | | $11.06 | | | $12.46 | | | $13.34 | | | $10.13 | | | $8.84 | | | $7.70 | |
| Income (loss) from investment operations | | | | | | | | | | | | | | | | | | |
Net investment loss (d) | | $(0.06 | ) | | $(0.03 | ) | | $(0.07 | ) | | $(0.10 | ) | | $(0.11 | ) | | $(0.05 | ) |
Net realized and unrealized gain (loss) on investments and foreign currency | | 0.75 | | | (1.37 | ) | | (0.81 | ) | | 3.31 | | | 1.40 | | | 1.19 | |
Total from investment operations | | $0.69 | | | $(1.40 | ) | | $(0.88 | ) | | $3.21 | | | $1.29 | | | $1.14 | |
Net asset value, end of period | | $11.75 | | | $11.06 | | | $12.46 | | | $13.34 | | | $10.13 | | | $8.84 | |
Total return (%) (r)(s)(t) | | 6.24 | (n) | | (11.24 | ) | | (6.60 | ) | | 31.69 | | | 14.59 | | | 14.81 | |
| Ratios (%) (to average net assets) and Supplemental data: | | | | | | | | | | | | | | | | | | |
Expenses before expense reductions (f) | | 1.62 | (a) | | 1.85 | | | 1.66 | | | 1.70 | | | 1.79 | | | 1.79 | |
Expenses after expense reductions (f) | | 1.52 | (a) | | 1.48 | | | 1.51 | | | 1.50 | | | 1.50 | | | 1.51 | |
Expenses after expense reductions excluding short sale dividend and interest expense (f) | | 1.48 | (a) | | 1.44 | | | 1.50 | | | N/A | | | N/A | | | N/A | |
Net investment loss | | (1.01 | )(a) | | (0.34 | ) | | (0.56 | ) | | (0.82 | ) | | (1.13 | ) | | (0.56 | ) |
Portfolio turnover | | 100 | | | 226 | | | 231 | | | 266 | | | 217 | | | 163 | |
Net assets at end of period (000 omitted) | | $97,294 | | | $86,720 | | | $64,791 | | | $56,598 | | | $43,313 | | | $48,945 | |
See Notes to Financial Statements
13
Financial Highlights – continued
| | | | | | | | | | | | | | | | | | |
| | | Six months
ended
2/28/10
(unaudited) | | | Years ended 8/31 | |
| Class B | | | 2009 | | | 2008 | | | 2007 | | | 2006 | | | 2005 | |
| | | | | | | | | | | | | | | | | |
Net asset value, beginning of period | | $10.42 | | | $11.82 | | | $12.74 | | | $9.73 | | | $8.55 | | | $7.50 | |
| Income (loss) from investment operations | | | | | | | | | | | | | | | | | | |
Net investment loss (d) | | $(0.10 | ) | | $(0.08 | ) | | $(0.16 | ) | | $(0.17 | ) | | $(0.17 | ) | | $(0.10 | ) |
Net realized and unrealized gain (loss) on investments and foreign currency | | 0.71 | | | (1.32 | ) | | (0.76 | ) | | 3.18 | | | 1.35 | | | 1.15 | |
Total from investment operations | | $0.61 | | | $(1.40 | ) | | $(0.92 | ) | | $3.01 | | | $1.18 | | | $1.05 | |
Net asset value, end of period | | $11.03 | | | $10.42 | | | $11.82 | | | $12.74 | | | $9.73 | | | $8.55 | |
Total return (%) (r)(s)(t) | | 5.85 | (n) | | (11.84 | ) | | (7.22 | ) | | 30.94 | | | 13.80 | | | 14.00 | |
| Ratios (%) (to average net assets) and Supplemental data: | | | | | | | | | | | | | | | | | | |
Expenses before expense reductions (f) | | 2.37 | (a) | | 2.58 | | | 2.32 | | | 2.36 | | | 2.44 | | | 2.44 | |
Expenses after expense reductions (f) | | 2.27 | (a) | | 2.19 | | | 2.16 | | | 2.15 | | | 2.15 | | | 2.16 | |
Expenses after expense reductions excluding short sale dividend and interest expense (f) | | 2.22 | (a) | | 2.15 | | | 2.15 | | | N/A | | | N/A | | | N/A | |
Net investment loss | | (1.77 | )(a) | | (0.98 | ) | | (1.24 | ) | | (1.47 | ) | | (1.79 | ) | | (1.24 | ) |
Portfolio turnover | | 100 | | | 226 | | | 231 | | | 266 | | | 217 | | | 163 | |
Net assets at end of period (000 omitted) | | $14,352 | | | $15,182 | | | $23,254 | | | $38,540 | | | $39,025 | | | $43,765 | |
See Notes to Financial Statements
14
Financial Highlights – continued
| | | | | | | | | | | | | | | | | | |
| | | Six months
ended
2/28/10
(unaudited) | | | Years ended 8/31 | |
| Class C | | | 2009 | | | 2008 | | | 2007 | | | 2006 | | | 2005 | |
| | | | | | | | | | | | | | | | | |
Net asset value, beginning of period | | $10.40 | | | $11.80 | | | $12.72 | | | $9.72 | | | $8.54 | | | $7.48 | |
| Income (loss) from investment operations | | | | | | | | | | | | | | | | | | |
Net investment loss (d) | | $(0.10 | ) | | $(0.08 | ) | | $(0.16 | ) | | $(0.17 | ) | | $(0.17 | ) | | $(0.10 | ) |
Net realized and unrealized gain (loss) on investments and foreign currency | | 0.71 | | | (1.32 | ) | | (0.76 | ) | | 3.17 | | | 1.35 | | | 1.16 | |
Total from investment operations | | $0.61 | | | $(1.40 | ) | | $(0.92 | ) | | $3.00 | | | $1.18 | | | $1.06 | |
Net asset value, end of period | | $11.01 | | | $10.40 | | | $11.80 | | | $12.72 | | | $9.72 | | | $8.54 | |
Total return (%) (r)(s)(t) | | 5.87 | (n) | | (11.86 | ) | | (7.23 | ) | | 30.86 | | | 13.82 | | | 14.17 | |
| Ratios (%) (to average net assets) and Supplemental data: | | | | | | | | | | | | | | | | | | |
Expenses before expense reductions (f) | | 2.37 | (a) | | 2.57 | | | 2.31 | | | 2.35 | | | 2.44 | | | 2.44 | |
Expenses after expense reductions (f) | | 2.28 | (a) | | 2.19 | | | 2.16 | | | 2.15 | | | 2.15 | | | 2.16 | |
Expenses after expense reductions excluding short sale dividend and interest expense (f) | | 2.23 | (a) | | 2.15 | | | 2.15 | | | N/A | | | N/A | | | N/A | |
Net investment loss | | (1.79 | )(a) | | (1.00 | ) | | (1.22 | ) | | (1.46 | ) | | (1.78 | ) | | (1.22 | ) |
Portfolio turnover | | 100 | | | 226 | | | 231 | | | 266 | | | 217 | | | 163 | |
Net assets at end of period (000 omitted) | | $20,251 | | | $15,356 | | | $15,765 | | | $16,064 | | | $11,659 | | | $12,414 | |
See Notes to Financial Statements
15
Financial Highlights – continued
| | | | | | | | | | | | | | | | | |
| | | Six months
ended
2/28/10
(unaudited) | | | Years ended 8/31 |
| Class I | | | 2009 | | | 2008 | | | 2007 | | | 2006 | | | 2005 |
| | | | | | | | | | | | | | | | |
Net asset value, beginning of period | | $11.47 | | | $12.88 | | | $13.74 | | | $10.39 | | | $9.04 | | | $7.85 |
| Income (loss) from investment operations | | | | | | | | | | | | | | | | | |
Net investment income (loss) (d) | | $(0.05 | ) | | $(0.00 | )(w) | | $(0.03 | ) | | $(0.06 | ) | | $(0.08 | ) | | $0.01 |
Net realized and unrealized gain (loss) on investments and foreign currency | | 0.78 | | | (1.41 | ) | | (0.83 | ) | | 3.41 | | | 1.43 | | | 1.18 |
Total from investment operations | | $0.73 | | | $(1.41 | ) | | $(0.86 | ) | | $3.35 | | | $1.35 | | | $1.19 |
Net asset value, end of period | | $12.20 | | | $11.47 | | | $12.88 | | | $13.74 | | | $10.39 | | | $9.04 |
Total return (%) (r)(s) | | 6.36 | (n) | | (10.95 | ) | | (6.26 | ) | | 32.24 | | | 14.93 | | | 15.16 |
| Ratios (%) (to average net assets) and Supplemental data: | | | | | | | | | | | | | | | | | |
Expenses before expense reductions (f) | | 1.38 | (a) | | 1.56 | | | 1.31 | | | 1.35 | | | 1.43 | | | 1.44 |
Expenses after expense reductions (f) | | 1.28 | (a) | | 1.19 | | | 1.16 | | | 1.15 | | | 1.15 | | | 1.16 |
Expenses after expense reductions excluding short sale dividend and interest expense (f) | | 1.23 | (a) | | 1.15 | | | 1.15 | | | N/A | | | N/A | | | N/A |
Net investment income (loss) | | (0.78 | )(a) | | (0.03 | ) | | (0.20 | ) | | (0.47 | ) | | (0.78 | ) | | 0.17 |
Portfolio turnover | | 100 | | | 226 | | | 231 | | | 266 | | | 217 | | | 163 |
Net assets at end of period (000 omitted) | | $9,712 | | | $6,726 | | | $4,958 | | | $4,180 | | | $3,492 | | | $3,384 |
See Notes to Financial Statements
16
Financial Highlights – continued
| | | | | | | | | | | | | | | | | | |
| | | Six months
ended
2/28/10
(unaudited) | | | Years ended 8/31 | |
| Class R1 | | | 2009 | | | 2008 | | | 2007 | | | 2006 | | | 2005 (i) | |
| | | | | | | | | | | | | | | | | |
Net asset value, beginning of period | | $10.39 | | | $11.78 | | | $12.70 | | | $9.72 | | | $8.55 | | | $8.01 | |
| Income (loss) from investment operations | | | | | | | | | | | | | | | | | | |
Net investment loss (d) | | $(0.10 | ) | | $(0.08 | ) | | $(0.15 | ) | | $(0.19 | ) | | $(0.18 | ) | | $(0.07 | ) |
Net realized and unrealized gain (loss) on investments and foreign currency | | 0.70 | | | (1.31 | ) | | (0.77 | ) | | 3.17 | | | 1.35 | | | 0.61 | (g) |
Total from investment operations | | $0.60 | | | $(1.39 | ) | | $(0.92 | ) | | $2.98 | | | $1.17 | | | $0.54 | |
Net asset value, end of period | | $10.99 | | | $10.39 | | | $11.78 | | | $12.70 | | | $9.72 | | | $8.55 | |
Total return (%) (r)(s) | | 5.77 | (n) | | (11.80 | ) | | (7.24 | ) | | 30.66 | | | 13.68 | | | 6.74 | (n) |
| Ratios (%) (to average net assets) and Supplemental data: | | | | | | | | | | | | | | | | | | |
Expenses before expense reductions (f) | | 2.37 | (a) | | 2.58 | | | 2.36 | | | 2.48 | | | 2.63 | | | 2.62 | (a) |
Expenses after expense reductions (f) | | 2.27 | (a) | | 2.19 | | | 2.21 | | | 2.25 | | | 2.25 | | | 2.34 | (a) |
Expenses after expense reductions excluding short sale dividend and interest expense (f) | | 2.23 | (a) | | 2.15 | | | 2.20 | | | N/A | | | N/A | | | N/A | |
Net investment loss | | (1.82 | )(a) | | (0.96 | ) | | (1.22 | ) | | (1.63 | ) | | (1.88 | ) | | (1.90 | )(a) |
Portfolio turnover | | 100 | | | 226 | | | 231 | | | 266 | | | 217 | | | 163 | |
Net assets at end of period (000 omitted) | | $1,649 | | | $1,585 | | | $2,026 | | | $1,235 | | | $213 | | | $64 | |
See Notes to Financial Statements
17
Financial Highlights – continued
| | | | | | | | | | | | | | | | | | |
| | | Six months
ended
2/28/10
(unaudited) | | | Years ended 8/31 | |
| Class R2 | | | 2009 | | | 2008 | | | 2007 | | | 2006 | | | 2005 | |
| | | | | | | | | | | | | | | | | |
Net asset value, beginning of period | | $10.85 | | | $12.25 | | | $13.14 | | | $10.00 | | | $8.76 | | | $7.66 | |
| Income (loss) from investment operations | | | | | | | | | | | | | | | | | | |
Net investment loss (d) | | $(0.07 | ) | | $(0.04 | ) | | $(0.09 | ) | | $(0.13 | ) | | $(0.14 | ) | | $(0.09 | ) |
Net realized and unrealized gain (loss) on investments and foreign currency | | 0.73 | | | (1.36 | ) | | (0.80 | ) | | 3.27 | | | 1.38 | | | 1.19 | |
Total from investment operations | | $0.66 | | | $(1.40 | ) | | $(0.89 | ) | | $3.14 | | | $1.24 | | | $1.10 | |
Net asset value, end of period | | $11.51 | | | $10.85 | | | $12.25 | | | $13.14 | | | $10.00 | | | $8.76 | |
Total return (%) (r)(s) | | 6.08 | (n) | | (11.43 | ) | | (6.77 | ) | | 31.40 | | | 14.16 | | | 14.36 | |
| Ratios (%) (to average net assets) and Supplemental data: | | | | | | | | | | | | | | | | | | |
Expenses before expense reductions (f) | | 1.87 | (a) | | 2.07 | | | 1.85 | | | 1.98 | | | 2.18 | | | 2.19 | |
Expenses after expense reductions (f) | | 1.77 | (a) | | 1.69 | | | 1.71 | | | 1.80 | | | 1.80 | | | 1.91 | |
Expenses after expense reductions excluding short sale dividend and interest expense (f) | | 1.73 | | | 1.65 | | | 1.69 | | | N/A | | | N/A | | | N/A | |
Net investment loss | | (1.27 | )(a) | | (0.50 | ) | | (0.65 | ) | | (1.07 | ) | | (1.41 | ) | | (1.07 | ) |
Portfolio turnover | | 100 | | | 226 | | | 231 | | | 266 | | | 217 | | | 163 | |
Net assets at end of period (000 omitted) | | $14,439 | | | $13,775 | | | $12,098 | | | $5,292 | | | $800 | | | $192 | |
See Notes to Financial Statements
18
Financial Highlights – continued
| | | | | | | | | | | | | | | | | | |
| | | Six months
ended
2/28/10
(unaudited) | | | Years ended 8/31 | |
| Class R3 | | | 2009 | | | 2008 | | | 2007 | | | 2006 | | | 2005 (i) | |
| | | | | | | | | | | | | | | | | |
Net asset value, beginning of period | | $11.06 | | | $12.45 | | | $13.33 | | | $10.12 | | | $8.85 | | | $8.26 | |
| Income (loss) from investment operations | | | | | | | | | | | | | | | | | | |
Net investment loss (d) | | $(0.06 | ) | | $(0.02 | ) | | $(0.06 | ) | | $(0.10 | ) | | $(0.14 | ) | | $(0.04 | ) |
Net realized and unrealized gain (loss) on investments and foreign currency | | 0.75 | | | (1.37 | ) | | (0.82 | ) | | 3.31 | | | 1.41 | | | 0.63 | (g) |
Total from investment operations | | $0.69 | | | $(1.39 | ) | | $(0.88 | ) | | $3.21 | | | $1.27 | | | $0.59 | |
Net asset value, end of period | | $11.75 | | | $11.06 | | | $12.45 | | | $13.33 | | | $10.12 | | | $8.85 | |
Total return (%) (r)(s) | | 6.24 | (n) | | (11.16 | ) | | (6.60 | ) | | 31.72 | | | 14.35 | | | 7.14 | (n) |
| Ratios (%) (to average net assets) and Supplemental data: | | | | | | | | | | | | | | | | | | |
Expenses before expense reductions (f) | | 1.62 | (a) | | 1.82 | | | 1.61 | | | 1.70 | | | 1.84 | | | 1.82 | (a) |
Expenses after expense reductions (f) | | 1.52 | (a) | | 1.44 | | | 1.46 | | | 1.55 | | | 1.55 | | | 1.54 | (a) |
Expenses after expense reductions excluding short sale dividend and interest expense (f) | | 1.48 | (a) | | 1.40 | | | 1.44 | | | N/A | | | N/A | | | N/A | |
Net investment loss | | (1.01 | )(a) | | (0.24 | ) | | (0.44 | ) | | (0.76 | ) | | (1.18 | ) | | (1.10 | )(a) |
Portfolio turnover | | 100 | | | 226 | | | 231 | | | 266 | | | 217 | | | 163 | |
Net assets at end of period (000 omitted) | | $3,478 | | | $3,133 | | | $2,390 | | | $1,547 | | | $113 | | | $54 | |
See Notes to Financial Statements
19
Financial Highlights – continued
| | | | | | | | | | | | | | | | | | |
| | | Six months
ended
2/28/10
(unaudited) | | | Years ended 8/31 | |
| Class R4 | | | 2009 | | | 2008 | | | 2007 | | | 2006 | | | 2005 (i) | |
| | | | | | | | | | | | | | | | | |
Net asset value, beginning of period | | $11.21 | | | $12.58 | | | $13.43 | | | $10.17 | | | $8.86 | | | $8.26 | |
| Income (loss) from investment operations | | | | | | | | | | | | | | | | | | |
Net investment income (loss) (d) | | $(0.05 | ) | | $(0.00 | )(w) | | $(0.03 | ) | | $(0.07 | ) | | $(0.09 | ) | | $(0.03 | ) |
Net realized and unrealized gain (loss) on investments and foreign currency | | 0.76 | | | (1.37 | ) | | (0.82 | ) | | 3.33 | | | 1.40 | | | 0.63 | (g) |
Total from investment operations | | $0.71 | | | $(1.37 | ) | | $(0.85 | ) | | $3.26 | | | $1.31 | | | $0.60 | |
Net asset value, end of period | | $11.92 | | | $11.21 | | | $12.58 | | | $13.43 | | | $10.17 | | | $8.86 | |
Total return (%) (r)(s) | | 6.33 | (n) | | (10.89 | ) | | (6.33 | ) | | 32.06 | | | 14.79 | | | 7.26 | (n) |
| Ratios (%) (to average net assets) and Supplemental data: | | | | | | | | | | | | | | | | | | |
Expenses before expense reductions (f) | | 1.41 | (a) | | 1.54 | | | 1.35 | | | 1.45 | | | 1.53 | | | 1.52 | (a) |
Expenses after expense reductions (f) | | 1.33 | (a) | | 1.18 | | | 1.20 | | | 1.25 | | | 1.25 | | | 1.24 | (a) |
Expenses after expense reductions excluding short sale dividend and interest expense (f) | | 1.27 | (a) | | 1.15 | | | 1.19 | | | N/A | | | N/A | | | N/A | |
Net investment loss | | (0.81 | )(a) | | (0.02 | ) | | (0.24 | ) | | (0.56 | ) | | (0.88 | ) | | (0.79 | )(a) |
Portfolio turnover | | 100 | | | 226 | | | 231 | | | 266 | | | 217 | | | 163 | |
Net assets at end of period (000 omitted) | | $410 | | | $153 | | | $76 | | | $81 | | | $62 | | | $54 | |
Any redemption fees charged by the fund during the 2005 fiscal year resulted in a per share impact of less than $0.01.
| (d) | Per share data is based on average shares outstanding. |
| (f) | Ratios do not reflect reductions from fees paid indirectly, if applicable. |
| (g) | The per share amount is not in accordance with the net realized and unrealized gain/loss for the period because of the timing of sales of fund shares and the per share amount of realized and unrealized gains and losses at such time. |
| (i) | For the period from the class’ inception, and April 1, 2005 (Classes R1, R3, and R4) through the stated period end. |
| (r) | Certain expenses have been reduced without which performance would have been lower. |
| (s) | From time to time the fund may receive proceeds from litigation settlements, without which performance would be lower. Excluding the effect of the proceeds received from a non-recurring litigation settlement against Nortel Networks Corp., the Class A, Class B, Class C, Class I, Class R1, Class R2, Class R3, and Class R4 total returns for the year ended August 31, 2008 would have each been lower by approximately 0.55%. Excluding the effect of the proceeds received from a non-recurring litigation settlement against Global Research Analyst II, the Class A, Class B, Class C, Class I, Class R1, Class R2, Class R3, and Class R4 total returns for the year ended August 31, 2007 would have each been lower by approximately 0.56%. |
| (t) | Total returns do not include any applicable sales charges. |
| (w) | Per share amount was less than $0.01. |
See Notes to Financial Statements
20
NOTES TO FINANCIAL STATEMENTS
(unaudited)
| (1) | | Business and Organization |
MFS Technology Fund (the fund) is a series of MFS Series Trust I (the trust). The trust is organized as a Massachusetts business trust and is registered under the Investment Company Act of 1940, as amended, as an open-end management investment company.
| (2) | | Significant Accounting Policies |
General – The preparation of financial statements in conformity with U.S. generally accepted accounting principles requires management to make estimates and assumptions that affect the reported amounts of assets and liabilities, and disclosure of contingent assets and liabilities at the date of the financial statements and the reported amounts of revenues and expenses during the reporting period. Actual results could differ from those estimates. In the preparation of these financial statements, management has evaluated subsequent events occurring after the date of the fund’s Statement of Assets and Liabilities through the date that the financial statements were issued. The fund can invest in foreign securities, including securities of emerging market issuers. Investments in foreign securities are vulnerable to the effects of changes in the relative values of the local currency and the U.S. dollar and to the effects of changes in each country’s legal, political, and economic environment. The markets of emerging markets countries are generally more volatile than the markets of developed countries with more mature economies. All of the risks of investing in foreign securities previously described are heightened when investing in emerging markets countries.
Investment Valuations – Equity securities, including restricted equity securities, are generally valued at the last sale or official closing price as provided by a third-party pricing service on the market or exchange on which they are primarily traded. Equity securities, for which there were no sales reported that day, are generally valued at the last quoted daily bid quotation as provided by a third-party pricing service on the market or exchange on which such securities are primarily traded. Equity securities held short, for which there were no sales reported for that day, are generally valued at the last quoted daily ask quotation as provided by a third-party pricing service on the market or exchange on which such securities are primarily traded. Debt instruments and floating rate loans (other than short-term instruments), including restricted debt instruments, are generally valued at an evaluated or composite bid as provided by a third-party pricing service. Short-term instruments with a maturity at issuance of 60 days or less generally are valued at amortized cost, which approximates market value. Exchange-traded options
21
Notes to Financial Statements (unaudited) – continued
are generally valued at the last sale or official closing price as provided by a third-party pricing service on the exchange on which such options are primarily traded. Exchange-traded options for which there were no sales reported that day are generally valued at the last daily bid quotation as provided by a third-party pricing service on the exchange on which such options are primarily traded. Options not traded on an exchange are generally valued at a broker/dealer bid quotation. Foreign currency options are generally valued using an external pricing model that uses market data from a third-party source. Open-end investment companies are generally valued at net asset value per share. Securities and other assets generally valued on the basis of information from a third-party pricing service may also be valued at a broker/dealer bid quotation. Values obtained from third-party pricing services can utilize both transaction data and market information such as yield, quality, coupon rate, maturity, type of issue, trading characteristics, and other market data. The values of foreign securities and other assets and liabilities expressed in foreign currencies are converted to U.S. dollars using the mean of bid and asked prices for rates provided by a third-party pricing service.
The Board of Trustees has delegated primary responsibility for determining or causing to be determined the value of the fund’s investments (including any fair valuation) to the adviser pursuant to valuation policies and procedures approved by the Board. If the adviser determines that reliable market quotations are not readily available, investments are valued at fair value as determined in good faith by the adviser in accordance with such procedures under the oversight of the Board of Trustees. Under the fund’s valuation policies and procedures, market quotations are not considered to be readily available for most types of debt instruments and floating rate loans and many types of derivatives. These investments are generally valued at fair value based on information from third-party pricing services. In addition, investments may be valued at fair value if the adviser determines that an investment’s value has been materially affected by events occurring after the close of the exchange or market on which the investment is principally traded (such as foreign exchange or market) and prior to the determination of the fund’s net asset value, or after the halting of trading of a specific security where trading does not resume prior to the close of the exchange or market on which the security is principally traded. Events that occur on a frequent basis after foreign markets close (such as developments in foreign markets and significant movements in the U.S. markets) and prior to the determination of the fund’s net asset value may be deemed to have a material effect on the value of securities traded in foreign markets. Accordingly, the fund’s foreign equity securities may often be valued at fair value. The adviser generally relies on third-party pricing services or other information (such as the correlation with price movements of similar securities in the same or other markets; the type,
22
Notes to Financial Statements (unaudited) – continued
cost and investment characteristics of the security; the business and financial condition of the issuer; and trading and other market data) to assist in determining whether to fair value and at what value to fair value an investment. The value of an investment for purposes of calculating the fund’s net asset value can differ depending on the source and method used to determine value. When fair valuation is used, the value of an investment used to determine the fund’s net asset value may differ from quoted or published prices for the same investment. There can be no assurance that the fund could obtain the fair value assigned to an investment if it were to sell the investment at the same time at which the fund determines its net asset value per share.
Various inputs are used in determining the value of the fund’s assets or liabilities. These inputs are categorized into three broad levels. In certain cases, the inputs used to measure fair value may fall into different levels of the fair value hierarchy. In such cases, an investment’s level within the fair value hierarchy is based on the lowest level of input that is significant to the fair value measurement. The fund’s assessment of the significance of a particular input to the fair value measurement in its entirety requires judgment, and considers factors specific to the investment. Level 1 includes unadjusted quoted prices in active markets for identical assets or liabilities. Level 2 includes other significant observable market-based inputs (including quoted prices for similar securities, interest rates, prepayment speed, and credit risk). Level 3 includes unobservable inputs, which may include the adviser’s own assumptions in determining the fair value of investments. Other financial instruments are derivative instruments not reflected in total investments, such as futures, forwards, swap contracts, and written options. The following is a summary of the levels used as of February 28, 2010 in valuing the fund’s assets or liabilities:
| | | | | | | | | | |
| Investments at Value | | Level 1 | | | Level 2 | | Level 3 | | Total | |
| Equity Securities | | $157,453,864 | | | $— | | $— | | $157,453,864 | |
| Corporate Bonds | | — | | | 5,687,755 | | — | | 5,687,755 | |
| Mutual Funds | | 2,598,239 | | | — | | — | | 2,598,239 | |
| Total Investments | | $160,052,103 | | | $5,687,755 | | $— | | $165,739,858 | |
| | | | |
| Short Sales | | $(4,298,380 | ) | | $— | | $— | | $(4,298,380 | ) |
For further information regarding security characteristics, see the Portfolio of Investments.
In January 2010, Accounting Standards Update (ASU) No. 2010-06, Improving Disclosures about Fair Value Measurements (the “Update”) was issued, and is effective for interim and annual reporting periods beginning after December 15, 2009. This Update provides for expanded disclosures about fair value measurements. Management has evaluated the application of the Update
23
Notes to Financial Statements (unaudited) – continued
to the fund, and believes the impact is limited to expanded disclosures resulting from the adoption of this Update in the fund’s financial statements.
Foreign Currency Translation – Purchases and sales of foreign investments, income, and expenses are converted into U.S. dollars based upon currency exchange rates prevailing on the respective dates of such transactions or on the reporting date for foreign denominated receivables and payables. Gains and losses attributable to foreign currency exchange rates on sales of securities are recorded for financial statement purposes as net realized gains and losses on investments. Gains and losses attributable to foreign exchange rate movements on receivables, payables, income and expenses are recorded for financial statement purposes as foreign currency transaction gains and losses. That portion of both realized and unrealized gains and losses on investments that results from fluctuations in foreign currency exchange rates is not separately disclosed.
Derivatives – The fund may use derivatives for different purposes, including to earn income and enhance returns, to increase or decrease exposure to a particular market, to manage or adjust the risk profile of the fund, or as alternatives to direct investments. Derivatives may be used for hedging or non-hedging purposes. While hedging can reduce or eliminate losses, it can also reduce or eliminate gains. When the fund uses derivatives as an investment to increase market exposure, or for hedging purposes, gains and losses from derivative instruments may be substantially greater than the derivative’s original cost.
Derivative instruments include written options, purchased options, futures contracts, forward foreign currency exchange contracts, and swap agreements. The fund’s period end derivatives, as presented in the Portfolio of Investments and the associated Derivative Contract Tables, generally are indicative of the volume of its derivative activity during the period.
The following table presents, by major type of derivative contract, the fair value, on a gross basis, of the asset and liability components of derivatives held by the fund at February 28, 2010, which are not accounted for as hedging instruments under FASB Accounting standard Codification 815, Derivatives and Hedging (ASC 815):
| | | | |
| | | | | Fair Value (a) |
| Risk | | Derivative | | Asset Derivatives |
| Equity Contracts | | Purchased Equity Options | | $586,974 |
| (a) | The value of purchased options outstanding is included in total investments, at value, within the fund’s Statement of Assets and Liabilities. |
24
Notes to Financial Statements (unaudited) – continued
The following table presents, by major type of derivative contract, the realized gain (loss) on derivatives held by the fund for the six months ended February 28, 2010 as reported in the Statement of Operations:
| | | | | | |
| | | Purchased
Options | | | Written
Options | |
| Equity Contracts | | $(1,653,736 | ) | | $(148,669 | ) |
The following table presents, by major type of derivative contract, the change in unrealized appreciation (depreciation) on derivatives held by the fund for the six months ended February 28, 2010 as reported in the Statement of Operations:
| | | |
| | | Purchased Options | |
| Equity Contracts | | $(738,871 | ) |
Derivative counterparty credit risk is managed through formal evaluation of the creditworthiness of all potential counterparties. On certain over-the-counter derivatives, the fund attempts to reduce its exposure to counterparty credit risk whenever possible by entering into an International Swaps and Derivatives Association (ISDA) Master Agreement on a bilateral basis with each of the counterparties with whom it undertakes a significant volume of transactions. The ISDA Master Agreement gives each party to the agreement the right to terminate all transactions traded under such agreement if there is a certain deterioration in the credit quality of the other party. The ISDA Master Agreement gives the fund the right, upon an event of default by the applicable counterparty or a termination of the agreement, to close out all transactions traded under such agreement and to net amounts owed under each transaction to one net amount payable by one party to the other. This right to close out and net payments across all transactions traded under the ISDA Master Agreement could result in a reduction of the fund’s credit risk to such counterparty equal to any amounts payable by the fund under the applicable transactions, if any. However, absent an event of default by the counterparty or a termination of the agreement, the ISDA Master Agreement does not result in an offset of reported balance sheet assets and liabilities across transactions between the fund and the applicable counterparty.
Collateral requirements differ by type of derivative. Collateral or margin requirements are set by the broker or exchange clearing house for exchange traded derivatives (i.e., futures and exchange-traded options) while collateral terms are contract specific for over-the-counter traded derivatives (i.e., forwards, swaps and over-the-counter options). For derivatives traded under an ISDA Master Agreement, the collateral requirements are netted across all transactions traded under such agreement and one amount is posted from one party to the other to collateralize such obligations. Cash collateral that has been
25
Notes to Financial Statements (unaudited) – continued
pledged to cover obligations of the fund under derivative contracts will be reported separately on the Statement of Assets and Liabilities as restricted cash. Securities collateral pledged for the same purpose is noted in the Portfolio of Investments.
Written Options – In exchange for a premium, the fund writes call or put options on securities for which it believes the premium received exceeds the potential loss that would result from adverse price changes in the options’ underlying securities. In a written option, the fund as the option writer grants the buyer the right to purchase from, or sell to, the fund a specified number of shares or units of a particular security, currency or index at a specified price within a specified period of time.
The premium received is initially recorded as a liability on the Statement of Assets and Liabilities. The option is subsequently marked-to-market daily with the difference between the premium received and the market value of the written option being recorded as unrealized appreciation or depreciation. When a written option expires, the fund realizes a gain equal to the amount of the premium received. The difference between the premium received and the amount paid on effecting a closing transaction is considered a realized gain or loss. When a written call option is exercised, the premium received is offset against the proceeds to determine the realized gain or loss. When a written put option is exercised, the premium reduces the cost basis of the security purchased by the fund.
At the initiation of the written option contract, for exchange traded options, the fund is required to deposit securities or cash as collateral with the custodian for the benefit of the broker. For over-the-counter options, the fund may post collateral subject to the terms of an ISDA Master Agreement as generally described above if the market value of the options contract moves against it. The fund, as writer of an option, may have no control over whether the underlying securities may be sold (call) or purchased (put) and, as a result, bears the market risk of an unfavorable change in the price of the securities underlying the written option. Although the fund’s market risk may be significant, the maximum counterparty credit risk to the fund is equal to the market value of any collateral posted to the broker. For over-the-counter options, this risk is mitigated in cases where there is an ISDA Master Agreement between the fund and the counterparty providing for netting as described above.
26
Notes to Financial Statements (unaudited) – continued
Written Option Transactions
| | | | | | |
| | | Number of
contracts | | | Premiums
Received | |
| Outstanding, beginning of period | | — | | | $— | |
| Options written | | 78 | | | 93,365 | |
| Options closed | | (78 | ) | | (93,365 | ) |
| Outstanding, end of period | | — | | | $— | |
Purchased Options – The fund may purchase call or put options for a premium. Purchased options entitle the holder to buy or sell a specified number of shares or units of a particular security, currency or index at a specified price at a specified date or within a specified period of time. Purchasing call options may be used to hedge against an anticipated increase in the dollar cost of securities or currency to be acquired or to increase the fund’s exposure to an underlying instrument. Purchasing put options may hedge against a decline in the value of portfolio securities or currency.
The premium paid is initially recorded as an investment in the Statement of Assets and Liabilities. That investment is subsequently marked-to-market daily with the difference between the premium paid and the market value of the purchased option being recorded as unrealized appreciation or depreciation. Premiums paid for purchased options which have expired are treated as realized losses on investments in the Statement of Operations. Upon the exercise or closing of a purchased option, the premium paid is either added to the cost of the security or financial instrument in the case of a call option, or offset against the proceeds on the sale of the underlying security or financial instrument in the case of a put option, in order to determine the realized gain or loss on investments.
The risk in purchasing an option is that the fund pays a premium whether or not the option is exercised. The fund’s maximum risk of loss due to counterparty credit risk is limited to the market value of the option. For over-the-counter options, this risk is mitigated in cases where there is an ISDA Master Agreement between the fund and the counterparty providing for netting as described above and for posting of collateral by the counterparty to the fund to cover the fund’s exposure to the counterparty under such ISDA Master Agreement.
Short Sales – The fund may enter into short sales whereby it sells a security it does not own in anticipation of a decline in the value of that security. The fund will realize a gain if the security price decreases and a loss if the security price increases between the date of the short sale and the date on which the fund replaces the borrowed security. Losses from short sales can exceed the proceeds of the security sold; and they can also exceed the potential loss from an ordinary buy and sell transaction. The amount of any premium, dividends, or
27
Notes to Financial Statements (unaudited) – continued
interest the fund may be required to pay in connection with a short sale will be recognized as a fund expense. During the six months ended February 28, 2010, this expense amounted to $36,199. The fund segregates cash or marketable securities in an amount that, when combined with the amount of proceeds from the short sale deposited with the broker, at least equals the current market value of the security sold short.
Security Loans – State Street Bank and Trust Company (“State Street”), as lending agent, may loan the securities of the fund to certain qualified institutions (the “Borrowers”) approved by the fund. The loans are collateralized by cash and/or U.S. Treasury and federal agency obligations in an amount typically at least equal to the market value of the securities loaned. The market value of the loaned securities is determined at the close of business of the fund and any additional required collateral is delivered to the fund on the next business day. State Street provides the fund with indemnification against Borrower default. The fund bears the risk of loss with respect to the investment of cash collateral. On loans collateralized by cash, the cash collateral is invested in a money market fund or short-term securities. A portion of the income generated upon investment of the collateral is remitted to the Borrowers, and the remainder is allocated between the fund and the lending agent. On loans collateralized by U.S. Treasury and/or federal agency obligations, a fee is received from the Borrower, and is allocated between the fund and the lending agent. Income from securities lending is included in interest income on the Statement of Operations. The dividend and interest income earned on the securities loaned is accounted for in the same manner as other dividend and interest income.
Indemnifications – Under the fund’s organizational documents, its officers and Trustees may be indemnified against certain liabilities and expenses arising out of the performance of their duties to the fund. Additionally, in the normal course of business, the fund enters into agreements with service providers that may contain indemnification clauses. The fund’s maximum exposure under these agreements is unknown as this would involve future claims that may be made against the fund that have not yet occurred.
Investment Transactions and Income – Investment transactions are recorded on the trade date. Interest income is recorded on the accrual basis. All premium and discount is amortized or accreted for financial statement purposes in accordance with U.S. generally accepted accounting principles. Dividends received in cash are recorded on the ex-dividend date. Certain dividends from foreign securities will be recorded when the fund is informed of the dividend if such information is obtained subsequent to the ex-dividend date. Dividend and interest payments received in additional securities are recorded on the ex-dividend or ex-interest date in an amount equal to the value
28
Notes to Financial Statements (unaudited) – continued
of the security on such date. The fund may receive proceeds from litigation settlements. Any proceeds received from litigation involving portfolio holdings are reflected in the Statement of Operations in realized gain/loss if the security has been disposed of by the fund or in unrealized gain/loss if the security is still held by the fund. Any other proceeds from litigation not related to portfolio holdings are reflected as other income in the Statement of Operations.
Fees Paid Indirectly – The fund’s custody fee may be reduced according to an arrangement that measures the value of cash deposited with the custodian by the fund. This amount, for the six months ended February 28, 2010, is shown as a reduction of total expenses on the Statement of Operations.
Tax Matters and Distributions – The fund intends to qualify as a regulated investment company, as defined under Subchapter M of the Internal Revenue Code, and to distribute all of its taxable income, including realized capital gains. As a result, no provision for federal income tax is required. The fund’s federal tax returns for the prior three fiscal years remain subject to examination by the Internal Revenue Service. Foreign taxes, if any, have been accrued by the fund in the accompanying financial statements.
Distributions to shareholders are recorded on the ex-dividend date. Income and capital gain distributions are determined in accordance with income tax regulations, which may differ from U.S. generally accepted accounting principles. Certain capital accounts in the financial statements are periodically adjusted for permanent differences in order to reflect their tax character. These adjustments have no impact on net assets or net asset value per share. Temporary differences which arise from recognizing certain items of income, expense, gain or loss in different periods for financial statement and tax purposes will reverse at some time in the future. Distributions in excess of net investment income or net realized gains are temporary overdistributions for financial statement purposes resulting from differences in the recognition or classification of income or distributions for financial statement and tax purposes.
Book/tax differences primarily relate to net operating losses, expiration of capital loss carryforwards, and wash sale loss deferrals.
The fund declared no distributions for the year ended August 31, 2009.
29
Notes to Financial Statements (unaudited) – continued
The federal tax cost and the tax basis components of distributable earnings were as follows:
| | | |
| As of 2/28/10 | | | |
| Cost of investments | | $168,206,386 | |
| Gross appreciation | | 9,574,302 | |
| Gross depreciation | | (12,040,830 | ) |
| Net unrealized appreciation (depreciation) | | $(2,466,528 | ) |
| |
| As of 8/31/09 | | | |
| Capital loss carryforwards | | (106,482,196 | ) |
| Post-October capital loss deferral | | (17,084,500 | ) |
| Other temporary differences | | (24,829 | ) |
| Net unrealized appreciation (depreciation) | | (4,361,024 | ) |
The aggregate cost above includes prior fiscal year end tax adjustments.
As of August 31, 2009, the fund had capital loss carryforwards available to offset future realized gains. Such losses expire as follows:
| | | |
| 8/31/10 | | $(13,128,962 | ) |
| 8/31/11 | | (74,891,618 | ) |
| 8/31/12 | | (4,463,246 | ) |
| 8/31/17 | | (13,998,370 | ) |
| Total | | $(106,482,196 | ) |
The availability of a portion of the capital loss carryforwards, which were acquired on August 22, 2003 in connection with the the MFS Global Telecommunications Fund merger, may be limited in a given year.
Multiple Classes of Shares of Beneficial Interest – The fund offers multiple classes of shares, which differ in their respective distribution and service fees. The fund’s income, realized and unrealized gain (loss), and common expenses are allocated to shareholders based on the daily net assets of each class. Dividends are declared separately for each class. Differences in per share dividend rates are generally due to differences in separate class expenses. Class B shares will convert to Class A shares approximately eight years after purchase.
| (3) | | Transactions with Affiliates |
Investment Adviser – The fund has an investment advisory agreement with MFS to provide overall investment management and related administrative services and facilities to the fund.
The management fee is computed daily and paid monthly at the following annual rates:
| | | |
| First $1 billion of average daily net assets | | 0.75 | % |
| Average daily net assets in excess of $1 billion | | 0.70 | % |
30
Notes to Financial Statements (unaudited) – continued
The management fee incurred for the six months ended February 28, 2010 was equivalent to an annual effective rate of 0.75% of the fund’s average daily net assets.
The investment adviser had agreed in writing to pay a portion of the fund’s operating expenses, exclusive of management fee, distribution and service fee, interest, taxes, extraordinary expenses, brokerage and transaction costs, and investment-related expenses, such that operating expenses did not exceed 0.40% annually of the fund’s average daily net assets. This agreement terminated on December 31, 2009. For the period September 1, 2009 through December 31, 2009 this reduction amounted to $78,340 and is reflected as a reduction of total expenses in the Statement of Operations.
Effective January 1, 2010, the investment adviser has agreed in writing to pay a portion of the fund’s total annual operating expenses, exclusive of interest, taxes, extraordinary expenses, brokerage and transaction costs, and investment-related expenses, such that total annual fund operating expenses do not exceed the following rates annually of the fund’s average daily net assets.
| | | | | | | | | | | | | | |
| Class A | | Class B | | Class C | | Class I | | Class R1 | | Class R2 | | Class R3 | | Class R4 |
| 1.63% | | 2.38% | | 2.38% | | 1.38% | | 2.38% | | 1.88% | | 1.63% | | 1.38% |
This written agreement will continue until modified by the fund’s Board of Trustees, but such agreement will continue at least until December 31, 2010. For the period January 1, 2010 through February 28, 2010, this reduction amounted to $980 and is reflected as a reduction of total expenses in the Statement of Operations.
Distributor – MFS Fund Distributors, Inc. (MFD), a wholly-owned subsidiary of MFS, as distributor, received $23,318 for the six months ended February 28, 2010, as its portion of the initial sales charge on sales of Class A shares of the fund.
The Board of Trustees has adopted a distribution plan for certain class shares pursuant to Rule 12b-1 of the Investment Company Act of 1940.
The fund’s distribution plan provides that the fund will pay MFD for services provided by MFD and financial intermediaries in connection with the distribution and servicing of certain share classes. One component of the plan is a distribution fee paid to MFD and another component of the plan is a service fee paid to MFD. MFD may subsequently pay all, or a portion, of the distribution and/or service fees to financial intermediaries.
31
Notes to Financial Statements (unaudited) – continued
Distribution Plan Fee Table:
| | | | | | | | | | |
| | | Distribution
Fee Rate (d) | | Service
Fee Rate (d) | | Total
Distribution
Plan (d) | | Annual
Effective
Rate (e) | | Distribution
and Service
Fee |
| Class A | | — | | 0.25% | | 0.25% | | 0.25% | | $120,054 |
| Class B | | 0.75% | | 0.25% | | 1.00% | | 1.00% | | 77,484 |
| Class C | | 0.75% | | 0.25% | | 1.00% | | 1.00% | | 94,737 |
| Class R1 | | 0.75% | | 0.25% | | 1.00% | | 1.00% | | 8,197 |
| Class R2 | | 0.25% | | 0.25% | | 0.50% | | 0.50% | | 37,778 |
| Class R3 | | — | | 0.25% | | 0.25% | | 0.25% | | 4,259 |
| Total Distribution and Service Fees | | | | $342,509 |
| (d) | In accordance with the distribution plan for certain classes, the fund pays distribution and/or service fees equal to these annual percentage rates of each class’ average daily net assets. The distribution and service fee rates disclosed by class represent the current rates in effect at the end of the reporting period. Any rate changes, if applicable, are detailed below. |
| (e) | The annual effective rates represent actual fees incurred under the distribution plan for the six months ended February 28, 2010 based on each class’ average daily net assets. |
Certain Class A shares purchased on or subsequent to September 1, 2008 are subject to a contingent deferred sales charge (CDSC) in the event of a shareholder redemption within 24 months of purchase. Class C shares are subject to a CDSC in the event of a shareholder redemption within 12 months of purchase. Class B shares are subject to a CDSC in the event of a shareholder redemption within six years of purchase. All contingent deferred sales charges are paid to MFD and during the six months ended February 28, 2010, were as follows:
| | |
| | | Amount |
| Class A | | $— |
| Class B | | 10,241 |
| Class C | | 1,345 |
Shareholder Servicing Agent – MFS Service Center, Inc. (MFSC), a wholly-owned subsidiary of MFS, receives a fee from the fund for its services as shareholder servicing agent calculated as a percentage of the average daily net assets of the fund as determined periodically under the supervision of the fund’s Board of Trustees. For the six months ended February 28, 2010, the fee was $172,401, which equated to 0.2161% annually of the fund’s average daily net assets. MFSC also receives payment from the fund for out-of-pocket expenses, sub-accounting and other shareholder servicing costs which may be paid to affiliated and unaffiliated service providers. For the six months ended February 28, 2010, these out-of-pocket expenses, sub-accounting and other shareholder servicing costs amounted to $125,409.
Administrator – MFS provides certain financial, legal, shareholder communications, compliance, and other administrative services to the fund. Under an administrative services agreement, the fund partially reimburses MFS the costs incurred to provide these services. The fund is charged an
32
Notes to Financial Statements (unaudited) – continued
annual fixed amount of $17,500 plus a fee based on average daily net assets. The administrative services fee incurred for the six months ended February 28, 2010 was equivalent to an annual effective rate of 0.0211% of the fund’s average daily net assets.
Trustees’ and Officers’ Compensation – The fund pays compensation to independent Trustees in the form of a retainer, attendance fees, and additional compensation to Board and Committee chairpersons. The fund does not pay compensation directly to Trustees or officers of the fund who are also officers of the investment adviser, all of whom receive remuneration for their services to the fund from MFS. Certain officers and Trustees of the fund are officers or directors of MFS, MFD, and MFSC.
Prior to December 31, 2001, the fund had an unfunded defined benefit plan (“DB plan”) for independent Trustees. As of December 31, 2001, the Board took action to terminate the DB plan with respect to then-current and any future independent Trustees, such that the DB Plan covers only certain of those former independent Trustees who retired on or before December 31, 2001. Effective January 1, 2002, accrued benefits under the DB Plan for then current independent Trustees who continued were credited to an unfunded retirement deferral plan (the “Retirement Deferral plan”), which was established for and exists solely with respect to these credited amounts, and is not available for other deferrals by these or other independent Trustees. Although the Retirement Deferral plan is unfunded, amounts deferred under the plan are periodically adjusted for investment experience as if they had been invested in shares of the fund. The DB Plan resulted in a pension expense of $252 and the Retirement Deferral plan resulted in an expense of $3,559. Both amounts are included in independent Trustees’ compensation for the six months ended February 28, 2010. The liability for deferred retirement benefits payable to certain independent Trustees under both Plans amounted to $51,656 at February 28, 2010, and is included in payable for independent Trustees’ compensation on the Statement of Assets and Liabilities.
Other – This fund and certain other funds managed by MFS (the funds) have entered into services agreements (the Agreements) which provide for payment of fees by the funds to Tarantino LLC and Griffin Compliance LLC in return for the provision of services of an Independent Chief Compliance Officer (ICCO) and Assistant ICCO, respectively, for the funds. The ICCO and Assistant ICCO are officers of the funds and the sole members of Tarantino LLC and Griffin Compliance LLC, respectively. The funds can terminate the Agreements with Tarantino LLC and Griffin Compliance LLC at any time under the terms of the Agreements. For the six months ended February 28, 2010, the aggregate fees paid by the fund to Tarantino LLC and Griffin Compliance LLC were $920 and are included in miscellaneous expense on the Statement of Operations. MFS
33
Notes to Financial Statements (unaudited) – continued
has agreed to reimburse the fund for a portion of the payments made by the fund in the amount of $317, which is shown as a reduction of total expenses in the Statement of Operations. Additionally, MFS has agreed to bear all expenses associated with office space, other administrative support, and supplies provided to the ICCO and Assistant ICCO.
The fund may invest in the MFS Institutional Money Market Portfolio which is managed by MFS and seeks a high level of current income consistent with preservation of capital and liquidity. Income earned on this investment is included in dividends from underlying funds on the Statement of Operations. This money market fund does not pay a management fee to MFS.
Purchases and sales of investments, other than U.S. Government securities, purchased option transactions, short sales, and short-term obligations, aggregated $170,018,950 and $156,338,951, respectively.
| (5) | | Shares of Beneficial Interest |
The fund’s Declaration of Trust permits the Trustees to issue an unlimited number of full and fractional shares of beneficial interest. Transactions in fund shares were as follows:
| | | | | | | | | | | | |
| | | Six months ended
2/28/10 | | | Year ended
8/31/09 | |
| | | Shares | | | Amount | | | Shares | | | Amount | |
| Shares sold | | | | | | | | | | | | |
Class A | | 2,005,815 | | | $23,926,003 | | | 5,014,951 | | | $46,118,308 | |
Class B | | 157,046 | | | 1,760,324 | | | 371,721 | | | 3,101,549 | |
Class C | | 534,818 | | | 6,020,729 | | | 473,991 | | | 4,114,178 | |
Class I | | 289,051 | | | 3,628,182 | | | 338,035 | | | 3,274,017 | |
Class R1 | | 25,775 | | | 288,842 | | | 86,025 | | | 682,554 | |
Class R2 | | 346,259 | | | 4,020,108 | | | 677,826 | | | 5,857,349 | |
Class R3 | | 66,265 | | | 787,814 | | | 147,649 | | | 1,212,851 | |
Class R4 | | 22,917 | | | 286,937 | | | 7,894 | | | 58,764 | |
| | 3,447,946 | | | $40,718,939 | | | 7,118,092 | | | $64,419,570 | |
| Shares reacquired | | | | | | | | | | | | |
Class A | | (1,563,392 | ) | | $(18,524,109 | ) | | (2,376,489 | ) | | $(21,266,305 | ) |
Class B | | (312,466 | ) | | (3,523,823 | ) | | (882,277 | ) | | (7,019,791 | ) |
Class C | | (171,132 | ) | | (1,899,002 | ) | | (334,157 | ) | | (2,670,474 | ) |
Class I | | (79,160 | ) | | (961,738 | ) | | (136,625 | ) | | (1,324,807 | ) |
Class R1 | | (28,345 | ) | | (316,883 | ) | | (105,398 | ) | | (908,227 | ) |
Class R2 | | (361,295 | ) | | (4,211,843 | ) | | (396,304 | ) | | (3,409,828 | ) |
Class R3 | | (53,432 | ) | | (634,579 | ) | | (56,395 | ) | | (485,407 | ) |
Class R4 | | (2,183 | ) | | (26,406 | ) | | (257 | ) | | (2,206 | ) |
| | (2,571,405 | ) | | $(30,098,383 | ) | | (4,287,902 | ) | | $(37,087,045 | ) |
34
Notes to Financial Statements (unaudited) – continued
| | | | | | | | | | | | |
| | | Six months ended
2/28/10 | | | Year ended
8/31/09 | |
| | | Shares | | | Amount | | | Shares | | | Amount | |
| Net change | | | | | | | | | | | | |
Class A | | 442,423 | | | $5,401,894 | | | 2,638,462 | | | $24,852,003 | |
Class B | | (155,420 | ) | | (1,763,499 | ) | | (510,556 | ) | | (3,918,242 | ) |
Class C | | 363,686 | | | 4,121,727 | | | 139,834 | | | 1,443,704 | |
Class I | | 209,891 | | | 2,666,444 | | | 201,410 | | | 1,949,210 | |
Class R1 | | (2,570 | ) | | (28,041 | ) | | (19,373 | ) | | (225,673 | ) |
Class R2 | | (15,036 | ) | | (191,735 | ) | | 281,522 | | | 2,447,521 | |
Class R3 | | 12,833 | | | 153,235 | | | 91,254 | | | 727,444 | |
Class R4 | | 20,734 | | | 260,531 | | | 7,637 | | | 56,558 | |
| | 876,541 | | | $10,620,556 | | | 2,830,190 | | | $27,332,525 | |
The fund and certain other funds managed by MFS participate in a $1.1 billion unsecured committed line of credit, subject to a $1 billion sublimit, provided by a syndication of banks under a credit agreement. Borrowings may be made for temporary financing needs. Interest is charged to each fund, based on its borrowings, generally at a rate equal to the higher of the Federal Reserve funds rate or one month LIBOR plus an agreed upon spread. A commitment fee, based on the average daily, unused portion of the committed line of credit, is allocated among the participating funds at the end of each calendar quarter. In addition, the fund and other funds managed by MFS have established unsecured uncommitted borrowing arrangements with certain banks for temporary financing needs. Interest is charged to each fund, based on its borrowings, at a rate equal to the Federal Reserve funds rate plus an agreed upon spread. For the six months ended February 28, 2010, the fund’s commitment fee and interest expense were $997 and $0, respectively, and are included in miscellaneous expense on the Statement of Operations.
| (7) | | Transactions in Underlying Funds-Affiliated Issuers |
An affiliated issuer may be considered one in which the fund owns 5% or more of the outstanding voting securities, or a company which is under common control. For the purposes of this report, the fund assumes the following to be affiliated issuers:
| | | | | | | | | |
| Underlying Funds | | Beginning
Shares/Par
Amount | | Acquisitions
Shares/Par
Amount | | Dispositions
Shares/Par
Amount | | | Ending
Shares/Par
Amount |
MFS Institutional Money
Market Portfolio | | 2,364,705 | | 34,244,426 | | (36,608,932 | ) | | 199 |
| | | | |
| Underlying Funds | | Realized
Gain (Loss) | | Capital Gain
Distributions | | Dividend
Income | | | Ending
Value |
MFS Institutional Money
Market Portfolio | | $— | | $— | | $1,943 | | | $199 |
35
RESULTS OF SHAREHOLDER MEETING
(unaudited)
At a special meeting of shareholders of MFS Series Trust I, which was held on January 28, 2010, the following actions were taken:
Item 1. To elect the following individuals as Trustees:
| | | | |
| | | Number of Dollars |
Nominee | | For | | Withheld Authority |
| Robert E. Butler | | 13,799,428,259.131 | | 298,698,895.701 |
| Lawrence H. Cohn | | 13,775,964,000.646 | | 322,163,154.185 |
| Maureen R. Goldfarb | | 13,797,667,920.487 | | 300,459,234.345 |
| David H. Gunning | | 13,795,139,579.854 | | 302,987,574.978 |
| William R. Gutow | | 13,798,125,706.624 | | 300,001,448.207 |
| Michael Hegarty | | 13,780,926,681.791 | | 317,200,473.041 |
| John P. Kavanaugh | | 13,799,879,923.291 | | 298,247,231.541 |
| Robert J. Manning | | 13,802,393,104.041 | | 295,734,050.791 |
| Robert C. Pozen | | 13,802,480,679.754 | | 295,646,475.078 |
| J. Dale Sherratt | | 13,779,899,981.473 | | 318,227,173.359 |
| Laurie J. Thomsen | | 13,797,678,786.081 | | 300,448,368.750 |
| Robert W. Uek | | 13,798,504,506.307 | | 299,622,648.525 |
36
BOARD REVIEW OF INVESTMENT ADVISORY AGREEMENT
A discussion regarding the Board’s most recent review and renewal of the fund’s Investment Advisory Agreement with MFS is available by clicking on the fund’s name under “Mutual Funds” in the “Products and Performance” section of the MFS Web site (mfs.com).
PROXY VOTING POLICIES AND INFORMATION
A general description of the MFS funds’ proxy voting policies and procedures is available without charge, upon request, by calling 1-800-225-2606, by visiting the Proxy Voting section of mfs.com or by visiting the SEC’s Web site at http://www.sec.gov.
Information regarding how the fund voted proxies relating to portfolio securities during the most recent twelve-month period ended June 30 is available without charge by visiting the Proxy Voting section of mfs.com or by visiting the SEC’s Web site at http://www.sec.gov.
QUARTERLY PORTFOLIO DISCLOSURE
The fund will file a complete schedule of portfolio holdings with the Securities and Exchange Commission (the Commission) for the first and third quarters of each fiscal year on Form N-Q. The fund’s Form N-Q may be reviewed and copied at the:
Public Reference Room
Securities and Exchange Commission
100 F Street, NE, Room 1580
Washington, D.C. 20549
Information on the operation of the Public Reference Room may be obtained by calling the Commission at 1-800-SEC-0330. The fund’s Form N-Q is available on the EDGAR database on the Commission’s Internet Web site at http://www.sec.gov, and copies of this information may be obtained, upon payment of a duplicating fee, by electronic request at the following e-mail address: publicinfo@sec.gov or by writing the Public Reference Section at the above address.
A shareholder can also obtain the quarterly portfolio holdings report at mfs.com.
FURTHER INFORMATION
From time to time, MFS may post important information about the fund or the MFS funds on the MFS web site (mfs.com). This information is available by visiting the “News & Commentary” section of mfs.com or by clicking on the fund’s name under “Mutual Funds” in the “Products and Performance” section of mfs.com.
37
CONTACT US
Web site
mfs.com
MFS TALK
1-800-637-8255
24 hours a day
Account service and literature
Shareholders
1-800-225-2606
Investment professionals
1-800-343-2829
Retirement plan services
1-800-637-1255
Mailing address
MFS Service Center, Inc.
P.O. Box 55824
Boston, MA 02205-5824
Overnight mail
MFS Service Center, Inc.
c/o Boston Financial Data Services
30 Dan Road
Canton, MA 02021-2809

Save paper with eDelivery. MFS® will send you prospectuses, reports, and proxies directly via e-mail so you will get information faster with less mailbox clutter. To sign up: 1. go to mfs.com. 2. log in via MFS® Access. 3. select eDelivery. If you own your MFS fund shares through a financial institution or a retirement plan, MFS® TALK, MFS Access, and eDelivery may not be available to you.


MFS® Value Fund
The report is prepared for the general information of shareholders. It is authorized for distribution to prospective investors only when preceded or accompanied by a current prospectus.
NOT FDIC INSURED Ÿ MAY LOSE VALUE Ÿ
NO BANK GUARANTEE
2/28/10
EIF-SEM

LETTER FROM THE CEO
Dear Shareholders:
After having suffered their biggest declines since the Great Depression, most global markets experienced an impressive resurgence during the latter months of 2009 and the first quarter of 2010. The global economy was able to reap the benefits of two major trends. The first of these was the massive efforts of governments and central banks to increase liquidity in the financial system as they sought to prevent the credit crisis from further affecting the banking system. The second was the move by companies around the world to cut costs and operations to prepare for rapidly changing market conditions. We believe that these moves not only shortened the length of the downturn but also set the stage for the recovery we are seeing today.
Even with the significant market gains of 2009 and the early part of 2010, the recovery is unrolling at a moderate pace, with rebounds in the manufacturing sector and corporate America leading the way. Central bankers are proceeding with caution and have held benchmark interest rates unchanged as they debate the best way to withdraw stimulus measures without disrupting the fragile growth process.
While hurdles remain, we believe that the global economy is on the road to recovery. As always, we continue to be mindful of the many challenges faced at the individual, national, and international levels. It is at times such as these that we want to remind investors of the merits of maintaining a long-term view, adhering to basic investing principles such as asset allocation and diversification, and working closely with advisors to identify and research investment opportunities. At MFS®, we take particular pride in how well mutual funds can help investors by providing the diversification that is important in any type of market climate.
Respectfully,

Robert J. Manning
Chief Executive Officer and Chief Investment Officer
MFS Investment Management®
April 15, 2010
The opinions expressed in this letter are subject to change, may not be relied upon for investment advice, and no forecasts can be guaranteed.
1
PORTFOLIO COMPOSITION
Portfolio structure
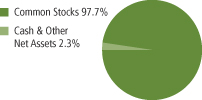
| | |
| Top ten holdings | | |
| Lockheed Martin Corp. | | 4.4% |
| AT&T, Inc. | | 3.2% |
| Philip Morris International, Inc. | | 3.0% |
| Bank of New York Mellon Corp. | | 2.9% |
| JPMorgan Chase & Co. | | 2.7% |
| MetLife, Inc. | | 2.5% |
| Goldman Sachs Group, Inc. | | 2.5% |
| Johnson & Johnson | | 2.5% |
| Northrop Grumman Corp. | | 2.4% |
| United Technologies Corp. | | 2.2% |
| | |
| Equity sectors | | |
| Financial Services | | 21.7% |
| Energy | | 12.8% |
| Health Care | | 11.7% |
| Industrial Goods & Services | | 10.9% |
| Consumer Staples | | 10.7% |
| Utilities & Communications | | 9.4% |
| Technology | | 4.9% |
| Retailing | | 4.8% |
| Special Products & Services | | 3.0% |
| Leisure | | 2.8% |
| Basic Materials | | 2.7% |
| Autos & Housing | | 2.0% |
| Transportation | | 0.3% |
Percentages are based on net assets as of 2/28/10.
The portfolio is actively managed and current holdings may be different.
2
MARKET ENVIRONMENT
After having suffered through one of the largest and most concentrated downturns since the 1930s, most asset markets staged a remarkable rebound during 2009. This recovery in global activity, which covers this reporting period, has been led importantly by emerging Asian economies, but broadening to include most of the global economy to varying degrees. Primary drivers of the recovery included an unwinding of the inventory destocking that took place earlier, as well as massive fiscal and monetary stimulus.
During the worst of the credit crisis, policy makers globally loosened monetary and fiscal policy on a massive scale. Having reached their lower bound on policy rates prior to the beginning of the reporting period, several central banks were implementing quantitative easing as a means to further loosen monetary policy to offset the continuing fall in global economic activity. However, by the beginning of the period, there were ever-broadening signs that the global macroeconomic deterioration had passed, which caused the subsequent rise in asset valuations. As most asset prices rebounded during the period and the demand for liquidity waned, the debate concerning the existence of asset bubbles and the need for monetary exit strategies had begun, creating added uncertainty regarding the forward path of policy rates. This changing dynamic caused asset valuations to move broadly sideways during the latter part of the period.
3
EXPENSE TABLE
Fund expenses borne by the shareholders during the period,
September 1, 2009 through February 28, 2010
As a shareholder of the fund, you incur two types of costs: (1) transaction costs, including sales charges (loads) on certain purchase or redemption payments, and (2) ongoing costs, including management fees; distribution and service (12b-1) fees; and other fund expenses. This example is intended to help you understand your ongoing costs (in dollars) of investing in the fund and to compare these costs with the ongoing costs of investing in other mutual funds.
The example is based on an investment of $1,000 invested at the beginning of the period and held for the entire period September 1, 2009 through February 28, 2010.
The expenses include the payment of a portion of the transfer-agent-related expenses of MFS funds that invest in the fund. For further information, please see the Notes to the Financial Statements.
Actual Expenses
The first line for each share class in the following table provides information about actual account values and actual expenses. You may use the information in this line, together with the amount you invested, to estimate the expenses that you paid over the period. Simply divide your account value by $1,000 (for example, an $8,600 account value divided by $1,000 = 8.6), then multiply the result by the number in the first line under the heading entitled “Expenses Paid During Period” to estimate the expenses you paid on your account during this period.
Hypothetical Example for Comparison Purposes
The second line for each share class in the following table provides information about hypothetical account values and hypothetical expenses based on the fund’s actual expense ratio and an assumed rate of return of 5% per year before expenses, which is not the fund’s actual return. The hypothetical account values and expenses may not be used to estimate the actual ending account balance or expenses you paid for the period. You may use this information to compare the ongoing costs of investing in the fund and other funds. To do so, compare this 5% hypothetical example with the 5% hypothetical examples that appear in the shareholder reports of the other funds.
Please note that the expenses shown in the table are meant to highlight your ongoing costs only and do not reflect any transactional costs, such as sales charges (loads). Therefore, the second line for each share class in the table is
4
Expense Table – continued
useful in comparing ongoing costs only, and will not help you determine the relative total costs of owning different funds. In addition, if these transactional costs were included, your costs would have been higher.
| | | | | | | | | | |
Share
Class | | | | Annualized
Expense
Ratio | | Beginning
Account Value
9/01/09 | | Ending
Account Value
2/28/10 | | Expenses
Paid During
Period (p)
9/01/09-2/28/10 |
| A | | Actual | | 0.96% | | $1,000.00 | | $1,071.83 | | $4.93 |
| | Hypothetical (h) | | 0.96% | | $1,000.00 | | $1,020.03 | | $4.81 |
| B | | Actual | | 1.71% | | $1,000.00 | | $1,067.59 | | $8.77 |
| | Hypothetical (h) | | 1.71% | | $1,000.00 | | $1,016.31 | | $8.55 |
| C | | Actual | | 1.71% | | $1,000.00 | | $1,067.52 | | $8.77 |
| | Hypothetical (h) | | 1.71% | | $1,000.00 | | $1,016.31 | | $8.55 |
| I | | Actual | | 0.71% | | $1,000.00 | | $1,072.86 | | $3.65 |
| | Hypothetical (h) | | 0.71% | | $1,000.00 | | $1,021.27 | | $3.56 |
| W | | Actual | | 0.81% | | $1,000.00 | | $1,072.77 | | $4.16 |
| | Hypothetical (h) | | 0.81% | | $1,000.00 | | $1,020.78 | | $4.06 |
| R1 | | Actual | | 1.71% | | $1,000.00 | | $1,068.07 | | $8.77 |
| | Hypothetical (h) | | 1.71% | | $1,000.00 | | $1,016.31 | | $8.55 |
| R2 | | Actual | | 1.21% | | $1,000.00 | | $1,070.67 | | $6.21 |
| | Hypothetical (h) | | 1.21% | | $1,000.00 | | $1,018.79 | | $6.06 |
| R3 | | Actual | | 0.96% | | $1,000.00 | | $1,072.09 | | $4.93 |
| | Hypothetical (h) | | 0.96% | | $1,000.00 | | $1,020.03 | | $4.81 |
| R4 | | Actual | | 0.71% | | $1,000.00 | | $1,073.20 | | $3.65 |
| | Hypothetical (h) | | 0.71% | | $1,000.00 | | $1,021.27 | | $3.56 |
| 529A | | Actual | | 1.06% | | $1,000.00 | | $1,071.21 | | $5.44 |
| | Hypothetical (h) | | 1.06% | | $1,000.00 | | $1,019.54 | | $5.31 |
| 529B | | Actual | | 1.81% | | $1,000.00 | | $1,067.36 | | $9.28 |
| | Hypothetical (h) | | 1.81% | | $1,000.00 | | $1,015.82 | | $9.05 |
| 529C | | Actual | | 1.81% | | $1,000.00 | | $1,067.55 | | $9.28 |
| | Hypothetical (h) | | 1.81% | | $1,000.00 | | $1,015.82 | | $9.05 |
| (h) | 5% class return per year before expenses. |
| (p) | Expenses paid is equal to each class’ annualized expense ratio, as shown above, multiplied by the average account value over the period, multiplied by the number of days in the period, divided by the number of days in the year. Expenses paid do not include any applicable sales charges (loads). If these transaction costs had been included, your costs would have been higher. |
5
PORTFOLIO OF INVESTMENTS
2/28/10 (unaudited)
The Portfolio of Investments is a complete list of all securities owned by your fund. It is categorized by broad-based asset classes.
| | | | | |
| Common Stocks - 97.7% | | | | | |
| Issuer | | Shares/Par | | Value ($) |
| | | | | |
| Aerospace - 9.6% | | | | | |
| Honeywell International, Inc. | | 2,358,790 | | $ | 94,729,000 |
| Lockheed Martin Corp. | | 7,154,197 | | | 556,310,359 |
| Northrop Grumman Corp. | | 4,948,915 | | | 303,170,533 |
| United Technologies Corp. | | 3,998,727 | | | 274,512,609 |
| | | | | |
| | | | | $ | 1,228,722,501 |
| Alcoholic Beverages - 1.3% | | | | | |
| Diageo PLC | | 10,235,219 | | $ | 166,054,811 |
| | |
| Apparel Manufacturers - 1.4% | | | | | |
| NIKE, Inc., “B” | | 2,730,370 | | $ | 184,573,012 |
| | |
| Automotive - 0.3% | | | | | |
| Johnson Controls, Inc. | | 1,418,185 | | $ | 44,105,554 |
| | |
| Broadcasting - 2.4% | | | | | |
| Omnicom Group, Inc. | | 3,644,900 | | $ | 133,476,238 |
| Walt Disney Co. | | 5,568,507 | | | 173,960,159 |
| | | | | |
| | | | | $ | 307,436,397 |
| Business Services - 2.8% | | | | | |
| Accenture Ltd., “A” | | 6,294,810 | | $ | 251,603,556 |
| Dun & Bradstreet Corp. | | 538,985 | | | 37,815,188 |
| MasterCard, Inc., “A” | | 19,300 | | | 4,330,341 |
| Western Union Co. | | 3,666,120 | | | 57,851,374 |
| | | | | |
| | | | | $ | 351,600,459 |
| Chemicals - 2.1% | | | | | |
| 3M Co. | | 1,419,613 | | $ | 113,781,982 |
| PPG Industries, Inc. | | 2,466,207 | | | 151,770,379 |
| | | | | |
| | | | | $ | 265,552,361 |
| Computer Software - 1.5% | | | | | |
| Oracle Corp. | | 7,532,563 | | $ | 185,677,678 |
6
Portfolio of Investments (unaudited) – continued
| | | | | |
| Issuer | | Shares/Par | | Value ($) |
| | | | | |
| Common Stocks - continued | | | | | |
| Computer Software - Systems - 1.9% | | | | | |
| Hewlett-Packard Co. | | 878,410 | | $ | 44,614,444 |
| International Business Machines Corp. | | 1,588,982 | | | 202,054,951 |
| | | | | |
| | | | | $ | 246,669,395 |
| Construction - 1.7% | | | | | |
| Black & Decker Corp. | | 720,520 | | $ | 52,216,084 |
| Pulte Homes, Inc. (a) | | 3,997,235 | | | 43,290,055 |
| Sherwin-Williams Co. | | 1,947,715 | | | 123,446,177 |
| | | | | |
| | | | | $ | 218,952,316 |
| Consumer Products - 1.3% | | | | | |
| Kimberly-Clark Corp. | | 652,520 | | $ | 39,634,065 |
| Procter & Gamble Co. | | 2,065,779 | | | 130,722,495 |
| | | | | |
| | | | | $ | 170,356,560 |
| Consumer Services - 0.2% | | | | | |
| Apollo Group, Inc., “A” (a) | | 339,225 | | $ | 20,312,793 |
| | |
| Electrical Equipment - 0.7% | | | | | |
| Danaher Corp. | | 855,090 | | $ | 63,251,007 |
| W.W. Grainger, Inc. | | 248,318 | | | 25,241,525 |
| | | | | |
| | | | | $ | 88,492,532 |
| Electronics - 1.4% | | | | | |
| Intel Corp. | | 8,783,307 | | $ | 180,321,293 |
| | |
| Energy - Independent - 4.3% | | | | | |
| Apache Corp. | | 1,947,170 | | $ | 201,804,699 |
| Devon Energy Corp. | | 2,052,127 | | | 141,309,465 |
| EOG Resources, Inc. | | 1,186,430 | | | 111,583,742 |
| Occidental Petroleum Corp. | | 1,140,652 | | | 91,081,062 |
| | | | | |
| | | | | $ | 545,778,968 |
| Energy - Integrated - 7.7% | | | | | |
| Chevron Corp. | | 3,662,874 | | $ | 264,825,790 |
| ConocoPhillips | | 1,150,920 | | | 55,244,160 |
| Exxon Mobil Corp. | | 3,767,435 | | | 244,883,275 |
| Hess Corp. | | 2,802,120 | | | 164,764,656 |
| TOTAL S.A., ADR | | 4,653,474 | | | 259,012,363 |
| | | | | |
| | | | | $ | 988,730,244 |
7
Portfolio of Investments (unaudited) – continued
| | | | | |
| Issuer | | Shares/Par | | Value ($) |
| | | | | |
| Common Stocks - continued | | | | | |
| Food & Beverages - 4.8% | | | | | |
| Campbell Soup Co. | | 748,120 | | $ | 24,934,840 |
| General Mills, Inc. | | 1,054,790 | | | 75,955,428 |
| J.M. Smucker Co. | | 834,287 | | | 49,790,248 |
| Kellogg Co. | | 2,404,501 | | | 125,394,727 |
| Nestle S.A. | | 4,182,546 | | | 208,105,268 |
| PepsiCo, Inc. | | 2,084,923 | | | 130,245,140 |
| | | | | |
| | | | | $ | 614,425,651 |
| Food & Drug Stores - 1.4% | | | | | |
| CVS Caremark Corp. | | 3,513,252 | | $ | 118,572,255 |
| Kroger Co. | | 2,507,000 | | | 55,404,700 |
| | | | | |
| | | | | $ | 173,976,955 |
| General Merchandise - 0.7% | | | | | |
| Wal-Mart Stores, Inc. | | 1,558,910 | | $ | 84,290,264 |
| | |
| Insurance - 7.6% | | | | | |
| Allstate Corp. | | 6,105,978 | | $ | 190,811,813 |
| Aon Corp. | | 2,629,380 | | | 107,646,817 |
| Chubb Corp. | | 1,651,145 | | | 83,316,777 |
| MetLife, Inc. | | 8,888,703 | | | 323,459,902 |
| Prudential Financial, Inc. | | 2,561,922 | | | 134,270,332 |
| Travelers Cos., Inc. | | 2,469,623 | | | 129,877,474 |
| | | | | |
| | | | | $ | 969,383,115 |
| Leisure & Toys - 0.4% | | | | | |
| Hasbro, Inc. | | 1,499,600 | | $ | 53,655,688 |
| | |
| Machinery & Tools - 0.6% | | | | | |
| Eaton Corp. | | 1,140,597 | | $ | 77,697,468 |
| | |
| Major Banks - 13.7% | | | | | |
| Bank of America Corp. | | 8,390,370 | | $ | 139,783,564 |
| Bank of New York Mellon Corp. | | 12,920,118 | | | 368,481,765 |
| Goldman Sachs Group, Inc. | | 2,037,815 | | | 318,612,375 |
| JPMorgan Chase & Co. | | 8,118,100 | | | 340,716,657 |
| PNC Financial Services Group, Inc. | | 2,149,442 | | | 115,554,002 |
| Regions Financial Corp. | | 6,659,300 | | | 44,950,275 |
| State Street Corp. | | 4,037,755 | | | 181,335,577 |
| Wells Fargo & Co. | | 8,791,257 | | | 240,352,966 |
| | | | | |
| | | | | $ | 1,749,787,181 |
8
Portfolio of Investments (unaudited) – continued
| | | | | |
| Issuer | | Shares/Par | | Value ($) |
| | | | | |
| Common Stocks - continued | | | | | |
| Medical Equipment - 3.7% | | | | | |
| Becton, Dickinson & Co. | | 1,552,345 | | $ | 120,881,105 |
| Medtronic, Inc. | | 4,120,240 | | | 178,818,416 |
| St. Jude Medical, Inc. (a) | | 1,958,020 | | | 74,835,524 |
| Thermo Fisher Scientific, Inc. (a) | | 931,025 | | | 45,406,089 |
| Waters Corp. (a) | | 981,320 | | | 58,545,551 |
| | | | | |
| | | | | $ | 478,486,685 |
| Natural Gas - Distribution - 0.1% | | | | | |
| Sempra Energy | | 211,617 | | $ | 10,405,208 |
| | |
| Network & Telecom - 0.1% | | | | | |
| Cisco Systems, Inc. (a) | | 776,400 | | $ | 18,889,812 |
| | |
| Oil Services - 0.8% | | | | | |
| National Oilwell Varco, Inc. | | 2,216,870 | | $ | 96,367,339 |
| | |
| Other Banks & Diversified Financials - 0.4% | | | | | |
| Northern Trust Corp. | | 931,842 | | $ | 49,657,860 |
| | |
| Pharmaceuticals - 8.0% | | | | | |
| Abbott Laboratories | | 4,821,610 | | $ | 261,716,991 |
| GlaxoSmithKline PLC | | 2,954,152 | | | 54,684,497 |
| Johnson & Johnson | | 5,013,687 | | | 315,862,281 |
| Merck & Co., Inc. | | 2,515,127 | | | 92,757,884 |
| Pfizer, Inc. | | 13,948,648 | | | 244,798,772 |
| Roche Holding AG | | 284,445 | | | 47,502,381 |
| | | | | |
| | | | | $ | 1,017,322,806 |
| Railroad & Shipping - 0.3% | | | | | |
| Canadian National Railway Co. | | 664,430 | | $ | 34,988,884 |
| | |
| Specialty Chemicals - 0.6% | | | | | |
| Air Products & Chemicals, Inc. | | 1,191,160 | | $ | 81,689,753 |
| | |
| Specialty Stores - 1.3% | | | | | |
| Advance Auto Parts, Inc. | | 1,607,710 | | $ | 65,594,568 |
| Home Depot, Inc. | | 1,587,520 | | | 49,530,624 |
| Staples, Inc. | | 2,138,755 | | | 55,094,329 |
| | | | | |
| | | | | $ | 170,219,521 |
| Telecommunications - Wireless - 1.4% | | | | | |
| Vodafone Group PLC | | 80,083,643 | | $ | 172,726,697 |
9
Portfolio of Investments (unaudited) – continued
| | | | | |
| Issuer | | Shares/Par | | Value ($) |
| | | | | |
| Common Stocks - continued | | | | | |
| Telephone Services - 3.2% | | | | | |
| AT&T, Inc. | | 16,398,992 | | $ | 406,858,992 |
| | |
| Tobacco - 3.3% | | | | | |
| Altria Group, Inc. | | 1,349,345 | | $ | 27,148,821 |
| Lorillard, Inc. | | 245,000 | | | 17,894,800 |
| Philip Morris International, Inc. | | 7,700,659 | | | 377,178,278 |
| | | | | |
| | | | | $ | 422,221,899 |
| Utilities - Electric Power - 4.7% | | | | | |
| Dominion Resources, Inc. | | 4,843,195 | | $ | 183,992,978 |
| Entergy Corp. | | 647,325 | | | 49,177,280 |
| FPL Group, Inc. | | 1,345,607 | | | 62,395,797 |
| PG&E Corp. | | 2,758,918 | | | 115,653,843 |
| PPL Corp. | | 2,941,862 | | | 83,784,230 |
| Public Service Enterprise Group, Inc. | | 3,453,383 | | | 102,634,543 |
| | | | | |
| | | | | $ | 597,638,671 |
| Total Common Stocks (Identified Cost, $11,007,589,629) | | | | $ | 12,474,027,323 |
| | |
| Money Market Funds (v) - 1.4% | | | | | |
MFS Institutional Money Market Portfolio, 0.14%,
at Cost and Net Asset Value | | 174,742,788 | | $ | 174,742,788 |
| Total Investments (Identified Cost, $11,182,332,417) | | | | $ | 12,648,770,111 |
| | |
| Other Assets, Less Liabilities - 0.9% | | | | | 116,662,058 |
| Net Assets - 100.0% | | | | $ | 12,765,432,169 |
| (a) | Non-income producing security. |
| (v) | Underlying fund that is available only to investment companies managed by MFS. The rate quoted is the annualized seven-day yield of the fund at period end. |
The following abbreviations are used in this report and are defined:
| ADR | | American Depository Receipt |
| PLC | | Public Limited Company |
See Notes to Financial Statements
10
Financial Statements
STATEMENT OF ASSETS AND LIABILITIES
At 2/28/10 (unaudited)
This statement represents your fund’s balance sheet, which details the assets and liabilities comprising the total value of the fund.
| | | |
| Assets | | | |
Investments- | | | |
Non-affiliated issuers, at value (identified cost, $11,007,589,629) | | $12,474,027,323 | |
Underlying funds, at cost and value | | 174,742,788 | |
Total investments, at value (identified cost, $11,182,332,417) | | $12,648,770,111 | |
Receivables for | | | |
Investments sold | | 93,665,553 | |
Fund shares sold | | 49,036,020 | |
Interest and dividends | | 31,813,462 | |
Other assets | | 125,775 | |
Total assets | | $12,823,410,921 | |
| Liabilities | | | |
Payables for | | | |
Investments purchased | | $34,360,926 | |
Fund shares reacquired | | 18,646,144 | |
Payable to affiliates | | | |
Investment adviser | | 787,178 | |
Shareholder servicing costs | | 3,702,151 | |
Distribution and service fees | | 325,230 | |
Administrative services fee | | 21,052 | |
Program manager fees | | 93 | |
Payable for independent Trustees’ compensation | | 23,987 | |
Accrued expenses and other liabilities | | 111,991 | |
Total liabilities | | $57,978,752 | |
Net assets | | $12,765,432,169 | |
| Net assets consist of | | | |
Paid-in capital | | $12,781,247,433 | |
Unrealized appreciation (depreciation) on investments and translation of assets and liabilities in foreign currencies | | 1,466,404,832 | |
Accumulated net realized gain (loss) on investments and foreign currency transactions | | (1,508,919,561 | ) |
Undistributed net investment income | | 26,699,465 | |
Net assets | | $12,765,432,169 | |
Shares of beneficial interest outstanding | | 619,319,406 | |
| | | | | | |
| | | Net assets | | Shares
outstanding | | Net asset value
per share (a) |
Class A | | $5,234,191,820 | | 253,892,529 | | $20.62 |
Class B | | 311,667,553 | | 15,214,530 | | 20.48 |
Class C | | 859,070,530 | | 42,067,199 | | 20.42 |
Class I | | 2,987,675,264 | | 144,257,162 | | 20.71 |
Class W | | 1,300,542,722 | | 63,148,246 | | 20.60 |
Class R1 | | 36,036,293 | | 1,775,303 | | 20.30 |
Class R2 | | 390,850,498 | | 19,105,871 | | 20.46 |
Class R3 | | 509,983,519 | | 24,797,524 | | 20.57 |
Class R4 | | 1,126,932,928 | | 54,645,489 | | 20.62 |
Class 529A | | 5,383,726 | | 262,674 | | 20.50 |
Class 529B | | 1,215,758 | | 59,987 | | 20.27 |
Class 529C | | 1,881,558 | | 92,892 | | 20.26 |
| (a) | Maximum offering price per share was equal to the net asset value per share for all share classes, except for Classes A and 529A, for which the maximum offering prices per share were $21.88 [100 / 94.25 x $20.62] and $21.75 [100 / 94.25 x $20.50], respectively. On sales of $50,000 or more, the maximum offering prices of Class A and Class 529A shares are reduced. A contingent deferred sales charge may be imposed on redemptions of Class A, Class B, Class C, Class 529B, and Class 529C shares. Redemption price per share was equal to the net asset value per share for Classes I, W, R1, R2, R3, R4, and 529A. |
See Notes to Financial Statements
11
Financial Statements
STATEMENT OF OPERATIONS
Six months ended 2/28/10 (unaudited)
This statement describes how much your fund earned in investment income and accrued in expenses. It also describes any gains and/or losses generated by fund operations.
| | | |
| Net investment income | | | |
Income | | | |
Dividends | | $153,988,729 | |
Interest | | 413,120 | |
Dividends from underlying funds | | 131,809 | |
Foreign taxes withheld | | (1,203,901 | ) |
Total investment income | | $153,329,757 | |
Expenses | | | |
Management fee | | $33,477,247 | |
Distribution and service fees | | 14,238,080 | |
Program manager fees | | 4,128 | |
Shareholder servicing costs | | 6,277,392 | |
Administrative services fee | | 873,732 | |
Independent Trustees’ compensation | | 88,531 | |
Custodian fee | | 231,171 | |
Shareholder communications | | 313,589 | |
Auditing fees | | 23,373 | |
Legal fees | | 115,600 | |
Miscellaneous | | 437,908 | |
Total expenses | | $56,080,751 | |
Fees paid indirectly | | (23 | ) |
Reduction of expenses by investment adviser | | (23,572 | ) |
Net expenses | | $56,057,156 | |
Net investment income | | $97,272,601 | |
Realized and unrealized gain (loss) on investments
and foreign currency transactions | | | |
Realized gain (loss) (identified cost basis) | | | |
Investment transactions | | $(69,723,987 | ) |
Foreign currency transactions | | (304,079 | ) |
Net realized gain (loss) on investments
and foreign currency transactions | | $(70,028,066 | ) |
Change in unrealized appreciation (depreciation) | | | |
Investments | | $747,129,816 | |
Translation of assets and liabilities in foreign currencies | | (29,431 | ) |
Net unrealized gain (loss) on investments
and foreign currency translation | | $747,100,385 | |
Net realized and unrealized gain (loss) on investments
and foreign currency | | $677,072,319 | |
Change in net assets from operations | | $774,344,920 | |
See Notes to Financial Statements
12
Financial Statements
STATEMENTS OF CHANGES IN NET ASSETS
These statements describe the increases and/or decreases in net assets resulting from operations, any distributions, and any shareholder transactions.
| | | | | | |
| Change in net assets | | Six months ended
2/28/10
(unaudited) | | | Year ended
8/31/09 | |
| From operations | | | | | | |
Net investment income | | $97,272,601 | | | $155,013,245 | |
Net realized gain (loss) on investments and foreign currency transactions | | (70,028,066 | ) | | (1,089,373,338 | ) |
Net unrealized gain (loss) on investments and foreign currency translation | | 747,100,385 | | | (676,628,876 | ) |
Change in net assets from operations | | $774,344,920 | | | $(1,610,988,969 | ) |
| Distributions declared to shareholders | | | | | | |
From net investment income | | $(92,407,450 | ) | | $(154,220,972 | ) |
Change in net assets from fund share transactions | | $1,614,911,361 | | | $1,976,315,828 | |
Total change in net assets | | $2,296,848,831 | | | $211,105,887 | |
| Net assets | | | | | | |
At beginning of period | | 10,468,583,338 | | | 10,257,477,451 | |
At end of period (including undistributed net investment income of $26,699,465 and $21,834,314, respectively) | | $12,765,432,169 | | | $10,468,583,338 | |
See Notes to Financial Statements
13
Financial Statements
FINANCIAL HIGHLIGHTS
The financial highlights table is intended to help you understand the fund’s financial performance for the semiannual period and the past 5 fiscal years (or life of a particular share class, if shorter). Certain information reflects financial results for a single fund share. The total returns in the table represent the rate by which an investor would have earned (or lost) on an investment in the fund share class (assuming reinvestment of all distributions) held for the entire period.
| | | | | | | | | | | | | | | | | | |
| | | Six months
ended
2/28/10
(unaudited) | | | Years ended 8/31 | |
| Class A | | | 2009 | | | 2008 | | | 2007 | | | 2006 | | | 2005 | |
| | | | | | | | | | | | | | | | | |
Net asset value, beginning of period | | $19.39 | | | $23.75 | | | $28.11 | �� | | $25.20 | | | $23.81 | | | $20.88 | |
| Income (loss) from investment operations | | | | | | | | | | | | | | | | | | |
Net investment income (d) | | $0.17 | | | $0.34 | | | $0.32 | | | $0.30 | | | $0.34 | | | $0.28 | |
Net realized and unrealized gain (loss) on investments and foreign currency | | 1.22 | | | (4.35 | ) | | (2.43 | ) | | 3.77 | | | 2.48 | | | 2.91 | |
Total from investment operations | | $1.39 | | | $(4.01 | ) | | $(2.11 | ) | | $4.07 | | | $2.82 | | | $3.19 | |
| Less distributions declared to shareholders | | | | | | | | | | | | | | | | | | |
From net investment income | | $(0.16 | ) | | $(0.35 | ) | | $(0.31 | ) | | $(0.36 | ) | | $(0.29 | ) | | $(0.26 | ) |
From net realized gain
on investments | | — | | | — | | | (1.94 | ) | | (0.80 | ) | | (1.14 | ) | | — | |
Total distributions declared to shareholders | | $(0.16 | ) | | $(0.35 | ) | | $(2.25 | ) | | $(1.16 | ) | | $(1.43 | ) | | $(0.26 | ) |
Net asset value, end of period | | $20.62 | | | $19.39 | | | $23.75 | | | $28.11 | | | $25.20 | | | $23.81 | |
Total return (%) (r)(s)(t) | | 7.18 | (n) | | (16.75 | ) | | (8.27 | ) | | 16.42 | | | 12.36 | | | 15.36 | |
Ratios (%) (to average
net assets) and Supplemental data: | | | | | | | | | | | | | | | | | | |
Expenses before expense reductions (f) | | 0.96 | (a) | | 1.09 | | | 1.11 | | | 1.13 | | | 1.17 | | | 1.16 | |
Expenses after expense reductions (f) | | 0.96 | (a) | | 1.09 | | | 1.10 | | | 1.11 | | | 1.16 | | | 1.16 | |
Net investment income | | 1.65 | (a) | | 1.94 | | | 1.24 | | | 1.10 | | | 1.40 | | | 1.23 | |
Portfolio turnover | | 11 | | | 33 | | | 31 | | | 26 | | | 26 | | | 24 | |
Net assets at end of period (000 omitted) | | $5,234,192 | | | $4,665,411 | | | $5,724,586 | | | $6,239,176 | | | $4,929,525 | | | $4,554,484 | |
See Notes to Financial Statements
14
Financial Highlights – continued
| | | | | | | | | | | | | | | | | | |
| | | Six months
ended
2/28/10
(unaudited) | | | Years ended 8/31 | |
| Class B | | | 2009 | | | 2008 | | | 2007 | | | 2006 | | | 2005 | |
| | | | | | | | | | | | | | | | | |
Net asset value, beginning of period | | $19.26 | | | $23.59 | | | $27.92 | | | $25.04 | | | $23.66 | | | $20.77 | |
| Income (loss) from investment operations | | | | | | | | | | | | | | | | | | |
Net investment
income (d) | | $0.09 | | | $0.22 | | | $0.15 | | | $0.12 | | | $0.17 | | | $0.13 | |
Net realized and
unrealized gain (loss) on investments and foreign currency | | 1.21 | | | (4.34 | ) | | (2.41 | ) | | 3.74 | | | 2.49 | | | 2.90 | |
Total from investment operations | | $1.30 | | | $(4.12 | ) | | $(2.26 | ) | | $3.86 | | | $2.66 | | | $3.03 | |
Less distributions
declared to shareholders | | | | | | | | | | | | | | | | | | |
From net investment
income | | $(0.08 | ) | | $(0.21 | ) | | $(0.13 | ) | | $(0.18 | ) | | $(0.14 | ) | | $(0.14 | ) |
From net realized gain on investments | | — | | | — | | | (1.94 | ) | | (0.80 | ) | | (1.14 | ) | | — | |
Total distributions declared to shareholders | | $(0.08 | ) | | $(0.21 | ) | | $(2.07 | ) | | $(0.98 | ) | | $(1.28 | ) | | $(0.14 | ) |
Net asset value, end
of period | | $20.48 | | | $19.26 | | | $23.59 | | | $27.92 | | | $25.04 | | | $23.66 | |
Total return (%) (r)(s)(t) | | 6.76 | (n) | | (17.36 | ) | | (8.87 | ) | | 15.64 | | | 11.66 | | | 14.61 | |
Ratios (%) (to average
net assets) and Supplemental data: | | | | | | | | | | | | | | | | | | |
Expenses before expense reductions (f) | | 1.71 | (a) | | 1.79 | | | 1.76 | | | 1.78 | | | 1.82 | | | 1.81 | |
Expenses after expense reductions (f) | | 1.71 | (a) | | 1.79 | | | 1.75 | | | 1.76 | | | 1.81 | | | 1.81 | |
Net investment income | | 0.90 | (a) | | 1.26 | | | 0.58 | | | 0.44 | | | 0.72 | | | 0.58 | |
Portfolio turnover | | 11 | | | 33 | | | 31 | | | 26 | | | 26 | | | 24 | |
Net assets at end of period (000 omitted) | | $311,668 | | | $371,270 | | | $672,484 | | | $1,049,401 | | | $1,139,651 | | | $1,262,029 | |
See Notes to Financial Statements
15
Financial Highlights – continued
| | | | | | | | | | | | | | | | | | |
| | | Six months
ended
2/28/10
(unaudited) | | | Years ended 8/31 | |
| Class C | | | 2009 | | | 2008 | | | 2007 | | | 2006 | | | 2005 | |
| | | | | | | | | | | | | | | | | |
Net asset value, beginning of period | | $19.21 | | | $23.54 | | | $27.88 | | | $25.01 | | | $23.64 | | | $20.75 | |
| Income (loss) from investment operations | | | | | | | | | | | | | | | | | | |
Net investment
income (d) | | $0.09 | | | $0.22 | | | $0.15 | | | $0.12 | | | $0.18 | | | $0.13 | |
Net realized and
unrealized gain (loss) on investments and foreign currency | | 1.21 | | | (4.33 | ) | | (2.41 | ) | | 3.74 | | | 2.47 | | | 2.90 | |
Total from investment
operations | | $1.30 | | | $(4.11 | ) | | $(2.26 | ) | | $3.86 | | | $2.65 | | | $3.03 | |
Less distributions
declared to shareholders | | | | | | | | | | | | | | | | | | |
From net investment
income | | $(0.09 | ) | | $(0.22 | ) | | $(0.14 | ) | | $(0.19 | ) | | $(0.14 | ) | | $(0.14 | ) |
From net realized gain on investments | | — | | | — | | | (1.94 | ) | | (0.80 | ) | | (1.14 | ) | | — | |
Total distributions declared
to shareholders | | $(0.09 | ) | | $(0.22 | ) | | $(2.08 | ) | | $(0.99 | ) | | $(1.28 | ) | | $(0.14 | ) |
Net asset value, end
of period | | $20.42 | | | $19.21 | | | $23.54 | | | $27.88 | | | $25.01 | | | $23.64 | |
Total return (%) (r)(s)(t) | | 6.75 | (n) | | (17.35 | ) | | (8.88 | ) | | 15.66 | | | 11.65 | | | 14.63 | |
Ratios (%) (to average
net assets) and
Supplemental data: | | | | | | | | | | | | | | | | | | |
Expenses before expense reductions (f) | | 1.71 | (a) | | 1.79 | | | 1.76 | | | 1.78 | | | 1.82 | | | 1.81 | |
Expenses after expense
reductions (f) | | 1.71 | (a) | | 1.79 | | | 1.75 | | | 1.76 | | | 1.81 | | | 1.81 | |
Net investment income | | 0.90 | (a) | | 1.24 | | | 0.59 | | | 0.45 | | | 0.74 | | | 0.58 | |
Portfolio turnover | | 11 | | | 33 | | | 31 | | | 26 | | | 26 | | | 24 | |
Net assets at end of period
(000 omitted) | | $859,071 | | | $776,373 | | | $950,299 | | | $1,052,467 | | | $881,538 | | | $863,486 | |
See Notes to Financial Statements
16
Financial Highlights – continued
| | | | | | | | | | | | | | | | | | |
| | | Six months
ended
2/28/10
(unaudited) | | | Years ended 8/31 | |
| Class I | | | 2009 | | | 2008 | | | 2007 | | | 2006 | | | 2005 | |
| | | | | | | | | | | | | | | | | |
Net asset value, beginning of period | | $19.48 | | | $23.87 | | | $28.24 | | | $25.32 | | | $23.91 | | | $20.95 | |
Income (loss) from
investment operations | | | | | | | | | | | | | | | | | | |
Net investment
income (d) | | $0.19 | | | $0.40 | | | $0.41 | | | $0.40 | | | $0.43 | | | $0.37 | |
Net realized and unrealized gain (loss) on investments and foreign currency | | 1.23 | | | (4.38 | ) | | (2.44 | ) | | 3.77 | | | 2.49 | | | 2.91 | |
Total from investment operations | | $1.42 | | | $(3.98 | ) | | $(2.03 | ) | | $4.17 | | | $2.92 | | | $3.28 | |
Less distributions
declared to shareholders | | | | | | | | | | | | | | | | | | |
From net investment income | | $(0.19 | ) | | $(0.41 | ) | | $(0.40 | ) | | $(0.45 | ) | | $(0.37 | ) | | $(0.32 | ) |
From net realized gain on investments | | — | | | — | | | (1.94 | ) | | (0.80 | ) | | (1.14 | ) | | — | |
Total distributions declared to shareholders | | $(0.19 | ) | | $(0.41 | ) | | $(2.34 | ) | | $(1.25 | ) | | $(1.51 | ) | | $(0.32 | ) |
Net asset value, end of period | | $20.71 | | | $19.48 | | | $23.87 | | | $28.24 | | | $25.32 | | | $23.91 | |
Total return (%) (r)(s) | | 7.29 | (n) | | (16.53 | ) | | (7.94 | ) | | 16.78 | | | 12.78 | | | 15.78 | |
Ratios (%) (to average
net assets) and Supplemental data: | | | | | | | | | | | | | | | | | | |
Expenses before expense reductions (f) | | 0.71 | (a) | | 0.79 | | | 0.76 | | | 0.78 | | | 0.82 | | | 0.81 | |
Expenses after expense reductions (f) | | 0.71 | (a) | | 0.79 | | | 0.75 | | | 0.76 | | | 0.81 | | | 0.81 | |
Net investment income | | 1.89 | (a) | | 2.26 | | | 1.60 | | | 1.45 | | | 1.77 | | | 1.59 | |
Portfolio turnover | | 11 | | | 33 | | | 31 | | | 26 | | | 26 | | | 24 | |
Net assets at end of period (000 omitted) | | $2,987,675 | | | $2,335,922 | | | $1,663,139 | | | $1,529,643 | | | $1,162,665 | | | $899,654 | |
See Notes to Financial Statements
17
Financial Highlights – continued
| | | | | | | | | | | | | | | |
| | | Six months
ended
2/28/10 (unaudited) | | | Years ended 8/31 | |
| Class W | | | 2009 | | | 2008 | | | 2007 | | | 2006 (i) | |
| | | | | | | | | | | | | | |
Net asset value, beginning of period | | $19.37 | | | $23.74 | | | $28.11 | | | $25.20 | | | $25.04 | |
| Income (loss) from investment operations | | | | | | | | | | | | | | | |
Net investment income (d) | | $0.18 | | | $0.37 | | | $0.37 | | | $0.37 | | | $0.24 | |
Net realized and unrealized gain (loss)
on investments and foreign currency | | 1.23 | | | (4.35 | ) | | (2.42 | ) | | 3.77 | | | 0.02 | (g) |
Total from investment operations | | $1.41 | | | $(3.98 | ) | | $(2.05 | ) | | $4.14 | | | $0.26 | |
| Less distributions declared to shareholders | | | | | | | | | | | | | | | |
From net investment income | | $(0.18 | ) | | $(0.39 | ) | | $(0.38 | ) | | $(0.43 | ) | | $(0.10 | ) |
From net realized gain on investments | | — | | | — | | | (1.94 | ) | | (0.80 | ) | | — | |
Total distributions declared to shareholders | | $(0.18 | ) | | $(0.39 | ) | | $(2.32 | ) | | $(1.23 | ) | | $(0.10 | ) |
Net asset value, end of period | | $20.60 | | | $19.37 | | | $23.74 | | | $28.11 | | | $25.20 | |
Total return (%) (r)(s) | | 7.28 | (n) | | (16.61 | ) | | (8.05 | ) | | 16.73 | | | 1.05 | (n) |
Ratios (%) (to average net assets)
and Supplemental data: | | | | | | | | | | | | | | | |
Expenses before expense reductions (f) | | 0.81 | (a) | | 0.89 | | | 0.87 | | | 0.88 | | | 0.92 | (a) |
Expenses after expense reductions (f) | | 0.81 | (a) | | 0.88 | | | 0.85 | | | 0.86 | | | 0.91 | (a) |
Net investment income | | 1.81 | (a) | | 2.12 | | | 1.54 | | | 1.37 | | | 3.32 | (a) |
Portfolio turnover | | 11 | | | 33 | | | 31 | | | 26 | | | 26 | |
Net assets at end of period (000 omitted) | | $1,300,543 | | | $999,969 | | | $581,005 | | | $69,115 | | | $8,952 | |
See Notes to Financial Statements
18
Financial Highlights – continued
| | | | | | | | | | | | | | | | | | |
| | | Six months
ended
2/28/10
(unaudited) | | | Years ended 8/31 | |
| Class R1 | | | 2009 | | | 2008 | | | 2007 | | | 2006 | | | 2005 (i) | |
| | | | | | | | | | | | | | | | | |
Net asset value, beginning
of period | | $19.09 | | | $23.42 | | | $27.76 | | | $24.93 | | | $23.63 | | | $23.17 | |
Income (loss) from
investment operations | | | | | | | | | | | | | | | | | | |
Net investment
income (d) | | $0.09 | | | $0.21 | | | $0.14 | | | $0.10 | | | $0.22 | | | $0.09 | |
Net realized and
unrealized gain (loss) on investments and
foreign currency | | 1.21 | | | (4.31 | ) | | (2.40 | ) | | 3.72 | | | 2.39 | | | 0.42 | (g) |
Total from investment
operations | | $1.30 | | | $(4.10 | ) | | $(2.26 | ) | | $3.82 | | | $2.61 | | | $0.51 | |
Less distributions
declared to shareholders | | | | | | | | | | | | | | | | | | |
From net investment
income | | $(0.09 | ) | | $(0.23 | ) | | $(0.14 | ) | | $(0.19 | ) | | $(0.17 | ) | | $(0.05 | ) |
From net realized gain
on investments | | — | | | — | | | (1.94 | ) | | (0.80 | ) | | (1.14 | ) | | — | |
Total distributions declared to shareholders | | $(0.09 | ) | | $(0.23 | ) | | $(2.08 | ) | | $(0.99 | ) | | $(1.31 | ) | | $(0.05 | ) |
Net asset value, end
of period | | $20.30 | | | $19.09 | | | $23.42 | | | $27.76 | | | $24.93 | | | $23.63 | |
Total return (%) (r)(s) | | 6.81 | (n) | | (17.38 | ) | | (8.91 | ) | | 15.55 | | | 11.51 | | | 2.21 | (n) |
Ratios (%) (to average
net assets) and
Supplemental data: | | | | | | | | | | | | | | | | | | |
Expenses before expense
reductions (f) | | 1.71 | (a) | | 1.78 | | | 1.81 | | | 1.92 | | | 2.02 | | | 2.04 | (a) |
Expenses after expense
reductions (f) | | 1.71 | (a) | | 1.78 | | | 1.79 | | | 1.86 | | | 1.92 | | | 2.04 | (a) |
Net investment income | | 0.90 | (a) | | 1.24 | | | 0.54 | | | 0.36 | | | 0.93 | | | 0.89 | (a) |
Portfolio turnover | | 11 | | | 33 | | | 31 | | | 26 | | | 26 | | | 24 | |
Net assets at end of period
(000 omitted) | | $36,036 | | | $30,690 | | | $25,252 | | | $15,823 | | | $4,639 | | | $574 | |
See Notes to Financial Statements
19
Financial Highlights – continued
| | | | | | | | | | | | | | | | | | |
| | | Six months
ended
2/28/10
(unaudited) | | | Years ended 8/31 | |
| Class R2 | | | 2009 | | | 2008 | | | 2007 | | | 2006 | | | 2005 | |
| | | | | | | | | | | | | | | | | |
Net asset value, beginning
of period | | $19.24 | | | $23.59 | | | $27.94 | | | $25.07 | | | $23.71 | | | $20.84 | |
Income (loss) from
investment operations | | | | | | | | | | | | | | | | | | |
Net investment
income (d) | | $0.14 | | | $0.30 | | | $0.27 | | | $0.22 | | | $0.31 | | | $0.21 | |
Net realized and
unrealized gain (loss)
on investments and
foreign currency | | 1.22 | | | (4.33 | ) | | (2.42 | ) | | 3.75 | | | 2.43 | | | 2.88 | |
Total from investment
operations | | $1.36 | | | $(4.03 | ) | | $(2.15 | ) | | $3.97 | | | $2.74 | | | $3.09 | |
Less distributions
declared to shareholders | | | | | | | | | | | | | | | | | | |
From net investment
income | | $(0.14 | ) | | $(0.32 | ) | | $(0.26 | ) | | $(0.30 | ) | | $(0.24 | ) | | $(0.22 | ) |
From net realized gain
on investments | | — | | | — | | | (1.94 | ) | | (0.80 | ) | | (1.14 | ) | | — | |
Total distributions declared to shareholders | | $(0.14 | ) | | $(0.32 | ) | | $(2.20 | ) | | $(1.10 | ) | | $(1.38 | ) | | $(0.22 | ) |
Net asset value, end
of period | | $20.46 | | | $19.24 | | | $23.59 | | | $27.94 | | | $25.07 | | | $23.71 | |
Total return (%) (r)(s) | | 7.07 | (n) | | (16.96 | ) | | (8.46 | ) | | 16.07 | | | 12.03 | | | 14.91 | |
Ratios (%) (to average
net assets) and
Supplemental data: | | | | | | | | | | | | | | | | | | |
Expenses before expense
reductions (f) | | 1.21 | (a) | | 1.29 | | | 1.30 | | | 1.47 | | | 1.56 | | | 1.57 | |
Expenses after expense
reductions (f) | | 1.21 | (a) | | 1.28 | | | 1.28 | | | 1.41 | | | 1.47 | | | 1.57 | |
Net investment income | | 1.39 | (a) | | 1.73 | | | 1.10 | | | 0.81 | | | 1.27 | | | 0.93 | |
Portfolio turnover | | 11 | | | 33 | | | 31 | | | 26 | | | 26 | | | 24 | |
Net assets at end of period
(000 omitted) | | $390,850 | | | $286,115 | | | $246,027 | | | $98,970 | | | $30,001 | | | $8,316 | |
See Notes to Financial Statements
20
Financial Highlights – continued
| | | | | | | | | | | | | | | | | | |
| | | Six months
ended
2/28/10 (unaudited) | | | Years ended 8/31 | |
| Class R3 | | | 2009 | | | 2008 | | | 2007 | | | 2006 | | | 2005 (i) | |
| | | | | | | | | | | | | | | | | |
Net asset value, beginning
of period | | $19.34 | | | $23.71 | | | $28.07 | | | $25.17 | | | $23.81 | | | $23.29 | |
Income (loss) from
investment operations | | | | | | | | | | | | | | | | | | |
Net investment
income (d) | | $0.17 | | | $0.34 | | | $0.33 | | | $0.30 | | | $0.42 | | | $0.15 | |
Net realized and
unrealized gain (loss) on investments and
foreign currency | | 1.22 | | | (4.35 | ) | | (2.43 | ) | | 3.75 | | | 2.39 | | | 0.44 | (g) |
Total from investment
operations | | $1.39 | | | $(4.01 | ) | | $(2.10 | ) | | $4.05 | | | $2.81 | | | $0.59 | |
Less distributions
declared to shareholders | | | | | | | | | | | | | | | | | | |
From net investment
income | | $(0.16 | ) | | $(0.36 | ) | | $(0.32 | ) | | $(0.35 | ) | | $(0.31 | ) | | $(0.07 | ) |
From net realized gain on investments | | — | | | — | | | (1.94 | ) | | (0.80 | ) | | (1.14 | ) | | — | |
Total distributions declared to shareholders | | $(0.16 | ) | | $(0.36 | ) | | $(2.26 | ) | | $(1.15 | ) | | $(1.45 | ) | | $(0.07 | ) |
Net asset value, end
of period | | $20.57 | | | $19.34 | | | $23.71 | | | $28.07 | | | $25.17 | | | $23.81 | |
Total return (%) (r)(s) | | 7.21 | (n) | | (16.75 | ) | | (8.25 | ) | | 16.38 | | | 12.33 | | | 2.53 | (n) |
Ratios (%) (to average
net assets) and
Supplemental data: | | | | | | | | | | | | | | | | | | |
Expenses before expense
reductions (f) | | 0.96 | (a) | | 1.03 | | | 1.06 | | | 1.18 | | | 1.22 | | | 1.23 | (a) |
Expenses after expense
reductions (f) | | 0.96 | (a) | | 1.03 | | | 1.04 | | | 1.16 | | | 1.22 | | | 1.23 | (a) |
Net investment income | | 1.64 | (a) | | 1.94 | | | 1.29 | | | 1.07 | | | 1.80 | | | 1.94 | (a) |
Portfolio turnover | | 11 | | | 33 | | | 31 | | | 26 | | | 26 | | | 24 | |
Net assets at end of period
(000 omitted) | | $509,984 | | | $341,993 | | | $190,002 | | | $128,909 | | | $46,731 | | | $400 | |
See Notes to Financial Statements
21
Financial Highlights – continued
| | | | | | | | | | | | | | | | | | |
| | | Six months
ended
2/28/10 (unaudited) | | | Years ended 8/31 | |
| Class R4 | | | 2009 | | | 2008 | | | 2007 | | | 2006 | | | 2005 (i) | |
| | | | | | | | | | | | | | | | | |
Net asset value, beginning
of period | | $19.39 | | | $23.77 | | | $28.13 | | | $25.22 | | | $23.83 | | | $23.29 | |
Income (loss) from
investment operations | | | | | | | | | | | | | | | | | | |
Net investment
income (d) | | $0.19 | | | $0.37 | | | $0.40 | | | $0.39 | | | $0.45 | | | $0.15 | |
Net realized and
unrealized gain (loss) on investments and
foreign currency | | 1.23 | | | (4.34 | ) | | (2.43 | ) | | 3.75 | | | 2.43 | | | 0.47 | (g) |
Total from investment
operations | | $1.42 | | | $(3.97 | ) | | $(2.03 | ) | | $4.14 | | | $2.88 | | | $0.62 | |
Less distributions
declared to shareholders | | | | | | | | | | | | | | | | | | |
From net investment
income | | $(0.19 | ) | | $(0.41 | ) | | $(0.39 | ) | | $(0.43 | ) | | $(0.35 | ) | | $(0.08 | ) |
From net realized gain on investments | | — | | | — | | | (1.94 | ) | | (0.80 | ) | | (1.14 | ) | | — | |
Total distributions declared to shareholders | | $(0.19 | ) | | $(0.41 | ) | | $(2.33 | ) | | $(1.23 | ) | | $(1.49 | ) | | $(0.08 | ) |
Net asset value, end
of period | | $20.62 | | | $19.39 | | | $23.77 | | | $28.13 | | | $25.22 | | | $23.83 | |
Total return (%) (r)(s) | | 7.32 | (n) | | (16.56 | ) | | (7.99 | ) | | 16.70 | | | 12.64 | | | 2.68 | (n) |
Ratios (%) (to average
net assets) and
Supplemental data: | | | | | | | | | | | | | | | | | | |
Expenses before expense
reductions (f) | | 0.71 | (a) | | 0.77 | | | 0.80 | | | 0.88 | | | 0.92 | | | 0.92 | (a) |
Expenses after expense
reductions (f) | | 0.71 | (a) | | 0.77 | | | 0.78 | | | 0.86 | | | 0.91 | | | 0.92 | (a) |
Net investment income | | 1.88 | (a) | | 2.10 | | | 1.58 | | | 1.39 | | | 1.80 | | | 1.57 | (a) |
Portfolio turnover | | 11 | | | 33 | | | 31 | | | 26 | | | 26 | | | 24 | |
Net assets at end of period
(000 omitted) | | $1,126,933 | | | $652,906 | | | $194,753 | | | $137,524 | | | $60,124 | | | $51 | |
See Notes to Financial Statements
22
Financial Highlights – continued
| | | | | | | | | | | | | | | | | | |
| | | Six months
ended
2/28/10
(unaudited) | | | Years ended 8/31 | |
| Class 529A | | | 2009 | | | 2008 | | | 2007 | | | 2006 | | | 2005 | |
| | | | | | | | | | | | | | | | | |
Net asset value, beginning
of period | | $19.28 | | | $23.62 | | | $27.96 | | | $25.09 | | | $23.71 | | | $20.80 | |
Income (loss) from
investment operations | | | | | | | | | | | | | | | | | | |
Net investment
income (d) | | $0.16 | | | $0.32 | | | $0.27 | | | $0.23 | | | $0.28 | | | $0.23 | |
Net realized and
unrealized gain (loss)
on investments and
foreign currency | | 1.21 | | | (4.33 | ) | | (2.42 | ) | | 3.74 | | | 2.48 | | | 2.90 | |
Total from investment
operations | | $1.37 | | | $(4.01 | ) | | $(2.15 | ) | | $3.97 | | | $2.76 | | | $3.13 | |
Less distributions
declared to shareholders | | | | | | | | | | | | | | | | | | |
From net investment
income | | $(0.15 | ) | | $(0.33 | ) | | $(0.25 | ) | | $(0.30 | ) | | $(0.24 | ) | | $(0.22 | ) |
From net realized gain
on investments | | — | | | — | | | (1.94 | ) | | (0.80 | ) | | (1.14 | ) | | — | |
Total distributions declared
to shareholders | | $(0.15 | ) | | $(0.33 | ) | | $(2.19 | ) | | $(1.10 | ) | | $(1.38 | ) | | $(0.22 | ) |
Net asset value, end
of period | | $20.50 | | | $19.28 | | | $23.62 | | | $27.96 | | | $25.09 | | | $23.71 | |
Total return (%) (r)(s)(t) | | 7.12 | (n) | | (16.84 | ) | | (8.45 | ) | | 16.09 | | | 12.11 | | | 15.09 | |
Ratios (%) (to average
net assets) and
Supplemental data: | | | | | | | | | | | | | | | | | | |
Expenses before expense
reductions (f) | | 1.06 | (a) | | 1.19 | | | 1.30 | | | 1.38 | | | 1.42 | | | 1.41 | |
Expenses after expense
reductions (f) | | 1.06 | (a) | | 1.19 | | | 1.28 | | | 1.36 | | | 1.41 | | | 1.41 | |
Net investment income | | 1.55 | (a) | | 1.84 | | | 1.05 | | | 0.85 | | | 1.18 | | | 0.99 | |
Portfolio turnover | | 11 | | | 33 | | | 31 | | | 26 | | | 26 | | | 24 | |
Net assets at end of period
(000 omitted) | | $5,384 | | | $5,008 | | | $6,025 | | | $6,194 | | | $3,947 | | | $2,914 | |
See Notes to Financial Statements
23
Financial Highlights – continued
| | | | | | | | | | | | | | | | | | |
| | | Six months
ended
2/28/10
(unaudited) | | | Years ended 8/31 | |
| Class 529B | | | 2009 | | | 2008 | | | 2007 | | | 2006 | | | 2005 | |
| | | | | | | | | | | | | | | | | | | |
Net asset value, beginning
of period | | $19.06 | | | $23.37 | | | $27.69 | | | $24.87 | | | $23.52 | | | $20.67 | |
Income (loss) from
investment operations | | | | | | | | | | | | | | | | | | |
Net investment
income (d) | | $0.08 | | | $0.20 | | | $0.10 | | | $0.06 | | | $0.13 | | | $0.08 | |
Net realized and
unrealized gain (loss)
on investments and
foreign currency | | 1.20 | | | (4.30 | ) | | (2.39 | ) | | 3.71 | | | 2.45 | | | 2.87 | |
Total from investment
operations | | $1.28 | | | $(4.10 | ) | | $(2.29 | ) | | $3.77 | | | $2.58 | | | $2.95 | |
Less distributions
declared to shareholders | | | | | | | | | | | | | | | | | | |
From net investment
income | | $(0.07 | ) | | $(0.21 | ) | | $(0.09 | ) | | $(0.15 | ) | | $(0.09 | ) | | $(0.10 | ) |
From net realized gain
on investments | | — | | | — | | | (1.94 | ) | | (0.80 | ) | | (1.14 | ) | | — | |
Total distributions declared
to shareholders | | $(0.07 | ) | | $(0.21 | ) | | $(2.03 | ) | | $(0.95 | ) | | $(1.23 | ) | | $(0.10 | ) |
Net asset value, end
of period | | $20.27 | | | $19.06 | | | $23.37 | | | $27.69 | | | $24.87 | | | $23.52 | |
Total return (%) (r)(s)(t) | | 6.74 | (n) | | (17.46 | ) | | (9.05 | ) | | 15.37 | | | 11.39 | | | 14.32 | |
Ratios (%) (to average
net assets) and
Supplemental data: | | | | | | | | | | | | | | | | | | |
Expenses before expense
reductions (f) | | 1.81 | (a) | | 1.89 | | | 1.95 | | | 2.03 | | | 2.06 | | | 2.06 | |
Expenses after expense
reductions (f) | | 1.81 | (a) | | 1.89 | | | 1.94 | | | 2.01 | | | 2.06 | | | 2.06 | |
Net investment income | | 0.80 | (a) | | 1.15 | | | 0.40 | | | 0.20 | | | 0.53 | | | 0.34 | |
Portfolio turnover | | 11 | | | 33 | | | 31 | | | 26 | | | 26 | | | 24 | |
Net assets at end of period
(000 omitted) | | $1,216 | | | $1,215 | | | $1,624 | | | $1,823 | | | $946 | | | $655 | |
See Notes to Financial Statements
24
Financial Highlights – continued
| | | | | | | | | | | | | | | | | | |
| | | Six months
ended
2/28/10
(unaudited) | | | Years ended 8/31 | |
| Class 529C | | | 2009 | | | 2008 | | | 2007 | | | 2006 | | | 2005 | |
| | | | | | | | | | | | | | | | | |
Net asset value, beginning
of period | | $19.05 | | | $23.35 | | | $27.67 | | | $24.86 | | | $23.51 | | | $20.66 | |
Income (loss) from
investment operations | | | | | | | | | | | | | | | | | | |
Net investment
income (d) | | $0.08 | | | $0.20 | | | $0.10 | | | $0.06 | | | $0.12 | | | $0.08 | |
Net realized and
unrealized gain (loss)
on investments and
foreign currency | | 1.21 | | | (4.30 | ) | | (2.39 | ) | | 3.70 | | | 2.46 | | | 2.87 | |
Total from investment
operations | | $1.29 | | | $(4.10 | ) | | $(2.29 | ) | | $3.76 | | | $2.58 | | | $2.95 | |
Less distributions
declared to shareholders | | | | | | | | | | | | | | | | | | |
From net investment
income | | $(0.08 | ) | | $(0.20 | ) | | $(0.09 | ) | | $(0.15 | ) | | $(0.09 | ) | | $(0.10 | ) |
From net realized gain
on investments | | — | | | — | | | (1.94 | ) | | (0.80 | ) | | (1.14 | ) | | — | |
Total distributions declared
to shareholders | | $(0.08 | ) | | $(0.20 | ) | | $(2.03 | ) | | $(0.95 | ) | | $(1.23 | ) | | $(0.10 | ) |
Net asset value, end
of period | | $20.26 | | | $19.05 | | | $23.35 | | | $27.67 | | | $24.86 | | | $23.51 | |
Total return (%) (r)(s)(t) | | 6.75 | (n) | | (17.45 | ) | | (9.05 | ) | | 15.34 | | | 11.39 | | | 14.32 | |
Ratios (%) (to average
net assets) and
Supplemental data: | | | | | | | | | | | | | | | | | | |
Expenses before expense
reductions (f) | | 1.81 | (a) | | 1.89 | | | 1.95 | | | 2.03 | | | 2.06 | | | 2.06 | |
Expenses after expense
reductions (f) | | 1.81 | (a) | | 1.89 | | | 1.94 | | | 2.01 | | | 2.06 | | | 2.06 | |
Net investment income | | 0.80 | (a) | | 1.15 | | | 0.40 | | | 0.20 | | | 0.51 | | | 0.36 | |
Portfolio turnover | | 11 | | | 33 | | | 31 | | | 26 | | | 26 | | | 24 | |
Net assets at end of period
(000 omitted) | | $1,882 | | | $1,710 | | | $2,282 | | | $2,463 | | | $1,279 | | | $1,062 | |
See Notes to Financial Statements
25
Financial Highlights – continued
Any redemption fees charged by the fund during the 2005 fiscal year resulted in a per share impact of less than $0.01.
| (d) | Per share data is based on average shares outstanding. |
| (f) | Ratios do not reflect reductions from fees paid indirectly, if applicable. |
| (g) | The per share amount is not in accordance with the net realized and unrealized gain/loss for the period because of the timing of sales of fund shares and the per share amount of realized and unrealized gains and losses at such time. |
| (i) | For the period from the class’ inception, April 1, 2005 (Classes R1, R3, and R4) and May 1, 2006 (Class W) through the stated period end. |
| (r) | Certain expenses have been reduced without which performance would have been lower. |
| (s) | From time to time the fund may receive proceeds from litigation settlements, without which performance would be lower. |
| (t) | Total returns do not include any applicable sales charges. |
See Notes to Financial Statements
26
NOTES TO FINANCIAL STATEMENTS
(unaudited)
| (1) | | Business and Organization |
MFS Value Fund (the fund) is a series of MFS Series Trust I (the trust). The trust is organized as a Massachusetts business trust and is registered under the Investment Company Act of 1940, as amended, as an open-end management investment company.
| (2) | | Significant Accounting Policies |
General – The preparation of financial statements in conformity with U.S. generally accepted accounting principles requires management to make estimates and assumptions that affect the reported amounts of assets and liabilities, and disclosure of contingent assets and liabilities at the date of the financial statements and the reported amounts of revenues and expenses during the reporting period. Actual results could differ from those estimates. In the preparation of these financial statements, management has evaluated subsequent events occurring after the date of the fund’s Statement of Assets and Liabilities through the date that the financial statements were issued. The fund can invest in foreign securities. Investments in foreign securities are vulnerable to the effects of changes in the relative values of the local currency and the U.S. dollar and to the effects of changes in each country’s legal, political, and economic environment.
Investment Valuations – Equity securities, including restricted equity securities, are generally valued at the last sale or official closing price as provided by a third-party pricing service on the market or exchange on which they are primarily traded. Equity securities, for which there were no sales reported that day, are generally valued at the last quoted daily bid quotation as provided by a third-party pricing service on the market or exchange on which such securities are primarily traded. Equity securities held short, for which there were no sales reported for that day, are generally valued at the last quoted daily ask quotation as provided by a third-party pricing service on the market or exchange on which such securities are primarily traded. Short-term instruments with a maturity at issuance of 60 days or less generally are valued at amortized cost, which approximates market value. Open-end investment companies are generally valued at net asset value per share. Securities and other assets generally valued on the basis of information from a third-party pricing service may also be valued at a broker/dealer bid quotation. Values obtained from third-party pricing services can utilize both transaction data and market information such as yield, quality, coupon rate, maturity, type of issue, trading characteristics, and other market data. The values of foreign securities and other assets and liabilities expressed in foreign currencies are converted to U.S. dollars using the mean of bid and asked prices for rates provided by a third-party pricing service.
27
Notes to Financial Statements (unaudited) – continued
The Board of Trustees has delegated primary responsibility for determining or causing to be determined the value of the fund’s investments (including any fair valuation) to the adviser pursuant to valuation policies and procedures approved by the Board. If the adviser determines that reliable market quotations are not readily available, investments are valued at fair value as determined in good faith by the adviser in accordance with such procedures under the oversight of the Board of Trustees. Under the fund’s valuation policies and procedures, market quotations are not considered to be readily available for most types of debt instruments and floating rate loans and many types of derivatives. These investments are generally valued at fair value based on information from third-party pricing services. In addition, investments may be valued at fair value if the adviser determines that an investment’s value has been materially affected by events occurring after the close of the exchange or market on which the investment is principally traded (such as foreign exchange or market) and prior to the determination of the fund’s net asset value, or after the halting of trading of a specific security where trading does not resume prior to the close of the exchange or market on which the security is principally traded. Events that occur on a frequent basis after foreign markets close (such as developments in foreign markets and significant movements in the U.S. markets) and prior to the determination of the fund’s net asset value may be deemed to have a material effect on the value of securities traded in foreign markets. Accordingly, the fund’s foreign equity securities may often be valued at fair value. The adviser generally relies on third-party pricing services or other information (such as the correlation with price movements of similar securities in the same or other markets; the type, cost and investment characteristics of the security; the business and financial condition of the issuer; and trading and other market data) to assist in determining whether to fair value and at what value to fair value an investment. The value of an investment for purposes of calculating the fund’s net asset value can differ depending on the source and method used to determine value. When fair valuation is used, the value of an investment used to determine the fund’s net asset value may differ from quoted or published prices for the same investment. There can be no assurance that the fund could obtain the fair value assigned to an investment if it were to sell the investment at the same time at which the fund determines its net asset value per share.
Various inputs are used in determining the value of the fund’s assets or liabilities. These inputs are categorized into three broad levels. In certain cases, the inputs used to measure fair value may fall into different levels of the fair value hierarchy. In such cases, an investment’s level within the fair value hierarchy is based on the lowest level of input that is significant to the fair value measurement. The fund’s assessment of the significance of a particular input to the fair value measurement in its entirety requires judgment, and
28
Notes to Financial Statements (unaudited) – continued
considers factors specific to the investment. Level 1 includes unadjusted quoted prices in active markets for identical assets or liabilities. Level 2 includes other significant observable market-based inputs (including quoted prices for similar securities, interest rates, prepayment speed, and credit risk). Level 3 includes unobservable inputs, which may include the adviser’s own assumptions in determining the fair value of investments. Other financial instruments are derivative instruments not reflected in total investments, such as futures, forwards, swap contracts, and written options. The following is a summary of the levels used as of February 28, 2010 in valuing the fund’s assets or liabilities:
| | | | | | | | |
| Investments at Value | | Level 1 | | Level 2 | | Level 3 | | Total |
| Equity Securities | | $12,474,027,323 | | $— | | $— | | $12,474,027,323 |
| Mutual Funds | | 174,742,788 | | — | | — | | 174,742,788 |
| Total Investments | | $12,648,770,111 | | $— | | $— | | $12,648,770,111 |
For further information regarding security characteristics, see the Portfolio of Investments.
In January 2010, Accounting Standards Update (ASU) No. 2010-06, Improving Disclosures about Fair Value Measurements (the “Update”) was issued, and is effective for interim and annual reporting periods beginning after December 15, 2009. This Update provides for expanded disclosures about fair value measurements. Management has evaluated the application of the Update to the fund, and believes the impact is limited to expanded disclosures resulting from the adoption of this Update in the fund’s financial statements.
Foreign Currency Translation – Purchases and sales of foreign investments, income, and expenses are converted into U.S. dollars based upon currency exchange rates prevailing on the respective dates of such transactions or on the reporting date for foreign denominated receivables and payables. Gains and losses attributable to foreign currency exchange rates on sales of securities are recorded for financial statement purposes as net realized gains and losses on investments. Gains and losses attributable to foreign exchange rate movements on receivables, payables, income and expenses are recorded for financial statement purposes as foreign currency transaction gains and losses. That portion of both realized and unrealized gains and losses on investments that results from fluctuations in foreign currency exchange rates is not separately disclosed.
Derivatives – The fund may use derivatives for different purposes, including to earn income and enhance returns, to increase or decrease exposure to a particular market, to manage or adjust the risk profile of the fund, or as alternatives to direct investments. Derivatives may be used for hedging or non-hedging purposes. While hedging can reduce or eliminate losses, it can
29
Notes to Financial Statements (unaudited) – continued
also reduce or eliminate gains. When the fund uses derivatives as an investment to increase market exposure, or for hedging purposes, gains and losses from derivative instruments may be substantially greater than the derivative’s original cost.
Derivative instruments include written options, purchased options, futures contracts, forward foreign currency exchange contracts, and swap agreements. For the six months ended February 28, 2010, the fund did not invest in any derivative instruments.
Security Loans – State Street Bank and Trust Company (“State Street”), as lending agent, may loan the securities of the fund to certain qualified institutions (the “Borrowers”) approved by the fund. The loans are collateralized by cash and/or U.S. Treasury and federal agency obligations in an amount typically at least equal to the market value of the securities loaned. The market value of the loaned securities is determined at the close of business of the fund and any additional required collateral is delivered to the fund on the next business day. State Street provides the fund with indemnification against Borrower default. The fund bears the risk of loss with respect to the investment of cash collateral. On loans collateralized by cash, the cash collateral is invested in a money market fund or short-term securities. A portion of the income generated upon investment of the collateral is remitted to the Borrowers, and the remainder is allocated between the fund and the lending agent. On loans collateralized by U.S. Treasury and/or federal agency obligations, a fee is received from the Borrower, and is allocated between the fund and the lending agent. Income from securities lending is included in interest income on the Statement of Operations. The dividend and interest income earned on the securities loaned is accounted for in the same manner as other dividend and interest income.
Indemnifications – Under the fund’s organizational documents, its officers and Trustees may be indemnified against certain liabilities and expenses arising out of the performance of their duties to the fund. Additionally, in the normal course of business, the fund enters into agreements with service providers that may contain indemnification clauses. The fund’s maximum exposure under these agreements is unknown as this would involve future claims that may be made against the fund that have not yet occurred.
Investment Transactions and Income – Investment transactions are recorded on the trade date. Interest income is recorded on the accrual basis. All premium and discount is amortized or accreted for financial statement purposes in accordance with U.S. generally accepted accounting principles. Dividends received in cash are recorded on the ex-dividend date. Certain dividends from foreign securities will be recorded when the fund is informed of the dividend if such information is obtained subsequent to the ex-dividend
30
Notes to Financial Statements (unaudited) – continued
date. Dividend and interest payments received in additional securities are recorded on the ex-dividend or ex-interest date in an amount equal to the value of the security on such date. The fund may receive proceeds from litigation settlements. Any proceeds received from litigation involving portfolio holdings are reflected in the Statement of Operations in realized gain/loss if the security has been disposed of by the fund or in unrealized gain/loss if the security is still held by the fund. Any other proceeds from litigation not related to portfolio holdings are reflected as other income in the Statement of Operations.
Fees Paid Indirectly – The fund’s custody fee may be reduced according to an arrangement that measures the value of cash deposited with the custodian by the fund. This amount, for the six months ended February 28, 2010, is shown as a reduction of total expenses on the Statement of Operations.
Tax Matters and Distributions – The fund intends to qualify as a regulated investment company, as defined under Subchapter M of the Internal Revenue Code, and to distribute all of its taxable income, including realized capital gains. As a result, no provision for federal income tax is required. The fund’s federal tax returns for the prior three fiscal years remain subject to examination by the Internal Revenue Service. Foreign taxes, if any, have been accrued by the fund in the accompanying financial statements.
Distributions to shareholders are recorded on the ex-dividend date. Income and capital gain distributions are determined in accordance with income tax regulations, which may differ from U.S. generally accepted accounting principles. Certain capital accounts in the financial statements are periodically adjusted for permanent differences in order to reflect their tax character. These adjustments have no impact on net assets or net asset value per share. Temporary differences which arise from recognizing certain items of income, expense, gain or loss in different periods for financial statement and tax purposes will reverse at some time in the future. Distributions in excess of net investment income or net realized gains are temporary overdistributions for financial statement purposes resulting from differences in the recognition or classification of income or distributions for financial statement and tax purposes.
Book/tax differences primarily relate to wash sale loss deferrals and capital loss carryforwards and wash sale loss deferrals assumed as a result of the acquisition of MFS Strategic Value Fund.
31
Notes to Financial Statements (unaudited) – continued
The tax character of distributions made during the current period will be determined at fiscal year end. The tax character of distributions declared to shareholders for the last fiscal year is as follows:
| | |
| | | 8/31/09 |
| Ordinary income (including any short-term capital gains) | | $154,220,972 |
The federal tax cost and the tax basis components of distributable earnings were as follows:
| | | |
| As of 2/28/10 | | | |
| Cost of investments | | $11,402,916,725 | |
| Gross appreciation | | 1,537,354,448 | |
| Gross depreciation | | (291,501,062 | ) |
| Net unrealized appreciation (depreciation) | | $1,245,853,386 | |
| |
| As of 8/31/09 | | | |
| Undistributed ordinary income | | 21,842,009 | |
| Capital loss carryforwards | | (404,918,017 | ) |
| Post-October capital loss deferral | | (811,249,945 | ) |
| Other temporary differences | | (2,150,351 | ) |
| Net unrealized appreciation (depreciation) | | 498,723,570 | |
The aggregate cost above includes prior fiscal year end tax adjustments.
As of August 31, 2009, the fund had capital loss carryforwards available to offset future realized gains. Such losses expire as follows:
| | | |
| 8/31/16 | | $(173,813,061 | ) |
| 8/31/17 | | (231,104,956 | ) |
| Total | | $(404,918,017 | ) |
The availability of a portion of the capital loss carryforwards, which were acquired on July 24, 2009 in connection with the MFS Strategic Value Fund merger, may be limited in a given year.
Multiple Classes of Shares of Beneficial Interest – The fund offers multiple classes of shares, which differ in their respective distribution, service, and program manager fees. The fund’s income, realized and unrealized gain (loss), and common expenses are allocated to shareholders based on the daily net assets of each class. Dividends are declared separately for each class. Differences in per share dividend rates are generally due to differences in separate class expenses. Class B and Class 529B shares will convert to Class A and Class 529A shares, respectively, approximately eight years after purchase.
32
Notes to Financial Statements (unaudited) – continued
The fund’s distributions declared to shareholders as reported on the Statements of Changes in Net Assets are presented by class as follows:
| | | | |
| | | From net investment income |
| | | Six months ended
2/28/10 | | Year ended
8/31/09 |
| Class A | | $39,373,930 | | $84,055,338 |
| Class B | | 1,414,302 | | 4,941,104 |
| Class C | | 3,519,730 | | 8,662,663 |
| Class I | | 24,136,431 | | 29,668,552 |
| Class W | | 10,205,190 | | 13,508,786 |
| Class R1 | | 150,758 | | 309,031 |
| Class R2 | | 2,250,718 | | 3,733,677 |
| Class R3 | | 3,116,876 | | 4,556,365 |
| Class R4 | | 8,189,063 | | 4,668,683 |
| Class 529A | | 39,152 | | 84,438 |
| Class 529B | | 4,446 | | 14,160 |
| Class 529C | | 6,854 | | 18,175 |
| Total | | $92,407,450 | | $154,220,972 |
| (3) | | Transactions with Affiliates |
Investment Adviser – The fund has an investment advisory agreement with MFS to provide overall investment management and related administrative services and facilities to the fund.
The management fee is computed daily and paid monthly at the following annual rates:
| | | |
| First $7.5 billion of average daily net assets | | 0.60 | % |
| Next $2.5 billion of average daily net assets | | 0.53 | % |
| Average daily net assets in excess of $10 billion | | 0.50 | % |
The investment adviser has agreed in writing to reduce its management fee to 0.45% of average daily net assets in excess of $12.5 billion. This written agreement will continue until modified by the fund’s Board of Trustees, but such agreement will continue at least until November 30, 2012. For the six months ended February 28, 2010, the fund’s average daily net assets did not exceed $12.5 billion and therefore, the management fee was not reduced.
The management fee incurred for the six months ended February 28, 2010 was equivalent to an annual effective rate of 0.57% of the fund’s average daily net assets.
Distributor – MFS Fund Distributors, Inc. (MFD), a wholly-owned subsidiary of MFS, as distributor, received $404,078 and $1,817 for the six months ended February 28, 2010, as its portion of the initial sales charge on sales of Class A and Class 529A shares of the fund, respectively.
The Board of Trustees has adopted a distribution plan for certain class shares pursuant to Rule 12b-1 of the Investment Company Act of 1940.
33
Notes to Financial Statements (unaudited) – continued
The fund’s distribution plan provides that the fund will pay MFD for services provided by MFD and financial intermediaries in connection with the distribution and servicing of certain share classes. One component of the plan is a distribution fee paid to MFD and another component of the plan is a service fee paid to MFD. MFD may subsequently pay all, or a portion, of the distribution and/or service fees to financial intermediaries.
Distribution Plan Fee Table:
| | | | | | | | | | |
| | | Distribution
Fee Rate (d) | | Service
Fee Rate (d) | | Total
Distribution
Plan (d) | | Annual
Effective
Rate (e) | | Distribution
and Service
Fee |
| Class A | | — | | 0.25% | | 0.25% | | 0.25% | | $6,244,117 |
| Class B | | 0.75% | | 0.25% | | 1.00% | | 1.00% | | 1,731,404 |
| Class C | | 0.75% | | 0.25% | | 1.00% | | 1.00% | | 4,113,095 |
| Class W | | 0.10% | | — | | 0.10% | | 0.10% | | 594,800 |
| Class R1 | | 0.75% | | 0.25% | | 1.00% | | 1.00% | | 168,556 |
| Class R2 | | 0.25% | | 0.25% | | 0.50% | | 0.50% | | 848,216 |
| Class R3 | | — | | 0.25% | | 0.25% | | 0.25% | | 516,240 |
| Class 529A | | — | | 0.25% | | 0.25% | | 0.25% | | 6,542 |
| Class 529B | | 0.75% | | 0.25% | | 1.00% | | 1.00% | | 6,091 |
| Class 529C | | 0.75% | | 0.25% | | 1.00% | | 1.00% | | 9,019 |
| Total Distribution and Service Fees | | | | | | | | $14,238,080 |
| (d) | In accordance with the distribution plan for certain classes, the fund pays distribution and/or service fees equal to these annual percentage rates of each class’ average daily net assets. The distribution and service fee rates disclosed by class represent the current rates in effect at the end of the reporting period. Any rate changes, if applicable, are detailed below. |
| (e) | The annual effective rates represent actual fees incurred under the distribution plan for the six months ended February 28, 2010 based on each class’ average daily net assets. |
Certain Class A shares purchased on or subsequent to September 1, 2008 are subject to a contingent deferred sales charge (CDSC) in the event of a shareholder redemption within 24 months of purchase. Class C and Class 529C shares are subject to a CDSC in the event of a shareholder redemption within 12 months of purchase. Class B and Class 529B shares are subject to a CDSC in the event of a shareholder redemption within six years of purchase. All contingent deferred sales charges are paid to MFD and during the six months ended February 28, 2010, were as follows:
| | |
| | | Amount |
| Class A | | $3,018 |
| Class B | | 147,016 |
| Class C | | 46,594 |
| Class 529B | | 194 |
| Class 529C | | 43 |
The fund has entered into and may from time to time enter into contracts with program managers and other parties which administer the tuition programs
34
Notes to Financial Statements (unaudited) – continued
through which an investment in the fund’s 529 share classes is made. The fund has entered into an agreement with MFD pursuant to which MFD receives an annual fee of up to 0.10% of the average daily net assets attributable to each 529 share class. The services provided by MFD, or a third party with which MFD contracts, include recordkeeping and tax reporting and account services, as well as services designed to maintain the program’s compliance with the Internal Revenue Code and other regulatory requirements. Program manager fees for the six months ended February 28, 2010, were as follows:
| | |
| | | Amount |
| Class 529A | | $2,617 |
| Class 529B | | 609 |
| Class 529C | | 902 |
| Total Program Manager Fees | | $4,128 |
Shareholder Servicing Agent – MFS Service Center, Inc. (MFSC), a wholly-owned subsidiary of MFS, receives a fee from the fund for its services as shareholder servicing agent calculated as a percentage of the average daily net assets of the fund as determined periodically under the supervision of the fund’s Board of Trustees. For the six months ended February 28, 2010, the fee was $1,455,043, which equated to 0.0247% annually of the fund’s average daily net assets. MFSC also receives payment from the fund for out-of-pocket expenses, sub-accounting and other shareholder servicing costs which may be paid to affiliated and unaffiliated service providers. For the six months ended February 28, 2010, these out-of-pocket expenses, sub-accounting and other shareholder servicing costs amounted to $4,413,448.
Under a Special Servicing Agreement among MFS, each MFS fund which invests in other MFS funds (“MFS fund-of-funds”) and certain underlying funds in which a MFS fund-of-funds invests (“underlying funds”), each underlying fund may pay a portion of each MFS fund-of-fund’s transfer agent-related expenses, including sub-accounting fees payable to financial intermediaries, to the extent such payments do not exceed the benefits realized or expected to be realized by the underlying fund from the investment in the underlying fund by the MFS fund-of-fund. For the six months ended February 28, 2010, these costs for the fund amounted to $408,901 and are reflected in the shareholder servicing costs on the Statement of Operations.
Administrator – MFS provides certain financial, legal, shareholder communications, compliance, and other administrative services to the fund. Under an administrative services agreement, the fund partially reimburses MFS the costs incurred to provide these services. The fund is charged an annual fixed amount of $17,500 plus a fee based on average daily net assets. The administrative services fee incurred for the six months ended February 28, 2010 was equivalent to an annual effective rate of 0.0149% of the fund’s average daily net assets.
35
Notes to Financial Statements (unaudited) – continued
Trustees’ and Officers’ Compensation – The fund pays compensation to independent Trustees in the form of a retainer, attendance fees, and additional compensation to Board and Committee chairpersons. The fund does not pay compensation directly to Trustees or officers of the fund who are also officers of the investment adviser, all of whom receive remuneration for their services to the fund from MFS. Certain officers and Trustees of the fund are officers or directors of MFS, MFD, and MFSC.
Prior to December 31, 2001, the fund had an unfunded defined benefit plan (“DB plan”) for independent Trustees. As of December 31, 2001, the Board took action to terminate the DB plan with respect to then-current and any future independent Trustees, such that the DB Plan covers only certain of those former independent Trustees who retired on or before December 31, 2001. The DB Plan resulted in a pension expense of $543 and is included in independent Trustees’ compensation for the six months ended February 28, 2010. The liability for deferred retirement benefits payable to certain independent Trustees under the DB plan amounted to $7,240 at February 28, 2010, and is included in payable for independent Trustees’ compensation on the Statement of Assets and Liabilities.
Other – This fund and certain other funds managed by MFS (the funds) have entered into services agreements (the Agreements) which provide for payment of fees by the funds to Tarantino LLC and Griffin Compliance LLC in return for the provision of services of an Independent Chief Compliance Officer (ICCO) and Assistant ICCO, respectively, for the funds. The ICCO and Assistant ICCO are officers of the funds and the sole members of Tarantino LLC and Griffin Compliance LLC, respectively. The funds can terminate the Agreements with Tarantino LLC and Griffin Compliance LLC at any time under the terms of the Agreements. For the six months ended February 28, 2010, the aggregate fees paid by the fund to Tarantino LLC and Griffin Compliance LLC were $69,392 and are included in miscellaneous expense on the Statement of Operations. MFS has agreed to reimburse the fund for a portion of the payments made by the fund in the amount of $23,572, which is shown as a reduction of total expenses in the Statement of Operations. Additionally, MFS has agreed to bear all expenses associated with office space, other administrative support, and supplies provided to the ICCO and Assistant ICCO.
The fund may invest in the MFS Institutional Money Market Portfolio which is managed by MFS and seeks a high level of current income consistent with preservation of capital and liquidity. Income earned on this investment is included in dividends from underlying funds on the Statement of Operations. This money market fund does not pay a management fee to MFS.
36
Notes to Financial Statements (unaudited) – continued
Purchases and sales of investments, other than U.S. Government securities, purchased option transactions, and short-term obligations, aggregated $2,709,203,986 and $1,211,787,649, respectively.
| (5) | | Shares of Beneficial Interest |
The fund’s Declaration of Trust permits the Trustees to issue an unlimited number of full and fractional shares of beneficial interest. Transactions in fund shares were as follows:
| | | | | | | | |
| | | Six months ended
2/28/10 | | Year ended
8/31/09 |
| | | Shares | | Amount | | Shares | | Amount |
| Shares sold | | | | | | | | |
Class A | | 43,415,296 | | $883,789,750 | | 114,220,241 | | $1,977,046,497 |
Class B | | 687,994 | | 13,924,093 | | 1,851,024 | | 31,978,710 |
Class C | | 5,365,194 | | 108,315,734 | | 9,668,328 | | 168,722,263 |
Class I | | 38,280,713 | | 781,965,953 | | 81,825,274 | | 1,495,504,115 |
Class W | | 20,691,556 | | 421,203,335 | | 42,042,814 | | 751,366,445 |
Class R1 | | 436,341 | | 8,787,821 | | 859,001 | | 14,365,812 |
Class R2 | | 6,185,792 | | 125,346,823 | | 7,879,905 | | 136,521,336 |
Class R3 | | 9,683,850 | | 198,394,637 | | 12,546,759 | | 215,521,587 |
Class R4 | | 24,375,632 | | 495,167,810 | | 29,125,129 | | 501,838,158 |
Class 529A | | 16,150 | | 326,543 | | 44,407 | | 725,464 |
Class 529B | | 2,912 | | 58,712 | | 8,554 | | 143,812 |
Class 529C | | 9,988 | | 198,407 | | 15,101 | | 253,141 |
| | 149,151,418 | | $3,037,479,618 | | 300,086,537 | | $5,293,987,340 |
| Shares issued in connection with acquisition of MFS Strategic Value Fund | | | | | | | | |
Class A | | — | | $— | | 5,927,351 | | $110,841,470 |
Class B | | — | | — | | 2,483,156 | | 46,161,864 |
Class C | | — | | — | | 1,254,950 | | 23,282,099 |
Class I | | — | | — | | 140,193 | | 2,632,823 |
Class R1 | | — | | — | | 43,158 | | 795,393 |
Class R2 | | — | | — | | 52,077 | | 966,551 |
Class R3 | | — | | — | | 102,973 | | 1,922,735 |
Class R4 | | — | | — | | 6,623 | | 123,930 |
| | — | | $— | | 10,010,481 | | $186,726,865 |
37
Notes to Financial Statements (unaudited) – continued
| | | | | | | | | | | | |
| | | Six months ended
2/28/10 | | | Year ended
8/31/09 | |
| | | Shares | | | Amount | | | Shares | | | Amount | |
| Shares issued to shareholders in reinvestment of distributions | | | | | | | | | | | | |
Class A | | 1,685,143 | | | $34,227,502 | | | 3,646,818 | | | $64,925,044 | |
Class B | | 60,200 | | | 1,217,983 | | | 235,893 | | | 4,136,858 | |
Class C | | 106,770 | | | 2,154,490 | | | 299,018 | | | 5,216,018 | |
Class I | | 719,315 | | | 14,671,612 | | | 1,352,689 | | | 24,305,732 | |
Class W | | 486,589 | | | 9,873,690 | | | 715,689 | | | 12,615,286 | |
Class R1 | | 7,493 | | | 150,332 | | | 17,971 | | | 309,031 | |
Class R2 | | 106,818 | | | 2,155,582 | | | 202,274 | | | 3,554,285 | |
Class R3 | | 153,770 | | | 3,116,870 | | | 260,962 | | | 4,556,365 | |
Class R4 | | 346,484 | | | 7,041,863 | | | 182,633 | | | 3,234,419 | |
Class 529A | | 1,939 | | | 39,152 | | | 4,779 | | | 84,386 | |
Class 529B | | 222 | | | 4,446 | | | 820 | | | 14,149 | |
Class 529C | | 342 | | | 6,854 | | | 1,053 | | | 18,149 | |
| | 3,675,085 | | | $74,660,376 | | | 6,920,599 | | | $122,969,722 | |
| Shares reacquired | | | | | | | | | | | | |
Class A | | (31,844,694 | ) | | $(647,017,284 | ) | | (124,230,352 | ) | | $(2,212,076,546 | ) |
Class B | | (4,808,938 | ) | | (98,223,470 | ) | | (13,801,295 | ) | | (235,153,482 | ) |
Class C | | (3,826,151 | ) | | (76,999,492 | ) | | (11,168,256 | ) | | (189,581,664 | ) |
Class I | | (14,677,145 | ) | | (299,168,453 | ) | | (33,062,871 | ) | | (528,992,098 | ) |
Class W | | (9,653,694 | ) | | (196,537,469 | ) | | (15,609,548 | ) | | (267,801,880 | ) |
Class R1 | | (275,848 | ) | | (5,559,762 | ) | | (391,073 | ) | | (6,633,795 | ) |
Class R2 | | (2,056,028 | ) | | (41,550,775 | ) | | (3,694,508 | ) | | (63,192,966 | ) |
Class R3 | | (2,720,796 | ) | | (55,342,544 | ) | | (3,243,149 | ) | | (55,647,147 | ) |
Class R4 | | (3,740,919 | ) | | (76,239,886 | ) | | (3,842,938 | ) | | (66,874,580 | ) |
Class 529A | | (15,207 | ) | | (306,697 | ) | | (44,449 | ) | | (749,328 | ) |
Class 529B | | (6,893 | ) | | (138,399 | ) | | (15,132 | ) | | (246,206 | ) |
Class 529C | | (7,175 | ) | | (144,402 | ) | | (24,121 | ) | | (418,407 | ) |
| | (73,633,488 | ) | | $(1,497,228,633 | ) | | (209,127,692 | ) | | $(3,627,368,099 | ) |
| Net change | | | | | | | | | | | | |
Class A | | 13,255,745 | | | $270,999,968 | | | (435,942 | ) | | $(59,263,535 | ) |
Class B | | (4,060,744 | ) | | (83,081,394 | ) | | (9,231,222 | ) | | (152,876,050 | ) |
Class C | | 1,645,813 | | | 33,470,732 | | | 54,040 | | | 7,638,716 | |
Class I | | 24,322,883 | | | 497,469,112 | | | 50,255,285 | | | 993,450,572 | |
Class W | | 11,524,451 | | | 234,539,556 | | | 27,148,955 | | | 496,179,851 | |
Class R1 | | 167,986 | | | 3,378,391 | | | 529,057 | | | 8,836,441 | |
Class R2 | | 4,236,582 | | | 85,951,630 | | | 4,439,748 | | | 77,849,206 | |
Class R3 | | 7,116,824 | | | 146,168,963 | | | 9,667,545 | | | 166,353,540 | |
Class R4 | | 20,981,197 | | | 425,969,787 | | | 25,471,447 | | | 438,321,927 | |
Class 529A | | 2,882 | | | 58,998 | | | 4,737 | | | 60,522 | |
Class 529B | | (3,759 | ) | | (75,241 | ) | | (5,758 | ) | | (88,245 | ) |
Class 529C | | 3,155 | | | 60,859 | | | (7,967 | ) | | (147,117 | ) |
| | 79,193,015 | | | $1,614,911,361 | | | 107,889,925 | | | $1,976,315,828 | |
38
Notes to Financial Statements (unaudited) – continued
The fund is one of several mutual funds in which the MFS funds-of-funds may invest. The MFS funds-of-funds do not invest in the underlying MFS funds for the purpose of exercising management or control. At the end of the period, the MFS Growth Allocation Fund, MFS Moderate Allocation Fund, and MFS Aggressive Growth Allocation Fund were the owners of record of approximately 2%, 1%, and 1% respectively, of the value of outstanding voting shares of the fund. In addition, the MFS Conservative Allocation Fund, MFS Lifetime Retirement Income Fund, MFS Lifetime 2010 Fund, MFS Lifetime 2020 Fund, MFS Lifetime 2030 Fund, and the MFS Lifetime 2040 Fund were each the owners of record of less than 1% of the value of outstanding voting shares of the fund.
The fund and certain other funds managed by MFS participate in a $1.1 billion unsecured committed line of credit, subject to a $1 billion sublimit, provided by a syndication of banks under a credit agreement. Borrowings may be made for temporary financing needs. Interest is charged to each fund, based on its borrowings, generally at a rate equal to the higher of the Federal Reserve funds rate or one month LIBOR plus an agreed upon spread. A commitment fee, based on the average daily, unused portion of the committed line of credit, is allocated among the participating funds at the end of each calendar quarter. In addition, the fund and other funds managed by MFS have established unsecured uncommitted borrowing arrangements with certain banks for temporary financing needs. Interest is charged to each fund, based on its borrowings, at a rate equal to the Federal Reserve funds rate plus an agreed upon spread. For the six months ended February 28, 2010, the fund’s commitment fee and interest expense were $79,234 and $0, respectively, and are included in miscellaneous expense on the Statement of Operations.
The fund’s investment adviser, MFS, was the subject of an administrative proceeding concerning market timing which resulted in the Securities and Exchange Commission (the “SEC”) entering an order approving a settlement with MFS and two of its former officers (the “Settlement Order”). Under the terms of the Settlement Order, MFS transferred $175 million in disgorgement and $50 million in penalty (the “Payments”) to the SEC, which established a Fair Fund from which settlement funds have been, or will be, distributed to eligible current and former shareholders of the fund and certain other affected MFS retail funds. The Payments, along with additional amounts from a third-party settlement, have been, or will be, distributed to eligible shareholders in accordance with a plan developed by an independent distribution consultant (the “IDC”) in consultation with MFS and the Board of Trustees of the MFS retail funds. The plan was approved in July 2007 by the
39
Notes to Financial Statements (unaudited) – continued
SEC. Pursuant to the distribution plan, after the distributions to eligible shareholders have been made, residual amounts, if any, may be available for distribution to the fund and certain other affected MFS retail funds. Certain procedural conditions of the distribution plan have not been met to date and, as such, the ultimate timing and amount of any payment of the residual amount is not known at this time.
| (8) | | Transactions in Underlying Funds-Affiliated Issuers |
An affiliated issuer may be considered one in which the fund owns 5% or more of the outstanding voting securities, or a company which is under common control. For the purposes of this report, the fund assumes the following to be affiliated issuers:
| | | | | | | | | |
| Underlying Funds | | Beginning
Shares/Par
Amount | | Acquisitions
Shares/Par
Amount | | Dispositions
Shares/Par
Amount | | | Ending
Shares/Par
Amount |
| MFS Institutional Money Market Portfolio | | 136,700,516 | | 1,561,384,937 | | (1,523,342,665 | ) | | 174,742,788 |
| | | | |
| Underlying Funds | | Realized
Gain (Loss) | | Capital Gain
Distributions | | Dividend
Income | | | Ending
Value |
| MFS Institutional Money Market Portfolio | | $— | | $— | | $131,809 | | | $174,742,788 |
At close of business on July 24, 2009, the fund acquired all of the assets and liabilities of MFS Strategic Value Fund. The acquisition was accomplished by a tax-free exchange of 10,010,481 shares of the fund (valued at $186,726,865) for all of the assets and liabilities of MFS Strategic Value Fund. MFS Strategic Value Fund then distributed the shares of the fund that MFS Strategic Value Fund received from the fund to its shareholders. MFS Strategic Value Fund’s net assets on that date were $186,726,865, including $5,941,770 of unrealized appreciation, $260,707 of accumulated net investment loss, and $183,222,873 of accumulated net realized loss on investments and foreign currency transactions. The aggregate net assets of the fund after the acquisition were $9,770,920,204.
40
RESULTS OF SHAREHOLDER MEETING
(unaudited)
At a special meeting of shareholders of MFS Series Trust I, which was held on January 28, 2010, the following actions were taken:
Item 1. To elect the following individuals as Trustees:
| | | | |
| | | Number of Dollars |
Nominee | | For | | Withheld Authority |
| Robert E. Butler | | 13,799,428,259.131 | | 298,698,895.701 |
| Lawrence H. Cohn | | 13,775,964,000.646 | | 322,163,154.185 |
| Maureen R. Goldfarb | | 13,797,667,920.487 | | 300,459,234.345 |
| David H. Gunning | | 13,795,139,579.854 | | 302,987,574.978 |
| William R. Gutow | | 13,798,125,706.624 | | 300,001,448.207 |
| Michael Hegarty | | 13,780,926,681.791 | | 317,200,473.041 |
| John P. Kavanaugh | | 13,799,879,923.291 | | 298,247,231.541 |
| Robert J. Manning | | 13,802,393,104.041 | | 295,734,050.791 |
| Robert C. Pozen | | 13,802,480,679.754 | | 295,646,475.078 |
| J. Dale Sherratt | | 13,779,899,981.473 | | 318,227,173.359 |
| Laurie J. Thomsen | | 13,797,678,786.081 | | 300,448,368.750 |
| Robert W. Uek | | 13,798,504,506.307 | | 299,622,648.525 |
41
BOARD REVIEW OF INVESTMENT ADVISORY AGREEMENT
A discussion regarding the Board’s most recent review and renewal of the fund’s Investment Advisory Agreement with MFS is available by clicking on the fund’s name under “Mutual Funds” in the “Products and Performance” section of the MFS Web site (mfs.com).
PROXY VOTING POLICIES AND INFORMATION
A general description of the MFS funds’ proxy voting policies and procedures is available without charge, upon request, by calling 1-800-225-2606, by visiting the Proxy Voting section of mfs.com or by visiting the SEC’s Web site at http://www.sec.gov.
Information regarding how the fund voted proxies relating to portfolio securities during the most recent twelve-month period ended June 30 is available without charge by visiting the Proxy Voting section of mfs.com or by visiting the SEC’s Web site at http://www.sec.gov.
QUARTERLY PORTFOLIO DISCLOSURE
The fund will file a complete schedule of portfolio holdings with the Securities and Exchange Commission (the Commission) for the first and third quarters of each fiscal year on Form N-Q. The fund’s Form N-Q may be reviewed and copied at the:
Public Reference Room
Securities and Exchange Commission
100 F Street, NE, Room 1580
Washington, D.C. 20549
Information on the operation of the Public Reference Room may be obtained by calling the Commission at 1-800-SEC-0330. The fund’s Form N-Q is available on the EDGAR database on the Commission’s Internet Web site at http://www.sec.gov, and copies of this information may be obtained, upon payment of a duplicating fee, by electronic request at the following e-mail address: publicinfo@sec.gov or by writing the Public Reference Section at the above address.
A shareholder can also obtain the quarterly portfolio holdings report at mfs.com.
FURTHER INFORMATION
From time to time, MFS may post important information about the fund or the MFS funds on the MFS web site (mfs.com). This information is available by visiting the “News & Commentary” section of mfs.com or by clicking on the fund’s name under “Mutual Funds” in the “Products and Performance” section of mfs.com.
42
CONTACT US
Web site
mfs.com
MFS TALK
1-800-637-8255
24 hours a day
Account service and literature
Shareholders
1-800-225-2606
Investment professionals
1-800-343-2829
Retirement plan services
1-800-637-1255
Mailing address
MFS Service Center, Inc.
P.O. Box 55824
Boston, MA 02205-5824
Overnight mail
MFS Service Center, Inc.
c/o Boston Financial Data Services
30 Dan Road
Canton, MA 02021-2809

Save paper with eDelivery. MFS® will send you prospectuses, reports, and proxies directly via e-mail so you will get information faster with less mailbox clutter. To sign up: 1. go to mfs.com. 2. log in via MFS® Access. 3. select eDelivery. If you own your MFS fund shares through a financial institution or a retirement plan, MFS® TALK, MFS Access, and eDelivery may not be available to you.

The Registrant has not amended any provision in its Code of Ethics (the “Code”) that relates to any element of the Code’s definition enumerated in paragraph (b) of Item 2 of this Form N-CSR.
| ITEM 3. | AUDIT COMMITTEE FINANCIAL EXPERT. |
Not applicable for semi-annual reports.
| ITEM 4. | PRINCIPAL ACCOUNTANT FEES AND SERVICES. |
Not applicable for semi-annual reports.
| ITEM 5. | AUDIT COMMITTEE OF LISTED REGISTRANTS. |
Not applicable to the Registrant.
A schedule of investments for each series of the Registrant is included as part of the report to shareholders of such series under Item 1 of this Form N-CSR.
| ITEM 7. | DISCLOSURE OF PROXY VOTING POLICIES AND PROCEDURES FOR CLOSED-END MANAGEMENT INVESTMENT COMPANIES. |
Not applicable to the Registrant.
| ITEM 8. | PORTFOLIO MANAGERS OF CLOSED-END MANAGEMENT INVESTMENT COMPANIES. |
Not applicable to the Registrant.
| ITEM 9. | PURCHASES OF EQUITY SECURITIES BY CLOSED-END MANAGEMENT INVESTMENT COMPANY AND AFFILIATED PURCHASERS. |
Not applicable to the Registrant.
| ITEM 10. | SUBMISSION OF MATTERS TO A VOTE OF SECURITY HOLDERS. |
There were no material changes to the procedures by which shareholders may send recommendations to the Board for nominees to the Registrant’s Board since the Registrant last provided disclosure as to such procedures in response to the requirements of Item 407 (c)(2)(iv) of Regulation S-K or this Item.
| ITEM 11. | CONTROLS AND PROCEDURES. |
| (a) | Based upon their evaluation of the effectiveness of the registrant’s disclosure controls and procedures (as defined in Rule 30a-3(c) under the Investment Company Act of 1940 (the “Act”)) as conducted within 90 days of the filing date of this report on Form N-CSR, the registrant’s principal financial officer and principal executive officer have concluded that those disclosure controls and procedures provide reasonable assurance that the material information required to be disclosed by the registrant on this report is recorded, processed, summarized and reported within the time periods specified in the Securities and Exchange Commission’s rules and forms. |
| (b) | There were no changes in the registrant’s internal controls over financial reporting (as defined in Rule 30a-3(d) under the Act) that occurred during the second fiscal quarter of the period covered by the report that have materially affected, or are reasonably likely to materially affect, the registrant’s internal control over financial reporting. |
| (a) | File the exhibits listed below as part of this form. Letter or number the exhibits in the sequence indicated. |
| | (1) | Any code of ethics, or amendment thereto, that is the subject of the disclosure required by Item 2, to the extent that the registrant intends to satisfy the Item 2 requirements through filing of an exhibit. |
| | (2) | A separate certification for each principal executive officer and principal financial officer of the registrant as required by Rule 30a-2 under the Act (17 CFR 270.30a-2): Attached hereto. |
| | (b) | If the report is filed under Section 13(a) or 15(d) of the Exchange Act, provide the certifications required by Rule 30a-2(b) under the Act (17 CFR 270.30a-2(b)), Rule 13a-14(b) or Rule 15d-14(b) under the Exchange Act (17 CFR 240.13a-14(b) or 240.15d-14(b)) and Section 1350 of Chapter 63 of Title 18 of the United States Code (18 U.S.C. 1350) as an exhibit. A certification furnished pursuant to this paragraph will not be deemed “filed” for the purposes of Section 18 of the Exchange Act (15 U.S.C. 78r), or otherwise subject to the liability of that section. Such certification will not be deemed to be incorporated by reference into any filing under the Securities Act of 1933 or the Exchange Act, except to the extent that the registrant specifically incorporates it by reference: Attached hereto. |
Notice
A copy of the Amended and Restated Declaration of Trust, as amended, of the Registrant is on file with the Secretary of State of The Commonwealth of Massachusetts and notice is hereby given that this instrument is executed on behalf of the Registrant by an officer of the Registrant as an officer and not individually and the obligations of or arising out of this instrument are not binding upon any of the Trustees or shareholders individually, but are binding only upon the assets and property of the respective constituent series of the Registrant.
SIGNATURES
Pursuant to the requirements of the Securities Exchange Act of 1934 and the Investment Company Act of 1940, the registrant has duly caused this report to be signed on its behalf by the undersigned, thereunto duly authorized.
(Registrant) MFS SERIES TRUST I
| | |
| By (Signature and Title)* | | MARIA F. DWYER |
| | Maria F. Dwyer, President |
Date: April 16, 2010
Pursuant to the requirements of the Securities Exchange Act of 1934 and the Investment Company Act of 1940, this report has been signed below by the following persons on behalf of the registrant and in the capacities and on the dates indicated.
| | |
| By (Signature and Title)* | | MARIA F. DWYER |
| | Maria F. Dwyer, President (Principal Executive Officer) |
Date: April 16, 2010
| | |
| By (Signature and Title)* | | JOHN M. CORCORAN |
| | John M. Corcoran, Treasurer (Principal Financial Officer and Accounting Officer) |
Date: April 16, 2010
| * | Print name and title of each signing officer under his or her signature. |