UNITED STATES
SECURITIES AND EXCHANGE COMMISSION
Washington, D.C. 20549
FORM N-CSR
CERTIFIED SHAREHOLDER REPORT OF
REGISTERED MANAGEMENT INVESTMENT COMPANIES
Investment Company Act file number 811-4777
MFS SERIES TRUST I
(Exact name of registrant as specified in charter)
500 Boylston Street, Boston, Massachusetts 02116
(Address of principal executive offices) (Zip code)
Susan S. Newton
Massachusetts Financial Services Company
500 Boylston Street
Boston, Massachusetts 02116
(Name and address of agents for service)
Registrant’s telephone number, including area code: (617) 954-5000
Date of fiscal year end: August 31
Date of reporting period: August 31, 2009
| ITEM 1. | REPORTS TO STOCKHOLDERS. |

MFS® Cash Reserve Fund
SIPC Contact Information:
You may obtain information about the Securities Investor Protection Corporation (“SIPC”), including the SIPC Brochure, by contacting SIPC either by telephone (202-371-8300) or by accessing SIPC’s website address (www.sipc.org).
The report is prepared for the general information of shareholders. It is authorized for distribution to prospective investors only when preceded or accompanied by a current prospectus.
NOT FDIC INSURED Ÿ MAY LOSE VALUE Ÿ
NO BANK GUARANTEE
8/31/09
LMM-ANN

LETTER FROM THE CEO
Dear Shareholders:
In the fall of 2008, the markets took investors on what was perhaps the most tumultuous ride of their lives. Many are now debating when the market will stage a sustainable recovery, but not even the most experienced investor can provide a definitive answer to that question.
Even so, the basic rules of investing have not changed, and the turbulence reinforced the benefits of investing through the waves. Investors who jumped ship early on may have regretted their decisions when the markets gained some traction in the early half of this year. While anyone with a short-term horizon may have needed to take some action, most with longer-term goals probably found the best option was to stick with their long-term strategy.
At MFS® we believe investors are always best served by developing a plan with their investment professionals that addresses specific long-term needs. Most advisors agree that yearly reviews are important to monitor a plan’s progress. Most would also caution their clients against reacting too quickly to the daily news. When markets do recover, they often gain ground in quick, sudden bursts. If you are out of the market, you can easily miss the benefits of these rallies.
Few of us would again like to live through the kind of market turmoil we saw over the past year. But as turbulent as markets were, in our view, they proved that the fundamental principles of long-term investing still apply.
Respectfully,

Robert J. Manning
Chief Executive Officer and Chief Investment Officer
MFS Investment Management®
October 15, 2009
The opinions expressed in this letter are subject to change, may not be relied upon for investment advice, and no forecasts can be guaranteed.
1
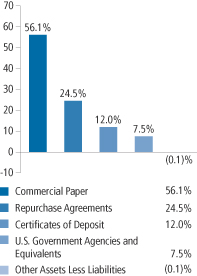
PORTFOLIO COMPOSITION
Portfolio structure (u)
| | |
| Short term credit quality (q) | | |
Average Credit Quality
Short Term Bonds (a) | | A-1 |
| All holdings are rated “A-1” | | |
| | |
| Maturity breakdown (u) | | |
0 - 29 days | | 69.1% |
| 30 - 59 days | | 11.5% |
| 90 - 366 days | | 19.5% |
| Other Assets Less Liabilities | | (0.1)% |
| (a) | The average credit quality is based upon a market weighted average of portfolio holdings that are rated by public rating agencies. |
| (q) | Each security is assigned a rating from Moody’s Investors Service. If not rated by Moody’s, the rating will be that assigned by Standard & Poor’s. Likewise, if not assigned a rating by Standard & Poor’s, it will be based on the rating assigned by Fitch, Inc. If not rated by any of the three agencies, the security is considered Not Rated. U.S. Treasuries and U.S. Agency securities are included in the “A-1”-rating category. Percentages are based on the total market value of investments as of 8/31/09. |
| (u) | For purposes of this presentation, accrued interest, where applicable, is included. |
From time to time “Other Assets Less Liabilities” may be negative due to timing of cash receipts.
Percentages are based on net assets as of 8/31/09, unless otherwise noted.
The portfolio is actively managed and current holdings may be different.
2
PERFORMANCE SUMMARY THROUGH 8/31/09
Total returns as well as the current 7-day yield have been provided for the applicable time periods. Performance results reflect the percentage change in net asset value, including the reinvestment of any dividends and capital gains distributions. (See Notes to Performance Summary.)
Performance data shown represents past performance and is no guarantee of future results. Although the fund seeks to preserve the value of your investment at $1.00 per share, you could lose money on your investment in the fund. An investment in the fund is not a bank deposit and is not insured or guaranteed by the Federal Deposit Insurance Corporation or any other governmental agency. The performance shown does not reflect the deduction of taxes, if any, that a shareholder would pay on fund distributions or the redemption of fund shares.
| | | | | | | | | | | | |
| | | Share class | | Inception | | 1 Year Total
Return (without
sales charge) | | Current
7-day yield (w) | | Current
7-day yield
without waiver | | |
| | | A | | 9/07/93 | | 0.31% | | 0.00% | | (0.40)% | | |
| | | B | | 12/29/86 | | 0.10% | | 0.00% | | (1.40)% | | |
| | | C | | 4/01/96 | | 0.10% | | 0.00% | | (1.40)% | | |
| | | R1 | | 4/01/05 | | 0.10% | | 0.00% | | (1.40)% | | |
| | | R2 | | 4/01/05 | | 0.17% | | 0.00% | | (0.90)% | | |
| | | R3 | | 4/01/05 | | 0.23% | | 0.00% | | (0.65)% | | |
| | | R4 | | 4/01/05 | | 0.31% | | 0.00% | | (0.40)% | | |
| | | 529A | | 7/31/02 | | 0.28% | | 0.00% | | (0.75)% | | |
| | | 529B | | 7/31/02 | | 0.08% | | 0.00% | | (1.50)% | | |
| | | 529C | | 7/31/02 | | 0.08% | | 0.00% | | (1.50)% | | |
| | | | | | | | | | | | |
| | | Share class | | | | 1 Year total
return | | |
| | | B
with CDSC (Declining over six years from 4% to 0%) (x) | | (3.90)% | | |
| | | C
with CDSC (1% for 12 months) (x) | | (0.90)% | | |
| | | 529B
with CDSC ( Declining over six year from 4% to 0%) (x) | | (3.92)% | | |
| | | 529C
with CDSC (1% for 12 months) (x) | | (0.92)% | | |
3
Performance Summary – continued
Class R1, R2, R3, R4, and 529A shares do not have a sales charge. Certain Class A shares acquired through an exchange may be subject to a CDSC upon redemption depending on when the shares exchanged were originally purchased.
CDSC – Contingent Deferred Sales Charge.
| (w) | Yield was less than 0.01%. |
| (x) | Assuming redemption at the end of the applicable period |
Yields quoted are based on the latest seven days ended as of August 31, 2009, with dividends annualized. The yield quotations more closely reflect the current earnings of the fund than the total return quotations. Shares of the fund can be purchased at net asset value without a sales charge.
Notes to Performance Summary
Performance results reflect any applicable expense subsidies, waivers, and adjustments in effect during the periods shown. Subsidies and fee waivers may be imposed to enhance a fund’s yield or to avoid a negative yield during periods when the fund’s operating expenses have a significant impact on the fund’s yield due to lower interest rates. Without such subsidies and waivers the fund’s performance results would be less favorable. Please see the prospectus and financial statements for complete details. All results are historical and assume the reinvestment of any dividends and capital gain distributions.
From time to time the fund may receive proceeds from litigation settlements, without which performance would be lower.
4
EXPENSE TABLE
Fund expenses borne by the shareholders during the period,
March 1, 2009 through August 31, 2009
As a shareholder of the fund, you incur two types of costs: (1) transaction costs, including sales charges (loads) on certain purchase or redemption payments, and (2) ongoing costs, including management fees; distribution and service (12b-1) fees; and other fund expenses. This example is intended to help you understand your ongoing costs (in dollars) of investing in the fund and to compare these costs with the ongoing costs of investing in other mutual funds.
The example is based on an investment of $1,000 invested at the beginning of the period and held for the entire period March 1, 2009 through August 31, 2009.
Actual Expenses
The first line for each share class in the following table provides information about actual account values and actual expenses. You may use the information in this line, together with the amount you invested, to estimate the expenses that you paid over the period. Simply divide your account value by $1,000 (for example, an $8,600 account value divided by $1,000 = 8.6), then multiply the result by the number in the first line under the heading entitled “Expenses Paid During Period” to estimate the expenses you paid on your account during this period.
Hypothetical Example for Comparison Purposes
The second line for each share class in the following table provides information about hypothetical account values and hypothetical expenses based on the fund’s actual expense ratio and an assumed rate of return of 5% per year before expenses, which is not the fund’s actual return. The hypothetical account values and expenses may not be used to estimate the actual ending account balance or expenses you paid for the period. You may use this information to compare the ongoing costs of investing in the fund and other funds. To do so, compare this 5% hypothetical example with the 5% hypothetical examples that appear in the shareholder reports of the other funds.
Please note that the expenses shown in the table are meant to highlight your ongoing costs only and do not reflect any transactional costs, such as sales charges (loads). Therefore, the second line for each share class in the table is useful in comparing ongoing costs only, and will not help you determine the relative total costs of owning different funds. In addition, if these transactional costs were included, your costs would have been higher.
5
Expense Table – continued
| | | | | | | | | | |
Share
Class | | | | Annualized Expense
Ratio | | Beginning
Account Value
3/01/09 | | Ending
Account Value
8/31/09 | | Expenses
Paid During
Period (p)
3/01/09-8/31/09 |
| A | | Actual | | 0.32% | | $1,000.00 | | $1,000.00 | | $1.61 |
| | Hypothetical (h) | | 0.32% | | $1,000.00 | | $1,023.59 | | $1.63 |
| B | | Actual | | 0.32% | | $1,000.00 | | $1,000.00 | | $1.61 |
| | Hypothetical (h) | | 0.32% | | $1,000.00 | | $1,023.59 | | $1.63 |
| C | | Actual | | 0.32% | | $1,000.00 | | $1,000.00 | | $1.61 |
| | Hypothetical (h) | | 0.32% | | $1,000.00 | | $1,023.59 | | $1.63 |
| R1 | | Actual | | 0.32% | | $1,000.00 | | $1,000.00 | | $1.61 |
| | Hypothetical (h) | | 0.32% | | $1,000.00 | | $1,023.59 | | $1.63 |
| R2 | | Actual | | 0.32% | | $1,000.00 | | $1,000.00 | | $1.61 |
| | Hypothetical (h) | | 0.32% | | $1,000.00 | | $1,023.59 | | $1.63 |
| R3 | | Actual | | 0.32% | | $1,000.00 | | $1,000.00 | | $1.61 |
| | Hypothetical (h) | | 0.32% | | $1,000.00 | | $1,023.59 | | $1.63 |
| R4 | | Actual | | 0.32% | | $1,000.00 | | $1,000.00 | | $1.61 |
| | Hypothetical (h) | | 0.32% | | $1,000.00 | | $1,023.59 | | $1.63 |
| 529A | | Actual | | 0.32% | | $1,000.00 | | $1,000.00 | | $1.61 |
| | Hypothetical (h) | | 0.32% | | $1,000.00 | | $1,023.59 | | $1.63 |
| 529B | | Actual | | 0.32% | | $1,000.00 | | $1,000.00 | | $1.61 |
| | Hypothetical (h) | | 0.32% | | $1,000.00 | | $1,023.59 | | $1.63 |
| 529C | | Actual | | 0.32% | | $1,000.00 | | $1,000.00 | | $1.61 |
| | Hypothetical (h) | | 0.32% | | $1,000.00 | | $1,023.59 | | $1.63 |
| (h) | 5% class return per year before expenses. |
| (p) | Expenses paid is equal to each class’ annualized expense ratio, as shown above, multiplied by the average account value over the period, multiplied by the number of days in the period, divided by the number of days in the year. Expenses paid do not include any applicable sales charges (loads). If these transaction costs had been included, your costs would have been higher. |
Expense Changes Impacting the Table
As more fully disclosed in footnote 3 to the financial statements, the expense ratios reported above include additional expense reductions to avoid a negative yield.
6
PORTFOLIO OF INVESTMENTS
8/31/09
The Portfolio of Investments is a complete list of all securities owned by your fund. It is categorized by broad-based asset classes.
| | | | | | |
| Certificates of Deposit - 12.0% | | | | | | |
| Issuer | | Shares/Par | | Value ($) |
| | | | | | |
| Major Banks - 8.8% | | | | | | |
| Abbey National Treasury Services PLC (U.S. Branch), 0.25%, due 9/28/09 | | $ | 19,498,000 | | $ | 19,498,000 |
| Credit Agricole S.A., 0.6%, due 5/18/10 | | | 16,000,000 | | | 16,000,000 |
| Credit Suisse NY, 0.88%, due 8/02/10 | | | 16,400,000 | | | 16,400,000 |
| Credit Suisse, NY, 0.82%, due 8/02/10 | | | 2,800,000 | | | 2,800,000 |
| | | | | | |
| | | | | | $ | 54,698,000 |
| Other Banks & Diversified Financials - 3.2% | | | | | | |
| Nordea Bank Finland PLC (New York), 0.83%, due 7/15/10 | | $ | 7,200,000 | | $ | 7,200,000 |
| Nordea Bank Finland PLC (New York), 0.83%, due 7/15/10 | | | 12,600,000 | | | 12,600,000 |
| | | | | | |
| | | | | | $ | 19,800,000 |
| Total Certificates of Deposit, at Amortized Cost and Value | | | | | $ | 74,498,000 |
| | |
| Commercial Paper (y) - 56.1% | | | | | | |
| Automotive - 3.0% | | | | | | |
| Toyota Motor Credit Corp., 0.2%, due 9/24/09 | | $ | 18,788,000 | | $ | 18,785,599 |
| | |
| Energy - Integrated - 1.7% | | | | | | |
| ConocoPhillips, 0.16%, due 9/01/09 (t) | | $ | 10,390,000 | | $ | 10,390,000 |
| | |
| Financial Institutions - 2.5% | | | | | | |
| General Electric Capital Corp., 0.21%, due 9/18/09 | | $ | 15,682,000 | | $ | 15,680,445 |
| | |
| Food & Beverages - 3.1% | | | | | | |
| Coca-Cola Co., 0.24%, due 9/17/09 (t) | | $ | 14,900,000 | | $ | 14,898,411 |
| Coca-Cola Co., 0.2%, due 9/24/09 (t) | | | 4,500,000 | | | 4,499,425 |
| | | | | | |
| | | | | | $ | 19,397,836 |
| Major Banks - 23.2% | | | | | | |
| ANZ National (International) Ltd., 0.84%, due 6/25/10 | | $ | 14,560,000 | | $ | 14,459,099 |
| ANZ National (International) Ltd., 0.29%, due 10/19/09 | | | 5,140,000 | | | 5,138,013 |
| Bank of America Corp., 0.24%, due 9/14/09 | | | 19,021,000 | | | 19,019,352 |
| BNP Paribas Finance, Inc., 0.32%, due 9/04/09 | | | 20,376,000 | | | 20,375,457 |
| JPMorgan Chase Funding, Inc., 0.23%, due 12/01/09 | | | 13,000,000 | | | 12,992,442 |
| Societe Generale North America, Inc., 0.2%, due 9/04/09 | | | 18,667,000 | | | 18,666,689 |
| Toronto Dominion HDG USA, 0.35%, due 3/15/10 | | | 7,100,000 | | | 7,086,540 |
| Toronto Dominion HDG USA, 0.4%, due 3/15/10 | | | 9,490,000 | | | 9,469,438 |
| Toronto Dominion HDG USA, 0.6%, due 4/09/10 | | | 2,050,000 | | | 2,042,483 |
7
Portfolio of Investments – continued
| | | | | | |
| Issuer | | Shares/Par | | Value ($) |
| | | | | | |
| Commercial Paper (y) - continued | | | | | | |
| Major Banks - continued | | | | | | |
| Wells Fargo & Co., 0.15%, due 9/01/09 | | $ | 18,623,000 | | $ | 18,623,000 |
| Westpac Banking Corp., 0.34%, due 9/09/09 | | | 16,000,000 | | | 15,998,791 |
| | | | | | |
| | | | | | $ | 143,871,304 |
| Medical Equipment - 2.4% | | | | | | |
| Merck & Co, Inc., 0.17%, due 9/18/09 | | $ | 15,000,000 | | $ | 14,998,796 |
| | |
| Other Banks & Diversified Financials - 14.1% | | | | | | |
| Bank of Nova Scotia, 0.28%, due 10/05/09 | | $ | 19,924,000 | | $ | 19,918,731 |
| Citigroup Funding, Inc., 0.32%, due 9/24/09 | | | 18,671,000 | | | 18,667,183 |
| HSBC USA, Inc., 0.2%, due 9/10/09 | | | 19,034,000 | | | 19,033,048 |
| Rabobank USA Financial Corp., 0.4%, due 1/15/10 | | | 19,978,000 | | | 19,947,811 |
| UBS Finance Delaware LLC, 0.19%, due 9/01/09 | | | 9,633,000 | | | 9,633,000 |
| | | | | | |
| | | | | | $ | 87,199,773 |
| Pharmaceuticals - 3.1% | | | | | | |
| Pfizer, Inc., 0.25%, due 9/09/09 (t) | | $ | 19,430,000 | | $ | 19,428,921 |
| | |
| Retailers - 3.0% | | | | | | |
| Wal-Mart Stores, Inc., 0.14%, due 9/01/09 (t) | | $ | 18,868,000 | | $ | 18,868,000 |
| Total Commercial Paper, at Amortized Cost and Value | | | | | $ | 348,620,674 |
| | |
| U.S. Government Agencies and Equivalents (y) - 7.5% | | | | | | |
| Fannie Mae, 0.58%, due 10/13/09 | | $ | 35,440,000 | | $ | 35,416,018 |
| Federal Home Loan Bank, 0.2%, due 10/30/09 | | | 10,916,000 | | | 10,912,422 |
| Total U.S. Government Agencies and Equivalents, at Amortized Cost and Value | | | | | $ | 46,328,440 |
| | |
| Repurchase Agreements - 24.5% | | | | | | |
Bank of America Corp., 0.19%, dated 8/31/09, due 9/01/09,
total to be received $62,077,328 (secured by U.S. Treasury and Federal Agency obligations and Mortgage Backed securities valued at $63,318,873 in a jointly traded account) | | $ | 62,077,000 | | $ | 62,077,000 |
Goldman Sachs, 0.2%, dated 8/31/09, due 9/01/09,
total to be received $62,077,345 (secured by various U.S. Treasury and Federal Agency obligations and Mortgage Backed securities valued at $63,318,549 in a jointly traded account) | | | 62,077,000 | | | 62,077,000 |
Morgan Stanley, 0.17%, dated 8/31/09, due 9/1/09,
total to be received $27,936,132 (secured by U.S. Treasury and Federal Agency obligations and Mortgage Backed securities valued at $28,632,555 in a jointly traded account) | | | 27,936,000 | | | 27,936,000 |
| Total Repurchase Agreements, at Cost and Value | | | | | $ | 152,090,000 |
| Total Investments, at Amortized Cost and Value | | | | | $ | 621,537,114 |
8
Portfolio of Investments – continued
| | | | | | |
| Issuer | | | | Value ($) | |
| | | | | | |
| Other Assets, Less Liabilities - (0.1)% | | | | $ | (751,131 | ) |
| Net Assets - 100.0% | | | | $ | 620,785,983 | |
| (t) | Security exempt from registration with the U.S. Securities and Exchange Commission under Section 4(2) of the Securities Act of 1933. |
| (y) | The rate shown represents an annualized yield at time of purchase. |
See Notes to Financial Statements
9
Financial Statements
STATEMENT OF ASSETS AND LIABILITIES
At 8/31/09
This statement represents your fund’s balance sheet, which details the assets and liabilities comprising the total value of the fund.
| | | |
| Assets | | | |
Investments, at amortized cost and value | | $469,447,114 | |
Repurchase agreements, at cost and value | | 152,090,000 | |
Total investments, at amortized cost and value | | $621,537,114 | |
Cash | | 431 | |
Receivables for | | | |
Fund shares sold | | 1,957,722 | |
Interest | | 41,343 | |
Receivable from investment adviser | | 77,612 | |
Other assets | | 3,069 | |
Total assets | | $623,617,291 | |
| Liabilities | | | |
Payables for | | | |
Fund shares reacquired | | $2,550,186 | |
Payable to affiliates | | | |
Investment adviser | | 4,450 | |
Shareholder servicing costs | | 168,527 | |
Distribution and service fees | | 95 | |
Administrative services fee | | 1,288 | |
Program manager fees | | 145 | |
Payable for independent Trustees’ compensation | | 22,798 | |
Accrued expenses and other liabilities | | 83,819 | |
Total liabilities | | $2,831,308 | |
Net assets | | $620,785,983 | |
| Net assets consist of | | | |
Paid-in capital | | $620,994,618 | |
Accumulated net realized gain (loss) on investments | | (208,635 | ) |
Net assets | | $620,785,983 | |
Shares of beneficial interest outstanding | | 620,994,220 | |
| | | | | | |
| | | Net assets | | Shares
outstanding | | Net asset value
per share |
Class A | | $173,134,548 | | 173,199,513 | | $1.00 |
Class B | | 104,695,545 | | 104,739,050 | | 1.00 |
Class C | | 70,004,884 | | 70,032,429 | | 1.00 |
Class R1 | | 29,457,314 | | 29,465,838 | | 1.00 |
Class R2 | | 120,476,028 | | 120,508,913 | | 1.00 |
Class R3 | | 104,062,409 | | 104,089,607 | | 1.00 |
Class R4 | | 5,696,546 | | 5,698,044 | | 1.00 |
Class 529A | | 6,925,944 | | 6,927,239 | | 1.00 |
Class 529B | | 1,941,884 | | 1,942,119 | | 1.00 |
Class 529C | | 4,390,881 | | 4,391,468 | | 1.00 |
A contingent deferred sales charge may be imposed on redemptions of Class A, Class B, Class C, Class 529B, and Class 529C shares.
See Notes to Financial Statements
10
Financial Statements
STATEMENT OF OPERATIONS
Year ended 8/31/09
This statement describes how much your fund earned in investment income and accrued in expenses. It also describes any gains and/or losses generated by fund operations.
| | | | | | |
| Net investment income | | | | | | |
Interest income | | | | | $4,742,343 | |
Expenses | | | | | | |
Management fee | | $2,787,660 | | | | |
Distribution and service fees | | 3,543,751 | | | | |
Program manager fees | | 11,914 | | | | |
Shareholder servicing costs | | 1,563,433 | | | | |
Administrative services fee | | 145,434 | | | | |
Independent Trustees’ compensation | | 24,353 | | | | |
Custodian fee | | 122,256 | | | | |
Shareholder communications | | 35,549 | | | | |
Auditing fees | | 31,133 | | | | |
Legal fees | | 20,325 | | | | |
Miscellaneous | | 309,735 | | | | |
Total expenses | | | | | $8,595,543 | |
Fees paid indirectly | | (1,928 | ) | | | |
Reduction of expenses by investment adviser and distributor | | (5,119,814 | ) | | | |
Net expenses | | | | | $3,473,801 | |
Net investment income | | | | | $1,268,542 | |
Net realized gain (loss) on investment transactions | | | | | (184,390 | ) |
Change in net assets from operations | | | | | $1,084,152 | |
See Notes to Financial Statements
11
Financial Statements
STATEMENTS OF CHANGES IN NET ASSETS
These statements describe the increases and/or decreases in net assets resulting from operations, any distributions, and any shareholder transactions.
| | | | | | |
| | | Year ended 8/31 | |
| | | 2009 | | | 2008 | |
| Change in net assets | | | | | | |
| From operations | | | | | | |
Net investment income | | $1,268,542 | | | $14,023,575 | |
Net realized gain (loss) on investments | | (184,390 | ) | | — | |
Change in net assets from operations | | $1,084,152 | | | $14,023,575 | |
| Distributions declared to shareholders | | | | | | |
From net investment income | | $(1,268,542 | ) | | $(14,023,575 | ) |
Change in net assets from fund share transactions | | 20,458,239 | | | 155,628,784 | |
Total change in net assets | | $20,273,849 | | | $155,628,784 | |
| Net assets | | | | | | |
At beginning of period | | 600,512,134 | | | 444,883,350 | |
At end of period | | $620,785,983 | | | $600,512,134 | |
See Notes to Financial Statements
12
Financial Statements
FINANCIAL HIGHLIGHTS
The financial highlights table is intended to help you understand the fund’s financial performance for the past 5 years (or life of a particular share class, if shorter). Certain information reflects financial results for a single fund share. The total returns in the table represent the rate by which an investor would have earned (or lost) on an investment in the fund share class (assuming reinvestment of all distributions) held for the entire period.
| | | | | | | | | | | | | | | |
| Class A | | Years ended 8/31 | |
| | | 2009 | | | 2008 | | | 2007 | | | 2006 | | | 2005 | |
Net asset value, beginning of period | | $1.00 | | | $1.00 | | | $1.00 | | | $1.00 | | | $1.00 | |
Income (loss) from investment
operations | | | | | | | | | | | | | | | |
Net investment income (d) | | $0.00 | (w) | | $0.03 | | | $0.05 | | | $0.04 | | | $0.02 | |
Net realized and unrealized gain (loss)
on investments | | (0.00 | )(w) | | — | | | (0.00 | )(w) | | (0.00 | )(w) | | — | |
Total from investment operations | | $0.00 | (w) | | $0.03 | | | $0.05 | | | $0.04 | | | $0.02 | |
Less distributions declared to
shareholders | | | | | | | | | | | | | | | |
From net investment income | | $(0.00 | )(w) | | $(0.03 | ) | | $(0.05 | ) | | $(0.04 | ) | | $(0.02 | ) |
Net asset value, end of period | | $1.00 | | | $1.00 | | | $1.00 | | | $1.00 | | | $1.00 | |
Total return (%) (r)(s)(t) | | 0.31 | | | 3.43 | | | 5.06 | | | 4.19 | | | 2.11 | |
Ratios (%) (to average net assets)
and Supplemental data: | | | | | | | | | | | | | | | |
Expenses before expense reductions (f) | | 0.72 | | | 0.87 | | | 0.83 | | | 0.89 | | | 0.90 | |
Expenses after expense reductions (f) | | 0.39 | | | 0.47 | | | 0.43 | | | 0.49 | | | 0.50 | |
Net investment income | | 0.33 | | | 3.29 | | | 4.94 | | | 4.14 | | | 2.10 | |
Net assets at end of period (000 Omitted) | | $173,135 | | | $189,684 | | | $136,204 | | | $114,481 | | | $91,165 | |
See Notes to Financial Statements
13
Financial Highlights – continued
| | | | | | | | | | | | | | | |
| Class B | | Years ended 8/31 | |
| | | 2009 | | | 2008 | | | 2007 | | | 2006 | | | 2005 | |
Net asset value, beginning of period | | $1.00 | | | $1.00 | | | $1.00 | | | $1.00 | | | $1.00 | |
Income (loss) from investment
operations | | | | | | | | | | | | | | | |
Net investment income (d) | | $0.00 | (w) | | $0.02 | | | $0.04 | | | $0.03 | | | $0.01 | |
Net realized and unrealized gain (loss)
on investments | | (0.00 | )(w) | | — | | | (0.00 | )(w) | | (0.00 | )(w) | | — | |
Total from investment operations | | $0.00 | (w) | | $0.02 | | | $0.04 | | | $0.03 | | | $0.01 | |
Less distributions declared to
shareholders | | | | | | | | | | | | | | | |
From net investment income | | $(0.00 | )(w) | | $(0.02 | ) | | $(0.04 | ) | | $(0.03 | ) | | $(0.01 | ) |
Net asset value, end of period | | $1.00 | | | $1.00 | | | $1.00 | | | $1.00 | | | $1.00 | |
Total return (%) (r)(s)(t) | | 0.10 | | | 2.40 | | | 4.02 | | | 3.16 | | | 1.10 | |
Ratios (%) (to average net assets)
and Supplemental data: | | | | | | | | | | | | | | | |
Expenses before expense reductions (f) | | 1.72 | | | 1.86 | | | 1.83 | | | 1.89 | | | 1.89 | |
Expenses after expense reductions (f) | | 0.60 | | | 1.46 | | | 1.43 | | | 1.49 | | | 1.49 | |
Net investment income | | 0.08 | | | 2.44 | | | 3.94 | | | 3.09 | | | 1.03 | |
Net assets at end of period (000 Omitted) | | $104,696 | | | $112,707 | | | $154,176 | | | $222,661 | | | $280,361 | |
| | | | | | | | | | | | | | | |
| Class C | | Years ended 8/31 | |
| | | 2009 | | | 2008 | | | 2007 | | | 2006 | | | 2005 | |
Net asset value, beginning of period | | $1.00 | | | $1.00 | | | $1.00 | | | $1.00 | | | $1.00 | |
Income (loss) from investment
operations | | | | | | | | | | | | | | | |
Net investment income (d) | | $0.00 | (w) | | $0.02 | | | $0.04 | | | $0.03 | | | $0.01 | |
Net realized and unrealized gain (loss)
on investments | | (0.00 | )(w) | | – | | | (0.00 | )(w) | | (0.00 | )(w) | | — | |
Total from investment operations | | $0.00 | (w) | | $0.02 | | | $0.04 | | | $0.03 | | | $0.01 | |
Less distributions declared to
shareholders | | | | | | | | | | | | | | | |
From net investment income | | $(0.00 | )(w) | | $(0.02 | ) | | $(0.04 | ) | | $(0.03 | ) | | $(0.01 | ) |
Net asset value, end of period | | $1.00 | | | $1.00 | | | $1.00 | | | $1.00 | | | $1.00 | |
Total return (%) (r)(s)(t) | | 0.10 | | | 2.40 | | | 4.02 | | | 3.15 | | | 1.10 | |
Ratios (%) (to average net assets)
and Supplemental data: | | | | | | | | | | | | | | | |
Expenses before expense reductions (f) | | 1.72 | | | 1.87 | | | 1.83 | | | 1.89 | | | 1.89 | |
Expenses after expense reductions (f) | | 0.60 | | | 1.47 | | | 1.43 | | | 1.49 | | | 1.49 | |
Net investment income | | 0.08 | | | 2.18 | | | 3.94 | | | 3.14 | | | 1.03 | |
Net assets at end of period (000 Omitted) | | $70,005 | | | $79,091 | | | $60,390 | | | $56,456 | | | $46,483 | |
See Notes to Financial Statements
14
Financial Highlights – continued
| | | | | | | | | | | | | | | |
| Class R1 | | Years ended 8/31 | |
| | | 2009 | | | 2008 | | | 2007 | | | 2006 | | | 2005 (i) | |
Net asset value, beginning of period | | $1.00 | | | $1.00 | | | $1.00 | | | $1.00 | | | $1.00 | |
Income (loss) from investment
operations | | | | | | | | | | | | | | | |
Net investment income (d) | | $0.00 | (w) | | $0.02 | | | $0.04 | | | $0.03 | | | $0.01 | |
Net realized and unrealized gain (loss)
on investments | | (0.00 | )(w) | | — | | | (0.00 | )(w) | | (0.00 | )(w) | | — | |
Total from investment operations | | $0.00 | (w) | | $0.02 | | | $0.04 | | | $0.03 | | | $0.01 | |
Less distributions declared to
shareholders | | | | | | | | | | | | | | | |
From net investment income | | $(0.00 | )(w) | | $(0.02 | ) | | $(0.04 | ) | | $(0.03 | ) | | $(0.01 | ) |
Net asset value, end of period | | $1.00 | | | $1.00 | | | $1.00 | | | $1.00 | | | $1.00 | |
Total return (%) (r)(s) | | 0.10 | | | 2.35 | | | 3.91 | | | 3.04 | | | 0.59 | (n) |
Ratios (%) (to average net assets)
and Supplemental data: | | | | | | | | | | | | | | | |
Expenses before expense reductions (f) | | 1.72 | | | 1.91 | | | 1.97 | | | 2.09 | | | 2.24 | (a) |
Expenses after expense reductions (f) | | 0.58 | | | 1.51 | | | 1.53 | | | 1.59 | | | 1.84 | (a) |
Net investment income | | 0.09 | | | 2.10 | | | 3.82 | | | 3.15 | | | 1.52 | (a) |
Net assets at end of period (000 Omitted) | | $29,457 | | | $27,361 | | | $8,538 | | | $898 | | | $258 | |
| | | | | | | | | | | | | | | |
| Class R2 | | Years ended 8/31 | |
| | | 2009 | | | 2008 | | | 2007 | | | 2006 | | | 2005 (i) | |
Net asset value, beginning of period | | $1.00 | | | $1.00 | | | $1.00 | | | $1.00 | | | $1.00 | |
Income (loss) from investment
operations | | | | | | | | | | | | | | | |
Net investment income (d) | | $0.00 | (w) | | $0.03 | | | $0.04 | | | $0.04 | | | $0.01 | |
Net realized and unrealized gain (loss)
on investments | | (0.00 | )(w) | | — | | | 0.00 | (w) | | (0.01 | ) | | — | |
Total from investment operations | | $0.00 | (w) | | $0.03 | | | $0.04 | | | $0.03 | | | $0.01 | |
Less distributions declared to
shareholders | | | | | | | | | | | | | | | |
From net investment income | | $(0.00 | )(w) | | $(0.03 | ) | | $(0.04 | ) | | $(0.03 | ) | | $(0.01 | ) |
Net asset value, end of period | | $1.00 | | | $1.00 | | | $1.00 | | | $1.00 | | | $1.00 | |
Total return (%) (r)(s) | | 0.17 | | | 2.86 | | | 4.38 | | | 3.51 | | | 0.78 | (n) |
Ratios (%) (to average net assets)
and Supplemental data: | | | | | | | | | | | | | | | |
Expenses before expense reductions (f) | | 1.22 | | | 1.41 | | | 1.52 | | | 1.63 | | | 1.83 | (a) |
Expenses after expense reductions (f) | | 0.51 | | | 1.01 | | | 1.09 | | | 1.13 | | | 1.43 | (a) |
Net investment income | | 0.15 | | | 2.58 | | | 4.28 | | | 3.73 | | | 2.10 | (a) |
Net assets at end of period (000 Omitted) | | $120,476 | | | $98,825 | | | $36,027 | | | $4,909 | | | $1,179 | |
See Notes to Financial Statements
15
Financial Highlights – continued
| | | | | | | | | | | | | | | |
| Class R3 | | Years ended 8/31 | |
| | | 2009 | | | 2008 | | | 2007 | | | 2006 | | | 2005 (i) | |
Net asset value, beginning of period | | $1.00 | | | $1.00 | | | $1.00 | | | $1.00 | | | $1.00 | |
Income (loss) from investment
operations | | | | | | | | | | | | | | | |
Net investment income (d) | | $0.00 | (w) | | $0.03 | | | $0.05 | | | $0.04 | | | $0.01 | |
Net realized and unrealized gain (loss)
on investments | | (0.00 | )(w) | | — | | | (0.00 | )(w) | | (0.00 | )(w) | | — | |
Total from investment operations | | $0.00 | (w) | | $0.03 | | | $0.05 | | | $0.04 | | | $0.01 | |
Less distributions declared to
shareholders | | | | | | | | | | | | | | | |
From net investment income | | $(0.00 | )(w) | | $(0.03 | ) | | $(0.05 | ) | | $(0.04 | ) | | $(0.01 | ) |
Net asset value, end of period | | $1.00 | | | $1.00 | | | $1.00 | | | $1.00 | | | $1.00 | |
Total return (%) (r)(s) | | 0.23 | | | 3.12 | | | 4.63 | | | 3.77 | | | 0.93 | (n) |
Ratios (%) (to average net assets)
and Supplemental data: | | | | | | | | | | | | | | | |
Expenses before expense reductions (f) | | 0.97 | | | 1.15 | | | 1.23 | | | 1.28 | | | 1.38 | (a) |
Expenses after expense reductions (f) | | 0.45 | | | 0.75 | | | 0.83 | | | 0.88 | | | 0.98 | (a) |
Net investment income | | 0.20 | | | 2.82 | | | 4.53 | | | 4.06 | | | 2.21 | (a) |
Net assets at end of period (000 Omitted) | | $104,062 | | | $82,454 | | | $32,545 | | | $1,019 | | | $51 | |
| | | | | | | | | | | | | | | |
| Class R4 | | Years ended 8/31 | |
| | | 2009 | | | 2008 | | | 2007 | | | 2006 | | | 2005 (i) | |
Net asset value, beginning of period | | $1.00 | | | $1.00 | | | $1.00 | | | $1.00 | | | $1.00 | |
Income (loss) from investment
operations | | | | | | | | | | | | | | | |
Net investment income (d) | | $0.00 | (w) | | $0.03 | | | $0.05 | | | $0.04 | | | $0.01 | |
Net realized and unrealized gain (loss)
on investments | | (0.00 | )(w) | | — | | | (0.00 | )(w) | | (0.00 | )(w) | | — | |
Total from investment operations | | $0.00 | (w) | | $0.03 | | | $0.05 | | | $0.04 | | | $0.01 | |
Less distributions declared to
shareholders | | | | | | | | | | | | | | | |
From net investment income | | $(0.00 | )(w) | | $(0.03 | ) | | $(0.05 | ) | | $(0.04 | ) | | $(0.01 | ) |
Net asset value, end of period | | $1.00 | | | $1.00 | | | $1.00 | | | $1.00 | | | $1.00 | |
Total return (%) (r)(s) | | 0.31 | | | 3.39 | | | 4.96 | | | 4.09 | | | 1.06 | (n) |
Ratios (%) (to average net assets)
and Supplemental data: | | | | | | | | | | | | | | | |
Expenses before expense reductions (f) | | 0.72 | | | 0.90 | | | 0.93 | | | 0.99 | | | 1.08 | (a) |
Expenses after expense reductions (f) | | 0.38 | | | 0.50 | | | 0.53 | | | 0.59 | | | 0.68 | (a) |
Net investment income | | 0.23 | | | 3.24 | | | 4.80 | | | 4.03 | | | 2.51 | (a) |
Net assets at end of period (000 Omitted) | | $5,697 | | | $4,094 | | | $3,717 | | | $53 | | | $51 | |
See Notes to Financial Statements
16
Financial Highlights – continued
| | | | | | | | | | | | | | | |
| Class 529A | | Years ended 8/31 | |
| | | 2009 | | | 2008 | | | 2007 | | | 2006 | | | 2005 | |
Net asset value, beginning of period | | $1.00 | | | $1.00 | | | $1.00 | | | $1.00 | | | $1.00 | |
Income (loss) from investment
operations | | | | | | | | | | | | | | | |
Net investment income (d) | | $0.00 | (w) | | $0.03 | | | $0.05 | | | $0.04 | | | $0.02 | |
Net realized and unrealized gain (loss)
on investments | | (0.00 | )(w) | | — | | | (0.00 | )(w) | | (0.00 | )(w) | | — | |
Total from investment operations | | $0.00 | (w) | | $0.03 | | | $0.05 | | | $0.04 | | | $0.02 | |
Less distributions declared to
shareholders | | | | | | | | | | | | | | | |
From net investment income | | $(0.00 | )(w) | | $(0.03 | ) | | $(0.05 | ) | | $(0.04 | ) | | $(0.02 | ) |
Net asset value, end of period | | $1.00 | | | $1.00 | | | $1.00 | | | $1.00 | | | $1.00 | |
Total return (%) (r)(s) | | 0.28 | | | 3.23 | | | 4.80 | | | 3.93 | | | 1.86 | |
Ratios (%) (to average net assets)
and Supplemental data: | | | | | | | | | | | | | | | |
Expenses before expense reductions (f) | | 1.12 | | | 1.40 | | | 1.44 | | | 1.49 | | | 1.50 | |
Expenses after expense reductions (f) | | 0.40 | | | 0.65 | | | 0.68 | | | 0.74 | | | 0.75 | |
Net investment income | | 0.19 | | | 3.05 | | | 4.69 | | | 3.92 | | | 1.93 | |
Net assets at end of period (000 Omitted) | | $6,926 | | | $3,777 | | | $2,548 | | | $2,135 | | | $1,650 | |
| | | | | | | | | | | | | | | |
| Class 529B | | Years ended 8/31 | |
| | | 2009 | | | 2008 | | | 2007 | | | 2006 | | | 2005 | |
Net asset value, beginning of period | | $1.00 | | | $1.00 | | | $1.00 | | | $1.00 | | | $1.00 | |
Income (loss) from investment
operations | | | | | | | | | | | | | | | |
Net investment income (d) | | $0.00 | (w) | | $0.02 | | | $0.04 | | | $0.03 | | | $0.01 | |
Net realized and unrealized gain (loss)
on investments | | (0.00 | )(w) | | — | | | (0.00 | )(w) | | (0.00 | )(w) | | — | |
Total from investment operations | | $0.00 | (w) | | $0.02 | | | $0.04 | | | $0.03 | | | $0.01 | |
Less distributions declared to
shareholders | | | | | | | | | | | | | | | |
From net investment income | | $(0.00 | )(w) | | $(0.02 | ) | | $(0.04 | ) | | $(0.03 | ) | | $(0.01 | ) |
Net asset value, end of period | | $1.00 | | | $1.00 | | | $1.00 | | | $1.00 | | | $1.00 | |
Total return (%) (r)(s)(t) | | 0.08 | | | 2.21 | | | 3.77 | | | 2.90 | | | 0.87 | |
Ratios (%) (to average net assets)
and Supplemental data: | | | | | | | | | | | | | | | |
Expenses before expense reductions (f) | | 1.83 | | | 2.04 | | | 2.09 | | | 2.14 | | | 2.13 | |
Expenses after expense reductions (f) | | 0.51 | | | 1.64 | | | 1.69 | | | 1.74 | | | 1.73 | |
Net investment income | | 0.04 | | | 1.91 | | | 3.69 | | | 2.88 | | | 0.87 | |
Net assets at end of period (000 Omitted) | | $1,942 | | | $700 | | | $328 | | | $297 | | | $340 | |
See Notes to Financial Statements
17
Financial Highlights – continued
| | | | | | | | | | | | | | | |
| Class 529C | | Years ended 8/31 | |
| | | 2009 | | | 2008 | | | 2007 | | | 2006 | | | 2005 | |
Net asset value, beginning of period | | $1.00 | | | $1.00 | | | $1.00 | | | $1.00 | | | $1.00 | |
Income (loss) from investment
operations | | | | | | | | | | | | | | | |
Net investment income (d) | | $0.00 | (w) | | $0.02 | | | $0.04 | | | $0.03 | | | $0.01 | |
Net realized and unrealized gain (loss)
on investments | | (0.00 | )(w) | | — | | | (0.00 | )(w) | | (0.00 | )(w) | | — | |
Total from investment operations | | $0.00 | (w) | | $0.02 | | | $0.04 | | | $0.03 | | | $0.01 | |
Less distributions declared to
shareholders | | | | | | | | | | | | | | | |
From net investment income | | $(0.00 | )(w) | | $(0.02 | ) | | $(0.04 | ) | | $(0.03 | ) | | $(0.01 | ) |
Net asset value, end of period | | $1.00 | | | $1.00 | | | $1.00 | | | $1.00 | | | $1.00 | |
Total return (%) (r)(s)(t) | | 0.08 | | | 2.21 | | | 3.76 | | | 2.90 | | | 0.87 | |
Ratios (%) (to average net assets)
and Supplemental data: | | | | | | | | | | | | | | | |
Expenses before expense reductions (f) | | 1.83 | | | 2.04 | | | 2.09 | | | 2.14 | | | 2.13 | |
Expenses after expense reductions (f) | | 0.52 | | | 1.64 | | | 1.68 | | | 1.74 | | | 1.73 | |
Net investment income | | 0.04 | | | 1.85 | | | 3.69 | | | 2.89 | | | 0.85 | |
Net assets at end of period (000 Omitted) | | $4,391 | | | $1,820 | | | $814 | | | $688 | | | $611 | |
| (d) | Per share data is based on average shares outstanding. |
| (f) | Ratios do not reflect reductions from fees paid indirectly, if applicable. |
| (i) | For the period from the class’ inception, April 1, 2005 (Classes R1, R2, R3, and R4) through the stated period end. |
| (r) | Certain expenses have been reduced without which performance would have been lower. |
| (s) | From time to time the fund may receive proceeds from litigation settlements, without which performance would be lower. |
| (t) | Total returns do not include any applicable sales charges. |
| (w) | Per share amount was less than $0.01. |
See Notes to Financial Statements
18
NOTES TO FINANCIAL STATEMENTS
| (1) | | Business and Organization |
MFS Cash Reserve Fund (the fund) is a series of MFS Series Trust I (the trust). The trust is organized as a Massachusetts business trust and is registered under the Investment Company Act of 1940, as amended, as an open-end management investment company.
| (2) | | Significant Accounting Policies |
General – The preparation of financial statements in conformity with U.S. generally accepted accounting principles requires management to make estimates and assumptions that affect the reported amounts of assets and liabilities, and disclosure of contingent assets and liabilities at the date of the financial statements and the reported amounts of revenues and expenses during the reporting period. In making these estimates and assumptions, management has considered the effects, if any, of events occurring after the date of the fund’s Statement of Assets and Liabilities through October 16, 2009 which is the date that the financial statements were issued. Actual results could differ from those estimates.
Investment Valuations – Pursuant to procedures approved by the Board of Trustees, investments held by the fund are valued at amortized cost, which approximates market value. Amortized cost involves valuing an instrument at its cost as adjusted for amortization of premium or accretion of discount rather than its current market value. The amortized cost value of an instrument can be different from the market value of an instrument.
The fund adopted FASB Statement No. 157, Fair Value Measurements (the “Statement”). This Statement provides a single definition of fair value, a hierarchy for measuring fair value and expanded disclosures about fair value measurements.
Various inputs are used in determining the value of the fund’s assets or liabilities carried at market value. These inputs are categorized into three broad levels. In certain cases, the inputs used to measure fair value may fall into different levels of the fair value hierarchy. In such cases, an investment’s level within the fair value hierarchy is based on the lowest level of input that is significant to the fair value measurement. The fund’s assessment of the significance of a particular input to the fair value measurement in its entirety requires judgment, and considers factors specific to the investment. Level 1 includes unadjusted quoted prices in active markets for identical assets or liabilities. Level 2 includes other significant observable market-based inputs (including quoted prices for similar securities, interest rates, prepayment speed, and credit risk). Level 3 includes unobservable inputs, which may include the adviser’s own assumptions in determining the fair value of investments. Other financial instruments are derivative instruments not
19
Notes to Financial Statements – continued
reflected in total investments, such as futures, forwards, swap contracts, and written options. The following is a summary of the levels used as of August 31, 2009 in valuing the fund’s assets or liabilities carried at market value:
| | | | | | | | |
| Investments at Value | | Level 1 | | Level 2 | | Level 3 | | Total |
| Short Term Securities | | $— | | $621,537,114 | | $— | | $621,537,114 |
For further information regarding security characteristics, see the Portfolio of Investments.
Repurchase Agreements – The fund may enter into repurchase agreements with approved counterparties. Each repurchase agreement is recorded at cost. The fund requires that the securities collateral in a repurchase transaction be transferred to a custodian. The fund monitors, on a daily basis, the value of the collateral to ensure that its value, including accrued interest, is greater than amounts owed to the fund under each such repurchase agreement. The fund and other funds managed by MFS may utilize a joint trading account for the purpose of entering into one or more repurchase agreements.
Indemnifications – Under the fund’s organizational documents, its officers and Trustees may be indemnified against certain liabilities and expenses arising out of the performance of their duties to the fund. Additionally, in the normal course of business, the fund enters into agreements with service providers that may contain indemnification clauses. The fund’s maximum exposure under these agreements is unknown as this would involve future claims that may be made against the fund that have not yet occurred.
Investment Transactions and Income – Investment transactions are recorded on the trade date. Interest income is recorded on the accrual basis. All premium and discount is amortized or accreted for financial statement purposes in accordance with U.S. generally accepted accounting principles.
The fund may receive proceeds from litigation settlements. Any proceeds received from litigation involving portfolio holdings are reflected in the Statement of Operations in realized gain/loss if the security has been disposed of by the fund or in unrealized gain/loss if the security is still held by the fund. Any other proceeds from litigation not related to portfolio holdings are reflected as other income in the Statement of Operations.
Fees Paid Indirectly – The fund’s custody fee may be reduced according to an arrangement that measures the value of cash deposited with the custodian by the fund. This amount, for the year ended August 31, 2009, is shown as a reduction of total expenses on the Statement of Operations.
Tax Matters and Distributions – The fund intends to qualify as a regulated investment company, as defined under Subchapter M of the Internal Revenue Code, and to distribute all of its taxable income, including realized capital gains. As a result, no provision for federal income tax is required. The fund’s
20
Notes to Financial Statements – continued
federal tax returns for the prior three fiscal years remain subject to examination by the Internal Revenue Service. Foreign taxes, if any, have been accrued by the fund in the accompanying financial statements.
Distributions to shareholders are recorded on the ex-dividend date. Income and capital gain distributions are determined in accordance with income tax regulations, which may differ from U.S. generally accepted accounting principles. Certain capital accounts in the financial statements are periodically adjusted for permanent differences in order to reflect their tax character. These adjustments have no impact on net assets or net asset value per share. Temporary differences which arise from recognizing certain items of income, expense, gain or loss in different periods for financial statement and tax purposes will reverse at some time in the future. Distributions in excess of net investment income or net realized gains are temporary overdistributions for financial statement purposes resulting from differences in the recognition or classification of income or distributions for financial statement and tax purposes.
During the year ended August 31, 2009, there were no significant adjustments due to differences between book and tax accounting.
The tax character of distributions declared to shareholders for the last two fiscal years is as follows:
| | | | |
| | | 8/31/09 | | 8/31/08 |
| Ordinary income (including any short-term capital gains) | | $1,268,542 | | $14,023,575 |
The federal tax cost and the tax basis components of distributable earnings were as follows:
| | | |
| As of 8/31/09 | | | |
| Cost of investments | | $621,537,114 | |
| Undistributed ordinary income | | 22,689 | |
| Capital loss carryforwards | | (208,635 | ) |
| Other temporary differences | | (22,689 | ) |
As of August 31, 2009, the fund had capital loss carryforwards available to offset future realized gains. Such losses expire as follows:
| | | |
| 8/31/12 | | $(441 | ) |
| 8/31/13 | | (4 | ) |
| 8/31/15 | | (811 | ) |
| 8/31/16 | | (22,989 | ) |
| 8/31/17 | | (184,390 | ) |
| | $(208,635 | ) |
Multiple Classes of Shares of Beneficial Interest – The fund offers multiple classes of shares, which differ in their respective distribution, service, and
21
Notes to Financial Statements – continued
program manager fees. The fund’s income and common expenses are allocated to shareholders based on the value of settled shares outstanding of each class. The fund’s realized and unrealized gain (loss) are allocated to shareholders based on the daily net assets of each class. Dividends are declared separately for each class. Differences in per share dividend rates are generally due to differences in separate class expenses. Class B and Class 529B shares will convert to Class A and Class 529A shares, respectively, approximately eight years after purchase. The fund’s distributions declared to shareholders as reported on the Statement of Changes in Net Assets are presented by class as follows:
| | | | |
| | | From net investment
income |
| | | Year ended
8/31/09 | | Year ended
8/31/08 |
| Class A | | $632,992 | | $4,983,420 |
| Class B | | 111,198 | | 2,887,171 |
| Class C | | 78,898 | | 1,405,342 |
| Class R1 | | 25,840 | | 445,800 |
| Former Class R2 (b) | | — | | 268,397 |
| Class R2 | | 182,897 | | 1,929,113 |
| Class R3 | | 207,009 | | 1,845,052 |
| Class R4 | | 15,469 | | 123,580 |
| Class 529A | | 12,012 | | 101,887 |
| Class 529B | | 621 | | 9,123 |
| Class 529C | | 1,606 | | 24,690 |
| Total | | $1,268,542 | | $14,023,575 |
| (b) | At the close of business on April 18, 2008, Class R2 shares converted into Class R3 shares. Following this conversion, Class R3, Class R4, and Class R5 shares were renamed Class R2, Class R3, and Class R4 shares, respectively. |
| (3) | | Transactions with Affiliates |
Investment Adviser – The fund has an investment advisory agreement with MFS to provide overall investment management and related administrative services and facilities to the fund.
The management fee is computed daily and paid monthly at an annual rate of 0.40% of the fund’s average daily net assets.
As part of a settlement agreement with the New York Attorney General concerning market timing and related matters, MFS had agreed to reduce the management fee to 0.15% of the fund’s average daily net assets for the period March 1, 2004 through February 28, 2009. For the year ended August 31, 2009, this waiver amounted to $871,040 and is reflected as a reduction of total expenses in the Statement of Operations
During the year ended August 31, 2009, MFS voluntarily waived receipt of $1,487,932 of the fund’s management fee in order to avoid a negative yield
22
Notes to Financial Statements – continued
which had the effect of further reducing the management fee and is reflected as a reduction of total expenses in the Statement of Operations.
The management fee incurred for the year ended August 31, 2009 was equivalent to an annual effective rate of 0.06% of the fund’s average daily net assets.
Distributor – The Board of Trustees has adopted a distribution plan for certain class shares pursuant to Rule 12b-1 of the Investment Company Act of 1940.
The fund’s distribution plan provides that the fund will pay MFD for services provided by MFD and financial intermediaries in connection with the distribution and servicing of certain share classes. One component of the plan is a distribution fee paid to MFD and another component of the plan is a service fee paid to MFD. MFD may subsequently pay all, or a portion, of the distribution and/or service fees to financial intermediaries.
Distribution Plan Fee Table:
| | | | | | | | | | |
| | | Distribution
Fee Rate (d) | | Service
Fee Rate (d) | | Total
Distribution
Plan (d) | | Annual
Effective
Rate (e) | | Distribution
and Service
Fee |
| Class A | | — | | 0.25% | | 0.25% | | 0.00% | | $0 |
| Class B | | 0.75% | | 0.25% | | 1.00% | | 0.22% | | 1,363,457 |
| Class C | | 0.75% | | 0.25% | | 1.00% | | 0.22% | | 946,747 |
| Class R1 | | 0.75% | | 0.25% | | 1.00% | | 0.20% | | 302,351 |
| Class R2 | | 0.25% | | 0.25% | | 0.50% | | 0.13% | | 595,394 |
| Class R3 | | — | | 0.25% | | 0.25% | | 0.07% | | 262,164 |
| Class 529A | | — | | 0.25% | | 0.25% | | 0.00% | | 18,730 |
| Class 529B | | 0.75% | | 0.25% | | 1.00% | | 0.11% | | 16,428 |
| Class 529C | | 0.75% | | 0.25% | | 1.00% | | 0.12% | | 38,480 |
| Total Distribution and Service Fees | | | | | | $3,543,751 |
| (d) | As of August 31, 2009, in accordance with the distribution plan for certain classes, the fund pays distribution and/or service fees equal to these annual percentage rates of each class’ average daily net assets. The distribution and service fee rates disclosed by class represent the current rates in effect at the end of the reporting period. Any rate changes, if applicable, are detailed below. |
| (e) | The annual effective rates represent actual fees incurred under the distribution plan for the year ended August 31, 2009 based on each class’ average daily net assets. Prior to March 1, 2009, the distribution fee rate for Class A and Class 529A shares was 0.10% and 0.25%, respectively. Prior to March 1, 2009, payment of the 0.10% annual Class A distribution fee and 0.15% of the Class 529A distribution were not in effect. For the period September 1, 2008 through February 28, 2009, the remaining 0.10% of the Class 529A distribution fee was waived under a written waiver arrangement. For the year ended August 31, 2009, this waiver amounted to $2,673 and is reflected as a reduction of total expenses in the Statement of Operations. Effective March 1, 2009, the 0.10% Class A and 0.25% Class 529A annual distribution fees were eliminated. Payment of the 0.25% annual Class A service fee is not yet in effect and will be implemented on such date as the fund’s Board of Trustees may determine. 0.25% of the Class 529A service fee is currently being waived until modified by the Board of Trustees, but this waiver will remain in effect at least until December 31, 2009. For the year ended August 31, 2009, this waiver amounted to $16,057 and is reflected as a reduction of total expenses in the Statement of Operations. During the year ended August 31, 2009, MFD voluntarily waived receipt of $2,729,201 of the fund’s distribution and service fees in order to avoid a negative yield for Class B, Class C, Class R1, Class R2, Class R3, Class 529B, and Class 529C shares. |
23
Notes to Financial Statements – continued
Certain Class A shares acquired through an exchange may be subject to a CDSC upon redemption depending on when the shares exchanged were originally purchased. Class C and Class 529C shares are subject to a CDSC in the event of a shareholder redemption within 12 months of purchase. Class B and Class 529B shares are subject to a CDSC in the event of a shareholder redemption within six years of purchase. All contingent deferred sales charges are paid to MFD and during the year ended August 31, 2009, were as follows:
| | |
| | | Amount |
| Class A | | $864 |
| Class B | | 675,208 |
| Class C | | 40,405 |
| Class 529B | | 2,588 |
| Class 529C | | 52 |
The fund has entered into and may from time to time enter into contracts with program managers and other parties which administer the tuition programs through which an investment in the fund’s 529 share classes is made. The fund has entered into an agreement with MFD pursuant to which MFD receives an annual fee of up to 0.10% of the average daily net assets attributable to each 529 share class. During the year ended August 31, 2009 MFD voluntarily waived receipt of $8,443 of the fund’s program manager fees, in order to avoid a negative yield for Class 529A, Class 529B, and Class 529C shares. The program manager fees incurred for the year ended August 31, 2009 were equivalent to an annual effective rate of 0.03% of average daily net assets for Class 529A, Class 529B, and Class 529B shares. The services provided by MFD, or a third party with which MFD contracts, include recordkeeping and tax reporting and account services, as well as services designed to maintain the program’s compliance with the Internal Revenue Code and other regulatory requirements. Program manager fees for the year ended August 31, 2009, were as follows:
| | |
| | | Amount |
| Class 529A | | $6,423 |
| Class 529B | | 1,643 |
| Class 529C | | 3,848 |
| Total Program Manager Fees | | $11,914 |
Shareholder Servicing Agent – MFS Service Center, Inc. (MFSC), a wholly-owned subsidiary of MFS, receives a fee from the fund for its services as shareholder servicing agent calculated as a percentage of the average daily net assets of the fund as determined periodically under the supervision of the fund’s Board of Trustees. For the year ended August 31, 2009, the fee was $645,517, which equated to 0.0926% annually of the fund’s average daily net assets. MFSC also receives payment from the fund for out-of-pocket expenses, sub-accounting and other shareholder servicing costs which may be paid to
24
Notes to Financial Statements – continued
affiliated and unaffiliated service providers. For the year ended August 31, 2009, these out-of-pocket expenses, sub-accounting and other shareholder servicing costs amounted to $917,916.
Administrator – MFS provides certain financial, legal, shareholder communications, compliance, and other administrative services to the fund. Under an administrative services agreement, the fund partially reimburses MFS the costs incurred to provide these services. The fund is charged an annual fixed amount of $17,500 plus a fee based on average daily net assets. The administrative services fee incurred for the year ended August 31, 2009 was equivalent to an annual effective rate of 0.0209% of the fund’s average daily net assets.
Trustees’ and Officers’ Compensation – The fund pays compensation to independent Trustees in the form of a retainer, attendance fees, and additional compensation to Board and Committee chairpersons. The fund does not pay compensation directly to Trustees or officers of the fund who are also officers of the investment adviser, all of whom receive remuneration for their services to the fund from MFS. Certain officers and Trustees of the fund are officers or directors of MFS, MFD, and MFSC.
Prior to December 31, 2001, the fund had an unfunded defined benefit plan (“DB plan”) for independent Trustees. As of December 31, 2001, the Board took action to terminate the DB plan with respect to then-current and any future independent Trustees, such that the DB Plan covers only certain of those former independent Trustees who retired on or before December 31, 2001. The DB Plan resulted in a pension expense of $2,358 and is included in independent Trustees’ compensation for the year ended August 31, 2009. The liability for deferred retirement benefits payable to certain independent Trustees under the DB plan amounted to $22,670 at August 31, 2009, and is included in payable for independent Trustees’ compensation on the Statement of Assets and Liabilities.
Other – This fund and certain other funds managed by MFS (the funds) have entered into services agreements (the Agreements) which provide for payment of fees by the funds to Tarantino LLC and Griffin Compliance LLC in return for the provision of services of an Independent Chief Compliance Officer (ICCO) and Assistant ICCO, respectively, for the funds. The ICCO and Assistant ICCO are officers of the funds and the sole members of Tarantino LLC and Griffin Compliance LLC, respectively. The funds can terminate the Agreements with Tarantino LLC and Griffin Compliance LLC at any time under the terms of the Agreements. For the year ended August 31, 2009, the aggregate fees paid by the fund to Tarantino LLC and Griffin Compliance LLC were $8,742 and are included in miscellaneous expense on the Statement of Operations. MFS has agreed to reimburse the fund for a portion of the payments made by the fund in the amount of $4,468, which is shown as a reduction of total expenses in the
25
Notes to Financial Statements – continued
Statement of Operations. Additionally, MFS has agreed to bear all expenses associated with office space, other administrative support, and supplies provided to the ICCO and Assistant ICCO.
Purchases and sales of money market securities, exclusive of securities subject to repurchase agreements, aggregated $27,846,274,978 and $27,957,367,348, respectively.
| (5) | | Shares of Beneficial Interest |
The fund’s Declaration of Trust permits the Trustees to issue an unlimited number of full and fractional shares of beneficial interest. Transactions in fund shares were as follows:
| | | | | | | | |
| | | Year ended
8/31/09 | | Year ended
8/31/08 |
| | | Shares | | Amount | | Shares | | Amount |
| Shares sold | | | | | | | | |
Class A | | 161,730,623 | | $161,730,659 | | 172,485,490 | | $172,485,490 |
Class B | | 138,214,631 | | 138,214,631 | | 101,303,033 | | 101,303,033 |
Class C | | 96,716,541 | | 96,716,541 | | 86,112,900 | | 86,112,900 |
Class R1 | | 26,331,930 | | 26,331,930 | | 78,385,633 | | 78,385,633 |
Former Class R2 (b) | | — | | — | | 58,115,747 | | 58,115,747 |
Class R2 | | 112,067,569 | | 112,067,569 | | 246,786,335 | | 246,786,335 |
Class R3 | | 104,847,806 | | 104,847,806 | | 238,218,335 | | 238,218,335 |
Class R4 | | 9,795,915 | | 9,795,915 | | 11,642,469 | | 11,642,469 |
Class 529A | | 6,292,783 | | 6,292,783 | | 2,413,422 | | 2,413,422 |
Class 529B | | 1,777,078 | | 1,777,078 | | 448,042 | | 448,042 |
Class 529C | | 4,950,767 | | 4,950,767 | | 1,514,398 | | 1,514,398 |
| | 662,725,643 | | $662,725,679 | | 997,425,804 | | $997,425,804 |
| Shares issued to shareholders in reinvestment of distributions | | | | | | | | |
Class A | | 595,074 | | $595,074 | | 4,683,683 | | $4,683,683 |
Class B | | 100,373 | | 100,373 | | 2,668,459 | | 2,668,459 |
Class C | | 75,102 | | 75,102 | | 1,311,958 | | 1,311,958 |
Class R1 | | 25,779 | | 25,779 | | 429,173 | | 429,173 |
Former Class R2 (b) | | — | | — | | 217,134 | | 217,134 |
Class R2 | | 181,340 | | 181,340 | | 1,870,880 | | 1,870,880 |
Class R3 | | 206,284 | | 206,284 | | 1,804,478 | | 1,804,478 |
Class R4 | | 15,425 | | 15,425 | | 123,580 | | 123,580 |
Class 529A | | 11,977 | | 11,977 | | 101,205 | | 101,205 |
Class 529B | | 615 | | 615 | | 8,992 | | 8,992 |
Class 529C | | 1,597 | | 1,597 | | 24,507 | | 24,507 |
| | 1,213,566 | | $1,213,566 | | 13,244,049 | | $13,244,049 |
26
Notes to Financial Statements – continued
| | | | | | | | | | | | |
| | | Year ended
8/31/09 | | | Year ended
8/31/08 | |
| | | Shares | | | Amount | | | Shares | | | Amount | |
| Shares reacquired | | | | | | | | | | | | |
Class A | | (178,817,174 | ) | | $(178,817,175 | ) | | (123,689,742 | ) | | $(123,689,742 | ) |
Class B | | (146,292,001 | ) | | (146,292,055 | ) | | (145,435,312 | ) | | (145,435,312 | ) |
Class C | | (105,852,969 | ) | | (105,852,969 | ) | | (68,724,606 | ) | | (68,724,606 | ) |
Class R1 | | (24,253,400 | ) | | (24,253,400 | ) | | (59,992,434 | ) | | (59,992,434 | ) |
Former Class R2 (b) | | — | | | — | | | (67,929,610 | ) | | (67,929,177 | ) |
Class R2 | | (90,566,134 | ) | | (90,566,134 | ) | | (185,861,524 | ) | | (185,861,524 | ) |
Class R3 | | (83,420,395 | ) | | (83,420,395 | ) | | (190,115,228 | ) | | (190,115,228 | ) |
Class R4 | | (8,207,762 | ) | | (8,207,762 | ) | | (11,388,944 | ) | | (11,388,944 | ) |
Class 529A | | (3,154,669 | ) | | (3,154,669 | ) | | (1,285,355 | ) | | (1,285,355 | ) |
Class 529B | | (535,728 | ) | | (535,729 | ) | | (85,328 | ) | | (85,328 | ) |
Class 529C | | (2,380,718 | ) | | (2,380,718 | ) | | (533,419 | ) | | (533,419 | ) |
| | (643,480,950 | ) | | $(643,481,006 | ) | | (855,041,502 | ) | | $(855,041,069 | ) |
| Net change | | | | | | | | | | | | |
Class A | | (16,491,477 | ) | | $(16,491,442 | ) | | 53,479,431 | | | $53,479,431 | |
Class B | | (7,976,997 | ) | | (7,977,051 | ) | | (41,463,820 | ) | | (41,463,820 | ) |
Class C | | (9,061,326 | ) | | (9,061,326 | ) | | 18,700,252 | | | 18,700,252 | |
Class R1 | | 2,104,309 | | | 2,104,309 | | | 18,822,372 | | | 18,822,372 | |
Former Class R2 (b) | | — | | | — | | | (9,596,729 | ) | | (9,596,296 | ) |
Class R2 | | 21,682,775 | | | 21,682,775 | | | 62,795,691 | | | 62,795,691 | |
Class R3 | | 21,633,695 | | | 21,633,695 | | | 49,907,585 | | | 49,907,585 | |
Class R4 | | 1,603,578 | | | 1,603,578 | | | 377,105 | | | 377,105 | |
Class 529A | | 3,150,091 | | | 3,150,091 | | | 1,229,272 | | | 1,229,272 | |
Class 529B | | 1,241,965 | | | 1,241,964 | | | 371,706 | | | 371,706 | |
Class 529C | | 2,571,646 | | | 2,571,646 | | | 1,005,486 | | | 1,005,486 | |
| | 20,458,259 | | | $20,458,239 | | | 155,628,351 | | | $155,628,784 | |
| (b) | At the close of business on April 18, 2008, Class R2 shares converted into Class R3 shares. Following this conversion, Class R3, Class R4, and Class R5 shares were renamed Class R2, Class R3, and Class R4 shares, respectively. |
Effective at the close of business February 27, 2009, the sale of fund shares have been suspended except in certain circumstances. Please see the fund’s prospectus for details.
The fund and certain other funds managed by MFS participate in a $1.1 billion unsecured committed line of credit, subject to a $1 billion sublimit, provided by a syndication of banks under a credit agreement. Borrowings may be made for temporary financing needs. Interest is charged to each fund, based on its borrowings, generally at a rate equal to the higher of the Federal Reserve funds rate or one month LIBOR plus an agreed upon spread. A commitment fee, based on the average daily, unused portion of the committed line of credit, is allocated among the participating funds at the end of each calendar quarter. In
27
Notes to Financial Statements – continued
addition, the fund and other funds managed by MFS have established unsecured uncommitted borrowing arrangements with certain banks for temporary financing needs. Interest is charged to each fund, based on its borrowings, at a rate equal to the Federal Reserve funds rate plus an agreed upon spread. For the year ended August 31, 2009, the fund’s commitment fee and interest expense were $8,901 and $0, respectively, and are included in miscellaneous expense on the Statement of Operations.
28
REPORT OF INDEPENDENT REGISTERED PUBLIC ACCOUNTING FIRM
To the Board of Trustees of MFS Series Trust I and the Shareholders of MFS Cash Reserve Fund:
We have audited the accompanying statement of assets and liabilities, including the portfolio of investments, of MFS Cash Reserve Fund (one of the portfolios comprising MFS Series Trust I) (the “Fund”) as of August 31, 2009, and the related statement of operations for the year then ended, the statements of changes in net assets for each of the two years in the period then ended, and the financial highlights for each of the five years in the period then ended. These financial statements and financial highlights are the responsibility of the Fund’s management. Our responsibility is to express an opinion on these financial statements and financial highlights based on our audits.
We conducted our audits in accordance with the standards of the Public Company Accounting Oversight Board (United States). Those standards require that we plan and perform the audit to obtain reasonable assurance about whether the financial statements and financial highlights are free of material misstatement. The Fund is not required to have, nor were we engaged to perform, an audit of its internal control over financial reporting. Our audits included consideration of internal control over financial reporting as a basis for designing audit procedures that are appropriate in the circumstances, but not for the purpose of expressing an opinion on the effectiveness of the Fund’s internal control over financial reporting. Accordingly, we express no such opinion. An audit also includes examining, on a test basis, evidence supporting the amounts and disclosures in the financial statements, assessing the accounting principles used and significant estimates made by management, as well as evaluating the overall financial statement presentation. Our procedures included confirmation of securities owned as of August 31, 2009, by correspondence with the custodian and brokers; where replies were not received from brokers, we performed other auditing procedures. We believe that our audits provide a reasonable basis for our opinion.
In our opinion, the financial statements and financial highlights referred to above present fairly, in all material respects, the financial position of MFS Cash Reserve Fund as of August 31, 2009, the results of its operations for the year then ended, the changes in its net assets for each of the two years in the period then ended, and the financial highlights for each of the five years in the period then ended, in conformity with accounting principles generally accepted in the United States of America.
DELOITTE & TOUCHE LLP
Boston, Massachusetts
October 16, 2009
29
TRUSTEES AND OFFICERS — IDENTIFICATION AND BACKGROUND
The Trustees and officers of the Trust, as of October 1, 2009, are listed below, together with their principal occupations during the past five years. (Their titles may have varied during that period.) The address of each Trustee and officer is 500 Boylston Street, Boston, Massachusetts 02116.
| | | | | | |
Name, Date of Birth | | Position(s) Held
with Fund | | Trustee/Officer
Since (h) | | Principal Occupations During
the Past Five Years & Other
Directorships (j) |
| INTERESTED TRUSTEES | | | | |
Robert J. Manning (k)
(born 10/20/63) | | Trustee | | February 2004 | | Massachusetts Financial Services Company, Chief Executive Officer, President, Chief Investment Officer and Director |
Robert C. Pozen (k)
(born 8/08/46) | | Trustee | | February 2004 | | Massachusetts Financial Services Company, Chairman (since February 2004); Medtronic, Inc, (medical devices), Director (since 2004); Harvard Business School (education), Senior Lecturer (since 2008); Bell Canada Enterprises (telecommunications), Director (until February 2009); The Bank of New York, Director (finance), (March 2004 to May 2005); Telesat (satellite communications), Director (until November 2007) |
| INDEPENDENT TRUSTEES | | | | |
David H. Gunning
(born 5/30/42) | | Trustee and Chair of Trustees | | January 2004 | | Retired; Cleveland-Cliffs Inc. (mining products and service provider), Vice Chairman/Director (until May 2007); Lincoln Electric Holdings, Inc. (welding equipment manufacturer), Director; Development Alternatives, Inc. (consulting), Director/Non Executive Chairman; Southwest Gas Corp. (natural gas distribution), Director (until May 2004); Portman Limited (mining), Director (until 2008) |
30
Trustees and Officers – continued
| | | | | | |
Name, Date of Birth | | Position(s) Held
with Fund | | Trustee/Officer
Since (h) | | Principal Occupations During
the Past Five Years & Other
Directorships (j) |
Robert E. Butler (n)
(born 11/29/41) | | Trustee | | January 2006 | | Consultant – investment company industry regulatory and compliance matters (since July 2002); PricewaterhouseCoopers LLP (professional services firm), Partner (until 2002) |
Lawrence H. Cohn, M.D.
(born 3/11/37) | | Trustee | | June 1989 | | Brigham and Women’s Hospital, Senior Cardiac Surgeon (since 2005); Harvard Medical School, Professor of Cardiac Surgery; Partners HealthCare, Physician Director of Medical Device Technology (since 2006); Brigham and Women’s Hospital, Chief of Cardiac Surgery (until 2005) |
Maureen R. Goldfarb
(born 4/6/55) | | Trustee | | January 2009 | | Private investor; John Hancock Financial Services, Inc., Executive Vice President (until 2004); John Hancock Mutual Funds, Trustee and Chief Executive Officer (until 2004) |
William R. Gutow
(born 9/27/41) | | Trustee | | December 1993 | | Private investor and real estate consultant; Capital Entertainment Management Company (video franchise), Vice Chairman; Atlantic Coast Tan (tanning salons), Vice Chairman (until 2007); Texas Donuts (donut franchise), Vice Chairman (until 2009) |
Michael Hegarty
(born 12/21/44) | | Trustee | | December 2004 | | Private investor; Retired; AXA Financial (financial services and insurance), Vice Chairman and Chief Operating Officer (until 2001); The Equitable Life Assurance Society (insurance), President and Chief Operating Officer (until 2001) |
J. Atwood Ives
(born 5/01/36) | | Trustee | | February 1992 | | Private investor; KeySpan Corporation (energy related services), Director (until 2004) |
31
Trustees and Officers – continued
| | | | | | |
Name, Date of Birth | | Position(s) Held
with Fund | | Trustee/Officer
Since (h) | | Principal Occupations During
the Past Five Years & Other
Directorships (j) |
John P. Kavanaugh
(born 11/4/54) | | Trustee | | January 2009 | | Private investor; The Hanover Insurance Group, Inc., Vice President and Chief Investment Officer (until 2006); Allmerica Investment Trust, Allmerica Securities Trust and Opus Investment Trust (investment companies), Chairman, President and Trustee (until 2006) |
J. Dale Sherratt
(born 9/23/38) | | Trustee | | June 1989 | | Insight Resources, Inc. (acquisition planning specialists), President; Wellfleet Investments (investor in health care companies), Managing General Partner |
Laurie J. Thomsen
(born 8/05/57) | | Trustee | | March 2005 | | New Profit, Inc. (venture philanthropy), Executive Partner (since 2006); Private investor; Prism Venture Partners (venture capital), Co-founder and General Partner (until June 2004); The Travelers Companies (commercial property liability insurance), Director |
Robert W. Uek
(born 5/18/41) | | Trustee | | January 2006 | | Consultant to investment company industry; PricewaterhouseCoopers LLP (professional services firm), Partner (until 1999); TT International Funds (mutual fund complex), Trustee (until 2005); Hillview Investment Trust II Funds (mutual fund complex), Trustee (until 2005) |
| OFFICERS | | | | | | |
Maria F. Dwyer (k)
(born 12/01/58) | | President | | November 2005 | | Massachusetts Financial Services Company, Executive Vice President and Chief Regulatory Officer (since March 2004) Chief Compliance Officer (since December 2006); Fidelity Management & Research Company, Vice President (prior to March 2004); Fidelity Group of Funds, President and Treasurer (until March 2004) |
32
Trustees and Officers – continued
| | | | | | |
Name, Date of Birth | | Position(s) Held
with Fund | | Trustee/Officer
Since (h) | | Principal Occupations During
the Past Five Years & Other
Directorships (j) |
Christopher R. Bohane (k)
(born 1/18/74) | | Assistant Secretary and Assistant Clerk | | July 2005 | | Massachusetts Financial Services Company, Vice President and Senior Counsel |
John M. Corcoran (k)
(born 04/13/65) | | Treasurer | | October 2008 | | Massachusetts Financial Services Company, Senior Vice President (since October 2008); State Street Bank and Trust (financial services provider), Senior Vice President, (until September 2008) |
Ethan D. Corey (k)
(born 11/21/63) | | Assistant Secretary and Assistant Clerk | | July 2005 | | Massachusetts Financial Services Company, Senior Vice President and Associate General Counsel (since 2004); Dechert LLP (law firm), Counsel (prior to December 2004) |
David L. DiLorenzo (k)
(born 8/10/68) | | Assistant Treasurer | | July 2005 | | Massachusetts Financial Services Company, Vice President (since June 2005); JP Morgan Investor Services, Vice President (until June 2005) |
Timothy M. Fagan (k)
(born 7/10/68) | | Assistant Secretary and Assistant Clerk | | September 2005 | | Massachusetts Financial Services Company, Vice President and Senior Counsel (since September 2005); John Hancock Advisers, LLC, Vice President, Senior Attorney and Chief Compliance Officer (until August 2005) |
Mark D. Fischer (k)
(born 10/27/70) | | Assistant Treasurer | | July 2005 | | Massachusetts Financial Services Company, Vice President (since May 2005); JP Morgan Investment Management Company, Vice President (until May 2005) |
Robyn L. Griffin
(born 7/04/75) | | Assistant Independent Chief Compliance Officer | | August 2008 | | Griffin Compliance LLC (provider of compliance services), Principal (since August 2008); State Street Corporation (financial services provider), Mutual Fund Administration Assistant Vice President (October 2006 – July 2008); Liberty Mutual Group (insurance), Personal Market Assistant Controller (April 2006 – October 2006); Deloitte & Touche LLP (professional services firm), Senior Manager (prior to April 2006) |
33
Trustees and Officers – continued
| | | | | | |
Name, Date of Birth | | Position(s) Held
with Fund | | Trustee/Officer
Since (h) | | Principal Occupations During
the Past Five Years & Other
Directorships (j) |
Brian E. Langenfeld (k)
(born 3/07/73) | | Assistant Secretary and Assistant Clerk | | June 2006 | | Massachusetts Financial Services Company, Vice President and Senior Counsel (since May 2006); John Hancock Advisers, LLC, Assistant Vice President and Counsel (until April 2006) |
Ellen Moynihan (k)
(born 11/13/57) | | Assistant Treasurer | | April 1997 | | Massachusetts Financial Services Company, Senior Vice President |
Susan S. Newton (k)
(born 3/07/50) | | Assistant Secretary and Assistant Clerk | | May 2005 | | Massachusetts Financial Services Company, Senior Vice President and Associate General Counsel (since April 2005); John Hancock Advisers, LLC, Senior Vice President, Secretary and Chief Legal Officer (until April 2005) |
Susan A. Pereira (k)
(born 11/05/70) | | Assistant Secretary and Assistant Clerk | | July 2005 | | Massachusetts Financial Services Company, Vice President and Senior Counsel (since June 2004); Bingham McCutchen LLP (law firm), Associate (until June 2004) |
Mark N. Polebaum (k)
(born 5/01/52) | | Secretary and Clerk | | January 2006 | | Massachusetts Financial Services Company, Executive Vice President, General Counsel and Secretary (since January 2006); Wilmer Cutler Pickering Hale and Dorr LLP (law firm), Partner (until January 2006) |
Frank L. Tarantino
(born 3/07/44) | | Independent Chief Compliance Officer | | June 2004 | | Tarantino LLC (provider of compliance services), Principal (since June 2004); CRA Business Strategies Group (consulting services), Executive Vice President (until June 2004) |
Richard S. Weitzel (k)
(born 7/16/70) | | Assistant Secretary and Assistant Clerk | | October 2007 | | Massachusetts Financial Services Company, Vice President and Assistant General Counsel (since 2004); Massachusetts Department of Business and Technology, General Counsel (until April 2004) |
James O. Yost (k)
(born 6/12/60) | | Assistant Treasurer | | September 1990 | | Massachusetts Financial Services Company, Senior Vice President |
| (h) | Date first appointed to serve as Trustee/officer of an MFS fund. Each Trustee has served continuously since appointment unless indicated otherwise. For the period from December 15, 2004 until February 22, 2005, Messrs. Pozen and Manning served as Advisory Trustees. For the period March 2008 until October 2008, Ms. Dwyer served as Treasurer of the Funds. |
34
Trustees and Officers – continued
| (j) | Directorships or trusteeships of companies required to report to the Securities and Exchange Commission (i.e., “public companies”). |
| (k) | “Interested person” of the Trust within the meaning of the Investment Company Act of 1940 (referred to as the 1940 Act), which is the principal federal law governing investment companies like the fund, as a result of position with MFS. The address of MFS is 500 Boylston Street, Boston, Massachusetts 02116. |
| (n) | In 2004 and 2005, Mr. Butler provided consulting services to the independent compliance consultant retained by MFS pursuant to its settlement with the SEC concerning market timing and related matters. The terms of that settlement required that compensation and expenses related to the independent compliance consultant be borne exclusively by MFS and, therefore, MFS paid Mr. Butler for the services he rendered to the independent compliance consultant. In 2004 and 2005, MFS paid Mr. Butler a total of $351,119.29. |
Each Trustee (except Messrs. Butler, Kavanaugh and Uek and Ms. Goldfarb) has been elected by shareholders and each Trustee and officer holds office until his or her successor is chosen and qualified or until his or her earlier death, resignation, retirement or removal. The Trust held a shareholders’ meeting in 2005 to elect Trustees, and will hold a shareholders’ meeting at least once every five years thereafter, to elect Trustees. Messrs. Butler, Kavanaugh, Sherratt, Uek and Ms. Thomsen are members of the Trust’s Audit Committee.
Each of the Fund’s Trustees and officers holds comparable positions with certain other funds of which MFS or a subsidiary is the investment adviser or distributor, and, in the case of the officers, with certain affiliates of MFS. As of January 1, 2009, the Trustees served as board members of 104 funds within the MFS Family of Funds.
The Statement of Additional Information for the Fund and further information about the Trustees are available without charge upon request by calling 1-800-225-2606.
| | |
| Investment Adviser | | Custodian |
Massachusetts Financial Services Company
500 Boylston Street, Boston, MA 02116-3741 | | State Street Bank and Trust 1 Lincoln Street, Boston, MA 02111-2900 |
| Distributor | | Independent Registered Public Accounting Firm |
MFS Fund Distributors, Inc.
500 Boylston Street, Boston, MA 02116-3741 | | Deloitte & Touche LLP 200 Berkeley Street, Boston, MA 02116 |
| Portfolio Manager | | |
| Edward O’Dette | | |
35
BOARD REVIEW OF INVESTMENT ADVISORY AGREEMENT
The Investment Company Act of 1940 requires that both the full Board of Trustees and a majority of the non-interested (“independent”) Trustees, voting separately, annually approve the continuation of the Fund’s investment advisory agreement with MFS. The Trustees consider matters bearing on the Fund and its advisory arrangements at their meetings throughout the year, including a review of performance data at each regular meeting. In addition, the independent Trustees met several times over the course of three months beginning in May and ending in July, 2009 (“contract review meetings”) for the specific purpose of considering whether to approve the continuation of the investment advisory agreement for the Fund and the other investment companies that the Board oversees (the “MFS Funds”). The independent Trustees were assisted in their evaluation of the Fund’s investment advisory agreement by independent legal counsel, from whom they received separate legal advice and with whom they met separately from MFS during various contract review meetings. The independent Trustees were also assisted in this process by the MFS Funds’ Independent Chief Compliance Officer, a full-time senior officer appointed by and reporting to the independent Trustees.
In connection with their deliberations regarding the continuation of the investment advisory agreement, the Trustees, including the independent Trustees, considered such information and factors as they believed, in light of the legal advice furnished to them and their own business judgment, to be relevant. The investment advisory agreement for the Fund was considered separately, although the Trustees also took into account the common interests of all MFS Funds in their review. As described below, the Trustees considered the nature, quality, and extent of the various investment advisory, administrative, and shareholder services performed by MFS under the existing investment advisory agreement and other arrangements with the Fund.
In connection with their contract review meetings, the Trustees received and relied upon materials that included, among other items: (i) information provided by Lipper Inc., an independent third party, on the investment performance of the Fund for various time periods ended December 31, 2008 and the investment performance of a group of funds with substantially similar investment classifications/objectives (the “Lipper performance universe”), (ii) information provided by Lipper Inc. on the Fund’s advisory fees and other expenses and the advisory fees and other expenses of comparable funds identified by Lipper Inc. (the “Lipper expense group”), (iii) information provided by MFS on the advisory fees of comparable portfolios of other clients of MFS, including institutional separate accounts and other clients, (iv) information as to whether and to what extent applicable expense waivers,
36
Board Review of Investment Advisory Agreement – continued
reimbursements or fee “breakpoints” are observed for the Fund, (v) information regarding MFS’ financial results and financial condition, including MFS’ and certain of its affiliates’ estimated profitability from services performed for the Fund and the MFS Funds as a whole, (vi) MFS’ views regarding the outlook for the mutual fund industry and the strategic business plans of MFS, (vii) descriptions of various functions performed by MFS for the Funds, such as compliance monitoring and portfolio trading practices, and (viii) information regarding the overall organization of MFS, including information about MFS’ senior management and other personnel providing investment advisory, administrative and other services to the Fund and the other MFS Funds. The comparative performance, fee and expense information prepared and provided by Lipper Inc. was not independently verified and the independent Trustees did not independently verify any information provided to them by MFS.
The Trustees’ conclusion as to the continuation of the investment advisory agreement was based on a comprehensive consideration of all information provided to the Trustees and not the result of any single factor. Some of the factors that figured particularly in the Trustees’ deliberations are described below, although individual Trustees may have evaluated the information presented differently from one another, giving different weights to various factors. It is also important to recognize that the fee arrangements for the Fund and other MFS Funds are the result of years of review and discussion between the independent Trustees and MFS, that certain aspects of such arrangements may receive greater scrutiny in some years than in others, and that the Trustees’ conclusions may be based, in part, on their consideration of these same arrangements during the course of the year and in prior years.
Based on information provided by Lipper Inc., the Trustees reviewed the Fund’s total return investment performance as well as the performance of peer groups of funds over various time periods. The Trustees placed particular emphasis on the total return performance of the Fund’s Class A shares in comparison to the performance of funds in its Lipper performance universe over the three-year period ended December 31, 2008, which the Trustees believed was a long enough period to reflect differing market conditions. The total return performance of the Fund’s Class A shares was in the 2nd quintile relative to the other funds in the universe for this three-year period (the 1st quintile being the best performers and the 5th quintile being the worst performers). The total return performance of the Fund’s Class A shares was in the 3rd quintile for the one-year period and the 1st quintile for five-year period ended December 31, 2008 relative to the Lipper performance universe. Because of the passage of time, these performance results are likely to differ from the performance results for more recent periods, including those shown elsewhere in this report.
37
Board Review of Investment Advisory Agreement – continued
In the course of their deliberations, the Trustees took into account information provided by MFS in connection with the contract review meetings, as well as during investment review meetings conducted with portfolio management personnel during the course of the year regarding the Fund’s performance. After reviewing these and related factors, the Trustees concluded, within the context of their overall conclusions regarding the investment advisory agreement, that they were satisfied with MFS’ responses and efforts relating to investment performance.
In assessing the reasonableness of the Fund’s advisory fee, the Trustees considered, among other information, the Fund’s advisory fee and the total expense ratio of the Fund’s Class A shares as a percentage of average daily net assets and the advisory fee and total expense ratios of peer groups of funds based on information provided by Lipper Inc. The Trustees considered that MFS Fund Distributors, Inc. (“MFD”), an affiliated of MFS, will observe a Class 12b-1 waiver beginning on January 1, 2010, which cannot be changed without the Trustees’ approval. The Trustees also considered that, according to the Lipper data (which takes into account any fee reductions or expense limitations that were in effect during the Fund’s last fiscal year), the Fund’s effective advisory fee rate and total expense ratio were each lower than the Lipper expense group median.
The Trustees also considered the advisory fees charged by MFS to institutional accounts. In comparing these fees, the Trustees considered information provided by MFS as to the generally broader scope of services provided by MFS to the Fund in comparison to institutional accounts, the higher demands placed on MFS’ investment personnel and trading infrastructure as a result of the daily cash in-flows and out-flows of the Fund, and the impact on MFS and expenses associated with the more extensive regulatory regime to which the Fund is subject in comparison to institutional accounts.
The Trustees also considered whether the Fund is likely to benefit from any economies of scale in the management of the Fund in the event of growth in assets of the Fund. They noted that the Fund’s advisory fee rate schedule is not currently subject to any breakpoints. Taking into account that the Fund’s effective advisory fee rate was lower than the Lipper expense group median described above, the Trustees determined not to recommend any advisory fee breakpoints for the Fund at this time.
The Trustees also considered information prepared by MFS relating to MFS’ costs and profits with respect to the Fund, the MFS Funds considered as a group, and other investment companies and accounts advised by MFS, as well as MFS’ methodologies used to determine and allocate its costs to the MFS Funds, the Fund and other accounts and products for purposes of estimating profitability.
38
Board Review of Investment Advisory Agreement – continued
After reviewing these and other factors described herein, the Trustees concluded, within the context of their overall conclusions regarding the investment advisory agreement, that the advisory fees charged to the Fund represent reasonable compensation in light of the services being provided by MFS to the Fund.
In addition, the Trustees considered MFS’ resources and related efforts to continue to retain, attract and motivate capable personnel to serve the Fund. The Trustees also considered current and developing conditions in the financial services industry, including the entry into the industry of large and well-capitalized companies which are spending, and appear to be prepared to continue to spend, substantial sums to engage personnel and to provide services to competing investment companies. In this regard, the Trustees also considered the financial resources of MFS and its ultimate parent, Sun Life Financial Inc. The Trustees also considered the advantages and possible disadvantages to the Fund of having an adviser that also serves other investment companies as well as other accounts.
The Trustees also considered the nature, quality, cost, and extent of administrative, transfer agency, and distribution services provided to the Fund by MFS and its affiliates under agreements and plans other than the investment advisory agreement, including any 12b-1 fees the Fund pays to MFD. The Trustees also considered the nature, extent and quality of certain other services MFS performs or arranges for on the Fund’s behalf, which may include securities lending programs, directed expense payment programs, class action recovery programs, and MFS’ interaction with third-party service providers, principally custodians and sub-custodians. The Trustees concluded that the various non-advisory services provided by MFS and its affiliates on behalf of the Funds were satisfactory.
The Trustees also considered benefits to MFS from the use of the Fund’s portfolio brokerage commissions, if applicable, to pay for investment research, and various other factors. Additionally, the Trustees considered so-called “fall-out benefits” to MFS such as reputational value derived from serving as investment manager to the Fund.
Based on their evaluation of factors that they deemed to be material, including those factors described above, the Board of Trustees, including a majority of the independent Trustees, concluded that the Fund’s investment advisory agreement with MFS should be continued for an additional one-year period, commencing August 1, 2009.
A discussion regarding the Board’s most recent review and renewal of the fund’s Investment Advisory Agreement with MFS will be available on or about November 1, 2009 by clicking on the fund’s name under “Mutual Funds” in the “Products and Performance” section of the MFS Web site (mfs.com).
39
PROXY VOTING POLICIES AND INFORMATION
A general description of the MFS funds’ proxy voting policies and procedures is available without charge, upon request, by calling 1-800-225-2606, by visiting the Proxy Voting section of mfs.com or by visiting the SEC’s Web site at http://www.sec.gov.
Information regarding how the fund voted proxies relating to portfolio securities during the most recent twelve-month period ended June 30 is available without charge by visiting the Proxy Voting section of mfs.com or by visiting the SEC’s Web site at http://www.sec.gov.
QUARTERLY PORTFOLIO DISCLOSURE
The fund will file a complete schedule of portfolio holdings with the Securities and Exchange Commission (the Commission) for the first and third quarters of each fiscal year on Form N-Q. The fund’s Form N-Q may be reviewed and copied at the:
Public Reference Room
Securities and Exchange Commission
100 F Street, NE, Room 1580
Washington, D.C. 20549
Information on the operation of the Public Reference Room may be obtained by calling the Commission at 1-800-SEC-0330. The fund’s Form N-Q is available on the EDGAR database on the Commission’s Internet Web site at http://www.sec.gov, and copies of this information may be obtained, upon payment of a duplicating fee, by electronic request at the following e-mail address: publicinfo@sec.gov or by writing the Public Reference Section at the above address.
A shareholder can also obtain the quarterly portfolio holdings report at mfs.com.
FURTHER INFORMATION
From time to time, MFS may post important information about the fund or the MFS funds on the MFS web site (mfs.com). This information is available by visiting the “News & Commentary” section of mfs.com or by clicking on the fund’s name under “Mutual Funds” in the “Products and Performance” section of mfs.com.
FEDERAL TAX INFORMATION (unaudited)
The fund will notify shareholders of amounts for use in preparing 2009 income tax forms in January 2010.
40
MFS® PRIVACY NOTICE
Privacy is a concern for every investor today. At MFS Investment Management® and the MFS funds, we take this concern very seriously. We want you to understand our policies about the investment products and services that we offer, and how we protect the nonpublic personal information of investors who have a direct relationship with us and our wholly owned subsidiaries.
Throughout our business relationship, you provide us with personal information. We maintain information and records about you, your investments, and the services you use. Examples of the nonpublic personal information we maintain include
| | Ÿ | | data from investment applications and other forms |
| | Ÿ | | share balances and transactional history with us, our affiliates, or others |
| | Ÿ | | facts from a consumer reporting agency |
We do not disclose any nonpublic personal information about our customers or former customers to anyone, except as permitted by law. We may share nonpublic personal information with third parties or certain of our affiliates in connection with servicing your account or processing your transactions. We may share information with companies or financial institutions that perform marketing services on our behalf or with other financial institutions with which we have joint marketing arrangements, subject to any legal requirements.
Authorization to access your nonpublic personal information is limited to appropriate personnel who provide products, services, or information to you. We maintain physical, electronic, and procedural safeguards to help protect the personal information we collect about you.
If you have any questions about the MFS privacy policy, please call 1-800-225-2606 any business day between 8 a.m. and 8 p.m. Eastern time.
Note: If you own MFS products or receive MFS services in the name of a third party such as a bank or broker-dealer, their privacy policy may apply to you instead of ours.
41
CONTACT US
| | |
Web site mfs.com MFS TALK 1-800-637-8255 24 hours a day Account service and literature Shareholders 1-800-225-2606 Investment professionals 1-800-343-2829 Retirement plan services 1-800-637-1255 | | Mailing address MFS Service Center, Inc. P.O. Box 55824 Boston, MA 02205-5824 Overnight mail MFS Service Center, Inc. c/o Boston Financial Data Services 30 Dan Road Canton, MA 02021-2809 |

Save paper with eDelivery. MFS® will send you prospectuses, reports, and proxies directly via e-mail so you will get information faster with less mailbox clutter. To sign up: 1. go to mfs.com. 2. log in via MFS® Access. 3. select eDelivery. If you own your MFS fund shares through a financial institution or a retirement plan, MFS® TALK, MFS Access, and eDelivery may not be available to you.


MFS® Core Equity Fund
SIPC Contact Information:
You may obtain information about the Securities Investor Protection Corporation (“SIPC”), including the SIPC Brochure, by contacting SIPC either by telephone (202-371-8300) or by accessing SIPC’s website address (www.sipc.org).
The report is prepared for the general information of shareholders. It is authorized for distribution to prospective investors only when preceded or accompanied by a current prospectus.
NOT FDIC INSURED Ÿ MAY LOSE VALUE Ÿ
NO BANK GUARANTEE
8/31/09
RGI-ANN

LETTER FROM THE CEO
Dear Shareholders:
In the fall of 2008, the markets took investors on what was perhaps the most tumultuous ride of their lives. Many are now debating when the market will stage a sustainable recovery, but not even the most experienced investor can provide a definitive answer to that question.
Even so, the basic rules of investing have not changed, and the turbulence reinforced the benefits of investing through the waves. Investors who jumped ship early on may have regretted their decisions when the markets gained some traction in the early half of this year. While anyone with a short-term horizon may have needed to take some action, most with longer-term goals probably found the best option was to stick with their long-term strategy.
At MFS® we believe investors are always best served by developing a plan with their investment professionals that addresses specific long-term needs. Most advisors agree that yearly reviews are important to monitor a plan’s progress. Most would also caution their clients against reacting too quickly to the daily news. When markets do recover, they often gain ground in quick, sudden bursts. If you are out of the market, you can easily miss the benefits of these rallies.
Few of us would again like to live through the kind of market turmoil we saw over the past year. But as turbulent as markets were, in our view, they proved that the fundamental principles of long-term investing still apply.
Respectfully,

Robert J. Manning
Chief Executive Officer and Chief Investment Officer
MFS Investment Management®
October 15, 2009
The opinions expressed in this letter are subject to change, may not be relied upon for investment advice, and no forecasts can be guaranteed.
1
PORTFOLIO COMPOSITION
Portfolio structure

| | |
| Top ten holdings | | |
| Apple, Inc. | | 3.0% |
| Chevron Corp. | | 2.4% |
| JPMorgan Chase & Co. | | 2.2% |
| Bank of America Corp. | | 1.9% |
| AT&T, Inc. | | 1.8% |
| Exxon Mobil Corp. | | 1.8% |
| Intel Corp. | | 1.8% |
| Johnson & Johnson | | 1.7% |
| Cisco Systems, Inc. | | 1.7% |
| Google, Inc., “A” | | 1.6% |
| | |
| Equity sectors | | |
| Technology | | 17.6% |
| Financial Services | | 15.2% |
| Health Care | | 13.0% |
| Energy | | 10.3% |
| Consumer Staples | | 7.8% |
| Retailing | | 7.6% |
| Utilities & Communications | | 7.3% |
| Industrial Goods & Services | | 7.2% |
| Leisure | | 4.2% |
| Basic Materials | | 3.7% |
| Special Products & Services | | 2.7% |
| Transportation | | 2.1% |
| Autos & Housing | | 0.6% |
Percentages are based on net assets as of 8/31/09.
The portfolio is actively managed and current holdings may be different.
2
MANAGEMENT REVIEW
Summary of Results
For the twelve months ended August 31, 2009, Class A shares of the MFS Core Equity Fund provided a total return of –16.55%, at net asset value. This compares with a return of –18.62% for the fund’s benchmark, the Russell 3000 Index.
Market Environment
The global economy and financial markets experienced substantial deterioration and extraordinary volatility over most of the reporting period. Through the first quarter of 2009, the strong headwinds in the U.S. included accelerated deterioration in the housing market, anemic corporate investment, a rapidly declining job market, and a much tighter credit environment. During the early stages of the period, a seemingly continuous series of tumultuous financial events hammered markets. As a result of this barrage of turbulent news, global equity markets pushed significantly lower and credit markets witnessed the worst market decline since the beginning of the credit crisis. The synchronized global downturn in economic activity experienced in the fourth quarter of 2008 and the first quarter of 2009 was among the most intense in the post-World War II period. Not only did Europe and Japan fall into very deep recessions, but an increasingly powerful engine of global growth – emerging markets – also contracted almost across the board. Though credit conditions and equity indices improved considerably during the second half of the period, the degree of financial and macroeconomic dislocation remained significant.
During the first half of the reporting period, the Fed continued to cut interest rates aggressively towards zero, while making increasing use of its new lending facilities to alleviate ever-tightening credit markets. On the fiscal front, the U.S. Treasury designed and began implementing a massive fiscal stimulus package. As inflationary concerns diminished in the face of global deleveraging, and equity and credit markets deteriorated more sharply, central banks around the world also cut interest rates dramatically. Policy makers in different countries increasingly sought to coordinate their rescue efforts, which resulted in a number of international actions such as the agreement of swap lines between the Federal Reserve and a number of other central banks and a substantial increase in the financial resources of the International Monetary Fund. By the middle of the period, several central banks had approached their lower bound on policy rates and were examining the implementation and ramifications of quantitative easing as a means to further loosen monetary policy to offset the continuing fall in global economic activity. However, by the end of the period, there emerged broadening signs that the worst of the global macroeconomic deterioration had passed, which caused the subsequent rise in asset valuations. As asset prices rebounded in the second half of the period and
3
Management Review – continued
the demand for liquidity waned, the debate concerning monetary exit strategies had begun, creating added uncertainty regarding the forward path of policy rates.
Contributors to Performance
Stock selection in the financial services sector was the principal factor in the fund’s return relative to the Russell 3000 Index. Overweighted positions in strong-performing global financial services firm JPMorgan Chase and insurance company Allied World Assurance Holdings boosted relative results. Not holding poor-performing international financial conglomerate Citigroup also helped.
Stock selection in the industrial goods and services and technology sectors also aided relative performance. In the industrial goods and services sector, having no exposure to struggling diversified industrial conglomerate General Electric (g) for the majority of the period was a positive factor for relative results as the stock significantly underperformed the benchmark. In the technology sector, the fund’s overweighted positions in computer and personal electronics maker Apple and networking chip maker Marvell Technology Group, both of which outperformed the benchmark over the reporting period, also bolstered relative returns.
Elsewhere, the fund’s ownership of global healthcare company Schering-Plough and pharmaceutical company Merck had a positive impact on relative performance. Shares of Schering-Plough rose after Merck announced plans to merge the two companies in a stock and cash deal that offered a significant premium to Schering-Plough shareholders. Holdings of drug company Wyeth and automotive parts retailer O’Reilly Automotive (g) were also among the fund’s top contributors for the reporting period. Shares of O’Reilly Automotive rose as same-store sales growth grew due, in part, to consumer preference to maintain their older vehicles rather than make new purchases in the current economy.
Detractors from Performance
Stock selection in the energy sector held back relative performance over the reporting period. No individual stocks within this sector were among the fund’s top relative detractors.
Stock selection in the health care sector also hurt relative performance. The fund’s ownership of employee benefits company Cigna (g) at the beginning of the reporting period was a top relative detractor as its shares substantially underperformed the benchmark. Not holding medical products makers Abbott Laboratories and Johnson & Johnson for the entire reporting period negatively impacted investment results. Our ownership of medical products company Advanced Medical Optics (g) at the beginning of the period was another relative detractor as the stock underperformed the benchmark.
4
Management Review – continued
Global biotech company Genzyme was also among the fund’s top relative detractors. Shares of Genzyme fell after the company announced it was being forced to temporarily shut down its Boston manufacturing plant due to viral contamination in one of the bioreactors. This shutdown was expected to create a supply shortage in Cerezyme and Fabrazyme, two of the company’s key drugs.
Elsewhere, commercial banking firm Sovereign Bancorp (g), diversified mine development and operating company Teck Resources (aa), women’s apparel company Ann Taylor (g), owner and operator of apartment communities Apartment Investment and Management (g), and home furnishings retailer Pier 1 Imports (g) were all top relative detractors.
During the reporting period, the portfolio’s currency exposure also detracted from relative performance. All of MFS’ investment decisions are driven by the fundamentals of each individual opportunity and as such, it is common for our portfolios to have different currency exposure than the benchmark.
Respectfully,
| | |
Joseph MacDougall Portfolio Manager | | Katrina Mead Portfolio Manager |
| (aa) | Security is not a benchmark constituent. |
| (g) | Security was not held in the portfolio at period end. |
The views expressed in this report are those of the portfolio managers only through the end of the period of the report as stated on the cover and do not necessarily reflect the views of MFS or any other person in the MFS organization. These views are subject to change at any time based on market or other conditions, and MFS disclaims any responsibility to update such views. These views may not be relied upon as investment advice or an indication of trading intent on behalf of any MFS portfolio. References to specific securities are not recommendations of such securities, and may not be representative of any MFS portfolio’s current or future investments.
5
PERFORMANCE SUMMARY THROUGH 8/31/09
The following chart illustrates a representative class of the fund's historical performance in comparison to its benchmark(s). Performance results include the deduction of the maximum applicable sales charge and reflect the percentage change in net asset value, including reinvestment of dividends and capital gains distributions. The performance of other share classes will be greater than or less than that of the class depicted below. Benchmarks are unmanaged and may not be invested in directly. Benchmark returns do not reflect sales charges, commissions or expenses. (See Notes to Performance Summary.)
Performance data shown represents past performance and is no guarantee of future results. Investment return and principal value fluctuate so your shares, when sold, may be worth more or less than the original cost; current performance may be lower or higher than quoted. The performance shown does not reflect the deduction of taxes, if any, that a shareholder would pay on fund distributions or the redemption of fund shares.
Growth of a Hypothetical $10,000 Investment
6
Performance Summary – continued
Total Returns through 8/31/09
Average annual without sales charge
| | | | | | | | | | | | | | |
| | | Share class | | Class inception date | | 1-yr | | 5-yr | | 10-yr | | Life (t) | | |
| | | A | | 1/02/96 | | (16.55)% | | 1.98% | | 0.40% | | N/A | | |
| | | B | | 1/02/97 | | (17.15)% | | 1.31% | | (0.26)% | | N/A | | |
| | | C | | 1/02/97 | | (17.10)% | | 1.32% | | (0.26)% | | N/A | | |
| | | I | | 1/02/97 | | (16.29)% | | 2.34% | | 0.75% | | N/A | | |
| | | R1 | | 4/01/05 | | (17.15)% | | N/A | | N/A | | (0.85)% | | |
| | | R2 | | 10/31/03 | | (16.71)% | | 1.70% | | N/A | | 2.30% | | |
| | | R3 | | 4/01/05 | | (16.48)% | | N/A | | N/A | | (0.13)% | | |
| | | R4 | | 4/01/05 | | (16.28)% | | N/A | | N/A | | 0.16% | | |
| Comparative benchmark | | | | | | | | | | |
| | | Russell 3000 Index (f) | | (18.62)% | | 1.04% | | 0.06% | | N/A | | |
| Average annual with sales charge | | | | | | | | | | |
| | | A
With Initial Sales Charge (5.75%) | | (21.34)% | | 0.78% | | (0.19)% | | N/A | | |
| | | B
With CDSC (Declining over six years from 4% to 0%) (x) | | (20.47)% | | 0.98% | | (0.26)% | | N/A | | |
| | | C
With CDSC (1% for 12 months) (x) | | (17.93)% | | 1.32% | | (0.26)% | | N/A | | |
Class I, R1, R2, R3, and R4 shares do not have a sales charge.
CDSC – Contingent Deferred Sales Charge.
| (f) | Source: FactSet Research Systems Inc. |
| (t) | For the period from the commencement of the class’ inception date through the stated period end (for those share classes with less than 10 years of performance history). No comparative benchmark information is provided for “life” periods. (See Notes to Performance Summary below.) |
| (x) | Assuming redemption at the end of the applicable period. |
Benchmark Definition
Russell 3000 Index – constructed to provide a comprehensive barometer for the 3,000 largest U.S. companies based on total market capitalization, which represents approximately 98% of the investable U.S. equity market.
It is not possible to invest directly in an index.
Notes to Performance Summary
Average annual total return represents the average annual change in value for each share class for the periods presented. Life returns are presented where the share class has less than 10 years of performance history and represent the average annual total return from the class inception date to the stated period
7
Performance Summary – continued
end date. As the fund’s share classes may have different inception dates, the life returns may represent different time periods and may not be comparable. As a result, no comparative benchmark performance information is provided for life periods.
Performance results reflect any applicable expense subsidies and waivers in effect during the periods shown. Without such subsidies and waivers the fund’s performance results would be less favorable. Please see the prospectus and financial statements for complete details.
From time to time the fund may receive proceeds from litigation settlements, without which performance would be lower.
8
EXPENSE TABLE
Fund expenses borne by the shareholders during the period,
March 1, 2009 through August 31, 2009
As a shareholder of the fund, you incur two types of costs: (1) transaction costs, including sales charges (loads) on certain purchase or redemption payments, and (2) ongoing costs, including management fees; distribution and service (12b-1) fees; and other fund expenses. This example is intended to help you understand your ongoing costs (in dollars) of investing in the fund and to compare these costs with the ongoing costs of investing in other mutual funds.
The example is based on an investment of $1,000 invested at the beginning of the period and held for the entire period March 1, 2009 through August 31, 2009.
Actual Expenses
The first line for each share class in the following table provides information about actual account values and actual expenses. You may use the information in this line, together with the amount you invested, to estimate the expenses that you paid over the period. Simply divide your account value by $1,000 (for example, an $8,600 account value divided by $1,000 = 8.6), then multiply the result by the number in the first line under the heading entitled “Expenses Paid During Period” to estimate the expenses you paid on your account during this period.
Hypothetical Example for Comparison Purposes
The second line for each share class in the following table provides information about hypothetical account values and hypothetical expenses based on the fund’s actual expense ratio and an assumed rate of return of 5% per year before expenses, which is not the fund’s actual return. The hypothetical account values and expenses may not be used to estimate the actual ending account balance or expenses you paid for the period. You may use this information to compare the ongoing costs of investing in the fund and other funds. To do so, compare this 5% hypothetical example with the 5% hypothetical examples that appear in the shareholder reports of the other funds.
Please note that the expenses shown in the table are meant to highlight your ongoing costs only and do not reflect any transactional costs, such as sales charges (loads). Therefore, the second line for each share class in the table is useful in comparing ongoing costs only, and will not help you determine the relative total costs of owning different funds. In addition, if these transactional costs were included, your costs would have been higher.
9
Expense Table – continued
| | | | | | | | | | |
Share
Class | | | | Annualized
Expense
Ratio | | Beginning
Account Value
3/01/09 | | Ending
Account Value
8/31/09 | | Expenses
Paid During
Period (p)
3/01/09-8/31/09 |
| A | | Actual | | 1.21% | | $1,000.00 | | $1,415.31 | | $7.37 |
| | Hypothetical (h) | | 1.21% | | $1,000.00 | | $1,019.11 | | $6.16 |
| B | | Actual | | 1.96% | | $1,000.00 | | $1,409.69 | | $11.90 |
| | Hypothetical (h) | | 1.96% | | $1,000.00 | | $1,015.32 | | $9.96 |
| C | | Actual | | 1.96% | | $1,000.00 | | $1,410.40 | | $11.91 |
| | Hypothetical (h) | | 1.96% | | $1,000.00 | | $1,015.32 | | $9.96 |
| I | | Actual | | 0.96% | | $1,000.00 | | $1,417.49 | | $5.85 |
| | Hypothetical (h) | | 0.96% | | $1,000.00 | | $1,020.37 | | $4.89 |
| R1 | | Actual | | 1.96% | | $1,000.00 | | $1,410.40 | | $11.91 |
| | Hypothetical (h) | | 1.96% | | $1,000.00 | | $1,015.32 | | $9.96 |
| R2 | | Actual | | 1.46% | | $1,000.00 | | $1,414.33 | | $8.88 |
| | Hypothetical (h) | | 1.46% | | $1,000.00 | | $1,017.85 | | $7.43 |
| R3 | | Actual | | 1.21% | | $1,000.00 | | $1,414.71 | | $7.36 |
| | Hypothetical (h) | | 1.21% | | $1,000.00 | | $1,019.11 | | $6.16 |
| R4 | | Actual | | 0.95% | | $1,000.00 | | $1,417.85 | | $5.79 |
| | Hypothetical (h) | | 0.95% | | $1,000.00 | | $1,020.42 | | $4.84 |
| (h) | 5% class return per year before expenses. |
| (p) | Expenses paid is equal to each class’ annualized expense ratio, as shown above, multiplied by the average account value over the period, multiplied by the number of days in the period, divided by the number of days in the year. Expenses paid do not include any applicable sales charges (loads). If these transaction costs had been included, your costs would have been higher. |
10
PORTFOLIO OF INVESTMENTS
8/31/09
The Portfolio of Investments is a complete list of all securities owned by your fund. It is categorized by broad-based asset classes.
| | | | | |
| Common Stocks - 99.3% | | | | | |
| Issuer | | Shares/Par | | Value ($) |
| | | | | |
| Aerospace - 2.6% | | | | | |
| Goodrich Corp. | | 77,830 | | $ | 4,293,103 |
| Lockheed Martin Corp. | | 83,800 | | | 6,283,324 |
| Precision Castparts Corp. | | 23,870 | | | 2,178,854 |
| United Technologies Corp. | | 119,680 | | | 7,104,205 |
| | | | | |
| | | | | $ | 19,859,486 |
| Airlines - 0.1% | | | | | |
| Copa Holdings S.A., “A” | | 18,970 | | $ | 792,377 |
| | |
| Apparel Manufacturers - 0.8% | | | | | |
| NIKE, Inc., “B” | | 110,410 | | $ | 6,115,610 |
| | |
| Biotechnology - 2.0% | | | | | |
| Amgen, Inc. (a) | | 60,650 | | $ | 3,623,231 |
| Celgene Corp. (a) | | 57,210 | | | 2,984,646 |
| Genzyme Corp. (a) | | 150,121 | | | 8,363,241 |
| | | | | |
| | | | | $ | 14,971,118 |
| Broadcasting - 1.4% | | | | | |
| Discovery Communications, Inc., “A” (a) | | 62,820 | | $ | 1,628,294 |
| Omnicom Group, Inc. | | 42,190 | | | 1,532,341 |
| Time Warner, Inc. | | 123,626 | | | 3,450,402 |
| Walt Disney Co. | | 169,260 | | | 4,407,530 |
| | | | | |
| | | | | $ | 11,018,567 |
| Brokerage & Asset Managers - 1.6% | | | | | |
| Affiliated Managers Group, Inc. (a) | | 24,404 | | $ | 1,594,313 |
| Charles Schwab Corp. | | 80,450 | | | 1,452,927 |
| CME Group, Inc. | | 12,260 | | | 3,568,150 |
| GFI Group, Inc. | | 261,920 | | | 1,875,347 |
| Invesco Ltd. | | 109,060 | | | 2,262,995 |
| MarketAxess Holdings, Inc. (a) | | 133,520 | | | 1,480,737 |
| | | | | |
| | | | | $ | 12,234,469 |
| Business Services - 2.0% | | | | | |
| Accenture Ltd., “A” | | 131,290 | | $ | 4,332,570 |
| Amdocs Ltd. (a) | | 86,800 | | | 2,110,976 |
| Dun & Bradstreet Corp. | | 36,210 | | | 2,644,778 |
11
Portfolio of Investments – continued
| | | | | |
| Issuer | | Shares/Par | | Value ($) |
| | | | | |
| Common Stocks - continued | | | | | |
| Business Services - continued | | | | | |
| MasterCard, Inc., “A” | | 17,340 | | $ | 3,513,604 |
| Western Union Co. | | 158,050 | | | 2,851,222 |
| | | | | |
| | | | | $ | 15,453,150 |
| Cable TV - 0.9% | | | | | |
| Comcast Corp., “Special A” | | 128,640 | | $ | 1,876,858 |
| DIRECTV Group, Inc. (a) | | 133,820 | | | 3,313,383 |
| Time Warner Cable, Inc. | | 54,026 | | | 1,994,640 |
| | | | | |
| | | | | $ | 7,184,881 |
| Chemicals - 0.8% | | | | | |
| 3M Co. | | 42,020 | | $ | 3,029,642 |
| Celanese Corp. | | 128,580 | | | 3,274,933 |
| | | | | |
| | | | | $ | 6,304,575 |
| Computer Software - 4.0% | | | | | |
| Adobe Systems, Inc. (a) | | 319,370 | | $ | 10,034,605 |
| MicroStrategy, Inc., “A” (a) | | 176,960 | | | 10,927,280 |
| MSC.Software Corp. (a) | | 557,081 | | | 4,222,674 |
| Oracle Corp. | | 260,900 | | | 5,705,883 |
| | | | | |
| | | | | $ | 30,890,442 |
| Computer Software - Systems - 5.2% | | | | | |
| Apple, Inc. (a) | | 134,380 | | $ | 22,604,060 |
| Dell, Inc. (a) | | 350,260 | | | 5,544,616 |
| Hewlett-Packard Co. | | 251,310 | | | 11,281,306 |
| | | | | |
| | | | | $ | 39,429,982 |
| Construction - 0.6% | | | | | |
| Lennar Corp., “A” | | 229,400 | | $ | 3,475,410 |
| Sherwin-Williams Co. | | 17,210 | | | 1,036,042 |
| | | | | |
| | | | | $ | 4,511,452 |
| Consumer Products - 2.3% | | | | | |
| Church & Dwight Co., Inc. | | 25,900 | | $ | 1,479,667 |
| Kimberly-Clark Corp. | | 68,300 | | | 4,129,418 |
| Procter & Gamble Co. | | 219,810 | | | 11,893,919 |
| | | | | |
| | | | | $ | 17,503,004 |
| Consumer Services - 0.7% | | | | | |
| Capella Education Co. (a) | | 48,280 | | $ | 3,058,538 |
| Monster Worldwide, Inc. (a) | | 50,470 | | | 818,623 |
| priceline.com, Inc. (a) | | 9,250 | | | 1,424,315 |
| | | | | |
| | | | | $ | 5,301,476 |
12
Portfolio of Investments – continued
| | | | | |
| Issuer | | Shares/Par | | Value ($) |
| | | | | |
| Common Stocks - continued | | | | | |
| Containers - 0.8% | | | | | |
| Owens-Illinois, Inc. (a) | | 174,670 | | $ | 5,928,300 |
| | |
| Electrical Equipment - 3.0% | | | | | |
| AMETEK, Inc. | | 104,400 | | $ | 3,286,512 |
| Danaher Corp. | | 128,030 | | | 7,772,701 |
| Rockwell Automation, Inc. | | 127,980 | | | 5,355,963 |
| Tyco Electronics Ltd. | | 292,980 | | | 6,685,804 |
| | | | | |
| | | | | $ | 23,100,980 |
| Electronics - 4.3% | | | | | |
| First Solar, Inc. (a) | | 8,760 | | $ | 1,065,041 |
| Flextronics International Ltd. (a) | | 562,275 | | | 3,334,291 |
| Hittite Microwave Corp. (a) | | 77,630 | | | 2,672,025 |
| Intel Corp. | | 675,960 | | | 13,735,507 |
| Marvell Technology Group Ltd. (a) | | 284,040 | | | 4,331,610 |
| National Semiconductor Corp. | | 329,010 | | | 4,991,082 |
| Silicon Laboratories, Inc. (a) | | 48,310 | | | 2,175,882 |
| Tessera Technologies, Inc. (a) | | 37,390 | | | 939,611 |
| | | | | |
| | | | | $ | 33,245,049 |
| Energy - Independent - 3.1% | | | | | |
| Anadarko Petroleum Corp. | | 63,400 | | $ | 3,351,958 |
| Apache Corp. | | 74,660 | | | 6,342,367 |
| CONSOL Energy, Inc. | | 34,610 | | | 1,294,760 |
| Denbury Resources, Inc. (a) | | 95,340 | | | 1,451,075 |
| Nexen, Inc. | | 167,690 | | | 3,293,295 |
| Noble Energy, Inc. | | 49,250 | | | 2,977,655 |
| XTO Energy, Inc. | | 135,400 | | | 5,226,440 |
| | | | | |
| | | | | $ | 23,937,550 |
| Energy - Integrated - 5.4% | | | | | |
| Chevron Corp. | | 265,930 | | $ | 18,599,144 |
| Exxon Mobil Corp. (s) | | 201,462 | | | 13,931,097 |
| Hess Corp. | | 69,700 | | | 3,526,123 |
| Marathon Oil Corp. | | 108,380 | | | 3,345,691 |
| Suncor Energy, Inc. | | 56,500 | | | 1,731,160 |
| | | | | |
| | | | | $ | 41,133,215 |
| Engineering - Construction - 0.8% | | | | | |
| Fluor Corp. | | 86,900 | | $ | 4,597,010 |
| North American Energy Partners, Inc. (a) | | 234,860 | | | 1,474,921 |
| | | | | |
| | | | | $ | 6,071,931 |
13
Portfolio of Investments – continued
| | | | | |
| Issuer | | Shares/Par | | Value ($) |
| | | | | |
| Common Stocks - continued | | | | | |
| Food & Beverages - 3.6% | | | | | |
| Coca-Cola Co. | | 135,580 | | $ | 6,612,237 |
| Flowers Foods, Inc. | | 53,300 | | | 1,266,941 |
| General Mills, Inc. | | 66,930 | | | 3,997,729 |
| J.M. Smucker Co. | | 31,860 | | | 1,665,322 |
| Kellogg Co. | | 65,390 | | | 3,079,215 |
| PepsiCo, Inc. (s) | | 188,479 | | | 10,681,105 |
| | | | | |
| | | | | $ | 27,302,549 |
| Food & Drug Stores - 1.1% | | | | | |
| CVS Caremark Corp. | | 177,520 | | $ | 6,660,550 |
| Kroger Co. | | 87,320 | | | 1,885,239 |
| | | | | |
| | | | | $ | 8,545,789 |
| Gaming & Lodging - 0.6% | | | | | |
| International Game Technology | | 95,100 | | $ | 1,989,492 |
| Melco PBL Entertainment (Macau) Ltd., ADR (a) | | 219,100 | | | 1,343,083 |
| Royal Caribbean Cruises Ltd. | | 78,060 | | | 1,489,385 |
| | | | | |
| | | | | $ | 4,821,960 |
| General Merchandise - 2.1% | | | | | |
| Target Corp. | | 189,890 | | $ | 8,924,830 |
| Wal-Mart Stores, Inc. | | 136,600 | | | 6,948,842 |
| | | | | |
| | | | | $ | 15,873,672 |
| Health Maintenance Organizations - 0.8% | | | | | |
| WellPoint, Inc. (a) | | 110,050 | | $ | 5,816,142 |
| | |
| Insurance - 3.1% | | | | | |
| ACE Ltd. | | 24,970 | | $ | 1,302,935 |
| Allied World Assurance Co. Holdings Ltd. | | 116,080 | | | 5,377,986 |
| Chubb Corp. | | 37,150 | | | 1,834,838 |
| Hartford Financial Services Group, Inc. | | 200,800 | | | 4,762,976 |
| MetLife, Inc. | | 162,990 | | | 6,154,502 |
| Prudential Financial, Inc. | | 20,560 | | | 1,039,925 |
| Travelers Cos., Inc. | | 72,170 | | | 3,638,811 |
| | | | | |
| | | | | $ | 24,111,973 |
| Internet - 1.6% | | | | | |
| Google, Inc., “A” (a) | | 25,840 | | $ | 11,929,553 |
| | |
| Leisure & Toys - 0.7% | | | | | |
| Hasbro, Inc. | | 194,340 | | $ | 5,517,313 |
14
Portfolio of Investments – continued
| | | | | |
| Issuer | | Shares/Par | | Value ($) |
| | | | | |
| Common Stocks - continued | | | | | |
| Machinery & Tools - 0.4% | | | | | |
| Bucyrus International, Inc. | | 40,820 | | $ | 1,218,477 |
| Roper Industries, Inc. | | 45,170 | | | 2,140,155 |
| | | | | |
| | | | | $ | 3,358,632 |
| Major Banks - 7.4% | | | | | |
| Bank of America Corp. | | 845,700 | | $ | 14,875,863 |
| Bank of New York Mellon Corp. | | 139,228 | | | 4,122,541 |
| Goldman Sachs Group, Inc. | | 50,740 | | | 8,395,440 |
| JPMorgan Chase & Co. (s) | | 385,810 | | | 16,767,303 |
| Regions Financial Corp. | | 479,780 | | | 2,811,511 |
| State Street Corp. | | 112,570 | | | 5,907,674 |
| SunTrust Banks, Inc. | | 175,400 | | | 4,099,098 |
| | | | | |
| | | | | $ | 56,979,430 |
| Medical & Health Technology & Services - 1.3% | | | | | |
| DaVita, Inc. (a) | | 44,680 | | $ | 2,310,403 |
| Express Scripts, Inc. (a) | | 45,470 | | | 3,283,843 |
| Laboratory Corp. of America Holdings (a) | | 24,000 | | | 1,674,960 |
| MWI Veterinary Supply, Inc. (a) | | 44,662 | | | 1,661,873 |
| VCA Antech, Inc. (a) | | 45,940 | | | 1,137,015 |
| | | | | |
| | | | | $ | 10,068,094 |
| Medical Equipment - 2.7% | | | | | |
| Becton, Dickinson & Co. | | 58,800 | | $ | 4,093,656 |
| Medtronic, Inc. | | 106,490 | | | 4,078,567 |
| NxStage Medical, Inc. (a) | | 157,410 | | | 972,794 |
| NxStage Medical, Inc. (a)(z) | | 342,400 | | | 2,116,032 |
| St. Jude Medical, Inc. (a) | | 122,200 | | | 4,709,588 |
| Thermo Fisher Scientific, Inc. (a) | | 53,280 | | | 2,408,789 |
| Waters Corp. (a) | | 48,050 | | | 2,415,954 |
| | | | | |
| | | | | $ | 20,795,380 |
| Metals & Mining - 0.8% | | | | | |
| Cameco Corp. | | 51,040 | | $ | 1,356,643 |
| Cliffs Natural Resources, Inc. | | 106,740 | | | 2,701,589 |
| Steel Dynamics, Inc. | | 135,280 | | | 2,238,884 |
| | | | | |
| | | | | $ | 6,297,116 |
| Natural Gas - Distribution - 0.5% | | | | | |
| EQT Corp. | | 61,810 | | $ | 2,452,003 |
| Sempra Energy | | 27,960 | | | 1,402,753 |
| | | | | |
| | | | | $ | 3,854,756 |
15
Portfolio of Investments – continued
| | | | | |
| Issuer | | Shares/Par | | Value ($) |
| | | | | |
| Common Stocks - continued | | | | | |
| Natural Gas - Pipeline - 0.4% | | | | | |
| Williams Cos., Inc. | | 168,010 | | $ | 2,762,084 |
| | |
| Network & Telecom - 2.1% | | | | | |
| Ciena Corp. (a) | | 221,740 | | $ | 2,971,316 |
| Cisco Systems, Inc. (a) | | 604,280 | | | 13,052,448 |
| | | | | |
| | | | | $ | 16,023,764 |
| Oil Services - 1.8% | | | | | |
| Exterran Holdings, Inc. (a) | | 143,960 | | $ | 2,595,599 |
| Halliburton Co. | | 147,280 | | | 3,492,009 |
| Helmerich & Payne, Inc. | | 18,580 | | | 621,687 |
| Noble Corp. | | 84,220 | | | 2,950,227 |
| Pride International, Inc. (a) | | 88,800 | | | 2,289,264 |
| Smith International, Inc. | | 57,190 | | | 1,576,728 |
| | | | | |
| | | | | $ | 13,525,514 |
| Other Banks & Diversified Financials - 1.2% | | | | | |
| Discover Financial Services | | 116,930 | | $ | 1,607,787 |
| Euro Dekania Ltd. (a)(z) | | 580,280 | | | 1,218,717 |
| NewAlliance Bancshares, Inc. | | 123,800 | | | 1,455,888 |
| Ocwen Financial Corp. (a) | | 250,420 | | | 2,591,847 |
| SVB Financial Group (a) | | 64,060 | | | 2,546,385 |
| | | | | |
| | | | | $ | 9,420,624 |
| Personal Computers & Peripherals - 0.4% | | | | | |
| Nuance Communications, Inc. (a) | | 221,900 | | $ | 2,736,027 |
| | |
| Pharmaceuticals - 6.2% | | | | | |
| Abbott Laboratories | | 261,920 | | $ | 11,846,642 |
| Johnson & Johnson | | 220,280 | | | 13,313,723 |
| Merck & Co., Inc. | | 166,120 | | | 5,387,272 |
| Pfizer, Inc. | | 472,650 | | | 7,893,255 |
| Schering-Plough Corp. | | 72,820 | | | 2,052,068 |
| Teva Pharmaceutical Industries Ltd., ADR | | 73,050 | | | 3,762,075 |
| Wyeth | | 61,620 | | | 2,948,517 |
| | | | | |
| | | | | $ | 47,203,552 |
| Pollution Control - 0.4% | | | | | |
| Republic Services, Inc. | | 132,402 | | $ | 3,390,815 |
| | |
| Precious Metals & Minerals - 0.4% | | | | | |
| Goldcorp, Inc. | | 38,670 | | $ | 1,409,908 |
| Teck Resources Ltd., “B” (a) | | 68,100 | | | 1,643,482 |
| | | | | |
| | | | | $ | 3,053,390 |
16
Portfolio of Investments – continued
| | | | | |
| Issuer | | Shares/Par | | Value ($) |
| | | | | |
| Common Stocks - continued | | | | | |
| Printing & Publishing - 0.3% | | | | | |
| Moody’s Corp. | | 70,340 | | $ | 1,916,062 |
| | |
| Railroad & Shipping - 1.0% | | | | | |
| Canadian National Railway Co. | | 107,700 | | $ | 5,198,679 |
| Union Pacific Corp. | | 40,530 | | | 2,424,099 |
| | | | | |
| | | | | $ | 7,622,778 |
| Real Estate - 1.9% | | | | | |
| Annaly Mortgage Management, Inc., REIT | | 253,090 | | $ | 4,388,581 |
| Entertainment Property Trust, REIT | | 165,600 | | | 5,193,216 |
| Kilroy Realty Corp., REIT | | 103,780 | | | 2,875,744 |
| Mack-Cali Realty Corp., REIT | | 73,440 | | | 2,352,283 |
| | | | | |
| | | | | $ | 14,809,824 |
| Restaurants - 0.3% | | | | | |
| P.F. Chang’s China Bistro, Inc. (a) | | 68,530 | | $ | 2,186,792 |
| | |
| Specialty Chemicals - 0.9% | | | | | |
| Praxair, Inc. | | 65,000 | | $ | 4,980,300 |
| Rockwood Holdings, Inc. (a) | | 92,300 | | | 1,880,151 |
| | | | | |
| | | | | $ | 6,860,451 |
| Specialty Stores - 3.6% | | | | | |
| Abercrombie & Fitch Co., “A” | | 151,600 | | $ | 4,895,164 |
| Advance Auto Parts, Inc. | | 93,110 | | | 3,938,553 |
| Home Depot, Inc. | | 262,330 | | | 7,158,986 |
| Nordstrom, Inc. | | 134,970 | | | 3,784,559 |
| Staples, Inc. | | 155,520 | | | 3,360,787 |
| Tiffany & Co. | | 115,710 | | | 4,209,530 |
| | | | | |
| | | | | $ | 27,347,579 |
| Telecommunications - Wireless - 0.6% | | | | | |
| Cellcom Israel Ltd. | | 86,990 | | $ | 2,461,817 |
| Rogers Communications, Inc., “B” | | 68,100 | | | 1,874,888 |
| | | | | |
| | | | | $ | 4,336,705 |
| Telephone Services - 2.4% | | | | | |
| American Tower Corp., “A” (a) | | 68,900 | | $ | 2,180,685 |
| AT&T, Inc. | | 534,810 | | | 13,931,800 |
| CenturyTel, Inc. | | 69,680 | | | 2,245,786 |
| | | | | |
| | | | | $ | 18,358,271 |
17
Portfolio of Investments – continued
| | | | | |
| Issuer | | Shares/Par | | Value ($) |
| | | | | |
| Common Stocks - continued | | | | | |
| Tobacco - 1.9% | | | | | |
| Lorillard, Inc. | | 43,170 | | $ | 3,141,481 |
| Philip Morris International, Inc. | | 247,960 | | | 11,334,252 |
| | | | | |
| | | | | $ | 14,475,733 |
| Trucking - 1.0% | | | | | |
| Expeditors International of Washington, Inc. | | 108,870 | | $ | 3,555,694 |
| FedEx Corp. | | 21,240 | | | 1,459,400 |
| Landstar System, Inc. | | 84,170 | | | 2,935,008 |
| | | | | |
| | | | | $ | 7,950,102 |
| Utilities - Electric Power - 3.4% | | | | | |
| American Electric Power Co., Inc. | | 100,800 | | $ | 3,168,144 |
| CMS Energy Corp. | | 233,627 | | | 3,132,938 |
| Dominion Resources, Inc. | | 35,160 | | | 1,163,093 |
| FirstEnergy Corp. | | 9,580 | | | 432,345 |
| NRG Energy, Inc. (a) | | 81,240 | | | 2,181,294 |
| PG&E Corp. | | 76,400 | | | 3,101,076 |
| PPL Corp. | | 107,250 | | | 3,153,150 |
| Progress Energy, Inc. | | 93,170 | | | 3,683,010 |
| Public Service Enterprise Group, Inc. | | 98,050 | | | 3,105,243 |
| Wisconsin Energy Corp. | | 68,060 | | | 3,094,688 |
| | | | | |
| | | | | $ | 26,214,981 |
| Total Common Stocks (Identified Cost, $780,990,354) | | | | $ | 760,455,021 |
| | | | | | | | | | |
| | | | |
| | | Strike Price | | First Exercise | | | | |
| | | | | | | | | | |
| Warrants - 0.1% | | | | | | | | | | |
| Medical Equipment - 0.1% | | | | | | | | | | |
| NxStage Medical, Inc. (1 share for 1 warrant) (Identified Cost, $187,933) (a)(z) | | $ | 5.50 | | 5/23/08 | | 68,480 | | $ | 286,757 |
| | | | | |
| | |
| Money Market Funds (v) - 0.3% | | | | | |
MFS Institutional Money Market Portfolio, 0.2%,
at Cost and Net Asset Value | | 2,482,922 | | $ | 2,482,922 |
| Total Investments (Identified Cost, $783,661,209) | | | | $ | 763,224,700 |
| | |
| Other Assets, Less Liabilities - 0.3% | | | | | 2,305,160 |
| Net Assets - 100.0% | | | | $ | 765,529,860 |
| (a) | Non-income producing security. |
| (s) | Security or a portion of the security was pledged to cover collateral requirements for securities sold short and written options. At August 31, 2009, the value of securities pledged amounted to $163,040. At August 31, 2009, the fund had no short sales outstanding. |
18
Portfolio of Investments – continued
| (v) | Underlying fund that is available only to investment companies managed by MFS. The rate quoted is the annualized seven-day yield of the fund at period end. |
| (z) | Restricted securities are not registered under the Securities Act of 1933 and are subject to legal restrictions on resale. These securities generally may be resold in transactions exempt from registration or to the public if the securities are subsequently registered. Disposal of these securities may involve time-consuming negotiations and prompt sale at an acceptable price may be difficult. The fund holds the following restricted securities: |
| | | | | | |
| Restricted Securities | | Acquisition
Date | | Cost | | Current
Market
Value |
| Euro Dekania Ltd. | | 3/08/07-6/25/07 | | $8,173,430 | | $1,218,717 |
| NxStage Medical, Inc. | | 5/22/08 | | 1,352,874 | | 2,116,032 |
| NxStage Medical, Inc. (Warrants) | | 5/22/08 | | 187,933 | | 286,757 |
| Total Restricted Securities | | | | | | $3,621,506 |
| % of Net Assets | | | | | | 0.5% |
The following abbreviations are used in this report and are defined:
| ADR | | American Depository Receipt |
| REIT | | Real Estate Investment Trust |
See Notes to Financial Statements
19
Financial Statements
STATEMENT OF ASSETS AND LIABILITIES
At 8/31/09
This statement represents your fund’s balance sheet, which details the assets and liabilities comprising the total value of the fund.
| | | |
| Assets | | | |
Investments- | | | |
Non-affiliated issuers, at value (identified cost, $781,178,287) | | $760,741,778 | |
Underlying funds, at cost and value | | 2,482,922 | |
Total investments, at value (identified cost, $783,661,209) | | $763,224,700 | |
Receivables for | | | |
Investments sold | | 7,421,951 | |
Fund shares sold | | 414,430 | |
Interest and dividends | | 1,490,125 | |
Other assets | | 2,175 | |
Total assets | | $772,553,381 | |
| Liabilities | | | |
Payables for | | | |
Investments purchased | | $4,448,215 | |
Fund shares reacquired | | 1,736,164 | |
Payable to affiliates | | | |
Investment adviser | | 190,350 | |
Shareholder servicing costs | | 276,215 | |
Distribution and service fees | | 33,406 | |
Administrative services fee | | 1,581 | |
Payable for independent Trustees’ compensation | | 136,579 | |
Accrued expenses and other liabilities | | 201,011 | |
Total liabilities | | $7,023,521 | |
Net assets | | $765,529,860 | |
| Net assets consist of | | | |
Paid-in capital | | $1,168,257,648 | |
Unrealized appreciation (depreciation) on investments and translation of assets and liabilities in foreign currencies | | (20,411,409 | ) |
Accumulated net realized gain (loss) on investments and foreign currency transactions | | (387,764,275 | ) |
Undistributed net investment income | | 5,447,896 | |
Net assets | | $765,529,860 | |
Shares of beneficial interest outstanding | | 56,064,170 | |
| | | | | | |
| | | Net assets | | Shares
outstanding | | Net asset value
per share (a) |
Class A | | $559,571,557 | | 40,329,735 | | $13.87 |
Class B | | 79,607,532 | | 6,217,893 | | 12.80 |
Class C | | 63,993,281 | | 5,019,356 | | 12.75 |
Class I | | 15,765,757 | | 1,092,606 | | 14.43 |
Class R1 | | 3,734,866 | | 292,850 | | 12.75 |
Class R2 | | 15,483,104 | | 1,136,772 | | 13.62 |
Class R3 | | 25,741,098 | | 1,858,195 | | 13.85 |
Class R4 | | 1,632,665 | | 116,763 | | 13.98 |
On sales of $50,000 or more, the offering price of Class A shares is reduced. A contingent deferred sales charge may be imposed on redemptions of Class A, Class B, and Class C shares.
| (a) | Maximum offering price and redemption price per share were equal to the net asset value per share for all share classes, except for Class A, for which the maximum offering price per share was $14.72. |
See Notes to Financial Statements
20
Financial Statements
STATEMENT OF OPERATIONS
Year ended 8/31/09
This statement describes how much your fund earned in investment income and accrued in expenses. It also describes any gains and/or losses generated by fund operations.
| | | | | | |
| Net investment income | | | | | | |
Income | | | | | | |
Dividends | | $14,506,251 | | | | |
Interest | | 92,658 | | | | |
Dividends from underlying funds | | 11,304 | | | | |
Foreign taxes withheld | | (140,070 | ) | | | |
Total investment income | | | | | $14,470,143 | |
Expenses | | | | | | |
Management fee | | $4,027,792 | | | | |
Distribution and service fees | | 2,879,162 | | | | |
Shareholder servicing costs | | 2,172,270 | | | | |
Administrative services fee | | 132,121 | | | | |
Independent Trustees’ compensation | | 8,147 | | | | |
Custodian fee | | 144,770 | | | | |
Shareholder communications | | 96,886 | | | | |
Auditing fees | | 53,368 | | | | |
Legal fees | | 40,515 | | | | |
Dividend and interest expense on securities sold short | | 5,067 | | | | |
Miscellaneous | | 163,141 | | | | |
Total expenses | | | | | $9,723,239 | |
Fees paid indirectly | | (1,322 | ) | | | |
Reduction of expenses by investment adviser | | (990,136 | ) | | | |
Net expenses | | | | | $8,731,781 | |
Net investment income | | | | | $5,738,362 | |
Realized and unrealized gain (loss) on investments and
foreign currency transactions | | | | | | |
Realized gain (loss) (identified cost basis) | | | | | | |
Investment transactions (s) | | $(223,831,932 | ) | | | |
Written option transactions | | 84 | | | | |
Securities sold short | | (142,454 | ) | | | |
Foreign currency transactions | | (9,208 | ) | | | |
Net realized gain (loss) on investments
and foreign currency transactions | | | | | $(223,983,510 | ) |
Change in unrealized appreciation (depreciation) | | | | | | |
Investments | | $43,194,385 | | | | |
Translation of assets and liabilities in foreign currencies | | 10,811 | | | | |
Net unrealized gain (loss) on investments
and foreign currency translation | | | | | $43,205,196 | |
Net realized and unrealized gain (loss) on investments
and foreign currency | | | | | $(180,778,314 | ) |
Change in net assets from operations | | | | | $(175,039,952 | ) |
| (s) | Includes proceeds received from a non-recurring cash settlement in the amount of $14,093,465 from a litigation settlement against Enron Corp. |
See Notes to Financial Statements
21
Financial Statements
STATEMENTS OF CHANGES IN NET ASSETS
These statements describe the increases and/or decreases in net assets resulting from operations, any distributions, and any shareholder transactions.
| | | | | | |
| | | Years ended 8/31 | |
| | | 2009 | | | 2008 | |
| Change in net assets | | | | | | |
| From operations | | | | | | |
Net investment income | | $5,738,362 | | | $3,621,403 | |
Net realized gain (loss) on investments and
foreign currency transactions | | (223,983,510 | ) | | (24,127,504 | ) |
Net unrealized gain (loss) on investments and
foreign currency translation | | 43,205,196 | | | (83,770,828 | ) |
Change in net assets from operations | | $(175,039,952 | ) | | $(104,276,929 | ) |
| Distributions declared to shareholders | | | | | | |
From net investment income | | $(3,543,509 | ) | | $— | |
From net realized gain on investments | | — | | | (92,445,687 | ) |
Total distributions declared to shareholders | | $(3,543,509 | ) | | $(92,445,687 | ) |
Change in net assets from fund share transactions | | $(13,414,881 | ) | | $(124,491,190 | ) |
Total change in net assets | | $(191,998,342 | ) | | $(321,213,806 | ) |
| Net assets | | | | | | |
At beginning of period | | 957,528,202 | | | 1,278,742,008 | |
At end of period (including undistributed net investment
income of $5,447,896 and $3,311,334, respectively) | | $765,529,860 | | | $957,528,202 | |
See Notes to Financial Statements
22
Financial Statements
FINANCIAL HIGHLIGHTS
The financial highlights table is intended to help you understand the fund’s financial performance for the past 5 years (or life of a particular share class, if shorter). Certain information reflects financial results for a single fund share. The total returns in the table represent the rate by which an investor would have earned (or lost) on an investment in the fund share class (assuming reinvestment of all distributions) held for the entire period.
| | | | | | | | | | | | | | |
| Class A | | Years ended 8/31 |
| | | 2009 | | | 2008 | | | 2007 | | | 2006 | | | 2005 |
Net asset value, beginning of period | | $16.75 | | | $19.83 | | | $18.17 | | | $17.88 | | | $15.35 |
| Income (loss) from investment operations | | | | | | | | | | | | | | |
Net investment income (d) | | $0.12 | | | $0.09 | | | $0.04 | | | $0.03 | | | $0.03 |
Net realized and unrealized gain (loss)
on investments and foreign currency | | (2.92 | ) | | (1.71 | ) | | 3.01 | | | 1.06 | | | 2.50 |
Total from investment operations | | $(2.80 | ) | | $(1.62 | ) | | $3.05 | | | $1.09 | | | $2.53 |
| Less distributions declared to shareholders | | | | | | | | | | | | | | |
From net investment income | | $(0.08 | ) | | $— | | | $— | | | $— | | | $— |
From net realized gain on investments | | — | | | (1.46 | ) | | (1.39 | ) | | (0.80 | ) | | — |
Total distributions declared to shareholders | | $(0.08 | ) | | $(1.46 | ) | | $(1.39 | ) | | $(0.80 | ) | | $— |
Net asset value, end of period | | $13.87 | | | $16.75 | | | $19.83 | | | $18.17 | | | $17.88 |
Total return (%) (r)(s)(t) | | (16.55 | ) | | (8.94 | ) | | 17.26 | | | 6.25 | | | 16.48 |
Ratios (%) (to average net assets)
and Supplemental data: | | | | | | | | | | | | | | |
Expenses before expense reductions (f) | | 1.36 | | | 1.24 | | | 1.26 | | | 1.37 | | | 1.41 |
Expenses after expense reductions (f) | | 1.21 | | | 1.21 | | | 1.26 | | | 1.36 | | | 1.41 |
Expenses after expense reductions excluding short sale dividend and interest expense (f) | | 1.21 | | | N/A | | | N/A | | | N/A | | | N/A |
Net investment income | | 1.03 | | | 0.52 | | | 0.22 | | | 0.15 | | | 0.17 |
Portfolio turnover | | 109 | | | 86 | | | 283 | | | 138 | | | 81 |
Net assets at end of period (000 Omitted) | | $559,572 | | | $650,476 | | | $766,202 | | | $146,355 | | | $141,808 |
See Notes to Financial Statements
23
Financial Highlights – continued
| | | | | | | | | | | | | | | |
| Class B | | Years ended 8/31 | |
| | | 2009 | | | 2008 | | | 2007 | | | 2006 | | | 2005 | |
Net asset value, beginning of period | | $15.45 | | | $18.52 | | | $17.16 | | | $17.03 | | | $14.71 | |
| Income (loss) from investment operations | | | | | | | | | | | | | | | |
Net investment income (loss) (d) | | $0.05 | | | $(0.02 | ) | | $(0.08 | ) | | $(0.09 | ) | | $(0.08 | ) |
Net realized and unrealized gain (loss)
on investments and foreign currency | | (2.70 | ) | | (1.59 | ) | | 2.83 | | | 1.02 | | | 2.40 | |
Total from investment operations | | $(2.65 | ) | | $(1.61 | ) | | $2.75 | | | $0.93 | | | $2.32 | |
| Less distributions declared to shareholders | | | | | | | | | | | | | | | |
From net realized gain on investments | | $— | | | $(1.46 | ) | | $(1.39 | ) | | $(0.80 | ) | | $— | |
Net asset value, end of period | | $12.80 | | | $15.45 | | | $18.52 | | | $17.16 | | | $17.03 | |
Total return (%) (r)(s)(t) | | (17.15 | ) | | (9.55 | ) | | 16.49 | | | 5.60 | | | 15.77 | |
Ratios (%) (to average net assets)
and Supplemental data: | | | | | | | | | | | | | | | |
Expenses before expense reductions (f) | | 2.07 | | | 1.88 | | | 1.90 | | | 2.02 | | | 2.06 | |
Expenses after expense reductions (f) | | 1.90 | | | 1.86 | | | 1.90 | | | 2.02 | | | 2.06 | |
Expenses after expense reductions excluding short sale dividend and interest expense (f) | | 1.90 | | | N/A | | | N/A | | | N/A | | | N/A | |
Net investment income (loss) | | 0.42 | | | (0.14 | ) | | (0.46 | ) | | (0.50 | ) | | (0.47 | ) |
Portfolio turnover | | 109 | | | 86 | | | 283 | | | 138 | | | 81 | |
Net assets at end of period (000 Omitted) | | $79,608 | | | $162,122 | | | $325,525 | | | $49,192 | | | $71,088 | |
See Notes to Financial Statements
24
Financial Highlights – continued
| | | | | | | | | | | | | | | |
| Class C | | Years ended 8/31 | |
| | | 2009 | | | 2008 | | | 2007 | | | 2006 | | | 2005 | |
Net asset value, beginning of period | | $15.38 | | | $18.44 | | | $17.09 | | | $16.97 | | | $14.66 | |
| Income (loss) from investment operations | | | | | | | | | | | | | | | |
Net investment income (loss) (d) | | $0.04 | | | $(0.02 | ) | | $(0.08 | ) | | $(0.09 | ) | | $(0.08 | ) |
Net realized and unrealized gain (loss)
on investments and foreign currency | | (2.67 | ) | | (1.58 | ) | | 2.82 | | | 1.01 | | | 2.39 | |
Total from investment operations | | $(2.63 | ) | | $(1.60 | ) | | $2.74 | | | $0.92 | | | $2.31 | |
| Less distributions declared to shareholders | | | | | | | | | | | | | | | |
From net realized gain on investments | | $— | | | $(1.46 | ) | | $(1.39 | ) | | $(0.80 | ) | | $— | |
Net asset value, end of period | | $12.75 | | | $15.38 | | | $18.44 | | | $17.09 | | | $16.97 | |
Total return (%) (r)(s)(t) | | (17.10 | ) | | (9.54 | ) | | 16.50 | | | 5.56 | | | 15.76 | |
| Ratios (%) (to average net assets) and Supplemental data: | | | | | | | | | | | | | | | |
Expenses before expense reductions (f) | | 2.06 | | | 1.89 | | | 1.90 | | | 2.02 | | | 2.06 | |
Expenses after expense reductions (f) | | 1.91 | | | 1.86 | | | 1.90 | | | 2.02 | | | 2.06 | |
Expenses after expense reductions excluding short sale dividend and interest expense (f) | | 1.91 | | | N/A | | | N/A | | | N/A | | | N/A | |
Net investment income (loss) | | 0.34 | | | (0.14 | ) | | (0.45 | ) | | (0.50 | ) | | (0.48 | ) |
Portfolio turnover | | 109 | | | 86 | | | 283 | | | 138 | | | 81 | |
Net assets at end of period (000 Omitted) | | $63,993 | | | $79,213 | | | $107,948 | | | $16,613 | | | $17,898 | |
See Notes to Financial Statements
25
Financial Highlights – continued
| | | | | | | | | | | | | | |
| Class I | | Years ended 8/31 |
| | | 2009 | | | 2008 | | | 2007 | | | 2006 | | | 2005 |
Net asset value, beginning of period | | $17.47 | | | $20.54 | | | $18.72 | | | $18.33 | | | $15.68 |
| Income (loss) from investment operations | | | | | | | | | | | | | | |
Net investment income (d) | | $0.17 | | | $0.17 | | | $0.11 | | | $0.09 | | | $0.09 |
Net realized and unrealized gain (loss)
on investments and foreign currency | | (3.06 | ) | | (1.78 | ) | | 3.10 | | | 1.10 | | | 2.56 |
Total from investment operations | | $(2.89 | ) | | $(1.61 | ) | | $3.21 | | | $1.19 | | | $2.65 |
| Less distributions declared to shareholders | | | | | | | | | | | | | | |
From net investment income | | $(0.15 | ) | | $— | | | $— | | | $— | | | $— |
From net realized gain on investments | | — | | | (1.46 | ) | | (1.39 | ) | | (0.80 | ) | | — |
Total distributions declared to shareholders | | $(0.15 | ) | | $(1.46 | ) | | $(1.39 | ) | | $(0.80 | ) | | $— |
Net asset value, end of period | | $14.43 | | | $17.47 | | | $20.54 | | | $18.72 | | | $18.33 |
Total return (%) (r)(s) | | (16.29 | ) | | (8.56 | ) | | 17.63 | | | 6.66 | | | 16.90 |
Ratios (%) (to average net assets)
and Supplemental data: | | | | | | | | | | | | | | |
Expenses before expense reductions (f) | | 1.06 | | | 0.89 | | | 0.92 | | | 1.01 | | | 1.09 |
Expenses after expense reductions (f) | | 0.91 | | | 0.86 | | | 0.92 | | | 1.01 | | | 1.09 |
Expenses after expense reductions excluding short sale dividend and interest expense (f) | | 0.91 | | | N/A | | | N/A | | | N/A | | | N/A |
Net investment income | | 1.32 | | | 0.88 | | | 0.58 | | | 0.50 | | | 0.51 |
Portfolio turnover | | 109 | | | 86 | | | 283 | | | 138 | | | 81 |
Net assets at end of period (000 Omitted) | | $15,766 | | | $17,269 | | | $27,544 | | | $4,763 | | | $3,170 |
See Notes to Financial Statements
26
Financial Highlights – continued
| | | | | | | | | | | | | | | |
| Class R1 | | Years ended 8/31 | |
| | | 2009 | | | 2008 | | | 2007 | | | 2006 | | | 2005 (i) | |
Net asset value, beginning of period | | $15.39 | | | $18.45 | | | $17.11 | | | $17.01 | | | $16.25 | |
| Income (loss) from investment operations | | | | | | | | | | | | | | | |
Net investment income (loss) (d) | | $0.04 | | | $(0.03 | ) | | $(0.09 | ) | | $(0.10 | ) | | $(0.04 | ) |
Net realized and unrealized gain (loss)
on investments and foreign currency | | (2.68 | ) | | (1.57 | ) | | 2.82 | | | 1.00 | | | 0.80 | (g) |
Total from investment operations | | $(2.64 | ) | | $(1.60 | ) | | $2.73 | | | $0.90 | | | $0.76 | |
| Less distributions declared to shareholders | | | | | | | | | | | | | | | |
From net realized gain on investments | | $— | | | $(1.46 | ) | | $(1.39 | ) | | $(0.80 | ) | | $— | |
Net asset value, end of period | | $12.75 | | | $15.39 | | | $18.45 | | | $17.11 | | | $17.01 | |
Total return (%) (r)(s) | | (17.15 | ) | | (9.53 | ) | | 16.42 | | | 5.43 | | | 4.68 | (n) |
| Ratios (%) (to average net assets) and Supplemental data: | | | | | | | | | | | | | | | |
Expenses before expense reductions (f) | | 2.06 | | | 1.95 | | | 2.05 | | | 2.20 | | | 2.23 | (a) |
Expenses after expense reductions (f) | | 1.91 | | | 1.91 | | | 2.02 | | | 2.11 | | | 2.23 | (a) |
Expenses after expense reductions excluding short sale dividend and interest expense (f) | | 1.91 | | | N/A | | | N/A | | | N/A | | | N/A | |
Net investment income (loss) | | 0.32 | | | (0.18 | ) | | (0.51 | ) | | (0.61 | ) | | (0.63 | )(a) |
Portfolio turnover | | 109 | | | 86 | | | 283 | | | 138 | | | 81 | |
Net assets at end of period (000 Omitted) | | $3,735 | | | $3,663 | | | $2,543 | | | $441 | | | $55 | |
See Notes to Financial Statements
27
Financial Highlights – continued
| | | | | | | | | | | | | | | |
| Class R2 | | Years ended 8/31 | |
| | | 2009 | | | 2008 | | | 2007 | | | 2006 | | | 2005 | |
Net asset value, beginning of period | | $16.45 | | | $19.53 | | | $17.97 | | | $17.74 | | | $15.29 | |
| Income (loss) from investment operations | | | | | | | | | | | | | | | |
Net investment income (loss) (d) | | $0.10 | | | $0.06 | | | $(0.01 | ) | | $(0.03 | ) | | $(0.04 | ) |
Net realized and unrealized gain (loss)
on investments and foreign currency | | (2.87 | ) | | (1.68 | ) | | 2.96 | | | 1.06 | | | 2.49 | |
Total from investment operations | | $(2.77 | ) | | $(1.62 | ) | | $2.95 | | | $1.03 | | | $2.45 | |
| Less distributions declared to shareholders | | | | | | | | | | | | | | | |
From net investment income | | $(0.06 | ) | | $— | | | $— | | | $— | | | $— | |
From net realized gain on investments | | — | | | (1.46 | ) | | (1.39 | ) | | (0.80 | ) | | — | |
Total distributions declared to shareholders | | $(0.06 | ) | | $(1.46 | ) | | $(1.39 | ) | | $(0.80 | ) | | $— | |
Net asset value, end of period | | $13.62 | | | $16.45 | | | $19.53 | | | $17.97 | | | $17.74 | |
Total return (%) (r)(s) | | (16.71 | ) | | (9.08 | ) | | 16.88 | | | 5.96 | | | 16.02 | |
Ratios (%) (to average net assets)
and Supplemental data: | | | | | | | | | | | | | | | |
Expenses before expense reductions (f) | | 1.56 | | | 1.45 | | | 1.61 | | | 1.77 | | | 1.81 | |
Expenses after expense reductions (f) | | 1.41 | | | 1.41 | | | 1.58 | | | 1.67 | | | 1.81 | |
Expenses after expense reductions excluding short sale dividend and interest expense (f) | | 1.41 | | | N/A | | | N/A | | | N/A | | | N/A | |
Net investment income (loss) | | 0.82 | | | 0.34 | | | (0.05 | ) | | (0.15 | ) | | (0.22 | ) |
Portfolio turnover | | 109 | | | 86 | | | 283 | | | 138 | | | 81 | |
Net assets at end of period (000 Omitted) | | $15,483 | | | $16,539 | | | $9,492 | | | $1,193 | | | $948 | |
See Notes to Financial Statements
28
Financial Highlights – continued
| | | | | | | | | | | | | | | |
| Class R3 | | Years ended 8/31 | |
| | | 2009 | | | 2008 | | | 2007 | | | 2006 | | | 2005 (i) | |
Net asset value, beginning of period | | $16.73 | | | $19.80 | | | $18.15 | | | $17.88 | | | $17.02 | |
| Income (loss) from investment operations | | | | | | | | | | | | | | | |
Net investment income (d) | | $0.13 | | | $0.10 | | | $0.05 | | | $0.05 | | | $0.01 | |
Net realized and unrealized gain (loss)
on investments and foreign currency | | (2.91 | ) | | (1.71 | ) | | 2.99 | | | 1.02 | | | 0.85 | (g) |
Total from investment operations | | $(2.78 | ) | | $(1.61 | ) | | $3.04 | | | $1.07 | | | $0.86 | |
| Less distributions declared to shareholders | | | | | | | | | | | | | | | |
From net investment income | | $(0.10 | ) | | $— | | | $— | | | $— | | | $— | |
From net realized gain on investments | | — | | | (1.46 | ) | | (1.39 | ) | | (0.80 | ) | | — | |
Total distributions declared to shareholders | | $(0.10 | ) | | $(1.46 | ) | | $(1.39 | ) | | $(0.80 | ) | | $— | |
Net asset value, end of period | | $13.85 | | | $16.73 | | | $19.80 | | | $18.15 | | | $17.88 | |
Total return (%) (r)(s) | | (16.48 | ) | | (8.90 | ) | | 17.22 | | | 6.14 | | | 5.05 | (n) |
Ratios (%) (to average net assets)
and Supplemental data: | | | | | | | | | | | | | | | |
Expenses before expense reductions (f) | | 1.32 | | | 1.19 | | | 1.36 | | | 1.37 | | | 1.43 | (a) |
Expenses after expense reductions (f) | | 1.16 | | | 1.17 | | | 1.36 | | | 1.37 | | | 1.43 | (a) |
Expenses after expense reductions excluding short sale dividend and interest expense (f) | | 1.16 | | | N/A | | | N/A | | | N/A | | | N/A | |
Net investment income | | 1.07 | | | 0.57 | | | 0.24 | | | 0.27 | | | 0.17 | (a) |
Portfolio turnover | | 109 | | | 86 | | | 283 | | | 138 | | | 81 | |
Net assets at end of period (000 Omitted) | | $25,741 | | | $28,185 | | | $31,963 | | | $22,646 | | | $53 | |
See Notes to Financial Statements
29
Financial Highlights – continued
| | | | | | | | | | | | | | | |
| Class R4 | | Years ended 8/31 | |
| | | 2009 | | | 2008 | | | 2007 | | | 2006 | | | 2005 (i) | |
Net asset value, beginning of period | | $16.92 | | | $19.96 | | | $18.24 | | | $17.90 | | | $17.02 | |
| Income (loss) from investment operations | | | | | | | | | | | | | | | |
Net investment income (d) | | $0.10 | | | $0.15 | | | $0.11 | | | $0.07 | | | $0.03 | |
Net realized and unrealized gain (loss)
on investments and foreign currency | | (2.90 | ) | | (1.73 | ) | | 3.00 | | | 1.07 | | | 0.85 | (g) |
Total from investment operations | | $(2.80 | ) | | $(1.58 | ) | | $3.11 | | | $1.14 | | | $0.88 | |
| Less distributions declared to shareholders | | | | | | | | | | | | | | | |
From net investment income | | $(0.14 | ) | | $— | | | $— | | | $— | | | $— | |
From net realized gain on investments | | — | | | (1.46 | ) | | (1.39 | ) | | (0.80 | ) | | — | |
Total distributions declared to shareholders | | $(0.14 | ) | | $(1.46 | ) | | $(1.39 | ) | | $(0.80 | ) | | $— | |
Net asset value, end of period | | $13.98 | | | $16.92 | | | $19.96 | | | $18.24 | | | $17.90 | |
Total return (%) (r)(s) | | (16.28 | ) | | (8.67 | ) | | 17.54 | | | 6.54 | | | 5.17 | (n) |
Ratios (%) (to average net assets)
and Supplemental data: | | | | | | | | | | | | | | | |
Expenses before expense reductions (f) | | 0.96 | | | 0.92 | | | 1.06 | | | 1.12 | | | 1.13 | (a) |
Expenses after expense reductions (f) | | 0.95 | | | 0.90 | | | 1.06 | | | 1.12 | | | 1.13 | (a) |
Expenses after expense reductions excluding
short sale dividend and interest expense (f) | | 0.95 | | | N/A | | | N/A | | | N/A | | | N/A | |
Net investment income | | 0.75 | | | 0.83 | | | 0.55 | | | 0.40 | | | 0.47 | (a) |
Portfolio turnover | | 109 | | | 86 | | | 283 | | | 138 | | | 81 | |
Net assets at end of period (000 Omitted) | | $1,633 | | | $60 | | | $66 | | | $56 | | | $53 | |
Any redemption fees charged by the fund during the 2005 fiscal year resulted in a per share impact of less than $0.01.
| (d) | Per share data is based on average shares outstanding. |
| (f) | Ratios do not reflect reductions from fees paid indirectly, if applicable. |
| (g) | The per share amount varies from the net realized and unrealized gain/loss for the period because of the timing of sales of fund shares and the per share amount of realized and unrealized gains and losses at such time. |
| (i) | For the period from the class’ inception, April 1, 2005 (Classes R1, R3, and R4) through the stated period end. |
| (r) | Certain expenses have been reduced without which performance would have been lower. |
| (s) | From time to time the fund may receive proceeds from litigation settlements, without which performance would be lower. Excluding the effect of the proceeds received from a non-recurring litigation settlement against Enron Corp., the Class A, Class B, Class C, Class I, Class R1, Class R2, Class R3, and Class R4 total returns for the year ended August 31, 2009 would have been lower by approximately 2.41%, 2.40%, 2.42%, 2.40%, 2.40%, 2.36%, 2.40% and 2.40%, respectively. |
| (t) | Total returns do not include any applicable sales charges. |
See Notes to Financial Statements
30
NOTES TO FINANCIAL STATEMENTS
| (1) | | Business and Organization |
MFS Core Equity Fund (the fund) is a series of MFS Series Trust I (the trust). The trust is organized as a Massachusetts business trust and is registered under the Investment Company Act of 1940, as amended, as an open-end management investment company.
| (2) | | Significant Accounting Policies |
General – The preparation of financial statements in conformity with U.S. generally accepted accounting principles requires management to make estimates and assumptions that affect the reported amounts of assets and liabilities, and disclosure of contingent assets and liabilities at the date of the financial statements and the reported amounts of revenues and expenses during the reporting period. In making these estimates and assumptions, management has considered the effects, if any, of events occurring after the date of the fund’s Statement of Assets and Liabilities through October 16, 2009 which is the date that the financial statements were issued. Actual results could differ from those estimates. The fund can invest in foreign securities, including securities of emerging market issuers. Investments in foreign securities are vulnerable to the effects of changes in the relative values of the local currency and the U.S. dollar and to the effects of changes in each country’s legal, political, and economic environment. The markets of emerging markets countries are generally more volatile than the markets of developed countries with more mature economies. All of the risks of investing in foreign securities previously described are heightened when investing in emerging markets countries.
Investment Valuations – Equity securities, including restricted equity securities, are generally valued at the last sale or official closing price as provided by a third-party pricing service on the market or exchange on which they are primarily traded. For securities for which there were no sales reported that day, equity securities are generally valued at the last quoted daily bid quotation as provided by a third-party pricing service on the market or exchange on which such securities are primarily traded. For securities held short for which there were no sales reported for that day, the position is generally valued at the last quoted daily ask quotation as provided by a third-party pricing service on the market or exchange on which such securities are primarily traded. Short-term instruments with a maturity at issuance of 60 days or less generally are valued at amortized cost, which approximates market value. Exchange-traded options are generally valued at the last sale or official closing price as provided by a third-party pricing service on the exchange on which such options are primarily traded. Exchange-traded options for which
31
Notes to Financial Statements – continued
there were no sales reported that day are generally valued at the last daily bid quotation as provided by a third-party pricing service on the exchange on which such options are primarily traded. Options not traded on an exchange are generally valued at a broker/dealer bid quotation. Foreign currency options are generally valued using an external pricing model that uses market data from a third-party source. Open-end investment companies are generally valued at net asset value per share. Securities and other assets generally valued on the basis of information from a third-party pricing service may also be valued at a broker/dealer bid quotation. Values obtained from third-party pricing services can utilize both transaction data and market information such as yield, quality, coupon rate, maturity, type of issue, trading characteristics, and other market data. The values of foreign securities and other assets and liabilities expressed in foreign currencies are converted to U.S. dollars using the mean of bid and asked prices for rates provided by a third-party pricing service.
The Board of Trustees has delegated primary responsibility for determining or causing to be determined the value of the fund’s investments (including any fair valuation) to the adviser pursuant to valuation policies and procedures approved by the Board. If the adviser determines that reliable market quotations are not readily available, investments are valued at fair value as determined in good faith by the adviser in accordance with such procedures under the oversight of the Board of Trustees. Under the fund’s valuation policies and procedures, market quotations are not considered to be readily available for most types of debt instruments and floating rate loans and many types of derivatives. These investments are generally valued at fair value based on information from third-party pricing services. In addition, investments may be valued at fair value if the adviser determines that an investment’s value has been materially affected by events occurring after the close of the exchange or market on which the investment is principally traded (such as foreign exchange or market) and prior to the determination of the fund’s net asset value, or after the halting of trading of a specific security where trading does not resume prior to the close of the exchange or market on which the security is principally traded. Events that occur on a frequent basis after foreign markets close (such as developments in foreign markets and significant movements in the U.S. markets) and prior to the determination of the fund’s net asset value may be deemed to have a material affect on the value of securities traded in foreign markets. Accordingly, the fund’s foreign equity securities may often be valued at fair value. The adviser generally relies on third-party pricing services or other information (such as the correlation with price movements of similar securities in the same or other markets; the type, cost and investment characteristics of the security; the business and financial condition of the issuer; and trading and other market data) to assist in
32
Notes to Financial Statements – continued
determining whether to fair value and at what value to fair value an investment. The value of an investment for purposes of calculating the fund’s net asset value can differ depending on the source and method used to determine value. When fair valuation is used, the value of an investment used to determine the fund’s net asset value may differ from quoted or published prices for the same investment. There can be no assurance that the fund could obtain the fair value assigned to an investment if it were to sell the investment at the same time at which the fund determines its net asset value per share.
The fund adopted FASB Statement No. 157, Fair Value Measurements (the “Statement”). This Statement provides a single definition of fair value, a hierarchy for measuring fair value and expanded disclosures about fair value measurements.
Various inputs are used in determining the value of the fund’s assets or liabilities carried at market value. These inputs are categorized into three broad levels. In certain cases, the inputs used to measure fair value may fall into different levels of the fair value hierarchy. In such cases, an investment’s level within the fair value hierarchy is based on the lowest level of input that is significant to the fair value measurement. The fund’s assessment of the significance of a particular input to the fair value measurement in its entirety requires judgment, and considers factors specific to the investment. Level 1 includes unadjusted quoted prices in active markets for identical assets or liabilities. Level 2 includes other significant observable market-based inputs (including quoted prices for similar securities, interest rates, prepayment speed, and credit risk). Level 3 includes unobservable inputs, which may include the adviser’s own assumptions in determining the fair value of investments. Other financial instruments are derivative instruments not reflected in total investments, such as futures, forwards, swap contracts, and written options. The following is a summary of the levels used as of August 31, 2009 in valuing the fund’s assets or liabilities carried at market value:
| | | | | | | | |
| Investments at Value | | Level 1 | | Level 2 | | Level 3 | | Total |
| Equity Securities: | | | | | | | | |
United States | | $728,666,967 | | $2,402,789 | | $— | | $731,069,756 |
Canada | | 17,982,977 | | — | | — | | 17,982,977 |
Israel | | 6,223,892 | | — | | — | | 6,223,892 |
United Kingdom | | 2,110,976 | | — | | 1,218,717 | | 3,329,693 |
Hong Kong | | 1,343,083 | | — | | — | | 1,343,083 |
Panama | | 792,377 | | — | | — | | 792,377 |
| Mutual Funds | | 2,482,922 | | — | | — | | 2,482,922 |
| Total Investments | | $759,603,194 | | $2,402,789 | | $1,218,717 | | $763,224,700 |
For further information regarding security characteristics, see the Portfolio of Investments.
33
Notes to Financial Statements – continued
Following is a reconciliation of Level 3 assets for which significant unobservable inputs were used to determine fair value. The table presents the activity of Level 3 securities held at the beginning and the end of the period.
| | | |
| | | Equity Securities | |
| Balance as of 8/31/08 | | $3,519,098 | |
Accrued discounts/premiums | | — | |
Realized gain (loss) | | — | |
Change in unrealized appreciation (depreciation) | | (3,458,450 | ) |
Net purchases (sales) | | — | |
Acquired in connection with merger (See note 8) | | 1,158,069 | |
Transfers in and/or out of Level 3 | | — | |
| Balance as of 8/31/09 | | $1,218,717 | |
Repurchase Agreements – The fund may enter into repurchase agreements with approved counterparties. Each repurchase agreement is recorded at cost. The fund requires that the securities collateral in a repurchase transaction be transferred to a custodian. The fund monitors, on a daily basis, the value of the collateral to ensure that its value, including accrued interest, is greater than amounts owed to the fund under each such repurchase agreement. The fund and other funds managed by MFS may utilize a joint trading account for the purpose of entering into one or more repurchase agreements.
Foreign Currency Translation – Purchases and sales of foreign investments, income, and expenses are converted into U.S. dollars based upon currency exchange rates prevailing on the respective dates of such transactions or on the reporting date for foreign denominated receivables and payables. Gains and losses attributable to foreign currency exchange rates on sales of securities are recorded for financial statement purposes as net realized gains and losses on investments. Gains and losses attributable to foreign exchange rate movements on receivables, payables, income and expenses are recorded for financial statement purposes as foreign currency transaction gains and losses. That portion of both realized and unrealized gains and losses on investments that results from fluctuations in foreign currency exchange rates is not separately disclosed.
Derivatives – The fund may use derivatives for different purposes, including to earn income and enhance returns, to increase or decrease exposure to a particular market, to manage or adjust the risk profile of the fund, or as alternatives to direct investments. Derivatives may be used for hedging or non-hedging purposes. While hedging can reduce or eliminate losses, it can also reduce or eliminate gains. When the fund uses derivatives as an investment to increase market exposure, or for hedging purposes, gains and losses from derivative instruments may be substantially greater than the derivative’s original cost.
34
Notes to Financial Statements – continued
In this reporting period the fund adopted FASB Statement No. 161, Disclosure about Derivative Instruments and Hedging Activities (“FAS 161”), and FASB Staff Position FAS No. 133-1 and FIN 45-4, Disclosures about Credit Derivatives and Certain Guarantees: An Amendment of FASB Statement No. 133 and FASB Interpretation No. 45; and Clarification of the Effective Date of FAS 161 (“FSP FAS 133-1”).
FAS 161 amends FASB Statement No. 133, Accounting for Derivatives and Hedging Activities (“FAS 133”). FAS 161 provides enhanced disclosures about the fund’s use of and accounting for derivative instruments and the effect of derivative instruments on the fund’s results of operations and financial position. Under FAS 161, tabular disclosure regarding derivative fair value and gain/loss by contract type (e.g., interest rate contracts, foreign exchange contracts, credit contracts, etc.) is required and derivatives accounted for as hedging instruments under FAS 133 must be disclosed separately from derivatives that do not qualify for hedge accounting under FAS 133. Because investment companies account for their derivatives at fair value and record any changes in fair value in current period earnings, the fund’s derivatives are not accounted for as hedging instruments under FAS 133. As such, even though the fund may use derivatives in an attempt to achieve an economic hedge, the fund’s derivatives are not considered to be hedging instruments under FAS 133.
FSP FAS 133-1 amends FAS 133 to require sellers of credit derivatives to make disclosures that will enable financial statement users to assess the potential effects of those credit derivatives on an entity’s financial position, financial performance and cash flows. As defined by FSP FAS 133-1, a credit derivative is a derivative instrument (a) in which one or more of the derivative’s underlyings are related to the credit risk of a specified entity (or group of entities) or an index based on the credit risk of a group of entities and (b) that exposes the seller to potential loss from credit-risk-related events specified in the derivative contract. The seller (or writer) is the party that provides the credit protection and assumes the credit risk on a credit derivatives contract, such as a credit default swap. There was no impact from implementing FSP 133-1 as the fund did not hold any of these credit derivatives at period end.
As defined under FAS 133, derivative instruments include written options, purchased options, futures contracts, forward foreign currency exchange contracts, and swap agreements. At August 31, 2009, the fund did not have any outstanding derivative instruments.
35
Notes to Financial Statements – continued
The following table presents, by major type of derivative contract, the realized gain (loss) on derivatives held by the fund for the year ended August 31, 2009 as reported in the Statement of Operations:
| | | | | | | | |
| | | Written
Option
Transactions | | Investment
Transactions
(i.e.,
Purchased
Options) | | | Total | |
| Interest Rate Contracts | | $84 | | $— | | | $84 | |
| Equity Contracts | | — | | (342,794 | ) | | (342,794 | ) |
Total | | $84 | | $(342,794 | ) | | $(342,710 | ) |
Derivative counterparty credit risk is managed through formal evaluation of the creditworthiness of all potential counterparties. On certain over-the-counter derivatives, the fund attempts to reduce its exposure to counterparty credit risk by entering into an International Swaps and Derivatives Association (ISDA) Master Agreement on a bilateral basis with each of the counterparties with whom it undertakes a significant volume of transactions. The ISDA Master Agreement gives each party to the agreement the right to terminate all transactions traded under such agreement if there is a certain deterioration in the credit quality of the other party. The ISDA Master Agreement gives the fund the right, upon an event of default by the applicable counterparty or a termination of the agreement, to close out all transactions traded under such agreement and to net amounts owed under each transaction to one net amount payable by one party to the other. This right to close out and net payments across all transactions traded under the ISDA Master Agreement could result in a reduction of the fund’s credit risk to such counterparty equal to any amounts payable by the fund under the applicable transactions, if any. However, absent an event of default by the counterparty or a termination of the agreement, the ISDA Master Agreement does not result in an offset of reported balance sheet assets and liabilities across transactions between the fund and the applicable counterparty.
Collateral requirements differ by type of derivative. Collateral or margin requirements are set by the broker or exchange clearing house for exchange traded derivatives (i.e., futures and exchange-traded options) while collateral terms are contract specific for over-the-counter traded derivatives (i.e., forwards, swaps and over-the-counter options). For derivatives traded under an ISDA Master Agreement, the collateral requirements are netted across all transactions traded under such agreement and one amount is posted from one party to the other to collateralize such obligations. Cash collateral that has been pledged to cover obligations of the fund under derivative contracts will be reported separately on the Statement of Assets and Liabilities as restricted cash. Securities collateral pledged for the same purpose is noted in the Portfolio of Investments.
36
Notes to Financial Statements – continued
Written Options – In exchange for a premium, the fund writes call or put options on securities for which it believes the premium received exceeds the potential loss that would result from adverse price changes in the options’ underlying securities. In a written option, the fund as the option writer grants the buyer the right to purchase from, or sell to, the fund a specified number of shares or units of a particular security, currency or index at a specified price within a specified period of time.
The premium received is initially recorded as a liability on the Statement of Assets and Liabilities. The option is subsequently marked-to-market daily with the difference between the premium received and the market value of the written option being recorded as unrealized appreciation or depreciation. When a written option expires, the fund realizes a gain equal to the amount of the premium received. The difference between the premium received and the amount paid on effecting a closing transaction is considered a realized gain or loss. When a written call option is exercised, the premium received is offset against the proceeds to determine the realized gain or loss. When a written put option is exercised, the premium reduces the cost basis of the security purchased by the fund.
At the initiation of the written option contract, for exchange traded options, the fund is required to deposit securities or cash as collateral with the custodian for the benefit of the broker. For over-the-counter options, the fund may post collateral subject to the terms of an ISDA Master Agreement as generally described above if the market value of the options contract moves against it. The fund, as writer of an option, may have no control over whether the underlying securities may be sold (call) or purchased (put) and, as a result, bears the market risk of an unfavorable change in the price of the securities underlying the written option. Although the fund’s market risk may be significant, the maximum counterparty credit risk to the fund is equal to the market value of any collateral posted to the broker. For over-the-counter options, this risk is mitigated in cases where there is an ISDA Master Agreement between the fund and the counterparty providing for netting as described above.
Written Option Transactions
| | | | | | |
| | | Number of
contracts | | | Premiums
received | |
| Outstanding, beginning of period | | — | | | $— | |
| Options written | | 1 | | | 84 | |
| Options closed | | — | | | — | |
| Options exercised | | — | | | — | |
| Options expired | | (1 | ) | | (84 | ) |
| Outstanding, end of period | | | | | $— | |
37
Notes to Financial Statements – continued
Purchased Options – The fund may purchase call or put options for a premium. Purchased options entitle the holder to buy or sell a specified number of shares or units of a particular security, currency or index at a specified price at a specified date or within a specified period of time. Purchasing call options may be used to hedge against an anticipated increase in the dollar cost of securities or currency to be acquired or to increase the fund’s exposure to an underlying instrument. Purchasing put options may hedge against a decline in the value of portfolio securities or currency.
The premium paid is initially recorded as an investment in the Statement of Assets and Liabilities. That investment is subsequently marked-to-market daily with the difference between the premium paid and the market value of the purchased option being recorded as unrealized appreciation or depreciation. Premiums paid for purchased options which have expired are treated as realized losses on investments in the Statement of Operations. Upon the exercise or closing of a purchased option, the premium paid is either added to the cost of the security or financial instrument in the case of a call option, or offset against the proceeds on the sale of the underlying security or financial instrument in the case of a put option, in order to determine the realized gain or loss on investments.
The risk in purchasing an option is that the fund pays a premium whether or not the option is exercised. The fund’s maximum risk of loss due to counterparty credit risk is limited to the market value of the option. For over-the-counter options, this risk is mitigated in cases where there is an ISDA Master Agreement between the fund and the counterparty providing for netting as described above and for posting of collateral by the counterparty to the fund to cover the fund’s exposure to the counterparty under such ISDA Master Agreement.
Short Sales – The fund may enter into short sales whereby it sells a security it does not own in anticipation of a decline in the value of that security. The fund will realize a gain if the security price decreases and a loss if the security price increases between the date of the short sale and the date on which the fund replaces the borrowed security. Losses from short sales can exceed the proceeds of the security sold; and they can also exceed the potential loss from an ordinary buy and sell transaction. The amount of any premium, dividends, or interest the fund may be required to pay in connection with a short sale will be recognized as a fund expense. During the year ended August 31, 2009, this expense amounted to $5,067. The fund segregates cash or marketable securities in an amount that, when combined with the amount of proceeds from the short sale deposited with the broker, at least equals the current market value of the security sold short. At August 31, 2009, the fund had no short sales outstanding.
38
Notes to Financial Statements – continued
Security Loans – State Street Bank and Trust Company (“State Street”), as lending agent, may loan the securities of the fund to certain qualified institutions (the “Borrowers”) approved by the fund. The loans are collateralized by cash and/or U.S. Treasury and federal agency obligations in an amount typically at least equal to the market value of the securities loaned. The market value of the loaned securities is determined at the close of business of the fund and any additional required collateral is delivered to the fund on the next business day. State Street provides the fund with indemnification against Borrower default. The fund bears the risk of loss with respect to the investment of cash collateral. On loans collateralized by cash, the cash collateral is invested in a money market fund or short-term securities. A portion of the income generated upon investment of the collateral is remitted to the Borrowers, and the remainder is allocated between the fund and the lending agent. On loans collateralized by U.S. Treasury and/or federal agency obligations, a fee is received from the Borrower, and is allocated between the fund and the lending agent. Income from securities lending is included in interest income on the Statement of Operations. The dividend and interest income earned on the securities loaned is accounted for in the same manner as other dividend and interest income. At August 31, 2009, there were no securities on loan.
Indemnifications – Under the fund’s organizational documents, its officers and Trustees may be indemnified against certain liabilities and expenses arising out of the performance of their duties to the fund. Additionally, in the normal course of business, the fund enters into agreements with service providers that may contain indemnification clauses. The fund’s maximum exposure under these agreements is unknown as this would involve future claims that may be made against the fund that have not yet occurred.
Investment Transactions and Income – Investment transactions are recorded on the trade date. Interest income is recorded on the accrual basis. All premium and discount is amortized or accreted for financial statement purposes in accordance with U.S. generally accepted accounting principles. Dividends received in cash are recorded on the ex-dividend date. Certain dividends from foreign securities will be recorded when the fund is informed of the dividend if such information is obtained subsequent to the ex-dividend date. Dividend and interest payments received in additional securities are recorded on the ex-dividend or ex-interest date in an amount equal to the value of the security on such date.
The fund may receive proceeds from litigation settlements. Any proceeds received from litigation involving portfolio holdings are reflected in the Statement of Operations in realized gain/loss if the security has been disposed of by the fund or in unrealized gain/loss if the security is still held by the fund. Any other proceeds from litigation not related to portfolio holdings are
39
Notes to Financial Statements – continued
reflected as other income in the Statement of Operations. The fund was a participant in litigation against Enron Corp. On December 26, 2008, the fund received a cash settlement in the amount of $14,093,465.
Fees Paid Indirectly – The fund’s custody fee may be reduced according to an arrangement that measures the value of cash deposited with the custodian by the fund. This amount, for the year ended August 31, 2009, is shown as a reduction of total expenses on the Statement of Operations.
Tax Matters and Distributions – The fund intends to qualify as a regulated investment company, as defined under Subchapter M of the Internal Revenue Code, and to distribute all of its taxable income, including realized capital gains. As a result, no provision for federal income tax is required. The fund’s federal tax returns for the prior three fiscal years remain subject to examination by the Internal Revenue Service. Foreign taxes, if any, have been accrued by the fund in the accompanying financial statements.
Distributions to shareholders are recorded on the ex-dividend date. Income and capital gain distributions are determined in accordance with income tax regulations, which may differ from U.S. generally accepted accounting principles. Certain capital accounts in the financial statements are periodically adjusted for permanent differences in order to reflect their tax character. These adjustments have no impact on net assets or net asset value per share. Temporary differences which arise from recognizing certain items of income, expense, gain or loss in different periods for financial statement and tax purposes will reverse at some time in the future. Distributions in excess of net investment income or net realized gains are temporary overdistributions for financial statement purposes resulting from differences in the recognition or classification of income or distributions for financial statement and tax purposes.
Book/tax differences primarily relate to expiration of capital loss carryforwards, wash sale loss deferrals, and capital loss carryforwards and wash sale loss deferrals assumed as a result of the acquisition of the MFS New Endeavor Fund.
The tax character of distributions declared to shareholders for the last two fiscal years is as follows:
| | | | |
| | | 8/31/09 | | 8/31/08 |
| Ordinary income (including any short-term capital gains) | | $3,543,509 | | $17,463,468 |
| Long-term capital gain | | — | | 74,982,219 |
| Total distributions | | $3,543,509 | | $92,445,687 |
40
Notes to Financial Statements – continued
The federal tax cost and the tax basis components of distributable earnings were as follows:
| | | |
| As of 8/31/09 | | | |
| Cost of investments | | $789,832,193 | |
| Gross appreciation | | 62,753,545 | |
| Gross depreciation | | (89,361,038 | ) |
| Net unrealized appreciation (depreciation) | | $(26,607,493 | ) |
| | | |
| Undistributed ordinary income | | 5,587,093 | |
| Capital loss carryforwards | | (221,165,513 | ) |
| Post-October capital loss deferral | | (160,427,778 | ) |
| Other temporary differences | | (114,097 | ) |
As of August 31, 2009, the fund had capital loss carryforwards available to offset future realized gains. Such losses expire as follows:
| | | |
| 8/31/10 | | $(74,153,956 | ) |
| 8/31/16 | | (48,648,322 | ) |
| 8/31/17 | | (98,363,235 | ) |
| | $(221,165,513 | ) |
The availability of a portion of the capital loss carryforwards, which were acquired on June 22, 2007 and July 24, 2009, in connection with the MFS Capital Opportunities Fund and the MFS New Endeavor Fund mergers, respectively, may be limited in a given year.
41
Notes to Financial Statements – continued
Multiple Classes of Shares of Beneficial Interest – The fund offers multiple classes of shares, which differ in their respective distribution and service fees. The fund’s income, realized and unrealized gain (loss), and common expenses are allocated to shareholders based on the daily net assets of each class. Dividends are declared separately for each class. Differences in per share dividend rates are generally due to differences in separate class expenses. Class B shares will convert to Class A shares approximately eight years after purchase. The fund’s distributions declared to shareholders as reported on the Statements of Changes in Net Assets are presented by class as follows:
| | | | | | | | |
| | | From net investment
income | | From net realized gain on
investments |
| | | Year ended
8/31/09 | | Year ended
8/31/08 | | Year ended
8/31/09 | | Year ended
8/31/08 |
| Class A | | $3,180,163 | | $— | | $— | | $55,958,979 |
| Class B | | — | | — | | — | | 22,499,641 |
| Class C | | — | | — | | — | | 8,053,425 |
| Class I | | 141,605 | | — | | — | | 1,831,049 |
| Class R (b) | | — | | — | | — | | 183,230 |
| Class R1 | | — | | — | | — | | 329,794 |
| Former Class R2 (b) | | — | | — | | — | | 159,753 |
| Class R2 | | 59,248 | | — | | — | | 1,031,345 |
| Class R3 | | 161,981 | | — | | — | | 2,393,639 |
| Class R4 | | 512 | | — | | — | | 4,832 |
| Total | | $3,543,509 | | $— | | $— | | $92,445,687 |
| (b) | At the close of business on April 18, 2008, Class R and Class R2 shares converted into Class R3 shares. Following this conversion, Class R3, Class R4, and Class R5 shares were renamed Class R2, Class R3, and Class R4 shares, respectively. |
| (3) | | Transactions with Affiliates |
Investment Adviser – The fund has an investment advisory agreement with MFS to provide overall investment management and related administrative services and facilities to the fund. The management fee is computed daily and paid monthly at the following annual rates:
| | | |
| First $500 million of average daily net assets | | 0.65 | % |
| Average daily net assets in excess of $500 million | | 0.55 | % |
The management fee incurred for the year ended August 31, 2009 was equivalent to an annual effective rate of 0.63% of the fund’s average daily net assets.
At the commencement of the period until February 28, 2009, the investment adviser had agreed in writing to pay a portion of the fund’s total annual operating expenses, exclusive of interest, taxes, extraordinary expenses, brokerage and transaction costs, and investment-related expenses, such that
42
Notes to Financial Statements – continued
total annual fund operating expenses did not exceed the following rates annually of the fund’s average daily net assets.
| | | | | | | | | | | | | | |
| Class A | | Class B | | Class C | | Class I | | Class R1 | | Class R2 | | Class R3 | | Class R4 |
| 1.21% | | 1.86% | | 1.86% | | 0.86% | | 1.86% | | 1.36% | | 1.11% | | 0.86% |
Effective March 1, 2009, the investment adviser has agreed in writing to pay a portion of the fund’s total annual operating expenses, exclusive of interest, taxes, extraordinary expenses, brokerage and transaction costs and investment-related expenses, such that total annual fund operating expenses do not exceed the following rates annually of the fund’s average daily net assets.
| | | | | | | | | | | | | | |
| Class A | | Class B | | Class C | | Class I | | Class R1 | | Class R2 | | Class R3 | | Class R4 |
| 1.21% | | 1.96% | | 1.96% | | 0.96% | | 1.96% | | 1.46% | | 1.21% | | 0.96% |
This written agreement will continue until modified by the fund’s Board of Trustees, but such agreement will continue at least until December 31, 2009. For the year ended August 31, 2009, these reductions amounted to $985,994 and are reflected as a reduction of total expenses in the Statement of Operations.
Distributor – MFS Fund Distributors, Inc. (MFD), a wholly-owned subsidiary of MFS, as distributor, received $32,111 for the year ended August 31, 2009, as its portion of the initial sales charge on sales of Class A shares of the fund.
The Board of Trustees has adopted a distribution plan for certain class shares pursuant to Rule 12b-1 of the Investment Company Act of 1940.
The fund’s distribution plan provides that the fund will pay MFD for services provided by MFD and financial intermediaries in connection with the distribution and servicing of certain share classes. One component of the plan is a distribution fee paid to MFD and another component of the plan is a service fee paid to MFD. MFD may subsequently pay all, or a portion, of the distribution and/or service fees to financial intermediaries.
Distribution Plan Fee Table:
| | | | | | | | | | |
| | | Distribution
Fee Rate (d) | | Service
Fee Rate (d) | | Total
Distribution
Plan (d) | | Annual
Effective
Rate (e) | | Distribution
and Service
Fee |
| Class A | | — | | 0.25% | | 0.25% | | 0.30% | | $1,371,587 |
| Class B | | 0.75% | | 0.25% | | 1.00% | | 1.00% | | 851,561 |
| Class C | | 0.75% | | 0.25% | | 1.00% | | 1.00% | | 521,143 |
| Class R1 | | 0.75% | | 0.25% | | 1.00% | | 1.00% | | 25,856 |
| Class R2 | | 0.25% | | 0.25% | | 0.50% | | 0.50% | | 57,018 |
| Class R3 | | — | | 0.25% | | 0.25% | | 0.25% | | 51,997 |
| Total Distribution and Service Fees | | | | $2,879,162 |
| (d) | As of August 31, 2009, in accordance with the distribution plan for certain classes, the fund pays distribution and/or service fees equal to these annual percentage rates of each class’ average daily net assets. The distribution and service fee rates disclosed by class represent the current rates in effect at the end of the reporting period. Any rate changes, if applicable, are detailed below. |
43
Notes to Financial Statements – continued
| (e) | The annual effective rates represent actual fees incurred under the distribution plan for the year ended August 31, 2009 based on each class’ average daily net assets. Prior to March 1, 2009, a 0.10% Class A distribution fee was paid by the fund. Effective March 1, 2009, the 0.10% Class A annual distribution fee was eliminated. Assets attributable to Class A shares sold prior to October 1, 1989 with respect to shares that were acquired as part of the reorganization of MFS Capital Opportunities Fund into MFS Core Equity are subject to a service fee of 0.15% annually. |
Certain Class A shares purchased prior to September 1, 2008 are subject to a contingent deferred sales charge (CDSC) in the event of a shareholder redemption within 12 months of purchase. Certain Class A shares purchased on or subsequent to September 1, 2008 are subject to a CDSC in the event of a shareholder redemption within 24 months of purchase. Class C shares are subject to a CDSC in the event of a shareholder redemption within 12 months of purchase. Class B shares are subject to a CDSC in the event of a shareholder redemption within six years of purchase. All contingent deferred sales charges are paid to MFD and during the year ended August 31, 2009, were as follows:
| | |
| | | Amount |
| Class A | | $867 |
| Class B | | 72,700 |
| Class C | | 1,766 |
Shareholder Servicing Agent – MFS Service Center, Inc. (MFSC), a wholly-owned subsidiary of MFS, receives a fee from the fund for its services as shareholder servicing agent calculated as a percentage of the average daily net assets of the fund as determined periodically under the supervision of the fund’s Board of Trustees. For the year ended August 31, 2009, the fee was $1,092,909, which equated to 0.1701% annually of the fund’s average daily net assets. MFSC also receives payment from the fund for out-of-pocket expenses, sub-accounting and other shareholder servicing costs which may be paid to affiliated and unaffiliated service providers. For the year ended August 31, 2009, these out-of-pocket expenses, sub-accounting and other shareholder servicing costs amounted to $1,079,361.
Administrator – MFS provides certain financial, legal, shareholder communications, compliance, and other administrative services to the fund. Under an administrative services agreement, the fund partially reimburses MFS the costs incurred to provide these services. The fund is charged an annual fixed amount of $17,500 plus a fee based on average daily net assets. The administrative services fee incurred for the year ended August 31, 2009 was equivalent to an annual effective rate of 0.0206% of the fund’s average daily net assets.
Trustees’ and Officers’ Compensation – The fund pays compensation to independent Trustees in the form of a retainer, attendance fees, and additional compensation to Board and Committee chairpersons. The fund does not pay compensation directly to trustees or officers of the fund who are also officers
44
Notes to Financial Statements – continued
of the investment adviser, all of whom receive remuneration for their services to the fund from MFS. Certain officers and Trustees of the fund are officers or directors of MFS, MFD, and MFSC.
Prior to December 31, 2001, the fund had an unfunded defined benefit plan (“DB plan”) for independent Trustees. As of December 31, 2001, the Board took action to terminate the DB plan with respect to then-current and any future independent Trustees, such that the DB Plan covers only certain of those former independent Trustees who retired on or before December 31, 2001. Effective January 1, 2002, accrued benefits under the DB Plan for then current independent Trustees who continued were credited to an unfunded retirement deferral plan (the “Retirement Deferral plan”), which was established for and exists solely with respect to these credited amounts, and is not available for other deferrals by these or other independent Trustees. The DB Plan resulted in a pension expense of $10,120 and the Retirement Deferral plan resulted in a net decrease in expense of $29,229. Both amounts are included in independent Trustees’ compensation for the year ended August 31, 2009. The liability for deferred retirement benefits payable to certain independent Trustees under both Plans amounted to $136,554 at August 31, 2009, and is included in payable for independent Trustees’ compensation on the Statement of Assets and Liabilities.
Other – This fund and certain other funds managed by MFS (the funds) have entered into services agreements (the Agreements) which provide for payment of fees by the funds to Tarantino LLC and Griffin Compliance LLC in return for the provision of services of an Independent Chief Compliance Officer (ICCO) and Assistant ICCO, respectively, for the funds. The ICCO and Assistant ICCO are officers of the funds and the sole members of Tarantino LLC and Griffin Compliance LLC, respectively. The funds can terminate the Agreements with Tarantino LLC and Griffin Compliance LLC at any time under the terms of the Agreements. For the year ended August 31, 2009, the aggregate fees paid by the fund to Tarantino LLC and Griffin Compliance LLC were $8,006 and are included in miscellaneous expense on the Statement of Operations. MFS has agreed to reimburse the fund for a portion of the payments made by the fund in the amount of $4,142, which is shown as a reduction of total expenses in the Statement of Operations. Additionally, MFS has agreed to bear all expenses associated with office space, other administrative support, and supplies provided to the ICCO and Assistant ICCO.
The fund may invest in a money market fund managed by MFS which seeks a high level of current income consistent with preservation of capital and liquidity. Income earned on this investment is included in dividends from underlying funds on the Statement of Operations. This money market fund does not pay a management fee to MFS.
45
Notes to Financial Statements – continued
Purchases and sales of investments, other than U.S. Government securities, purchased option transactions, and short-term obligations, aggregated $713,209,378 and $771,110,212, respectively.
| (5) | | Shares of Beneficial Interest |
The fund’s Declaration of Trust permits the Trustees to issue an unlimited number of full and fractional shares of beneficial interest. Transactions in fund shares were as follows:
| | | | | | | | |
| | | Year ended
8/31/09 | | Year ended
8/31/08 |
| | | Shares | | Amount | | Shares | | Amount |
| Shares sold | | | | | | | | |
Class A | | 8,482,415 | | $100,729,655 | | 10,555,888 | | $198,559,304 |
Class B | | 738,200 | | 8,054,369 | | 533,209 | | 9,186,373 |
Class C | | 297,337 | | 3,281,371 | | 332,970 | | 5,716,091 |
Class I | | 116,989 | | 1,586,423 | | 1,144,826 | | 23,867,513 |
Class R (b) | | — | | — | | 133,309 | | 2,597,631 |
Class R1 | | 115,075 | | 1,324,614 | | 158,677 | | 2,874,720 |
Former Class R2 (b) | | — | | — | | 53,276 | | 978,339 |
Class R2 | | 339,614 | | 4,100,924 | | 760,473 | | 14,115,397 |
Class R3 | | 425,233 | | 5,161,333 | | 387,738 | | 7,108,853 |
Class R4 | | 140,923 | | 1,794,179 | | — | | — |
| | 10,655,786 | | $126,032,868 | | 14,060,366 | | $265,004,221 |
| Shares issued in connection with acquisition of MFS New Endeavor Fund | | | | | | | | |
Class A | | 3,289,862 | | $43,919,660 | | | | |
Class B | | 1,088,292 | | 13,418,637 | | | | |
Class C | | 761,588 | | 9,354,503 | | | | |
Class I | | 89,575 | | 1,243,296 | | | | |
Class R1 | | 6,912 | | 84,898 | | | | |
Class R2 | | 104,964 | | 1,376,082 | | | | |
Class R3 | | 24,998 | | 333,257 | | | | |
Class R4 | | 10,154 | | 136,659 | | | | |
| | 5,376,345 | | $69,866,992 | | | | |
46
Notes to Financial Statements – continued
| | | | | | | | | | | | |
| | | Year ended
8/31/09 | | | Year ended
8/31/08 | |
| | | Shares | | | Amount | | | Shares | | | Amount | |
| Shares issued to shareholders in reinvestment of distributions | | | | | | | | | | | | |
Class A | | 269,553 | | | $2,911,168 | | | 2,764,142 | | | $51,882,943 | |
Class B | | — | | | — | | | 1,200,579 | | | 20,890,083 | |
Class C | | — | | | — | | | 395,196 | | | 6,844,787 | |
Class I | | 12,549 | | | 140,677 | | | 89,117 | | | 1,739,557 | |
Class R (b) | | — | | | — | | | 9,846 | | | 183,230 | |
Class R1 | | — | | | — | | | 19,030 | | | 329,794 | |
Former Class R2 (b) | | — | | | — | | | 9,118 | | | 159,753 | |
Class R2 | | 5,425 | | | 57,610 | | | 55,899 | | | 1,031,345 | |
Class R3 | | 15,026 | | | 161,981 | | | 127,729 | | | 2,393,639 | |
Class R4 | | 47 | | | 512 | | | 255 | | | 4,832 | |
| | 302,600 | | | $3,271,948 | | | 4,670,911 | | | $85,459,963 | |
| Shares reacquired | | | | | | | | | | | | |
Class A | | (10,537,901 | ) | | $(123,230,409 | ) | | (13,126,299 | ) | | $(245,047,802 | ) |
Class B | | (6,102,644 | ) | | (66,479,026 | ) | | (8,820,667 | ) | | (148,697,791 | ) |
Class C | | (1,189,587 | ) | | (12,922,363 | ) | | (1,432,484 | ) | | (24,293,088 | ) |
Class I | | (115,127 | ) | | (1,598,601 | ) | | (1,586,016 | ) | | (31,405,837 | ) |
Class R (b) | | — | | | — | | | (444,601 | ) | | (8,580,951 | ) |
Class R1 | | (67,217 | ) | | (733,426 | ) | | (77,430 | ) | | (1,271,488 | ) |
Former Class R2 (b) | | — | | | — | | | (144,482 | ) | | (2,381,858 | ) |
Class R2 | | (318,704 | ) | | (3,816,946 | ) | | (296,852 | ) | | (5,210,586 | ) |
Class R3 | | (291,286 | ) | | (3,338,374 | ) | | (445,307 | ) | | (8,065,973 | ) |
Class R4 | | (37,915 | ) | | (467,544 | ) | | — | | | — | |
| | (18,660,381 | ) | | $(212,586,689 | ) | | (26,374,138 | ) | | $(474,955,374 | ) |
| Net change | | | | | | | | | | | | |
Class A | | 1,503,929 | | | $24,330,074 | | | 193,731 | | | $5,394,445 | |
Class B | | (4,276,152 | ) | | (45,006,020 | ) | | (7,086,879 | ) | | (118,621,335 | ) |
Class C | | (130,662 | ) | | (286,489 | ) | | (704,318 | ) | | (11,732,210 | ) |
Class I | | 103,986 | | | 1,371,795 | | | (352,073 | ) | | (5,798,767 | ) |
Class R (b) | | — | | | — | | | (301,446 | ) | | (5,800,090 | ) |
Class R1 | | 54,770 | | | 676,086 | | | 100,277 | | | 1,933,026 | |
Former Class R2 (b) | | — | | | — | | | (82,088 | ) | | (1,243,766 | ) |
Class R2 | | 131,299 | | | 1,717,670 | | | 519,520 | | | 9,936,156 | |
Class R3 | | 173,971 | | | 2,318,197 | | | 70,160 | | | 1,436,519 | |
Class R4 | | 113,209 | | | 1,463,806 | | | 255 | | | 4,832 | |
| | (2,325,650 | ) | | $(13,414,881 | ) | | (7,642,861 | ) | | $(124,491,190 | ) |
| (b) | At the close of business on April 18, 2008, Class R and Class R2 shares converted into Class R3 shares. Following this conversion, Class R3, Class R4, and Class R5 shares were renamed Class R2, Class R3, and Class R4 shares, respectively. |
47
Notes to Financial Statements – continued
The fund and certain other funds managed by MFS participate in a $1.1 billion unsecured committed line of credit, subject to a $1 billion sublimit, provided by a syndication of banks under a credit agreement. Borrowings may be made for temporary financing needs. Interest is charged to each fund, based on its borrowings, generally at a rate equal to the higher of the Federal Reserve funds rate or one month LIBOR plus an agreed upon spread. A commitment fee, based on the average daily, unused portion of the committed line of credit, is allocated among the participating funds at the end of each calendar quarter. In addition, the fund and other funds managed by MFS have established unsecured uncommitted borrowing arrangements with certain banks for temporary financing needs. Interest is charged to each fund, based on its borrowings, at a rate equal to the Federal Reserve funds rate plus an agreed upon spread. For the year ended August 31, 2009, the fund’s commitment fee and interest expense were $7,696 and $0, respectively, and are included in miscellaneous expense on the Statement of Operations.
| (7) | | Transactions in Underlying Funds-Affiliated Issuers |
An affiliated issuer may be considered one in which the fund owns 5% or more of the outstanding voting securities, or a company which is under common control. For the purposes of this report, the fund assumes the following to be affiliated issuers:
| | | | | | | | | |
| Underlying Funds | | Beginning
Shares/Par
Amount | | Acquisitions
Shares/Par
Amount | | Dispositions
Shares/Par
Amount | | | Ending
Shares/Par
Amount |
MFS Institutional Money
Market Portfolio | | — | | 83,345,722 | | (80,862,800 | ) | | 2,482,922 |
| | | | |
| Underlying Funds | | Realized
Gain (Loss) | | Capital Gain
Distributions | | Dividend
Income | | | Ending
Value |
MFS Institutional Money
Market Portfolio | | $— | | $— | | $11,304 | | | $2,482,922 |
At close of business on July 24, 2009, the fund acquired all of the assets and liabilities of MFS New Endeavor Fund. The acquisition was accomplished by a tax-free exchange of 5,376,345 shares of the fund (valued at $69,866,992) for all of the assets and liabilities of MFS New Endeavor Fund. MFS New Endeavor Fund then distributed the shares of the fund that MFS New Endeavor Fund received from the fund to its shareholders. MFS New Endeavor Fund net assets on that date were $69,866,992, including $4,855,836 of unrealized appreciation, $36,477 of accumulated net investment income, and $51,958,958 of accumulated net realized loss on investments and foreign currency transactions. The aggregate net assets of the fund after the acquisition were $745,938,537.
48
REPORT OF INDEPENDENT REGISTERED PUBLIC ACCOUNTING FIRM
To the Board of Trustees of MFS Series Trust I and Shareholders of MFS Core Equity Fund:
We have audited the accompanying statement of assets and liabilities of MFS Core Equity Fund (the Fund) (one of the portfolios comprising MFS Series Trust I), including the portfolio of investments, as of August 31, 2009, and the related statement of operations for the year then ended, the statements of changes in net assets for each of the two years in the period then ended, and the financial highlights for each of the periods indicated therein. These financial statements and financial highlights are the responsibility of the Fund’s management. Our responsibility is to express an opinion on these financial statements and financial highlights based on our audits.
We conducted our audits in accordance with the standards of the Public Company Accounting Oversight Board (United States). Those standards require that we plan and perform the audit to obtain reasonable assurance about whether the financial statements and financial highlights are free of material misstatement. We were not engaged to perform an audit of the Fund’s internal control over financial reporting. Our audits included consideration of internal control over financial reporting as a basis for designing audit procedures that are appropriate in the circumstances, but not for the purpose of expressing an opinion on the effectiveness of the Fund’s internal control over financial reporting. Accordingly, we express no such opinion. An audit also includes examining, on a test basis, evidence supporting the amounts and disclosures in the financial statements and financial highlights, assessing the accounting principles used and significant estimates made by management, and evaluating the overall financial statement presentation. Our procedures included confirmation of securities owned as of August 31, 2009, by correspondence with the custodian and brokers or by other appropriate auditing procedures where replies from brokers were not received. We believe that our audits provide a reasonable basis for our opinion.
In our opinion, the financial statements and financial highlights referred to above present fairly, in all material respects, the financial position of the MFS Core Equity Fund at August 31, 2009, the results of its operations for the year then ended, the changes in its net assets for each of the two years in the period then ended, and its financial highlights for each of the periods indicated therein, in conformity with U.S. generally accepted accounting principles.

Boston, Massachusetts
October 16, 2009
49
TRUSTEES AND OFFICERS —
IDENTIFICATION AND BACKGROUND
The Trustees and officers of the Trust, as of October 1, 2009, are listed below, together with their principal occupations during the past five years. (Their titles may have varied during that period.) The address of each Trustee and officer is 500 Boylston Street, Boston, Massachusetts 02116.
| | | | | | |
Name, Date of Birth | | Position(s) Held
with Fund | | Trustee/Officer
Since (h) | | Principal Occupations During
the Past Five Years & Other
Directorships (j) |
| INTERESTED TRUSTEES | | | | |
Robert J. Manning (k)
(born 10/20/63) | | Trustee | | February 2004 | | Massachusetts Financial Services Company, Chief Executive Officer, President, Chief Investment Officer and Director |
Robert C. Pozen (k)
(born 8/08/46) | | Trustee | | February 2004 | | Massachusetts Financial Services Company, Chairman (since February 2004); Medtronic, Inc, (medical devices), Director (since 2004); Harvard Business School (education), Senior Lecturer (since 2008); Bell Canada Enterprises (telecommunications), Director (until February 2009); The Bank of New York, Director (finance), (March 2004 to May 2005); Telesat (satellite communications), Director (until November 2007) |
| INDEPENDENT TRUSTEES | | | | |
David H. Gunning
(born 5/30/42) | | Trustee and Chair of Trustees | | January 2004 | | Retired; Cleveland-Cliffs Inc. (mining products and service provider), Vice Chairman/Director (until May 2007); Lincoln Electric Holdings, Inc. (welding equipment manufacturer), Director; Development Alternatives, Inc. (consulting), Director/Non Executive Chairman; Southwest Gas Corp. (natural gas distribution), Director (until May 2004); Portman Limited (mining), Director (until 2008) |
50
Trustees and Officers – continued
| | | | | | |
Name, Date of Birth | | Position(s) Held
with Fund | | Trustee/Officer
Since (h) | | Principal Occupations During
the Past Five Years & Other
Directorships (j) |
Robert E. Butler (n)
(born 11/29/41) | | Trustee | | January 2006 | | Consultant – investment company industry regulatory and compliance matters (since July 2002); PricewaterhouseCoopers LLP (professional services firm), Partner (until 2002) |
Lawrence H. Cohn, M.D.
(born 3/11/37) | | Trustee | | June 1989 | | Brigham and Women’s Hospital, Senior Cardiac Surgeon (since 2005); Harvard Medical School, Professor of Cardiac Surgery; Partners HealthCare, Physician Director of Medical Device Technology (since 2006); Brigham and Women’s Hospital, Chief of Cardiac Surgery (until 2005) |
Maureen R. Goldfarb
(born 4/6/55) | | Trustee | | January 2009 | | Private investor; John Hancock Financial Services, Inc., Executive Vice President (until 2004); John Hancock Mutual Funds, Trustee and Chief Executive Officer (until 2004) |
William R. Gutow
(born 9/27/41) | | Trustee | | December 1993 | | Private investor and real estate consultant; Capital Entertainment Management Company (video franchise), Vice Chairman; Atlantic Coast Tan (tanning salons), Vice Chairman (until 2007); Texas Donuts (donut franchise), Vice Chairman (until 2009) |
Michael Hegarty
(born 12/21/44) | | Trustee | | December 2004 | | Private investor; Retired; AXA Financial (financial services and insurance), Vice Chairman and Chief Operating Officer (until 2001); The Equitable Life Assurance Society (insurance), President and Chief Operating Officer (until 2001) |
J. Atwood Ives
(born 5/01/36) | | Trustee | | February 1992 | | Private investor; KeySpan Corporation (energy related services), Director (until 2004) |
51
Trustees and Officers – continued
| | | | | | |
Name, Date of Birth | | Position(s) Held
with Fund | | Trustee/Officer
Since (h) | | Principal Occupations During
the Past Five Years & Other
Directorships (j) |
John P. Kavanaugh
(born 11/4/54) | | Trustee | | January 2009 | | Private investor; The Hanover Insurance Group, Inc., Vice President and Chief Investment Officer (until 2006); Allmerica Investment Trust, Allmerica Securities Trust and Opus Investment Trust (investment companies), Chairman, President and Trustee (until 2006) |
J. Dale Sherratt
(born 9/23/38) | | Trustee | | June 1989 | | Insight Resources, Inc. (acquisition planning specialists), President; Wellfleet Investments (investor in health care companies), Managing General Partner |
Laurie J. Thomsen
(born 8/05/57) | | Trustee | | March 2005 | | New Profit, Inc. (venture philanthropy), Executive Partner (since 2006); Private investor; Prism Venture Partners (venture capital), Co-founder and General Partner (until June 2004); The Travelers Companies (commercial property liability insurance), Director |
Robert W. Uek
(born 5/18/41) | | Trustee | | January 2006 | | Consultant to investment company industry; PricewaterhouseCoopers LLP (professional services firm), Partner (until 1999); TT International Funds (mutual fund complex), Trustee (until 2005); Hillview Investment Trust II Funds (mutual fund complex), Trustee (until 2005) |
| OFFICERS | | | | | | |
Maria F. Dwyer (k)
(born 12/01/58) | | President | | November 2005 | | Massachusetts Financial Services Company, Executive Vice President and Chief Regulatory Officer (since March 2004) Chief Compliance Officer (since December 2006); Fidelity Management & Research Company, Vice President (prior to March 2004); Fidelity Group of Funds, President and Treasurer (until March 2004) |
52
Trustees and Officers – continued
| | | | | | |
Name, Date of Birth | | Position(s) Held
with Fund | | Trustee/Officer
Since (h) | | Principal Occupations During
the Past Five Years & Other
Directorships (j) |
Christopher R. Bohane (k)
(born 1/18/74) | | Assistant Secretary and Assistant Clerk | | July 2005 | | Massachusetts Financial Services Company, Vice President and Senior Counsel |
John M. Corcoran (k)
(born 04/13/65) | | Treasurer | | October 2008 | | Massachusetts Financial Services Company, Senior Vice President (since October 2008); State Street Bank and Trust (financial services provider), Senior Vice President, (until September 2008) |
Ethan D. Corey (k)
(born 11/21/63) | | Assistant Secretary and Assistant Clerk | | July 2005 | | Massachusetts Financial Services Company, Senior Vice President and Associate General Counsel (since 2004); Dechert LLP (law firm), Counsel (prior to December 2004) |
David L. DiLorenzo (k)
(born 8/10/68) | | Assistant Treasurer | | July 2005 | | Massachusetts Financial Services Company, Vice President (since June 2005); JP Morgan Investor Services, Vice President (until June 2005) |
Timothy M. Fagan (k)
(born 7/10/68) | | Assistant Secretary and Assistant Clerk | | September 2005 | | Massachusetts Financial Services Company, Vice President and Senior Counsel (since September 2005); John Hancock Advisers, LLC, Vice President, Senior Attorney and Chief Compliance Officer (until August 2005) |
Mark D. Fischer (k)
(born 10/27/70) | | Assistant Treasurer | | July 2005 | | Massachusetts Financial Services Company, Vice President (since May 2005); JP Morgan Investment Management Company, Vice President (until May 2005) |
Robyn L. Griffin
(born 7/04/75) | | Assistant Independent Chief Compliance Officer | | August 2008 | | Griffin Compliance LLC (provider of compliance services), Principal (since August 2008); State Street Corporation (financial services provider), Mutual Fund Administration Assistant Vice President (October 2006 – July 2008); Liberty Mutual Group (insurance), Personal Market Assistant Controller (April 2006 – October 2006); Deloitte & Touche LLP (professional services firm), Senior Manager (prior to April 2006) |
53
Trustees and Officers – continued
| | | | | | |
Name, Date of Birth | | Position(s) Held
with Fund | | Trustee/Officer
Since (h) | | Principal Occupations During
the Past Five Years & Other
Directorships (j) |
Brian E. Langenfeld (k)
(born 3/07/73) | | Assistant Secretary and Assistant Clerk | | June 2006 | | Massachusetts Financial Services Company, Vice President and Senior Counsel (since May 2006); John Hancock Advisers, LLC, Assistant Vice President and Counsel (until April 2006) |
Ellen Moynihan (k)
(born 11/13/57) | | Assistant Treasurer | | April 1997 | | Massachusetts Financial Services Company, Senior Vice President |
Susan S. Newton (k)
(born 3/07/50) | | Assistant Secretary and Assistant Clerk | | May 2005 | | Massachusetts Financial Services Company, Senior Vice President and Associate General Counsel (since April 2005); John Hancock Advisers, LLC, Senior Vice President, Secretary and Chief Legal Officer (until April 2005) |
Susan A. Pereira (k)
(born 11/05/70) | | Assistant Secretary and Assistant Clerk | | July 2005 | | Massachusetts Financial Services Company, Vice President and Senior Counsel (since June 2004); Bingham McCutchen LLP (law firm), Associate (until June 2004) |
Mark N. Polebaum (k)
(born 5/01/52) | | Secretary and Clerk | | January 2006 | | Massachusetts Financial Services Company, Executive Vice President, General Counsel and Secretary (since January 2006); Wilmer Cutler Pickering Hale and Dorr LLP (law firm), Partner (until January 2006) |
Frank L. Tarantino
(born 3/07/44) | | Independent Chief Compliance Officer | | June 2004 | | Tarantino LLC (provider of compliance services), Principal (since June 2004); CRA Business Strategies Group (consulting services), Executive Vice President (until June 2004) |
Richard S. Weitzel (k)
(born 7/16/70) | | Assistant Secretary and Assistant Clerk | | October 2007 | | Massachusetts Financial Services Company, Vice President and Assistant General Counsel (since 2004); Massachusetts Department of Business and Technology, General Counsel (until April 2004) |
James O. Yost (k)
(born 6/12/60) | | Assistant Treasurer | | September 1990 | | Massachusetts Financial Services Company, Senior Vice President |
| (h) | Date first appointed to serve as Trustee/officer of an MFS fund. Each Trustee has served continuously since appointment unless indicated otherwise. For the period from December 15, 2004 until February 22, 2005, Messrs. Pozen and Manning served as Advisory Trustees. For the period March 2008 until October 2008, Ms. Dwyer served as Treasurer of the Funds. |
54
Trustees and Officers – continued
| (j) | Directorships or trusteeships of companies required to report to the Securities and Exchange Commission (i.e., “public companies”). |
| (k) | “Interested person” of the Trust within the meaning of the Investment Company Act of 1940 (referred to as the 1940 Act), which is the principal federal law governing investment companies like the fund, as a result of position with MFS. The address of MFS is 500 Boylston Street, Boston, Massachusetts 02116. |
| (n) | In 2004 and 2005, Mr. Butler provided consulting services to the independent compliance consultant retained by MFS pursuant to its settlement with the SEC concerning market timing and related matters. The terms of that settlement required that compensation and expenses related to the independent compliance consultant be borne exclusively by MFS and, therefore, MFS paid Mr. Butler for the services he rendered to the independent compliance consultant. In 2004 and 2005, MFS paid Mr. Butler a total of $351,119.29. |
Each Trustee (except Messrs. Butler, Kavanaugh and Uek and Ms. Goldfarb) has been elected by shareholders and each Trustee and officer holds office until his or her successor is chosen and qualified or until his or her earlier death, resignation, retirement or removal. The Trust held a shareholders’ meeting in 2005 to elect Trustees, and will hold a shareholders’ meeting at least once every five years thereafter, to elect Trustees. Messrs. Butler, Kavanaugh, Sherratt, Uek and Ms. Thomsen are members of the Trust’s Audit Committee.
Each of the Fund’s Trustees and officers holds comparable positions with certain other funds of which MFS or a subsidiary is the investment adviser or distributor, and, in the case of the officers, with certain affiliates of MFS. As of January 1, 2009, the Trustees served as board members of 104 funds within the MFS Family of Funds.
The Statement of Additional Information for the Fund and further information about the Trustees are available without charge upon request by calling 1-800-225-2606.
| | |
| Investment Adviser | | Custodian |
Massachusetts Financial Services Company
500 Boylston Street, Boston, MA 02116-3741 | | State Street Bank and Trust
1 Lincoln Street, Boston, MA 02111-2900 |
| Distributor | | Independent Registered Public Accounting Firm |
MFS Fund Distributors, Inc.
500 Boylston Street, Boston, MA 02116-3741 | | Ernst & Young LLP
200 Clarendon Street, Boston, MA 02116 |
| Portfolio Managers | | |
Joseph MacDougall Katrina Mead | | |
55
BOARD REVIEW OF INVESTMENT ADVISORY AGREEMENT
The Investment Company Act of 1940 requires that both the full Board of Trustees and a majority of the non-interested (“independent”) Trustees, voting separately, annually approve the continuation of the Fund’s investment advisory agreement with MFS. The Trustees consider matters bearing on the Fund and its advisory arrangements at their meetings throughout the year, including a review of performance data at each regular meeting. In addition, the independent Trustees met several times over the course of three months beginning in May and ending in July, 2009 (“contract review meetings”) for the specific purpose of considering whether to approve the continuation of the investment advisory agreement for the Fund and the other investment companies that the Board oversees (the “MFS Funds”). The independent Trustees were assisted in their evaluation of the Fund’s investment advisory agreement by independent legal counsel, from whom they received separate legal advice and with whom they met separately from MFS during various contract review meetings. The independent Trustees were also assisted in this process by the MFS Funds’ Independent Chief Compliance Officer, a full-time senior officer appointed by and reporting to the independent Trustees.
In connection with their deliberations regarding the continuation of the investment advisory agreement, the Trustees, including the independent Trustees, considered such information and factors as they believed, in light of the legal advice furnished to them and their own business judgment, to be relevant. The investment advisory agreement for the Fund was considered separately, although the Trustees also took into account the common interests of all MFS Funds in their review. As described below, the Trustees considered the nature, quality, and extent of the various investment advisory, administrative, and shareholder services performed by MFS under the existing investment advisory agreement and other arrangements with the Fund.
In connection with their contract review meetings, the Trustees received and relied upon materials that included, among other items: (i) information provided by Lipper Inc., an independent third party, on the investment performance of the Fund for various time periods ended December 31, 2008 and the investment performance of a group of funds with substantially similar investment classifications/objectives (the “Lipper performance universe”), (ii) information provided by Lipper Inc. on the Fund’s advisory fees and other expenses and the advisory fees and other expenses of comparable funds identified by Lipper Inc. (the “Lipper expense group”), (iii) information provided by MFS on the advisory fees of comparable portfolios of other clients of MFS, including institutional separate accounts and other clients, (iv) information as to whether and to what extent applicable expense waivers,
56
Board Review of Investment Advisory Agreement – continued
reimbursements or fee “breakpoints” are observed for the Fund, (v) information regarding MFS’ financial results and financial condition, including MFS’ and certain of its affiliates’ estimated profitability from services performed for the Fund and the MFS Funds as a whole, (vi) MFS’ views regarding the outlook for the mutual fund industry and the strategic business plans of MFS, (vii) descriptions of various functions performed by MFS for the Funds, such as compliance monitoring and portfolio trading practices, and (viii) information regarding the overall organization of MFS, including information about MFS’ senior management and other personnel providing investment advisory, administrative and other services to the Fund and the other MFS Funds. The comparative performance, fee and expense information prepared and provided by Lipper Inc. was not independently verified and the independent Trustees did not independently verify any information provided to them by MFS.
The Trustees’ conclusion as to the continuation of the investment advisory agreement was based on a comprehensive consideration of all information provided to the Trustees and not the result of any single factor. Some of the factors that figured particularly in the Trustees’ deliberations are described below, although individual Trustees may have evaluated the information presented differently from one another, giving different weights to various factors. It is also important to recognize that the fee arrangements for the Fund and other MFS Funds are the result of years of review and discussion between the independent Trustees and MFS, that certain aspects of such arrangements may receive greater scrutiny in some years than in others, and that the Trustees’ conclusions may be based, in part, on their consideration of these same arrangements during the course of the year and in prior years.
Based on information provided by Lipper Inc., the Trustees reviewed the Fund’s total return investment performance as well as the performance of peer groups of funds over various time periods. The Trustees placed particular emphasis on the total return performance of the Fund’s Class A shares in comparison to the performance of funds in its Lipper performance universe over the three-year period ended December 31, 2008, which the Trustees believed was a long enough period to reflect differing market conditions. The total return performance of the Fund’s Class A shares was in the 2nd quintile relative to the other funds in the universe for this three-year period (the 1st quintile being the best performers and the 5th quintile being the worst performers). The total return performance of the Fund’s Class A shares was in the 3rd quintile for the one-year period and the 2nd quintile for the five-year period ended December 31, 2008 relative to the Lipper performance universe. Because of the passage of time, these performance results are likely to differ from the performance results for more recent periods, including those shown elsewhere in this report.
57
Board Review of Investment Advisory Agreement – continued
In the course of their deliberations, the Trustees took into account information provided by MFS in connection with the contract review meetings, as well as during investment review meetings conducted with portfolio management personnel during the course of the year regarding the Fund’s performance. After reviewing these and related factors, the Trustees concluded, within the context of their overall conclusions regarding the investment advisory agreement, that they were satisfied with MFS’ responses and efforts relating to investment performance.
In assessing the reasonableness of the Fund’s advisory fee, the Trustees considered, among other information, the Fund’s advisory fee and the total expense ratio of the Fund’s Class A shares as a percentage of average daily net assets and the advisory fee and total expense ratios of peer groups of funds based on information provided by Lipper Inc. The Trustees considered that MFS currently observes an expense limitation for the Fund. The Trustees also considered that, according to the Lipper data (which takes into account any fee reductions or expense limitations that were in effect during the Fund’s last fiscal year), the Fund’s effective advisory fee rate was lower than the Lipper expense group median, and the Fund’s total expense ratio was approximately at the Lipper expense group median.
The Trustees also considered the advisory fees charged by MFS to institutional accounts. In comparing these fees, the Trustees considered information provided by MFS as to the generally broader scope of services provided by MFS to the Fund in comparison to institutional accounts, the higher demands placed on MFS’ investment personnel and trading infrastructure as a result of the daily cash in-flows and out-flows of the Fund, and the impact on MFS and expenses associated with the more extensive regulatory regime to which the Fund is subject in comparison to institutional accounts.
The Trustees also considered whether the Fund is likely to benefit from any economies of scale in the management of the Fund in the event of growth in assets of the Fund. They noted the Fund’s advisory fee rate schedule is currently subject to a contractual breakpoint that reduces the Fund’s advisory fee rate on average daily net assets over $500 million. The Trustees concluded that the existing breakpoint was sufficient to allow the Fund to benefit from economies of scale as its assets grow.
The Trustees also considered information prepared by MFS relating to MFS’ costs and profits with respect to the Fund, the MFS Funds considered as a group, and other investment companies and accounts advised by MFS, as well as MFS’ methodologies used to determine and allocate its costs to the MFS Funds, the Fund and other accounts and products for purposes of estimating profitability.
58
Board Review of Investment Advisory Agreement – continued
After reviewing these and other factors described herein, the Trustees concluded, within the context of their overall conclusions regarding the investment advisory agreement, that the advisory fees charged to the Fund represent reasonable compensation in light of the services being provided by MFS to the Fund.
In addition, the Trustees considered MFS’ resources and related efforts to continue to retain, attract and motivate capable personnel to serve the Fund. The Trustees also considered current and developing conditions in the financial services industry, including the entry into the industry of large and well-capitalized companies which are spending, and appear to be prepared to continue to spend, substantial sums to engage personnel and to provide services to competing investment companies. In this regard, the Trustees also considered the financial resources of MFS and its ultimate parent, Sun Life Financial Inc. The Trustees also considered the advantages and possible disadvantages to the Fund of having an adviser that also serves other investment companies as well as other accounts.
The Trustees also considered the nature, quality, cost, and extent of administrative, transfer agency, and distribution services provided to the Fund by MFS and its affiliates under agreements and plans other than the investment advisory agreement, including any 12b-1 fees the Fund pays to MFS Fund Distributors, Inc., an affiliate of MFS. The Trustees also considered the nature, extent and quality of certain other services MFS performs or arranges for on the Fund’s behalf, which may include securities lending programs, directed expense payment programs, class action recovery programs, and MFS’ interaction with third-party service providers, principally custodians and sub-custodians. The Trustees concluded that the various non-advisory services provided by MFS and its affiliates on behalf of the Funds were satisfactory.
The Trustees also considered benefits to MFS from the use of the Fund’s portfolio brokerage commissions, if applicable, to pay for investment research, and various other factors. Additionally, the Trustees considered so-called “fall-out benefits” to MFS such as reputational value derived from serving as investment manager to the Fund.
Based on their evaluation of factors that they deemed to be material, including those factors described above, the Board of Trustees, including a majority of the independent Trustees, concluded that the Fund’s investment advisory agreement with MFS should be continued for an additional one-year period, commencing August 1, 2009.
A discussion regarding the Board’s most recent review and renewal of the fund’s Investment Advisory Agreement with MFS will be available on or about November 1, 2009 by clicking on the fund’s name under “Mutual Funds” in the “Products and Performance” section of the MFS Web site (mfs.com).
59
PROXY VOTING POLICIES AND INFORMATION
A general description of the MFS funds’ proxy voting policies and procedures is available without charge, upon request, by calling
1-800-225-2606, by visiting the Proxy Voting section of mfs.com or by visiting the SEC’s Web site at http://www.sec.gov.
Information regarding how the fund voted proxies relating to portfolio securities during the most recent twelve-month period ended June 30 is available without charge by visiting the Proxy Voting section of mfs.com or by visiting the SEC’s Web site at http://www.sec.gov.
QUARTERLY PORTFOLIO DISCLOSURE
The fund will file a complete schedule of portfolio holdings with the Securities and Exchange Commission (the Commission) for the first and third quarters of each fiscal year on Form N-Q. The fund’s Form N-Q may be reviewed and copied at the:
Public Reference Room
Securities and Exchange Commission
100 F Street, NE, Room 1580
Washington, D.C. 20549
Information on the operation of the Public Reference Room may be obtained by calling the Commission at 1-800-SEC-0330. The fund’s Form N-Q is available on the EDGAR database on the Commission’s Internet Web site at http://www.sec.gov, and copies of this information may be obtained, upon payment of a duplicating fee, by electronic request at the following e-mail address: publicinfo@sec.gov or by writing the Public Reference Section at the above address.
A shareholder can also obtain the quarterly portfolio holdings report at mfs.com.
FURTHER INFORMATION
From time to time, MFS may post important information about the fund or the MFS funds on the MFS web site (mfs.com). This information is available by visiting the “News & Commentary” section of mfs.com or by clicking on the fund’s name under “Mutual Funds” in the “Products and Performance” section of mfs.com.
FEDERAL TAX INFORMATION (unaudited)
The fund will notify shareholders of amounts for use in preparing 2009 income tax forms in January 2010. The following information is provided pursuant to provisions of the Internal Revenue Code.
The fund designates the maximum amount allowable as qualified dividend income eligible for the 15% tax rate.
For corporate shareholders, 100% of the ordinary income dividends paid during the fiscal year qualify for the corporate dividends received deduction.
60
MFS® PRIVACY NOTICE
Privacy is a concern for every investor today. At MFS Investment Management® and the MFS funds, we take this concern very seriously. We want you to understand our policies about the investment products and services that we offer, and how we protect the nonpublic personal information of investors who have a direct relationship with us and our wholly owned subsidiaries.
Throughout our business relationship, you provide us with personal information. We maintain information and records about you, your investments, and the services you use. Examples of the nonpublic personal information we maintain include
| | Ÿ | | data from investment applications and other forms |
| | Ÿ | | share balances and transactional history with us, our affiliates, or others |
| | Ÿ | | facts from a consumer reporting agency |
We do not disclose any nonpublic personal information about our customers or former customers to anyone, except as permitted by law. We may share nonpublic personal information with third parties or certain of our affiliates in connection with servicing your account or processing your transactions. We may share information with companies or financial institutions that perform marketing services on our behalf or with other financial institutions with which we have joint marketing arrangements, subject to any legal requirements.
Authorization to access your nonpublic personal information is limited to appropriate personnel who provide products, services, or information to you. We maintain physical, electronic, and procedural safeguards to help protect the personal information we collect about you.
If you have any questions about the MFS privacy policy, please call 1-800-225-2606 any business day between 8 a.m. and 8 p.m. Eastern time.
Note: If you own MFS products or receive MFS services in the name of a third party such as a bank or broker-dealer, their privacy policy may apply to you instead of ours.
61
CONTACT US
| | |
Web site mfs.com MFS TALK 1-800-637-8255 24 hours a day Account service and literature Shareholders 1-800-225-2606 Investment professionals 1-800-343-2829 Retirement plan services 1-800-637-1255 | | Mailing address MFS Service Center, Inc. P.O. Box 55824 Boston, MA 02205-5824 Overnight mail MFS Service Center, Inc. c/o Boston Financial Data Services 30 Dan Road Canton, MA 02021-2809 |

Save paper with eDelivery. MFS® will send you prospectuses, reports, and proxies directly via e-mail so you will get information faster with less mailbox clutter. To sign up: 1. go to mfs.com. 2. log in via MFS® Access. 3. select eDelivery. If you own your MFS fund shares through a financial institution or a retirement plan, MFS® TALK, MFS Access, and eDelivery may not be available to you.


MFS® Core Growth Fund
SIPC Contact Information:
You may obtain information about the Securities Investor Protection Corporation (“SIPC”), including the SIPC Brochure, by contacting SIPC either by telephone (202-371-8300) or by accessing SIPC’s website address (www.sipc.org).
The report is prepared for the general information of shareholders. It is authorized for distribution to prospective investors only when preceded or accompanied by a current prospectus.
NOT FDIC INSURED Ÿ MAY LOSE VALUE Ÿ
NO BANK GUARANTEE
8/31/09
CGF-ANN

LETTER FROM THE CEO
Dear Shareholders:
In the fall of 2008, the markets took investors on what was perhaps the most tumultuous ride of their lives. Many are now debating when the market will stage a sustainable recovery, but not even the most experienced investor can provide a definitive answer to that question.
Even so, the basic rules of investing have not changed, and the turbulence reinforced the benefits of investing through the waves. Investors who jumped ship early on may have regretted their decisions when the markets gained some traction in the early half of this year. While anyone with a short-term horizon may have needed to take some action, most with longer-term goals probably found the best option was to stick with their long-term strategy.
At MFS® we believe investors are always best served by developing a plan with their investment professionals that addresses specific long-term needs. Most advisors agree that yearly reviews are important to monitor a plan’s progress. Most would also caution their clients against reacting too quickly to the daily news. When markets do recover, they often gain ground in quick, sudden bursts. If you are out of the market, you can easily miss the benefits of these rallies.
Few of us would again like to live through the kind of market turmoil we saw over the past year. But as turbulent as markets were, in our view, they proved that the fundamental principles of long-term investing still apply.
Respectfully,

Robert J. Manning
Chief Executive Officer and Chief Investment Officer
MFS Investment Management®
October 15, 2009
The opinions expressed in this letter are subject to change, may not be relied upon for investment advice, and no forecasts can be guaranteed.
1
PORTFOLIO COMPOSITION
Portfolio structure
| | |
| Top ten holdings | | |
| Apple, Inc. | | 4.5% |
| Google, Inc., “A” | | 3.4% |
| Cisco Systems, Inc. | | 2.6% |
| Express Scripts, Inc. | | 1.8% |
| Hewlett-Packard Co. | | 1.8% |
| Bank of America Corp. | | 1.8% |
| Gilead Sciences, Inc. | | 1.7% |
| EMC Corp. | | 1.5% |
| St. Jude Medical, Inc. | | 1.5% |
| Philip Morris International, Inc. | | 1.5% |
| | |
| Equity sectors | | |
| Technology | | 26.0% |
| Health Care | | 15.8% |
| Retailing | | 8.6% |
| Financial Services | | 8.5% |
| Leisure | | 7.0% |
| Consumer Staples | | 6.4% |
| Special Products & Services | | 6.0% |
| Basic Materials | | 5.8% |
| Energy | | 4.7% |
| Industrial Goods & Services | | 4.1% |
| Utilities & Communications | | 1.6% |
| Transportation | | 1.5% |
Percentages are based on net assets as of 8/31/09.
The portfolio is actively managed and current holdings may be different.
2
MANAGEMENT REVIEW
Summary of Results
For the twelve months ended August 31, 2009, Class A shares of the MFS Core Growth Fund provided a total return of –22.48%, at net asset value. This compares with a return of –16.76% for the fund’s benchmark, the Russell 1000 Growth Index.
Market Environment
The global economy and financial markets experienced substantial deterioration and extraordinary volatility over most of the reporting period. Through the first quarter of 2009, the strong headwinds in the U.S. included accelerated deterioration in the housing market, anemic corporate investment, a rapidly declining job market, and a much tighter credit environment. During the early stages of the period, a seemingly continuous series of tumultuous financial events hammered markets. As a result of this barrage of turbulent news, global equity markets pushed significantly lower and credit markets witnessed the worst market decline since the beginning of the credit crisis. The synchronized global downturn in economic activity experienced in the fourth quarter of 2008 and the first quarter of 2009 was among the most intense in the post-World War II period. Not only did Europe and Japan fall into very deep recessions, but an increasingly powerful engine of global growth – emerging markets – also contracted almost across the board. Though credit conditions and equity indices improved considerably during the second half of the period, the degree of financial and macroeconomic dislocation remained significant.
During the first half of the reporting period, the Fed continued to cut interest rates aggressively towards zero, while making increasing use of its new lending facilities to alleviate ever-tightening credit markets. On the fiscal front, the U.S. Treasury designed and began implementing a massive fiscal stimulus package. As inflationary concerns diminished in the face of global deleveraging, and equity and credit markets deteriorated more sharply, central banks around the world also cut interest rates dramatically. Policy makers in different countries increasingly sought to coordinate their rescue efforts, which resulted in a number of international actions such as the agreement of swap lines between the Federal Reserve and a number of other central banks and a substantial increase in the financial resources of the International Monetary Fund. By the middle of the period, several central banks had approached their lower bound on policy rates and were examining the implementation and ramifications of quantitative easing as a means to further loosen monetary policy to offset the continuing fall in global economic activity. However, by the end of the period, there emerged broadening signs that the worst of the global
3
Management Review – continued
macroeconomic deterioration had passed, which caused the subsequent rise in asset valuations. As asset prices rebounded in the second half of the period and the demand for liquidity waned, the debate concerning monetary exit strategies had begun, creating added uncertainty regarding the forward path of policy rates.
Detractors from Performance
Stock selection in the leisure sector held back performance relative to the Russell 1000 Growth Index. The fund’s holdings of educational software and video game publishing company Ubisoft Entertainment (aa)(g) was a top relative detractor. Shares of Ubisoft fell as the global economic slowdown and pullback in consumer spending led to weaker-than-expected sales in the video game industry.
Stock selection in the health care and financial services sectors also hurt relative results over the reporting period. In health care, holdings of biopharmaceutical company Celgene and global health care company Schering-Plough were among the sector’s top detractors. In the financial services sector, holdings of poor-performing trust bank State Street Corporation had a negative impact on relative performance. Shares of State Street declined as the company reported substantial unrealized losses on investments and commercial paper.
Elsewhere, the fund’s holdings of money transfer company Western Union, oilfield services provider Halliburton, wireless solutions provider Research in Motion (aa)(g), and commercial information company Dun & Bradstreet hindered relative performance. An underweighted position in software giant Microsoft also held back relative results as the company outperformed the benchmark.
The fund’s cash position was also a detractor from relative performance. The fund holds cash to buy new holdings and to provide liquidity. The most significant impact came during the second half of the reporting period, when equity markets rose, as measured by the fund’s benchmark, and holding cash hurt performance versus the benchmark, which has no cash position.
Contributors to Performance
An overweighted position and, to a lesser extent, stock selection in the basic materials sector boosted relative results. An underweighted position in the transportation sector also aided relative performance. No individual stocks within either of these sectors were among the fund’s top contributors for the period.
Elsewhere, overweighted positions in for-profit education company Apollo Group and computer and personal electronics maker Apple bolstered relative results as both stocks outperformed the benchmark. The fund’s holdings of access infrastructure products manufacturer Citrix Systems (g) and oil and gas
4
Management Review – continued
exploration company Petroleo Brasileiro (aa) also helped. Shares of Citrix rose as the company realized gains from tight cost controls and strong sales of its XenApp virtualization technology. The fund’s relatively small exposure to struggling household products manufacturer Proctor & Gamble (g), which underperformed the benchmark over the reporting period, was another positive factor for relative performance.
Respectfully,
Stephen Pesek
Portfolio Manager
| (aa) | Security is not a benchmark constituent. |
| (g) | Security was not held in the portfolio at period end. |
The views expressed in this report are those of the portfolio manager only through the end of the period of the report as stated on the cover and do not necessarily reflect the views of MFS or any other person in the MFS organization. These views are subject to change at any time based on market or other conditions, and MFS disclaims any responsibility to update such views. These views may not be relied upon as investment advice or an indication of trading intent on behalf of any MFS portfolio. References to specific securities are not recommendations of such securities, and may not be representative of any MFS portfolio’s current or future investments.
5
PERFORMANCE SUMMARY THROUGH 8/31/09
The following chart illustrates a representative class of the fund's historical performance in comparison to its benchmark(s). Performance results include the deduction of the maximum applicable sales charge and reflect the percentage change in net asset value, including reinvestment of dividends and capital gains distributions. The performance of other share classes will be greater than or less than that of the class depicted below. Benchmarks are unmanaged and may not be invested in directly. Benchmark returns do not reflect sales charges, commissions or expenses. (See Notes to Performance Summary.)
Performance data shown represents past performance and is no guarantee of future results. Investment return and principal value fluctuate so your shares, when sold, may be worth more or less than the original cost; current performance may be lower or higher than quoted. The performance shown does not reflect the deduction of taxes, if any, that a shareholder would pay on fund distributions or the redemption of fund shares.
Growth of a Hypothetical $10,000 Investment
6
Performance Summary – continued
Total Returns through 8/31/09
Average annual without sales charge
| | | | | | | | | | | | | | |
| | | Share class | | Class inception date | | 1-yr | | 5-yr | | 10-yr | | Life (t) | | |
| | | A | | 1/02/96 | | (22.48)% | | 1.33% | | (1.12)% | | N/A | | |
| | | B | | 12/31/99 | | (23.07)% | | 0.64% | | N/A | | (4.40)% | | |
| | | C | | 12/31/99 | | (23.07)% | | 0.64% | | N/A | | (4.40)% | | |
| | | I | | 1/02/97 | | (22.26)% | | 1.68% | | (0.79)% | | N/A | | |
| | | W | | 5/01/06 | | (22.33)% | | N/A | | N/A | | (4.30)% | | |
| | | R1 | | 4/01/05 | | (23.08)% | | N/A | | N/A | | (0.93)% | | |
| | | R2 | | 10/31/03 | | (22.63)% | | 1.04% | | N/A | | 0.94% | | |
| | | R3 | | 4/01/05 | | (22.45)% | | N/A | | N/A | | (0.20)% | | |
| | | R4 | | 4/01/05 | | (22.31)% | | N/A | | N/A | | 0.06% | | |
| Comparative benchmark | | | | | | | | | | |
| | | Russell 1000 Growth Index (f) | | (16.76)% | | 1.21% | | (3.17)% | | N/A | | |
| Average annual with sales charge | | | | | | | | | | |
| | | A
With Initial Sales Charge (5.75%) | | (26.94)% | | 0.14% | | (1.70)% | | N/A | | |
| | | B
With CDSC (Declining over six years from 4% to 0%) (x) | | (26.15)% | | 0.28% | | N/A | | (4.40)% | | |
| | | C
With CDSC (1% for 12 months) (x) | | (23.84)% | | 0.64% | | N/A | | (4.40)% | | |
Class I, W, R1, R2, R3, and R4 shares do not have a sales charge.
| CDSC | – Contingent Deferred Sales Charge. |
| (f) | Source: FactSet Research Systems, Inc. |
| (t) | For the period from the commencement of the class’ inception date through the stated period end (for those share classes with less than 10 years of Performance history). No comparative benchmark information is provided for “life” periods. (See Notes to Performance Summary below.) |
| (x) | Assuming redemption at the end of the applicable period. |
Benchmark Definition
Russell 1000 Growth Index – constructed to provide a comprehensive barometer for growth securities in the large-cap segment of the U.S. equity universe. Companies in this index generally have higher price-to-book ratios and higher forecasted growth values.
It is not possible to invest directly in an index.
Notes to Performance Summary
Average annual total return represents the average annual change in value for each share class for the periods presented. Life returns are presented where the
7
Performance Summary – continued
share class has less than 10 years of performance history and represent the average annual total return from the class inception date to the stated period end date. As the fund’s share classes may have different inception dates, the life returns may represent different time periods and may not be comparable. As a result, no comparative benchmark performance information is provided for life periods.
Performance results reflect any applicable expense subsidies and waivers in effect during the periods shown. Without such subsidies and waivers the fund’s performance results would be less favorable. Please see the prospectus and financial statements for complete details.
From time to time the fund may receive proceeds from litigation settlements, without which performance would be lower.
8
EXPENSE TABLE
Fund expenses borne by the shareholders during the period,
March 1, 2009 through August 31, 2009
As a shareholder of the fund, you incur two types of costs: (1) transaction costs, including sales charges (loads) on certain purchase or redemption payments, and (2) ongoing costs, including management fees; distribution and service (12b-1) fees; and other fund expenses. This example is intended to help you understand your ongoing costs (in dollars) of investing in the fund and to compare these costs with the ongoing costs of investing in other mutual funds.
The example is based on an investment of $1,000 invested at the beginning of the period and held for the entire period March 1, 2009 through August 31, 2009.
The expenses include the payment of a portion of the transfer-agent-related expenses of MFS funds that invest in the fund. For further information, please see the Notes to the Financial Statements.
Actual Expenses
The first line for each share class in the following table provides information about actual account values and actual expenses. You may use the information in this line, together with the amount you invested, to estimate the expenses that you paid over the period. Simply divide your account value by $1,000 (for example, an $8,600 account value divided by $1,000 = 8.6), then multiply the result by the number in the first line under the heading entitled “Expenses Paid During Period” to estimate the expenses you paid on your account during this period.
Hypothetical Example for Comparison Purposes
The second line for each share class in the following table provides information about hypothetical account values and hypothetical expenses based on the fund’s actual expense ratio and an assumed rate of return of 5% per year before expenses, which is not the fund’s actual return. The hypothetical account values and expenses may not be used to estimate the actual ending account balance or expenses you paid for the period. You may use this information to compare the ongoing costs of investing in the fund and other funds. To do so, compare this 5% hypothetical example with the 5% hypothetical examples that appear in the shareholder reports of the other funds.
Please note that the expenses shown in the table are meant to highlight your ongoing costs only and do not reflect any transactional costs, such as sales charges (loads). Therefore, the second line for each share class in the table is useful in comparing ongoing costs only, and will not help you determine the
9
Expense Table – continued
relative total costs of owning different funds. In addition, if these transactional costs were included, your costs would have been higher.
| | | | | | | | | | |
Share
Class | | | | Annualized
Expense
Ratio | | Beginning
Account Value
3/01/09 | | Ending
Account Value
8/31/09 | | Expenses
Paid During
Period (p)
3/01/09-8/31/09 |
| A | | Actual | | 1.23% | | $1,000.00 | | $1,281.42 | | $7.07 |
| | Hypothetical (h) | | 1.23% | | $1,000.00 | | $1,019.00 | | $6.26 |
| B | | Actual | | 1.98% | | $1,000.00 | | $1,275.73 | | $11.36 |
| | Hypothetical (h) | | 1.98% | | $1,000.00 | | $1,015.22 | | $10.06 |
| C | | Actual | | 1.98% | | $1,000.00 | | $1,275.73 | | $11.36 |
| | Hypothetical (h) | | 1.98% | | $1,000.00 | | $1,015.22 | | $10.06 |
| I | | Actual | | 0.98% | | $1,000.00 | | $1,282.70 | | $5.64 |
| | Hypothetical (h) | | 0.98% | | $1,000.00 | | $1,020.27 | | $4.99 |
| W | | Actual | | 1.04% | | $1,000.00 | | $1,281.84 | | $5.98 |
| | Hypothetical (h) | | 1.04% | | $1,000.00 | | $1,019.96 | | $5.30 |
| R1 | | Actual | | 1.98% | | $1,000.00 | | $1,275.56 | | $11.36 |
| | Hypothetical (h) | | 1.98% | | $1,000.00 | | $1,015.22 | | $10.06 |
| R2 | | Actual | | 1.47% | | $1,000.00 | | $1,279.89 | | $8.45 |
| | Hypothetical (h) | | 1.47% | | $1,000.00 | | $1,017.80 | | $7.48 |
| R3 | | Actual | | 1.23% | | $1,000.00 | | $1,280.51 | | $7.07 |
| | Hypothetical (h) | | 1.23% | | $1,000.00 | | $1,019.00 | | $6.26 |
| R4 | | Actual | | 0.98% | | $1,000.00 | | $1,281.73 | | $5.64 |
| | Hypothetical (h) | | 0.98% | | $1,000.00 | | $1,020.27 | | $4.99 |
| (h) | 5% class return per year before expenses. |
| (p) | Expenses paid is equal to each class’ annualized expense ratio, as shown above, multiplied by the average account value over the period, multiplied by the number of days in the period, divided by the number of days in the year. Expenses paid do not include any applicable sales charges (loads). If these transaction costs had been included, your costs would have been higher. |
10
PORTFOLIO OF INVESTMENTS
8/31/09
The Portfolio of Investments is a complete list of all securities owned by your fund. It is categorized by broad-based asset classes.
| | | | | |
| Common Stocks - 96.0% | | | | | |
| Issuer | | Shares/Par | | Value ($) |
| | | | | |
| Aerospace - 2.1% | | | | | |
| Goodrich Corp. | | 154,670 | | $ | 8,531,597 |
| Lockheed Martin Corp. | | 71,790 | | | 5,382,814 |
| Precision Castparts Corp. | | 64,900 | | | 5,924,072 |
| United Technologies Corp. | | 217,430 | | | 12,906,645 |
| | | | | |
| | | | | $ | 32,745,128 |
| Alcoholic Beverages - 0.4% | | | | | |
| Diageo PLC | | 406,300 | | $ | 6,310,105 |
| | |
| Apparel Manufacturers - 1.3% | | | | | |
| Coach, Inc. | | 137,700 | | $ | 3,895,533 |
| NIKE, Inc., “B” | | 297,770 | | | 16,493,480 |
| | | | | |
| | | | | $ | 20,389,013 |
| Biotechnology - 2.4% | | | | | |
| Celgene Corp. (a) | | 135,440 | | $ | 7,065,905 |
| Genzyme Corp. (a) | | 86,940 | | | 4,843,427 |
| Gilead Sciences, Inc. (a) | | 592,160 | | | 26,682,730 |
| | | | | |
| | | | | $ | 38,592,062 |
| Broadcasting - 1.3% | | | | | |
| Discovery Communications, Inc., “A” (a) | | 314,100 | | $ | 8,141,472 |
| Walt Disney Co. | | 473,030 | | | 12,317,701 |
| | | | | |
| | | | | $ | 20,459,173 |
| Brokerage & Asset Managers - 2.4% | | | | | |
| Affiliated Managers Group, Inc. (a) | | 246,840 | | $ | 16,126,057 |
| Charles Schwab Corp. | | 644,370 | | | 11,637,322 |
| CME Group, Inc. | | 23,263 | | | 6,770,464 |
| IntercontinentalExchange, Inc. (a) | | 44,100 | | | 4,136,580 |
| | | | | |
| | | | | $ | 38,670,423 |
| Business Services - 4.7% | | | | | |
| Cognizant Technology Solutions Corp., “A” (a) | | 413,900 | | $ | 14,436,832 |
| Dun & Bradstreet Corp. | | 65,910 | | | 4,814,066 |
| Fidelity National Information Services, Inc. | | 555,100 | | | 13,633,256 |
| MasterCard, Inc., “A” | | 77,870 | | | 15,778,798 |
11
Portfolio of Investments – continued
| | | | | |
| Issuer | | Shares/Par | | Value ($) |
| | | | | |
| Common Stocks - continued | | | | | |
| Business Services - continued | | | | | |
| Visa, Inc., “A” | | 140,080 | | $ | 9,959,688 |
| Western Union Co. | | 938,500 | | | 16,930,540 |
| | | | | |
| | | | | $ | 75,553,180 |
| Chemicals - 2.4% | | | | | |
| 3M Co. | | 303,710 | | $ | 21,897,491 |
| Ecolab, Inc. | | 301,650 | | | 12,756,779 |
| Monsanto Co. | | 38,940 | | | 3,266,287 |
| | | | | |
| | | | | $ | 37,920,557 |
| Computer Software - 3.7% | | | | | |
| Adobe Systems, Inc. (a) | | 602,750 | | $ | 18,938,405 |
| Intuit, Inc. (a) | | 449,800 | | | 12,490,946 |
| Microsoft Corp. | | 232,730 | | | 5,736,795 |
| Oracle Corp. | | 1,018,116 | | | 22,266,197 |
| | | | | |
| | | | | $ | 59,432,343 |
| Computer Software - Systems - 9.5% | | | | | |
| Apple, Inc. (a) | | 423,240 | | $ | 71,193,200 |
| EMC Corp. (a) | | 1,507,050 | | | 23,962,095 |
| Hewlett-Packard Co. | | 631,040 | | | 28,327,386 |
| International Business Machines Corp. | | 190,550 | | | 22,494,428 |
| VMware, Inc. (a) | | 138,200 | | | 4,896,426 |
| | | | | |
| | | | | $ | 150,873,535 |
| Consumer Products - 1.5% | | | | | |
| Avon Products, Inc. | | 321,300 | | $ | 10,239,831 |
| Colgate-Palmolive Co. | | 176,850 | | | 12,856,995 |
| | | | | |
| | | | | $ | 23,096,826 |
| Consumer Services - 1.3% | | | | | |
| Apollo Group, Inc., “A” (a) | | 133,520 | | $ | 8,654,766 |
| priceline.com, Inc. (a) | | 73,030 | | | 11,245,159 |
| | | | | |
| | | | | $ | 19,899,925 |
| Containers - 0.7% | | | | | |
| Owens-Illinois, Inc. (a) | | 343,610 | | $ | 11,662,123 |
| | |
| Electrical Equipment - 1.7% | | | | | |
| Danaher Corp. | | 261,110 | | $ | 15,851,988 |
| Tyco Electronics Ltd. | | 515,070 | | | 11,753,897 |
| | | | | |
| | | | | $ | 27,605,885 |
12
Portfolio of Investments – continued
| | | | | |
| Issuer | | Shares/Par | | Value ($) |
| | | | | |
| Common Stocks - continued | | | | | |
| Electronics - 4.8% | | | | | |
| Broadcom Corp., “A” (a) | | 107,000 | | $ | 3,044,150 |
| Corning, Inc. | | 202,600 | | | 3,055,208 |
| Intel Corp. | | 1,091,060 | | | 22,170,339 |
| Marvell Technology Group Ltd. (a) | | 838,930 | | | 12,793,683 |
| Samsung Electronics Co. Ltd. | | 27,404 | | | 16,917,675 |
| Silicon Laboratories, Inc. (a) | | 278,180 | | | 12,529,227 |
| Taiwan Semiconductor Manufacturing Co. Ltd., ADR | | 535,200 | | | 5,726,640 |
| | | | | |
| | | | | $ | 76,236,922 |
| Energy - Independent - 2.3% | | | | | |
| Anadarko Petroleum Corp. | | 250,100 | | $ | 13,222,787 |
| Occidental Petroleum Corp. | | 133,000 | | | 9,722,300 |
| Southwestern Energy Co. (a) | | 182,800 | | | 6,738,008 |
| XTO Energy, Inc. | | 162,580 | | | 6,275,588 |
| | | | | |
| | | | | $ | 35,958,683 |
| Energy - Integrated - 0.4% | | | | | |
| Petroleo Brasileiro S.A., ADR | | 172,060 | | $ | 6,820,458 |
| | |
| Entertainment - 0.6% | | | | | |
| DreamWorks Animation, Inc., “A” (a) | | 261,390 | | $ | 8,824,526 |
| | |
| Food & Beverages - 3.0% | | | | | |
| Coca-Cola Co. | | 240,940 | | $ | 11,750,644 |
| Mead Johnson Nutrition Co., “A” | | 296,200 | | | 11,747,292 |
| Nestle S.A. | | 140,347 | | | 5,829,126 |
| PepsiCo, Inc. | | 334,860 | | | 18,976,516 |
| | | | | |
| | | | | $ | 48,303,578 |
| Food & Drug Stores - 2.1% | | | | | |
| CVS Caremark Corp. | | 606,866 | | $ | 22,769,612 |
| Walgreen Co. | | 334,300 | | | 11,326,084 |
| | | | | |
| | | | | $ | 34,095,696 |
| Gaming & Lodging - 2.0% | | | | | |
| Carnival Corp. | | 208,500 | | $ | 6,098,625 |
| International Game Technology | | 200,130 | | | 4,186,720 |
| Las Vegas Sands Corp. (a) | | 340,100 | | | 4,849,826 |
| Royal Caribbean Cruises Ltd. | | 571,000 | | | 10,894,680 |
| Starwood Hotels & Resorts Worldwide, Inc. | | 197,800 | | | 5,890,484 |
| | | | | |
| | | | | $ | 31,920,335 |
13
Portfolio of Investments – continued
| | | | | |
| Issuer | | Shares/Par | | Value ($) |
| | | | | |
| Common Stocks - continued | | | | | |
| General Merchandise - 2.8% | | | | | |
| Target Corp. | | 472,040 | | $ | 22,185,880 |
| Wal-Mart Stores, Inc. | | 440,310 | | | 22,398,570 |
| | | | | |
| | | | | $ | 44,584,450 |
| Insurance - 0.7% | | | | | |
| ACE Ltd. | | 116,200 | | $ | 6,063,316 |
| Hartford Financial Services Group, Inc. | | 229,100 | | | 5,434,252 |
| | | | | |
| | | | | $ | 11,497,568 |
| Internet - 3.6% | | | | | |
| eBay, Inc. (a) | | 109,900 | | $ | 2,433,186 |
| Google, Inc., “A” (a) | | 117,965 | | | 54,460,902 |
| | | | | |
| | | | | $ | 56,894,088 |
| Leisure & Toys - 0.1% | | | | | |
| Electronic Arts, Inc. (a) | | 128,600 | | $ | 2,343,092 |
| | |
| Machinery & Tools - 0.3% | | | | | |
| Illinois Tool Works, Inc. | | 114,800 | | $ | 4,800,936 |
| | |
| Major Banks - 4.7% | | | | | |
| Bank of America Corp. | | 1,588,400 | | $ | 27,939,956 |
| Goldman Sachs Group, Inc. | | 87,590 | | | 14,492,641 |
| JPMorgan Chase & Co. | | 356,540 | | | 15,495,228 |
| State Street Corp. | | 331,800 | | | 17,412,864 |
| | | | | |
| | | | | $ | 75,340,689 |
| Medical & Health Technology & Services - 4.6% | | | | | |
| Express Scripts, Inc. (a) | | 397,790 | | $ | 28,728,394 |
| Henry Schein, Inc. (a) | | 214,100 | | | 11,343,018 |
| Laboratory Corp. of America Holdings (a) | | 57,900 | | | 4,040,841 |
| McKesson Corp. | | 102,600 | | | 5,833,836 |
| Medco Health Solutions, Inc. (a) | | 425,450 | | | 23,493,349 |
| | | | | |
| | | | | $ | 73,439,438 |
| Medical Equipment - 4.7% | | | | | |
| Baxter International, Inc. | | 253,410 | | $ | 14,424,097 |
| Becton, Dickinson & Co. | | 83,500 | | | 5,813,270 |
| Medtronic, Inc. | | 274,960 | | | 10,530,968 |
| St. Jude Medical, Inc. (a) | | 621,020 | | | 23,934,111 |
| Thermo Fisher Scientific, Inc. (a) | | 461,930 | | | 20,883,855 |
| | | | | |
| | | | | $ | 75,586,301 |
14
Portfolio of Investments – continued
| | | | | |
| Issuer | | Shares/Par | | Value ($) |
| | | | | |
| Common Stocks - continued | | | | | |
| Metals & Mining - 0.8% | | | | | |
| Cliffs Natural Resources, Inc. | | 182,600 | | $ | 4,621,606 |
| Freeport-McMoRan Copper & Gold, Inc. | | 125,400 | | | 7,897,692 |
| | | | | |
| | | | | $ | 12,519,298 |
| Network & Telecom - 4.2% | | | | | |
| Cisco Systems, Inc. (a) | | 1,937,440 | | $ | 41,848,704 |
| Juniper Networks, Inc. (a) | | 238,100 | | | 5,492,967 |
| QUALCOMM, Inc. | | 415,040 | | | 19,266,157 |
| | | | | |
| | | | | $ | 66,607,828 |
| Oil Services - 2.0% | | | | | |
| Halliburton Co. | | 499,900 | | $ | 11,852,629 |
| Pride International, Inc. (a) | | 160,500 | | | 4,137,690 |
| Schlumberger Ltd. | | 99,100 | | | 5,569,420 |
| Transocean, Inc. (a) | | 89,290 | | | 6,771,754 |
| Weatherford International Ltd. (a) | | 209,730 | | | 4,184,114 |
| | | | | |
| | | | | $ | 32,515,607 |
| Other Banks & Diversified Financials - 0.7% | | | | | |
| American Express Co. | | 166,100 | | $ | 5,617,502 |
| Northern Trust Corp. | | 82,400 | | | 4,817,104 |
| | | | | |
| | | | | $ | 10,434,606 |
| Personal Computers & Peripherals - 0.2% | | | | | |
| Nuance Communications, Inc. (a) | | 254,680 | | $ | 3,140,204 |
| | |
| Pharmaceuticals - 4.1% | | | | | |
| Abbott Laboratories | | 313,560 | | $ | 14,182,319 |
| Allergan, Inc. | | 288,720 | | | 16,145,222 |
| Johnson & Johnson | | 173,200 | | | 10,468,208 |
| Schering-Plough Corp. | | 204,740 | | | 5,769,573 |
| Shire PLC, ADR | | 32,300 | | | 1,600,788 |
| Teva Pharmaceutical Industries Ltd., ADR | | 341,710 | | | 17,598,065 |
| | | | | |
| | | | | $ | 65,764,175 |
| Printing & Publishing - 1.0% | | | | | |
| McGraw-Hill Cos., Inc. | | 167,500 | | $ | 5,629,675 |
| Moody’s Corp. | | 351,900 | | | 9,585,756 |
| | | | | |
| | | | | $ | 15,215,431 |
| Railroad & Shipping - 0.8% | | | | | |
| Union Pacific Corp. | | 208,190 | | $ | 12,451,844 |
15
Portfolio of Investments – continued
| | | | | | |
| Issuer | | Shares/Par | | Value ($) | |
| | | | | | |
| Common Stocks - continued | | | | | | |
| Restaurants - 2.0% | | | | | | |
| McDonald’s Corp. | | 324,740 | | $ | 18,263,378 | |
| YUM! Brands, Inc. | | 391,500 | | | 13,408,875 | |
| | | | | | |
| | | | | $ | 31,672,253 | |
| Specialty Chemicals - 1.9% | | | | | | |
| Air Products & Chemicals, Inc. | | 153,790 | | $ | 11,538,864 | |
| Praxair, Inc. | | 249,660 | | | 19,128,949 | |
| | | | | | |
| | | | | $ | 30,667,813 | |
| Specialty Stores - 2.4% | | | | | | |
| Amazon.com, Inc. (a) | | 117,590 | | $ | 9,547,132 | |
| Nordstrom, Inc. | | 327,420 | | | 9,180,857 | |
| Staples, Inc. | | 439,610 | | | 9,499,972 | |
| TJX Cos., Inc. | | 281,580 | | | 10,122,801 | |
| | | | | | |
| | | | | $ | 38,350,762 | |
| Telecommunications - Wireless - 0.4% | | | | | | |
| America Movil S.A.B. de C.V., “L”, ADR | | 137,210 | | $ | 6,195,032 | |
| | |
| Telephone Services - 0.7% | | | | | | |
| American Tower Corp., “A” (a) | | 345,390 | | $ | 10,931,594 | |
| | |
| Tobacco - 1.5% | | | | | | |
| Philip Morris International, Inc. | | 522,420 | | $ | 23,879,818 | |
| | |
| Trucking - 0.7% | | | | | | |
| FedEx Corp. | | 166,300 | | $ | 11,426,473 | |
| | |
| Utilities - Electric Power - 0.5% | | | | | | |
| AES Corp. (a) | | 568,860 | | $ | 7,776,316 | |
| Total Common Stocks (Identified Cost, $1,498,216,779) | | | | $ | 1,529,406,092 | |
| | |
| Money Market Funds (v) - 4.8% | | | | | | |
MFS Institutional Money Market Portfolio, 0.2%,
at Cost and Net Asset Value | | 76,236,576 | | $ | 76,236,576 | |
| Total Investments (Identified Cost, $1,574,453,355) | | | | $ | 1,605,642,668 | |
| | |
| Other Assets, Less Liabilities - (0.8)% | | | | | (12,499,971 | ) |
| Net Assets - 100.0% | | | | $ | 1,593,142,697 | |
16
Portfolio of Investments – continued
| (a) | Non-income producing security. |
| (v) | Underlying fund that is available only to investment companies managed by MFS. The rate quoted is the annualized seven-day yield of the fund at period end. |
The following abbreviations are used in this report and are defined:
| ADR | | American Depository Receipt |
| PLC | | Public Limited Company |
See Notes to Financial Statements
17
Financial Statements
STATEMENT OF ASSETS AND LIABILITIES
At 8/31/09
This statement represents your fund’s balance sheet, which details the assets and liabilities comprising the total value of the fund.
| | | |
| Assets | | | |
Investments- | | | |
Non-affiliated issuers, at value (identified cost, $1,498,216,779) | | $1,529,406,092 | |
Underlying funds, at cost and value | | 76,236,576 | |
Total investments, at value (identified cost, $1,574,453,355) | | $1,605,642,668 | |
Receivables for | | | |
Investments sold | | 78,112,199 | |
Fund shares sold | | 792,067 | |
Interest and dividends | | 1,957,434 | |
Other assets | | 4,972 | |
Total assets | | $1,686,509,340 | |
| Liabilities | | | |
Payables for | | | |
Investments purchased | | $90,849,035 | |
Fund shares reacquired | | 1,704,508 | |
Payable to affiliates | | | |
Investment adviser | | 125,659 | |
Shareholder servicing costs | | 433,678 | |
Distribution and service fees | | 34,717 | |
Administrative services fee | | 3,184 | |
Payable for independent Trustees’ compensation | | 70,842 | |
Accrued expenses and other liabilities | | 145,020 | |
Total liabilities | | $93,366,643 | |
Net assets | | $1,593,142,697 | |
| Net assets consist of | | | |
Paid-in capital | | $2,500,890,738 | |
Unrealized appreciation (depreciation) on investments and translation of assets and liabilities in foreign currencies | | 31,180,859 | |
Accumulated net realized gain (loss) on investments and foreign currency transactions | | (941,325,462 | ) |
Undistributed net investment income | | 2,396,562 | |
Net assets | | $1,593,142,697 | |
Shares of beneficial interest outstanding | | 111,945,106 | |
18
Statement of Assets and Liabilities – continued
| | | | | | |
| | | Net assets | | Shares
outstanding | | Net asset value
per share (a) |
| Class A | | $553,626,071 | | 39,360,728 | | $14.07 |
| Class B | | 97,066,490 | | 7,385,397 | | 13.14 |
| Class C | | 64,950,385 | | 4,942,044 | | 13.14 |
| Class I | | 810,495,266 | | 55,493,194 | | 14.61 |
| Class W | | 5,331,337 | | 375,757 | | 14.19 |
| Class R1 | | 2,355,881 | | 179,820 | | 13.10 |
| Class R2 | | 17,546,147 | | 1,270,952 | | 13.81 |
| Class R3 | | 5,116,232 | | 363,906 | | 14.06 |
| Class R4 | | 36,654,888 | | 2,573,308 | | 14.24 |
On sales of $50,000 or more, the offering price of Class A shares is reduced. A contingent deferred sales charge may be imposed on redemptions of Class A, Class B, and Class C shares.
| (a) | Maximum offering price and redemption price per share were equal to the net asset value per share for all share classes, except for Class A, for which the maximum offering price per share was $14.93. |
See Notes to Financial Statements
19
Financial Statements
STATEMENT OF OPERATIONS
Year ended 8/31/09
This statement describes how much your fund earned in investment income and accrued in expenses. It also describes any gains and/or losses generated by fund operations.
| | | | | | |
| Net investment income | | | | | | |
Income | | | | | | |
Dividends | | $19,422,015 | | | | |
Interest | | 318,400 | | | | |
Dividends from other affiliated issuers | | 161,895 | | | | |
Foreign taxes withheld | | (161,985 | ) | | | |
Total investment income | | | | | $19,740,325 | |
Expenses | | | | | | |
Management fee | | $10,653,611 | | | | |
Distribution and service fees | | 3,452,243 | | | | |
Shareholder servicing costs | | 3,843,060 | | | | |
Administrative services fee | | 297,028 | | | | |
Independent Trustees’ compensation | | 27,533 | | | | |
Custodian fee | | 167,355 | | | | |
Shareholder communications | | 10,228 | | | | |
Auditing fees | | 47,937 | | | | |
Legal fees | | 47,897 | | | | |
Miscellaneous | | 248,536 | | | | |
Total expenses | | | | | $18,795,428 | |
Fees paid indirectly | | (5,588 | ) | | | |
Reduction of expenses by investment adviser | | (1,289,166 | ) | | | |
Net expenses | | | | | $17,500,674 | |
Net investment income | | | | | $2,239,651 | |
Realized and unrealized gain (loss) on investments
and foreign currency transactions | | | | | | |
Realized gain (loss) (identified cost basis)
Investment transactions | | $(533,307,815 | ) | | | |
Foreign currency transactions | | 254,281 | | | | |
Net realized gain (loss) on investments
and foreign currency transactions | | | | | $(533,053,534 | ) |
Change in unrealized appreciation (depreciation)
Investments | | $68,058,138 | | | | |
Translation of assets and liabilities in foreign currencies | | 11,475 | | | | |
Net unrealized gain (loss) on investments
and foreign currency translation | | | | | $68,069,613 | |
Net realized and unrealized gain (loss) on investments
and foreign currency | | | | | $(464,983,921 | ) |
Change in net assets from operations | | | | | $(462,744,270 | ) |
See Notes to Financial Statements
20
Financial Statements
STATEMENTS OF CHANGES IN NET ASSETS
These statements describe the increases and/or decreases in net assets resulting from operations, any distributions, and any shareholder transactions.
| | | | | | |
| | | Years ended 8/31 | |
| | | 2009 | | | 2008 | |
| Change in net assets | | | | | | |
| From operations | | | | | | |
Net investment income | | $2,239,651 | | | $690,582 | |
Net realized gain (loss) on investments and foreign currency transactions | | (533,053,534 | ) | | 39,201,310 | |
Net unrealized gain (loss) on investments and foreign currency translation | | 68,069,613 | | | (74,873,251 | ) |
Change in net assets from operations | | $(462,744,270 | ) | | $(34,981,359 | ) |
| Distributions declared to shareholders | | | | | | |
From net investment income | | $(608,615 | ) | | $— | |
From net realized gain on investments | | — | | | (205,162,175 | ) |
Total distributions declared to shareholders | | $(608,615 | ) | | $(205,162,175 | ) |
Change in net assets from fund share transactions | | $(15,231,777 | ) | | $(103,398,439 | ) |
Total change in net assets | | $(478,584,662 | ) | | $(343,541,973 | ) |
| Net assets | | | | | | |
At beginning of period | | 2,071,727,359 | | | 2,415,269,332 | |
At end of period (including undistributed net investment income of $2,396,562 and $511,245, respectively) | | $1,593,142,697 | | | $2,071,727,359 | |
See Notes to Financial Statements
21
Financial Statements
FINANCIAL HIGHLIGHTS
The financial highlights table is intended to help you understand the fund’s financial performance for the past 5 years (or life of a particular share class, if shorter). Certain information reflects financial results for a single fund share. The total returns in the table represent the rate by which an investor would have earned (or lost) on an investment in the fund share class (assuming reinvestment of all distributions) held for the entire period.
| | | | | | | | | | | | | | | |
| Class A | | Years ended 8/31 | |
| | | 2009 | | | 2008 | | | 2007 | | | 2006 | | | 2005 | |
Net asset value, beginning of period | | $18.15 | | | $20.35 | | | $17.70 | | | $16.82 | | | $14.71 | |
| Income (loss) from investment operations | | | | | | | | | | | | | |
Net investment income (loss) (d) | | $0.01 | | | $(0.01 | ) | | $(0.02 | ) | | $(0.05 | ) | | $(0.01 | ) |
Net realized and unrealized gain (loss)
on investments and foreign currency | | (4.09 | ) | | (0.31 | ) | | 3.01 | | | 0.93 | | | 2.12 | |
Total from investment operations | | $(4.08 | ) | | $(0.32 | ) | | $2.99 | | | $0.88 | | | $2.11 | |
| Less distributions declared to shareholders | | | | | | | | | | | | | |
From net realized gain on investments | | $— | | | $(1.88 | ) | | $(0.34 | ) | | $— | | | $— | |
Net asset value, end of period | | $14.07 | | | $18.15 | | | $20.35 | | | $17.70 | | | $16.82 | |
Total return (%) (r)(s)(t) | | (22.48 | ) | | (2.16 | ) | | 17.07 | | | 5.23 | | | 14.34 | |
| Ratios (%) (to average net assets) and Supplemental data: | | | | | | | | | | | | | |
Expenses before expense reductions (f) | | 1.33 | | | 1.29 | | | 1.33 | | | 1.44 | | | 1.38 | |
Expenses after expense reductions (f) | | 1.25 | | | 1.25 | | | 1.25 | | | 1.34 | | | 1.28 | |
Net investment income (loss) | | 0.08 | | | (0.03 | ) | | (0.11 | ) | | (0.31 | ) | | (0.08 | ) |
Portfolio turnover | | 589 | | | 301 | | | 329 | | | 245 | | | 184 | |
Net assets at end of period (000 Omitted) | | $553,626 | | | $787,300 | | | $935,865 | | | $504,761 | | | $632,209 | |
See Notes to Financial Statements
22
Financial Highlights – continued
| | | | | | | | | | | | | | | |
| Class B | | Years ended 8/31 | |
| | | 2009 | | | 2008 | | | 2007 | | | 2006 | | | 2005 | |
Net asset value, beginning of period | | $17.08 | | | $19.38 | | | $16.98 | | | $16.24 | | | $14.30 | |
| Income (loss) from investment operations | | | | | | | | | | | | | |
Net investment loss (d) | | $(0.08 | ) | | $(0.13 | ) | | $(0.14 | ) | | $(0.16 | ) | | $(0.11 | ) |
Net realized and unrealized gain (loss)
on investments and foreign currency | | (3.86 | ) | | (0.29 | ) | | 2.88 | | | 0.90 | | | 2.05 | |
Total from investment operations | | $(3.94 | ) | | $(0.42 | ) | | $2.74 | | | $0.74 | | | $1.94 | |
| Less distributions declared to shareholders | | | | | | | | | | | | | |
From net realized gain on investments | | $— | | | $(1.88 | ) | | $(0.34 | ) | | $— | | | $— | |
Net asset value, end of period | | $13.14 | | | $17.08 | | | $19.38 | | | $16.98 | | | $16.24 | |
Total return (%) (r)(s)(t) | | (23.07 | ) | | (2.81 | ) | | 16.31 | | | 4.56 | | | 13.57 | |
Ratios (%) (to average net assets)
and Supplemental data: | | | | | | | | | | | | | | | |
Expenses before expense reductions (f) | | 2.04 | | | 1.94 | | | 1.98 | | | 2.09 | | | 2.03 | |
Expenses after expense reductions (f) | | 1.94 | | | 1.90 | | | 1.90 | | | 1.99 | | | 1.93 | |
Net investment loss | | (0.61 | ) | | (0.67 | ) | | (0.77 | ) | | (0.96 | ) | | (0.73 | ) |
Portfolio turnover | | 589 | | | 301 | | | 329 | | | 245 | | | 184 | |
Net assets at end of period (000 Omitted) | | $97,066 | | | $192,755 | | | $303,614 | | | $162,868 | | | $201,513 | |
| |
| Class C | | Years ended 8/31 | |
| | | 2009 | | | 2008 | | | 2007 | | | 2006 | | | 2005 | |
Net asset value, beginning of period | | $17.08 | | | $19.38 | | | $16.98 | | | $16.23 | | | $14.30 | |
| Income (loss) from investment operations | | | | | | | | | | | | | |
Net investment loss (d) | | $(0.08 | ) | | $(0.13 | ) | | $(0.14 | ) | | $(0.16 | ) | | $(0.11 | ) |
Net realized and unrealized gain (loss)
on investments and foreign currency | | (3.86 | ) | | (0.29 | ) | | 2.88 | | | 0.91 | | | 2.04 | |
Total from investment operations | | $(3.94 | ) | | $(0.42 | ) | | $2.74 | | | $0.75 | | | $1.93 | |
| Less distributions declared to shareholders | | | | | | | | | | | | | |
From net realized gain on investments | | $— | | | $(1.88 | ) | | $(0.34 | ) | | $— | | | $— | |
Net asset value, end of period | | $13.14 | | | $17.08 | | | $19.38 | | | $16.98 | | | $16.23 | |
Total return (%) (r)(s)(t) | | (23.07 | ) | | (2.81 | ) | | 16.31 | | | 4.62 | | | 13.50 | |
Ratios (%) (to average net assets)
and Supplemental data: | | | | | | | | | | | | | | | |
Expenses before expense reductions (f) | | 2.03 | | | 1.95 | | | 1.98 | | | 2.09 | | | 2.03 | |
Expenses after expense reductions (f) | | 1.94 | | | 1.90 | | | 1.90 | | | 1.99 | | | 1.93 | |
Net investment loss | | (0.62 | ) | | (0.67 | ) | | (0.76 | ) | | (0.96 | ) | | (0.69 | ) |
Portfolio turnover | | 589 | | | 301 | | | 329 | | | 245 | | | 184 | |
Net assets at end of period (000 Omitted) | | $64,950 | | | $89,252 | | | $108,950 | | | $58,523 | | | $82,182 | |
See Notes to Financial Statements
23
Financial Highlights – continued
| | | | | | | | | | | | | | |
| Class I | | Years ended 8/31 |
| | | 2009 | | | 2008 | | | 2007 | | | 2006 | | | 2005 |
Net asset value, beginning of period | | $18.81 | | | $20.96 | | | $18.15 | | | $17.18 | | | $14.98 |
| Income (loss) from investment operations | | | | | | | | | | | | | | |
Net investment income (d) | | $0.05 | | | $0.07 | | | $0.01 | | | $0.00 | (w) | | $0.05 |
Net realized and unrealized gain (loss)
on investments and foreign currency | | (4.24 | ) | | (0.34 | ) | | 3.14 | | | 0.97 | | | 2.15 |
Total from investment operations | | $(4.19 | ) | | $(0.27 | ) | | $3.15 | | | $0.97 | | | $2.20 |
| Less distributions declared to shareholders | | | | | | | | | | | | |
From net investment income | | $(0.01 | ) | | $— | | | $— | | | $— | | | $— |
From net realized gain on investments | | — | | | (1.88 | ) | | (0.34 | ) | | — | | | — |
Total distributions declared to shareholders | | $(0.01 | ) | | $(1.88 | ) | | $(0.34 | ) | | $— | | | $— |
Net asset value, end of period | | $14.61 | | | $18.81 | | | $20.96 | | | $18.15 | | | $17.18 |
Total return (%) (r)(s) | | (22.26 | ) | | (1.84 | ) | | 17.53 | | | 5.65 | | | 14.69 |
Ratios (%) (to average net assets)
and Supplemental data: | | | | | | | | | | | | | | |
Expenses before expense reductions (f) | | 1.03 | | | 0.95 | | | 0.93 | | | 1.06 | | | 1.02 |
Expenses after expense reductions (f) | | 0.95 | | | 0.90 | | | 0.89 | | | 0.96 | | | 0.92 |
Net investment income | | 0.39 | | | 0.32 | | | 0.06 | | | 0.03 | | | 0.32 |
Portfolio turnover | | 589 | | | 301 | | | 329 | | | 245 | | | 184 |
Net assets at end of period (000 Omitted) | | $810,495 | | | $962,434 | | | $1,010,075 | | | $34,998 | | | $3,816 |
See Notes to Financial Statements
24
Financial Highlights – continued
| | | | | | | | | | | | |
| Class W | | Years ended 8/31 | |
| | | 2009 | | | 2008 | | | 2007 | | | 2006 (i) | |
Net asset value, beginning of period | | $18.27 | | | $20.43 | | | $17.72 | | | $18.35 | |
| Income (loss) from investment operations | | | | | | | | | | |
Net investment income (loss) (d) | | $0.01 | | | $0.04 | | | $0.05 | | | $(0.00 | )(w) |
Net realized and unrealized gain (loss)
on investments and foreign currency | | (4.09 | ) | | (0.32 | ) | | 3.00 | | | (0.63 | )(g) |
Total from investment operations | | $(4.08 | ) | | $(0.28 | ) | | $3.05 | | | $(0.63 | ) |
| Less distributions declared to shareholders | | | | | | | | | | |
From net realized gain on investments | | $— | | | $(1.88 | ) | | $(0.34 | ) | | $— | |
Net asset value, end of period | | $14.19 | | | $18.27 | | | $20.43 | | | $17.72 | |
Total return (%) (r)(s) | | (22.33 | ) | | (1.95 | ) | | 17.39 | | | (3.43 | )(n) |
Ratios (%) (to average net assets)
and Supplemental data: | | | | | | | | | | | | |
Expenses before expense reductions (f) | | 1.06 | | | 1.05 | | | 1.07 | | | 1.18 | (a) |
Expenses after expense reductions (f) | | 1.03 | | | 1.00 | | | 0.99 | | | 1.08 | (a) |
Net investment income (loss) | | 0.07 | | | 0.23 | | | 0.27 | | | (0.03 | )(a) |
Portfolio turnover | | 589 | | | 301 | | | 329 | | | 245 | |
Net assets at end of period (000 Omitted) | | $5,331 | | | $343 | | | $373 | | | $97 | |
| | | | | | | | | | | | | | | |
| Class R1 | | Years ended 8/31 | |
| | | 2009 | | | 2008 | | | 2007 | | | 2006 | | | 2005 (i) | |
Net asset value, beginning of period | | $17.03 | | | $19.33 | | | $16.95 | | | $16.23 | | | $15.35 | |
| Income (loss) from investment operations | | | | | | | | | | | | | | | |
Net investment loss (d) | | $(0.08 | ) | | $(0.14 | ) | | $(0.15 | ) | | $(0.17 | ) | | $(0.08 | ) |
Net realized and unrealized gain (loss)
on investments and foreign currency | | (3.85 | ) | | (0.28 | ) | | 2.87 | | | 0.89 | | | 0.96 | (g) |
Total from investment operations | | $(3.93 | ) | | $(0.42 | ) | | $2.72 | | | $0.72 | | | $0.88 | |
| Less distributions declared to shareholders | | | | | | | | | | | | | | | |
From net realized gain on investments | | $— | | | $(1.88 | ) | | $(0.34 | ) | | $— | | | $— | |
Net asset value, end of period | | $13.10 | | | $17.03 | | | $19.33 | | | $16.95 | | | $16.23 | |
Total return (%) (r)(s) | | (23.08 | ) | | (2.82 | ) | | 16.22 | | | 4.44 | | | 5.73 | (n) |
Ratios (%) (to average net assets)
and Supplemental data: | | | | | | | | | | | | | | | |
Expenses before expense reductions (f) | | 2.03 | | | 2.00 | | | 2.12 | | | 2.28 | | | 2.35 | (a) |
Expenses after expense reductions (f) | | 1.94 | | | 1.95 | | | 2.00 | | | 2.09 | | | 2.25 | (a) |
Net investment loss | | (0.62 | ) | | (0.74 | ) | | (0.89 | ) | | (1.07 | ) | | (1.21 | )(a) |
Portfolio turnover | | 589 | | | 301 | | | 329 | | | 245 | | | 184 | |
Net assets at end of period (000 Omitted) | | $2,356 | | | $2,552 | | | $1,517 | | | $506 | | | $80 | |
See Notes to Financial Statements
25
Financial Highlights – continued
| | | | | | | | | | | | | | | |
| Class R2 | | Years ended 8/31 | |
| | | 2009 | | | 2008 | | | 2007 | | | 2006 | | | 2005 | |
Net asset value, beginning of period | | $17.85 | | | $20.08 | | | $17.52 | | | $16.70 | | | $14.67 | |
| Income (loss) from investment operations | | | | | | | | | | | | | | | |
Net investment loss (d) | | $(0.02 | ) | | $(0.05 | ) | | $(0.07 | ) | | $(0.11 | ) | | $(0.06 | ) |
Net realized and unrealized gain (loss)
on investments and foreign currency | | (4.02 | ) | | (0.30 | ) | | 2.97 | | | 0.93 | | | 2.09 | |
Total from investment operations | | $(4.04 | ) | | $(0.35 | ) | | $2.90 | | | $0.82 | | | $2.03 | |
| Less distributions declared to shareholders | | | | | | | | | | | | | | | |
From net realized gain on investments | | $— | | | $(1.88 | ) | | $(0.34 | ) | | $— | | | $— | |
Net asset value, end of period | | $13.81 | | | $17.85 | | | $20.08 | | | $17.52 | | | $16.70 | |
Total return (%) (r)(s) | | (22.63 | ) | | (2.34 | ) | | 16.73 | | | 4.91 | | | 13.84 | |
Ratios (%) (to average net assets)
and Supplemental data: | | | | | | | | | | | | | | | |
Expenses before expense reductions (f) | | 1.52 | | | 1.49 | | | 1.67 | | | 1.85 | | | 1.82 | |
Expenses after expense reductions (f) | | 1.44 | | | 1.44 | | | 1.54 | | | 1.65 | | | 1.72 | |
Net investment loss | | (0.14 | ) | | (0.24 | ) | | (0.37 | ) | | (0.60 | ) | | (0.48 | ) |
Portfolio turnover | | 589 | | | 301 | | | 329 | | | 245 | | | 184 | |
Net assets at end of period (000 Omitted) | | $17,546 | | | $13,471 | | | $5,728 | | | $1,804 | | | $774 | |
| |
| Class R3 | | Years ended 8/31 | |
| | | 2009 | | | 2008 | | | 2007 | | | 2006 | | | 2005 (i) | |
Net asset value, beginning of period | | $18.13 | | | $20.33 | | | $17.69 | | | $16.81 | | | $15.85 | |
| Income (loss) from investment operations | | | | | | | | | | | | | |
Net investment income (loss) (d) | | $0.01 | | | $0.00 | (w) | | $(0.03 | ) | | $(0.06 | ) | | $(0.03 | ) |
Net realized and unrealized gain (loss)
on investments and foreign currency | | (4.08 | ) | | (0.32 | ) | | 3.01 | | | 0.94 | | | 0.99 | (g) |
Total from investment operations | | $(4.07 | ) | | $(0.32 | ) | | $2.98 | | | $0.88 | | | $0.96 | |
| Less distributions declared to shareholders | | | | | | | | | | | | | |
From net realized gain on investments | | $— | | | $(1.88 | ) | | $(0.34 | ) | | $— | | | $— | |
Net asset value, end of period | | $14.06 | | | $18.13 | | | $20.33 | | | $17.69 | | | $16.81 | |
Total return (%) (r)(s) | | (22.45 | ) | | (2.16 | ) | | 17.02 | | | 5.23 | | | 6.06 | (n) |
Ratios (%) (to average net assets)
and Supplemental data: | | | | | | | | | | | | | | | |
Expenses before expense reductions (f) | | 1.26 | | | 1.25 | | | 1.37 | | | 1.48 | | | 1.56 | (a) |
Expenses after expense reductions (f) | | 1.20 | | | 1.20 | | | 1.29 | | | 1.38 | | | 1.46 | (a) |
Net investment income (loss) | | 0.09 | | | 0.02 | | | (0.18 | ) | | (0.36 | ) | | (0.41 | )(a) |
Portfolio turnover | | 589 | | | 301 | | | 329 | | | 245 | | | 184 | |
Net assets at end of period (000 Omitted) | | $5,116 | | | $2,848 | | | $1,641 | | | $286 | | | $53 | |
See Notes to Financial Statements
26
Financial Highlights – continued
| | | | | | | | | | | | | | | |
| Class R4 | | Years ended 8/31 | |
| | | 2009 | | | 2008 | | | 2007 | | | 2006 | | | 2005 (i) | |
| Net asset value, beginning of period | | $18.33 | | | $20.47 | | | $17.76 | | | $16.83 | | | $15.85 | |
| Income (loss) from investment operations | | | | | | | | | | | | | |
Net investment income (loss) (d) | | $0.05 | | | $0.06 | | | $0.04 | | | $(0.01 | ) | | $(0.01 | ) |
Net realized and unrealized gain (loss)
on investments and foreign currency | | (4.14 | ) | | (0.32 | ) | | 3.01 | | | 0.94 | | | 0.99 | (g) |
Total from investment operations | | $(4.09 | ) | | $(0.26 | ) | | $3.05 | | | $0.93 | | | $0.98 | |
| Less distributions declared to shareholders | | | | | | | | | | | | | |
From net realized gain on investments | | $— | | | $(1.88 | ) | | $(0.34 | ) | | $— | | | $— | |
Net asset value, end of period | | $14.24 | | | $18.33 | | | $20.47 | | | $17.76 | | | $16.83 | |
Total return (%) (r)(s) | | (22.31 | ) | | (1.84 | ) | | 17.35 | | | 5.53 | | | 6.18 | (n) |
| Ratios (%) (to average net assets) and Supplemental data: | | | | | | | | | | | | | | | |
| Expenses before expense reductions (f) | | 1.01 | | | 0.98 | | | 1.08 | | | 1.19 | | | 1.26 | (a) |
| Expenses after expense reductions (f) | | 0.96 | | | 0.94 | | | 0.99 | | | 1.09 | | | 1.16 | (a) |
| Net investment income (loss) | | 0.35 | | | 0.29 | | | 0.21 | | | (0.06 | ) | | (0.11 | )(a) |
| Portfolio turnover | | 589 | | | 301 | | | 329 | | | 245 | | | 184 | |
Net assets at end of period (000 Omitted) | | $36,655 | | | $20,773 | | | $41,102 | | | $56 | | | $53 | |
Any redemption fees charged by the fund during the 2005 fiscal year resulted in a per share impact of less than $0.01.
| (d) | Per share data is based on average shares outstanding. |
| (f) | Ratios do not reflect reductions from fees paid indirectly, if applicable. |
| (g) | The per share amount varies from the net realized and unrealized gain/loss for the period because of the timing of sales of fund shares and the per share amount of realized and unrealized gains and losses at such time. |
| (i) | For the period from the class’ inception, April 1, 2005 (Classes R1, R3, and R4) and May 1, 2006 (Class W) through the stated period end. |
| (r) | Certain expenses have been reduced without which performance would have been lower. |
| (s) | From time to time the fund may receive proceeds from litigation settlements, without which performance would be lower. |
| (t) | Total returns do not include any applicable sales charges. |
| (w) | Per share amount was less than $0.01. |
See Notes to Financial Statements
27
NOTES TO FINANCIAL STATEMENTS
| (1) | | Business and Organization |
MFS Core Growth Fund (the fund) is a series of MFS Series Trust I (the trust). The trust is organized as a Massachusetts business trust and is registered under the Investment Company Act of 1940, as amended, as an open-end management investment company.
| (2) | | Significant Accounting Policies |
General – The preparation of financial statements in conformity with U.S. generally accepted accounting principles requires management to make estimates and assumptions that affect the reported amounts of assets and liabilities, and disclosure of contingent assets and liabilities at the date of the financial statements and the reported amounts of revenues and expenses during the reporting period. In making these estimates and assumptions, management has considered the effects, if any, of events occurring after the date of the fund’s Statement of Assets and Liabilities through October 16, 2009 which is the date that the financial statements were issued. Actual results could differ from those estimates. The fund can invest in foreign securities, including securities of emerging market issuers. Investments in foreign securities are vulnerable to the effects of changes in the relative values of the local currency and the U.S. dollar and to the effects of changes in each country’s legal, political, and economic environment. The markets of emerging markets countries are generally more volatile than the markets of developed countries with more mature economies. All of the risks of investing in foreign securities previously described are heightened when investing in emerging markets countries.
Investment Valuations – Equity securities, including restricted equity securities, are generally valued at the last sale or official closing price as provided by a third-party pricing service on the market or exchange on which they are primarily traded. For securities for which there were no sales reported that day, equity securities are generally valued at the last quoted daily bid quotation as provided by a third-party pricing service on the market or exchange on which such securities are primarily traded. For securities held short for which there were no sales reported for that day, the position is generally valued at the last quoted daily ask quotation as provided by a third-party pricing service on the market or exchange on which such securities are primarily traded. Short-term instruments with a maturity at issuance of 60 days or less generally are valued at amortized cost, which approximates market value. Open-end investment companies are generally valued at net asset value per share. Securities and other assets generally valued on the basis of information from a third-party pricing service may also be valued at a broker/dealer bid quotation. Values obtained from third-party pricing services can
28
Notes to Financial Statements – continued
utilize both transaction data and market information such as yield, quality, coupon rate, maturity, type of issue, trading characteristics, and other market data. The values of foreign securities and other assets and liabilities expressed in foreign currencies are converted to U.S. dollars using the mean of bid and asked prices for rates provided by a third-party pricing service.
The Board of Trustees has delegated primary responsibility for determining or causing to be determined the value of the fund’s investments (including any fair valuation) to the adviser pursuant to valuation policies and procedures approved by the Board. If the adviser determines that reliable market quotations are not readily available, investments are valued at fair value as determined in good faith by the adviser in accordance with such procedures under the oversight of the Board of Trustees. Under the fund’s valuation policies and procedures, market quotations are not considered to be readily available for most types of debt instruments and floating rate loans and many types of derivatives. These investments are generally valued at fair value based on information from third-party pricing services. In addition, investments may be valued at fair value if the adviser determines that an investment’s value has been materially affected by events occurring after the close of the exchange or market on which the investment is principally traded (such as foreign exchange or market) and prior to the determination of the fund’s net asset value, or after the halting of trading of a specific security where trading does not resume prior to the close of the exchange or market on which the security is principally traded. Events that occur on a frequent basis after foreign markets close (such as developments in foreign markets and significant movements in the U.S. markets) and prior to the determination of the fund’s net asset value may be deemed to have a material affect on the value of securities traded in foreign markets. Accordingly, the fund’s foreign equity securities may often be valued at fair value. The adviser generally relies on third-party pricing services or other information (such as the correlation with price movements of similar securities in the same or other markets; the type, cost and investment characteristics of the security; the business and financial condition of the issuer; and trading and other market data) to assist in determining whether to fair value and at what value to fair value an investment. The value of an investment for purposes of calculating the fund’s net asset value can differ depending on the source and method used to determine value. When fair valuation is used, the value of an investment used to determine the fund’s net asset value may differ from quoted or published prices for the same investment. There can be no assurance that the fund could obtain the fair value assigned to an investment if it were to sell the investment at the same time at which the fund determines its net asset value per share.
The fund adopted FASB Statement No. 157, Fair Value Measurements (the “Statement”). This Statement provides a single definition of fair value, a
29
Notes to Financial Statements – continued
hierarchy for measuring fair value and expanded disclosures about fair value measurements.
Various inputs are used in determining the value of the fund’s assets or liabilities carried at market value. These inputs are categorized into three broad levels. In certain cases, the inputs used to measure fair value may fall into different levels of the fair value hierarchy. In such cases, an investment’s level within the fair value hierarchy is based on the lowest level of input that is significant to the fair value measurement. The fund’s assessment of the significance of a particular input to the fair value measurement in its entirety requires judgment, and considers factors specific to the investment. Level 1 includes unadjusted quoted prices in active markets for identical assets or liabilities. Level 2 includes other significant observable market-based inputs (including quoted prices for similar securities, interest rates, prepayment speed, and credit risk). Level 3 includes unobservable inputs, which may include the adviser’s own assumptions in determining the fair value of investments. Other financial instruments are derivative instruments not reflected in total investments, such as futures, forwards, swap contracts, and written options. The following is a summary of the levels used as of August 31, 2009 in valuing the fund’s assets or liabilities carried at market value:
| | | | | | | | |
| Investments at Value | | Level 1 | | Level 2 | | Level 3 | | Total |
| Equity Securities | | $1,529,406,092 | | $— | | $— | | $1,529,406,092 |
| Mutual Funds | | 76,236,576 | | — | | — | | 76,236,576 |
| Total Investments | | $1,605,642,668 | | $— | | $— | | $1,605,642,668 |
For further information regarding security characteristics, see the Portfolio of Investments.
Repurchase Agreements – The fund may enter into repurchase agreements with approved counterparties. Each repurchase agreement is recorded at cost. The fund requires that the securities collateral in a repurchase transaction be transferred to a custodian. The fund monitors, on a daily basis, the value of the collateral to ensure that its value, including accrued interest, is greater than amounts owed to the fund under each such repurchase agreement. The fund and other funds managed by MFS may utilize a joint trading account for the purpose of entering into one or more repurchase agreements.
Foreign Currency Translation – Purchases and sales of foreign investments, income, and expenses are converted into U.S. dollars based upon currency exchange rates prevailing on the respective dates of such transactions or on the reporting date for foreign denominated receivables and payables. Gains and losses attributable to foreign currency exchange rates on sales of securities are recorded for financial statement purposes as net realized gains and losses on investments. Gains and losses attributable to foreign exchange rate movements on receivables, payables, income and expenses are recorded for
30
Notes to Financial Statements – continued
financial statement purposes as foreign currency transaction gains and losses. That portion of both realized and unrealized gains and losses on investments that results from fluctuations in foreign currency exchange rates is not separately disclosed.
Derivatives – The fund may use derivatives for different purposes, including to earn income and enhance returns, to increase or decrease exposure to a particular market, to manage or adjust the risk profile of the fund, or as alternatives to direct investments. Derivatives may be used for hedging or non-hedging purposes. While hedging can reduce or eliminate losses, it can also reduce or eliminate gains. When the fund uses derivatives as an investment to increase market exposure, or for hedging purposes, gains and losses from derivative instruments may be substantially greater than the derivative’s original cost.
In this reporting period the fund adopted FASB Statement No. 161, Disclosure about Derivative Instruments and Hedging Activities (“FAS 161”), and FASB Staff Position FAS No. 133-1 and FIN 45-4, Disclosures about Credit Derivatives and Certain Guarantees: An Amendment of FASB Statement No. 133 and FASB Interpretation No. 45; and Clarification of the Effective Date of FAS 161 (“FSP FAS 133-1”).
FAS 161 amends FASB Statement No. 133, Accounting for Derivatives and Hedging Activities (“FAS 133”). FAS 161 provides enhanced disclosures about the fund’s use of and accounting for derivative instruments and the effect of derivative instruments on the fund’s results of operations and financial position. Under FAS 161, tabular disclosure regarding derivative fair value and gain/loss by contract type (e.g., interest rate contracts, foreign exchange contracts, credit contracts, etc.) is required and derivatives accounted for as hedging instruments under FAS 133 must be disclosed separately from derivatives that do not qualify for hedge accounting under FAS 133. Because investment companies account for their derivatives at fair value and record any changes in fair value in current period earnings, the fund’s derivatives are not accounted for as hedging instruments under FAS 133. As such, even though the fund may use derivatives in an attempt to achieve an economic hedge, the fund’s derivatives are not considered to be hedging instruments under FAS 133.
FSP FAS 133-1 amends FAS 133 to require sellers of credit derivatives to make disclosures that will enable financial statement users to assess the potential effects of those credit derivatives on an entity’s financial position, financial performance and cash flows. As defined by FSP FAS 133-1, a credit derivative is a derivative instrument (a) in which one or more of the derivative’s underlyings are related to the credit risk of a specified entity (or group of entities) or an index based on the credit risk of a group of entities and (b) that exposes the
31
Notes to Financial Statements – continued
seller to potential loss from credit-risk-related events specified in the derivative contract. The seller (or writer) is the party that provides the credit protection and assumes the credit risk on a credit derivatives contract, such as a credit default swap. There was no impact from implementing FSP 133-1 as the fund did not hold any of these credit derivatives at period end.
As defined under FAS 133, derivative instruments include written options, purchased options, futures contracts, forward foreign currency exchange contracts, and swap agreements. For the year ended August 31, 2009, the fund did not invest in any derivative instruments and accordingly there is no impact to the financial statements.
Derivative counterparty credit risk is managed through formal evaluation of the creditworthiness of all potential counterparties. On certain over-the-counter derivatives, the fund attempts to reduce its exposure to counterparty credit risk by entering into an International Swaps and Derivatives Association (ISDA) Master Agreement on a bilateral basis with each of the counterparties with whom it undertakes a significant volume of transactions. The ISDA Master Agreement gives each party to the agreement the right to terminate all transactions traded under such agreement if there is a certain deterioration in the credit quality of the other party. The ISDA Master Agreement gives the fund the right, upon an event of default by the applicable counterparty or a termination of the agreement, to close out all transactions traded under such agreement and to net amounts owed under each transaction to one net amount payable by one party to the other. This right to close out and net payments across all transactions traded under the ISDA Master Agreement could result in a reduction of the fund’s credit risk to such counterparty equal to any amounts payable by the fund under the applicable transactions, if any. However, absent an event of default by the counterparty or a termination of the agreement, the ISDA Master Agreement does not result in an offset of reported balance sheet assets and liabilities across transactions between the fund and the applicable counterparty.
Collateral requirements differ by type of derivative. Collateral or margin requirements are set by the broker or exchange clearing house for exchange traded derivatives (i.e., futures and exchange-traded options) while collateral terms are contract specific for over-the-counter traded derivatives (i.e., forwards, swaps and over-the-counter options). For derivatives traded under an ISDA Master Agreement, the collateral requirements are netted across all transactions traded under such agreement and one amount is posted from one party to the other to collateralize such obligations. Cash collateral that has been pledged to cover obligations of the fund under derivative contracts will be reported separately on the Statement of Assets and Liabilities as restricted
32
Notes to Financial Statements – continued
cash. Securities collateral pledged for the same purpose is noted in the Portfolio of Investments.
Security Loans – State Street Bank and Trust Company (“State Street”), as lending agent, may loan the securities of the fund to certain qualified institutions (the “Borrowers”) approved by the fund. The loans are collateralized by cash and/or U.S. Treasury and federal agency obligations in an amount typically at least equal to the market value of the securities loaned. The market value of the loaned securities is determined at the close of business of the fund and any additional required collateral is delivered to the fund on the next business day. State Street provides the fund with indemnification against Borrower default. The fund bears the risk of loss with respect to the
investment of cash collateral. On loans collateralized by cash, the cash collateral is invested in a money market fund or short-term securities. A portion of the income generated upon investment of the collateral is remitted to the Borrowers, and the remainder is allocated between the fund and the lending agent. On loans collateralized by U.S. Treasury and/or federal agency obligations, a fee is received from the Borrower, and is allocated between the fund and the lending agent. Income from securities lending is included in interest income on the Statement of Operations. The dividend and interest income earned on the securities loaned is accounted for in the same manner as other dividend and interest income. At August 31, 2009, there were no securities on loan.
Indemnifications – Under the fund’s organizational documents, its officers and Trustees may be indemnified against certain liabilities and expenses arising out of the performance of their duties to the fund. Additionally, in the normal course of business, the fund enters into agreements with service providers that may contain indemnification clauses. The fund’s maximum exposure under these agreements is unknown as this would involve future claims that may be made against the fund that have not yet occurred.
Investment Transactions and Income – Investment transactions are recorded on the trade date. Interest income is recorded on the accrual basis. All premium and discount is amortized or accreted for financial statement purposes in accordance with U.S. generally accepted accounting principles. Dividends received in cash are recorded on the ex-dividend date. Certain dividends from foreign securities will be recorded when the fund is informed of the dividend if such information is obtained subsequent to the ex-dividend date. Dividend and interest payments received in additional securities are recorded on the ex-dividend or ex-interest date in an amount equal to the value of the security on such date.
The fund may receive proceeds from litigation settlements. Any proceeds received from litigation involving portfolio holdings are reflected in the
33
Notes to Financial Statements – continued
Statement of Operations in realized gain/loss if the security has been disposed of by the fund or in unrealized gain/loss if the security is still held by the fund. Any other proceeds from litigation not related to portfolio holdings are reflected as other income in the Statement of Operations.
Fees Paid Indirectly – The fund’s custody fee may be reduced according to an arrangement that measures the value of cash deposited with the custodian by the fund. This amount, for the year ended August 31, 2009, is shown as a reduction of total expenses on the Statement of Operations.
Tax Matters and Distributions – The fund intends to qualify as a regulated investment company, as defined under Subchapter M of the Internal Revenue Code, and to distribute all of its taxable income, including realized capital gains. As a result, no provision for federal income tax is required. The fund’s federal tax returns for the prior three fiscal years remain subject to examination by the Internal Revenue Service. Foreign taxes, if any, have been accrued by the fund in the accompanying financial statements.
Distributions to shareholders are recorded on the ex-dividend date. Income and capital gain distributions are determined in accordance with income tax regulations, which may differ from U.S. generally accepted accounting principles. Certain capital accounts in the financial statements are periodically adjusted for permanent differences in order to reflect their tax character. These adjustments have no impact on net assets or net asset value per share. Temporary differences which arise from recognizing certain items of income, expense, gain or loss in different periods for financial statement and tax purposes will reverse at some time in the future. Distributions in excess of net investment income or net realized gains are temporary overdistributions for financial statement purposes resulting from differences in the recognition or classification of income or distributions for financial statement and tax purposes.
Book/tax differences primarily relate to expiration of capital loss carryforwards and wash sale loss deferrals.
The tax character of distributions declared to shareholders for the last two fiscal years is as follows:
| | | | |
| | | 8/31/09 | | 8/31/08 |
| Ordinary income (including any short-term capital gains) | | $608,615 | | $86,503,995 |
| Long-term capital gain | | — | | 118,658,180 |
| Total distributions | | $608,615 | | $205,162,175 |
34
Notes to Financial Statements – continued
The federal tax cost and the tax basis components of distributable earnings were as follows:
| | | |
| As of 8/31/09 | | | |
| Cost of investments | | $1,643,639,423 | |
| Gross appreciation | | 23,956,461 | |
| Gross depreciation | | (61,953,216 | ) |
| Net unrealized appreciation (depreciation) | | $(37,996,755 | ) |
| Undistributed ordinary income | | 2,468,528 | |
| Capital loss carryforwards | | (550,230,537 | ) |
| Post-October capital loss deferral | | (317,586,685 | ) |
| Other temporary differences | | (4,402,592 | ) |
As of August 31, 2009, the fund had capital loss carryforwards available to offset future realized gains. Such losses expire as follows:
| | | |
| 8/31/10 | | $(325,450,819 | ) |
| 8/31/11 | | (30,032,975 | ) |
| 8/31/17 | | (194,746,743 | ) |
| | $(550,230,537 | ) |
The availability of a portion of the capital loss carryforwards of the fund and the capital loss carryforwards that the fund acquired on June 22, 2007 in connection with the MFS Strategic Growth Fund merger, may be limited in a given year.
Multiple Classes of Shares of Beneficial Interest – The fund offers multiple classes of shares, which differ in their respective distribution and service fees. The fund’s income, realized and unrealized gain (loss), and common expenses are allocated to shareholders based on the daily net assets of each class. Dividends are declared separately for each class. Differences in per share dividend rates are generally due to differences in separate class expenses. Class B shares will convert to Class A shares approximately eight years after purchase. The fund’s distributions declared to shareholders as reported on the Statements of Changes in Net Assets are presented by class as follows:
35
Notes to Financial Statements – continued
| | | | | | | | |
| | | From net investment
income | | From net realized gain on
investments |
| | | Year ended
8/31/09 | | Year ended
8/31/08 | | Year ended
8/31/09 | | Year ended
8/31/08 |
| Class A | | $— | | $— | | $— | | $77,652,488 |
| Class B | | — | | — | | — | | 24,115,726 |
| Class C | | — | | — | | — | | 9,911,561 |
| Class I | | 608,615 | | — | | — | | 88,840,909 |
| Class W | | — | | — | | — | | 36,456 |
| Class R (b) | | — | | — | | — | | 77,392 |
| Class R1 | | — | | — | | — | | 263,200 |
| Former Class R2 (b) | | — | | — | | — | | 73,024 |
| Class R2 | | — | | — | | — | | 1,101,532 |
| Class R3 | | — | | — | | — | | 292,532 |
| Class R4 | | — | | — | | — | | 2,797,355 |
| Total | | $608,615 | | $— | | $— | | $205,162,175 |
| (b) | At the close of business on April 18, 2008, Class R and Class R2 shares converted into Class R3 shares. Following this conversion, Class R3, Class R4, and Class R5 shares were renamed Class R2, Class R3, and Class R4 shares, respectively. |
| (3) | | Transactions with Affiliates |
Investment Adviser – The fund has an investment advisory agreement with MFS to provide overall investment management and related administrative services and facilities to the fund. The management fee is computed daily and paid monthly at the following annual rates:
| | | |
| First $1 billion of average daily net assets | | 0.75 | % |
| Next $1.5 billion of average daily net assets | | 0.65 | % |
| Average daily net assets in excess of $2.5 billion | | 0.60 | % |
As part of a settlement agreement with the New York Attorney General concerning market timing and related matters, MFS agreed to reduce the management fee to 0.65% on the first $1 billion of the fund’s average daily net assets for the period March 1, 2004 through February 28, 2009. For the year ended August 31, 2009, this waiver amounted to $495,891 and is reflected as a reduction of total expenses in the Statement of Operations.
The management fee incurred for the year ended August 31, 2009 was equivalent to an annual effective rate of 0.68% of the fund’s average daily net assets.
At the commencement of the period until February 28, 2009, the investment adviser had agreed in writing to pay a portion of the fund’s total annual operating expenses, exclusive of interest, taxes, extraordinary expenses, brokerage and transaction costs and investment-related expenses, such that total annual fund operating expenses did not exceed the following rates annually of the fund’s average daily net assets.
| | | | | | | | | | | | | | | | |
| Class A | | Class B | | Class C | | Class I | | Class W | | Class R1 | | Class R2 | | Class R3 | | Class R4 |
| 1.26% | | 1.91% | | 1.91% | | 0.91% | | 1.01% | | 1.91% | | 1.41% | | 1.16% | | 0.91% |
36
Notes to Financial Statements – continued
Effective March 1, 2009, the investment adviser has agreed in writing to pay a portion of the fund’s total annual operating expenses, exclusive of interest, taxes, extraordinary expenses, brokerage and transaction costs, and investment-related expenses, such that total annual fund operating expenses do not exceed the following rates annually of the fund’s average daily net assets.
| | | | | | | | | | | | | | | | |
| Class A | | Class B | | Class C | | Class I | | Class W | | Class R1 | | Class R2 | | Class R3 | | Class R4 |
| 1.26% | | 2.01% | | 2.01% | | 1.01% | | 1.11% | | 2.01% | | 1.51% | | 1.26% | | 1.01% |
This written agreement will continue until modified by the fund’s Board of Trustees, but such agreement will continue at least until December 31, 2010. For the year ended August 31, 2009, these reductions amounted to $783,639 and are reflected as a reduction of total expenses in the Statement of Operations.
Distributor – MFS Fund Distributors, Inc. (MFD), a wholly-owned subsidiary of MFS, as distributor, received $60,216 for the year ended August 31, 2009, as its portion of the initial sales charge on sales of Class A shares of the fund.
The Board of Trustees has adopted a distribution plan for certain class shares pursuant to Rule 12b-1 of the Investment Company Act of 1940.
The fund’s distribution plan provides that the fund will pay MFD for services provided by MFD and financial intermediaries in connection with the distribution and servicing of certain share classes. One component of the plan is a distribution fee paid to MFD and another component of the plan is a service fee paid to MFD. MFD may subsequently pay all, or a portion, of the distribution and/or service fees to financial intermediaries.
Distribution Plan Fee Table:
| | | | | | | | | | |
| | | Distribution
Fee Rate (d) | | Service
Fee Rate (d) | | Total
Distribution
Plan (d) | | Annual
Effective
Rate (e) | | Distribution
and Service
Fee |
| Class A | | — | | 0.25% | | 0.25% | | 0.30% | | $1,614,429 |
| Class B | | 0.75% | | 0.25% | | 1.00% | | 1.00% | | 1,129,344 |
| Class C | | 0.75% | | 0.25% | | 1.00% | | 1.00% | | 621,818 |
| Class W | | 0.10% | | — | | 0.10% | | 0.10% | | 1,461 |
| Class R1 | | 0.75% | | 0.25% | | 1.00% | | 1.00% | | 20,247 |
| Class R2 | | 0.25% | | 0.25% | | 0.50% | | 0.50% | | 56,432 |
| Class R3 | | — | | 0.25% | | 0.25% | | 0.25% | | 8,512 |
| Total Distribution and Service Fees | | | | | | | | $3,452,243 |
| (d) | As of August 31, 2009, in accordance with the distribution plan for certain classes, the fund pays distribution and/or service fees equal to these annual percentage rates of each class’ average daily net assets. The distribution and service fee rates disclosed by class represent the current rates in effect at the end of the reporting period. Any rate changes, if applicable, are detailed below. |
| (e) | The annual effective rates represent actual fees incurred under the distribution plan for the year ended August 31, 2009 based on each class’ average daily net assets. Prior to March 1, 2009, a 0.10% Class A annual distribution fee was paid by the fund. Effective March 1, 2009, the 0.10% Class A annual distribution fee was eliminated. |
37
Notes to Financial Statements – continued
Certain Class A shares purchased prior to September 1, 2008 are subject to a contingent deferred sales charge (CDSC) in the event of a shareholder redemption within 12 months of purchase. Certain Class A shares purchased on or subsequent to September 1, 2008 are subject to a CDSC in the event of a shareholder redemption within 24 months of purchase. Class C shares are subject to a CDSC in the event of a shareholder redemption within 12 months of purchase. Class B shares are subject to a CDSC in the event of a shareholder redemption within six years of purchase. All contingent deferred sales charges are paid to MFD and during the year ended August 31, 2009, were as follows:
| | |
| | | Amount |
| Class A | | $209 |
| Class B | | 131,077 |
| Class C | | 7,788 |
Shareholder Servicing Agent – MFS Service Center, Inc. (MFSC), a wholly-owned subsidiary of MFS, receives a fee from the fund for its services as shareholder servicing agent calculated as a percentage of the average daily net assets of the fund as determined periodically under the supervision of the fund’s Board of Trustees. For the year ended August 31, 2009, the fee was $1,500,312, which equated to 0.1009% annually of the fund’s average daily net assets. MFSC also receives payment from the fund for out-of-pocket expenses, sub-accounting and other shareholder servicing costs which may be paid to affiliated and unaffiliated service providers. For the year ended August 31, 2009, these out-of-pocket expenses, sub-accounting and other shareholder servicing costs amounted to $1,270,711.
Under a Special Servicing Agreement among MFS, each MFS fund which invests in other MFS funds (“MFS fund-of-funds”) and certain underlying funds in which a MFS fund-of-funds invests (“underlying funds”), each underlying fund may pay a portion of each MFS fund-of-fund’s transfer agent-related expenses, including sub-accounting fees payable to financial intermediaries, to the extent such payments do not exceed the benefits realized or expected to be realized by the underlying fund from the investment in the underlying fund by the MFS fund-of-fund. For the year ended August 31, 2009, these costs for the fund amounted to $1,072,037 and are reflected in the shareholder servicing costs on the Statement of Operations.
Administrator – MFS provides certain financial, legal, shareholder communications, compliance, and other administrative services to the fund. Under an administrative services agreement, the fund partially reimburses MFS the costs incurred to provide these services. The fund is charged an annual fixed amount of $17,500 plus a fee based on average daily net assets. The administrative services fee incurred for the year ended August 31, 2009 was equivalent to an annual effective rate of 0.0200% of the fund’s average daily net assets.
38
Notes to Financial Statements – continued
Trustees’ and Officers’ Compensation – The fund pays compensation to independent Trustees in the form of a retainer, attendance fees, and additional compensation to Board and Committee chairpersons. The fund does not pay compensation directly to Trustees or officers of the fund who are also officers of the investment adviser, all of whom receive remuneration for their services to the fund from MFS. Certain officers and Trustees of the fund are officers or directors of MFS, MFD, and MFSC.
Prior to December 31, 2001, the fund had an unfunded defined benefit plan (“DB plan”) for independent Trustees. As of December 31, 2001, the Board took action to terminate the DB plan with respect to then-current and any future independent Trustees, such that the DB Plan covers only certain of those former independent Trustees who retired on or before December 31, 2001. Effective January 1, 2002, accrued benefits under the DB Plan for then current independent Trustees who continued were credited to an unfunded retirement deferral plan (the “Retirement Deferral plan”), which was established for and exists solely with respect to these credited amounts, and is not available for other deferrals by these or other independent Trustees. The DB Plan resulted in a pension expense of $631 and the Retirement Deferral plan resulted in a net decrease in expense of $20,731. Both amounts are included in independent Trustees’ compensation for the year ended August 31, 2009. The liability for deferred retirement benefits payable to certain independent Trustees under both Plans amounted to $70,836 at August 31, 2009, and is included in payable for independent Trustees’ compensation on the Statement of Assets and Liabilities.
Other – This fund and certain other funds managed by MFS (the funds) have entered into services agreements (the Agreements) which provide for payment of fees by the funds to Tarantino LLC and Griffin Compliance LLC in return for the provision of services of an Independent Chief Compliance Officer (ICCO) and Assistant ICCO, respectively, for the funds. The ICCO and Assistant ICCO are officers of the funds and the sole members of Tarantino LLC and Griffin Compliance LLC, respectively. The funds can terminate the Agreements with Tarantino LLC and Griffin Compliance LLC at any time under the terms of the Agreements. For the year ended August 31, 2009, the aggregate fees paid by the fund to Tarantino LLC and Griffin Compliance LLC were $18,481 and are included in miscellaneous expense on the Statement of Operations. MFS has agreed to reimburse the fund for a portion of the payments made by the fund in the amount of $9,636, which is shown as a reduction of total expenses in the Statement of Operations. Additionally, MFS has agreed to bear all expenses associated with office space, other administrative support, and supplies provided to the ICCO and Assistant ICCO.
The fund may invest in a money market fund managed by MFS which seeks a high level of current income consistent with preservation of capital and liquidity. Income earned on this investment is included in dividends from
39
Notes to Financial Statements – continued
underlying funds on the Statement of Operations. This money market fund does not pay a management fee to MFS.
Purchases and sales of investments, other than U.S. Government securities, purchased option transactions, and short-term obligations, aggregated $8,657,800,318 and $8,641,760,178, respectively.
| (5) | | Shares of Beneficial Interest |
The fund’s Declaration of Trust permits the Trustees to issue an unlimited number of full and fractional shares of beneficial interest. Transactions in fund shares were as follows:
| | | | | | | | |
| | | Year ended
8/31/09 | | Year ended
8/31/08 |
| | | Shares | | Amount | | Shares | | Amount |
| Shares sold | | | | | | | | |
Class A | | 10,705,331 | | $134,898,932 | | 11,963,681 | | $238,131,169 |
Class B | | 769,827 | | 9,333,574 | | 878,961 | | 16,596,938 |
Class C | | 1,154,118 | | 13,746,901 | | 633,037 | | 12,017,505 |
Class I | | 22,062,123 | | 285,103,240 | | 4,652,318 | | 94,159,590 |
Class W | | 401,398 | | 5,248,875 | | 2,552 | | 50,139 |
Class R (b) | | — | | — | | 73,439 | | 1,556,587 |
Class R1 | | 60,493 | | 725,327 | | 91,037 | | 1,800,160 |
Former Class R2 (b) | | — | | — | | 29,506 | | 602,108 |
Class R2 | | 768,015 | | 9,682,090 | | 562,802 | | 11,308,402 |
Class R3 | | 261,432 | | 3,128,788 | | 142,365 | | 2,953,665 |
Class R4 | | 1,765,443 | | 21,316,135 | | 445,691 | | 9,070,485 |
| | 37,948,180 | | $483,183,862 | | 19,475,389 | | $388,246,748 |
| | | | |
| Shares issued to shareholders in reinvestment of distributions | | | | | | | | |
Class A | | — | | $— | | 3,470,851 | | $68,767,100 |
Class B | | — | | — | | 1,205,045 | | 22,624,378 |
Class C | | — | | — | | 419,021 | | 7,846,321 |
Class I | | 43,893 | | 556,562 | | 4,340,348 | | 88,840,909 |
Class W | | — | | — | | 870 | | 17,297 |
Class R (b) | | — | | — | | 2,056 | | 42,245 |
Class R1 | | — | | — | | 14,081 | | 263,200 |
Former Class R2 (b) | | — | | — | | 3,699 | | 73,024 |
Class R2 | | — | | — | | 53,938 | | 1,047,154 |
Class R3 | | — | | — | | 14,760 | | 292,532 |
Class R4 | | — | | — | | 97,103 | | 1,936,855 |
| | 43,893 | | $556,562 | | 9,621,772 | | $191,751,015 |
40
Notes to Financial Statements – continued
| | | | | | | | | | | | |
| | | Year ended
8/31/09 | | | Year ended
8/31/08 | |
| | | Shares | | | Amount | | | Shares | | | Amount | |
| | | | |
| Shares reacquired | | | | | | | | | | | | |
Class A | | (14,718,650 | ) | | $(195,792,193 | ) | | (18,040,749 | ) | | $(365,020,387 | ) |
Class B | | (4,669,245 | ) | | (56,616,643 | ) | | (6,466,286 | ) | | (122,410,250 | ) |
Class C | | (1,437,761 | ) | | (17,545,782 | ) | | (1,448,459 | ) | | (27,310,950 | ) |
Class I | | (17,782,303 | ) | | (219,933,966 | ) | | (6,023,090 | ) | | (127,244,629 | ) |
Class W | | (44,426 | ) | | (562,577 | ) | | (2,903 | ) | | (52,872 | ) |
Class R (b) | | — | | | — | | | (290,915 | ) | | (6,058,729 | ) |
Class R1 | | (30,560 | ) | | (365,665 | ) | | (33,713 | ) | | (622,197 | ) |
Former Class R2 (b) | | — | | | — | | | (138,266 | ) | | (2,696,755 | ) |
Class R2 | | (251,745 | ) | | (3,208,016 | ) | | (147,270 | ) | | (2,860,090 | ) |
Class R3 | | (54,562 | ) | | (718,120 | ) | | (80,804 | ) | | (1,550,318 | ) |
Class R4 | | (325,553 | ) | | (4,229,239 | ) | | (1,417,186 | ) | | (27,569,025 | ) |
| | (39,314,805 | ) | | $(498,972,201 | ) | | (34,089,641 | ) | | $(683,396,202 | ) |
| | | | |
| Net change | | | | | | | | | | | | |
Class A | | (4,013,319 | ) | | $(60,893,261 | ) | | (2,606,217 | ) | | $(58,122,118 | ) |
Class B | | (3,899,418 | ) | | (47,283,069 | ) | | (4,382,280 | ) | | (83,188,934 | ) |
Class C | | (283,643 | ) | | (3,798,881 | ) | | (396,401 | ) | | (7,447,124 | ) |
Class I | | 4,323,713 | | | 65,725,836 | | | 2,969,576 | | | 55,755,870 | |
Class W | | 356,972 | | | 4,686,298 | | | 519 | | | 14,564 | |
Class R (b) | | — | | | — | | | (215,420 | ) | | (4,459,897 | ) |
Class R1 | | 29,933 | | | 359,662 | | | 71,405 | | | 1,441,163 | |
Former Class R2 (b) | | — | | | — | | | (105,061 | ) | | (2,021,623 | ) |
Class R2 | | 516,270 | | | 6,474,074 | | | 469,470 | | | 9,495,466 | |
Class R3 | | 206,870 | | | 2,410,668 | | | 76,321 | | | 1,695,879 | |
Class R4 | | 1,439,890 | | | 17,086,896 | | | (874,392 | ) | | (16,561,685 | ) |
| | (1,322,732 | ) | | $(15,231,777 | ) | | (4,992,480 | ) | | $(103,398,439 | ) |
| (b) | At the close of business on April 18, 2008, Class R and Class R2 shares converted into Class R3 shares. Following this conversion, Class R3, Class R4, and Class R5 shares were renamed Class R2, Class R3, and Class R4 shares, respectively. |
The fund is one of several mutual funds in which the MFS funds-of-funds may invest. The MFS funds-of-funds do not invest in the underlying MFS funds for the purpose of exercising management or control. At the end of the period, the MFS Growth Allocation Fund, MFS Moderate Allocation Fund, MFS Aggressive Growth Allocation Fund, and MFS Conservative Allocation Fund were the owners of record of approximately 14%, 10%, 8%, and 3%, respectively, of the value of outstanding voting shares of the fund. In addition, the MFS Lifetime 2010 Fund, the MFS Lifetime 2020 Fund, the MFS Lifetime 2030 Fund, the MFS Lifetime 2040 Fund and the MFS Lifetime Retirement Income Fund were each the owners of record of less than 1% of the value of outstanding voting shares of the fund.
41
Notes to Financial Statements – continued
The fund and certain other funds managed by MFS participate in a $1.1 billion unsecured committed line of credit, subject to a $1 billion sublimit, provided by a syndication of banks under a credit agreement. Borrowings may be made for temporary financing needs. Interest is charged to each fund, based on its borrowings, generally at a rate equal to the higher of the Federal Reserve funds rate or one month LIBOR plus an agreed upon spread. A commitment fee, based on the average daily, unused portion of the committed line of credit, is allocated among the participating funds at the end of each calendar quarter. In addition, the fund and other funds managed by MFS have established unsecured uncommitted borrowing arrangements with certain banks for temporary financing needs. Interest is charged to each fund, based on its borrowings, at a rate equal to the Federal Reserve funds rate plus an agreed upon spread. For the year ended August 31, 2009, the fund’s commitment fee and interest expense were $18,396 and $738, respectively, and are included in miscellaneous expense on the Statement of Operations.
| (7) | | Transactions in Underlying Funds-Affiliated Issuers |
An affiliated issuer may be considered one in which the fund owns 5% or more of the outstanding voting securities, or a company which is under common control. For the purposes of this report, the fund assumes the following to be affiliated issuers:
| | | | | | | | | |
| Underlying Funds | | Beginning
Shares/Par
Amount | | Acquisitions
Shares/Par
Amount | | Dispositions
Shares/Par
Amount | | | Ending
Shares/Par
Amount |
| MFS Institutional Money Market Portfolio | | — | | 1,543,370,341 | | (1,467,133,765 | ) | | 76,236,576 |
| | | | |
| Underlying Funds | | Realized
Gain (Loss) | | Capital Gain
Distributions | | Dividend
Income | | | Ending
Value |
| MFS Institutional Money Market Portfolio | | $— | | $— | | $161,895 | | | $76,236,576 |
42
REPORT OF INDEPENDENT REGISTERED PUBLIC ACCOUNTING FIRM
To the Board of Trustees of MFS Series Trust I and Shareholders of MFS Core Growth Fund:
We have audited the accompanying statement of assets and liabilities of MFS Core Growth Fund (the Fund) (one of the portfolios comprising MFS Series Trust I), including the portfolio of investments, as of August 31, 2009, and the related statement of operations for the year then ended, the statements of changes in net assets for each of the two years in the period then ended, and the financial highlights for each of the periods indicated therein. These financial statements and financial highlights are the responsibility of the Fund’s management. Our responsibility is to express an opinion on these financial statements and financial highlights based on our audits.
We conducted our audits in accordance with the standards of the Public Company Accounting Oversight Board (United States). Those standards require that we plan and perform the audit to obtain reasonable assurance about whether the financial statements and financial highlights are free of material misstatement. We were not engaged to perform an audit of the Fund’s internal control over financial reporting. Our audits included consideration of internal control over financial reporting as a basis for designing audit procedures that are appropriate in the circumstances, but not for the purpose of expressing an opinion on the effectiveness of the Fund’s internal control over financial reporting. Accordingly, we express no such opinion. An audit also includes examining, on a test basis, evidence supporting the amounts and disclosures in the financial statements and financial highlights, assessing the accounting principles used and significant estimates made by management, and evaluating the overall financial statement presentation. Our procedures included confirmation of securities owned as of August 31, 2009, by correspondence with the custodian and brokers or by other appropriate auditing procedures where replies from brokers were not received. We believe that our audits provide a reasonable basis for our opinion.
In our opinion, the financial statements and financial highlights referred to above present fairly, in all material respects, the financial position of the MFS Core Growth Fund at August 31, 2009, the results of its operations for the year then ended, the changes in its net assets for each of the two years in the period then ended, and its financial highlights for each of the periods indicated therein, in conformity with U.S. generally accepted accounting principles.

Boston, Massachusetts
October 16, 2009
43
TRUSTEES AND OFFICERS — IDENTIFICATION AND BACKGROUND
The Trustees and officers of the Trust, as of October 1, 2009, are listed below, together with their principal occupations during the past five years. (Their titles may have varied during that period.) The address of each Trustee and officer is 500 Boylston Street, Boston, Massachusetts 02116.
| | | | | | |
Name, Date of Birth | | Position(s) Held
with Fund | | Trustee/Officer
Since (h) | | Principal Occupations During
the Past Five Years & Other
Directorships (j) |
| INTERESTED TRUSTEES | | | | |
Robert J. Manning (k)
(born 10/20/63) | | Trustee | | February 2004 | | Massachusetts Financial Services Company, Chief Executive Officer, President, Chief Investment Officer and Director |
Robert C. Pozen (k)
(born 8/08/46) | | Trustee | | February 2004 | | Massachusetts Financial Services Company, Chairman (since February 2004); Medtronic, Inc, (medical devices), Director (since 2004); Harvard Business School (education), Senior Lecturer (since 2008); Bell Canada Enterprises (telecommunications), Director (until February 2009); The Bank of New York, Director (finance), (March 2004 to May 2005); Telesat (satellite communications), Director (until November 2007) |
| INDEPENDENT TRUSTEES | | | | |
David H. Gunning
(born 5/30/42) | | Trustee and Chair of Trustees | | January 2004 | | Retired; Cleveland-Cliffs Inc. (mining products and service provider), Vice Chairman/Director (until May 2007); Lincoln Electric Holdings, Inc. (welding equipment manufacturer), Director; Development Alternatives, Inc. (consulting), Director/Non Executive Chairman; Southwest Gas Corp. (natural gas distribution), Director (until May 2004); Portman Limited (mining), Director (until 2008) |
44
Trustees and Officers – continued
| | | | | | |
Name, Date of Birth | | Position(s) Held
with Fund | | Trustee/Officer
Since (h) | | Principal Occupations During
the Past Five Years & Other
Directorships (j) |
Robert E. Butler (n)
(born 11/29/41) | | Trustee | | January 2006 | | Consultant – investment company industry regulatory and compliance matters (since July 2002); PricewaterhouseCoopers LLP (professional services firm), Partner (until 2002) |
Lawrence H. Cohn, M.D.
(born 3/11/37) | | Trustee | | June 1989 | | Brigham and Women’s Hospital, Senior Cardiac Surgeon (since 2005); Harvard Medical School, Professor of Cardiac Surgery; Partners HealthCare, Physician Director of Medical Device Technology (since 2006); Brigham and Women’s Hospital, Chief of Cardiac Surgery (until 2005) |
Maureen R. Goldfarb
(born 4/6/55) | | Trustee | | January 2009 | | Private investor; John Hancock Financial Services, Inc., Executive Vice President (until 2004); John Hancock Mutual Funds, Trustee and Chief Executive Officer (until 2004) |
William R. Gutow
(born 9/27/41) | | Trustee | | December 1993 | | Private investor and real estate consultant; Capital Entertainment Management Company (video franchise), Vice Chairman; Atlantic Coast Tan (tanning salons), Vice Chairman (until 2007); Texas Donuts (donut franchise), Vice Chairman (until 2009) |
Michael Hegarty
(born 12/21/44) | | Trustee | | December 2004 | | Private investor; Retired; AXA Financial (financial services and insurance), Vice Chairman and Chief Operating Officer (until 2001); The Equitable Life Assurance Society (insurance), President and Chief Operating Officer (until 2001) |
J. Atwood Ives
(born 5/01/36) | | Trustee | | February 1992 | | Private investor; KeySpan Corporation (energy related services), Director (until 2004) |
45
Trustees and Officers – continued
| | | | | | |
Name, Date of Birth | | Position(s) Held
with Fund | | Trustee/Officer
Since (h) | | Principal Occupations During
the Past Five Years & Other
Directorships (j) |
John P. Kavanaugh
(born 11/4/54) | | Trustee | | January 2009 | | Private investor; The Hanover Insurance Group, Inc., Vice President and Chief Investment Officer (until 2006); Allmerica Investment Trust, Allmerica Securities Trust and Opus Investment Trust (investment companies), Chairman, President and Trustee (until 2006) |
J. Dale Sherratt
(born 9/23/38) | | Trustee | | June 1989 | | Insight Resources, Inc. (acquisition planning specialists), President; Wellfleet Investments (investor in health care companies), Managing General Partner |
Laurie J. Thomsen
(born 8/05/57) | | Trustee | | March 2005 | | New Profit, Inc. (venture philanthropy), Executive Partner (since 2006); Private investor; Prism Venture Partners (venture capital), Co-founder and General Partner (until June 2004); The Travelers Companies (commercial property liability insurance), Director |
Robert W. Uek
(born 5/18/41) | | Trustee | | January 2006 | | Consultant to investment company industry; PricewaterhouseCoopers LLP (professional services firm), Partner (until 1999); TT International Funds (mutual fund complex), Trustee (until 2005); Hillview Investment Trust II Funds (mutual fund complex), Trustee (until 2005) |
| OFFICERS | | | | | | |
Maria F. Dwyer (k)
(born 12/01/58) | | President | | November 2005 | | Massachusetts Financial Services Company, Executive Vice President and Chief Regulatory Officer (since March 2004) Chief Compliance Officer (since December 2006); Fidelity Management & Research Company, Vice President (prior to March 2004); Fidelity Group of Funds, President and Treasurer (until March 2004) |
46
Trustees and Officers – continued
| | | | | | |
Name, Date of Birth | | Position(s) Held
with Fund | | Trustee/Officer
Since (h) | | Principal Occupations During
the Past Five Years & Other
Directorships (j) |
Christopher R. Bohane (k)
(born 1/18/74) | | Assistant Secretary and Assistant Clerk | | July 2005 | | Massachusetts Financial Services Company, Vice President and Senior Counsel |
John M. Corcoran (k)
(born 04/13/65) | | Treasurer | | October 2008 | | Massachusetts Financial Services Company, Senior Vice President (since October 2008); State Street Bank and Trust (financial services provider), Senior Vice President, (until September 2008) |
Ethan D. Corey (k)
(born 11/21/63) | | Assistant Secretary and Assistant Clerk | | July 2005 | | Massachusetts Financial Services Company, Senior Vice President and Associate General Counsel (since 2004); Dechert LLP (law firm), Counsel (prior to December 2004) |
David L. DiLorenzo (k)
(born 8/10/68) | | Assistant Treasurer | | July 2005 | | Massachusetts Financial Services Company, Vice President (since June 2005); JP Morgan Investor Services, Vice President (until June 2005) |
Timothy M. Fagan (k)
(born 7/10/68) | | Assistant Secretary and Assistant Clerk | | September 2005 | | Massachusetts Financial Services Company, Vice President and Senior Counsel (since September 2005); John Hancock Advisers, LLC, Vice President, Senior Attorney and Chief Compliance Officer (until August 2005) |
Mark D. Fischer (k)
(born 10/27/70) | | Assistant Treasurer | | July 2005 | | Massachusetts Financial Services Company, Vice President (since May 2005); JP Morgan Investment Management Company, Vice President (until May 2005) |
Robyn L. Griffin
(born 7/04/75) | | Assistant Independent Chief Compliance Officer | | August 2008 | | Griffin Compliance LLC (provider of compliance services), Principal (since August 2008); State Street Corporation (financial services provider), Mutual Fund Administration Assistant Vice President (October 2006 – July 2008); Liberty Mutual Group (insurance), Personal Market Assistant Controller (April 2006 – October 2006); Deloitte & Touche LLP (professional services firm), Senior Manager (prior to April 2006) |
47
Trustees and Officers – continued
| | | | | | |
Name, Date of Birth | | Position(s) Held
with Fund | | Trustee/Officer
Since (h) | | Principal Occupations During
the Past Five Years & Other
Directorships (j) |
Brian E. Langenfeld (k)
(born 3/07/73) | | Assistant Secretary and Assistant Clerk | | June 2006 | | Massachusetts Financial Services Company, Vice President and Senior Counsel (since May 2006); John Hancock Advisers, LLC, Assistant Vice President and Counsel (until April 2006) |
Ellen Moynihan (k)
(born 11/13/57) | | Assistant Treasurer | | April 1997 | | Massachusetts Financial Services Company, Senior Vice President |
Susan S. Newton (k)
(born 3/07/50) | | Assistant Secretary and Assistant Clerk | | May 2005 | | Massachusetts Financial Services Company, Senior Vice President and Associate General Counsel (since April 2005); John Hancock Advisers, LLC, Senior Vice President, Secretary and Chief Legal Officer (until April 2005) |
Susan A. Pereira (k)
(born 11/05/70) | | Assistant Secretary and Assistant Clerk | | July 2005 | | Massachusetts Financial Services Company, Vice President and Senior Counsel (since June 2004); Bingham McCutchen LLP (law firm), Associate (until June 2004) |
Mark N. Polebaum (k)
(born 5/01/52) | | Secretary and Clerk | | January 2006 | | Massachusetts Financial Services Company, Executive Vice President, General Counsel and Secretary (since January 2006); Wilmer Cutler Pickering Hale and Dorr LLP (law firm), Partner (until January 2006) |
Frank L. Tarantino
(born 3/07/44) | | Independent Chief Compliance Officer | | June 2004 | | Tarantino LLC (provider of compliance services), Principal (since June 2004); CRA Business Strategies Group (consulting services), Executive Vice President (until June 2004) |
Richard S. Weitzel (k)
(born 7/16/70) | | Assistant Secretary and Assistant Clerk | | October 2007 | | Massachusetts Financial Services Company, Vice President and Assistant General Counsel (since 2004); Massachusetts Department of Business and Technology, General Counsel (until April 2004) |
James O. Yost (k)
(born 6/12/60) | | Assistant Treasurer | | September 1990 | | Massachusetts Financial Services Company, Senior Vice President |
| (h) | Date first appointed to serve as Trustee/officer of an MFS fund. Each Trustee has served continuously since appointment unless indicated otherwise. For the period from December 15, 2004 until February 22, 2005, Messrs. Pozen and Manning served as Advisory Trustees. For the period March 2008 until October 2008, Ms. Dwyer served as Treasurer of the Funds. |
48
Trustees and Officers – continued
| (j) | Directorships or trusteeships of companies required to report to the Securities and Exchange Commission (i.e., “public companies”). |
| (k) | “Interested person” of the Trust within the meaning of the Investment Company Act of 1940 (referred to as the 1940 Act), which is the principal federal law governing investment companies like the fund, as a result of position with MFS. The address of MFS is 500 Boylston Street, Boston, Massachusetts 02116. |
| (n) | In 2004 and 2005, Mr. Butler provided consulting services to the independent compliance consultant retained by MFS pursuant to its settlement with the SEC concerning market timing and related matters. The terms of that settlement required that compensation and expenses related to the independent compliance consultant be borne exclusively by MFS and, therefore, MFS paid Mr. Butler for the services he rendered to the independent compliance consultant. In 2004 and 2005, MFS paid Mr. Butler a total of $351,119.29. |
Each Trustee (except Messrs. Butler, Kavanaugh and Uek and Ms. Goldfarb) has been elected by shareholders and each Trustee and officer holds office until his or her successor is chosen and qualified or until his or her earlier death, resignation, retirement or removal. The Trust held a shareholders’ meeting in 2005 to elect Trustees, and will hold a shareholders’ meeting at least once every five years thereafter, to elect Trustees. Messrs. Butler, Kavanaugh, Sherratt, Uek and Ms. Thomsen are members of the Trust’s Audit Committee.
Each of the Fund’s Trustees and officers holds comparable positions with certain other funds of which MFS or a subsidiary is the investment adviser or distributor, and, in the case of the officers, with certain affiliates of MFS. As of January 1, 2009, the Trustees served as board members of 104 funds within the MFS Family of Funds.
The Statement of Additional Information for the Fund and further information about the Trustees are available without charge upon request by calling 1-800-225-2606.
| | |
| Investment Adviser | | Custodian |
Massachusetts Financial Services Company
500 Boylston Street, Boston, MA 02116-3741 | | State Street Bank and Trust
1 Lincoln Street, Boston, MA 02111-2900 |
| Distributor | | Independent Registered Public Accounting Firm |
MFS Fund Distributors, Inc.
500 Boylston Street, Boston, MA 02116-3741 | | Ernst & Young LLP
200 Clarendon Street, Boston, MA 02116 |
| Portfolio Manager | | |
Stephen Pesek | | |
49
BOARD REVIEW OF INVESTMENT ADVISORY AGREEMENT
The Investment Company Act of 1940 requires that both the full Board of Trustees and a majority of the non-interested (“independent”) Trustees, voting separately, annually approve the continuation of the Fund’s investment advisory agreement with MFS. The Trustees consider matters bearing on the Fund and its advisory arrangements at their meetings throughout the year, including a review of performance data at each regular meeting. In addition, the independent Trustees met several times over the course of three months beginning in May and ending in July, 2009 (“contract review meetings”) for the specific purpose of considering whether to approve the continuation of the investment advisory agreement for the Fund and the other investment companies that the Board oversees (the “MFS Funds”). The independent Trustees were assisted in their evaluation of the Fund’s investment advisory agreement by independent legal counsel, from whom they received separate legal advice and with whom they met separately from MFS during various contract review meetings. The independent Trustees were also assisted in this process by the MFS Funds’ Independent Chief Compliance Officer, a full-time senior officer appointed by and reporting to the independent Trustees.
In connection with their deliberations regarding the continuation of the investment advisory agreement, the Trustees, including the independent Trustees, considered such information and factors as they believed, in light of the legal advice furnished to them and their own business judgment, to be relevant. The investment advisory agreement for the Fund was considered separately, although the Trustees also took into account the common interests of all MFS Funds in their review. As described below, the Trustees considered the nature, quality, and extent of the various investment advisory, administrative, and shareholder services performed by MFS under the existing investment advisory agreement and other arrangements with the Fund.
In connection with their contract review meetings, the Trustees received and relied upon materials that included, among other items: (i) information provided by Lipper Inc., an independent third party, on the investment performance of the Fund for various time periods ended December 31, 2008 and the investment performance of a group of funds with substantially similar investment classifications/objectives (the “Lipper performance universe”), (ii) information provided by Lipper Inc. on the Fund’s advisory fees and other expenses and the advisory fees and other expenses of comparable funds identified by Lipper Inc. (the “Lipper expense group”), (iii) information provided by MFS on the advisory fees of comparable portfolios of other clients of MFS, including institutional separate accounts and other clients, (iv) information as to whether and to what extent applicable expense waivers,
50
Board Review of Investment Advisory Agreement – continued
reimbursements or fee “breakpoints” are observed for the Fund, (v) information regarding MFS’ financial results and financial condition, including MFS’ and certain of its affiliates’ estimated profitability from services performed for the Fund and the MFS Funds as a whole, (vi) MFS’ views regarding the outlook for the mutual fund industry and the strategic business plans of MFS, (vii) descriptions of various functions performed by MFS for the Funds, such as compliance monitoring and portfolio trading practices, and (viii) information regarding the overall organization of MFS, including information about MFS’ senior management and other personnel providing investment advisory, administrative and other services to the Fund and the other MFS Funds. The comparative performance, fee and expense information prepared and provided by Lipper Inc. was not independently verified and the independent Trustees did not independently verify any information provided to them by MFS.
The Trustees’ conclusion as to the continuation of the investment advisory agreement was based on a comprehensive consideration of all information provided to the Trustees and not the result of any single factor. Some of the factors that figured particularly in the Trustees’ deliberations are described below, although individual Trustees may have evaluated the information presented differently from one another, giving different weights to various factors. It is also important to recognize that the fee arrangements for the Fund and other MFS Funds are the result of years of review and discussion between the independent Trustees and MFS, that certain aspects of such arrangements may receive greater scrutiny in some years than in others, and that the Trustees’ conclusions may be based, in part, on their consideration of these same arrangements during the course of the year and in prior years.
Based on information provided by Lipper Inc., the Trustees reviewed the Fund’s total return investment performance as well as the performance of peer groups of funds over various time periods. The Trustees placed particular emphasis on the total return performance of the Fund’s Class A shares in comparison to the performance of funds in its Lipper performance universe over the three-year period ended December 31, 2008, which the Trustees believed was a long enough period to reflect differing market conditions. The total return performance of the Fund’s Class A shares was in the 1st quintile relative to the other funds in the universe for this three-year period (the 1st quintile being the best performers and the 5th quintile being the worst performers). The total return performance of the Fund’s Class A shares was in the 1st quintile for each of the one and five-year periods ended December 31, 2008 relative to the Lipper performance universe. Because of the passage of time, these performance results are likely to differ from the performance results for more recent periods, including those shown elsewhere in this report.
51
Board Review of Investment Advisory Agreement – continued
In the course of their deliberations, the Trustees took into account information provided by MFS in connection with the contract review meetings, as well as during investment review meetings conducted with portfolio management personnel during the course of the year regarding the Fund’s performance. After reviewing these and related factors, the Trustees concluded, within the context of their overall conclusions regarding the investment advisory agreement, that they were satisfied with MFS’ responses and efforts relating to investment performance.
In assessing the reasonableness of the Fund’s advisory fee, the Trustees considered, among other information, the Fund’s advisory fee and the total expense ratio of the Fund’s Class A shares as a percentage of average daily net assets and the advisory fee and total expense ratios of peer groups of funds based on information provided by Lipper Inc. The Trustees considered that MFS currently observes an expense limitation for the Fund. The Trustees also considered that, according to the Lipper data (which takes into account any fee reductions or expense limitations that were in effect during the Fund’s last fiscal year), the Fund’s effective advisory fee rate and total expense ratio were each higher than the Lipper expense group median.
The Trustees also considered the advisory fees charged by MFS to institutional accounts. In comparing these fees, the Trustees considered information provided by MFS as to the generally broader scope of services provided by MFS to the Fund in comparison to institutional accounts, the higher demands placed on MFS’ investment personnel and trading infrastructure as a result of the daily cash in-flows and out-flows of the Fund, and the impact on MFS and expenses associated with the more extensive regulatory regime to which the Fund is subject in comparison to institutional accounts.
The Trustees also considered whether the Fund is likely to benefit from any economies of scale in the management of the Fund in the event of growth in assets of the Fund. They noted that the Fund’s advisory fee rate schedule is currently subject to contractual breakpoints that reduce the Fund’s advisory rate on average daily net assets over $1 billion and $2.5 billion. The Trustees concluded that the existing breakpoints were sufficient to allow the Fund to benefit from economies of scale as its assets grow.
The Trustees also considered information prepared by MFS relating to MFS’ costs and profits with respect to the Fund, the MFS Funds considered as a group, and other investment companies and accounts advised by MFS, as well as MFS’ methodologies used to determine and allocate its costs to the MFS Funds, the Fund and other accounts and products for purposes of estimating profitability.
After reviewing these and other factors described herein, the Trustees concluded, within the context of their overall conclusions regarding the
52
Board Review of Investment Advisory Agreement – continued
investment advisory agreement, that the advisory fees charged to the Fund represent reasonable compensation in light of the services being provided by MFS to the Fund.
In addition, the Trustees considered MFS’ resources and related efforts to continue to retain, attract and motivate capable personnel to serve the Fund. The Trustees also considered current and developing conditions in the financial services industry, including the entry into the industry of large and well-capitalized companies which are spending, and appear to be prepared to continue to spend, substantial sums to engage personnel and to provide services to competing investment companies. In this regard, the Trustees also considered the financial resources of MFS and its ultimate parent, Sun Life Financial Inc. The Trustees also considered the advantages and possible disadvantages to the Fund of having an adviser that also serves other investment companies as well as other accounts.
The Trustees also considered the nature, quality, cost, and extent of administrative, transfer agency, and distribution services provided to the Fund by MFS and its affiliates under agreements and plans other than the investment advisory agreement, including any 12b-1 fees the Fund pays to MFS Fund Distributors, Inc., an affiliate of MFS. The Trustees also considered the nature, extent and quality of certain other services MFS performs or arranges for on the Fund’s behalf, which may include securities lending programs, directed expense payment programs, class action recovery programs, and MFS’ interaction with third-party service providers, principally custodians and sub-custodians. The Trustees concluded that the various non-advisory services provided by MFS and its affiliates on behalf of the Funds were satisfactory.
The Trustees also considered benefits to MFS from the use of the Fund’s portfolio brokerage commissions, if applicable, to pay for investment research, and various other factors. Additionally, the Trustees considered so-called “fall-out benefits” to MFS such as reputational value derived from serving as investment manager to the Fund.
Based on their evaluation of factors that they deemed to be material, including those factors described above, the Board of Trustees, including a majority of the independent Trustees, concluded that the Fund’s investment advisory agreement with MFS should be continued for an additional one-year period, commencing August 1, 2009.
A discussion regarding the Board’s most recent review and renewal of the fund’s Investment Advisory Agreement with MFS will be available on or about November 1, 2009 by clicking on the fund’s name under “Mutual Funds” in the “Products and Performance” section of the MFS Web site (mfs.com).
53
PROXY VOTING POLICIES AND INFORMATION
A general description of the MFS funds’ proxy voting policies and procedures is available without charge, upon request, by calling
1-800-225-2606, by visiting the Proxy Voting section of mfs.com or by visiting the SEC’s Web site at http://www.sec.gov.
Information regarding how the fund voted proxies relating to portfolio securities during the most recent twelve-month period ended June 30 is available without charge by visiting the Proxy Voting section of mfs.com or by visiting the SEC’s Web site at http://www.sec.gov.
QUARTERLY PORTFOLIO DISCLOSURE
The fund will file a complete schedule of portfolio holdings with the Securities and Exchange Commission (the Commission) for the first and third quarters of each fiscal year on Form N-Q. The fund’s Form N-Q may be reviewed and copied at the:
Public Reference Room
Securities and Exchange Commission
100 F Street, NE, Room 1580
Washington, D.C. 20549
Information on the operation of the Public Reference Room may be obtained by calling the Commission at 1-800-SEC-0330. The fund’s Form N-Q is available on the EDGAR database on the Commission’s Internet Web site at http://www.sec.gov, and copies of this information may be obtained, upon payment of a duplicating fee, by electronic request at the following e-mail address: publicinfo@sec.gov or by writing the Public Reference Section at the above address.
A shareholder can also obtain the quarterly portfolio holdings report at mfs.com.
FURTHER INFORMATION
From time to time, MFS may post important information about the fund or the MFS funds on the MFS web site (mfs.com). This information is available by visiting the “News & Commentary” section of mfs.com or by clicking on the fund’s name under “Mutual Funds” in the “Products and Performance” section of mfs.com.
FEDERAL TAX INFORMATION (unaudited)
The fund will notify shareholders of amounts for use in preparing 2009 income tax forms in January 2010. The following information is provided pursuant to provisions of the Internal Revenue Code.
The fund designates the maximum amount allowable as qualified dividend income eligible for the 15% tax rate.
For corporate shareholders, 100% of the ordinary income dividends paid during the fiscal year qualify for the corporate dividends received deduction.
54
MFS® PRIVACY NOTICE
Privacy is a concern for every investor today. At MFS Investment Management® and the MFS funds, we take this concern very seriously. We want you to understand our policies about the investment products and services that we offer, and how we protect the nonpublic personal information of investors who have a direct relationship with us and our wholly owned subsidiaries.
Throughout our business relationship, you provide us with personal information. We maintain information and records about you, your investments, and the services you use. Examples of the nonpublic personal information we maintain include
| | Ÿ | | data from investment applications and other forms |
| | Ÿ | | share balances and transactional history with us, our affiliates, or others |
| | Ÿ | | facts from a consumer reporting agency |
We do not disclose any nonpublic personal information about our customers or former customers to anyone, except as permitted by law. We may share nonpublic personal information with third parties or certain of our affiliates in connection with servicing your account or processing your transactions. We may share information with companies or financial institutions that perform marketing services on our behalf or with other financial institutions with which we have joint marketing arrangements, subject to any legal requirements.
Authorization to access your nonpublic personal information is limited to appropriate personnel who provide products, services, or information to you. We maintain physical, electronic, and procedural safeguards to help protect the personal information we collect about you.
If you have any questions about the MFS privacy policy, please call 1-800-225-2606 any business day between 8 a.m. and 8 p.m. Eastern time.
Note: If you own MFS products or receive MFS services in the name of a third party such as a bank or broker-dealer, their privacy policy may apply to you instead of ours.
55
CONTACT US
| | |
Web site mfs.com MFS TALK 1-800-637-8255 24 hours a day Account service and literature Shareholders 1-800-225-2606 Investment professionals 1-800-343-2829 Retirement plan services 1-800-637-1255 | | Mailing address MFS Service Center, Inc. P.O. Box 55824 Boston, MA 02205-5824 Overnight mail MFS Service Center, Inc. c/o Boston Financial Data Services 30 Dan Road Canton, MA 02021-2809 |

Save paper with eDelivery. MFS® will send you prospectuses, reports, and proxies directly via e-mail so you will get information faster with less mailbox clutter. To sign up: 1. go to mfs.com. 2. log in via MFS® Access. 3. select eDelivery. If you own your MFS fund shares through a financial institution or a retirement plan, MFS® TALK, MFS Access, and eDelivery may not be available to you.


MFS® New Discovery Fund
SIPC Contact Information:
You may obtain information about the Securities Investor Protection Corporation (“SIPC”), including the SIPC Brochure, by contacting SIPC either by telephone (202-371-8300) or by accessing SIPC’s website address (www.sipc.org).
The report is prepared for the general information of shareholders. It is authorized for distribution to prospective investors only when preceded or accompanied by a current prospectus.
NOT FDIC INSURED Ÿ MAY LOSE VALUE Ÿ
NO BANK GUARANTEE
8/31/09
NDF-ANN

LETTER FROM THE CEO
Dear Shareholders:
In the fall of 2008, the markets took investors on what was perhaps the most tumultuous ride of their lives. Many are now debating when the market will stage a sustainable recovery, but not even the most experienced investor can provide a definitive answer to that question.
Even so, the basic rules of investing have not changed, and the turbulence reinforced the benefits of investing through the waves. Investors who jumped ship early on may have regretted their decisions when the markets gained some traction in the early half of this year. While anyone with a short-term horizon may have needed to take some action, most with longer-term goals probably found the best option was to stick with their long-term strategy.
At MFS® we believe investors are always best served by developing a plan with their investment professionals that addresses specific long-term needs. Most advisors agree that yearly reviews are important to monitor a plan’s progress. Most would also caution their clients against reacting too quickly to the daily news. When markets do recover, they often gain ground in quick, sudden bursts. If you are out of the market, you can easily miss the benefits of these rallies.
Few of us would again like to live through the kind of market turmoil we saw over the past year. But as turbulent as markets were, in our view, they proved that the fundamental principles of long-term investing still apply.
Respectfully,

Robert J. Manning
Chief Executive Officer and Chief Investment Officer
MFS Investment Management®
October 15, 2009
The opinions expressed in this letter are subject to change, may not be relied upon for investment advice, and no forecasts can be guaranteed.
1
PORTFOLIO COMPOSITION
Portfolio structure
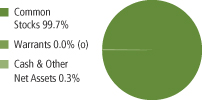
| | |
| Top ten holdings | | |
| CoStar Group, Inc. | | 1.7% |
| Hittite Microwave Corp. | | 1.6% |
| Silicon Laboratories, Inc. | | 1.6% |
| Team, Inc. | | 1.6% |
| MICROS Systems, Inc. | | 1.6% |
| Nuance Communications, Inc. | | 1.5% |
| Mindray Medical International Ltd., ADR | | 1.5% |
| ARM Holdings PLC | | 1.4% |
| Jones Lang LaSalle, Inc. | | 1.4% |
| Zumiez, Inc. | | 1.4% |
| | |
| Equity sectors | | |
| Technology | | 22.8% |
| Health Care | | 22.3% |
| Industrial Goods & Services | | 11.6% |
| Financial Services | | 7.9% |
| Retailing | | 7.1% |
| Leisure | | 7.0% |
| Special Products & Services | | 6.9% |
| Energy | | 4.6% |
| Basic Materials | | 3.0% |
| Consumer Staples | | 2.8% |
| Transportation | | 2.4% |
| Utilities & Communications | | 0.8% |
| Autos & Housing | | 0.5% |
Percentages are based on net assets as of 8/31/09.
The portfolio is actively managed and current holdings may be different.
2
MANAGEMENT REVIEW
Summary of Results
For the twelve months ended August 31, 2009, Class A shares of the MFS New Discovery Fund provided a total return of –9.69%, at net asset value. This compares with a return of –22.02% for the fund’s benchmark, the Russell 2000 Growth Index.
Market Environment
The global economy and financial markets experienced substantial deterioration and extraordinary volatility over most of the reporting period. Through the first quarter of 2009, the strong headwinds in the U.S. included accelerated deterioration in the housing market, anemic corporate investment, a rapidly declining job market, and a much tighter credit environment. During the early stages of the period, a seemingly continuous series of tumultuous financial events hammered markets. As a result of this barrage of turbulent news, global equity markets pushed significantly lower and credit markets witnessed the worst market decline since the beginning of the credit crisis. The synchronized global downturn in economic activity experienced in the fourth quarter of 2008 and the first quarter of 2009 was among the most intense in the post-World War II period. Not only did Europe and Japan fall into very deep recessions, but an increasingly powerful engine of global growth – emerging markets – also contracted almost across the board. Though credit conditions and equity indices improved considerably during the second half of the period, the degree of financial and macroeconomic dislocation remained significant.
During the first half of the reporting period, the Fed continued to cut interest rates aggressively towards zero, while making increasing use of its new lending facilities to alleviate ever-tightening credit markets. On the fiscal front, the U.S. Treasury designed and began implementing a massive fiscal stimulus package. As inflationary concerns diminished in the face of global deleveraging, and equity and credit markets deteriorated more sharply, central banks around the world also cut interest rates dramatically. Policy makers in different countries increasingly sought to coordinate their rescue efforts, which resulted in a number of international actions such as the agreement of swap lines between the Federal Reserve and a number of other central banks and a substantial increase in the financial resources of the International Monetary Fund. By the middle of the period, several central banks had approached their lower bound on policy rates and were examining the implementation and ramifications of quantitative easing as a means to further loosen monetary policy to offset the continuing fall in global economic activity. However, by the end of the period, there emerged broadening signs that the worst of the global macroeconomic deterioration had passed, which caused the subsequent rise in
3
Management Review – continued
asset valuations. As asset prices rebounded in the second half of the period and the demand for liquidity waned, the debate concerning monetary exit strategies had begun, creating added uncertainty regarding the forward path of policy rates.
Contributors to Performance
Strong stock selection in the technology sector boosted performance relative to the Russell 2000 Growth Index. Our overweighted position in semiconductor designer and developer Hittite Microwave and our holdings in transport and switching equipment maker Ciena Corp. (aa), a standout performer, were among the fund’s top relative contributors within this sector.
Security selection in the retailing sector also benefited relative returns. Here, urban fashion apparel retailer Citi Trends, specialty retailer of hardwood flooring Lumber Liquidators, and deep-discount store 99 Cents Only Stores (g) all contributed to relative results over the reporting period.
Although positive relative contribution from the energy sector was driven primarily by favorable stock selection, no individual stocks within this sector were among the fund’s top contributors.
Individual stocks in other sectors that aided relative performance included the fund’s ownership of leisure travel company Allegiant Travel (g), manufacturer of engineered wood and construction materials Universal Forest Products (aa)(g), slot machine maker International Game Technology (aa), and online provider of post-secondary education services Capella Education. Capella Education was the fund’s best relative-performing stock during this period. Its shares appreciated after management reported better-than-expected revenue and earnings growth and also increased earnings guidance, primarily due to strong enrollment trends. Elsewhere, our positioning in casual dining restaurants Red Robin Gourmet Burgers also helped relative returns as the fund captured more of the stock’s upside performance than the benchmark during the reporting period.
Detractors from Performance
Stock selection in the industrial goods and services sector detracted from relative performance. The fund’s overweighted positions in global high technology filtration company Polypore International and integrated mechanical services manufacturer Team, Inc. negatively impacted relative results. The fund’s holdings of oil services company, North American Energy Partners (aa) was also a detractor within this sector.
Several individual stocks in other sectors that hurt relative performance included aluminum producer Century Aluminum Company (aa)(g), hotel operator Morgans Hotel Group (g), interactive entertainment software company THQ (g), investment holding company Heckmann Corporation (aa)(g), and oil services
4
Management Review – continued
company Helix Energy Solutions (aa)(g). Helix’s shares sold off sharply in the fourth quarter of 2008 when management withdrew earnings guidance after Hurricane Ike forced the company to shut down most of its oil and gas production. Investor concerns that exploration companies would reduce capital spending following the sharp selloff in crude oil also, we believe, contributed to the stock’s selloff. Elsewhere, our positioning in genetic disease diagnostics company Affymetrix (g) dampened relative results. We sold out of our position early in the reporting period and, thus, missed the stock’s significant price appreciation in the second half of the period.
The fund’s cash position was also a detractor from relative performance. The fund holds cash to buy new holdings and to provide liquidity. The most significant impacts occurred during the second half of the reporting period, when equity markets increased, as measured by the fund’s benchmark. Holding cash in up markets can hurt performance versus the benchmark, which has no cash position.
Respectfully,
Thomas Wetherald
Portfolio Manager
| (aa) | Security is not a benchmark constituent. |
| (g) | Security was not held in the portfolio at period end. |
The views expressed in this report are those of the portfolio manager only through the end of the period of the report as stated on the cover and do not necessarily reflect the views of MFS or any other person in the MFS organization. These views are subject to change at any time based on market or other conditions, and MFS disclaims any responsibility to update such views. These views may not be relied upon as investment advice or an indication of trading intent on behalf of any MFS portfolio. References to specific securities are not recommendations of such securities, and may not be representative of any MFS portfolio’s current or future investments.
5
PERFORMANCE SUMMARY THROUGH 8/31/09
The following chart illustrates a representative class of the fund's historical performance in comparison to its benchmark(s). Performance results include the deduction of the maximum applicable sales charge and reflect the percentage change in net asset value, including reinvestment of dividends and capital gains distributions. The performance of other share classes will be greater than or less than that of the class depicted below. Benchmarks are unmanaged and may not be invested in directly. Benchmark returns do not reflect sales charges, commissions or expenses. (See Notes to Performance Summary.)
Performance data shown represents past performance and is no guarantee of future results. Investment return and principal value fluctuate so your shares, when sold, may be worth more or less than the original cost; current performance may be lower or higher than quoted. The performance shown does not reflect the deduction of taxes, if any, that a shareholder would pay on fund distributions or the redemption of fund shares.
Growth of a Hypothetical $10,000 Investment
6
Performance Summary – continued
Total Returns through 8/31/09
Average annual without sales charge
| | | | | | | | | | | | | | |
| | | Share class | | Class inception date | | 1-yr | | 5-yr | | 10-yr | | Life (t) | | |
| | | A | | 1/02/97 | | (9.69)% | | 4.39% | | 3.59% | | N/A | | |
| | | B | | 11/03/97 | | (10.30)% | | 3.71% | | 2.91% | | N/A | | |
| | | C | | 11/03/97 | | (10.34)% | | 3.72% | | 2.91% | | N/A | | |
| | | I | | 1/02/97 | | (9.43)% | | 4.75% | | 3.94% | | N/A | | |
| | | R1 | | 4/01/05 | | (10.33)% | | N/A | | N/A | | 1.74% | | |
| | | R2 | | 10/31/03 | | (9.84)% | | 4.13% | | N/A | | 1.24% | | |
| | | R3 | | 4/01/05 | | (9.59)% | | N/A | | N/A | | 2.50% | | |
| | | R4 | | 4/01/05 | | (9.43)% | | N/A | | N/A | | 2.78% | | |
| | | 529A | | 7/31/02 | | (9.77)% | | 4.17% | | N/A | | 4.68% | | |
| | | 529B | | 7/31/02 | | (10.39)% | | 3.50% | | N/A | | 4.00% | | |
| | | 529C | | 7/31/02 | | (10.38)% | | 3.50% | | N/A | | 3.99% | | |
| | | | | | | | | | | | | | |
| Comparative benchmark | | | | | | | | | | |
| | | Russell 2000 Growth Index (f) | | (22.02)% | | (2.71)% | | 0.65% | | N/A | | |
| | | | | | | | | | | | | | |
| Average annual with sales charge | | | | | | | | |
| | | | | | | | | | | | | | |
| | | A
With Initial Sales Charge (5.75%) | | (14.88)% | | 3.16% | | 2.97% | | N/A | | |
| | | B
With CDSC (Declining over six years from 4% to 0%) (x) | | (13.88)% | | 3.37% | | 2.91% | | N/A | | |
| | | C
With CDSC (1% for 12 months) (x) | | (11.23)% | | 3.72% | | 2.91% | | N/A | | |
| | | 529A
With Initial Sales Charge (5.75%) | | (14.96)% | | 2.94% | | N/A | | 3.81% | | |
| | | 529B
With CDSC (Declining over six years from 4% to 0%) (x) | | (13.97)% | | 3.15% | | N/A | | 4.00% | | |
| | | 529C
With CDSC (1% for 12 months) (x) | | (11.28)% | | 3.50% | | N/A | | 3.99% | | |
Class I, R1, R2, R3, and R4 shares do not have a sales charge.
CDSC – Contingent Deferred Sales Charge.
| (f) | Source: FactSet Research Systems, Inc. |
| (t) | For the period from the commencement of the class’ inception date through the stated period end (for those share classes with less than 10 years of performance history). No comparative benchmark information is provided for “life” periods. (See Notes to Performance Summary below.) |
| (x) | Assuming redemption at the end of the applicable period. |
7
Performance Summary – continued
Benchmark Definition
Russell 2000 Growth Index – constructed to provide a comprehensive barometer for growth securities in the small-cap segment of the U.S. equity universe. Companies in this index generally have higher price-to-book ratios and higher forecasted growth values.
It is not possible to invest directly in an index.
Notes to Performance Summary
Average annual total return represents the average annual change in value for each share class for the periods presented. Life returns are presented where the share class has less than 10 years of performance history and represent the average annual total return from the class inception date to the stated period end date. As the fund’s share classes may have different inception dates, the life returns may represent different time periods and may not be comparable. As a result, no comparative benchmark performance information is provided for life periods.
Performance results reflect any applicable expense subsidies and waivers in effect during the periods shown. Without such subsidies and waivers the fund’s performance results would be less favorable. Please see the prospectus and financial statements for complete details.
From time to time the fund may receive proceeds from litigation settlements, without which performance would be lower.
8
EXPENSE TABLE
Fund expenses borne by the shareholders during the period,
March 1, 2009 through August 31, 2009
As a shareholder of the fund, you incur two types of costs: (1) transaction costs, including sales charges (loads) on certain purchase or redemption payments, and (2) ongoing costs, including management fees; distribution and service (12b-1) fees; and other fund expenses. This example is intended to help you understand your ongoing costs (in dollars) of investing in the fund and to compare these costs with the ongoing costs of investing in other mutual funds.
The example is based on an investment of $1,000 invested at the beginning of the period and held for the entire period March 1, 2009 through August 31, 2009.
The expenses include the payment of a portion of the transfer-agent-related expenses of MFS funds that invest in the fund. For further information, please see the Notes to the Financial Statements.
Actual Expenses
The first line for each share class in the following table provides information about actual account values and actual expenses. You may use the information in this line, together with the amount you invested, to estimate the expenses that you paid over the period. Simply divide your account value by $1,000 (for example, an $8,600 account value divided by $1,000 = 8.6), then multiply the result by the number in the first line under the heading entitled “Expenses Paid During Period” to estimate the expenses you paid on your account during this period.
Hypothetical Example for Comparison Purposes
The second line for each share class in the following table provides information about hypothetical account values and hypothetical expenses based on the fund’s actual expense ratio and an assumed rate of return of 5% per year before expenses, which is not the fund’s actual return. The hypothetical account values and expenses may not be used to estimate the actual ending account balance or expenses you paid for the period. You may use this information to compare the ongoing costs of investing in the fund and other funds. To do so, compare this 5% hypothetical example with the 5% hypothetical examples that appear in the shareholder reports of the other funds.
Please note that the expenses shown in the table are meant to highlight your ongoing costs only and do not reflect any transactional costs, such as sales charges (loads). Therefore, the second line for each share class in the table is useful in comparing ongoing costs only, and will not help you determine the relative total costs of owning different funds. In addition, if these transactional costs were included, your costs would have been higher.
9
Expense Table – continued
| | | | | | | | | | |
Share
Class | | | | Annualized
Expense
Ratio | | Beginning
Account Value
3/01/09 | | Ending
Account Value
8/31/09 | | Expenses
Paid During
Period (p)
3/01/09-8/31/09 |
| A | | Actual | | 1.45% | | $1,000.00 | | $1,656.79 | | $9.71 |
| | Hypothetical (h) | | 1.45% | | $1,000.00 | | $1,017.90 | | $7.38 |
| B | | Actual | | 2.21% | | $1,000.00 | | $1,651.42 | | $14.77 |
| | Hypothetical (h) | | 2.21% | | $1,000.00 | | $1,014.06 | | $11.22 |
| C | | Actual | | 2.20% | | $1,000.00 | | $1,651.80 | | $14.70 |
| | Hypothetical (h) | | 2.20% | | $1,000.00 | | $1,014.12 | | $11.17 |
| I | | Actual | | 1.20% | | $1,000.00 | | $1,659.47 | | $8.04 |
| | Hypothetical (h) | | 1.20% | | $1,000.00 | | $1,019.16 | | $6.11 |
| R1 | | Actual | | 2.20% | | $1,000.00 | | $1,652.08 | | $14.71 |
| | Hypothetical (h) | | 2.20% | | $1,000.00 | | $1,014.12 | | $11.17 |
| R2 | | Actual | | 1.71% | | $1,000.00 | | $1,655.24 | | $11.44 |
| | Hypothetical (h) | | 1.71% | | $1,000.00 | | $1,016.59 | | $8.69 |
| R3 | | Actual | | 1.46% | | $1,000.00 | | $1,658.49 | | $9.78 |
| | Hypothetical (h) | | 1.46% | | $1,000.00 | | $1,017.85 | | $7.43 |
| R4 | | Actual | | 1.21% | | $1,000.00 | | $1,660.26 | | $8.11 |
| | Hypothetical (h) | | 1.21% | | $1,000.00 | | $1,019.11 | | $6.16 |
| 529A | | Actual | | 1.56% | | $1,000.00 | | $1,656.64 | | $10.45 |
| | Hypothetical (h) | | 1.56% | | $1,000.00 | | $1,017.34 | | $7.93 |
| 529B | | Actual | | 2.30% | | $1,000.00 | | $1,650.44 | | $15.37 |
| | Hypothetical (h) | | 2.30% | | $1,000.00 | | $1,013.61 | | $11.67 |
| 529C | | Actual | | 2.30% | | $1,000.00 | | $1,649.72 | | $15.36 |
| | Hypothetical (h) | | 2.30% | | $1,000.00 | | $1,013.61 | | $11.67 |
| (h) | 5% class return per year before expenses. |
| (p) | Expenses paid is equal to each class’ annualized expense ratio, as shown above, multiplied by the average account value over the period, multiplied by the number of days in the period, divided by the number of days in the year. Expenses paid do not include any applicable sales charges (loads). If these transaction costs had been included, your costs would have been higher. |
10
PORTFOLIO OF INVESTMENTS
8/31/09
The Portfolio of Investments is a complete list of all securities owned by your fund. It is categorized by broad-based asset classes.
| | | | | |
| Common Stocks - 99.7% | | | | | |
| Issuer | | Shares/Par | | Value ($) |
| | | | | |
| Aerospace - 0.7% | | | | | |
| HEICO Corp. | | 79,490 | | $ | 2,945,899 |
| HEICO Corp., “A” | | 51,300 | | | 1,574,910 |
| | | | | |
| | | | | $ | 4,520,809 |
| Airlines - 0.7% | | | | | |
| Copa Holdings S.A., “A” | | 99,490 | | $ | 4,155,697 |
| | |
| Apparel Manufacturers - 0.3% | | | | | |
| Stella International Holdings | | 1,254,500 | | $ | 2,091,251 |
| | |
| Biotechnology - 2.1% | | | | | |
| Human Genome Sciences, Inc. (a) | | 239,700 | | $ | 4,741,266 |
| Illumina, Inc. (a) | | 54,830 | | | 1,933,854 |
| Luminex Corp. (a) | | 248,260 | | | 3,793,413 |
| Myriad Genetics, Inc. (a) | | 83,100 | | | 2,540,367 |
| | | | | |
| | | | | $ | 13,008,900 |
| Brokerage & Asset Managers - 1.5% | | | | | |
| BM&F Bovespa S.A. | | 705,600 | | $ | 4,350,333 |
| Bolsa Mexicana de Valores S.A. de C.V. (a) | | 1,175,900 | | | 1,404,467 |
| Thomas Weisel Partners Group (a) | | 190,078 | | | 842,046 |
| TradeStation Group, Inc. (a) | | 330,150 | | | 2,367,176 |
| | | | | |
| | | | | $ | 8,964,022 |
| Business Services - 6.3% | | | | | |
| ATA, Inc., ADR (a) | | 75,610 | | $ | 537,587 |
| Concur Technologies, Inc. (a) | | 197,290 | | | 6,976,174 |
| Constant Contact, Inc. (a) | | 125,470 | | | 2,613,540 |
| Copart, Inc. (a) | | 229,460 | | | 8,109,116 |
| CoStar Group, Inc. (a) | | 274,950 | | | 10,434,353 |
| Kroton Educacional S.A., IEU | | 274,110 | | | 2,617,913 |
| Redecard S.A. | | 95,800 | | | 1,311,424 |
| Ultimate Software Group, Inc. (a) | | 218,330 | | | 5,757,362 |
| | | | | |
| | | | | $ | 38,357,469 |
| Computer Software - 4.1% | | | | | |
| ANSYS, Inc. (a) | | 69,180 | | $ | 2,430,985 |
| Blackboard, Inc. (a) | | 179,580 | | | 6,179,348 |
11
Portfolio of Investments – continued
| | | | | |
| Issuer | | Shares/Par | | Value ($) |
| | | | | |
| Common Stocks - continued | | | | | |
| Computer Software - continued | | | | | |
| CommVault Systems, Inc. (a) | | 201,580 | | $ | 3,686,898 |
| Emdeon, Inc., “A” (a) | | 179,020 | | | 3,122,109 |
| NetSuite, Inc. (a) | | 61,930 | | | 849,060 |
| Salesforce.com, Inc. (a) | | 111,960 | | | 5,807,365 |
| SolarWinds, Inc. (a) | | 131,270 | | | 2,449,498 |
| | | | | |
| | | | | $ | 24,525,263 |
| Computer Software - Systems - 2.3% | | | | | |
| LogMeIn, Inc. (a) | | 57,730 | | $ | 940,999 |
| MICROS Systems, Inc. (a) | | 341,730 | | | 9,524,015 |
| PROS Holdings, Inc. (a) | | 412,310 | | | 3,331,465 |
| | | | | |
| | | | | $ | 13,796,479 |
| Construction - 0.5% | | | | | |
| NVR, Inc. (a) | | 4,470 | | $ | 3,018,368 |
| | |
| Consumer Products - 1.2% | | | | | |
| Dabur India Ltd. | | 643,530 | | $ | 1,645,565 |
| Hengan International Group Co. Ltd. | | 374,000 | | | 2,070,151 |
| Natura Cosmeticos S.A. | | 224,630 | | | 3,633,984 |
| | | | | |
| | | | | $ | 7,349,700 |
| Consumer Services - 0.6% | | | | | |
| Capella Education Co. (a) | | 56,690 | | $ | 3,591,312 |
| | |
| Electrical Equipment - 1.6% | | | | | |
| Houston Wire & Cable Co. | | 93,410 | | $ | 1,075,149 |
| Mettler-Toledo International, Inc. (a) | | 38,320 | | | 3,349,168 |
| Sunpower Corp., “A” (a) | | 109,780 | | | 2,782,923 |
| Yingli Green Energy Holding Co. Ltd., ADR (a) | | 218,780 | | | 2,360,636 |
| | | | | |
| | | | | $ | 9,567,876 |
| Electronics - 7.9% | | | | | |
| ARM Holdings PLC | | 4,062,330 | | $ | 8,637,817 |
| CEVA, Inc. (a) | | 7,691 | | | 66,989 |
| Hittite Microwave Corp. (a) | | 286,930 | | | 9,876,131 |
| MEMC Electronic Materials, Inc. (a) | | 414,050 | | | 6,604,098 |
| NetLogic Microsystems, Inc. (a) | | 95,810 | | | 4,207,017 |
| Silicon Laboratories, Inc. (a) | | 215,480 | | | 9,705,219 |
| Stratasys, Inc. (a) | | 196,460 | | | 2,827,059 |
| Tessera Technologies, Inc. (a) | | 243,120 | | | 6,109,606 |
| | | | | |
| | | | | $ | 48,033,936 |
12
Portfolio of Investments – continued
| | | | | |
| Issuer | | Shares/Par | | Value ($) |
| | | | | |
| Common Stocks - continued | | | | | |
| Energy - Independent - 1.9% | | | | | |
| Arena Resources, Inc. (a) | | 112,410 | | $ | 3,437,498 |
| Continental Resources, Inc. (a) | | 68,110 | | | 2,404,283 |
| EXCO Resources, Inc. (a) | | 379,700 | | | 5,566,402 |
| | | | | |
| | | | | $ | 11,408,183 |
| Energy - Integrated - 0.6% | | | | | |
| Cimarex Energy Co. | | 90,910 | | $ | 3,549,126 |
| | |
| Engineering - Construction - 4.3% | | | | | |
| MYR Group, Inc. (a) | | 220,370 | | $ | 4,517,585 |
| North American Energy Partners, Inc. (a) | | 985,760 | | | 6,190,573 |
| Quanta Services, Inc. (a) | | 272,509 | | | 6,027,899 |
| Team, Inc. (a) | | 547,965 | | | 9,551,030 |
| | | | | |
| | | | | $ | 26,287,087 |
| Entertainment - 0.5% | | | | | |
| TiVo, Inc. (a) | | 317,220 | | $ | 3,111,928 |
| | |
| Food & Beverages - 1.6% | | | | | |
| Flowers Foods, Inc. | | 178,970 | | $ | 4,254,117 |
| Mead Johnson Nutrition Co., “A” | | 137,090 | | | 5,436,989 |
| | | | | |
| | | | | $ | 9,691,106 |
| Gaming & Lodging - 2.2% | | | | | |
| Genting Berhad | | 815,500 | | $ | 1,536,092 |
| International Game Technology | | 307,500 | | | 6,432,900 |
| Orient-Express Hotels Ltd., “A” | | 531,720 | | | 5,295,931 |
| | | | | |
| | | | | $ | 13,264,923 |
| Health Maintenance Organizations - 0.2% | | | | | |
| OdontoPrev S.A. | | 80,600 | | $ | 1,368,494 |
| | |
| Insurance - 0.8% | | | | | |
| PICO Holdings, Inc. (a) | | 141,140 | | $ | 4,675,968 |
| | |
| Internet - 4.9% | | | | | |
| Dealertrack Holdings, Inc. (a) | | 146,810 | | $ | 2,962,626 |
| Omniture, Inc. (a) | | 558,090 | | | 7,986,268 |
| Rackspace Hosting, Inc. (a) | | 433,540 | | | 5,610,008 |
| TechTarget, Inc. (a) | | 937,850 | | | 6,020,997 |
| Vocus, Inc. (a) | | 404,290 | | | 6,816,329 |
| | | | | |
| | | | | $ | 29,396,228 |
13
Portfolio of Investments – continued
| | | | | |
| Issuer | | Shares/Par | | Value ($) |
| | | | | |
| Common Stocks - continued | | | | | |
| Machinery & Tools - 5.0% | | | | | |
| Bucyrus International, Inc. | | 79,000 | | $ | 2,358,150 |
| Colfax Corp. (a) | | 586,910 | | | 6,221,246 |
| Duoyuan Global Water, Inc., ADR (a) | | 105,010 | | | 3,135,599 |
| Kennametal, Inc. | | 263,940 | | | 5,819,877 |
| Polypore International, Inc. (a) | | 412,597 | | | 4,691,228 |
| Ritchie Bros. Auctioneers, Inc. (l) | | 96,150 | | | 2,409,519 |
| RTI International Metals, Inc. (a) | | 275,788 | | | 5,300,645 |
| | | | | |
| | | | | $ | 29,936,264 |
| Medical & Health Technology & Services - 10.0% | | | | | |
| Allscripts Healthcare Solutions, Inc. | | 182,120 | | $ | 2,704,482 |
| athenahealth, Inc. (a) | | 141,750 | | | 5,702,603 |
| Cerner Corp. (a) | | 91,490 | | | 5,645,848 |
| Diagnosticos da America S.A. (a) | | 246,100 | | | 5,546,945 |
| Healthcare Services Group, Inc. | | 261,300 | | | 4,619,784 |
| IDEXX Laboratories, Inc. (a)(l) | | 155,670 | | | 7,901,809 |
| IPC The Hospitalist Co., Inc. (a) | | 197,887 | | | 5,845,582 |
| LCA-Vision, Inc. (a) | | 675,080 | | | 3,658,934 |
| Medassets, Inc. (a) | | 300,230 | | | 6,704,136 |
| Medidata Solutions, Inc. (a) | | 138,900 | | | 2,202,954 |
| MEDNAX, Inc. (a) | | 105,200 | | | 5,477,764 |
| MWI Veterinary Supply, Inc. (a) | | 115,806 | | | 4,309,141 |
| | | | | |
| | | | | $ | 60,319,982 |
| Medical Equipment - 8.7% | | | | | |
| Aspect Medical Systems, Inc. (a) | | 112,242 | | $ | 721,716 |
| AtriCure, Inc. (a) | | 95,380 | | | 373,890 |
| Conceptus, Inc. (a) | | 304,440 | | | 5,516,453 |
| DENTSPLY International, Inc. | | 177,290 | | | 5,976,446 |
| DexCom, Inc. (a) | | 835,840 | | | 6,527,910 |
| Edwards Lifesciences Corp. (a) | | 36,380 | | | 2,251,194 |
| Intuitive Surgical, Inc. (a) | | 20,160 | | | 4,489,834 |
| Mindray Medical International Ltd., ADR (l) | | 288,900 | | | 8,927,010 |
| NxStage Medical, Inc. (a) | | 862,981 | | | 5,333,223 |
| Orthovita, Inc. (a) | | 755,730 | | | 3,189,181 |
| ResMed, Inc. (a) | | 120,740 | | | 5,543,173 |
| Thoratec Corp. (a) | | 144,660 | | | 3,795,878 |
| | | | | |
| | | | | $ | 52,645,908 |
| Metals & Mining - 1.8% | | | | | |
| Cameco Corp. | | 151,120 | | $ | 4,016,770 |
| Cliffs Natural Resources, Inc. | | 145,380 | | | 3,679,568 |
14
Portfolio of Investments – continued
| | | | | |
| Issuer | | Shares/Par | | Value ($) |
| | | | | |
| Common Stocks - continued | | | | | |
| Metals & Mining - continued | | | | | |
| Globe Specialty Metals, Inc. (a) | | 356,070 | | $ | 2,916,213 |
| | | | | |
| | | | | $ | 10,612,551 |
| Network & Telecom - 2.1% | | | | | |
| Ciena Corp. (a) | | 618,170 | | $ | 8,283,478 |
| Polycom, Inc. (a) | | 186,310 | | | 4,395,053 |
| | | | | |
| | | | | $ | 12,678,531 |
| Oil Services - 2.1% | | | | | |
| Cal Dive International, Inc. (a) | | 69,105 | | $ | 720,765 |
| Dresser-Rand Group, Inc. (a) | | 138,080 | | | 4,100,976 |
| Exterran Holdings, Inc. (a) | | 425,220 | | | 7,666,717 |
| | | | | |
| | | | | $ | 12,488,458 |
| Other Banks & Diversified Financials - 4.2% | | | | | |
| City National Corp. | | 136,820 | | $ | 5,404,390 |
| Ocwen Financial Corp. (a) | | 327,900 | | | 3,393,765 |
| People’s United Financial, Inc. | | 394,270 | | | 6,331,976 |
| Signature Bank (a) | | 137,570 | | | 4,176,625 |
| SVB Financial Group (a) | | 154,580 | | | 6,144,555 |
| | | | | |
| | | | | $ | 25,451,311 |
| Personal Computers & Peripherals - 1.5% | | | | | |
| Nuance Communications, Inc. (a) | | 726,969 | | $ | 8,963,528 |
| | |
| Pharmaceuticals - 1.3% | | | | | |
| Cadence Pharmaceuticals, Inc. (a) | | 123,423 | | $ | 1,346,545 |
| Eurand N.V. (a) | | 211,340 | | | 3,041,183 |
| Genomma Lab Internacional S.A., “B” (a) | | 1,380,100 | | | 1,947,027 |
| Inspire Pharmaceuticals, Inc. (a) | | 263,180 | | | 1,571,185 |
| | | | | |
| | | | | $ | 7,905,940 |
| Printing & Publishing - 2.1% | | | | | |
| MSCI, Inc., “A” (a) | | 234,770 | | $ | 6,906,933 |
| VistaPrint Ltd. (a) | | 141,390 | | | 5,859,202 |
| | | | | |
| | | | | $ | 12,766,135 |
| Railroad & Shipping - 0.4% | | | | | |
| Diana Shipping, Inc. | | 199,570 | | $ | 2,592,414 |
| | |
| Real Estate - 1.4% | | | | | |
| Jones Lang LaSalle, Inc. | | 184,170 | | $ | 8,633,890 |
15
Portfolio of Investments – continued
| | | | | |
| Issuer | | Shares/Par | | Value ($) |
| | | | | |
| Common Stocks - continued | | | | | |
| Restaurants - 2.2% | | | | | |
| McCormick & Schmick’s Seafood Restaurant, Inc. (a) | | 673,286 | | $ | 5,931,650 |
| Peet’s Coffee & Tea, Inc. (a) | | 103,650 | | | 2,727,032 |
| Red Robin Gourmet Burgers, Inc. (a) | | 226,710 | | | 4,370,969 |
| | | | | |
| | | | | $ | 13,029,651 |
| Specialty Chemicals - 1.2% | | | | | |
| Asian Paints Ltd. | | 83,612 | | $ | 2,397,990 |
| Rockwood Holdings, Inc. (a) | | 244,370 | | | 4,977,817 |
| | | | | |
| | | | | $ | 7,375,807 |
| Specialty Stores - 6.8% | | | | | |
| Abercrombie & Fitch Co., “A” | | 135,420 | | $ | 4,372,712 |
| Citi Trends, Inc. (a) | | 182,270 | | | 4,062,798 |
| Ctrip.com International Ltd., ADR (a) | | 91,550 | | | 4,480,451 |
| Dufry South America Ltd., BDR | | 156,900 | | | 2,397,581 |
| hhgregg, Inc. (a) | | 172,250 | | | 2,976,480 |
| Lumber Liquidators, Inc. (a) | | 180,310 | | | 3,966,820 |
| Overstock.com, Inc. (a) | | 218,220 | | | 2,719,021 |
| Tiffany & Co. | | 65,910 | | | 2,397,806 |
| Titan Machinery, Inc. (a) | | 424,810 | | | 5,118,961 |
| Zumiez, Inc. (a) | | 662,629 | | | 8,375,631 |
| | | | | |
| | | | | $ | 40,868,261 |
| Trucking - 1.3% | | | | | |
| Landstar System, Inc. | | 217,250 | | $ | 7,575,508 |
| | |
| Utilities - Electric Power - 0.8% | | | | | |
| ITC Holdings Corp. | | 105,690 | | $ | 4,923,040 |
| Total Common Stocks (Identified Cost, $494,566,081) | | | | $ | 602,501,304 |
| | | | | | | | | | |
| | | | |
| | | Strike Price | | First Exercise | | | | |
| | | | | | | | | | |
| Warrants - 0.0% | | | | | | | | | | |
| Alcoholic Beverages - 0.0% | | | | | | | | | | |
Castle Brands, Inc. (1 share for 1 warrant)
(Identified Cost, $155,725) (a)(z) | | $ | 6.57 | | 5/08/07 | | 110,880 | | $ | 2,433 |
| | | | | |
| | |
| Money Market Funds (v) - 0.8% | | | | | |
| | | | | |
MFS Institutional Money Market Portfolio, 0.2%,
at Cost and Net Asset Value | | 4,462,053 | | $ | 4,462,053 |
16
Portfolio of Investments – continued
| | | | | | |
| Collateral for Securities Loaned - 1.1% | | | | | | |
| Issuer | | Shares/Par | | Value ($) | |
| | | | | | |
Navigator Securities Lending Prime Portfolio,
at Cost and Net Asset Value | | 6,828,901 | | $ | 6,828,901 | |
| Total Investments (Identified Cost, $506,012,760) | | | | $ | 613,794,691 | |
| | |
| Other Assets, Less Liabilities - (1.6)% | | | | | (9,706,338 | ) |
| Net Assets - 100.0% | | | | $ | 604,088,353 | |
| (a) | Non-income producing security. |
| (l) | All or a portion of this security is on loan. |
| (v) | Underlying fund that is available only to investment companies managed by MFS. The rate quoted is the annualized seven-day yield of the fund at period end. |
| (z) | Restricted securities are not registered under the Securities Act of 1933 and are subject to legal restrictions on resale. These securities generally may be resold in transactions exempt from registration or to the public if the securities are subsequently registered. Disposal of these securities may involve time-consuming negotiations and prompt sale at an acceptable price may be difficult. The fund holds the following restricted security: |
| | | | | | |
| Restricted Security | | Acquisition
Date | | Cost | | Current
Market
Value |
| Castle Brands, Inc. (Warrants) | | 4/18/07 | | $155,725 | | $2,433 |
| % of Net Assets | | | | | | 0.0% |
The following abbreviations are used in this report and are defined:
| ADR | | American Depository Receipt |
| BDR | | Brazilian Depository Receipt |
| IEU | | International Equity Unit |
| PLC | | Public Limited Company |
See Notes to Financial Statements
17
Financial Statements
STATEMENT OF ASSETS AND LIABILITIES
At 8/31/09
This statement represents your fund’s balance sheet, which details the assets and liabilities comprising the total value of the fund.
| | | |
| Assets | | | |
Investments- | | | |
Non-affiliated issuers, at value (identified cost, $501,550,707) | | $609,332,638 | |
Underlying funds, at cost and value | | 4,462,053 | |
Total investments, at value, including $6,555,840 of securities on loan
(identified cost, $506,012,760) | | $613,794,691 | |
Foreign currency, at value (identified cost, $5,766) | | 5,759 | |
Receivables for | | | |
Investments sold | | 16,426,137 | |
Fund shares sold | | 1,581,629 | |
Interest and dividends | | 136,232 | |
Other assets | | 1,249 | |
Total assets | | $631,945,697 | |
| Liabilities | | | |
Payables for | | | |
Investments purchased | | $18,996,353 | |
Fund shares reacquired | | 1,564,768 | |
Collateral for securities loaned, at value | | 6,828,901 | |
Payable to affiliates | | | |
Investment adviser | | 53,707 | |
Shareholder servicing costs | | 198,746 | |
Distribution and service fees | | 14,086 | |
Administrative services fee | | 1,271 | |
Program manager fees | | 22 | |
Payable for independent Trustees’ compensation | | 8,640 | |
Accrued expenses and other liabilities | | 190,850 | |
Total liabilities | | $27,857,344 | |
Net assets | | $604,088,353 | |
| Net assets consist of | | | |
Paid-in capital | | $686,384,379 | |
Unrealized appreciation (depreciation) on investments and translation of assets
and liabilities in foreign currencies (net of $75,108 deferred country tax) | | 107,707,000 | |
Accumulated net realized gain (loss) on investments and foreign
currency transactions | | (189,994,398 | ) |
Accumulated net investment loss | | (8,628 | ) |
Net assets | | $604,088,353 | |
Shares of beneficial interest outstanding | | 36,866,636 | |
18
Statement of Assets and Liabilities – continued
| | | | | | |
| | | Net assets | | Shares
outstanding | | Net asset value
per share (a) |
Class A | | $248,657,946 | | 15,325,808 | | $16.22 |
Class B | | 27,581,508 | | 1,819,276 | | 15.16 |
Class C | | 25,430,858 | | 1,675,389 | | 15.18 |
Class I | | 238,410,103 | | 14,096,457 | | 16.91 |
Class R1 | | 4,217,271 | | 279,232 | | 15.10 |
Class R2 | | 11,312,445 | | 709,760 | | 15.94 |
Class R3 | | 3,491,621 | | 215,328 | | 16.22 |
Class R4 | | 42,974,366 | | 2,616,925 | | 16.42 |
Class 529A | | 1,444,191 | | 90,412 | | 15.97 |
Class 529B | | 175,057 | | 11,731 | | 14.92 |
Class 529C | | 392,987 | | 26,318 | | 14.93 |
On sales of $50,000 or more, the offering prices of Class A and Class 529A shares are reduced. A contingent deferred sales charge may be imposed on redemptions of Class A, Class B, Class C, Class 529B, and Class 529C shares.
| (a) | Maximum offering price and redemption price per share were equal to the net asset value per share for all share classes, except for Classes A and 529A, for which the maximum offering prices per share were $17.21 and $16.94, respectively. |
See Notes to Financial Statements
19
Financial Statements
STATEMENT OF OPERATIONS
Year ended 8/31/09
This statement describes how much your fund earned in investment income and accrued in expenses. It also describes any gains and/or losses generated by fund operations.
| | | | | | |
| Net investment loss | | | | | | |
Income | | | | | | |
Dividends | | $1,946,347 | | | | |
Income on securities loaned | | 262,588 | | | | |
Interest | | 5,316 | | | | |
Dividends from underlying funds | | 4,274 | | | | |
Foreign taxes withheld | | (32,688 | ) | | | |
Total investment income | | | | | $2,185,837 | |
Expenses | | | | | | |
Management fee | | $3,614,858 | | | | |
Distribution and service fees | | 1,065,684 | | | | |
Program manager fees | | 1,512 | | | | |
Shareholder servicing costs | | 1,461,790 | | | | |
Administrative services fee | | 84,968 | | | | |
Independent Trustees’ compensation | | 18,218 | | | | |
Custodian fee | | 155,896 | | | | |
Shareholder communications | | 38,923 | | | | |
Auditing fees | | 47,368 | | | | |
Legal fees | | 12,926 | | | | |
Miscellaneous | | 138,503 | | | | |
Total expenses | | | | | $6,640,646 | |
Fees paid indirectly | | (1,589 | ) | | | |
Reduction of expenses by investment adviser | �� | (404,368 | ) | | | |
Net expenses | | | | | $6,234,689 | |
Net investment loss | | | | | $(4,048,852 | ) |
Realized and unrealized gain (loss) on investments and
foreign currency transactions | | | | | | |
Realized gain (loss) (identified cost basis) | | | | | | |
Investment transactions (net of $1,770 country tax) | | $(141,453,952 | ) | | | |
Foreign currency transactions | | (59,388 | ) | | | |
Net realized gain (loss) on investments
and foreign currency transactions | | | | | $(141,513,340 | ) |
Change in unrealized appreciation (depreciation) | | | | | | |
Investments (net of $75,108 deferred country tax) | | $142,730,202 | | | | |
Translation of assets and liabilities in foreign currencies | | 177 | | | | |
Net unrealized gain (loss) on investments
and foreign currency translation | | | | | $142,730,379 | |
Net realized and unrealized gain (loss) on investments
and foreign currency | | | | | $1,217,039 | |
Change in net assets from operations | | | | | $(2,831,813 | ) |
See Notes to Financial Statements
20
Financial Statements
STATEMENTS OF CHANGES IN NET ASSETS
These statements describe the increases and/or decreases in net assets resulting from operations, any distributions, and any shareholder transactions.
| | | | | | |
| | | Years ended 8/31 | |
| | | 2009 | | | 2008 | |
| Change in net assets | | | | | | |
| From operations | | | | | | |
Net investment loss | | $(4,048,852 | ) | | $(5,240,496 | ) |
Net realized gain (loss) on investments and
foreign currency transactions | | (141,513,340 | ) | | (11,072,095 | ) |
Net unrealized gain (loss) on investments and
foreign currency translation | | 142,730,379 | | | (45,932,006 | ) |
Change in net assets from operations | | $(2,831,813 | ) | | $(62,244,597 | ) |
| Distributions declared to shareholders | | | | | | |
From net realized gain on investments | | $— | | | $(21,776,506 | ) |
Change in net assets from fund share transactions | | $86,060,960 | | | $(120,426,495 | ) |
Total change in net assets | | $83,229,147 | | | $(204,447,598 | ) |
| Net assets | | | | | | |
At beginning of period | | 520,859,206 | | | 725,306,804 | |
At end of period (including accumulated net investment
loss of $8,628 and $9,664, respectively) | | $604,088,353 | | | $520,859,206 | |
See Notes to Financial Statements
21
Financial Statements
FINANCIAL HIGHLIGHTS
The financial highlights table is intended to help you understand the fund’s financial performance for the past 5 years (or life of a particular share class, if shorter). Certain information reflects financial results for a single fund share. The total returns in the table represent the rate by which an investor would have earned (or lost) on an investment in the fund share class (assuming reinvestment of all distributions) held for the entire period.
| | | | | | | | | | | | | | | |
| Class A | | Years ended 8/31 | |
| | | 2009 | | | 2008 | | | 2007 | | | 2006 | | | 2005 | |
Net asset value, beginning of period | | $17.96 | | | $20.48 | | | $16.96 | | | $16.85 | | | $13.53 | |
| Income (loss) from investment operations | | | | | | | | | | | | | | | |
Net investment loss (d) | | $(0.13 | ) | | $(0.16 | ) | | $(0.16 | ) | | $(0.20 | ) | | $(0.16 | ) |
Net realized and unrealized gain (loss)
on investments and foreign currency | | (1.61 | )(g) | | (1.70 | ) | | 3.68 | | | 0.31 | | | 3.48 | |
Total from investment operations | | $(1.74 | ) | | $(1.86 | ) | | $3.52 | | | $0.11 | | | $3.32 | |
| Less distributions declared to shareholders | | | | | | | | | | | | | | | |
From net realized gain on investments | | $— | | | $(0.66 | ) | | $— | | | $— | | | $— | |
Redemption fees added to paid-in capital (d) | | $— | | | $— | | | $0.00 | (w) | | $0.00 | (w) | | $0.00 | (w) |
Net asset value, end of period | | $16.22 | | | $17.96 | | | $20.48 | | | $16.96 | | | $16.85 | |
Total return (%) (r)(s)(t) | | (9.69 | ) | | (9.31 | ) | | 20.75 | | | 0.65 | | | 24.54 | |
Ratios (%) (to average net assets)
and Supplemental data: | | | | | | | | | | | | | | | |
Expenses before expense reductions (f) | | 1.70 | | | 1.61 | | | 1.57 | | | 1.57 | | | 1.57 | |
Expenses after expense reductions (f) | | 1.60 | | | 1.51 | | | 1.47 | | | 1.47 | | | 1.47 | |
Net investment loss | | (1.05 | ) | | (0.86 | ) | | (1.04 | ) | | (1.12 | ) | | (1.05 | ) |
Portfolio turnover | | 150 | | | 95 | | | 94 | | | 99 | | | 112 | |
Net assets at end of period (000 Omitted) | | $248,658 | | | $282,079 | | | $395,993 | | | $409,471 | | | $603,396 | |
See Notes to Financial Statements
22
Financial Highlights – continued
| | | | | | | | | | | | | | | |
| Class B | | Years ended 8/31 | |
| | | 2009 | | | 2008 | | | 2007 | | | 2006 | | | 2005 | |
Net asset value, beginning of period | | $16.90 | | | $19.44 | | | $16.20 | | | $16.20 | | | $13.09 | |
| Income (loss) from investment operations | | | | | | | | | | | | | | | |
Net investment loss (d) | | $(0.21 | ) | | $(0.27 | ) | | $(0.25 | ) | | $(0.30 | ) | | $(0.25 | ) |
Net realized and unrealized gain (loss)
on investments and foreign currency | | (1.53 | )(g) | | (1.61 | ) | | 3.49 | | | 0.30 | | | 3.36 | |
Total from investment operations | | $(1.74 | ) | | $(1.88 | ) | | $3.24 | | | $— | | | $3.11 | |
| Less distributions declared to shareholders | | | | | | | | | | | | | | | |
From net realized gain on investments | | $— | | | $(0.66 | ) | | $— | | | $— | | | $— | |
Redemption fees added to paid-in capital (d) | | $— | | | $— | | | $0.00 | (w) | | $0.00 | (w) | | $0.00 | (w) |
Net asset value, end of period | | $15.16 | | | $16.90 | | | $19.44 | | | $16.20 | | | $16.20 | |
Total return (%) (r)(s)(t) | | (10.30 | ) | | (9.92 | ) | | 20.00 | | | 0.00 | | | 23.76 | |
Ratios (%) (to average net assets)
and Supplemental data: | | | | | | | | | | | | | | | |
Expenses before expense reductions (f) | | 2.41 | | | 2.27 | | | 2.22 | | | 2.22 | | | 2.22 | |
Expenses after expense reductions (f) | | 2.30 | | | 2.17 | | | 2.12 | | | 2.12 | | | 2.12 | |
Net investment loss | | (1.76 | ) | | (1.53 | ) | | (1.69 | ) | | (1.77 | ) | | (1.70 | ) |
Portfolio turnover | | 150 | | | 95 | | | 94 | | | 99 | | | 112 | |
Net assets at end of period (000 Omitted) | | $27,582 | | | $38,724 | | | $91,922 | | | $132,519 | | | $203,722 | |
| |
| Class C | | Years ended 8/31 | |
| | | 2009 | | | 2008 | | | 2007 | | | 2006 | | | 2005 | |
Net asset value, beginning of period | | $16.93 | | | $19.46 | | | $16.22 | | | $16.22 | | | $13.10 | |
| Income (loss) from investment operations | | | | | | | | | | | | | | | |
Net investment loss (d) | | $(0.21 | ) | | $(0.27 | ) | | $(0.25 | ) | | $(0.30 | ) | | $(0.25 | ) |
Net realized and unrealized gain (loss)
on investments and foreign currency | | (1.54 | )(g) | | (1.60 | ) | | 3.49 | | | 0.30 | | | 3.37 | |
Total from investment operations | | $(1.75 | ) | | $(1.87 | ) | | $3.24 | | | $— | | | $3.12 | |
| Less distributions declared to shareholders | | | | | | | | | | | | | | | |
From net realized gain on investments | | $— | | | $(0.66 | ) | | $— | | | $— | | | $— | |
Redemption fees added to paid-in capital (d) | | $— | | | $— | | | $0.00 | (w) | | $0.00 | (w) | | $0.00 | (w) |
Net asset value, end of period | | $15.18 | | | $16.93 | | | $19.46 | | | $16.22 | | | $16.22 | |
Total return (%) (r)(s)(t) | | (10.34 | ) | | (9.86 | ) | | 19.98 | | | 0.00 | | | 23.82 | |
Ratios (%) (to average net assets)
and Supplemental data: | | | | | | | | | | | | | | | |
Expenses before expense reductions (f) | | 2.40 | | | 2.26 | | | 2.22 | | | 2.22 | | | 2.22 | |
Expenses after expense reductions (f) | | 2.30 | | | 2.16 | | | 2.12 | | | 2.12 | | | 2.12 | |
Net investment loss | | (1.75 | ) | | (1.51 | ) | | (1.69 | ) | | (1.77 | ) | | (1.70 | ) |
Portfolio turnover | | 150 | | | 95 | | | 94 | | | 99 | | | 112 | |
Net assets at end of period (000 Omitted) | | $25,431 | | | $29,661 | | | $42,296 | | | $47,293 | | | $58,454 | |
See Notes to Financial Statements
23
Financial Highlights – continued
| | | | | | | | | | | | | | | |
| Class I | | Years ended 8/31 | |
| | | 2009 | | | 2008 | | | 2007 | | | 2006 | | | 2005 | |
Net asset value, beginning of period | | $18.67 | | | $21.19 | | | $17.48 | | | $17.31 | | | $13.85 | |
| Income (loss) from investment operations | | | | | | | | | | | | | | | |
Net investment loss (d) | | $(0.10 | ) | | $(0.10 | ) | | $(0.11 | ) | | $(0.14 | ) | | $(0.11 | ) |
Net realized and unrealized gain (loss)
on investments and foreign currency | | (1.66 | )(g) | | (1.76 | ) | | 3.82 | | | 0.31 | | | 3.57 | |
Total from investment operations | | $(1.76 | ) | | $(1.86 | ) | | $3.71 | | | $0.17 | | | $3.46 | |
| Less distributions declared to shareholders | | | | | | | | | | | | | | | |
From net realized gain on investments | | $— | | | $(0.66 | ) | | $— | | | $— | | | $— | |
Redemption fees added to paid-in capital (d) | | $— | | | $— | | | $0.00 | (w) | | $0.00 | (w) | | $0.00 | (w) |
Net asset value, end of period | | $16.91 | | | $18.67 | | | $21.19 | | | $17.48 | | | $17.31 | |
Total return (%) (r)(s) | | (9.43 | ) | | (8.99 | ) | | 21.22 | | | 0.98 | | | 24.98 | |
Ratios (%) (to average net assets)
and Supplemental data: | | | | | | | | | | | | | | | |
Expenses before expense reductions (f) | | 1.35 | | | 1.26 | | | 1.22 | | | 1.22 | | | 1.23 | |
Expenses after expense reductions (f) | | 1.25 | | | 1.16 | | | 1.12 | | | 1.12 | | | 1.13 | |
Net investment loss | | (0.71 | ) | | (0.51 | ) | | (0.69 | ) | | (0.77 | ) | | (0.70 | ) |
Portfolio turnover | | 150 | | | 95 | | | 94 | | | 99 | | | 112 | |
Net assets at end of period (000 Omitted) | | $238,410 | | | $90,045 | | | $100,245 | | | $119,053 | | | $107,842 | |
| |
| Class R1 | | Years ended 8/31 | |
| | | 2009 | | | 2008 | | | 2007 | | | 2006 | | | 2005 (i) | |
Net asset value, beginning of period | | $16.84 | | | $19.37 | | | $16.16 | | | $16.18 | | | $14.50 | |
| Income (loss) from investment operations | | | | | | | | | | | | | | | |
Net investment loss (d) | | $(0.21 | ) | | $(0.27 | ) | | $(0.26 | ) | | $(0.31 | ) | | $(0.10 | ) |
Net realized and unrealized gain (loss)
on investments and foreign currency | | (1.53 | )(g) | | (1.60 | ) | | 3.47 | | | 0.29 | | | 1.78 | |
Total from investment operations | | $(1.74 | ) | | $(1.87 | ) | | $3.21 | | | $(0.02 | ) | | $1.68 | |
| Less distributions declared to shareholders | | | | | | | | | | | | | | | |
From net realized gain on investments | | $— | | | $(0.66 | ) | | $— | | | $— | | | $— | |
Redemption fees added to paid-in capital (d) | | $— | | | $— | | | $0.00 | (w) | | $0.00 | (w) | | $0.00 | (w) |
Net asset value, end of period | | $15.10 | | | $16.84 | | | $19.37 | | | $16.16 | | | $16.18 | |
Total return (%) (r)(s) | | (10.33 | ) | | (9.91 | ) | | 19.86 | | | (0.12 | ) | | 11.59 | (n) |
Ratios (%) (to average net assets)
and Supplemental data: | | | | | | | | | | | | | | | |
Expenses before expense reductions (f) | | 2.40 | | | 2.30 | | | 2.37 | | | 2.43 | | | 2.43 | (a) |
Expenses after expense reductions (f) | | 2.30 | | | 2.20 | | | 2.22 | | | 2.22 | | | 2.33 | (a) |
Net investment loss | | (1.76 | ) | | (1.54 | ) | | (1.79 | ) | | (1.86 | ) | | (1.69 | )(a) |
Portfolio turnover | | 150 | | | 95 | | | 94 | | | 99 | | | 112 | |
Net assets at end of period (000 Omitted) | | $4,217 | | | $4,565 | | | $2,609 | | | $857 | | | $206 | |
See Notes to Financial Statements
24
Financial Highlights – continued
| | | | | | | | | | | | | | | |
| Class R2 | | Years ended 8/31 | |
| | | 2009 | | | 2008 | | | 2007 | | | 2006 | | | 2005 | |
Net asset value, beginning of period | | $17.68 | | | $20.21 | | | $16.78 | | | $16.72 | | | $13.47 | |
| Income (loss) from investment operations | | | | | | | | | | | | | | | |
Net investment loss (d) | | $(0.16 | ) | | $(0.19 | ) | | $(0.20 | ) | | $(0.24 | ) | | $(0.22 | ) |
Net realized and unrealized gain (loss)
on investments and foreign currency | | (1.58 | )(g) | | (1.68 | ) | | 3.63 | | | 0.30 | | | 3.47 | |
Total from investment operations | | $(1.74 | ) | | $(1.87 | ) | | $3.43 | | | $0.06 | | | $3.25 | |
| Less distributions declared to shareholders | | | | | | | | | | | | | | | |
From net realized gain on investments | | $— | | | $(0.66 | ) | | $— | | | $— | | | $— | |
Redemption fees added to paid-in capital (d) | | $— | | | $— | | | $0.00 | (w) | | $0.00 | (w) | | $0.00 | (w) |
Net asset value, end of period | | $15.94 | | | $17.68 | | | $20.21 | | | $16.78 | | | $16.72 | |
Total return (%) (r)(s) | | (9.84 | ) | | (9.48 | ) | | 20.44 | | | 0.36 | | | 24.13 | |
Ratios (%) (to average net assets)
and Supplemental data: | | | | | | | | | | | | | | | |
Expenses before expense reductions (f) | | 1.90 | | | 1.80 | | | 1.92 | | | 1.96 | | | 1.98 | |
Expenses after expense reductions (f) | | 1.80 | | | 1.70 | | | 1.77 | | | 1.77 | | | 1.88 | |
Net investment loss | | (1.26 | ) | | (1.03 | ) | | (1.34 | ) | | (1.41 | ) | | (1.42 | ) |
Portfolio turnover | | 150 | | | 95 | | | 94 | | | 99 | | | 112 | |
Net assets at end of period (000 Omitted) | | $11,312 | | | $13,675 | | | $8,711 | | | $4,417 | | | $1,573 | |
| |
| Class R3 | | Years ended 8/31 | |
| | | 2009 | | | 2008 | | | 2007 | | | 2006 | | | 2005 (i) | |
Net asset value, beginning of period | | $17.94 | | | $20.45 | | | $16.94 | | | $16.84 | | | $15.04 | |
| Income (loss) from investment operations | | | | | | | | | | | | | | | |
Net investment loss (d) | | $(0.13 | ) | | $(0.15 | ) | | $(0.17 | ) | | $(0.21 | ) | | $(0.04 | ) |
Net realized and unrealized gain (loss)
on investments and foreign currency | | (1.59 | )(g) | | (1.70 | ) | | 3.68 | | | 0.31 | | | 1.84 | |
Total from investment operations | | $(1.72 | ) | | $(1.85 | ) | | $3.51 | | | $0.10 | | | $1.80 | |
| Less distributions declared to shareholders | | | | | | | | | | | | | | | |
From net realized gain on investments | | $— | | | $(0.66 | ) | | $— | | | $— | | | $— | |
Redemption fees added to paid-in capital (d) | | $— | | | $— | | | $0.00 | (w) | | $0.00 | (w) | | $0.00 | (w) |
Net asset value, end of period | | $16.22 | | | $17.94 | | | $20.45 | | | $16.94 | | | $16.84 | |
Total return (%) (r)(s) | | (9.59 | ) | | (9.27 | ) | | 20.72 | | | 0.59 | | | 11.97 | (n) |
Ratios (%) (to average net assets)
and Supplemental data: | | | | | | | | | | | | | | | |
Expenses before expense reductions (f) | | 1.65 | | | 1.57 | | | 1.62 | | | 1.62 | | | 1.63 | (a) |
Expenses after expense reductions (f) | | 1.55 | | | 1.47 | | | 1.52 | | | 1.52 | | | 1.53 | (a) |
Net investment loss | | (1.00 | ) | | (0.82 | ) | | (1.09 | ) | | (1.15 | ) | | (0.66 | )(a) |
Portfolio turnover | | 150 | | | 95 | | | 94 | | | 99 | | | 112 | |
Net assets at end of period (000 Omitted) | | $3,492 | | | $4,204 | | | $4,654 | | | $2,404 | | | $334 | |
See Notes to Financial Statements
25
Financial Highlights – continued
| | | | | | | | | | | | | | | |
| Class R4 | | Years ended 8/31 | |
| | | 2009 | | | 2008 | | | 2007 | | | 2006 | | | 2005 (i) | |
Net asset value, beginning of period | | $18.13 | | | $20.60 | | | $17.01 | | | $16.86 | | | $15.04 | |
| Income (loss) from investment operations | | | | | | | | | | | | | | | |
Net investment loss (d) | | $(0.10 | ) | | $(0.10 | ) | | $(0.12 | ) | | $(0.15 | ) | | $(0.04 | ) |
Net realized and unrealized gain (loss)
on investments and foreign currency | | (1.61 | )(g) | | (1.71 | ) | | 3.71 | | | 0.30 | | | 1.86 | |
Total from investment operations | | $(1.71 | ) | | $(1.81 | ) | | $3.59 | | | $0.15 | | | $1.82 | |
| Less distributions declared to shareholders | | | | | | | | | | | | | | | |
From net realized gain on investments | | $— | | | $(0.66 | ) | | $— | | | $— | | | $— | |
Redemption fees added to paid-in capital (d) | | $— | | | $— | | | $0.00 | (w) | | $0.00 | (w) | | $0.00 | (w) |
Net asset value, end of period | | $16.42 | | | $18.13 | | | $20.60 | | | $17.01 | | | $16.86 | |
Total return (%) (r)(s) | | (9.43 | ) | | (9.00 | ) | | 21.11 | | | 0.89 | | | 12.10 | (n) |
Ratios (%) (to average net assets) and Supplemental data: | | | | | | | | | | | | | | | |
Expenses before expense reductions (f) | | 1.40 | | | 1.30 | | | 1.32 | | | 1.32 | | | 1.32 | (a) |
Expenses after expense reductions (f) | | 1.30 | | | 1.20 | | | 1.22 | | | 1.22 | | | 1.22 | (a) |
Net investment loss | | (0.76 | ) | | (0.55 | ) | | (0.79 | ) | | (0.84 | ) | | (0.67 | )(a) |
Portfolio turnover | | 150 | | | 95 | | | 94 | | | 99 | | | 112 | |
Net assets at end of period (000 Omitted) | | $42,974 | | | $55,828 | | | $67,212 | | | $59,999 | | | $56 | |
| |
| Class 529A | | Years ended 8/31 | |
| | | 2009 | | | 2008 | | | 2007 | | | 2006 | | | 2005 | |
Net asset value, beginning of period | | $17.70 | | | $20.23 | | | $16.79 | | | $16.73 | | | $13.47 | |
| Income (loss) from investment operations | | | | | | | | | | | | | | | |
Net investment loss (d) | | $(0.14 | ) | | $(0.19 | ) | | $(0.21 | ) | | $(0.24 | ) | | $(0.20 | ) |
Net realized and unrealized gain (loss)
on investments and foreign currency | | (1.59 | )(g) | | (1.68 | ) | | 3.65 | | | 0.30 | | | 3.46 | |
Total from investment operations | | $(1.73 | ) | | $(1.87 | ) | | $3.44 | | | $0.06 | | | $3.26 | |
| Less distributions declared to shareholders | | | | | | | | | | | | | | | |
From net realized gain on investments | | $— | | | $(0.66 | ) | | $— | | | $— | | | $— | |
Redemption fees added to paid-in capital (d) | | $— | | | $— | | | $0.00 | (w) | | $0.00 | (w) | | $0.00 | (w) |
Net asset value, end of period | | $15.97 | | | $17.70 | | | $20.23 | | | $16.79 | | | $16.73 | |
Total return (%) (r)(s)(t) | | (9.77 | ) | | (9.48 | ) | | 20.49 | | | 0.36 | | | 24.20 | |
Ratios (%) (to average net assets)
and Supplemental data: | | | | | | | | | | | | | | | |
Expenses before expense reductions (f) | | 1.80 | | | 1.80 | | | 1.82 | | | 1.83 | | | 1.83 | |
Expenses after expense reductions (f) | | 1.70 | | | 1.70 | | | 1.72 | | | 1.72 | | | 1.73 | |
Net investment loss | | (1.15 | ) | | (1.04 | ) | | (1.29 | ) | | (1.37 | ) | | (1.27 | ) |
Portfolio turnover | | 150 | | | 95 | | | 94 | | | 99 | | | 112 | |
Net assets at end of period (000 Omitted) | | $1,444 | | | $1,568 | | | $1,715 | | | $1,630 | | | $1,637 | |
See Notes to Financial Statements
26
Financial Highlights – continued
| | | | | | | | | | | | | | | |
| Class 529B | | Years ended 8/31 | |
| | | 2009 | | | 2008 | | | 2007 | | | 2006 | | | 2005 | |
| Net asset value, beginning of period | | $16.65 | | | $19.20 | | | $16.03 | | | $16.07 | | | $13.02 | |
| Income (loss) from investment operations | | | | | | | | | | | | | | | |
Net investment loss (d) | | $(0.22 | ) | | $(0.29 | ) | | $(0.28 | ) | | $(0.33 | ) | | $(0.28 | ) |
Net realized and unrealized gain (loss)
on investments and foreign currency | | (1.51 | )(g) | | (1.60 | ) | | 3.45 | | | 0.29 | | | 3.33 | |
Total from investment operations | | $(1.73 | ) | | $(1.89 | ) | | $3.17 | | | $(0.04 | ) | | $3.05 | |
| Less distributions declared to shareholders | | | | | | | | | | | | | | | |
From net realized gain on investments | | $— | | | $(0.66 | ) | | $— | | | $— | | | $— | |
Redemption fees added to paid-in capital (d) | | $— | | | $— | | | $0.00 | (w) | | $0.00 | (w) | | $0.00 | (w) |
Net asset value, end of period | | $14.92 | | | $16.65 | | | $19.20 | | | $16.03 | | | $16.07 | |
Total return (%) (r)(s)(t) | | (10.39 | ) | | (10.10 | ) | | 19.78 | | | (0.25 | ) | | 23.43 | |
Ratios (%) (to average net assets)
and Supplemental data: | | | | | | | | | | | | | | | |
Expenses before expense reductions (f) | | 2.50 | | | 2.45 | | | 2.47 | | | 2.47 | | | 2.47 | |
Expenses after expense reductions (f) | | 2.40 | | | 2.35 | | | 2.37 | | | 2.37 | | | 2.37 | |
Net investment loss | | (1.85 | ) | | (1.70 | ) | | (1.94 | ) | | (2.02 | ) | | (1.93 | ) |
Portfolio turnover | | 150 | | | 95 | | | 94 | | | 99 | | | 112 | |
Net assets at end of period (000 Omitted) | | $175 | | | $212 | | | $239 | | | $211 | | | $177 | |
See Notes to Financial Statements
27
Financial Highlights – continued
| | | | | | | | | | | | | | | |
| Class 529C | | Years ended 8/31 | |
| | | 2009 | | | 2008 | | | 2007 | | | 2006 | | | 2005 | |
Net asset value, beginning of period | | $16.66 | | | $19.21 | | | $16.04 | | | $16.08 | | | $13.03 | |
| Income (loss) from investment operations | | | | | | | | | | | | | | | |
Net investment loss (d) | | $(0.22 | ) | | $(0.29 | ) | | $(0.28 | ) | | $(0.34 | ) | | $(0.28 | ) |
Net realized and unrealized gain (loss)
on investments and foreign currency | | (1.51 | )(g) | | (1.60 | ) | | 3.45 | | | 0.30 | | | 3.33 | |
Total from investment operations | | $(1.73 | ) | | $(1.89 | ) | | $3.17 | | | $(0.04 | ) | | $3.05 | |
| Less distributions declared to shareholders | | | | | | | | | | | | | | | |
From net realized gain on investments | | $— | | | $(0.66 | ) | | $— | | | $— | | | $— | |
Redemption fees added to paid-in capital (d) | | $— | | | $— | | | $0.00 | (w) | | $0.00 | (w) | | $0.00 | (w) |
Net asset value, end of period | | $14.93 | | | $16.66 | | | $19.21 | | | $16.04 | | | $16.08 | |
Total return (%) (r)(s)(t) | | (10.38 | ) | | (10.10 | ) | | 19.76 | | | (0.25 | ) | | 23.41 | |
Ratios (%) (to average net assets)
and Supplemental data: | | | | | | | | | | | | | | | |
Expenses before expense reductions (f) | | 2.48 | | | 2.45 | | | 2.47 | | | 2.48 | | | 2.47 | |
Expenses after expense reductions (f) | | 2.38 | | | 2.34 | | | 2.37 | | | 2.37 | | | 2.37 | |
Net investment loss | | (1.83 | ) | | (1.70 | ) | | (1.94 | ) | | (2.02 | ) | | (1.93 | ) |
Portfolio turnover | | 150 | | | 95 | | | 94 | | | 99 | | | 112 | |
Net assets at end of period (000 Omitted) | | $393 | | | $299 | | | $323 | | | $332 | | | $333 | |
| (d) | Per share data is based on average shares outstanding. |
| (f) | Ratios do not reflect reductions from fees paid indirectly, if applicable. |
| (g) | The per share amount varies from the net realized and unrealized gain/loss for the period because of the timing of sales of fund shares and the per share amount of realized and unrealized gains and losses at such time. |
| (i) | For the period from the class’ inception, April 1, 2005 (Classes R1, R3, and R4), through the stated period end. |
| (r) | Certain expenses have been reduced without which performance would have been lower. |
| (s) | From time to time the fund may receive proceeds from litigation settlements, without which performance would be lower. |
| (t) | Total returns do not include any applicable sales charges. |
| (w) | Per share amount was less than $0.01. |
See Notes to Financial Statements
28
NOTES TO FINANCIAL STATEMENTS
| (1) | | Business and Organization |
MFS New Discovery Fund (the fund) is a series of MFS Series Trust I (the trust). The trust is organized as a Massachusetts business trust and is registered under the Investment Company Act of 1940, as amended, as an open-end management investment company.
| (2) | | Significant Accounting Policies |
General – The preparation of financial statements in conformity with U.S. generally accepted accounting principles requires management to make estimates and assumptions that affect the reported amounts of assets and liabilities, and disclosure of contingent assets and liabilities at the date of the financial statements and the reported amounts of revenues and expenses during the reporting period. In making these estimates and assumptions, management has considered the effects, if any, of events occurring after the date of the fund’s Statement of Assets and Liabilities through October 16, 2009 which is the date that the financial statements were issued. Actual results could differ from those estimates. The fund will generally focus on securities of small size companies which may be more volatile than those of larger companies. The fund can invest in foreign securities, including securities of emerging market issuers. Investments in foreign securities are vulnerable to the effects of changes in the relative values of the local currency and the U.S. dollar and to the effects of changes in each country’s legal, political, and economic environment. The markets of emerging markets countries are generally more volatile than the markets of developed countries with more mature economies. All of the risks of investing in foreign securities previously described are heightened when investing in emerging markets countries.
Investment Valuations – Equity securities, including restricted equity securities, are generally valued at the last sale or official closing price as provided by a third-party pricing service on the market or exchange on which they are primarily traded. For securities for which there were no sales reported that day, equity securities are generally valued at the last quoted daily bid quotation as provided by a third-party pricing service on the market or exchange on which such securities are primarily traded. For securities held short for which there were no sales reported for that day, the position is generally valued at the last quoted daily ask quotation as provided by a third-party pricing service on the market or exchange on which such securities are primarily traded. Short-term instruments with a maturity at issuance of 60 days or less generally are valued at amortized cost, which approximates market value. Open-end investment companies are generally valued at net asset value per share. Securities and other assets generally valued on the basis of
29
Notes to Financial Statements – continued
information from a third-party pricing service may also be valued at a broker/ dealer bid quotation. Values obtained from third-party pricing services can utilize both transaction data and market information such as yield, quality, coupon rate, maturity, type of issue, trading characteristics, and other market data. The values of foreign securities and other assets and liabilities expressed in foreign currencies are converted to U.S. dollars using the mean of bid and asked prices for rates provided by a third-party pricing service.
The Board of Trustees has delegated primary responsibility for determining or causing to be determined the value of the fund’s investments (including any fair valuation) to the adviser pursuant to valuation policies and procedures approved by the Board. If the adviser determines that reliable market quotations are not readily available, investments are valued at fair value as determined in good faith by the adviser in accordance with such procedures under the oversight of the Board of Trustees. Under the fund’s valuation policies and procedures, market quotations are not considered to be readily available for most types of debt instruments and floating rate loans and many types of derivatives. These investments are generally valued at fair value based on information from third-party pricing services. In addition, investments may be valued at fair value if the adviser determines that an investment’s value has been materially affected by events occurring after the close of the exchange or market on which the investment is principally traded (such as foreign exchange or market) and prior to the determination of the fund’s net asset value, or after the halting of trading of a specific security where trading does not resume prior to the close of the exchange or market on which the security is principally traded. Events that occur on a frequent basis after foreign markets close (such as developments in foreign markets and significant movements in the U.S. markets) and prior to the determination of the fund’s net asset value may be deemed to have a material affect on the value of securities traded in foreign markets. Accordingly, the fund’s foreign equity securities may often be valued at fair value. The adviser generally relies on third-party pricing services or other information (such as the correlation with price movements of similar securities in the same or other markets; the type, cost and investment characteristics of the security; the business and financial condition of the issuer; and trading and other market data) to assist in determining whether to fair value and at what value to fair value an investment. The value of an investment for purposes of calculating the fund’s net asset value can differ depending on the source and method used to determine value. When fair valuation is used, the value of an investment used to determine the fund’s net asset value may differ from quoted or published prices for the same investment. There can be no assurance that the fund could obtain the fair value assigned to an investment if it were to sell the investment at the same time at which the fund determines its net asset value per share.
30
Notes to Financial Statements – continued
The fund adopted FASB Statement No. 157, Fair Value Measurements (the “Statement”). This Statement provides a single definition of fair value, a hierarchy for measuring fair value and expanded disclosures about fair value measurements.
Various inputs are used in determining the value of the fund’s assets or liabilities carried at market value. These inputs are categorized into three broad levels. In certain cases, the inputs used to measure fair value may fall into different levels of the fair value hierarchy. In such cases, an investment’s level within the fair value hierarchy is based on the lowest level of input that is significant to the fair value measurement. The fund’s assessment of the significance of a particular input to the fair value measurement in its entirety requires judgment, and considers factors specific to the investment. Level 1 includes unadjusted quoted prices in active markets for identical assets or liabilities. Level 2 includes other significant observable market-based inputs (including quoted prices for similar securities, interest rates, prepayment speed, and credit risk). Level 3 includes unobservable inputs, which may include the adviser’s own assumptions in determining the fair value of investments. Other financial instruments are derivative instruments not reflected in total investments, such as futures, forwards, swap contracts, and written options. The following is a summary of the levels used as of August 31, 2009 in valuing the fund’s assets or liabilities carried at market value:
| | | | | | | | |
| Investments at Value | | Level 1 | | Level 2 | | Level 3 | | Total |
| Equity Securities: | | | | | | | | |
United States | | $517,696,826 | | $2,433 | | $— | | $517,699,259 |
China | | 21,511,440 | | — | | — | | 21,511,440 |
Brazil | | 18,829,091 | | — | | — | | 18,829,091 |
Canada | | 12,616,861 | | — | | — | | 12,616,861 |
United Kingdom | | — | | 8,637,817 | | — | | 8,637,817 |
Panama | | 4,155,697 | | — | | — | | 4,155,697 |
India | | 4,043,556 | | — | | — | | 4,043,556 |
Mexico | | 3,351,494 | | — | | — | | 3,351,494 |
Netherlands | | 3,041,183 | | — | | — | | 3,041,183 |
Other Countries | | 7,081,247 | | 1,536,092 | | — | | 8,617,339 |
| Mutual Funds | | 11,290,954 | | — | | — | | 11,290,954 |
| Total Investments | | $603,618,349 | | $10,176,342 | | $— | | $613,794,691 |
For further information regarding security characteristics, see the Portfolio of Investments.
Repurchase Agreements – The fund may enter into repurchase agreements with approved counterparties. Each repurchase agreement is recorded at cost. The fund requires that the securities collateral in a repurchase transaction be transferred to a custodian. The fund monitors, on a daily basis, the value of the collateral to ensure that its value, including accrued interest, is greater than
31
Notes to Financial Statements – continued
amounts owed to the fund under each such repurchase agreement. The fund and other funds managed by MFS may utilize a joint trading account for the purpose of entering into one or more repurchase agreements.
Foreign Currency Translation – Purchases and sales of foreign investments, income, and expenses are converted into U.S. dollars based upon currency exchange rates prevailing on the respective dates of such transactions or on the reporting date for foreign denominated receivables and payables. Gains and losses attributable to foreign currency exchange rates on sales of securities are recorded for financial statement purposes as net realized gains and losses on investments. Gains and losses attributable to foreign exchange rate movements on receivables, payables, income and expenses are recorded for financial statement purposes as foreign currency transaction gains and losses. That portion of both realized and unrealized gains and losses on investments that results from fluctuations in foreign currency exchange rates is not separately disclosed.
Derivatives – The fund may use derivatives for different purposes, including to earn income and enhance returns, to increase or decrease exposure to a particular market, to manage or adjust the risk profile of the fund, or as alternatives to direct investments. Derivatives may be used for hedging or non-hedging purposes. While hedging can reduce or eliminate losses, it can also reduce or eliminate gains. When the fund uses derivatives as an investment to increase market exposure, or for hedging purposes, gains and losses from derivative instruments may be substantially greater than the derivative’s original cost.
In this reporting period the fund adopted FASB Statement No. 161, Disclosure about Derivative Instruments and Hedging Activities (“FAS 161”), and FASB Staff Position FAS No. 133-1 and FIN 45-4, Disclosures about Credit Derivatives and Certain Guarantees: An Amendment of FASB Statement No. 133 and FASB Interpretation No. 45; and Clarification of the Effective Date of FAS 161 (“FSP FAS 133-1”).
FAS 161 amends FASB Statement No. 133, Accounting for Derivatives and Hedging Activities (“FAS 133”). FAS 161 provides enhanced disclosures about the fund’s use of and accounting for derivative instruments and the effect of derivative instruments on the fund’s results of operations and financial position. Under FAS 161, tabular disclosure regarding derivative fair value and gain/loss by contract type (e.g., interest rate contracts, foreign exchange contracts, credit contracts, etc.) is required and derivatives accounted for as hedging instruments under FAS 133 must be disclosed separately from derivatives that do not qualify for hedge accounting under FAS 133. Because investment companies account for their derivatives at fair value and record any changes in fair value in current period earnings, the fund’s derivatives are not
32
Notes to Financial Statements – continued
accounted for as hedging instruments under FAS 133. As such, even though the fund may use derivatives in an attempt to achieve an economic hedge, the fund’s derivatives are not considered to be hedging instruments under FAS 133.
FSP FAS 133-1 amends FAS 133 to require sellers of credit derivatives to make disclosures that will enable financial statement users to assess the potential effects of those credit derivatives on an entity’s financial position, financial performance and cash flows. As defined by FSP FAS 133-1, a credit derivative is a derivative instrument (a) in which one or more of the derivative’s underlyings are related to the credit risk of a specified entity (or group of entities) or an index based on the credit risk of a group of entities and (b) that exposes the seller to potential loss from credit-risk-related events specified in the derivative contract. The seller (or writer) is the party that provides the credit protection and assumes the credit risk on a credit derivatives contract, such as a credit default swap. There was no impact from implementing FSP 133-1 as the fund did not hold any of these credit derivatives at period end.
As defined under FAS 133, derivative instruments include written options, purchased options, futures contracts, forward foreign currency exchange contracts, and swap agreements. For the year ended August 31, 2009, the fund did not invest in any derivative instruments and accordingly there is no impact to the financial statements.
Derivative counterparty credit risk is managed through formal evaluation of the creditworthiness of all potential counterparties. On certain over-the-counter derivatives, the fund attempts to reduce its exposure to counterparty credit risk by entering into an International Swaps and Derivatives Association (ISDA) Master Agreement on a bilateral basis with each of the counterparties with whom it undertakes a significant volume of transactions. The ISDA Master Agreement gives each party to the agreement the right to terminate all transactions traded under such agreement if there is a certain deterioration in the credit quality of the other party. The ISDA Master Agreement gives the fund the right, upon an event of default by the applicable counterparty or a termination of the agreement, to close out all transactions traded under such agreement and to net amounts owed under each transaction to one net amount payable by one party to the other. This right to close out and net payments across all transactions traded under the ISDA Master Agreement could result in a reduction of the fund’s credit risk to such counterparty equal to any amounts payable by the fund under the applicable transactions, if any. However, absent an event of default by the counterparty or a termination of the agreement, the ISDA Master Agreement does not result in an offset of reported balance sheet assets and liabilities across transactions between the fund and the applicable counterparty.
33
Notes to Financial Statements – continued
Collateral requirements differ by type of derivative. Collateral or margin requirements are set by the broker or exchange clearing house for exchange traded derivatives (i.e., futures and exchange-traded options) while collateral terms are contract specific for over-the-counter traded derivatives (i.e., forwards, swaps and over-the-counter options). For derivatives traded under an ISDA Master Agreement, the collateral requirements are netted across all transactions traded under such agreement and one amount is posted from one party to the other to collateralize such obligations. Cash collateral that has been pledged to cover obligations of the fund under derivative contracts will be reported separately on the Statement of Assets and Liabilities as restricted cash. Securities collateral pledged for the same purpose is noted in the Portfolio of Investments.
Security Loans – State Street Bank and Trust Company (“State Street”), as lending agent, may loan the securities of the fund to certain qualified institutions (the “Borrowers”) approved by the fund. The loans are collateralized by cash and/or U.S. Treasury and federal agency obligations in an amount typically at least equal to the market value of the securities loaned. The market value of the loaned securities is determined at the close of business of the fund and any additional required collateral is delivered to the fund on the next business day. State Street provides the fund with indemnification against Borrower default. The fund bears the risk of loss with respect to the investment of cash collateral. On loans collateralized by cash, the cash collateral is invested in a money market fund or short-term securities. A portion of the income generated upon investment of the collateral is remitted to the Borrowers, and the remainder is allocated between the fund and the lending agent. On loans collateralized by U.S. Treasury and/or federal agency obligations, a fee is received from the Borrower, and is allocated between the fund and the lending agent. Income from securities lending is separately reported on the Statement of Operations. The dividend and interest income earned on the securities loaned is accounted for in the same manner as other dividend and interest income.
Indemnifications – Under the fund’s organizational documents, its officers and Trustees may be indemnified against certain liabilities and expenses arising out of the performance of their duties to the fund. Additionally, in the normal course of business, the fund enters into agreements with service providers that may contain indemnification clauses. The fund’s maximum exposure under these agreements is unknown as this would involve future claims that may be made against the fund that have not yet occurred.
Investment Transactions and Income – Investment transactions are recorded on the trade date. Interest income is recorded on the accrual basis. All premium and discount is amortized or accreted for financial statement
34
Notes to Financial Statements – continued
purposes in accordance with U.S. generally accepted accounting principles. Dividends received in cash are recorded on the ex-dividend date. Certain dividends from foreign securities will be recorded when the fund is informed of the dividend if such information is obtained subsequent to the ex-dividend date. Dividend and interest payments received in additional securities are recorded on the ex-dividend or ex-interest date in an amount equal to the value of the security on such date.
The fund may receive proceeds from litigation settlements. Any proceeds received from litigation involving portfolio holdings are reflected in the Statement of Operations in realized gain/loss if the security has been disposed of by the fund or in unrealized gain/loss if the security is still held by the fund. Any other proceeds from litigation not related to portfolio holdings are reflected as other income in the Statement of Operations.
Fees Paid Indirectly – The fund’s custody fee may be reduced according to an arrangement that measures the value of cash deposited with the custodian by the fund. This amount, for the year ended August 31, 2009, is shown as a reduction of total expenses on the Statement of Operations.
Tax Matters and Distributions – The fund intends to qualify as a regulated investment company, as defined under Subchapter M of the Internal Revenue Code, and to distribute all of its taxable income, including realized capital gains. As a result, no provision for federal income tax is required. The fund’s federal tax returns for the prior three fiscal years remain subject to examination by the Internal Revenue Service. Foreign taxes, if any, have been accrued by the fund in the accompanying financial statements.
Distributions to shareholders are recorded on the ex-dividend date. Income and capital gain distributions are determined in accordance with income tax regulations, which may differ from U.S. generally accepted accounting principles. Certain capital accounts in the financial statements are periodically adjusted for permanent differences in order to reflect their tax character. These adjustments have no impact on net assets or net asset value per share. Temporary differences which arise from recognizing certain items of income, expense, gain or loss in different periods for financial statement and tax purposes will reverse at some time in the future. Distributions in excess of net investment income or net realized gains are temporary overdistributions for financial statement purposes resulting from differences in the recognition or classification of income or distributions for financial statement and tax purposes.
Book/tax differences primarily relate to net operating losses and wash sale loss deferrals.
35
Notes to Financial Statements – continued
The tax character of distributions declared to shareholders for the last two fiscal years is as follows:
| | | | |
| | | 8/31/09 | | 8/31/08 (i) |
| Long-term capital gain | | $— | | $21,776,506 |
| (i) | Included in the fund’s distribution is $503,913 in excess of long-term capital gains. |
The fund declared no distributions for the year ended August 31, 2009.
The federal tax cost and the tax basis components of distributable earnings were as follows:
| | | |
| As of 8/31/09 | | | |
| Cost of investments | | $527,235,555 | |
| Gross appreciation | | 100,166,333 | |
| Gross depreciation | | (13,607,197 | ) |
| Net unrealized appreciation (depreciation) | | $86,559,136 | |
| Capital loss carryforwards | | (98,381,558 | ) |
| Post-October capital loss deferral | | (70,306,011 | ) |
| Other temporary differences | | (167,593 | ) |
As of August 31, 2009, the fund had capital loss carryforwards available to offset future realized gains. Such losses expire as follows:
Multiple Classes of Shares of Beneficial Interest – The fund offers multiple classes of shares, which differ in their respective distribution, service, and program manager fees. The fund’s income, realized and unrealized gain (loss), and common expenses are allocated to shareholders based on the daily net assets of each class. Dividends are declared separately for each class. Differences in per share dividend rates are generally due to differences in separate class expenses. Class B and Class 529B shares will convert to Class A and Class 529A shares, respectively, approximately eight years after purchase.
36
Notes to Financial Statements – continued
The fund’s distributions declared to shareholders as reported on the Statements of Changes in Net Assets are presented by class as follows:
| | | | |
| | | From net realized gain on
investments |
| | | Year ended
8/31/09 | | Year ended
8/31/08 |
| Class A | | $— | | $11,841,588 |
| Class B | | — | | 2,389,728 |
| Class C | | — | | 1,311,756 |
| Class I | | — | | 3,175,368 |
| Class R (b) | | — | | 112,238 |
| Class R1 | | — | | 150,717 |
| Former Class R2 (b) | | — | | 67,592 |
| Class R2 | | — | | 385,068 |
| Class R3 | | — | | 171,384 |
| Class R4 | | — | | 2,093,044 |
| Class 529A | | — | | 58,223 |
| Class 529B | | — | | 8,357 |
| Class 529C | | — | | 11,443 |
| Total | | $— | | $21,776,506 |
| (b) | At the close of business on April 18, 2008, Class R and Class R2 shares converted into Class R3 shares. Following this conversion, Class R3, Class R4, and Class R5 shares were renamed Class R2, Class R3, and Class R4 shares, respectively. |
| (3) | | Transactions with Affiliates |
Investment Adviser – The fund has an investment advisory agreement with MFS to provide overall investment management and related administrative services and facilities to the fund.
The management fee is computed daily and paid monthly at an annual rate of 0.90% of the fund’s average daily net assets. As part of a settlement agreement with the New York Attorney General concerning market timing and related matters, MFS has agreed to reduce the management fee to 0.80% of average daily net assets for the first $1.5 billion and 0.75% of average daily net assets in excess of $1.5 billion through August 31, 2009. For the year ended August 31, 2009, this waiver amounted to $401,718 and is reflected as a reduction of total expenses in the Statement of Operations. The management fee incurred for the year ended August 31, 2009 was equivalent to an annual effective rate of 0.80% of the fund’s average daily net assets. Effective September 1, 2009, MFS has agreed in writing to reduce the fund’s management fee to 0.80% of average daily net assets for the first $1.5 billion and 0.75% of average daily net assets in excess of $1.5 billion. This agreement will continue until modified by the fund’s Board of Trustees, but such agreement will continue at least until December 31, 2010.
37
Notes to Financial Statements – continued
Distributor – MFS Fund Distributors, Inc. (MFD), a wholly-owned subsidiary of MFS, as distributor, received $19,422 and $595 for the year ended August 31, 2009, as its portion of the initial sales charge on sales of Class A and Class 529A shares of the fund, respectively.
The Board of Trustees has adopted a distribution plan for certain class shares pursuant to Rule 12b-1 of the Investment Company Act of 1940.
The fund’s distribution plan provides that the fund will pay MFD for services provided by MFD and financial intermediaries in connection with the distribution and servicing of certain share classes. One component of the plan is a distribution fee paid to MFD and another component of the plan is a service fee paid to MFD. MFD may subsequently pay all, or a portion, of the distribution and/or service fees to financial intermediaries.
Distribution Plan Fee Table:
| | | | | | | | | | |
| | | Distribution
Fee Rate (d) | | Service
Fee Rate (d) | | Total
Distribution
Plan (d) | | Annual
Effective
Rate (e) | | Distribution
and Service
Fee |
| Class A | | — | | 0.25% | | 0.25% | | 0.30% | | $543,379 |
| Class B | | 0.75% | | 0.25% | | 1.00% | | 1.00% | | 236,211 |
| Class C | | 0.75% | | 0.25% | | 1.00% | | 1.00% | | 195,504 |
| Class R1 | | 0.75% | | 0.25% | | 1.00% | | 1.00% | | 31,465 |
| Class R2 | | 0.25% | | 0.25% | | 0.50% | | 0.50% | | 45,154 |
| Class R3 | | — | | 0.25% | | 0.25% | | 0.25% | | 6,734 |
| Class 529A | | — | | 0.25% | | 0.25% | | 0.30% | | 3,319 |
| Class 529B | | 0.75% | | 0.25% | | 1.00% | | 1.00% | | 1,381 |
| Class 529C | | 0.75% | | 0.25% | | 1.00% | | 1.00% | | 2,537 |
| Total Distribution and Service Fees | | | | | | | | $1,065,684 |
| (d) | As of August 31, 2009, in accordance with the distribution plan for certain classes, the fund pays distribution and/or service fees equal to these annual percentage rates of each class’ average daily net assets. The distribution and service fee rates disclosed by class represent the current rates in effect at the end of the reporting period. Any rate changes, if applicable, are detailed below. |
| (e) | The annual effective rates represent actual fees incurred under the distribution plan for the year ended August 31, 2009 based on each class’ average daily net assets. Prior to March 1, 2009, a 0.10% Class A distribution fee was paid by the fund. Prior to March 1, 2009, the distribution fee rate for Class 529A was 0.25%, of which 0.10% was paid by the fund and the remaining 0.15% was not in effect. Effective March 1, 2009, the 0.10% Class A and 0.25% Class 529A annual distribution fees were eliminated. |
Certain Class A shares purchased prior to September 1, 2008 are subject to a contingent deferred sales charge (CDSC) in the event of a shareholder redemption within 12 months of purchase. Certain Class A shares purchased on or subsequent to September 1, 2008 are subject to a CDSC in the event of a shareholder redemption within 24 months of purchase. Class C and Class 529C shares are subject to a CDSC in the event of a shareholder redemption within 12 months of purchase. Class B and Class 529B shares are subject to a CDSC in the event of a shareholder redemption within six years of purchase. All
38
Notes to Financial Statements – continued
contingent deferred sales charges are paid to MFD and during the year ended August 31, 2009, were as follows:
| | |
| | | Amount |
| Class A | | $13 |
| Class B | | 31,980 |
| Class C | | 741 |
| Class 529B | | 18 |
| Class 529C | | — |
The fund has entered into and may from time to time enter into contracts with program managers and other parties which administer the tuition programs through which an investment in the fund’s 529 share classes is made. The fund has entered into an agreement with MFD pursuant to which MFD receives an annual fee of up to 0.10% of the average daily net assets attributable to each 529 share class. The services provided by MFD, or a third party with which MFD contracts, include recordkeeping and tax reporting and account services, as well as services designed to maintain the program’s compliance with the Internal Revenue Code and other regulatory requirements. Program manager fees for the year ended August 31, 2009, were as follows:
| | |
| | | Amount |
| Class 529A | | $1,119 |
| Class 529B | | 138 |
| Class 529C | | 255 |
| Total Program Manager Fees | | $1,512 |
Shareholder Servicing Agent – MFS Service Center, Inc. (MFSC), a wholly-owned subsidiary of MFS, receives a fee from the fund for its services as shareholder servicing agent calculated as a percentage of the average daily net assets of the fund as determined periodically under the supervision of the fund’s Board of Trustees. For the year ended August 31, 2009, the fee was $494,324, which equated to 0.1228% annually of the fund’s average daily net assets. MFSC also receives payment from the fund for out-of-pocket expenses, sub-accounting and other shareholder servicing costs which may be paid to affiliated and unaffiliated service providers. For the year ended August 31, 2009, these out-of-pocket expenses, sub-accounting and other shareholder servicing costs amounted to $600,045.
Under a Special Servicing Agreement among MFS, each MFS fund which invests in other MFS funds (“MFS fund-of-funds”) and certain underlying funds in which a MFS fund-of-funds invests (“underlying funds”), each underlying fund may pay a portion of each MFS fund-of-fund’s transfer agent-related expenses, including sub-accounting fees payable to financial intermediaries, to the extent such payments do not exceed the benefits realized or expected to be realized by the underlying fund from the investment in the underlying fund by the MFS fund-of-fund. For the year ended August 31, 2009,
39
Notes to Financial Statements – continued
these costs for the fund amounted to $367,421 and are reflected in the shareholder servicing costs on the Statement of Operations.
Administrator – MFS provides certain financial, legal, shareholder communications, compliance, and other administrative services to the fund. Under an administrative services agreement, the fund partially reimburses MFS the costs incurred to provide these services. The fund is charged an annual fixed amount of $17,500 plus a fee based on average daily net assets. The administrative services fee incurred for the year ended August 31, 2009 was equivalent to an annual effective rate of 0.0211% of the fund’s average daily net assets.
Trustees’ and Officers’ Compensation – The fund pays compensation to independent Trustees in the form of a retainer, attendance fees, and additional compensation to Board and Committee chairpersons. The fund does not pay compensation directly to Trustees or officers of the fund who are also officers of the investment adviser, all of whom receive remuneration for their services to the fund from MFS. Certain officers and Trustees of the fund are officers or directors of MFS, MFD, and MFSC.
Prior to December 31, 2001, the fund had an unfunded defined benefit plan (“DB plan”) for independent Trustees. As of December 31, 2001, the Board took action to terminate the DB plan with respect to then-current and any future independent Trustees, such that the DB Plan covers only certain of those former independent Trustees who retired on or before December 31, 2001. The DB Plan resulted in a pension expense of $1,112 and is included in independent Trustees’ compensation for the year ended August 31, 2009. The liability for deferred retirement benefits payable to certain independent Trustees under the DB plan amounted to $8,628 at August 31, 2009, and is included in payable for independent Trustees’ compensation on the Statement of Assets and Liabilities.
Other – This fund and certain other funds managed by MFS (the funds) have entered into services agreements (the Agreements) which provide for payment of fees by the funds to Tarantino LLC and Griffin Compliance LLC in return for the provision of services of an Independent Chief Compliance Officer (ICCO) and Assistant ICCO, respectively, for the funds. The ICCO and Assistant ICCO are officers of the funds and the sole members of Tarantino LLC and Griffin Compliance LLC, respectively. The funds can terminate the Agreements with Tarantino LLC and Griffin Compliance LLC at any time under the terms of the Agreements. For the year ended August 31, 2009, the aggregate fees paid by the fund to Tarantino LLC and Griffin Compliance LLC were $4,681 and are included in miscellaneous expense on the Statement of Operations. MFS has agreed to reimburse the fund for a portion of the payments made by the fund in the amount of $2,650, which is shown as a reduction of total expenses in the
40
Notes to Financial Statements – continued
Statement of Operations. Additionally, MFS has agreed to bear all expenses associated with office space, other administrative support, and supplies provided to the ICCO and Assistant ICCO.
The fund may invest in a money market fund managed by MFS which seeks a high level of current income consistent with preservation of capital and liquidity. Income earned on this investment is included in dividends from underlying funds on the Statement of Operations. This money market fund does not pay a management fee to MFS.
Purchases and sales of investments, other than U.S. Government securities, purchased option transactions, and short-term obligations, aggregated $709,903,994 and $624,910,158, respectively.
| (5) | | Shares of Beneficial Interest |
The fund’s Declaration of Trust permits the Trustees to issue an unlimited number of full and fractional shares of beneficial interest. Transactions in fund shares were as follows:
| | | | | | | | |
| | | Year ended
8/31/09 | | Year ended
8/31/08 |
| | | Shares | | Amount | | Shares | | Amount |
| Shares sold | | | | | | | | |
Class A | | 5,092,115 | | $67,789,677 | | 5,421,370 | | $104,733,134 |
Class B | | 283,553 | | 3,481,059 | | 224,521 | | 4,055,914 |
Class C | | 292,917 | | 3,733,586 | | 195,185 | | 3,506,502 |
Class I | | 11,902,139 | | 131,963,269 | | 1,258,611 | | 25,411,893 |
Class R (b) | | — | | — | | 109,374 | | 2,121,606 |
Class R1 | | 84,753 | | 1,035,999 | | 197,716 | | 3,653,591 |
Former Class R2 (b) | | — | | — | | 85,606 | | 1,596,462 |
Class R2 | | 202,168 | | 2,534,462 | | 694,797 | | 13,046,764 |
Class R3 | | 97,138 | | 1,134,024 | | 169,338 | | 3,310,468 |
Class R4 | | 1,207,603 | | 16,065,980 | | 770,386 | | 14,361,829 |
Class 529A | | 16,545 | | 194,126 | | 12,714 | | 240,416 |
Class 529B | | 870 | | 10,451 | | 1,658 | | 28,484 |
Class 529C | | 11,398 | | 116,135 | | 3,068 | | 53,829 |
| | 19,191,199 | | $228,058,768 | | 9,144,344 | | $176,120,892 |
41
Notes to Financial Statements – continued
| | | | | | | | | | | | |
| | | Year ended
8/31/09 | | | Year ended
8/31/08 | |
| | | Shares | | | Amount | | | Shares | | | Amount | |
| Shares issued to shareholders in reinvestment of distributions | | | | | | | | | | | | |
Class A | | — | | | $— | | | 540,398 | | | $10,413,467 | |
Class B | | — | | | — | | | 122,935 | | | 2,239,885 | |
Class C | | — | | | — | | | 64,835 | | | 1,183,234 | |
Class I | | — | | | — | | | 158,548 | | | 3,167,792 | |
Class R (b) | | — | | | — | | | 4,563 | | | 87,296 | |
Class R1 | | — | | | — | | | 8,299 | | | 150,717 | |
Former Class R2 (b) | | — | | | — | | | 3,690 | | | 67,592 | |
Class R2 | | — | | | — | | | 20,277 | | | 385,068 | |
Class R3 | | — | | | — | | | 8,908 | | | 171,384 | |
Class R4 | | — | | | — | | | 107,889 | | | 2,093,044 | |
Class 529A | | — | | | — | | | 3,061 | | | 58,223 | |
Class 529B | | — | | | — | | | 465 | | | 8,357 | |
Class 529C | | — | | | — | | | 636 | | | 11,443 | |
| | — | | | $— | | | 1,044,504 | | | $20,037,502 | |
| | | | |
| Shares reacquired | | | | | | | | | | | | |
Class A | | (5,469,551 | ) | | $(68,073,959 | ) | | (9,590,283 | ) | | $(184,229,220 | ) |
Class B | | (755,302 | ) | | (8,686,607 | ) | | (2,785,836 | ) | | (50,113,094 | ) |
Class C | | (369,909 | ) | | (4,434,017 | ) | | (680,772 | ) | | (12,218,454 | ) |
Class I | | (2,629,148 | ) | | (34,965,721 | ) | | (1,324,819 | ) | | (26,321,217 | ) |
Class R (b) | | — | | | — | | | (497,221 | ) | | (9,752,640 | ) |
Class R1 | | (76,622 | ) | | (872,359 | ) | | (69,581 | ) | | (1,185,212 | ) |
Former Class R2 (b) | | — | | | — | | | (170,726 | ) | | (2,906,223 | ) |
Class R2 | | (265,802 | ) | | (3,150,161 | ) | | (372,646 | ) | | (6,688,502 | ) |
Class R3 | | (116,127 | ) | | (1,374,215 | ) | | (171,459 | ) | | (3,181,641 | ) |
Class R4 | | (1,670,558 | ) | | (20,216,706 | ) | | (1,061,027 | ) | | (19,699,542 | ) |
Class 529A | | (14,695 | ) | | (168,245 | ) | | (11,990 | ) | | (215,471 | ) |
Class 529B | | (1,845 | ) | | (19,040 | ) | | (1,852 | ) | | (30,606 | ) |
Class 529C | | (3,029 | ) | | (36,778 | ) | | (2,585 | ) | | (43,067 | ) |
| | (11,372,588 | ) | | $(141,997,808 | ) | | (16,740,797 | ) | | $(316,584,889 | ) |
42
Notes to Financial Statements – continued
| | | | | | | | | | | | |
| | | Year ended
8/31/09 | | | Year ended
8/31/08 | |
| | | Shares | | | Amount | | | Shares | | | Amount | |
| Net change | | | | | | | | | | | | |
Class A | | (377,436 | ) | | $(284,282 | ) | | (3,628,515 | ) | | $(69,082,619 | ) |
Class B | | (471,749 | ) | | (5,205,548 | ) | | (2,438,380 | ) | | (43,817,295 | ) |
Class C | | (76,992 | ) | | (700,431 | ) | | (420,752 | ) | | (7,528,718 | ) |
Class I | | 9,272,991 | | | 96,997,548 | | | 92,340 | | | 2,258,468 | |
Class R (b) | | — | | | — | | | (383,284 | ) | | (7,543,738 | ) |
Class R1 | | 8,131 | | | 163,640 | | | 136,434 | | | 2,619,096 | |
Former Class R2 (b) | | — | | | — | | | (81,430 | ) | | (1,242,169 | ) |
Class R2 | | (63,634 | ) | | (615,699 | ) | | 342,428 | | | 6,743,330 | |
Class R3 | | (18,989 | ) | | (240,191 | ) | | 6,787 | | | 300,211 | |
Class R4 | | (462,955 | ) | | (4,150,726 | ) | | (182,752 | ) | | (3,244,669 | ) |
Class 529A | | 1,850 | | | 25,881 | | | 3,785 | | | 83,168 | |
Class 529B | | (975 | ) | | (8,589 | ) | | 271 | | | 6,235 | |
Class 529C | | 8,369 | | | 79,357 | | | 1,119 | | | 22,205 | |
| | 7,818,611 | | | $86,060,960 | | | (6,551,949 | ) | | $(120,426,495 | ) |
| (b) | At the close of business on April 18, 2008, Class R and Class R2 shares converted into Class R3 shares. Following this conversion, Class R3, Class R4, and Class R5 shares were renamed Class R2, Class R3, and Class R4 shares, respectively. |
The fund is one of several mutual funds in which the MFS funds-of-funds may invest. The MFS funds-of-funds do not invest in the underlying MFS funds for the purpose of exercising management or control. At the end of the period, the MFS Growth Allocation Fund, MFS Moderate Allocation Fund, MFS Aggressive Growth Allocation Fund, and MFS Conservative Allocation Fund were the owners of record of approximately 14%, 9%, 7%, and 3%, respectively, of the value of outstanding voting shares of the fund. In addition, the MFS Lifetime 2010 Fund, MFS Lifetime 2020 Fund, MFS Lifetime 2030 Fund, MFS Lifetime 2040 Fund, and the MFS Lifetime Retirement Income Fund were each the owners of record of less than 1% of the value of outstanding voting shares of the fund.
The fund and certain other funds managed by MFS participate in a $1.1 billion unsecured committed line of credit, subject to a $1 billion sublimit, provided by a syndication of banks under a credit agreement. Borrowings may be made for temporary financing needs. Interest is charged to each fund, based on its borrowings, generally at a rate equal to the higher of the Federal Reserve funds rate or one month LIBOR plus an agreed upon spread. A commitment fee, based on the average daily, unused portion of the committed line of credit, is allocated among the participating funds at the end of each calendar quarter. In addition, the fund and other funds managed by MFS have established unsecured uncommitted borrowing arrangements with certain banks for
43
Notes to Financial Statements – continued
temporary financing needs. Interest is charged to each fund, based on its borrowings, at a rate equal to the Federal Reserve funds rate plus an agreed upon spread. For the year ended August 31, 2009, the fund’s commitment fee and interest expense were $4,983 and $0, respectively, and are included in miscellaneous expense on the Statement of Operations.
| (7) | | Transactions in Underlying Funds-Affiliated Issuers |
An affiliated issuer may be considered one in which the fund owns 5% or more of the outstanding voting securities, or a company which is under common control. For the purposes of this report, the fund assumes the following to be affiliated issuers:
| | | | | | | | | |
| Underlying Funds | | Beginning
Shares/Par
Amount | | Acquisitions
Shares/Par
Amount | | Dispositions
Shares/Par
Amount | | | Ending
Shares/Par
Amount |
| MFS Institutional Money Market Portfolio | | — | | 101,712,600 | | (97,250,547 | ) | | 4,462,053 |
| | | | |
| Underlying Funds | | Realized
Gain (Loss) | | Capital Gain
Distributions | | Dividend
Income | | | Ending
Value |
| MFS Institutional Money Market Portfolio | | $— | | $— | | $4,274 | | | $4,462,053 |
44
REPORT OF INDEPENDENT REGISTERED
PUBLIC ACCOUNTING FIRM
To the Board of Trustees of MFS Series Trust I and Shareholders of
MFS New Discovery Fund:
We have audited the accompanying statement of assets and liabilities of MFS New Discovery Fund (the Fund) (one of the portfolios comprising MFS Series Trust I), including the portfolio of investments, as of August 31, 2009, and the related statement of operations for the year then ended, the statements of changes in net assets for each of the two years in the period then ended, and the financial highlights for each of the periods indicated therein. These financial statements and financial highlights are the responsibility of the Fund’s management. Our responsibility is to express an opinion on these financial statements and financial highlights based on our audits.
We conducted our audits in accordance with the standards of the Public Company Accounting Oversight Board (United States). Those standards require that we plan and perform the audit to obtain reasonable assurance about whether the financial statements and financial highlights are free of material misstatement. We were not engaged to perform an audit of the Fund’s internal control over financial reporting. Our audits included consideration of internal control over financial reporting as a basis for designing audit procedures that are appropriate in the circumstances, but not for the purpose of expressing an opinion on the effectiveness of the Fund’s internal control over financial reporting. Accordingly, we express no such opinion. An audit also includes examining, on a test basis, evidence supporting the amounts and disclosures in the financial statements and financial highlights, assessing the accounting principles used and significant estimates made by management, and evaluating the overall financial statement presentation. Our procedures included confirmation of securities owned as of August 31, 2009, by correspondence with the custodian and brokers or by other appropriate auditing procedures where replies from brokers were not received. We believe that our audits provide a reasonable basis for our opinion.
In our opinion, the financial statements and financial highlights referred to above present fairly, in all material respects, the financial position of the MFS New Discovery Fund at August 31, 2009, the results of its operations for the year then ended, the changes in its net assets for each of the two years in the period then ended, and its financial highlights for each of the periods indicated therein, in conformity with U.S. generally accepted accounting principles.

Boston, Massachusetts
October 16, 2009
45
TRUSTEES AND OFFICERS —
IDENTIFICATION AND BACKGROUND
The Trustees and officers of the Trust, as of October 1, 2009, are listed below, together with their principal occupations during the past five years. (Their titles may have varied during that period.) The address of each Trustee and officer is 500 Boylston Street, Boston, Massachusetts 02116.
| | | | | | |
Name, Date of Birth | | Position(s) Held
with Fund | | Trustee/Officer
Since (h) | | Principal Occupations During
the Past Five Years & Other
Directorships (j) |
| INTERESTED TRUSTEES | | | | |
Robert J. Manning (k)
(born 10/20/63) | | Trustee | | February 2004 | | Massachusetts Financial Services Company, Chief Executive Officer, President, Chief Investment Officer and Director |
Robert C. Pozen (k)
(born 8/08/46) | | Trustee | | February 2004 | | Massachusetts Financial Services Company, Chairman (since February 2004); Medtronic, Inc, (medical devices), Director (since 2004); Harvard Business School (education), Senior Lecturer (since 2008); Bell Canada Enterprises (telecommunications), Director (until February 2009); The Bank of New York, Director (finance), (March 2004 to May 2005); Telesat (satellite communications), Director (until November 2007) |
| INDEPENDENT TRUSTEES | | | | |
David H. Gunning
(born 5/30/42) | | Trustee and Chair of Trustees | | January 2004 | | Retired; Cleveland-Cliffs Inc. (mining products and service provider), Vice Chairman/Director (until May 2007); Lincoln Electric Holdings, Inc. (welding equipment manufacturer), Director; Development Alternatives, Inc. (consulting), Director/Non Executive Chairman; Southwest Gas Corp. (natural gas distribution), Director (until May 2004); Portman Limited (mining), Director (until 2008) |
46
Trustees and Officers – continued
| | | | | | |
Name, Date of Birth | | Position(s) Held
with Fund | | Trustee/Officer
Since (h) | | Principal Occupations During
the Past Five Years & Other
Directorships (j) |
Robert E. Butler (n)
(born 11/29/41) | | Trustee | | January 2006 | | Consultant – investment company industry regulatory and compliance matters (since July 2002); PricewaterhouseCoopers LLP (professional services firm), Partner (until 2002) |
Lawrence H. Cohn, M.D.
(born 3/11/37) | | Trustee | | June 1989 | | Brigham and Women’s Hospital, Senior Cardiac Surgeon (since 2005); Harvard Medical School, Professor of Cardiac Surgery; Partners HealthCare, Physician Director of Medical Device Technology (since 2006); Brigham and Women’s Hospital, Chief of Cardiac Surgery (until 2005) |
Maureen R. Goldfarb
(born 4/6/55) | | Trustee | | January 2009 | | Private investor; John Hancock Financial Services, Inc., Executive Vice President (until 2004); John Hancock Mutual Funds, Trustee and Chief Executive Officer (until 2004) |
William R. Gutow
(born 9/27/41) | | Trustee | | December 1993 | | Private investor and real estate consultant; Capital Entertainment Management Company (video franchise), Vice Chairman; Atlantic Coast Tan (tanning salons), Vice Chairman (until 2007); Texas Donuts (donut franchise), Vice Chairman (until 2009) |
Michael Hegarty
(born 12/21/44) | | Trustee | | December 2004 | | Private investor; Retired; AXA Financial (financial services and insurance), Vice Chairman and Chief Operating Officer (until 2001); The Equitable Life Assurance Society (insurance), President and Chief Operating Officer (until 2001) |
J. Atwood Ives
(born 5/01/36) | | Trustee | | February 1992 | | Private investor; KeySpan Corporation (energy related services), Director (until 2004) |
47
Trustees and Officers – continued
| | | | | | |
Name, Date of Birth | | Position(s) Held
with Fund | | Trustee/Officer
Since (h) | | Principal Occupations During
the Past Five Years & Other
Directorships (j) |
John P. Kavanaugh
(born 11/4/54) | | Trustee | | January 2009 | | Private investor; The Hanover Insurance Group, Inc., Vice President and Chief Investment Officer (until 2006); Allmerica Investment Trust, Allmerica Securities Trust and Opus Investment Trust (investment companies), Chairman, President and Trustee (until 2006) |
J. Dale Sherratt
(born 9/23/38) | | Trustee | | June 1989 | | Insight Resources, Inc. (acquisition planning specialists), President; Wellfleet Investments (investor in health care companies), Managing General Partner |
Laurie J. Thomsen
(born 8/05/57) | | Trustee | | March 2005 | | New Profit, Inc. (venture philanthropy), Executive Partner (since 2006); Private investor; Prism Venture Partners (venture capital), Co-founder and General Partner (until June 2004); The Travelers Companies (commercial property liability insurance), Director |
Robert W. Uek
(born 5/18/41) | | Trustee | | January 2006 | | Consultant to investment company industry; PricewaterhouseCoopers LLP (professional services firm), Partner (until 1999); TT International Funds (mutual fund complex), Trustee (until 2005); Hillview Investment Trust II Funds (mutual fund complex), Trustee (until 2005) |
| OFFICERS | | | | | | |
Maria F. Dwyer (k)
(born 12/01/58) | | President | | November 2005 | | Massachusetts Financial Services Company, Executive Vice President and Chief Regulatory Officer (since March 2004) Chief Compliance Officer (since December 2006); Fidelity Management & Research Company, Vice President (prior to March 2004); Fidelity Group of Funds, President and Treasurer (until March 2004) |
48
Trustees and Officers – continued
| | | | | | |
Name, Date of Birth | | Position(s) Held
with Fund | | Trustee/Officer
Since (h) | | Principal Occupations During
the Past Five Years & Other
Directorships (j) |
Christopher R. Bohane (k)
(born 1/18/74) | | Assistant Secretary and Assistant Clerk | | July 2005 | | Massachusetts Financial Services Company, Vice President and Senior Counsel |
John M. Corcoran (k)
(born 04/13/65) | | Treasurer | | October 2008 | | Massachusetts Financial Services Company, Senior Vice President (since October 2008); State Street Bank and Trust (financial services provider), Senior Vice President, (until September 2008) |
Ethan D. Corey (k)
(born 11/21/63) | | Assistant Secretary and Assistant Clerk | | July 2005 | | Massachusetts Financial Services Company, Senior Vice President and Associate General Counsel (since 2004); Dechert LLP (law firm), Counsel (prior to December 2004) |
David L. DiLorenzo (k)
(born 8/10/68) | | Assistant Treasurer | | July 2005 | | Massachusetts Financial Services Company, Vice President (since June 2005); JP Morgan Investor Services, Vice President (until June 2005) |
Timothy M. Fagan (k)
(born 7/10/68) | | Assistant Secretary and Assistant Clerk | | September 2005 | | Massachusetts Financial Services Company, Vice President and Senior Counsel (since September 2005); John Hancock Advisers, LLC, Vice President, Senior Attorney and Chief Compliance Officer (until August 2005) |
Mark D. Fischer (k)
(born 10/27/70) | | Assistant Treasurer | | July 2005 | | Massachusetts Financial Services Company, Vice President (since May 2005); JP Morgan Investment Management Company, Vice President (until May 2005) |
Robyn L. Griffin
(born 7/04/75) | | Assistant Independent Chief Compliance Officer | | August 2008 | | Griffin Compliance LLC (provider of compliance services), Principal (since August 2008); State Street Corporation (financial services provider), Mutual Fund Administration Assistant Vice President (October 2006 – July 2008); Liberty Mutual Group (insurance), Personal Market Assistant Controller (April 2006 – October 2006); Deloitte & Touche LLP (professional services firm), Senior Manager (prior to April 2006) |
49
Trustees and Officers – continued
| | | | | | |
Name, Date of Birth | | Position(s) Held
with Fund | | Trustee/Officer
Since (h) | | Principal Occupations During
the Past Five Years & Other
Directorships (j) |
Brian E. Langenfeld (k)
(born 3/07/73) | | Assistant Secretary and Assistant Clerk | | June 2006 | | Massachusetts Financial Services Company, Vice President and Senior Counsel (since May 2006); John Hancock Advisers, LLC, Assistant Vice President and Counsel (until April 2006) |
Ellen Moynihan (k)
(born 11/13/57) | | Assistant Treasurer | | April 1997 | | Massachusetts Financial Services Company, Senior Vice President |
Susan S. Newton (k)
(born 3/07/50) | | Assistant Secretary and Assistant Clerk | | May 2005 | | Massachusetts Financial Services Company, Senior Vice President and Associate General Counsel (since April 2005); John Hancock Advisers, LLC, Senior Vice President, Secretary and Chief Legal Officer (until April 2005) |
Susan A. Pereira (k)
(born 11/05/70) | | Assistant Secretary and Assistant Clerk | | July 2005 | | Massachusetts Financial Services Company, Vice President and Senior Counsel (since June 2004); Bingham McCutchen LLP (law firm), Associate (until June 2004) |
Mark N. Polebaum (k)
(born 5/01/52) | | Secretary and Clerk | | January 2006 | | Massachusetts Financial Services Company, Executive Vice President, General Counsel and Secretary (since January 2006); Wilmer Cutler Pickering Hale and Dorr LLP (law firm), Partner (until January 2006) |
Frank L. Tarantino
(born 3/07/44) | | Independent Chief Compliance Officer | | June 2004 | | Tarantino LLC (provider of compliance services), Principal (since June 2004); CRA Business Strategies Group (consulting services), Executive Vice President (until June 2004) |
Richard S. Weitzel (k)
(born 7/16/70) | | Assistant Secretary and Assistant Clerk | | October 2007 | | Massachusetts Financial Services Company, Vice President and Assistant General Counsel (since 2004); Massachusetts Department of Business and Technology, General Counsel (until April 2004) |
James O. Yost (k)
(born 6/12/60) | | Assistant Treasurer | | September 1990 | | Massachusetts Financial Services Company, Senior Vice President |
| (h) | Date first appointed to serve as Trustee/officer of an MFS fund. Each Trustee has served continuously since appointment unless indicated otherwise. For the period from December 15, 2004 until February 22, 2005, Messrs. Pozen and Manning served as Advisory Trustees. For the period March 2008 until October 2008, Ms. Dwyer served as Treasurer of the Funds. |
50
Trustees and Officers – continued
| (j) | Directorships or trusteeships of companies required to report to the Securities and Exchange Commission (i.e., “public companies”). |
| (k) | “Interested person” of the Trust within the meaning of the Investment Company Act of 1940 (referred to as the 1940 Act), which is the principal federal law governing investment companies like the fund, as a result of position with MFS. The address of MFS is 500 Boylston Street, Boston, Massachusetts 02116. |
| (n) | In 2004 and 2005, Mr. Butler provided consulting services to the independent compliance consultant retained by MFS pursuant to its settlement with the SEC concerning market timing and related matters. The terms of that settlement required that compensation and expenses related to the independent compliance consultant be borne exclusively by MFS and, therefore, MFS paid Mr. Butler for the services he rendered to the independent compliance consultant. In 2004 and 2005, MFS paid Mr. Butler a total of $351,119.29. |
Each Trustee (except Messrs. Butler, Kavanaugh and Uek and Ms. Goldfarb) has been elected by shareholders and each Trustee and officer holds office until his or her successor is chosen and qualified or until his or her earlier death, resignation, retirement or removal. The Trust held a shareholders’ meeting in 2005 to elect Trustees, and will hold a shareholders’ meeting at least once every five years thereafter, to elect Trustees. Messrs. Butler, Kavanaugh, Sherratt, Uek and Ms. Thomsen are members of the Trust’s Audit Committee.
Each of the Fund’s Trustees and officers holds comparable positions with certain other funds of which MFS or a subsidiary is the investment adviser or distributor, and, in the case of the officers, with certain affiliates of MFS. As of January 1, 2009, the Trustees served as board members of 104 funds within the MFS Family of Funds.
The Statement of Additional Information for the Fund and further information about the Trustees are available without charge upon request by calling 1-800-225-2606.
| | |
| Investment Adviser | | Custodian |
Massachusetts Financial Services Company
500 Boylston Street, Boston, MA 02116-3741 | | State Street Bank and Trust
1 Lincoln Street, Boston, MA 02111-2900 |
| Distributor | | Independent Registered Public Accounting Firm |
MFS Fund Distributors, Inc.
500 Boylston Street, Boston, MA 02116-3741 | | Ernst & Young LLP 200 Clarendon Street, Boston, MA 02116 |
| Portfolio Manager | | |
Thomas Wetherald | | |
51
BOARD REVIEW OF INVESTMENT ADVISORY AGREEMENT
The Investment Company Act of 1940 requires that both the full Board of Trustees and a majority of the non-interested (“independent”) Trustees, voting separately, annually approve the continuation of the Fund’s investment advisory agreement with MFS. The Trustees consider matters bearing on the Fund and its advisory arrangements at their meetings throughout the year, including a review of performance data at each regular meeting. In addition, the independent Trustees met several times over the course of three months beginning in May and ending in July, 2009 (“contract review meetings”) for the specific purpose of considering whether to approve the continuation of the investment advisory agreement for the Fund and the other investment companies that the Board oversees (the “MFS Funds”). The independent Trustees were assisted in their evaluation of the Fund’s investment advisory agreement by independent legal counsel, from whom they received separate legal advice and with whom they met separately from MFS during various contract review meetings. The independent Trustees were also assisted in this process by the MFS Funds’ Independent Chief Compliance Officer, a full-time senior officer appointed by and reporting to the independent Trustees.
In connection with their deliberations regarding the continuation of the investment advisory agreement, the Trustees, including the independent Trustees, considered such information and factors as they believed, in light of the legal advice furnished to them and their own business judgment, to be relevant. The investment advisory agreement for the Fund was considered separately, although the Trustees also took into account the common interests of all MFS Funds in their review. As described below, the Trustees considered the nature, quality, and extent of the various investment advisory, administrative, and shareholder services performed by MFS under the existing investment advisory agreement and other arrangements with the Fund.
In connection with their contract review meetings, the Trustees received and relied upon materials that included, among other items: (i) information provided by Lipper Inc., an independent third party, on the investment performance of the Fund for various time periods ended December 31, 2008 and the investment performance of a group of funds with substantially similar investment classifications/objectives (the “Lipper performance universe”), (ii) information provided by Lipper Inc. on the Fund’s advisory fees and other expenses and the advisory fees and other expenses of comparable funds identified by Lipper Inc. (the “Lipper expense group”), (iii) information provided by MFS on the advisory fees of comparable portfolios of other clients of MFS, including institutional separate accounts and other clients, (iv) information as to whether and to what extent applicable expense waivers,
52
Board Review of Investment Advisory Agreement – continued
reimbursements or fee “breakpoints” are observed for the Fund, (v) information regarding MFS’ financial results and financial condition, including MFS’ and certain of its affiliates’ estimated profitability from services performed for the Fund and the MFS Funds as a whole, (vi) MFS’ views regarding the outlook for the mutual fund industry and the strategic business plans of MFS, (vii) descriptions of various functions performed by MFS for the Funds, such as compliance monitoring and portfolio trading practices, and (viii) information regarding the overall organization of MFS, including information about MFS’ senior management and other personnel providing investment advisory, administrative and other services to the Fund and the other MFS Funds. The comparative performance, fee and expense information prepared and provided by Lipper Inc. was not independently verified and the independent Trustees did not independently verify any information provided to them by MFS.
The Trustees’ conclusion as to the continuation of the investment advisory agreement was based on a comprehensive consideration of all information provided to the Trustees and not the result of any single factor. Some of the factors that figured particularly in the Trustees’ deliberations are described below, although individual Trustees may have evaluated the information presented differently from one another, giving different weights to various factors. It is also important to recognize that the fee arrangements for the Fund and other MFS Funds are the result of years of review and discussion between the independent Trustees and MFS, that certain aspects of such arrangements may receive greater scrutiny in some years than in others, and that the Trustees’ conclusions may be based, in part, on their consideration of these same arrangements during the course of the year and in prior years.
Based on information provided by Lipper Inc., the Trustees reviewed the Fund’s total return investment performance as well as the performance of peer groups of funds over various time periods. The Trustees placed particular emphasis on the total return performance of the Fund’s Class A shares in comparison to the performance of funds in its Lipper performance universe over the three-year period ended December 31, 2008, which the Trustees believed was a long enough period to reflect differing market conditions. The total return performance of the Fund’s Class A shares was in the 3rd quintile relative to the other funds in the universe for this three-year period (the 1st quintile being the best performers and the 5th quintile being the worst performers). The total return performance of the Fund’s Class A shares was in the 2nd quintile for the one-year period and the 4th quintile for the five-year period ended December 31, 2008 relative to the Lipper performance universe. Because of the passage of time, these performance results are likely to differ from the performance results for more recent periods, including those shown elsewhere in this report.
53
Board Review of Investment Advisory Agreement – continued
In addition to considering the performance information provided in connection with the contract review meetings, the independent Trustees noted that, in light of the Fund’s substandard relative performance at the time of their contract meetings in 2008, they had met at each of their regular meetings since then with MFS’ senior investment management personnel to discuss the Fund’s performance and MFS’ efforts to improve the Fund’s performance. The independent Trustees further noted that the Fund’s relative performance for the three-year period ended December 31, 2008 had improved in comparison to the prior year. Taking this information into account, the Trustees concluded, within the context of their overall conclusions regarding the investment advisory agreement, that they were satisfied with MFS’ responses and efforts relating to investment performance.
In assessing the reasonableness of the Fund’s advisory fee, the Trustees considered, among other information, the Fund’s advisory fee and the total expense ratio of the Fund’s Class A shares as a percentage of average daily net assets and the advisory fee and total expense ratios of peer groups of funds based on information provided by Lipper Inc. The Trustees considered that MFS has agreed in writing to reduce its advisory fee on average daily net assets up to $1.5 billion, and to further reduce its advisory fee on average daily net assets over $1.5 billion, which may not be changed without the Trustees’ approval. The Trustees also considered that, according to the Lipper data (which takes into account any fee reductions or expense limitations that were in effect during the Fund’s last fiscal year), the Fund’s effective advisory fee rate was approximately at the Lipper expense group median, and the Fund’s total expense ratio was higher than the Lipper expense group median.
The Trustees also considered the advisory fees charged by MFS to institutional accounts. In comparing these fees, the Trustees considered information provided by MFS as to the generally broader scope of services provided by MFS to the Fund in comparison to institutional accounts, the higher demands placed on MFS’ investment personnel and trading infrastructure as a result of the daily cash in-flows and out-flows of the Fund, and the impact on MFS and expenses associated with the more extensive regulatory regime to which the Fund is subject in comparison to institutional accounts.
The Trustees also considered whether the Fund is likely to benefit from any economies of scale in the management of the Fund in the event of growth in assets of the Fund. They noted that the Fund’s advisory fee rate schedule is currently subject to the breakpoint described above. The Trustees concluded that the existing breakpoint was sufficient to allow the Fund to benefit from economies of scale as its assets grow.
The Trustees also considered information prepared by MFS relating to MFS’ costs and profits with respect to the Fund, the MFS Funds considered as a
54
Board Review of Investment Advisory Agreement – continued
group, and other investment companies and accounts advised by MFS, as well as MFS’ methodologies used to determine and allocate its costs to the MFS Funds, the Fund and other accounts and products for purposes of estimating profitability.
After reviewing these and other factors described herein, the Trustees concluded, within the context of their overall conclusions regarding the investment advisory agreement, that the advisory fees charged to the Fund represent reasonable compensation in light of the services being provided by MFS to the Fund.
In addition, the Trustees considered MFS’ resources and related efforts to continue to retain, attract and motivate capable personnel to serve the Fund. The Trustees also considered current and developing conditions in the financial services industry, including the entry into the industry of large and well-capitalized companies which are spending, and appear to be prepared to continue to spend, substantial sums to engage personnel and to provide services to competing investment companies. In this regard, the Trustees also considered the financial resources of MFS and its ultimate parent, Sun Life Financial Inc. The Trustees also considered the advantages and possible disadvantages to the Fund of having an adviser that also serves other investment companies as well as other accounts.
The Trustees also considered the nature, quality, cost, and extent of administrative, transfer agency, and distribution services provided to the Fund by MFS and its affiliates under agreements and plans other than the investment advisory agreement, including any 12b-1 fees the Fund pays to MFS Fund Distributors, Inc., an affiliate of MFS. The Trustees also considered the nature, extent and quality of certain other services MFS performs or arranges for on the Fund’s behalf, which may include securities lending programs, directed expense payment programs, class action recovery programs, and MFS’ interaction with third-party service providers, principally custodians and sub-custodians. The Trustees concluded that the various non-advisory services provided by MFS and its affiliates on behalf of the Funds were satisfactory.
The Trustees also considered benefits to MFS from the use of the Fund’s portfolio brokerage commissions, if applicable, to pay for investment research and other similar services, and various other factors. Additionally, the Trustees considered so-called “fall-out benefits” to MFS such as reputational value derived from serving as investment manager to the Fund.
Based on their evaluation of factors that they deemed to be material, including those factors described above, the Board of Trustees, including a majority of the independent Trustees, concluded that the Fund’s investment advisory
55
Board Review of Investment Advisory Agreement – continued
agreement with MFS should be continued for an additional one-year period, commencing August 1, 2009.
A discussion regarding the Board’s most recent review and renewal of the fund’s Investment Advisory Agreement with MFS will be available on or about November 1, 2009 by clicking on the fund’s name under “Mutual Funds” in the “Products and Performance” section of the MFS Web site (mfs.com).
56
PROXY VOTING POLICIES AND INFORMATION
A general description of the MFS funds’ proxy voting policies and procedures is available without charge, upon request, by calling
1-800-225-2606, by visiting the Proxy Voting section of mfs.com or by visiting the SEC’s Web site at http://www.sec.gov.
Information regarding how the fund voted proxies relating to portfolio securities during the most recent twelve-month period ended June 30 is available without charge by visiting the Proxy Voting section of mfs.com or by visiting the SEC’s Web site at http://www.sec.gov.
QUARTERLY PORTFOLIO DISCLOSURE
The fund will file a complete schedule of portfolio holdings with the Securities and Exchange Commission (the Commission) for the first and third quarters of each fiscal year on Form N-Q. The fund’s Form N-Q may be reviewed and copied at the:
Public Reference Room
Securities and Exchange Commission
100 F Street, NE, Room 1580
Washington, D.C. 20549
Information on the operation of the Public Reference Room may be obtained by calling the Commission at 1-800-SEC-0330. The fund’s Form N-Q is available on the EDGAR database on the Commission’s Internet Web site at http://www.sec.gov, and copies of this information may be obtained, upon payment of a duplicating fee, by electronic request at the following e-mail address: publicinfo@sec.gov or by writing the Public Reference Section at the above address.
A shareholder can also obtain the quarterly portfolio holdings report at mfs.com.
FURTHER INFORMATION
From time to time, MFS may post important information about the fund or the MFS funds on the MFS web site (mfs.com). This information is available by visiting the “News & Commentary” section of mfs.com or by clicking on the fund’s name under “Mutual Funds” in the “Products and Performance” section of mfs.com.
FEDERAL TAX INFORMATION (unaudited)
The fund will notify shareholders of amounts for use in preparing 2009 income tax forms in January 2010.
57
MFS® PRIVACY NOTICE
Privacy is a concern for every investor today. At MFS Investment Management® and the MFS funds, we take this concern very seriously. We want you to understand our policies about the investment products and services that we offer, and how we protect the nonpublic personal information of investors who have a direct relationship with us and our wholly owned subsidiaries.
Throughout our business relationship, you provide us with personal information. We maintain information and records about you, your investments, and the services you use. Examples of the nonpublic personal information we maintain include
| | Ÿ | | data from investment applications and other forms |
| | Ÿ | | share balances and transactional history with us, our affiliates, or others |
| | Ÿ | | facts from a consumer reporting agency |
We do not disclose any nonpublic personal information about our customers or former customers to anyone, except as permitted by law. We may share nonpublic personal information with third parties or certain of our affiliates in connection with servicing your account or processing your transactions. We may share information with companies or financial institutions that perform marketing services on our behalf or with other financial institutions with which we have joint marketing arrangements, subject to any legal requirements.
Authorization to access your nonpublic personal information is limited to appropriate personnel who provide products, services, or information to you. We maintain physical, electronic, and procedural safeguards to help protect the personal information we collect about you.
If you have any questions about the MFS privacy policy, please call 1-800-225-2606 any business day between 8 a.m. and 8 p.m. Eastern time.
Note: If you own MFS products or receive MFS services in the name of a third party such as a bank or broker-dealer, their privacy policy may apply to you instead of ours.
58
CONTACT US
| | |
Web site mfs.com MFS TALK 1-800-637-8255 24 hours a day Account service and literature Shareholders 1-800-225-2606 Investment professionals 1-800-343-2829 Retirement plan services 1-800-637-1255 | | Mailing address MFS Service Center, Inc. P.O. Box 55824 Boston, MA 02205-5824 Overnight mail MFS Service Center, Inc. c/o Boston Financial Data Services 30 Dan Road Canton, MA 02021-2809 |

Save paper with eDelivery. MFS® will send you prospectuses, reports, and proxies directly via e-mail so you will get information faster with less mailbox clutter. To sign up: 1. go to mfs.com. 2. log in via MFS® Access. 3. select eDelivery. If you own your MFS fund shares through a financial institution or a retirement plan, MFS® TALK, MFS Access, and eDelivery may not be available to you.


MFS® Research International Fund
SIPC Contact Information:
You may obtain information about the Securities Investor Protection Corporation (“SIPC”), including the SIPC Brochure, by contacting SIPC either by telephone (202-371-8300) or by accessing SIPC’s website address (www.sipc.org).
The report is prepared for the general information of shareholders. It is authorized for distribution to prospective investors only when preceded or accompanied by a current prospectus.
NOT FDIC INSURED Ÿ MAY LOSE VALUE Ÿ NO BANK GUARANTEE
8/31/09
RIF-ANN

LETTER FROM THE CEO
Dear Shareholders:
In the fall of 2008, the markets took investors on what was perhaps the most tumultuous ride of their lives. Many are now debating when the market will stage a sustainable recovery, but not even the most experienced investor can provide a definitive answer to that question.
Even so, the basic rules of investing have not changed, and the turbulence reinforced the benefits of investing through the waves. Investors who jumped ship early on may have regretted their decisions when the markets gained some traction in the early half of this year. While anyone with a short-term horizon may have needed to take some action, most with longer-term goals probably found the best option was to stick with their long-term strategy.
At MFS® we believe investors are always best served by developing a plan with their investment professionals that addresses specific long-term needs. Most advisors agree that yearly reviews are important to monitor a plan’s progress. Most would also caution their clients against reacting too quickly to the daily news. When markets do recover, they often gain ground in quick, sudden bursts. If you are out of the market, you can easily miss the benefits of these rallies.
Few of us would again like to live through the kind of market turmoil we saw over the past year. But as turbulent as markets were, in our view, they proved that the fundamental principles of long-term investing still apply.
Respectfully,

Robert J. Manning
Chief Executive Officer and Chief Investment Officer
MFS Investment Management®
October 15, 2009
The opinions expressed in this letter are subject to change, may not be relied upon for investment advice, and no forecasts can be guaranteed.
1
PORTFOLIO COMPOSITION
Portfolio structure

| | |
| Top ten holdings | | |
| HSBC Holdings PLC | | 3.0% |
| Nestle S.A. | | 2.6% |
| Roche Holding AG | | 2.6% |
| TOTAL S.A. | | 2.5% |
| GDF Suez | | 2.1% |
| E.ON AG | | 2.0% |
| Vodafone Group PLC | | 2.0% |
| Royal Dutch Shell PLC, “A” | | 1.9% |
| BNP Paribas | | 1.9% |
| BHP Billiton PLC | | 1.8% |
| | |
| Global equity sectors | | |
| Financial Services | | 25.0% |
| Capital Goods | | 22.7% |
| Energy | | 14.0% |
| Health Care | | 8.1% |
| Technology | | 7.8% |
| Consumer Staples | | 7.5% |
| Consumer Cyclicals | | 7.3% |
| Telecommunications/Cable TV | | 5.9% |
| |
| Country weightings | | |
| Japan | | 15.6% |
| United Kingdom | | 14.1% |
| Switzerland | | 11.8% |
| France | | 10.8% |
| Germany | | 10.3% |
| Netherlands | | 6.5% |
| China | | 4.6% |
| Italy | | 3.3% |
| Hong Kong | | 2.6% |
| Other Countries | | 20.4% |
Percentages are based on net assets as of 8/31/09.
The portfolio is actively managed and current holdings may be different.
2
MANAGEMENT REVIEW
Summary of Results
For the twelve months ended August 31, 2009, Class A shares of the MFS Research International Fund provided a total return of –16.22%, at net asset value. This compares with a return of –14.47% for the fund’s benchmark, the MSCI EAFE Index, and a return of –13.96% for the fund’s other benchmark, the MSCI All Country World (ex-U.S.) Index.
Market Environment
The global economy and financial markets experienced substantial deterioration and extraordinary volatility over most of the reporting period. Through the first quarter of 2009, the strong headwinds in the U.S. included accelerated deterioration in the housing market, anemic corporate investment, a rapidly declining job market, and a much tighter credit environment. During the early stages of the period, a seemingly continuous series of tumultuous financial events hammered markets. As a result of this barrage of turbulent news, global equity markets pushed significantly lower and credit markets witnessed the worst market decline since the beginning of the credit crisis. The synchronized global downturn in economic activity experienced in the fourth quarter of 2008 and the first quarter of 2009 was among the most intense in the post-World War II period. Not only did Europe and Japan fall into very deep recessions, but an increasingly powerful engine of global growth — emerging markets — also contracted almost across the board. Though credit conditions and equity indices improved considerably during the second half of the period, the degree of financial and macroeconomic dislocation remained significant.
During the first half of the reporting period, the Fed continued to cut interest rates aggressively towards zero, while making increasing use of its new lending facilities to alleviate ever-tightening credit markets. On the fiscal front, the U.S. Treasury designed and began implementing a massive fiscal stimulus package. As inflationary concerns diminished in the face of global deleveraging, and equity and credit markets deteriorated more sharply, central banks around the world also cut interest rates dramatically. Policy makers in different countries increasingly sought to coordinate their rescue efforts, which resulted in a number of international actions such as the agreement of swap lines between the Federal Reserve and a number of other central banks and a substantial increase in the financial resources of the International Monetary Fund. By the middle of the period, several central banks had approached their lower bound on policy rates and were examining the implementation and ramifications of quantitative easing as a means to further loosen monetary policy to offset the continuing fall in global economic activity. However, by the
3
Management Review – continued
end of the period, there emerged broadening signs that the worst of the global macroeconomic deterioration had passed, which caused the subsequent rise in asset valuations. As asset prices rebounded in the second half of the period and the demand for liquidity waned, the debate concerning monetary exit strategies had begun, creating added uncertainty regarding the forward path of policy rates.
Detractors from Performance
Security selection in the financial services sector was a major detractor from performance relative to the MSCI EAFE Index. The fund had sold off several banking and financial stocks towards the end of the first half of the reporting period, and these holdings subsequently experienced significant price appreciation. These included Barclays PLC (g) (U.K.), Erste Group Bank (g) (Austria), and Standard Chartered (g) (U.K.). Our ownership of financial services firm Intesa Sanpaolo (g) (Italy) and insurance company AXA (g) (France) at the beginning of the reporting period also hurt as the fund captured more of the stocks’ downside performance than the benchmark. Holdings of financial services firms, Anglo Irish Bank (g) and Sumitomo Mitsui Financial Group (Japan), were also among the top relative detractors.
Stocks in other sectors that held back relative performance included information technology services provider Satyam Computer Services (aa)(g) (India), convenience store chain Lawson (Japan), and pallet company Brambles Industries (g) (Australia). Coupled with the company’s plans to cut U.S. operations, Bramble Industries’ profits suffered as demand from its key markets dramatically declined amid the economic slowdown.
During the reporting period, currency exposure was a detractor from the fund’s relative performance. All of MFS’ investment decisions are driven by the fundamentals of each individual opportunity and, as such, it is common for our funds to have different currency exposure than the benchmark.
Contributors to Performance
Stock selection in the capital goods sector provided positive relative returns. The fund purchased shipyard operator Keppel (Singapore) early in the reporting period when the stock price was near its low and benefited from the stock’s strong performance over the remainder of the period due, in part, to higher demand for its services and the company’s increased profits as it built more offshore rigs. Holdings of parcel delivery services company Yamato Holdings (Japan), locks manufacturer ASSA ABLOY (Sweden), and paint maker Akzo Nobel (Netherlands) also aided relative results. Our positioning in mining operator Rio Tinto (g) (U.K.) was another positive factor for relative performance as the fund captured more of the stock’s upside performance than the benchmark over the reporting period.
4
Management Review – continued
Stock selection in the technology and consumer cyclicals sectors also had a favorable impact on relative results. No individual stocks within the technology sector were among the fund’s top contributors. In the consumer cyclicals sector, an overweighted position in strong-performing fashion distributor Industria de Diseno Textil S.A. (Spain) helped relative returns.
Elsewhere, not owning poor-performing banking firm Royal Bank of Scotland (U.K) aided relative performance. Not holding financial services firms, HSBC Holdings (U.K.) and ING Groep (Netherlands), in the first half of the reporting period, also had a beneficial impact on relative results as these stocks had precipitous price declines earlier in the period.
The fund’s cash position was also a contributor to relative performance. The fund holds cash to buy new holdings and to provide liquidity. In a period when equity markets declined, as measured by the fund’s benchmark, holding cash helped performance versus the benchmark, which has no cash position.
Respectfully,
| | |
| Jose Luis Garcia | | Thomas Melendez |
| Portfolio Manager | | Portfolio Manager |
| (aa) | Security is not a benchmark constituent. |
| (g) | Security was not held in the portfolio at period end. |
The views expressed in this report are those of the portfolio managers only through the end of the period of the report as stated on the cover and do not necessarily reflect the views of MFS or any other person in the MFS organization. These views are subject to change at any time based on market or other conditions, and MFS disclaims any responsibility to update such views. These views may not be relied upon as investment advice or an indication of trading intent on behalf of any MFS portfolio. References to specific securities are not recommendations of such securities, and may not be representative of any MFS portfolio’s current or future investments.
5
PERFORMANCE SUMMARY THROUGH 8/31/09
The following chart illustrates a representative class of the fund’s historical performance in comparison to its benchmark(s). Performance results include the deduction of the maximum applicable sales charge and reflect the percentage change in net asset value, including reinvestment of dividends and capital gains distributions. The performance of other share classes will be greater than or less than that of the class depicted below. Benchmarks are unmanaged and may not be invested in directly. Benchmark returns do not reflect sales charges, commissions or expenses. (See Notes to Performance Summary.)
Performance data shown represents past performance and is no guarantee of future results. Investment return and principal value fluctuate so your shares, when sold, may be worth more or less than the original cost; current performance may be lower or higher than quoted. The performance shown does not reflect the deduction of taxes, if any, that a shareholder would pay on fund distributions or the redemption of fund shares.
Growth of a Hypothetical $10,000 Investment
6
Performance Summary – continued
Total Returns through 8/31/09
Average annual without sales charge
| | | | | | | | | | | | | | |
| | | Share class | | Class inception date | | 1-yr | | 5-yr | | 10-yr | | Life (t) | | |
| | | A | | 1/02/97 | | (16.22)% | | 6.16% | | 5.02% | | N/A | | |
| | | B | | 1/02/98 | | (16.85)% | | 5.44% | | 4.34% | | N/A | | |
| | | C | | 1/02/98 | | (16.88)% | | 5.44% | | 4.34% | | N/A | | |
| | | I | | 1/02/97 | | (16.00)% | | 6.51% | | 5.40% | | N/A | | |
| | | W | | 5/01/06 | | (16.12)% | | N/A | | N/A | | (4.22)% | | |
| | | R1 | | 4/01/05 | | (16.87)% | | N/A | | N/A | | 2.89% | | |
| | | R2 | | 10/31/03 | | (16.45)% | | 5.84% | | N/A | | 6.99% | | |
| | | R3 | | 4/01/05 | | (16.26)% | | N/A | | N/A | | 3.62% | | |
| | | R4 | | 4/01/05 | | (16.03)% | | N/A | | N/A | | 3.93% | | |
| | | 529A | | 7/31/02 | | (16.32)% | | 5.93% | | N/A | | 8.44% | | |
| | | 529B | | 7/31/02 | | (16.99)% | | 5.22% | | N/A | | 7.72% | | |
| | | 529C | | 7/31/02 | | (16.98)% | | 5.21% | | N/A | | 7.71% | | |
| Comparative benchmarks | | | | | | | | | | |
| | | MSCI EAFE Index (f) | | (14.47)% | | 6.32% | | 2.68% | | N/A | | |
| | | MSCI All Country World (ex-U.S.) Index (f) | | (13.96)% | | 8.18% | | 4.01% | | N/A | | |
| Average annual with sales charge | | | | | | | | | | |
| | | A
With Initial Sales Charge (5.75%) | | (21.04)% | | 4.91% | | 4.40% | | N/A | | |
| | | B
With CDSC (Declining over six years
from 4% to 0%) (x) | | (20.08)% | | 5.15% | | 4.34% | | N/A | | |
| | | C
With CDSC (1% for 12 months) (x) | | (17.69)% | | 5.44% | | 4.34% | | N/A | | |
| | | 529A
With Initial Sales Charge (5.75%) | | (21.13)% | | 4.68% | | N/A | | 7.54% | | |
| | | 529B
With CDSC (Declining over six years
from 4% to 0%) (x) | | (20.21)% | | 4.93% | | N/A | | 7.72% | | |
| | | 529C
With CDSC (1% for 12 months) (x) | | (17.78)% | | 5.21% | | N/A | | 7.71% | | |
Class I, W, R1, R2, R3, and R4 shares do not have a sales charge.
CDSC – Contingent Deferred Sales Charge.
| (f) | Source: FactSet Research Systems Inc. |
| (t) | For the period from the class inception date through the stated period end (for those share classes with less than 10 years of performance history). No comparative benchmark information is provided for “life” periods. (See Notes to Performance Summary.) |
| (x) | Assuming redemption at the end of the applicable period. |
7
Performance Summary – continued
Benchmark Definitions
Morgan Stanley Capital International (MSCI) All Country World (ex-U.S.) Index – a market capitalization-weighted index that is designed to measure equity market performance in the developed and emerging markets, excluding the U.S.
Morgan Stanley Capital International (MSCI) EAFE (Europe, Australasia, Far East) Index – a market capitalization-weighted index that is designed to measure equity market performance in the developed markets, excluding the U.S. and Canada.
It is not possible to invest directly in an index.
Notes to Performance Summary
Average annual total return represents the average annual change in value for each share class for the periods presented. Life returns are presented where the share class has less than 10 years of performance history and represent the average annual total return from the class inception date to the stated period end date. As the fund’s share classes may have different inception dates, the life returns may represent different time periods and may not be comparable. As a result, no comparative benchmark performance information is provided for life periods.
Performance results reflect any applicable expense subsidies and waivers in effect during the periods shown. Without such subsidies and waivers the fund’s performance results would be less favorable. Please see the prospectus and financial statements for complete details.
From time to time the fund may receive proceeds from litigation settlements, without which performance would be lower.
8
EXPENSE TABLE
Fund expenses borne by the shareholders during the period, March 1, 2009 through August 31, 2009
As a shareholder of the fund, you incur two types of costs: (1) transaction costs, including sales charges (loads) on certain purchase or redemption payments, and (2) ongoing costs, including management fees; distribution and service (12b-1) fees; and other fund expenses. This example is intended to help you understand your ongoing costs (in dollars) of investing in the fund and to compare these costs with the ongoing costs of investing in other mutual funds.
The example is based on an investment of $1,000 invested at the beginning of the period and held for the entire period March 1, 2009 through August 31, 2009.
The expenses include the payment of a portion of the transfer-agent-related expenses of MFS funds that invest in the fund. For further information, please see the Notes to the Financial Statements.
Actual Expenses
The first line for each share class in the following table provides information about actual account values and actual expenses. You may use the information in this line, together with the amount you invested, to estimate the expenses that you paid over the period. Simply divide your account value by $1,000 (for example, an $8,600 account value divided by $1,000 = 8.6), then multiply the result by the number in the first line under the heading entitled “Expenses Paid During Period” to estimate the expenses you paid on your account during this period.
Hypothetical Example for Comparison Purposes
The second line for each share class in the following table provides information about hypothetical account values and hypothetical expenses based on the fund’s actual expense ratio and an assumed rate of return of 5% per year before expenses, which is not the fund’s actual return. The hypothetical account values and expenses may not be used to estimate the actual ending account balance or expenses you paid for the period. You may use this information to compare the ongoing costs of investing in the fund and other funds. To do so, compare this 5% hypothetical example with the 5% hypothetical examples that appear in the shareholder reports of the other funds.
Please note that the expenses shown in the table are meant to highlight your ongoing costs only and do not reflect any transactional costs, such as sales charges (loads). Therefore, the second line for each share class in the table is useful in comparing ongoing costs only, and will not help you determine the relative total costs of owning different funds. In addition, if these transactional costs were included, your costs would have been higher.
9
Expense Table – continued
| | | | | | | | | | |
Share
Class | | | | Annualized
Expense
Ratio | | Beginning
Account Value
3/01/09 | | Ending
Account Value
8/31/09 | | Expenses
Paid During
Period (p)
3/01/09-8/31/09 |
| A | | Actual | | 1.25% | | $1,000.00 | | $1,529.34 | | $7.97 |
| | Hypothetical (h) | | 1.25% | | $1,000.00 | | $1,018.90 | | $6.36 |
| B | | Actual | | 2.01% | | $1,000.00 | | $1,522.11 | | $12.78 |
| | Hypothetical (h) | | 2.01% | | $1,000.00 | | $1,015.07 | | $10.21 |
| C | | Actual | | 2.00% | | $1,000.00 | | $1,522.33 | | $12.72 |
| | Hypothetical (h) | | 2.00% | | $1,000.00 | | $1,015.12 | | $10.16 |
| I | | Actual | | 1.01% | | $1,000.00 | | $1,530.75 | | $6.44 |
| | Hypothetical (h) | | 1.01% | | $1,000.00 | | $1,020.11 | | $5.14 |
| W | | Actual | | 1.10% | | $1,000.00 | | $1,529.41 | | $7.01 |
| | Hypothetical (h) | | 1.10% | | $1,000.00 | | $1,019.66 | | $5.60 |
| R1 | | Actual | | 2.00% | | $1,000.00 | | $1,522.01 | | $12.71 |
| | Hypothetical (h) | | 2.00% | | $1,000.00 | | $1,015.12 | | $10.16 |
| R2 | | Actual | | 1.50% | | $1,000.00 | | $1,526.44 | | $9.55 |
| | Hypothetical (h) | | 1.50% | | $1,000.00 | | $1,017.64 | | $7.63 |
| R3 | | Actual | | 1.25% | | $1,000.00 | | $1,527.19 | | $7.96 |
| | Hypothetical (h) | | 1.25% | | $1,000.00 | | $1,018.90 | | $6.36 |
| R4 | | Actual | | 0.96% | | $1,000.00 | | $1,529.89 | | $6.12 |
| | Hypothetical (h) | | 0.96% | | $1,000.00 | | $1,020.37 | | $4.89 |
| 529A | | Actual | | 1.35% | | $1,000.00 | | $1,527.88 | | $8.60 |
| | Hypothetical (h) | | 1.35% | | $1,000.00 | | $1,018.40 | | $6.87 |
| 529B | | Actual | | 2.10% | | $1,000.00 | | $1,521.36 | | $13.35 |
| | Hypothetical (h) | | 2.10% | | $1,000.00 | | $1,014.62 | | $10.66 |
| 529C | | Actual | | 2.10% | | $1,000.00 | | $1,520.70 | | $13.34 |
| | Hypothetical (h) | | 2.10% | | $1,000.00 | | $1,014.62 | | $10.66 |
| (h) | 5% class return per year before expenses. |
| (p) | Expenses paid is equal to each class’ annualized expense ratio, as shown above, multiplied by the average account value over the period, multiplied by the number of days in the period, divided by the number of days in the year. Expenses paid do not include any applicable sales charges (loads). If these transaction costs had been included, your costs would have been higher. |
10
PORTFOLIO OF INVESTMENTS
8/31/09
The Portfolio of Investments is a complete list of all securities owned by your fund. It is categorized by broad-based asset classes.
| | | | | |
| Common Stocks - 98.3% | | | | | |
| Issuer | | Shares/Par | | Value ($) |
| | | | | |
| Alcoholic Beverages - 1.0% | | | | | |
| Heineken N.V. (l) | | 810,740 | | $ | 34,223,225 |
| | |
| Apparel Manufacturers - 2.1% | | | | | |
| Li & Fung Ltd. | | 5,860,000 | | $ | 19,469,192 |
| LVMH Moet Hennessy Louis Vuitton S.A. | | 590,250 | | | 56,431,875 |
| | | | | |
| | | | | $ | 75,901,067 |
| Automotive - 0.5% | | | | | |
| Bridgestone Corp. | | 1,037,000 | | $ | 18,956,870 |
| | |
| Biotechnology - 0.7% | | | | | |
| Actelion Ltd. (a) | | 433,404 | | $ | 25,008,012 |
| | |
| Broadcasting - 1.8% | | | | | |
| Grupo Televisa S.A., ADR | | 759,660 | | $ | 13,278,857 |
| WPP Group PLC | | 5,925,434 | | | 49,809,042 |
| | | | | |
| | | | | $ | 63,087,899 |
| Brokerage & Asset Managers - 1.5% | | | | | |
| Julius Baer Holding Ltd. | | 590,947 | | $ | 30,052,409 |
| Deutsche Boerse AG | | 288,170 | | | 21,998,656 |
| | | | | |
| | | | | $ | 52,051,065 |
| Business Services - 1.8% | | | | | |
| Mitsubishi Corp. | | 1,605,000 | | $ | 32,513,971 |
| Nomura Research, Inc. | | 1,278,900 | | | 30,512,176 |
| | | | | |
| | | | | $ | 63,026,147 |
| Computer Software - 1.0% | | | | | |
| SAP AG | | 750,930 | | $ | 36,666,704 |
| | |
| Computer Software - Systems - 1.8% | | | | | |
| Acer, Inc. | | 12,109,770 | | $ | 27,592,021 |
| Konica Minolta Holdings, Inc. | | 1,743,000 | | | 16,484,041 |
| Ricoh Co. Ltd. | | 1,499,000 | | | 21,602,998 |
| | | | | |
| | | | | $ | 65,679,060 |
11
Portfolio of Investments – continued
| | | | | |
| Issuer | | Shares/Par | | Value ($) |
| | | | | |
| | | | | |
| Common Stocks - continued | | | | | |
| Conglomerates - 4.3% | | | | | |
| Hutchison Whampoa Ltd. | | 3,782,000 | | $ | 26,594,456 |
| Keppel Corp. Ltd. | | 8,623,000 | | | 45,540,116 |
| Siemens AG | | 746,440 | | | 64,687,293 |
| Tomkins PLC | | 6,390,540 | | | 18,428,270 |
| | | | | |
| | | | | $ | 155,250,135 |
| Construction - 1.9% | | | | | |
| Corporacion Moctezuma S.A. de C.V. | | 1,221,100 | | $ | 2,372,843 |
| CRH PLC | | 439,224 | | | 11,271,115 |
| Duratex S.A., IPS | | 702,000 | | | 10,716,050 |
| Geberit AG | | 248,760 | | | 38,268,962 |
| Urbi Desarrollos Urbanos S.A. de C.V. (a) | | 3,729,500 | | | 7,146,632 |
| | | | | |
| | | | | $ | 69,775,602 |
| Consumer Products - 1.8% | | | | | |
| Hengan International Group Co. Ltd. | | 2,790,000 | | $ | 15,443,103 |
| Kimberly-Clark de Mexico S.A. de C.V., “A” | | 3,284,550 | | | 14,144,895 |
| Reckitt Benckiser Group PLC | | 719,890 | | | 33,343,065 |
| | | | | |
| | | | | $ | 62,931,063 |
| Electrical Equipment - 1.4% | | | | | |
| Schneider Electric S.A. | | 539,873 | | $ | 49,765,727 |
| | |
| Electronics - 2.0% | | | | | |
| ARM Holdings PLC | | 7,553,330 | | $ | 16,060,803 |
| Samsung Electronics Co. Ltd. | | 33,723 | | | 20,818,667 |
| Taiwan Semiconductor Manufacturing Co. Ltd. | | 19,676,326 | | | 35,387,678 |
| | | | | |
| | | | | $ | 72,267,148 |
| Energy - Independent - 1.8% | | | | | |
| CNOOC Ltd. | | 6,824,000 | | $ | 8,963,134 |
| INPEX Corp. | | 3,031 | | | 24,756,153 |
| Nexen, Inc. | | 597,330 | | | 11,731,076 |
| Tullow Oil PLC | | 1,049,202 | | | 18,293,508 |
| | | | | |
| | | | | $ | 63,743,871 |
| Energy - Integrated - 6.8% | | | | | |
| Eni S.p.A. | | 2,227,700 | | $ | 52,822,625 |
| Marathon Oil Corp. | | 404,750 | | | 12,494,633 |
| Petroleo Brasileiro S.A., ADR | | 269,890 | | | 10,698,440 |
| Royal Dutch Shell PLC, “A” | | 2,458,260 | | | 68,057,555 |
| Suncor Energy, Inc. | | 261,030 | | | 7,985,289 |
12
Portfolio of Investments – continued
| | | | | |
| Issuer | | Shares/Par | | Value ($) |
| | | | | |
| Common Stocks - continued | | | | | |
| Energy - Integrated - continued | | | | | |
| TOTAL S.A. | | 1,567,930 | | $ | 89,843,898 |
| | | | | |
| | | | | $ | 241,902,440 |
| Engineering - Construction - 1.1% | | | | | |
| JGC Corp. | | 2,159,000 | | $ | 40,070,854 |
| | |
| Food & Beverages - 4.0% | | | | | |
| Groupe Danone | | 873,485 | | $ | 47,496,987 |
| Nestle S.A. | | 2,265,940 | | | 94,112,797 |
| | | | | |
| | | | | $ | 141,609,784 |
| Food & Drug Stores - 0.8% | | | | | |
| Lawson, Inc. | | 666,200 | | $ | 28,853,154 |
| | |
| Insurance - 5.7% | | | | | |
| China Life Insurance | | 4,611,000 | | $ | 19,454,316 |
| ING Groep N.V. (a) | | 3,056,860 | | | 46,211,483 |
| QBE Insurance Group Ltd. | | 1,026,544 | | | 19,851,487 |
| Samsung Fire & Marine Insurance Co. Ltd. | | 127,952 | | | 22,949,194 |
| Storebrand A.S.A. (a) | | 5,167,680 | | | 28,098,659 |
| Swiss Reinsurance Co. | | 815,800 | | | 37,612,009 |
| Zurich Financial Services Ltd. | | 140,180 | | | 30,805,445 |
| | | | | |
| | | | | $ | 204,982,593 |
| Leisure & Toys - 0.1% | | | | | |
| Sankyo Co. Ltd. | | 83,900 | | $ | 5,283,761 |
| | |
| Machinery & Tools - 2.0% | | | | | |
| ASSA ABLOY AB, “B” | | 337,854 | | $ | 5,410,638 |
| Beml Ltd. | | 469,094 | | | 10,677,473 |
| Bucyrus International, Inc. | | 696,630 | | | 20,794,406 |
| Glory Ltd. | | 1,624,000 | | | 36,302,203 |
| | | | | |
| | | | | $ | 73,184,720 |
| Major Banks - 7.4% | | | | | |
| Bank of China Ltd. | | 73,761,000 | | $ | 35,879,074 |
| BNP Paribas | | 843,521 | | | 67,924,757 |
| HSBC Holdings PLC | | 9,735,190 | | | 106,517,197 |
| KBC Group N.V. (a) | | 402,671 | | | 15,081,149 |
| Sumitomo Mitsui Financial Group, Inc. | | 923,000 | | | 39,776,787 |
| | | | | |
| | | | | $ | 265,178,964 |
13
Portfolio of Investments – continued
| | | | | |
| Issuer | | Shares/Par | | Value ($) |
| | | | | |
| Common Stocks - continued | | | | | |
| Medical Equipment - 1.7% | | | | | |
| Smith & Nephew PLC | | 3,916,453 | | $ | 33,287,686 |
| Synthes, Inc. | | 242,320 | | | 28,353,431 |
| | | | | |
| | | | | $ | 61,641,117 |
| Metals & Mining - 2.2% | | | | | |
| BHP Billiton PLC | | 2,493,100 | | $ | 65,418,029 |
| Iluka Resources Ltd. (a) | | 3,516,897 | | | 11,741,300 |
| | | | | |
| | | | | $ | 77,159,329 |
| Natural Gas - Distribution - 2.5% | | | | | |
| GDF Suez | | 1,775,796 | | $ | 74,820,470 |
| Tokyo Gas Co. Ltd. | | 3,984,000 | | | 15,970,253 |
| | | | | |
| | | | | $ | 90,790,723 |
| Network & Telecom - 1.2% | | | | | |
| Nokia Oyj | | 3,200,970 | | $ | 44,512,410 |
| | |
| Oil Services - 0.4% | | | | | |
| Saipem S.p.A. | | 548,590 | | $ | 14,683,175 |
| | |
| Other Banks & Diversified Financials - 9.4% | | | | | |
| Aeon Credit Service Co. Ltd. | | 2,404,400 | | $ | 27,183,544 |
| Bank of Cyprus Public Co. Ltd. | | 4,541,610 | | | 31,512,508 |
| Chiba Bank Ltd. | | 3,526,000 | | | 22,205,653 |
| China Construction Bank | | 70,995,000 | | | 53,586,663 |
| HDFC Bank Ltd., ADR | | 354,570 | | | 34,928,691 |
| Housing Development Finance Corp. Ltd. | | 368,232 | | | 18,661,236 |
| Itau Unibanco Multiplo S.A., ADR | | 2,148,268 | | | 35,983,489 |
| Shizuoka Bank Ltd. | | 1,554,000 | | | 16,216,378 |
| UBS AG (a) | | 2,454,723 | | | 45,297,278 |
| Unione di Banche Italiane ScpA | | 3,275,307 | | | 49,490,335 |
| | | | | |
| | | | | $ | 335,065,775 |
| Pharmaceuticals - 5.7% | | | | | |
| Bayer AG | | 660,560 | | $ | 40,559,082 |
| Merck KGaA | | 482,000 | | | 43,705,424 |
| Roche Holding AG | | 588,390 | | | 93,517,836 |
| Santen, Inc. | | 760,400 | | | 25,578,205 |
| | | | | |
| | | | | $ | 203,360,547 |
| Precious Metals & Minerals - 1.3% | | | | | |
| Lihir Gold Ltd. (a) | | 5,550,845 | | $ | 12,995,660 |
| Paladin Resources Ltd. (a)(l) | | 4,908,422 | | | 19,083,551 |
14
Portfolio of Investments – continued
| | | | | |
| Issuer | | Shares/Par | | Value ($) |
| | | | | |
| Common Stocks - continued | | | | | |
| Precious Metals & Minerals - continued | | | | | |
| Teck Resources Ltd., “B” (a) | | 568,590 | | $ | 13,721,989 |
| | | | | |
| | | | | $ | 45,801,200 |
| Printing & Publishing - 0.7% | | | | | |
| Reed Elsevier PLC | | 3,633,901 | | $ | 26,443,687 |
| | |
| Railroad & Shipping - 1.3% | | | | | |
| East Japan Railway Co. | | 724,000 | | $ | 47,307,039 |
| | |
| Real Estate - 1.0% | | | | | |
| Shimao Property Holdings Ltd. | | 5,942,000 | | $ | 8,847,316 |
| Sun Hung Kai Properties Ltd. | | 2,090,000 | | | 28,287,519 |
| Unitech Ltd. | | 109,877 | | | 241,583 |
| | | | | |
| | | | | $ | 37,376,418 |
| Specialty Chemicals - 4.1% | | | | | |
| Akzo Nobel N.V. | | 1,033,740 | | $ | 58,545,182 |
| Linde AG | | 636,080 | | | 63,923,056 |
| Symrise AG | | 1,467,477 | | | 24,256,514 |
| | | | | |
| | | | | $ | 146,724,752 |
| Specialty Stores - 1.8% | | | | | |
| Esprit Holdings Ltd. | | 2,994,200 | | $ | 18,215,269 |
| Industria de Diseno Textil S.A. | | 818,340 | | | 44,533,595 |
| | | | | |
| | | | | $ | 62,748,864 |
| Telecommunications - Wireless - 3.7% | | | | | |
| America Movil S.A.B. de C.V., “L”, ADR | | 467,480 | | $ | 21,106,722 |
| KDDI Corp. | | 5,027 | | | 28,579,076 |
| Rogers Communications, Inc., “B” | | 469,580 | | | 12,928,195 |
| Vodafone Group PLC | | 32,739,250 | | | 70,572,714 |
| | | | | |
| | | | | $ | 133,186,707 |
| Telephone Services - 2.2% | | | | | |
| China Unicom Ltd. | | 15,606,000 | | $ | 21,947,809 |
| Royal KPN N.V. | | 3,600,700 | | | 55,284,601 |
| | | | | |
| | | | | $ | 77,232,410 |
| Tobacco - 0.7% | | | | | |
| Japan Tobacco, Inc. | | 8,332 | | $ | 24,167,725 |
15
Portfolio of Investments – continued
| | | | | | |
| Issuer | | Shares/Par | | Value ($) | |
| Common Stocks - continued | | | | | | |
| Trucking - 2.6% | | | | | | |
| TNT N.V. | | 1,487,254 | | $ | 36,693,893 | |
| Yamato Holdings Co. Ltd. | | 3,347,000 | | | 55,393,659 | |
| | | | | | |
| | | | | $ | 92,087,552 | |
| Utilities - Electric Power - 2.5% | | | | | | |
| CEZ AS | | 335,820 | | $ | 17,540,981 | |
| E.ON AG | | 1,702,827 | | | 72,038,972 | |
| | | | | | |
| | | | | $ | 89,579,953 | |
| Total Common Stocks (Identified Cost, $3,263,416,930) | | | | $ | 3,519,269,248 | |
| | |
| Money Market Funds (v) - 2.9% | | | | | | |
MFS Institutional Money Market Portfolio, 0.20%,
at Cost and Net Asset Value | | 101,861,738 | | $ | 101,861,738 | |
| | |
| Collateral for Securities Loaned - 0.7% | | | | | | |
Navigator Securities Lending Prime Portfolio,
at Cost and Net Asset Value | | 26,572,289 | | $ | 26,572,289 | |
| Total Investments (Identified Cost, $3,391,850,957) | | | | $ | 3,647,703,275 | |
| | |
| Other Assets, Less Liabilities - (1.9)% | | | | | (67,504,488 | ) |
| Net Assets - 100.0% | | | | $ | 3,580,198,787 | |
| (a) | Non-income producing security. |
| (l) | All or a portion of this security is on loan. |
| (v) | Underlying fund that is available only to investment companies managed by MFS. The rate quoted is the annualized seven-day yield of the fund at period end. |
The following abbreviations are used in this report and are defined:
| ADR | | American Depository Receipt |
| IPS | | International Preference Stock |
| PLC | | Public Limited Company |
See Notes to Financial Statements
16
Financial Statements
STATEMENT OF ASSETS AND LIABILITIES
At 8/31/09
This statement represents your fund’s balance sheet, which details the assets and liabilities comprising the total value of the fund.
| | | |
| Assets | | | |
Investments- | | | |
Non-affiliated issuers, at value (identified cost, $3,289,989,219) | | $3,545,841,537 | |
Underlying funds, at cost and value | | 101,861,738 | |
Total investments, at value, including $25,352,881 of securities on loan
(identified cost, $3,391,850,957) | | $3,647,703,275 | |
Foreign currency, at value (identified cost, $2,214,126) | | 2,211,480 | |
Receivables for | | | |
Investments sold | | 35,872,374 | |
Fund shares sold | | 6,736,527 | |
Interest and dividends | | 6,643,578 | |
Other assets | | 9,889 | |
Total assets | | $3,699,177,123 | |
| Liabilities | | | |
Payables for | | | |
Investments purchased | | $86,317,132 | |
Fund shares reacquired | | 4,133,938 | |
Collateral for securities loaned, at value | | 26,572,289 | |
Payable to affiliates | | | |
Investment adviser | | 308,929 | |
Shareholder servicing costs | | 849,571 | |
Distribution and service fees | | 60,990 | |
Administrative services fee | | 6,997 | |
Program manager fees | | 28 | |
Payable for independent Trustees’ compensation | | 22,862 | |
Accrued expenses and other liabilities | | 705,600 | |
Total liabilities | | $118,978,336 | |
Net assets | | $3,580,198,787 | |
| Net assets consist of | | | |
Paid-in capital | | $4,685,737,461 | |
Unrealized appreciation (depreciation) on investments and translation of assets and liabilities in foreign currencies (net of $274,890 deferred country tax) | | 255,777,916 | |
Accumulated net realized gain (loss) on investments and foreign currency transactions | | (1,420,863,037 | ) |
Undistributed net investment income | | 59,546,447 | |
Net assets | | $3,580,198,787 | |
Shares of beneficial interest outstanding | | 272,350,795 | |
17
Statement of Assets and Liabilities – continued
| | | | | | |
| | | Net assets | | Shares
outstanding | | Net asset value
per share (a) |
Class A | | $1,254,398,974 | | 96,295,454 | | $13.03 |
Class B | | 55,961,223 | | 4,517,329 | | 12.39 |
Class C | | 110,142,220 | | 8,974,332 | | 12.27 |
Class I | | 1,456,883,972 | | 108,427,357 | | 13.44 |
Class W | | 23,559,790 | | 1,812,631 | | 13.00 |
Class R1 | | 6,310,772 | | 521,521 | | 12.10 |
Class R2 | | 60,789,684 | | 4,786,900 | | 12.70 |
Class R3 | | 133,545,333 | | 10,332,845 | | 12.92 |
Class R4 | | 476,076,498 | | 36,480,672 | | 13.05 |
Class 529A | | 1,451,003 | | 112,691 | | 12.88 |
Class 529B | | 448,684 | | 37,042 | | 12.11 |
Class 529C | | 630,634 | | 52,021 | | 12.12 |
On sales of $50,000 or more, the offering prices of Class A and Class 529A shares are reduced. A contingent deferred sales charge may be imposed on redemptions of Class A, Class B, Class C, Class 529B, and Class 529C shares.
| (a) | Maximum offering price and redemption price per share were equal to the net asset value per share for all share classes, except for Classes A and 529A, for which the maximum offering prices per share were $13.82 and $13.67, respectively. |
See Notes to Financial Statements
18
Financial Statements
STATEMENT OF OPERATIONS
Year ended 8/31/09
This statement describes how much your fund earned in investment income and accrued in expenses. It also describes any gains and/or losses generated by fund operations.
| | | | | | |
| Net investment income | | | | | | |
Income | | | | | | |
Dividends | | $104,781,573 | | | | |
Interest | | 2,349,288 | | | | |
Dividends from underlying funds | | 67,617 | | | | |
Foreign taxes withheld | | (9,793,371 | ) | | | |
Total investment income | | | | | $97,405,107 | |
Expenses | | | | | | |
Management fee | | $23,591,803 | | | | |
Distribution and service fees | | 5,249,982 | | | | |
Program manager fees | | 2,263 | | | | |
Shareholder servicing costs | | 4,551,695 | | | | |
Administrative services fee | | 578,993 | | | | |
Independent Trustees’ compensation | | 84,445 | | | | |
Custodian fee | | 1,281,736 | | | | |
Shareholder communications | | 178,959 | | | | |
Auditing fees | | 66,435 | | | | |
Legal fees | | 93,190 | | | | |
Miscellaneous | | 464,089 | | | | |
Total expenses | | | | | $36,143,590 | |
Fees paid indirectly | | (2,475 | ) | | | |
Reduction of expenses by investment adviser | | (18,974 | ) | | | |
Net expenses | | | | | $36,122,141 | |
Net investment income | | | | | $61,282,966 | |
Realized and unrealized gain (loss) on investments
and foreign currency transactions | | | | | | |
Realized gain (loss) (identified cost basis) | | | | | | |
Investment transactions | | $(1,402,049,074 | ) | | | |
Foreign currency transactions | | (1,518,849 | ) | | | |
Net realized gain (loss) on investments
and foreign currency transactions | | | | | $(1,403,567,923 | ) |
Change in unrealized appreciation (depreciation) | | | | | | |
Investments (net of $274,890 deferred country tax) | | $499,022,246 | | | | |
Translation of assets and liabilities in foreign currencies | | 533,677 | | | | |
Net unrealized gain (loss) on investments
and foreign currency translation | | | | | $499,555,923 | |
Net realized and unrealized gain (loss) on investments
and foreign currency | | | | | $(904,012,000 | ) |
Change in net assets from operations | | | | | $(842,729,034 | ) |
See Notes to Financial Statements
19
Financial Statements
STATEMENTS OF CHANGES IN NET ASSETS
These statements describe the increases and/or decreases in net assets resulting from operations, any distributions, and any shareholder transactions.
| | | | | | |
| | | Years ended 8/31 | |
| | | 2009 | | | 2008 | |
| Change in net assets | | | | | | |
| From operations | | | | | | |
Net investment income | | $61,282,966 | | | $81,638,992 | |
Net realized gain (loss) on investments and
foreign currency transactions | | (1,403,567,923 | ) | | 113,785,930 | |
Net unrealized gain (loss) on investments and foreign currency translation | | 499,555,923 | | | (806,819,755 | ) |
Change in net assets from operations | | $(842,729,034 | ) | | $(611,394,833 | ) |
| Distributions declared to shareholders | | | | | | |
From net investment income | | $(59,328,561 | ) | | $(70,298,184 | ) |
From net realized gain on investments | | (56,492,868 | ) | | (461,127,184 | ) |
Total distributions declared to shareholders | | $(115,821,429 | ) | | $(531,425,368 | ) |
Change in net assets from fund share transactions | | $127,313,774 | | | $771,775,905 | |
Total change in net assets | | $(831,236,689 | ) | | $(371,044,296 | ) |
| Net assets | | | | | | |
At beginning of period | | 4,411,435,476 | | | 4,782,479,772 | |
At end of period (including undistributed net investment
income of $59,546,447 and $59,412,149, respectively) | | $3,580,198,787 | | | $4,411,435,476 | |
See Notes to Financial Statements
20
Financial Statements
FINANCIAL HIGHLIGHTS
The financial highlights table is intended to help you understand the fund’s financial performance for the past 5 years (or life of a particular share class, if shorter). Certain information reflects financial results for a single fund share. The total returns in the table represent the rate by which an investor would have earned (or lost) on an investment in the fund share class (assuming reinvestment of all distributions) held for the entire period.
| | | | | | | | | | | | | | | |
| Class A | | Years ended 8/31 | |
| | | 2009 | | | 2008 | | | 2007 | | | 2006 | | | 2005 | |
Net asset value, beginning of period | | $16.14 | | | $20.56 | | | $19.44 | | | $16.65 | | | $14.25 | |
| Income (loss) from investment operations | | | | | | | | | | | | | | | |
Net investment income (d) | | $0.22 | | | $0.30 | | | $0.26 | | | $0.19 | | | $0.12 | |
Net realized and unrealized gain (loss)
on investments and foreign currency | | (2.92 | ) | | (2.45 | ) | | 3.03 | | | 4.08 | | | 3.04 | |
| Total from investment operations | | $(2.70 | ) | | $(2.15 | ) | | $3.29 | | | $4.27 | | | $3.16 | |
| Less distributions declared to shareholders | | | | | | | | | | | | | |
From net investment income | | $(0.20 | ) | | $(0.28 | ) | | $(0.23 | ) | | $(0.12 | ) | | $(0.08 | ) |
From net realized gain on investments | | (0.21 | ) | | (1.99 | ) | | (1.94 | ) | | (1.36 | ) | | (0.68 | ) |
| Total distributions declared to shareholders | | $(0.41 | ) | | $(2.27 | ) | | $(2.17 | ) | | $(1.48 | ) | | $(0.76 | ) |
| Net asset value, end of period | | $13.03 | | | $16.14 | | | $20.56 | | | $19.44 | | | $16.65 | |
| Total return (%) (r)(s)(t) | | (16.22 | ) | | (12.46 | ) | | 17.82 | | | 27.18 | | | 22.67 | |
Ratios (%) (to average net assets)
and Supplemental data: | | | | | | | | | | | | | | | |
Expenses before expense reductions (f) | | 1.35 | | | 1.32 | | | 1.34 | | | 1.43 | | | 1.52 | |
Expenses after expense reductions (f) | | 1.35 | | | 1.32 | | | 1.34 | | | 1.43 | | | 1.55 | (e) |
Net investment income | | 1.95 | | | 1.57 | | | 1.28 | | | 1.06 | | | 0.80 | |
Portfolio turnover | | 88 | | | 68 | | | 66 | | | 85 | | | 79 | |
Net assets at end of period (000 omitted) | | $1,254,399 | | | $1,628,324 | | | $1,813,833 | | | $1,344,754 | | | $958,878 | |
See Notes to Financial Statements
21
Financial Highlights – continued
| | | | | | | | | | | | | | | |
| Class B | | Years ended 8/31 | |
| | | 2009 | | | 2008 | | | 2007 | | | 2006 | | | 2005 | |
Net asset value, beginning of period | | $15.34 | | | $19.61 | | | $18.63 | | | $16.02 | | | $13.76 | |
| Income (loss) from investment operations | | | | | | | | | | | | | |
Net investment income (d) | | $0.13 | | | $0.14 | | | $0.11 | | | $0.07 | | | $0.01 | |
Net realized and unrealized gain (loss)
on investments and foreign currency | | (2.77 | ) | | (2.30 | ) | | 2.92 | | | 3.93 | | | 2.93 | |
Total from investment operations | | $(2.64 | ) | | $(2.16 | ) | | $3.03 | | | $4.00 | | | $2.94 | |
| Less distributions declared to shareholders | | | | | | | | | | | | | |
From net investment income | | $(0.10 | ) | | $(0.12 | ) | | $(0.11 | ) | | $(0.03 | ) | | $(0.00 | )(w) |
From net realized gain on investments | | (0.21 | ) | | (1.99 | ) | | (1.94 | ) | | (1.36 | ) | | (0.68 | ) |
Total distributions declared to shareholders | | $(0.31 | ) | | $(2.11 | ) | | $(2.05 | ) | | $(1.39 | ) | | $(0.68 | ) |
Net asset value, end of period | | $12.39 | | | $15.34 | | | $19.61 | | | $18.63 | | | $16.02 | |
Total return (%) (r)(s)(t) | | (16.85 | ) | | (13.00 | ) | | 17.08 | | | 26.36 | | | 21.77 | |
Ratios (%) (to average net assets)
and Supplemental data: | | | | | | | | | | | | | | | |
Expenses before expense reductions (f) | | 2.05 | | | 1.97 | | | 1.99 | | | 2.08 | | | 2.17 | |
Expenses after expense reductions (f) | | 2.05 | | | 1.97 | | | 1.99 | | | 2.08 | | | 2.20 | (e) |
Net investment income | | 1.25 | | | 0.77 | | | 0.55 | | | 0.40 | | | 0.08 | |
Portfolio turnover | | 88 | | | 68 | | | 66 | | | 85 | | | 79 | |
Net assets at end of period (000 omitted) | | $55,961 | | | $111,389 | | | $185,670 | | | $184,341 | | | $141,515 | |
| | | | | | | | | | | | | | | |
| Class C | | Years ended 8/31 | |
| | | 2009 | | | 2008 | | | 2007 | | | 2006 | | | 2005 | |
Net asset value, beginning of period | | $15.23 | | | $19.52 | | | $18.57 | | | $15.98 | | | $13.73 | |
| Income (loss) from investment operations | | | | | | | | | | | | | |
Net investment income (d) | | $0.14 | | | $0.15 | | | $0.12 | | | $0.07 | | | $0.02 | |
Net realized and unrealized gain (loss)
on investments and foreign currency | | (2.77 | ) | | (2.29 | ) | | 2.89 | | | 3.92 | | | 2.92 | |
Total from investment operations | | $(2.63 | ) | | $(2.14 | ) | | $3.01 | | | $3.99 | | | $2.94 | |
| Less distributions declared to shareholders | | | | | | | | | | | | | |
From net investment income | | $(0.12 | ) | | $(0.16 | ) | | $(0.12 | ) | | $(0.04 | ) | | $(0.01 | ) |
From net realized gain on investments | | (0.21 | ) | | (1.99 | ) | | (1.94 | ) | | (1.36 | ) | | (0.68 | ) |
Total distributions declared to shareholders | | $(0.33 | ) | | $(2.15 | ) | | $(2.06 | ) | | $(1.40 | ) | | $(0.69 | ) |
Net asset value, end of period | | $12.27 | | | $15.23 | | | $19.52 | | | $18.57 | | | $15.98 | |
Total return (%) (r)(s)(t) | | (16.88 | ) | | (13.00 | ) | | 17.05 | | | 26.38 | | | 21.84 | |
Ratios (%) (to average net assets)
and Supplemental data: | | | | | | | | | | | | | | | |
Expenses before expense reductions (f) | | 2.05 | | | 1.97 | | | 1.99 | | | 2.08 | | | 2.17 | |
Expenses after expense reductions (f) | | 2.05 | | | 1.97 | | | 1.99 | | | 2.08 | | | 2.20 | (e) |
Net investment income | | 1.30 | | | 0.86 | | | 0.62 | | | 0.41 | | | 0.13 | |
Portfolio turnover | | 88 | | | 68 | | | 66 | | | 85 | | | 79 | |
Net assets at end of period (000 omitted) | | $110,142 | | | $168,396 | | | $200,491 | | | $158,564 | | | $109,347 | |
See Notes to Financial Statements
22
Financial Highlights – continued
| | | | | | | | | | | | | | | |
| Class I | | Years ended 8/31 | |
| | | 2009 | | | 2008 | | | 2007 | | | 2006 | | | 2005 | |
Net asset value, beginning of period | | $16.65 | | | $21.14 | | | $19.92 | | | $17.02 | | | $14.54 | |
| Income (loss) from investment operations | | | | | | | | | | | | | |
Net investment income (d) | | $0.26 | | | $0.37 | | | $0.34 | | | $0.26 | | | $0.19 | |
Net realized and unrealized gain (loss)
on investments and foreign currency | | (3.01 | ) | | (2.52 | ) | | 3.11 | | | 4.17 | | | 3.10 | |
Total from investment operations | | $(2.75 | ) | | $(2.15 | ) | | $3.45 | | | $4.43 | | | $3.29 | |
| Less distributions declared to shareholders | | | | | | | | | | | | | |
From net investment income | | $(0.25 | ) | | $(0.35 | ) | | $(0.29 | ) | | $(0.17 | ) | | $(0.13 | ) |
From net realized gain on investments | | (0.21 | ) | | (1.99 | ) | | (1.94 | ) | | (1.36 | ) | | (0.68 | ) |
Total distributions declared to shareholders | | $(0.46 | ) | | $(2.34 | ) | | $(2.23 | ) | | $(1.53 | ) | | $(0.81 | ) |
Net asset value, end of period | | $13.44 | | | $16.65 | | | $21.14 | | | $19.92 | | | $17.02 | |
Total return (%) (r)(s) | | (16.00 | ) | | (12.15 | ) | | 18.27 | | | 27.61 | | | 23.09 | |
Ratios (%) (to average net assets)
and Supplemental data: | | | | | | | | | | | | | | | |
Expenses before expense reductions (f) | | 1.05 | | | 0.97 | | | 0.99 | | | 1.08 | | | 1.17 | |
Expenses after expense reductions (f) | | 1.05 | | | 0.97 | | | 0.99 | | | 1.08 | | | 1.20 | (e) |
Net investment income | | 2.31 | | | 1.93 | | | 1.64 | | | 1.41 | | | 1.18 | |
Portfolio turnover | | 88 | | | 68 | | | 66 | | | 85 | | | 79 | |
Net assets at end of period (000 omitted) | | $1,456,884 | | | $2,167,218 | | | $2,210,257 | | | $1,565,596 | | | $851,484 | |
| | | | | | | | | | | | |
| Class W | | Years ended 8/31 | |
| | | 2009 | | | 2008 | | | 2007 | | | 2006 (i) | |
Net asset value, beginning of period | | $16.14 | | | $20.57 | | | $19.45 | | | $19.54 | |
| Income (loss) from investment operations | | | | | | | | | | | | |
Net investment income (d) | | $0.24 | | | $0.35 | | | $0.35 | | | $0.04 | |
Net realized and unrealized gain (loss) on investments
and foreign currency | | (2.93 | ) | | (2.45 | ) | | 3.00 | | | (0.13 | )(g) |
Total from investment operations | | $(2.69 | ) | | $(2.10 | ) | | $3.35 | | | $(0.09 | ) |
| Less distributions declared to shareholders | | | | | | | | | | | | |
From net investment income | | $(0.24 | ) | | $(0.34 | ) | | $(0.29 | ) | | $— | |
From net realized gain on investments | | (0.21 | ) | | (1.99 | ) | | (1.94 | ) | | — | |
Total distributions declared to shareholders | | $(0.45 | ) | | $(2.33 | ) | | $(2.23 | ) | | $— | |
Net asset value, end of period | | $13.00 | | | $16.14 | | | $20.57 | | | $19.45 | |
Total return (%) (r)(s) | | (16.12 | ) | | (12.25 | ) | | 18.15 | | | (0.46 | )(n) |
Ratios (%) (to average net assets)
and Supplemental data: | | | | | | | | | | | | |
Expenses before expense reductions (f) | | 1.14 | | | 1.07 | | | 1.10 | | | 1.20 | (a) |
Expenses after expense reductions (f) | | 1.14 | | | 1.07 | | | 1.10 | | | 1.20 | (a) |
Net investment income | | 2.25 | | | 1.89 | | | 1.78 | | | 1.02 | (a) |
Portfolio turnover | | 88 | | | 68 | | | 66 | | | 85 | |
Net assets at end of period (000 omitted) | | $23,560 | | | $16,633 | | | $10,272 | | | $1,033 | |
See Notes to Financial Statements
23
Financial Highlights – continued
| | | | | | | | | | | | | | | |
| Class R1 | | Years ended 8/31 | |
| | | 2009 | | | 2008 | | | 2007 | | | 2006 | | | 2005 (i) | |
Net asset value, beginning of period | | $15.05 | | | $19.38 | | | $18.49 | | | $16.02 | | | $15.07 | |
| Income (loss) from investment operations | | | | | | | | | | | | | | | |
Net investment income (d) | | $0.14 | | | $0.16 | | | $0.12 | | | $0.11 | | | $0.03 | |
Net realized and unrealized gain (loss)
on investments and foreign currency | | (2.74 | ) | | (2.28 | ) | | 2.87 | | | 3.84 | | | 0.92 | |
Total from investment operations | | $(2.60 | ) | | $(2.12 | ) | | $2.99 | | | $3.95 | | | $0.95 | |
| Less distributions declared to shareholders | | | | | | | | | | | | | | | |
From net investment income | | $(0.14 | ) | | $(0.22 | ) | | $(0.16 | ) | | $(0.12 | ) | | $— | |
From net realized gain on investments | | (0.21 | ) | | (1.99 | ) | | (1.94 | ) | | (1.36 | ) | | — | |
Total distributions declared to shareholders | | $(0.35 | ) | | $(2.21 | ) | | $(2.10 | ) | | $(1.48 | ) | | $— | |
Net asset value, end of period | | $12.10 | | | $15.05 | | | $19.38 | | | $18.49 | | | $16.02 | |
Total return (%) (r)(s) | | (16.87 | ) | | (13.03 | ) | | 17.00 | | | 26.12 | | | 6.30 | (n) |
Ratios (%) (to average net assets)
and Supplemental data: | | | | | | | | | | | | | | | |
Expenses before expense reductions (f) | | 2.05 | | | 2.02 | | | 2.14 | | | 2.26 | | | 2.36 | (a) |
Expenses after expense reductions (f) | | 2.05 | | | 2.02 | | | 2.09 | | | 2.16 | | | 2.39 | (a)(e) |
Net investment income | | 1.34 | | | 0.92 | | | 0.64 | | | 0.65 | | | 0.46 | (a) |
Portfolio turnover | | 88 | | | 68 | | | 66 | | | 85 | | | 79 | |
Net assets at end of period (000 omitted) | | $6,311 | | | $8,930 | | | $5,441 | | | $2,027 | | | $171 | |
| | | | | | | | | | | | | | | |
| Class R2 | | Years ended 8/31 | |
| | | 2009 | | | 2008 | | | 2007 | | | 2006 | | | 2005 | |
Net asset value, beginning of period | | $15.76 | | | $20.14 | | | $19.11 | | | $16.43 | | | $14.16 | |
| Income (loss) from investment operations | | | | | | | | | | | | | | | |
Net investment income (d) | | $0.20 | | | $0.36 | | | $0.22 | | | $0.15 | | | $0.11 | |
Net realized and unrealized gain (loss)
on investments and foreign currency | | (2.87 | ) | | (2.49 | ) | | 2.96 | | | 4.01 | | | 2.96 | |
Total from investment operations | | $(2.67 | ) | | $(2.13 | ) | | $3.18 | | | $4.16 | | | $3.07 | |
| Less distributions declared to shareholders | | | | | | | | | | | | | | | |
From net investment income | | $(0.18 | ) | | $(0.26 | ) | | $(0.21 | ) | | $(0.12 | ) | | $(0.12 | ) |
From net realized gain on investments | | (0.21 | ) | | (1.99 | ) | | (1.94 | ) | | (1.36 | ) | | (0.68 | ) |
Total distributions declared to shareholders | | $(0.39 | ) | | $(2.25 | ) | | $(2.15 | ) | | $(1.48 | ) | | $(0.80 | ) |
Net asset value, end of period | | $12.70 | | | $15.76 | | | $20.14 | | | $19.11 | | | $16.43 | |
Total return (%) (r)(s) | | (16.45 | ) | | (12.63 | ) | | 17.50 | | | 26.79 | | | 22.13 | |
Ratios (%) (to average net assets)
and Supplemental data: | | | | | | | | | | | | | | | |
Expenses before expense reductions (f) | | 1.54 | | | 1.51 | | | 1.69 | | | 1.82 | | | 1.92 | |
Expenses after expense reductions (f) | | 1.54 | | | 1.51 | | | 1.64 | | | 1.73 | | | 1.95 | (e) |
Net investment income | | 1.88 | | | 2.02 | | | 1.13 | | | 0.83 | | | 0.74 | |
Portfolio turnover | | 88 | | | 68 | | | 66 | | | 85 | | | 79 | |
Net assets at end of period (000 omitted) | | $60,790 | | | $96,672 | | | $36,143 | | | $13,799 | | | $2,357 | |
See Notes to Financial Statements
24
Financial Highlights – continued
| | | | | | | | | | | | | | | |
| Class R3 | | Years ended 8/31 | |
| | | 2009 | | | 2008 | | | 2007 | | | 2006 | | | 2005 (i) | |
Net asset value, beginning of period | | $16.06 | | | $20.47 | | | $19.39 | | | $16.65 | | | $15.62 | |
| Income (loss) from investment operations | | | | | | | | | | | | | | | |
Net investment income (d) | | $0.23 | | | $0.30 | | | $0.31 | | | $0.25 | | | $0.12 | |
Net realized and unrealized gain (loss)
on investments and foreign currency | | (2.93 | ) | | (2.43 | ) | | 2.96 | | | 4.00 | | | 0.91 | |
Total from investment operations | | $(2.70 | ) | | $(2.13 | ) | | $3.27 | | | $4.25 | | | $1.03 | |
| Less distributions declared to shareholders | | | | | | | | | | | | | | | |
From net investment income | | $(0.23 | ) | | $(0.29 | ) | | $(0.25 | ) | | $(0.15 | ) | | $— | |
From net realized gain on investments | | (0.21 | ) | | (1.99 | ) | | (1.94 | ) | | (1.36 | ) | | — | |
Total distributions declared to shareholders | | $(0.44 | ) | | $(2.28 | ) | | $(2.19 | ) | | $(1.51 | ) | | $— | |
Net asset value, end of period | | $12.92 | | | $16.06 | | | $20.47 | | | $19.39 | | | $16.65 | |
Total return (%) (r)(s) | | (16.26 | ) | | (12.42 | ) | | 17.78 | | | 27.07 | | | 6.59 | (n) |
Ratios (%) (to average net assets)
and Supplemental data: | | | | | | | | | | | | | | | |
Expenses before expense reductions (f) | | 1.29 | | | 1.27 | | | 1.39 | | | 1.47 | | | 1.55 | (a) |
Expenses after expense reductions (f) | | 1.29 | | | 1.27 | | | 1.39 | | | 1.47 | | | 1.58 | (a)(e) |
Net investment income | | 2.09 | | | 1.61 | | | 1.54 | | | 1.42 | | | 1.79 | (a) |
Portfolio turnover | | 88 | | | 68 | | | 66 | | | 85 | | | 79 | |
Net assets at end of period (000 omitted) | | $133,545 | | | $62,056 | | | $64,332 | | | $12,796 | | | $53 | |
| | | | | | | | | | | | | | | |
| Class R4 | | Years ended 8/31 | |
| | | 2009 | | | 2008 | | | 2007 | | | 2006 | | | 2005 (i) | |
Net asset value, beginning of period | | $16.19 | | | $20.60 | | | $19.47 | | | $16.67 | | | $15.62 | |
| Income (loss) from investment operations | | | | | | | | | | | | | | | |
Net investment income (d) | | $0.20 | | | $0.34 | | | $0.32 | | | $0.33 | | | $0.14 | |
Net realized and unrealized gain (loss)
on investments and foreign currency | | (2.88 | ) | | (2.43 | ) | | 3.03 | | | 3.99 | | | 0.91 | |
Total from investment operations | | $(2.68 | ) | | $(2.09 | ) | | $3.35 | | | $4.32 | | | $1.05 | |
| Less distributions declared to shareholders | | | | | | | | | | | | | |
From net investment income | | $(0.25 | ) | | $(0.33 | ) | | $(0.28 | ) | | $(0.16 | ) | | $— | |
From net realized gain on investments | | (0.21 | ) | | (1.99 | ) | | (1.94 | ) | | (1.36 | ) | | — | |
Total distributions declared to shareholders | | $(0.46 | ) | | $(2.32 | ) | | $(2.22 | ) | | $(1.52 | ) | | $— | |
Net asset value, end of period | | $13.05 | | | $16.19 | | | $20.60 | | | $19.47 | | | $16.67 | |
Total return (%) (r)(s) | | (16.03 | ) | | (12.15 | ) | | 18.13 | | | 27.50 | | | 6.72 | (n) |
Ratios (%) (to average net assets)
and Supplemental data: | | | | | | | | | | | | | | | |
Expenses before expense reductions (f) | | 1.00 | | | 1.01 | | | 1.09 | | | 1.17 | | | 1.25 | (a) |
Expenses after expense reductions (f) | | 1.00 | | | 1.01 | | | 1.09 | | | 1.17 | | | 1.28 | (a)(e) |
Net investment income | | 1.72 | | | 1.81 | | | 1.56 | | | 1.82 | | | 2.09 | (a) |
Portfolio turnover | | 88 | | | 68 | | | 66 | | | 85 | | | 79 | |
Net assets at end of period (000 omitted) | | $476,076 | | | $148,343 | | | $178,238 | | | $109,993 | | | $53 | |
See Notes to Financial Statements
25
Financial Highlights – continued
| | | | | | | | | | | | | | | |
| Class 529A | | Years ended 8/31 | |
| | | 2009 | | | 2008 | | | 2007 | | | 2006 | | | 2005 | |
Net asset value, beginning of period | | $15.96 | | | $20.34 | | | $19.27 | | | $16.53 | | | $14.18 | |
| Income (loss) from investment operations | | | | | | | | | | | | | | | |
Net investment income (d) | | $0.21 | | | $0.26 | | | $0.20 | | | $0.16 | | | $0.10 | |
Net realized and unrealized gain (loss)
on investments and foreign currency | | (2.89 | ) | | (2.42 | ) | | 3.01 | | | 4.04 | | | 3.01 | |
Total from investment operations | | $(2.68 | ) | | $(2.16 | ) | | $3.21 | | | $4.20 | | | $3.11 | |
| Less distributions declared to shareholders | | | | | | | | | | | | | | | |
From net investment income | | $(0.19 | ) | | $(0.23 | ) | | $(0.20 | ) | | $(0.10 | ) | | $(0.08 | ) |
From net realized gain on investments | | (0.21 | ) | | (1.99 | ) | | (1.94 | ) | | (1.36 | ) | | (0.68 | ) |
Total distributions declared to shareholders | | $(0.40 | ) | | $(2.22 | ) | | $(2.14 | ) | | $(1.46 | ) | | $(0.76 | ) |
Net asset value, end of period | | $12.88 | | | $15.96 | | | $20.34 | | | $19.27 | | | $16.53 | |
Total return (%) (r)(s)(t) | | (16.32 | ) | | (12.60 | ) | | 17.51 | | | 26.86 | | | 22.35 | |
Ratios (%) (to average net assets)
and Supplemental data: | | | | | | | | | | | | | | | |
Expenses before expense reductions (f) | | 1.45 | | | 1.51 | | | 1.59 | | | 1.68 | | | 1.76 | |
Expenses after expense reductions (f) | | 1.45 | | | 1.51 | | | 1.59 | | | 1.68 | | | 1.79 | (e) |
Net investment income | | 1.90 | | | 1.40 | | | 1.01 | | | 0.88 | | | 0.65 | |
Portfolio turnover | | 88 | | | 68 | | | 66 | | | 85 | | | 79 | |
Net assets at end of period (000 omitted) | | $1,451 | | | $2,017 | | | $2,060 | | | $1,552 | | | $760 | |
| | | | | | | | | | | | | | | |
| Class 529B | | Years ended 8/31 | |
| | | 2009 | | | 2008 | | | 2007 | | | 2006 | | | 2005 | |
Net asset value, beginning of period | | $15.05 | | | $19.31 | | | $18.43 | | | $15.88 | | | $13.68 | |
| Income (loss) from investment operations | | | | | | | | | | | | | | | |
Net investment income (loss) (d) | | $0.12 | | | $0.15 | | | $0.08 | | | $0.03 | | | $(0.02 | ) |
Net realized and unrealized gain (loss)
on investments and foreign currency | | (2.74 | ) | | (2.30 | ) | | 2.86 | | | 3.89 | | | 2.91 | |
Total from investment operations | | $(2.62 | ) | | $(2.15 | ) | | $2.94 | | | $3.92 | | | $2.89 | |
| Less distributions declared to shareholders | | | | | | | | | | | | | | | |
From net investment income | | $(0.11 | ) | | $(0.12 | ) | | $(0.12 | ) | | $(0.01 | ) | | $(0.01 | ) |
From net realized gain on investments | | (0.21 | ) | | (1.99 | ) | | (1.94 | ) | | (1.36 | ) | | (0.68 | ) |
Total distributions declared to shareholders | | $(0.32 | ) | | $(2.11 | ) | | $(2.06 | ) | | $(1.37 | ) | | $(0.69 | ) |
Net asset value, end of period | | $12.11 | | | $15.05 | | | $19.31 | | | $18.43 | | | $15.88 | |
Total return (%) (r)(s)(t) | | (16.99 | ) | | (13.16 | ) | | 16.78 | | | 26.06 | | | 21.54 | |
Ratios (%) (to average net assets)
and Supplemental data: | | | | | | | | | | | | | | | |
Expenses before expense reductions (f) | | 2.15 | | | 2.16 | | | 2.24 | | | 2.33 | | | 2.42 | |
Expenses after expense reductions (f) | | 2.15 | | | 2.16 | | | 2.24 | | | 2.33 | | | 2.45 | (e) |
Net investment income (loss) | | 1.19 | | | 0.83 | | | 0.42 | | | 0.15 | | | (0.13 | ) |
Portfolio turnover | | 88 | | | 68 | | | 66 | | | 85 | | | 79 | |
Net assets at end of period (000 omitted) | | $449 | | | $616 | | | $581 | | | $356 | | | $174 | |
See Notes to Financial Statements
26
Financial Highlights – continued
| | | | | | | | | | | | | | | |
| Class 529C | | Years ended 8/31 | |
| | | 2009 | | | 2008 | | | 2007 | | | 2006 | | | 2005 | |
Net asset value, beginning of period | | $15.06 | | | $19.31 | | | $18.40 | | | $15.86 | | | $13.66 | |
| Income (loss) from investment operations | | | | | | | | | | | | | | | |
Net investment income (loss) (d) | | $0.13 | | | $0.13 | | | $0.08 | | | $0.03 | | | $(0.01 | ) |
Net realized and unrealized gain (loss)
on investments and foreign currency | | (2.75 | ) | | (2.28 | ) | | 2.86 | | | 3.87 | | | 2.90 | |
Total from investment operations | | $(2.62 | ) | | $(2.15 | ) | | $2.94 | | | $3.90 | | | $2.89 | |
| Less distributions declared to shareholders | | | | | | | | | | | | | | | |
From net investment income | | $(0.11 | ) | | $(0.11 | ) | | $(0.09 | ) | | $(0.00 | )(w) | | $(0.01 | ) |
From net realized gain on investments | | (0.21 | ) | | (1.99 | ) | | (1.94 | ) | | (1.36 | ) | | (0.68 | ) |
Total distributions declared to shareholders | | $(0.32 | ) | | $(2.10 | ) | | $(2.03 | ) | | $(1.36 | ) | | $(0.69 | ) |
Net asset value, end of period | | $12.12 | | | $15.06 | | | $19.31 | | | $18.40 | | | $15.86 | |
Total return (%) (r)(s)(t) | | (16.98 | ) | | (13.16 | ) | | 16.79 | | | 25.98 | | | 21.53 | |
Ratios (%) (to average net assets)
and Supplemental data: | | | | | | | | | | | | | | | |
Expenses before expense reductions (f) | | 2.15 | | | 2.16 | | | 2.24 | | | 2.33 | | | 2.42 | |
Expenses after expense reductions (f) | | 2.15 | | | 2.16 | | | 2.24 | | | 2.33 | | | 2.45 | (e) |
Net investment income (loss) | | 1.23 | | | 0.73 | | | 0.40 | | | 0.16 | | | (0.07 | ) |
Portfolio turnover | | 88 | | | 68 | | | 66 | | | 85 | | | 79 | |
Net assets at end of period (000 omitted) | | $631 | | | $843 | | | $938 | | | $650 | | | $454 | |
Any redemption fees charged by the fund during the 2005 fiscal year resulted in a per share impact of less than $0.01.
| (d) | Per share data is based on average shares outstanding. |
| (e) | Ratio includes a reimbursement fee for expenses borne by MFS in prior years under the then existing expense reimbursement agreement. |
| (f) | Ratios do not reflect reductions from fees paid indirectly, if applicable. |
| (g) | The per share amount varies from the net realized and unrealized gain/loss for the period because of the timing of sales of fund shares and the per share amount of realized and unrealized gains and losses at such time. |
| (i) | For the period from the class’ inception, April 1, 2005 (Classes R1, R3, and R4) and May 1, 2006 (Class W), through the stated period end. |
| (r) | Certain expenses have been reduced without which performance would have been lower. |
| (s) | From time to time the fund may receive proceeds from litigation settlements, without which performance would be lower. |
| (t) | Total returns do not include any applicable sales charges. |
| (w) | Per share amount was less than $0.01. |
See Notes to Financial Statements
27
NOTES TO FINANCIAL STATEMENTS
| (1) | | Business and Organization |
MFS Research International Fund (the fund) is a series of MFS Series Trust I (the trust). The trust is organized as a Massachusetts business trust and is registered under the Investment Company Act of 1940, as amended, as an open-end management investment company.
| (2) | | Significant Accounting Policies |
General – The preparation of financial statements in conformity with U.S. generally accepted accounting principles requires management to make estimates and assumptions that affect the reported amounts of assets and liabilities, and disclosure of contingent assets and liabilities at the date of the financial statements and the reported amounts of revenues and expenses during the reporting period. In making these estimates and assumptions, management has considered the effects, if any, of events occurring after the date of the fund’s Statement of Assets and Liabilities through October 16, 2009 which is the date that the financial statements were issued. Actual results could differ from those estimates. The fund can invest in foreign securities, including securities of emerging market issuers. Investments in foreign securities are vulnerable to the effects of changes in the relative values of the local currency and the U.S. dollar and to the effects of changes in each country’s legal, political, and economic environment. The markets of emerging markets countries are generally more volatile than the markets of developed countries with more mature economies. All of the risks of investing in foreign securities previously described are heightened when investing in emerging markets countries.
Investment Valuations – Equity securities, including restricted equity securities, are generally valued at the last sale or official closing price as provided by a third-party pricing service on the market or exchange on which they are primarily traded. For securities for which there were no sales reported that day, equity securities are generally valued at the last quoted daily bid quotation as provided by a third-party pricing service on the market or exchange on which such securities are primarily traded. For securities held short for which there were no sales reported for that day, the position is generally valued at the last quoted daily ask quotation as provided by a third-party pricing service on the market or exchange on which such securities are primarily traded. Short-term instruments with a maturity at issuance of 60 days or less generally are valued at amortized cost, which approximates market value. Open-end investment companies are generally valued at net asset value per share. Securities and other assets generally valued on the basis of information from a third-party pricing service may also be valued at a broker/dealer bid quotation. Values obtained from third-party pricing services can
28
Notes to Financial Statements – continued
utilize both transaction data and market information such as yield, quality, coupon rate, maturity, type of issue, trading characteristics, and other market data. The values of foreign securities and other assets and liabilities expressed in foreign currencies are converted to U.S. dollars using the mean of bid and asked prices for rates provided by a third-party pricing service.
The Board of Trustees has delegated primary responsibility for determining or causing to be determined the value of the fund’s investments (including any fair valuation) to the adviser pursuant to valuation policies and procedures approved by the Board. If the adviser determines that reliable market quotations are not readily available, investments are valued at fair value as determined in good faith by the adviser in accordance with such procedures under the oversight of the Board of Trustees. Under the fund’s valuation policies and procedures, market quotations are not considered to be readily available for most types of debt instruments and floating rate loans and many types of derivatives. These investments are generally valued at fair value based on information from third-party pricing services. In addition, investments may be valued at fair value if the adviser determines that an investment’s value has been materially affected by events occurring after the close of the exchange or market on which the investment is principally traded (such as foreign exchange or market) and prior to the determination of the fund’s net asset value, or after the halting of trading of a specific security where trading does not resume prior to the close of the exchange or market on which the security is principally traded. Events that occur on a frequent basis after foreign markets close (such as developments in foreign markets and significant movements in the U.S. markets) and prior to the determination of the fund’s net asset value may be deemed to have a material affect on the value of securities traded in foreign markets. Accordingly, the fund’s foreign equity securities may often be valued at fair value. The adviser generally relies on third-party pricing services or other information (such as the correlation with price movements of similar securities in the same or other markets; the type, cost and investment characteristics of the security; the business and financial condition of the issuer; and trading and other market data) to assist in determining whether to fair value and at what value to fair value an investment. The value of an investment for purposes of calculating the fund’s net asset value can differ depending on the source and method used to determine value. When fair valuation is used, the value of an investment used to determine the fund’s net asset value may differ from quoted or published prices for the same investment. There can be no assurance that the fund could obtain the fair value assigned to an investment if it were to sell the investment at the same time at which the fund determines its net asset value per share.
29
Notes to Financial Statements – continued
The fund adopted FASB Statement No. 157, Fair Value Measurements (the “Statement”). This Statement provides a single definition of fair value, a hierarchy for measuring fair value and expanded disclosures about fair value measurements.
Various inputs are used in determining the value of the fund’s assets or liabilities carried at market value. These inputs are categorized into three broad levels. In certain cases, the inputs used to measure fair value may fall into different levels of the fair value hierarchy. In such cases, an investment’s level within the fair value hierarchy is based on the lowest level of input that is significant to the fair value measurement. The fund’s assessment of the significance of a particular input to the fair value measurement in its entirety requires judgment, and considers factors specific to the investment. Level 1 includes unadjusted quoted prices in active markets for identical assets or liabilities. Level 2 includes other significant observable market-based inputs (including quoted prices for similar securities, interest rates, prepayment speed, and credit risk). Level 3 includes unobservable inputs, which may include the adviser’s own assumptions in determining the fair value of investments. Other financial instruments are derivative instruments not reflected in total investments, such as futures, forwards, swap contracts, and written options. The following is a summary of the levels used as of August 31, 2009 in valuing the fund’s assets or liabilities carried at market value:
| | | | | | | | |
| Investments at Value | | Level 1 | | Level 2 | | Level 3 | | Total |
| Equity Securities: | | | | | | | | |
United States | | $33,289,038 | | $— | | $— | | $33,289,038 |
Japan | | 557,714,504 | | — | | — | | 557,714,504 |
United Kingdom | | 132,960,884 | | 373,270,672 | | — | | 506,231,556 |
Switzerland | | 423,028,180 | | — | | — | | 423,028,180 |
France | | 386,283,714 | | — | | — | | 386,283,714 |
Germany | | 367,835,700 | | — | | — | | 367,835,700 |
Netherlands | | 230,958,383 | | — | | — | | 230,958,383 |
China | | 164,121,415 | | — | | — | | 164,121,415 |
Italy | | 116,996,135 | | — | | — | | 116,996,135 |
Hong Kong | | 92,566,436 | | — | | — | | 92,566,436 |
Other Countries | | 640,244,187 | | — | | — | | 640,244,187 |
| Mutual Funds | | 128,434,027 | | — | | — | | 128,434,027 |
| Total Investments | | $3,274,432,603 | | $373,270,672 | | $— | | $3,647,703,275 |
Country disclosure is based on the country of domicile. For further information regarding security characteristics, see the Portfolio of Investments.
Repurchase Agreements – The fund may enter into repurchase agreements with approved counterparties. Each repurchase agreement is recorded at cost. The fund requires that the securities collateral in a repurchase transaction be transferred to a custodian. The fund monitors, on a daily basis, the value of the collateral to ensure that its value, including accrued interest, is greater than
30
Notes to Financial Statements – continued
amounts owed to the fund under each such repurchase agreement. The fund and other funds managed by MFS may utilize a joint trading account for the purpose of entering into one or more repurchase agreements.
Foreign Currency Translation – Purchases and sales of foreign investments, income, and expenses are converted into U.S. dollars based upon currency exchange rates prevailing on the respective dates of such transactions or on the reporting date for foreign denominated receivables and payables. Gains and losses attributable to foreign currency exchange rates on sales of securities are recorded for financial statement purposes as net realized gains and losses on investments. Gains and losses attributable to foreign exchange rate movements on receivables, payables, income and expenses are recorded for financial statement purposes as foreign currency transaction gains and losses. That portion of both realized and unrealized gains and losses on investments that results from fluctuations in foreign currency exchange rates is not separately disclosed.
Derivatives – The fund may use derivatives for different purposes, including to earn income and enhance returns, to increase or decrease exposure to a particular market, to manage or adjust the risk profile of the fund, or as alternatives to direct investments. Derivatives may be used for hedging or non-hedging purposes. While hedging can reduce or eliminate losses, it can also reduce or eliminate gains. When the fund uses derivatives as an investment to increase market exposure, or for hedging purposes, gains and losses from derivative instruments may be substantially greater than the derivative’s original cost.
In this reporting period the fund adopted FASB Statement No. 161, Disclosure about Derivative Instruments and Hedging Activities (“FAS 161”), and FASB Staff Position FAS No. 133-1 and FIN 45-4, Disclosures about Credit Derivatives and Certain Guarantees: An Amendment of FASB Statement No. 133 and FASB Interpretation No. 45; and Clarification of the Effective Date of FAS 161 (“FSP FAS 133-1”).
FAS 161 amends FASB Statement No. 133, Accounting for Derivatives and Hedging Activities (“FAS 133”). FAS 161 provides enhanced disclosures about the fund’s use of and accounting for derivative instruments and the effect of derivative instruments on the fund’s results of operations and financial position. Under FAS 161, tabular disclosure regarding derivative fair value and gain/loss by contract type (e.g., interest rate contracts, foreign exchange contracts, credit contracts, etc.) is required and derivatives accounted for as hedging instruments under FAS 133 must be disclosed separately from derivatives that do not qualify for hedge accounting under FAS 133. Because investment companies account for their derivatives at fair value and record any changes in fair value in current period earnings, the fund’s derivatives are not
31
Notes to Financial Statements – continued
accounted for as hedging instruments under FAS 133. As such, even though the fund may use derivatives in an attempt to achieve an economic hedge, the fund’s derivatives are not considered to be hedging instruments under FAS 133.
FSP FAS 133-1 amends FAS 133 to require sellers of credit derivatives to make disclosures that will enable financial statement users to assess the potential effects of those credit derivatives on an entity’s financial position, financial performance and cash flows. As defined by FSP FAS 133-1, a credit derivative is a derivative instrument (a) in which one or more of the derivative’s underlyings are related to the credit risk of a specified entity (or group of entities) or an index based on the credit risk of a group of entities and (b) that exposes the seller to potential loss from credit-risk-related events specified in the derivative contract. The seller (or writer) is the party that provides the credit protection and assumes the credit risk on a credit derivatives contract, such as a credit default swap. There was no impact from implementing FSP 133-1 as the fund did not hold any of these credit derivatives at period end.
As defined under FAS 133, derivative instruments include written options, purchased options, futures contracts, forward foreign currency exchange contracts, and swap agreements. For the year ended August 31, 2009, the fund did not invest in any derivative instruments and accordingly there is no impact to the financial statements.
Derivative counterparty credit risk is managed through formal evaluation of the creditworthiness of all potential counterparties. On certain over-the-counter derivatives, the fund attempts to reduce its exposure to counterparty credit risk by entering into an International Swaps and Derivatives Association (ISDA) Master Agreement on a bilateral basis with each of the counterparties with whom it undertakes a significant volume of transactions. The ISDA Master Agreement gives each party to the agreement the right to terminate all transactions traded under such agreement if there is a certain deterioration in the credit quality of the other party. The ISDA Master Agreement gives the fund the right, upon an event of default by the applicable counterparty or a termination of the agreement, to close out all transactions traded under such agreement and to net amounts owed under each transaction to one net amount payable by one party to the other. This right to close out and net payments across all transactions traded under the ISDA Master Agreement could result in a reduction of the fund’s credit risk to such counterparty equal to any amounts payable by the fund under the applicable transactions, if any. However, absent an event of default by the counterparty or a termination of the agreement, the ISDA Master Agreement does not result in an offset of reported balance sheet assets and liabilities across transactions between the fund and the applicable counterparty.
32
Notes to Financial Statements – continued
Collateral requirements differ by type of derivative. Collateral or margin requirements are set by the broker or exchange clearing house for exchange traded derivatives (i.e., futures and exchange-traded options) while collateral terms are contract specific for over-the-counter traded derivatives (i.e., forwards, swaps and over-the-counter options). For derivatives traded under an ISDA Master Agreement, the collateral requirements are netted across all transactions traded under such agreement and one amount is posted from one party to the other to collateralize such obligations. Cash collateral that has been pledged to cover obligations of the fund under derivative contracts will be reported separately on the Statement of Assets and Liabilities as restricted cash. Securities collateral pledged for the same purpose is noted in the Portfolio of Investments.
Security Loans – State Street Bank and Trust Company (“State Street”), as lending agent, may loan the securities of the fund to certain qualified institutions (the “Borrowers”) approved by the fund. The loans are collateralized by cash and/or U.S. Treasury and federal agency obligations in an amount typically at least equal to the market value of the securities loaned. The market value of the loaned securities is determined at the close of business of the fund and any additional required collateral is delivered to the fund on the next business day. State Street provides the fund with indemnification against Borrower default. The fund bears the risk of loss with respect to the investment of cash collateral. On loans collateralized by cash, the cash collateral is invested in a money market fund or short-term securities. A portion of the income generated upon investment of the collateral is remitted to the Borrowers, and the remainder is allocated between the fund and the lending agent. On loans collateralized by U.S. Treasury and/or federal agency obligations, a fee is received from the Borrower, and is allocated between the fund and the lending agent. Income from securities lending is included in interest income on the Statement of Operations. The dividend and interest income earned on the securities loaned is accounted for in the same manner as other dividend and interest income.
Indemnifications – Under the fund’s organizational documents, its officers and Trustees may be indemnified against certain liabilities and expenses arising out of the performance of their duties to the fund. Additionally, in the normal course of business, the fund enters into agreements with service providers that may contain indemnification clauses. The fund’s maximum exposure under these agreements is unknown as this would involve future claims that may be made against the fund that have not yet occurred.
Investment Transactions and Income – Investment transactions are recorded on the trade date. Interest income is recorded on the accrual basis. All premium and discount is amortized or accreted for financial statement
33
Notes to Financial Statements – continued
purposes in accordance with U.S. generally accepted accounting principles. Dividends received in cash are recorded on the ex-dividend date. Certain dividends from foreign securities will be recorded when the fund is informed of the dividend if such information is obtained subsequent to the ex-dividend date. Dividend and interest payments received in additional securities are recorded on the ex-dividend or ex-interest date in an amount equal to the value of the security on such date.
The fund may receive proceeds from litigation settlements. Any proceeds received from litigation involving portfolio holdings are reflected in the Statement of Operations in realized gain/loss if the security has been disposed of by the fund or in unrealized gain/loss if the security is still held by the fund. Any other proceeds from litigation not related to portfolio holdings are reflected as other income in the Statement of Operations.
Fees Paid Indirectly – The fund’s custody fee may be reduced according to an arrangement that measures the value of cash deposited with the custodian by the fund. This amount, for the year ended August 31, 2009, is shown as a reduction of total expenses on the Statement of Operations.
Tax Matters and Distributions – The fund intends to qualify as a regulated investment company, as defined under Subchapter M of the Internal Revenue Code, and to distribute all of its taxable income, including realized capital gains. As a result, no provision for federal income tax is required. The fund’s federal tax returns for the prior three fiscal years remain subject to examination by the Internal Revenue Service. Foreign taxes, if any, have been accrued by the fund in the accompanying financial statements.
Distributions to shareholders are recorded on the ex-dividend date. Income and capital gain distributions are determined in accordance with income tax regulations, which may differ from U.S. generally accepted accounting principles. Certain capital accounts in the financial statements are periodically adjusted for permanent differences in order to reflect their tax character. These adjustments have no impact on net assets or net asset value per share. Temporary differences which arise from recognizing certain items of income, expense, gain or loss in different periods for financial statement and tax purposes will reverse at some time in the future. Distributions in excess of net investment income or net realized gains are temporary overdistributions for financial statement purposes resulting from differences in the recognition or classification of income or distributions for financial statement and tax purposes.
Book/tax differences primarily relate to wash sale loss deferrals, foreign currency transactions, and foreign taxes.
34
Notes to Financial Statements – continued
The tax character of distributions declared to shareholders for the last two fiscal years is as follows:
| | | | |
| | | 8/31/09 | | 8/31/08 |
| Ordinary income (including any short-term capital gains) | | $59,328,561 | | $240,162,138 |
| Long-term capital gain | | 56,492,868 | | 291,263,230 |
| Total distributions | | $115,821,429 | | $531,425,368 |
The federal tax cost and the tax basis components of distributable earnings were as follows:
| | | |
| As of 8/31/09 | | | |
| Cost of investments | | $3,581,741,306 | |
| Gross appreciation | | 274,546,936 | |
| Gross depreciation | | (208,584,967 | ) |
| Net unrealized appreciation (depreciation) | | $65,961,969 | |
| Undistributed ordinary income | | 59,822,798 | |
| Capital loss carryforwards | | (297,223,831 | ) |
| Post-October capital loss deferral | | (933,411,699 | ) |
| Other temporary differences | | (687,911 | ) |
As of August 31, 2009, the fund had capital loss carryforwards available to offset future realized gains. Such losses expire as follows:
Multiple Classes of Shares of Beneficial Interest – The fund offers multiple classes of shares, which differ in their respective distribution, service, and program manager fees. The fund’s income, realized and unrealized gain (loss), and common expenses are allocated to shareholders based on the daily net assets of each class. Dividends are declared separately for each class. Differences in per share dividend rates are generally due to differences in separate class expenses. Class B and Class 529B shares will convert to Class A and Class 529A shares, respectively, approximately eight years after purchase.
35
Notes to Financial Statements – continued
The fund’s distributions declared to shareholders as reported on the Statements of Changes in Net Assets are presented by class as follows:
| | | | | | | | |
| | | From net investment
income | | From net realized gain on
investments |
| | | Year ended
8/31/09 | | Year ended
8/31/08 | | Year ended
8/31/09 | | Year ended
8/31/08 |
| Class A | | $18,819,220 | | $24,604,312 | | $19,620,196 | | $174,293,392 |
| Class B | | 601,628 | | 1,030,603 | | 1,302,024 | | 16,827,896 |
| Class C | | 1,165,394 | | 1,739,242 | | 2,082,642 | | 21,468,759 |
| Class I | | 33,473,452 | | 37,355,589 | | 28,589,164 | | 210,826,466 |
| Class W | | 365,261 | | 216,508 | | 320,061 | | 1,264,835 |
| Class R (b) | | — | | 604,448 | | — | | 5,573,100 |
| Class R1 | | 74,958 | | 96,196 | | 115,869 | | 852,985 |
| Former Class R2 (b) | | — | | 122,398 | | — | | 882,123 |
| Class R2 | | 761,037 | | 573,074 | | 875,827 | | 4,444,628 |
| Class R3 | | 2,027,798 | | 977,680 | | 1,828,194 | | 6,702,136 |
| Class R4 | | 2,005,929 | | 2,945,015 | | 1,713,234 | | 17,627,647 |
| Class 529A | | 23,408 | | 24,040 | | 26,124 | | 205,867 |
| Class 529B | | 4,499 | | 3,843 | | 8,421 | | 62,050 |
| Class 529C | | 5,977 | | 5,236 | | 11,112 | | 95,300 |
| Total | | $59,328,561 | | $70,298,184 | | $56,492,868 | | $461,127,184 |
| (b) | At the close of business on April 18, 2008, Class R and Class R2 shares converted into Class R3 shares. Following this conversion, Class R3, Class R4, and Class R5 shares were renamed Class R2, Class R3, and Class R4 shares, respectively. |
| (3) | | Transactions with Affiliates |
Investment Adviser – The fund has an investment advisory agreement with MFS to provide overall investment management and related administrative services and facilities to the fund.
The management fee is computed daily and paid monthly at the following annual rates:
| | | |
| First $1.0 billion of average daily net assets | | 0.90 | % |
| Next $1.0 billion of average daily net assets | | 0.80 | % |
| Average daily net assets in excess of $2.0 billion | | 0.70 | % |
The management fee incurred for the year ended August 31, 2009 was equivalent to an annual effective rate of 0.80% of the fund’s average daily net assets.
The investment adviser has agreed in writing to pay a portion of the fund’s operating expenses, exclusive of management fee, distribution and service fee, program manager fees, interest, taxes, extraordinary expenses, brokerage and transaction costs and investment-related expenses, such that operating expenses do not exceed 0.40% annually of the fund’s average daily net assets.
36
Notes to Financial Statements – continued
This written agreement will continue until modified by the fund’s Board of Trustees, but such agreement will continue at least until December 31, 2010. For the year ended August 31, 2009, the fund’s actual operating expenses did not exceed the limit and therefore, the investment adviser did not pay any portion of the fund’s expenses.
Distributor – MFS Fund Distributors, Inc. (MFD), a wholly-owned subsidiary of MFS, as distributor, received $42,410 and $993 for the year ended August 31, 2009, as its portion of the initial sales charge on sales of Class A and Class 529A shares of the fund, respectively.
The Board of Trustees has adopted a distribution plan for certain class shares pursuant to Rule 12b-1 of the Investment Company Act of 1940.
The fund’s distribution plan provides that the fund will pay MFD for services provided by MFD and financial intermediaries in connection with the distribution and servicing of certain share classes. One component of the plan is a distribution fee paid to MFD and another component of the plan is a service fee paid to MFD. MFD may subsequently pay all, or a portion, of the distribution and/or service fees to financial intermediaries.
Distribution Plan Fee Table:
| | | | | | | | | | |
| | | Distribution
Fee Rate (d) | | Service
Fee Rate (d) | | Total
Distribution
Plan (d) | | Annual
Effective
Rate (e) | | Distribution
and Service
Fee |
| Class A | | — | | 0.25% | | 0.25% | | 0.30% | | $3,071,850 |
| Class B | | 0.75% | | 0.25% | | 1.00% | | 1.00% | | 597,977 |
| Class C | | 0.75% | | 0.25% | | 1.00% | | 1.00% | | 1,013,515 |
| Class W | | 0.10% | | — | | 0.10% | | 0.10% | | 17,125 |
| Class R1 | | 0.75% | | 0.25% | | 1.00% | | 1.00% | | 56,504 |
| Class R2 | | 0.25% | | 0.25% | | 0.50% | | 0.50% | | 250,667 |
| Class R3 | | — | | 0.25% | | 0.25% | | 0.25% | | 228,814 |
| Class 529A | | — | | 0.25% | | 0.25% | | 0.30% | | 3,933 |
| Class 529B | | 0.75% | | 0.25% | | 1.00% | | 1.00% | | 4,037 |
| Class 529C | | 0.75% | | 0.25% | | 1.00% | | 1.00% | | 5,560 |
| Total Distribution and Service Fees | | | | | | | | $5,249,982 |
| (d) | As of August 31, 2009, in accordance with the distribution plan for certain classes, the fund pays distribution and/or service fees equal to these annual percentage rates of each class’ average daily net assets. The distribution and service fee rates disclosed by class represent the current rates in effect at the end of the reporting period. Any rate changes, if applicable, are detailed below. |
| (e) | The annual effective rates represent actual fees incurred under the distribution plan for the year ended August 31, 2009 based on each class’ average daily net assets. Prior to March 1, 2009, a 0.10% Class A distribution fee was paid by the fund. Prior to March 1, 2009, the distribution fee rate for Class 529A was 0.25%, of which 0.10% was paid by the fund and the remaining 0.15% was not in effect. Effective March 1, 2009, the 0.10% Class A and 0.25% Class 529A annual distribution fees were eliminated. |
Certain Class A shares purchased prior to September 1, 2008 are subject to a contingent deferred sales charge (CDSC) in the event of a shareholder
37
Notes to Financial Statements – continued
redemption within 12 months of purchase. Certain Class A shares purchased on or subsequent to September 1, 2008 are subject to a CDSC in the event of a shareholder redemption within 24 months of purchase. Class C and Class 529C shares are subject to a CDSC in the event of a shareholder redemption within 12 months of purchase. Class B and Class 529B shares are subject to a CDSC in the event of a shareholder redemption within six years of purchase. All contingent deferred sales charges are paid to MFD and during the year ended August 31, 2009, were as follows:
| | |
| | | Amount |
| Class A | | $38 |
| Class B | | 107,275 |
| Class C | | 23,090 |
| Class 529B | | 177 |
| Class 529C | | — |
The fund has entered into and may from time to time enter into contracts with program managers and other parties which administer the tuition programs through which an investment in the fund’s 529 share classes is made. The fund has entered into an agreement with MFD pursuant to which MFD receives an annual fee of up to 0.10% of the average daily net assets attributable to each 529 share class. The services provided by MFD, or a third party with which MFD contracts, include recordkeeping and tax reporting and account services, as well as services designed to maintain the program’s compliance with the Internal Revenue Code and other regulatory requirements. Program manager fees for the year ended August 31, 2009, were as follows:
| | |
| | | Amount |
| Class 529A | | $1,302 |
| Class 529B | | 404 |
| Class 529C | | 557 |
| Total Program Manager Fees | | $2,263 |
Shareholder Servicing Agent – MFS Service Center, Inc. (MFSC), a wholly-owned subsidiary of MFS, receives a fee from the fund for its services as shareholder servicing agent calculated as a percentage of the average daily net assets of the fund as determined periodically under the supervision of the fund’s Board of Trustees. For the year ended August 31, 2009, the fee was $587,535, which equated to 0.0199% annually of the fund’s average daily net assets. MFSC also receives payment from the fund for out-of-pocket expenses, sub-accounting and other shareholder servicing costs which may be paid to affiliated and unaffiliated service providers. For the year ended August 31, 2009, these out-of-pocket expenses, sub-accounting and other shareholder servicing costs amounted to $2,324,261.
Under a Special Servicing Agreement among MFS, each MFS fund which invests in other MFS funds (“MFS fund-of-funds”) and certain underlying
38
Notes to Financial Statements – continued
funds in which a MFS fund-of-funds invests (“underlying funds”), each underlying fund may pay a portion of each MFS fund-of-fund’s transfer agent-related expenses, including sub-accounting fees payable to financial intermediaries, to the extent such payments do not exceed the benefits realized or expected to be realized by the underlying fund from the investment in the underlying fund by the MFS fund-of-fund. For the year ended August 31, 2009, these costs for the fund amounted to $1,639,899 and are reflected in the shareholder servicing costs on the Statement of Operations.
Administrator – MFS provides certain financial, legal, shareholder communications, compliance, and other administrative services to the fund. Under an administrative services agreement, the fund partially reimburses MFS the costs incurred to provide these services. The fund is charged an annual fixed amount of $17,500 plus a fee based on average daily net assets. The administrative services fee incurred for the year ended August 31, 2009 was equivalent to an annual effective rate of 0.0197% of the fund’s average daily net assets.
Trustees’ and Officers’ Compensation – The fund pays compensation to independent Trustees in the form of a retainer, attendance fees, and additional compensation to Board and Committee chairpersons. The fund does not pay compensation directly to Trustees or officers of the fund who are also officers of the investment adviser, all of whom receive remuneration for their services to the fund from MFS. Certain officers and Trustees of the fund are officers or directors of MFS, MFD, and MFSC.
Prior to December 31, 2001, the fund had an unfunded defined benefit plan (“DB plan”) for independent Trustees. As of December 31, 2001, the Board took action to terminate the DB plan with respect to then-current and any future independent Trustees, such that the DB Plan covers only certain of those former independent Trustees who retired on or before December 31, 2001. Effective January 1, 2002, accrued benefits under the DB Plan for then current independent Trustees who continued were credited to an unfunded retirement deferral plan (the “Retirement Deferral plan”), which was established for and exists solely with respect to these credited amounts, and is not available for other deferrals by these or other independent Trustees. The DB Plan resulted in a pension expense of $516 and the Retirement Deferral plan resulted in a net decrease in expense of $6,681. Both amounts are included in independent Trustees’ compensation for the year ended August 31, 2009. The liability for deferred retirement benefits payable to certain independent Trustees under both Plans amounted to $22,851 at August 31, 2009, and is included in payable for independent Trustees’ compensation on the Statement of Assets and Liabilities.
39
Notes to Financial Statements – continued
Other – This fund and certain other funds managed by MFS (the funds) have entered into services agreements (the Agreements) which provide for payment of fees by the funds to Tarantino LLC and Griffin Compliance LLC in return for the provision of services of an Independent Chief Compliance Officer (ICCO) and Assistant ICCO, respectively, for the funds. The ICCO and Assistant ICCO are officers of the funds and the sole members of Tarantino LLC and Griffin Compliance LLC, respectively. The funds can terminate the Agreements with Tarantino LLC and Griffin Compliance LLC at any time under the terms of the Agreements. For the year ended August 31, 2009, the aggregate fees paid by the fund to Tarantino LLC and Griffin Compliance LLC were $37,126 and are included in miscellaneous expense on the Statement of Operations. MFS has agreed to reimburse the fund for a portion of the payments made by the fund in the amount of $18,974, which is shown as a reduction of total expenses in the Statement of Operations. Additionally, MFS has agreed to bear all expenses associated with office space, other administrative support, and supplies provided to the ICCO and Assistant ICCO.
The fund may invest in a money market fund managed by MFS which seeks a high level of current income consistent with preservation of capital and liquidity. Income earned on this investment is included in dividends from underlying funds on the Statement of Operations. This money market fund does not pay a management fee to MFS.
Purchases and sales of investments, other than U.S. Government securities, purchased option transactions, and short-term obligations, aggregated $2,707,411,187 and $2,675,905,222, respectively.
40
Notes to Financial Statements – continued
| (5) | | Shares of Beneficial Interest |
The fund’s Declaration of Trust permits the Trustees to issue an unlimited number of full and fractional shares of beneficial interest. Transactions in fund shares were as follows:
| | | | | | | | |
| | | Year ended
8/31/09 | | Year ended
8/31/08 |
| | | Shares | | Amount | | Shares | | Amount |
| Shares sold | | | | | | | | |
Class A | | 57,089,748 | | $651,028,968 | | 40,909,810 | | $788,291,475 |
Class B | | 606,117 | | 6,433,584 | | 1,155,325 | | 21,309,901 |
Class C | | 1,761,317 | | 18,200,415 | | 3,194,326 | | 58,838,670 |
Class I | | 43,002,783 | | 492,844,984 | | 25,825,039 | | 491,701,724 |
Class W | | 1,940,854 | | 20,748,533 | | 739,980 | | 13,790,463 |
Class R (b) | | — | | — | | 1,053,409 | | 20,771,600 |
Class R1 | | 192,747 | | 1,966,129 | | 402,027 | | 7,395,891 |
Former Class R2 (b) | | — | | — | | 433,413 | | 8,277,088 |
Class R2 | | 2,226,873 | | 23,864,850 | | 5,494,019 | | 102,043,429 |
Class R3 | | 9,161,620 | | 101,894,308 | | 1,544,491 | | 29,584,151 |
Class R4 | | 31,977,909 | | 368,441,033 | | 3,090,111 | | 59,051,834 |
Class 529A | | 22,059 | | 238,803 | | 26,333 | | 487,269 |
Class 529B | | 3,547 | | 38,043 | | 11,732 | | 209,939 |
Class 529C | | 12,320 | | 121,927 | | 7,936 | | 142,819 |
| | 147,997,894 | | $1,685,821,577 | | 83,887,951 | | $1,601,896,253 |
| Shares issued to shareholders in reinvestment of distributions | | | | | | | | |
Class A | | 2,339,975 | | $25,599,320 | | 6,971,064 | | $137,469,374 |
Class B | | 152,830 | | 1,598,607 | | 794,830 | | 14,966,642 |
Class C | | 185,169 | | 1,918,356 | | 787,794 | | 14,723,865 |
Class I | | 4,852,081 | | 54,634,430 | | 11,742,363 | | 238,252,550 |
Class W | | 54,152 | | 590,258 | | 71,572 | | 1,408,544 |
Class R (b) | | — | | — | | 252,655 | | 4,949,508 |
Class R1 | | 17,083 | | 174,419 | | 51,390 | | 949,181 |
Former Class R2 (b) | | — | | — | | 54,123 | | 1,004,521 |
Class R2 | | 127,339 | | 1,359,979 | | 260,389 | | 5,017,702 |
Class R3 | | 355,391 | | 3,855,992 | | 391,628 | | 7,679,816 |
Class R4 | | 339,960 | | 3,719,163 | | 1,043,238 | | 20,572,662 |
Class 529A | | 4,578 | | 49,532 | | 11,619 | | 226,793 |
Class 529B | | 1,263 | | 12,920 | | 3,564 | | 65,893 |
Class 529C | | 1,669 | | 17,089 | | 5,434 | | 100,536 |
| | 8,431,490 | | $93,530,065 | | 22,441,663 | | $447,387,587 |
41
Notes to Financial Statements – continued
| | | | | | | | | | | | |
| | | Year ended
8/31/09 | | | Year ended
8/31/08 | |
| | | Shares | | | Amount | | | Shares | | | Amount | |
| Shares reacquired | | | | | | | | | | | | |
Class A | | (63,995,315 | ) | | $(690,563,452 | ) | | (35,230,304 | ) | | $(680,578,099 | ) |
Class B | | (3,502,910 | ) | | (36,143,427 | ) | | (4,155,633 | ) | | (75,916,494 | ) |
Class C | | (4,029,911 | ) | | (41,401,443 | ) | | (3,194,394 | ) | | (56,020,640 | ) |
Class I | | (69,594,402 | ) | | (733,568,181 | ) | | (11,965,615 | ) | | (237,835,617 | ) |
Class W | | (1,212,941 | ) | | (12,778,436 | ) | | (280,466 | ) | | (4,865,459 | ) |
Class R (b) | | — | | | — | | | (4,698,135 | ) | | (90,757,342 | ) |
Class R1 | | (281,811 | ) | | (2,885,069 | ) | | (140,656 | ) | | (2,460,526 | ) |
Former Class R2 (b) | | — | | | — | | | (747,774 | ) | | (13,292,349 | ) |
Class R2 | | (3,702,118 | ) | | (46,414,385 | ) | | (1,414,415 | ) | | (25,131,800 | ) |
Class R3 | | (3,047,997 | ) | | (32,042,160 | ) | | (1,215,494 | ) | | (22,747,995 | ) |
Class R4 | | (5,002,416 | ) | | (55,566,180 | ) | | (3,621,534 | ) | | (67,475,294 | ) |
Class 529A | | (40,306 | ) | | (422,830 | ) | | (12,839 | ) | | (245,811 | ) |
Class 529B | | (8,701 | ) | | (80,772 | ) | | (4,455 | ) | | (73,162 | ) |
Class 529C | | (17,943 | ) | | (171,533 | ) | | (5,946 | ) | | (107,347 | ) |
| | (154,436,771 | ) | | $(1,652,037,868 | ) | | (66,687,660 | ) | | $(1,277,507,935 | ) |
| Net change | | | | | | | | | | | | |
Class A | | (4,565,592 | ) | | $(13,935,164 | ) | | 12,650,570 | | | $245,182,750 | |
Class B | | (2,743,963 | ) | | (28,111,236 | ) | | (2,205,478 | ) | | (39,639,951 | ) |
Class C | | (2,083,425 | ) | | (21,282,672 | ) | | 787,726 | | | 17,541,895 | |
Class I | | (21,739,538 | ) | | (186,088,767 | ) | | 25,601,787 | | | 492,118,657 | |
Class W | | 782,065 | | | 8,560,355 | | | 531,086 | | | 10,333,548 | |
Class R (b) | | — | | | — | | | (3,392,071 | ) | | (65,036,234 | ) |
Class R1 | | (71,981 | ) | | (744,521 | ) | | 312,761 | | | 5,884,546 | |
Former Class R2 (b) | | — | | | — | | | (260,238 | ) | | (4,010,740 | ) |
Class R2 | | (1,347,906 | ) | | (21,189,556 | ) | | 4,339,993 | | | 81,929,331 | |
Class R3 | | 6,469,014 | | | 73,708,140 | | | 720,625 | | | 14,515,972 | |
Class R4 | | 27,315,453 | | | 316,594,016 | | | 511,815 | | | 12,149,202 | |
Class 529A | | (13,669 | ) | | (134,495 | ) | | 25,113 | | | 468,251 | |
Class 529B | | (3,891 | ) | | (29,809 | ) | | 10,841 | | | 202,670 | |
Class 529C | | (3,954 | ) | | (32,517 | ) | | 7,424 | | | 136,008 | |
| | 1,992,613 | | | $127,313,774 | | | 39,641,954 | | | $771,775,905 | |
| (b) | At the close of business on April 18, 2008, Class R and Class R2 shares converted into Class R3 shares. Following this conversion, Class R3, Class R4, and Class R5 shares were renamed Class R2, Class R3, and Class R4 shares, respectively. |
The fund is one of several mutual funds in which the MFS funds-of-funds may invest. The MFS funds-of-funds do not invest in the underlying MFS funds for the purpose of exercising management or control. At the end of the period, the MFS International Diversification Fund, MFS Growth Allocation Fund, MFS Moderate Allocation Fund, MFS Aggressive Growth Allocation Fund, and MFS Conservative Allocation Fund were the owners of record of approximately 17%, 5%, 3%, 2%, and 1%, respectively, of the value of outstanding voting
42
Notes to Financial Statements – continued
shares of the fund. In addition, the MFS Lifetime 2010 Fund, MFS Lifetime 2020 Fund, MFS Lifetime 2030 Fund, MFS Lifetime 2040 Fund, and MFS Lifetime Retirement Income Fund were each the owners of record of less than 1% of the value of outstanding voting shares of the fund.
The fund and certain other funds managed by MFS participate in a $1.1 billion unsecured committed line of credit, subject to a $1 billion sublimit, provided by a syndication of banks under a credit agreement. Borrowings may be made for temporary financing needs. Interest is charged to each fund, based on its borrowings, generally at a rate equal to the higher of the Federal Reserve funds rate or one month LIBOR plus an agreed upon spread. A commitment fee, based on the average daily, unused portion of the committed line of credit, is allocated among the participating funds at the end of each calendar quarter. In addition, the fund and other funds managed by MFS have established unsecured uncommitted borrowing arrangements with certain banks for temporary financing needs. Interest is charged to each fund, based on its borrowings, at a rate equal to the Federal Reserve funds rate plus an agreed upon spread. For the year ended August 31, 2009, the fund’s commitment fee and interest expense were $35,151 and $0, respectively, and are included in miscellaneous expense on the Statement of Operations.
| (7) | | Transactions in Underlying Funds-Affiliated Issuers |
An affiliated issuer may be considered one in which the fund owns 5% or more of the outstanding voting securities, or a company which is under common control. For the purposes of this report, the fund assumes the following to be affiliated issuers:
| | | | | | | | | |
| Underlying Funds | | Beginning
Shares/Par
Amount | | Acquisitions
Shares/Par
Amount | | Dispositions
Shares/Par
Amount | | | Ending
Shares/Par
Amount |
MFS Institutional Money
Market Portfolio | | — | | 827,194,617 | | (725,332,879 | ) | | 101,861,738 |
| | | | |
| Underlying Funds | | Realized
Gain (Loss) | | Capital Gain
Distributions | | Dividend
Income | | | Ending
Value |
MFS Institutional Money
Market Portfolio | | $— | | $— | | $67,617 | | | $101,861,738 |
43
REPORT OF INDEPENDENT REGISTERED PUBLIC ACCOUNTING FIRM
To the Board of Trustees of MFS Series Trust I and Shareholders of MFS Research International Fund:
We have audited the accompanying statement of assets and liabilities of MFS Research International Fund (the Fund) (one of the portfolios comprising MFS Series Trust I), including the portfolio of investments, as of August 31, 2009, and the related statement of operations for the year then ended, the statements of changes in net assets for each of the two years in the period then ended, and the financial highlights for each of the periods indicated therein. These financial statements and financial highlights are the responsibility of the Fund’s management. Our responsibility is to express an opinion on these financial statements and financial highlights based on our audits.
We conducted our audits in accordance with the standards of the Public Company Accounting Oversight Board (United States). Those standards require that we plan and perform the audit to obtain reasonable assurance about whether the financial statements and financial highlights are free of material misstatement. We were not engaged to perform an audit of the Fund’s internal control over financial reporting. Our audits included consideration of internal control over financial reporting as a basis for designing audit procedures that are appropriate in the circumstances, but not for the purpose of expressing an opinion on the effectiveness of the Fund’s internal control over financial reporting. Accordingly, we express no such opinion. An audit also includes examining, on a test basis, evidence supporting the amounts and disclosures in the financial statements and financial highlights, assessing the accounting principles used and significant estimates made by management, and evaluating the overall financial statement presentation. Our procedures included confirmation of securities owned as of August 31, 2009, by correspondence with the custodian and brokers or by other appropriate auditing procedures where replies from brokers were not received. We believe that our audits provide a reasonable basis for our opinion.
In our opinion, the financial statements and financial highlights referred to above present fairly, in all material respects, the financial position of the MFS Research International Fund at August 31, 2009, the results of its operations for the year then ended, the changes in its net assets for each of the two years in the period then ended, and its financial highlights for each of the periods indicated therein, in conformity with U.S. generally accepted accounting principles.

Boston, Massachusetts
October 16, 2009
44
TRUSTEES AND OFFICERS —
IDENTIFICATION AND BACKGROUND
The Trustees and officers of the Trust, as of October 1, 2009, are listed below, together with their principal occupations during the past five years. (Their titles may have varied during that period.) The address of each Trustee and officer is 500 Boylston Street, Boston, Massachusetts 02116.
| | | | | | |
Name, Date of Birth | | Position(s) Held
with Fund | | Trustee/Officer
Since (h) | | Principal Occupations During
the Past Five Years & Other
Directorships (j) |
| INTERESTED TRUSTEES | | | | |
Robert J. Manning (k)
(born 10/20/63) | | Trustee | | February 2004 | | Massachusetts Financial Services Company, Chief Executive Officer, President, Chief Investment Officer and Director |
Robert C. Pozen (k)
(born 8/08/46) | | Trustee | | February 2004 | | Massachusetts Financial Services Company, Chairman (since February 2004); Medtronic, Inc, (medical devices), Director (since 2004); Harvard Business School (education), Senior Lecturer (since 2008); Bell Canada Enterprises (telecommunications), Director (until February 2009); The Bank of New York, Director (finance), (March 2004 to May 2005); Telesat (satellite communications), Director (until November 2007) |
| INDEPENDENT TRUSTEES | | | | |
David H. Gunning
(born 5/30/42) | | Trustee and Chair of Trustees | | January 2004 | | Retired; Cleveland-Cliffs Inc. (mining products and service provider), Vice Chairman/Director (until May 2007); Lincoln Electric Holdings, Inc. (welding equipment manufacturer), Director; Development Alternatives, Inc. (consulting), Director/Non Executive Chairman; Southwest Gas Corp. (natural gas distribution), Director (until May 2004); Portman Limited (mining), Director (until 2008) |
45
Trustees and Officers – continued
| | | | | | |
Name, Date of Birth | | Position(s) Held
with Fund | | Trustee/Officer
Since (h) | | Principal Occupations During
the Past Five Years & Other
Directorships (j) |
Robert E. Butler (n)
(born 11/29/41) | | Trustee | | January 2006 | | Consultant – investment company industry regulatory and compliance matters (since July 2002); PricewaterhouseCoopers LLP (professional services firm), Partner (until 2002) |
Lawrence H. Cohn, M.D.
(born 3/11/37) | | Trustee | | June 1989 | | Brigham and Women’s Hospital, Senior Cardiac Surgeon (since 2005); Harvard Medical School, Professor of Cardiac Surgery; Partners HealthCare, Physician Director of Medical Device Technology (since 2006); Brigham and Women’s Hospital, Chief of Cardiac Surgery (until 2005) |
Maureen R. Goldfarb
(born 4/6/55) | | Trustee | | January 2009 | | Private investor; John Hancock Financial Services, Inc., Executive Vice President (until 2004); John Hancock Mutual Funds, Trustee and Chief Executive Officer (until 2004) |
William R. Gutow
(born 9/27/41) | | Trustee | | December 1993 | | Private investor and real estate consultant; Capital Entertainment Management Company (video franchise), Vice Chairman; Atlantic Coast Tan (tanning salons), Vice Chairman (until 2007); Texas Donuts (donut franchise), Vice Chairman (until 2009) |
Michael Hegarty
(born 12/21/44) | | Trustee | | December 2004 | | Private investor; Retired; AXA Financial (financial services and insurance), Vice Chairman and Chief Operating Officer (until 2001); The Equitable Life Assurance Society (insurance), President and Chief Operating Officer (until 2001) |
J. Atwood Ives
(born 5/01/36) | | Trustee | | February 1992 | | Private investor; KeySpan Corporation (energy related services), Director (until 2004) |
46
Trustees and Officers – continued
| | | | | | |
Name, Date of Birth | | Position(s) Held
with Fund | | Trustee/Officer
Since (h) | | Principal Occupations During
the Past Five Years & Other
Directorships (j) |
John P. Kavanaugh
(born 11/4/54) | | Trustee | | January 2009 | | Private investor; The Hanover Insurance Group, Inc., Vice President and Chief Investment Officer (until 2006); Allmerica Investment Trust, Allmerica Securities Trust and Opus Investment Trust (investment companies), Chairman, President and Trustee (until 2006) |
J. Dale Sherratt
(born 9/23/38) | | Trustee | | June 1989 | | Insight Resources, Inc. (acquisition planning specialists), President; Wellfleet Investments (investor in health care companies), Managing General Partner |
Laurie J. Thomsen
(born 8/05/57) | | Trustee | | March 2005 | | New Profit, Inc. (venture philanthropy), Executive Partner (since 2006); Private investor; Prism Venture Partners (venture capital), Co-founder and General Partner (until June 2004); The Travelers Companies (commercial property liability insurance), Director |
Robert W. Uek
(born 5/18/41) | | Trustee | | January 2006 | | Consultant to investment company industry; PricewaterhouseCoopers LLP (professional services firm), Partner (until 1999); TT International Funds (mutual fund complex), Trustee (until 2005); Hillview Investment Trust II Funds (mutual fund complex), Trustee (until 2005) |
| OFFICERS | | | | | | |
Maria F. Dwyer (k)
(born 12/01/58) | | President | | November 2005 | | Massachusetts Financial Services Company, Executive Vice President and Chief Regulatory Officer (since March 2004) Chief Compliance Officer (since December 2006); Fidelity Management & Research Company, Vice President (prior to March 2004); Fidelity Group of Funds, President and Treasurer (until March 2004) |
47
Trustees and Officers – continued
| | | | | | |
Name, Date of Birth | | Position(s) Held
with Fund | | Trustee/Officer
Since (h) | | Principal Occupations During
the Past Five Years & Other
Directorships (j) |
Christopher R. Bohane (k)
(born 1/18/74) | | Assistant Secretary and Assistant Clerk | | July 2005 | | Massachusetts Financial Services Company, Vice President and Senior Counsel |
John M. Corcoran (k)
(born 04/13/65) | | Treasurer | | October 2008 | | Massachusetts Financial Services Company, Senior Vice President (since October 2008); State Street Bank and Trust (financial services provider), Senior Vice President, (until September 2008) |
Ethan D. Corey (k)
(born 11/21/63) | | Assistant Secretary and Assistant Clerk | | July 2005 | | Massachusetts Financial Services Company, Senior Vice President and Associate General Counsel (since 2004); Dechert LLP (law firm), Counsel (prior to December 2004) |
David L. DiLorenzo (k)
(born 8/10/68) | | Assistant Treasurer | | July 2005 | | Massachusetts Financial Services Company, Vice President (since June 2005); JP Morgan Investor Services, Vice President (until June 2005) |
Timothy M. Fagan (k)
(born 7/10/68) | | Assistant Secretary and Assistant Clerk | | September 2005 | | Massachusetts Financial Services Company, Vice President and Senior Counsel (since September 2005); John Hancock Advisers, LLC, Vice President, Senior Attorney and Chief Compliance Officer (until August 2005) |
Mark D. Fischer (k)
(born 10/27/70) | | Assistant Treasurer | | July 2005 | | Massachusetts Financial Services Company, Vice President (since May 2005); JP Morgan Investment Management Company, Vice President (until May 2005) |
Robyn L. Griffin
(born 7/04/75) | | Assistant Independent Chief Compliance Officer | | August 2008 | | Griffin Compliance LLC (provider of compliance services), Principal (since August 2008); State Street Corporation (financial services provider), Mutual Fund Administration Assistant Vice President (October 2006 – July 2008); Liberty Mutual Group (insurance), Personal Market Assistant Controller (April 2006 – October 2006); Deloitte & Touche LLP (professional services firm), Senior Manager (prior to April 2006) |
48
Trustees and Officers – continued
| | | | | | |
Name, Date of Birth | | Position(s) Held
with Fund | | Trustee/Officer
Since (h) | | Principal Occupations During
the Past Five Years & Other
Directorships (j) |
Brian E. Langenfeld (k)
(born 3/07/73) | | Assistant Secretary and Assistant Clerk | | June 2006 | | Massachusetts Financial Services Company, Vice President and Senior Counsel (since May 2006); John Hancock Advisers, LLC, Assistant Vice President and Counsel (until April 2006) |
Ellen Moynihan (k)
(born 11/13/57) | | Assistant Treasurer | | April 1997 | | Massachusetts Financial Services Company, Senior Vice President |
Susan S. Newton (k)
(born 3/07/50) | | Assistant Secretary and Assistant Clerk | | May 2005 | | Massachusetts Financial Services Company, Senior Vice President and Associate General Counsel (since April 2005); John Hancock Advisers, LLC, Senior Vice President, Secretary and Chief Legal Officer (until April 2005) |
Susan A. Pereira (k)
(born 11/05/70) | | Assistant Secretary and Assistant Clerk | | July 2005 | | Massachusetts Financial Services Company, Vice President and Senior Counsel (since June 2004); Bingham McCutchen LLP (law firm), Associate (until June 2004) |
Mark N. Polebaum (k)
(born 5/01/52) | | Secretary and Clerk | | January 2006 | | Massachusetts Financial Services Company, Executive Vice President, General Counsel and Secretary (since January 2006); Wilmer Cutler Pickering Hale and Dorr LLP (law firm), Partner (until January 2006) |
Frank L. Tarantino
(born 3/07/44) | | Independent Chief Compliance Officer | | June 2004 | | Tarantino LLC (provider of compliance services), Principal (since June 2004); CRA Business Strategies Group (consulting services), Executive Vice President (until June 2004) |
Richard S. Weitzel (k)
(born 7/16/70) | | Assistant Secretary and Assistant Clerk | | October 2007 | | Massachusetts Financial Services Company, Vice President and Assistant General Counsel (since 2004); Massachusetts Department of Business and Technology, General Counsel (until April 2004) |
James O. Yost (k)
(born 6/12/60) | | Assistant Treasurer | | September 1990 | | Massachusetts Financial Services Company, Senior Vice President |
| (h) | Date first appointed to serve as Trustee/officer of an MFS fund. Each Trustee has served continuously since appointment unless indicated otherwise. For the period from December 15, 2004 until February 22, 2005, Messrs. Pozen and Manning served as Advisory Trustees. For the period March 2008 until October 2008, Ms. Dwyer served as Treasurer of the Funds. |
49
Trustees and Officers – continued
| (j) | Directorships or trusteeships of companies required to report to the Securities and Exchange Commission (i.e., “public companies”). |
| (k) | “Interested person” of the Trust within the meaning of the Investment Company Act of 1940 (referred to as the 1940 Act), which is the principal federal law governing investment companies like the fund, as a result of position with MFS. The address of MFS is 500 Boylston Street, Boston, Massachusetts 02116. |
| (n) | In 2004 and 2005, Mr. Butler provided consulting services to the independent compliance consultant retained by MFS pursuant to its settlement with the SEC concerning market timing and related matters. The terms of that settlement required that compensation and expenses related to the independent compliance consultant be borne exclusively by MFS and, therefore, MFS paid Mr. Butler for the services he rendered to the independent compliance consultant. In 2004 and 2005, MFS paid Mr. Butler a total of $351,119.29. |
Each Trustee (except Messrs. Butler, Kavanaugh and Uek and Ms. Goldfarb) has been elected by shareholders and each Trustee and officer holds office until his or her successor is chosen and qualified or until his or her earlier death, resignation, retirement or removal. The Trust held a shareholders’ meeting in 2005 to elect Trustees, and will hold a shareholders’ meeting at least once every five years thereafter, to elect Trustees. Messrs. Butler, Kavanaugh, Sherratt, Uek and Ms. Thomsen are members of the Trust’s Audit Committee.
Each of the Fund’s Trustees and officers holds comparable positions with certain other funds of which MFS or a subsidiary is the investment adviser or distributor, and, in the case of the officers, with certain affiliates of MFS. As of January 1, 2009, the Trustees served as board members of 104 funds within the MFS Family of Funds.
The Statement of Additional Information for the Fund and further information about the Trustees are available without charge upon request by calling 1-800-225-2606.
| | |
| Investment Adviser | | Custodian |
Massachusetts Financial Services Company
500 Boylston Street, Boston, MA 02116-3741 | | State Street Bank and Trust
1 Lincoln Street, Boston, MA 02111-2900 |
| Distributor | | Independent Registered Public Accounting Firm |
MFS Fund Distributors, Inc.
500 Boylston Street, Boston, MA 02116-3741 | | Ernst & Young LLP
200 Clarendon Street, Boston, MA 02116 |
| Portfolio Managers | | |
| Jose Luis Garcia | | |
| Thomas Melendez | | |
50
BOARD REVIEW OF INVESTMENT ADVISORY AGREEMENT
The Investment Company Act of 1940 requires that both the full Board of Trustees and a majority of the non-interested (“independent”) Trustees, voting separately, annually approve the continuation of the Fund’s investment advisory agreement with MFS. The Trustees consider matters bearing on the Fund and its advisory arrangements at their meetings throughout the year, including a review of performance data at each regular meeting. In addition, the independent Trustees met several times over the course of three months beginning in May and ending in July, 2009 (“contract review meetings”) for the specific purpose of considering whether to approve the continuation of the investment advisory agreement for the Fund and the other investment companies that the Board oversees (the “MFS Funds”). The independent Trustees were assisted in their evaluation of the Fund’s investment advisory agreement by independent legal counsel, from whom they received separate legal advice and with whom they met separately from MFS during various contract review meetings. The independent Trustees were also assisted in this process by the MFS Funds’ Independent Chief Compliance Officer, a full-time senior officer appointed by and reporting to the independent Trustees.
In connection with their deliberations regarding the continuation of the investment advisory agreement, the Trustees, including the independent Trustees, considered such information and factors as they believed, in light of the legal advice furnished to them and their own business judgment, to be relevant. The investment advisory agreement for the Fund was considered separately, although the Trustees also took into account the common interests of all MFS Funds in their review. As described below, the Trustees considered the nature, quality, and extent of the various investment advisory, administrative, and shareholder services performed by MFS under the existing investment advisory agreement and other arrangements with the Fund.
In connection with their contract review meetings, the Trustees received and relied upon materials that included, among other items: (i) information provided by Lipper Inc., an independent third party, on the investment performance of the Fund for various time periods ended December 31, 2008 and the investment performance of a group of funds with substantially similar investment classifications/objectives (the “Lipper performance universe”), (ii) information provided by Lipper Inc. on the Fund’s advisory fees and other expenses and the advisory fees and other expenses of comparable funds identified by Lipper Inc. (the “Lipper expense group”), (iii) information provided by MFS on the advisory fees of comparable portfolios of other clients of MFS, including institutional separate accounts and other clients, (iv) information as to whether and to what extent applicable expense waivers,
51
Board Review of Investment Advisory Agreement – continued
reimbursements or fee “breakpoints” are observed for the Fund, (v) information regarding MFS’ financial results and financial condition, including MFS’ and certain of its affiliates’ estimated profitability from services performed for the Fund and the MFS Funds as a whole, (vi) MFS’ views regarding the outlook for the mutual fund industry and the strategic business plans of MFS, (vii) descriptions of various functions performed by MFS for the Funds, such as compliance monitoring and portfolio trading practices, and (viii) information regarding the overall organization of MFS, including information about MFS’ senior management and other personnel providing investment advisory, administrative and other services to the Fund and the other MFS Funds. The comparative performance, fee and expense information prepared and provided by Lipper Inc. was not independently verified and the independent Trustees did not independently verify any information provided to them by MFS.
The Trustees’ conclusion as to the continuation of the investment advisory agreement was based on a comprehensive consideration of all information provided to the Trustees and not the result of any single factor. Some of the factors that figured particularly in the Trustees’ deliberations are described below, although individual Trustees may have evaluated the information presented differently from one another, giving different weights to various factors. It is also important to recognize that the fee arrangements for the Fund and other MFS Funds are the result of years of review and discussion between the independent Trustees and MFS, that certain aspects of such arrangements may receive greater scrutiny in some years than in others, and that the Trustees’ conclusions may be based, in part, on their consideration of these same arrangements during the course of the year and in prior years.
Based on information provided by Lipper Inc., the Trustees reviewed the Fund’s total return investment performance as well as the performance of peer groups of funds over various time periods. The Trustees placed particular emphasis on the total return performance of the Fund’s Class A shares in comparison to the performance of funds in its Lipper performance universe over the three-year period ended December 31, 2008, which the Trustees believed was a long enough period to reflect differing market conditions. The total return performance of the Fund’s Class A shares was in the 2nd quintile relative to the other funds in the universe for this three-year period (the 1st quintile being the best performers and the 5th quintile being the worst performers). The total return performance of the Fund’s Class A shares was in the 3rd quintile for the one-year period and the 2nd quintile for the five-year period ended December 31, 2008 relative to the Lipper performance universe. Because of the passage of time, these performance results are likely to differ from the performance results for more recent periods, including those shown elsewhere in this report.
52
Board Review of Investment Advisory Agreement – continued
In the course of their deliberations, the Trustees took into account information provided by MFS in connection with the contract review meetings, as well as during investment review meetings conducted with portfolio management personnel during the course of the year regarding the Fund’s performance. After reviewing these and related factors, the Trustees concluded, within the context of their overall conclusions regarding the investment advisory agreement, that they were satisfied with MFS’ responses and efforts relating to investment performance.
In assessing the reasonableness of the Fund’s advisory fee, the Trustees considered, among other information, the Fund’s advisory fee and the total expense ratio of the Fund’s Class A shares as a percentage of average daily net assets and the advisory fee and total expense ratios of peer groups of funds based on information provided by Lipper Inc. The Trustees considered that MFS currently observes an expense limitation for the Fund. The Trustees also considered that, according to the Lipper data (which takes into account any fee reductions or expense limitations that were in effect during the fund’s last fiscal year), the Fund’s effective advisory fee rate and total expense ratio were each lower than the Lipper expense group median.
The Trustees also considered the advisory fees charged by MFS to institutional accounts. In comparing these fees, the Trustees considered information provided by MFS as to the generally broader scope of services provided by MFS to the Fund in comparison to institutional accounts, the higher demands placed on MFS’ investment personnel and trading infrastructure as a result of the daily cash in-flows and out-flows of the Fund, and the impact on MFS and expenses associated with the more extensive regulatory regime to which the Fund is subject in comparison to institutional accounts.
The Trustees also considered whether the Fund is likely to benefit from any economies of scale in the management of the Fund in the event of growth in assets of the Fund. They noted that the Fund’s advisory fee rate schedule is currently subject to contractual breakpoints that reduce the Fund’s advisory fee rate on average daily net assets over $1 billion and $2 billion. The Trustees concluded that the existing breakpoints were sufficient to allow the Fund to benefit from economies of scale as its assets grow.
The Trustees also considered information prepared by MFS relating to MFS’ costs and profits with respect to the Fund, the MFS Funds considered as a group, and other investment companies and accounts advised by MFS, as well as MFS’ methodologies used to determine and allocate its costs to the MFS Funds, the Fund and other accounts and products for purposes of estimating profitability.
After reviewing these and other factors described herein, the Trustees concluded, within the context of their overall conclusions regarding the
53
Board Review of Investment Advisory Agreement – continued
investment advisory agreement, that the advisory fees charged to the Fund represent reasonable compensation in light of the services being provided by MFS to the Fund.
In addition, the Trustees considered MFS’ resources and related efforts to continue to retain, attract and motivate capable personnel to serve the Fund. The Trustees also considered current and developing conditions in the financial services industry, including the entry into the industry of large and well-capitalized companies which are spending, and appear to be prepared to continue to spend, substantial sums to engage personnel and to provide services to competing investment companies. In this regard, the Trustees also considered the financial resources of MFS and its ultimate parent, Sun Life Financial Inc. The Trustees also considered the advantages and possible disadvantages to the Fund of having an adviser that also serves other investment companies as well as other accounts.
The Trustees also considered the nature, quality, cost, and extent of administrative, transfer agency, and distribution services provided to the Fund by MFS and its affiliates under agreements and plans other than the investment advisory agreement, including any 12b-1 fees the Fund pays to MFS Fund Distributors, Inc., an affiliate of MFS. The Trustees also considered the nature, extent and quality of certain other services MFS performs or arranges for on the Fund’s behalf, which may include securities lending programs, directed expense payment programs, class action recovery programs, and MFS’ interaction with third-party service providers, principally custodians and sub-custodians. The Trustees concluded that the various non-advisory services provided by MFS and its affiliates on behalf of the Funds were satisfactory.
The Trustees also considered benefits to MFS from the use of the Fund’s portfolio brokerage commissions, if applicable, to pay for investment research and other similar services, and various other factors. Additionally, the Trustees considered so-called “fall-out benefits” to MFS such as reputational value derived from serving as investment manager to the Fund.
Based on their evaluation of factors that they deemed to be material, including those factors described above, the Board of Trustees, including a majority of the independent Trustees, concluded that the Fund’s investment advisory agreement with MFS should be continued for an additional one-year period, commencing August 1, 2009.
A discussion regarding the Board’s most recent review and renewal of the fund’s Investment Advisory Agreement with MFS will be available on or about November 1, 2009 by clicking on the fund’s name under “Mutual Funds” in the “Products and Performance” section of the MFS Web site (mfs.com).
54
PROXY VOTING POLICIES AND INFORMATION
A general description of the MFS funds’ proxy voting policies and procedures is available without charge, upon request, by calling
1-800-225-2606, by visiting the Proxy Voting section of mfs.com or by visiting the SEC’s Web site at http://www.sec.gov.
Information regarding how the fund voted proxies relating to portfolio securities during the most recent twelve-month period ended June 30, 2008 is available without charge by visiting the Proxy Voting section of mfs.com or by visiting the SEC’s Web site at http://www.sec.gov.
QUARTERLY PORTFOLIO DISCLOSURE
The fund will file a complete schedule of portfolio holdings with the Securities and Exchange Commission (the Commission) for the first and third quarters of each fiscal year on Form N-Q. The fund’s Form N-Q may be reviewed and copied at the:
Public Reference Room
Securities and Exchange Commission
100 F Street, NE, Room 1580
Washington, D.C. 20549
Information on the operation of the Public Reference Room may be obtained by calling the Commission at 1-800-SEC-0330. The fund’s Form N-Q is available on the EDGAR database on the Commission’s Internet Web site at http://www.sec.gov, and copies of this information may be obtained, upon payment of a duplicating fee, by electronic request at the following e-mail address: publicinfo@sec.gov or by writing the Public Reference Section at the above address.
A shareholder can also obtain the quarterly portfolio holdings report at mfs.com.
FURTHER INFORMATION
From time to time, MFS may post important information about the fund or the MFS funds on the MFS web site (mfs.com). This information is available by visiting the “News & Commentary” section of mfs.com or by clicking on the fund’s name under “Mutual Funds” in the “Products and Performance” section of mfs.com.
FEDERAL TAX INFORMATION (unaudited)
The fund will notify shareholders of amounts for use in preparing 2009 income tax forms in January 2010. The following information is provided pursuant to provisions of the Internal Revenue Code.
The fund designates the maximum amount allowable as qualified dividend income eligible for the 15% tax rate.
The fund designates $62,143,000 as capital gain dividends paid during the fiscal year.
Income derived from foreign sources was $90,540,294. The fund intends to pass through foreign tax credits of $7,709,596 for the fiscal year.
55
MFS® PRIVACY NOTICE
Privacy is a concern for every investor today. At MFS Investment Management® and the MFS funds, we take this concern very seriously. We want you to understand our policies about the investment products and services that we offer, and how we protect the nonpublic personal information of investors who have a direct relationship with us and our wholly owned subsidiaries.
Throughout our business relationship, you provide us with personal information. We maintain information and records about you, your investments, and the services you use. Examples of the nonpublic personal information we maintain include
| | Ÿ | | data from investment applications and other forms |
| | Ÿ | | share balances and transactional history with us, our affiliates, or others |
| | Ÿ | | facts from a consumer reporting agency |
We do not disclose any nonpublic personal information about our customers or former customers to anyone, except as permitted by law. We may share nonpublic personal information with third parties or certain of our affiliates in connection with servicing your account or processing your transactions. We may share information with companies or financial institutions that perform marketing services on our behalf or with other financial institutions with which we have joint marketing arrangements, subject to any legal requirements.
Authorization to access your nonpublic personal information is limited to appropriate personnel who provide products, services, or information to you. We maintain physical, electronic, and procedural safeguards to help protect the personal information we collect about you.
If you have any questions about the MFS privacy policy, please call 1-800-225-2606 any business day between 8 a.m. and 8 p.m. Eastern time.
Note: If you own MFS products or receive MFS services in the name of a third party such as a bank or broker-dealer, their privacy policy may apply to you instead of ours.
56
CONTACT US
| | |
Web site mfs.com MFS TALK 1-800-637-8255 24 hours a day Account service and literature Shareholders 1-800-225-2606 Investment professionals 1-800-343-2829 Retirement plan services 1-800-637-1255 | | Mailing address MFS Service Center, Inc. P.O. Box 55824 Boston, MA 02205-5824 Overnight mail MFS Service Center, Inc. c/o Boston Financial Data Services 30 Dan Road Canton, MA 02021-2809 |

Save paper with eDelivery. MFS® will send you prospectuses, reports, and proxies directly via e-mail so you will get information faster with less mailbox clutter. To sign up: 1. go to mfs.com. 2. log in via MFS® Access. 3. select eDelivery. If you own your MFS fund shares through a financial institution or a retirement plan, MFS® TALK, MFS Access, and eDelivery may not be available to you.


MFS® Technology Fund
SIPC Contact Information:
You may obtain information about the Securities Investor Protection Corporation (“SIPC”), including the SIPC Brochure, by contacting SIPC either by telephone (202-371-8300) or by accessing SIPC’s website address (www.sipc.org).
The report is prepared for the general information of shareholders. It is authorized for distribution to prospective investors only when preceded or accompanied by a current prospectus.
NOT FDIC INSURED Ÿ MAY LOSE VALUE Ÿ
NO BANK GUARANTEE
8/31/09
SCT-ANN

LETTER FROM THE CEO
Dear Shareholders:
In the fall of 2008, the markets took investors on what was perhaps the most tumultuous ride of their lives. Many are now debating when the market will stage a sustainable recovery, but not even the most experienced investor can provide a definitive answer to that question.
Even so, the basic rules of investing have not changed, and the turbulence reinforced the benefits of investing through the waves. Investors who jumped ship early on may have regretted their decisions when the markets gained some traction in the early half of this year. While anyone with a short-term horizon may have needed to take some action, most with longer-term goals probably found the best option was to stick with their long-term strategy.
At MFS® we believe investors are always best served by developing a plan with their investment professionals that addresses specific long-term needs. Most advisors agree that yearly reviews are important to monitor a plan’s progress. Most would also caution their clients against reacting too quickly to the daily news. When markets do recover, they often gain ground in quick, sudden bursts. If you are out of the market, you can easily miss the benefits of these rallies.
Few of us would again like to live through the kind of market turmoil we saw over the past year. But as turbulent as markets were, in our view, they proved that the fundamental principles of long-term investing still apply.
Respectfully,

Robert J. Manning
Chief Executive Officer and Chief Investment Officer
MFS Investment Management®
October 15, 2009
The opinions expressed in this letter are subject to change, may not be relied upon for investment advice, and no forecasts can be guaranteed.
1
PORTFOLIO COMPOSITION
Portfolio structure (i)
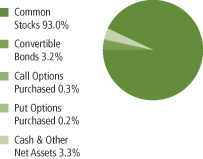
| | |
| Top ten holdings (i) | | |
| Samsung Electronics Co. Ltd., GDR | | 7.1% |
| Apple, Inc. | | 5.4% |
| Google, Inc., “A” | | 5.4% |
| Flextronics International Ltd. | | 5.1% |
| Hewlett-Packard Co. | | 4.6% |
| MicroStrategy, Inc., “A” | | 4.0% |
| Dell, Inc. | | 3.6% |
| Intel Corp. | | 3.5% |
| Tyco Electronics Ltd. | | 3.0% |
| Cisco Systems, Inc. | | 2.8% |
| | |
| Top five industries (i) | | |
| Electronics | | 25.2% |
| Computer Systems | | 19.6% |
| Computer Software | | 15.4% |
| Business Services | | 9.2% |
| Network & Telecom | | 5.8% |
| (i) | For purposes of this presentation, the bond component includes accrued interest amounts and may be positively or negatively impacted by the equivalent exposure from any derivative holdings, if applicable. |
Percentages are based on net assets as of 8/31/09.
The portfolio is actively managed and current holdings may be different.
2
MANAGEMENT REVIEW
Summary of Results
For the twelve months ended August 31, 2009, Class A shares of the MFS Technology Fund provided a total return of –11.24%, at net asset value. This compares with a return of –18.25% for the fund’s benchmark, the Standard & Poor’s 500 Stock Index, and a return of –10.32% for the fund’s other benchmark, the Standard & Poor’s North American Technology Sector Index.
Market Environment
The global economy and financial markets experienced substantial deterioration and extraordinary volatility over most of the reporting period. Through the first quarter of 2009, the strong headwinds in the U.S. included accelerated deterioration in the housing market, anemic corporate investment, a rapidly declining job market, and a much tighter credit environment. During the early stages of the period, a seemingly continuous series of tumultuous financial events hammered markets. As a result of this barrage of turbulent news, global equity markets pushed significantly lower and credit markets witnessed the worst market decline since the beginning of the credit crisis. The synchronized global downturn in economic activity experienced in the fourth quarter of 2008 and the first quarter of 2009 was among the most intense in the post-World War II period. Not only did Europe and Japan fall into very deep recessions, but an increasingly powerful engine of global growth — emerging markets — also contracted almost across the board. Though credit conditions and equity indices improved considerably during the second half of the period, the degree of financial and macroeconomic dislocation remained significant.
During the first half of the reporting period, the Fed continued to cut interest rates aggressively towards zero, while making increasing use of its new lending facilities to alleviate ever-tightening credit markets. On the fiscal front, the U.S. Treasury designed and began implementing a massive fiscal stimulus package. As inflationary concerns diminished in the face of global deleveraging, and equity and credit markets deteriorated more sharply, central banks around the world also cut interest rates dramatically. Policy makers in different countries increasingly sought to coordinate their rescue efforts, which resulted in a number of international actions such as the agreement of swap lines between the Federal Reserve and a number of other central banks and a substantial increase in the financial resources of the International Monetary Fund. By the middle of the period, several central banks had approached their lower bound on policy rates and were examining the implementation and ramifications of quantitative easing as a means to further loosen monetary policy to offset the continuing fall in global economic activity. However, by the
3
Management Review – continued
end of the period, there emerged broadening signs that the worst of the global macroeconomic deterioration had passed, which caused the subsequent rise in asset valuations. As asset prices rebounded in the second half of the period and the demand for liquidity waned, the debate concerning monetary exit strategies had begun, creating added uncertainty regarding the forward path of policy rates.
Detractors from Performance
Stock selection in the electronics industry held back performance relative to the Standard & Poor’s North American Technology Sector Index. Detractors within this industry included electronic device maker RF Microdevices (g), electronics design and manufacturing services provider Flextronics (aa) (Singapore), solar power equipment maker GT Solar International (aa)(g), solar electric power modules manufacturer First Solar (aa), and silicon wafers maker MEMC Electronic Materials.
The fund’s overweighted position and stock selection in the leisure and toys industry also hurt relative performance. Gaming software developer Take-Two Interactive (g) and entertainment software company THQ weighed on relative returns as these stocks underperformed the benchmark over the reporting period.
Stock selection in the computer systems industry had a negative impact on relative results. Japanese video game console maker Nintendo (aa) was among the fund’s top detractors. Shares of Nintendo suffered after the company cut its earnings and game console sales forecasts, casting doubt over growth prospects for at a company that had previously defied the global financial crisis.
The fund’s exposure to the special products industry, which is not represented in the benchmark, also hindered relative returns. No individual stocks within this industry were among the fund’s top detractors.
Stocks in other industries that also hurt relative returns included packaged software firm MSC Software (aa) and mobile phone maker Nokia (aa)(g) (Finland).
Contributors to Performance
Stock selection and, to a lesser extent, an underweighted position in the weak-performing network and telecom industry were positive factors contributing to the fund’s relative return. The fund’s timing of its purchases and sales of communications networking company Ciena and our holdings of wireless solutions provider Research In Motion (g) (Canada) benefited relative results. Although the stock price of Research In Motion declined sharply during the reporting period, strong performance from the fund’s holdings of the company’s call options for part of the period more than offset the negative effect of the long position in the stock.
4
Management Review – continued
Stock selection in the computer software industry also aided relative results. Internet software services provider Akamai Technologies (g) and access infrastructure products manufacturer Citrix Systems (g) were among the fund’s top contributors. In addition, a combination of short positioning and holding put options on publishing software company Adobe Systems early in the reporting period boosted relative returns as the company underperformed the benchmark.
Stock selection in the print and publishing and electrical equipment industries bolstered relative performance. Within the print and publishing industry, holdings of put options on financial data and software firm FactSet Research Systems (g) provided positive relative returns. There were no top relative contributors within the electrical equipment industry.
Elsewhere, microchip and electronics manufacturer Samsung Electronics (aa) (South Korea) and network chip maker Marvell Technology Group (aa) pushed relative returns higher. During the first quarter of 2009, Marvell Technology Group raised expectations for the coming quarter and announced cost cutting initiatives, including layoffs, in response to the deteriorating economic conditions. Our timing of purchases and sales of diversified technology company Corning Incorporated (g), and not owning computer maker Dell for the majority of the reporting period, during which the company’s stock declined, also helped relative results.
Respectfully,
Telis Bertsekas
Portfolio Manager
| (aa) | Security is not a benchmark constituent. |
| (g) | Security was not held in the portfolio at period end. |
The views expressed in this report are those of the portfolio manager only through the end of the period of the report as stated on the cover and do not necessarily reflect the views of MFS or any other person in the MFS organization. These views are subject to change at any time based on market or other conditions, and MFS disclaims any responsibility to update such views. These views may not be relied upon as investment advice or an indication of trading intent on behalf of any MFS portfolio. References to specific securities are not recommendations of such securities, and may not be representative of any MFS portfolio’s current or future investments.
5
PERFORMANCE SUMMARY THROUGH 8/31/09
The following chart illustrates a representative class of the fund's historical performance in comparison to its benchmark(s). Performance results include the deduction of the maximum applicable sales charge and reflect the percentage change in net asset value, including reinvestment of dividends and capital gains distributions. The performance of other share classes will be greater than or less than that of the class depicted below. Benchmarks are unmanaged and may not be invested in directly. Benchmark returns do not reflect sales charges, commissions or expenses. (See Notes to Performance Summary.)
Performance data shown represents past performance and is no guarantee of future results. Investment return and principal value fluctuate so your shares, when sold, may be worth more or less than the original cost; current performance may be lower or higher than quoted. The performance shown does not reflect the deduction of taxes, if any, that a shareholder would pay on fund distributions or the redemption of fund shares.
Growth of a Hypothetical $10,000 Investment
6
Performance Summary – continued
Total Returns through 8/31/09
Average annual without sales charge
| | | | | | | | | | | | | | |
| | | Share class | | Class inception date | | 1-yr | | 5-yr | | 10-yr | | Life (t) | | |
| | | A | | 1/02/97 | | (11.24)% | | 7.51% | | (2.73)% | | N/A | | |
| | | B | | 4/14/00 | | (11.84)% | | 6.80% | | N/A | | (6.31)% | | |
| | | C | | 4/14/00 | | (11.86)% | | 6.81% | | N/A | | (6.33)% | | |
| | | I | | 1/02/97 | | (10.95)% | | 7.88% | | (2.37)% | | N/A | | |
| | | R1 | | 4/01/05 | | (11.80)% | | N/A | | N/A | | 6.06% | | |
| | | R2 | | 10/31/03 | | (11.43)% | | 7.21% | | N/A | | 3.67% | | |
| | | R3 | | 4/01/05 | | (11.16)% | | N/A | | N/A | | 6.83% | | |
| | | R4 | | 4/01/05 | | (10.89)% | | N/A | | N/A | | 7.15% | | |
| Comparative benchmarks | | | | | | | | | | |
| | | Standard & Poor’s 500 Stock Index (f) | | (18.25)% | | 0.49% | | (0.79)% | | N/A | | |
| | | Standard & Poor’s North American
Technology Sector Index (f) | | (10.32)% | | 4.30% | | (4.56)% | | N/A | | |
| Average annual with sales charge | | | | | | | | | | |
| | | A
With Initial Sales Charge (5.75%) | | (16.34)% | | 6.25% | | (3.31)% | | N/A | | |
| | | B
With CDSC (Declining over six years from 4% to 0%) (x) | | (15.37)% | | 6.49% | | N/A | | (6.31)% | | |
| | | C
With CDSC (1% for 12 months) (x) | | (12.75)% | | 6.81% | | N/A | | (6.33)% | | |
Class I, R1, R2, R3, and R4 shares do not have a sales charge.
CDSC – Contingent Deferred Sales Charge.
| (f) | Source: FactSet Research Systems Inc. |
| (t) | For the period from the commencement of the class’ inception date through the stated period end. (For those share classes with less than 10 years of performance history). No comparative benchmark information is provided for “life” periods. (See Notes to Performance Summary below.) |
| (x) | Assuming redemption at the end of the applicable period. |
Benchmark Definitions
Standard & Poor’s 500 Stock Index – a market capitalization-weighted index of 500 widely held equity securities, designed to measure broad U.S. equity performance.
Standard & Poor’s North American Technology Sector Index – a modified market capitalization- weighted index that measures the performance of selected technology stocks.
It is not possible to invest directly in an index.
7
Performance Summary – continued
Notes to Performance Summary
Average annual total return represents the average annual change in value for each share class for the periods presented. Life returns are presented where the share class has less than 10 years of performance history and represent the average annual total return from the class inception date to the stated period end date. As the fund’s share classes may have different inception dates, the life returns may represent different time periods and may not be comparable. As a result, no comparative benchmark performance information is provided for life periods.
Performance results reflect any applicable expense subsidies and waivers in effect during the periods shown. Without such subsidies and waivers the fund’s performance results would be less favorable. Please see the prospectus and financial statements for complete details.
From time to time the fund may receive proceeds from litigation settlements, without which performance would be lower.
8
EXPENSE TABLE
Fund expenses borne by the shareholders during the period,
March 1, 2009 through August 31, 2009
As a shareholder of the fund, you incur two types of costs: (1) transaction costs, including sales charges (loads) on certain purchase or redemption payments, and (2) ongoing costs, including management fees; distribution and service (12b-1) fees; and other fund expenses. This example is intended to help you understand your ongoing costs (in dollars) of investing in the fund and to compare these costs with the ongoing costs of investing in other mutual funds.
The example is based on an investment of $1,000 invested at the beginning of the period and held for the entire period March 1, 2009 through August 31, 2009.
Actual Expenses
The first line for each share class in the following table provides information about actual account values and actual expenses. You may use the information in this line, together with the amount you invested, to estimate the expenses that you paid over the period. Simply divide your account value by $1,000 (for example, an $8,600 account value divided by $1,000 = 8.6), then multiply the result by the number in the first line under the heading entitled “Expenses Paid During Period” to estimate the expenses you paid on your account during this period.
Hypothetical Example for Comparison Purposes
The second line for each share class in the following table provides information about hypothetical account values and hypothetical expenses based on the fund’s actual expense ratio and an assumed rate of return of 5% per year before expenses, which is not the fund’s actual return. The hypothetical account values and expenses may not be used to estimate the actual ending account balance or expenses you paid for the period. You may use this information to compare the ongoing costs of investing in the fund and other funds. To do so, compare this 5% hypothetical example with the 5% hypothetical examples that appear in the shareholder reports of the other funds.
9
Expense Table – continued
Please note that the expenses shown in the table are meant to highlight your ongoing costs only and do not reflect any transactional costs, such as sales charges (loads). Therefore, the second line for each share class in the table is useful in comparing ongoing costs only, and will not help you determine the relative total costs of owning different funds. In addition, if these transactional costs were included, your costs would have been higher.
| | | | | | | | | | |
Share
Class | | | | Annualized
Expense
Ratio | | Beginning
Account Value
3/01/09 | | Ending
Account Value
8/31/09 | | Expenses
Paid During
Period (p)
3/01/09-8/31/09 |
| A | | Actual | | 1.42% | | $1,000.00 | | $1,650.75 | | $9.49 |
| | Hypothetical (h) | | 1.42% | | $1,000.00 | | $1,018.05 | | $7.22 |
| B | | Actual | | 2.17% | | $1,000.00 | | $1,646.13 | | $14.47 |
| | Hypothetical (h) | | 2.17% | | $1,000.00 | | $1,014.27 | | $11.02 |
| C | | Actual | | 2.17% | | $1,000.00 | | $1,645.57 | | $14.47 |
| | Hypothetical (h) | | 2.17% | | $1,000.00 | | $1,014.27 | | $11.02 |
| I | | Actual | | 1.17% | | $1,000.00 | | $1,652.74 | | $7.82 |
| | Hypothetical (h) | | 1.17% | | $1,000.00 | | $1,019.31 | | $5.96 |
| R1 | | Actual | | 2.17% | | $1,000.00 | | $1,646.59 | | $14.48 |
| | Hypothetical (h) | | 2.17% | | $1,000.00 | | $1,014.27 | | $11.02 |
| R2 | | Actual | | 1.67% | | $1,000.00 | | $1,648.94 | | $11.15 |
| | Hypothetical (h) | | 1.67% | | $1,000.00 | | $1,016.79 | | $8.49 |
| R3 | | Actual | | 1.42% | | $1,000.00 | | $1,650.75 | | $9.49 |
| | Hypothetical (h) | | 1.42% | | $1,000.00 | | $1,018.05 | | $7.22 |
| R4 | | Actual | | 1.17% | | $1,000.00 | | $1,653.39 | | $7.82 |
| | Hypothetical (h) | | 1.17% | | $1,000.00 | | $1,019.31 | | $5.96 |
| (h) | 5% class return per year before expenses. |
| (p) | Expenses paid is equal to each class’ annualized expense ratio, as shown above, multiplied by the average account value over the period, multiplied by the number of days in the period, divided by the number of days in the year. Expenses paid do not include any applicable sales charges (loads). If these transaction costs had been included, your costs would have been higher. |
10
PORTFOLIO OF INVESTMENTS
8/31/09
The Portfolio of Investments is a complete list of all securities owned by your fund. It is categorized by broad-based asset classes.
| | | | | |
| Common Stocks - 93.0% | | | | | |
| Issuer | | Shares/Par | | Value ($) |
| | | | | |
| Business Services - 9.2% | | | | | |
| Cognizant Technology Solutions Corp., “A” (a) | | 88,140 | | $ | 3,074,321 |
| Concur Technologies, Inc. (a) | | 49,400 | | | 1,746,784 |
| Fidelity National Information Services, Inc. | | 69,400 | | | 1,704,464 |
| MasterCard, Inc., “A” | | 13,740 | | | 2,784,136 |
| Pegasystems, Inc. | | 41,690 | | | 1,276,965 |
| Western Union Co. | | 141,330 | | | 2,549,593 |
| | | | | |
| | | | | $ | 13,136,263 |
| Computer Software - 14.3% | | | | | |
| Adobe Systems, Inc. (a) | | 91,800 | | $ | 2,884,356 |
| MicroStrategy, Inc., “A” (a)(s) | | 92,040 | | | 5,683,470 |
| MSC.Software Corp. (a) | | 450,369 | | | 3,413,797 |
| Oracle Corp. | | 170,600 | | | 3,731,022 |
| Parametric Technology Corp. (a) | | 239,220 | | | 3,181,626 |
| VeriSign, Inc. (a) | | 68,226 | | | 1,445,709 |
| | | | | |
| | | | | $ | 20,339,980 |
| Computer Software - Systems - 19.6% | | | | | |
| Apple, Inc. (a)(s) | | 45,740 | | $ | 7,693,925 |
| Dell, Inc. (a) | | 321,150 | | | 5,083,805 |
| Hewlett-Packard Co. (s) | | 146,520 | | | 6,577,283 |
| Mercadolibre, Inc. (a) | | 81,300 | | | 2,558,511 |
| Nintendo Co. Ltd. | | 8,675 | | | 2,345,653 |
| OpenTable, Inc. (a) | | 36,900 | | | 1,019,547 |
| VMware, Inc. (a) | | 74,100 | | | 2,625,363 |
| | | | | |
| | | | | $ | 27,904,087 |
| Consumer Services - 3.2% | | | | | |
| Alibaba.com Corp. (z) | | 655,500 | | $ | 1,627,237 |
| Priceline.com, Inc. (a) | | 19,500 | | | 3,002,610 |
| | | | | |
| | | | | $ | 4,629,847 |
| Electrical Equipment - 3.0% | | | | | |
| Tyco Electronics Ltd. | | 189,080 | | $ | 4,314,806 |
| | |
| Electronics - 24.7% | | | | | |
| Avago Technologies Ltd. (a) | | 58,980 | | $ | 1,073,436 |
| First Solar, Inc. (a) | | 14,670 | | | 1,783,579 |
| Flextronics International Ltd. (a) | | 1,215,422 | | | 7,207,452 |
11
Portfolio of Investments – continued
| | | | | | |
| Issuer | | Shares/Par | | Value ($) |
| Common Stocks - continued | | | | | | |
| | | | | | |
| Electronics - continued | | | | | | |
| Intel Corp. | | | 243,096 | | $ | 4,939,711 |
| Marvell Technology Group Ltd. (a) | | | 141,186 | | | 2,153,087 |
| MEMC Electronic Materials, Inc. (a) | | | 173,750 | | | 2,771,313 |
| National Semiconductor Corp. | | | 155,410 | | | 2,357,570 |
| Samsung Electronics Co. Ltd., GDR | | | 33,110 | | | 10,093,098 |
| Silicon Laboratories, Inc. (a) | | | 64,000 | | | 2,882,560 |
| | | | | | |
| | | | | | $ | 35,261,806 |
| Entertainment - 0.7% | | | | | | |
| TiVo, Inc. (a) | | | 109,800 | | $ | 1,077,138 |
| | |
| Internet - 5.4% | | | | | | |
| Google, Inc., “A” (a) | | | 16,585 | | $ | 7,656,797 |
| | |
| Leisure & Toys - 2.5% | | | | | | |
| THQ, Inc. (a) | | | 645,320 | | $ | 3,555,713 |
| | |
| Medical & Health Technology & Services - 1.3% | | | | | | |
| Medassets, Inc. (a) | | | 80,400 | | $ | 1,795,332 |
| | |
| Network & Telecom - 5.8% | | | | | | |
| Ciena Corp. (a) | | | 140,060 | | $ | 1,876,804 |
| Cisco Systems, Inc. (a) | | | 186,370 | | | 4,025,592 |
| Tellabs, Inc. (a) | | | 376,000 | | | 2,383,840 |
| | | | | | |
| | | | | | $ | 8,286,236 |
| Printing & Publishing - 1.0% | | | | | | |
| MSCI, Inc., “A” (a) | | | 49,060 | | $ | 1,443,345 |
| | |
| Specialty Stores - 1.0% | | | | | | |
| Ctrip.com International Ltd., ADR (a) | | | 29,370 | | $ | 1,437,368 |
| | |
| Telephone Services - 1.3% | | | | | | |
| American Tower Corp., “A” (a) | | | 56,800 | | $ | 1,797,720 |
| Total Common Stocks (Identified Cost, $136,013,569) | | | | | $ | 132,636,438 |
| | |
| Convertible Bonds - 3.2% | | | | | | |
| Computer Software - 1.1% | | | | | | |
| Verisign, Inc., 3.25%, 2037 | | $ | 1,960,000 | | $ | 1,607,200 |
12
Portfolio of Investments – continued
| | | | | | |
| Issuer | | Shares/Par | | Value ($) |
| Convertible Bonds - continued | | | | | | |
| Leisure & Toys - 2.1% | | | | | | |
| Take-Two Interactive Software, Inc., 4.375%, 2014 | | $ | 1,290,000 | | $ | 1,549,613 |
| THQ, Inc., 5%, 2014 (z) | | | 1,458,000 | | | 1,394,213 |
| | | | | | |
| | | | | | $ | 2,943,826 |
| Total Convertible Bonds (Identified Cost, $4,122,970) | | | | | $ | 4,551,026 |
| | |
| Money Market Funds (v) - 1.6% | | | | | | |
MFS Institutional Money Market Portfolio, 0.2%,
at Cost and Net Asset Value | | | 2,364,705 | | $ | 2,364,705 |
| | |
| Issuer/Expiration Date/Strike Price | | Number of
Contracts | | |
| Call Options Purchased - 0.3% | | | | | | |
SanDisk Corp. - October 2009 @ $16
(Premiums Paid, $362,513) (a) | | | 1,870 | | $ | 439,450 |
| | |
| Put Options Purchased - 0.2% | | | | | | |
Micron Technology Inc. - January 2010 @ $7.50
(Premiums Paid, $361,426) (a) | | | 2,253 | | $ | 270,360 |
| Total Investments (Identified Cost, $143,225,183) | | | | | $ | 140,261,979 |
| | |
| Other Assets, Less Liabilities - 1.7% | | | | | | 2,368,065 |
| Net Assets - 100.0% | | | | | $ | 142,630,044 |
| (a) | Non-income producing security. |
| (s) | Security or a portion of the security was pledged to cover collateral requirements for securities sold short. At August 31, 2009, the value of securities pledged amounted to $169,932. At August 31, 2009, the fund has no short sales outstanding. |
| (v) | Underlying fund that is available only to investment companies managed by MFS. The rate quoted is the annualized seven-day yield of the fund at period end. |
| (z) | Restricted securities are not registered under the Securities Act of 1933 and are subject to legal restrictions on resale. These securities generally may be resold in transactions exempt from registration or to the public if the securities are subsequently registered. Disposal of these securities may involve time-consuming negotiations and prompt sale at an acceptable price may be difficult. The fund holds the following restricted securities: |
| | | | | | |
| Restricted Securities | | Acquisition
Date | | Cost | | Current
Market
Value |
| Alibaba.com Corp. | | 5/05/09-8/10/09 | | $955,494 | | $1,627,237 |
| THQ, Inc., 5%, 2014 | | 7/30/09-8/20/09 | | 1,459,571 | | 1,394,213 |
| Total Restricted Securities | | | | | | $3,021,450 |
| % of Net Assets | | | | | | 2.1% |
The following abbreviations are used in this report and are defined:
| ADR | | American Depository Receipt |
| GDR | | Global Depository Receipt |
See Notes to Financial Statements
13
Financial Statements
STATEMENT OF ASSETS AND LIABILITIES
At 8/31/09
This statement represents your fund’s balance sheet, which details the assets and liabilities comprising the total value of the fund.
| | | |
| Assets | | | |
Investments- | | | |
Non-affiliated issuers, at value (identified cost, $140,860,478) | | $137,897,274 | |
Underlying funds, at cost and value | | 2,364,705 | |
Total investments, at value (identified cost, $143,225,183) | | $140,261,979 | |
Deposits with brokers for securities sold short | | 776 | |
Receivables for | | | |
Investments sold | | 6,192,006 | |
Fund shares sold | | 517,292 | |
Interest and dividends | | 80,098 | |
Receivable from investment adviser | | 24,546 | |
Other assets | | 446 | |
Total assets | | $147,077,143 | |
| Liabilities | | | |
Payables for | | | |
Investments purchased | | $4,011,429 | |
Fund shares reacquired | | 255,862 | |
Payable to affiliates | | | |
Investment adviser | | 11,778 | |
Shareholder servicing costs | | 48,093 | |
Distribution and service fees | | 6,767 | |
Administrative services fee | | 371 | |
Payable for independent Trustees’ compensation | | 48,236 | |
Accrued expenses and other liabilities | | 64,563 | |
Total liabilities | | $4,447,099 | |
Net assets | | $142,630,044 | |
| Net assets consist of | | | |
Paid-in capital | | $270,582,593 | |
Unrealized appreciation (depreciation) on investments and translation of assets and
liabilities in foreign currencies | | (2,963,204 | ) |
Accumulated net realized gain (loss) on investments and foreign currency transactions | | (124,986,872 | ) |
Accumulated net investment loss | | (2,473 | ) |
Net assets | | $142,630,044 | |
Shares of beneficial interest outstanding | | 13,076,447 | |
| | | | | | |
| | | Net assets | | Shares
outstanding | | Net asset value
per share (a) |
Class A | | $86,719,787 | | 7,838,291 | | $11.06 |
Class B | | 15,182,440 | | 1,456,851 | | 10.42 |
Class C | | 15,355,794 | | 1,475,921 | | 10.40 |
Class I | | 6,725,884 | | 586,406 | | 11.47 |
Class R1 | | 1,584,887 | | 152,582 | | 10.39 |
Class R2 | | 13,775,116 | | 1,269,484 | | 10.85 |
Class R3 | | 3,132,732 | | 283,222 | | 11.06 |
Class R4 | | 153,404 | | 13,690 | | 11.21 |
On sales of $50,000 or more, the offering price of Class A shares is reduced. A contingent deferred sales charge may be imposed on redemptions of Class A, Class B, and Class C shares.
| (a) | Maximum offering price and redemption price per share were equal to the net asset value per share for all share classes, except for Class A, for which the maximum offering price per share was $11.73. |
See Notes to Financial Statements
14
Financial Statements
STATEMENT OF OPERATIONS
Year ended 8/31/09
This statement describes how much your fund earned in investment income and accrued in expenses.
It also describes any gains and/or losses generated by fund operations.
| | | | | | |
| Net investment loss | | | | | | |
Income | | | | | | |
Interest | | $611,304 | | | | |
Dividends | | 445,117 | | | | |
Dividends from underlying funds | | 3,239 | | | | |
Foreign taxes withheld | | (22,234 | ) | | | |
Total investment income | | | | | $1,037,426 | |
Expenses | | | | | | |
Management fee | | $668,546 | | | | |
Distribution and service fees | | 443,102 | | | | |
Shareholder servicing costs | | 451,690 | | | | |
Administrative services fee | | 24,800 | | | | |
Independent Trustees’ compensation | | 5,378 | | | | |
Custodian fee | | 31,414 | | | | |
Shareholder communications | | 20,783 | | | | |
Auditing fees | | 54,694 | | | | |
Legal fees | | 3,781 | | | | |
Registration fees | | 93,293 | | | | |
Dividend and interest expense on securities sold short | | 32,745 | | | | |
Miscellaneous | | 10,228 | | | | |
Total expenses | | | | | $1,840,454 | |
Fees paid indirectly | | (1,750 | ) | | | |
Reduction of expenses by investment adviser | | (337,118 | ) | | | |
Net expenses | | | | | $1,501,586 | |
Net investment loss | | | | | $(464,160 | ) |
Realized and unrealized gain (loss) on investments
and foreign currency transactions | | | | | | |
Realized gain (loss) (identified cost basis) | | | | | | |
Investment transactions | | $(28,380,215 | ) | | | |
Written option transactions | | 885,149 | | | | |
Securities sold short | | 1,486,672 | | | | |
Foreign currency transactions | | (49,703 | ) | | | |
Net realized gain (loss) on investments
and foreign currency transactions | | | | | $(26,058,097 | ) |
Change in unrealized appreciation (depreciation) | | | | | | |
Investments | | $16,772,682 | | | | |
Written options | | (151,391 | ) | | | |
Securities sold short | | (160,290 | ) | | | |
Translation of assets and liabilities in foreign currencies | | 473 | | | | |
Net unrealized gain (loss) on investments
and foreign currency translation | | | | | $16,461,474 | |
Net realized and unrealized gain (loss) on investments
and foreign currency | | | | | $(9,596,623 | ) |
Change in net assets from operations | | | | | $(10,060,783 | ) |
See Notes to Financial Statements
15
Financial Statements
STATEMENTS OF CHANGES IN NET ASSETS
These statements describe the increases and/or decreases in net assets resulting from operations, any distributions, and any shareholder transactions.
| | | | | | |
| | | Years Ended 8/31 | |
| | | 2009 | | | 2008 | |
| Change in net assets | | | | | | |
| From operations | | | | | | |
| Net investment loss | | $(464,160 | ) | | $(1,074,105 | ) |
Net realized gain (loss) on investments and
foreign currency transactions | | (26,058,097 | ) | | 10,198,397 | |
Net unrealized gain (loss) on investments and
foreign currency translation | | 16,461,474 | | | (19,478,653 | ) |
Change in net assets from operations | | $(10,060,783 | ) | | $(10,354,361 | ) |
Change in net assets from fund share transactions | | $27,332,525 | | | $8,897,292 | |
Total change in net assets | | $17,271,742 | | | $(1,457,069 | ) |
| Net assets | | | | | | |
At beginning of period | | 125,358,302 | | | 126,815,371 | |
At end of period (including accumulated net investment
loss of $2,473 and $0, respectively) | | $142,630,044 | | | $125,358,302 | |
See Notes to Financial Statements
16
Financial Statements
FINANCIAL HIGHLIGHTS
The financial highlights table is intended to help you understand the fund’s financial performance for the past 5 years (or life of a particular share class, if shorter). Certain information reflects financial results for a single fund share. The total returns in the table represent the rate by which an investor would have earned (or lost) on an investment in the fund share class (assuming reinvestment of all distributions) held for the entire period.
| | | | | | | | | | | | | | | |
| Class A | | Years ended 8/31 | |
| | | 2009 | | | 2008 | | | 2007 | | | 2006 | | | 2005 | |
Net asset value, beginning of period | | $12.46 | | | $13.34 | | | $10.13 | | | $8.84 | | | $7.70 | |
| Income (loss) from investment operations | | | | | | | | | | | | | | | |
Net investment loss (d) | | $(0.03 | ) | | $(0.07 | ) | | $(0.10 | ) | | $(0.11 | ) | | $(0.05 | ) |
Net realized and unrealized gain (loss)
on investments and foreign currency | | (1.37 | ) | | (0.81 | ) | | 3.31 | | | 1.40 | | | 1.19 | |
Total from investment operations | | $(1.40 | ) | | $(0.88 | ) | | $3.21 | | | $1.29 | | | $1.14 | |
Net asset value, end of period | | $11.06 | | | $12.46 | | | $13.34 | | | $10.13 | | | $8.84 | |
Total return (%) (r)(s)(t) | | (11.24 | ) | | (6.60 | ) | | 31.69 | | | 14.59 | | | 14.81 | |
Ratios (%) (to average net assets)
and Supplemental data: | | | | | | | | | | | | | |
Expenses before expense reductions (f) | | 1.85 | | | 1.66 | | | 1.70 | | | 1.79 | | | 1.79 | |
Expenses after expense reductions (f) | | 1.48 | | | 1.51 | | | 1.50 | | | 1.50 | | | 1.51 | |
Expenses after expense reductions excluding
short sale dividend and interest expense (f) | | 1.44 | | | 1.50 | | | N/A | | | N/A | | | N/A | |
Net investment loss | | (0.34 | ) | | (0.56 | ) | | (0.82 | ) | | (1.13 | ) | | (0.56 | ) |
Portfolio turnover | | 226 | | | 231 | | | 266 | | | 217 | | | 163 | |
Net assets at end of period (000 omitted) | | $86,720 | | | $64,791 | | | $56,598 | | | $43,313 | | | $48,945 | |
See Notes to Financial Statements
17
Financial Highlights – continued
| | | | | | | | | | | | | | | |
| Class B | | Years ended 8/31 | |
| | | 2009 | | | 2008 | | | 2007 | | | 2006 | | | 2005 | |
Net asset value, beginning of period | | $11.82 | | | $12.74 | | | $9.73 | | | $8.55 | | | $7.50 | |
| Income (loss) from investment operations | | | | | | | | | | | | | | | |
Net investment loss (d) | | $(0.08 | ) | | $(0.16 | ) | | $(0.17 | ) | | $(0.17 | ) | | $(0.10 | ) |
Net realized and unrealized gain (loss)
on investments and foreign currency | | (1.32 | ) | | (0.76 | ) | | 3.18 | | | 1.35 | | | 1.15 | |
Total from investment operations | | $(1.40 | ) | | $(0.92 | ) | | $3.01 | | | $1.18 | | | $1.05 | |
Net asset value, end of period | | $10.42 | | | $11.82 | | | $12.74 | | | $9.73 | | | $8.55 | |
Total return (%) (r)(s)(t) | | (11.84 | ) | | (7.22 | ) | | 30.94 | | | 13.80 | | | 14.00 | |
Ratios (%) (to average net assets)
and Supplemental data: | | | | | | | | | | | | | |
Expenses before expense reductions (f) | | 2.58 | | | 2.32 | | | 2.36 | | | 2.44 | | | 2.44 | |
Expenses after expense reductions (f) | | 2.19 | | | 2.16 | | | 2.15 | | | 2.15 | | | 2.16 | |
Expenses after expense reductions excluding
short sale dividend and interest expense (f) | | 2.15 | | | 2.15 | | | N/A | | | N/A | | | N/A | |
Net investment loss | | (0.98 | ) | | (1.24 | ) | | (1.47 | ) | | (1.79 | ) | | (1.24 | ) |
Portfolio turnover | | 226 | | | 231 | | | 266 | | | 217 | | | 163 | |
Net assets at end of period (000 omitted) | | $15,182 | | | $23,254 | | | $38,540 | | | $39,025 | | | $43,765 | |
| | | | | | | | | | | | | | | |
| Class C | | Years ended 8/31 | |
| | | 2009 | | | 2008 | | | 2007 | | | 2006 | | | 2005 | |
Net asset value, beginning of period | | $11.80 | | | $12.72 | | | $9.72 | | | $8.54 | | | $7.48 | |
| Income (loss) from investment operations | | | | | | | | | | | | | |
Net investment loss (d) | | $(0.08 | ) | | $(0.16 | ) | | $(0.17 | ) | | $(0.17 | ) | | $(0.10 | ) |
Net realized and unrealized gain (loss)
on investments and foreign currency | | (1.32 | ) | | (0.76 | ) | | 3.17 | | | 1.35 | | | 1.16 | |
Total from investment operations | | $(1.40 | ) | | $(0.92 | ) | | $3.00 | | | $1.18 | | | $1.06 | |
Net asset value, end of period | | $10.40 | | | $11.80 | | | $12.72 | | | $9.72 | | | $8.54 | |
Total return (%) (r)(s)(t) | | (11.86 | ) | | (7.23 | ) | | 30.86 | | | 13.82 | | | 14.17 | |
Ratios (%) (to average net assets)
and Supplemental data: | | | | | | | | | | | | | |
Expenses before expense reductions (f) | | 2.57 | | | 2.31 | | | 2.35 | | | 2.44 | | | 2.44 | |
Expenses after expense reductions (f) | | 2.19 | | | 2.16 | | | 2.15 | | | 2.15 | | | 2.16 | |
Expenses after expense reductions excluding
short sale dividend and interest expense (f) | | 2.15 | | | 2.15 | | | N/A | | | N/A | | | N/A | |
Net investment loss | | (1.00 | ) | | (1.22 | ) | | (1.46 | ) | | (1.78 | ) | | (1.22 | ) |
Portfolio turnover | | 226 | | | 231 | | | 266 | | | 217 | | | 163 | |
Net assets at end of period (000 omitted) | | $15,356 | | | $15,765 | | | $16,064 | | | $11,659 | | | $12,414 | |
See Notes to Financial Statements
18
Financial Highlights – continued
| | | | | | | | | | | | | | |
| Class I | | Years ended 8/31 |
| | | 2009 | | | 2008 | | | 2007 | | | 2006 | | | 2005 |
Net asset value, beginning of period | | $12.88 | | | $13.74 | | | $10.39 | | | $9.04 | | | $7.85 |
| Income (loss) from investment operations | | | | | | | | | | | | | | |
Net investment income (loss) (d) | | $(0.00 | )(w) | | $(0.03 | ) | | $(0.06 | ) | | $(0.08 | ) | | $0.01 |
Net realized and unrealized gain (loss)
on investments and foreign currency | | (1.41 | ) | | (0.83 | ) | | 3.41 | | | 1.43 | | | 1.18 |
Total from investment operations | | $(1.41 | ) | | $(0.86 | ) | | $3.35 | | | $1.35 | | | $1.19 |
Net asset value, end of period | | $11.47 | | | $12.88 | | | $13.74 | | | $10.39 | | | $9.04 |
Total return (%) (r)(s) | | (10.95 | ) | | (6.26 | ) | | 32.24 | | | 14.93 | | | 15.16 |
Ratios (%) (to average net assets)
and Supplemental data: | | | | | | | | | | | | | | |
Expenses before expense reductions (f) | | 1.56 | | | 1.31 | | | 1.35 | | | 1.43 | | | 1.44 |
Expenses after expense reductions (f) | | 1.19 | | | 1.16 | | | 1.15 | | | 1.15 | | | 1.16 |
Expenses after expense reductions excluding
short sale dividend and interest expense (f) | | 1.15 | | | 1.15 | | | N/A | | | N/A | | | N/A |
Net investment income (loss) | | (0.03 | ) | | (0.20 | ) | | (0.47 | ) | | (0.78 | ) | | 0.17 |
Portfolio turnover | | 226 | | | 231 | | | 266 | | | 217 | | | 163 |
Net assets at end of period (000 omitted) | | $6,726 | | | $4,958 | | | $4,180 | | | $3,492 | | | $3,384 |
| | | | | | | | | | | | | | | |
| Class R1 | | Years ended 8/31 | |
| | | 2009 | | | 2008 | | | 2007 | | | 2006 | | | 2005 (i) | |
Net asset value, beginning of period | | $11.78 | | | $12.70 | | | $9.72 | | | $8.55 | | | $8.01 | |
| Income (loss) from investment operations | | | | | | | | | | | | | | | |
Net investment loss (d) | | $(0.08 | ) | | $(0.15 | ) | | $(0.19 | ) | | $(0.18 | ) | | $(0.07 | ) |
Net realized and unrealized gain (loss)
on investments and foreign currency | | (1.31 | ) | | (0.77 | ) | | 3.17 | | | 1.35 | | | 0.61 | (g) |
Total from investment operations | | $(1.39 | ) | | $(0.92 | ) | | $2.98 | | | $1.17 | | | $0.54 | |
Net asset value, end of period | | $10.39 | | | $11.78 | | | $12.70 | | | $9.72 | | | $8.55 | |
Total return (%) (r)(s) | | (11.80 | ) | | (7.24 | ) | | 30.66 | | | 13.68 | | | 6.74 | (n) |
Ratios (%) (to average net assets)
and Supplemental data: | | | | | | | | | | | | | |
Expenses before expense reductions (f) | | 2.58 | | | 2.36 | | | 2.48 | | | 2.63 | | | 2.62 | (a) |
Expenses after expense reductions (f) | | 2.19 | | | 2.21 | | | 2.25 | | | 2.25 | | | 2.34 | (a) |
Expenses after expense reductions excluding
short sale dividend and interest expense (f) | | 2.15 | | | 2.20 | | | N/A | | | N/A | | | N/A | |
Net investment loss | | (0.96 | ) | | (1.22 | ) | | (1.63 | ) | | (1.88 | ) | | (1.90 | )(a) |
Portfolio turnover | | 226 | | | 231 | | | 266 | | | 217 | | | 163 | |
Net assets at end of period (000 omitted) | | $1,585 | | | $2,026 | | | $1,235 | | | $213 | | | $64 | |
See Notes to Financial Statements
19
Financial Highlights – continued
| | | | | | | | | | | | | | | |
| Class R2 | | Years ended 8/31 | |
| | | 2009 | | | 2008 | | | 2007 | | | 2006 | | | 2005 | |
Net asset value, beginning of period | | $12.25 | | | $13.14 | | | $10.00 | | | $8.76 | | | $7.66 | |
| Income (loss) from investment operations | | | | | | | | | | | | | | | |
Net investment loss (d) | | $(0.04 | ) | | $(0.09 | ) | | $(0.13 | ) | | $(0.14 | ) | | $(0.09 | ) |
Net realized and unrealized gain (loss)
on investments and foreign currency | | (1.36 | ) | | (0.80 | ) | | 3.27 | | | 1.38 | | | 1.19 | |
Total from investment operations | | $(1.40 | ) | | $(0.89 | ) | | $3.14 | | | $1.24 | | | $1.10 | |
Net asset value, end of period | | $10.85 | | | $12.25 | | | $13.14 | | | $10.00 | | | $8.76 | |
Total return (%) (r)(s) | | (11.43 | ) | | (6.77 | ) | | 31.40 | | | 14.16 | | | 14.36 | |
Ratios (%) (to average net assets)
and Supplemental data: | | | | | | | | | | | | | | | |
Expenses before expense reductions (f) | | 2.07 | | | 1.85 | | | 1.98 | | | 2.18 | | | 2.19 | |
Expenses after expense reductions (f) | | 1.69 | | | 1.71 | | | 1.80 | | | 1.80 | | | 1.91 | |
Expenses after expense reductions excluding
short sale dividend and interest expense (f) | | 1.65 | | | 1.69 | | | N/A | | | N/A | | | N/A | |
Net investment loss | | (0.50 | ) | | (0.65 | ) | | (1.07 | ) | | (1.41 | ) | | (1.07 | ) |
Portfolio turnover | | 226 | | | 231 | | | 266 | | | 217 | | | 163 | |
Net assets at end of period (000 omitted) | | $13,775 | | | $12,098 | | | $5,292 | | | $800 | | | $192 | |
| | | | | | | | | | | | | | | |
| Class R3 | | Years ended 8/31 | |
| | | 2009 | | | 2008 | | | 2007 | | | 2006 | | | 2005 (i) | |
Net asset value, beginning of period | | $12.45 | | | $13.33 | | | $10.12 | | | $8.85 | | | $8.26 | |
| Income (loss) from investment operations | | | | | | | | | | | | | | | |
Net investment loss (d) | | $(0.02 | ) | | $(0.06 | ) | | $(0.10 | ) | | $(0.14 | ) | | $(0.04 | ) |
Net realized and unrealized gain (loss)
on investments and foreign currency | | (1.37 | ) | | (0.82 | ) | | 3.31 | | | 1.41 | | | 0.63 | (g) |
Total from investment operations | | $(1.39 | ) | | $(0.88 | ) | | $3.21 | | | $1.27 | | | $0.59 | |
Net asset value, end of period | | $11.06 | | | $12.45 | | | $13.33 | | | $10.12 | | | $8.85 | |
Total return (%) (r)(s) | | (11.16 | ) | | (6.60 | ) | | 31.72 | | | 14.35 | | | 7.14 | (n) |
Ratios (%) (to average net assets)
and Supplemental data: | | | | | | | | | | | | | |
Expenses before expense reductions (f) | | 1.82 | | | 1.61 | | | 1.70 | | | 1.84 | | | 1.82 | (a) |
Expenses after expense reductions (f) | | 1.44 | | | 1.46 | | | 1.55 | | | 1.55 | | | 1.54 | (a) |
Expenses after expense reductions excluding
short sale dividend and interest expense (f) | | 1.40 | | | 1.44 | | | N/A | | | N/A | | | N/A | |
Net investment loss | | (0.24 | ) | | (0.44 | ) | | (0.76 | ) | | (1.18 | ) | | (1.10 | )(a) |
Portfolio turnover | | 226 | | | 231 | | | 266 | | | 217 | | | 163 | |
Net assets at end of period (000 omitted) | | $3,133 | | | $2,390 | | | $1,547 | | | $113 | | | $54 | |
See Notes to Financial Statements
20
Financial Highlights – continued
| | | | | | | | | | | | | | | |
| Class R4 | | Years ended 8/31 | |
| | | 2009 | | | 2008 | | | 2007 | | | 2006 | | | 2005 (i) | |
Net asset value, beginning of period | | $12.58 | | | $13.43 | | | $10.17 | | | $8.86 | | | $8.26 | |
| Income (loss) from investment operations | | | | | | | | | | | | | | | |
Net investment income (loss) (d) | | $(0.00 | )(w) | | $(0.03 | ) | | $(0.07 | ) | | $(0.09 | ) | | $(0.03 | ) |
Net realized and unrealized gain (loss)
on investments and foreign currency | | (1.37 | ) | | (0.82 | ) | | 3.33 | | | 1.40 | | | 0.63 | (g) |
Total from investment operations | | $(1.37 | ) | | $(0.85 | ) | | $3.26 | | | $1.31 | | | $0.60 | |
Net asset value, end of period | | $11.21 | | | $12.58 | | | $13.43 | | | $10.17 | | | $8.86 | |
Total return (%) (r)(s) | | (10.89 | ) | | (6.33 | ) | | 32.06 | | | 14.79 | | | 7.26 | (n) |
Ratios (%) (to average net assets)
and Supplemental data: | | | | | | | | | | | | | |
Expenses before expense reductions (f) | | 1.54 | | | 1.35 | | | 1.45 | | | 1.53 | | | 1.52 | (a) |
Expenses after expense reductions (f) | | 1.18 | | | 1.20 | | | 1.25 | | | 1.25 | | | 1.24 | (a) |
Expenses after expense reductions excluding
short sale dividend and interest expense (f) | | 1.15 | | | 1.19 | | | N/A | | | N/A | | | N/A | |
Net investment loss | | (0.02 | ) | | (0.24 | ) | | (0.56 | ) | | (0.88 | ) | | (0.79 | )(a) |
Portfolio turnover | | 226 | | | 231 | | | 266 | | | 217 | | | 163 | |
Net assets at end of period (000 omitted) | | $153 | | | $76 | | | $81 | | | $62 | | | $54 | |
Any redemption fees charged by the fund during the 2005 fiscal years resulted in a per share impact of less than $0.01.
| (d) | Per share data is based on average shares outstanding. |
| (f) | Ratios do not reflect reductions from fees paid indirectly, if applicable. |
| (g) | The per share amount is not in accordance with the net realized and unrealized gain/loss for the period because of the timing of sales of fund shares and the per share amount of realized and unrealized gains and losses at such time. |
| (i) | For the period from the class’ inception, and April 1, 2005 (Classes R1, R3, and R4) through the stated period end. |
| (r) | Certain expenses have been reduced without which performance would have been lower. |
| (s) | From time to time the fund may receive proceeds from litigation settlements, without which performance would be lower. Excluding the effect of the proceeds received from a non-recurring litigation settlement against Nortel Networks Corp., the Class A, Class B, Class C, Class I, Class R1, Class R2, Class R3, and Class R4 total returns for the year ended August 31, 2008 would have each been lower by approximately 0.55%. |
| (t) | Total returns do not include any applicable sales charges. |
| (w) | Per share amount was less than $0.01. |
See Notes to Financial Statements
21
NOTES TO FINANCIAL STATEMENTS
| (1) | | Business and Organization |
MFS Technology Fund (the fund) is a series of MFS Series Trust I (the trust). The trust is organized as a Massachusetts business trust and is registered under the Investment Company Act of 1940, as amended, as an open-end management investment company.
| (2) | | Significant Accounting Policies |
General – The preparation of financial statements in conformity with U.S. generally accepted accounting principles requires management to make estimates and assumptions that affect the reported amounts of assets and liabilities, and disclosure of contingent assets and liabilities at the date of the financial statements and the reported amounts of revenues and expenses during the reporting period. In making these estimates and assumptions, management has considered the effects, if any, of events occurring after the date of the fund’s Statement of Assets and Liabilities through October 16, 2009 which is the date that the financial statements were issued. Actual results could differ from those estimates. The fund can invest in foreign securities, including securities of emerging market issuers. Investments in foreign securities are vulnerable to the effects of changes in the relative values of the local currency and the U.S. dollar and to the effects of changes in each country’s legal, political, and economic environment. The markets of emerging markets countries are generally more volatile than the markets of developed countries with more mature economies. All of the risks of investing in foreign securities previously described are heightened when investing in emerging markets countries.
Investment Valuations – Equity securities, including restricted equity securities, are generally valued at the last sale or official closing price as provided by a third-party pricing service on the market or exchange on which they are primarily traded. For securities for which there were no sales reported that day, equity securities are generally valued at the last quoted daily bid quotation as provided by a third-party pricing service on the market or exchange on which such securities are primarily traded. For securities held short for which there were no sales reported for that day, the position is generally valued at the last quoted daily ask quotation as provided by a third-party pricing service on the market or exchange on which such securities are primarily traded. Debt instruments and floating rate loans (other than short-term instruments), including restricted debt instruments, are generally valued at an evaluated or composite bid as provided by a third-party pricing service. Short-term instruments with a maturity at issuance of 60 days or less generally are valued at amortized cost, which approximates market value.
22
Notes to Financial Statements – continued
Exchange-traded options are generally valued at the last sale or official closing price as provided by a third-party pricing service on the exchange on which such options are primarily traded. Exchange-traded options for which there were no sales reported that day are generally valued at the last daily bid quotation as provided by a third-party pricing service on the exchange on which such options are primarily traded. Options not traded on an exchange are generally valued at a broker/dealer bid quotation. Foreign currency options are generally valued using an external pricing model that uses market data from a third-party source. Open-end investment companies are generally valued at net asset value per share. Securities and other assets generally valued on the basis of information from a third-party pricing service may also be valued at a broker/dealer bid quotation. Values obtained from third-party pricing services can utilize both transaction data and market information such as yield, quality, coupon rate, maturity, type of issue, trading characteristics, and other market data. The values of foreign securities and other assets and liabilities expressed in foreign currencies are converted to U.S. dollars using the mean of bid and asked prices for rates provided by a third-party pricing service.
The Board of Trustees has delegated primary responsibility for determining or causing to be determined the value of the fund’s investments (including any fair valuation) to the adviser pursuant to valuation policies and procedures approved by the Board. If the adviser determines that reliable market quotations are not readily available, investments are valued at fair value as determined in good faith by the adviser in accordance with such procedures under the oversight of the Board of Trustees. Under the fund’s valuation policies and procedures, market quotations are not considered to be readily available for most types of debt instruments and floating rate loans and many types of derivatives. These investments are generally valued at fair value based on information from third-party pricing services. In addition, investments may be valued at fair value if the adviser determines that an investment’s value has been materially affected by events occurring after the close of the exchange or market on which the investment is principally traded (such as foreign exchange or market) and prior to the determination of the fund’s net asset value, or after the halting of trading of a specific security where trading does not resume prior to the close of the exchange or market on which the security is principally traded. Events that occur on a frequent basis after foreign markets close (such as developments in foreign markets and significant movements in the U.S. markets) and prior to the determination of the fund’s net asset value may be deemed to have a material affect on the value of securities traded in foreign markets. Accordingly, the fund’s foreign equity securities may often be valued at fair value. The adviser generally relies on third-party pricing services or other information (such as the correlation with
23
Notes to Financial Statements – continued
price movements of similar securities in the same or other markets; the type, cost and investment characteristics of the security; the business and financial condition of the issuer; and trading and other market data) to assist in determining whether to fair value and at what value to fair value an investment. The value of an investment for purposes of calculating the fund’s net asset value can differ depending on the source and method used to determine value. When fair valuation is used, the value of an investment used to determine the fund’s net asset value may differ from quoted or published prices for the same investment. There can be no assurance that the fund could obtain the fair value assigned to an investment if it were to sell the investment at the same time at which the fund determines its net asset value per share.
The fund adopted FASB Statement No. 157, Fair Value Measurements (the “Statement”). This Statement provides a single definition of fair value, a hierarchy for measuring fair value and expanded disclosures about fair value measurements.
Various inputs are used in determining the value of the fund’s assets or liabilities carried at market value. These inputs are categorized into three broad levels. In certain cases, the inputs used to measure fair value may fall into different levels of the fair value hierarchy. In such cases, an investment’s level within the fair value hierarchy is based on the lowest level of input that is significant to the fair value measurement. The fund’s assessment of the significance of a particular input to the fair value measurement in its entirety requires judgment, and considers factors specific to the investment. Level 1 includes unadjusted quoted prices in active markets for identical assets or liabilities. Level 2 includes other significant observable market-based inputs (including quoted prices for similar securities, interest rates, prepayment speed, and credit risk). Level 3 includes unobservable inputs, which may include the adviser’s own assumptions in determining the fair value of investments. Other financial instruments are derivative instruments not reflected in total investments, such as futures, forwards, swap contracts, and written options. The following is a summary of the levels used as of August 31, 2009 in valuing the fund’s assets or liabilities carried at market value:
| | | | | | | | |
| Investments at Value | | Level 1 | | Level 2 | | Level 3 | | Total |
| Equity Securities: | | | | | | | | |
United States | | $116,769,457 | | $— | | $— | | $116,769,457 |
South Korea | | — | | 10,093,097 | | — | | 10,093,097 |
China | | 3,064,605 | | — | | — | | 3,064,605 |
Japan | | 2,345,653 | | — | | — | | 2,345,653 |
Singapore | | 1,073,436 | | — | | — | | 1,073,436 |
| Corporate Bonds | | — | | 4,551,026 | | — | | 4,551,026 |
| Mutual Funds | | 2,364,705 | | — | | — | | 2,364,705 |
| Total Investments | | $125,617,856 | | $14,644,123 | | $— | | $140,261,979 |
24
Notes to Financial Statements – continued
For further information regarding security characteristics, see the Portfolio of Investments.
Repurchase Agreements – The fund may enter into repurchase agreements with approved counterparties. Each repurchase agreement is recorded at cost. The fund requires that the securities collateral in a repurchase transaction be transferred to a custodian. The fund monitors, on a daily basis, the value of the collateral to ensure that its value, including accrued interest, is greater than amounts owed to the fund under each such repurchase agreement. The fund and other funds managed by MFS may utilize a joint trading account for the purpose of entering into one or more repurchase agreements.
Foreign Currency Translation – Purchases and sales of foreign investments, income, and expenses are converted into U.S. dollars based upon currency exchange rates prevailing on the respective dates of such transactions or on the reporting date for foreign denominated receivables and payables. Gains and losses attributable to foreign currency exchange rates on sales of securities are recorded for financial statement purposes as net realized gains and losses on investments. Gains and losses attributable to foreign exchange rate movements on receivables, payables, income and expenses are recorded for financial statement purposes as foreign currency transaction gains and losses. That portion of both realized and unrealized gains and losses on investments that results from fluctuations in foreign currency exchange rates is not separately disclosed.
Derivatives – The fund may use derivatives for different purposes, including to earn income and enhance returns, to increase or decrease exposure to a particular market, to manage or adjust the risk profile of the fund, or as alternatives to direct investments. Derivatives may be used for hedging or non-hedging purposes. While hedging can reduce or eliminate losses, it can also reduce or eliminate gains. When the fund uses derivatives as an investment to increase market exposure, or for hedging purposes, gains and losses from derivative instruments may be substantially greater than the derivative’s original cost.
In this reporting period the fund adopted FASB Statement No. 161, Disclosure about Derivative Instruments and Hedging Activities (“FAS 161”), and FASB Staff Position FAS No. 133-1 and FIN 45-4, Disclosures about Credit Derivatives and Certain Guarantees: An Amendment of FASB Statement No. 133 and FASB Interpretation No. 45; and Clarification of the Effective Date of FAS 161 (“FSP FAS 133-1”).
FAS 161 amends FASB Statement No. 133, Accounting for Derivatives and Hedging Activities (“FAS 133”). FAS 161 provides enhanced disclosures about the fund’s use of and accounting for derivative instruments and the effect of
25
Notes to Financial Statements – continued
derivative instruments on the fund’s results of operations and financial position. Under FAS 161, tabular disclosure regarding derivative fair value and gain/loss by contract type (e.g., interest rate contracts, foreign exchange contracts, credit contracts, etc.) is required and derivatives accounted for as hedging instruments under FAS 133 must be disclosed separately from derivatives that do not qualify for hedge accounting under FAS 133. Because investment companies account for their derivatives at fair value and record any changes in fair value in current period earnings, the fund’s derivatives are not accounted for as hedging instruments under FAS 133. As such, even though the fund may use derivatives in an attempt to achieve an economic hedge, the fund’s derivatives are not considered to be hedging instruments under FAS 133.
FSP FAS 133-1 amends FAS 133 to require sellers of credit derivatives to make disclosures that will enable financial statement users to assess the potential effects of those credit derivatives on an entity’s financial position, financial performance and cash flows. As defined by FSP FAS 133-1, a credit derivative is a derivative instrument (a) in which one or more of the derivative’s underlyings are related to the credit risk of a specified entity (or group of entities) or an index based on the credit risk of a group of entities and (b) that exposes the seller to potential loss from credit-risk-related events specified in the derivative contract. The seller (or writer) is the party that provides the credit protection and assumes the credit risk on a credit derivatives contract, such as a credit default swap. There was no impact from implementing FSP 133-1 as the fund did not hold any of these credit derivatives at period end.
As defined under FAS 133, derivative instruments include written options, purchased options, futures contracts, forward foreign currency exchange contracts, and swap agreements. The following table presents, by major type of derivative contract, the fair value, on a gross basis, of the asset and liability components of derivatives held by the fund at August 31, 2009:
| | | | | | |
| | | | | Asset Derivatives |
| | | | | Location on Statement of Assets and Liabilities | | Fair Value |
Equity Contracts not Accounted for as
Hedging Instruments Under FAS 133 | | Equity
Options
Purchased | | Total investments, at value | | $709,810 |
26
Notes to Financial Statements – continued
The following table presents, by major type of derivative contract, the realized gain (loss) on derivatives held by the fund for the year ended August 31, 2009 as reported in the Statement of Operations:
| | | | | | |
| | | Written
Options
Transactions | | Investments
(i.e.,
Purchased
Options) | | Total |
| Equity Contracts | | $885,149 | | $1,838,933 | | $2,724,082 |
The following table presents, by major type of derivative contract, the change in unrealized appreciation (depreciation) on derivatives held by the fund for the year ended August 31, 2009 as reported in the Statement of Operations:
| | | | | | | |
| | | Written
Options
Transactions | | | Investments
(i.e.,
Purchased
Options) | | Total |
| Equity Contracts | | $(151,391 | ) | | $463,776 | | $312,385 |
Derivative counterparty credit risk is managed through formal evaluation of the creditworthiness of all potential counterparties. On certain over-the-counter derivatives, the fund attempts to reduce its exposure to counterparty credit risk by entering into an International Swaps and Derivatives Association (ISDA) Master Agreement on a bilateral basis with each of the counterparties with whom it undertakes a significant volume of transactions. The ISDA Master Agreement gives each party to the agreement the right to terminate all transactions traded under such agreement if there is a certain deterioration in the credit quality of the other party. The ISDA Master Agreement gives the fund the right, upon an event of default by the applicable counterparty or a termination of the agreement, to close out all transactions traded under such agreement and to net amounts owed under each transaction to one net amount payable by one party to the other. This right to close out and net payments across all transactions traded under the ISDA Master Agreement could result in a reduction of the fund’s credit risk to such counterparty equal to any amounts payable by the fund under the applicable transactions, if any. However, absent an event of default by the counterparty or a termination of the agreement, the ISDA Master Agreement does not result in an offset of reported balance sheet assets and liabilities across transactions between the fund and the applicable counterparty.
Collateral requirements differ by type of derivative. Collateral or margin requirements are set by the broker or exchange clearing house for exchange traded derivatives (i.e., futures and exchange-traded options) while collateral terms are contract specific for over-the-counter traded derivatives (i.e., forwards, swaps and over-the-counter options). For derivatives traded under an ISDA Master Agreement, the collateral requirements are netted across all
27
Notes to Financial Statements – continued
transactions traded under such agreement and one amount is posted from one party to the other to collateralize such obligations. Cash collateral that has been pledged to cover obligations of the fund under derivative contracts will be reported separately on the Statement of Assets and Liabilities as restricted cash. Securities collateral pledged for the same purpose is noted in the Portfolio of Investments.
Written Options – In exchange for a premium, the fund writes call or put options on securities for which it believes the premium received exceeds the potential loss that would result from adverse price changes in the options’ underlying securities. In a written option, the fund as the option writer grants the buyer the right to purchase from, or sell to, the fund a specified number of shares or units of a particular security, currency or index at a specified price within a specified period of time.
The premium received is initially recorded as a liability on the Statement of Assets and Liabilities. The option is subsequently marked-to-market daily with the difference between the premium received and the market value of the written option being recorded as unrealized appreciation or depreciation. When a written option expires, the fund realizes a gain equal to the amount of the premium received. The difference between the premium received and the amount paid on effecting a closing transaction is considered a realized gain or loss. When a written call option is exercised, the premium received is offset against the proceeds to determine the realized gain or loss. When a written put option is exercised, the premium reduces the cost basis of the security purchased by the fund.
At the initiation of the written option contract, for exchange traded options, the fund is required to deposit securities or cash as collateral with the custodian for the benefit of the broker. For over-the-counter options, the fund may post collateral subject to the terms of an ISDA Master Agreement as generally described above if the market value of the options contract moves against it. The fund, as writer of an option, may have no control over whether the underlying securities may be sold (call) or purchased (put) and, as a result, bears the market risk of an unfavorable change in the price of the securities underlying the written option. Although the fund’s market risk may be significant, the maximum counterparty credit risk to the fund is equal to the market value of any collateral posted to the broker. For over-the-counter options, this risk is mitigated in cases where there is an ISDA Master Agreement between the fund and the counterparty providing for netting as described above.
28
Notes to Financial Statements – continued
Written Option Transactions
| | | | | | |
| | | Number of
contracts | | | Premiums
received | |
| Outstanding, beginning of period | | 3,252 | | | $319,751 | |
| Options written | | 15,036 | | | 1,089,842 | |
| Options closed | | (8,720 | ) | | (779,595 | ) |
| Options expired | | (9,568 | ) | | (629,998 | ) |
| Outstanding, end of period | | — | | | $— | |
Purchased Options – The fund may purchase call or put options for a premium. Purchased options entitle the holder to buy or sell a specified number of shares or units of a particular security, currency or index at a specified price at a specified date or within a specified period of time. Purchasing call options may be used to hedge against an anticipated increase in the dollar cost of securities or currency to be acquired or to increase the fund’s exposure to an underlying instrument. Purchasing put options may hedge against a decline in the value of portfolio securities or currency.
The premium paid is initially recorded as an investment in the Statement of Assets and Liabilities. That investment is subsequently marked-to-market daily with the difference between the premium paid and the market value of the purchased option being recorded as unrealized appreciation or depreciation. Premiums paid for purchased options which have expired are treated as realized losses on investments in the Statement of Operations. Upon the exercise or closing of a purchased option, the premium paid is either added to the cost of the security or financial instrument in the case of a call option, or offset against the proceeds on the sale of the underlying security or financial instrument in the case of a put option, in order to determine the realized gain or loss on investments.
The risk in purchasing an option is that the fund pays a premium whether or not the option is exercised. The fund’s maximum risk of loss due to counterparty credit risk is limited to the market value of the option. For over-the-counter options, this risk is mitigated in cases where there is an ISDA Master Agreement between the fund and the counterparty providing for netting as described above and for posting of collateral by the counterparty to the fund to cover the fund’s exposure to the counterparty under such ISDA Master Agreement.
Short Sales – The fund may enter into short sales whereby it sells a security it does not own in anticipation of a decline in the value of that security. The fund will realize a gain if the security price decreases and a loss if the security price increases between the date of the short sale and the date on which the fund replaces the borrowed security. Losses from short sales can exceed the proceeds of the security sold; and they can also exceed the potential loss from an
29
Notes to Financial Statements – continued
ordinary buy and sell transaction. The amount of any premium, dividends, or interest the fund may be required to pay in connection with a short sale will be recognized as a fund expense. During the year ended August 31, 2009, this expense amounted to $32,745. The fund segregates cash or marketable securities in an amount that, when combined with the amount of proceeds from the short sale deposited with the broker, at least equals the current market value of the security sold short. At August 31, 2009, the fund had no short sales outstanding.
Security Loans – State Street Bank and Trust Company (“State Street”), as lending agent, may loan the securities of the fund to certain qualified institutions (the “Borrowers”) approved by the fund. The loans are collateralized by cash and/or U.S. Treasury and federal agency obligations in an amount typically at least equal to the market value of the securities loaned. The market value of the loaned securities is determined at the close of business of the fund and any additional required collateral is delivered to the fund on the next business day. State Street provides the fund with indemnification against Borrower default. The fund bears the risk of loss with respect to the investment of cash collateral. On loans collateralized by cash, the cash collateral is invested in a money market fund or short-term securities. A portion of the income generated upon investment of the collateral is remitted to the Borrowers, and the remainder is allocated between the fund and the lending agent. On loans collateralized by U.S. Treasury and/or federal agency obligations, a fee is received from the Borrower, and is allocated between the fund and the lending agent. Income from securities lending is included in interest income on the Statement of Operations. The dividend and interest income earned on the securities loaned is accounted for in the same manner as other dividend and interest income. At August 31, 2009, there were no securities on loan.
Indemnifications – Under the fund’s organizational documents, its officers and Trustees may be indemnified against certain liabilities and expenses arising out of the performance of their duties to the fund. Additionally, in the normal course of business, the fund enters into agreements with service providers that may contain indemnification clauses. The fund’s maximum exposure under these agreements is unknown as this would involve future claims that may be made against the fund that have not yet occurred.
Investment Transactions and Income – Investment transactions are recorded on the trade date. Interest income is recorded on the accrual basis. All premium and discount is amortized or accreted for financial statement purposes in accordance with U.S. generally accepted accounting principles. Dividends received in cash are recorded on the ex-dividend date. Certain dividends from foreign securities will be recorded when the fund is informed of the dividend if such information is obtained subsequent to the ex-dividend
30
Notes to Financial Statements – continued
date. Dividend and interest payments received in additional securities are recorded on the ex-dividend or ex-interest date in an amount equal to the value of the security on such date.
The fund may receive proceeds from litigation settlements. Any proceeds received from litigation involving portfolio holdings are reflected in the Statement of Operations in realized gain/loss if the security has been disposed of by the fund or in unrealized gain/loss if the security is still held by the fund. Any other proceeds from litigation not related to portfolio holdings are reflected as other income in the Statement of Operations.
Fees Paid Indirectly – The fund’s custody fee may be reduced according to an arrangement that measures the value of cash deposited with the custodian by the fund. This amount, for the year ended August 31, 2009, is shown as a reduction of total expenses on the Statement of Operations.
Tax Matters and Distributions – The fund intends to qualify as a regulated investment company, as defined under Subchapter M of the Internal Revenue Code, and to distribute all of its taxable income, including realized capital gains. As a result, no provision for federal income tax is required. The fund’s federal tax returns for the prior three fiscal years remain subject to examination by the Internal Revenue Service. Foreign taxes, if any, have been accrued by the fund in the accompanying financial statements.
Distributions to shareholders are recorded on the ex-dividend date. Income and capital gain distributions are determined in accordance with income tax regulations, which may differ from U.S. generally accepted accounting principles. Certain capital accounts in the financial statements are periodically adjusted for permanent differences in order to reflect their tax character. These adjustments have no impact on net assets or net asset value per share. Temporary differences which arise from recognizing certain items of income, expense, gain or loss in different periods for financial statement and tax purposes will reverse at some time in the future. Distributions in excess of net investment income or net realized gains are temporary over distributions for financial statement purposes resulting from differences in the recognition or classification of income or distributions for financial statement and tax purposes.
Book/tax differences primarily relate to net operating losses, expiration of capital loss carryforwards, and wash sale loss deferrals.
The fund declared no distributions for the years ended August 31, 2009 and August 31, 2008.
31
Notes to Financial Statements – continued
The federal tax cost and the tax basis components of distributable earnings were as follows:
| | | |
| As of 8/31/09 | | | |
| Cost of investments | | $144,623,003 | |
| Gross appreciation | | 11,193,604 | |
| Gross depreciation | | (15,554,628 | ) |
| Net unrealized appreciation (depreciation) | | $(4,361,024 | ) |
| | | |
| Capital loss carryforwards | | (106,482,196 | ) |
| Post-October capital loss deferral | | (17,084,500 | ) |
| Other temporary differences | | (24,829 | ) |
As of August 31, 2009, the fund had capital loss carryforwards available to offset future realized gains. Such losses expire as follows:
| | | |
| 8/31/10 | | $(13,128,962 | ) |
| 8/31/11 | | (74,891,618 | ) |
| 8/31/12 | | (4,463,246 | ) |
| 8/31/17 | | (13,998,370 | ) |
| | $(106,482,196 | ) |
The availability of a portion of the capital loss carryforwards, which were acquired on August 22, 2003 in connection with the MFS Global Telecommunications fund merger, may be limited in a given year.
Multiple Classes of Shares of Beneficial Interest – The fund offers multiple classes of shares, which differ in their respective distribution and service fees. The fund’s income, realized and unrealized gain (loss), and common expenses are allocated to shareholders based on the daily net assets of each class. Dividends are declared separately for each class. Differences in per share dividend rates are generally due to differences in separate class expenses. Class B shares will convert to Class A shares approximately eight years after purchase.
| (3) | | Transactions with Affiliates |
Investment Adviser – The fund has an investment advisory agreement with MFS to provide overall investment management and related administrative services and facilities to the fund.
The management fee is computed daily and paid monthly at the following annual rates:
| | | |
| First $1 billion of average daily net assets | | 0.75 | % |
| Average daily net assets in excess of $1 billion | | 0.70 | % |
The management fee incurred for the year ended August 31, 2009 was equivalent to an annual effective rate of 0.75% of the fund’s average daily net assets.
32
Notes to Financial Statements – continued
The investment adviser has agreed in writing to pay a portion of the fund’s operating expenses, exclusive of management fee, distribution and service fee, interest, taxes, extraordinary expenses, brokerage and transaction costs and investment-related expenses, such that operating expenses do not exceed 0.40% annually of the fund’s average daily net assets. This written agreement will continue until modified by the fund’s Board of Trustees, but such agreement will continue at least until December 31, 2009. For the year ended August 31, 2009, this reduction amounted to $336,542 and is reflected as a reduction of total expenses in the Statement of Operations.
Distributor – MFS Fund Distributors, Inc. (MFD), a wholly-owned subsidiary of MFS, as distributor, received $24,259 for the year ended August 31, 2009, as its portion of the initial sales charge on sales of Class A shares of the fund.
The Board of Trustees has adopted a distribution plan for certain class shares pursuant to Rule 12b-1 of the Investment Company Act of 1940.
The fund’s distribution plan provides that the fund will pay MFD for services provided by MFD and financial intermediaries in connection with the distribution and servicing of certain share classes. One component of the plan is a distribution fee paid to MFD and another component of the plan is a service fee paid to MFD. MFD may subsequently pay all, or a portion, of the distribution and/or service fees to financial intermediaries.
Distribution Plan Fee Table:
| | | | | | | | | | |
| | | Distribution
Fee Rate (d) | | Service
Fee Rate (d) | | Total
Distribution
Plan (d) | | Annual
Effective
Rate (e) | | Distribution
and Service
Fee |
| Class A | | — | | 0.25% | | 0.25% | | 0.29% | | $141,490 |
| Class B | | 0.75% | | 0.25% | | 1.00% | | 1.00% | | 130,526 |
| Class C | | 0.75% | | 0.25% | | 1.00% | | 1.00% | | 105,591 |
| Class R1 | | 0.75% | | 0.25% | | 1.00% | | 1.00% | | 14,470 |
| Class R2 | | 0.25% | | 0.25% | | 0.50% | | 0.50% | | 45,831 |
| Class R3 | | — | | 0.25% | | 0.25% | | 0.25% | | 5,194 |
| Total Distribution and Service Fees | | | | | | $443,102 |
| (d) | As of August 31, 2009, in accordance with the distribution plan for certain classes, the fund pays distribution and/or service fees equal to these annual percentage rates of each class’ average daily net assets. The distribution and service fee rates disclosed by class represent the current rates in effect at the end of the reporting period. Any rate changes, if applicable, are detailed below. |
| (e) | The annual effective rates represent actual fees incurred under the distribution plan for the year ended August 31, 2009 based on each class’ average daily net assets. Prior to March 1, 2009, a 0.10% Class A distribution fee was paid by the fund. Effective March 1, 2009, the 0.10% Class A annual distribution fee was eliminated. |
Certain Class A shares purchased prior to September 1, 2008 are subject to a contingent deferred sales charge (CDSC) in the event of a shareholder redemption within 12 months of purchase. Certain Class A shares purchased on or subsequent to September 1, 2008 are subject to a CDSC in the event of a
33
Notes to Financial Statements – continued
shareholder redemption within 24 months of purchase. Class C shares are subject to a CDSC in the event of a shareholder redemption within 12 months of purchase. Class B shares are subject to a CDSC in the event of a shareholder redemption within six years of purchase. All contingent deferred sales charges are paid to MFD and during the year ended August 31, 2009, were as follows:
| | |
| | | Amount |
| Class A | | $— |
| Class B | | 16,918 |
| Class C | | 2,728 |
Shareholder Servicing Agent – MFS Service Center, Inc. (MFSC), a wholly-owned subsidiary of MFS, receives a fee from the fund for its services as shareholder servicing agent calculated as a percentage of the average daily net assets of the fund as determined periodically under the supervision of the fund’s Board of Trustees. For the year ended August 31, 2009, the fee was $230,684, which equated to 0.2583% annually of the fund’s average daily net assets. MFSC also receives payment from the fund for out-of-pocket expenses, sub-accounting and other shareholder servicing costs which may be paid to affiliated and unaffiliated service providers. For the year ended August 31, 2009, these out-of-pocket expenses, sub-accounting and other shareholder servicing costs amounted to $221,006.
Administrator – MFS provides certain financial, legal, shareholder communications, compliance, and other administrative services to the fund. Under an administrative services agreement, the fund partially reimburses MFS the costs incurred to provide these services. The fund is charged an annual fixed amount of $17,500 plus a fee based on average daily net assets. The administrative services fee incurred for the year ended August 31, 2009 was equivalent to an annual effective rate of 0.0278% of the fund’s average daily net assets.
Trustees’ and Officers’ Compensation – The fund pays compensation to independent Trustees in the form of a retainer, attendance fees, and additional compensation to Board and Committee chairpersons. The fund does not pay compensation directly to Trustees or officers of the fund who are also officers of the investment adviser, all of whom receive remuneration for their services to the fund from MFS. Certain officers and Trustees of the fund are officers or directors of MFS, MFD, and MFSC.
Prior to December 31, 2001, the fund had an unfunded defined benefit plan (“DB plan”) for independent Trustees. As of December 31, 2001, the Board took action to terminate the DB plan with respect to then-current and any future independent Trustees, such that the DB Plan covers only certain of those former independent Trustees who retired on or before December 31, 2001. Effective January 1, 2002, accrued benefits under the DB Plan for then current
34
Notes to Financial Statements – continued
independent Trustees who continued were credited to an unfunded retirement deferral plan (the “Retirement Deferral plan”), which was established for and exists solely with respect to these credited amounts, and is not available for other deferrals by these or other independent Trustees. The DB Plan resulted in a pension expense of $512 and the Retirement Deferral plan resulted in a net decrease in expense of $ 7,162. Both amounts are included in independent Trustees’ compensation for the year ended August 31, 2009. The liability for deferred retirement benefits payable to certain independent Trustees under both Plans amounted to $48,231 at August 31, 2009, and is included in payable for independent Trustees’ compensation on the Statement of Assets and Liabilities.
Other – This fund and certain other funds managed by MFS (the funds) have entered into services agreements (the Agreements) which provide for payment of fees by the funds to Tarantino LLC and Griffin Compliance LLC in return for the provision of services of an Independent Chief Compliance Officer (ICCO) and Assistant ICCO, respectively, for the funds. The ICCO and Assistant ICCO are officers of the funds and the sole members of Tarantino LLC and Griffin Compliance LLC, respectively. The funds can terminate the Agreements with Tarantino LLC and Griffin Compliance LLC at any time under the terms of the Agreements. For the year ended August 31, 2009, the aggregate fees paid by the fund to Tarantino LLC and Griffin Compliance LLC were $1,025 and are included in miscellaneous expense on the Statement of Operations. MFS has agreed to reimburse the fund for a portion of the payments made by the fund in the amount of $576, which is shown as a reduction of total expenses in the Statement of Operations. Additionally, MFS has agreed to bear all expenses associated with office space, other administrative support, and supplies provided to the ICCO and Assistant ICCO.
The fund may invest in a money market fund managed by MFS which seeks a high level of current income consistent with preservation of capital and liquidity. Income earned on this investment is included in dividends from underlying funds on the Statement of Operations. This money market fund does not pay a management fee to MFS.
Purchases and sales of investments, other than U.S. Government securities, purchased option transactions, short sales, and short-term obligations, aggregated $231,545,934 and $206,870,298, respectively.
35
Notes to Financial Statements – continued
| (5) | | Shares of Beneficial Interest |
The fund’s Declaration of Trust permits the Trustees to issue an unlimited number of full and fractional shares of beneficial interest. Transactions in fund shares were as follows:
| | | | | | | | | | | | |
| | | Year ended
8/31/09 | | | Year ended
8/31/08 | |
| | | Shares | | | Amount | | | Shares | | | Amount | |
| Shares sold | | | | | | | | | | | | |
Class A | | 5,014,951 | | | $46,118,308 | | | 3,517,764 | | | $48,364,564 | |
Class B | | 371,721 | | | 3,101,549 | | | 299,607 | | | 3,866,214 | |
Class C | | 473,991 | | | 4,114,178 | | | 481,461 | | | 6,306,301 | |
Class I | | 338,035 | | | 3,274,017 | | | 520,379 | | | 7,602,152 | |
Class R (b) | | — | | | — | | | 54,937 | | | 753,955 | |
Class R1 | | 86,025 | | | 682,554 | | | 97,587 | | | 1,262,759 | |
Former Class R2 (b) | | — | | | — | | | 75,207 | | | 967,187 | |
Class R2 | | 677,826 | | | 5,857,349 | | | 847,079 | | | 11,217,679 | |
Class R3 | | 147,649 | | | 1,212,851 | | | 120,559 | | | 1,593,349 | |
Class R4 | | 7,894 | | | 58,764 | | | — | | | — | |
| | 7,118,092 | | | $64,419,570 | | | 6,014,580 | | | $81,934,160 | |
| | | | |
| Shares reacquired | | | | | | | | | | | | |
Class A | | (2,376,489 | ) | | $(21,266,305 | ) | | (2,559,994 | ) | | $(34,899,522 | ) |
Class B | | (882,277 | ) | | (7,019,791 | ) | | (1,357,283 | ) | | (17,384,338 | ) |
Class C | | (334,157 | ) | | (2,670,474 | ) | | (408,375 | ) | | (5,082,966 | ) |
Class I | | (136,625 | ) | | (1,324,807 | ) | | (439,578 | ) | | (6,432,607 | ) |
Class R (b) | | — | | | — | | | (209,323 | ) | | (2,836,415 | ) |
Class R1 | | (105,398 | ) | | (908,227 | ) | | (22,824 | ) | | (287,601 | ) |
Former Class R2 (b) | | — | | | — | | | (171,701 | ) | | (2,206,926 | ) |
Class R2 | | (396,304 | ) | | (3,409,828 | ) | | (261,874 | ) | | (3,325,992 | ) |
Class R3 | | (56,395 | ) | | (485,407 | ) | | (44,714 | ) | | (580,501 | ) |
Class R4 | | (257 | ) | | (2,206 | ) | | — | | | — | |
| | (4,287,902 | ) | | $(37,087,045 | ) | | (5,475,666 | ) | | $(73,036,868 | ) |
| | | | |
| Net change | | | | | | | | | | | | |
Class A | | 2,638,462 | | | $24,852,003 | | | 957,770 | | | $13,465,042 | |
Class B | | (510,556 | ) | | (3,918,242 | ) | | (1,057,676 | ) | | (13,518,124 | ) |
Class C | | 139,834 | | | 1,443,704 | | | 73,086 | | | 1,223,335 | |
Class I | | 201,410 | | | 1,949,210 | | | 80,801 | | | 1,169,545 | |
Class R (b) | | — | | | — | | | (154,386 | ) | | (2,082,460 | ) |
Class R1 | | (19,373 | ) | | (225,673 | ) | | 74,763 | | | 975,158 | |
Former Class R2 (b) | | — | | | — | | | (96,494 | ) | | (1,239,739 | ) |
Class R2 | | 281,522 | | | 2,447,521 | | | 585,205 | | | 7,891,687 | |
Class R3 | | 91,254 | | | 727,444 | | | 75,845 | | | 1,012,848 | |
Class R4 | | 7,637 | | | 56,558 | | | — | | | — | |
| | 2,830,190 | | | $27,332,525 | | | 538,914 | | | $8,897,292 | |
| (b) | At the close of business on April 18, 2008, Class R and Class R2 shares converted into Class R3 shares. Following this conversion, Class R3, Class R4, and Class R5 shares were renamed Class R2, Class R3, and Class R4 shares, respectively. |
36
Notes to Financial Statements – continued
The fund and certain other funds managed by MFS participate in a $1.1 billion unsecured committed line of credit, subject to a $1 billion sublimit, provided by a syndication of banks under a credit agreement. Borrowings may be made for temporary financing needs. Interest is charged to each fund, based on its borrowings, generally at a rate equal to the higher of the Federal Reserve funds rate or one month LIBOR plus an agreed upon spread. A commitment fee, based on the average daily, unused portion of the committed line of credit, is allocated among the participating funds at the end of each calendar quarter. In addition, the fund and other funds managed by MFS have established unsecured uncommitted borrowing arrangements with certain banks for temporary financing needs. Interest is charged to each fund, based on its borrowings, at a rate equal to the Federal Reserve funds rate plus an agreed upon spread. For the year ended August 31, 2009, the fund’s commitment fee and interest expense were $1,063 and $0, respectively, and are included in miscellaneous expense on the Statement of Operations.
| (7) | | Transactions in Underlying Funds-Affiliated Issuers |
An affiliated issuer may be considered one in which the fund owns 5% or more of the outstanding voting securities, or a company which is under common control. For the purposes of this report, the fund assumes the following to be affiliated issuers:
| | | | | | | | | |
| Underlying Funds | | Beginning
Shares/Par
Amount | | Acquisitions
Shares/Par
Amount | | Dispositions
Shares/Par
Amount | | | Ending
Shares/Par
Amount |
MFS Institutional Money
Market Portfolio | | — | | 36,492,268 | | (34,127,563 | ) | | 2,364,705 |
| | | | |
| Underlying Funds | | Realized
Gain (Loss) | | Capital Gain
Distributions | | Dividend
Income | | | Ending
Value |
MFS Institutional Money
Market Portfolio | | $— | | $— | | $3,239 | | | $2,364,705 |
37
REPORT OF INDEPENDENT REGISTERED
PUBLIC ACCOUNTING FIRM
To the Board of Trustees of MFS Series Trust I and Shareholders of
MFS Technology Fund:
We have audited the accompanying statement of assets and liabilities of MFS Technology Fund (the Fund) (one of the portfolios comprising MFS Series Trust I), including the portfolio of investments, as of August 31, 2009, and the related statement of operations for the year then ended, the statements of changes in net assets for each of the two years in the period then ended, and the financial highlights for each of the periods indicated therein. These financial statements and financial highlights are the responsibility of the Fund’s management. Our responsibility is to express an opinion on these financial statements and financial highlights based on our audits.
We conducted our audits in accordance with the standards of the Public Company Accounting Oversight Board (United States). Those standards require that we plan and perform the audit to obtain reasonable assurance about whether the financial statements and financial highlights are free of material misstatement. We were not engaged to perform an audit of the Fund’s internal control over financial reporting. Our audits included consideration of internal control over financial reporting as a basis for designing audit procedures that are appropriate in the circumstances, but not for the purpose of expressing an opinion on the effectiveness of the Fund’s internal control over financial reporting. Accordingly, we express no such opinion. An audit also includes examining, on a test basis, evidence supporting the amounts and disclosures in the financial statements and financial highlights, assessing the accounting principles used and significant estimates made by management, and evaluating the overall financial statement presentation. Our procedures included confirmation of securities owned as of August 31, 2009, by correspondence with the custodian and brokers or by other appropriate auditing procedures where replies from brokers were not received. We believe that our audits provide a reasonable basis for our opinion.
In our opinion, the financial statements and financial highlights referred to above present fairly, in all material respects, the financial position of the MFS Technology Fund at August 31, 2009, the results of its operations for the year then ended, the changes in its net assets for each of the two years in the period then ended, and its financial highlights for each of the periods indicated therein, in conformity with U.S. generally accepted accounting principles.

Boston, Massachusetts
October 16, 2009
38
TRUSTEES AND OFFICERS — IDENTIFICATION AND BACKGROUND
The Trustees and officers of the Trust, as of October 1, 2009, are listed below, together with their principal occupations during the past five years. (Their titles may have varied during that period.) The address of each Trustee and officer is 500 Boylston Street, Boston, Massachusetts 02116.
| | | | | | |
Name, Date of Birth | | Position(s) Held
with Fund | | Trustee/Officer
Since (h) | | Principal Occupations During
the Past Five Years & Other
Directorships (j) |
| INTERESTED TRUSTEES | | | | |
Robert J. Manning (k)
(born 10/20/63) | | Trustee | | February 2004 | | Massachusetts Financial Services Company, Chief Executive Officer, President, Chief Investment Officer and Director |
Robert C. Pozen (k)
(born 8/08/46) | | Trustee | | February 2004 | | Massachusetts Financial Services Company, Chairman (since February 2004); Medtronic, Inc, (medical devices), Director (since 2004); Harvard Business School (education), Senior Lecturer (since 2008); Bell Canada Enterprises (telecommunications), Director (until February 2009); The Bank of New York, Director (finance), (March 2004 to May 2005); Telesat (satellite communications), Director (until November 2007) |
| INDEPENDENT TRUSTEES | | | | |
David H. Gunning
(born 5/30/42) | | Trustee and Chair of Trustees | | January 2004 | | Retired; Cleveland-Cliffs Inc. (mining products and service provider), Vice Chairman/Director (until May 2007); Lincoln Electric Holdings, Inc. (welding equipment manufacturer), Director; Development Alternatives, Inc. (consulting), Director/Non Executive Chairman; Southwest Gas Corp. (natural gas distribution), Director (until May 2004); Portman Limited (mining), Director (until 2008) |
39
Trustees and Officers – continued
| | | | | | |
Name, Date of Birth | | Position(s) Held
with Fund | | Trustee/Officer
Since (h) | | Principal Occupations During
the Past Five Years & Other
Directorships (j) |
Robert E. Butler (n)
(born 11/29/41) | | Trustee | | January 2006 | | Consultant – investment company industry regulatory and compliance matters (since July 2002); PricewaterhouseCoopers LLP (professional services firm), Partner (until 2002) |
Lawrence H. Cohn, M.D.
(born 3/11/37) | | Trustee | | June 1989 | | Brigham and Women’s Hospital, Senior Cardiac Surgeon (since 2005); Harvard Medical School, Professor of Cardiac Surgery; Partners HealthCare, Physician Director of Medical Device Technology (since 2006); Brigham and Women’s Hospital, Chief of Cardiac Surgery (until 2005) |
Maureen R. Goldfarb
(born 4/6/55) | | Trustee | | January 2009 | | Private investor; John Hancock Financial Services, Inc., Executive Vice President (until 2004); John Hancock Mutual Funds, Trustee and Chief Executive Officer (until 2004) |
William R. Gutow
(born 9/27/41) | | Trustee | | December 1993 | | Private investor and real estate consultant; Capital Entertainment Management Company (video franchise), Vice Chairman; Atlantic Coast Tan (tanning salons), Vice Chairman (until 2007); Texas Donuts (donut franchise), Vice Chairman (until 2009) |
Michael Hegarty
(born 12/21/44) | | Trustee | | December 2004 | | Private investor; Retired; AXA Financial (financial services and insurance), Vice Chairman and Chief Operating Officer (until 2001); The Equitable Life Assurance Society (insurance), President and Chief Operating Officer (until 2001) |
J. Atwood Ives
(born 5/01/36) | | Trustee | | February 1992 | | Private investor; KeySpan Corporation (energy related services), Director (until 2004) |
40
Trustees and Officers – continued
| | | | | | |
Name, Date of Birth | | Position(s) Held
with Fund | | Trustee/Officer
Since (h) | | Principal Occupations During
the Past Five Years & Other
Directorships (j) |
John P. Kavanaugh
(born 11/4/54) | | Trustee | | January 2009 | | Private investor; The Hanover Insurance Group, Inc., Vice President and Chief Investment Officer (until 2006); Allmerica Investment Trust, Allmerica Securities Trust and Opus Investment Trust (investment companies), Chairman, President and Trustee (until 2006) |
J. Dale Sherratt
(born 9/23/38) | | Trustee | | June 1989 | | Insight Resources, Inc. (acquisition planning specialists), President; Wellfleet Investments (investor in health care companies), Managing General Partner |
Laurie J. Thomsen
(born 8/05/57) | | Trustee | | March 2005 | | New Profit, Inc. (venture philanthropy), Executive Partner (since 2006); Private investor; Prism Venture Partners (venture capital), Co-founder and General Partner (until June 2004); The Travelers Companies (commercial property liability insurance), Director |
Robert W. Uek
(born 5/18/41) | | Trustee | | January 2006 | | Consultant to investment company industry; PricewaterhouseCoopers LLP (professional services firm), Partner (until 1999); TT International Funds (mutual fund complex), Trustee (until 2005); Hillview Investment Trust II Funds (mutual fund complex), Trustee (until 2005) |
| OFFICERS | | | | | | |
Maria F. Dwyer (k)
(born 12/01/58) | | President | | November 2005 | | Massachusetts Financial Services Company, Executive Vice President and Chief Regulatory Officer (since March 2004) Chief Compliance Officer (since December 2006); Fidelity Management & Research Company, Vice President (prior to March 2004); Fidelity Group of Funds, President and Treasurer (until March 2004) |
41
Trustees and Officers – continued
| | | | | | |
Name, Date of Birth | | Position(s) Held
with Fund | | Trustee/Officer
Since (h) | | Principal Occupations During
the Past Five Years & Other
Directorships (j) |
Christopher R. Bohane (k)
(born 1/18/74) | | Assistant Secretary and Assistant Clerk | | July 2005 | | Massachusetts Financial Services Company, Vice President and Senior Counsel |
John M. Corcoran (k)
(born 04/13/65) | | Treasurer | | October 2008 | | Massachusetts Financial Services Company, Senior Vice President (since October 2008); State Street Bank and Trust (financial services provider), Senior Vice President, (until September 2008) |
Ethan D. Corey (k)
(born 11/21/63) | | Assistant Secretary and Assistant Clerk | | July 2005 | | Massachusetts Financial Services Company, Senior Vice President and Associate General Counsel (since 2004); Dechert LLP (law firm), Counsel (prior to December 2004) |
David L. DiLorenzo (k)
(born 8/10/68) | | Assistant Treasurer | | July 2005 | | Massachusetts Financial Services Company, Vice President (since June 2005); JP Morgan Investor Services, Vice President (until June 2005) |
Timothy M. Fagan (k)
(born 7/10/68) | | Assistant Secretary and Assistant Clerk | | September 2005 | | Massachusetts Financial Services Company, Vice President and Senior Counsel (since September 2005); John Hancock Advisers, LLC, Vice President, Senior Attorney and Chief Compliance Officer (until August 2005) |
Mark D. Fischer (k)
(born 10/27/70) | | Assistant Treasurer | | July 2005 | | Massachusetts Financial Services Company, Vice President (since May 2005); JP Morgan Investment Management Company, Vice President (until May 2005) |
Robyn L. Griffin
(born 7/04/75) | | Assistant Independent Chief Compliance Officer | | August 2008 | | Griffin Compliance LLC (provider of compliance services), Principal (since August 2008); State Street Corporation (financial services provider), Mutual Fund Administration Assistant Vice President (October 2006 – July 2008); Liberty Mutual Group (insurance), Personal Market Assistant Controller (April 2006 – October 2006); Deloitte & Touche LLP (professional services firm), Senior Manager (prior to April 2006) |
42
Trustees and Officers – continued
| | | | | | |
Name, Date of Birth | | Position(s) Held
with Fund | | Trustee/Officer
Since (h) | | Principal Occupations During
the Past Five Years & Other
Directorships (j) |
Brian E. Langenfeld (k)
(born 3/07/73) | | Assistant Secretary and Assistant Clerk | | June 2006 | | Massachusetts Financial Services Company, Vice President and Senior Counsel (since May 2006); John Hancock Advisers, LLC, Assistant Vice President and Counsel (until April 2006) |
Ellen Moynihan (k)
(born 11/13/57) | | Assistant Treasurer | | April 1997 | | Massachusetts Financial Services Company, Senior Vice President |
Susan S. Newton (k)
(born 3/07/50) | | Assistant Secretary and Assistant Clerk | | May 2005 | | Massachusetts Financial Services Company, Senior Vice President and Associate General Counsel (since April 2005); John Hancock Advisers, LLC, Senior Vice President, Secretary and Chief Legal Officer (until April 2005) |
Susan A. Pereira (k)
(born 11/05/70) | | Assistant Secretary and Assistant Clerk | | July 2005 | | Massachusetts Financial Services Company, Vice President and Senior Counsel (since June 2004); Bingham McCutchen LLP (law firm), Associate (until June 2004) |
Mark N. Polebaum (k)
(born 5/01/52) | | Secretary and Clerk | | January 2006 | | Massachusetts Financial Services Company, Executive Vice President, General Counsel and Secretary (since January 2006); Wilmer Cutler Pickering Hale and Dorr LLP (law firm), Partner (until January 2006) |
Frank L. Tarantino
(born 3/07/44) | | Independent Chief Compliance Officer | | June 2004 | | Tarantino LLC (provider of compliance services), Principal (since June 2004); CRA Business Strategies Group (consulting services), Executive Vice President (until June 2004) |
Richard S. Weitzel (k)
(born 7/16/70) | | Assistant Secretary and Assistant Clerk | | October 2007 | | Massachusetts Financial Services Company, Vice President and Assistant General Counsel (since 2004); Massachusetts Department of Business and Technology, General Counsel (until April 2004) |
James O. Yost (k)
(born 6/12/60) | | Assistant Treasurer | | September 1990 | | Massachusetts Financial Services Company, Senior Vice President |
| (h) | Date first appointed to serve as Trustee/officer of an MFS fund. Each Trustee has served continuously since appointment unless indicated otherwise. For the period from December 15, 2004 until February 22, 2005, Messrs. Pozen and Manning served as Advisory Trustees. For the period March 2008 until October 2008, Ms. Dwyer served as Treasurer of the Funds. |
43
Trustees and Officers – continued
| (j) | Directorships or trusteeships of companies required to report to the Securities and Exchange Commission (i.e., “public companies”). |
| (k) | “Interested person” of the Trust within the meaning of the Investment Company Act of 1940 (referred to as the 1940 Act), which is the principal federal law governing investment companies like the fund, as a result of position with MFS. The address of MFS is 500 Boylston Street, Boston, Massachusetts 02116. |
| (n) | In 2004 and 2005, Mr. Butler provided consulting services to the independent compliance consultant retained by MFS pursuant to its settlement with the SEC concerning market timing and related matters. The terms of that settlement required that compensation and expenses related to the independent compliance consultant be borne exclusively by MFS and, therefore, MFS paid Mr. Butler for the services he rendered to the independent compliance consultant. In 2004 and 2005, MFS paid Mr. Butler a total of $351,119.29. |
Each Trustee (except Messrs. Butler, Kavanaugh and Uek and Ms. Goldfarb) has been elected by shareholders and each Trustee and officer holds office until his or her successor is chosen and qualified or until his or her earlier death, resignation, retirement or removal. The Trust held a shareholders’ meeting in 2005 to elect Trustees, and will hold a shareholders’ meeting at least once every five years thereafter, to elect Trustees. Messrs. Butler, Kavanaugh, Sherratt, Uek and Ms. Thomsen are members of the Trust’s Audit Committee.
Each of the Fund’s Trustees and officers holds comparable positions with certain other funds of which MFS or a subsidiary is the investment adviser or distributor, and, in the case of the officers, with certain affiliates of MFS. As of January 1, 2009, the Trustees served as board members of 104 funds within the MFS Family of Funds.
The Statement of Additional Information for the Fund and further information about the Trustees are available without charge upon request by calling 1-800-225-2606.
| | |
| Investment Adviser | | Custodian |
Massachusetts Financial Services Company
500 Boylston Street, Boston, MA 02116-3741 | | State Street Bank and Trust
1 Lincoln Street, Boston, MA 02111-2900 |
| Distributor | | Independent Registered Public Accounting Firm |
MFS Fund Distributors, Inc.
500 Boylston Street, Boston, MA 02116-3741 | | Ernst & Young LLP 200 Clarendon Street, Boston, MA 02116 |
| Portfolio Manager | | |
Telis Bertsekas | | |
44
BOARD REVIEW OF INVESTMENT ADVISORY AGREEMENT
The Investment Company Act of 1940 requires that both the full Board of Trustees and a majority of the non-interested (“independent”) Trustees, voting separately, annually approve the continuation of the Fund’s investment advisory agreement with MFS. The Trustees consider matters bearing on the Fund and its advisory arrangements at their meetings throughout the year, including a review of performance data at each regular meeting. In addition, the independent Trustees met several times over the course of three months beginning in May and ending in July, 2009 (“contract review meetings”) for the specific purpose of considering whether to approve the continuation of the investment advisory agreement for the Fund and the other investment companies that the Board oversees (the “MFS Funds”). The independent Trustees were assisted in their evaluation of the Fund’s investment advisory agreement by independent legal counsel, from whom they received separate legal advice and with whom they met separately from MFS during various contract review meetings. The independent Trustees were also assisted in this process by the MFS Funds’ Independent Chief Compliance Officer, a full-time senior officer appointed by and reporting to the independent Trustees.
In connection with their deliberations regarding the continuation of the investment advisory agreement, the Trustees, including the independent Trustees, considered such information and factors as they believed, in light of the legal advice furnished to them and their own business judgment, to be relevant. The investment advisory agreement for the Fund was considered separately, although the Trustees also took into account the common interests of all MFS Funds in their review. As described below, the Trustees considered the nature, quality, and extent of the various investment advisory, administrative, and shareholder services performed by MFS under the existing investment advisory agreement and other arrangements with the Fund.
In connection with their contract review meetings, the Trustees received and relied upon materials that included, among other items: (i) information provided by Lipper Inc., an independent third party, on the investment performance of the Fund for various time periods ended December 31, 2008 and the investment performance of a group of funds with substantially similar investment classifications/objectives (the “Lipper performance universe”), (ii) information provided by Lipper Inc. on the Fund’s advisory fees and other expenses and the advisory fees and other expenses of comparable funds identified by Lipper Inc. (the “Lipper expense group”), (iii) information provided by MFS on the advisory fees of comparable portfolios of other clients of MFS, including institutional separate accounts and other clients, (iv) information as to whether and to what extent applicable expense waivers, reimbursements or fee “breakpoints” are
45
Board Review of Investment Advisory Agreement – continued
observed for the Fund, (v) information regarding MFS’ financial results and financial condition, including MFS’ and certain of its affiliates’ estimated profitability from services performed for the Fund and the MFS Funds as a whole, (vi) MFS’ views regarding the outlook for the mutual fund industry and the strategic business plans of MFS, (vii) descriptions of various functions performed by MFS for the Funds, such as compliance monitoring and portfolio trading practices, and (viii) information regarding the overall organization of MFS, including information about MFS’ senior management and other personnel providing investment advisory, administrative and other services to the Fund and the other MFS Funds. The comparative performance, fee and expense information prepared and provided by Lipper Inc. was not independently verified and the independent Trustees did not independently verify any information provided to them by MFS.
The Trustees’ conclusion as to the continuation of the investment advisory agreement was based on a comprehensive consideration of all information provided to the Trustees and not the result of any single factor. Some of the factors that figured particularly in the Trustees’ deliberations are described below, although individual Trustees may have evaluated the information presented differently from one another, giving different weights to various factors. It is also important to recognize that the fee arrangements for the Fund and other MFS Funds are the result of years of review and discussion between the independent Trustees and MFS, that certain aspects of such arrangements may receive greater scrutiny in some years than in others, and that the Trustees’ conclusions may be based, in part, on their consideration of these same arrangements during the course of the year and in prior years.
Based on information provided by Lipper Inc., the Trustees reviewed the Fund’s total return investment performance as well as the performance of peer groups of funds over various time periods. The Trustees placed particular emphasis on the total return performance of the Fund’s Class A shares in comparison to the performance of funds in its Lipper performance universe over the three-year period ended December 31, 2008, which the Trustees believed was a long enough period to reflect differing market conditions. The total return performance of the Fund’s Class A shares was in the 2nd quintile relative to the other funds in the universe for this three-year period (the 1st quintile being the best performers and the 5th quintile being the worst performers). The total return performance of the Fund’s Class A shares was in the 4th quintile for the one-year period and the 3rd quintile for the five-year period ended December 31, 2008 relative to the Lipper performance universe. Because of the passage of time, these performance results are likely to differ from the performance results for more recent periods, including those shown elsewhere in this report.
46
Board Review of Investment Advisory Agreement – continued
In the course of their deliberations, the Trustees took into account information provided by MFS in connection with the contract review meetings, as well as during investment review meetings conducted with portfolio management personnel during the course of the year regarding the Fund’s performance. After reviewing these and related factors, the Trustees concluded, within the context of their overall conclusions regarding the investment advisory agreement, that they were satisfied with MFS’ responses and efforts relating to investment performance.
In assessing the reasonableness of the Fund’s advisory fee, the Trustees considered, among other information, the Fund’s advisory fee and the total expense ratio of the Fund’s Class A shares as a percentage of average daily net assets and the advisory fee and total expense ratios of peer groups of funds based on information provided by Lipper Inc. The Trustees considered that MFS currently observes an expense limitation for the Fund. The Trustees also considered that, according to the Lipper data (which takes into account any fee reductions or expense limitations that were in effect during the Fund’s last fiscal year), the Fund’s effective advisory fee rate and total expense ratio were each lower than the Lipper expense group median.
The Trustees also considered the advisory fees charged by MFS to institutional accounts. In comparing these fees, the Trustees considered information provided by MFS as to the generally broader scope of services provided by MFS to the Fund in comparison to institutional accounts, the higher demands placed on MFS’ investment personnel and trading infrastructure as a result of the daily cash in-flows and out-flows of the Fund, and the impact on MFS and expenses associated with the more extensive regulatory regime to which the Fund is subject in comparison to institutional accounts.
The Trustees also considered whether the Fund is likely to benefit from any economies of scale in the management of the Fund in the event of growth in assets of the Fund. They noted that the Fund’s advisory fee rate schedule is currently subject to a contractual breakpoint that reduces the Fund’s advisory fee rate on average daily net assets over $1.0 billion. The Trustees concluded that the existing breakpoint was sufficient to allow the Fund to benefit from economies of scale as its assets grow.
The Trustees also considered information prepared by MFS relating to MFS’ costs and profits with respect to the Fund, the MFS Funds considered as a group, and other investment companies and accounts advised by MFS, as well as MFS’ methodologies used to determine and allocate its costs to the MFS Funds, the Fund and other accounts and products for purposes of estimating profitability.
After reviewing these and other factors described herein, the Trustees concluded, within the context of their overall conclusions regarding the
47
Board Review of Investment Advisory Agreement – continued
investment advisory agreement, that the advisory fees charged to the Fund represent reasonable compensation in light of the services being provided by MFS to the Fund.
In addition, the Trustees considered MFS’ resources and related efforts to continue to retain, attract and motivate capable personnel to serve the Fund. The Trustees also considered current and developing conditions in the financial services industry, including the entry into the industry of large and well-capitalized companies which are spending, and appear to be prepared to continue to spend, substantial sums to engage personnel and to provide services to competing investment companies. In this regard, the Trustees also considered the financial resources of MFS and its ultimate parent, Sun Life Financial Inc. The Trustees also considered the advantages and possible disadvantages to the Fund of having an adviser that also serves other investment companies as well as other accounts.
The Trustees also considered the nature, quality, cost, and extent of administrative, transfer agency, and distribution services provided to the Fund by MFS and its affiliates under agreements and plans other than the investment advisory agreement, including any 12b-1 fees the Fund pays to MFS Fund Distributors, Inc., an affiliate of MFS. The Trustees also considered the nature, extent and quality of certain other services MFS performs or arranges for on the Fund’s behalf, which may include securities lending programs, directed expense payment programs, class action recovery programs, and MFS’ interaction with third-party service providers, principally custodians and sub-custodians. The Trustees concluded that the various non-advisory services provided by MFS and its affiliates on behalf of the Funds were satisfactory.
The Trustees also considered benefits to MFS from the use of the Fund’s portfolio brokerage commissions, if applicable, to pay for investment research, and various other factors. Additionally, the Trustees considered so-called “fall-out benefits” to MFS such as reputational value derived from serving as investment manager to the Fund.
Based on their evaluation of factors that they deemed to be material, including those factors described above, the Board of Trustees, including a majority of the independent Trustees, concluded that the Fund’s investment advisory agreement with MFS should be continued for an additional one-year period, commencing August 1, 2009.
A discussion regarding the Board’s most recent review and renewal of the fund’s Investment Advisory Agreement with MFS will be available on or about November 1, 2009 by clicking on the fund’s name under “Mutual Funds” in the “Products and Performance” section of the MFS Web site (mfs.com).
48
PROXY VOTING POLICIES AND INFORMATION
A general description of the MFS funds’ proxy voting policies and procedures is available without charge, upon request, by calling
1-800-225-2606, by visiting the Proxy Voting section of mfs.com or by visiting the SEC’s Web site at http://www.sec.gov.
Information regarding how the fund voted proxies relating to portfolio securities during the most recent twelve-month period ended June 30 is available without charge by visiting the Proxy Voting section of mfs.com or by visiting the SEC’s Web site at http://www.sec.gov.
QUARTERLY PORTFOLIO DISCLOSURE
The fund will file a complete schedule of portfolio holdings with the Securities and Exchange Commission (the Commission) for the first and third quarters of each fiscal year on Form N-Q. The fund’s Form N-Q may be reviewed and copied at the:
Public Reference Room
Securities and Exchange Commission
100 F Street, NE, Room 1580
Washington, D.C. 20549
Information on the operation of the Public Reference Room may be obtained by calling the Commission at 1-800-SEC-0330. The fund’s Form N-Q is available on the EDGAR database on the Commission’s Internet Web site at http://www.sec.gov, and copies of this information may be obtained, upon payment of a duplicating fee, by electronic request at the following e-mail address: publicinfo@sec.gov or by writing the Public Reference Section at the above address.
A shareholder can also obtain the quarterly portfolio holdings report at mfs.com.
FURTHER INFORMATION
From time to time, MFS may post important information about the fund or the MFS funds on the MFS web site (mfs.com). This information is available by visiting the “News & Commentary” section of mfs.com or by clicking on the fund’s name under “Mutual Funds” in the “Products and Performance” section of mfs.com.
FEDERAL TAX INFORMATION (unaudited)
The fund will notify shareholders of amounts for use in preparing 2009 income tax forms in January 2010.
49
MFS® PRIVACY NOTICE
Privacy is a concern for every investor today. At MFS Investment Management® and the MFS funds, we take this concern very seriously. We want you to understand our policies about the investment products and services that we offer, and how we protect the nonpublic personal information of investors who have a direct relationship with us and our wholly owned subsidiaries.
Throughout our business relationship, you provide us with personal information. We maintain information and records about you, your investments, and the services you use. Examples of the nonpublic personal information we maintain include
| | Ÿ | | data from investment applications and other forms |
| | Ÿ | | share balances and transactional history with us, our affiliates, or others |
| | Ÿ | | facts from a consumer reporting agency |
We do not disclose any nonpublic personal information about our customers or former customers to anyone, except as permitted by law. We may share nonpublic personal information with third parties or certain of our affiliates in connection with servicing your account or processing your transactions. We may share information with companies or financial institutions that perform marketing services on our behalf or with other financial institutions with which we have joint marketing arrangements, subject to any legal requirements.
Authorization to access your nonpublic personal information is limited to appropriate personnel who provide products, services, or information to you. We maintain physical, electronic, and procedural safeguards to help protect the personal information we collect about you.
If you have any questions about the MFS privacy policy, please call 1-800-225-2606 any business day between 8 a.m. and 8 p.m. Eastern time.
Note: If you own MFS products or receive MFS services in the name of a third party such as a bank or broker-dealer, their privacy policy may apply to you instead of ours.
50
CONTACT US
| | |
Web site mfs.com MFS TALK 1-800-637-8255 24 hours a day Account service and literature Shareholders 1-800-225-2606 Investment professionals 1-800-343-2829 Retirement plan services 1-800-637-1255 | | Mailing address MFS Service Center, Inc. P.O. Box 55824 Boston, MA 02205-5824 Overnight mail MFS Service Center, Inc. c/o Boston Financial Data Services 30 Dan Road Canton, MA 02021-2809 |

Save paper with eDelivery. MFS® will send you prospectuses, reports, and proxies directly via e-mail so you will get information faster with less mailbox clutter. To sign up: 1. go to mfs.com. 2. log in via MFS® Access. 3. select eDelivery. If you own your MFS fund shares through a financial institution or a retirement plan, MFS® TALK, MFS Access, and eDelivery may not be available to you.


MFS® Value Fund
SIPC Contact Information:
You may obtain information about the Securities Investor Protection Corporation (“SIPC”), including the SIPC Brochure, by contacting SIPC either by telephone (202-371-8300) or by accessing SIPC’s website address (www.sipc.org).
The report is prepared for the general information of shareholders. It is authorized for distribution to prospective investors only when preceded or accompanied by a current prospectus.
NOT FDIC INSURED Ÿ MAY LOSE VALUE Ÿ
NO BANK GUARANTEE
8/31/09
EIF-ANN

LETTER FROM THE CEO
Dear Shareholders:
In the fall of 2008, the markets took investors on what was perhaps the most tumultuous ride of their lives. Many are now debating when the market will stage a sustainable recovery, but not even the most experienced investor can provide a definitive answer to that question.
Even so, the basic rules of investing have not changed, and the turbulence reinforced the benefits of investing through the waves. Investors who jumped ship early on may have regretted their decisions when the markets gained some traction in the early half of this year. While anyone with a short-term horizon may have needed to take some action, most with longer-term goals probably found the best option was to stick with their long-term strategy.
At MFS® we believe investors are always best served by developing a plan with their investment professionals that addresses specific long-term needs. Most advisors agree that yearly reviews are important to monitor a plan’s progress. Most would also caution their clients against reacting too quickly to the daily news. When markets do recover, they often gain ground in quick, sudden bursts. If you are out of the market, you can easily miss the benefits of these rallies.
Few of us would again like to live through the kind of market turmoil we saw over the past year. But as turbulent as markets were, in our view, they proved that the fundamental principles of long-term investing still apply.
Respectfully,

Robert J. Manning
Chief Executive Officer and Chief Investment Officer
MFS Investment Management®
October 15, 2009
The opinions expressed in this letter are subject to change, may not be relied upon for investment advice, and no forecasts can be guaranteed.
1
PORTFOLIO COMPOSITION
Portfolio structure

| | |
| Top ten holdings | | |
| Lockheed Martin Corp. | | 4.4% |
| AT&T, Inc. | | 3.3% |
| MetLife, Inc. | | 3.0% |
| JPMorgan Chase & Co. | | 3.0% |
| Philip Morris International, Inc. | | 3.0% |
| TOTAL S.A., ADR | | 2.8% |
| Goldman Sachs Group, Inc. | | 2.7% |
| Bank of New York Mellon Corp. | | 2.6% |
| Northrop Grumman Corp. | | 2.3% |
| Exxon Mobil Corp. | | 2.2% |
| | |
| Equity sectors | | |
| Financial Services | | 20.9% |
| Energy | | 13.1% |
| Health Care | | 12.0% |
| Industrial Goods & Services | | 10.5% |
| Consumer Staples | | 10.2% |
| Utilities & Communications | | 9.4% |
| Technology | | 5.2% |
| Retailing | | 4.9% |
| Basic Materials | | 3.9% |
| Leisure | | 3.6% |
| Special Products & Services | | 2.8% |
| Autos & Housing | | 1.8% |
| Transportation | | 0.3% |
Percentages are based on net assets as of 8/31/09.
The portfolio is actively managed and current holdings may be different.
2
MANAGEMENT REVIEW
Summary of Results
For the twelve months ended August 31, 2009, Class A shares of the MFS Value Fund provided a total return of –16.75%, at net asset value. This compares with a return of –20.27% for the fund’s benchmark, the Russell 1000 Value Index.
Market Environment
The global economy and financial markets experienced substantial deterioration and extraordinary volatility over most of the reporting period. Through the first quarter of 2009, the strong headwinds in the U.S. included accelerated deterioration in the housing market, anemic corporate investment, a rapidly declining job market, and a much tighter credit environment. During the early stages of the period, a seemingly continuous series of tumultuous financial events hammered markets. As a result of this barrage of turbulent news, global equity markets pushed significantly lower and credit markets witnessed the worst market decline since the beginning of the credit crisis. The synchronized global downturn in economic activity experienced in the fourth quarter of 2008 and the first quarter of 2009 was among the most intense in the post-World War II period. Not only did Europe and Japan fall into very deep recessions, but an increasingly powerful engine of global growth — emerging markets — also contracted almost across the board. Though credit conditions and equity indices improved considerably during the second half of the period, the degree of financial and macroeconomic dislocation remained significant.
During the first half of the reporting period, the Fed continued to cut interest rates aggressively towards zero, while making increasing use of its new lending facilities to alleviate ever-tightening credit markets. On the fiscal front, the U.S. Treasury designed and began implementing a massive fiscal stimulus package. As inflationary concerns diminished in the face of global deleveraging, and equity and credit markets deteriorated more sharply, central banks around the world also cut interest rates dramatically. Policy makers in different countries increasingly sought to coordinate their rescue efforts, which resulted in a number of international actions such as the agreement of swap lines between the Federal Reserve and a number of other central banks and a substantial increase in the financial resources of the International Monetary Fund. By the middle of the period, several central banks had approached their lower bound on policy rates and were examining the implementation and ramifications of quantitative easing as a means to further loosen monetary policy to offset the continuing fall in global economic activity. However, by the end of the period, there emerged broadening signs that the worst of the global macroeconomic deterioration had passed, which caused the subsequent rise in
3
Management Review – continued
asset valuations. As asset prices rebounded in the second half of the period and the demand for liquidity waned, the debate concerning monetary exit strategies had begun, creating added uncertainty regarding the forward path of policy rates.
Contributors to Performance
The combination of an overweighted position and good stock selection in the technology sector boosted performance relative to the Russell 1000 Value Index. Holdings of enterprise software products maker Oracle (aa), semiconductor manufacturer Intel, and information technology products and services provider IBM (aa) contributed to relative returns over the reporting period. Shares of Oracle significantly outperformed the Russell 1000 Value index during the period as the company’s very strong balance sheet and better-than-expected results were positively received by investors.
Security selection in the industrial goods and services sector was another positive factor for relative performance. Not owning diversified industrial conglomerate General Electric benefited relative results as this benchmark constituent significantly underperformed the benchmark as a whole.
The fund’s underweighted position in the energy sector and stock selection in the basic materials sector also positively impacted relative performance. Within the energy sector, integrated oil company TOTAL (aa) (France) added to the fund’s relative returns as the company fared better than the benchmark. No individual stocks within the basic materials sector were among the fund’s top contributors for the reporting period.
Elsewhere, our avoidance of weak-performing financial services firm Citigroup and insurance company American International Group strongly contributed to relative results as shares of each firm declined dramatically during the financial crisis. Holdings of pharmaceutical company Wyeth, tobacco manufacturer Philip Morris International (aa), and financial services firm Goldman Sachs also bolstered relative performance.
Detractors from Performance
Over the reporting period, several individual stocks dampened relative returns. These included defense contractor Lockheed Martin (aa), integrated oil and gas company Hess, and insurance company Allstate Corporation. The fund’s ownership of Lockheed Martin negatively affected results as investor concern regarding the future outlook for defense spending and weaker-than-expected results at the end of the period led to the stock’s underperformance during the quarter. Our ownership of financial services firm Bank of America and insurance company Genworth during the early part of the period, when their share prices declined significantly in the face of the financial crisis, combined with our decision to eliminate each from the fund prior to their strong share
4
Management Review – continued
price performance during the second half of the period, weighed on the fund’s relative returns. The fund’s underweighted position in strong-performing financial services company JPMorgan Chase also hampered results.
Currency exposure was another detractor from the fund’s relative performance. All of MFS’ investment decisions are driven by the fundamentals of each individual opportunity and, as such, it is common for our funds to have different currency exposure than the benchmark.
Respectfully,
| | |
| Nevin Chitkara | | Steven Gorham |
| Portfolio Manager | | Portfolio Manager |
| (aa) | Security is not a benchmark constituent. |
| (g) | Security was not held in the portfolio at period end. |
The views expressed in this report are those of the portfolio managers only through the end of the period of the report as stated on the cover and do not necessarily reflect the views of MFS or any other person in the MFS organization. These views are subject to change at any time based on market or other conditions, and MFS disclaims any responsibility to update such views. These views may not be relied upon as investment advice or an indication of trading intent on behalf of any MFS portfolio. References to specific securities are not recommendations of such securities, and may not be representative of any MFS portfolio’s current or future investments.
5
PERFORMANCE SUMMARY THROUGH 8/31/09
The following chart illustrates a representative class of the fund's historical performance in comparison to its benchmark(s). Performance results include the deduction of the maximum applicable sales charge and reflect the percentage change in net asset value, including reinvestment of dividends and capital gains distributions. The performance of other share classes will be greater than or less than that of the class depicted below. Benchmarks are unmanaged and may not be invested in directly. Benchmark returns do not reflect sales charges, commissions or expenses. (See Notes to Performance Summary.)
Performance data shown represents past performance and is no guarantee of future results. Investment return and principal value fluctuate so your shares, when sold, may be worth more or less than the original cost; current performance may be lower or higher than quoted. The performance shown does not reflect the deduction of taxes, if any, that a shareholder would pay on fund distributions or the redemption of fund shares.
Growth of a Hypothetical $10,000 Investment
6
Performance Summary – continued
Total Returns through 8/31/09
Average annual without sales charge
| | | | | | | | | | | | | | |
| | | Share class | | Class inception date | | 1-yr | | 5-yr | | 10-yr | | Life (t) | | |
| | | A | | 1/02/96 | | (16.75)% | | 2.88% | | 4.48% | | N/A | | |
| | | B | | 11/04/97 | | (17.36)% | | 2.19% | | 3.79% | | N/A | | |
| | | C | | 11/05/97 | | (17.35)% | | 2.20% | | 3.80% | | N/A | | |
| | | I | | 1/02/97 | | (16.53)% | | 3.22% | | 4.83% | | N/A | | |
| | | W | | 5/01/06 | | (16.61)% | | N/A | | N/A | | (2.96)% | | |
| | | R1 | | 4/01/05 | | (17.38)% | | N/A | | N/A | | (0.20)% | | |
| | | R2 | | 10/31/03 | | (16.96)% | | 2.58% | | N/A | | 4.20% | | |
| | | R3 | | 4/01/05 | | (16.75)% | | N/A | | N/A | | 0.53% | | |
| | | R4 | | 4/01/05 | | (16.56)% | | N/A | | N/A | | 0.81% | | |
| | | 529A | | 7/31/02 | | (16.84)% | | 2.66% | | N/A | | 5.28% | | |
| | | 529B | | 7/31/02 | | (17.46)% | | 1.98% | | N/A | | 4.61% | | |
| | | 529C | | 7/31/02 | | (17.45)% | | 1.97% | | N/A | | 4.61% | | |
| Comparative benchmark | | | | | | | | | | |
| | | Russell 1000 Value Index (f) | | (20.27)% | | 0.45% | | 1.84% | | N/A | | |
| Average annual with sales charge | | | | | | | | |
| | | A
With Initial Sales Charge (5.75%) | | (21.54)% | | 1.66% | | 3.86% | | N/A | | |
| | | B
With CDSC (Declining over six years from 4% to 0%) (x) | | (20.63)% | | 1.85% | | 3.79% | | N/A | | |
| | | C
With CDSC (1% for 12 months) (x) | | (18.16)% | | 2.20% | | 3.80% | | N/A | | |
| | | 529A
With Initial Sales Charge (5.75%) | | (21.62)% | | 1.45% | | N/A | | 4.41% | | |
| | | 529B
With CDSC (Declining over six years from 4% to 0%) (x) | | (20.72)% | | 1.63% | | N/A | | 4.61% | | |
| | | 529C
With CDSC (1% for 12 months) (x) | | (18.27)% | | 1.97% | | N/A | | 4.61% | | |
Class I, W, R1, R2, R3, and R4 shares do not have a sales charge.
| CDSC | – Contingent Deferred Sales Charge. |
| (f) | Source: FactSet Research Systems Inc. |
| (t) | For the period from the commencement of the class’ inception date through the stated period end (for those share classes with less than 10 years of performance history). No comparative benchmark information is provided for “life” periods. (See Notes to Performance Summary below.) |
| (x) | Assuming redemption at the end of the applicable period. |
7
Performance Summary – continued
Benchmark Definition
Russell 1000 Value Index – constructed to provide a comprehensive barometer for the value securities in the large-cap segment of the U.S. equity universe. Companies in this index generally have lower price-to-book ratios and lower forecasted growth values.
It is not possible to invest directly in an index.
Notes to Performance Summary
Average annual total return represents the average annual change in value for each share class for the periods presented. Life returns are presented where the share class has less than 10 years of performance history and represent the average annual total return from the class inception date to the stated period end date. As the fund’s share classes may have different inception dates, the life returns may represent different time periods and may not be comparable. As a result, no comparative benchmark performance information is provided for life periods.
Performance results reflect any applicable expense subsidies and waivers in effect during the periods shown. Without such subsidies and waivers the fund’s performance results would be less favorable. Please see the prospectus and financial statements for complete details.
From time to time the fund may receive proceeds from litigation settlements, without which performance would be lower.
8
EXPENSE TABLE
Fund expenses borne by the shareholders during the period, March 1, 2009 through August 31, 2009
As a shareholder of the fund, you incur two types of costs: (1) transaction costs, including sales charges (loads) on certain purchase or redemption payments, and (2) ongoing costs, including management fees; distribution and service (12b-1) fees; and other fund expenses. This example is intended to help you understand your ongoing costs (in dollars) of investing in the fund and to compare these costs with the ongoing costs of investing in other mutual funds.
The example is based on an investment of $1,000 invested at the beginning of the period and held for the entire period March 1, 2009 through August 31, 2009.
The expenses include the payment of a portion of the transfer-agent-related expenses of MFS funds that invest in the fund. For further information, please see the Notes to the Financial Statements.
Actual Expenses
The first line for each share class in the following table provides information about actual account values and actual expenses. You may use the information in this line, together with the amount you invested, to estimate the expenses that you paid over the period. Simply divide your account value by $1,000 (for example, an $8,600 account value divided by $1,000 = 8.6), then multiply the result by the number in the first line under the heading entitled “Expenses Paid During Period” to estimate the expenses you paid on your account during this period.
Hypothetical Example for Comparison Purposes
The second line for each share class in the following table provides information about hypothetical account values and hypothetical expenses based on the fund’s actual expense ratio and an assumed rate of return of 5% per year before expenses, which is not the fund’s actual return. The hypothetical account values and expenses may not be used to estimate the actual ending account balance or expenses you paid for the period. You may use this information to compare the ongoing costs of investing in the fund and other funds. To do so, compare this 5% hypothetical example with the 5% hypothetical examples that appear in the shareholder reports of the other funds.
Please note that the expenses shown in the table are meant to highlight your ongoing costs only and do not reflect any transactional costs, such as sales charges (loads). Therefore, the second line for each share class in the table is useful in comparing ongoing costs only, and will not help you determine the relative total costs of owning different funds. In addition, if these transactional costs were included, your costs would have been higher.
9
Expense Table – continued
| | | | | | | | | | |
Share
Class | | | | Annualized
Expense
Ratio | | Beginning
Account Value
3/01/09 | | Ending
Account Value
8/31/09 | | Expenses
Paid During
Period (p) 3/01/09-8/31/09 |
| A | | Actual | | 1.02% | | $1,000.00 | | $1,386.19 | | $6.13 |
| | Hypothetical (h) | | 1.02% | | $1,000.00 | | $1,020.06 | | $5.19 |
| B | | Actual | | 1.77% | | $1,000.00 | | $1,380.56 | | $10.62 |
| | Hypothetical (h) | | 1.77% | | $1,000.00 | | $1,016.28 | | $9.00 |
| C | | Actual | | 1.77% | | $1,000.00 | | $1,381.57 | | $10.63 |
| | Hypothetical (h) | | 1.77% | | $1,000.00 | | $1,016.28 | | $9.00 |
| I | | Actual | | 0.76% | | $1,000.00 | | $1,388.46 | | $4.58 |
| | Hypothetical (h) | | 0.76% | | $1,000.00 | | $1,021.37 | | $3.87 |
| W | | Actual | | 0.87% | | $1,000.00 | | $1,386.93 | | $5.23 |
| | Hypothetical (h) | | 0.87% | | $1,000.00 | | $1,020.82 | | $4.43 |
| R1 | | Actual | | 1.76% | | $1,000.00 | | $1,380.33 | | $10.56 |
| | Hypothetical (h) | | 1.76% | | $1,000.00 | | $1,016.33 | | $8.94 |
| R2 | | Actual | | 1.26% | | $1,000.00 | | $1,384.10 | | $7.57 |
| | Hypothetical (h) | | 1.26% | | $1,000.00 | | $1,018.85 | | $6.41 |
| R3 | | Actual | | 1.02% | | $1,000.00 | | $1,385.85 | | $6.13 |
| | Hypothetical (h) | | 1.02% | | $1,000.00 | | $1,020.06 | | $5.19 |
| R4 | | Actual | | 0.75% | | $1,000.00 | | $1,386.99 | | $4.51 |
| | Hypothetical (h) | | 0.75% | | $1,000.00 | | $1,021.42 | | $3.82 |
| 529A | | Actual | | 1.12% | | $1,000.00 | | $1,385.61 | | $6.73 |
| | Hypothetical (h) | | 1.12% | | $1,000.00 | | $1,019.56 | | $5.70 |
| 529B | | Actual | | 1.87% | | $1,000.00 | | $1,380.02 | | $11.22 |
| | Hypothetical (h) | | 1.87% | | $1,000.00 | | $1,015.78 | | $9.50 |
| 529C | | Actual | | 1.87% | | $1,000.00 | | $1,380.36 | | $11.22 |
| | Hypothetical (h) | | 1.87% | | $1,000.00 | | $1,015.78 | | $9.50 |
| (h) | 5% class return per year before expenses. |
| (p) | Expenses paid is equal to each class’ annualized expense ratio, as shown above, multiplied by the average account value over the period, multiplied by the number of days in the period, divided by the number of days in the year. Expenses paid do not include any applicable sales charges (loads). If these transaction costs had been included, your costs would have been higher. |
10
PORTFOLIO OF INVESTMENTS
8/31/09
The Portfolio of Investments is a complete list of all securities owned by your fund. It is categorized by broad-based asset classes.
| | | | | |
| Common Stocks - 98.6% | | | | | |
| Issuer | | Shares/Par | | Value ($) |
| | | | | |
| Aerospace - 8.7% | | | | | |
| Lockheed Martin Corp. | | 6,097,947 | | $ | 457,224,062 |
| Northrop Grumman Corp. | | 4,944,585 | | | 241,345,194 |
| United Technologies Corp. | | 3,577,277 | | | 212,347,163 |
| | | | | |
| | | | | $ | 910,916,419 |
| Alcoholic Beverages - 1.6% | | | | | |
| Diageo PLC | | 8,944,219 | | $ | 138,909,581 |
| Molson Coors Brewing Co. | | 563,305 | | | 26,689,391 |
| | | | | |
| | | | | $ | 165,598,972 |
| Apparel Manufacturers - 1.1% | | | | | |
| NIKE, Inc., “B” | | 2,164,180 | | $ | 119,873,930 |
| | |
| Automotive - 0.5% | | | | | |
| Johnson Controls, Inc. | | 2,037,955 | | $ | 50,480,145 |
| | |
| Broadcasting - 3.3% | | | | | |
| Omnicom Group, Inc. | | 3,808,150 | | $ | 138,312,008 |
| Walt Disney Co. | | 5,961,687 | | | 155,242,329 |
| WPP Group PLC | | 6,084,930 | | | 51,149,761 |
| | | | | |
| | | | | $ | 344,704,098 |
| Business Services - 2.6% | | | | | |
| Accenture Ltd., “A” | | 5,756,280 | | $ | 189,957,240 |
| Dun & Bradstreet Corp. | | 473,515 | | | 34,585,536 |
| Western Union Co. | | 2,555,890 | | | 46,108,256 |
| | | | | |
| | | | | $ | 270,651,032 |
| Chemicals - 2.9% | | | | | |
| 3M Co. | | 1,459,883 | | $ | 105,257,564 |
| PPG Industries, Inc. | | 3,524,837 | | | 195,275,970 |
| | | | | |
| | | | | $ | 300,533,534 |
| Computer Software - 1.4% | | | | | |
| Oracle Corp. | | 6,614,273 | | $ | 144,654,151 |
11
Portfolio of Investments – continued
| | | | | |
| Issuer | | Shares/Par | | Value ($) |
| | | | | |
| Common Stocks - continued | | | | | |
| Computer Software - Systems - 2.1% | | | | | |
| Hewlett-Packard Co. | | 779,780 | | $ | 35,004,324 |
| International Business Machines Corp. | | 1,542,682 | | | 182,113,610 |
| | | | | |
| | | | | $ | 217,117,934 |
| Construction - 1.3% | | | | | |
| Pulte Homes, Inc. | | 3,733,715 | | $ | 47,716,878 |
| Sherwin-Williams Co. | | 1,435,425 | | | 86,412,585 |
| | | | | |
| | | | | $ | 134,129,463 |
| Consumer Products - 1.2% | | | | | |
| Kimberly-Clark Corp. | | 351,390 | | $ | 21,245,039 |
| Procter & Gamble Co. | | 1,970,009 | | | 106,597,187 |
| | | | | |
| | | | | $ | 127,842,226 |
| Consumer Services - 0.2% | | | | | |
| Apollo Group, Inc., “A” (a) | | 324,805 | | $ | 21,053,860 |
| | |
| Electrical Equipment - 1.0% | | | | | |
| Danaher Corp. | | 748,380 | | $ | 45,434,150 |
| W.W. Grainger, Inc. | | 646,028 | | | 56,508,069 |
| | | | | |
| | | | | $ | 101,942,219 |
| Electronics - 1.7% | | | | | |
| Intel Corp. | | 8,840,277 | | $ | 179,634,429 |
| | |
| Energy - Independent - 3.9% | | | | | |
| Apache Corp. | | 1,711,420 | | $ | 145,385,129 |
| Devon Energy Corp. | | 1,802,207 | | | 110,619,466 |
| EOG Resources, Inc. | | 1,198,300 | | | 86,277,600 |
| Occidental Petroleum Corp. | | 1,000,352 | | | 73,125,731 |
| | | | | |
| | | | | $ | 415,407,926 |
| Energy - Integrated - 8.5% | | | | | |
| Chevron Corp. | | 2,869,964 | | $ | 200,725,282 |
| ConocoPhillips | | 1,008,590 | | | 45,416,808 |
| Exxon Mobil Corp. | | 3,309,155 | | | 228,828,068 |
| Hess Corp. | | 2,462,710 | | | 124,588,499 |
| TOTAL S.A., ADR | | 5,088,484 | | | 291,417,479 |
| | | | | |
| | | | | $ | 890,976,136 |
| Food & Beverages - 3.9% | | | | | |
| J.M. Smucker Co. | | 799,167 | | $ | 41,772,459 |
| Kellogg Co. | | 1,764,951 | | | 83,111,543 |
12
Portfolio of Investments – continued
| | | | | |
| Issuer | | Shares/Par | | Value ($) |
| | | | | |
| Common Stocks - continued | | | | | |
| Food & Beverages - continued | | | | | |
| Nestle S.A. | | 4,015,204 | | $ | 166,766,146 |
| PepsiCo, Inc. | | 2,053,273 | | | 116,358,981 |
| | | | | |
| | | | | $ | 408,009,129 |
| Food & Drug Stores - 2.5% | | | | | |
| CVS Caremark Corp. | | 4,437,352 | | $ | 166,489,447 |
| Kroger Co. | | 4,454,310 | | | 96,168,553 |
| | | | | |
| | | | | $ | 262,658,000 |
| General Merchandise - 0.4% | | | | | |
| Macy’s, Inc. | | 2,501,130 | | $ | 38,817,538 |
| | |
| Health Maintenance Organizations - 0.2% | | | | | |
| WellPoint, Inc. (a) | | 444,475 | | $ | 23,490,504 |
| | |
| Insurance - 7.9% | | | | | |
| Allstate Corp. | | 7,015,178 | | $ | 206,176,081 |
| Aon Corp. | | 2,041,970 | | | 85,272,667 |
| Chubb Corp. | | 1,450,705 | | | 71,650,320 |
| MetLife, Inc. | | 8,205,453 | | | 309,837,905 |
| Prudential Financial, Inc. | | 1,270,950 | | | 64,284,651 |
| Travelers Cos., Inc. | | 1,924,823 | | | 97,049,576 |
| | | | | |
| | | | | $ | 834,271,200 |
| Leisure & Toys - 0.3% | | | | | |
| Hasbro, Inc. | | 1,074,780 | | $ | 30,513,004 |
| | |
| Machinery & Tools - 0.8% | | | | | |
| Eaton Corp. | | 1,519,077 | | $ | 81,954,204 |
| | |
| Major Banks - 12.7% | | | | | |
| Bank of New York Mellon Corp. | | 9,167,508 | | $ | 271,449,912 |
| Goldman Sachs Group, Inc. | | 1,733,095 | | | 286,757,899 |
| JPMorgan Chase & Co. | | 7,128,470 | | | 309,803,306 |
| PNC Financial Services Group, Inc. | | 1,638,852 | | | 69,798,707 |
| State Street Corp. | | 3,799,065 | | | 199,374,931 |
| Wells Fargo & Co. | | 7,080,397 | | | 194,852,525 |
| | | | | |
| | | | | $ | 1,332,037,280 |
| Medical Equipment - 2.8% | | | | | |
| Becton, Dickinson & Co. | | 985,765 | | $ | 68,628,959 |
| Medtronic, Inc. | | 3,613,850 | | | 138,410,455 |
| Thermo Fisher Scientific, Inc. (a) | | 905,565 | | | 40,940,594 |
13
Portfolio of Investments – continued
| | | | | |
| Issuer | | Shares/Par | | Value ($) |
| | | | | |
| Common Stocks - continued | | | | | |
| Medical Equipment - continued | | | | | |
| Waters Corp. (a) | | 857,100 | | $ | 43,094,988 |
| | | | | |
| | | | | $ | 291,074,996 |
| Oil Services - 0.7% | | | | | |
| National Oilwell Varco, Inc. (a) | | 2,022,050 | | $ | 73,501,518 |
| | |
| Other Banks & Diversified Financials - 0.3% | | | | | |
| Northern Trust Corp. | | 525,512 | | $ | 30,721,432 |
| | |
| Pharmaceuticals - 9.0% | | | | | |
| Abbott Laboratories | | 3,436,560 | | $ | 155,435,609 |
| GlaxoSmithKline PLC | | 2,567,692 | | | 50,286,332 |
| Johnson & Johnson | | 2,984,917 | | | 180,408,383 |
| Merck & Co., Inc. | | 6,913,627 | | | 224,208,924 |
| Pfizer, Inc. | | 11,024,112 | | | 184,102,670 |
| Roche Holding AG | | 250,285 | | | 39,779,928 |
| Wyeth | | 2,197,510 | | | 105,150,854 |
| | | | | |
| | | | | $ | 939,372,700 |
| Railroad & Shipping - 0.3% | | | | | |
| Burlington Northern Santa Fe Corp. | | 281,132 | | $ | 23,339,579 |
| Canadian National Railway Co. | | 102,900 | | | 4,966,983 |
| | | | | |
| | | | | $ | 28,306,562 |
| Specialty Chemicals - 1.0% | | | | | |
| Air Products & Chemicals, Inc. | | 1,362,320 | | $ | 102,214,870 |
| | |
| Specialty Stores - 0.9% | | | | | |
| Abercrombie & Fitch Co., “A” | | 765,525 | | $ | 24,718,802 |
| Home Depot, Inc. | | 743,190 | | | 20,281,655 |
| Staples, Inc. | | 2,130,465 | | | 46,039,349 |
| | | | | |
| | | | | $ | 91,039,806 |
| Telecommunications - Wireless - 1.4% | | | | | |
| Vodafone Group PLC | | 69,902,193 | | $ | 150,681,138 |
| | |
| Telephone Services - 3.3% | | | | | |
| AT&T, Inc. | | 13,407,732 | | $ | 349,271,419 |
| | |
| Tobacco - 3.5% | | | | | |
| Altria Group, Inc. | | 2,109,105 | | $ | 38,554,439 |
| Lorillard, Inc. | | 218,370 | | | 15,890,785 |
| Philip Morris International, Inc. | | 6,770,479 | | | 309,478,595 |
| | | | | |
| | | | | $ | 363,923,819 |
14
Portfolio of Investments – continued
| | | | | |
| Issuer | | Shares/Par | | Value ($) |
| | | | | |
| Common Stocks - continued | | | | | |
| Utilities - Electric Power - 4.7% | | | | | |
| Dominion Resources, Inc. | | 3,789,535 | | $ | 125,357,818 |
| Entergy Corp. | | 860,185 | | | 67,954,615 |
| FPL Group, Inc. | | 1,180,257 | | | 66,306,838 |
| PG&E Corp. | | 1,956,128 | | | 79,399,236 |
| PPL Corp. | | 2,576,142 | | | 75,738,575 |
| Public Service Enterprise Group, Inc. | | 2,418,923 | | | 76,607,291 |
| | | | | |
| | | | | $ | 491,364,373 |
| Total Common Stocks (Identified Cost, $9,599,432,088) | | | | $ | 10,318,739,966 |
| | |
| Money Market Funds (v) - 1.3% | | | | | |
MFS Institutional Money Market Portfolio,
0.2%, at Cost and Net Asset Value | | 136,700,516 | | $ | 136,700,516 |
| Total Investments (Identified Cost, $9,736,132,604) | | | | $ | 10,455,440,482 |
| | |
| Other Assets, Less Liabilities - 0.1% | | | | | 13,142,856 |
| Net Assets - 100.0% | | | | $ | 10,468,583,338 |
| (a) | Non-income producing security. |
| (v) | Underlying fund that is available only to investment companies managed by MFS. The rate quoted is the annualized seven-day yield of the fund at period end. |
The following abbreviations are used in this report and are defined:
| ADR | | American Depository Receipt |
| PLC | | Public Limited Company |
See Notes to Financial Statements
15
Financial Statements
STATEMENT OF ASSETS AND LIABILITIES
At 8/31/09
This statement represents your fund’s balance sheet, which details the assets and liabilities comprising the total value of the fund.
| | | |
| Assets | | | |
Investments- | | | |
Non-affiliated issuers, at value (identified cost, $9,599,432,088) | | $10,318,739,966 | |
Underlying funds, at cost and value | | 136,700,516 | |
Total investments, at value (identified cost, $9,736,132,604) | | $10,455,440,482 | |
Receivables for | | | |
Investments sold | | 58,433,797 | |
Fund shares sold | | 42,579,378 | |
Interest and dividends | | 29,292,055 | |
Other assets | | 26,377 | |
Total assets | | $10,585,772,089 | |
| Liabilities | | | |
Payables for | | | |
Investments purchased | | $96,545,554 | |
Fund shares reacquired | | 16,020,265 | |
Payable to affiliates | | | |
Investment adviser | | 667,544 | |
Shareholder servicing costs | | 2,934,562 | |
Distribution and service fees | | 295,529 | |
Administrative services fee | | 20,296 | |
Program manager fees | | 87 | |
Payable for independent Trustees’ compensation | | 7,710 | |
Accrued expenses and other liabilities | | 697,204 | |
Total liabilities | | $117,188,751 | |
Net assets | | $10,468,583,338 | |
| Net assets consist of | | | |
Paid-in capital | | $11,166,336,072 | |
Unrealized appreciation (depreciation) on investments and translation of assets and liabilities in foreign currencies | | 719,304,447 | |
Accumulated net realized gain (loss) on investments and foreign currency transactions | | (1,438,891,495 | ) |
Undistributed net investment income | | 21,834,314 | |
Net assets | | $10,468,583,338 | |
Shares of beneficial interest outstanding | | 540,126,391 | |
| | | | | | |
| | | Net assets | | Shares
outstanding | | Net asset value
per share (a) |
Class A | | $4,665,411,243 | | 240,636,784 | | $19.39 |
Class B | | 371,270,133 | | 19,275,274 | | 19.26 |
Class C | | 776,373,456 | | 40,421,386 | | 19.21 |
Class I | | 2,335,921,848 | | 119,934,279 | | 19.48 |
Class W | | 999,969,475 | | 51,623,795 | | 19.37 |
Class R1 | | 30,690,349 | | 1,607,317 | | 19.09 |
Class R2 | | 286,115,311 | | 14,869,289 | | 19.24 |
Class R3 | | 341,993,230 | | 17,680,700 | | 19.34 |
Class R4 | | 652,905,886 | | 33,664,292 | | 19.39 |
Class 529A | | 5,007,806 | | 259,792 | | 19.28 |
Class 529B | | 1,214,982 | | 63,746 | | 19.06 |
Class 529C | | 1,709,619 | | 89,737 | | 19.05 |
On sales of $50,000 or more, the offering prices of Class A and Class 529A shares are reduced. A contingent deferred sales charge may be imposed on redemptions of Class A, Class B, Class C, Class 529B, and Class 529C shares.
| (a) | Maximum offering price and redemption price per share were equal to the net asset value per share for all share classes, except for Classes A and 529A, for which the maximum offering prices per share were $20.57 and $20.46, respectively. |
See Notes to Financial Statements
16
Financial Statements
STATEMENT OF OPERATIONS
Year ended 8/31/09
This statement describes how much your fund earned in investment income and accrued in expenses.
It also describes any gains and/or losses generated by fund operations.
| | | | | | |
| Net investment income | | | | | | |
Income | | | | | | |
Dividends | | $246,101,982 | | | | |
Interest | | 1,536,450 | | | | |
Dividends from underlying funds | | 264,799 | | | | |
Foreign taxes withheld | | (2,874,279 | ) | | | |
Total investment income | | | | | $245,028,952 | |
Expenses | | | | | | |
Management fee | | $48,244,630 | | | | |
Distribution and service fees | | 26,210,691 | | | | |
Program manager fees | | 7,197 | | | | |
Shareholder servicing costs | | 11,735,309 | | | | |
Administrative services fee | | 1,581,167 | | | | |
Independent Trustees’ compensation | | 171,368 | | | | |
Custodian fee | | 378,950 | | | | |
Shareholder communications | | 523,931 | | | | |
Auditing fees | | 52,937 | | | | |
Legal fees | | 253,926 | | | | |
Miscellaneous | | 908,723 | | | | |
Total expenses | | | | | $90,068,829 | |
Fees paid indirectly | | (1,049 | ) | | | |
Reduction of expenses by investment adviser | | (52,073 | ) | | | |
Net expenses | | | | | $90,015,707 | |
Net investment income | | | | | $155,013,245 | |
Realized and unrealized gain (loss) on investments
and foreign currency transactions | | | | | | |
Realized gain (loss) (identified cost basis) | | | | | | |
Investment transactions | | $(1,089,145,013 | ) | | | |
Foreign currency transactions | | (228,325 | ) | | | |
Net realized gain (loss) on investments
and foreign currency transactions | | | | | $(1,089,373,338 | ) |
Change in unrealized appreciation (depreciation) | | | | | | |
Investments | | $(676,750,914 | ) | | | |
Translation of assets and liabilities in foreign currencies | | 122,038 | | | | |
Net unrealized gain (loss) on investments
and foreign currency translation | | | | | $(676,628,876 | ) |
Net realized and unrealized gain (loss) on investments
and foreign currency | | | | | $(1,766,002,214 | ) |
Change in net assets from operations | | | | | $(1,610,988,969 | ) |
See Notes to Financial Statements
17
Financial Statements
STATEMENTS OF CHANGES IN NET ASSETS
These statements describe the increases and/or decreases in net assets resulting from operations, any distributions, and any shareholder transactions.
| | | | | | |
| | | Years ended 8/31 | |
| | | 2009 | | | 2008 | |
| Change in net assets | | | | | | |
| From operations | | | | | | |
Net investment income | | $155,013,245 | | | $121,807,278 | |
Net realized gain (loss) on investments and
foreign currency transactions | | (1,089,373,338 | ) | | 34,304,308 | |
Net unrealized gain (loss) on investments and
foreign currency translation | | (676,628,876 | ) | | (1,030,635,411 | ) |
Change in net assets from operations | | $(1,610,988,969 | ) | | $(874,523,825 | ) |
| Distributions declared to shareholders | | | | | | |
From net investment income | | $(154,220,972 | ) | | $(114,795,088 | ) |
From net realized gain on investments | | — | | | (715,434,767 | ) |
Total distributions declared to shareholders | | $(154,220,972 | ) | | $(830,229,855 | ) |
Change in net assets from fund share transactions | | $1,976,315,828 | | | $1,550,678,271 | |
Total change in net assets | | $211,105,887 | | | $(154,075,409 | ) |
| Net assets | | | | | | |
At beginning of period | | 10,257,477,451 | | | 10,411,552,860 | |
At end of period (including undistributed net investment
income of $21,834,314 and $22,011,318, respectively) | | $10,468,583,338 | | | $10,257,477,451 | |
See Notes to Financial Statements
18
Financial Statements
FINANCIAL HIGHLIGHTS
The financial highlights table is intended to help you understand the fund’s financial performance for the past 5 years (or life of a particular share class, if shorter). Certain information reflects financial results for a single fund share. The total returns in the table represent the rate by which an investor would have earned (or lost) on an investment in the fund share class (assuming reinvestment of all distributions) held for the entire period.
| | | | | | | | | | | | | | | |
| Class A | | Years ended 8/31 | |
| | | 2009 | | | 2008 | | | 2007 | | | 2006 | | | 2005 | |
Net asset value, beginning of period | | $23.75 | | | $28.11 | | | $25.20 | | | $23.81 | | | $20.88 | |
| Income (loss) from investment operations | | | | | | | | | | | | | | | |
Net investment income (d) | | $0.34 | | | $0.32 | | | $0.30 | | | $0.34 | | | $0.28 | |
Net realized and unrealized gain (loss)
on investments and foreign currency | | (4.35 | ) | | (2.43 | ) | | 3.77 | | | 2.48 | | | 2.91 | |
Total from investment operations | | $(4.01 | ) | | $(2.11 | ) | | $4.07 | | | $2.82 | | | $3.19 | |
Less distributions declared to
shareholders | | | | | | | | | | | | | | | |
From net investment income | | $(0.35 | ) | | $(0.31 | ) | | $(0.36 | ) | | $(0.29 | ) | | $(0.26 | ) |
From net realized gain on investments | | — | | | (1.94 | ) | | (0.80 | ) | | (1.14 | ) | | — | |
Total distributions declared to shareholders | | $(0.35 | ) | | $(2.25 | ) | | $(1.16 | ) | | $(1.43 | ) | | $(0.26 | ) |
Net asset value, end of period | | $19.39 | | | $23.75 | | | $28.11 | | | $25.20 | | | $23.81 | |
Total return (%) (r)(s)(t) | | (16.75 | ) | | (8.27 | ) | | 16.42 | | | 12.36 | | | 15.36 | |
Ratios (%) (to average net assets)
and Supplemental data: | | | | | | | | | | | | | | | |
Expenses before expense reductions (f) | | 1.09 | | | 1.11 | | | 1.13 | | | 1.17 | | | 1.16 | |
Expenses after expense reductions (f) | | 1.09 | | | 1.10 | | | 1.11 | | | 1.16 | | | 1.16 | |
Net investment income | | 1.94 | | | 1.24 | | | 1.10 | | | 1.40 | | | 1.23 | |
Portfolio turnover | | 33 | | | 31 | | | 26 | | | 26 | | | 24 | |
Net assets at end of period (000 omitted) | | $4,665,411 | | | $5,724,586 | | | $6,239,176 | | | $4,929,525 | | | $4,554,484 | |
See Notes to Financial Statements
19
Financial Highlights – continued
| | | | | | | | | | | | | | | |
| Class B | | Years ended 8/31 | |
| | | 2009 | | | 2008 | | | 2007 | | | 2006 | | | 2005 | |
Net asset value, beginning of period | | $23.59 | | | $27.92 | | | $25.04 | | | $23.66 | | | $20.77 | |
| Income (loss) from investment operations | | | | | | | | | | | | | | | |
Net investment income (d) | | $0.22 | | | $0.15 | | | $0.12 | | | $0.17 | | | $0.13 | |
Net realized and unrealized gain (loss)
on investments and foreign currency | | (4.34 | ) | | (2.41 | ) | | 3.74 | | | 2.49 | | | 2.90 | |
Total from investment operations | | $(4.12 | ) | | $(2.26 | ) | | $3.86 | | | $2.66 | | | $3.03 | |
Less distributions declared to
shareholders | | | | | | | | | | | | | | | |
From net investment income | | $(0.21 | ) | | $(0.13 | ) | | $(0.18 | ) | | $(0.14 | ) | | $(0.14 | ) |
From net realized gain on investments | | — | | | (1.94 | ) | | (0.80 | ) | | (1.14 | ) | | — | |
Total distributions declared to shareholders | | $(0.21 | ) | | $(2.07 | ) | | $(0.98 | ) | | $(1.28 | ) | | $(0.14 | ) |
Net asset value, end of period | | $19.26 | | | $23.59 | | | $27.92 | | | $25.04 | | | $23.66 | |
Total return (%) (r)(s)(t) | | (17.36 | ) | | (8.87 | ) | | 15.64 | | | 11.66 | | | 14.61 | |
Ratios (%) (to average net assets)
and Supplemental data: | | | | | | | | | | | | | | | |
Expenses before expense reductions (f) | | 1.79 | | | 1.76 | | | 1.78 | | | 1.82 | | | 1.81 | |
Expenses after expense reductions (f) | | 1.79 | | | 1.75 | | | 1.76 | | | 1.81 | | | 1.81 | |
Net investment income | | 1.26 | | | 0.58 | | | 0.44 | | | 0.72 | | | 0.58 | |
Portfolio turnover | | 33 | | | 31 | | | 26 | | | 26 | | | 24 | |
Net assets at end of period (000 omitted) | | $371,270 | | | $672,484 | | | $1,049,401 | | | $1,139,651 | | | $1,262,029 | |
See Notes to Financial Statements
20
Financial Highlights – continued
| | | | | | | | | | | | | | | |
| Class C | | Years ended 8/31 | |
| | | 2009 | | | 2008 | | | 2007 | | | 2006 | | | 2005 | |
Net asset value, beginning of period | | $23.54 | | | $27.88 | | | $25.01 | | | $23.64 | | | $20.75 | |
| Income (loss) from investment operations | | | | | | | | | | | | | | | |
Net investment income (d) | | $0.22 | | | $0.15 | | | $0.12 | | | $0.18 | | | $0.13 | |
Net realized and unrealized gain (loss)
on investments and foreign currency | | (4.33 | ) | | (2.41 | ) | | 3.74 | | | 2.47 | | | 2.90 | |
Total from investment operations | | $(4.11 | ) | | $(2.26 | ) | | $3.86 | | | $2.65 | | | $3.03 | |
Less distributions declared to
shareholders | | | | | | | | | | | | | | | |
From net investment income | | $(0.22 | ) | | $(0.14 | ) | | $(0.19 | ) | | $(0.14 | ) | | $(0.14 | ) |
From net realized gain on investments | | — | | | (1.94 | ) | | (0.80 | ) | | (1.14 | ) | | — | |
Total distributions declared to shareholders | | $(0.22 | ) | | $(2.08 | ) | | $(0.99 | ) | | $(1.28 | ) | | $(0.14 | ) |
Net asset value, end of period | | $19.21 | | | $23.54 | | | $27.88 | | | $25.01 | | | $23.64 | |
Total return (%) (r)(s)(t) | | (17.35 | ) | | (8.88 | ) | | 15.66 | | | 11.65 | | | 14.63 | |
Ratios (%) (to average net assets)
and Supplemental data: | | | | | | | | | | | | | | | |
Expenses before expense reductions (f) | | 1.79 | | | 1.76 | | | 1.78 | | | 1.82 | | | 1.81 | |
Expenses after expense reductions (f) | | 1.79 | | | 1.75 | | | 1.76 | | | 1.81 | | | 1.81 | |
Net investment income | | 1.24 | | | 0.59 | | | 0.45 | | | 0.74 | | | 0.58 | |
Portfolio turnover | | 33 | | | 31 | | | 26 | | | 26 | | | 24 | |
Net assets at end of period (000 omitted) | | $776,373 | | | $950,299 | | | $1,052,467 | | | $881,538 | | | $863,486 | |
See Notes to Financial Statements
21
Financial Highlights – continued
| | | | | | | | | | | | | | | |
| Class I | | Years ended 8/31 | |
| | | 2009 | | | 2008 | | | 2007 | | | 2006 | | | 2005 | |
Net asset value, beginning of period | | $23.87 | | | $28.24 | | | $25.32 | | | $23.91 | | | $20.95 | |
| Income (loss) from investment operations | | | | | | | | | | | | | | | |
Net investment income (d) | | $0.40 | | | $0.41 | | | $0.40 | | | $0.43 | | | $0.37 | |
Net realized and unrealized gain (loss)
on investments and foreign currency | | (4.38 | ) | | (2.44 | ) | | 3.77 | | | 2.49 | | | 2.91 | |
| Total from investment operations | | $(3.98 | ) | | $(2.03 | ) | | $4.17 | | | $2.92 | | | $3.28 | |
Less distributions declared to
shareholders | | | | | | | | | | | | | | | |
From net investment income | | $(0.41 | ) | | $(0.40 | ) | | $(0.45 | ) | | $(0.37 | ) | | $(0.32 | ) |
From net realized gain on investments | | — | | | (1.94 | ) | | (0.80 | ) | | (1.14 | ) | | — | |
| Total distributions declared to shareholders | | $(0.41 | ) | | $(2.34 | ) | | $(1.25 | ) | | $(1.51 | ) | | $(0.32 | ) |
| Net asset value, end of period | | $19.48 | | | $23.87 | | | $28.24 | | | $25.32 | | | $23.91 | |
| Total return (%) (r)(s) | | (16.53 | ) | | (7.94 | ) | | 16.78 | | | 12.78 | | | 15.78 | |
Ratios (%) (to average net assets)
and Supplemental data: | | | | | | | | | | | | | | | |
Expenses before expense reductions (f) | | 0.79 | | | 0.76 | | | 0.78 | | | 0.82 | | | 0.81 | |
Expenses after expense reductions (f) | | 0.79 | | | 0.75 | | | 0.76 | | | 0.81 | | | 0.81 | |
Net investment income | | 2.26 | | | 1.60 | | | 1.45 | | | 1.77 | | | 1.59 | |
Portfolio turnover | | 33 | | | 31 | | | 26 | | | 26 | | | 24 | |
Net assets at end of period (000 omitted) | | $2,335,922 | | | $1,663,139 | | | $1,529,643 | | | $1,162,665 | | | $899,654 | |
See Notes to Financial Statements
22
Financial Highlights – continued
| | | | | | | | | | | | |
| Class W | | Years ended 8/31 | |
| | | 2009 | | | 2008 | | | 2007 | | | 2006 (i) | |
| Net asset value, beginning of period | | $23.74 | | | $28.11 | | | $25.20 | | | $25.04 | |
| Income (loss) from investment operations | | | | | | | | | | | | |
Net investment income (d) | | $0.37 | | | $0.37 | | | $0.37 | | | $0.24 | |
Net realized and unrealized gain (loss)
on investments and foreign currency | | (4.35 | ) | | (2.42 | ) | | 3.77 | | | 0.02 | (g) |
| Total from investment operations | | $(3.98 | ) | | $(2.05 | ) | | $4.14 | | | $0.26 | |
| Less distributions declared to shareholders | | | | | | | | | | | | |
From net investment income | | $(0.39 | ) | | $(0.38 | ) | | $(0.43 | ) | | $(0.10 | ) |
From net realized gain on investments | | — | | | (1.94 | ) | | (0.80 | ) | | — | |
| Total distributions declared to shareholders | | $(0.39 | ) | | $(2.32 | ) | | $(1.23 | ) | | $(0.10 | ) |
| Net asset value, end of period | | $19.37 | | | $23.74 | | | $28.11 | | | $25.20 | |
| Total return (%) (r)(s) | | (16.61 | ) | | (8.05 | ) | | 16.73 | | | 1.05 | (n) |
Ratios (%) (to average net assets)
and Supplemental data: | | | | | | | | | | | | |
| Expenses before expense reductions (f) | | 0.89 | | | 0.87 | | | 0.88 | | | 0.92 | (a) |
| Expenses after expense reductions (f) | | 0.88 | | | 0.85 | | | 0.86 | | | 0.91 | (a) |
| Net investment income | | 2.12 | | | 1.54 | | | 1.37 | | | 3.32 | (a) |
| Portfolio turnover | | 33 | | | 31 | | | 26 | | | 26 | |
Net assets at end of period (000 omitted) | | $999,969 | | | $581,005 | | | $69,115 | | | $8,952 | |
See Notes to Financial Statements
23
Financial Highlights – continued
| | | | | | | | | | | | | | | |
| Class R1 | | Years ended 8/31 | |
| | | 2009 | | | 2008 | | | 2007 | | | 2006 | | | 2005 (i) | |
Net asset value, beginning of period | | $23.42 | | | $27.76 | | | $24.93 | | | $23.63 | | | $23.17 | |
| Income (loss) from investment operations | | | | | | | | | | | | | | | |
Net investment income (d) | | $0.21 | | | $0.14 | | | $0.10 | | | $0.22 | | | $0.09 | |
Net realized and unrealized gain (loss)
on investments and foreign currency | | (4.31 | ) | | (2.40 | ) | | 3.72 | | | 2.39 | | | 0.42 | (g) |
Total from investment operations | | $(4.10 | ) | | $(2.26 | ) | | $3.82 | | | $2.61 | | | $0.51 | |
Less distributions declared to
shareholders | | | | | | | | | | | | | | | |
From net investment income | | $(0.23 | ) | | $(0.14 | ) | | $(0.19 | ) | | $(0.17 | ) | | $(0.05 | ) |
From net realized gain on investments | | — | | | (1.94 | ) | | (0.80 | ) | | (1.14 | ) | | — | |
Total distributions declared to shareholders | | $(0.23 | ) | | $(2.08 | ) | | $(0.99 | ) | | $(1.31 | ) | | $(0.05 | ) |
Net asset value, end of period | | $19.09 | | | $23.42 | | | $27.76 | | | $24.93 | | | $23.63 | |
Total return (%) (r)(s) | | (17.38 | ) | | (8.91 | ) | | 15.55 | | | 11.51 | | | 2.21 | (n) |
Ratios (%) (to average net assets)
and Supplemental data: | | | | | | | | | | | | | | | |
Expenses before expense reductions (f) | | 1.78 | | | 1.81 | | | 1.92 | | | 2.02 | | | 2.04 | (a) |
Expenses after expense reductions (f) | | 1.78 | | | 1.79 | | | 1.86 | | | 1.92 | | | 2.04 | (a) |
Net investment income | | 1.24 | | | 0.54 | | | 0.36 | | | 0.93 | | | 0.89 | (a) |
Portfolio turnover | | 33 | | | 31 | | | 26 | | | 26 | | | 24 | |
Net assets at end of period (000 omitted) | | $30,690 | | | $25,252 | | | $15,823 | | | $4,639 | | | $574 | |
See Notes to Financial Statements
24
Financial Highlights – continued
| | | | | | | | | | | | | | | |
| Class R2 | | Years ended 8/31 | |
| | | 2009 | | | 2008 | | | 2007 | | | 2006 | | | 2005 | |
Net asset value, beginning of period | | $23.59 | | | $27.94 | | | $25.07 | | | $23.71 | | | $20.84 | |
| Income (loss) from investment operations | | | | | | | | | | | | | | | |
Net investment income (d) | | $0.30 | | | $0.27 | | | $0.22 | | | $0.31 | | | $0.21 | |
Net realized and unrealized gain (loss)
on investments and foreign currency | | (4.33 | ) | | (2.42 | ) | | 3.75 | | | 2.43 | | | 2.88 | |
| Total from investment operations | | $(4.03 | ) | | $(2.15 | ) | | $3.97 | | | $2.74 | | | $3.09 | |
Less distributions declared to
shareholders | | | | | | | | | | | | | | | |
From net investment income | | $(0.32 | ) | | $(0.26 | ) | | $(0.30 | ) | | $(0.24 | ) | | $(0.22 | ) |
From net realized gain on investments | | — | | | (1.94 | ) | | (0.80 | ) | | (1.14 | ) | | — | |
| Total distributions declared to shareholders | | $(0.32 | ) | | $(2.20 | ) | | $(1.10 | ) | | $(1.38 | ) | | $(0.22 | ) |
| Net asset value, end of period | | $19.24 | | | $23.59 | | | $27.94 | | | $25.07 | | | $23.71 | |
| Total return (%) (r)(s) | | (16.96 | ) | | (8.46 | ) | | 16.07 | | | 12.03 | | | 14.91 | |
Ratios (%) (to average net assets)
and Supplemental data: | | | | | | | | | | | | | | | |
Expenses before expense reductions (f) | | 1.29 | | | 1.30 | | | 1.47 | | | 1.56 | | | 1.57 | |
Expenses after expense reductions (f) | | 1.28 | | | 1.28 | | | 1.41 | | | 1.47 | | | 1.57 | |
Net investment income | | 1.73 | | | 1.10 | | | 0.81 | | | 1.27 | | | 0.93 | |
Portfolio turnover | | 33 | | | 31 | | | 26 | | | 26 | | | 24 | |
Net assets at end of period (000 omitted) | | $286,115 | | | $246,027 | | | $98,970 | | | $30,001 | | | $8,316 | |
See Notes to Financial Statements
25
Financial Highlights – continued
| | | | | | | | | | | | | | | |
| Class R3 | | Years ended 8/31 | |
| | | 2009 | | | 2008 | | | 2007 | | | 2006 | | | 2005 (i) | |
Net asset value, beginning of period | | $23.71 | | | $28.07 | | | $25.17 | | | $23.81 | | | $23.29 | |
| Income (loss) from investment operations | | | | | | | | | | | | | | | |
Net investment income (d) | | $0.34 | | | $0.33 | | | $0.30 | | | $0.42 | | | $0.15 | |
Net realized and unrealized gain (loss)
on investments and foreign currency | | (4.35 | ) | | (2.43 | ) | | 3.75 | | | 2.39 | | | 0.44 | (g) |
| Total from investment operations | | $(4.01 | ) | | $(2.10 | ) | | $4.05 | | | $2.81 | | | $0.59 | |
Less distributions declared to
shareholders | | | | | | | | | | | | | | | |
From net investment income | | $(0.36 | ) | | $(0.32 | ) | | $(0.35 | ) | | $(0.31 | ) | | $(0.07 | ) |
From net realized gain on investments | | — | | | (1.94 | ) | | (0.80 | ) | | (1.14 | ) | | — | |
| Total distributions declared to shareholders | | $(0.36 | ) | | $(2.26 | ) | | $(1.15 | ) | | $(1.45 | ) | | $(0.07 | ) |
| Net asset value, end of period | | $19.34 | | | $23.71 | | | $28.07 | | | $25.17 | | | $23.81 | |
| Total return (%) (r)(s) | | (16.75 | ) | | (8.25 | ) | | 16.38 | | | 12.33 | | | 2.53 | (n) |
Ratios (%) (to average net assets)
and Supplemental data: | | | | | | | | | | | | | | | |
Expenses before expense reductions (f) | | 1.03 | | | 1.06 | | | 1.18 | | | 1.22 | | | 1.23 | (a) |
Expenses after expense reductions (f) | | 1.03 | | | 1.04 | | | 1.16 | | | 1.22 | | | 1.23 | (a) |
Net investment income | | 1.94 | | | 1.29 | | | 1.07 | | | 1.80 | | | 1.94 | (a) |
Portfolio turnover | | 33 | | | 31 | | | 26 | | | 26 | | | 24 | |
Net assets at end of period (000 omitted) | | $341,993 | | | $190,002 | | | $128,909 | | | $46,731 | | | $400 | |
See Notes to Financial Statements
26
Financial Highlights – continued
| | | | | | | | | | | | | | | |
| Class R4 | | Years ended 8/31 | |
| | | 2009 | | | 2008 | | | 2007 | | | 2006 | | | 2005 (i) | |
| Net asset value, beginning of period | | $23.77 | | | $28.13 | | | $25.22 | | | $23.83 | | | $23.29 | |
| Income (loss) from investment operations | | | | | | | | | | | | | | | |
Net investment income (d) | | $0.37 | | | $0.40 | | | $0.39 | | | $0.45 | | | $0.15 | |
Net realized and unrealized gain (loss)
on investments and foreign currency | | (4.34 | ) | | (2.43 | ) | | 3.75 | | | 2.43 | | | 0.47 | (g) |
Total from investment operations | | $(3.97 | ) | | $(2.03 | ) | | $4.14 | | | $2.88 | | | $0.62 | |
Less distributions declared to
shareholders | | | | | | | | | | | | | | | |
From net investment income | | $(0.41 | ) | | $(0.39 | ) | | $(0.43 | ) | | $(0.35 | ) | | $(0.08 | ) |
From net realized gain on investments | | — | | | (1.94 | ) | | (0.80 | ) | | (1.14 | ) | | — | |
Total distributions declared to shareholders | | $(0.41 | ) | | $(2.33 | ) | | $(1.23 | ) | | $(1.49 | ) | | $(0.08 | ) |
Net asset value, end of period | | $19.39 | | | $23.77 | | | $28.13 | | | $25.22 | | | $23.83 | |
Total return (%) (r)(s) | | (16.56 | ) | | (7.99 | ) | | 16.70 | | | 12.64 | | | 2.68 | (n) |
Ratios (%) (to average net assets)
and Supplemental data: | | | | | | | | | | | | | | | |
Expenses before expense reductions (f) | | 0.77 | | | 0.80 | | | 0.88 | | | 0.92 | | | 0.92 | (a) |
Expenses after expense reductions (f) | | 0.77 | | | 0.78 | | | 0.86 | | | 0.91 | | | 0.92 | (a) |
Net investment income | | 2.10 | | | 1.58 | | | 1.39 | | | 1.80 | | | 1.57 | (a) |
Portfolio turnover | | 33 | | | 31 | | | 26 | | | 26 | | | 24 | |
Net assets at end of period (000 omitted) | | $652,906 | | | $194,753 | | | $137,524 | | | $60,124 | | | $51 | |
See Notes to Financial Statements
27
Financial Highlights – continued
| | | | | | | | | | | | | | | |
| Class 529A | | Years ended 8/31 | |
| | | 2009 | | | 2008 | | | 2007 | | | 2006 | | | 2005 | |
Net asset value, beginning of period | | $23.62 | | | $27.96 | | | $25.09 | | | $23.71 | | | $20.80 | |
| Income (loss) from investment operations | | | | | | | | | | | | | | | |
Net investment income (d) | | $0.32 | | | $0.27 | | | $0.23 | | | $0.28 | | | $0.23 | |
Net realized and unrealized gain (loss)
on investments and foreign currency | | (4.33 | ) | | (2.42 | ) | | 3.74 | | | 2.48 | | | 2.90 | |
| Total from investment operations | | $(4.01 | ) | | $(2.15 | ) | | $3.97 | | | $2.76 | | | $3.13 | |
Less distributions declared to
shareholders | | | | | | | | | | | | | | | |
From net investment income | | $(0.33 | ) | | $(0.25 | ) | | $(0.30 | ) | | $(0.24 | ) | | $(0.22 | ) |
From net realized gain on investments | | — | | | (1.94 | ) | | (0.80 | ) | | (1.14 | ) | | — | |
| Total distributions declared to shareholders | | $(0.33 | ) | | $(2.19 | ) | | $(1.10 | ) | | $(1.38 | ) | | $(0.22 | ) |
| Net asset value, end of period | | $19.28 | | | $23.62 | | | $27.96 | | | $25.09 | | | $23.71 | |
| Total return (%) (r)(s)(t) | | (16.84 | ) | | (8.45 | ) | | 16.09 | | | 12.11 | | | 15.09 | |
Ratios (%) (to average net assets)
and Supplemental data: | | | | | | | | | | | | | | | |
Expenses before expense reductions (f) | | 1.19 | | | 1.30 | | | 1.38 | | | 1.42 | | | 1.41 | |
Expenses after expense reductions (f) | | 1.19 | | | 1.28 | | | 1.36 | | | 1.41 | | | 1.41 | |
Net investment income | | 1.84 | | | 1.05 | | | 0.85 | | | 1.18 | | | 0.99 | |
Portfolio turnover | | 33 | | | 31 | | | 26 | | | 26 | | | 24 | |
Net assets at end of period (000 omitted) | | $5,008 | | | $6,025 | | | $6,194 | | | $3,947 | | | $2,914 | |
See Notes to Financial Statements
28
Financial Highlights – continued
| | | | | | | | | | | | | | | |
| Class 529B | | Years ended 8/31 | |
| | | 2009 | | | 2008 | | | 2007 | | | 2006 | | | 2005 | |
Net asset value, beginning of period | | $23.37 | | | $27.69 | | | $24.87 | | | $23.52 | | | $20.67 | |
| Income (loss) from investment operations | | | | | | | | | | | | | | | |
Net investment income (d) | | $0.20 | | | $0.10 | | | $0.06 | | | $0.13 | | | $0.08 | |
Net realized and unrealized gain (loss)
on investments and foreign currency | | (4.30 | ) | | (2.39 | ) | | 3.71 | | | 2.45 | | | 2.87 | |
| Total from investment operations | | $(4.10 | ) | | $(2.29 | ) | | $3.77 | | | $2.58 | | | $2.95 | |
Less distributions declared to
shareholders | | | | | | | | | | | | | | | |
From net investment income | | $(0.21 | ) | | $(0.09 | ) | | $(0.15 | ) | | $(0.09 | ) | | $(0.10 | ) |
From net realized gain on investments | | — | | | (1.94 | ) | | (0.80 | ) | | (1.14 | ) | | — | |
| Total distributions declared to shareholders | | $(0.21 | ) | | $(2.03 | ) | | $(0.95 | ) | | $(1.23 | ) | | $(0.10 | ) |
| Net asset value, end of period | | $19.06 | | | $23.37 | | | $27.69 | | | $24.87 | | | $23.52 | |
| Total return (%) (r)(s)(t) | | (17.46 | ) | | (9.05 | ) | | 15.37 | | | 11.39 | | | 14.32 | |
Ratios (%) (to average net assets)
and Supplemental data: | | | | | | | | | | | | | | | |
Expenses before expense reductions (f) | | 1.89 | | | 1.95 | | | 2.03 | | | 2.06 | | | 2.06 | |
Expenses after expense reductions (f) | | 1.89 | | | 1.94 | | | 2.01 | | | 2.06 | | | 2.06 | |
Net investment income | | 1.15 | | | 0.40 | | | 0.20 | | | 0.53 | | | 0.34 | |
Portfolio turnover | | 33 | | | 31 | | | 26 | | | 26 | | | 24 | |
Net assets at end of period (000 omitted) | | $1,215 | | | $1,624 | | | $1,823 | | | $946 | | | $655 | |
See Notes to Financial Statements
29
Financial Highlights – continued
| | | | | | | | | | | | | | | |
| Class 529C | | Years ended 8/31 | |
| | | 2009 | | | 2008 | | | 2007 | | | 2006 | | | 2005 | |
| Net asset value, beginning of period | | $23.35 | | | $27.67 | | | $24.86 | | | $23.51 | | | $20.66 | |
| Income (loss) from investment operations | | | | | | | | | | | | | | | |
Net investment income (d) | | $0.20 | | | $0.10 | | | $0.06 | | | $0.12 | | | $0.08 | |
Net realized and unrealized gain (loss)
on investments and foreign currency | | (4.30 | ) | | (2.39 | ) | | 3.70 | | | 2.46 | | | 2.87 | |
| Total from investment operations | | $(4.10 | ) | | $(2.29 | ) | | $3.76 | | | $2.58 | | | $2.95 | |
Less distributions declared to
shareholders | | | | | | | | | | | | | | | |
From net investment income | | $(0.20 | ) | | $(0.09 | ) | | $(0.15 | ) | | $(0.09 | ) | | $(0.10 | ) |
From net realized gain on investments | | — | | | (1.94 | ) | | (0.80 | ) | | (1.14 | ) | | — | |
| Total distributions declared to shareholders | | $(0.20 | ) | | $(2.03 | ) | | $(0.95 | ) | | $(1.23 | ) | | $(0.10 | ) |
| Net asset value, end of period | | $19.05 | | | $23.35 | | | $27.67 | | | $24.86 | | | $23.51 | |
| Total return (%) (r)(s)(t) | | (17.45 | ) | | (9.05 | ) | | 15.34 | | | 11.39 | | | 14.32 | |
Ratios (%) (to average net assets)
and Supplemental data: | | | | | | | | | | | | | | | |
| Expenses before expense reductions (f) | | 1.89 | | | 1.95 | | | 2.03 | | | 2.06 | | | 2.06 | |
| Expenses after expense reductions (f) | | 1.89 | | | 1.94 | | | 2.01 | | | 2.06 | | | 2.06 | |
| Net investment income | | 1.15 | | | 0.40 | | | 0.20 | | | 0.51 | | | 0.36 | |
| Portfolio turnover | | 33 | | | 31 | | | 26 | | | 26 | | | 24 | |
| Net assets at end of period (000 omitted) | | $1,710 | | | $2,282 | | | $2,463 | | | $1,279 | | | $1,062 | |
Any redemption fees charged by the fund during the 2005 fiscal year resulted in a per share impact of less than $0.01.
| (d) | Per share data are based on average shares outstanding. |
| (f) | Ratios do not reflect reductions from fees paid indirectly, if applicable. |
| (g) | The per share amount is not in accordance with the net realized and unrealized gain/loss for the period because of the timing of sales of fund shares and the per share amount of realized and unrealized gains and losses at such time. |
| (i) | For the period from the class’ inception, April 1, 2005 (Classes R1, R3, and R4) and May 1, 2006 (Class W) through the stated period end. |
| (r) | Certain expenses have been reduced without which performance would have been lower. |
| (s) | From time to time the fund may receive proceeds from litigation settlements, without which performance would be lower. |
| (t) | Total returns do not include any applicable sales charges. |
See Notes to Financial Statements
30
NOTES TO FINANCIAL STATEMENTS
| (1) | | Business and Organization |
MFS Value Fund (the fund) is a series of MFS Series Trust I (the trust). The trust is organized as a Massachusetts business trust and is registered under the Investment Company Act of 1940, as amended, as an open-end management investment company.
| (2) | | Significant Accounting Policies |
General – The preparation of financial statements in conformity with U.S. generally accepted accounting principles requires management to make estimates and assumptions that affect the reported amounts of assets and liabilities, and disclosure of contingent assets and liabilities at the date of the financial statements and the reported amounts of revenues and expenses during the reporting period. In making these estimates and assumptions, management has considered the effects, if any, of events occurring after the date of the fund’s Statement of Assets and Liabilities through October 16, 2009 which is the date that the financial statements were issued. Actual results could differ from those estimates. The fund can invest in foreign securities. Investments in foreign securities are vulnerable to the effects of changes in the relative values of the local currency and the U.S. dollar and to the effects of changes in each country’s legal, political, and economic environment.
Investment Valuations – Equity securities, including restricted equity securities, are generally valued at the last sale or official closing price as provided by a third-party pricing service on the market or exchange on which they are primarily traded. For securities for which there were no sales reported that day, equity securities are generally valued at the last quoted daily bid quotation as provided by a third-party pricing service on the market or exchange on which such securities are primarily traded. For securities held short for which there were no sales reported for that day, the position is generally valued at the last quoted daily ask quotation as provided by a third-party pricing service on the market or exchange on which such securities are primarily traded. Short-term instruments with a maturity at issuance of 60 days or less generally are valued at amortized cost, which approximates market value. Open-end investment companies are generally valued at net asset value per share. Securities and other assets generally valued on the basis of information from a third-party pricing service may also be valued at a broker/dealer bid quotation. Values obtained from third-party pricing services can utilize both transaction data and market information such as yield, quality, coupon rate, maturity, type of issue, trading characteristics, and other market data. The values of foreign securities and other assets and liabilities expressed in foreign currencies are converted to U.S. dollars using the mean of bid and asked prices for rates provided by a third-party pricing service.
31
Notes to Financial Statements – continued
The Board of Trustees has delegated primary responsibility for determining or causing to be determined the value of the fund’s investments (including any fair valuation) to the adviser pursuant to valuation policies and procedures approved by the Board. If the adviser determines that reliable market quotations are not readily available, investments are valued at fair value as determined in good faith by the adviser in accordance with such procedures under the oversight of the Board of Trustees. Under the fund’s valuation policies and procedures, market quotations are not considered to be readily available for most types of debt instruments and floating rate loans and many types of derivatives. These investments are generally valued at fair value based on information from third-party pricing services. In addition, investments may be valued at fair value if the adviser determines that an investment’s value has been materially affected by events occurring after the close of the exchange or market on which the investment is principally traded (such as foreign exchange or market) and prior to the determination of the fund’s net asset value, or after the halting of trading of a specific security where trading does not resume prior to the close of the exchange or market on which the security is principally traded. Events that occur on a frequent basis after foreign markets close (such as developments in foreign markets and significant movements in the U.S. markets) and prior to the determination of the fund’s net asset value may be deemed to have a material affect on the value of securities traded in foreign markets. Accordingly, the fund’s foreign equity securities may often be valued at fair value. The adviser generally relies on third-party pricing services or other information (such as the correlation with price movements of similar securities in the same or other markets; the type, cost and investment characteristics of the security; the business and financial condition of the issuer; and trading and other market data) to assist in determining whether to fair value and at what value to fair value an investment. The value of an investment for purposes of calculating the fund’s net asset value can differ depending on the source and method used to determine value. When fair valuation is used, the value of an investment used to determine the fund’s net asset value may differ from quoted or published prices for the same investment. There can be no assurance that the fund could obtain the fair value assigned to an investment if it were to sell the investment at the same time at which the fund determines its net asset value per share.
The fund adopted FASB Statement No. 157, Fair Value Measurements (the “Statement”). This Statement provides a single definition of fair value, a hierarchy for measuring fair value and expanded disclosures about fair value measurements.
Various inputs are used in determining the value of the fund’s assets or liabilities carried at market value. These inputs are categorized into three broad levels. In certain cases, the inputs used to measure fair value may fall into
32
Notes to Financial Statements – continued
different levels of the fair value hierarchy. In such cases, an investment’s level within the fair value hierarchy is based on the lowest level of input that is significant to the fair value measurement. The fund’s assessment of the significance of a particular input to the fair value measurement in its entirety requires judgment, and considers factors specific to the investment. Level 1 includes unadjusted quoted prices in active markets for identical assets or liabilities. Level 2 includes other significant observable market-based inputs (including quoted prices for similar securities, interest rates, prepayment speed, and credit risk). Level 3 includes unobservable inputs, which may include the adviser’s own assumptions in determining the fair value of investments. Other financial instruments are derivative instruments not reflected in total investments, such as futures, forwards, swap contracts, and written options. The following is a summary of the levels used as of August 31, 2009 in valuing the fund’s assets or liabilities carried at market value:
| | | | | | | | |
| Investments at Value | | Level 1 | | Level 2 | | Level 3 | | Total |
| Equity Securities: | | | | | | | | |
United States | | $9,424,782,618 | | $— | | $— | | $9,424,782,618 |
United Kingdom | | 189,195,913 | | 201,830,899 | | — | | 391,026,812 |
France | | 291,417,479 | | — | | — | | 291,417,479 |
Switzerland | | 206,546,074 | | — | | — | | 206,546,074 |
Canada | | 4,966,983 | | — | | — | | 4,966,983 |
| Mutual Funds | | 136,700,516 | | — | | — | | 136,700,516 |
| Total Investments | | $10,253,609,583 | | $201,830,899 | | $— | | $10,455,440,482 |
For further information regarding security characteristics, see the Portfolio of Investments.
Repurchase Agreements – The fund may enter into repurchase agreements with approved counterparties. Each repurchase agreement is recorded at cost. The fund requires that the securities collateral in a repurchase transaction be transferred to a custodian. The fund monitors, on a daily basis, the value of the collateral to ensure that its value, including accrued interest, is greater than amounts owed to the fund under each such repurchase agreement. The fund and other funds managed by MFS may utilize a joint trading account for the purpose of entering into one or more repurchase agreements.
Foreign Currency Translation – Purchases and sales of foreign investments, income, and expenses are converted into U.S. dollars based upon currency exchange rates prevailing on the respective dates of such transactions or on the reporting date for foreign denominated receivables and payables. Gains and losses attributable to foreign currency exchange rates on sales of securities are recorded for financial statement purposes as net realized gains and losses on investments. Gains and losses attributable to foreign exchange rate movements on receivables, payables, income and expenses are recorded for financial statement purposes as foreign currency transaction gains and losses. That
33
Notes to Financial Statements – continued
portion of both realized and unrealized gains and losses on investments that results from fluctuations in foreign currency exchange rates is not separately disclosed.
Derivatives – The fund may use derivatives for different purposes, including to earn income and enhance returns, to increase or decrease exposure to a particular market, to manage or adjust the risk profile of the fund, or as alternatives to direct investments. Derivatives may be used for hedging or non-hedging purposes. While hedging can reduce or eliminate losses, it can also reduce or eliminate gains. When the fund uses derivatives as an investment to increase market exposure, or for hedging purposes, gains and losses from derivative instruments may be substantially greater than the derivative’s original cost.
In this reporting period the fund adopted FASB Statement No. 161, Disclosure about Derivative Instruments and Hedging Activities (“FAS 161”), and FASB Staff Position FAS No. 133-1 and FIN 45-4, Disclosures about Credit Derivatives and Certain Guarantees: An Amendment of FASB Statement No. 133 and FASB Interpretation No. 45; and Clarification of the Effective Date of FAS 161 (“FSP FAS 133-1”).
FAS 161 amends FASB Statement No. 133, Accounting for Derivatives and Hedging Activities (“FAS 133”). FAS 161 provides enhanced disclosures about the fund’s use of and accounting for derivative instruments and the effect of derivative instruments on the fund’s results of operations and financial position. Under FAS 161, tabular disclosure regarding derivative fair value and gain/loss by contract type (e.g., interest rate contracts, foreign exchange contracts, credit contracts, etc.) is required and derivatives accounted for as hedging instruments under FAS 133 must be disclosed separately from derivatives that do not qualify for hedge accounting under FAS 133. Because investment companies account for their derivatives at fair value and record any changes in fair value in current period earnings, the fund’s derivatives are not accounted for as hedging instruments under FAS 133. As such, even though the fund may use derivatives in an attempt to achieve an economic hedge, the fund’s derivatives are not considered to be hedging instruments under FAS 133.
FSP FAS 133-1 amends FAS 133 to require sellers of credit derivatives to make disclosures that will enable financial statement users to assess the potential effects of those credit derivatives on an entity’s financial position, financial performance and cash flows. As defined by FSP FAS 133-1, a credit derivative is a derivative instrument (a) in which one or more of the derivative’s underlyings are related to the credit risk of a specified entity (or group of entities) or an index based on the credit risk of a group of entities and (b) that exposes the seller to potential loss from credit-risk-related events specified in
34
Notes to Financial Statements – continued
the derivative contract. The seller (or writer) is the party that provides the credit protection and assumes the credit risk on a credit derivatives contract, such as a credit default swap. There was no impact from implementing FSP 133-1 as the fund did not hold any of these credit derivatives at period end.
As defined under FAS 133, derivative instruments include written options, purchased options, futures contracts, forward foreign currency exchange contracts, and swap agreements. For the year ended August 31, 2009, the fund did not invest in any derivative instruments and accordingly there is no impact to the financial statements.
Derivative counterparty credit risk is managed through formal evaluation of the creditworthiness of all potential counterparties. On certain over-the-counter derivatives, the fund attempts to reduce its exposure to counterparty credit risk by entering into an International Swaps and Derivatives Association (ISDA) Master Agreement on a bilateral basis with each of the counterparties with whom it undertakes a significant volume of transactions. The ISDA Master Agreement gives each party to the agreement the right to terminate all transactions traded under such agreement if there is a certain deterioration in the credit quality of the other party. The ISDA Master Agreement gives the fund the right, upon an event of default by the applicable counterparty or a termination of the agreement, to close out all transactions traded under such agreement and to net amounts owed under each transaction to one net amount payable by one party to the other. This right to close out and net payments across all transactions traded under the ISDA Master Agreement could result in a reduction of the fund’s credit risk to such counterparty equal to any amounts payable by the fund under the applicable transactions, if any. However, absent an event of default by the counterparty or a termination of the agreement, the ISDA Master Agreement does not result in an offset of reported balance sheet assets and liabilities across transactions between the fund and the applicable counterparty.
Collateral requirements differ by type of derivative. Collateral or margin requirements are set by the broker or exchange clearing house for exchange traded derivatives (i.e., futures and exchange-traded options) while collateral terms are contract specific for over-the-counter traded derivatives (i.e., forwards, swaps and over-the-counter options). For derivatives traded under an ISDA Master Agreement, the collateral requirements are netted across all transactions traded under such agreement and one amount is posted from one party to the other to collateralize such obligations. Cash collateral that has been pledged to cover obligations of the fund under derivative contracts will be reported separately on the Statement of Assets and Liabilities as restricted cash. Securities collateral pledged for the same purpose is noted in the Portfolio of Investments.
35
Notes to Financial Statements – continued
Security Loans – State Street Bank and Trust Company (“State Street”), as lending agent, may loan the securities of the fund to certain qualified institutions (the “Borrowers”) approved by the fund. The loans are collateralized by cash and/or U.S. Treasury and federal agency obligations in an amount typically at least equal to the market value of the securities loaned. The market value of the loaned securities is determined at the close of business of the fund and any additional required collateral is delivered to the fund on the next business day. State Street provides the fund with indemnification against Borrower default. The fund bears the risk of loss with respect to the investment of cash collateral. On loans collateralized by cash, the cash collateral is invested in a money market fund or short-term securities. A portion of the income generated upon investment of the collateral is remitted to the Borrowers, and the remainder is allocated between the fund and the lending agent. On loans collateralized by U.S. Treasury and/or federal agency obligations, a fee is received from the Borrower, and is allocated between the fund and the lending agent. Income from securities lending is included in interest income on the Statement of Operations. The dividend and interest income earned on the securities loaned is accounted for in the same manner as other dividend and interest income. At August 31, 2009 there were no securities on loan.
Indemnifications – Under the fund’s organizational documents, its officers and Trustees may be indemnified against certain liabilities and expenses arising out of the performance of their duties to the fund. Additionally, in the normal course of business, the fund enters into agreements with service providers that may contain indemnification clauses. The fund’s maximum exposure under these agreements is unknown as this would involve future claims that may be made against the fund that have not yet occurred.
Investment Transactions and Income – Investment transactions are recorded on the trade date. Interest income is recorded on the accrual basis. All premium and discount is amortized or accreted for financial statement purposes in accordance with U.S. generally accepted accounting principles. Dividends received in cash are recorded on the ex-dividend date. Certain dividends from foreign securities will be recorded when the fund is informed of the dividend if such information is obtained subsequent to the ex-dividend date. Dividend and interest payments received in additional securities are recorded on the ex-dividend or ex-interest date in an amount equal to the value of the security on such date.
The fund may receive proceeds from litigation settlements. Any proceeds received from litigation involving portfolio holdings are reflected in the Statement of Operations in realized gain/loss if the security has been disposed of by the fund or in unrealized gain/loss if the security is still held by the fund. Any other proceeds from litigation not related to portfolio holdings are reflected as other income in the Statement of Operations.
36
Notes to Financial Statements – continued
Fees Paid Indirectly – The fund’s custody fee may be reduced according to an arrangement that measures the value of cash deposited with the custodian by the fund. This amount, for the year ended August 31, 2009, is shown as a reduction of total expenses on the Statement of Operations.
Tax Matters and Distributions – The fund intends to qualify as a regulated investment company, as defined under Subchapter M of the Internal Revenue Code, and to distribute all of its taxable income, including realized capital gains. As a result, no provision for federal income tax is required. The fund’s federal tax returns for the prior three fiscal years remain subject to examination by the Internal Revenue Service. Foreign taxes, if any, have been accrued by the fund in the accompanying financial statements.
Distributions to shareholders are recorded on the ex-dividend date. Income and capital gain distributions are determined in accordance with income tax regulations, which may differ from U.S. generally accepted accounting principles. Certain capital accounts in the financial statements are periodically adjusted for permanent differences in order to reflect their tax character. These adjustments have no impact on net assets or net asset value per share. Temporary differences which arise from recognizing certain items of income, expense, gain or loss in different periods for financial statement and tax purposes will reverse at some time in the future. Distributions in excess of net investment income or net realized gains are temporary overdistributions for financial statement purposes resulting from differences in the recognition or classification of income or distributions for financial statement and tax purposes.
Book/tax differences primarily relate to wash sale loss deferrals and capital loss carryforward and wash sale loss deferrals assumed as a result of the acquisition of MFS Strategic Value Fund.
The tax character of distributions declared to shareholders for the last two fiscal years is as follows:
| | | | |
| | | 8/31/2009 | | 8/31/2008 |
| Ordinary income (including any short-term capital gains) | | $154,220,972 | | $173,946,949 |
| Long-term capital gain | | — | | 656,282,906 |
| Total distributions | | $154,220,972 | | $830,229,855 |
37
Notes to Financial Statements – continued
The federal tax cost and the tax basis components of distributable earnings were as follows:
| | | |
| As of 8/31/09 | | | |
| Cost of investments | | $9,956,716,912 | |
| Gross appreciation | | 887,099,557 | |
| Gross depreciation | | (388,375,987 | ) |
| Net unrealized appreciation (depreciation) | | $498,723,570 | |
| |
| | | | |
| Undistributed ordinary income | | 21,842,009 | |
| Capital loss carryforwards | | (404,918,017 | ) |
| Post-October capital loss deferral | | (811,249,945 | ) |
| Other temporary differences | | (2,150,351 | ) |
As of August 31, 2009, the fund had capital loss carryforwards available to offset future realized gains. Such losses expire as follows:
| | | |
| 8/31/16 | | $(173,813,061 | ) |
| 8/31/17 | | (231,104,956 | ) |
| | $(404,918,017 | ) |
The availability of a portion of the capital loss carryforwards, which were acquired on July 24, 2009 in connection with the MFS Strategic Value Fund merger, may be limited in a given year.
Multiple Classes of Shares of Beneficial Interest – The fund offers multiple classes of shares, which differ in their respective distribution, service, and program manager fees. The fund’s income, realized and unrealized gain (loss), and common expenses are allocated to shareholders based on the daily net assets of each class. Dividends are declared separately for each class. Differences in per share dividend rates are generally due to differences in separate class expenses. Class B and Class 529B shares will convert to Class A and Class 529A shares, respectively, approximately eight years after purchase.
38
Notes to Financial Statements – continued
The fund’s distributions declared to shareholders as reported on the Statements of Changes in Net Assets are presented by class as follows:
| | | | | | | | |
| | | From net investment
income | | From net realized gain on
investments |
| | | Year ended
8/31/09 | | Year ended
8/31/08 | | Year ended
8/31/09 | | Year ended
8/31/08 |
| Class A | | $84,055,338 | | $70,728,880 | | $— | | $422,791,205 |
| Class B | | 4,941,104 | | 4,219,671 | | — | | 65,938,831 |
| Class C | | 8,662,663 | | 5,397,628 | | — | | 73,497,065 |
| Class I | | 29,668,552 | | 23,777,864 | | — | | 106,851,483 |
| Class W | | 13,508,786 | | 4,119,225 | | — | | 8,514,237 |
| Class R (b) | | — | | 414,601 | | — | | 3,981,123 |
| Class R1 | | 309,031 | | 115,459 | | — | | 1,493,207 |
| Former Class R2 (b) | | — | | 109,649 | | — | | 1,069,576 |
| Class R2 | | 3,733,677 | | 1,557,993 | | — | | 8,461,563 |
| Class R3 | | 4,556,365 | | 1,919,285 | | — | | 11,062,481 |
| Class R4 | | 4,668,683 | | 2,361,747 | | — | | 11,042,447 |
| Class 529A | | 84,438 | | 58,822 | | — | | 431,704 |
| Class 529B | | 14,160 | | 5,880 | | — | | 125,712 |
| Class 529C | | 18,175 | | 8,384 | | — | | 174,133 |
| Total | | $154,220,972 | | $114,795,088 | | $— | | $715,434,767 |
| (b) | At the close of business on April 18, 2008, Class R and Class R2 shares converted into Class R3 shares. Following this conversion, Class R3, Class R4, and Class R5 shares were renamed Class R2, Class R3, and Class R4 shares, respectively. |
| (3) | | Transactions with Affiliates |
Investment Adviser – The fund has an investment advisory agreement with MFS to provide overall investment management and related administrative services and facilities to the fund.
The management fee is computed daily and paid monthly at the following annual rates:
| | | |
| First $7.5 billion of average daily net assets | | 0.60 | % |
| Next $2.5 billion of average daily net assets | | 0.53 | % |
| Average daily net assets in excess of $10 billion | | 0.50 | % |
The investment adviser has agreed in writing to reduce its management fee to 0.45% of average daily net assets in excess of $12.5 billion. This written agreement will continue until modified by the fund’s Board of Trustees, but such agreement will continue at least until November 30, 2012. For the year ended August 31, 2009, the fund’s average daily net assets did not exceed $12.5 billion and therefore, the management fee was not reduced.
The management fee incurred for the year ended August 31, 2009 was equivalent to an annual effective rate of 0.59% of the fund’s average daily net assets.
39
Notes to Financial Statements – continued
Distributor – MFS Fund Distributors, Inc. (MFD), a wholly-owned subsidiary of MFS, as distributor, received $414,420 and $2,193 for the year ended August 31, 2009, as its portion of the initial sales charge on sales of Class A and Class 529A shares of the fund, respectively.
The Board of Trustees has adopted a distribution plan for certain class shares pursuant to Rule 12b-1 of the Investment Company Act of 1940.
The fund’s distribution plan provides that the fund will pay MFD for services provided by MFD and financial intermediaries in connection with the distribution and servicing of certain share classes. One component of the plan is a distribution fee paid to MFD and another component of the plan is a service fee paid to MFD. MFD may subsequently pay all, or a portion, of the distribution and/or service fees to financial intermediaries.
Distribution Plan Fee Table:
| | | | | | | | | | |
| | | Distribution
Fee Rate (d) | | Service
Fee Rate (d) | | Total
Distribution
Plan (d) | | Annual
Effective
Rate (e) | | Distribution
and Service
Fee |
| Class A | | — | | 0.25% | | 0.25% | | 0.30% | | $12,809,882 |
| Class B | | 0.75% | | 0.25% | | 1.00% | | 1.00% | | 4,040,594 |
| Class C | | 0.75% | | 0.25% | | 1.00% | | 1.00% | | 6,806,471 |
| Class W | | 0.10% | | — | | 0.10% | | 0.10% | | 651,295 |
| Class R1 | | 0.75% | | 0.25% | | 1.00% | | 1.00% | | 232,288 |
| Class R2 | | 0.25% | | 0.25% | | 0.50% | | 0.50% | | 1,057,223 |
| Class R3 | | — | | 0.25% | | 0.25% | | 0.25% | | 572,221 |
| Class 529A | | — | | 0.25% | | 0.25% | | 0.30% | | 13,398 |
| Class 529B | | 0.75% | | 0.25% | | 1.00% | | 1.00% | | 11,711 |
| Class 529C | | 0.75% | | 0.25% | | 1.00% | | 1.00% | | 15,608 |
| Total Distribution and Service Fees | | | | | | $26,210,691 |
| (d) | As of August 31, 2009, in accordance with the distribution plan for certain classes, the fund pays distribution and/or service fees equal to these annual percentage rates of each class’ average daily net assets. The distribution and service fee rates disclosed by class represent the current rates in effect at the end of the reporting period. Any rate changes, if applicable, are detailed below. |
| (e) | The annual effective rates represent actual fees incurred under the distribution plan for the year ended August 31, 2009 based on each class’ average daily net assets. Prior to March 1, 2009, the distribution fee rate for Class A and Class 529A was 0.10% and 0.25%, respectively, of which 0.10% of the Class A and Class 529A distribution fees were paid by the fund and the remaining 0.15% of the Class 529A distribution fee was not in effect. Effective March 1, 2009 the 0.10% Class A and 0.25% Class 529A annual distribution fees were eliminated. |
Certain Class A shares purchased prior to September 1, 2008 are subject to a contingent deferred sales charge (CDSC) in the event of a shareholder redemption within 12 months of purchase. Certain Class A shares purchased on or subsequent to September 1, 2008 are subject to a CDSC in the event of a shareholder redemption within 24 months of purchase. Class C and Class 529C shares are subject to a CDSC in the event of a shareholder redemption within 12 months of purchase. Class B and Class 529B shares are subject to a CDSC in
40
Notes to Financial Statements – continued
the event of a shareholder redemption within six years of purchase. All contingent deferred sales charges are paid to MFD and during the year ended August 31, 2009, were as follows:
| | |
| | | Amount |
| Class A | | $7,732 |
| Class B | | 432,471 |
| Class C | | 137,929 |
| Class 529B | | 568 |
| Class 529C | | 66 |
The fund has entered into and may from time to time enter into contracts with program managers and other parties which administer the tuition programs through which an investment in the fund’s 529 share classes is made. The fund has entered into an agreement with MFD pursuant to which MFD receives an annual fee of up to 0.10% of the average daily net assets attributable to each 529 share class. The services provided by MFD, or a third party with which MFD contracts, include recordkeeping and tax reporting and account services, as well as services designed to maintain the program’s compliance with the Internal Revenue Code and other regulatory requirements. Program manager fees for the year ended August 31, 2009, were as follows:
| | |
| | | Amount |
| Class 529A | | $4,463 |
| Class 529B | | 1,172 |
| Class 529C | | 1,562 |
| Total Program Manager Fees | | $7,197 |
Shareholder Servicing Agent – MFS Service Center, Inc. (MFSC), a wholly-owned subsidiary of MFS, receives a fee from the fund for its services as shareholder servicing agent calculated as a percentage of the average daily net assets of the fund as determined periodically under the supervision of the fund’s Board of Trustees. For the year ended August 31, 2009, the fee was $2,692,344, which equated to 0.0332% annually of the fund’s average daily net assets. MFSC also receives payment from the fund for out-of-pocket expenses, sub-accounting and other shareholder servicing costs which may be paid to affiliated and unaffiliated service providers. For the year ended August 31, 2009, these out-of-pocket expenses, sub-accounting and other shareholder servicing costs amounted to $7,934,778.
Under a Special Servicing Agreement among MFS, each MFS fund which invests in other MFS funds (“MFS fund-of-funds”) and certain underlying funds in which a MFS fund-of-funds invests (“underlying funds”), each underlying fund may pay a portion of each MFS fund-of-fund’s transfer agent-related expenses, including sub-accounting fees payable to financial intermediaries, to the extent such payments do not exceed the benefits realized
41
Notes to Financial Statements – continued
or expected to be realized by the underlying fund from the investment in the underlying fund by the MFS fund-of-fund. For the year ended August 31, 2009, these costs for the fund amounted to $1,108,187 and are reflected in the shareholder servicing costs on the Statement of Operations.
Administrator – MFS provides certain financial, legal, shareholder communications, compliance, and other administrative services to the fund. Under an administrative services agreement, the fund partially reimburses MFS the costs incurred to provide these services. The fund is charged an annual fixed amount of $17,500 plus a fee based on average daily net assets. The administrative services fee incurred for the year ended August 31, 2009 was equivalent to an annual effective rate of 0.0195% of the fund’s average daily net assets.
Trustees’ and Officers’ Compensation – The fund pays compensation to independent Trustees in the form of a retainer, attendance fees, and additional compensation to Board and Committee chairpersons. The fund does not pay compensation directly to Trustees or officers of the fund who are also officers of the investment adviser, all of whom receive remuneration for their services to the fund from MFS. Certain officers and Trustees of the fund are officers or directors of MFS, MFD, and MFSC.
Prior to December 31, 2001, the fund had an unfunded defined benefit plan (“DB plan”) for independent Trustees. As of December 31, 2001, the Board took action to terminate the DB plan with respect to then-current and any future independent Trustees, such that the DB Plan covers only certain of those former independent Trustees who retired on or before December 31, 2001. The DB Plan resulted in a pension expense of $1,091 and is included in independent Trustees’ compensation for the year ended August 31, 2009. The liability for deferred retirement benefits payable to certain independent Trustees under the DB plan amounted to $7,695 at August 31, 2009, and is included in payable for independent Trustees’ compensation on the Statement of Assets and Liabilities.
Other – This fund and certain other funds managed by MFS (the funds) have entered into services agreements (the Agreements) which provide for payment of fees by the funds to Tarantino LLC and Griffin Compliance LLC in return for the provision of services of an Independent Chief Compliance Officer (ICCO) and Assistant ICCO, respectively, for the funds. The ICCO and Assistant ICCO are officers of the funds and the sole members of Tarantino LLC and Griffin Compliance LLC, respectively. The funds can terminate the Agreements with Tarantino LLC and Griffin Compliance LLC at any time under the terms of the Agreements. For the year ended August 31, 2009, the aggregate fees paid by the fund to Tarantino LLC and Griffin Compliance LLC were $99,374 and are included in miscellaneous expense on the Statement of Operations. MFS has
42
Notes to Financial Statements – continued
agreed to reimburse the fund for a portion of the payments made by the fund in the amount of $52,073, which is shown as a reduction of total expenses in the Statement of Operations. Additionally, MFS has agreed to bear all expenses associated with office space, other administrative support, and supplies provided to the ICCO and Assistant ICCO.
The fund may invest in a money market fund managed by MFS which seeks a high level of current income consistent with preservation of capital and liquidity. Income earned on this investment is included in dividends from underlying funds on the Statement of Operations. This money market fund does not pay a management fee to MFS.
Purchases and sales of investments, other than U.S. Government securities, purchased option transactions, and short-term obligations, aggregated $4,501,781,119 and $2,738,924,962, respectively.
| (5) | | Shares of Beneficial Interest |
The fund’s Declaration of Trust permits the Trustees to issue an unlimited number of full and fractional shares of beneficial interest. Transactions in fund shares were as follows:
| | | | | | | | |
| | | Year ended
8/31/09 | | Year ended
8/31/08 |
| | | Shares | | Amount | | Shares | | Amount |
| Shares sold | | | | | | | | |
Class A | | 114,220,241 | | $1,977,046,497 | | 86,069,004 | | $2,236,318,273 |
Class B | | 1,851,024 | | 31,978,710 | | 1,907,676 | | 49,149,792 |
Class C | | 9,668,328 | | 168,722,263 | | 8,557,410 | | 218,552,020 |
Class I | | 81,825,274 | | 1,495,504,115 | | 20,262,584 | | 517,717,688 |
Class W | | 42,042,814 | | 751,366,445 | | 25,112,117 | | 623,140,497 |
Class R (b) | | — | | — | | 1,385,503 | | 37,451,432 |
Class R1 | | 859,001 | | 14,365,812 | | 701,608 | | 18,116,215 |
Former Class R2 (b) | | — | | — | | 905,950 | | 23,480,033 |
Class R2 | | 7,879,905 | | 136,521,336 | | 8,592,789 | | 217,364,251 |
Class R3 | | 12,546,759 | | 215,521,587 | | 5,080,886 | | 130,948,123 |
Class R4 | | 29,125,129 | | 501,838,158 | | 6,508,294 | | 172,369,910 |
Class 529A | | 44,407 | | 725,464 | | 44,600 | | 1,093,545 |
Class 529B | | 8,554 | | 143,812 | | 7,042 | | 176,417 |
Class 529C | | 15,101 | | 253,141 | | 14,558 | | 372,338 |
| | 300,086,537 | | $5,293,987,340 | | 165,150,021 | | $4,246,250,534 |
43
Notes to Financial Statements – continued
| | | | | | | | | | | | |
| | | Year ended
8/31/09 | | | Year ended
8/31/08 | |
| | | Shares | | | Amount | | | Shares | | | Amount | |
Shares issued in connection with
acquisition of MFS Strategic Value
Fund | | | | | | | | | | | | |
Class A | | 5,927,351 | | | $110,841,470 | | | — | | | $— | |
Class B | | 2,483,156 | | | 46,161,864 | | | — | | | — | |
Class C | | 1,254,950 | | | 23,282,099 | | | — | | | — | |
Class I | | 140,193 | | | 2,632,823 | | | — | | | — | |
Class R1 | | 43,158 | | | 795,393 | | | — | | | — | |
Class R2 | | 52,077 | | | 966,551 | | | — | | | — | |
Class R3 | | 102,973 | | | 1,922,735 | | | — | | | — | |
Class R4 | | 6,623 | | | 123,930 | | | — | | | — | |
| | 10,010,481 | | | $186,726,865 | | | — | | | $— | |
Shares issued to shareholders in
reinvestment of distributions | | | | | | | | | | | | |
Class A | | 3,646,818 | | | $64,925,044 | | | 14,747,850 | | | $390,320,630 | |
Class B | | 235,893 | | | 4,136,858 | | | 2,190,531 | | | 57,861,235 | |
Class C | | 299,018 | | | 5,216,018 | | | 1,822,295 | | | 48,010,577 | |
Class I | | 1,352,689 | | | 24,305,732 | | | 4,550,064 | | | 120,814,399 | |
Class W | | 715,689 | | | 12,615,286 | | | 451,347 | | | 11,641,957 | |
Class R (b) | | — | | | — | | | 130,998 | | | 3,481,221 | |
Class R1 | | 17,971 | | | 309,031 | | | 61,410 | | | 1,608,666 | |
Former Class R2 (b) | | — | | | — | | | 44,686 | | | 1,176,701 | |
Class R2 | | 202,274 | | | 3,554,285 | | | 380,300 | | | 9,957,529 | |
Class R3 | | 260,962 | | | 4,556,365 | | | 492,217 | | | 12,981,766 | |
Class R4 | | 182,633 | | | 3,234,419 | | | 274,670 | | | 7,241,027 | |
Class 529A | | 4,779 | | | 84,386 | | | 18,617 | | | 490,490 | |
Class 529B | | 820 | | | 14,149 | | | 5,029 | | | 131,592 | |
Class 529C | | 1,053 | | | 18,149 | | | 6,981 | | | 182,517 | |
| | 6,920,599 | | | $122,969,722 | | | 25,176,995 | | | $665,900,307 | |
| Shares reacquired | | | | | | | | | | | | |
Class A | | (124,230,352 | ) | | $(2,212,076,546 | ) | | (81,712,080 | ) | | $(2,145,146,045 | ) |
Class B | | (13,801,295 | ) | | (235,153,482 | ) | | (13,175,491 | ) | | (339,199,800 | ) |
Class C | | (11,168,256 | ) | | (189,581,664 | ) | | (7,762,108 | ) | | (196,554,106 | ) |
Class I | | (33,062,871 | ) | | (528,992,098 | ) | | (9,291,362 | ) | | (245,943,303 | ) |
Class W | | (15,609,548 | ) | | (267,801,880 | ) | | (3,547,674 | ) | | (87,306,230 | ) |
Class R (b) | | — | | | — | | | (3,915,578 | ) | | (102,959,050 | ) |
Class R1 | | (391,073 | ) | | (6,633,795 | ) | | (254,731 | ) | | (6,381,496 | ) |
Former Class R2 (b) | | — | | | — | | | (1,407,645 | ) | | (35,373,200 | ) |
Class R2 | | (3,694,508 | ) | | (63,192,966 | ) | | (2,085,401 | ) | | (52,051,070 | ) |
Class R3 | | (3,243,149 | ) | | (55,647,147 | ) | | (2,152,810 | ) | | (55,002,992 | ) |
Class R4 | | (3,842,938 | ) | | (66,874,580 | ) | | (3,478,526 | ) | | (94,277,219 | ) |
Class 529A | | (44,449 | ) | | (749,328 | ) | | (29,663 | ) | | (742,098 | ) |
Class 529B | | (15,132 | ) | | (246,206 | ) | | (8,406 | ) | | (210,422 | ) |
Class 529C | | (24,121 | ) | | (418,407 | ) | | (12,856 | ) | | (325,539 | ) |
| | (209,127,692 | ) | | $(3,627,368,099 | ) | | (128,834,331 | ) | | $(3,361,472,570 | ) |
44
Notes to Financial Statements – continued
| | | | | | | | | | | | |
| | | Year ended
8/31/09 | | | Year ended
8/31/08 | |
| | | Shares | | | Amount | | | Shares | | | Amount | |
| Net change | | | | | | | | | | | | |
Class A | | (435,942 | ) | | $(59,263,535 | ) | | 19,104,774 | | | $481,492,858 | |
Class B | | (9,231,222 | ) | | (152,876,050 | ) | | (9,077,284 | ) | | (232,188,773 | ) |
Class C | | 54,040 | | | 7,638,716 | | | 2,617,597 | | | 70,008,491 | |
Class I | | 50,255,285 | | | 993,450,572 | | | 15,521,286 | | | 392,588,784 | |
Class W | | 27,148,955 | | | 496,179,851 | | | 22,015,790 | | | 547,476,224 | |
Class R (b) | | — | | | — | | | (2,399,077 | ) | | (62,026,397 | ) |
Class R1 | | 529,057 | | | 8,836,441 | | | 508,287 | | | 13,343,385 | |
Former Class R2 (b) | | — | | | — | | | (457,009 | ) | | (10,716,466 | ) |
Class R2 | | 4,439,748 | | | 77,849,206 | | | 6,887,688 | | | 175,270,710 | |
Class R3 | | 9,667,545 | | | 166,353,540 | | | 3,420,293 | | | 88,926,897 | |
Class R4 | | 25,471,447 | | | 438,321,927 | | | 3,304,438 | | | 85,333,718 | |
Class 529A | | 4,737 | | | 60,522 | | | 33,554 | | | 841,937 | |
Class 529B | | (5,758 | ) | | (88,245 | ) | | 3,665 | | | 97,587 | |
Class 529C | | (7,967 | ) | | (147,117 | ) | | 8,683 | | | 229,316 | |
| | 107,889,925 | | | $1,976,315,828 | | | 61,492,685 | | | $1,550,678,271 | |
| (b) | At the close of business on April 18, 2008, Class R and Class R2 shares converted into Class R3 shares. Following this conversion, Class R3, Class R4, and Class R5 shares were renamed Class R2, Class R3, and Class R4 shares, respectively. |
The fund is one of several mutual funds in which the MFS funds-of-funds may invest. The MFS funds-of-funds do not invest in the underlying MFS funds for the purpose of exercising management or control. At the end of the period, the MFS Aggressive Growth Allocation Fund, MFS Growth Allocation Fund and MFS Moderate Allocation Fund were the owners of record of approximately 1%, 2%, and 2% respectively, of the value of outstanding voting shares of the fund. In addition, the MFS Conservative Allocation Fund, MFS Lifetime Retirement Income Fund, MFS Lifetime 2010 Fund, MFS Lifetime 2020 Fund, MFS Lifetime 2030 Fund, and MFS Lifetime 2040 Fund were each the owners of record of less than 1% of the value of outstanding voting shares of the fund.
The fund and certain other funds managed by MFS participate in a $1.1 billion unsecured committed line of credit, subject to a $1 billion sublimit, provided by a syndication of banks under a credit agreement. Borrowings may be made for temporary financing needs. Interest is charged to each fund, based on its borrowings, generally at a rate equal to the higher of the Federal Reserve funds rate or one month LIBOR plus an agreed upon spread. A commitment fee, based on the average daily, unused portion of the committed line of credit, is allocated among the participating funds at the end of each calendar quarter. In addition, the fund and other funds managed by MFS have established unsecured uncommitted borrowing arrangements with certain banks for temporary financing needs. Interest is charged to each fund, based on its
45
Notes to Financial Statements – continued
borrowings, at a rate equal to the Federal Reserve funds rate plus an agreed upon spread. For the year ended August 31, 2009, the fund’s commitment fee and interest expense were $97,493 and $1,617 respectively, and are included in miscellaneous expense on the Statement of Operations.
The fund’s investment adviser, MFS, was the subject of an administrative proceeding concerning market timing which resulted in the Securities and Exchange Commission (the “SEC”) entering an order approving a settlement with MFS and two of its former officers (the “Settlement Order”). Under the terms of the Settlement Order, MFS transferred $175 million in disgorgement and $50 million in penalty (the “Payments”) to the SEC, which established a Fair Fund from which settlement funds have been, or will be, distributed to eligible current and former shareholders of the fund and certain other affected MFS retail funds. The Payments, along with additional amounts from a third-party settlement, have been, or will be, distributed to eligible shareholders in accordance with a plan developed by an independent distribution consultant (the “IDC”) in consultation with MFS and the Board of Trustees of the MFS retail funds. The plan was approved in July 2007 by the SEC. Pursuant to the distribution plan, after the distributions to eligible shareholders have been made, residual amounts, if any, may be available for distribution to the fund and certain other affected MFS retail funds. Certain procedural conditions of the distribution plan have not been met to date and, as such, the ultimate timing and amount of any payment of the residual amount is not known at this time.
| (8) | | Transactions in Underlying Funds-Affiliated Issuers |
An affiliated issuer may be considered one in which the fund owns 5% or more of the outstanding voting securities, or a company which is under common control. For the purposes of this report, the fund assumes the following to be affiliated issuers:
| | | | | | | | | |
| Underlying Funds | | Beginning
Shares/Par
Amount | | Acquisitions
Shares/Par
Amount | | Dispositions
Shares/Par
Amount | | | Ending
Shares/Par
Amount |
MFS Institutional Money
Market Portfolio | | — | | 1,921,088,125 | | (1,784,387,609 | ) | | 136,700,516 |
| | | | |
| Underlying Funds | | Realized
Gain (Loss) | | Capital Gain
Distributions | | Dividend
Income | | | Ending Value |
MFS Institutional Money
Market Portfolio | | $— | | $— | | $264,799 | | | $136,700,516 |
At close of business on July 24, 2009, the fund acquired all of the assets and liabilities of MFS Strategic Value Fund. The acquisition was accomplished by a
46
Notes to Financial Statements – continued
tax-free exchange of 10,010,481 shares of the fund (valued at $186,726,865) for all of the assets and liabilities of MFS Strategic Value Fund. MFS Strategic Value Fund then distributed the shares of the fund that MFS Strategic Value Fund received from the fund to its shareholders. MFS Strategic Value Fund’s net assets on that date were $186,726,865, including $5,941,770 of unrealized appreciation, $260,707 of accumulated net investment loss, and $183,222,873 of accumulated net realized loss on investments and foreign currency transactions. The aggregate net assets of the fund after the acquisition were $9,770,920,204.
47
REPORT OF INDEPENDENT REGISTERED
PUBLIC ACCOUNTING FIRM
To the Board of Trustees of MFS Series Trust I and Shareholders of
MFS Value Fund:
We have audited the accompanying statement of assets and liabilities of MFS Value Fund (the Fund) (one of the portfolios comprising MFS Series Trust I), including the portfolio of investments, as of August 31, 2009, and the related statement of operations for the year then ended, the statements of changes in net assets for each of the two years in the period then ended, and the financial highlights for each of the periods indicated therein. These financial statements and financial highlights are the responsibility of the Fund’s management. Our responsibility is to express an opinion on these financial statements and financial highlights based on our audits.
We conducted our audits in accordance with the standards of the Public Company Accounting Oversight Board (United States). Those standards require that we plan and perform the audit to obtain reasonable assurance about whether the financial statements and financial highlights are free of material misstatement. We were not engaged to perform an audit of the Fund’s internal control over financial reporting. Our audits included consideration of internal control over financial reporting as a basis for designing audit procedures that are appropriate in the circumstances, but not for the purpose of expressing an opinion on the effectiveness of the Fund’s internal control over financial reporting. Accordingly, we express no such opinion. An audit also includes examining, on a test basis, evidence supporting the amounts and disclosures in the financial statements and financial highlights, assessing the accounting principles used and significant estimates made by management, and evaluating the overall financial statement presentation. Our procedures included confirmation of securities owned as of August 31, 2009, by correspondence with the custodian and brokers or by other appropriate auditing procedures where replies from brokers were not received. We believe that our audits provide a reasonable basis for our opinion.
In our opinion, the financial statements and financial highlights referred to above present fairly, in all material respects, the financial position of the MFS Value Fund at August 31, 2009, the results of its operations for the year then ended, the changes in its net assets for each of the two years in the period then ended, and its financial highlights for each of the periods indicated therein, in conformity with U.S. generally accepted accounting principles.

Boston, Massachusetts
October 16, 2009
48
TRUSTEES AND OFFICERS —
IDENTIFICATION AND BACKGROUND
The Trustees and officers of the Trust, as of October 1, 2009, are listed below, together with their principal occupations during the past five years. (Their titles may have varied during that period.) The address of each Trustee and officer is 500 Boylston Street, Boston, Massachusetts 02116.
| | | | | | |
Name, Date of Birth | | Position(s) Held
with Fund | | Trustee/Officer
Since (h) | | Principal Occupations During
the Past Five Years & Other
Directorships (j) |
| INTERESTED TRUSTEES | | | | |
Robert J. Manning (k)
(born 10/20/63) | | Trustee | | February 2004 | | Massachusetts Financial Services Company, Chief Executive Officer, President, Chief Investment Officer and Director |
Robert C. Pozen (k)
(born 8/08/46) | | Trustee | | February 2004 | | Massachusetts Financial Services Company, Chairman (since February 2004); Medtronic, Inc, (medical devices), Director (since 2004); Harvard Business School (education), Senior Lecturer (since 2008); Bell Canada Enterprises (telecommunications), Director (until February 2009); The Bank of New York, Director (finance), (March 2004 to May 2005); Telesat (satellite communications), Director (until November 2007) |
| INDEPENDENT TRUSTEES | | | | |
David H. Gunning
(born 5/30/42) | | Trustee and Chair of Trustees | | January 2004 | | Retired; Cleveland-Cliffs Inc. (mining products and service provider), Vice Chairman/Director (until May 2007); Lincoln Electric Holdings, Inc. (welding equipment manufacturer), Director; Development Alternatives, Inc. (consulting), Director/Non Executive Chairman; Southwest Gas Corp. (natural gas distribution), Director (until May 2004); Portman Limited (mining), Director (until 2008) |
49
Trustees and Officers – continued
| | | | | | |
Name, Date of Birth | | Position(s) Held
with Fund | | Trustee/Officer
Since (h) | | Principal Occupations During
the Past Five Years & Other
Directorships (j) |
Robert E. Butler (n)
(born 11/29/41) | | Trustee | | January 2006 | | Consultant – investment company industry regulatory and compliance matters (since July 2002); PricewaterhouseCoopers LLP (professional services firm), Partner (until 2002) |
Lawrence H. Cohn, M.D.
(born 3/11/37) | | Trustee | | June 1989 | | Brigham and Women’s Hospital, Senior Cardiac Surgeon (since 2005); Harvard Medical School, Professor of Cardiac Surgery; Partners HealthCare, Physician Director of Medical Device Technology (since 2006); Brigham and Women’s Hospital, Chief of Cardiac Surgery (until 2005) |
Maureen R. Goldfarb
(born 4/6/55) | | Trustee | | January 2009 | | Private investor; John Hancock Financial Services, Inc., Executive Vice President (until 2004); John Hancock Mutual Funds, Trustee and Chief Executive Officer (until 2004) |
William R. Gutow
(born 9/27/41) | | Trustee | | December 1993 | | Private investor and real estate consultant; Capital Entertainment Management Company (video franchise), Vice Chairman; Atlantic Coast Tan (tanning salons), Vice Chairman (until 2007); Texas Donuts (donut franchise), Vice Chairman (until 2009) |
Michael Hegarty
(born 12/21/44) | | Trustee | | December 2004 | | Private investor; Retired; AXA Financial (financial services and insurance), Vice Chairman and Chief Operating Officer (until 2001); The Equitable Life Assurance Society (insurance), President and Chief Operating Officer (until 2001) |
J. Atwood Ives
(born 5/01/36) | | Trustee | | February 1992 | | Private investor; KeySpan Corporation (energy related services), Director (until 2004) |
50
Trustees and Officers – continued
| | | | | | |
Name, Date of Birth | | Position(s) Held
with Fund | | Trustee/Officer
Since (h) | | Principal Occupations During
the Past Five Years & Other
Directorships (j) |
John P. Kavanaugh
(born 11/4/54) | | Trustee | | January 2009 | | Private investor; The Hanover Insurance Group, Inc., Vice President and Chief Investment Officer (until 2006); Allmerica Investment Trust, Allmerica Securities Trust and Opus Investment Trust (investment companies), Chairman, President and Trustee (until 2006) |
J. Dale Sherratt
(born 9/23/38) | | Trustee | | June 1989 | | Insight Resources, Inc. (acquisition planning specialists), President; Wellfleet Investments (investor in health care companies), Managing General Partner |
Laurie J. Thomsen
(born 8/05/57) | | Trustee | | March 2005 | | New Profit, Inc. (venture philanthropy), Executive Partner (since 2006); Private investor; Prism Venture Partners (venture capital), Co-founder and General Partner (until June 2004); The Travelers Companies (commercial property liability insurance), Director |
Robert W. Uek
(born 5/18/41) | | Trustee | | January 2006 | | Consultant to investment company industry; PricewaterhouseCoopers LLP (professional services firm), Partner (until 1999); TT International Funds (mutual fund complex), Trustee (until 2005); Hillview Investment Trust II Funds (mutual fund complex), Trustee (until 2005) |
| OFFICERS | | | | | | |
Maria F. Dwyer (k)
(born 12/01/58) | | President | | November 2005 | | Massachusetts Financial Services Company, Executive Vice President and Chief Regulatory Officer (since March 2004) Chief Compliance Officer (since December 2006); Fidelity Management & Research Company, Vice President (prior to March 2004); Fidelity Group of Funds, President and Treasurer (until March 2004) |
51
Trustees and Officers – continued
| | | | | | |
Name, Date of Birth | | Position(s) Held
with Fund | | Trustee/Officer
Since (h) | | Principal Occupations During
the Past Five Years & Other
Directorships (j) |
Christopher R. Bohane (k)
(born 1/18/74) | | Assistant Secretary and Assistant Clerk | | July 2005 | | Massachusetts Financial Services Company, Vice President and Senior Counsel |
John M. Corcoran (k)
(born 04/13/65) | | Treasurer | | October 2008 | | Massachusetts Financial Services Company, Senior Vice President (since October 2008); State Street Bank and Trust (financial services provider), Senior Vice President, (until September 2008) |
Ethan D. Corey (k)
(born 11/21/63) | | Assistant Secretary and Assistant Clerk | | July 2005 | | Massachusetts Financial Services Company, Senior Vice President and Associate General Counsel (since 2004); Dechert LLP (law firm), Counsel (prior to December 2004) |
David L. DiLorenzo (k)
(born 8/10/68) | | Assistant Treasurer | | July 2005 | | Massachusetts Financial Services Company, Vice President (since June 2005); JP Morgan Investor Services, Vice President (until June 2005) |
Timothy M. Fagan (k)
(born 7/10/68) | | Assistant Secretary and Assistant Clerk | | September 2005 | | Massachusetts Financial Services Company, Vice President and Senior Counsel (since September 2005); John Hancock Advisers, LLC, Vice President, Senior Attorney and Chief Compliance Officer (until August 2005) |
Mark D. Fischer (k)
(born 10/27/70) | | Assistant Treasurer | | July 2005 | | Massachusetts Financial Services Company, Vice President (since May 2005); JP Morgan Investment Management Company, Vice President (until May 2005) |
Robyn L. Griffin
(born 7/04/75) | | Assistant Independent Chief Compliance Officer | | August 2008 | | Griffin Compliance LLC (provider of compliance services), Principal (since August 2008); State Street Corporation (financial services provider), Mutual Fund Administration Assistant Vice President (October 2006 – July 2008); Liberty Mutual Group (insurance), Personal Market Assistant Controller (April 2006 – October 2006); Deloitte & Touche LLP (professional services firm), Senior Manager (prior to April 2006) |
52
Trustees and Officers – continued
| | | | | | |
Name, Date of Birth | | Position(s) Held
with Fund | | Trustee/Officer
Since (h) | | Principal Occupations During
the Past Five Years & Other
Directorships (j) |
Brian E. Langenfeld (k)
(born 3/07/73) | | Assistant Secretary and Assistant Clerk | | June 2006 | | Massachusetts Financial Services Company, Vice President and Senior Counsel (since May 2006); John Hancock Advisers, LLC, Assistant Vice President and Counsel (until April 2006) |
Ellen Moynihan (k)
(born 11/13/57) | | Assistant Treasurer | | April 1997 | | Massachusetts Financial Services Company, Senior Vice President |
Susan S. Newton (k)
(born 3/07/50) | | Assistant Secretary and Assistant Clerk | | May 2005 | | Massachusetts Financial Services Company, Senior Vice President and Associate General Counsel (since April 2005); John Hancock Advisers, LLC, Senior Vice President, Secretary and Chief Legal Officer (until April 2005) |
Susan A. Pereira (k)
(born 11/05/70) | | Assistant Secretary and Assistant Clerk | | July 2005 | | Massachusetts Financial Services Company, Vice President and Senior Counsel (since June 2004); Bingham McCutchen LLP (law firm), Associate (until June 2004) |
Mark N. Polebaum (k)
(born 5/01/52) | | Secretary and Clerk | | January 2006 | | Massachusetts Financial Services Company, Executive Vice President, General Counsel and Secretary (since January 2006); Wilmer Cutler Pickering Hale and Dorr LLP (law firm), Partner (until January 2006) |
Frank L. Tarantino
(born 3/07/44) | | Independent Chief Compliance Officer | | June 2004 | | Tarantino LLC (provider of compliance services), Principal (since June 2004); CRA Business Strategies Group (consulting services), Executive Vice President (until June 2004) |
Richard S. Weitzel (k)
(born 7/16/70) | | Assistant Secretary and Assistant Clerk | | October 2007 | | Massachusetts Financial Services Company, Vice President and Assistant General Counsel (since 2004); Massachusetts Department of Business and Technology, General Counsel (until April 2004) |
James O. Yost (k)
(born 6/12/60) | | Assistant Treasurer | | September 1990 | | Massachusetts Financial Services Company, Senior Vice President |
| (h) | Date first appointed to serve as Trustee/officer of an MFS fund. Each Trustee has served continuously since appointment unless indicated otherwise. For the period from December 15, 2004 until February 22, 2005, Messrs. Pozen and Manning served as Advisory Trustees. For the period March 2008 until October 2008, Ms. Dwyer served as Treasurer of the Funds. |
53
Trustees and Officers – continued
| (j) | Directorships or trusteeships of companies required to report to the Securities and Exchange Commission (i.e., “public companies”). |
| (k) | “Interested person” of the Trust within the meaning of the Investment Company Act of 1940 (referred to as the 1940 Act), which is the principal federal law governing investment companies like the fund, as a result of position with MFS. The address of MFS is 500 Boylston Street, Boston, Massachusetts 02116. |
| (n) | In 2004 and 2005, Mr. Butler provided consulting services to the independent compliance consultant retained by MFS pursuant to its settlement with the SEC concerning market timing and related matters. The terms of that settlement required that compensation and expenses related to the independent compliance consultant be borne exclusively by MFS and, therefore, MFS paid Mr. Butler for the services he rendered to the independent compliance consultant. In 2004 and 2005, MFS paid Mr. Butler a total of $351,119.29. |
Each Trustee (except Messrs. Butler, Kavanaugh and Uek and Ms. Goldfarb) has been elected by shareholders and each Trustee and officer holds office until his or her successor is chosen and qualified or until his or her earlier death, resignation, retirement or removal. The Trust held a shareholders’ meeting in 2005 to elect Trustees, and will hold a shareholders’ meeting at least once every five years thereafter, to elect Trustees. Messrs. Butler, Kavanaugh, Sherratt, Uek and Ms. Thomsen are members of the Trust’s Audit Committee.
Each of the Fund’s Trustees and officers holds comparable positions with certain other funds of which MFS or a subsidiary is the investment adviser or distributor, and, in the case of the officers, with certain affiliates of MFS. As of January 1, 2009, the Trustees served as board members of 104 funds within the MFS Family of Funds.
The Statement of Additional Information for the Fund and further information about the Trustees are available without charge upon request by calling 1-800-225-2606.
| | |
| Investment Adviser | | Custodian |
Massachusetts Financial Services Company
500 Boylston Street, Boston, MA 02116-3741 | | State Street Bank and Trust
1 Lincoln Street, Boston, MA 02111-2900 |
| Distributor | | Independent Registered Public Accounting Firm |
MFS Fund Distributors, Inc.
500 Boylston Street, Boston, MA 02116-3741 | | Ernst & Young LLP
200 Clarendon Street, Boston, MA 02116 |
| Portfolio Managers | | |
Nevin Chitkara Steven Gorham | | |
54
BOARD REVIEW OF INVESTMENT ADVISORY AGREEMENT
The Investment Company Act of 1940 requires that both the full Board of Trustees and a majority of the non-interested (“independent”) Trustees, voting separately, annually approve the continuation of the Fund’s investment advisory agreement with MFS. The Trustees consider matters bearing on the Fund and its advisory arrangements at their meetings throughout the year, including a review of performance data at each regular meeting. In addition, the independent Trustees met several times over the course of three months beginning in May and ending in July, 2009 (“contract review meetings”) for the specific purpose of considering whether to approve the continuation of the investment advisory agreement for the Fund and the other investment companies that the Board oversees (the “MFS Funds”). The independent Trustees were assisted in their evaluation of the Fund’s investment advisory agreement by independent legal counsel, from whom they received separate legal advice and with whom they met separately from MFS during various contract review meetings. The independent Trustees were also assisted in this process by the MFS Funds’ Independent Chief Compliance Officer, a full-time senior officer appointed by and reporting to the independent Trustees.
In connection with their deliberations regarding the continuation of the investment advisory agreement, the Trustees, including the independent Trustees, considered such information and factors as they believed, in light of the legal advice furnished to them and their own business judgment, to be relevant. The investment advisory agreement for the Fund was considered separately, although the Trustees also took into account the common interests of all MFS Funds in their review. As described below, the Trustees considered the nature, quality, and extent of the various investment advisory, administrative, and shareholder services performed by MFS under the existing investment advisory agreement and other arrangements with the Fund.
In connection with their contract review meetings, the Trustees received and relied upon materials that included, among other items: (i) information provided by Lipper Inc., an independent third party, on the investment performance of the Fund for various time periods ended December 31, 2008 and the investment performance of a group of funds with substantially similar investment classifications/objectives (the “Lipper performance universe”), (ii) information provided by Lipper Inc. on the Fund’s advisory fees and other expenses and the advisory fees and other expenses of comparable funds identified by Lipper Inc. (the “Lipper expense group”), (iii) information provided by MFS on the advisory fees of comparable portfolios of other clients of MFS, including institutional separate accounts and other clients, (iv) information as to whether and to what extent applicable expense waivers,
55
Board Review of Investment Advisory Agreement – continued
reimbursements or fee “breakpoints” are observed for the Fund, (v) information regarding MFS’ financial results and financial condition, including MFS’ and certain of its affiliates’ estimated profitability from services performed for the Fund and the MFS Funds as a whole, (vi) MFS’ views regarding the outlook for the mutual fund industry and the strategic business plans of MFS, (vii) descriptions of various functions performed by MFS for the Funds, such as compliance monitoring and portfolio trading practices, and (viii) information regarding the overall organization of MFS, including information about MFS’ senior management and other personnel providing investment advisory, administrative and other services to the Fund and the other MFS Funds. The comparative performance, fee and expense information prepared and provided by Lipper Inc. was not independently verified and the independent Trustees did not independently verify any information provided to them by MFS.
The Trustees’ conclusion as to the continuation of the investment advisory agreement was based on a comprehensive consideration of all information provided to the Trustees and not the result of any single factor. Some of the factors that figured particularly in the Trustees’ deliberations are described below, although individual Trustees may have evaluated the information presented differently from one another, giving different weights to various factors. It is also important to recognize that the fee arrangements for the Fund and other MFS Funds are the result of years of review and discussion between the independent Trustees and MFS, that certain aspects of such arrangements may receive greater scrutiny in some years than in others, and that the Trustees’ conclusions may be based, in part, on their consideration of these same arrangements during the course of the year and in prior years.
Based on information provided by Lipper Inc., the Trustees reviewed the Fund’s total return investment performance as well as the performance of peer groups of funds over various time periods. The Trustees placed particular emphasis on the total return performance of the Fund’s Class A shares in comparison to the performance of funds in its Lipper performance universe over the three-year period ended December 31, 2008, which the Trustees believed was a long enough period to reflect differing market conditions. The total return performance of the Fund’s Class A shares was in the 1st quintile relative to the other funds in the universe for this three-year period (the 1st quintile being the best performers and the 5th quintile being the worst performers). The total return performance of the Fund’s Class A shares was in the 1st quintile for each of the one and five-year periods ended December 31, 2008 relative to the Lipper performance universe. Because of the passage of time, these performance results are likely to differ from the performance results for more recent periods, including those shown elsewhere in this report.
56
Board Review of Investment Advisory Agreement – continued
In the course of their deliberations, the Trustees took into account information provided by MFS in connection with the contract review meetings, as well as during investment review meetings conducted with portfolio management personnel during the course of the year regarding the Fund’s performance. After reviewing these and related factors, the Trustees concluded, within the context of their overall conclusions regarding the investment advisory agreement, that they were satisfied with MFS’ responses and efforts relating to investment performance.
In assessing the reasonableness of the Fund’s advisory fee, the Trustees considered, among other information, the Fund’s advisory fee and the total expense ratio of the Fund’s Class A shares as a percentage of average daily net assets and the advisory fee and total expense ratios of peer groups of funds based on information provided by Lipper Inc. The Trustees considered that, according to the Lipper data (which takes into account any fee reductions or expense limitations that were in effect during the Fund’s last fiscal year), the Fund’s effective advisory fee rate was approximately at the Lipper expense group median, and the Fund’s total expense ratio was higher than the Lipper expense group median.
The Trustees also considered the advisory fees charged by MFS to institutional accounts. In comparing these fees, the Trustees considered information provided by MFS as to the generally broader scope of services provided by MFS to the Fund in comparison to institutional accounts, the higher demands placed on MFS’ investment personnel and trading infrastructure as a result of the daily cash in-flows and out-flows of the Fund, and the impact on MFS and expenses associated with the more extensive regulatory regime to which the Fund is subject in comparison to institutional accounts.
The Trustees also considered whether the Fund is likely to benefit from any economies of scale in the management of the Fund in the event of growth in assets of the Fund. They noted that the Fund’s advisory fee rate schedule is currently subject to contractual breakpoints that reduce the Fund’s advisory fee rate on average daily net assets over $7.5 billion and $10 billion, and that MFS has agreed in writing to reduce its advisory fee on average daily net assets over $12.5 billion, which may not be changed without the Trustees’ approval. The Trustees concluded that the existing breakpoints were sufficient to allow the Fund to benefit from economies of scale as its assets grow.
The Trustees also considered information prepared by MFS relating to MFS’ costs and profits with respect to the Fund, the MFS Funds considered as a group, and other investment companies and accounts advised by MFS, as well as MFS’ methodologies used to determine and allocate its costs to the MFS Funds, the Fund and other accounts and products for purposes of estimating profitability.
57
Board Review of Investment Advisory Agreement – continued
After reviewing these and other factors described herein, the Trustees concluded, within the context of their overall conclusions regarding the investment advisory agreement, that the advisory fees charged to the Fund represent reasonable compensation in light of the services being provided by MFS to the Fund.
In addition, the Trustees considered MFS’ resources and related efforts to continue to retain, attract and motivate capable personnel to serve the Fund. The Trustees also considered current and developing conditions in the financial services industry, including the entry into the industry of large and well-capitalized companies which are spending, and appear to be prepared to continue to spend, substantial sums to engage personnel and to provide services to competing investment companies. In this regard, the Trustees also considered the financial resources of MFS and its ultimate parent, Sun Life Financial Inc. The Trustees also considered the advantages and possible disadvantages to the Fund of having an adviser that also serves other investment companies as well as other accounts.
The Trustees also considered the nature, quality, cost, and extent of administrative, transfer agency, and distribution services provided to the Fund by MFS and its affiliates under agreements and plans other than the investment advisory agreement, including any 12b-1 fees the Fund pays to MFS Fund Distributors, Inc., an affiliate of MFS. The Trustees also considered the nature, extent and quality of certain other services MFS performs or arranges for on the Fund’s behalf, which may include securities lending programs, directed expense payment programs, class action recovery programs, and MFS’ interaction with third-party service providers, principally custodians and sub-custodians. The Trustees concluded that the various non-advisory services provided by MFS and its affiliates on behalf of the Funds were satisfactory.
The Trustees also considered benefits to MFS from the use of the Fund’s portfolio brokerage commissions, if applicable, to pay for investment research, and various other factors. Additionally, the Trustees considered so-called “fall-out benefits” to MFS such as reputational value derived from serving as investment manager to the Fund.
Based on their evaluation of factors that they deemed to be material, including those factors described above, the Board of Trustees, including a majority of the independent Trustees, concluded that the Fund’s investment advisory agreement with MFS should be continued for an additional one-year period, commencing August 1, 2009.
A discussion regarding the Board’s most recent review and renewal of the fund’s Investment Advisory Agreement with MFS will be available on or about November 1, 2009 by clicking on the fund’s name under “Mutual Funds” in the “Products and Performance” section of the MFS Web site (mfs.com).
58
PROXY VOTING POLICIES AND INFORMATION
A general description of the MFS funds’ proxy voting policies and procedures is available without charge, upon request, by calling
1-800-225-2606, by visiting the Proxy Voting section of mfs.com or by visiting the SEC’s Web site at http://www.sec.gov.
Information regarding how the fund voted proxies relating to portfolio securities during the most recent twelve-month period ended June 30 is available without charge by visiting the Proxy Voting section of mfs.com or by visiting the SEC’s Web site at http://www.sec.gov.
QUARTERLY PORTFOLIO DISCLOSURE
The fund will file a complete schedule of portfolio holdings with the Securities and Exchange Commission (the Commission) for the first and third quarters of each fiscal year on Form N-Q. The fund’s Form N-Q may be reviewed and copied at the:
Public Reference Room
Securities and Exchange Commission
100 F Street, NE, Room 1580
Washington, D.C. 20549
Information on the operation of the Public Reference Room may be obtained by calling the Commission at 1-800-SEC-0330. The fund’s Form N-Q is available on the EDGAR database on the Commission’s Internet Web site at http://www.sec.gov, and copies of this information may be obtained, upon payment of a duplicating fee, by electronic request at the following e-mail address: publicinfo@sec.gov or by writing the Public Reference Section at the above address.
A shareholder can also obtain the quarterly portfolio holdings report at mfs.com.
FURTHER INFORMATION
From time to time, MFS may post important information about the fund or the MFS funds on the MFS web site (mfs.com). This information is available by visiting the “News & Commentary” section of mfs.com or by clicking on the fund’s name under “Mutual Funds” in the “Products and Performance” section of mfs.com.
FEDERAL TAX INFORMATION (unaudited)
The fund will notify shareholders of amounts for use in preparing 2009 income tax forms in January 2010. The following information is provided pursuant to provisions of the Internal Revenue Code.
The fund designates the maximum amount allowable as qualified dividend income eligible for the 15% tax rate.
For corporate shareholders, 100% of the ordinary income dividends paid during the fiscal year qualify for the corporate dividends received deduction.
59
MFS® PRIVACY NOTICE
Privacy is a concern for every investor today. At MFS Investment Management® and the MFS funds, we take this concern very seriously. We want you to understand our policies about the investment products and services that we offer, and how we protect the nonpublic personal information of investors who have a direct relationship with us and our wholly owned subsidiaries.
Throughout our business relationship, you provide us with personal information. We maintain information and records about you, your investments, and the services you use. Examples of the nonpublic personal information we maintain include
| | Ÿ | | data from investment applications and other forms |
| | Ÿ | | share balances and transactional history with us, our affiliates, or others |
| | Ÿ | | facts from a consumer reporting agency |
We do not disclose any nonpublic personal information about our customers or former customers to anyone, except as permitted by law. We may share nonpublic personal information with third parties or certain of our affiliates in connection with servicing your account or processing your transactions. We may share information with companies or financial institutions that perform marketing services on our behalf or with other financial institutions with which we have joint marketing arrangements, subject to any legal requirements.
Authorization to access your nonpublic personal information is limited to appropriate personnel who provide products, services, or information to you. We maintain physical, electronic, and procedural safeguards to help protect the personal information we collect about you.
If you have any questions about the MFS privacy policy, please call 1-800-225-2606 any business day between 8 a.m. and 8 p.m. Eastern time.
Note: If you own MFS products or receive MFS services in the name of a third party such as a bank or broker-dealer, their privacy policy may apply to you instead of ours.
60
CONTACT US
| | |
Web site mfs.com MFS TALK 1-800-637-8255 24 hours a day Account service and literature Shareholders 1-800-225-2606 Investment professionals 1-800-343-2829 Retirement plan services 1-800-637-1255 | | Mailing address MFS Service Center, Inc. P.O. Box 55824 Boston, MA 02205-5824 Overnight mail MFS Service Center, Inc. c/o Boston Financial Data Services 30 Dan Road Canton, MA 02021-2809 |

Save paper with eDelivery. MFS® will send you prospectuses, reports, and proxies directly via e-mail so you will get information faster with less mailbox clutter. To sign up: 1. go to mfs.com. 2. log in via MFS® Access. 3. select eDelivery. If you own your MFS fund shares through a financial institution or a retirement plan, MFS® TALK, MFS Access, and eDelivery may not be available to you.

The Registrant has adopted a Code of Ethics pursuant to Section 406 of the Sarbanes-Oxley Act and as defined in Form N-CSR that applies to the Registrant’s principal executive officer and principal financial and accounting officer. The Registrant has not amended any provision in its Code of Ethics (the “Code”) that relates to an element of the Code’s definitions enumerated in paragraph (b) of Item 2 of this Form N-CSR.
A copy of the Code of Ethics is filed as an exhibit to this Form N-CSR.
| ITEM 3. | AUDIT COMMITTEE FINANCIAL EXPERT. |
Messrs. Robert E. Butler, John P. Kavanaugh and Robert W. Uek and Ms. Laurie J. Thomsen, members of the Audit Committee, have been determined by the Board of Trustees in their reasonable business judgment to meet the definition of “audit committee financial expert” as such term is defined in Form N-CSR. In addition, Messrs. Butler, Kavanaugh and Uek and Ms. Thomsen are “independent” members of the Audit Committee (as such term has been defined by the Securities and Exchange Commission in regulations implementing Section 407 of the Sarbanes-Oxley Act of 2002). The Securities and Exchange Commission has stated that the designation of a person as an audit committee financial expert pursuant to this Item 3 on the Form N-CSR does not impose on such a person any duties, obligations or liability that are greater than the duties, obligations or liability imposed on such person as a member of the Audit Committee and the Board of Trustees in the absence of such designation or identification.
| ITEM 4. | PRINCIPAL ACCOUNTANT FEES AND SERVICES. |
Items 4(a) through 4(d) and 4(g):
The Board of Trustees has appointed Deloitte & Touche LLP (“Deloitte”) to serve as independent accountants to certain series of the Registrant and Ernst & Young LLP (“E&Y”) to serve in the same capacity to certain other series of the Registrant (the series referred to collectively as the “Funds” and singularly as a “Fund”). The tables below set forth the audit fees billed to the Funds as well as fees for non-audit services provided to the Funds and/or to the Funds’ investment adviser, Massachusetts Financial Services Company (“MFS”), and to various entities either controlling, controlled by, or under common control with MFS that provide ongoing services to the Funds (“MFS Related Entities”).
For the fiscal years ended August 31, 2009 and 2008, audit fees billed to the Funds by Deloitte and E&Y were as follows:
| | | | |
| | | Audit Fees |
| | 2009 | | 2008 |
Fees billed by Deloitte: | | | | |
MFS Cash Reserve Fund | | 28,006 | | 28,006 |
| | | | |
| | | Audit Fees |
| | 2009 | | 2008 |
Fees billed by E&Y: | | | | |
MFS Core Equity Fund | | 39,188 | | 38,435 |
MFS Core Growth Fund | | 39,757 | | 38,993 |
MFS New Discovery Fund | | 39,188 | | 38,435 |
MFS Research International Fund | | 42,254 | | 41,441 |
MFS Technology Fund | | 39,188 | | 38,435 |
MFS Value Fund | | 39,757 | | 38,993 |
Total | | 239,332 | | 234,732 |
For the fiscal years ended August 31, 2009 and 2008, fees billed by Deloitte and E&Y for audit-related, tax and other services provided to the Funds and for audit-related, tax and other services provided to MFS and MFS Related Entities were as follows:
| | | | | | | | | | | | |
| | | Audit-Related Fees1 | | Tax Fees2 | | All Other Fees3 |
| | 2009 | | 2008 | | 2009 | | 2008 | | 2009 | | 2008 |
Fees billed by Deloitte: | | | | | | | | | | | | |
To MFS Cash Reserve Fund | | 0 | | 2,500 | | 2,828 | | 2,738 | | 1,068 | | 1,207 |
To MFS and MFS Related Entities of MFS Cash Reserve Fund* | | 1,210,192 | | 1,340,542 | | 0 | | 0 | | 178,392 | | 191,422 |
| | | | | | | | | | | | |
Aggregate fees for non-audit services: | | | | | | | | | | | | |
| | | 2009 | | | | 2008 | | | | | | |
To MFS Cash Reserve Fund, MFS and MFS Related Entities# | | 1,488,430 | | | | 1,640,796 | | | | | | |
| | | |
| | | Audit-Related Fees1 | | Tax Fees2 | | All Other Fees4 |
| | 2009 | | 2008 | | 2009 | | 2008 | | 2009 | | 2008 |
Fees billed by E&Y: | | | | | | | | | | | | |
To MFS Core Equity Fund | | 0 | | 0 | | 7,631 | | 8,131 | | 0 | | 0 |
To MFS Core Growth Fund | | 0 | | 0 | | 7,631 | | 8,131 | | 0 | | 0 |
To MFS New Discovery Fund | | 0 | | 0 | | 7,631 | | 8,131 | | 0 | | 0 |
To MFS Research International Fund | | 0 | | 0 | | 8,021 | | 8,521 | | 0 | | 0 |
To MFS Technology Fund | | 0 | | 0 | | 7,631 | | 8,131 | | 0 | | 0 |
To MFS Value Fund | | 0 | | 0 | | 7,631 | | 8,131 | | 0 | | 0 |
| | | | | | | | | | | | |
To MFS and MFS Related Entities of MFS Core Equity Fund* | | 0 | | 0 | | 0 | | 0 | | 0 | | 0 |
To MFS and MFS Related Entities of MFS Core Growth Fund* | | 0 | | 0 | | 0 | | 0 | | 0 | | 0 |
To MFS and MFS Related Entities of MFS New Discovery Fund* | | 0 | | 0 | | 0 | | 0 | | 0 | | 0 |
To MFS and MFS Related Entities of MFS Research International Fund* | | 0 | | 0 | | 0 | | 0 | | 0 | | 0 |
To MFS and MFS Related Entities of MFS Technology Fund* | | 0 | | 0 | | 0 | | 0 | | 0 | | 0 |
To MFS and MFS Related Entities of MFS Value Fund* | | 0 | | 0 | | 0 | | 0 | | 0 | | 0 |
| | | | | | |
Aggregate fees for non-audit services: | | | | | | | | | | | | |
| | | | | | |
| | | 2009 | | | | 2008 | | | | | | |
To MFS Core Equity Fund, MFS and MFS Related Entities# | | 552,074 | | | | 232,668 | | | | | | |
To MFS Core Growth Fund, MFS and MFS Related Entities# | | 552,074 | | | | 232,668 | | | | | | |
To MFS New Discovery Fund, MFS and MFS Related Entities# | | 552,074 | | | | 232,668 | | | | | | |
To MFS Research International Fund, MFS and MFS Related Entities# | | 552,464 | | | | 233,058 | | | | | | |
To MFS Technology Fund, MFS and MFS Related Entities# | | 552,074 | | | | 232,668 | | | | | | |
To MFS Value Fund, MFS and MFS Related Entities# | | 552,074 | | | | 232,668 | | | | | | |
| * | This amount reflects the fees billed to MFS and MFS Related Entities for non-audit services relating directly to the operations and financial reporting of the Funds (portions of which services also related to the operations and financial reporting of other funds within the MFS Funds complex). |
| # | This amount reflects the aggregate fees billed by Deloitte or E&Y for non-audit services rendered to the Funds and for non-audit services rendered to MFS and the MFS Related Entities. |
| 1 | The fees included under “Audit-Related Fees” are fees related to assurance and related services that are reasonably related to the performance of the audit or review of financial |
| | statements, but not reported under “Audit Fees,” including accounting consultations, agreed-upon procedure reports, attestation reports, comfort letters and internal control reviews. |
| 2 | The fees included under “Tax Fees” are fees associated with tax compliance, tax advice and tax planning, including services relating to the filing or amendment of federal, state or local income tax returns, regulated investment company qualification reviews and tax distribution and analysis. |
| 3 | The fees included under “All Other Fees” are fees for products and services provided by Deloitte other than those reported under “Audit Fees,” “Audit-Related Fees” and “Tax Fees,” including fees for services related to portfolio holdings, and review of internal controls and review of Rule 38a-1 compliance program. |
| 4 | The fees included under “All Other Fees” are fees for products and services provided by E&Y other than those reported under “Audit Fees,” “Audit-Related Fees” and “Tax Fees,” including fees for the subscription to tax treatise and for services related to analysis of fund administrative expenses, compliance program and records management projects. |
Item 4(e)(1):
Set forth below are the policies and procedures established by the Audit Committee of the Board of Trustees relating to the pre-approval of audit and non-audit related services:
To the extent required by applicable law, pre-approval by the Audit Committee of the Board is needed for all audit and permissible non-audit services rendered to the Funds and all permissible non-audit services rendered to MFS or MFS Related Entities if the services relate directly to the operations and financial reporting of the Registrant. Pre-approval is currently on an engagement-by-engagement basis. In the event pre-approval of such services is necessary between regular meetings of the Audit Committee and it is not practical to wait to seek pre-approval at the next regular meeting of the Audit Committee, pre-approval of such services may be referred to the Chair of the Audit Committee for approval; provided that the Chair may not pre-approve any individual engagement for such services exceeding $50,000 or multiple engagements for such services in the aggregate exceeding $100,000 in each period between regular meetings of the Audit Committee. Any engagement pre-approved by the Chair between regular meetings of the Audit Committee shall be presented for ratification by the entire Audit Committee at its next regularly scheduled meeting.
Item 4(e)(2):
None, or 0%, of the services relating to the Audit-Related Fees, Tax Fees and All Other Fees paid by the Fund and MFS and MFS Related Entities relating directly to the operations and financial reporting of the Registrant disclosed above were approved by the audit committee pursuant to paragraphs (c)(7)(i)(C) of Rule 2-01 of Regulation S-X (which permits audit committee approval after the start of the engagement with respect to services other than audit, review or attest services, if certain conditions are satisfied).
Item 4(f): Not applicable.
Item 4(h): The Registrant’s Audit Committee has considered whether the provision by a Registrant’s independent registered public accounting firm of non-audit services to MFS and MFS Related Entities that were not pre-approved by the Committee (because such services did not relate directly to the operations and financial reporting of the Registrant) was compatible with maintaining the independence of the independent registered public accounting firm as the Registrant’s principal auditors.
| ITEM 5. | AUDIT COMMITTEE OF LISTED REGISTRANTS. |
Not applicable to the Registrant.
A schedule of investments of the Registrant is included as part of the report to shareholders of such series under Item 1 of this Form N-CSR.
| ITEM 7. | DISCLOSURE OF PROXY VOTING POLICIES AND PROCEDURES FOR CLOSED-END MANAGEMENT INVESTMENT COMPANIES. |
Not applicable to the Registrant.
| ITEM 8. | PORTFOLIO MANAGERS OF CLOSED-END MANAGEMENT INVESTMENT COMPANIES. |
Not applicable to the Registrant.
| ITEM 9. | PURCHASES OF EQUITY SECURITIES BY CLOSED-END MANAGEMENT INVESTMENT COMPANY AND AFFILIATED PURCHASERS. |
Not applicable to the Registrant.
| ITEM 10. | SUBMISSION OF MATTERS TO A VOTE OF SECURITY HOLDERS. |
There were no material changes to the procedures by which shareholders may send recommendations to the Board for nominees to the Registrant’s Board since the Registrant last provided disclosure as to such procedures in response to the requirements of Item 407 (c)(2)(iv) of Regulation S-K or this Item.
| ITEM 11. | CONTROLS AND PROCEDURES. |
| (a) | Based upon their evaluation of the effectiveness of the registrant’s disclosure controls and procedures (as defined in Rule 30a-3(c) under the Investment Company Act of 1940 (the “Act”)) as conducted within 90 days of the filing date of this report on Form N-CSR, the registrant’s principal financial officer and principal executive officer have concluded that those disclosure controls and procedures provide reasonable assurance that the material information required to be disclosed by the registrant on this report is recorded, processed, summarized and reported within the time periods specified in the Securities and Exchange Commission’s rules and forms. |
| (b) | There were no changes in the registrant’s internal controls over financial reporting (as defined in Rule 30a-3(d) under the Act) that occurred during the second fiscal quarter of the period covered by the report that have materially affected, or are reasonably likely to materially affect, the registrant’s internal control over financial reporting. |
| (a) | File the exhibits listed below as part of this form. Letter or number the exhibits in the sequence indicated. |
| | (1) | Any code of ethics, or amendment thereto, that is the subject of the disclosure required by Item 2, to the extent that the registrant intends to satisfy the Item 2 requirements through filing of an exhibit: Code of Ethics attached hereto. |
| | (2) | A separate certification for each principal executive officer and principal financial officer of the registrant as required by Rule 30a-2 under the Act (17 CFR 270.30a-2): Attached hereto. |
| (b) | If the report is filed under Section 13(a) or 15(d) of the Exchange Act, provide the certifications required by Rule 30a-2(b) under the Act (17 CFR 270.30a-2(b)), Rule 13a-14(b) or Rule 15d-14(b) under the Exchange Act (17 CFR 240.13a-14(b) or 240.15d-14(b)) and Section 1350 of Chapter 63 of Title 18 of the United States Code (18 U.S.C. 1350) as an exhibit. A certification furnished pursuant to this paragraph will not be deemed “filed” for the purposes of Section 18 of the Exchange Act (15 U.S.C. 78r), or otherwise subject to the liability of that section. Such certification will not be deemed to be incorporated by reference into any filing under the Securities Act of 1933 or the Exchange Act, except to the extent that the registrant specifically incorporates it by reference: Attached hereto. |
Notice
A copy of the Amended and Restated Declaration of Trust, as amended, of the Registrant is on file with the Secretary of State of The Commonwealth of Massachusetts and notice is hereby given that this instrument is executed on behalf of the Registrant by an officer of the Registrant as an officer and not individually and the obligations of or arising out of this instrument are not binding upon any of the Trustees or shareholders individually, but are binding only upon the assets and property of the respective constituent series of the Registrant.
SIGNATURES
Pursuant to the requirements of the Securities Exchange Act of 1934 and the Investment Company Act of 1940, the registrant has duly caused this report to be signed on its behalf by the undersigned, thereunto duly authorized.
(Registrant) MFS SERIES TRUST I
| | |
| By (Signature and Title)* | | MARIA F. DWYER |
| | Maria F. Dwyer, President |
Date: October 16, 2009
Pursuant to the requirements of the Securities Exchange Act of 1934 and the Investment Company Act of 1940, this report has been signed below by the following persons on behalf of the registrant and in the capacities and on the dates indicated.
| | |
| By (Signature and Title)* | | MARIA F. DWYER |
| | Maria F. Dwyer, President (Principal Executive Officer) |
Date: October 16, 2009
| | |
| By (Signature and Title)* | | JOHN M. CORCORAN |
| | John M. Corcoran, Treasurer (Principal Financial Officer and Accounting Officer) |
Date: October 16, 2009
| * | Print name and title of each signing officer under his or her signature. |