UNITED STATES
SECURITIES AND EXCHANGE COMMISSION
Washington, D.C. 20549
FORM N-CSR
CERTIFIED SHAREHOLDER REPORT OF
REGISTERED MANAGEMENT INVESTMENT COMPANIES
Investment Company Act file number 811-4777
MFS SERIES TRUST I
(Exact name of registrant as specified in charter)
500 Boylston Street, Boston, Massachusetts 02116
(Address of principal executive offices) (Zip code)
Susan S. Newton
Massachusetts Financial Services Company
500 Boylston Street
Boston, Massachusetts 02116
(Name and address of agents for service)
Registrant’s telephone number, including area code: (617) 954-5000
Date of fiscal year end: August 31
Date of reporting period: August 31, 2011*
| * | This Form N-CSR pertains to the following series of the Registrant: MFS Cash Reserve Fund, MFS Core Growth Fund, MFS Core Equity Fund, MFS New Discovery Fund, MFS Research International Fund, MFS Technology Fund, and MFS Value Fund. The remaining series of the Registrant, MFS Global Leaders Fund, did not commence operations during the period. The MFS Core Growth Fund, a series of the Registrant, was reorganized into the MFS Growth Fund, a series of MFS Series Trust II, as of August 26, 2011. |
| ITEM 1. | REPORTS TO STOCKHOLDERS. |
MFS Global Leaders Fund and MFS Core Growth Fund, each a series of the Registrant, did not have any shareholders as of period end. For further information please see the introductory footnote.

MFS® Cash Reserve Fund

ANNUAL REPORT
August 31, 2011
LMM-ANN
MFS® CASH RESERVE FUND
SIPC Contact Information: You may obtain information about the Securities Investor Protection Corporation (“SIPC”), including the SIPC Brochure, by contacting SIPC either by telephone (1-202-371-8300) or by accessing SIPC’s web site address (www.sipc.org).
The report is prepared for the general information of shareholders.
It is authorized for distribution to prospective investors only when preceded or accompanied by a current prospectus.
NOT FDIC INSURED Ÿ MAY LOSE VALUE Ÿ NO BANK GUARANTEE

LETTER FROM THE CEO
Dear Shareholders:
We are indeed living through some volatile times. Economic uncertainty is everywhere, as it seems no place in the world has been unmoved by crisis this year. We have seen a devastating earthquake and tsunami that have led to disruptions in the Japanese markets and supply chains. Protests have changed the face of the Middle East and left in their wake lingering tensions and resultant higher oil prices. We have seen debt limits tested in Europe and the United States and policymakers grappling to craft often unpopular monetary and fiscal responses at a time when consumers and businesses struggle with what appears to be a slowing global economy. On top of all of that, we have seen long-term U.S. debt lose its Standard & Poor’s AAA rating.
When markets become volatile, managing risk becomes a top priority for investors and their advisors. At MFS® risk management is foremost in our minds in all market climates. Our analysts and portfolio managers keep risks firmly in mind when evaluating securities. Additionally, we have a team of quantitative analysts that measures and assesses the risk profiles of our portfolios and securities on an ongoing basis. The chief investment risk officer, who oversees the team, reports directly to the firm’s president and chief investment officer so the risk associated with each portfolio can be assessed objectively and independently of the portfolio management team.
As always, we continue to be mindful of the many economic challenges faced at the local, national, and international levels. It is in times such as these that we want to remind investors of the merits of maintaining a long-term view, adhering to basic investing principles such as asset allocation and diversification, and working closely with their advisors to research and identify appropriate investment opportunities.
Respectfully,

Robert J. Manning
Chairman and Chief Executive Officer
MFS Investment Management®
October 17, 2011
The opinions expressed in this letter are subject to change, may not be relied upon for investment advice, and no forecasts can be guaranteed.
1
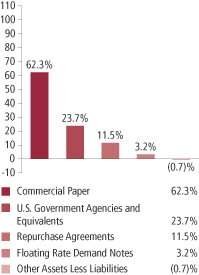
PORTFOLIO COMPOSITION
Portfolio structure (u)
| | | | |
| Composition including fixed income credit quality (a)(u) | |
| A-1+ | | | 24.8% | |
| A-1 | | | 75.9% | |
| Not Rated | | | 0.0% | |
| Cash & Other | | | (0.7)% | |
| | | | |
| Maturity breakdown (u) | | | | |
| 0 - 7 days | | | 26.8% | |
| 8 - 29 days | | | 42.9% | |
| 30 - 59 days | | | 20.8% | |
| 60 - 89 days | | | 3.7% | |
| 90 - 365 days | | | 6.5% | |
| Other Assets Less Liabilities | | | (0.7)% | |
| (a) | Ratings are assigned to portfolio securities utilizing ratings from Moody’s, Fitch, and Standard & Poor’s rating agencies and applying the following hierarchy: If all three agencies provide a rating, the middle rating (after dropping the highest and lowest ratings) is assigned; if two of the three agencies rate a security, the lower of the two is assigned. Cash & Other portfolio assets that are not securities are not included in the categories mentioned above. Ratings are shown in the S&P scale. All ratings are subject to change. The fund itself is not rated. |
| (u) | For purposes of this presentation, accrued interest, where applicable, is included. |
From time to time “Other Assets Less Liabilities” may be negative due to timing of cash receipts.
Percentages are based on net assets as of 8/31/11.
The portfolio is actively managed and current holdings may be different.
2
PERFORMANCE SUMMARY THROUGH 8/31/11
Total returns as well as the current 7-day yield have been provided for the applicable time periods. Performance results reflect the percentage change in net asset value, including the reinvestment of any dividends and capital gains distributions. (See Notes to Performance Summary.)
Performance data shown represents past performance and is no guarantee of future results. Although the fund seeks to preserve the value of your investment at $1.00 per share, you could lose money on your investment in the fund. An investment in the fund is not a bank deposit and is not insured or guaranteed by the Federal Deposit Insurance Corporation or any other governmental agency. The performance shown does not reflect the deduction of taxes, if any, that a shareholder would pay on fund distributions or the redemption of fund shares.
| | | | | | | | | | |
| | | Share Class | | Inception | | 1-Year Total
Return (without
sales charge) (w) | | Current
7-day yield (w) | | |
| | | A | | 9/07/93 | | 0.00% | | 0.00% | | |
| | | B | | 12/29/86 | | 0.00% | | 0.00% | | |
| | | C | | 4/01/96 | | 0.00% | | 0.00% | | |
| | | R1 | | 4/01/05 | | 0.00% | | 0.00% | | |
| | | R2 | | 4/01/05 | | 0.00% | | 0.00% | | |
| | | R3 | | 4/01/05 | | 0.00% | | 0.00% | | |
| | | R4 | | 4/01/05 | | 0.00% | | 0.00% | | |
| | | 529A | | 7/31/02 | | 0.00% | | 0.00% | | |
| | | 529B | | 7/31/02 | | 0.00% | | 0.00% | | |
| | | 529C | | 7/31/02 | | 0.00% | | 0.00% | | |
| | | | | | |
| | | Share Class | | 1-Year
Total Return | | |
| | | B
With CDSC (Declining over six years from 4% to 0%) (x) | | (4.00)% | | |
| | | C
With CDSC (1% for 12 months) (x) | | (1.00)% | | |
| | | 529B
With CDSC (Declining over six years from 4% to 0%) (x) | | (4.00)% | | |
| | | 529C
With CDSC (1% for 12 months) (x) | | (1.00)% | | |
3
Performance Summary – continued
Class R1, R2, R3, R4 and 529A shares do not have a sales charge. Certain Class A shares acquired through an exchange may be subject to a CDSC upon redemption depending on when the shares exchanged were originally purchased.
CDSC – Contingent Deferred Sales Charge.
| (w) | Total return and/or yield were less than 0.01%, respectively. |
| (x) | Assuming redemption at the end of applicable period. |
Yields quoted are based on the latest seven days ended as of August 31, 2011, with dividends annualized. The yield quotations more closely reflect the current earnings of the fund than the total return quotations. Shares of the fund can be purchased at net asset value without a sales charge.
Notes to Performance Summary
Performance results reflect any applicable expense subsidies, waivers and adjustments in effect during the periods shown. Subsidies and fee waivers may be imposed to enhance a fund’s yield or to avoid a negative yield during periods when the fund’s operating expenses have a significant impact on the fund’s yield due to lower interest rates. Without such subsidies and waivers the fund’s performance results would be less favorable. Please see the prospectus and financial statements for complete details. All results are historical and assume the reinvestment of any dividends and capital gain distributions.
4
EXPENSE TABLE
Fund expenses borne by the shareholders during the period,
March 1, 2011 through August 31, 2011
As a shareholder of the fund, you incur two types of costs: (1) transaction costs, including sales charges (loads) on certain purchase or redemption payments, and (2) ongoing costs, including management fees; distribution and service (12b-1) fees; and other fund expenses. This example is intended to help you understand your ongoing costs (in dollars) of investing in the fund and to compare these costs with the ongoing costs of investing in other mutual funds.
The example is based on an investment of $1,000 invested at the beginning of the period and held for the entire period March 1, 2011 through August 31, 2011.
Actual Expenses
The first line for each share class in the following table provides information about actual account values and actual expenses. You may use the information in this line, together with the amount you invested, to estimate the expenses that you paid over the period. Simply divide your account value by $1,000 (for example, an $8,600 account value divided by $1,000 = 8.6), then multiply the result by the number in the first line under the heading entitled “Expenses Paid During Period” to estimate the expenses you paid on your account during this period.
Hypothetical Example for Comparison Purposes
The second line for each share class in the following table provides information about hypothetical account values and hypothetical expenses based on the fund’s actual expense ratio and an assumed rate of return of 5% per year before expenses, which is not the fund’s actual return. The hypothetical account values and expenses may not be used to estimate the actual ending account balance or expenses you paid for the period. You may use this information to compare the ongoing costs of investing in the fund and other funds. To do so, compare this 5% hypothetical example with the 5% hypothetical examples that appear in the shareholder reports of the other funds.
Please note that the expenses shown in the table are meant to highlight your ongoing costs only and do not reflect any transactional costs, such as sales charges (loads). Therefore, the second line for each share class in the table is useful in comparing ongoing costs only, and will not help you determine the relative total costs of owning different funds. In addition, if these transactional costs were included, your costs would have been higher.
5
Expense Table – continued
| | | | | | | | | | | | | | | | | | |
Share
Class | | | | Annualized
Expense Ratio | | | Beginning
Account Value
3/01/11 | | | Ending Account Value
8/31/11 | | | Expenses Paid During
Period (p) 3/01/11-8/31/11 | |
| A | | Actual | | | 0.17% | | | | $1,000.00 | | | | $1,000.00 | | | | $0.86 | |
| | Hypothetical (h) | | | 0.17% | | | | $1,000.00 | | | | $1,024.35 | | | | $0.87 | |
| B | | Actual | | | 0.17% | | | | $1,000.00 | | | | $1,000.00 | | | | $0.86 | |
| | Hypothetical (h) | | | 0.17% | | | | $1,000.00 | | | | $1,024.35 | | | | $0.87 | |
| C | | Actual | | | 0.16% | | | | $1,000.00 | | | | $1,000.00 | | | | $0.81 | |
| | Hypothetical (h) | | | 0.16% | | | | $1,000.00 | | | | $1,024.40 | | | | $0.82 | |
| R1 | | Actual | | | 0.17% | | | | $1,000.00 | | | | $1,000.00 | | | | $0.86 | |
| | Hypothetical (h) | | | 0.17% | | | | $1,000.00 | | | | $1,024.35 | | | | $0.87 | |
| R2 | | Actual | | | 0.17% | | | | $1,000.00 | | | | $1,000.00 | | | | $0.86 | |
| | Hypothetical (h) | | | 0.17% | | | | $1,000.00 | | | | $1,024.35 | | | | $0.87 | |
| R3 | | Actual | | | 0.17% | | | | $1,000.00 | | | | $1,000.00 | | | | $0.86 | |
| | Hypothetical (h) | | | 0.17% | | | | $1,000.00 | | | | $1,024.35 | | | | $0.87 | |
| R4 | | Actual | | | 0.16% | | | | $1,000.00 | | | | $1,000.00 | | | | $0.81 | |
| | Hypothetical (h) | | | 0.16% | | | | $1,000.00 | | | | $1,024.40 | | | | $0.82 | |
| 529A | | Actual | | | 0.17% | | | | $1,000.00 | | | | $1,000.00 | | | | $0.86 | |
| | Hypothetical (h) | | | 0.17% | | | | $1,000.00 | | | | $1,024.35 | | | | $0.87 | |
| 529B | | Actual | | | 0.17% | | | | $1,000.00 | | | | $1,000.00 | | | | $0.86 | |
| | Hypothetical (h) | | | 0.17% | | | | $1,000.00 | | | | $1,024.35 | | | | $0.87 | |
| 529C | | Actual | | | 0.17% | | | | $1,000.00 | | | | $1,000.00 | | | | $0.86 | |
| | Hypothetical (h) | | | 0.17% | | | | $1,000.00 | | | | $1,024.35 | | | | $0.87 | |
| (h) | 5% class return per year before expenses. |
| (p) | Expenses paid is equal to each class’ annualized expense ratio, as shown above, multiplied by the average account value over the period, multiplied by the number of days in the period, divided by the number of days in the year. Expenses paid do not include any applicable sales charges (loads). If these transaction costs had been included, your costs would have been higher. |
Expense Changes Impacting the Table
As more fully disclosed in footnote 3 to the financial statements, the expense ratios reported above include additional expense reductions to avoid a negative yield.
6
PORTFOLIO OF INVESTMENTS
8/31/11
The Portfolio of Investments is a complete list of all securities owned by your fund. It is categorized by broad-based asset classes.
| | | | | | | | |
| Commercial Paper (y) - 62.3% | | | | | | | | |
| Issuer | | Shares/Par | | | Value ($) | |
| | | | | | | | |
| Automotive - 3.1% | | | | | | | | |
| Toyota Motor Credit Corp., 0.15%, due 9/14/11 | | $ | 4,634,000 | | | $ | 4,633,749 | |
| Toyota Motor Credit Corp., 0.18%, due 9/09/11 | | | 10,841,000 | | | | 10,840,566 | |
| | | | | | | | |
| | | | | | | $ | 15,474,315 | |
| Business Services - 2.8% | | | | | | | | |
| Cisco Systems Inc., 0.08%, due 9/13/11 (t) | | $ | 13,950,000 | | | $ | 13,949,628 | |
| | |
| Computer Software - Systems - 2.6% | | | | | | | | |
| International Business Machines Corp., 0.07%, due 9/19/11 (t) | | $ | 13,335,000 | | | $ | 13,334,533 | |
| | |
| Conglomerates - 3.5% | | | | | | | | |
| Siemens Capital Corp., 0.12%, due 9/30/11 (t) | | $ | 2,490,000 | | | $ | 2,489,759 | |
| United Technologies Corp., 0.08%, due 9/22/11 (t) | | | 15,327,000 | | | | 15,326,285 | |
| | | | | | | | |
| | | | | | | $ | 17,816,044 | |
| Consumer Products - 5.7% | | | | | | | | |
| Colgate-Palmolive Co., 0.06%, due 9/13/11 (t) | | $ | 15,474,000 | | | $ | 15,473,691 | |
| Proctor & Gamble Co., 0.11%, due 10/11/11 (t) | | | 13,155,000 | | | | 13,153,392 | |
| | | | | | | | |
| | | | | | | $ | 28,627,083 | |
| Energy - Integrated - 1.7% | | | | | | | | |
| Chevron Corp., 0.03%, due 9/23/11 | | $ | 8,616,000 | | | $ | 8,615,842 | |
| | |
| Financial Institutions - 2.0% | | | | | | | | |
| General Electric Captial Corp., 0.13%, due 9/21/11 | | $ | 10,241,000 | | | $ | 10,240,260 | |
| | |
| Food & Beverages - 5.5% | | | | | | | | |
| Coca-Cola Co., 0.15%, due 9/07/11 (t) | | $ | 5,400,000 | | | $ | 5,399,865 | |
| Coca-Cola Co., 0.15%, due 10/06/11 (t) | | | 8,800,000 | | | | 8,798,717 | |
| Pepsico, Inc., 0.1%, due 11/07/11 (t) | | | 13,900,000 | | | | 13,897,413 | |
| | | | | | | | |
| | | | | | | $ | 28,095,995 | |
| Machinery & Tools - 1.9% | | | | | | | | |
| Deere and Co., 0.06%, due 9/01/11 (t) | | $ | 9,699,000 | | | $ | 9,699,000 | |
7
Portfolio of Investments – continued
| | | | | | | | |
| Issuer | | Shares/Par | | | Value ($) | |
| | | | | | | | |
| Commercial Paper (y) - continued | | | | | | | | |
| Major Banks - 10.9% | | | | | | | | |
| Bank of Montreal, 0.09%, due 9/23/11 | | $ | 10,247,000 | | | $ | 10,246,436 | |
| Barclays U.S. Funding Corp., 0.1%, due 9/01/11 | | | 10,184,000 | | | | 10,184,000 | |
| Credit Suisse First Boston, Inc., 0.2%, due 10/13/11 | | | 12,052,000 | | | | 12,049,188 | |
| Credit Suisse First Boston, Inc., 0.25%, due 11/14/11 | | | 1,200,000 | | | | 1,199,383 | |
| HSBC USA, Inc., 0.17%, due 9/06/11 | | | 900,000 | | | | 899,979 | |
| Royal Bank of Canada, 0.09%, due 11/14/11 | | | 3,817,000 | | | | 3,816,294 | |
| Royal Bank of Canada, 0.1%, due 10/27/11 | | | 5,000,000 | | | | 4,999,222 | |
| Toronto Dominion Holdings (USA), Inc., 0.2%, due 12/23/11 (t) | | | 11,800,000 | | | | 11,792,592 | |
| | | | | | | | |
| | | | | | | $ | 55,187,094 | |
| Medical Equipment - 1.0% | | | | | | | | |
| Merck & Co., Inc., 0.07%, due 9/14/11 (t) | | $ | 5,050,000 | | | $ | 5,049,872 | |
| | |
| Other Banks & Diversified Financials - 7.4% | | | | | | | | |
| Bank of Nova Scotia, 0.12%, due 10/07/11 | | $ | 8,575,000 | | | $ | 8,573,971 | |
| Citigroup Funding, Inc., 0.21%, due 9/07/11 | | | 15,454,000 | | | | 15,453,459 | |
| Rabobank USA Financial Corp., 0.2%, due 9/12/11 | | | 13,337,000 | | | | 13,336,185 | |
| | | | | | | | |
| | | | | | | $ | 37,363,615 | |
| Pharmaceuticals - 9.7% | | | | | | | | |
| Abbott Laboratories, 0.1%, due 9/26/11 (t) | | $ | 6,250,000 | | | $ | 6,249,566 | |
| Johnson & Johnson, 0.1%, due 9/14/11 (t) | | | 15,106,000 | | | | 15,105,455 | |
| Novartis Finance Corp., 0.07%, due 9/06/11 (t) | | | 9,305,000 | | | | 9,304,910 | |
| Novartis Finance Corp., 0.28%, due 9/12/11 (t) | | | 3,426,000 | | | | 3,425,707 | |
| Sanofi-Aventis, 0.11%, due 10/12/11 (t) | | | 14,633,000 | | | | 14,631,167 | |
| Sanofi-Aventis, 0.16%, due 10/17/11 (t) | | | 474,000 | | | | 473,903 | |
| | | | | | | | |
| | | | | | | $ | 49,190,708 | |
| Retailers - 2.5% | | | | | | | | |
| Wal-Mart Stores, Inc., 0.07%, due 9/19/11 (t) | | $ | 12,707,000 | | | $ | 12,706,555 | |
| | |
| Tobacco - 2.0% | | | | | | | | |
| Philip Morris International, Inc., 0.08%, due 9/07/11 (t) | | $ | 10,265,000 | | | $ | 10,264,863 | |
| Total Commercial Paper, at Amortized Cost and Value | | | | | | $ | 315,615,407 | |
| | |
| U.S. Government Agencies and Equivalents (y) - 23.7% | | | | | | | | |
| Fannie Mae, 0.01%, due 9/28/11 | | $ | 5,100,000 | | | $ | 5,099,962 | |
| Fannie Mae, 0.03%, due 9/28/11 | | | 15,000,000 | | | | 14,999,663 | |
| Fannie Mae, 0.035%, due 10/05/11 | | | 13,100,000 | | | | 13,099,567 | |
| Fannie Mae, 0.09%, due 10/17/11 | | | 13,285,000 | | | | 13,283,472 | |
| Federal Farm Credit Bank, 0.01%, due 9/29/11 | | | 4,000,000 | | | | 3,999,969 | |
8
Portfolio of Investments – continued
| | | | | | | | |
| Issuer | | Shares/Par | | | Value ($) | |
| | | | | | | | |
| U.S. Government Agencies and Equivalents (y) - continued | | | | | |
| Federal Home Loan Bank, 0.02%, due 10/11/11 | | $ | 2,836,000 | | | $ | 2,835,937 | |
| Federal Home Loan Bank, 0.05%, due 9/23/11 | | | 13,260,000 | | | | 13,259,595 | |
| Freddie Mac, 0.22%, due 9/14/11 | | | 13,934,000 | | | | 13,932,893 | |
| Freddie Mac, 0.095%, due 10/12/11 | | | 13,260,000 | | | | 13,258,565 | |
| Freddie Mac, 0.13%, due 12/05/11 | | | 13,260,000 | | | | 13,255,451 | |
| Freddie Mac, 0.13%, due 2/08/12 | | | 8,000,000 | | | | 7,995,378 | |
| Freddie Mac, 0.03%, due 9/22/11 | | | 5,120,000 | | | | 5,119,910 | |
Total U.S. Government Agencies and Equivalents,
at Amortized Cost and Value | | | | | | $ | 120,140,362 | |
| | |
| Floating Rate Demand Notes - 3.2% | | | | | | | | |
| Industrial Revenue - Other - 3.2% | | | | | | | | |
| East Baton Rouge, LA, Pollution Control Rev. (Exxon Mobil Corp.), 0.05%, due 9/01/11 | | $ | 9,700,000 | | | $ | 9,700,000 | |
| Lincoln County, WY, Pollution Control Rev. (Exxon Mobil Corp.), 0.05%, due 9/01/11 | | | 5,300,000 | | | | 5,300,000 | |
| Lincoln County, WY, Pollution Control Rev. (Exxon Mobil Corp.), “A”, 0.06%, due 9/01/11 | | | 1,300,000 | | | | 1,300,000 | |
| Total Floating Rate Demand Notes, at Cost and Value | | | | | | $ | 16,300,000 | |
| | |
| Repurchase Agreements - 11.5% | | | | | | | | |
| Goldman Sachs, 0.04%, dated 8/31/11, due 9/01/11, total to be received $47,727,053 (secured by U.S. Treasury and Federal Agency obligations valued at $48,681,840 in a jointly traded account) | | $ | 47,727,000 | | | $ | 47,727,000 | |
| Merrill Lynch, Pierce, Fenner & Smith, Inc., 0.04%, dated 8/31/11, due 9/01/11, total to be received $10,188,011 (secured by U.S. Treasury and Federal Agency obligations valued at $10,391,762 in a jointly traded account) | | | 10,188,000 | | | | 10,188,000 | |
| Total Repurchase Agreements, at Cost and Value | | | | | | $ | 57,915,000 | |
| Total Investments, at Amortized Cost and Value | | | | | | $ | 509,970,769 | |
| | |
| Other Assets, Less Liabilities - (0.7)% | | | | | | | (3,527,354 | ) |
| Net Assets - 100.0% | | | | | | $ | 506,443,415 | |
| (t) | Security exempt from registration with the U.S. Securities and Exchange Commission under Section 4(2) of the Securities Act of 1933. |
| (y) | The rate shown represents an annualized yield at time of purchase. |
See Notes to Financial Statements
9
Financial Statements
STATEMENT OF ASSETS AND LIABILITIES
At 8/31/11
This statement represents your fund’s balance sheet, which details the assets and liabilities comprising the total value of the fund.
| | | | |
| Assets | | | | |
Investments, at amortized cost and value | | | $452,055,769 | |
Repurchase agreements, at cost and value | | | 57,915,000 | |
Total investments, at amortized cost and value | | | $509,970,769 | |
Cash | | | 404 | |
Receivables for | | | | |
Fund shares sold | | | 587,437 | |
Interest | | | 1,050 | |
Receivable from investment adviser and distributor | | | 118,716 | |
Other assets | | | 1,149 | |
Total assets | | | $510,679,525 | |
| Liabilities | | | | |
Payable for fund shares reacquired | | | $4,037,666 | |
Payable to affiliates for shareholder servicing costs | | | 118,927 | |
Payable for independent Trustees’ compensation | | | 17,567 | |
Accrued expenses and other liabilities | | | 61,950 | |
Total liabilities | | | $4,236,110 | |
Net assets | | | $506,443,415 | |
| Net assets consist of | | | | |
Paid-in capital | | | $506,668,663 | |
Accumulated net realized gain (loss) on investments | | | (207,708 | ) |
Accumulated distributions in excess of net investment income | | | (17,540 | ) |
Net assets | | | $506,443,415 | |
Shares of beneficial interest outstanding | | | 506,673,730 | |
10
Statement of Assets and Liabilities – continued
| | | | | | | | | | | | |
| | | Net assets | | | Shares
outstanding | | | Net asset value
per share | |
Class A | | | $153,633,792 | | | | 153,705,016 | | | | $1.00 | |
Class B | | | 50,378,971 | | | | 50,426,073 | | | | 1.00 | |
Class C | | | 61,942,529 | | | | 61,972,354 | | | | 1.00 | |
Class R1 | | | 28,705,124 | | | | 28,714,782 | | | | 1.00 | |
Class R2 | | | 104,130,042 | | | | 104,167,209 | | | | 1.00 | |
Class R3 | | | 85,602,209 | | | | 85,633,199 | | | | 1.00 | |
Class R4 | | | 5,742,993 | | | | 5,744,706 | | | | 1.00 | |
Class 529A | | | 9,709,719 | | | | 9,711,291 | | | | 1.00 | |
Class 529B | | | 1,073,491 | | | | 1,073,806 | | | | 1.00 | |
Class 529C | | | 5,524,545 | | | | 5,525,294 | | | | 1.00 | |
A contingent deferred sales charge may be imposed on redemptions of Class A, Class B, Class C, Class 529B, and Class 529C shares. Redemption price per share was equal to the net asset value per share for Classes R1, R2, R3, R4, and 529A.
See Notes to Financial Statements
11
Financial Statements
STATEMENT OF OPERATIONS
Year ended 8/31/11
This statement describes how much your fund earned in investment income and accrued in expenses. It also describes any gains and/or losses generated by fund operations.
| | | | |
| Net investment income | | | | |
Interest income | | | $939,765 | |
Expenses | | | | |
Management fee | | | $1,881,825 | |
Distribution and service fees | | | 2,426,801 | |
Program manager fees | | | 16,576 | |
Shareholder servicing costs | | | 1,026,732 | |
Administrative services fee | | | 74,873 | |
Independent Trustees’ compensation | | | 17,026 | |
Custodian fee | | | 47,536 | |
Shareholder communications | | | 25,088 | |
Auditing fees | | | 33,374 | |
Legal fees | | | 7,971 | |
Miscellaneous | | | 139,992 | |
Total expenses | | | $5,697,794 | |
Fees paid indirectly | | | (98 | ) |
Reduction of expenses by investment adviser and distributor | | | (4,758,107 | ) |
Net expenses | | | $939,589 | |
Net investment income | | | $176 | |
Net realized gain (loss) on investment transactions | | | $(110 | ) |
Change in net assets from operations | | | $66 | |
See Notes to Financial Statements
12
Financial Statements
STATEMENTS OF CHANGES IN NET ASSETS
These statements describe the increases and/or decreases in net assets resulting from operations, any distributions, and any shareholder transactions.
| | | | | | | | |
| | | Years ended 8/31 | |
| | | 2011 | | | 2010 | |
| Change in net assets | | | | | | |
| From operations | | | | | | | | |
Net investment income | | | $176 | | | | $169 | |
Net realized gain (loss) on investments | | | (110 | ) | | | 1,037 | |
Change in net assets from operations | | | $66 | | | | $1,206 | |
| Distributions declared to shareholders | | | | | | | | |
From net investment income | | | $(7 | ) | | | $(22,677 | ) |
From tax return of capital | | | (169 | ) | | | (490 | ) |
Total distributions declared to shareholders | | | $(176 | ) | | | $(23,167 | ) |
Change in net assets from fund share transactions | | | $(6,038,510 | ) | | | $(108,281,987 | ) |
Total change in net assets | | | $(6,038,620 | ) | | | $(108,303,948 | ) |
| Net assets | | | | | | | | |
At beginning of period | | | 512,482,035 | | | | 620,785,983 | |
At end of period (including accumulated distributions in excess of net investment income of $17,540 and $20,107, respectively) | | | $506,443,415 | | | | $512,482,035 | |
See Notes to Financial Statements
13
Financial Statements
FINANCIAL HIGHLIGHTS
The financial highlights table is intended to help you understand the fund’s financial performance for the past 5 years. Certain information reflects financial results for a single fund share. The total returns in the table represent the rate by which an investor would have earned (or lost) on an investment in the fund share class (assuming reinvestment of all distributions) held for the entire period.
| | | | | | | | | | | | | | | | | | | | |
| Class A | | Years ended 8/31 | |
| | | 2011 | | | 2010 | | | 2009 | | | 2008 | | | 2007 | |
Net asset value, beginning of period | | | $1.00 | | | | $1.00 | | | | $1.00 | | | | $1.00 | | | | $1.00 | |
| Income (loss) from investment operations | | | | | | | | | | | | | | | | | |
Net investment income (d) | | | $0.00 | (w) | | | $0.00 | (w) | | | $0.00 | (w) | | | $0.03 | | | | $0.05 | |
Net realized and unrealized gain (loss)
on investments | | | (0.00 | )(w) | | | 0.00 | (w) | | | (0.00 | )(w) | | | — | | | | (0.00 | )(w) |
Total from investment operations | | | $0.00 | (w) | | | $0.00 | (w) | | | $0.00 | (w) | | | $0.03 | | | | $0.05 | |
| Less distributions declared to shareholders | | | | | | | | | | | | | | | | | |
From net investment income | | | $(0.00 | )(w) | | | $(0.00 | )(w) | | | $(0.00 | )(w) | | | $(0.03 | ) | | | $(0.05 | ) |
From tax return of capital | | | (0.00 | )(w) | | | (0.00 | )(w) | | | — | | | | — | | | | — | |
Total distributions declared to shareholders | | | $(0.00 | )(w) | | | $(0.00 | )(w) | | | $(0.00 | )(w) | | | $(0.03 | ) | | | $(0.05 | ) |
Net asset value, end of period | | | $1.00 | | | | $1.00 | | | | $1.00 | | | | $1.00 | | | | $1.00 | |
Total return (%) (r)(t) | | | 0.00 | (w) | | | 0.00 | (w) | | | 0.31 | | | | 3.43 | | | | 5.06 | |
Ratios (%) (to average net assets)
and Supplemental data: | | | | | | | | | | | | | | | | | |
Expenses before expense reductions (f) | | | 0.94 | | | | 0.85 | | | | 0.72 | | | | 0.87 | | | | 0.83 | |
Expenses after expense reductions (f) | | | 0.20 | | | | 0.27 | | | | 0.39 | | | | 0.47 | | | | 0.43 | |
Net investment income | | | 0.00 | (w) | | | 0.00 | (w) | | | 0.33 | | | | 3.29 | | | | 4.94 | |
Net assets at end of period
(000 omitted) | | | $153,634 | | | | $141,832 | | | | $173,135 | | | | $189,684 | | | | $136,204 | |
See Notes to Financial Statements
14
Financial Highlights – continued
| | | | | | | | | | | | | | | | | | | | |
| Class B | | Years ended 8/31 | |
| | | 2011 | | | 2010 | | | 2009 | | | 2008 | | | 2007 | |
Net asset value, beginning of period | | | $1.00 | | | | $1.00 | | | | $1.00 | | | | $1.00 | | | | $1.00 | |
| Income (loss) from investment operations | | | | | | | | | | | | | | | | | |
Net investment income (d) | | | $— | | | | $0.00 | (w) | | | $0.00 | (w) | | | $0.02 | | | | $0.04 | |
Net realized and unrealized gain (loss)
on investments | | | (0.00 | )(w) | | | 0.00 | (w) | | | (0.00 | )(w) | | | — | | | | (0.00 | )(w) |
Total from investment operations | | | $(0.00 | )(w) | | | $0.00 | (w) | | | $0.00 | (w) | | | $0.02 | | | | $0.04 | |
| Less distributions declared to shareholders | | | | | | | | | | | | | | | | | |
From net investment income | | | $— | | | | $(0.00 | )(w) | | | $(0.00 | )(w) | | | $(0.02 | ) | | | $(0.04 | ) |
From tax return of capital | | | — | | | | (0.00 | )(w) | | | — | | | | — | | | | — | |
Total distributions declared to shareholders | | | $— | | | | $(0.00 | )(w) | | | $(0.00 | )(w) | | | $(0.02 | ) | | | $(0.04 | ) |
Net asset value, end of period | | | $1.00 | | | | $1.00 | | | | $1.00 | | | | $1.00 | | | | $1.00 | |
Total return (%) (r)(t) | | | 0.00 | (w) | | | 0.00 | (w) | | | 0.10 | | | | 2.40 | | | | 4.02 | |
Ratios (%) (to average net assets)
and Supplemental data: | | | | | | | | | | | | | | | | | |
Expenses before expense reductions (f) | | | 1.69 | | | | 1.69 | | | | 1.72 | | | | 1.86 | | �� | | 1.83 | |
Expenses after expense reductions (f) | | | 0.20 | | | | 0.27 | | | | 0.60 | | | | 1.46 | | | | 1.43 | |
Net investment income | | | — | | | | 0.00 | (w) | | | 0.08 | | | | 2.44 | | | | 3.94 | |
Net assets at end of period
(000 omitted) | | | $50,379 | | | | $66,601 | | | | $104,696 | | | | $112,707 | | | | $154,176 | |
See Notes to Financial Statements
15
Financial Highlights – continued
| | | | | | | | | | | | | | | | | | | | |
| Class C | | Years ended 8/31 | |
| | | 2011 | | | 2010 | | | 2009 | | | 2008 | | | 2007 | |
Net asset value, beginning of period | | | $1.00 | | | | $1.00 | | | | $1.00 | | | | $1.00 | | | | $1.00 | |
| Income (loss) from investment operations | | | | | | | | | | | | | | | | | |
Net investment income (d) | | | $— | | | | $0.00 | (w) | | | $0.00 | (w) | | | $0.02 | | | | $0.04 | |
Net realized and unrealized gain (loss)
on investments | | | (0.00 | )(w) | | | 0.00 | (w) | | | (0.00 | )(w) | | | — | | | | (0.00 | )(w) |
Total from investment operations | | | $(0.00 | )(w) | | | $0.00 | (w) | | | $0.00 | (w) | | | $0.02 | | | | $0.04 | |
| Less distributions declared to shareholders | | | | | | | | | | | | | | | | | |
From net investment income | | | $— | | | | $(0.00 | )(w) | | | $(0.00 | )(w) | | | $(0.02 | ) | | | $(0.04 | ) |
From tax return of capital | | | — | | | | (0.00 | )(w) | | | — | | | | — | | | | — | |
Total distributions declared to shareholders | | | $— | | | | $(0.00 | )(w) | | | $(0.00 | )(w) | | | $(0.02 | ) | | | $(0.04 | ) |
Net asset value, end of period | | | $1.00 | | | | $1.00 | | | | $1.00 | | | | $1.00 | | | | $1.00 | |
Total return (%) (r)(t) | | | 0.00 | (w) | | | 0.00 | (w) | | | 0.10 | | | | 2.40 | | | | 4.02 | |
Ratios (%) (to average net assets)
and Supplemental data: | | | | | | | | | | | | | | | | | |
Expenses before expense reductions (f) | | | 1.69 | | | | 1.69 | | | | 1.72 | | | | 1.87 | | | | 1.83 | |
Expenses after expense reductions (f) | | | 0.20 | | | | 0.27 | | | | 0.60 | | | | 1.47 | | | | 1.43 | |
Net investment income | | | — | | | | 0.00 | (w) | | | 0.08 | | | | 2.18 | | | | 3.94 | |
Net assets at end of period
(000 omitted) | | | $61,943 | | | | $50,196 | | | | $70,005 | | | | $79,091 | | | | $60,390 | |
See Notes to Financial Statements
16
Financial Highlights – continued
| | | | | | | | | | | | | | | | | | | | |
| Class R1 | | Years ended 8/31 | |
| | | 2011 | | | 2010 | | | 2009 | | | 2008 | | | 2007 | |
Net asset value, beginning of period | | | $1.00 | | | | $1.00 | | | | $1.00 | | | | $1.00 | | | | $1.00 | |
| Income (loss) from investment operations | | | | | | | | | | | | | | | | | |
Net investment income (d) | | | $— | | | | $0.00 | (w) | | | $0.00 | (w) | | | $0.02 | | | | $0.04 | |
Net realized and unrealized gain (loss)
on investments | | | (0.00 | )(w) | | | 0.00 | (w) | | | (0.00 | )(w) | | | — | | | | (0.00 | )(w) |
Total from investment operations | | | $(0.00 | )(w) | | | $0.00 | (w) | | | $0.00 | (w) | | | $0.02 | | | | $0.04 | |
| Less distributions declared to shareholders | | | | | | | | | | | | | | | | | |
From net investment income | | | $— | | | | $(0.00 | )(w) | | | $(0.00 | )(w) | | | $(0.02 | ) | | | $(0.04 | ) |
From tax return of capital | | | — | | | | (0.00 | )(w) | | | — | | | | — | | | | — | |
Total distributions declared to shareholders | | | $— | | | | $(0.00 | )(w) | | | $(0.00 | )(w) | | | $(0.02 | ) | | | $(0.04 | ) |
Net asset value, end of period | | | $1.00 | | | | $1.00 | | | | $1.00 | | | | $1.00 | | | | $1.00 | |
Total return (%) (r) | | | 0.00 | (w) | | | 0.00 | (w) | | | 0.10 | | | | 2.35 | | | | 3.91 | |
Ratios (%) (to average net assets)
and Supplemental data: | | | | | | | | | | | | | | | | | |
Expenses before expense reductions (f) | | | 1.69 | | | | 1.69 | | | | 1.72 | | | | 1.91 | | | | 1.97 | |
Expenses after expense reductions (f) | | | 0.20 | | | | 0.27 | | | | 0.58 | | | | 1.51 | | | | 1.53 | |
Net investment income | | | — | | | | 0.00 | (w) | | | 0.09 | | | | 2.10 | | | | 3.82 | |
Net assets at end of period
(000 omitted) | | | $28,705 | | | | $30,233 | | | | $29,457 | | | | $27,361 | | | | $8,538 | |
See Notes to Financial Statements
17
Financial Highlights – continued
| | | | | | | | | | | | | | | | | | | | |
| Class R2 | | Years ended 8/31 | |
| | | 2011 | | | 2010 | | | 2009 | | | 2008 | | | 2007 | |
Net asset value, beginning of period | | | $1.00 | | | | $1.00 | | | | $1.00 | | | | $1.00 | | | | $1.00 | |
| Income (loss) from investment operations | | | | | | | | | | | | | | | | | |
Net investment income (d) | | | $— | | | | $0.00 | (w) | | | $0.00 | (w) | | | $0.03 | | | | $0.04 | |
Net realized and unrealized gain (loss)
on investments | | | (0.00 | )(w) | | | 0.00 | (w) | | | (0.00 | )(w) | | | — | | | | (0.00 | )(w) |
Total from investment operations | | | $(0.00 | )(w) | | | $0.00 | (w) | | | $0.00 | (w) | | | $0.03 | | | | $0.04 | |
| Less distributions declared to shareholders | | | | | | | | | | | | | | | | | |
From net investment income | | | $— | | | | $(0.00 | )(w) | | | $(0.00 | )(w) | | | $(0.03 | ) | | | $(0.04 | ) |
From tax return of capital | | | — | | | | (0.00 | )(w) | | | — | | | | — | | | | — | |
Total distributions declared to shareholders | | | $— | | | | $(0.00 | )(w) | | | $(0.00 | )(w) | | | $(0.03 | ) | | | $(0.04 | ) |
Net asset value, end of period | | | $1.00 | | | | $1.00 | | | | $1.00 | | | | $1.00 | | | | $1.00 | |
Total return (%) (r) | | | 0.00 | (w) | | | 0.00 | (w) | | | 0.17 | | | | 2.86 | | | | 4.38 | |
Ratios (%) (to average net assets)
and Supplemental data: | | | | | | | | | | | | | | | | | |
Expenses before expense reductions (f) | | | 1.19 | | | | 1.19 | | | | 1.22 | | | | 1.41 | | | | 1.52 | |
Expenses after expense reductions (f) | | | 0.20 | | | | 0.27 | | | | 0.51 | | | | 1.01 | | | | 1.09 | |
Net investment income | | | — | | | | 0.00 | (w) | | | 0.15 | | | | 2.58 | | | | 4.28 | |
Net assets at end of period
(000 omitted) | | | $104,130 | | | | $109,362 | | | | $120,476 | | | | $98,825 | | | | $36,027 | |
See Notes to Financial Statements
18
Financial Highlights – continued
| | | | | | | | | | | | | | | | | | | | |
| Class R3 | | Years ended 8/31 | |
| | | 2011 | | | 2010 | | | 2009 | | | 2008 | | | 2007 | |
Net asset value, beginning of period | | | $1.00 | | | | $1.00 | | | | $1.00 | | | | $1.00 | | | | $1.00 | |
| Income (loss) from investment operations | | | | | | | | | | | | | | | | | |
Net investment income (d) | | | $— | | | | $0.00 | (w) | | | $0.00 | (w) | | | $0.03 | | | | $0.05 | |
Net realized and unrealized gain (loss)
on investments | | | (0.00 | )(w) | | | 0.00 | (w) | | | (0.00 | )(w) | | | — | | | | (0.00 | )(w) |
Total from investment operations | | | $(0.00 | )(w) | | | $0.00 | (w) | | | $0.00 | (w) | | | $0.03 | | | | $0.05 | |
| Less distributions declared to shareholders | | | | | | | | | | | | | | | | | |
From net investment income | | | $— | | | | $(0.00 | )(w) | | | $(0.00 | )(w) | | | $(0.03 | ) | | | $(0.05 | ) |
From tax return of capital | | | — | | | | (0.00 | )(w) | | | — | | | | — | | | | — | |
Total distributions declared to shareholders | | | $— | | | | $(0.00 | )(w) | | | $(0.00 | )(w) | | | $(0.03 | ) | | | $(0.05 | ) |
Net asset value, end of period | | | $1.00 | | | | $1.00 | | | | $1.00 | | | | $1.00 | | | | $1.00 | |
Total return (%) (r) | | | 0.00 | (w) | | | 0.00 | (w) | | | 0.23 | | | | 3.12 | | | | 4.63 | |
Ratios (%) (to average net assets)
and Supplemental data: | | | | | | | | | | | | | | | | | |
Expenses before expense reductions (f) | | | 0.94 | | | | 0.94 | | | | 0.97 | | | | 1.15 | | | | 1.23 | |
Expenses after expense reductions (f) | | | 0.20 | | | | 0.27 | | | | 0.45 | | | | 0.75 | | | | 0.83 | |
Net investment income | | | — | | | | 0.00 | (w) | | | 0.20 | | | | 2.82 | | | | 4.53 | |
Net assets at end of period
(000 omitted) | | | $85,602 | | | | $90,331 | | | | $104,062 | | | | $82,454 | | | | $32,545 | |
See Notes to Financial Statements
19
Financial Highlights – continued
| | | | | | | | | | | | | | | | | | | | |
| Class R4 | | Years ended 8/31 | |
| | | 2011 | | | 2010 | | | 2009 | | | 2008 | | | 2007 | |
Net asset value, beginning of period | | | $1.00 | | | | $1.00 | | | | $1.00 | | | | $1.00 | | | | $1.00 | |
| Income (loss) from investment operations | | | | | | | | | | | | | | | | | |
Net investment income (d) | | | $0.00 | (w) | | | $0.00 | (w) | | | $0.00 | (w) | | | $0.03 | | | | $0.05 | |
Net realized and unrealized gain (loss)
on investments | | | (0.00 | )(w) | | | 0.00 | (w) | | | (0.00 | )(w) | | | — | | | | (0.00 | )(w) |
Total from investment operations | | | $0.00 | (w) | | | $0.00 | (w) | | | $0.00 | (w) | | | $0.03 | | | | $0.05 | |
| Less distributions declared to shareholders | | | | | | | | | | | | | | | | | |
From net investment income | | | $(0.00 | )(w) | | | $(0.00 | )(w) | | | $(0.00 | )(w) | | | $(0.03 | ) | | | $(0.05 | ) |
From tax return of capital | | | (0.00 | )(w) | | | (0.00 | )(w) | | | — | | | | — | | | | — | |
Total distributions declared to shareholders | | | $(0.00 | )(w) | | | $(0.00 | )(w) | | | $(0.00 | )(w) | | | $(0.03 | ) | | | $(0.05 | ) |
Net asset value, end of period | | | $1.00 | | | | $1.00 | | | | $1.00 | | | | $1.00 | | | | $1.00 | |
Total return (%) (r) | | | 0.00 | (w) | | | 0.00 | (w) | | | 0.31 | | | | 3.39 | | | | 4.96 | |
Ratios (%) (to average net assets)
and Supplemental data: | | | | | | | | | | | | | | | | | |
Expenses before expense reductions (f) | | | 0.69 | | | | 0.68 | | | | 0.72 | | | | 0.90 | | | | 0.93 | |
Expenses after expense reductions (f) | | | 0.20 | | | | 0.27 | | | | 0.38 | | | | 0.50 | | | | 0.53 | |
Net investment income | | | 0.00 | (w) | | | 0.00 | (w) | | | 0.23 | | | | 3.24 | | | | 4.80 | |
Net assets at end of period
(000 omitted) | | | $5,743 | | | | $6,172 | | | | $5,697 | | | | $4,094 | | | | $3,717 | |
See Notes to Financial Statements
20
Financial Highlights – continued
| | | | | | | | | | | | | | | | | | | | |
| Class 529A | | Years ended 8/31 | |
| | | 2011 | | | 2010 | | | 2009 | | | 2008 | | | 2007 | |
Net asset value, beginning of period | | | $1.00 | | | | $1.00 | | | | $1.00 | | | | $1.00 | | | | $1.00 | |
| Income (loss) from investment operations | | | | | | | | | | | | | | | | | |
Net investment income (d) | | | $— | | | | $0.00 | (w) | | | $0.00 | (w) | | | $0.03 | | | | $0.05 | |
Net realized and unrealized gain (loss)
on investments | | | (0.00 | )(w) | | | 0.00 | (w) | | | (0.00 | )(w) | | | — | | | | (0.00 | )(w) |
Total from investment operations | | | $(0.00 | )(w) | | | $0.00 | (w) | | | $0.00 | (w) | | | $0.03 | | | | $0.05 | |
| Less distributions declared to shareholders | | | | | | | | | | | | | | | | | |
From net investment income | | | $— | | | | $(0.00 | )(w) | | | $(0.00 | )(w) | | | $(0.03 | ) | | | $(0.05 | ) |
From tax return of capital | | | — | | | | (0.00 | )(w) | | | — | | | | — | | | | — | |
Total distributions declared to shareholders | | | $— | | | | $(0.00 | )(w) | | | $(0.00 | )(w) | | | $(0.03 | ) | | | $(0.05 | ) |
Net asset value, end of period | | | $1.00 | | | | $1.00 | | | | $1.00 | | | | $1.00 | | | | $1.00 | |
Total return (%) (r) | | | 0.00 | (w) | | | 0.00 | (w) | | | 0.28 | | | | 3.23 | | | | 4.80 | |
Ratios (%) (to average net assets)
and Supplemental data: | | | | | | | | | | | | | | | | | |
Expenses before expense reductions (f) | | | 1.04 | | | | 1.03 | | | | 1.12 | | | | 1.40 | | | | 1.44 | |
Expenses after expense reductions (f) | | | 0.20 | | | | 0.27 | | | | 0.40 | | | | 0.65 | | | | 0.68 | |
Net investment income | | | — | | | | 0.00 | (w) | | | 0.19 | | | | 3.05 | | | | 4.69 | |
Net assets at end of period
(000 omitted) | | | $9,710 | | | | $9,919 | | | | $6,926 | | | | $3,777 | | | | $2,548 | |
See Notes to Financial Statements
21
Financial Highlights – continued
| | | | | | | | | | | | | | | | | | | | |
| Class 529B | | Years ended 8/31 | |
| | | 2011 | | | 2010 | | | 2009 | | | 2008 | | | 2007 | |
Net asset value, beginning of period | | | $1.00 | | | | $1.00 | | | | $1.00 | | | | $1.00 | | | | $1.00 | |
| Income (loss) from investment operations | | | | | | | | | | | | | | | | | | | | |
Net investment income (d) | | | $— | | | | $0.00 | (w) | | | $0.00 | (w) | | | $0.02 | | | | $0.04 | |
Net realized and unrealized gain (loss)
on investments | | | (0.00 | )(w) | | | 0.00 | (w) | | | (0.00 | )(w) | | | — | | | | (0.00 | )(w) |
Total from investment operations | | | $(0.00 | )(w) | | | $0.00 | (w) | | | $0.00 | (w) | | | $0.02 | | | | $0.04 | |
| Less distributions declared to shareholders | | | | | | | | | | | | | | | | | |
From net investment income | | | $— | | | | $(0.00 | )(w) | | | $(0.00 | )(w) | | | $(0.02 | ) | | | $(0.04 | ) |
From tax return of capital | | | — | | | | (0.00 | )(w) | | | — | | | | — | | | | — | |
Total distributions declared to shareholders | | | $— | | | | $(0.00 | )(w) | | | $(0.00 | )(w) | | | $(0.02 | ) | | | $(0.04 | ) |
Net asset value, end of period | | | $1.00 | | | | $1.00 | | | | $1.00 | | | | $1.00 | | | | $1.00 | |
Total return (%) (r)(t) | | | 0.00 | (w) | | | 0.00 | (w) | | | 0.08 | | | | 2.21 | | | | 3.77 | |
Ratios (%) (to average net assets)
and Supplemental data: | | | | | | | | | | | | | | | | | | | | |
Expenses before expense reductions (f) | | | 1.79 | | | | 1.79 | | | | 1.83 | | | | 2.04 | | | | 2.09 | |
Expenses after expense reductions (f) | | | 0.20 | | | | 0.27 | | | | 0.51 | | | | 1.64 | | | | 1.69 | |
Net investment income | | | — | | | | 0.00 | (w) | | | 0.04 | | | | 1.91 | | | | 3.69 | |
Net assets at end of period
(000 omitted) | | | $1,073 | | | | $1,613 | | | | $1,942 | | | | $700 | | | | $328 | |
See Notes to Financial Statements
22
Financial Highlights – continued
| | | | | | | | | | | | | | | | | | | | |
| Class 529C | | Years ended 8/31 | |
| | | 2011 | | | 2010 | | | 2009 | | | 2008 | | | 2007 | |
Net asset value, beginning of period | | | $1.00 | | | | $1.00 | | | | $1.00 | | | | $1.00 | | | | $1.00 | |
| Income (loss) from investment operations | | | | | | | | | | | | | | | | | | | | |
Net investment income (d) | | | $— | | | | $0.00 | (w) | | | $0.00 | (w) | | | $0.02 | | | | $0.04 | |
Net realized and unrealized gain (loss)
on investments | | | (0.00 | )(w) | | | 0.00 | (w) | | | (0.00 | )(w) | | | — | | | | (0.00 | )(w) |
Total from investment operations | | | $(0.00 | )(w) | | | $0.00 | (w) | | | $0.00 | (w) | | | $0.02 | | | | $0.04 | |
| Less distributions declared to shareholders | | | | | | | | | | | | | | | | | |
From net investment income | | | $— | | | | $(0.00 | )(w) | | | $(0.00 | )(w) | | | $(0.02 | ) | | | $(0.04 | ) |
From tax return of capital | | | — | | | | (0.00 | )(w) | | | — | | | | — | | | | — | |
Total distributions declared to shareholders | | | $— | | | | $(0.00 | )(w) | | | $(0.00 | )(w) | | | $(0.02 | ) | | | $(0.04 | ) |
Net asset value, end of period | | | $1.00 | | | | $1.00 | | | | $1.00 | | | | $1.00 | | | | $1.00 | |
Total return (%) (r)(t) | | | 0.00 | (w) | | | 0.00 | (w) | | | 0.08 | | | | 2.21 | | | | 3.76 | |
Ratios (%) (to average net assets)
and Supplemental data: | | | | | | | | | | | | | | | | | |
Expenses before expense reductions (f) | | | 1.79 | | | | 1.78 | | | | 1.83 | | | | 2.04 | | | | 2.09 | |
Expenses after expense reductions (f) | | | 0.20 | | | | 0.27 | | | | 0.52 | | | | 1.64 | | | | 1.68 | |
Net investment income | | | — | | | | 0.00 | (w) | | | 0.04 | | | | 1.85 | | | | 3.69 | |
Net assets at end of period
(000 omitted) | | | $5,525 | | | | $6,224 | | | | $4,391 | | | | $1,820 | | | | $814 | |
| Supplemental Ratios (%): | | | | | | | | | | | | | | | | | | | | |
| (d) | Per share data is based on average shares outstanding. |
| (f) | Ratios do not reflect reductions from fees paid indirectly, if applicable. |
| (r) | Certain expenses have been reduced without which performance would have been lower. |
| (t) | Total returns do not include any applicable sales charges. |
| (w) | Per share amount was less than $0.01 and total return or ratio was less than 0.01%, as applicable. |
See Notes to Financial Statements
23
NOTES TO FINANCIAL STATEMENTS
| (1) | | Business and Organization |
MFS Cash Reserve Fund (the fund) is a series of MFS Series Trust I (the trust). The trust is organized as a Massachusetts business trust and is registered under the Investment Company Act of 1940, as amended, as an open-end management investment company.
| (2) | | Significant Accounting Policies |
General – The preparation of financial statements in conformity with U.S. generally accepted accounting principles requires management to make estimates and assumptions that affect the reported amounts of assets and liabilities, and disclosure of contingent assets and liabilities at the date of the financial statements and the reported amounts of revenues and expenses during the reporting period. Actual results could differ from those estimates. In the preparation of these financial statements, management has evaluated subsequent events occurring after the date of the fund’s Statement of Assets and Liabilities through the date that the financial statements were issued.
Investment Valuations – Pursuant to procedures approved by the Board of Trustees, investments held by the fund are generally valued at amortized cost, which approximates market value. Amortized cost involves valuing an instrument at its cost as adjusted for amortization of premium or accretion of discount rather than its current market value. The amortized cost value of an instrument can be different from the market value of an instrument.
Various inputs are used in determining the value of the fund’s assets or liabilities. These inputs are categorized into three broad levels. In certain cases, the inputs used to measure fair value may fall into different levels of the fair value hierarchy. In such cases, an investment’s level within the fair value hierarchy is based on the lowest level of input that is significant to the fair value measurement. The fund’s assessment of the significance of a particular input to the fair value measurement in its entirety requires judgment, and considers factors specific to the investment. Level 1 includes unadjusted quoted prices in active markets for identical assets or liabilities. Level 2 includes other significant observable market-based inputs (including quoted prices for similar securities, interest rates, prepayment speed, and credit risk). Level 3 includes unobservable inputs, which may include the adviser’s own assumptions in determining the fair value of investments. The following is a summary of the levels used as of August 31, 2011 in valuing the fund’s assets or liabilities:
| | | | | | | | | | | | | | | | |
| Investments at Value | | Level 1 | | | Level 2 | | | Level 3 | | | Total | |
| | | | |
| Short Term Securities | | | $— | | | | $509,970,769 | | | | $— | | | | $509,970,769 | |
24
Notes to Financial Statements – continued
For further information regarding security characteristics, see the Portfolio of Investments.
Repurchase Agreements – The fund entered into repurchase agreements with approved counterparties. Each repurchase agreement is recorded at cost. The fund requires that the securities collateral in a repurchase transaction be transferred to a custodian. The fund monitors, on a daily basis, the value of the collateral to ensure that its value, including accrued interest, is greater than amounts owed to the fund under each such repurchase agreement. The fund and other funds managed by MFS may utilize a joint trading account for the purpose of entering into one or more repurchase agreements.
Indemnifications – Under the fund’s organizational documents, its officers and Trustees may be indemnified against certain liabilities and expenses arising out of the performance of their duties to the fund. Additionally, in the normal course of business, the fund enters into agreements with service providers that may contain indemnification clauses. The fund’s maximum exposure under these agreements is unknown as this would involve future claims that may be made against the fund that have not yet occurred.
Investment Transactions and Income – Investment transactions are recorded on the trade date. Interest income is recorded on the accrual basis. All premium and discount is amortized or accreted for financial statement purposes in accordance with U.S. generally accepted accounting principles.
Fees Paid Indirectly – The fund’s custody fee may be reduced according to an arrangement that measures the value of cash deposited with the custodian by the fund. This amount, for the year ended August 31, 2011, is shown as a reduction of total expenses on the Statement of Operations.
Tax Matters and Distributions – The fund intends to qualify as a regulated investment company, as defined under Subchapter M of the Internal Revenue Code, and to distribute all of its taxable income, including realized capital gains. As a result, no provision for federal income tax is required. The fund’s federal tax returns for the prior three fiscal years remain subject to examination by the Internal Revenue Service. Foreign taxes, if any, have been accrued by the fund in the accompanying financial statements.
Distributions to shareholders are recorded on the ex-dividend date. Income and capital gain distributions are determined in accordance with income tax regulations, which may differ from U.S. generally accepted accounting principles. Certain capital accounts in the financial statements are periodically adjusted for permanent differences in order to reflect their tax character. These adjustments have no impact on net assets or net asset value per share. Temporary differences which arise from recognizing certain items of income, expense, gain or loss in different periods for financial statement and tax
25
Notes to Financial Statements – continued
purposes will reverse at some time in the future. Distributions in excess of net investment income or net realized gains are temporary overdistributions for financial statement purposes resulting from differences in the recognition or classification of income or distributions for financial statement and tax purposes.
Book/tax differences primarily relate to the timing of recognition of certain expenses.
The tax character of distributions declared to shareholders for the last two fiscal years is as follows:
| | | | | | | | |
| | | 8/31/11 | | | 8/31/10 | |
| Ordinary income (including any short-term capital gains) | | | $7 | | | | $22,677 | |
| Tax return of capital (b) | | | 169 | | | | 490 | |
| Total distributions | | | $176 | | | | $23,167 | |
| (b) | Distributions in excess of tax basis earnings and profits are reported in the financial statements as a tax return of capital. |
The federal tax cost and the tax basis components of distributable earnings were as follows:
| | | | |
| As of 8/31/11 | | | |
| Cost of investments | | | $509,970,769 | |
| Capital loss carryforwards | | | (207,598 | ) |
| Post-October capital loss deferral | | | (110 | ) |
| Other temporary differences | | | (17,540 | ) |
As of August 31, 2011, the fund had capital loss carryforwards available to offset future realized gains. Such losses expire as follows:
| | | | |
| 8/31/15 | | | $ (219 | ) |
| 8/31/16 | | | (22,989 | ) |
| 8/31/17 | | | (184,390 | ) |
| Total | | | $(207,598 | ) |
Multiple Classes of Shares of Beneficial Interest – The fund offers multiple classes of shares, which differ in their respective distribution, service, and program manager fees. The fund’s income and common expenses are allocated to shareholders based on the value of settled shares outstanding of each class. The fund’s realized and unrealized gain (loss) are allocated to shareholders based on the daily net assets of each class. Dividends are declared separately for each class. Differences in per share dividend rates are generally due to differences in separate class expenses. Class B and Class 529B shares will convert to Class A and Class 529A shares, respectively, approximately eight
26
Notes to Financial Statements – continued
years after purchase. The fund’s distributions declared to shareholders as reported on the Statements of Changes in Net Assets are presented by class as follows:
| | | | | | | | | | | | | | | | |
| | | From net investment
income | | | From tax return of
capital | |
| | | Year ended
8/31/11 | | | Year ended
8/31/10 | | | Year ended
8/31/11 | | | Year ended
8/31/10 | |
| Class A | | | $6 | | | | $6,567 | | | | $162 | | | | $139 | |
| Class B | | | — | | | | 3,645 | | | | — | | | | 73 | |
| Class C | | | — | | | | 2,323 | | | | — | | | | 49 | |
| Class R1 | | | — | | | | 1,155 | | | | — | | | | 26 | |
| Class R2 | | | — | | | | 4,372 | | | | — | | | | 99 | |
| Class R3 | | | — | | | | 3,865 | | | | — | | | | 85 | |
| Class R4 | | | 1 | | | | 226 | | | | 7 | | | | 5 | |
| Class 529A | | | — | | | | 281 | | | | — | | | | 7 | |
| Class 529B | | | — | | | | 81 | | | | — | | | | 2 | |
| Class 529C | | | — | | | | 162 | | | | — | | | | 5 | |
| Total | | | $7 | | | | $22,677 | | | | $169 | | | | $490 | |
| (3) | | Transactions with Affiliates |
Investment Adviser – The fund has an investment advisory agreement with MFS to provide overall investment management and related administrative services and facilities to the fund.
The management fee is computed daily and paid monthly at an annual rate of 0.40% of the fund’s average daily net assets.
During the year ended August 31, 2011, MFS voluntarily waived receipt of $1,881,825 of the fund’s management fee in order to avoid a negative yield. This amount is reflected as a reduction of total expenses in the Statement of Operations. The management fee incurred for the year ended August 31, 2011, was equivalent to an annual effective rate of 0.00% of the fund’s average daily net assets.
In order to avoid a negative yield for the year ended August 31, 2011, MFS voluntarily agreed to reduce certain other expenses in the amount of $430,889, which is shown as a reduction of total expenses in the Statement of Operations.
Distributor – The Board of Trustees has adopted a distribution plan for certain class shares pursuant to Rule 12b-1 of the Investment Company Act of 1940.
The fund’s distribution plan provides that the fund will pay MFD for services provided by MFD and financial intermediaries in connection with the distribution and servicing of certain share classes. One component of the plan is a distribution fee paid to MFD and another component of the plan is a service fee paid to MFD. MFD may subsequently pay all, or a portion, of the distribution and/or service fees to financial intermediaries.
27
Notes to Financial Statements – continued
Distribution Plan Fee Table:
| | | | | | | | | | | | | | | | | | | | |
| | | Distribution
Fee Rate (d) | | | Service
Fee Rate (d) | | | Total
Distribution
Plan (d) | | | Annual
Effective
Rate (e) | | | Distribution
and Service
Fee | |
| Class A | | | — | | | | 0.25% | | | | 0.25% | | | | 0.00% | | | | $334,315 | |
| Class B | | | 0.75% | | | | 0.25% | | | | 1.00% | | | | 0.00% | | | | 533,552 | |
| Class C | | | 0.75% | | | | 0.25% | | | | 1.00% | | | | 0.00% | | | | 468,494 | |
| Class R1 | | | 0.75% | | | | 0.25% | | | | 1.00% | | | | 0.00% | | | | 272,686 | |
| Class R2 | | | 0.25% | | | | 0.25% | | | | 0.50% | | | | 0.00% | | | | 514,989 | |
| Class R3 | | | — | | | | 0.25% | | | | 0.25% | | | | 0.00% | | | | 209,456 | |
| Class 529A | | | — | | | | 0.25% | | | | 0.25% | | | | 0.00% | | | | 24,154 | |
| Class 529B | | | 0.75% | | | | 0.25% | | | | 1.00% | | | | 0.00% | | | | 13,091 | |
| Class 529C | | | 0.75% | | | | 0.25% | | | | 1.00% | | | | 0.00% | | | | 56,064 | |
| Total Distribution and Service Fees | | | | | | | | | | | | $2,426,801 | |
| (d) | In accordance with the distribution plan for certain classes, the fund pays distribution and/or service fees equal to these annual percentage rates of each class’ average daily net assets. The distribution and service fee rates disclosed by class represent the current rates in effect at the end of the reporting period. Any rate changes, if applicable, are detailed below. |
| (e) | The annual effective rates represent actual fees incurred under the distribution plan for the year ended August 31, 2011 based on each class’ average daily net assets. MFD has agreed in writing to waive the Class A and Class 529A service fee. This written agreement will continue until modified by the fund’s Board of Trustees, but such agreement will continue until at least December 31, 2012. These reductions for Class A and Class 529A amounted to $334,315 and $24,154, respectively, and are shown as a reduction of total expenses in the Statement of Operations. During the year ended August 31, 2011, MFD voluntarily waived receipt of $2,068,332 of the fund’s distribution and service fees in order to avoid a negative yield for Class B, Class C, Class R1, Class R2, Class R3, Class 529B, and Class 529 C shares. This amount is reflected as a reduction of total expenses in the Statement of Operations. |
Certain Class A shares acquired through an exchange may be subject to a contingent deferred sales charge (CDSC) upon redemption depending on when the shares exchanged were originally purchased. Class C and Class 529C shares are subject to a CDSC in the event of a shareholder redemption within 12 months of purchase. Class B and Class 529B shares are subject to a CDSC in the event of a shareholder redemption within six years of purchase. All contingent deferred sales charges are paid to MFD and during the year ended August 31, 2011, were as follows:
| | | | |
| | | Amount | |
| Class A | | | $24 | |
| Class B | | | 178,017 | |
| Class C | | | 11,506 | |
| Class 529B | | | 1,047 | |
| Class 529C | | | 202 | |
The fund has entered into and may from time to time enter into contracts with program managers and other parties which administer the tuition programs through which an investment in the fund’s 529 share classes is made. The fund has entered into an agreement with MFD pursuant to which MFD receives an
28
Notes to Financial Statements – continued
annual fee of up to 0.10% of the average daily net assets attributable to each 529 share class. Effective July 1, 2011, MFD has agreed to waive 0.05% of this annual fee. This waiver agreement will continue until modified by the fund’s Board of Trustees but such agreement will continue at least until December 31, 2012, after which MFD may eliminate this waiver without a vote of the fund’s Board of Trustees. For the period July 1, 2011 through August 31, 2011 this waiver amounted to $1,365 and is reflected as a reduction of total expenses in the Statement of Operations. In addition, for the year ended August 31, 2011, MFS voluntarily waived receipt of $15,211 of the fund’s program manager fees, which is shown as a reduction of total expenses in the Statement of Operations, in order to avoid a negative yield for Class 529A, Class 529B, and Class 529C shares. These waivers had the effect of reducing the program manager fee by 0.10% of average daily net assets attributable to Class 529A, Class 529B, and Class 529C shares on an annualized basis. The program manager fees incurred for the year ended August 31, 2011, were equivalent to an annual effective rate of 0.00% of average daily net assets for each of the fund’s 529 share classes. The services provided by MFD, or a third party with which MFD contracts, include recordkeeping and tax reporting and account services, as well as services designed to maintain the program’s compliance with the Internal Revenue Code and other regulatory requirements. Program manager fees for the year ended August 31, 2011, were as follows:
| | | | |
| | | Amount | |
| Class 529A | | | $9,661 | |
| Class 529B | | | 1,309 | |
| Class 529C | | | 5,606 | |
| Total Program Manager Fees | | | $16,576 | |
Shareholder Servicing Agent – MFS Service Center, Inc. (MFSC), a wholly-owned subsidiary of MFS, receives a fee from the fund for its services as shareholder servicing agent calculated as a percentage of the average daily net assets of the fund as determined periodically under the supervision of the fund’s Board of Trustees. For the year ended August 31, 2011, the fee was $391,773, which equated to 0.0833% annually of the fund’s average daily net assets. MFSC also receives payment from the fund for out-of-pocket expenses, sub-accounting and other shareholder servicing costs which may be paid to affiliated and unaffiliated service providers. For the year ended August 31, 2011, these out-of-pocket expenses, sub-accounting and other shareholder servicing costs amounted to $634,959.
Administrator – MFS provides certain financial, legal, shareholder communications, compliance, and other administrative services to the fund. Under an administrative services agreement, the fund partially reimburses MFS the costs incurred to provide these services. The fund is charged an annual fixed amount of $17,500 plus a fee based on average daily net assets.
29
Notes to Financial Statements – continued
The administrative services fee incurred for the year ended August 31, 2011 was equivalent to an annual effective rate of 0.0159% of the fund’s average daily net assets.
Trustees’ and Officers’ Compensation – The fund pays compensation to independent Trustees in the form of a retainer, attendance fees, and additional compensation to Board and Committee chairpersons. The fund does not pay compensation directly to Trustees or officers of the fund who are also officers of the investment adviser, all of whom receive remuneration for their services to the fund from MFS. Certain officers and Trustees of the fund are officers or directors of MFS, MFD, and MFSC.
Prior to December 31, 2001, the fund had an unfunded defined benefit plan (“DB plan”) for independent Trustees. As of December 31, 2001, the Board took action to terminate the DB plan with respect to then-current and any future independent Trustees, such that the DB Plan covers only certain of those former independent Trustees who retired on or before December 31, 2001. The DB Plan resulted in a pension expense of $2,326 and is included in independent Trustees’ compensation for the year ended August 31, 2011. The liability for deferred retirement benefits payable to certain independent Trustees under the DB plan amounted to $17,526 at August 31, 2011, and is included in payable for independent Trustees’ compensation on the Statement of Assets and Liabilities.
Other – This fund and certain other funds managed by MFS (the funds) have entered into services agreements (the Agreements) which provide for payment of fees by the funds to Tarantino LLC and Griffin Compliance LLC in return for the provision of services of an Independent Chief Compliance Officer (ICCO) and Assistant ICCO, respectively, for the funds. The ICCO and Assistant ICCO are officers of the funds and the sole members of Tarantino LLC and Griffin Compliance LLC, respectively. The funds can terminate the Agreements with Tarantino LLC and Griffin Compliance LLC at any time under the terms of the Agreements. For the year ended August 31, 2011, the aggregate fees paid by the fund to Tarantino LLC and Griffin Compliance LLC were $4,451 and are included in miscellaneous expense on the Statement of Operations. MFS has agreed to reimburse the fund for a portion of the payments made by the fund in the amount of $2,016, which is shown as a reduction of total expenses in the Statement of Operations. Additionally, MFS has agreed to bear all expenses associated with office space, other administrative support, and supplies provided to the ICCO and Assistant ICCO.
30
Notes to Financial Statements – continued
| (4) | | Shares of Beneficial Interest |
The fund’s Declaration of Trust permits the Trustees to issue an unlimited number of full and fractional shares of beneficial interest. Transactions in fund shares were as follows:
| | | | | | | | | | | | | | | | |
| | | Year ended
8/31/11 | | | Year ended
8/31/10 | |
| | | Shares | | | Amount | | | Shares | | | Amount | |
| Shares sold | | | | | | | | | | | | | | | | |
Class A | | | 86,445,718 | | | | $86,445,729 | | | | 67,811,504 | | | | $67,811,516 | |
Class B | | | 29,536,384 | | | | 29,536,384 | | | | 34,447,545 | | | | 34,447,545 | |
Class C | | | 57,884,834 | | | | 57,884,836 | | | | 29,118,542 | | | | 29,118,542 | |
Class R1 | | | 14,507,748 | | | | 14,507,747 | | | | 18,665,394 | | | | 18,665,394 | |
Class R2 | | | 64,357,741 | | | | 64,357,741 | | | | 65,575,281 | | | | 65,575,281 | |
Class R3 | | | 51,089,070 | | | | 51,089,070 | | | | 48,952,936 | | | | 48,952,936 | |
Class R4 | | | 5,499,234 | | | | 5,499,234 | | | | 4,994,689 | | | | 4,994,689 | |
Class 529A | | | 4,181,167 | | | | 4,181,166 | | | | 6,903,031 | | | | 6,903,031 | |
Class 529B | | | 585,060 | | | | 585,059 | | | | 366,627 | | | | 366,627 | |
Class 529C | | | 2,597,058 | | | | 2,597,057 | | | | 4,332,541 | | | | 4,332,541 | |
| | | 316,684,014 | | | | $316,684,023 | | | | 281,168,090 | | | | $281,168,102 | |
Shares issued to shareholders in
reinvestment of distributions | |
Class A | | | 24 | | | | $24 | | | | 6,185 | | | | $6,185 | |
Class B | | | — | | | | — | | | | 3,379 | | | | 3,379 | |
Class C | | | — | | | | — | | | | 2,082 | | | | 2,082 | |
Class R1 | | | — | | | | — | | | | 1,173 | | | | 1,173 | |
Class R2 | | | — | | | | — | | | | 4,413 | | | | 4,413 | |
Class R3 | | | — | | | | — | | | | 3,908 | | | | 3,908 | |
Class R4 | | | 5 | | | | 5 | | | | 231 | | | | 231 | |
Class 529A | | | — | | | | — | | | | 283 | | | | 283 | |
Class 529B | | | — | | | | — | | | | 83 | | | | 83 | |
Class 529C | | | — | | | | — | | | | 167 | | | | 167 | |
| | | 29 | | | | $29 | | | | 21,904 | | | | $21,904 | |
| Shares reacquired | |
Class A | | | (74,643,888 | ) | | | $(74,643,889 | ) | | | (99,114,040 | ) | | | $(99,114,042 | ) |
Class B | | | (45,758,155 | ) | | | (45,758,165 | ) | | | (72,542,130 | ) | | | (72,542,144 | ) |
Class C | | | (46,137,917 | ) | | | (46,137,918 | ) | | | (48,927,616 | ) | | | (48,927,616 | ) |
Class R1 | | | (16,035,600 | ) | | | (16,035,600 | ) | | | (17,889,771 | ) | | | (17,889,771 | ) |
Class R2 | | | (69,589,541 | ) | | | (69,589,541 | ) | | | (76,689,598 | ) | | | (76,689,598 | ) |
Class R3 | | | (55,817,955 | ) | | | (55,817,955 | ) | | | (62,684,367 | ) | | | (62,684,367 | ) |
Class R4 | | | (5,927,888 | ) | | | (5,927,888 | ) | | | (4,519,609 | ) | | | (4,519,609 | ) |
Class 529A | | | (4,390,540 | ) | | | (4,390,540 | ) | | | (3,909,889 | ) | | | (3,909,889 | ) |
Class 529B | | | (1,124,892 | ) | | | (1,124,892 | ) | | | (695,191 | ) | | | (695,191 | ) |
Class 529C | | | (3,296,174 | ) | | | (3,296,174 | ) | | | (2,499,766 | ) | | | (2,499,766 | ) |
| | | (322,722,550 | ) | | | $(322,722,562 | ) | | | (389,471,977 | ) | | | $(389,471,993 | ) |
31
Notes to Financial Statements – continued
| | | | | | | | | | | | | | | | |
| | | Year ended
8/31/11 | | | Year ended
8/31/10 | |
| | | Shares | | | Amount | | | Shares | | | Amount | |
| Net change | |
Class A | | | 11,801,854 | | | | $11,801,864 | | | | (31,296,351 | ) | | | $(31,296,341 | ) |
Class B | | | (16,221,771 | ) | | | (16,221,781 | ) | | | (38,091,206 | ) | | | (38,091,220 | ) |
Class C | | | 11,746,917 | | | | 11,746,918 | | | | (19,806,992 | ) | | | (19,806,992 | ) |
Class R1 | | | (1,527,852 | ) | | | (1,527,853 | ) | | | 776,796 | | | | 776,796 | |
Class R2 | | | (5,231,800 | ) | | | (5,231,800 | ) | | | (11,109,904 | ) | | | (11,109,904 | ) |
Class R3 | | | (4,728,885 | ) | | | (4,728,885 | ) | | | (13,727,523 | ) | | | (13,727,523 | ) |
Class R4 | | | (428,649 | ) | | | (428,649 | ) | | | 475,311 | | | | 475,311 | |
Class 529A | | | (209,373 | ) | | | (209,374 | ) | | | 2,993,425 | | | | 2,993,425 | |
Class 529B | | | (539,832 | ) | | | (539,833 | ) | | | (328,481 | ) | | | (328,481 | ) |
Class 529C | | | (699,116 | ) | | | (699,117 | ) | | | 1,832,942 | | | | 1,832,942 | |
| | | (6,038,507 | ) | | | $(6,038,510 | ) | | | (108,281,983 | ) | | | $(108,281,987 | ) |
The sale of fund shares has been suspended except in certain circumstances. Please see the fund’s prospectus for details.
The fund and certain other funds managed by MFS participate in a $1.1 billion unsecured committed line of credit, subject to a $1 billion sublimit, provided by a syndication of banks under a credit agreement. Borrowings may be made for temporary financing needs. Interest is charged to each fund, based on its borrowings, generally at a rate equal to the higher of the Federal Reserve funds rate or one month LIBOR plus an agreed upon spread. A commitment fee, based on the average daily, unused portion of the committed line of credit, is allocated among the participating funds at the end of each calendar quarter. In addition, the fund and other funds managed by MFS have established unsecured uncommitted borrowing arrangements with certain banks for temporary financing needs. Interest is charged to each fund, based on its borrowings, at a rate equal to the Federal Reserve funds rate plus an agreed upon spread. For the year ended August 31, 2011, the fund’s commitment fee and interest expense were $4,380 and $0, respectively, and are included in miscellaneous expense on the Statement of Operations.
32
REPORT OF INDEPENDENT REGISTERED PUBLIC ACCOUNTING FIRM
To the Board of Trustees of MFS Series Trust I and the Shareholders of MFS Cash Reserve Fund:
We have audited the accompanying statement of assets and liabilities, including the portfolio of investments, of MFS Cash Reserve Fund (one of the portfolios comprising MFS Series Trust I) (the “Fund”) as of August 31, 2011, and the related statement of operations for the year then ended, the statements of changes in net assets for each of the two years in the period then ended, and the financial highlights for each of the five years in the period then ended. These financial statements and financial highlights are the responsibility of the Fund’s management. Our responsibility is to express an opinion on these financial statements and financial highlights based on our audits.
We conducted our audits in accordance with the standards of the Public Company Accounting Oversight Board (United States). Those standards require that we plan and perform the audit to obtain reasonable assurance about whether the financial statements and financial highlights are free of material misstatement. The Fund is not required to have, nor were we engaged to perform, an audit of its internal control over financial reporting. Our audits included consideration of internal control over financial reporting as a basis for designing audit procedures that are appropriate in the circumstances, but not for the purpose of expressing an opinion on the effectiveness of the Fund’s internal control over financial reporting. Accordingly, we express no such opinion. An audit also includes examining, on a test basis, evidence supporting the amounts and disclosures in the financial statements, assessing the accounting principles used and significant estimates made by management, as well as evaluating the overall financial statement presentation. Our procedures included confirmation of securities owned as of August 31, 2011, by correspondence with the custodian and brokers; where replies were not received from brokers, we performed other auditing procedures. We believe that our audits provide a reasonable basis for our opinion.
In our opinion, the financial statements and financial highlights referred to above present fairly, in all material respects, the financial position of MFS Cash Reserve Fund as of August 31, 2011, the results of its operations for the year then ended, the changes in its net assets for each of the two years in the period then ended, and the financial highlights for each of the five years in the period then ended, in conformity with accounting principles generally accepted in the United States of America.
DELOITTE & TOUCHE LLP
Boston, Massachusetts
October 17, 2011
33
TRUSTEES AND OFFICERS —
IDENTIFICATION AND BACKGROUND
The Trustees and officers of the Trust, as of October 1, 2011, are listed below, together with their principal occupations during the past five years. (Their titles may have varied during that period.) The address of each Trustee and officer is 500 Boylston Street, Boston, Massachusetts 02116.
| | | | | | | | |
Name, Age | | Position(s) Held with Fund | | Trustee/Officer
Since (h) | | Principal Occupations
During the Past Five Years | | Other
Directorships (j) |
| INTERESTED TRUSTEES |
Robert J. Manning (k)
(age 47) | | Trustee | | February 2004 | | Massachusetts Financial Services Company, Chairman, Chief Executive Officer and Director; President (until December 2009); Chief Investment Officer (until July 2010) | | |
Robert C. Pozen (k)
(age 65) | | Trustee | | February 2004 | | Massachusetts Financial Services Company, Chairman Emeritus; Chairman (until July 2010) | | Medtronic, Inc, (medical devices), Director (since 2004); The Neilsen Company (market research), Director (since 2010); Telesat (satellite communications), Director (until November 2007); Bell Canada Enterprises (telecommunications), Director (until February 2009) |
34
Trustees and Officers – continued
| | | | | | | | |
Name, Age | | Position(s) Held with Fund | | Trustee/Officer
Since (h) | | Principal Occupations
During the Past Five Years | | Other
Directorships (j) |
| INDEPENDENT TRUSTEES |
David H. Gunning
(age 69) | | Trustee and Chair of Trustees | | January 2004 | | Retired; Cleveland-Cliffs Inc. (mining products and service provider), Vice Chairman/Director (until May 2007) | | Lincoln Electric Holdings, Inc. (welding equipment manufacturer), Director; Development Alternatives, Inc. (consulting), Director/Non-Executive Chairman; Portman Limited (mining), Director (until 2008) |
Robert E. Butler
(age 69) | | Trustee | | January 2006 | | Consultant – investment company industry regulatory and compliance matters | | |
Maureen R. Goldfarb
(age 56) | | Trustee | | January 2009 | | Private investor | | |
William R. Gutow
(age 70) | | Trustee | | December 1993 | | Private investor and real estate consultant; Capitol Entertainment Management Company (video franchise), Vice Chairman | | Atlantic Coast Tan (tanning salons), Vice Chairman (until 2007); Texas Donuts (donut franchise), Vice Chairman (until 2010) |
Michael Hegarty
(age 66) | | Trustee | | December 2004 | | Private investor | | |
35
Trustees and Officers – continued
| | | | | | | | |
Name, Age | | Position(s) Held with Fund | | Trustee/Officer
Since (h) | | Principal Occupations
During the Past Five Years | | Other
Directorships (j) |
John P. Kavanaugh
(age 56) | | Trustee | | January 2009 | | Private investor; The Hanover Insurance Group, Inc., Vice President and Chief Investment Officer (until 2006); Allmerica Investment Trust, Allmerica Securities Trust and Opus Investment Trust (investment companies), Chairman, President and Trustee (until 2006) | | |
J. Dale Sherratt
(age 73) | | Trustee | | June 1989 | | Insight Resources, Inc. (acquisition planning specialists), President; Wellfleet Investments (investor in health care companies), Managing General Partner | | |
Laurie J. Thomsen
(age 54) | | Trustee | | March 2005 | | Private investor; New Profit, Inc. (venture philanthropy), Executive Partner (until 2010) | | The Travelers Companies (property and casualty insurance), Director |
Robert W. Uek
(age 70) | | Trustee | | January 2006 | | Consultant to investment company industry | | |
| OFFICERS | | | | | | | | |
Maria F. DiOrioDwyer (k)
(age 52) | | President | | March 2004 | | Massachusetts Financial Services Company, Executive Vice President and Chief Regulatory Officer Chief Compliance Officer (since December 2006) | | |
Christopher R. Bohane (k)
(age 37) | | Assistant Secretary and Assistant Clerk | | July 2005 | | Massachusetts Financial Services Company, Vice President and Senior Counsel | | |
36
Trustees and Officers – continued
| | | | | | | | |
Name, Age | | Position(s) Held with Fund | | Trustee/Officer
Since (h) | | Principal Occupations
During the Past Five Years | | Other
Directorships (j) |
John M. Corcoran (k)
(age 46) | | Treasurer | | October 2008 | | Massachusetts Financial Services Company, Senior Vice President (since October 2008); State Street Bank and Trust (financial services provider), Senior Vice President, (until September 2008) | | |
Ethan D. Corey (k)
(age 47) | | Assistant Secretary and Assistant Clerk | | July 2005 | | Massachusetts Financial Services Company, Senior Vice President and Associate General Counsel | | |
David L. DiLorenzo (k)
(age 43) | | Assistant Treasurer | | July 2005 | | Massachusetts Financial Services Company, Vice President | | |
Timothy M. Fagan (k)
(age 43) | | Assistant Secretary and Assistant Clerk | | September 2005 | | Massachusetts Financial Services Company, Vice President and Senior Counsel | | |
Robyn L. Griffin
(age 36) | | Assistant Independent Chief Compliance Officer | | August 2008 | | Griffin Compliance LLC (provider of compliance services), Principal (since August 2008); State Street Corporation (financial services provider), Mutual Fund Administration Assistant Vice President (October 2006 – July 2008); Liberty Mutual Group (insurance), Personal Market Assistant Controller (April 2006 – October 2006); Deloitte & Touche LLP (professional services firm). | | |
37
Trustees and Officers – continued
| | | | | | | | |
Name, Age | | Position(s) Held with Fund | | Trustee/Officer
Since (h) | | Principal Occupations
During the Past Five Years | | Other
Directorships (j) |
Brian E. Langenfeld (k)
(age 38) | | Assistant Secretary and Assistant Clerk | | June 2006 | | Massachusetts Financial Services Company, Vice President and Senior Counsel | | |
Ellen Moynihan (k)
(age 53) | | Assistant Treasurer | | April 1997 | | Massachusetts Financial Services Company, Senior Vice President | | |
Susan S. Newton (k)
(age 61) | | Assistant Secretary and Assistant Clerk | | May 2005 | | Massachusetts Financial Services Company, Senior Vice President and Associate General Counsel | | |
Susan A. Pereira (k)
(age 40) | | Assistant Secretary and Assistant Clerk | | July 2005 | | Massachusetts Financial Services Company, Vice President and Senior Counsel | | |
Mark N. Polebaum (k)
(age 59) | | Secretary and Clerk | | January 2006 | | Massachusetts Financial Services Company, Executive Vice President, General Counsel and Secretary | | |
Frank L. Tarantino
(age 67) | | Independent Chief Compliance Officer | | June 2004 | | Tarantino LLC (provider of compliance services), Principal | | |
Richard S. Weitzel (k)
(age 41) | | Assistant Secretary and Assistant Clerk | | October 2007 | | Massachusetts Financial Services Company, Vice President and Assistant General Counsel | | |
James O. Yost (k)
(age 51) | | Assistant Treasurer | | September 1990 | | Massachusetts Financial Services Company, Senior Vice President | | |
| (h) | Date first appointed to serve as Trustee/officer of an MFS fund. Each Trustee has served continuously since appointment unless indicated otherwise. For the period from December 15, 2004 until February 22, 2005, Messrs. Pozen and Manning served as Advisory Trustees. For the period March 2008 until October 2008, Ms. DiOrioDwyer served as Treasurer of the Funds. |
38
Trustees and Officers – continued
| (j) | Directorships or trusteeships of companies required to report to the Securities and Exchange Commission (i.e., “public companies”). |
| (k) | “Interested person” of the Trust within the meaning of the Investment Company Act of 1940 (referred to as the 1940 Act), which is the principal federal law governing investment companies like the fund, as a result of position with MFS. The address of MFS is 500 Boylston Street, Boston, Massachusetts 02116. |
Each Trustee has been elected by shareholders and each Trustee and officer holds office until his or her successor is chosen and qualified or until his or her earlier death, resignation, retirement or removal. The Trust does not hold annual meetings for the purpose of electing Trustees, and Trustees are not elected for fixed terms. Messrs. Butler, Kavanaugh, Uek and Ms. Thomsen are members of the Trust’s Audit Committee.
Each of the Fund’s Trustees and officers holds comparable positions with certain other funds of which MFS or a subsidiary is the investment adviser or distributor, and, in the case of the officers, with certain affiliates of MFS. As of January 1, 2011, the Trustees served as board members of 105 funds within the MFS Family of Funds.
The Statement of Additional Information for the Fund includes further information about the Trustees and is available without charge upon request by calling 1-800-225-2606.
| | |
| Investment Adviser | | Custodian |
Massachusetts Financial Services Company
500 Boylston Street, Boston, MA 02116-3741 | | State Street Bank and Trust 1 Lincoln Street, Boston, MA 02111-2900 |
| Distributor | | Independent Registered Public Accounting Firm |
MFS Fund Distributors, Inc.
500 Boylston Street, Boston, MA 02116-3741 | | Deloitte & Touche LLP 200 Berkeley Street, Boston, MA 02116 |
| Portfolio Manager | | |
| Edward O’Dette | | |
39
BOARD REVIEW OF INVESTMENT ADVISORY AGREEMENT
The Investment Company Act of 1940 requires that both the full Board of Trustees and a majority of the non-interested (“independent”) Trustees, voting separately, annually approve the continuation of the Fund’s investment advisory agreement with MFS. The Trustees consider matters bearing on the Fund and its advisory arrangements at their meetings throughout the year, including a review of performance data at each regular meeting. In addition, the independent Trustees met several times over the course of three months beginning in May and ending in July, 2011 (“contract review meetings”) for the specific purpose of considering whether to approve the continuation of the investment advisory agreement for the Fund and the other investment companies that the Board oversees (the “MFS Funds”). The independent Trustees were assisted in their evaluation of the Fund’s investment advisory agreement by independent legal counsel, from whom they received separate legal advice and with whom they met separately from MFS during various contract review meetings. The independent Trustees were also assisted in this process by the MFS Funds’ Independent Chief Compliance Officer, a full-time senior officer appointed by and reporting to the independent Trustees.
In connection with their deliberations regarding the continuation of the investment advisory agreement, the Trustees, including the independent Trustees, considered such information and factors as they believed, in light of the legal advice furnished to them and their own business judgment, to be relevant. The investment advisory agreement for the Fund was considered separately, although the Trustees also took into account the common interests of all MFS Funds in their review. As described below, the Trustees considered the nature, quality, and extent of the various investment advisory, administrative, and shareholder services performed by MFS under the existing investment advisory agreement and other arrangements with the Fund.
In connection with their contract review meetings, the Trustees received and relied upon materials that included, among other items: (i) information provided by Lipper Inc., an independent third party, on the investment performance of the Fund for various time periods ended December 31, 2010 and the investment performance of a group of funds with substantially similar investment classifications/objectives (the “Lipper performance universe”), (ii) information provided by Lipper Inc. on the Fund’s advisory fees and other expenses and the advisory fees and other expenses of comparable funds identified by Lipper Inc. (the “Lipper expense group”), (iii) information provided by MFS on the advisory fees of comparable portfolios of other clients of MFS, including institutional separate accounts and other clients, (iv) information as to whether and to what extent applicable expense waivers,
40
Board Review of Investment Advisory Agreement – continued
reimbursements or fee “breakpoints” are observed for the Fund, (v) information regarding MFS’ financial results and financial condition, including MFS’ and certain of its affiliates’ estimated profitability from services performed for the Fund and the MFS Funds as a whole, and compared to MFS’ institutional business, (vi) MFS’ views regarding the outlook for the mutual fund industry and the strategic business plans of MFS, (vii) descriptions of various functions performed by MFS for the Funds, such as compliance monitoring and portfolio trading practices, and (viii) information regarding the overall organization of MFS, including information about MFS’ senior management and other personnel providing investment advisory, administrative and other services to the Fund and the other MFS Funds. The comparative performance, fee and expense information prepared and provided by Lipper Inc. was not independently verified and the independent Trustees did not independently verify any information provided to them by MFS.
The Trustees’ conclusion as to the continuation of the investment advisory agreement was based on a comprehensive consideration of all information provided to the Trustees and not the result of any single factor. Some of the factors that figured particularly in the Trustees’ deliberations are described below, although individual Trustees may have evaluated the information presented differently from one another, giving different weights to various factors. It is also important to recognize that the fee arrangements for the Fund and other MFS Funds are the result of years of review and discussion between the independent Trustees and MFS, that certain aspects of such arrangements may receive greater scrutiny in some years than in others, and that the Trustees’ conclusions may be based, in part, on their consideration of these same arrangements during the course of the year and in prior years.
Based on information provided by Lipper Inc., the Trustees reviewed the Fund’s total return investment performance as well as the performance of peer groups of funds over various time periods. The Trustees placed particular emphasis on the total return performance of the Fund’s Class A shares in comparison to the performance of funds in its Lipper performance universe over the three-year period ended December 31, 2010, which the Trustees believed was a long enough period to reflect differing market conditions. The total return performance of the Fund’s Class A shares was in the 4th quintile relative to the other funds in the universe for this three-year period (the 1st quintile being the best performers and the 5th quintile being the worst performers). The total return performance of the Fund’s Class A shares was in the 4th quintile for the one-year period and the 2nd quintile for the five-year period ended December 31, 2010 relative to the Lipper performance universe. Because of the passage of time, these performance results are likely to differ
41
Board Review of Investment Advisory Agreement – continued
from the performance results for more recent periods, including those shown elsewhere in this report.
The Trustees expressed concern to MFS about the substandard investment performance of the Fund. In the course of their deliberations, the Trustees took into account information provided by MFS in connection with the contract review meetings, as well as during investment review meetings conducted with portfolio management personnel during the course of the year, as to MFS’ efforts to improve the Fund’s performance. In addition, the Trustees requested that they receive a separate update on the Fund’s performance at each of their regular meetings. After reviewing these and related factors, the Trustees concluded, within the context of their overall conclusions regarding the investment advisory agreement, that MFS’ responses and efforts and plans to improve investment performance were sufficient to support approval of the continuance of the investment advisory agreement for an additional one-year period, but that they would continue to closely monitor the performance of the Fund.
In assessing the reasonableness of the Fund’s advisory fee, the Trustees considered, among other information, the Fund’s advisory fee and the total expense ratio of the Fund’s Class A shares as a percentage of average daily net assets and the advisory fee and total expense ratios of peer groups of funds based on information provided by Lipper Inc. The Trustees considered that MFS Fund Distributors, Inc. (“MFD”), an affiliate of MFS, currently observes a Class A 12b-1 fee waiver, which may not be changed without the Trustees’ approval. The Trustees also considered that, according to the Lipper data (which takes into account any fee reductions or expense limitations that were in effect during the Fund’s last fiscal year), the Fund’s effective advisory fee rate and total expense ratio were each lower than the Lipper expense group median.
The Trustees also considered the advisory fees charged by MFS to institutional accounts. In comparing these fees, the Trustees considered information provided by MFS as to the generally broader scope of services provided by MFS to the Fund in comparison to institutional accounts, the higher demands placed on MFS’ investment personnel and trading infrastructure as a result of the daily cash in-flows and out-flows of the Fund, and the impact on MFS and expenses associated with the more extensive regulatory regime to which the Fund is subject in comparison to institutional accounts.
The Trustees also considered whether the Fund is likely to benefit from any economies of scale in the management of the Fund in the event of growth in assets of the Fund. They noted that the Fund’s advisory fee rate schedule is not subject to any breakpoints. Taking into account that the Fund’s effective advisory fee rate was lower than the Lipper expense group median described above, the Trustees determined not to recommend any advisory fee breakpoints for the Fund at this time.
42
Board Review of Investment Advisory Agreement – continued
The Trustees also considered information prepared by MFS relating to MFS’ costs and profits with respect to the Fund, the MFS Funds considered as a group, and other investment companies and accounts advised by MFS, as well as MFS’ methodologies used to determine and allocate its costs to the MFS Funds, the Fund and other accounts and products for purposes of estimating profitability.
After reviewing these and other factors described herein, the Trustees concluded, within the context of their overall conclusions regarding the investment advisory agreement, that the advisory fees charged to the Fund represent reasonable compensation in light of the services being provided by MFS to the Fund.
In addition, the Trustees considered MFS’ resources and related efforts to continue to retain, attract and motivate capable personnel to serve the Fund. The Trustees also considered current and developing conditions in the financial services industry, including the presence of large and well-capitalized companies which are spending, and appear to be prepared to continue to spend, substantial sums to engage personnel and to provide services to competing investment companies. In this regard, the Trustees also considered the financial resources of MFS and its ultimate parent, Sun Life Financial Inc. The Trustees also considered the advantages and possible disadvantages to the Fund of having an adviser that also serves other investment companies as well as other accounts.
The Trustees also considered the nature, quality, cost, and extent of administrative, transfer agency, and distribution services provided to the Fund by MFS and its affiliates under agreements and plans other than the investment advisory agreement, including any 12b-1 fees the Fund pays to MFD. The Trustees also considered the nature, extent and quality of certain other services MFS performs or arranges for on the Fund’s behalf, which may include securities lending programs, directed expense payment programs, class action recovery programs, and MFS’ interaction with third-party service providers, principally custodians and sub-custodians. The Trustees concluded that the various non-advisory services provided by MFS and its affiliates on behalf of the Fund were satisfactory.
The Trustees also considered benefits to MFS from the use of the Fund’s portfolio brokerage commissions, if applicable, to pay for investment research, and various other factors. Additionally, the Trustees considered so-called “fall-out benefits” to MFS such as reputational value derived from serving as investment manager to the Fund.
Based on their evaluation of factors that they deemed to be material, including those factors described above, the Board of Trustees, including a majority of the independent Trustees, concluded that the Fund’s investment advisory
43
Board Review of Investment Advisory Agreement – continued
agreement with MFS should be continued for an additional one-year period, commencing August 1, 2011.
A discussion regarding the Board’s most recent review and renewal of the fund’s Investment Advisory Agreement with MFS will be available on or about November 1, 2011 by clicking on the fund’s name under “Mutual Funds” in the “Products and Performance” section of the MFS Web site (mfs.com).
44
PROXY VOTING POLICIES AND INFORMATION
A general description of the MFS funds’ proxy voting policies and procedures is available without charge, upon request, by calling 1-800-225-2606, by visiting the Proxy Voting section of mfs.com or by visiting the SEC’s Web site at http://www.sec.gov.
Information regarding how the fund voted proxies relating to portfolio securities during the most recent twelve-month period ended June 30 is available without charge by visiting the Proxy Voting section of mfs.com or by visiting the SEC’s Web site at http://www.sec.gov.
QUARTERLY PORTFOLIO DISCLOSURE
The fund will file a complete schedule of portfolio holdings with the Securities and Exchange Commission (the Commission) for the first and third quarters of each fiscal year on Form N-Q. The fund’s Form N-Q may be reviewed and copied at the:
Public Reference Room
Securities and Exchange Commission
100 F Street, NE, Room 1580
Washington, D.C. 20549
Information on the operation of the Public Reference Room may be obtained by calling the Commission at 1-800-SEC-0330. The fund’s Form N-Q is available on the EDGAR database on the Commission’s Internet Web site at http://www.sec.gov, and copies of this information may be obtained, upon payment of a duplicating fee, by electronic request at the following e-mail address: publicinfo@sec.gov or by writing the Public Reference Section at the above address.
A shareholder can also obtain the quarterly portfolio holdings report at mfs.com.
FURTHER INFORMATION
From time to time, MFS may post important information about the fund or the MFS funds on the MFS web site (mfs.com). This information is available by visiting the “News & Commentary” section of mfs.com or by clicking on the fund’s name under “Mutual Funds” in the “Products and Performance” section of mfs.com.
FEDERAL TAX INFORMATION (unaudited)
The fund will notify shareholders of amounts for use in preparing 2011 income tax forms in January 2012.
45
rev. 3/11
| | | | |
| FACTS | | WHAT DOES MFS DO WITH YOUR PERSONAL INFORMATION? | |  |
| | |
| Why? | | Financial companies choose how they share your personal information. Federal law gives consumers the right to limit some but not all sharing. Federal law also requires us to tell you how we collect, share, and protect your personal information. Please read this notice carefully to understand what we do. |
| | |
| What? | | The types of personal information we collect and share depend on the product or service you have with us. This information can include: •Social Security number and account balances •Account transactions and transaction history •Checking account information and wire transfer instructions When you are no longer our customer, we continue to share your information as described in this notice. |
| | |
| How? | | All financial companies need to share customers’ personal information to run their everyday business. In the section below, we list the reasons financial companies can share their customers’ personal information; the reasons MFS chooses to share; and whether you can limit this sharing. |
| | | | |
| Reasons we can share your personal information | | Does MFS share? | | Can you limit
this sharing? |
For our everyday business purposes – such as to process your transactions, maintain your account(s), respond to court orders and legal investigations, or report to credit bureaus | | Yes | | No |
For our marketing purposes – to offer our products and services to you | | No | | We don’t share |
| For joint marketing with other financial companies | | No | | We don’t share |
For our affiliates’ everyday business purposes – information about your transactions and experiences | | No | | We don’t share |
For our affiliates’ everyday business purposes – information about your creditworthiness | | No | | We don’t share |
| For nonaffiliates to market to you | | No | | We don’t share |
| | |
| Questions? | | Call 800-225-2606 or go to mfs.com. |
46
| | |
| Who we are |
| Who is providing this notice? | | MFS Funds, MFS Investment Management, MFS Institutional Advisors, Inc., MFS Fund Distributors, Inc., MFS Heritage Trust Company, and MFS Service Center, Inc. |
| | |
| What we do |
| How does MFS protect my personal information? | | To protect your personal information from unauthorized access and use, we use security measures that comply with federal law. These measures include procedural, electronic, and physical safeguards for the protection of the personal information we collect about you. |
How does MFS
collect my personal information? | | We collect your personal information, for example, when you •open an account or provide account information •direct us to buy securities or direct us to sell your securities •make a wire transfer We also collect your personal information from others, such as credit bureaus, affiliates and other companies. |
| Why can’t I limit all sharing? | | Federal law gives you the right to limit only •sharing for affiliates’ everyday business purposes – information about your creditworthiness •affiliates from using your information to market to you •sharing for nonaffiliates to market to you State laws and individual companies may give you additional rights to limit sharing. |
| | |
| Definitions |
| Affiliates | | Companies related by common ownership or control. They can be financial and nonfinancial companies. •MFS does not share personal information with affiliates, except for everyday business purposes as described on page one of this notice. |
| Nonaffiliates | | Companies not related by common ownership or control. They can be financial and nonfinancial companies. •MFS does not share with nonaffiliates so they can market to you. |
| Joint Marketing | | A formal agreement between nonaffiliated financial companies that together market financial products or services to you. •MFS doesn’t jointly market. |
| | |
| Other important information |
| If you own an MFS product or receive an MFS service in the name of a third party such as a bank or broker-dealer, their privacy policy may apply to you instead of ours. |
47
Save paper with eDelivery.
MFS® will send you prospectuses, reports, and proxies directly via e-mail so you will get information faster with less mailbox clutter.
To sign up:
1. Go to mfs.com.
2. Log in via MFS® Access.
3. Select eDelivery.
If you own your MFS fund shares through a financial institution or a retirement plan, MFS® TALK, MFS® Access, or eDelivery may not be available to you.

Web site
mfs.com
MFS TALK
1-800-637-8255
24 hours a day
Account service and literature
Shareholders
1-800-225-2606
Financial advisors
1-800-343-2829
Retirement plan services
1-800-637-1255
Mailing address
MFS Service Center, Inc.
P.O. Box 55824
Boston, MA 02205-5824
Overnight mail
MFS Service Center, Inc.
c/o Boston Financial Data Services
30 Dan Road
Canton, MA 02021-2809

MFS® Core Equity Fund

ANNUAL REPORT
August 31, 2011
RGI-ANN
MFS® CORE EQUITY FUND
SIPC Contact Information: You may obtain information about the Securities Investor Protection Corporation (“SIPC”), including the SIPC Brochure, by contacting SIPC either by telephone (1-202-371-8300) or by accessing SIPC’s web site address (www.sipc.org).
The report is prepared for the general information of shareholders.
It is authorized for distribution to prospective investors only when preceded or accompanied by a current prospectus.
NOT FDIC INSURED Ÿ MAY LOSE VALUE Ÿ NO BANK GUARANTEE

LETTER FROM THE CEO
Dear Shareholders:
We are indeed living through some volatile times. Economic uncertainty is everywhere, as it seems no place in the world has been unmoved by crisis this year. We have seen a devastating earthquake and tsunami that have led to disruptions in the Japanese markets and supply chains. Protests have changed the face of the Middle East and left in their wake lingering tensions and resultant higher oil prices. We have seen debt limits tested in Europe and the United States and policymakers grappling to craft often unpopular monetary and fiscal responses at a time when consumers and businesses struggle with what appears to be a slowing global economy. On top of all of that, we have seen long-term U.S. debt lose its Standard & Poor’s AAA rating.
When markets become volatile, managing risk becomes a top priority for investors and their advisors. At MFS® risk management is foremost in our minds in all market climates. Our analysts and portfolio managers keep risks firmly in mind when evaluating securities. Additionally, we have a team of quantitative analysts that measures and assesses the risk profiles of our portfolios and securities on an ongoing basis. The chief investment risk officer, who oversees the team, reports directly to the firm’s president and chief investment officer so the risk associated with each portfolio can be assessed objectively and independently of the portfolio management team.
As always, we continue to be mindful of the many economic challenges faced at the local, national, and international levels. It is in times such as these that we want to remind investors of the merits of maintaining a long-term view, adhering to basic investing principles such as asset allocation and diversification, and working closely with their advisors to research and identify appropriate investment opportunities.
Respectfully,

Robert J. Manning
Chairman and Chief Executive Officer
MFS Investment Management®
October 17, 2011
The opinions expressed in this letter are subject to change, may not be relied upon for investment advice, and no forecasts can be guaranteed.
1
PORTFOLIO COMPOSITION
Portfolio structure

| | | | |
| Top ten holdings | | | | |
| Apple, Inc. | | | 4.0% | |
| Exxon Mobil Corp. | | | 3.0% | |
| JPMorgan Chase & Co. | | | 2.1% | |
| Danaher Corp. | | | 2.1% | |
| Fluor Corp. | | | 1.8% | |
| Chevron Corp. | | | 1.7% | |
| Abbott Laboratories | | | 1.7% | |
| Target Corp. | | | 1.7% | |
| International Business Machines Corp. | | | 1.6% | |
| Johnson & Johnson | | | 1.5% | |
| | | | |
| Equity sectors | | | | |
| Technology (s) | | | 15.3% | |
| Financial Services | | | 15.3% | |
| Health Care | | | 11.7% | |
| Energy | | | 11.2% | |
| Industrial Goods & Services | | | 8.8% | |
| Consumer Staples | | | 7.6% | |
| Retailing | | | 6.9% | |
| Utilities & Communications | | | 6.5% | |
| Leisure | | | 5.7% | |
| Basic Materials | | | 3.5% | |
| Special Products & Services | | | 2.7% | |
| Transportation | | | 2.1% | |
| Autos & Housing | | | 1.3% | |
| (s) | Equity sector includes securities sold short. |
Percentages are based on net assets as of 8/31/11.
The portfolio is actively managed and current holdings may be different.
2
MANAGEMENT REVIEW
Summary of Results
For the twelve months ended August 31, 2011, Class A shares of the MFS Core Equity Fund (the “fund”) provided a total return of 18.39%, at net asset value. This compares with a return of 19.30% for the fund’s benchmark, the Russell 3000 Index.
Market Environment
Early in the period, the U.S. Federal Reserve (the Fed) indicated that further monetary loosening would be forthcoming if macroeconomic activity did not show signs of improvement. The prospects for, and subsequent implementation of, more easing by the Fed improved market sentiment and drove risk-asset prices markedly higher. The December agreement on a surprisingly large (relative to expectations) expansionary U.S. fiscal package also boosted sentiment. During the subsequent several months, the renewed positive market sentiment, coupled with better indications of global macroeconomic activity, pushed many asset valuations to post-crisis highs. At the same time, global sovereign bond yields rose amidst the more “risk-seeking” environment.
However, towards the middle of the period, a weakening macroeconomic backdrop and renewed concerns over Greek debt sustainability began to challenge equity valuations and pushed sovereign bond yields lower. Towards the end of the reporting period, uncertainty in financial markets continued to increase. European policy makers debated and disagreed over elements of a new Greek bailout package, while Spanish and Italian bond yields increased markedly signaling a widening European crisis. In the U.S., concerns about sovereign debt default and the long term sustainability of the trend in U.S. fiscal policy resulted in one agency downgrading U.S. credit quality. Amidst this turmoil, global equity markets declined sharply. As a result of these developments, global consumer and producer sentiment indicators fell precipitously, highly-rated sovereign bond yields hit multi-decade lows and, despite a more mixed picture emanating from the “hard” data, markets grew increasingly worried about a return to global recession.
Detractors from Performance
Stock selection in the health care and technology sectors was a major detractor from performance relative to the benchmark. The fund’s holdings of generic drug manufacturer Teva Pharmaceutical Industries (b) (Israel) held back relative performance within the health care sector. In the technology sector, the fund’s short position in semiconductor and passive electronic components vendor Vishay Intertech (h) weakened relative performance. Holdings of solar electric power modules manufacturer First Solar (h), and the timing of the fund’s
3
Management Review – continued
ownership in shares of fiber optics manufacturer Finisar, were other top relative detractors within this sector. Shares of Vishay Intertech soared throughout the second half of 2010 and first half of 2011 due to a favorable business environment which lead to increased sales. The combination of improved sales and lowered operating expenses allowed the firm to report pre-crisis level earnings and record-level free cash flow and engage in share repurchases throughout this period.
Security selection in the consumer staples, autos & housing and transportation sectors were other notable detractors from the fund’s relative underperformance. Within the consumer staples sector, the fund’s overweight holdings of cosmetics and beauty supply company Avon Products, and the timing of ownership in shares of diversified consumer products company Colgate-Palmolive (h), weakened relative performance. Shares of Avon Products declined significantly after the company reported disappointing earnings for the third quarter of 2010 and second quarter of 2011 primarily due to lower-than-expected organic revenue growth.
In the autos & housing sector, the fund’s holdings of global automaker General Motors, which underperformed during the reporting period, detracted from relative performance. In the transportation sector, the fund’s holdings of marine fuel logistics company Aegean Marine Petroleum Network (b)(h) (Greece) also dampened relative results. The company posted disappointing consolidated results for the third quarter 2010 due to lower tanker volume and greater oil supply resulting in heightened pricing pressure. The market’s reaction to the results appeared to have been reflected in the stock’s poor performance for the remainder of the period.
Elsewhere, the fund’s holdings of real estate company Entertainment Properties (h) were also among the top relative detractors.
The fund’s cash position held back relative performance. The fund holds cash to buy new holdings and to provide liquidity. In a period when equity markets rose, as measured by the fund’s benchmark, holding cash hurt performance versus the benchmark, which has no cash position.
Contributors to Performance
Stock selection in the industrial goods & services sector was a positive factor for performance relative to the benchmark. Holdings of electrical products manufacturer Sensata Technologies (b) (The Netherlands) and project management provider Fluor Corp. were among the fund’s top relative contributors. Shares of Sensata Technologies rose significantly throughout the reporting period due to increased demand, particularly from the auto industry, which resulted in better-than-expected organic revenue growth.
4
Management Review – continued
Stock selection in the financial services and basic materials sectors was another significant factor that contributed positively to relative performance. Within the financial services sector, the fund’s ownership in consumer bank Cathay General Bancorp (h), and not owning shares of poor-performing insurance and investment firm Berkshire Hathaway, helped relative performance.
In the basic materials sector, holdings of chemical manufacturer Celanese Corp. and containers manufacturer Graham Packaging (h) aided relative results. Celanese Corp. reported improved revenue and earnings growth throughout most of the period. The company engaged in share repurchases and increased its dividends, which positively impacted the stock’s performance for the period.
Stocks in other sectors that benefited relative performance included computer and personal electronics maker Apple, oilfield services provider Halliburton, and clothing retailer Abercrombie and Fitch (h). Not owning pharmaceutical company Merck & Co. also helped relative performance as the stock underperformed the benchmark.
Respectfully,
Joseph MacDougall
Portfolio Manager
| (b) | Security is not a benchmark constituent. |
| (h) | Security was not held in the portfolio at period end. |
Note to Shareholders: Katrina Mead is no longer a co-manager of the fund.
The views expressed in this report are those of the portfolio manager only through the end of the period of the report as stated on the cover and do not necessarily reflect the views of MFS or any other person in the MFS organization. These views are subject to change at any time based on market or other conditions, and MFS disclaims any responsibility to update such views. These views may not be relied upon as investment advice or an indication of trading intent on behalf of any MFS portfolio. References to specific securities are not recommendations of such securities, and may not be representative of any MFS portfolio’s current or future investments.
5
PERFORMANCE SUMMARY THROUGH 8/31/11
The following chart illustrates a representative class of the fund’s historical performance in comparison to its benchmark(s). Performance results include the deduction of the maximum applicable sales charge and reflect the percentage change in net asset value, including reinvestment of dividends and capital gains distributions. The performance of other share classes will be greater than or less than that of the class depicted below. Benchmarks are unmanaged and may not be invested in directly. Benchmark returns do not reflect sales charges, commissions or expenses. (See Notes to Performance Summary.)
Performance data shown represents past performance and is no guarantee of future results. Investment return and principal value fluctuate so your shares, when sold, may be worth more or less than the original cost; current performance may be lower or higher than quoted. The performance shown does not reflect the deduction of taxes, if any, that a shareholder would pay on fund distributions or the redemption of fund shares.
Growth of a Hypothetical $10,000 Investment
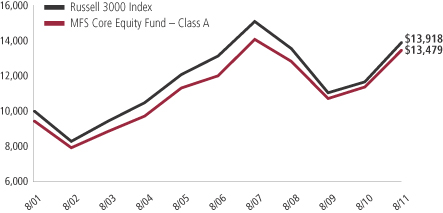
6
Performance Summary – continued
Total Returns through 8/31/11
Average annual without sales charge
| | | | | | | | | | | | | | |
| | | Share class | | Class inception date | | 1-yr | | 5-yr | | 10-Yr | | Life (t) | | |
| | | A | | 1/02/96 | | 18.39% | | 2.31% | | 3.64% | | N/A | | |
| | | B | | 1/02/97 | | 17.48% | | 1.59% | | 2.95% | | N/A | | |
| | | C | | 1/02/97 | | 17.55% | | 1.60% | | 2.95% | | N/A | | |
| | | I | | 1/02/97 | | 18.73% | | 2.62% | | 3.99% | | N/A | | |
| | | R1 | | 4/01/05 | | 17.56% | | 1.58% | | N/A | | 2.79% | | |
| | | R2 | | 10/31/03 | | 18.14% | | 2.07% | | N/A | | 4.66% | | |
| | | R3 | | 4/01/05 | | 18.38% | | 2.32% | | N/A | | 3.55% | | |
| | | R4 | | 4/01/05 | | 18.68% | | 2.56% | | N/A | | 3.81% | | |
| Comparative benchmark | | | | | | | | | | |
| | | Russell 3000 Index (f) | | 19.30% | | 1.14% | | 3.36% | | N/A | | |
| Average annual with sales charge | | | | | | | | | | |
| | | A
With Initial Sales Charge (5.75%) | | 11.58% | | 1.11% | | 3.03% | | N/A | | |
| | | B
With CDSC (Declining over six years from 4% to 0%) (x) | | 13.48% | | 1.24% | | 2.95% | | N/A | | |
| | | C
With CDSC (1% for 12 months) (x) | | 16.55% | | 1.60% | | 2.95% | | N/A | | |
Class I, R1, R2, R3, and R4 shares do not have a sales charge.
CDSC – Contingent Deferred Sales Charge.
| (f) | Source: FactSet Research Systems Inc. |
| (t) | For the period from the class inception date through the stated period end (for those share classes with less than 10 years of performance history). No comparative benchmark performance information is provided for “life” periods. (See Notes to Performance Summary.) |
| (x) | Assuming redemption at the end of the applicable period. |
Benchmark Definition
Russell 3000 Index – constructed to provide a comprehensive barometer for the 3,000 largest U.S. companies based on total market capitalization, which represents approximately 98% of the investable U.S. equity market.
It is not possible to invest directly in an index.
7
Performance Summary – continued
Notes to Performance Summary
Average annual total return represents the average annual change in value for each share class for the periods presented. Life returns are presented where the share class has less than 10 years of performance history and represent the average annual total return from the class inception date to the stated period end date. As the fund’s share classes may have different inception dates, the life returns may represent different time periods and may not be comparable. As a result, no comparative benchmark performance information is provided for life periods.
Performance results reflect any applicable expense subsidies and waivers in effect during the periods shown. Without such subsidies and waivers the fund’s performance results would be less favorable. Please see the prospectus and financial statements for complete details.
Performance results do not include adjustments made for financial reporting purposes in accordance with U.S. generally accepted accounting principles and may differ from amounts reported in the financial highlights.
From time to time the fund may receive proceeds from litigation settlements, without which performance would be lower.
8
EXPENSE TABLE
Fund expenses borne by the shareholders during the period,
March 1, 2011 through August 31, 2011
As a shareholder of the fund, you incur two types of costs: (1) transaction costs, including sales charges (loads) on certain purchase or redemption payments, and (2) ongoing costs, including management fees; distribution and service (12b-1) fees; and other fund expenses. This example is intended to help you understand your ongoing costs (in dollars) of investing in the fund and to compare these costs with the ongoing costs of investing in other mutual funds.
The example is based on an investment of $1,000 invested at the beginning of the period and held for the entire period March 1, 2011 through August 31, 2011.
Actual Expenses
The first line for each share class in the following table provides information about actual account values and actual expenses. You may use the information in this line, together with the amount you invested, to estimate the expenses that you paid over the period. Simply divide your account value by $1,000 (for example, an $8,600 account value divided by $1,000 = 8.6), then multiply the result by the number in the first line under the heading entitled “Expenses Paid During Period” to estimate the expenses you paid on your account during this period.
Hypothetical Example for Comparison Purposes
The second line for each share class in the following table provides information about hypothetical account values and hypothetical expenses based on the fund’s actual expense ratio and an assumed rate of return of 5% per year before expenses, which is not the fund’s actual return. The hypothetical account values and expenses may not be used to estimate the actual ending account balance or expenses you paid for the period. You may use this information to compare the ongoing costs of investing in the fund and other funds. To do so, compare this 5% hypothetical example with the 5% hypothetical examples that appear in the shareholder reports of the other funds.
Please note that the expenses shown in the table are meant to highlight your ongoing costs only and do not reflect any transactional costs, such as sales charges (loads). Therefore, the second line for each share class in the table is useful in comparing ongoing costs only, and will not help you determine the relative total costs of owning different funds. In addition, if these transactional costs were included, your costs would have been higher.
9
Expense Table – continued
| | | | | | | | | | | | | | | | | | |
Share
Class | | | | Annualized
Expense Ratio | | | Beginning
Account Value
3/01/11 | | | Ending Account Value
8/31/11 | | | Expenses Paid During
Period (p) 3/01/11-8/31/11 | |
| A | | Actual | | | 1.16% | | | | $1,000.00 | | | | $925.73 | | | | $5.63 | |
| | Hypothetical (h) | | | 1.16% | | | | $1,000.00 | | | | $1,019.36 | | | | $5.90 | |
| B | | Actual | | | 1.91% | | | | $1,000.00 | | | | $922.63 | | | | $9.26 | |
| | Hypothetical (h) | | | 1.91% | | | | $1,000.00 | | | | $1,015.58 | | | | $9.70 | |
| C | | Actual | | | 1.91% | | | | $1,000.00 | | | | $922.63 | | | | $9.26 | |
| | Hypothetical (h) | | | 1.91% | | | | $1,000.00 | | | | $1,015.58 | | | | $9.70 | |
| I | | Actual | | | 0.91% | | | | $1,000.00 | | | | $927.02 | | | | $4.42 | |
| | Hypothetical (h) | | | 0.91% | | | | $1,000.00 | | | | $1,020.62 | | | | $4.63 | |
| R1 | | Actual | | | 1.91% | | | | $1,000.00 | | | | $922.54 | | | | $9.26 | |
| | Hypothetical (h) | | | 1.91% | | | | $1,000.00 | | | | $1,015.58 | | | | $9.70 | |
| R2 | | Actual | | | 1.41% | | | | $1,000.00 | | | | $924.85 | | | | $6.84 | |
| | Hypothetical (h) | | | 1.41% | | | | $1,000.00 | | | | $1,018.10 | | | | $7.17 | |
| R3 | | Actual | | | 1.16% | | | | $1,000.00 | | | | $925.57 | | | | $5.63 | |
| | Hypothetical (h) | | | 1.16% | | | | $1,000.00 | | | | $1,019.36 | | | | $5.90 | |
| R4 | | Actual | | | 0.90% | | | | $1,000.00 | | | | $927.20 | | | | $4.37 | |
| | Hypothetical (h) | | | 0.90% | | | | $1,000.00 | | | | $1,020.67 | | | | $4.58 | |
| (h) | 5% class return per year before expenses. |
| (p) | Expenses paid is equal to each class’ annualized expense ratio, as shown above, multiplied by the average account value over the period, multiplied by the number of days in the period, divided by the number of days in the year. Expenses paid do not include any applicable sales charges (loads). If these transaction costs had been included, your costs would have been higher. |
10
PORTFOLIO OF INVESTMENTS
8/31/11
The Portfolio of Investments is a complete list of all securities owned by your fund. It is categorized by broad-based asset classes.
| | | | | | | | |
| Common Stocks - 98.2% | | | | | | | | |
| Issuer | | Shares/Par | | | Value ($) | |
| | | | | | | | |
| Aerospace - 2.5% | | | | | | | | |
| Boeing Co. | | | 25,620 | | | $ | 1,712,953 | |
| Goodrich Corp. | | | 28,970 | | | | 2,583,545 | |
| Honeywell International, Inc. | | | 98,200 | | | | 4,694,942 | |
| Precision Castparts Corp. | | | 22,700 | | | | 3,719,395 | |
| Textron, Inc. | | | 77,500 | | | | 1,307,425 | |
| United Technologies Corp. | | | 83,230 | | | | 6,179,826 | |
| | | | | | | | |
| | | | | | | $ | 20,198,086 | |
| Apparel Manufacturers - 0.9% | | | | | | | | |
| NIKE, Inc., “B” | | | 51,100 | | | $ | 4,427,815 | |
| PVH Corp. | | | 35,030 | | | | 2,335,100 | |
| | | | | | | | |
| | | | | | | $ | 6,762,915 | |
| Automotive - 0.8% | | | | | | | | |
| General Motors Co. (a) | | | 222,410 | | | $ | 5,344,512 | |
| LKQ Corp. (a) | | | 53,710 | | | | 1,374,976 | |
| | | | | | | | |
| | | | | | | $ | 6,719,488 | |
| Biotechnology - 1.6% | | | | | | | | |
| Amgen, Inc. | | | 126,440 | | | $ | 7,005,408 | |
| Anacor Pharmaceuticals, Inc. (a) | | | 185,150 | | | | 896,126 | |
| Gilead Sciences, Inc. (a) | | | 121,340 | | | | 4,839,646 | |
| | | | | | | | |
| | | | | | | $ | 12,741,180 | |
| Broadcasting - 1.9% | | | | | | | | |
| QuinStreet, Inc. (a) | | | 269,600 | | | $ | 3,251,376 | |
| Viacom, Inc., “B” | | | 107,390 | | | | 5,180,494 | |
| Walt Disney Co. | | | 200,690 | | | | 6,835,501 | |
| | | | | | | | |
| | | | | | | $ | 15,267,371 | |
| Brokerage & Asset Managers - 1.4% | | | | | | | | |
| Affiliated Managers Group, Inc. (a) | | | 16,064 | | | $ | 1,400,138 | |
| Blackrock, Inc. | | | 5,338 | | | | 879,436 | |
| Charles Schwab Corp. | | | 105,060 | | | | 1,295,390 | |
| CME Group, Inc. | | | 6,940 | | | | 1,853,813 | |
| Cowen Group, Inc. “A” (a) | | | 113,588 | | | | 395,286 | |
| Franklin Resources, Inc. | | | 21,460 | | | | 2,573,483 | |
| FXCM, Inc. “A” | | | 133,200 | | | | 1,557,108 | |
| GFI Group, Inc. | | | 271,290 | | | | 1,185,537 | |
| | | | | | | | |
| | | | | | | $ | 11,140,191 | |
11
Portfolio of Investments – continued
| | | | | | | | |
| Issuer | | Shares/Par | | | Value ($) | |
| | | | | | | | |
| Common Stocks - continued | | | | | | | | |
| Business Services - 1.7% | | | | | | | | |
| Accenture PLC, “A” | | | 57,370 | | | $ | 3,074,458 | |
| Automatic Data Processing, Inc. | | | 77,080 | | | | 3,856,312 | |
| FleetCor Technologies, Inc. (a) | | | 148,050 | | | | 4,206,101 | |
| Jones Lang LaSalle, Inc. | | | 41,070 | | | | 2,747,994 | |
| | | | | | | | |
| | | | | | | $ | 13,884,865 | |
| Cable TV - 1.2% | | | | | | | | |
| Comcast Corp., “Special A” | | | 237,370 | | | $ | 5,022,749 | |
| DIRECTV, “A” (a) | | | 97,730 | | | | 4,297,188 | |
| | | | | | | | |
| | | | | | | $ | 9,319,937 | |
| Chemicals - 0.5% | | | | | | | | |
| Celanese Corp. | | | 91,520 | | | $ | 4,302,355 | |
| | |
| Computer Software - 3.8% | | | | | | | | |
| Autodesk, Inc. (a) | | | 149,680 | | | $ | 4,220,976 | |
| Check Point Software Technologies Ltd. (a) | | | 89,180 | | | | 4,854,959 | |
| Oracle Corp. | | | 397,670 | | | | 11,162,597 | |
| Red Hat, Inc. (a) | | | 115,400 | | | | 4,562,916 | |
| Symantec Corp. (a) | | | 139,580 | | | | 2,393,797 | |
| VeriSign, Inc. | | | 105,730 | | | | 3,293,490 | |
| | | | | | | | |
| | | | | | | $ | 30,488,735 | |
| Computer Software - Systems - 7.0% | | | | | | | | |
| Apple, Inc. (a)(s) | | | 83,440 | | | $ | 32,110,215 | |
| EMC Corp. (a) | | | 413,850 | | | | 9,348,872 | |
| International Business Machines Corp. | | | 71,810 | | | | 12,344,857 | |
| NICE Systems Ltd., ADR (a) | | | 68,890 | | | | 2,150,057 | |
| | | | | | | | |
| | | | | | | $ | 55,954,001 | |
| Construction - 0.5% | | | | | | | | |
| Lennar Corp., “A” | | | 39,100 | | | $ | 574,770 | |
| Owens Corning (a) | | | 83,540 | | | | 2,427,672 | |
| Stanley Black & Decker, Inc. | | | 19,560 | | | | 1,212,329 | |
| | | | | | | | |
| | | | | | | $ | 4,214,771 | |
| Consumer Products - 1.0% | | | | | | | | |
| Avon Products, Inc. | | | 247,620 | | | $ | 5,586,307 | |
| Newell Rubbermaid, Inc. | | | 152,690 | | | | 2,113,230 | |
| | | | | | | | |
| | | | | | | $ | 7,699,537 | |
| Consumer Services - 1.0% | | | | | | | | |
| DeVry, Inc. | | | 54,470 | | | $ | 2,406,485 | |
| HomeAway, Inc. (a) | | | 45,720 | | | | 1,912,925 | |
| Priceline.com, Inc. (a) | | | 6,120 | | | | 3,288,031 | |
| | | | | | | | |
| | | | | | | $ | 7,607,441 | |
12
Portfolio of Investments – continued
| | | | | | | | |
| Issuer | | Shares/Par | | | Value ($) | |
| | | | | | | | |
| Common Stocks - continued | | | | | | | | |
| Containers - 0.5% | | | | | | | | |
| Silgan Holdings, Inc. | | | 112,090 | | | $ | 4,251,574 | |
| | |
| Electrical Equipment - 2.7% | | | | | | | | |
| AMETEK, Inc. | | | 42,560 | | | $ | 1,663,245 | |
| Danaher Corp. | | | 359,350 | | | | 16,461,824 | |
| Sensata Technologies Holding B.V. (a) | | | 114,740 | | | | 3,722,166 | |
| | | | | | | | |
| | | | | | | $ | 21,847,235 | |
| Electronics - 2.6% | | | | | | | | |
| Advanced Micro Devices, Inc. (a) | | | 839,355 | | | $ | 5,732,795 | |
| ASML Holding N.V. | | | 79,300 | | | | 2,796,911 | |
| Hittite Microwave Corp. (a) | | | 48,540 | | | | 2,636,693 | |
| Linear Technology Corp. | | | 53,620 | | | | 1,535,141 | |
| Microchip Technology, Inc. | | | 143,450 | | | | 4,708,029 | |
| Teradyne, Inc. (a) | | | 96,000 | | | | 1,161,600 | |
| Veeco Instruments, Inc. (a) | | | 49,070 | | | | 1,784,185 | |
| | | | | | | | |
| | | | | | | $ | 20,355,354 | |
| Energy - Independent - 3.7% | | | | | | | | |
| Apache Corp. | | | 39,980 | | | $ | 4,120,739 | |
| Arch Coal, Inc. | | | 44,410 | | | | 901,967 | |
| Brigham Exploration Co. (a) | | | 56,250 | | | | 1,636,875 | |
| Cabot Oil & Gas Corp. | | | 32,910 | | | | 2,496,553 | |
| Canadian Natural Resources Ltd. | | | 30,070 | | | | 1,136,107 | |
| CONSOL Energy, Inc. | | | 18,120 | | | | 827,359 | |
| Energy XXI (Bermuda) Ltd. (a) | | | 50,686 | | | | 1,358,892 | |
| Marathon Oil Corp. | | | 68,870 | | | | 1,853,980 | |
| Marathon Petroleum Corp. | | | 34,585 | | | | 1,281,720 | |
| Newfield Exploration Co. (a) | | | 32,180 | | | | 1,642,789 | |
| Noble Energy, Inc. | | | 40,380 | | | | 3,567,977 | |
| Occidental Petroleum Corp. | | | 81,780 | | | | 7,093,597 | |
| Peabody Energy Corp. | | | 19,960 | | | | 974,048 | |
| Walter Energy, Inc. | | | 8,960 | | | | 732,390 | |
| | | | | | | | |
| | | | | | | $ | 29,624,993 | |
| Energy - Integrated - 5.4% | | | | | | | | |
| Chevron Corp. | | | 139,780 | | | $ | 13,825,640 | |
| EQT Corp. | | | 30,190 | | | | 1,805,966 | |
| Exxon Mobil Corp. (s) | | | 320,552 | | | | 23,733,670 | |
| QEP Resources, Inc. | | | 100,260 | | | | 3,530,155 | |
| | | | | | | | |
| | | | | | | $ | 42,895,431 | |
13
Portfolio of Investments – continued
| | | | | | | | |
| Issuer | | Shares/Par | | | Value ($) | |
| | | | | | | | |
| Common Stocks - continued | | | | | | | | |
| Engineering - Construction - 1.8% | | | | | | | | |
| Fluor Corp. | | | 234,330 | | | $ | 14,228,518 | |
| | |
| Food & Beverages - 3.8% | | | | | | | | |
| Bunge Ltd. | | | 48,710 | | | $ | 3,152,024 | |
| Coca-Cola Enterprises, Inc. | | | 58,950 | | | | 1,628,199 | |
| General Mills, Inc. | | | 155,040 | | | | 5,877,566 | |
| Kraft Foods, Inc., “A” | | | 123,380 | | | | 4,320,768 | |
| Mead Johnson Nutrition Co., “A” | | | 85,770 | | | | 6,111,113 | |
| PepsiCo, Inc. | | | 142,939 | | | | 9,209,560 | |
| | | | | | | | |
| | | | | | | $ | 30,299,230 | |
| Food & Drug Stores - 1.0% | | | | | | | | |
| CVS Caremark Corp. | | | 186,480 | | | $ | 6,696,497 | |
| Whole Foods Market, Inc. | | | 14,500 | | | | 957,435 | |
| | | | | | | | |
| | | | | | | $ | 7,653,932 | |
| Gaming & Lodging - 0.8% | | | | | | | | |
| Carnival Corp. | | | 46,760 | | | $ | 1,544,483 | |
| Las Vegas Sands Corp. (a) | | | 65,340 | | | | 3,042,884 | |
| Marriott International, Inc., “A” | | | 54,020 | | | | 1,581,706 | |
| | | | | | | | |
| | | | | | | $ | 6,169,073 | |
| General Merchandise - 2.5% | | | | | | | | |
| Kohl’s Corp. | | | 144,240 | | | $ | 6,684,082 | |
| Target Corp. | | | 259,180 | | | | 13,391,831 | |
| | | | | | | | |
| | | | | | | $ | 20,075,913 | |
| Health Maintenance Organizations - 1.0% | | | | | | | | |
| Aetna, Inc. | | | 141,470 | | | $ | 5,663,044 | |
| WellPoint, Inc. | | | 30,290 | | | | 1,917,357 | |
| | | | | | | | |
| | | | | | | $ | 7,580,401 | |
| Insurance - 3.8% | | | | | | | | |
| ACE Ltd. | | | 175,580 | | | $ | 11,338,956 | |
| Aflac, Inc. | | | 16,460 | | | | 620,871 | |
| Aon Corp. | | | 122,860 | | | | 5,741,248 | |
| Chubb Corp. | | | 52,710 | | | | 3,262,222 | |
| Hartford Financial Services Group, Inc. | | | 87,490 | | | | 1,674,559 | |
| MetLife, Inc. | | | 111,040 | | | | 3,730,944 | |
| Prudential Financial, Inc. | | | 48,250 | | | | 2,422,633 | |
| Willis Group Holdings PLC | | | 41,580 | | | | 1,627,025 | |
| | | | | | | | |
| | | | | | | $ | 30,418,458 | |
| Internet - 1.2% | | | | | | | | |
| Google, Inc., “A” (a) | | | 17,850 | | | $ | 9,656,136 | |
14
Portfolio of Investments – continued
| | | | | | | | |
| Issuer | | Shares/Par | | | Value ($) | |
| | | | | | | | |
| Common Stocks - continued | | | | | | | | |
| Leisure & Toys - 0.1% | | | | | | | | |
| Hasbro, Inc. | | | 21,740 | | | $ | 842,208 | |
| | |
| Machinery & Tools - 1.3% | | | | | | | | |
| Flowserve Corp. | | | 32,380 | | | $ | 3,054,729 | |
| Joy Global, Inc. | | | 49,430 | | | | 4,124,933 | |
| WABCO Holdings, Inc. (a) | | | 59,420 | | | | 2,771,943 | |
| | | | | | | | |
| | | | | | | $ | 9,951,605 | |
| Major Banks - 4.0% | | | | | | | | |
| Bank of New York Mellon Corp. | | | 185,008 | | | $ | 3,824,115 | |
| Goldman Sachs Group, Inc. | | | 60,020 | | | | 6,975,524 | |
| JPMorgan Chase & Co. (s) | | | 451,160 | | | | 16,945,570 | |
| PNC Financial Services Group, Inc. | | | 54,950 | | | | 2,755,193 | |
| SunTrust Banks, Inc. | | | 71,150 | | | | 1,415,885 | |
| | | | | | | | |
| | | | | | | $ | 31,916,287 | |
| Medical & Health Technology & Services - 1.4% | | | | | | | | |
| AmerisourceBergen Corp. | | | 70,810 | | | $ | 2,802,660 | |
| Cross Country Healthcare, Inc. (a) | | | 508,660 | | | | 2,507,694 | |
| Henry Schein, Inc. (a) | | | 18,740 | | | | 1,235,153 | |
| Medco Health Solutions, Inc. (a) | | | 64,990 | | | | 3,518,559 | |
| Quest Diagnostics, Inc. | | | 13,940 | | | | 697,976 | |
| | | | | | | | |
| | | | | | | $ | 10,762,042 | |
| Medical Equipment - 2.8% | | | | | | | | |
| Becton, Dickinson & Co. | | | 39,450 | | | $ | 3,210,441 | |
| Covidien PLC | | | 100,840 | | | | 5,261,831 | |
| Heartware International, Inc. (a) | | | 25,900 | | | | 1,626,779 | |
| Medtronic, Inc. | | | 138,610 | | | | 4,861,053 | |
| NxStage Medical, Inc. (a) | | | 59,530 | | | | 1,094,757 | |
| NxStage Medical, Inc. (a) | | | 218,347 | | | | 4,015,401 | |
| Thermo Fisher Scientific, Inc. (a) | | | 45,660 | | | | 2,508,104 | |
| | | | | | | | |
| | | | | | | $ | 22,578,366 | |
| Metals & Mining - 0.9% | | | | | | | | |
| Cliffs Natural Resources, Inc. | | | 45,530 | | | $ | 3,772,161 | |
| Teck Resources Ltd., “B” | | | 83,400 | | | | 3,704,585 | |
| | | | | | | | |
| | | | | | | $ | 7,476,746 | |
| Natural Gas - Distribution - 0.3% | | | | | | | | |
| AGL Resources, Inc. | | | 49,480 | | | $ | 2,049,462 | |
| ONEOK, Inc. | | | 5,560 | | | | 394,204 | |
| | | | | | | | |
| | | | | | | $ | 2,443,666 | |
15
Portfolio of Investments – continued
| | | | | | | | |
| Issuer | | Shares/Par | | | Value ($) | |
| | | | | | | | |
| Common Stocks - continued | | | | | | | | |
| Natural Gas - Pipeline - 0.4% | | | | | | | | |
| Kinder Morgan, Inc. | | | 109,570 | | | $ | 2,832,383 | |
| | |
| Network & Telecom - 0.9% | | | | | | | | |
| Acme Packet, Inc. (a) | | | 38,870 | | | $ | 1,830,388 | |
| F5 Networks, Inc. (a) | | | 33,060 | | | | 2,698,357 | |
| Finisar Corp. (a) | | | 135,200 | | | | 2,495,792 | |
| | | | | | | | |
| | | | | | | $ | 7,024,537 | |
| Oil Services - 2.1% | | | | | | | | |
| Cameron International Corp. (a) | | | 91,640 | | | $ | 4,761,614 | |
| Dresser-Rand Group, Inc. (a) | | | 24,190 | | | | 1,026,866 | |
| FMC Technologies, Inc. (a) | | | 36,300 | | | | 1,613,898 | |
| Halliburton Co. | | | 41,470 | | | | 1,840,024 | |
| Schlumberger Ltd. | | | 98,760 | | | | 7,715,131 | |
| | | | | | | | |
| | | | | | | $ | 16,957,533 | |
| Other Banks & Diversified Financials - 3.7% | | | | | | | | |
| American Express Co. | | | 32,660 | | | $ | 1,623,529 | |
| BankUnited, Inc. | | | 70,530 | | | | 1,653,929 | |
| CapitalSource, Inc. | | | 206,980 | | | | 1,314,323 | |
| Citigroup, Inc. | | | 202,919 | | | | 6,300,635 | |
| Discover Financial Services | | | 46,820 | | | | 1,177,991 | |
| EuroDekania Ltd. (a)(z) | | | 580,280 | | | | 1,439,082 | |
| Fifth Third Bancorp | | | 269,560 | | | | 2,862,727 | |
| TCF Financial Corp. | | | 110,170 | | | | 1,150,175 | |
| Visa, Inc., “A” | | | 78,550 | | | | 6,902,974 | |
| Wintrust Financial Corp. | | | 62,310 | | | | 1,967,750 | |
| Zions Bancorporation | | | 174,060 | | | | 3,035,606 | |
| | | | | | | | |
| | | | | | | $ | 29,428,721 | |
| Pharmaceuticals - 4.9% | | | | | | | | |
| Abbott Laboratories | | | 258,680 | | | $ | 13,583,287 | |
| Hospira, Inc. (a) | | | 67,710 | | | | 3,128,202 | |
| Johnson & Johnson | | | 183,270 | | | | 12,059,166 | |
| Pfizer, Inc. | | | 319,746 | | | | 6,068,779 | |
| Teva Pharmaceutical Industries Ltd., ADR | | | 105,990 | | | | 4,383,746 | |
| | | | | | | | |
| | | | | | | $ | 39,223,180 | |
| Pollution Control - 0.5% | | | | | | | | |
| Republic Services, Inc. | | | 117,440 | | | $ | 3,565,478 | |
| | |
| Precious Metals & Minerals - 0.2% | | | | | | | | |
| Goldcorp, Inc. | | | 31,850 | | | $ | 1,653,652 | |
16
Portfolio of Investments – continued
| | | | | | | | |
| Issuer | | Shares/Par | | | Value ($) | |
| | | | | | | | |
| Common Stocks - continued | | | | | | | | |
| Printing & Publishing - 0.3% | | | | | | | | |
| Moody’s Corp. | | | 82,840 | | | $ | 2,553,957 | |
| | |
| Railroad & Shipping - 0.8% | | | | | | | | |
| Kansas City Southern Co. (a) | | | 110,920 | | | $ | 6,007,427 | |
| | |
| Real Estate - 2.4% | | | | | | | | |
| Mid-America Apartment Communities, Inc., REIT | | | 85,062 | | | $ | 6,080,232 | |
| Public Storage, Inc., REIT | | | 57,680 | | | | 7,136,746 | |
| Tanger Factory Outlet Centers, Inc., REIT | | | 213,990 | | | | 6,019,539 | |
| | | | | | | | |
| | | | | | | $ | 19,236,517 | |
| Restaurants - 1.4% | | | | | | | | |
| McDonald’s Corp. | | | 121,320 | | | $ | 10,974,607 | |
| | |
| Specialty Chemicals - 1.4% | | | | | | | | |
| Airgas, Inc. | | | 145,983 | | | $ | 9,471,377 | |
| Ferro Corp. (a) | | | 175,840 | | | | 1,471,781 | |
| | | | | | | | |
| | | | | | | $ | 10,943,158 | |
| Specialty Stores - 2.5% | | | | | | | | |
| Amazon.com, Inc. (a) | | | 34,640 | | | $ | 7,457,646 | |
| Dick’s Sporting Goods, Inc. (a) | | | 54,170 | | | | 1,902,992 | |
| PetSmart, Inc. | | | 98,860 | | | | 4,169,915 | |
| Tiffany & Co. | | | 35,110 | | | | 2,526,516 | |
| Urban Outfitters, Inc. (a) | | | 144,780 | | | | 3,789,617 | |
| | | | | | | | |
| | | | | | | $ | 19,846,686 | |
| Telecommunications - Wireless - 0.3% | | | | | | | | |
| SBA Communications Corp. (a) | | | 53,780 | | | $ | 2,032,346 | |
| | |
| Telephone Services - 2.6% | | | | | | | | |
| American Tower Corp., “A” (a) | | | 73,860 | | | $ | 3,978,100 | |
| AT&T, Inc. | | | 342,940 | | | | 9,766,931 | |
| CenturyLink, Inc. | | | 64,018 | | | | 2,314,251 | |
| Verizon Communications, Inc. | | | 123,920 | | | | 4,482,186 | |
| | | | | | | | |
| | | | | | | $ | 20,541,468 | |
| Tobacco - 2.8% | | | | | | | | |
| Altria Group, Inc. | | | 304,310 | | | $ | 8,274,189 | |
| Philip Morris International, Inc. | | | 140,150 | | | | 9,715,198 | |
| Reynolds American, Inc. | | | 108,210 | | | | 4,065,450 | |
| | | | | | | | |
| | | | | | | $ | 22,054,837 | |
17
Portfolio of Investments – continued
| | | | | | | | |
| Issuer | | Shares/Par | | | Value ($) | |
| | | | | | | | |
| Common Stocks - continued | | | | | | | | |
| Trucking - 1.3% | | | | | | | | |
| Atlas Air Worldwide Holdings, Inc. (a) | | | 34,860 | | | $ | 1,710,929 | |
| Expeditors International of Washington, Inc. | | | 123,770 | | | | 5,631,535 | |
| Swift Transportation Co. (a) | | | 336,640 | | | | 2,901,837 | |
| | | | | | | | |
| | | | | | | $ | 10,244,301 | |
| Utilities - Electric Power - 2.3% | | | | | | | | |
| AES Corp. (a) | | | 211,690 | | | $ | 2,298,953 | |
| American Electric Power Co., Inc. | | | 110,610 | | | | 4,272,864 | |
| Calpine Corp. (a) | | | 154,670 | | | | 2,278,289 | |
| CMS Energy Corp. | | | 170,367 | | | | 3,356,230 | |
| PG&E Corp. | | | 65,510 | | | | 2,774,345 | |
| Public Service Enterprise Group, Inc. | | | 104,072 | | | | 3,551,977 | |
| | | | | | | | |
| | | | | | | $ | 18,532,658 | |
| Total Common Stocks (Identified Cost, $761,339,887) | | | | | | $ | 780,981,487 | |
| | |
| Convertible Preferred Stocks - 0.6% | | | | | | | | |
| Utilities - Electric Power - 0.6% | | | | | | | | |
| PPL Corp., 9.5% | | | 45,860 | | | $ | 2,636,491 | |
| PPL Corp., 8.75% | | | 42,560 | | | | 2,328,032 | |
| Total Convertible Preferred Stocks (Identified Cost, $4,496,166) | | | $ | 4,964,523 | |
| | |
| Money Market Funds (v) - 1.1% | | | | | | | | |
MFS Institutional Money Market Portfolio, 0.08%,
at Cost and Net Asset Value | | | 8,313,349 | | | $ | 8,313,349 | |
| Total Investments (Identified Cost, $774,149,402) | | | | | | $ | 794,259,359 | |
| | |
| Securities Sold Short - (0.2)% | | | | | | | | |
| Electronics - (0.2)% | | | | | | | | |
| Cree, Inc. (Proceeds Received, $1,669,824) (a) | | | (53,619 | ) | | $ | (1,738,864 | ) |
| | |
| Other Assets, Less Liabilities - 0.3% | | | | | | | 2,635,374 | |
| Net Assets - 100.0% | | | | | | $ | 795,155,869 | |
| (a) | Non-income producing security. |
| (s) | Security or a portion of the security was pledged to cover collateral requirements for securities sold short. At August 31, 2011, the value of securities pledged amounted to $957,184. |
| (v) | Underlying affiliated fund that is available only to investment companies managed by MFS. The rate quoted is the annualized seven-day yield of the fund at period end. |
18
Portfolio of Investments – continued
| (z) | Restricted securities are not registered under the Securities Act of 1933 and are subject to legal restrictions on resale. These securities generally may be resold in transactions exempt from registration or to the public if the securities are subsequently registered. Disposal of these securities may involve time-consuming negotiations and prompt sale at an acceptable price may be difficult. The fund holds the following restricted securities: |
| | | | | | | | | | |
| Restricted Securities | | Acquisition
Date | | Cost | | | Value | |
| EuroDekania Ltd. | | 3/08/07-6/25/07 | | | $8,173,430 | | | | $1,439,082 | |
| % of Net assets | | | | | | | | | 0.2% | |
The following abbreviations are used in this report and are defined:
| ADR | | American Depository Receipt |
| PLC | | Public Limited Company |
| REIT | | Real Estate Investment Trust |
See Notes to Financial Statements
19
Financial Statements
STATEMENT OF ASSETS AND LIABILITIES
At 8/31/11
This statement represents your fund’s balance sheet, which details the assets and liabilities comprising the total value of the fund.
| | | | |
| Assets | | | | |
Investments- | | | | |
Non-affiliated issuers, at value (identified cost, $765,836,053) | | | $785,946,010 | |
Underlying affiliated funds, at cost and value | | | 8,313,349 | |
Total investments, at value (identified cost, $774,149,402) | | | $794,259,359 | |
Deposits with brokers | | | 2,015,953 | |
Receivables for | | | | |
Investments sold | | | 2,645,849 | |
Fund shares sold | | | 776,871 | |
Dividends | | | 1,289,419 | |
Other assets | | | 1,778 | |
Total assets | | | $800,989,229 | |
| Liabilities | | | | |
Payables for | | | | |
Securities sold short, at value (proceeds received, $1,669,824) | | | $1,738,864 | |
Investments purchased | | | 2,974,844 | |
Fund shares reacquired | | | 547,374 | |
Payable to affiliates | | | | |
Investment adviser | | | 27,221 | |
Shareholder servicing costs | | | 292,072 | |
Distribution and service fees | | | 15,499 | |
Payable for independent Trustees’ compensation | | | 120,785 | |
Accrued expenses and other liabilities | | | 116,701 | |
Total liabilities | | | $5,833,360 | |
Net assets | | | $795,155,869 | |
| Net assets consist of | | | | |
Paid-in capital | | | $952,681,190 | |
Unrealized appreciation (depreciation) on investments | | | 20,040,917 | |
Accumulated net realized gain (loss) on investments and foreign currency transactions | | | (181,509,826 | ) |
Undistributed net investment income | | | 3,943,588 | |
Net assets | | | $795,155,869 | |
Shares of beneficial interest outstanding | | | 46,811,460 | |
20
Statement of Assets and Liabilities – continued
| | | | | | | | | | | | |
| | | Net assets | | | Shares
outstanding | | | Net asset value
per share (a) | |
Class A | | | $612,503,526 | | | | 35,609,497 | | | | $17.20 | |
Class B | | | 49,181,359 | | | | 3,101,294 | | | | 15.86 | |
Class C | | | 62,248,712 | | | | 3,954,916 | | | | 15.74 | |
Class I | | | 17,249,933 | | | | 963,261 | | | | 17.91 | |
Class R1 | | | 3,904,428 | | | | 248,438 | | | | 15.72 | |
Class R2 | | | 16,423,621 | | | | 974,401 | | | | 16.86 | |
Class R3 | | | 32,276,993 | | | | 1,880,698 | | | | 17.16 | |
Class R4 | | | 1,367,297 | | | | 78,955 | | | | 17.32 | |
| (a) | Maximum offering price per share was equal to the net asset value per share for all share classes, except for Class A, for which the maximum offering price per share was $18.25 [100 / 94.25 x $17.20]. On sales of $50,000 or more, the maximum offering price of Class A shares is reduced. A contingent deferred sales charge may be imposed on redemptions of Class A, Class B, and Class C shares. Redemption price per share was equal to the net asset value per share for Classes I, R1, R2, R3, and R4. |
See Notes to Financial Statements
21
Financial Statements
STATEMENT OF OPERATIONS
Year ended 8/31/11
This statement describes how much your fund earned in investment income and accrued in expenses. It also describes any gains and/or losses generated by fund operations.
| | | | |
| Net investment income | | | | |
Income | | | | |
Dividends | | | $14,909,134 | |
Interest | | | 129,323 | |
Dividends from underlying affiliated funds | | | 7,339 | |
Foreign taxes withheld | | | (67,898 | ) |
Total investment income | | | $14,977,898 | |
Expenses | | | | |
Management fee | | | $5,145,344 | |
Distribution and service fees | | | 3,091,870 | |
Shareholder servicing costs | | | 2,053,173 | |
Administrative services fee | | | 126,259 | |
Independent Trustees’ compensation | | | 44,984 | |
Custodian fee | | | 100,233 | |
Shareholder communications | | | 82,051 | |
Auditing fees | | | 50,211 | |
Legal fees | | | 13,180 | |
Dividend and interest expense on securities sold short | | | 54,447 | |
Miscellaneous | | | 166,406 | |
Total expenses | | | $10,928,158 | |
Fees paid indirectly | | | (107 | ) |
Reduction of expenses by investment adviser | | | (3,733 | ) |
Net expenses | | | $10,924,318 | |
Net investment income | | | $4,053,580 | |
Realized and unrealized gain (loss) on investments
and foreign currency transactions | | | | |
Realized gain (loss) (identified cost basis)
Investment transactions | | | $70,779,100 | |
Written option transactions | | | 17,688 | |
Securities sold short | | | (3,157,063 | ) |
Foreign currency transactions | | | (396 | ) |
Net realized gain (loss) on investments
and foreign currency transactions | | | $67,639,329 | |
Change in unrealized appreciation (depreciation)
Investments | | | $60,584,431 | |
Securities sold short | | | (294,119 | ) |
Net unrealized gain (loss) on investments | | | $60,290,312 | |
Net realized and unrealized gain (loss) on investments | | | $127,929,641 | |
Change in net assets from operations | | | $131,983,221 | |
See Notes to Financial Statements
22
Financial Statements
STATEMENTS OF CHANGES IN NET ASSETS
These statements describe the increases and/or decreases in net assets resulting from operations, any distributions, and any shareholder transactions.
| | | | | | | | |
| | | Years ended 8/31 | |
| | | 2011 | | | 2010 | |
| Change in net assets | | | | | | |
| From operations | | | | | | | | |
Net investment income | | | $4,053,580 | | | | $4,364,126 | |
Net realized gain (loss) on investments and
foreign currency transactions | | | 67,639,329 | | | | 64,552,166 | |
Net unrealized gain (loss) on investments | | | 60,290,312 | | | | (19,837,986 | ) |
Change in net assets from operations | | | $131,983,221 | | | | $49,078,306 | |
| Distributions declared to shareholders | | | | | | | | |
From net investment income | | | $(4,385,037 | ) | | | $(5,590,368 | ) |
Change in net assets from fund share transactions | | | $(55,302,879 | ) | | | $(86,157,234 | ) |
Total change in net assets | | | $72,295,305 | | | | $(42,669,296 | ) |
| Net assets | | | | | | | | |
At beginning of period | | | 722,860,564 | | | | 765,529,860 | |
At end of period (including undistributed net investment
income of $3,943,588 and $4,245,545, respectively) | | | $795,155,869 | | | | $722,860,564 | |
See Notes to Financial Statements
23
Financial Statements
FINANCIAL HIGHLIGHTS
The financial highlights table is intended to help you understand the fund’s financial performance for the past 5 years. Certain information reflects financial results for a single fund share. The total returns in the table represent the rate by which an investor would have earned (or lost) on an investment in the fund share class (assuming reinvestment of all distributions) held for the entire period.
| | | | | | | | | | | | | | | | | | | | |
| Class A | | Years ended 8/31 | |
| | | 2011 | | | 2010 | | | 2009 | | | 2008 | | | 2007 | |
Net asset value, beginning of period | | | $14.62 | | | | $13.87 | | | | $16.75 | | | | $19.83 | | | | $18.17 | |
| Income (loss) from investment operations | | | | | | | | | | | | | | | | | | | | |
Net investment income (d) | | | $0.11 | | | | $0.10 | | | | $0.12 | | | | $0.09 | | | | $0.04 | |
Net realized and unrealized gain (loss)
on investments and foreign currency | | | 2.58 | | | | 0.77 | | | | (2.92 | ) | | | (1.71 | ) | | | 3.01 | |
Total from investment operations | | | $2.69 | | | | $0.87 | | | | $(2.80 | ) | | | $(1.62 | ) | | | $3.05 | |
| Less distributions declared to shareholders | | | | | | | | | | | | | | | | | | | | |
From net investment income | | | $(0.11 | ) | | | $(0.12 | ) | | | $(0.08 | ) | | | $— | | | | $— | |
From net realized gain on investments | | | — | | | | — | | | | — | | | | (1.46 | ) | | | (1.39 | ) |
Total distributions declared to shareholders | | | $(0.11 | ) | | | $(0.12 | ) | | | $(0.08 | ) | | | $(1.46 | ) | | | $(1.39 | ) |
Net asset value, end of period | | | $17.20 | | | | $14.62 | | | | $13.87 | | | | $16.75 | | | | $19.83 | |
Total return (%) (r)(s)(t)(x) | | | 18.39 | | | | 6.27 | | | | (16.55 | ) | | | (8.94 | ) | | | 17.26 | |
Ratios (%) (to average net assets)
and Supplemental data: | | | | | | | | | | | | | | | | | | | | |
Expenses before expense reductions (f) | | | 1.18 | | | | 1.24 | | | | 1.36 | | | | 1.24 | | | | 1.26 | |
Expenses after expense reductions (f) | | | 1.18 | | | | 1.23 | | | | 1.21 | | | | 1.21 | | | | 1.26 | |
Net investment income | | | 0.60 | | | | 0.68 | | | | 1.03 | | | | 0.52 | | | | 0.22 | |
Portfolio turnover | | | 66 | | | | 77 | | | | 109 | | | | 86 | | | | 283 | |
Net assets at end of period (000 omitted) | | | $612,504 | | | | $547,296 | | | | $559,572 | | | | $650,476 | | | | $766,202 | |
| Supplemental Ratios (%): | | | | | | | | | | | | | | | | | | | | |
Ratio of expenses to average net assets after
expense reductions excluding short sale
dividend and interest expense (f) | | | 1.17 | | | | 1.22 | | | | 1.21 | | | | N/A | | | | N/A | |
See Notes to Financial Statements
24
Financial Highlights – continued
| | | | | | | | | | | | | | | | | | | | |
| Class B | | Years ended 8/31 | |
| | | 2011 | | | 2010 | | | 2009 | | | 2008 | | | 2007 | |
Net asset value, beginning of period | | | $13.50 | | | | $12.80 | | | | $15.45 | | | | $18.52 | | | | $17.16 | |
| Income (loss) from investment operations | | | | | | | | | | | | | | | | | | | | |
Net investment income (loss) (d) | | | $(0.02 | ) | | | $(0.01 | ) | | | $0.05 | | | | $(0.02 | ) | | | $(0.08 | ) |
Net realized and unrealized gain (loss)
on investments and foreign currency | | | 2.38 | | | | 0.71 | | | | (2.70 | ) | | | (1.59 | ) | | | 2.83 | |
Total from investment operations | | | $2.36 | | | | $0.70 | | | | $(2.65 | ) | | | $(1.61 | ) | | | $2.75 | |
| Less distributions declared to shareholders | | | | | | | | | | | | | | | | | | | | |
From net investment income | | | $— | | | | $(0.00 | )(w) | | | $— | | | | $— | | | | $— | |
From net realized gain on investments | | | — | | | | — | | | | — | | | | (1.46 | ) | | | (1.39 | ) |
Total distributions declared to shareholders | | | $— | | | | $(0.00 | )(w) | | | $— | | | | $(1.46 | ) | | | $(1.39 | ) |
Net asset value, end of period | | | $15.86 | | | | $13.50 | | | | $12.80 | | | | $15.45 | | | | $18.52 | |
Total return (%) (r)(s)(t)(x) | | | 17.48 | | | | 5.49 | | | | (17.15 | ) | | | (9.55 | ) | | | 16.49 | |
Ratios (%) (to average net assets)
and Supplemental data: | | | | | | | | | | | | | | | | | | | | |
Expenses before expense reductions (f) | | | 1.93 | | | | 1.99 | | | | 2.07 | | | | 1.88 | | | | 1.90 | |
Expenses after expense reductions (f) | | | 1.93 | | | | 1.98 | | | | 1.90 | | | | 1.86 | | | | 1.90 | |
Net investment income (loss) | | | (0.15 | ) | | | (0.06 | ) | | | 0.42 | | | | (0.14 | ) | | | (0.46 | ) |
Portfolio turnover | | | 66 | | | | 77 | | | | 109 | | | | 86 | | | | 283 | |
Net assets at end of period (000 omitted) | | | $49,181 | | | | $55,327 | | | | $79,608 | | | | $162,122 | | | | $325,525 | |
| Supplemental Ratios (%): | | | | | | | | | | | | | | | | | | | | |
Ratio of expenses to average net assets after
expense reductions excluding short sale
dividend and interest expense (f) | | | 1.92 | | | | 1.97 | | | | 1.90 | | | | N/A | | | | N/A | |
See Notes to Financial Statements
25
Financial Highlights – continued
| | | | | | | | | | | | | | | | | | | | |
| Class C | | Years ended 8/31 | |
| | | 2011 | | | 2010 | | | 2009 | | | 2008 | | | 2007 | |
Net asset value, beginning of period | | | $13.39 | | | | $12.75 | | | | $15.38 | | | | $18.44 | | | | $17.09 | |
| Income (loss) from investment operations | | | | | | | | | | | | | | | | | | | | |
Net investment income (loss) (d) | | | $(0.02 | ) | | | $(0.01 | ) | | | $0.04 | | | | $(0.02 | ) | | | $(0.08 | ) |
Net realized and unrealized gain (loss)
on investments and foreign currency | | | 2.37 | | | | 0.70 | | | | (2.67 | ) | | | (1.58 | ) | | | 2.82 | |
Total from investment operations | | | $2.35 | | | | $0.69 | | | | $(2.63 | ) | | | $(1.60 | ) | | | $2.74 | |
| Less distributions declared to shareholders | | | | | | | | | | | | | | | | | | | | |
From net investment income | | | $— | | | | $(0.05 | ) | | | $— | | | | $— | | | | $— | |
From net realized gain on investments | | | — | | | | — | | | | — | | | | (1.46 | ) | | | (1.39 | ) |
Total distributions declared to shareholders | | | $— | | | | $(0.05 | ) | | | $— | | | | $(1.46 | ) | | | $(1.39 | ) |
Net asset value, end of period | | | $15.74 | | | | $13.39 | | | | $12.75 | | | | $15.38 | | | | $18.44 | |
Total return (%) (r)(s)(t)(x) | | | 17.55 | | | | 5.40 | | | | (17.10 | ) | | | (9.54 | ) | | | 16.50 | |
Ratios (%) (to average net assets)
and Supplemental data: | | | | | | | | | | | | | | | | | | | | |
Expenses before expense reductions (f) | | | 1.93 | | | | 1.99 | | | | 2.06 | | | | 1.89 | | | | 1.90 | |
Expenses after expense reductions (f) | | | 1.93 | | | | 1.98 | | | | 1.91 | | | | 1.86 | | | | 1.90 | |
Net investment income (loss) | | | (0.15 | ) | | | (0.07 | ) | | | 0.34 | | | | (0.14 | ) | | | (0.45 | ) |
Portfolio turnover | | | 66 | | | | 77 | | | | 109 | | | | 86 | | | | 283 | |
Net assets at end of period (000 omitted) | | | $62,249 | | | | $59,265 | | | | $63,993 | | | | $79,213 | | | | $107,948 | |
| Supplemental Ratios (%): | | | | | | | | | | | | | | | | | | | | |
Ratio of expenses to average net assets after
expense reductions excluding short sale
dividend and interest expense (f) | | | 1.92 | | | | 1.97 | | | | 1.91 | | | | N/A | | | | N/A | |
See Notes to Financial Statements
26
Financial Highlights – continued
| | | | | | | | | | | | | | | | | | | | |
| Class I | | Years ended 8/31 | |
| | | 2011 | | | 2010 | | | 2009 | | | 2008 | | | 2007 | |
Net asset value, beginning of period | | | $15.21 | | | | $14.43 | | | | $17.47 | | | | $20.54 | | | | $18.72 | |
| Income (loss) from investment operations | | | | | | | | | | | | | | | | | | | | |
Net investment income (d) | | | $0.15 | | | | $0.15 | | | | $0.17 | | | | $0.17 | | | | $0.11 | |
Net realized and unrealized gain (loss)
on investments and foreign currency | | | 2.70 | | | | 0.79 | | | | (3.06 | ) | | | (1.78 | ) | | | 3.10 | |
Total from investment operations | | | $2.85 | | | | $0.94 | | | | $(2.89 | ) | | | $(1.61 | ) | | | $3.21 | |
| Less distributions declared to shareholders | | | | | | | | | | | | | | | | | | | | |
From net investment income | | | $(0.15 | ) | | | $(0.16 | ) | | | $(0.15 | ) | | | $— | | | | $— | |
From net realized gain on investments | | | — | | | | — | | | | — | | | | (1.46 | ) | | | (1.39 | ) |
Total distributions declared to shareholders | | | $(0.15 | ) | | | $(0.16 | ) | | | $(0.15 | ) | | | $(1.46 | ) | | | $(1.39 | ) |
Net asset value, end of period | | | $17.91 | | | | $15.21 | | | | $14.43 | | | | $17.47 | | | | $20.54 | |
Total return (%) (r)(s)(x) | | | 18.73 | | | | 6.47 | | | | (16.29 | ) | | | (8.56 | ) | | | 17.63 | |
Ratios (%) (to average net assets)
and Supplemental data: | | | | | | | | | | | | | | | | | | | | |
Expenses before expense reductions (f) | | | 0.93 | | | | 0.99 | | | | 1.06 | | | | 0.89 | | | | 0.92 | |
Expenses after expense reductions (f) | | | 0.93 | | | | 0.98 | | | | 0.91 | | | | 0.86 | | | | 0.92 | |
Net investment income | | | 0.83 | | | | 0.93 | | | | 1.32 | | | | 0.88 | | | | 0.58 | |
Portfolio turnover | | | 66 | | | | 77 | | | | 109 | | | | 86 | | | | 283 | |
Net assets at end of period (000 omitted) | | | $17,250 | | | | $16,291 | | | | $15,766 | | | | $17,269 | | | | $27,544 | |
| Supplemental Ratios (%): | | | | | | | | | | | | | | | | | | | | |
Ratio of expenses to average net assets after
expense reductions excluding short sale
dividend and interest expense (f) | | | 0.92 | | | | 0.97 | | | | 0.91 | | | | N/A | | | | N/A | |
See Notes to Financial Statements
27
Financial Highlights – continued
| | | | | | | | | | | | | | | | | | | | |
| Class R1 | | Years ended 8/31 | |
| | | 2011 | | | 2010 | | | 2009 | | | 2008 | | | 2007 | |
Net asset value, beginning of period | | | $13.38 | | | | $12.75 | | | | $15.39 | | | | $18.45 | | | | $17.11 | |
| Income (loss) from investment operations | | | | | | | | | | | | | | | | | | | | |
Net investment income (loss) (d) | | | $(0.02 | ) | | | $(0.01 | ) | | | $0.04 | | | | $(0.03 | ) | | | $(0.09 | ) |
Net realized and unrealized gain (loss)
on investments and foreign currency | | | 2.37 | | | | 0.70 | | | | (2.68 | ) | | | (1.57 | ) | | | 2.82 | |
Total from investment operations | | | $2.35 | | | | $0.69 | | | | $(2.64 | ) | | | $(1.60 | ) | | | $2.73 | |
| Less distributions declared to shareholders | | | | | | | | | | | | | | | | | | | | |
From net investment income | | | $(0.01 | ) | | | $(0.06 | ) | | | $— | | | | $— | | | | $— | |
From net realized gain on investments | | | — | | | | — | | | | — | | | | (1.46 | ) | | | (1.39 | ) |
Total distributions declared to shareholders | | | $(0.01 | ) | | | $(0.06 | ) | | | $— | | | | $(1.46 | ) | | | $(1.39 | ) |
Net asset value, end of period | | | $15.72 | | | | $13.38 | | | | $12.75 | | | | $15.39 | | | | $18.45 | |
Total return (%) (r)(s)(x) | | | 17.56 | | | | 5.43 | | | | (17.15 | ) | | | (9.53 | ) | | | 16.42 | |
Ratios (%) (to average net assets)
and Supplemental data: | | | | | | | | | | | | | | | | | | | | |
Expenses before expense reductions (f) | | | 1.93 | | | | 1.99 | | | | 2.06 | | | | 1.95 | | | | 2.05 | |
Expenses after expense reductions (f) | | | 1.93 | | | | 1.98 | | | | 1.91 | | | | 1.91 | | | | 2.02 | |
Net investment income (loss) | | | (0.15 | ) | | | (0.07 | ) | | | 0.32 | | | | (0.18 | ) | | | (0.51 | ) |
Portfolio turnover | | | 66 | | | | 77 | | | | 109 | | | | 86 | | | | 283 | |
Net assets at end of period (000 omitted) | | | $3,904 | | | | $3,688 | | | | $3,735 | | | | $3,663 | | | | $2,543 | |
| Supplemental Ratios (%): | | | | | | | | | | | | | | | | | | | | |
Ratio of expenses to average net assets after
expense reductions excluding short sale
dividend and interest expense (f) | | | 1.92 | | | | 1.97 | | | | 1.91 | | | | N/A | | | | N/A | |
See Notes to Financial Statements
28
Financial Highlights – continued
| | | | | | | | | | | | | | | | | | | | |
| Class R2 | | Years ended 8/31 | |
| | | 2011 | | | 2010 | | | 2009 | | | 2008 | | | 2007 | |
Net asset value, beginning of period | | | $14.33 | | | | $13.62 | | | | $16.45 | | | | $19.53 | | | | $17.97 | |
| Income (loss) from investment operations | | | | | | | | | | | | | | | | | | | | |
Net investment income (loss) (d) | | | $0.06 | | | | $0.06 | | | | $0.10 | | | | $0.06 | | | | $(0.01 | ) |
Net realized and unrealized gain (loss)
on investments and foreign currency | | | 2.54 | | | | 0.75 | | | | (2.87 | ) | | | (1.68 | ) | | | 2.96 | |
Total from investment operations | | | $2.60 | | | | $0.81 | | | | $(2.77 | ) | | | $(1.62 | ) | | | $2.95 | |
| Less distributions declared to shareholders | | | | | | | | | | | | | | | | | | | | |
From net investment income | | | $(0.07 | ) | | | $(0.10 | ) | | | $(0.06 | ) | | | $— | | | | $— | |
From net realized gain on investments | | | — | | | | — | | | | — | | | | (1.46 | ) | | | (1.39 | ) |
Total distributions declared to shareholders | | | $(0.07 | ) | | | $(0.10 | ) | | | $(0.06 | ) | | | $(1.46 | ) | | | $(1.39 | ) |
Net asset value, end of period | | | $16.86 | | | | $14.33 | | | | $13.62 | | | | $16.45 | | | | $19.53 | |
Total return (%) (r)(s)(x) | | | 18.14 | | | | 5.97 | | | | (16.71 | ) | | | (9.08 | ) | | | 16.88 | |
Ratios (%) (to average net assets)
and Supplemental data: | | | | | | | | | | | | | | | | | | | | |
Expenses before expense reductions (f) | | | 1.43 | | | | 1.49 | | | | 1.56 | | | | 1.45 | | | | 1.61 | |
Expenses after expense reductions (f) | | | 1.43 | | | | 1.48 | | | | 1.41 | | | | 1.41 | | | | 1.58 | |
Net investment income (loss) | | | 0.35 | | | | 0.43 | | | | 0.82 | | | | 0.34 | | | | (0.05 | ) |
Portfolio turnover | | | 66 | | | | 77 | | | | 109 | | | | 86 | | | | 283 | |
Net assets at end of period (000 omitted) | | | $16,424 | | | | $14,013 | | | | $15,483 | | | | $16,539 | | | | $9,492 | |
| Supplemental Ratios (%): | | | | | | | | | | | | | | | | | | | | |
Ratio of expenses to average net assets after
expense reductions excluding short sale
dividend and interest expense (f) | | | 1.42 | | | | 1.47 | | | | 1.41 | | | | N/A | | | | N/A | |
See Notes to Financial Statements
29
Financial Highlights – continued
| | | | | | | | | | | | | | | | | | | | |
| Class R3 | | Years ended 8/31 | |
| | | 2011 | | | 2010 | | | 2009 | | | 2008 | | | 2007 | |
Net asset value, beginning of period | | | $14.59 | | | | $13.85 | | | | $16.73 | | | | $19.80 | | | | $18.15 | |
| Income (loss) from investment operations | | | | | | | | | | | | | | | | | | | | |
Net investment income (d) | | | $0.11 | | | | $0.10 | | | | $0.13 | | | | $0.10 | | | | $0.05 | |
Net realized and unrealized gain (loss)
on investments and foreign currency | | | 2.57 | | | | 0.77 | | | | (2.91 | ) | | | (1.71 | ) | | | 2.99 | |
Total from investment operations | | | $2.68 | | | | $0.87 | | | | $(2.78 | ) | | | $(1.61 | ) | | | $3.04 | |
| Less distributions declared to shareholders | | | | | | | | | | | | | | | | | | | | |
From net investment income | | | $(0.11 | ) | | | $(0.13 | ) | | | $(0.10 | ) | | | $— | | | | $— | |
From net realized gain on investments | | | — | | | | — | | | | — | | | | (1.46 | ) | | | (1.39 | ) |
Total distributions declared to shareholders | | | $(0.11 | ) | | | $(0.13 | ) | | | $(0.10 | ) | | | $(1.46 | ) | | | $(1.39 | ) |
Net asset value, end of period | | | $17.16 | | | | $14.59 | | | | $13.85 | | | | $16.73 | | | | $19.80 | |
Total return (%) (r)(s)(x) | | | 18.38 | | | | 6.25 | | | | (16.48 | ) | | | (8.90 | ) | | | 17.22 | |
Ratios (%) (to average net assets)
and Supplemental data: | | | | | | | | | | | | | | | | | | | | |
Expenses before expense reductions (f) | | | 1.18 | | | | 1.24 | | | | 1.32 | | | | 1.19 | | | | 1.36 | |
Expenses after expense reductions (f) | | | 1.18 | | | | 1.23 | | | | 1.16 | | | | 1.17 | | | | 1.36 | |
Net investment income | | | 0.60 | | | | 0.68 | | | | 1.07 | | | | 0.57 | | | | 0.24 | |
Portfolio turnover | | | 66 | | | | 77 | | | | 109 | | | | 86 | | | | 283 | |
Net assets at end of period (000 omitted) | | | $32,277 | | | | $26,573 | | | | $25,741 | | | | $28,185 | | | | $31,963 | |
| Supplemental Ratios (%): | | | | | | | | | | | | | | | | | | | | |
Ratio of expenses to average net assets after
expense reductions excluding short sale
dividend and interest expense (f) | | | 1.17 | | | | 1.22 | | | | 1.16 | | | | N/A | | | | N/A | |
See Notes to Financial Statements
30
Financial Highlights – continued
| | | | | | | | | | | | | | | | | | | | |
| Class R4 | | Years ended 8/31 | |
| | | 2011 | | | 2010 | | | 2009 | | | 2008 | | | 2007 | |
Net asset value, beginning of period | | | $14.72 | | | | $13.98 | | | | $16.92 | | | | $19.96 | | | | $18.24 | |
| Income (loss) from investment operations | | | | | | | | | | | | | | | | | | | | |
Net investment income (d) | | | $0.13 | | | | $0.14 | | | | $0.10 | | | | $0.15 | | | | $0.11 | |
Net realized and unrealized gain (loss)
on investments and foreign currency | | | 2.62 | | | | 0.76 | | | | (2.90 | ) | | | (1.73 | ) | | | 3.00 | |
Total from investment operations | | | $2.75 | | | | $0.90 | | | | $(2.80 | ) | | | $(1.58 | ) | | | $3.11 | |
| Less distributions declared to shareholders | | | | | | | | | | | | | | | | | | | | |
From net investment income | | | $(0.15 | ) | | | $(0.16 | ) | | | $(0.14 | ) | | | $— | | | | $— | |
From net realized gain on investments | | | — | | | | — | | | | — | | | | (1.46 | ) | | | (1.39 | ) |
Total distributions declared to shareholders | | | $(0.15 | ) | | | $(0.16 | ) | | | $(0.14 | ) | | | $(1.46 | ) | | | $(1.39 | ) |
Net asset value, end of period | | | $17.32 | | | | $14.72 | | | | $13.98 | | | | $16.92 | | | | $19.96 | |
Total return (%) (r)(s)(x) | | | 18.68 | | | | 6.40 | | | | (16.28 | ) | | | (8.67 | ) | | | 17.54 | |
Ratios (%) (to average net assets)
and Supplemental data: | | | | | | | | | | | | | | | | | | | | |
Expenses before expense reductions (f) | | | 0.92 | | | | 0.98 | | | | 0.96 | | | | 0.92 | | | | 1.06 | |
Expenses after expense reductions (f) | | | 0.92 | | | | 0.97 | | | | 0.95 | | | | 0.90 | | | | 1.06 | |
Net investment income | | | 0.75 | | | | 0.92 | | | | 0.75 | | | | 0.83 | | | | 0.55 | |
Portfolio turnover | | | 66 | | | | 77 | | | | 109 | | | | 86 | | | | 283 | |
Net assets at end of period (000 omitted) | | | $1,367 | | | | $408 | | | | $1,633 | | | | $60 | | | | $66 | |
| Supplemental Ratios (%): | | | | | | | | | | | | | | | | | | | | |
Ratio of expenses to average net assets after
expense reductions excluding short sale
dividend and interest expense (f) | | | 0.91 | | | | 0.97 | | | | 0.95 | | | | N/A | | | | N/A | |
| (d) | Per share data is based on average shares outstanding. |
| (f) | Ratios do not reflect reductions from fees paid indirectly, if applicable. |
| (r) | Certain expenses have been reduced without which performance would have been lower. |
| (s) | From time to time the fund may receive proceeds from litigation settlements, without which performance would be lower. Excluding the effect of the proceeds received from a non-recurring litigation settlement against Enron Corp., the Class A, Class B, Class C, Class I, Class R1, Class R2, Class R3, and Class R4 total returns for the year ended August 31, 2009 would have been lower by approximately 2.41%, 2.40%, 2.42%, 2.40%, 2.40%, 2.36%, 2.40%, and 2.40%, respectively. |
| (t) | Total returns do not include any applicable sales charges. |
| (w) | Per share amount was less than $0.01. |
| (x) | Total returns have been calculated on net asset values which include adjustments made in accordance with U.S. generally accepted accounting principles required at period end for financial reporting purposes. |
See Notes to Financial Statements
31
NOTES TO FINANCIAL STATEMENTS
| (1) | | Business and Organization |
MFS Core Equity Fund (the fund) is a series of MFS Series Trust I (the trust). The trust is organized as a Massachusetts business trust and is registered under the Investment Company Act of 1940, as amended, as an open-end management investment company.
| (2) | | Significant Accounting Policies |
General – The preparation of financial statements in conformity with U.S. generally accepted accounting principles requires management to make estimates and assumptions that affect the reported amounts of assets and liabilities, and disclosure of contingent assets and liabilities at the date of the financial statements and the reported amounts of revenues and expenses during the reporting period. Actual results could differ from those estimates. In the preparation of these financial statements, management has evaluated subsequent events occurring after the date of the fund’s Statement of Assets and Liabilities through the date that the financial statements were issued.
Investment Valuations – Equity securities, including restricted equity securities, are generally valued at the last sale or official closing price as provided by a third-party pricing service on the market or exchange on which they are primarily traded. Equity securities, for which there were no sales reported that day, are generally valued at the last quoted daily bid quotation as provided by a third-party pricing service on the market or exchange on which such securities are primarily traded. Equity securities held short, for which there were no sales reported for that day, are generally valued at the last quoted daily ask quotation as provided by a third-party pricing service on the market or exchange on which such securities are primarily traded. Short-term instruments with a maturity at issuance of 60 days or less generally are valued at amortized cost, which approximates market value. Exchange-traded options are generally valued at the last sale or official closing price as provided by a third-party pricing service on the exchange on which such options are primarily traded. Exchange-traded options for which there were no sales reported that day are generally valued at the last daily bid quotation as provided by a third-party pricing service on the exchange on which such options are primarily traded. Options not traded on an exchange are generally valued at a broker/dealer bid quotation. Foreign currency options are generally valued at valuations provided by a third-party pricing service. Open-end investment companies are generally valued at net asset value per share. Securities and other assets generally valued on the basis of information from a third-party pricing service may also be valued at a broker/dealer bid quotation. Values obtained from third-party pricing services can utilize both transaction
32
Notes to Financial Statements – continued
data and market information such as yield, quality, coupon rate, maturity, type of issue, trading characteristics, and other market data. The values of foreign securities and other assets and liabilities expressed in foreign currencies are converted to U.S. dollars using the mean of bid and asked prices for rates provided by a third-party pricing service.
The Board of Trustees has delegated primary responsibility for determining or causing to be determined the value of the fund’s investments (including any fair valuation) to the adviser pursuant to valuation policies and procedures approved by the Board. If the adviser determines that reliable market quotations are not readily available, investments are valued at fair value as determined in good faith by the adviser in accordance with such procedures under the oversight of the Board of Trustees. Under the fund’s valuation policies and procedures, market quotations are not considered to be readily available for most types of debt instruments and floating rate loans and many types of derivatives. These investments are generally valued at fair value based on information from third-party pricing services. In addition, investments may be valued at fair value if the adviser determines that an investment’s value has been materially affected by events occurring after the close of the exchange or market on which the investment is principally traded (such as foreign exchange or market) and prior to the determination of the fund’s net asset value, or after the halting of trading of a specific security where trading does not resume prior to the close of the exchange or market on which the security is principally traded. Events that occur on a frequent basis after foreign markets close (such as developments in foreign markets and significant movements in the U.S. markets) and prior to the determination of the fund’s net asset value may be deemed to have a material effect on the value of securities traded in foreign markets. Accordingly, the fund’s foreign equity securities may often be valued at fair value. The adviser generally relies on third-party pricing services or other information (such as the correlation with price movements of similar securities in the same or other markets; the type, cost and investment characteristics of the security; the business and financial condition of the issuer; and trading and other market data) to assist in determining whether to fair value and at what value to fair value an investment. The value of an investment for purposes of calculating the fund’s net asset value can differ depending on the source and method used to determine value. When fair valuation is used, the value of an investment used to determine the fund’s net asset value may differ from quoted or published prices for the same investment. There can be no assurance that the fund could obtain the fair value assigned to an investment if it were to sell the investment at the same time at which the fund determines its net asset value per share.
Various inputs are used in determining the value of the fund’s assets or liabilities. These inputs are categorized into three broad levels. In certain cases,
33
Notes to Financial Statements – continued
the inputs used to measure fair value may fall into different levels of the fair value hierarchy. In such cases, an investment’s level within the fair value hierarchy is based on the lowest level of input that is significant to the fair value measurement. The fund’s assessment of the significance of a particular input to the fair value measurement in its entirety requires judgment, and considers factors specific to the investment. Level 1 includes unadjusted quoted prices in active markets for identical assets or liabilities. Level 2 includes other significant observable market-based inputs (including quoted prices for similar securities, interest rates, prepayment speed, and credit risk). Level 3 includes unobservable inputs, which may include the adviser’s own assumptions in determining the fair value of investments. The following is a summary of the levels used as of August 31, 2011 in valuing the fund’s assets or liabilities:
| | | | | | | | | | | | | | | | |
| Investments at Value | | Level 1 | | | Level 2 | | | Level 3 | | | Total | |
| Equity Securities: | | | | | | | | | | | | | | | | |
United States | | | $762,732,153 | | | | $1,094,757 | | | | $— | | | | $763,826,910 | |
Israel | | | 11,388,763 | | | | — | | | | — | | | | 11,388,763 | |
Canada | | | 6,494,344 | | | | — | | | | — | | | | 6,494,344 | |
Netherlands | | | 2,796,911 | | | | — | | | | — | | | | 2,796,911 | |
United Kingdom | | | — | | | | — | | | | 1,439,082 | | | | 1,439,082 | |
| Mutual Funds | | | 8,313,349 | | | | — | | | | — | | | | 8,313,349 | |
| Total Investments | | | $791,725,520 | | | | $1,094,757 | | | | $1,439,082 | | | | $794,259,359 | |
| | | | |
| Short Sales | | | $(1,738,864 | ) | | | $— | | | | $— | | | | $(1,738,864 | ) |
For further information regarding security characteristics, see the Portfolio of Investments.
The following is a reconciliation of level 3 assets for which significant unobservable inputs were used to determine fair value. The fund’s policy is to recognize transfers between the levels as of the end of the period. The table presents the activity of level 3 securities held at the beginning and the end of the period.
| | | | |
| | | Equity
Securities | |
| Balance as of 8/31/10 | | | $1,135,444 | |
Change in unrealized appreciation (depreciation) | | | 303,638 | |
| Balance as of 8/31/11 | | | $1,439,082 | |
The net change in unrealized appreciation (depreciation) from investments still held as level 3 at August 31, 2011 is $303,638.
Foreign Currency Translation – Purchases and sales of foreign investments, income, and expenses are converted into U.S. dollars based upon currency exchange rates prevailing on the respective dates of such transactions or on the
34
Notes to Financial Statements – continued
reporting date for foreign denominated receivables and payables. Gains and losses attributable to foreign currency exchange rates on sales of securities are recorded for financial statement purposes as net realized gains and losses on investments. Gains and losses attributable to foreign exchange rate movements on receivables, payables, income and expenses are recorded for financial statement purposes as foreign currency transaction gains and losses. That portion of both realized and unrealized gains and losses on investments that results from fluctuations in foreign currency exchange rates is not separately disclosed.
Derivatives – The fund uses derivatives for different purposes, including to earn income and enhance returns, to increase or decrease exposure to a particular market, to manage or adjust the risk profile of the fund, or as alternatives to direct investments. Derivatives are used for hedging or non-hedging purposes. While hedging can reduce or eliminate losses, it can also reduce or eliminate gains. When the fund uses derivatives as an investment to increase market exposure, or for hedging purposes, gains and losses from derivative instruments may be substantially greater than the derivative’s original cost.
The derivative instruments used by the fund were written options and purchased options. At August 31, 2011, the fund did not have any outstanding derivative instruments.
The following table presents, by major type of derivative contract, the realized gain (loss) on derivatives held by the fund for the year ended August 31, 2011 as reported in the Statement of Operations:
| | | | | | | | |
| Risk | | Investments
(Purchased
Options) | | | Written
Options | |
| Equity | | | $(192,320 | ) | | | $17,688 | |
There is no unrealized gain (loss) from derivative transactions at period end.
Derivative counterparty credit risk is managed through formal evaluation of the creditworthiness of all potential counterparties. On certain over-the-counter derivatives, the fund attempts to reduce its exposure to counterparty credit risk whenever possible by entering into an International Swaps and Derivatives Association (ISDA) Master Agreement on a bilateral basis with each of the counterparties with whom it undertakes a significant volume of transactions. The ISDA Master Agreement gives each party to the agreement the right to terminate all transactions traded under such agreement if there is a certain deterioration in the credit quality of the other party. The ISDA Master Agreement gives the fund the right, upon an event of default by the applicable counterparty or a termination of the agreement, to close out all transactions traded under such agreement and to net amounts owed under each transaction
35
Notes to Financial Statements – continued
to one net amount payable by one party to the other. This right to close out and net payments across all transactions traded under the ISDA Master Agreement could result in a reduction of the fund’s credit risk to such counterparty equal to any amounts payable by the fund under the applicable transactions, if any. However, absent an event of default by the counterparty or a termination of the agreement, the ISDA Master Agreement does not result in an offset of reported amounts of assets and liabilities in the Statement of Assets and Liabilities across transactions between the fund and the applicable counterparty.
Collateral requirements differ by type of derivative. Collateral or margin requirements are set by the broker or exchange clearing house for exchange traded derivatives (i.e., futures and exchange-traded options) while collateral terms are contract specific for over-the-counter traded derivatives (i.e., forward foreign currency exchange contracts, swaps and over-the-counter options). For derivatives traded under an ISDA Master Agreement, the collateral requirements are netted across all transactions traded under such agreement and one amount is posted from one party to the other to collateralize such obligations. Cash collateral that has been pledged to cover obligations of the fund under derivative contracts, if any, will be reported separately on the Statement of Assets and Liabilities as restricted cash. Securities collateral pledged for the same purpose, if any, is noted in the Portfolio of Investments.
Written Options – In exchange for a premium, the fund wrote call options on securities that it anticipated the price would decline and also wrote put options on securities that it anticipated the price would increase. At the time the option was written, the fund believed the premium received exceeded the potential loss that could result from adverse price changes in the options’ underlying securities. In a written option, the fund as the option writer grants the buyer the right to purchase from, or sell to, the fund a specified number of shares or units of a particular security, currency or index at a specified price within a specified period of time.
The premium received is initially recorded as a liability on the Statement of Assets and Liabilities. The option is subsequently marked-to-market daily with the difference between the premium received and the market value of the written option being recorded as unrealized appreciation or depreciation. When a written option expires, the fund realizes a gain equal to the amount of the premium received. The difference between the premium received and the amount paid on effecting a closing transaction is considered a realized gain or loss. When a written call option is exercised, the premium received is offset against the proceeds to determine the realized gain or loss. When a written put option is exercised, the premium reduces the cost basis of the security purchased by the fund.
36
Notes to Financial Statements – continued
At the initiation of the written option contract, for exchange traded options, the fund is required to deposit securities or cash as collateral with the custodian for the benefit of the broker. For over-the-counter options, the fund may post collateral subject to the terms of an ISDA Master Agreement as generally described above if the market value of the options contract moves against it. The fund, as writer of an option, may have no control over whether the underlying securities may be sold (call) or purchased (put) and, as a result, bears the market risk of an unfavorable change in the price of the securities underlying the written option. Losses from writing options can exceed the premium received and can exceed the potential loss from an ordinary buy and sell transaction. Although the fund’s market risk may be significant, the maximum counterparty credit risk to the fund is equal to the market value of any collateral posted to the broker. For over-the-counter options, this risk is mitigated in cases where there is an ISDA Master Agreement between the fund and the counterparty providing for netting as described above.
Written Option Transactions
| | | | | | | | |
| | | Number of
Contracts | | | Premiums
Received | |
| Outstanding, beginning of period | | | — | | | | $— | |
| Options written | | | 1,243 | | | | 74,941 | |
| Options closed | | | (168 | ) | | | (10,416 | ) |
| Options exercised | | | (1,027 | ) | | | (55,405 | ) |
| Options expired | | | (48 | ) | | | (9,120 | ) |
| Outstanding, end of period | | | — | | | | $— | |
Purchased Options – The fund purchased call and put options for a premium. Purchased call and put options entitle the holder to buy and sell a specified number of shares or units of a particular security, currency or index at a specified price at a specified date or within a specified period of time. Purchasing call options may be used to hedge against an anticipated increase in the dollar cost of securities or currency to be acquired or to increase the fund’s exposure to an underlying instrument. Purchasing put options may hedge against a decline in the value of portfolio securities or currency.
The premium paid is initially recorded as an investment in the Statement of Assets and Liabilities. That investment is subsequently marked-to-market daily with the difference between the premium paid and the market value of the purchased option being recorded as unrealized appreciation or depreciation. Premiums paid for purchased call and put options which have expired are treated as realized losses on investments in the Statement of Operations. Upon the exercise or closing of a purchased call option, the premium paid is added to the cost of the security or financial instrument. Upon the exercise or closing of a purchased put option, the premium paid is offset against the proceeds on the sale of the underlying security or financial instrument in order to determine the realized gain or loss on investments.
37
Notes to Financial Statements – continued
The risk in purchasing an option is that the fund pays a premium whether or not the option is exercised. The fund’s maximum risk of loss due to counterparty credit risk is limited to the market value of the option. For over-the-counter options, this risk is mitigated in cases where there is an ISDA Master Agreement between the fund and the counterparty providing for netting as described above and for posting of collateral by the counterparty to the fund to cover the fund’s exposure to the counterparty under such ISDA Master Agreement.
Short Sales – The fund entered into short sales whereby it sells a security it does not own in anticipation of a decline in the value of that security. The fund will realize a gain if the security price decreases and a loss if the security price increases between the date of the short sale and the date on which the fund replaces the borrowed security. Losses from short sales can exceed the proceeds of the security sold; and they can also exceed the potential loss from an ordinary buy and sell transaction. The amount of any premium, dividends, or interest the fund may be required to pay in connection with a short sale will be recognized as a fund expense. During the year ended August 31, 2011, this expense amounted to $54,447. The fund segregates cash or marketable securities in an amount that, when combined with the amount of proceeds from the short sale deposited with the broker, at least equals the current market value of the security sold short.
Security Loans – State Street Bank and Trust Company (“State Street”), as lending agent, loans the securities of the fund to certain qualified institutions (the “Borrowers”) approved by the fund. The loans are collateralized by cash and/or U.S. Treasury and federal agency obligations in an amount typically at least equal to the market value of the securities loaned. The market value of the loaned securities is determined at the close of business of the fund and any additional required collateral is delivered to the fund on the next business day. State Street provides the fund with indemnification against Borrower default. The fund bears the risk of loss with respect to the investment of cash collateral. On loans collateralized by cash, the cash collateral is invested in a money market fund or short-term securities. A portion of the income generated upon investment of the collateral is remitted to the Borrowers, and the remainder is allocated between the fund and the lending agent. On loans collateralized by U.S. Treasury and/or federal agency obligations, a fee is received from the Borrower, and is allocated between the fund and the lending agent. Income from securities lending is included in interest income on the Statement of Operations. The dividend and interest income earned on the securities loaned is accounted for in the same manner as other dividend and interest income.
Indemnifications – Under the fund’s organizational documents, its officers and Trustees may be indemnified against certain liabilities and expenses
38
Notes to Financial Statements – continued
arising out of the performance of their duties to the fund. Additionally, in the normal course of business, the fund enters into agreements with service providers that may contain indemnification clauses. The fund’s maximum exposure under these agreements is unknown as this would involve future claims that may be made against the fund that have not yet occurred.
Investment Transactions and Income – Investment transactions are recorded on the trade date. Interest income is recorded on the accrual basis. Dividends received in cash are recorded on the ex-dividend date. Certain dividends from foreign securities will be recorded when the fund is informed of the dividend if such information is obtained subsequent to the ex-dividend date. Dividend and interest payments received in additional securities are recorded on the ex-dividend or ex-interest date in an amount equal to the value of the security on such date.
The fund may receive proceeds from litigation settlements. Any proceeds received from litigation involving portfolio holdings are reflected in the Statement of Operations in realized gain/loss if the security has been disposed of by the fund or in unrealized gain/loss if the security is still held by the fund. Any other proceeds from litigation not related to portfolio holdings are reflected as other income in the Statement of Operations.
Fees Paid Indirectly – The fund’s custody fee may be reduced according to an arrangement that measures the value of cash deposited with the custodian by the fund. This amount, for the year ended August 31, 2011, is shown as a reduction of total expenses on the Statement of Operations.
Tax Matters and Distributions – The fund intends to qualify as a regulated investment company, as defined under Subchapter M of the Internal Revenue Code, and to distribute all of its taxable income, including realized capital gains. As a result, no provision for federal income tax is required. The fund’s federal tax returns for the prior three fiscal years remain subject to examination by the Internal Revenue Service. Foreign taxes, if any, have been accrued by the fund in the accompanying financial statements.
Distributions to shareholders are recorded on the ex-dividend date. Income and capital gain distributions are determined in accordance with income tax regulations, which may differ from U.S. generally accepted accounting principles. Certain capital accounts in the financial statements are periodically adjusted for permanent differences in order to reflect their tax character. These adjustments have no impact on net assets or net asset value per share. Temporary differences which arise from recognizing certain items of income, expense, gain or loss in different periods for financial statement and tax purposes will reverse at some time in the future. Distributions in excess of net investment income or net realized gains are temporary overdistributions for
39
Notes to Financial Statements – continued
financial statement purposes resulting from differences in the recognition or classification of income or distributions for financial statement and tax purposes.
Book/tax differences primarily relate to wash sale loss deferrals.
The tax character of distributions declared to shareholders for the last two fiscal years is as follows:
| | | | | | | | |
| | | 8/31/11 | | | 8/31/10 | |
| Ordinary income (including any short-term capital gains) | | | $4,385,037 | | | | $5,590,368 | |
The federal tax cost and the tax basis components of distributable earnings were as follows:
| | | | |
| As of 8/31/11 | | | |
| Cost of investments | | | $774,894,683 | |
| Gross appreciation | | | 77,003,885 | |
| Gross depreciation | | | (57,639,209 | ) |
| Net unrealized appreciation (depreciation) | | | $19,364,676 | |
| Undistributed ordinary income | | | 4,058,759 | |
| Capital loss carryforwards | | | (180,764,545 | ) |
| Other temporary differences | | | (184,211 | ) |
As of August 31, 2011, the fund had capital loss carryforwards available to offset future realized gains. Such losses expire as follows:
| | | | |
| 8/31/16 | | | $(41,915,365 | ) |
| 8/31/17 | | | (37,806,029 | ) |
| 8/31/18 | | | (101,043,151 | ) |
| Total | | | $(180,764,545 | ) |
The availability of a portion of the capital loss carryforwards, which were acquired on July 24, 2009, in connection with the acquisition of the MFS New Endeavor Fund, may be limited in a given year.
Multiple Classes of Shares of Beneficial Interest – The fund offers multiple classes of shares, which differ in their respective distribution and service fees. The fund’s income, realized and unrealized gain (loss), and common expenses are allocated to shareholders based on the daily net assets of each class. Dividends are declared separately for each class. Differences in per share dividend rates are generally due to differences in separate class expenses. Class B shares will convert to Class A shares approximately eight years after
40
Notes to Financial Statements – continued
purchase. The fund’s distributions declared to shareholders as reported on the Statements of Changes in Net Assets are presented by class as follows:
| | | | | | | | |
| | | From net investment
income | |
| | | Year ended
8/31/11 | | | Year ended
8/31/10 | |
| Class A | | | $3,993,456 | | | | $4,779,998 | |
| Class B | | | — | | | | 17,074 | |
| Class C | | | — | | | | 244,298 | |
| Class I | | | 109,026 | | | | 168,467 | |
| Class R1 | | | 2,507 | | | | 17,743 | |
| Class R2 | | | 68,041 | | | | 114,882 | |
| Class R3 | | | 207,933 | | | | 229,697 | |
| Class R4 | | | 4,074 | | | | 18,209 | |
| Total | | | $4,385,037 | | | | $5,590,368 | |
| (3) | | Transactions with Affiliates |
Investment Adviser – The fund has an investment advisory agreement with MFS to provide overall investment management and related administrative services and facilities to the fund. The management fee is computed daily and paid monthly at the following annual rates:
| | | | |
| First $500 million of average daily net assets | | | 0.65 | % |
| Average daily net assets in excess of $500 million | | | 0.55 | % |
The management fee incurred for the year ended August 31, 2011 was equivalent to an annual effective rate of 0.61% of the fund’s average daily net assets.
The investment adviser has agreed in writing to pay a portion of the fund’s total annual operating expenses, exclusive of interest, taxes, extraordinary expenses, brokerage and transaction costs, and investment related expenses, such that total annual fund operating expenses do not exceed the following rates annually of the fund’s average daily net assets.
| | | | | | | | | | | | | | | | | | | | | | | | | | | | |
| Class A | | Class B | | | Class C | | | Class I | | | Class R1 | | | Class R2 | | | Class R3 | | | Class R4 | |
| 1.26% | | | 2.01% | | | | 2.01% | | | | 1.01% | | | | 2.01% | | | | 1.51% | | | | 1.26% | | | | 1.01% | |
This written agreement will continue until modified by the fund’s Board of Trustees, but such agreement will continue at least until December 31, 2012. For the year ended August 31, 2011 the fund’s actual expenses did not exceed the limit and therefore, the investment adviser did not pay any portion of the fund’s expenses.
Distributor – MFS Fund Distributors, Inc. (MFD), a wholly-owned subsidiary of MFS, as distributor, received $203,212 for the year ended August 31, 2011, as its portion of the initial sales charge on sales of Class A shares of the fund, respectively.
41
Notes to Financial Statements – continued
The Board of Trustees has adopted a distribution plan for certain class shares pursuant to Rule 12b-1 of the Investment Company Act of 1940.
The fund’s distribution plan provides that the fund will pay MFD for services provided by MFD and financial intermediaries in connection with the distribution and servicing of certain share classes. One component of the plan is a distribution fee paid to MFD and another component of the plan is a service fee paid to MFD. MFD may subsequently pay all, or a portion, of the distribution and/or service fees to financial intermediaries.
Distribution Plan Fee Table:
| | | | | | | | | | | | | | | | | | | | |
| | | Distribution
Fee Rate (d) | | | Service
Fee Rate (d) | | | Total
Distribution
Plan (d) | | | Annual
Effective
Rate (e) | | | Distribution
and Service
Fee | |
| Class A | | | — | | | | 0.25% | | | | 0.25% | | | | 0.25% | | | | $1,619,698 | |
| Class B | | | 0.75% | | | | 0.25% | | | | 1.00% | | | | 1.00% | | | | 585,226 | |
| Class C | | | 0.75% | | | | 0.25% | | | | 1.00% | | | | 1.00% | | | | 676,732 | |
| Class R1 | | | 0.75% | | | | 0.25% | | | | 1.00% | | | | 1.00% | | | | 43,214 | |
| Class R2 | | | 0.25% | | | | 0.25% | | | | 0.50% | | | | 0.50% | | | | 85,820 | |
| Class R3 | | | — | | | | 0.25% | | | | 0.25% | | | | 0.25% | | | | 81,180 | |
| Total Distribution and Service Fees | | | | | | | | | | | | | | | | $3,091,870 | |
| (d) | In accordance with the distribution plan for certain classes, the fund pays distribution and/or service fees equal to these annual percentage rates of each class’ average daily net assets. The distribution and service fee rates disclosed by class represent the current rates in effect at the end of the reporting period. Any rate changes, if applicable, are detailed below. |
| (e) | The annual effective rates represent actual fees incurred under the distribution plan for the year ended August 31, 2011 based on each class’ average daily net assets. Effective January 1, 2011 the service fee on assets attributable to Class A shares sold prior to October 1, 1989 with respect to shares that were acquired as part of the reorganization of MFS Capital Opportunities Fund into MFS Core Equity Fund are subject to a service fee of 0.25% annually. Prior to this date, the service fee on these assets was 0.15% annually. |
Certain Class A shares are subject to a contingent deferred sales charge (CDSC) in the event of a shareholder redemption within 24 months of purchase. Class C shares are subject to a CDSC in the event of a shareholder redemption within 12 months of purchase. Class B shares are subject to a CDSC in the event of a shareholder redemption within six years of purchase. All contingent deferred sales charges are paid to MFD and during the year ended August 31, 2011, were as follows:
| | | | |
| | | Amount | |
| Class A | | | $64 | |
| Class B | | | 55,805 | |
| Class C | | | 3,342 | |
Shareholder Servicing Agent – MFS Service Center, Inc. (MFSC), a wholly-owned subsidiary of MFS, receives a fee from the fund for its services as shareholder servicing agent calculated as a percentage of the average daily net assets of the fund as determined periodically under the supervision of the
42
Notes to Financial Statements – continued
fund’s Board of Trustees. For the year ended August 31, 2011, the fee was $900,901, which equated to 0.1066% annually of the fund’s average daily net assets. MFSC also receives payment from the fund for out-of-pocket expenses, sub-accounting and other shareholder servicing costs which may be paid to affiliated and unaffiliated service providers. For the year ended August 31, 2011, these out-of-pocket expenses, sub-accounting and other shareholder servicing costs amounted to $1,152,272.
Administrator – MFS provides certain financial, legal, shareholder communications, compliance, and other administrative services to the fund. Under an administrative services agreement, the fund partially reimburses MFS the costs incurred to provide these services. The fund is charged an annual fixed amount of $17,500 plus a fee based on average daily net assets. The administrative services fee incurred for the year ended August 31, 2011 was equivalent to an annual effective rate of 0.0149% of the fund’s average daily net assets.
Trustees’ and Officers’ Compensation – The fund pays compensation to independent Trustees in the form of a retainer, attendance fees, and additional compensation to Board and Committee chairpersons. The fund does not pay compensation directly to Trustees or officers of the fund who are also officers of the investment adviser, all of whom receive remuneration for their services to the fund from MFS. Certain officers and Trustees of the fund are officers or directors of MFS, MFD, and MFSC.
Prior to December 31, 2001, the fund had an unfunded defined benefit plan (“DB plan”) for independent Trustees. As of December 31, 2001, the Board took action to terminate the DB plan with respect to then-current and any future independent Trustees, such that the DB Plan covers only certain of those former independent Trustees who retired on or before December 31, 2001. Effective January 1, 2002, accrued benefits under the DB Plan for then-current independent Trustees who continued were credited to an unfunded retirement deferral plan (the “Retirement Deferral plan”), which was established for and exists solely with respect to these credited amounts, and is not available for other deferrals by these or other independent Trustees. Although the Retirement Deferral plan is unfunded, amounts deferred under the plan are periodically adjusted for investment experience as if they had been invested in shares of the fund. The DB Plan resulted in a pension expense of $6,296 and the Retirement Deferral plan resulted in an expense of $18,270. Both amounts are included in independent Trustees’ compensation for the year ended August 31, 2011. The liability for deferred retirement benefits payable to certain independent Trustees under both plans amounted to $120,715 at August 31, 2011, and is included in payable for independent Trustees’ compensation on the Statement of Assets and Liabilities.
43
Notes to Financial Statements – continued
Other – This fund and certain other funds managed by MFS (the funds) have entered into services agreements (the Agreements) which provide for payment of fees by the funds to Tarantino LLC and Griffin Compliance LLC in return for the provision of services of an Independent Chief Compliance Officer (ICCO) and Assistant ICCO, respectively, for the funds. The ICCO and Assistant ICCO are officers of the funds and the sole members of Tarantino LLC and Griffin Compliance LLC, respectively. The funds can terminate the Agreements with Tarantino LLC and Griffin Compliance LLC at any time under the terms of the Agreements. For the year ended August 31, 2011, the aggregate fees paid by the fund to Tarantino LLC and Griffin Compliance LLC were $7,694 and are included in miscellaneous expense on the Statement of Operations. MFS has agreed to reimburse the fund for a portion of the payments made by the fund in the amount of $3,733, which is shown as a reduction of total expenses in the Statement of Operations. Additionally, MFS has agreed to bear all expenses associated with office space, other administrative support, and supplies provided to the ICCO and Assistant ICCO.
The fund invests in the MFS Institutional Money Market Portfolio which is managed by MFS and seeks a high level of current income consistent with preservation of capital and liquidity. Income earned on this investment is included in dividends from underlying affiliated funds on the Statement of Operations. This money market fund does not pay a management fee to MFS.
Purchases and sales of investments, other than U.S. Government securities, purchased option transactions, short sales, and short-term obligations, aggregated $556,814,632 and $616,328,619, respectively.
| (5) | | Shares of Beneficial Interest |
The fund’s Declaration of Trust permits the Trustees to issue an unlimited number of full and fractional shares of beneficial interest. Transactions in fund shares were as follows:
| | | | | | | | | | | | | | | | |
| | | Year ended
8/31/11 | | | Year ended
8/31/10 | |
| | | Shares | | | Amount | | | Shares | | | Amount | |
| Shares sold | | | | | | | | | | | | | | | | |
Class A | | | 4,886,814 | | | | $87,065,132 | | | | 4,624,997 | | | | $70,737,632 | |
Class B | | | 381,981 | | | | 6,270,879 | | | | 369,255 | | | | 5,211,852 | |
Class C | | | 331,436 | | | | 5,405,042 | | | | 364,466 | | | | 5,048,103 | |
Class I | | | 428,166 | | | | 7,774,904 | | | | 63,817 | | | | 1,002,331 | |
Class R1 | | | 62,283 | | | | 1,005,894 | | | | 63,431 | | | | 875,557 | |
Class R2 | | | 295,251 | | | | 5,204,536 | | | | 211,483 | | | | 3,147,778 | |
Class R3 | | | 279,757 | | | | 4,940,411 | | | | 353,613 | | | | 5,393,441 | |
Class R4 | | | 68,795 | | | | 1,295,008 | | | | 16,813 | | | | 258,836 | |
| | | 6,734,483 | | | | $118,961,806 | | | | 6,067,875 | | | | $91,675,530 | |
44
Notes to Financial Statements – continued
| | | | | | | | | | | | | | | | |
| | | Year ended
8/31/11 | | | Year ended
8/31/10 | |
| | | Shares | | | Amount | | | Shares | | | Amount | |
| Shares issued to shareholders in reinvestment of distributions | | | | | | | | | | | | | | | | |
Class A | | | 208,104 | | | | $3,596,038 | | | | 292,183 | | | | $4,347,684 | |
Class B | | | — | | | | — | | | | 1,183 | | | | 16,329 | |
Class C | | | — | | | | — | | | | 15,133 | | | | 207,482 | |
Class I | | | 5,580 | | | | 100,211 | | | | 10,343 | | | | 159,905 | |
Class R1 | | | 158 | | | | 2,507 | | | | 1,296 | | | | 17,743 | |
Class R2 | | | 3,668 | | | | 62,246 | | | | 7,679 | | | | 112,189 | |
Class R3 | | | 12,054 | | | | 207,933 | | | | 15,468 | | | | 229,697 | |
Class R4 | | | 235 | | | | 4,074 | | | | 215 | | | | 3,215 | |
| | | 229,799 | | | | $3,973,009 | | | | 343,500 | | | | $5,094,244 | |
| | | | |
| Shares reacquired | | | | | | | | | | | | | | | | |
Class A | | | (6,918,023 | ) | | | $(122,403,344 | ) | | | (7,814,313 | ) | | | $(118,185,321 | ) |
Class B | | | (1,380,083 | ) | | | (22,465,178 | ) | | | (2,488,935 | ) | | | (35,058,366 | ) |
Class C | | | (801,075 | ) | | | (12,922,008 | ) | | | (974,400 | ) | | | (13,529,830 | ) |
Class I | | | (541,304 | ) | | | (9,296,042 | ) | | | (95,947 | ) | | | (1,530,135 | ) |
Class R1 | | | (89,561 | ) | | | (1,472,688 | ) | | | (82,019 | ) | | | (1,128,598 | ) |
Class R2 | | | (302,300 | ) | | | (5,273,008 | ) | | | (378,152 | ) | | | (5,663,523 | ) |
Class R3 | | | (232,254 | ) | | | (4,077,179 | ) | | | (406,135 | ) | | | (6,095,268 | ) |
Class R4 | | | (17,827 | ) | | | (328,247 | ) | | | (106,039 | ) | | | (1,735,967 | ) |
| | | (10,282,427 | ) | | | $(178,237,694 | ) | | | (12,345,940 | ) | | | $(182,927,008 | ) |
| | | | |
| Net change | | | | | | | | | | | | | | | | |
Class A | | | (1,823,105 | ) | | | $(31,742,174 | ) | | | (2,897,133 | ) | | | $(43,100,005 | ) |
Class B | | | (998,102 | ) | | | (16,194,299 | ) | | | (2,118,497 | ) | | | (29,830,185 | ) |
Class C | | | (469,639 | ) | | | (7,516,966 | ) | | | (594,801 | ) | | | (8,274,245 | ) |
Class I | | | (107,558 | ) | | | (1,420,927 | ) | | | (21,787 | ) | | | (367,899 | ) |
Class R1 | | | (27,120 | ) | | | (464,287 | ) | | | (17,292 | ) | | | (235,298 | ) |
Class R2 | | | (3,381 | ) | | | (6,226 | ) | | | (158,990 | ) | | | (2,403,556 | ) |
Class R3 | | | 59,557 | | | | 1,071,165 | | | | (37,054 | ) | | | (472,130 | ) |
Class R4 | | | 51,203 | | | | 970,835 | | | | (89,011 | ) | | | (1,473,916 | ) |
| | | (3,318,145 | ) | | | $(55,302,879 | ) | | | (5,934,565 | ) | | | $(86,157,234 | ) |
The fund and certain other funds managed by MFS participate in a $1.1 billion unsecured committed line of credit, subject to a $1 billion sublimit, provided by a syndication of banks under a credit agreement. Borrowings may be made for temporary financing needs. Interest is charged to each fund, based on its borrowings, generally at a rate equal to the higher of the Federal Reserve funds rate or one month LIBOR plus an agreed upon spread. A commitment fee, based on the average daily, unused portion of the committed line of credit, is allocated among the participating funds at the end of each calendar quarter. In
45
Notes to Financial Statements – continued
addition, the fund and other funds managed by MFS have established unsecured uncommitted borrowing arrangements with certain banks for temporary financing needs. Interest is charged to each fund, based on its borrowings, at a rate equal to the Federal Reserve funds rate plus an agreed upon spread. For the year ended August 31, 2011, the fund’s commitment fee and interest expense were $7,603 and $0, respectively, and are included in miscellaneous expense on the Statement of Operations.
| (7) | | Transactions in Underlying Affiliated Funds-Affiliated Issuers |
An affiliated issuer may be considered one in which the fund owns 5% or more of the outstanding voting securities, or a company which is under common control. For the purposes of this report, the fund assumes the following to be affiliated issuers:
| | | | | | | | | | | | | | | | |
| Underlying Affiliated Funds | | Beginning
Shares/Par
Amount | | | Acquisitions
Shares/Par
Amount | | | Dispositions
Shares/Par
Amount | | | Ending
Shares/Par
Amount | |
MFS Institutional Money
Market Portfolio | | | 238,798 | | | | 152,489,009 | | | | (144,414,458 | ) | | | 8,313,349 | |
| | | | |
| Underlying Affiliated Funds | | Realized
Gain (Loss) | | | Capital Gain
Distributions | | | Dividend
Income | | | Ending
Value | |
MFS Institutional Money Market Portfolio | | | $— | | | | $— | | | | $7,339 | | | | $8,313,349 | |
46
REPORT OF INDEPENDENT REGISTERED PUBLIC ACCOUNTING FIRM
To the Board of Trustees of MFS Series Trust I and Shareholders of
MFS Core Equity Fund:
We have audited the accompanying statement of assets and liabilities of MFS Core Equity Fund (the Fund) (one of the portfolios comprising MFS Series Trust I), including the portfolio of investments, as of August 31, 2011, and the related statement of operations for the year then ended, the statements of changes in net assets for each of the two years in the period then ended, and the financial highlights for each of the five years in the period then ended. These financial statements and financial highlights are the responsibility of the Fund’s management. Our responsibility is to express an opinion on these financial statements and financial highlights based on our audits.
We conducted our audits in accordance with the standards of the Public Company Accounting Oversight Board (United States). Those standards require that we plan and perform the audit to obtain reasonable assurance about whether the financial statements and financial highlights are free of material misstatement. We were not engaged to perform an audit of the Fund’s internal control over financial reporting. Our audits included consideration of internal control over financial reporting as a basis for designing audit procedures that are appropriate in the circumstances, but not for the purpose of expressing an opinion on the effectiveness of the Fund’s internal control over financial reporting. Accordingly, we express no such opinion. An audit also includes examining, on a test basis, evidence supporting the amounts and disclosures in the financial statements and financial highlights, assessing the accounting principles used and significant estimates made by management, and evaluating the overall financial statement presentation. Our procedures included confirmation of securities owned as of August 31, 2011, by correspondence with the custodian and brokers or by other appropriate auditing procedures where replies from brokers were not received. We believe that our audits provide a reasonable basis for our opinion.
In our opinion, the financial statements and financial highlights referred to above present fairly, in all material respects, the financial position of the MFS Core Equity Fund at August 31, 2011, the results of its operations for the year then ended, the changes in its net assets for each of the two years in the period then ended, and its financial highlights for each of the five years in the period then ended, in conformity with U.S. generally accepted accounting principles.

Boston, Massachusetts
October 17, 2011
47
TRUSTEES AND OFFICERS —
IDENTIFICATION AND BACKGROUND
The Trustees and officers of the Trust, as of October 1, 2011, are listed below, together with their principal occupations during the past five years. (Their titles may have varied during that period.) The address of each Trustee and officer is 500 Boylston Street, Boston, Massachusetts 02116.
| | | | | | | | |
Name, Age | | Position(s) Held with Fund | | Trustee/Officer
Since (h) | | Principal Occupations
During the Past Five Years | | Other
Directorships (j) |
| INTERESTED TRUSTEES |
Robert J. Manning (k)
(age 47) | | Trustee | | February 2004 | | Massachusetts Financial Services Company, Chairman, Chief Executive Officer and Director; President (until December 2009); Chief Investment Officer (until July 2010) | | |
Robert C. Pozen (k)
(age 65) | | Trustee | | February 2004 | | Massachusetts Financial Services Company, Chairman Emeritus; Chairman (until July 2010) | | Medtronic, Inc, (medical devices), Director (since 2004); The Neilsen Company (market research), Director (since 2010); Telesat (satellite communications), Director (until November 2007); Bell Canada Enterprises (telecommunications), Director (until February 2009) |
48
Trustees and Officers – continued
| | | | | | | | |
Name, Age | | Position(s) Held with Fund | | Trustee/Officer
Since (h) | | Principal Occupations
During the Past Five Years | | Other
Directorships (j) |
| INDEPENDENT TRUSTEES |
David H. Gunning
(age 69) | | Trustee and Chair of Trustees | | January 2004 | | Retired; Cleveland-Cliffs Inc. (mining products and service provider), Vice Chairman/Director (until May 2007) | | Lincoln Electric Holdings, Inc. (welding equipment manufacturer), Director; Development Alternatives, Inc. (consulting), Director/Non-Executive Chairman; Portman Limited (mining), Director (until 2008) |
Robert E. Butler
(age 69) | | Trustee | | January 2006 | | Consultant – investment company industry regulatory and compliance matters | | |
Maureen R. Goldfarb
(age 56) | | Trustee | | January 2009 | | Private investor | | |
William R. Gutow
(age 70) | | Trustee | | December 1993 | | Private investor and real estate consultant; Capitol Entertainment Management Company (video franchise), Vice Chairman | | Atlantic Coast Tan (tanning salons), Vice Chairman (until 2007); Texas Donuts (donut franchise), Vice Chairman (until 2010) |
Michael Hegarty
(age 66) | | Trustee | | December 2004 | | Private investor | | |
49
Trustees and Officers – continued
| | | | | | | | |
Name, Age | | Position(s) Held with Fund | | Trustee/Officer
Since (h) | | Principal Occupations
During the Past Five Years | | Other
Directorships (j) |
John P. Kavanaugh
(age 56) | | Trustee | | January 2009 | | Private investor; The Hanover Insurance Group, Inc., Vice President and Chief Investment Officer (until 2006); Allmerica Investment Trust, Allmerica Securities Trust and Opus Investment Trust (investment companies), Chairman, President and Trustee (until 2006) | | |
J. Dale Sherratt
(age 73) | | Trustee | | June 1989 | | Insight Resources, Inc. (acquisition planning specialists), President; Wellfleet Investments (investor in health care companies), Managing General Partner | | |
Laurie J. Thomsen
(age 54) | | Trustee | | March 2005 | | Private investor; New Profit, Inc. (venture philanthropy), Executive Partner (until 2010) | | The Travelers Companies (property and casualty insurance), Director |
Robert W. Uek
(age 70) | | Trustee | | January 2006 | | Consultant to investment company industry | | |
| OFFICERS | | | | | | | | |
Maria F. DiOrioDwyer (k)
(age 52) | | President | | March 2004 | | Massachusetts Financial Services Company, Executive Vice President and Chief Regulatory Officer Chief Compliance Officer (since December 2006) | | |
Christopher R. Bohane (k)
(age 37) | | Assistant Secretary and Assistant Clerk | | July 2005 | | Massachusetts Financial Services Company, Vice President and Senior Counsel | | |
50
Trustees and Officers – continued
| | | | | | | | |
Name, Age | | Position(s) Held with Fund | | Trustee/Officer
Since (h) | | Principal Occupations
During the Past Five Years | | Other
Directorships (j) |
John M. Corcoran (k)
(age 46) | | Treasurer | | October 2008 | | Massachusetts Financial Services Company, Senior Vice President (since October 2008); State Street Bank and Trust (financial services provider), Senior Vice President, (until September 2008) | | |
Ethan D. Corey (k)
(age 47) | | Assistant Secretary and Assistant Clerk | | July 2005 | | Massachusetts Financial Services Company, Senior Vice President and Associate General Counsel | | |
David L. DiLorenzo (k)
(age 43) | | Assistant Treasurer | | July 2005 | | Massachusetts Financial Services Company, Vice President | | |
Timothy M. Fagan (k)
(age 43) | | Assistant Secretary and Assistant Clerk | | September 2005 | | Massachusetts Financial Services Company, Vice President and Senior Counsel | | |
Robyn L. Griffin
(age 36) | | Assistant Independent Chief Compliance Officer | | August 2008 | | Griffin Compliance LLC (provider of compliance services), Principal (since August 2008); State Street Corporation (financial services provider), Mutual Fund Administration Assistant Vice President (October 2006 – July 2008); Liberty Mutual Group (insurance), Personal Market Assistant Controller (April 2006 – October 2006); Deloitte & Touche LLP (professional services firm). | | |
51
Trustees and Officers – continued
| | | | | | | | |
Name, Age | | Position(s) Held with Fund | | Trustee/Officer
Since (h) | | Principal Occupations
During the Past Five Years | | Other
Directorships (j) |
Brian E. Langenfeld (k)
(age 38) | | Assistant Secretary and Assistant Clerk | | June 2006 | | Massachusetts Financial Services Company, Vice President and Senior Counsel | | |
Ellen Moynihan (k)
(age 53) | | Assistant Treasurer | | April 1997 | | Massachusetts Financial Services Company, Senior Vice President | | |
Susan S. Newton (k)
(age 61) | | Assistant Secretary and Assistant Clerk | | May 2005 | | Massachusetts Financial Services Company, Senior Vice President and Associate General Counsel | | |
Susan A. Pereira (k)
(age 40) | | Assistant Secretary and Assistant Clerk | | July 2005 | | Massachusetts Financial Services Company, Vice President and Senior Counsel | | |
Mark N. Polebaum (k)
(age 59) | | Secretary and Clerk | | January 2006 | | Massachusetts Financial Services Company, Executive Vice President, General Counsel and Secretary | | |
Frank L. Tarantino
(age 67) | | Independent Chief Compliance Officer | | June 2004 | | Tarantino LLC (provider of compliance services), Principal | | |
Richard S. Weitzel (k)
(age 41) | | Assistant Secretary and Assistant Clerk | | October 2007 | | Massachusetts Financial Services Company, Vice President and Assistant General Counsel | | |
James O. Yost (k)
(age 51) | | Assistant Treasurer | | September 1990 | | Massachusetts Financial Services Company, Senior Vice President | | |
| (h) | Date first appointed to serve as Trustee/officer of an MFS fund. Each Trustee has served continuously since appointment unless indicated otherwise. For the period from December 15, 2004 until February 22, 2005, Messrs. Pozen and Manning served as Advisory Trustees. For the period March 2008 until October 2008, Ms. DiOrioDwyer served as Treasurer of the Funds. |
52
Trustees and Officers – continued
| (j) | Directorships or trusteeships of companies required to report to the Securities and Exchange Commission (i.e., “public companies”). |
| (k) | “Interested person” of the Trust within the meaning of the Investment Company Act of 1940 (referred to as the 1940 Act), which is the principal federal law governing investment companies like the fund, as a result of position with MFS. The address of MFS is 500 Boylston Street, Boston, Massachusetts 02116. |
Each Trustee has been elected by shareholders and each Trustee and officer holds office until his or her successor is chosen and qualified or until his or her earlier death, resignation, retirement or removal. The Trust does not hold annual meetings for the purpose of electing Trustees, and Trustees are not elected for fixed terms. Messrs. Butler, Kavanaugh, Uek and Ms. Thomsen are members of the Trust’s Audit Committee.
Each of the Fund’s Trustees and officers holds comparable positions with certain other funds of which MFS or a subsidiary is the investment adviser or distributor, and, in the case of the officers, with certain affiliates of MFS. As of January 1, 2011, the Trustees served as board members of 105 funds within the MFS Family of Funds.
The Statement of Additional Information for the Fund includes further information about the Trustees and is available without charge upon request by calling 1-800-225-2606.
| | |
| Investment Adviser | | Custodian |
Massachusetts Financial Services Company
500 Boylston Street, Boston, MA 02116-3741 | | State Street Bank and Trust
1 Lincoln Street, Boston, MA 02111-2900 |
| Distributor | | Independent Registered Public Accounting Firm |
MFS Fund Distributors, Inc.
500 Boylston Street, Boston, MA 02116-3741 | | Ernst & Young LLP 200 Clarendon Street, Boston, MA 02116 |
| Portfolio Manager | | |
| Joseph MacDougall | | |
53
BOARD REVIEW OF INVESTMENT
ADVISORY AGREEMENT
The Investment Company Act of 1940 requires that both the full Board of Trustees and a majority of the non-interested (“independent”) Trustees, voting separately, annually approve the continuation of the Fund’s investment advisory agreement with MFS. The Trustees consider matters bearing on the Fund and its advisory arrangements at their meetings throughout the year, including a review of performance data at each regular meeting. In addition, the independent Trustees met several times over the course of three months beginning in May and ending in July, 2011 (“contract review meetings”) for the specific purpose of considering whether to approve the continuation of the investment advisory agreement for the Fund and the other investment companies that the Board oversees (the “MFS Funds”). The independent Trustees were assisted in their evaluation of the Fund’s investment advisory agreement by independent legal counsel, from whom they received separate legal advice and with whom they met separately from MFS during various contract review meetings. The independent Trustees were also assisted in this process by the MFS Funds’ Independent Chief Compliance Officer, a full-time senior officer appointed by and reporting to the independent Trustees.
In connection with their deliberations regarding the continuation of the investment advisory agreement, the Trustees, including the independent Trustees, considered such information and factors as they believed, in light of the legal advice furnished to them and their own business judgment, to be relevant. The investment advisory agreement for the Fund was considered separately, although the Trustees also took into account the common interests of all MFS Funds in their review. As described below, the Trustees considered the nature, quality, and extent of the various investment advisory, administrative, and shareholder services performed by MFS under the existing investment advisory agreement and other arrangements with the Fund.
In connection with their contract review meetings, the Trustees received and relied upon materials that included, among other items: (i) information provided by Lipper Inc., an independent third party, on the investment performance of the Fund for various time periods ended December 31, 2010 and the investment performance of a group of funds with substantially similar investment classifications/objectives (the “Lipper performance universe”), (ii) information provided by Lipper Inc. on the Fund’s advisory fees and other expenses and the advisory fees and other expenses of comparable funds identified by Lipper Inc. (the “Lipper expense group”), (iii) information provided by MFS on the advisory fees of comparable portfolios of other clients of MFS, including institutional separate accounts and other clients, (iv) information as to whether and to what extent applicable expense waivers,
54
Board Review of Investment Advisory Agreement – continued
reimbursements or fee “breakpoints” are observed for the Fund, (v) information regarding MFS’ financial results and financial condition, including MFS’ and certain of its affiliates’ estimated profitability from services performed for the Fund and the MFS Funds as a whole, and compared to MFS’ institutional business, (vi) MFS’ views regarding the outlook for the mutual fund industry and the strategic business plans of MFS, (vii) descriptions of various functions performed by MFS for the Funds, such as compliance monitoring and portfolio trading practices, and (viii) information regarding the overall organization of MFS, including information about MFS’ senior management and other personnel providing investment advisory, administrative and other services to the Fund and the other MFS Funds. The comparative performance, fee and expense information prepared and provided by Lipper Inc. was not independently verified and the independent Trustees did not independently verify any information provided to them by MFS.
The Trustees’ conclusion as to the continuation of the investment advisory agreement was based on a comprehensive consideration of all information provided to the Trustees and not the result of any single factor. Some of the factors that figured particularly in the Trustees’ deliberations are described below, although individual Trustees may have evaluated the information presented differently from one another, giving different weights to various factors. It is also important to recognize that the fee arrangements for the Fund and other MFS Funds are the result of years of review and discussion between the independent Trustees and MFS, that certain aspects of such arrangements may receive greater scrutiny in some years than in others, and that the Trustees’ conclusions may be based, in part, on their consideration of these same arrangements during the course of the year and in prior years.
Based on information provided by Lipper Inc., the Trustees reviewed the Fund’s total return investment performance as well as the performance of peer groups of funds over various time periods. The Trustees placed particular emphasis on the total return performance of the Fund’s Class A shares in comparison to the performance of funds in its Lipper performance universe over the three-year period ended December 31, 2010, which the Trustees believed was a long enough period to reflect differing market conditions. The total return performance of the Fund’s Class A shares was in the 2nd quintile relative to the other funds in the universe for this three-year period (the 1st quintile being the best performers and the 5th quintile being the worst performers). The total return performance of the Fund’s Class A shares was in the 2nd quintile for each of the one- and five-year periods ended December 31, 2010 relative to the Lipper performance universe. Because of the passage of time, these performance results are likely to differ from the performance results for more recent periods, including those shown elsewhere in this report.
55
Board Review of Investment Advisory Agreement – continued
In the course of their deliberations, the Trustees took into account information provided by MFS in connection with the contract review meetings, as well as during investment review meetings conducted with portfolio management personnel during the course of the year regarding the Fund’s performance. After reviewing these and related factors, the Trustees concluded, within the context of their overall conclusions regarding the investment advisory agreement, that they were satisfied with MFS’ responses and efforts relating to investment performance.
In assessing the reasonableness of the Fund’s advisory fee, the Trustees considered, among other information, the Fund’s advisory fee and the total expense ratio of the Fund’s Class A shares as a percentage of average daily net assets and the advisory fee and total expense ratios of peer groups of funds based on information provided by Lipper Inc. The Trustees considered that MFS currently observes an expense limitation for the Fund, which may not be changed without the Trustees’ approval. The Trustees also considered that, according to the Lipper data (which takes into account any fee reductions or expense limitations that were in effect during the Fund’s last fiscal year), the Fund’s effective advisory fee rate and total expense ratio were each lower than the Lipper expense group median.
The Trustees also considered the advisory fees charged by MFS to institutional accounts. In comparing these fees, the Trustees considered information provided by MFS as to the generally broader scope of services provided by MFS to the Fund in comparison to institutional accounts, the higher demands placed on MFS’ investment personnel and trading infrastructure as a result of the daily cash in-flows and out-flows of the Fund, and the impact on MFS and expenses associated with the more extensive regulatory regime to which the Fund is subject in comparison to institutional accounts.
The Trustees also considered whether the Fund is likely to benefit from any economies of scale in the management of the Fund in the event of growth in assets of the Fund. They noted that the Fund’s advisory fee rate schedule is subject to a contractual breakpoint that reduces the Fund’s advisory fee rate on average daily net assets over $500 million. The Trustees concluded that the existing breakpoint was sufficient to allow the Fund to benefit from economies of scale as its assets grow.
The Trustees also considered information prepared by MFS relating to MFS’ costs and profits with respect to the Fund, the MFS Funds considered as a group, and other investment companies and accounts advised by MFS, as well as MFS’ methodologies used to determine and allocate its costs to the MFS Funds, the Fund and other accounts and products for purposes of estimating profitability.
56
Board Review of Investment Advisory Agreement – continued
After reviewing these and other factors described herein, the Trustees concluded, within the context of their overall conclusions regarding the investment advisory agreement, that the advisory fees charged to the Fund represent reasonable compensation in light of the services being provided by MFS to the Fund.
In addition, the Trustees considered MFS’ resources and related efforts to continue to retain, attract and motivate capable personnel to serve the Fund. The Trustees also considered current and developing conditions in the financial services industry, including the presence of large and well-capitalized companies which are spending, and appear to be prepared to continue to spend, substantial sums to engage personnel and to provide services to competing investment companies. In this regard, the Trustees also considered the financial resources of MFS and its ultimate parent, Sun Life Financial Inc. The Trustees also considered the advantages and possible disadvantages to the Fund of having an adviser that also serves other investment companies as well as other accounts.
The Trustees also considered the nature, quality, cost, and extent of administrative, transfer agency, and distribution services provided to the Fund by MFS and its affiliates under agreements and plans other than the investment advisory agreement, including any 12b-1 fees the Fund pays to MFS Fund Distributors, Inc., an affiliate of MFS. The Trustees also considered the nature, extent and quality of certain other services MFS performs or arranges for on the Fund’s behalf, which may include securities lending programs, directed expense payment programs, class action recovery programs, and MFS’ interaction with third-party service providers, principally custodians and sub-custodians. The Trustees concluded that the various non-advisory services provided by MFS and its affiliates on behalf of the Fund were satisfactory.
The Trustees also considered benefits to MFS from the use of the Fund’s portfolio brokerage commissions, if applicable, to pay for investment research, and various other factors. Additionally, the Trustees considered so-called “fall-out benefits” to MFS such as reputational value derived from serving as investment manager to the Fund.
Based on their evaluation of factors that they deemed to be material, including those factors described above, the Board of Trustees, including a majority of the independent Trustees, concluded that the Fund’s investment advisory agreement with MFS should be continued for an additional one-year period, commencing August 1, 2011.
A discussion regarding the Board’s most recent review and renewal of the fund’s Investment Advisory Agreement with MFS will be available on or about November 1, 2011 by clicking on the fund’s name under “Mutual Funds” in the “Products and Performance” section of the MFS Web site (mfs.com).
57
PROXY VOTING POLICIES AND INFORMATION
A general description of the MFS funds’ proxy voting policies and procedures is available without charge, upon request, by calling
1-800-225-2606, by visiting the Proxy Voting section of mfs.com or by visiting the SEC’s Web site at http://www.sec.gov.
Information regarding how the fund voted proxies relating to portfolio securities during the most recent twelve-month period ended June 30 is available without charge by visiting the Proxy Voting section of mfs.com or by visiting the SEC’s Web site at http://www.sec.gov.
QUARTERLY PORTFOLIO DISCLOSURE
The fund will file a complete schedule of portfolio holdings with the Securities and Exchange Commission (the Commission) for the first and third quarters of each fiscal year on Form N-Q. The fund’s Form N-Q may be reviewed and copied at the:
Public Reference Room
Securities and Exchange Commission
100 F Street, NE, Room 1580
Washington, D.C. 20549
Information on the operation of the Public Reference Room may be obtained by calling the Commission at 1-800-SEC-0330. The fund’s Form N-Q is available on the EDGAR database on the Commission’s Internet Web site at http://www.sec.gov, and copies of this information may be obtained, upon payment of a duplicating fee, by electronic request at the following e-mail address: publicinfo@sec.gov or by writing the Public Reference Section at the above address.
A shareholder can also obtain the quarterly portfolio holdings report at mfs.com.
FURTHER INFORMATION
From time to time, MFS may post important information about the fund or the MFS funds on the MFS web site (mfs.com). This information is available by visiting the “News & Commentary” section of mfs.com or by clicking on the fund’s name under “Mutual Funds” in the “Products and Performance” section of mfs.com.
FEDERAL TAX INFORMATION (unaudited)
The fund will notify shareholders of amounts for use in preparing 2011 income tax forms in January 2012. The following information is provided pursuant to provisions of the Internal Revenue Code.
The fund designates the maximum amount allowable as qualified dividend income eligible for the 15% tax rate.
For corporate shareholders, 100% of the ordinary income dividends paid during the fiscal year qualify for the corporate dividends received deduction.
58
rev. 3/11
| | | | |
| FACTS | | WHAT DOES MFS DO WITH YOUR PERSONAL INFORMATION? | |  |
| | |
| Why? | | Financial companies choose how they share your personal information. Federal law gives consumers the right to limit some but not all sharing. Federal law also requires us to tell you how we collect, share, and protect your personal information. Please read this notice carefully to understand what we do. |
| | |
| What? | | The types of personal information we collect and share depend on the product or service you have with us. This information can include: •Social Security number and account balances •Account transactions and transaction history •Checking account information and wire transfer instructions When you are no longer our customer, we continue to share your information as described in this notice. |
| | |
| How? | | All financial companies need to share customers’ personal information to run their everyday business. In the section below, we list the reasons financial companies can share their customers’ personal information; the reasons MFS chooses to share; and whether you can limit this sharing. |
| | | | |
| Reasons we can share your personal information | | Does MFS share? | | Can you limit
this sharing? |
For our everyday business purposes – such as to process your transactions, maintain your account(s), respond to court orders and legal investigations, or report to credit bureaus | | Yes | | No |
For our marketing purposes – to offer our products and services to you | | No | | We don’t share |
| For joint marketing with other financial companies | | No | | We don’t share |
For our affiliates’ everyday business purposes – information about your transactions and experiences | | No | | We don’t share |
For our affiliates’ everyday business purposes – information about your creditworthiness | | No | | We don’t share |
| For nonaffiliates to market to you | | No | | We don’t share |
| | |
| Questions? | | Call 800-225-2606 or go to mfs.com. |
59
| | |
| Who we are |
| Who is providing this notice? | | MFS Funds, MFS Investment Management, MFS Institutional Advisors, Inc., MFS Fund Distributors, Inc., MFS Heritage Trust Company, and MFS Service Center, Inc. |
| | |
| What we do |
| How does MFS protect my personal information? | | To protect your personal information from unauthorized access and use, we use security measures that comply with federal law. These measures include procedural, electronic, and physical safeguards for the protection of the personal information we collect about you. |
How does MFS
collect my personal information? | | We collect your personal information, for example, when you •open an account or provide account information •direct us to buy securities or direct us to sell your securities •make a wire transfer We also collect your personal information from others, such as credit bureaus, affiliates and other companies. |
| Why can’t I limit all sharing? | | Federal law gives you the right to limit only •sharing for affiliates’ everyday business purposes – information about your creditworthiness •affiliates from using your information to market to you •sharing for nonaffiliates to market to you State laws and individual companies may give you additional rights to limit sharing. |
| | |
| Definitions |
| Affiliates | | Companies related by common ownership or control. They can be financial and nonfinancial companies. •MFS does not share personal information with affiliates, except for everyday business purposes as described on page one of this notice. |
| Nonaffiliates | | Companies not related by common ownership or control. They can be financial and nonfinancial companies. •MFS does not share with nonaffiliates so they can market to you. |
| Joint Marketing | | A formal agreement between nonaffiliated financial companies that together market financial products or services to you. •MFS doesn’t jointly market. |
| | |
| Other important information |
| If you own an MFS product or receive an MFS service in the name of a third party such as a bank or broker-dealer, their privacy policy may apply to you instead of ours. |
60
Save paper with eDelivery.
MFS® will send you prospectuses, reports, and proxies directly via e-mail so you will get information faster with less mailbox clutter.
To sign up:
1. Go to mfs.com.
2. Log in via MFS® Access.
3. Select eDelivery.
If you own your MFS fund shares through a financial institution or a retirement plan, MFS® TALK, MFS® Access, or eDelivery may not be available to you.

Web site
mfs.com
MFS TALK
1-800-637-8255
24 hours a day
Account service and literature
Shareholders
1-800-225-2606
Financial advisors
1-800-343-2829
Retirement plan services
1-800-637-1255
Mailing address
MFS Service Center, Inc.
P.O. Box 55824
Boston, MA 02205-5824
Overnight mail
MFS Service Center, Inc.
c/o Boston Financial Data Services
30 Dan Road
Canton, MA 02021-2809

MFS® New Discovery Fund

ANNUAL REPORT
August 31, 2011
NDF-ANN
MFS® NEW DISCOVERY FUND
SIPC Contact Information: You may obtain information about the Securities Investor Protection Corporation (“SIPC”), including the SIPC Brochure, by contacting SIPC either by telephone (1-202-371-8300) or by accessing SIPC’s web site address (www.sipc.org).
The report is prepared for the general information of shareholders.
It is authorized for distribution to prospective investors only when preceded or accompanied by a current prospectus.
NOT FDIC INSURED Ÿ MAY LOSE VALUE Ÿ NO BANK GUARANTEE

LETTER FROM THE CEO
Dear Shareholders:
We are indeed living through some volatile times. Economic uncertainty is everywhere, as it seems no place in the world has been unmoved by crisis this year. We have seen a devastating earthquake and tsunami that have led to disruptions in the Japanese markets and supply chains. Protests have changed the face of the Middle East and left in their wake lingering tensions and resultant higher oil prices. We have seen debt limits tested in Europe and the United States and policymakers grappling to craft often unpopular monetary and fiscal responses at a time when consumers and businesses struggle with what appears to be a slowing global economy. On top of all of that, we have seen long-term U.S. debt lose its Standard & Poor’s AAA rating.
When markets become volatile, managing risk becomes a top priority for investors and their advisors. At MFS® risk management is foremost in our minds in all market climates. Our analysts and portfolio managers keep risks firmly in mind when evaluating securities. Additionally, we have a team of quantitative analysts that measures and assesses the risk profiles of our portfolios and securities on an ongoing basis. The chief investment risk officer, who oversees the team, reports directly to the firm’s president and chief investment officer so the risk associated with each portfolio can be assessed objectively and independently of the portfolio management team.
As always, we continue to be mindful of the many economic challenges faced at the local, national, and international levels. It is in times such as these that we want to remind investors of the merits of maintaining a long-term view, adhering to basic investing principles such as asset allocation and diversification, and working closely with their advisors to research and identify appropriate investment opportunities.
Respectfully,

Robert J. Manning
Chairman and Chief Executive Officer
MFS Investment Management®
October 17, 2011
The opinions expressed in this letter are subject to change, may not be relied upon for investment advice, and no forecasts can be guaranteed.
1
PORTFOLIO COMPOSITION
Portfolio structure

| | | | |
| Top ten holdings | | | | |
| Cabot Oil & Gas Corp. | | | 2.1% | |
| QuinStreet, Inc. | | | 2.1% | |
| Polypore International, Inc. | | | 1.9% | |
| WebMD Health Corp. | | | 1.8% | |
| F5 Networks, Inc. | | | 1.8% | |
| HomeAway, Inc. | | | 1.8% | |
| OpenTable, Inc. | | | 1.8% | |
| Brookdale Senior Living, Inc. | | | 1.6% | |
| LinkedIn Corp., “A” | | | 1.6% | |
| SuccessFactors, Inc. | | | 1.5% | |
| | | | |
| Equity sectors | | | | |
| Technology | | | 37.1% | |
| Industrial Goods & Services | | | 9.5% | |
| Energy | | | 8.3% | |
| Special Products & Services | | | 8.0% | |
| Financial Services | | | 7.0% | |
| Basic Materials | | | 6.0% | |
| Health Care | | | 5.8% | |
| Retailing | | | 5.5% | |
| Leisure | | | 4.4% | |
| Autos & Housing | | | 4.3% | |
| Transportation | | | 3.4% | |
| Consumer Staples | | | 0.5% | |
Percentages are based on net assets as of 8/31/11.
The portfolio is actively managed and current holdings may be different.
2
MANAGEMENT REVIEW
Summary of Results
For the twelve months ended August 31, 2011, Class A shares of the MFS New Discovery Fund (the “fund”) provided a total return of 26.13%, at net asset value. This compares with a return of 27.54% for the fund’s benchmark, the Russell 2000 Growth Index.
Market Environment
Early in the period, the U.S. Federal Reserve (the Fed) indicated that further monetary loosening would be forthcoming if macroeconomic activity did not show signs of improvement. The prospects for, and subsequent implementation of, more easing by the Fed improved market sentiment and drove risk-asset prices markedly higher. The December agreement on a surprisingly large (relative to expectations) expansionary U.S. fiscal package also boosted sentiment. During the subsequent several months, the renewed positive market sentiment, coupled with better indications of global macroeconomic activity, pushed many asset valuations to post-crisis highs. At the same time, global sovereign bond yields rose amidst the more “risk-seeking” environment.
However, towards the middle of the period, a weakening macroeconomic backdrop and renewed concerns over Greek debt sustainability began to challenge equity valuations and pushed sovereign bond yields lower. Towards the end of the reporting period, uncertainty in financial markets continued to increase. European policy makers debated and disagreed over elements of a new Greek bailout package, while Spanish and Italian bond yields increased markedly signaling a widening European crisis. In the U.S., concerns about sovereign debt default and the long term sustainability of the trend in U.S. fiscal policy resulted in one agency downgrading U.S. credit quality. Amidst this turmoil, global equity markets declined sharply. As a result of these developments, global consumer and producer sentiment indicators fell precipitously, highly-rated sovereign bond yields hit multi-decade lows and, despite a more mixed picture emanating from the “hard” data, markets grew increasingly worried about a return to global recession.
Detractors from Performance
Security selection in the retailing sector detracted from performance relative to the Russell 2000 Growth Index. The fund’s holdings of poor-performing urban fashion apparel retailer Citi Trends and specialty retailer hhgregg (h) weighed on results. Shares of Citi Trends declined as the company reported disappointing earnings results. Management attributed the results to weak consumer spending due to stagnant employment, rising food and gas prices, and lack luster government stimulus.
3
Management Review – continued
Stock selection and, to a lesser extent, the fund’s overweight position in the technology sector was another negative factor for relative performance. The timing of the fund’s ownership in shares of online marketing and media company QuinStreet dampened results. Holdings of semiconductor manufacturer Monolithic Power Systems, software developer Autonomy (b)(h), and healthcare services company DynaVox also hurt relative returns. Shares of DynaVox came under pressure as demand for their speech software and devices declined due to constrained school budgets and austerity measures by governments abroad.
Elsewhere, the fund’s holdings of marine fuel logistics company Aegean Marine Petroleum Network (b)(h), restaurant operator P.F. Chang’s China Bistro, ventricular assist device maker Thoratec (b)(h), and construction equipment company Eagle Materials held back relative performance. Shares of P.F. Chang’s China Bistro came under pressure as the company reported weak earnings results during the reporting period. The company experienced a decline in sales and increased food and labor related costs causing management to lower guidance for the year.
Contributors to Performance
Strong security selection in the industrial goods & services sector contributed to relative performance. Within this sector, holdings of electrical products manufacturer Sensata Technologies Holding (b) and industrial machinery manufacturer Bucyrus International (b)(h), had a positive effect on relative results. The fund’s overweight position in filtration and separation systems manufacturer Polypore International also helped.
Stock selection in the consumer staples sector benefited relative returns. The fund’s holdings of strong-performing specialty coffee producer Green Mountain Coffee Roasters (b)(h) supported results as the company outperformed the benchmark. Shares of Green Mountain Coffee Roasters rose as the company reported positive earnings results driven by increased sales growth in their single-serve segment and reductions in operating expenses. Management attributed increased demand for their single-serve platform to offering a broad variety of consumer coffee brands such as Starbucks and Dunkin Donuts.
A combination of favorable security selection and an overweight position in the energy sector aided relative returns. The fund’s holdings of oil and gas exploration companies Petrohawk Energy (b)(h) and Cabot Oil & Gas (b) were among the fund’s top relative contributors.
Individual standout performers in other sectors that helped relative performance included diversified mining company Molycorp and software developer PROS Holdings. Marketing software provider Constant Contact, and the timing of the fund’s ownership in communications equipment provider Aruba Networks, also contributed to relative returns.
4
Management Review – continued
Currency exposure was another factor that benefited the fund’s relative performance. All of MFS’ investment decisions are driven by the fundamentals of each individual opportunity and as such, it is common for our portfolios to have different currency exposure than the benchmark.
Respectfully,
Thomas Wetherald
Portfolio Manager
| (b) | Security is not a benchmark constituent. |
| (h) | Security was not held in the portfolio at period end. |
The views expressed in this report are those of the portfolio manager only through the end of the period of the report as stated on the cover and do not necessarily reflect the views of MFS or any other person in the MFS organization. These views are subject to change at any time based on market or other conditions, and MFS disclaims any responsibility to update such views. These views may not be relied upon as investment advice or an indication of trading intent on behalf of any MFS portfolio. References to specific securities are not recommendations of such securities, and may not be representative of any MFS portfolio’s current or future investments.
5
PERFORMANCE SUMMARY THROUGH 8/31/11
The following chart illustrates a representative class of the fund’s historical performance in comparison to its benchmark(s). Performance results include the deduction of the maximum applicable sales charge and reflect the percentage change in net asset value, including reinvestment of dividends and capital gains distributions. The performance of other share classes will be greater than or less than that of the class depicted below. Benchmarks are unmanaged and may not be invested in directly. Benchmark returns do not reflect sales charges, commissions or expenses. (See Notes to Performance Summary.)
Performance data shown represents past performance and is no guarantee of future results. Investment return and principal value fluctuate so your shares, when sold, may be worth more or less than the original cost; current performance may be lower or higher than quoted. The performance shown does not reflect the deduction of taxes, if any, that a shareholder would pay on fund distributions or the redemption of fund shares.
Growth of a Hypothetical $10,000 Investment
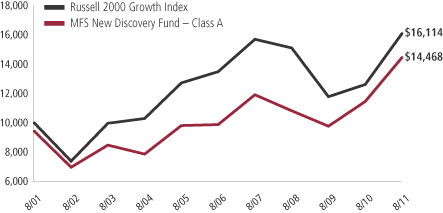
6
Performance Summary – continued
Total Returns through 8/31/11
Average annual without sales charge
| | | | | | | | | | | | | | |
| | | Share class | | Class inception date | | 1-yr | | 5-yr | | 10-yr | | Life (t) | | |
| | | A | | 1/02/97 | | 26.13% | | 7.92% | | 4.38% | | N/A | | |
| | | B | | 11/03/97 | | 25.18% | | 7.16% | | 3.68% | | N/A | | |
| | | C | | 11/03/97 | | 25.21% | | 7.16% | | 3.67% | | N/A | | |
| | | I | | 1/02/97 | | 26.53% | | 8.25% | | 4.72% | | N/A | | |
| | | R1 | | 4/01/05 | | 25.22% | | 7.14% | | N/A | | 7.32% | | |
| | | R2 | | 10/31/03 | | 25.79% | | 7.66% | | N/A | | 6.02% | | |
| | | R3 | | 4/01/05 | | 26.14% | | 7.93% | | N/A | | 8.11% | | |
| | | R4 | | 4/01/05 | | 26.49% | | 8.22% | | N/A | | 8.41% | | |
| | | 529A | | 7/31/02 | | 26.09% | | 7.77% | | N/A | | 8.18% | | |
| | | 529B | | 7/31/02 | | 25.08% | | 7.03% | | N/A | | 7.46% | | |
| | | 529C | | 7/31/02 | | 25.14% | | 7.02% | | N/A | | 7.44% | | |
| Comparative benchmark | | | | | | | | | | |
| | | Russell 2000 Growth Index (f) | | 27.54% | | 3.59% | | 4.89% | | N/A | | |
| Average annual with sales charge | | | | | | | | | | |
| | | A
With Initial Sales Charge (5.75%) | | 18.87% | | 6.64% | | 3.76% | | N/A | | |
| | | B
With CDSC (Declining over six years from 4% to 0%) (x) | | 21.18% | | 6.86% | | 3.68% | | N/A | | |
| | | C
With CDSC (1% for 12 months) (x) | | 24.21% | | 7.16% | | 3.67% | | N/A | | |
| | | 529A
With Initial Sales Charge (5.75%) | | 18.84% | | 6.50% | | N/A | | 7.47% | | |
| | | 529B
With CDSC (Declining over six years from 4% to 0%) (x) | | 21.08% | | 6.72% | | N/A | | 7.46% | | |
| | | 529C
With CDSC (1% for 12 months) (x) | | 24.14% | | 7.02% | | N/A | | 7.44% | | |
Class I, R1, R2, R3, and R4 shares do not have a sales charge.
CDSC – Contingent Deferred Sales Charge.
| (f) | Source: FactSet Research Systems Inc. |
| (t) | For the period from the class inception date through the stated period end (for those share classes with less than 10 years of performance history). No comparative benchmark performance information is provided for “life” periods. (See Notes to Performance Summary.) |
| (x) | Assuming redemption at the end of the applicable period. |
7
Performance Summary – continued
Benchmark Definition
Russell 2000 Growth Index – constructed to provide a comprehensive barometer for growth securities in the small-cap segment of the U.S. equity universe. Companies in this index generally have higher price-to-book ratios and higher forecasted growth values.
It is not possible to invest directly in an index.
Notes to Performance Summary
Average annual total return represents the average annual change in value for each share class for the periods presented. Life returns are presented where the share class has less than 10 years of performance history and represent the average annual total return from the class inception date to the stated period end date. As the fund’s share classes may have different inception dates, the life returns may represent different time periods and may not be comparable. As a result, no comparative benchmark performance information is provided for life periods.
Performance results reflect any applicable expense subsidies and waivers in effect during the periods shown. Without such subsidies and waivers the fund’s performance results would be less favorable. Please see the prospectus and financial statements for complete details.
Performance results do not include adjustments made for financial reporting purposes in accordance with U.S. generally accepted accounting principles and may differ from amounts reported in the financial highlights.
From time to time the fund may receive proceeds from litigation settlements, without which performance would be lower.
8
EXPENSE TABLE
Fund expenses borne by the shareholders during the period,
March 1, 2011 through August 31, 2011
As a shareholder of the fund, you incur two types of costs: (1) transaction costs, including sales charges (loads) on certain purchase or redemption payments, and (2) ongoing costs, including management fees; distribution and service (12b-1) fees; and other fund expenses. This example is intended to help you understand your ongoing costs (in dollars) of investing in the fund and to compare these costs with the ongoing costs of investing in other mutual funds.
The example is based on an investment of $1,000 invested at the beginning of the period and held for the entire period March 1, 2011 through August 31, 2011.
The expenses include the payment of a portion of the transfer-agent-related expenses of MFS funds that invest in the fund. For further information, please see the Notes to the Financial Statements.
Actual Expenses
The first line for each share class in the following table provides information about actual account values and actual expenses. You may use the information in this line, together with the amount you invested, to estimate the expenses that you paid over the period. Simply divide your account value by $1,000 (for example, an $8,600 account value divided by $1,000 = 8.6), then multiply the result by the number in the first line under the heading entitled “Expenses Paid During Period” to estimate the expenses you paid on your account during this period.
Hypothetical Example for Comparison Purposes
The second line for each share class in the following table provides information about hypothetical account values and hypothetical expenses based on the fund’s actual expense ratio and an assumed rate of return of 5% per year before expenses, which is not the fund’s actual return. The hypothetical account values and expenses may not be used to estimate the actual ending account balance or expenses you paid for the period. You may use this information to compare the ongoing costs of investing in the fund and other funds. To do so, compare this 5% hypothetical example with the 5% hypothetical examples that appear in the shareholder reports of the other funds.
Please note that the expenses shown in the table are meant to highlight your ongoing costs only and do not reflect any transactional costs, such as sales charges (loads). Therefore, the second line for each share class in the table is useful in comparing ongoing costs only, and will not help you determine the relative total costs of owning different funds. In addition, if these transactional costs were included, your costs would have been higher.
9
Expense Table – continued
| | | | | | | | | | | | | | | | | | |
Share
Class | | | | Annualized
Expense
Ratio | | | Beginning
Account Value
3/01/11 | | | Ending
Account Value
8/31/11 | | | Expenses
Paid During
Period (p)
3/01/11-8/31/11 | |
| A | | Actual | | | 1.30% | | | | $1,000.00 | | | | $883.29 | | | | $6.17 | |
| | Hypothetical (h) | | | 1.30% | | | | $1,000.00 | | | | $1,018.65 | | | | $6.61 | |
| B | | Actual | | | 2.05% | | | | $1,000.00 | | | | $879.88 | | | | $9.71 | |
| | Hypothetical (h) | | | 2.05% | | | | $1,000.00 | | | | $1,014.87 | | | | $10.41 | |
| C | | Actual | | | 2.06% | | | | $1,000.00 | | | | $880.03 | | | | $9.76 | |
| | Hypothetical (h) | | | 2.06% | | | | $1,000.00 | | | | $1,014.82 | | | | $10.46 | |
| I | | Actual | | | 1.05% | | | | $1,000.00 | | | | $884.67 | | | | $4.99 | |
| | Hypothetical (h) | | | 1.05% | | | | $1,000.00 | | | | $1,019.91 | | | | $5.35 | |
| R1 | | Actual | | | 2.05% | | | | $1,000.00 | | | | $880.22 | | | | $9.72 | |
| | Hypothetical (h) | | | 2.05% | | | | $1,000.00 | | | | $1,014.87 | | | | $10.41 | |
| R2 | | Actual | | | 1.55% | | | | $1,000.00 | | | | $882.19 | | | | $7.35 | |
| | Hypothetical (h) | | | 1.55% | | | | $1,000.00 | | | | $1,017.39 | | | | $7.88 | |
| R3 | | Actual | | | 1.31% | | | | $1,000.00 | | | | $883.59 | | | | $6.22 | |
| | Hypothetical (h) | | | 1.31% | | | | $1,000.00 | | | | $1,018.60 | | | | $6.67 | |
| R4 | | Actual | | | 1.05% | | | | $1,000.00 | | | | $884.84 | | | | $4.99 | |
| | Hypothetical (h) | | | 1.05% | | | | $1,000.00 | | | | $1,019.91 | | | | $5.35 | |
| 529A | | Actual | | | 1.39% | | | | $1,000.00 | | | | $883.15 | | | | $6.60 | |
| | Hypothetical (h) | | | 1.39% | | | | $1,000.00 | | | | $1,018.20 | | | | $7.07 | |
| 529B | | Actual | | | 2.13% | | | | $1,000.00 | | | | $879.81 | | | | $10.09 | |
| | Hypothetical (h) | | | 2.13% | | | | $1,000.00 | | | | $1,014.47 | | | | $10.82 | |
| 529C | | Actual | | | 2.14% | | | | $1,000.00 | | | | $879.86 | | | | $10.14 | |
| | Hypothetical (h) | | | 2.14% | | | | $1,000.00 | | | | $1,014.42 | | | | $10.87 | |
| (h) | 5% class return per year before expenses. |
| (p) | Expenses paid is equal to each class’ annualized expense ratio, as shown above, multiplied by the average account value over the period, multiplied by the number of days in the period, divided by the number of days in the year. Expenses paid do not include any applicable sales charges (loads). If these transaction costs had been included, your costs would have been higher. |
Expense Changes Impacting the Table
Changes to the fund’s fee arrangements occurred during the six month period. Had these fee changes been in effect throughout the entire six month period, the annualized expense ratios would have been 1.35%, 2.10% and 2.10% for Classes 529A, 529B and 529C, respectively; the actual expenses paid during the period would have been approximately $6.41, $9.95 and $9.95 for Classes 529A, 529B, and 529C respectively; and the hypothetical expenses paid during the period would have been approximately $6.87, $10.66 and $10.66 for Classes 529A, 529B and 529C, respectively. For further information about the fund’s fee arrangements and changes to those fee arrangements, please see Note 3 in the Notes to Financial Statements.
10
PORTFOLIO OF INVESTMENTS
8/31/11
The Portfolio of Investments is a complete list of all securities owned by your fund. It is categorized by broad-based asset classes.
| | | | | | | | |
| Common Stocks - 99.8% | | | | | | | | |
| Issuer | | Shares/Par | | | Value ($) | |
| | | | | | | | |
| Aerospace - 0.7% | | | | | | | | |
| HEICO Corp. | | | 160,610 | | | $ | 8,756,457 | |
| | |
| Airlines - 1.8% | | | | | | | | |
| Allegiant Travel Co. (a) | | | 189,630 | | | $ | 8,903,129 | |
| Spirit Airlines, Inc. (a) | | | 1,114,860 | | | | 13,467,509 | |
| | | | | | | | |
| | | | | | | $ | 22,370,638 | |
| Apparel Manufacturers - 1.0% | | | | | | | | |
| Arezzo Industria e Comercio S.A. | | | 860,910 | | | $ | 11,897,745 | |
| | |
| Biotechnology - 0.5% | | | | | | | | |
| Alimera Sciences, Inc. (a) | | | 119,790 | | | $ | 857,696 | |
| Anacor Pharmaceuticals, Inc. (a) | | | 705,880 | | | | 3,416,459 | |
| Pacific Biosciences of California, Inc. (a) | | | 193,620 | | | | 1,370,830 | |
| | | | | | | | |
| | | | | | | $ | 5,644,985 | |
| Broadcasting - 2.1% | | | | | | | | |
| QuinStreet, Inc. (a) | | | 2,090,042 | | | $ | 25,205,907 | |
| | |
| Business Services - 5.8% | | | | | | | | |
| Calix, Inc. (a) | | | 728,706 | | | $ | 10,770,275 | |
| Concur Technologies, Inc. (a) | | | 228,660 | | | | 9,562,561 | |
| Constant Contact, Inc. (a) | | | 891,743 | | | | 17,059,044 | |
| FleetCor Technologies, Inc. (a) | | | 595,730 | | | | 16,924,689 | |
| Jones Lang LaSalle, Inc. | | | 197,060 | | | | 13,185,285 | |
| LPS Brasil - Consultoria de Imoveis S.A. | | | 160,500 | | | | 3,523,761 | |
| | | | | | | | |
| | | | | | | $ | 71,025,615 | |
| Computer Software - 6.8% | | | | | | | | |
| Ariba, Inc. (a) | | | 401,140 | | | $ | 10,882,928 | |
| Check Point Software Technologies Ltd. (a) | | | 189,200 | | | | 10,300,048 | |
| CommVault Systems, Inc. (a) | | | 183,310 | | | | 6,216,042 | |
| Nuance Communications, Inc. (a) | | | 564,319 | | | | 10,473,761 | |
| Red Hat, Inc. (a) | | | 328,210 | | | | 12,977,423 | |
| SolarWinds, Inc. (a) | | | 536,640 | | | | 13,292,573 | |
| SuccessFactors, Inc. (a) | | | 801,080 | | | | 18,713,229 | |
| | | | | | | | |
| | | | | | | $ | 82,856,004 | |
11
Portfolio of Investments – continued
| | | | | | | | |
| Issuer | | Shares/Par | | | Value ($) | |
| | | | | | | | |
| Common Stocks - continued | | | | | | | | |
| Computer Software - Systems - 10.1% | | | | | | | | |
| Aruba Networks, Inc. (a) | | | 487,730 | | | $ | 10,403,281 | |
| BroadSoft, Inc. (a) | | | 407,050 | | | | 12,313,263 | |
| Cornerstone OnDemand, Inc. (a) | | | 556,257 | | | | 8,633,109 | |
| DemandTec, Inc. (a) | | | 1,274,610 | | | | 8,386,934 | |
| IntraLinks Holdings, Inc. (a) | | | 668,020 | | | | 6,259,347 | |
| National Instruments Corp. | | | 530,130 | | | | 13,481,206 | |
| PROS Holdings, Inc. (a) | | | 705,610 | | | | 11,190,975 | |
| Qlik Technologies, Inc. (a) | | | 380,880 | | | | 9,666,734 | |
| SciQuest, Inc. (a) | | | 761,440 | | | | 11,398,757 | |
| ServiceSource International, Inc. (a) | | | 559,240 | | | | 10,105,467 | |
| Tangoe, Inc. (a) | | | 1,068,962 | | | | 11,833,409 | |
| Velti PLC (a) | | | 442,000 | | | | 4,181,320 | |
| Verifone Systems, Inc. (a) | | | 154,740 | | | | 5,449,943 | |
| | | | | | | | |
| | | | | | | $ | 123,303,745 | |
| Construction - 4.3% | | | | | | | | |
| Beacon Roofing Supply, Inc. (a) | | | 631,550 | | | $ | 11,721,568 | |
| Eagle Materials, Inc. | | | 704,940 | | | | 13,901,410 | |
| NVR, Inc. (a) | | | 23,400 | | | | 14,894,100 | |
| Owens Corning (a) | | | 424,820 | | | | 12,345,269 | |
| | | | | | | | |
| | | | | | | $ | 52,862,347 | |
| Consumer Products - 0.5% | | | | | | | | |
| L’Occitane International S.A. (a) | | | 2,602,250 | | | $ | 6,249,867 | |
| | |
| Consumer Services - 2.2% | | | | | | | | |
| Anhanguera Educacional Participacoes S.A. | | | 293,500 | | | $ | 4,867,391 | |
| HomeAway, Inc. (a) | | | 514,000 | | | | 21,505,760 | |
| | | | | | | | |
| | | | | | | $ | 26,373,151 | |
| Electrical Equipment - 1.5% | | | | | | | | |
| MSC Industrial Direct Co., Inc., “A” | | | 178,600 | | | $ | 11,014,262 | |
| Sensata Technologies Holding B.V. (a) | | | 225,160 | | | | 7,304,190 | |
| | | | | | | | |
| | | | | | | $ | 18,318,452 | |
| Electronics - 5.5% | | | | | | | | |
| DynaVox, Inc., “A” (a) | | | 838,260 | | | $ | 5,658,255 | |
| Entegris, Inc. (a) | | | 945,000 | | | | 7,106,400 | |
| Hittite Microwave Corp. (a) | | | 180,130 | | | | 9,784,662 | |
| Inphi Corp. (a) | | | 300,620 | | | | 2,416,985 | |
| Monolithic Power Systems, Inc. (a) | | | 746,630 | | | | 9,429,937 | |
| Semtech Corp. (a) | | | 414,810 | | | | 8,847,897 | |
| Stratasys, Inc. (a) | | | 343,570 | | | | 7,950,210 | |
12
Portfolio of Investments – continued
| | | | | | | | |
| Issuer | | Shares/Par | | | Value ($) | |
| | | | | | | | |
| Common Stocks - continued | | | | | | | | |
| Electronics - continued | | | | | | | | |
| Veeco Instruments, Inc. (a)(l) | | | 454,530 | | | $ | 16,526,711 | |
| | | | | | | | |
| | | | | | | $ | 67,721,057 | |
| Energy - Independent - 6.9% | | | | | | | | |
| Brigham Exploration Co. (a) | | | 454,130 | | | $ | 13,215,183 | |
| Cabot Oil & Gas Corp. | | | 334,130 | | | | 25,347,102 | |
| Energy XXI (Bermuda) Ltd. (a) | | | 658,807 | | | | 17,662,616 | |
| EXCO Resources, Inc. | | | 1,108,001 | | | | 14,825,053 | |
| Oasis Petroleum LLC (a) | | | 508,065 | | | | 13,514,529 | |
| | | | | | | | |
| | | | | | | $ | 84,564,483 | |
| Food & Drug Stores - 0.1% | | | | | | | | |
| Sun Art Retail Group Ltd. (a) | | | 1,154,000 | | | $ | 1,455,497 | |
| | |
| Forest & Paper Products - 1.1% | | | | | | | | |
| Universal Forest Products, Inc. | | | 427,787 | | | $ | 13,073,171 | |
| | |
| Gaming & Lodging - 0.8% | | | | | | | | |
| Morgans Hotel Group Co. (a) | | | 1,379,852 | | | $ | 9,479,583 | |
| | |
| General Merchandise - 0.7% | | | | | | | | |
| Lojas Renner S.A. | | | 217,700 | | | $ | 8,184,776 | |
| | |
| Health Maintenance Organizations - 0.3% | | | | | | | | |
| OdontoPrev S.A. | | | 206,400 | | | $ | 3,565,551 | |
| | |
| Insurance - 1.4% | | | | | | | | |
| Brazil Insurance Participacoes e Administracao S.A. | | | 1,469,020 | | | $ | 17,533,375 | |
| | |
| Internet - 6.7% | | | | | | | | |
| Demand Media, Inc. (a) | | | 391,300 | | | $ | 3,384,745 | |
| LinkedIn Corp., “A” (a)(l) | | | 227,760 | | | | 19,159,171 | |
| LogMeIn, Inc. (a) | | | 170,870 | | | | 5,339,688 | |
| OpenTable, Inc. (a) | | | 350,590 | | | | 21,382,484 | |
| Shutterfly, Inc. (a) | | | 89,260 | | | | 4,789,692 | |
| TechTarget, Inc. (a) | | | 1,021,760 | | | | 6,529,046 | |
| WebMD Health Corp. (a) | | | 617,340 | | | | 21,816,796 | |
| | | | | | | | |
| | | | | | | $ | 82,401,622 | |
| Machinery & Tools - 7.3% | | | | | | | | |
| Douglas Dynamics, Inc. | | | 306,700 | | | $ | 4,453,284 | |
| Finning International, Inc. | | | 373,660 | | | | 9,542,772 | |
13
Portfolio of Investments – continued
| | | | | | | | |
| Issuer | | Shares/Par | | | Value ($) | |
| | | | | | | | |
| Common Stocks - continued | | | | | | | | |
| Machinery & Tools - continued | | | | | | | | |
| Herman Miller, Inc. | | | 515,240 | | | $ | 10,237,819 | |
| Joy Global, Inc. | | | 149,680 | | | | 12,490,796 | |
| Nordson Corp. | | | 5,330 | | | | 233,987 | |
| Polypore International, Inc. (a) | | | 376,557 | | | | 23,222,270 | |
| Thermon Group Holdings, Inc. (a) | | | 625,457 | | | | 9,744,620 | |
| United Rentals, Inc. (a) | | | 589,370 | | | | 9,830,692 | |
| WABCO Holdings, Inc. (a) | | | 195,850 | | | | 9,136,403 | |
| | | | | | | | |
| | | | | | | $ | 88,892,643 | |
| Medical & Health Technology & Services - 1.6% | | | | | | | | |
| Brookdale Senior Living, Inc. (a) | | | 1,232,670 | | | $ | 19,858,314 | |
| | |
| Medical Equipment - 3.4% | | | | | | | | |
| DexCom, Inc. (a) | | | 744,600 | | | $ | 8,957,538 | |
| Heartware International, Inc. (a) | | | 48,100 | | | | 3,021,161 | |
| IMRIS, Inc. (a) | | | 435,134 | | | | 1,866,725 | |
| Masimo Corp. | | | 347,710 | | | | 8,578,006 | |
| NxStage Medical, Inc. (a) | | | 619,821 | | | | 11,398,508 | |
| Uroplasty, Inc. (a)(h) | | | 1,342,802 | | | | 8,379,084 | |
| | | | | | | | |
| | | | | | | $ | 42,201,022 | |
| Metals & Mining - 1.7% | | | | | | | | |
| Globe Specialty Metals, Inc. | | | 683,110 | | | $ | 11,442,093 | |
| Molycorp, Inc. (a) | | | 159,560 | | | | 9,018,331 | |
| | | | | | | | |
| | | | | | | $ | 20,460,424 | |
| Network & Telecom - 8.0% | | | | | | | | |
| Acme Packet, Inc. (a) | | | 348,020 | | | $ | 16,388,262 | |
| Ciena Corp. (a) | | | 751,970 | | | | 9,204,113 | |
| F5 Networks, Inc. (a) | | | 266,930 | | | | 21,786,827 | |
| Finisar Corp. (a) | | | 631,630 | | | | 11,659,890 | |
| Fortinet, Inc. (a) | | | 798,450 | | | | 15,274,349 | |
| Polycom, Inc. (a) | | | 414,100 | | | | 9,855,580 | |
| Riverbed Technology, Inc. (a) | | | 552,060 | | | | 13,680,047 | |
| | | | | | | | |
| | | | | | | $ | 97,849,068 | |
| Oil Services - 1.4% | | | | | | | | |
| Dresser-Rand Group, Inc. (a) | | | 395,195 | | | $ | 16,776,028 | |
| | |
| Other Banks & Diversified Financials - 5.6% | | | | | | | | |
| BankUnited, Inc. | | | 458,660 | | | $ | 10,755,577 | |
| CVB Financial Corp. | | | 364,890 | | | | 3,181,841 | |
| First Interstate BancSystem, Inc. | | | 693,790 | | | | 8,457,300 | |
14
Portfolio of Investments – continued
| | | | | | | | |
| Issuer | | Shares/Par | | | Value ($) | |
| | | | | | | | |
| Common Stocks - continued | | | | | | | | |
| Other Banks & Diversified Financials - continued | | | | | | | | |
| First Republic Bank (a) | | | 355,630 | | | $ | 9,068,565 | |
| Metro Bancorp, Inc. (a)(h) | | | 718,350 | | | | 7,212,234 | |
| PacWest Bancorp | | | 593,570 | | | | 9,526,799 | |
| Wintrust Financial Corp. | | | 399,780 | | | | 12,625,052 | |
| Zipcar, Inc. (a)(l) | | | 366,740 | | | | 7,712,542 | |
| | | | | | | | |
| | | | | | | $ | 68,539,910 | |
| Precious Metals & Minerals - 1.7% | | | | | | | | |
| Colossus Minerals, Inc. (a) | | | 903,850 | | | $ | 5,796,158 | |
| Stillwater Mining Co. (a) | | | 959,890 | | | | 14,772,707 | |
| | | | | | | | |
| | | | | | | $ | 20,568,865 | |
| Restaurants - 1.5% | | | | | | | | |
| P.F. Chang’s China Bistro, Inc. | | | 597,820 | | | $ | 18,018,295 | |
| | |
| Specialty Chemicals - 1.5% | | | | | | | | |
| Ecosynthetix, Inc. (a)(z) | | | 344,420 | | | $ | 3,077,377 | |
| KiOR, Inc. “A” (a) | | | 222,610 | | | | 3,072,018 | |
| Rockwood Holdings, Inc. (a) | | | 238,340 | | | | 12,155,340 | |
| | | | | | | | |
| | | | | | | $ | 18,304,735 | |
| Specialty Stores - 3.7% | | | | | | | | |
| Citi Trends, Inc. (a)(h) | | | 1,114,620 | | | $ | 12,996,469 | |
| Francesca’s Holdings Corp. (a) | | | 679,140 | | | | 15,572,680 | |
| Urban Outfitters, Inc. (a) | | | 617,220 | | | | 16,155,734 | |
| | | | | | | | |
| | | | | | | $ | 44,724,883 | |
| Trucking - 1.6% | | | | | | | | |
| Atlas Air Worldwide Holdings, Inc. (a) | | | 243,858 | | | $ | 11,968,551 | |
| Swift Transportation Co. (a) | | | 932,320 | | | | 8,036,598 | |
| | | | | | | | |
| | | | | | | $ | 20,005,149 | |
| Total Common Stocks (Identified Cost, $1,312,916,154) | | | | | | $ | 1,219,043,364 | |
| | | | | | | | | | | | | | | | |
| | | | |
| | | Strike Price | | | First Exercise | | | | | | | |
| | | | | | | | | | | | | | | | |
| Warrants - 0.0% | | | | | | | | | | | | | | | | |
| Alcoholic Beverages - 0.0% | | | | | | | | | | | | | | | | |
Castle Brands, Inc.
(1 share for 1 warrant)
(Identified Cost, $155,725) (a)(z) | | $ | 6.57 | | | | 5/08/07 | | | | 110,880 | | | $ | 0 | |
15
Portfolio of Investments – continued
| | | | | | | | |
| Money Market Funds (v) - 0.7% | | | | | | | | |
| Issuer | | Shares/Par | | | Value ($) | |
| | | | | | | | |
MFS Institutional Money Market Portfolio, 0.08%,
at Cost and Net Asset Value | | | 8,947,281 | | | $ | 8,947,281 | |
| | |
| Collateral for Securities Loaned - 1.2% | | | | | | | | |
Navigator Securities Lending Prime Portfolio, 0.18%,
at Cost and Net Asset Value | | | 14,389,598 | | | $ | 14,389,598 | |
| Total Investments (Identified Cost, $1,336,408,758) | | | | | | $ | 1,242,380,243 | |
| | |
| Other Assets, Less Liabilities - (1.7)% | | | | | | | (21,283,096 | ) |
| Net Assets - 100.0% | | | | | | $ | 1,221,097,147 | |
| (a) | Non-income producing security. |
| (h) | Affiliated issuers are those in which the fund’s holdings of an issuer represent 5% or more of the outstanding voting securities of the issuer. |
| (l) | A portion of this security is on loan. |
| (v) | Underlying affiliated fund that is available only to investment companies managed by MFS. The rate quoted is the annualized seven-day yield of the fund at period end. |
| (z) | Restricted securities are not registered under the Securities Act of 1933 and are subject to legal restrictions on resale. These securities generally may be resold in transactions exempt from registration or to the public if the securities are subsequently registered. Disposal of these securities may involve time-consuming negotiations and prompt sale at an acceptable price may be difficult. The fund holds the following restricted securities: |
| | | | | | | | | | |
| Restricted Securities | | Acquisition Date | | Cost | | | Value | |
| Castle Brands, Inc. (Warrants) | | 4/18/07 | | | $155,725 | | | | $0 | |
| Ecosynthetix, Inc. | | 7/28/11 | | | 3,257,611 | | | | 3,077,377 | |
| Total Restricted Securities | | | | | | | | | $3,077,377 | |
| % of Net assets | | | | | | | | | 0.3% | |
The following abbreviations are used in this report and are defined:
| PLC | | Public Limited Company |
See Notes to Financial Statements
16
Financial Statements
STATEMENT OF ASSETS AND LIABILITIES
At 8/31/11
This statement represents your fund’s balance sheet, which details the assets and liabilities comprising the total value of the fund.
| | | | |
| Assets | | | | |
Investments- | | | | |
Non-affiliated issuers, at value (identified cost, $1,282,291,546) | | | $1,204,845,175 | |
Underlying affiliated funds, at cost and value | | | 8,947,281 | |
Other affiliated issuers, at value (identified cost, $45,169,931) | | | 28,587,787 | |
Total investments, at value, including $13,733,334 of securities on loan (identified cost, $1,336,408,758) | | | $1,242,380,243 | |
Cash | | | 3,200 | |
Receivables for | | | | |
Investments sold | | | 9,516,736 | |
Fund shares sold | | | 5,967,534 | |
Interest and dividends | | | 298,199 | |
Other assets | | | 2,191 | |
Total assets | | | $1,258,168,103 | |
| Liabilities | | | | |
Payables for | | | | |
Investments purchased | | | $19,643,208 | |
Fund shares reacquired | | | 2,450,345 | |
Collateral for securities loaned, at value | | | 14,389,598 | |
Payable to affiliates | | | | |
Investment adviser | | | 54,243 | |
Shareholder servicing costs | | | 324,652 | |
Distribution and service fees | | | 17,052 | |
Program manager fees | | | 9 | |
Payable for independent Trustees’ compensation | | | 6,617 | |
Accrued expenses and other liabilities | | | 185,232 | |
Total liabilities | | | $37,070,956 | |
Net assets | | | $1,221,097,147 | |
| Net assets consist of | | | | |
Paid-in capital | | | $1,134,371,963 | |
Unrealized appreciation (depreciation) on investments and translation of assets and liabilities in foreign currencies | | | (94,026,697 | ) |
Accumulated net realized gain (loss) on investments and foreign currency transactions | | | 180,758,486 | |
Accumulated net investment loss | | | (6,605 | ) |
Net assets | | | $1,221,097,147 | |
Shares of beneficial interest outstanding | | | 53,781,528 | |
17
Statement of Assets and Liabilities – continued
| | | | | | | | | | | | |
| | | Net assets | | | Shares
outstanding | | | Net asset value
per share (a) | |
Class A | | | $626,257,894 | | | | 27,670,434 | | | | $22.63 | |
Class B | | | 33,036,957 | | | | 1,593,485 | | | | 20.73 | |
Class C | | | 95,479,190 | | | | 4,599,449 | | | | 20.76 | |
Class I | | | 323,848,266 | | | | 13,621,820 | | | | 23.77 | |
Class R1 | | | 6,904,073 | | | | 334,366 | | | | 20.65 | |
Class R2 | | | 24,316,108 | | | | 1,100,572 | | | | 22.09 | |
Class R3 | | | 28,965,539 | | | | 1,280,628 | | | | 22.62 | |
Class R4 | | | 78,534,468 | | | | 3,408,045 | | | | 23.04 | |
Class 529A | | | 2,848,402 | | | | 128,210 | | | | 22.22 | |
Class 529B | | | 196,981 | | | | 9,680 | | | | 20.35 | |
Class 529C | | | 709,269 | | | | 34,839 | | | | 20.36 | |
| (a) | Maximum offering price per share was equal to the net asset value per share for all share classes, except for Classes A and 529A, for which the maximum offering prices per share were $24.01 [100 / 94.25 x $22.63] and $23.58 [100 / 94.25 x $22.22], respectively. On sales of $50,000 or more, the maximum offering prices of Class A and Class 529A shares are reduced. A contingent deferred sales charge may be imposed on redemptions of Class A, Class B, Class C, Class 529B, and Class 529C shares. Redemption price per share was equal to the net asset value per share for Classes I, R1, R2, R3, R4, and 529A. |
See Notes to Financial Statements
18
Financial Statements
STATEMENT OF OPERATIONS
Year ended 8/31/11
This statement describes how much your fund earned in investment income and accrued in expenses.
It also describes any gains and/or losses generated by fund operations.
| | | | |
| Net investment loss | | | | |
Income | | | | |
Dividends | | | $4,353,692 | |
Income on securities loaned | | | 589,834 | |
Dividends from underlying affiliated funds | | | 18,585 | |
Foreign taxes withheld | | | (88,243 | ) |
Total investment income | | | $4,873,868 | |
Expenses | | | | |
Management fee | | | $11,055,268 | |
Distribution and service fees | | | 2,886,435 | |
Program manager fees | | | 3,632 | |
Shareholder servicing costs | | | 2,193,567 | |
Administrative services fee | | | 179,969 | |
Independent Trustees’ compensation | | | 28,541 | |
Custodian fee | | | 233,473 | |
Shareholder communications | | | 77,688 | |
Auditing fees | | | 72,584 | |
Legal fees | | | 20,477 | |
Miscellaneous | | | 236,608 | |
Total expenses | | | $16,988,242 | |
Fees paid indirectly | | | (310 | ) |
Reduction of expenses by investment adviser and distributor | | | (1,237,129 | ) |
Net expenses | | | $15,750,803 | |
Net investment loss | | | $(10,876,935 | ) |
Realized and unrealized gain (loss) on investments
and foreign currency transactions | | | | |
Realized gain (loss) (identified cost basis) | | | | |
Investment transactions (net of $331,168 country tax): | | | | |
Non-affiliated issuers | | | $329,957,493 | |
Other affiliated issuers | | | (761,719 | ) |
Foreign currency transactions | | | (1,209,567 | ) |
Net realized gain (loss) on investments
and foreign currency transactions | | | $327,986,207 | |
Change in unrealized appreciation (depreciation) | | | | |
Investments (net of $114,829 decrease in deferred country tax) | | | $(137,592,570 | ) |
Translation of assets and liabilities in foreign currencies | | | (75 | ) |
Net unrealized gain (loss) on investments
and foreign currency translation | | | $(137,592,645 | ) |
Net realized and unrealized gain (loss) on investments
and foreign currency | | | $190,393,562 | |
Change in net assets from operations | | | $179,516,627 | |
See Notes to Financial Statements
19
Financial Statements
STATEMENTS OF CHANGES IN NET ASSETS
These statements describe the increases and/or decreases in net assets resulting from operations, any distributions, and any shareholder transactions.
| | | | | | | | |
| | | Years ended 8/31 | |
| | | 2011 | | | 2010 | |
| Change in net assets | | | | | | |
| From operations | | | | | | | | |
Net investment loss | | | $(10,876,935 | ) | | | $(6,281,951 | ) |
Net realized gain (loss) on investments and
foreign currency transactions | | | 327,986,207 | | | | 170,529,066 | |
Net unrealized gain (loss) on investments and
foreign currency translation | | | (137,592,645 | ) | | | (64,141,052 | ) |
Change in net assets from operations | | | $179,516,627 | | | | $100,106,063 | |
| Distributions declared to shareholders | | | | | | | | |
From net realized gain on investments | | | $(61,172,098 | ) | | | $— | |
Change in net assets from fund share transactions | | | $359,488,004 | | | | $39,070,198 | |
Total change in net assets | | | $477,832,533 | | | | $139,176,261 | |
| Net assets | | | | | | | | |
At beginning of period | | | 743,264,614 | | | | 604,088,353 | |
At end of period (including accumulated net investment
loss of $6,605 and $7,601, respectively) | | | $1,221,097,147 | | | | $743,264,614 | |
See Notes to Financial Statements
20
Financial Statements
FINANCIAL HIGHLIGHTS
The financial highlights table is intended to help you understand the fund’s financial performance for the past 5 years. Certain information reflects financial results for a single fund share. The total returns in the table represent the rate by which an investor would have earned (or lost) on an investment in the fund share class (assuming reinvestment of all distributions) held for the entire period.
| | | | | | | | | | | | | | | | | | | | |
| Class A | | Years ended 8/31 | |
| | | 2011 | | | 2010 | | | 2009 | | | 2008 | | | 2007 | |
Net asset value, beginning of period | | | $19.03 | | | | $16.22 | | | | $17.96 | | | | $20.48 | | | | $16.96 | |
| Income (loss) from investment operations | | | | | | | | | | | | | | | | | |
Net investment loss (d) | | | $(0.22 | ) | | | $(0.17 | ) | | | $(0.13 | ) | | | $(0.16 | ) | | | $(0.16 | ) |
Net realized and unrealized gain (loss) on
investments and foreign currency | | | 5.23 | | | | 2.98 | | | | (1.61 | )(g) | | | (1.70 | ) | | | 3.68 | |
Total from investment operations | | | $5.01 | | | | $2.81 | | | | $(1.74 | ) | | | $(1.86 | ) | | | $3.52 | |
| Less distributions declared to shareholders | | | | | | | | | | | | | | | | | |
From net realized gain on investments | | | $(1.41 | ) | | | $— | | | | $— | | | | $(0.66 | ) | | | $— | |
Redemption fees added to paid-in capital (d) | | | $— | | | | $— | | | | $— | | | | $— | | | | $0.00 | (w) |
Net asset value, end of period | | | $22.63 | | | | $19.03 | | | | $16.22 | | | | $17.96 | | | | $20.48 | |
Total return (%) (r)(s)(t)(x) | | | 26.13 | | | | 17.32 | | | | (9.69 | ) | | | (9.31 | ) | | | 20.75 | |
Ratios (%) (to average net assets)
and Supplemental data: | | | | | | | | | | | | | | | | | |
Expenses before expense reductions (f) | | | 1.40 | | | | 1.51 | | | | 1.70 | | | | 1.61 | | | | 1.57 | |
Expenses after expense reductions (f) | | | 1.30 | | | | 1.41 | | | | 1.60 | | | | 1.51 | | | | 1.47 | |
Net investment loss | | | (0.90 | ) | | | (0.92 | ) | | | (1.05 | ) | | | (0.86 | ) | | | (1.04 | ) |
Portfolio turnover | | | 205 | | | | 167 | | | | 150 | | | | 95 | | | | 94 | |
Net assets at end of period (000 omitted) | | | $626,258 | | | | $338,380 | | | | $248,658 | | | | $282,079 | | | | $395,993 | |
See Notes to Financial Statements
21
Financial Highlights – continued
| | | | | | | | | | | | | | | | | | | | |
| Class B | | Years ended 8/31 | |
| | | 2011 | | | 2010 | | | 2009 | | | 2008 | | | 2007 | |
Net asset value, beginning of period | | | $17.65 | | | | $15.16 | | | | $16.90 | | | | $19.44 | | | | $16.20 | |
| Income (loss) from investment operations | | | | | | | | | | | | | | | | | | | | |
Net investment loss (d) | | | $(0.37 | ) | | | $(0.29 | ) | | | $(0.21 | ) | | | $(0.27 | ) | | | $(0.25 | ) |
Net realized and unrealized gain (loss) on
investments and foreign currency | | | 4.86 | | | | 2.78 | | | | (1.53 | )(g) | | | (1.61 | ) | | | 3.49 | |
Total from investment operations | | | $4.49 | | | | $2.49 | | | | $(1.74 | ) | | | $(1.88 | ) | | | $3.24 | |
| Less distributions declared to shareholders | | | | | | | | | | | | | | | | | | | | |
From net realized gain on investments | | | $(1.41 | ) | | | $— | | | | $— | | | | $(0.66 | ) | | | $— | |
Redemption fees added to paid-in capital (d) | | | $— | | | | $— | | | | $— | | | | $— | | | | $0.00 | (w) |
Net asset value, end of period | | | $20.73 | | | | $17.65 | | | | $15.16 | | | | $16.90 | | | | $19.44 | |
Total return (%) (r)(s)(t)(x) | | | 25.18 | | | | 16.42 | | | | (10.30 | ) | | | (9.92 | ) | | | 20.00 | |
Ratios (%) (to average net assets)
and Supplemental data: | | | | | | | | | | | | | | | | | | | | |
Expenses before expense reductions (f) | | | 2.15 | | | | 2.26 | | | | 2.41 | | | | 2.27 | | | | 2.22 | |
Expenses after expense reductions (f) | | | 2.05 | | | | 2.16 | | | | 2.30 | | | | 2.17 | | | | 2.12 | |
Net investment loss | | | (1.65 | ) | | | (1.67 | ) | | | (1.76 | ) | | | (1.53 | ) | | | (1.69 | ) |
Portfolio turnover | | | 205 | | | | 167 | | | | 150 | | | | 95 | | | | 94 | |
Net assets at end of period (000 omitted) | | | $33,037 | | | | $26,777 | | | | $27,582 | | | | $38,724 | | | | $91,922 | |
| | | | | | | | | | | | | | | | | | | | |
| Class C | | Years ended 8/31 | |
| | | 2011 | | | 2010 | | | 2009 | | | 2008 | | | 2007 | |
Net asset value, beginning of period | | | $17.67 | | | | $15.18 | | | | $16.93 | | | | $19.46 | | | | $16.22 | |
| Income (loss) from investment operations | | | | | | | | | | | | | | | | | | | | |
Net investment loss (d) | | | $(0.37 | ) | | | $(0.30 | ) | | | $(0.21 | ) | | | $(0.27 | ) | | | $(0.25 | ) |
Net realized and unrealized gain (loss) on
investments and foreign currency | | | 4.87 | | | | 2.79 | | | | (1.54 | )(g) | | | (1.60 | ) | | | 3.49 | |
Total from investment operations | | | $4.50 | | | | $2.49 | | | | $(1.75 | ) | | | $(1.87 | ) | | | $3.24 | |
| Less distributions declared to shareholders | | | | | | | | | | | | | | | | | | | | |
From net realized gain on investments | | | $(1.41 | ) | | | $— | | | | $— | | | | $(0.66 | ) | | | $— | |
Redemption fees added to paid-in capital (d) | | | $— | | | | $— | | | | $— | | | | $— | | | | $0.00 | (w) |
Net asset value, end of period | | | $20.76 | | | | $17.67 | | | | $15.18 | | | | $16.93 | | | | $19.46 | |
Total return (%) (r)(s)(t)(x) | | | 25.21 | | | | 16.40 | | | | (10.34 | ) | | | (9.86 | ) | | | 19.98 | |
Ratios (%) (to average net assets)
and Supplemental data: | | | | | | | | | | | | | | | | | | | | |
Expenses before expense reductions (f) | | | 2.15 | | | | 2.26 | | | | 2.40 | | | | 2.26 | | | | 2.22 | |
Expenses after expense reductions (f) | | | 2.05 | | | | 2.16 | | | | 2.30 | | | | 2.16 | | | | 2.12 | |
Net investment loss | | | (1.65 | ) | | | (1.67 | ) | | | (1.75 | ) | | | (1.51 | ) | | | (1.69 | ) |
Portfolio turnover | | | 205 | | | | 167 | | | | 150 | | | | 95 | | | | 94 | |
Net assets at end of period (000 omitted) | | | $95,479 | | | | $37,144 | | | | $25,431 | | | | $29,661 | | | | $42,296 | |
See Notes to Financial Statements
22
Financial Highlights – continued
| | | | | | | | | | | | | | | | | | | | |
| Class I | | Years ended 8/31 | |
| | | 2011 | | | 2010 | | | 2009 | | | 2008 | | | 2007 | |
Net asset value, beginning of period | | | $19.88 | | | | $16.91 | | | | $18.67 | | | | $21.19 | | | | $17.48 | |
| Income (loss) from investment operations | | | | | | | | | | | | | | | | | |
Net investment loss (d) | | | $(0.17 | ) | | | $(0.13 | ) | | | $(0.10 | ) | | | $(0.10 | ) | | | $(0.11 | ) |
Net realized and unrealized gain (loss) on
investments and foreign currency | | | 5.47 | | | | 3.10 | | | | (1.66 | )(g) | | | (1.76 | ) | | | 3.82 | |
Total from investment operations | | | $5.30 | | | | $2.97 | | | | $(1.76 | ) | | | $(1.86 | ) | | | $3.71 | |
| Less distributions declared to shareholders | | | | | | | | | | | | | | | | | |
From net realized gain on investments | | | $(1.41 | ) | | | $— | | | | $— | | | | $(0.66 | ) | | | $— | |
Redemption fees added to paid-in capital (d) | | | $— | | | | $— | | | | $— | | | | $— | | | | $0.00 | (w) |
Net asset value, end of period | | | $23.77 | | | | $19.88 | | | | $16.91 | | | | $18.67 | | | | $21.19 | |
Total return (%) (r)(s)(x) | | | 26.48 | | | | 17.56 | | | | (9.43 | ) | | | (8.99 | ) | | | 21.22 | |
Ratios (%) (to average net assets)
and Supplemental data: | | | | | | | | | | | | | | | | | |
Expenses before expense reductions (f) | | | 1.15 | | | | 1.26 | | | | 1.35 | | | | 1.26 | | | | 1.22 | |
Expenses after expense reductions (f) | | | 1.05 | | | | 1.16 | | | | 1.25 | | | | 1.16 | | | | 1.12 | |
Net investment loss | | | (0.65 | ) | | | (0.67 | ) | | | (0.71 | ) | | | (0.51 | ) | | | (0.69 | ) |
Portfolio turnover | | | 205 | | | | 167 | | | | 150 | | | | 95 | | | | 94 | |
Net assets at end of period (000 omitted) | | | $323,848 | | | | $263,575 | | | | $238,410 | | | | $90,045 | | | | $100,245 | |
| | | | | | | | | | | | | | | | | | | | |
| Class R1 | | Years ended 8/31 | |
| | | 2011 | | | 2010 | | | 2009 | | | 2008 | | | 2007 | |
Net asset value, beginning of period | | | $17.58 | | | | $15.10 | | | | $16.84 | | | | $19.37 | | | | $16.16 | |
| Income (loss) from investment operations | | | | | | | | | | | | | | | | | |
Net investment loss (d) | | | $(0.37 | ) | | | $(0.29 | ) | | | $(0.21 | ) | | | $(0.27 | ) | | | $(0.26 | ) |
Net realized and unrealized gain (loss) on
investments and foreign currency | | | 4.85 | | | | 2.77 | | | | (1.53 | )(g) | | | (1.60 | ) | | | 3.47 | |
Total from investment operations | | | $4.48 | | | | $2.48 | | | | $(1.74 | ) | | | $(1.87 | ) | | | $3.21 | |
| Less distributions declared to shareholders | | | | | | | | | | | | | | | | | |
From net realized gain on investments | | | $(1.41 | ) | | | $— | | | | $— | | | | $(0.66 | ) | | | $— | |
Redemption fees added to paid-in capital (d) | | | $— | | | | $— | | | | $— | | | | $— | | | | $0.00 | (w) |
Net asset value, end of period | | | $20.65 | | | | $17.58 | | | | $15.10 | | | | $16.84 | | | | $19.37 | |
Total return (%) (r)(s)(x) | | | 25.22 | | | | 16.42 | | | | (10.33 | ) | | | (9.91 | ) | | | 19.86 | |
Ratios (%) (to average net assets)
and Supplemental data: | | | | | | | | | | | | | | | | | |
Expenses before expense reductions (f) | | | 2.15 | | | | 2.26 | | | | 2.40 | | | | 2.30 | | | | 2.37 | |
Expenses after expense reductions (f) | | | 2.05 | | | | 2.16 | | | | 2.30 | | | | 2.20 | | | | 2.22 | |
Net investment loss | | | (1.65 | ) | | | (1.67 | ) | | | (1.76 | ) | | | (1.54 | ) | | | (1.79 | ) |
Portfolio turnover | | | 205 | | | | 167 | | | | 150 | | | | 95 | | | | 94 | |
Net assets at end of period (000 omitted) | | | $6,904 | | | | $5,253 | | | | $4,217 | | | | $4,565 | | | | $2,609 | |
See Notes to Financial Statements
23
Financial Highlights – continued
| | | | | | | | | | | | | | | | | | | | |
| Class R2 | | Years ended 8/31 | |
| | | 2011 | | | 2010 | | | 2009 | | | 2008 | | | 2007 | |
Net asset value, beginning of period | | | $18.65 | | | | $15.94 | | | | $17.68 | | | | $20.21 | | | | $16.78 | |
| Income (loss) from investment operations | | | | | | | | | | | | | | | | | | | | |
Net investment loss (d) | | | $(0.28 | ) | | | $(0.22 | ) | | | $(0.16 | ) | | | $(0.19 | ) | | | $(0.20 | ) |
Net realized and unrealized gain (loss) on
investments and foreign currency | | | 5.13 | | | | 2.93 | | | | (1.58 | )(g) | | | (1.68 | ) | | | 3.63 | |
Total from investment operations | | | $4.85 | | | | $2.71 | | | | $(1.74 | ) | | | $(1.87 | ) | | | $3.43 | |
| Less distributions declared to shareholders | | | | | | | | | | | | | | | | | | | | |
From net realized gain on investments | | | $(1.41 | ) | | | $— | | | | $— | | | | $(0.66 | ) | | | $— | |
Redemption fees added to paid-in capital (d) | | | $— | | | | $— | | | | $— | | | | $— | | | | $0.00 | (w) |
Net asset value, end of period | | | $22.09 | | | | $18.65 | | | | $15.94 | | | | $17.68 | | | | $20.21 | |
Total return (%) (r)(s)(x) | | | 25.79 | | | | 17.00 | | | | (9.84 | ) | | | (9.48 | ) | | | 20.44 | |
Ratios (%) (to average net assets)
and Supplemental data: | | | | | | | | | | | | | | | | | | | | |
Expenses before expense reductions (f) | | | 1.65 | | | | 1.76 | | | | 1.90 | | | | 1.80 | | | | 1.92 | |
Expenses after expense reductions (f) | | | 1.55 | | | | 1.66 | | | | 1.80 | | | | 1.70 | | | | 1.77 | |
Net investment loss | | | (1.15 | ) | | | (1.17 | ) | | | (1.26 | ) | | | (1.03 | ) | | | (1.34 | ) |
Portfolio turnover | | | 205 | | | | 167 | | | | 150 | | | | 95 | | | | 94 | |
Net assets at end of period (000 omitted) | | | $24,316 | | | | $13,125 | | | | $11,312 | | | | $13,675 | | | | $8,711 | |
| | | | | | | | | | | | | | | | | | | | |
| Class R3 | | Years ended 8/31 | |
| | | 2011 | | | 2010 | | | 2009 | | | 2008 | | | 2007 | |
Net asset value, beginning of period | | | $19.02 | | | | $16.22 | | | | $17.94 | | | | $20.45 | | | | $16.94 | |
| Income (loss) from investment operations | | | | | | | | | | | | | | | | | | | | |
Net investment loss (d) | | | $(0.22 | ) | | | $(0.18 | ) | | | $(0.13 | ) | | | $(0.15 | ) | | | $(0.17 | ) |
Net realized and unrealized gain (loss) on
investments and foreign currency | | | 5.23 | | | | 2.98 | | | | (1.59 | )(g) | | | (1.70 | ) | | | 3.68 | |
Total from investment operations | | | $5.01 | | | | $2.80 | | | | $(1.72 | ) | | | $(1.85 | ) | | | $3.51 | |
| Less distributions declared to shareholders | | | | | | | | | | | | | | | | | | | | |
From net realized gain on investments | | | $(1.41 | ) | | | $— | | | | $— | | | | $(0.66 | ) | | | $— | |
Redemption fees added to paid-in capital (d) | | | $— | | | | $— | | | | $— | | | | $— | | | | $0.00 | (w) |
Net asset value, end of period | | | $22.62 | | | | $19.02 | | | | $16.22 | | | | $17.94 | | | | $20.45 | |
Total return (%) (r)(s)(x) | | | 26.14 | | | | 17.26 | | | | (9.59 | ) | | | (9.27 | ) | | | 20.72 | |
Ratios (%) (to average net assets)
and Supplemental data: | | | | | | | | | | | | | | | | | | | | |
Expenses before expense reductions (f) | | | 1.40 | | | | 1.51 | | | | 1.65 | | | | 1.57 | | | | 1.62 | |
Expenses after expense reductions (f) | | | 1.30 | | | | 1.41 | | | | 1.55 | | | | 1.47 | | | | 1.52 | |
Net investment loss | | | (0.90 | ) | | | (0.93 | ) | | | (1.00 | ) | | | (0.82 | ) | | | (1.09 | ) |
Portfolio turnover | | | 205 | | | | 167 | | | | 150 | | | | 95 | | | | 94 | |
Net assets at end of period (000 omitted) | | | $28,966 | | | | $6,456 | | | | $3,492 | | | | $4,204 | | | | $4,654 | |
See Notes to Financial Statements
24
Financial Highlights – continued
| | | | | | | | | | | | | | | | | | | | |
| Class R4 | | Years ended 8/31 | |
| | | 2011 | | | 2010 | | | 2009 | | | 2008 | | | 2007 | |
Net asset value, beginning of period | | | $19.31 | | | | $16.42 | | | | $18.13 | | | | $20.60 | | | | $17.01 | |
| Income (loss) from investment operations | | | | | | | | | | | | | | | | | | | | |
Net investment loss (d) | | | $(0.16 | ) | | | $(0.13 | ) | | | $(0.10 | ) | | | $(0.10 | ) | | | $(0.12 | ) |
Net realized and unrealized gain (loss) on
investments and foreign currency | | | 5.30 | | | | 3.02 | | | | (1.61 | )(g) | | | (1.71 | ) | | | 3.71 | |
Total from investment operations | | | $5.14 | | | | $2.89 | | | | $(1.71 | ) | | | $(1.81 | ) | | | $3.59 | |
| Less distributions declared to shareholders | | | | | | | | | | | | | | | | | | | | |
From net realized gain on investments | | | $(1.41 | ) | | | $— | | | | $— | | | | $(0.66 | ) | | | $— | |
Redemption fees added to paid-in capital (d) | | | $— | | | | $— | | | | $— | | | | $— | | | | $0.00 | (w) |
Net asset value, end of period | | | $23.04 | | | | $19.31 | | | | $16.42 | | | | $18.13 | | | | $20.60 | |
Total return (%) (r)(s)(x) | | | 26.43 | | | | 17.60 | | | | (9.43 | ) | | | (9.00 | ) | | | 21.11 | |
Ratios (%) (to average net assets)
and Supplemental data: | | | | | | | | | | | | | | | | | | | | |
Expenses before expense reductions (f) | | | 1.15 | | | | 1.26 | | | | 1.40 | | | | 1.30 | | | | 1.32 | |
Expenses after expense reductions (f) | | | 1.05 | | | | 1.16 | | | | 1.30 | | | | 1.20 | | | | 1.22 | |
Net investment loss | | | (0.66 | ) | | | (0.67 | ) | | | (0.76 | ) | | | (0.55 | ) | | | (0.79 | ) |
Portfolio turnover | | | 205 | | | | 167 | | | �� | 150 | | | | 95 | | | | 94 | |
Net assets at end of period (000 omitted) | | | $78,534 | | | | $50,147 | | | | $42,974 | | | | $55,828 | | | | $67,212 | |
| | | | | | | | | | | | | | | | | | | | |
| Class 529A | | Years ended 8/31 | |
| | | 2011 | | | 2010 | | | 2009 | | | 2008 | | | 2007 | |
Net asset value, beginning of period | | | $18.71 | | | | $15.97 | | | | $17.70 | | | | $20.23 | | | | $16.79 | |
| Income (loss) from investment operations | | | | | | | | | | | | | | | | | | | | |
Net investment loss (d) | | | $(0.24 | ) | | | $(0.19 | ) | | | $(0.14 | ) | | | $(0.19 | ) | | | $(0.21 | ) |
Net realized and unrealized gain (loss) on
investments and foreign currency | | | 5.16 | | | | 2.93 | | | | (1.59 | )(g) | | | (1.68 | ) | | | 3.65 | |
Total from investment operations | | | $4.92 | | | | $2.74 | | | | $(1.73 | ) | | | $(1.87 | ) | | | $3.44 | |
| Less distributions declared to shareholders | | | | | | | | | | | | | | | | | | | | |
From net realized gain on investments | | | $(1.41 | ) | | | $— | | | | $— | | | | $(0.66 | ) | | | $— | |
Redemption fees added to paid-in capital (d) | | | $— | | | | $— | | | | $— | | | | $— | | | | $0.00 | (w) |
Net asset value, end of period | | | $22.22 | | | | $18.71 | | | | $15.97 | | | | $17.70 | | | | $20.23 | |
Total return (%) (r)(s)(t)(x) | | | 26.09 | | | | 17.16 | | | | (9.77 | ) | | | (9.48 | ) | | | 20.49 | |
Ratios (%) (to average net assets)
and Supplemental data: | | | | | | | | | | | | | | | | | | | | |
Expenses before expense reductions (f) | | | 1.50 | | | | 1.61 | | | | 1.80 | | | | 1.80 | | | | 1.82 | |
Expenses after expense reductions (f) | | | 1.39 | | | | 1.51 | | | | 1.70 | | | | 1.70 | | | | 1.72 | |
Net investment loss | | | (0.99 | ) | | | (1.02 | ) | | | (1.15 | ) | | | (1.04 | ) | | | (1.29 | ) |
Portfolio turnover | | | 205 | | | | 167 | | | | 150 | | | | 95 | | | | 94 | |
Net assets at end of period (000 omitted) | | | $2,848 | | | | $1,735 | | | | $1,444 | | | | $1,568 | | | | $1,715 | |
See Notes to Financial Statements
25
Financial Highlights – continued
| | | | | | | | | | | | | | | | | | | | |
| Class 529B | | Years ended 8/31 | |
| | | 2011 | | | 2010 | | | 2009 | | | 2008 | | | 2007 | |
Net asset value, beginning of period | | | $17.36 | | | | $14.92 | | | | $16.65 | | | | $19.20 | | | | $16.03 | |
| Income (loss) from investment operations | | | | | | | | | | | | | | | | | | | | |
Net investment loss (d) | | | $(0.38 | ) | | | $(0.31 | ) | | | $(0.22 | ) | | | $(0.29 | ) | | | $(0.28 | ) |
Net realized and unrealized gain (loss) on
investments and foreign currency | | | 4.78 | | | | 2.75 | | | | (1.51 | )(g) | | | (1.60 | ) | | | 3.45 | |
Total from investment operations | | | $4.40 | | | | $2.44 | | | | $(1.73 | ) | | | $(1.89 | ) | | | $3.17 | |
| Less distributions declared to shareholders | | | | | | | | | | | | | | | | | | | | |
From net realized gain on investments | | | $(1.41 | ) | | | $— | | | | $— | | | | $(0.66 | ) | | | $— | |
Redemption fees added to paid-in capital (d) | | | $— | | | | $— | | | | $— | | | | $— | | | | $0.00 | (w) |
Net asset value, end of period | | | $20.35 | | | | $17.36 | | | | $14.92 | | | | $16.65 | | | | $19.20 | |
Total return (%) (r)(s)(t)(x) | | | 25.08 | | | | 16.35 | | | | (10.39 | ) | | | (10.10 | ) | | | 19.78 | |
Ratios (%) (to average net assets)
and Supplemental data: | | | | | | | | | | | | | | | | | | | | |
Expenses before expense reductions (f) | | | 2.24 | | | | 2.36 | | | | 2.50 | | | | 2.45 | | | | 2.47 | |
Expenses after expense reductions (f) | | | 2.14 | | | | 2.26 | | | | 2.40 | | | | 2.35 | | | | 2.37 | |
Net investment loss | | | (1.74 | ) | | | (1.77 | ) | | | (1.85 | ) | | | (1.70 | ) | | | (1.94 | ) |
Portfolio turnover | | | 205 | | | | 167 | | | | 150 | | | | 95 | | | | 94 | |
Net assets at end of period (000 omitted) | | | $197 | | | | $204 | | | | $175 | | | | $212 | | | | $239 | |
See Notes to Financial Statements
26
Financial Highlights – continued
| | | | | | | | | | | | | | | | | | | | |
| Class 529C | | Years ended 8/31 | |
| | | 2011 | | | 2010 | | | 2009 | | | 2008 | | | 2007 | |
Net asset value, beginning of period | | | $17.36 | | | | $14.93 | | | | $16.66 | | | | $19.21 | | | | $16.04 | |
| Income (loss) from investment operations | | | | | | | | | | | | | | | | | | | | |
Net investment loss (d) | | | $(0.38 | ) | | | $(0.31 | ) | | | $(0.22 | ) | | | $(0.29 | ) | | | $(0.28 | ) |
Net realized and unrealized gain (loss) on
investments and foreign currency | | | 4.79 | | | | 2.74 | | | | (1.51 | )(g) | | | (1.60 | ) | | | 3.45 | |
Total from investment operations | | | $4.41 | | | | $2.43 | | | | $(1.73 | ) | | | $(1.89 | ) | | | $3.17 | |
| Less distributions declared to shareholders | | | | | | | | | | | | | | | | | | | | |
From net realized gain on investments | | | $(1.41 | ) | | | $— | | | | $— | | | | $(0.66 | ) | | | $— | |
Redemption fees added to paid-in capital (d) | | | $— | | | | $— | | | | $— | | | | $— | | | | $0.00 | (w) |
Net asset value, end of period | | | $20.36 | | | | $17.36 | | | | $14.93 | | | | $16.66 | | | | $19.21 | |
Total return (%) (r)(s)(t)(x) | | | 25.14 | | | | 16.28 | | | | (10.38 | ) | | | (10.10 | ) | | | 19.76 | |
Ratios (%) (to average net assets)
and Supplemental data: | | | | | | | | | | | | | | | | | | | | |
Expenses before expense reductions (f) | | | 2.25 | | | | 2.36 | | | | 2.48 | | | | 2.45 | | | | 2.47 | |
Expenses after expense reductions (f) | | | 2.14 | | | | 2.26 | | | | 2.38 | | | | 2.34 | | | | 2.37 | |
Net investment loss | | | (1.74 | ) | | | (1.78 | ) | | | (1.83 | ) | | | (1.70 | ) | | | (1.94 | ) |
Portfolio turnover | | | 205 | | | | 167 | | | | 150 | | | | 95 | | | | 94 | |
Net assets at end of period (000 omitted) | | | $709 | | | | $469 | | | | $393 | | | | $299 | | | | $323 | |
| (d) | Per share data is based on average shares outstanding. |
| (f) | Ratios do not reflect reductions from fees paid indirectly, if applicable. |
| (g) | The per share amount varies from the net realized and unrealized gain/loss for the period because of the timing of sales of fund shares and the per share amount of realized and unrealized gains and losses at such time. |
| (r) | Certain expenses have been reduced without which performance would have been lower. |
| (s) | From time to time the fund may receive proceeds from litigation settlements, without which performance would be lower. |
| (t) | Total returns do not include any applicable sales charges. |
| (w) | Per share amount was less than $0.01. |
| (x) | Total returns have been calculated on net asset values which include adjustments made in accordance with U.S. generally accepted accounting principles required at period end for financial reporting purposes. |
See Notes to Financial Statements
27
NOTES TO FINANCIAL STATEMENTS
| (1) | | Business and Organization |
MFS New Discovery Fund (the fund) is a series of MFS Series Trust I (the trust). The trust is organized as a Massachusetts business trust and is registered under the Investment Company Act of 1940, as amended, as an open-end management investment company.
| (2) | | Significant Accounting Policies |
General – The preparation of financial statements in conformity with U.S. generally accepted accounting principles requires management to make estimates and assumptions that affect the reported amounts of assets and liabilities, and disclosure of contingent assets and liabilities at the date of the financial statements and the reported amounts of revenues and expenses during the reporting period. Actual results could differ from those estimates. In the preparation of these financial statements, management has evaluated subsequent events occurring after the date of the fund’s Statement of Assets and Liabilities through the date that the financial statements were issued. The fund will generally focus on securities of small size companies which may be more volatile than those of larger companies.
Investment Valuations – Equity securities, including restricted equity securities, are generally valued at the last sale or official closing price as provided by a third-party pricing service on the market or exchange on which they are primarily traded. Equity securities, for which there were no sales reported that day, are generally valued at the last quoted daily bid quotation as provided by a third-party pricing service on the market or exchange on which such securities are primarily traded. Equity securities held short, for which there were no sales reported for that day, are generally valued at the last quoted daily ask quotation as provided by a third-party pricing service on the market or exchange on which such securities are primarily traded. Short-term instruments with a maturity at issuance of 60 days or less generally are valued at amortized cost, which approximates market value. Open-end investment companies are generally valued at net asset value per share. Securities and other assets generally valued on the basis of information from a third-party pricing service may also be valued at a broker/dealer bid quotation. Values obtained from third-party pricing services can utilize both transaction data and market information such as yield, quality, coupon rate, maturity, type of issue, trading characteristics, and other market data. The values of foreign securities and other assets and liabilities expressed in foreign currencies are converted to U.S. dollars using the mean of bid and asked prices for rates provided by a third-party pricing service.
28
Notes to Financial Statements – continued
The Board of Trustees has delegated primary responsibility for determining or causing to be determined the value of the fund’s investments (including any fair valuation) to the adviser pursuant to valuation policies and procedures approved by the Board. If the adviser determines that reliable market quotations are not readily available, investments are valued at fair value as determined in good faith by the adviser in accordance with such procedures under the oversight of the Board of Trustees. Under the fund’s valuation policies and procedures, market quotations are not considered to be readily available for most types of debt instruments and floating rate loans and many types of derivatives. These investments are generally valued at fair value based on information from third-party pricing services. In addition, investments may be valued at fair value if the adviser determines that an investment’s value has been materially affected by events occurring after the close of the exchange or market on which the investment is principally traded (such as foreign exchange or market) and prior to the determination of the fund’s net asset value, or after the halting of trading of a specific security where trading does not resume prior to the close of the exchange or market on which the security is principally traded. Events that occur on a frequent basis after foreign markets close (such as developments in foreign markets and significant movements in the U.S. markets) and prior to the determination of the fund’s net asset value may be deemed to have a material effect on the value of securities traded in foreign markets. Accordingly, the fund’s foreign equity securities may often be valued at fair value. The adviser generally relies on third-party pricing services or other information (such as the correlation with price movements of similar securities in the same or other markets; the type, cost and investment characteristics of the security; the business and financial condition of the issuer; and trading and other market data) to assist in determining whether to fair value and at what value to fair value an investment. The value of an investment for purposes of calculating the fund’s net asset value can differ depending on the source and method used to determine value. When fair valuation is used, the value of an investment used to determine the fund’s net asset value may differ from quoted or published prices for the same investment. There can be no assurance that the fund could obtain the fair value assigned to an investment if it were to sell the investment at the same time at which the fund determines its net asset value per share.
Various inputs are used in determining the value of the fund’s assets or liabilities. These inputs are categorized into three broad levels. In certain cases, the inputs used to measure fair value may fall into different levels of the fair value hierarchy. In such cases, an investment’s level within the fair value hierarchy is based on the lowest level of input that is significant to the fair value measurement. The fund’s assessment of the significance of a particular input to the fair value measurement in its entirety requires judgment, and
29
Notes to Financial Statements – continued
considers factors specific to the investment. Level 1 includes unadjusted quoted prices in active markets for identical assets or liabilities. Level 2 includes other significant observable market-based inputs (including quoted prices for similar securities, interest rates, prepayment speed, and credit risk). Level 3 includes unobservable inputs, which may include the adviser’s own assumptions in determining the fair value of investments. The following is a summary of the levels used as of August 31, 2011 in valuing the fund’s assets or liabilities:
| | | | | | | | | | | | | | | | |
| Investments at Value | | Level 1 | | | Level 2 | | | Level 3 | | | Total | |
| Equity Securities: | | | | | | | | | | | | | | | | |
United States | | | $1,127,001,001 | | | | $0 | | | | $— | | | | $1,127,001,001 | |
Brazil | | | 49,572,599 | | | | — | | | | — | | | | 49,572,599 | |
Canada | | | 17,205,655 | | | | 3,077,377 | | | | — | | | | 20,283,032 | |
Israel | | | 10,300,048 | | | | — | | | | — | | | | 10,300,048 | |
Luxembourg | | | — | | | | 6,249,867 | | | | — | | | | 6,249,867 | |
Ireland | | | 4,181,320 | | | | — | | | | — | | | | 4,181,320 | |
China | | | 1,455,497 | | | | — | | | | — | | | | 1,455,497 | |
| Mutual Funds | | | 23,336,879 | | | | — | | | | — | | | | 23,336,879 | |
| Total Investments | | | $1,233,052,999 | | | | $9,327,244 | | | | $— | | | | $1,242,380,243 | |
For further information regarding security characteristics, see the Portfolio of Investments.
Foreign Currency Translation – Purchases and sales of foreign investments, income, and expenses are converted into U.S. dollars based upon currency exchange rates prevailing on the respective dates of such transactions or on the reporting date for foreign denominated receivables and payables. Gains and losses attributable to foreign currency exchange rates on sales of securities are recorded for financial statement purposes as net realized gains and losses on investments. Gains and losses attributable to foreign exchange rate movements on receivables, payables, income and expenses are recorded for financial statement purposes as foreign currency transaction gains and losses. That portion of both realized and unrealized gains and losses on investments that results from fluctuations in foreign currency exchange rates is not separately disclosed.
Security Loans – State Street Bank and Trust Company (“State Street”), as lending agent, loans the securities of the fund to certain qualified institutions (the “Borrowers”) approved by the fund. The loans are collateralized by cash and/or U.S. Treasury and federal agency obligations in an amount typically at least equal to the market value of the securities loaned. The market value of the loaned securities is determined at the close of business of the fund and any additional required collateral is delivered to the fund on the next business day. State Street provides the fund with indemnification against Borrower default.
30
Notes to Financial Statements – continued
The fund bears the risk of loss with respect to the investment of cash collateral. On loans collateralized by cash, the cash collateral is invested in a money market fund or short-term securities. A portion of the income generated upon investment of the collateral is remitted to the Borrowers, and the remainder is allocated between the fund and the lending agent. On loans collateralized by U.S. Treasury and/or federal agency obligations, a fee is received from the Borrower, and is allocated between the fund and the lending agent. Income from securities lending is separately reported on the Statement of Operations. The dividend and interest income earned on the securities loaned is accounted for in the same manner as other dividend and interest income.
Indemnifications – Under the fund’s organizational documents, its officers and Trustees may be indemnified against certain liabilities and expenses arising out of the performance of their duties to the fund. Additionally, in the normal course of business, the fund enters into agreements with service providers that may contain indemnification clauses. The fund’s maximum exposure under these agreements is unknown as this would involve future claims that may be made against the fund that have not yet occurred.
Investment Transactions and Income – Investment transactions are recorded on the trade date. Dividends received in cash are recorded on the ex-dividend date. Certain dividends from foreign securities will be recorded when the fund is informed of the dividend if such information is obtained subsequent to the ex-dividend date. Dividend and interest payments received in additional securities are recorded on the ex-dividend or ex-interest date in an amount equal to the value of the security on such date.
The fund may receive proceeds from litigation settlements. Any proceeds received from litigation involving portfolio holdings are reflected in the Statement of Operations in realized gain/loss if the security has been disposed of by the fund or in unrealized gain/loss if the security is still held by the fund. Any other proceeds from litigation not related to portfolio holdings are reflected as other income in the Statement of Operations.
Fees Paid Indirectly – The fund’s custody fee may be reduced according to an arrangement that measures the value of cash deposited with the custodian by the fund. This amount, for the year ended August 31, 2011, is shown as a reduction of total expenses on the Statement of Operations.
Tax Matters and Distributions – The fund intends to qualify as a regulated investment company, as defined under Subchapter M of the Internal Revenue Code, and to distribute all of its taxable income, including realized capital gains. As a result, no provision for federal income tax is required. The fund’s federal tax returns for the prior three fiscal years remain subject to examination by the Internal Revenue Service. Foreign taxes, if any, have been accrued by the fund in the accompanying financial statements.
31
Notes to Financial Statements – continued
Distributions to shareholders are recorded on the ex-dividend date. Income and capital gain distributions are determined in accordance with income tax regulations, which may differ from U.S. generally accepted accounting principles. Certain capital accounts in the financial statements are periodically adjusted for permanent differences in order to reflect their tax character. These adjustments have no impact on net assets or net asset value per share. Temporary differences which arise from recognizing certain items of income, expense, gain or loss in different periods for financial statement and tax purposes will reverse at some time in the future. Distributions in excess of net investment income or net realized gains are temporary overdistributions for financial statement purposes resulting from differences in the recognition or classification of income or distributions for financial statement and tax purposes.
Book/tax differences primarily relate to net operating losses, wash sale loss deferrals, and treating a portion of the proceeds from redemptions as a distribution for tax purposes.
The tax character of distributions declared to shareholders for the last two fiscal years is as follows:
| | | | | | | | |
| | | 8/31/11 | | | 8/31/10 | |
| Ordinary income (including any short-term capital gains) | | | $39,099,017 | | | | $— | |
| Long-term capital gain | | | 22,073,081 | | | | — | |
| Total distributions | | | $61,172,098 | | | | $— | |
The federal tax cost and the tax basis components of distributable earnings were as follows:
| | | | |
| As of 8/31/11 | | | |
| Cost of investments | | | $1,363,192,271 | |
| Gross appreciation | | | 73,536,885 | |
| Gross depreciation | | | (194,348,913 | ) |
| Net unrealized appreciation (depreciation) | | | $(120,812,028 | ) |
| Undistributed ordinary income | | | 177,237,344 | |
| Undistributed long-term capital gain | | | 30,304,655 | |
| Other temporary differences | | | (4,787 | ) |
Multiple Classes of Shares of Beneficial Interest – The fund offers multiple classes of shares, which differ in their respective distribution, service, and program manager fees. The fund’s income, realized and unrealized gain (loss), and common expenses are allocated to shareholders based on the daily net assets of each class. Dividends are declared separately for each class. Differences in per share dividend rates are generally due to differences in separate class expenses. Class B and Class 529B shares will convert to Class A
32
Notes to Financial Statements – continued
and Class 529A shares, respectively, approximately eight years after purchase. The fund’s distributions declared to shareholders as reported on the Statements of Changes in Net Assets are presented by class as follows:
| | | | | | | | |
| | | From net realized gain on
investments | |
| | | Year ended
8/31/11 | | | Year ended
8/31/10 | |
| Class A | | | $30,273,926 | | | | $— | |
| Class B | | | 2,134,478 | | | | — | |
| Class C | | | 3,407,719 | | | | — | |
| Class I | | | 19,253,038 | | | | — | |
| Class R1 | | | 438,284 | | | | — | |
| Class R2 | | | 1,127,711 | | | | — | |
| Class R3 | | | 626,131 | | | | — | |
| Class R4 | | | 3,719,166 | | | | — | |
| Class 529A | | | 133,977 | | | | — | |
| Class 529B | | | 17,347 | | | | — | |
| Class 529C | | | 40,321 | | | | — | |
| Total | | | $61,172,098 | | | | $— | |
| (3) | | Transactions with Affiliates |
Investment Adviser – The fund has an investment advisory agreement with MFS to provide overall investment management and related administrative services and facilities to the fund. The management fee is computed daily and paid monthly at an annual rate of 0.90% of the fund’s average daily net assets. The investment adviser has agreed in writing to reduce its management fee to 0.80% of average daily net assets for the first $1.5 billion and 0.75% of average daily net assets in excess of $1.5 billion. This written agreement will expire on December 31, 2011. This management fee reduction amounted to $1,231,146, which is shown as a reduction of total expenses in the Statement of Operations. The management fee incurred for the year ended August 31, 2011 was equivalent to an annual effective rate of 0.80% of the fund’s average daily net assets. Effective January 1, 2012, the investment adviser has agreed in writing to reduce its management fee to 0.80% of average daily net assets in excess of $1 billion up to $2.5 billion and 0.75% of average daily net assets in excess of $2.5 billion. This written agreement will continue until modified by the fund’s Board of Trustees, but such agreement will continue at least until December 31, 2012.
33
Notes to Financial Statements – continued
Also effective January 1, 2012, the investment adviser has agreed in writing to pay a portion of the fund’s total annual operating expenses, exclusive of interest, taxes, extraordinary expenses, brokerage and transaction costs, and investment-related expenses, such that total annual fund operating expenses do not exceed the following rates annually of each class’ average daily net assets:
| | | | | | | | | | | | | | | | | | | | | | | | | | | | | | | | | | | | | | | | |
| Class A | | Class B | | | Class C | | | Class I | | | Class R1 | | | Class R2 | | | Class R3 | | | Class R4 | | | Class 529A | | | Class 529B | | | Class 529C | |
| 1.41% | | | 2.16% | | | | 2.16% | | | | 1.16% | | | | 2.16% | | | | 1.66% | | | | 1.41% | | | | 1.16% | | | | 1.46% | | | | 2.21% | | | | 2.21% | |
This written agreement will continue until modified by the fund’s Board of Trustees, but such agreement will continue at least until December 31, 2012.
Distributor – MFS Fund Distributors, Inc. (MFD), a wholly-owned subsidiary of MFS, as distributor, received $270,628 and $2,402 for the year ended August 31, 2011, as its portion of the initial sales charge on sales of Class A and Class 529A shares of the fund, respectively.
The Board of Trustees has adopted a distribution plan for certain class shares pursuant to Rule 12b-1 of the Investment Company Act of 1940.
The fund’s distribution plan provides that the fund will pay MFD for services provided by MFD and financial intermediaries in connection with the distribution and servicing of certain share classes. One component of the plan is a distribution fee paid to MFD and another component of the plan is a service fee paid to MFD. MFD may subsequently pay all, or a portion, of the distribution and/or service fees to financial intermediaries.
Distribution Plan Fee Table:
| | | | | | | | | | | | | | | | | | | | |
| | | Distribution
Fee Rate (d) | | | Service
Fee Rate (d) | | | Total
Distribution Plan (d) | | | Annual
Effective Rate (e) | | | Distribution
and Service
Fee | |
| Class A | | | — | �� | | | 0.25% | | | | 0.25% | | | | 0.25% | | | | $1,519,788 | |
| Class B | | | 0.75% | | | | 0.25% | | | | 1.00% | | | | 1.00% | | | | 359,336 | |
| Class C | | | 0.75% | | | | 0.25% | | | | 1.00% | | | | 1.00% | | | | 761,846 | |
| Class R1 | | | 0.75% | | | | 0.25% | | | | 1.00% | | | | 1.00% | | | | 73,337 | |
| Class R2 | | | 0.25% | | | | 0.25% | | | | 0.50% | | | | 0.50% | | | | 109,576 | |
| Class R3 | | | — | | | | 0.25% | | | | 0.25% | | | | 0.25% | | | | 46,330 | |
| Class 529A | | | — | | | | 0.25% | | | | 0.25% | | | | 0.25% | | | | 6,706 | |
| Class 529B | | | 0.75% | | | | 0.25% | | | | 1.00% | | | | 1.00% | | | | 2,725 | |
| Class 529C | | | 0.75% | | | | 0.25% | | | | 1.00% | | | | 1.00% | | | | 6,791 | |
| Total Distribution and Service Fees | | | | | | | | | | | | $2,886,435 | |
| (d) | In accordance with the distribution plan for certain classes, the fund pays distribution and/or service fees equal to these annual percentage rates of each class’ average daily net assets. The distribution and service fee rates disclosed by class represent the current rates in effect at the end of the reporting period. |
| (e) | The annual effective rates represent actual fees incurred under the distribution plan for the year ended August 31, 2011 based on each class’ average daily net assets. |
34
Notes to Financial Statements – continued
Certain Class A shares are subject to a contingent deferred sales charge (CDSC) in the event of a shareholder redemption within 24 months of purchase. Class C and Class 529C shares are subject to a CDSC in the event of a shareholder redemption within 12 months of purchase. Class B and Class 529B shares are subject to a CDSC in the event of a shareholder redemption within six years of purchase. All contingent deferred sales charges are paid to MFD and during the year ended August 31, 2011, were as follows:
| | | | |
| | | Amount | |
| Class A | | | $6,054 | |
| Class B | | | 48,294 | |
| Class C | | | 25,191 | |
| Class 529B | | | 31 | |
| Class 529C | | | — | |
The fund has entered into and may from time to time enter into contracts with program managers and other parties which administer the tuition programs through which an investment in the fund’s 529 share classes is made. The fund has entered into an agreement with MFD pursuant to which MFD receives an annual fee of up to 0.10% of the average daily net assets attributable to each 529 share class. Effective July 1, 2011, MFD has agreed to waive 0.05% of this annual fee. This waiver agreement will continue until modified by the fund’s Board of Trustees but such agreement will continue at least until December 31, 2012, after which MFD may eliminate this waiver without a vote of the fund’s Board of Trustees. For the year ended August 31, 2011, this waiver amounted to $333 and is reflected as a reduction of total expenses in the Statement of Operations. The services provided by MFD, or a third party with which MFD contracts, include recordkeeping and tax reporting and account services, as well as services designed to maintain the program’s compliance with the Internal Revenue Code and other regulatory requirements. Program manager fees for the year ended August 31, 2011, were as follows:
| | | | |
| | | Amount | |
| Class 529A | | | $2,682 | |
| Class 529B | | | 272 | |
| Class 529C | | | 678 | |
| Total Program Manager Fees | | | $3,632 | |
Shareholder Servicing Agent – MFS Service Center, Inc. (MFSC), a wholly-owned subsidiary of MFS, receives a fee from the fund for its services as shareholder servicing agent calculated as a percentage of the average daily net assets of the fund as determined periodically under the supervision of the fund’s Board of Trustees. For the year ended August 31, 2011, the fee was $525,477, which equated to 0.0428% annually of the fund’s average daily net assets. MFSC also receives payment from the fund for out-of-pocket expenses, sub-accounting and other shareholder servicing costs which may be paid to
35
Notes to Financial Statements – continued
affiliated and unaffiliated service providers. For the year ended August 31, 2011, these out-of-pocket expenses, sub-accounting and other shareholder servicing costs amounted to $1,085,957.
Under a Special Servicing Agreement among MFS, each MFS fund which invests in other MFS funds (“MFS fund-of-funds”) and certain underlying funds in which a MFS fund-of-funds invests (“underlying funds”), each underlying fund may pay a portion of each MFS fund-of-fund’s transfer agent-related expenses, including sub-accounting fees payable to financial intermediaries, to the extent such payments do not exceed the benefits realized or expected to be realized by the underlying fund from the investment in the underlying fund by the MFS fund-of-fund. For the year ended August 31, 2011, these costs for the fund amounted to $582,133 and are reflected in the shareholder servicing costs on the Statement of Operations.
Administrator – MFS provides certain financial, legal, shareholder communications, compliance, and other administrative services to the fund. Under an administrative services agreement, the fund partially reimburses MFS the costs incurred to provide these services. The fund is charged an annual fixed amount of $17,500 plus a fee based on average daily net assets. The administrative services fee incurred for the year ended August 31, 2011 was equivalent to an annual effective rate of 0.0147% of the fund’s average daily net assets.
Trustees’ and Officers’ Compensation – The fund pays compensation to independent Trustees in the form of a retainer, attendance fees, and additional compensation to Board and Committee chairpersons. The fund does not pay compensation directly to Trustees or officers of the fund who are also officers of the investment adviser, all of whom receive remuneration for their services to the fund from MFS. Certain officers and Trustees of the fund are officers or directors of MFS, MFD, and MFSC.
Prior to December 31, 2001, the fund had an unfunded defined benefit plan (“DB plan”) for independent Trustees. As of December 31, 2001, the Board took action to terminate the DB plan with respect to then-current and any future independent Trustees, such that the DB plan covers only certain of those former independent Trustees who retired on or before December 31, 2001. The DB plan resulted in a pension expense of $1,153 and is included in independent Trustees’ compensation for the year ended August 31, 2011. The liability for deferred retirement benefits payable to certain independent Trustees under the DB plan amounted to $6,605 at August 31, 2011, and is included in payable for independent Trustees’ compensation on the Statement of Assets and Liabilities.
Other – This fund and certain other funds managed by MFS (the funds) have entered into services agreements (the Agreements) which provide for payment
36
Notes to Financial Statements – continued
of fees by the funds to Tarantino LLC and Griffin Compliance LLC in return for the provision of services of an Independent Chief Compliance Officer (ICCO) and Assistant ICCO, respectively, for the funds. The ICCO and Assistant ICCO are officers of the funds and the sole members of Tarantino LLC and Griffin Compliance LLC, respectively. The funds can terminate the Agreements with Tarantino LLC and Griffin Compliance LLC at any time under the terms of the Agreements. For the year ended August 31, 2011, the aggregate fees paid by the fund to Tarantino LLC and Griffin Compliance LLC were $10,390 and are included in miscellaneous expense on the Statement of Operations. MFS has agreed to reimburse the fund for a portion of the payments made by the fund in the amount of $5,650, which is shown as a reduction of total expenses in the Statement of Operations. Additionally, MFS has agreed to bear all expenses associated with office space, other administrative support, and supplies provided to the ICCO and Assistant ICCO.
The fund invests in the MFS Institutional Money Market Portfolio which is managed by MFS and seeks a high level of current income consistent with preservation of capital and liquidity. Income earned on this investment is included in dividends from underlying affiliated funds on the Statement of Operations. This money market fund does not pay a management fee to MFS.
Purchases and sales of investments, other than U.S. Government securities, purchased option transactions, and short-term obligations, aggregated $2,781,677,476 and $2,496,442,103, respectively.
| (5) | | Shares of Beneficial Interest |
The fund’s Declaration of Trust permits the Trustees to issue an unlimited number of full and fractional shares of beneficial interest. Transactions in fund shares were as follows:
| | | | | | | | | | | | | | | | |
| | | Year ended
8/31/11 | | | Year ended
8/31/10 | |
| | | Shares | | | Amount | | | Shares | | | Amount | |
| Shares sold | | | | | | | | | | | | | | | | |
Class A | | | 17,980,977 | | | | $435,035,111 | | | | 6,940,347 | | | | $132,282,923 | |
Class B | | | 685,425 | | | | 15,565,180 | | | | 328,287 | | | | 5,799,780 | |
Class C | | | 3,061,272 | | | | 70,014,777 | | | | 818,383 | | | | 14,512,850 | |
Class I | | | 9,571,305 | | | | 250,866,970 | | | | 2,555,492 | | | | 51,085,202 | |
Class R1 | | | 152,556 | | | | 3,452,935 | | | | 109,310 | | | | 1,903,834 | |
Class R2 | | | 763,263 | | | | 18,313,853 | | | | 294,745 | | | | 5,506,373 | |
Class R3 | | | 1,158,793 | | | | 29,025,298 | | | | 211,686 | | | | 4,125,397 | |
Class R4 | | | 1,952,085 | | | | 49,252,552 | | | | 955,120 | | | | 18,274,108 | |
Class 529A | | | 39,176 | | | | 936,063 | | | | 14,070 | | | | 267,454 | |
Class 529B | | | 3,456 | | | | 77,524 | | | | 1,984 | | | | 34,429 | |
Class 529C | | | 8,469 | | | | 184,626 | | | | 5,023 | | | | 88,281 | |
| | | 35,376,777 | | | | $872,724,889 | | | | 12,234,447 | | | | $233,880,631 | |
37
Notes to Financial Statements – continued
| | | | | | | | | | | | | | | | |
| | | Year ended
8/31/11 | | | Year ended
8/31/10 | |
| | | Shares | | | Amount | | | Shares | | | Amount | |
| Shares issued to shareholders in reinvestment of distributions | | | | | | | | | | | | | | | | |
Class A | | | 1,157,796 | | | | $26,918,745 | | | | — | | | | $— | |
Class B | | | 90,410 | | | | 1,936,582 | | | | — | | | | — | |
Class C | | | 127,853 | | | | 2,741,164 | | | | — | | | | — | |
Class I | | | 743,509 | | | | 18,126,743 | | | | — | | | | — | |
Class R1 | | | 20,548 | | | | 438,284 | | | | — | | | | — | |
Class R2 | | | 45,823 | | | | 1,042,025 | | | | — | | | | — | |
Class R3 | | | 26,942 | | | | 626,131 | | | | — | | | | — | |
Class R4 | | | 157,392 | | | | 3,719,166 | | | | — | | | | — | |
Class 529A | | | 5,866 | | | | 133,977 | | | | — | | | | — | |
Class 529B | | | 824 | | | | 17,347 | | | | — | | | | — | |
Class 529C | | | 1,916 | | | | 40,321 | | | | — | | | | — | |
| | | 2,378,879 | | | | $55,740,485 | | | | — | | | | $— | |
| Shares reacquired | | | | | | | | | | | | | | | | |
Class A | | | (9,251,518 | ) | | | $(225,719,683 | ) | | | (4,482,976 | ) | | | $(84,902,478 | ) |
Class B | | | (699,681 | ) | | | (15,599,715 | ) | | | (630,232 | ) | | | (11,168,524 | ) |
Class C | | | (691,887 | ) | | | (15,355,021 | ) | | | (391,561 | ) | | | (6,850,047 | ) |
Class I | | | (9,948,139 | ) | | | (260,949,267 | ) | | | (3,396,804 | ) | | | (64,037,306 | ) |
Class R1 | | | (137,512 | ) | | | (3,046,095 | ) | | | (89,768 | ) | | | (1,577,355 | ) |
Class R2 | | | (412,463 | ) | | | (9,900,939 | ) | | | (300,556 | ) | | | (5,570,564 | ) |
Class R3 | | | (244,582 | ) | | | (5,981,877 | ) | | | (87,539 | ) | | | (1,676,613 | ) |
Class R4 | | | (1,298,770 | ) | | | (31,987,386 | ) | | | (974,707 | ) | | | (18,701,481 | ) |
Class 529A | | | (9,548 | ) | | | (234,040 | ) | | | (11,766 | ) | | | (216,917 | ) |
Class 529B | | | (6,348 | ) | | | (145,103 | ) | | | (1,967 | ) | | | (33,557 | ) |
Class 529C | | | (2,578 | ) | | | (58,244 | ) | | | (4,309 | ) | | | (75,591 | ) |
| | | (22,703,026 | ) | | | $(568,977,370 | ) | | | (10,372,185 | ) | | | $(194,810,433 | ) |
| Net change | | | | | | | | | | | | | | | | |
Class A | | | 9,887,255 | | | | $236,234,173 | | | | 2,457,371 | | | | $47,380,445 | |
Class B | | | 76,154 | | | | 1,902,047 | | | | (301,945 | ) | | | (5,368,744 | ) |
Class C | | | 2,497,238 | | | | 57,400,920 | | | | 426,822 | | | | 7,662,803 | |
Class I | | | 366,675 | | | | 8,044,446 | | | | (841,312 | ) | | | (12,952,104 | ) |
Class R1 | | | 35,592 | | | | 845,124 | | | | 19,542 | | | | 326,479 | |
Class R2 | | | 396,623 | | | | 9,454,939 | | | | (5,811 | ) | | | (64,191 | ) |
Class R3 | | | 941,153 | | | | 23,669,552 | | | | 124,147 | | | | 2,448,784 | |
Class R4 | | | 810,707 | | | | 20,984,332 | | | | (19,587 | ) | | | (427,373 | ) |
Class 529A | | | 35,494 | | | | 836,000 | | | | 2,304 | | | | 50,537 | |
Class 529B | | | (2,068 | ) | | | (50,232 | ) | | | 17 | | | | 872 | |
Class 529C | | | 7,807 | | | | 166,703 | | | | 714 | | | | 12,690 | |
| | | 15,052,630 | | | | $359,488,004 | | | | 1,862,262 | | | | $39,070,198 | |
38
Notes to Financial Statements – continued
Class W shares were not available for sale during the period. Please see the fund’s prospectus for details.
The fund is one of several mutual funds in which the MFS funds-of-funds may invest. The MFS funds-of-funds do not invest in the underlying MFS funds for the purpose of exercising management or control. At the end of the period, the MFS Growth Allocation Fund, MFS Moderate Allocation Fund, MFS Aggressive Growth Allocation Fund, and MFS Conservative Allocation Fund were the owners of record of approximately 4%, 3%, 2%, and 1%, respectively, of the value of outstanding voting shares of the fund. In addition, the MFS Lifetime 2010 Fund, MFS Lifetime 2020 Fund, MFS Lifetime 2030 Fund, MFS Lifetime 2040 Fund, MFS Lifetime 2050 Fund, and the MFS Lifetime Retirement Income Fund were each the owners of record of less than 1% of the value of outstanding voting shares of the fund.
The fund and certain other funds managed by MFS participate in a $1.1 billion unsecured committed line of credit, subject to a $1 billion sublimit, provided by a syndication of banks under a credit agreement. Borrowings may be made for temporary financing needs. Interest is charged to each fund, based on its borrowings, generally at a rate equal to the higher of the Federal Reserve funds rate or one month LIBOR plus an agreed upon spread. A commitment fee, based on the average daily, unused portion of the committed line of credit, is allocated among the participating funds at the end of each calendar quarter. In addition, the fund and other funds managed by MFS have established unsecured uncommitted borrowing arrangements with certain banks for temporary financing needs. Interest is charged to each fund, based on its borrowings, at a rate equal to the Federal Reserve funds rate plus an agreed upon spread. For the year ended August 31, 2011, the fund’s commitment fee and interest expense were $10,269 and $0, respectively, and are included in miscellaneous expense on the Statement of Operations.
39
Notes to Financial Statements – continued
| (7) | | Transactions in Underlying Affiliated Funds-Affiliated Issuers |
An affiliated issuer may be considered one in which the fund owns 5% or more of the outstanding voting securities, or a company which is under common control. For the purposes of this report, the fund assumes the following to be affiliated issuers:
| | | | | | | | | | | | | | | | |
| Underlying Affiliated Funds | | Beginning
Shares/Par
Amount | | | Acquisitions
Shares/Par
Amount | | | Dispositions
Shares/Par
Amount | | | Ending
Shares/Par
Amount | |
MFS Institutional Money
Market Portfolio | | | 10,521,520 | | | | 643,414,295 | | | | (644,988,534 | ) | | | 8,947,281 | |
| | | | |
| Underlying Affiliated Funds | | Realized
Gain (Loss) | | | Capital Gain
Distributions | | | Dividend
Income | | | Ending
Value | |
MFS Institutional Money
Market Portfolio | | | $— | | | | $— | | | | $18,585 | | | | $8,947,281 | |
| | | | |
| Other Affiliated Issuers | | Beginning
Shares/Par
Amount | | | Acquisitions
Shares/Par
Amount | | | Dispositions
Shares/Par
Amount | | | Ending
Shares/Par
Amount | |
| Citi Trends, Inc. | | | 461,190 | | | | 699,440 | | | | (46,010 | ) | | | 1,114,620 | |
| Metro Bancorp, Inc. | | | 308,690 | | | | 453,990 | | | | (44,330 | ) | | | 718,350 | |
| Uroplasty, Inc. | | | — | | | | 1,382,192 | | | | (39,390 | ) | | | 1,342,802 | |
| | | | |
| Other Affiliated Issuers | | Realized
Gain (Loss) | | | Capital Gain
Distributions | | | Dividend
Income | | | Ending
Value | |
| Citi Trends, Inc. | | | $(640,767 | ) | | | $— | | | | $— | | | | $12,996,469 | |
| Metro Bancorp, Inc. | | | (87,273 | ) | | | — | | | | — | | | | 7,212,234 | |
| Uroplasty, Inc. | | | (33,679 | ) | | | — | | | | — | | | | 8,379,084 | |
| | | $(761,719 | ) | | | $— | | | | $— | | | | $28,587,787 | |
40
REPORT OF INDEPENDENT REGISTERED PUBLIC ACCOUNTING FIRM
To the Board of Trustees of MFS Series Trust I and Shareholders of MFS New Discovery Fund:
We have audited the accompanying statement of assets and liabilities of MFS New Discovery Fund (the Fund) (one of the portfolios comprising MFS Series Trust I), including the portfolio of investments, as of August 31, 2011, and the related statement of operations for the year then ended, the statements of changes in net assets for each of the two years in the period then ended, and the financial highlights for each of the five years in the period then ended. These financial statements and financial highlights are the responsibility of the Fund’s management. Our responsibility is to express an opinion on these financial statements and financial highlights based on our audits.
We conducted our audits in accordance with the standards of the Public Company Accounting Oversight Board (United States). Those standards require that we plan and perform the audit to obtain reasonable assurance about whether the financial statements and financial highlights are free of material misstatement. We were not engaged to perform an audit of the Fund’s internal control over financial reporting. Our audits included consideration of internal control over financial reporting as a basis for designing audit procedures that are appropriate in the circumstances, but not for the purpose of expressing an opinion on the effectiveness of the Fund’s internal control over financial reporting. Accordingly, we express no such opinion. An audit also includes examining, on a test basis, evidence supporting the amounts and disclosures in the financial statements and financial highlights, assessing the accounting principles used and significant estimates made by management, and evaluating the overall financial statement presentation. Our procedures included confirmation of securities owned as of August 31, 2011, by correspondence with the custodian and brokers or by other appropriate auditing procedures where replies from brokers were not received. We believe that our audits provide a reasonable basis for our opinion.
In our opinion, the financial statements and financial highlights referred to above present fairly, in all material respects, the financial position of the MFS New Discovery Fund at August 31, 2011, the results of its operations for the year then ended, the changes in its net assets for each of the two years in the period then ended, and its financial highlights for each of the five years in the period then ended, in conformity with U.S. generally accepted accounting principles.

Boston, Massachusetts
October 17, 2011
41
TRUSTEES AND OFFICERS —
IDENTIFICATION AND BACKGROUND
The Trustees and officers of the Trust, as of October 1, 2011, are listed below, together with their principal occupations during the past five years. (Their titles may have varied during that period.) The address of each Trustee and officer is 500 Boylston Street, Boston, Massachusetts 02116.
| | | | | | | | |
Name, Age | | Position(s) Held with Fund | | Trustee/Officer
Since (h) | | Principal Occupations
During the Past Five Years | | Other
Directorships (j) |
| INTERESTED TRUSTEES |
Robert J. Manning (k)
(age 47) | | Trustee | | February 2004 | | Massachusetts Financial Services Company, Chairman, Chief Executive Officer and Director; President (until December 2009); Chief Investment Officer (until July 2010) | | |
Robert C. Pozen (k)
(age 65) | | Trustee | | February 2004 | | Massachusetts Financial Services Company, Chairman Emeritus; Chairman (until July 2010) | | Medtronic, Inc, (medical devices), Director (since 2004); The Neilsen Company (market research), Director (since 2010); Telesat (satellite communications), Director (until November 2007); Bell Canada Enterprises (telecommunications), Director (until February 2009) |
42
Trustees and Officers – continued
| | | | | | | | |
Name, Age | | Position(s) Held with Fund | | Trustee/Officer
Since (h) | | Principal Occupations
During the Past Five Years | | Other
Directorships (j) |
| INDEPENDENT TRUSTEES |
David H. Gunning
(age 69) | | Trustee and Chair of Trustees | | January 2004 | | Retired; Cleveland-Cliffs Inc. (mining products and service provider), Vice Chairman/Director (until May 2007) | | Lincoln Electric Holdings, Inc. (welding equipment manufacturer), Director; Development Alternatives, Inc. (consulting), Director/Non-Executive Chairman; Portman Limited (mining), Director (until 2008) |
Robert E. Butler
(age 69) | | Trustee | | January 2006 | | Consultant – investment company industry regulatory and compliance matters | | |
Maureen R. Goldfarb
(age 56) | | Trustee | | January 2009 | | Private investor | | |
William R. Gutow
(age 70) | | Trustee | | December 1993 | | Private investor and real estate consultant; Capitol Entertainment Management Company (video franchise), Vice Chairman | | Atlantic Coast Tan (tanning salons), Vice Chairman (until 2007); Texas Donuts (donut franchise), Vice Chairman (until 2010) |
Michael Hegarty
(age 66) | | Trustee | | December 2004 | | Private investor | | |
43
Trustees and Officers – continued
| | | | | | | | |
Name, Age | | Position(s) Held with Fund | | Trustee/Officer
Since (h) | | Principal Occupations
During the Past Five Years | | Other
Directorships (j) |
John P. Kavanaugh
(age 56) | | Trustee | | January 2009 | | Private investor; The Hanover Insurance Group, Inc., Vice President and Chief Investment Officer (until 2006); Allmerica Investment Trust, Allmerica Securities Trust and Opus Investment Trust (investment companies), Chairman, President and Trustee (until 2006) | | |
J. Dale Sherratt
(age 73) | | Trustee | | June 1989 | | Insight Resources, Inc. (acquisition planning specialists), President; Wellfleet Investments (investor in health care companies), Managing General Partner | | |
Laurie J. Thomsen
(age 54) | | Trustee | | March 2005 | | Private investor; New Profit, Inc. (venture philanthropy), Executive Partner (until 2010) | | The Travelers Companies (property and casualty insurance), Director |
Robert W. Uek
(age 70) | | Trustee | | January 2006 | | Consultant to investment company industry | | |
| OFFICERS | | | | | | | | |
Maria F. DiOrioDwyer (k)
(age 52) | | President | | March 2004 | | Massachusetts Financial Services Company, Executive Vice President and Chief Regulatory Officer Chief Compliance Officer (since December 2006) | | |
Christopher R. Bohane (k)
(age 37) | | Assistant Secretary and Assistant Clerk | | July 2005 | | Massachusetts Financial Services Company, Vice President and Senior Counsel | | |
44
Trustees and Officers – continued
| | | | | | | | |
Name, Age | | Position(s) Held with Fund | | Trustee/Officer
Since (h) | | Principal Occupations
During the Past Five Years | | Other
Directorships (j) |
John M. Corcoran (k)
(age 46) | | Treasurer | | October 2008 | | Massachusetts Financial Services Company, Senior Vice President (since October 2008); State Street Bank and Trust (financial services provider), Senior Vice President, (until September 2008) | | |
Ethan D. Corey (k)
(age 47) | | Assistant Secretary and Assistant Clerk | | July 2005 | | Massachusetts Financial Services Company, Senior Vice President and Associate General Counsel | | |
David L. DiLorenzo (k)
(age 43) | | Assistant Treasurer | | July 2005 | | Massachusetts Financial Services Company, Vice President | | |
Timothy M. Fagan (k)
(age 43) | | Assistant Secretary and Assistant Clerk | | September 2005 | | Massachusetts Financial Services Company, Vice President and Senior Counsel | | |
Robyn L. Griffin
(age 36) | | Assistant Independent Chief Compliance Officer | | August 2008 | | Griffin Compliance LLC (provider of compliance services), Principal (since August 2008); State Street Corporation (financial services provider), Mutual Fund Administration Assistant Vice President (October 2006 – July 2008); Liberty Mutual Group (insurance), Personal Market Assistant Controller (April 2006 – October 2006); Deloitte & Touche LLP (professional services firm). | | |
45
Trustees and Officers – continued
| | | | | | | | |
Name, Age | | Position(s) Held with Fund | | Trustee/Officer
Since (h) | | Principal Occupations
During the Past Five Years | | Other
Directorships (j) |
Brian E. Langenfeld (k)
(age 38) | | Assistant Secretary and Assistant Clerk | | June 2006 | | Massachusetts Financial Services Company, Vice President and Senior Counsel | | |
Ellen Moynihan (k)
(age 53) | | Assistant Treasurer | | April 1997 | | Massachusetts Financial Services Company, Senior Vice President | | |
Susan S. Newton (k)
(age 61) | | Assistant Secretary and Assistant Clerk | | May 2005 | | Massachusetts Financial Services Company, Senior Vice President and Associate General Counsel | | |
Susan A. Pereira (k)
(age 40) | | Assistant Secretary and Assistant Clerk | | July 2005 | | Massachusetts Financial Services Company, Vice President and Senior Counsel | | |
Mark N. Polebaum (k)
(age 59) | | Secretary and Clerk | | January 2006 | | Massachusetts Financial Services Company, Executive Vice President, General Counsel and Secretary | | |
Frank L. Tarantino
(age 67) | | Independent Chief Compliance Officer | | June 2004 | | Tarantino LLC (provider of compliance services), Principal | | |
Richard S. Weitzel (k)
(age 41) | | Assistant Secretary and Assistant Clerk | | October 2007 | | Massachusetts Financial Services Company, Vice President and Assistant General Counsel | | |
James O. Yost (k)
(age 51) | | Assistant Treasurer | | September 1990 | | Massachusetts Financial Services Company, Senior Vice President | | |
| (h) | Date first appointed to serve as Trustee/officer of an MFS fund. Each Trustee has served continuously since appointment unless indicated otherwise. For the period from December 15, 2004 until February 22, 2005, Messrs. Pozen and Manning served as Advisory Trustees. For the period March 2008 until October 2008, Ms. DiOrioDwyer served as Treasurer of the Funds. |
46
Trustees and Officers – continued
| (j) | Directorships or trusteeships of companies required to report to the Securities and Exchange Commission (i.e., “public companies”). |
| (k) | “Interested person” of the Trust within the meaning of the Investment Company Act of 1940 (referred to as the 1940 Act), which is the principal federal law governing investment companies like the fund, as a result of position with MFS. The address of MFS is 500 Boylston Street, Boston, Massachusetts 02116. |
Each Trustee has been elected by shareholders and each Trustee and officer holds office until his or her successor is chosen and qualified or until his or her earlier death, resignation, retirement or removal. The Trust does not hold annual meetings for the purpose of electing Trustees, and Trustees are not elected for fixed terms. Messrs. Butler, Kavanaugh, Uek and Ms. Thomsen are members of the Trust’s Audit Committee.
Each of the Fund’s Trustees and officers holds comparable positions with certain other funds of which MFS or a subsidiary is the investment adviser or distributor, and, in the case of the officers, with certain affiliates of MFS. As of January 1, 2011, the Trustees served as board members of 105 funds within the MFS Family of Funds.
The Statement of Additional Information for the Fund includes further information about the Trustees and is available without charge upon request by calling 1-800-225-2606.
| | |
| Investment Adviser | | Custodian |
Massachusetts Financial Services Company
500 Boylston Street, Boston, MA 02116-3741 | | State Street Bank and Trust
1 Lincoln Street, Boston, MA 02111-2900 |
| Distributor | | Independent Registered Public Accounting Firm |
MFS Fund Distributors, Inc.
500 Boylston Street, Boston, MA 02116-3741 | | Ernst & Young LLP 200 Clarendon Street, Boston, MA 02116 |
| Portfolio Manager | | |
Thomas Wetherald | | |
47
BOARD REVIEW OF INVESTMENT ADVISORY AGREEMENT
The Investment Company Act of 1940 requires that both the full Board of Trustees and a majority of the non-interested (“independent”) Trustees, voting separately, annually approve the continuation of the Fund’s investment advisory agreement with MFS. The Trustees consider matters bearing on the Fund and its advisory arrangements at their meetings throughout the year, including a review of performance data at each regular meeting. In addition, the independent Trustees met several times over the course of three months beginning in May and ending in July, 2011 (“contract review meetings”) for the specific purpose of considering whether to approve the continuation of the investment advisory agreement for the Fund and the other investment companies that the Board oversees (the “MFS Funds”). The independent Trustees were assisted in their evaluation of the Fund’s investment advisory agreement by independent legal counsel, from whom they received separate legal advice and with whom they met separately from MFS during various contract review meetings. The independent Trustees were also assisted in this process by the MFS Funds’ Independent Chief Compliance Officer, a full-time senior officer appointed by and reporting to the independent Trustees.
In connection with their deliberations regarding the continuation of the investment advisory agreement, the Trustees, including the independent Trustees, considered such information and factors as they believed, in light of the legal advice furnished to them and their own business judgment, to be relevant. The investment advisory agreement for the Fund was considered separately, although the Trustees also took into account the common interests of all MFS Funds in their review. As described below, the Trustees considered the nature, quality, and extent of the various investment advisory, administrative, and shareholder services performed by MFS under the existing investment advisory agreement and other arrangements with the Fund.
In connection with their contract review meetings, the Trustees received and relied upon materials that included, among other items: (i) information provided by Lipper Inc., an independent third party, on the investment performance of the Fund for various time periods ended December 31, 2010 and the investment performance of a group of funds with substantially similar investment classifications/objectives (the “Lipper performance universe”), (ii) information provided by Lipper Inc. on the Fund’s advisory fees and other expenses and the advisory fees and other expenses of comparable funds identified by Lipper Inc. (the “Lipper expense group”), (iii) information provided by MFS on the advisory fees of comparable portfolios of other clients of MFS, including institutional separate accounts and other clients, (iv) information as to whether and to what extent applicable expense waivers,
48
Board Review of Investment Advisory Agreement – continued
reimbursements or fee “breakpoints” are observed for the Fund, (v) information regarding MFS’ financial results and financial condition, including MFS’ and certain of its affiliates’ estimated profitability from services performed for the Fund and the MFS Funds as a whole, and compared to MFS’ institutional business, (vi) MFS’ views regarding the outlook for the mutual fund industry and the strategic business plans of MFS, (vii) descriptions of various functions performed by MFS for the Funds, such as compliance monitoring and portfolio trading practices, and (viii) information regarding the overall organization of MFS, including information about MFS’ senior management and other personnel providing investment advisory, administrative and other services to the Fund and the other MFS Funds. The comparative performance, fee and expense information prepared and provided by Lipper Inc. was not independently verified and the independent Trustees did not independently verify any information provided to them by MFS.
The Trustees’ conclusion as to the continuation of the investment advisory agreement was based on a comprehensive consideration of all information provided to the Trustees and not the result of any single factor. Some of the factors that figured particularly in the Trustees’ deliberations are described below, although individual Trustees may have evaluated the information presented differently from one another, giving different weights to various factors. It is also important to recognize that the fee arrangements for the Fund and other MFS Funds are the result of years of review and discussion between the independent Trustees and MFS, that certain aspects of such arrangements may receive greater scrutiny in some years than in others, and that the Trustees’ conclusions may be based, in part, on their consideration of these same arrangements during the course of the year and in prior years.
Based on information provided by Lipper Inc., the Trustees reviewed the Fund’s total return investment performance as well as the performance of peer groups of funds over various time periods. The Trustees placed particular emphasis on the total return performance of the Fund’s Class A shares in comparison to the performance of funds in its Lipper performance universe over the three-year period ended December 31, 2010, which the Trustees believed was a long enough period to reflect differing market conditions. The total return performance of the Fund’s Class A shares was in the 1st quintile relative to the other funds in the universe for this three-year period (the 1st quintile being the best performers and the 5th quintile being the worst performers). The total return performance of the Fund’s Class A shares was in the 1st quintile for each of the one and five-year periods ended December 31, 2010 relative to the Lipper performance universe. Because of the passage of time, these performance results are likely to differ from the performance results for more recent periods, including those shown elsewhere in this report.
49
Board Review of Investment Advisory Agreement – continued
In the course of their deliberations, the Trustees took into account information provided by MFS in connection with the contract review meetings, as well as during investment review meetings conducted with portfolio management personnel during the course of the year regarding the Fund’s performance. After reviewing these and related factors, the Trustees concluded, within the context of their overall conclusions regarding the investment advisory agreement, that they were satisfied with MFS’ responses and efforts relating to investment performance.
In assessing the reasonableness of the Fund’s advisory fee, the Trustees considered, among other information, the Fund’s advisory fee and the total expense ratio of the Fund’s Class A shares as a percentage of average daily net assets and the advisory fee and total expense ratios of peer groups of funds based on information provided by Lipper Inc. The Trustees considered that MFS has agreed to implement an expense limitation for the Fund, which may not be changed without the Trustees’ approval. The Trustees also considered that, according to the Lipper data (which takes into account any fee reductions or expense limitations that were in effect during the Fund’s last fiscal year), the Fund’s effective advisory fee rate and total expense ratio were each approximately at the Lipper expense group median.
The Trustees also considered the advisory fees charged by MFS to institutional accounts. In comparing these fees, the Trustees considered information provided by MFS as to the generally broader scope of services provided by MFS to the Fund in comparison to institutional accounts, the higher demands placed on MFS’ investment personnel and trading infrastructure as a result of the daily cash in-flows and out-flows of the Fund, and the impact on MFS and expenses associated with the more extensive regulatory regime to which the Fund is subject in comparison to institutional accounts.
The Trustees also considered whether the Fund is likely to benefit from any economies of scale in the management of the Fund in the event of growth in assets of the Fund. They noted that MFS has agreed in writing to reduce its advisory fee on average daily net assets over $1 billion and $2.5 billion, which may not be changed without the Trustees’ approval. The Trustees concluded that the existing breakpoint was sufficient to allow the Fund to benefit from economies of scale as its assets grow.
The Trustees also considered information prepared by MFS relating to MFS’ costs and profits with respect to the Fund, the MFS Funds considered as a group, and other investment companies and accounts advised by MFS, as well as MFS’ methodologies used to determine and allocate its costs to the MFS Funds, the Fund and other accounts and products for purposes of estimating profitability.
50
Board Review of Investment Advisory Agreement – continued
After reviewing these and other factors described herein, the Trustees concluded, within the context of their overall conclusions regarding the investment advisory agreement, that the advisory fees charged to the Fund represent reasonable compensation in light of the services being provided by MFS to the Fund.
In addition, the Trustees considered MFS’ resources and related efforts to continue to retain, attract and motivate capable personnel to serve the Fund. The Trustees also considered current and developing conditions in the financial services industry, including the presence of large and well-capitalized companies which are spending, and appear to be prepared to continue to spend, substantial sums to engage personnel and to provide services to competing investment companies. In this regard, the Trustees also considered the financial resources of MFS and its ultimate parent, Sun Life Financial Inc. The Trustees also considered the advantages and possible disadvantages to the Fund of having an adviser that also serves other investment companies as well as other accounts.
The Trustees also considered the nature, quality, cost, and extent of administrative, transfer agency, and distribution services provided to the Fund by MFS and its affiliates under agreements and plans other than the investment advisory agreement, including any 12b-1 fees the Fund pays to MFS Fund Distributors, Inc., an affiliate of MFS. The Trustees also considered the nature, extent and quality of certain other services MFS performs or arranges for on the Fund’s behalf, which may include securities lending programs, directed expense payment programs, class action recovery programs, and MFS’ interaction with third-party service providers, principally custodians and sub-custodians. The Trustees concluded that the various non-advisory services provided by MFS and its affiliates on behalf of the Fund were satisfactory.
The Trustees also considered benefits to MFS from the use of the Fund’s portfolio brokerage commissions, if applicable, to pay for investment research and other similar services, and various other factors. Additionally, the Trustees considered so-called “fall-out benefits” to MFS such as reputational value derived from serving as investment manager to the Fund.
Based on their evaluation of factors that they deemed to be material, including those factors described above, the Board of Trustees, including a majority of the independent Trustees, concluded that the Fund’s investment advisory agreement with MFS should be continued for an additional one-year period, commencing August 1, 2011.
A discussion regarding the Board’s most recent review and renewal of the fund’s Investment Advisory Agreement with MFS will be available on or about November 1, 2011 by clicking on the fund’s name under “Mutual Funds” in the “Products and Performance” section of the MFS Web site (mfs.com).
51
PROXY VOTING POLICIES AND INFORMATION
A general description of the MFS funds’ proxy voting policies and procedures is available without charge, upon request, by calling
1-800-225-2606, by visiting the Proxy Voting section of mfs.com or by visiting the SEC’s Web site at http://www.sec.gov.
Information regarding how the fund voted proxies relating to portfolio securities during the most recent twelve-month period ended June 30 is available without charge by visiting the Proxy Voting section of mfs.com or by visiting the SEC’s Web site at http://www.sec.gov.
QUARTERLY PORTFOLIO DISCLOSURE
The fund will file a complete schedule of portfolio holdings with the Securities and Exchange Commission (the Commission) for the first and third quarters of each fiscal year on Form N-Q. The fund’s Form N-Q may be reviewed and copied at the:
Public Reference Room
Securities and Exchange Commission
100 F Street, NE, Room 1580
Washington, D.C. 20549
Information on the operation of the Public Reference Room may be obtained by calling the Commission at 1-800-SEC-0330. The fund’s Form N-Q is available on the EDGAR database on the Commission’s Internet Web site at http://www.sec.gov, and copies of this information may be obtained, upon payment of a duplicating fee, by electronic request at the following e-mail address: publicinfo@sec.gov or by writing the Public Reference Section at the above address.
A shareholder can also obtain the quarterly portfolio holdings report at mfs.com.
FURTHER INFORMATION
From time to time, MFS may post important information about the fund or the MFS funds on the MFS web site (mfs.com). This information is available by visiting the “News & Commentary” section of mfs.com or by clicking on the fund’s name under “Mutual Funds” in the “Products and Performance” section of mfs.com.
FEDERAL TAX INFORMATION (unaudited)
The fund will notify shareholders of amounts for use in preparing 2011 income tax forms in January 2012. The following information is provided pursuant to provisions of the Internal Revenue Code.
The fund designates the maximum amount allowable as qualified dividend income eligible for the 15% tax rate.
The fund designates $86,790,000 as capital gain dividends paid during the fiscal year.
52
rev. 3/11
| | | | |
| FACTS | | WHAT DOES MFS DO WITH YOUR PERSONAL INFORMATION? | |  |
| | |
| Why? | | Financial companies choose how they share your personal information. Federal law gives consumers the right to limit some but not all sharing. Federal law also requires us to tell you how we collect, share, and protect your personal information. Please read this notice carefully to understand what we do. |
| | |
| What? | | The types of personal information we collect and share depend on the product or service you have with us. This information can include: •Social Security number and account balances •Account transactions and transaction history •Checking account information and wire transfer instructions When you are no longer our customer, we continue to share your information as described in this notice. |
| | |
| How? | | All financial companies need to share customers’ personal information to run their everyday business. In the section below, we list the reasons financial companies can share their customers’ personal information; the reasons MFS chooses to share; and whether you can limit this sharing. |
| | | | |
| Reasons we can share your personal information | | Does MFS share? | | Can you limit
this sharing? |
For our everyday business purposes – such as to process your transactions, maintain your account(s), respond to court orders and legal investigations, or report to credit bureaus | | Yes | | No |
For our marketing purposes – to offer our products and services to you | | No | | We don’t share |
| For joint marketing with other financial companies | | No | | We don’t share |
For our affiliates’ everyday business purposes – information about your transactions and experiences | | No | | We don’t share |
For our affiliates’ everyday business purposes – information about your creditworthiness | | No | | We don’t share |
| For nonaffiliates to market to you | | No | | We don’t share |
| | |
| Questions? | | Call 800-225-2606 or go to mfs.com. |
53
| | |
| Who we are |
| Who is providing this notice? | | MFS Funds, MFS Investment Management, MFS Institutional Advisors, Inc., MFS Fund Distributors, Inc., MFS Heritage Trust Company, and MFS Service Center, Inc. |
| | |
| What we do |
| How does MFS protect my personal information? | | To protect your personal information from unauthorized access and use, we use security measures that comply with federal law. These measures include procedural, electronic, and physical safeguards for the protection of the personal information we collect about you. |
How does MFS
collect my personal information? | | We collect your personal information, for example, when you •open an account or provide account information •direct us to buy securities or direct us to sell your securities •make a wire transfer We also collect your personal information from others, such as credit bureaus, affiliates and other companies. |
| Why can’t I limit all sharing? | | Federal law gives you the right to limit only •sharing for affiliates’ everyday business purposes – information about your creditworthiness •affiliates from using your information to market to you •sharing for nonaffiliates to market to you State laws and individual companies may give you additional rights to limit sharing. |
| | |
| Definitions |
| Affiliates | | Companies related by common ownership or control. They can be financial and nonfinancial companies. •MFS does not share personal information with affiliates, except for everyday business purposes as described on page one of this notice. |
| Nonaffiliates | | Companies not related by common ownership or control. They can be financial and nonfinancial companies. •MFS does not share with nonaffiliates so they can market to you. |
| Joint Marketing | | A formal agreement between nonaffiliated financial companies that together market financial products or services to you. •MFS doesn’t jointly market. |
| | |
| Other important information |
| If you own an MFS product or receive an MFS service in the name of a third party such as a bank or broker-dealer, their privacy policy may apply to you instead of ours. |
54
Save paper with eDelivery.
MFS® will send you prospectuses, reports, and proxies directly via e-mail so you will get information faster with less mailbox clutter.
To sign up:
1. Go to mfs.com.
2. Log in via MFS® Access.
3. Select eDelivery.
If you own your MFS fund shares through a financial institution or a retirement plan, MFS® TALK, MFS® Access, or eDelivery may not be available to you.

Web site
mfs.com
MFS TALK
1-800-637-8255
24 hours a day
Account service and literature
Shareholders
1-800-225-2606
Financial advisors
1-800-343-2829
Retirement plan services
1-800-637-1255
Mailing address
MFS Service Center, Inc.
P.O. Box 55824
Boston, MA 02205-5824
Overnight mail
MFS Service Center, Inc.
c/o Boston Financial Data Services
30 Dan Road
Canton, MA 02021-2809

MFS® Research International Fund

ANNUAL REPORT
August 31, 2011
RIF-ANN
MFS® RESEARCH INTERNATIONAL FUND
SIPC Contact Information: You may obtain information about the Securities Investor Protection Corporation (“SIPC”), including the SIPC Brochure, by contacting SIPC either by telephone (1-202-371-8300) or by accessing SIPC’s web site address (www.sipc.org).
The report is prepared for the general information of shareholders.
It is authorized for distribution to prospective investors only when preceded or accompanied by a current prospectus.
NOT FDIC INSURED Ÿ MAY LOSE VALUE Ÿ NO BANK GUARANTEE

LETTER FROM THE CEO
Dear Shareholders:
We are indeed living through some volatile times. Economic uncertainty is everywhere, as it seems no place in the world has been unmoved by crisis this year. We have seen a devastating earthquake and tsunami that have led to disruptions in the Japanese markets and supply chains. Protests have changed the face of the Middle East and left in their wake lingering tensions and resultant higher oil prices. We have seen debt limits tested in Europe and the United States and policymakers grappling to craft often unpopular monetary and fiscal responses at a time when consumers and businesses struggle with what appears to be a slowing global economy. On top of all of that, we have seen long-term U.S. debt lose its Standard & Poor’s AAA rating.
When markets become volatile, managing risk becomes a top priority for investors and their advisors. At MFS® risk management is foremost in our minds in all market climates. Our analysts and portfolio managers keep risks firmly in mind when evaluating securities. Additionally, we have a team of quantitative analysts that measures and assesses the risk profiles of our portfolios and securities on an ongoing basis. The chief investment risk officer, who oversees the team, reports directly to the firm’s president and chief investment officer so the risk associated with each portfolio can be assessed objectively and independently of the portfolio management team.
As always, we continue to be mindful of the many economic challenges faced at the local, national, and international levels. It is in times such as these that we want to remind investors of the merits of maintaining a long-term view, adhering to basic investing principles such as asset allocation and diversification, and working closely with their advisors to research and identify appropriate investment opportunities.
Respectfully,

Robert J. Manning
Chairman and Chief Executive Officer
MFS Investment Management®
October 17, 2011
The opinions expressed in this letter are subject to change, may not be relied upon for investment advice, and no forecasts can be guaranteed.
1
PORTFOLIO COMPOSITION
Portfolio structure

| | | | |
| Top ten holdings | | | | |
| Nestle S.A. | | | 3.0% | |
| Royal Dutch Shell PLC, “A” | | | 2.6% | |
| Roche Holding AG | | | 2.5% | |
| Rio Tinto Ltd. | | | 2.0% | |
| Vodafone Group PLC | | | 1.8% | |
| Groupe Danone | | | 1.8% | |
| HSBC Holdings PLC | | | 1.7% | |
| Siemens AG | | | 1.7% | |
| Linde AG | | | 1.6% | |
| BNP Paribas | | | 1.6% | |
| |
| Global equity sectors | | | | |
| Capital Goods | | | 24.8% | |
| Financial Services | | | 21.6% | |
| Energy | | | 12.6% | |
| Health Care | | | 9.2% | |
| Consumer Staples | | | 8.6% | |
| Consumer Cyclicals | | | 7.8% | |
| Technology | | | 7.7% | |
| Telecommunications/Cable Television | | | 6.3% | |
| | | | |
| Issuer country weightings (x) | | | | |
| Japan | | | 20.6% | |
| United Kingdom | | | 17.6% | |
| Switzerland | | | 10.5% | |
| France | | | 9.2% | |
| Germany | | | 7.9% | |
| Netherlands | | | 5.7% | |
| Australia | | | 3.5% | |
| Hong Kong | | | 3.3% | |
| United States | | | 2.7% | |
| Other Countries | | | 19.0% | |
| |
| Currency exposure weightings (y) | | | | |
| Euro | | | 27.8% | |
| Japanese Yen | | | 20.6% | |
| British Pound Sterling | | | 17.6% | |
| Swiss Franc | | | 10.5% | |
| Hong Kong Dollar | | | 5.4% | |
| United States Dollar | | | 4.0% | |
| Australian Dollar | | | 3.4% | |
| Indian Rupee | | | 2.2% | |
| Swedish Krona | | | 1.9% | |
| Other Currencies | | | 6.6% | |
| (x) | Represents the portfolio’s exposure to issuer countries as a percentage of a portfolio’s total net assets. |
| (y) | Represents the portfolio’s exposure to a particular currency as a percentage of a portfolio’s total net assets. |
Percentages are based on net assets as of 8/31/11.
The portfolio is actively managed and current holdings may be different.
2
MANAGEMENT REVIEW
Summary of Results
For the twelve months ended August 31, 2011, Class A shares of the MFS Research International Fund (the “fund”) provided a total return of 14.89%, at net asset value. This compares with a return of 10.50% for the fund’s benchmark, the MSCI EAFE Index, and a return of 10.80% for the fund’s other benchmark, the MSCI All Country World (ex-U.S.) Index.
Market Environment
Early in the period, the U.S. Federal Reserve (the Fed) indicated that further monetary loosening would be forthcoming if macroeconomic activity did not show signs of improvement. The prospects for, and subsequent implementation of, more easing by the Fed improved market sentiment and drove risk-asset prices markedly higher. The December agreement on a surprisingly large (relative to expectations) expansionary U.S. fiscal package also boosted sentiment. During the subsequent several months, the renewed positive market sentiment, coupled with better indications of global macroeconomic activity, pushed many asset valuations to post-crisis highs. At the same time, global sovereign bond yields rose amidst the more “risk-seeking” environment.
However, towards the middle of the period, a weakening macroeconomic backdrop and renewed concerns over Greek debt sustainability began to challenge equity valuations and pushed sovereign bond yields lower. Towards the end of the reporting period, uncertainty in financial markets continued to increase. European policy makers debated and disagreed over elements of a new Greek bailout package, while Spanish and Italian bond yields increased markedly signaling a widening European crisis. In the U.S., concerns about sovereign debt default and the long term sustainability of the trend in U.S. fiscal policy resulted in one agency downgrading U.S. credit quality. Amidst this turmoil, global equity markets declined sharply. As a result of these developments, global consumer and producer sentiment indicators fell precipitously, highly-rated sovereign bond yields hit multi-decade lows and, despite a more mixed picture emanating from the “hard” data, markets grew increasingly worried about a return to global recession.
Contributors to Performance
Stock selection in the capital goods sector was a primary contributor to performance relative to the MSCI EAFE Index. Within this sector, the fund’s holdings of strong-performing mining company Iluka Resources (Australia), and overweight allocations to engineering and construction company JGC Corp. (Japan), industrial conglomerate Hutchison Whampoa Ltd. (Hong Kong), industrial gas supplier Linde AG (Germany), and parcel delivery services
3
Management Review – continued
company Yamato Holdings Co Ltd. (Japan), all benefited relative returns. Auto manufacturer BMW (h) (Germany) and diversified mining company Teck Resources (b) (Canada) were also among the fund’s top relative contributors for the reporting period. Shares of JGC Corporation appreciated as the company posted strong earnings for fiscal year ended March 2011. The company reported record operating margins and showed a strong new order pipeline.
Security selection in the energy and telecommunications/cable television sectors also boosted relative returns. In the energy sector, the fund’s avoidance of poor-performing natural gas producer Tokyo Electric Power (h) (Japan) aided relative performance. In telecommunications/cable television, ownership in shares of strong-performing telecommunications service provider China Unicom Ltd (b) (Hong Kong) also strengthened relative results.
Elsewhere, holdings of luxury goods maker LVMH (France) contributed to relative performance. Shares of LVMH appreciated early in the reporting period as the company reported third quarter 2010 sales that exceeded expectations, led by Louis Vuitton, Wines & Spirits, and cosmetics retailer Sephora. The company’s profitability reflected ongoing robust demand for luxury goods, which had been increasing in emerging markets.
Detractors from Performance
Stock selection in the technology sector held back relative returns. The fund’s ownership of information technology products and electronics maker Acer (b) (Taiwan), and overweight allocation to poor-performing copy machine manufacturer Konica Minolta Holdings (Japan), dampened relative returns. Shares of Konica Minolta depreciated halfway through the reporting period after management lowered guidance due to decreased printer and copier sales. Increased competition and intensified promotional efforts in the photocopier business were also key drivers to poor earnings results. Additionally, along with other Japanese companies, shares fell immediately following the earthquake/tsunami in Japan.
Individual securities in other sectors that negatively impacted relative performance included financial services firm Credit Suisse (Switzerland), global banking group BNP Paribas (France), financial services firms Barclays PLC (United Kingdom) and Banco Santander Brasil (b) (Brazil), Hong Kong-headquartered retailer Esprit Holdings (h), passenger railway company East Japan Railway (Japan), and asset management firm KBC Group (Belgium). The timing of the fund’s ownership in strong-performing mining operator Rio Tinto (Australia) also weakened relative results.
4
Management Review – continued
During the reporting period, the fund’s currency exposure was a detractor from relative performance. All of MFS’ investment decisions are driven by the fundamentals of each individual opportunity and as such, it is common for our portfolios to have different currency exposure than the benchmark.
Respectfully,
| | |
| Jose Luis Garcia | | Thomas Melendez |
| Portfolio Manager | | Portfolio Manager |
| (b) | Security is not a benchmark constituent. |
| (h) | Security was not held in the portfolio at period end. |
The views expressed in this report are those of the portfolio managers only through the end of the period of the report as stated on the cover and do not necessarily reflect the views of MFS or any other person in the MFS organization. These views are subject to change at any time based on market or other conditions, and MFS disclaims any responsibility to update such views. These views may not be relied upon as investment advice or an indication of trading intent on behalf of any MFS portfolio. References to specific securities are not recommendations of such securities, and may not be representative of any MFS portfolio’s current or future investments.
5
PERFORMANCE SUMMARY THROUGH 8/31/11
The following chart illustrates a representative class of the fund’s historical performance in comparison to its benchmark(s). Performance results include the deduction of the maximum applicable sales charge and reflect the percentage change in net asset value, including reinvestment of dividends and capital gains distributions. The performance of other share classes will be greater than or less than that of the class depicted below. Benchmarks are unmanaged and may not be invested in directly. Benchmark returns do not reflect sales charges, commissions or expenses. (See Notes to Performance Summary.)
Performance data shown represents past performance and is no guarantee of future results. Investment return and principal value fluctuate so your shares, when sold, may be worth more or less than the original cost; current performance may be lower or higher than quoted. The performance shown does not reflect the deduction of taxes, if any, that a shareholder would pay on fund distributions or the redemption of fund shares.
Growth of a Hypothetical $10,000 Investment
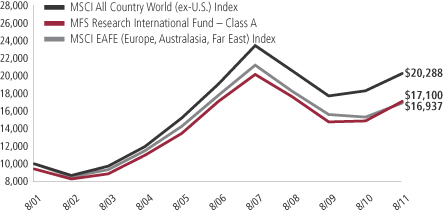
6
Performance Summary – continued
Total Returns through 8/31/11
Average annual without sales charge
| | | | | | | | | | | | | | |
| | | Share class | | Class inception date | | 1-yr | | 5-yr | | 10-Yr | | Life (t) | | |
| | | A | | 1/02/97 | | 14.89% | | (0.01)% | | 6.14% | | N/A | | |
| | | B | | 1/02/98 | | 14.02% | | (0.71)% | | 5.43% | | N/A | | |
| | | C | | 1/02/98 | | 14.05% | | (0.71)% | | 5.43% | | N/A | | |
| | | I | | 1/02/97 | | 15.19% | | 0.29% | | 6.49% | | N/A | | |
| | | W | | 5/01/06 | | 15.07% | | 0.18% | | N/A | | 0.08% | | |
| | | R1 | | 4/01/05 | | 14.09% | | (0.73)% | | N/A | | 4.08% | | |
| | | R2 | | 10/31/03 | | 14.61% | | (0.25)% | | N/A | | 7.07% | | |
| | | R3 | | 4/01/05 | | 14.88% | | (0.01)% | | N/A | | 4.83% | | |
| | | R4 | | 4/01/05 | | 15.19% | | 0.27% | | N/A | | 5.13% | | |
| | | 529A | | 7/31/02 | | 14.80% | | (0.16)% | | N/A | | 8.22% | | |
| | | 529B | | 7/31/02 | | 13.90% | | (0.86)% | | N/A | | 7.48% | | |
| | | 529C | | 7/31/02 | | 13.89% | | (0.86)% | | N/A | | 7.48% | | |
| Comparative benchmarks | | | | | | | | | | |
| | | MSCI EAFE (Europe, Australasia, Far East) Index (f) | | 10.50% | | (1.01)% | | 5.41% | | N/A | | |
| | | MSCI All Country World (ex-U.S.) Index (f) | | 10.80% | | 1.24% | | 7.33% | | N/A | | |
| Average annual with sales charge | | | | | | | | | | |
| | | A
With Initial Sales Charge (5.75%) | | 8.29% | | (1.19)% | | 5.51% | | N/A | | |
| | | B
With CDSC (Declining over six years from 4% to 0%) (x) | | 10.02% | | (1.02)% | | 5.43% | | N/A | | |
| | | C
With CDSC (1% for 12 months) (x) | | 13.05% | | (0.71)% | | 5.43% | | N/A | | |
| | | 529A
With Initial Sales Charge (5.75%) | | 8.20% | | (1.34)% | | N/A | | 7.51% | | |
| | | 529B
With CDSC (Declining over six years from 4% to 0%) (x) | | 9.90% | | (1.17)% | | N/A | | 7.48% | | |
| | | 529C
With CDSC (1% for 12 months) (x) | | 12.89% | | (0.86)% | | N/A | | 7.48% | | |
Class I, W, R1, R2, R3, and R4 shares do not have a sales charge.
CDSC – Contingent Deferred Sales Charge.
| (f) | Source: FactSet Research Systems Inc. |
| (t) | For the period from the class inception date through the stated period end (for those share classes with less than 10 years of performance history). No comparative benchmark performance information is provided for “life” periods. (See Notes to Performance Summary.) |
| (x) | Assuming redemption at the end of the applicable period. |
7
Performance Summary – continued
Benchmark Definitions
MSCI All Country World (ex-U.S.) Index – a market capitalization-weighted index that is designed to measure equity market performance in the developed and emerging markets, excluding the U.S.
MSCI EAFE (Europe, Australasia, Far East) Index – a market capitalization-weighted index that is designed to measure equity market performance in the developed markets, excluding the U.S. and Canada.
It is not possible to invest directly in an index.
Notes to Performance Summary
Average annual total return represents the average annual change in value for each share class for the periods presented. Life returns are presented where the share class has less than 10 years of performance history and represent the average annual total return from the class inception date to the stated period end date. As the fund’s share classes may have different inception dates, the life returns may represent different time periods and may not be comparable. As a result, no comparative benchmark performance information is provided for life periods.
Performance results reflect any applicable expense subsidies and waivers in effect during the periods shown. Without such subsidies and waivers the fund’s performance results would be less favorable. Please see the prospectus and financial statements for complete details.
Performance results do not include adjustments made for financial reporting purposes in accordance with U.S. generally accepted accounting principles and may differ from amounts reported in the financial highlights.
From time to time the fund may receive proceeds from litigation settlements, without which performance would be lower.
8
EXPENSE TABLE
Fund expenses borne by the shareholders during the period,
March 1, 2011 through August 31, 2011
As a shareholder of the fund, you incur two types of costs: (1) transaction costs, including sales charges (loads) on certain purchase or redemption payments, and (2) ongoing costs, including management fees; distribution and service (12b-1) fees; and other fund expenses. This example is intended to help you understand your ongoing costs (in dollars) of investing in the fund and to compare these costs with the ongoing costs of investing in other mutual funds.
The example is based on an investment of $1,000 invested at the beginning of the period and held for the entire period March 1, 2011 through August 31, 2011.
The expenses include the payment of a portion of the transfer-agent-related expenses of MFS funds that invest in the fund. For further information, please see the Notes to the Financial Statements.
Actual Expenses
The first line for each share class in the following table provides information about actual account values and actual expenses. You may use the information in this line, together with the amount you invested, to estimate the expenses that you paid over the period. Simply divide your account value by $1,000 (for example, an $8,600 account value divided by $1,000 = 8.6), then multiply the result by the number in the first line under the heading entitled “Expenses Paid During Period” to estimate the expenses you paid on your account during this period.
Hypothetical Example for Comparison Purposes
The second line for each share class in the following table provides information about hypothetical account values and hypothetical expenses based on the fund’s actual expense ratio and an assumed rate of return of 5% per year before expenses, which is not the fund’s actual return. The hypothetical account values and expenses may not be used to estimate the actual ending account balance or expenses you paid for the period. You may use this information to compare the ongoing costs of investing in the fund and other funds. To do so, compare this 5% hypothetical example with the 5% hypothetical examples that appear in the shareholder reports of the other funds.
Please note that the expenses shown in the table are meant to highlight your ongoing costs only and do not reflect any transactional costs, such as sales charges (loads). Therefore, the second line for each share class in the table is useful in comparing ongoing costs only, and will not help you determine the relative total costs of owning different funds. In addition, if these transactional costs were included, your costs would have been higher.
9
Expense Table – continued
| | | | | | | | | | | | | | | | | | |
Share
Class | | | | Annualized
Expense Ratio | | | Beginning
Account Value
3/01/11 | | | Ending Account Value
8/31/11 | | | Expenses Paid During
Period (p) 3/01/11-8/31/11 | |
| A | | Actual | | | 1.19% | | | | $1,000.00 | | | | $919.70 | | | | $5.76 | |
| | Hypothetical (h) | | | 1.19% | | | | $1,000.00 | | | | $1,019.21 | | | | $6.06 | |
| B | | Actual | | | 1.95% | | | | $1,000.00 | | | | $916.61 | | | | $9.42 | |
| | Hypothetical (h) | | | 1.95% | | | | $1,000.00 | | | | $1,015.38 | | | | $9.91 | |
| C | | Actual | | | 1.95% | | | | $1,000.00 | | | | $916.83 | | | | $9.42 | |
| | Hypothetical (h) | | | 1.95% | | | | $1,000.00 | | | | $1,015.38 | | | | $9.91 | |
| I | | Actual | | | 0.95% | | | | $1,000.00 | | | | $921.53 | | | | $4.60 | |
| | Hypothetical (h) | | | 0.95% | | | | $1,000.00 | | | | $1,020.42 | | | | $4.84 | |
| W | | Actual | | | 1.05% | | | | $1,000.00 | | | | $920.71 | | | | $5.08 | |
| | Hypothetical (h) | | | 1.05% | | | | $1,000.00 | | | | $1,019.91 | | | | $5.35 | |
| R1 | | Actual | | | 1.95% | | | | $1,000.00 | | | | $916.89 | | | | $9.42 | |
| | Hypothetical (h) | | | 1.95% | | | | $1,000.00 | | | | $1,015.38 | | | | $9.91 | |
| R2 | | Actual | | | 1.45% | | | | $1,000.00 | | | | $918.81 | | | | $7.01 | |
| | Hypothetical (h) | | | 1.45% | | | | $1,000.00 | | | | $1,017.90 | | | | $7.38 | |
| R3 | | Actual | | | 1.20% | | | | $1,000.00 | | | | $919.62 | | | | $5.81 | |
| | Hypothetical (h) | | | 1.20% | | | | $1,000.00 | | | | $1,019.16 | | | | $6.11 | |
| R4 | | Actual | | | 0.95% | | | | $1,000.00 | | | | $921.05 | | | | $4.60 | |
| | Hypothetical (h) | | | 0.95% | | | | $1,000.00 | | | | $1,020.42 | | | | $4.84 | |
| 529A | | Actual | | | 1.28% | | | | $1,000.00 | | | | $920.00 | | | | $6.19 | |
| | Hypothetical (h) | | | 1.28% | | | | $1,000.00 | | | | $1,018.75 | | | | $6.51 | |
| 529B | | Actual | | | 2.03% | | | | $1,000.00 | | | | $916.27 | | | | $9.81 | |
| | Hypothetical (h) | | | 2.03% | | | | $1,000.00 | | | | $1,014.97 | | | | $10.31 | |
| 529C | | Actual | | | 2.03% | | | | $1,000.00 | | | | $916.22 | | | | $9.80 | |
| | Hypothetical (h) | | | 2.03% | | | | $1,000.00 | | | | $1,014.97 | | | | $10.31 | |
| (h) | 5% class return per year before expenses. |
| (p) | Expenses paid is equal to each class’ annualized expense ratio, as shown above, multiplied by the average account value over the period, multiplied by the number of days in the period, divided by the number of days in the year. Expenses paid do not include any applicable sales charges (loads). If these transaction costs had been included, your costs would have been higher. |
Expense Changes Impacting the Table
Changes to the fund’s fee arrangements occurred during the six month period. Had these fee changes been in effect throughout the entire six month period, the annualized expense ratios would have been 1.25%, 2.00% and 2.00% for Classes 529A, 529B and 529C, respectively; the actual expenses paid during the period would have been approximately $6.05, $9.66 and $9.66 for Classes 529A, 529B, and 529C, respectively; and the hypothetical expenses paid during the period would have been
10
Expense Table – continued
approximately $6.36, $10.16 and $10.16 for Classes 529A, 529B and 529C, respectively. For further information about the fund’s fee arrangements and changes to those fee arrangements, please see Note 3 in the Notes to Financial Statements.
11
PORTFOLIO OF INVESTMENTS
8/31/11
The Portfolio of Investments is a complete list of all securities owned by your fund. It is categorized by broad-based asset classes.
| | | | | | | | |
| Common Stocks - 98.6% | | | | | | | | |
| Issuer | | Shares/Par | | | Value ($) | |
| | | | | | | | |
| Aerospace - 0.7% | | | | | | | | |
| Rolls Royce Holdings PLC | | | 3,071,982 | | | $ | 31,915,194 | |
| | |
| Alcoholic Beverages - 1.5% | | | | | | | | |
| Heineken N.V. (l) | | | 1,307,916 | | | $ | 65,467,571 | |
| | |
| Apparel Manufacturers - 1.6% | | | | | | | | |
| Li & Fung Ltd. | | | 9,892,000 | | | $ | 17,925,883 | |
| LVMH Moet Hennessy Louis Vuitton S.A. | | | 304,783 | | | | 51,640,994 | |
| | | | | | | | |
| | | | | | | $ | 69,566,877 | |
| Automotive - 3.6% | | | | | | | | |
| Bayerische Motoren Werke AG | | | 675,035 | | | $ | 54,641,941 | |
| DENSO Corp. | | | 1,202,300 | | | | 38,468,623 | |
| GKN PLC | | | 7,094,994 | | | | 23,264,956 | |
| Honda Motor Co. Ltd. | | | 1,309,600 | | | | 42,790,829 | |
| | | | | | | | |
| | | | | | | $ | 159,166,349 | |
| Broadcasting - 1.6% | | | | | | | | |
| Nippon Television Network Corp. | | | 216,510 | | | $ | 31,556,738 | |
| Publicis Groupe S.A. | | | 865,832 | | | | 40,714,761 | |
| | | | | | | | |
| | | | | | | $ | 72,271,499 | |
| Brokerage & Asset Managers - 1.1% | | | | | | | | |
| Nomura Holdings, Inc. | | | 3,866,828 | | | $ | 16,386,826 | |
| Deutsche Boerse AG (a) | | | 548,481 | | | | 31,795,440 | |
| | | | | | | | |
| | | | | | | $ | 48,182,266 | |
| Business Services - 2.3% | | | | | | | | |
| Cognizant Technology Solutions Corp., “A” (a) | | | 346,570 | | | $ | 21,989,867 | |
| Compass Group PLC | | | 1,812,864 | | | | 16,214,952 | |
| Mitsubishi Corp. | | | 1,648,100 | | | | 39,693,426 | |
| Nomura Research, Inc. | | | 1,016,100 | | | | 23,106,941 | |
| | | | | | | | |
| | | | | | | $ | 101,005,186 | |
| Chemicals - 0.4% | | | | | | | | |
| Nufarm Ltd. (a) | | | 4,744,886 | | | $ | 19,553,943 | |
| | |
| Computer Software - 0.8% | | | | | | | | |
| Dassault Systems S.A. | | | 437,480 | | | $ | 35,506,884 | |
12
Portfolio of Investments – continued
| | | | | | | | |
| Issuer | | Shares/Par | | | Value ($) | |
| | | | | | | | |
| Common Stocks - continued | | | | | | | | |
| Computer Software - Systems - 1.8% | | | | | | | | |
| Acer, Inc. | | | 62,000 | | | $ | 74,803 | |
| Canon, Inc. | | | 1,126,000 | | | | 53,167,287 | |
| Konica Minolta Holdings, Inc. | | | 3,902,500 | | | | 26,817,156 | |
| | | | | | | | |
| | | | | | | $ | 80,059,246 | |
| Conglomerates - 0.5% | | | | | | | | |
| Hutchison Whampoa Ltd. | | | 2,522,000 | | | $ | 24,310,526 | |
| | |
| Consumer Products - 1.5% | | | | | | | | |
| Kimberly-Clark de Mexico S.A. de C.V., “A” | | | 3,222,360 | | | $ | 19,326,221 | |
| Reckitt Benckiser Group PLC | | | 930,233 | | | | 49,454,053 | |
| | | | | | | | |
| | | | | | | $ | 68,780,274 | |
| Electrical Equipment - 3.3% | | | | | | | | |
| Legrand S.A. | | | 394,377 | | | $ | 15,661,526 | |
| Schneider Electric S.A. | | | 406,905 | | | | 54,418,757 | |
| Siemens AG | | | 734,325 | | | | 75,823,231 | |
| | | | | | | | |
| | | | | | | $ | 145,903,514 | |
| Electronics - 1.7% | | | | | | | | |
| ASML Holding N.V. | | | 398,927 | | | $ | 14,128,770 | |
| Samsung Electronics Co. Ltd. | | | 28,106 | | | | 19,709,683 | |
| Taiwan Semiconductor Manufacturing Co. Ltd. | | | 17,209,326 | | | | 41,098,122 | |
| | | | | | | | |
| | | | | | | $ | 74,936,575 | |
| Energy - Independent - 2.4% | | | | | | | | |
| Bankers Petroleum Ltd. (a) | | | 2,110,394 | | | $ | 10,775,013 | |
| Cairn Energy PLC (a) | | | 2,122,586 | | | | 11,535,850 | |
| INPEX Corp. | | | 9,516 | | | | 64,503,326 | |
| Reliance Industries Ltd. | | | 1,172,176 | | | | 20,021,506 | |
| | | | | | | | |
| | | | | | | $ | 106,835,695 | |
| Energy - Integrated - 5.0% | | | | | | | | |
| BG Group PLC | | | 1,902,641 | | | $ | 41,139,586 | |
| BP PLC | | | 10,459,299 | | | | 68,330,304 | |
| Royal Dutch Shell PLC, “A” | | | 3,451,486 | | | | 115,697,777 | |
| | | | | | | | |
| | | | | | | $ | 225,167,667 | |
| Engineering - Construction - 2.2% | | | | | | | | |
| JGC Corp. | | | 2,047,000 | | | $ | 58,292,229 | |
| Keppel Corp. Ltd. | | | 3,213,400 | | | | 24,814,930 | |
| Outotec Oyj | | | 346,379 | | | | 14,359,978 | |
| | | | | | | | |
| | | | | | | $ | 97,467,137 | |
13
Portfolio of Investments – continued
| | | | | | | | |
| Issuer | | Shares/Par | | | Value ($) | |
| | | | | | | | |
| Common Stocks - continued | | | | | | | | |
| Food & Beverages - 4.7% | | | | | | | | |
| Groupe Danone | | | 1,148,757 | | | $ | 78,491,310 | |
| Nestle S.A. | | | 2,154,495 | | | | 133,437,793 | |
| | | | | | | | |
| | | | | | | $ | 211,929,103 | |
| Food & Drug Stores - 2.1% | �� | | | | | | | |
| Lawson, Inc. | | | 838,800 | | | $ | 45,626,250 | |
| Tesco PLC | | | 7,480,589 | | | | 45,974,313 | |
| | | | | | | | |
| | | | | | | $ | 91,600,563 | |
| Gaming & Lodging - 1.0% | | | | | | | | |
| Sands China Ltd. (a) | | | 13,516,000 | | | $ | 42,279,838 | |
| | |
| Insurance - 4.1% | | | | | | | | |
| AIA Group Ltd. | | | 9,651,400 | | | $ | 34,056,380 | |
| Amlin PLC | | | 1,256,783 | | | | 6,363,184 | |
| Hiscox Ltd. | | | 2,919,306 | | | | 16,842,086 | |
| ING Groep N.V. (a) | | | 6,118,171 | | | | 52,952,268 | |
| SNS REAAL Groep N.V. (a) | | | 3,554,426 | | | | 11,942,785 | |
| Swiss Re Ltd. | | | 1,200,069 | | | | 62,948,336 | |
| | | | | | | | |
| | | | | | | $ | 185,105,039 | |
| Machinery & Tools - 3.0% | | | | | | | | |
| BEML Ltd. | | | 345,661 | | | $ | 3,492,354 | |
| Glory Ltd. | | | 1,556,900 | | | | 33,622,778 | |
| Joy Global, Inc. | | | 458,410 | | | | 38,254,315 | |
| Schindler Holding AG | | | 418,939 | | | | 49,777,762 | |
| Sinotruk Hong Kong Ltd. | | | 14,575,500 | | | | 9,978,026 | |
| | | | | | | | |
| | | | | | | $ | 135,125,235 | |
| Major Banks - 10.4% | | | | | | | | |
| Barclays PLC | | | 10,383,197 | | | $ | 28,779,991 | |
| BNP Paribas | | | 1,385,781 | | | | 71,405,536 | |
| Credit Suisse Group AG | | | 1,360,232 | | | | 38,924,055 | |
| Erste Group Bank AG | | | 853,885 | | | | 31,094,477 | |
| HSBC Holdings PLC | | | 8,818,745 | | | | 76,816,815 | |
| Julius Baer Group Ltd. | | | 749,082 | | | | 30,768,275 | |
| KBC Group N.V. | | | 725,711 | | | | 20,536,945 | |
| Mitsubishi UFJ Financial Group, Inc. | | | 2,722,700 | | | | 12,321,366 | |
| Standard Chartered PLC | | | 2,154,046 | | | | 48,953,286 | |
| Sumitomo Mitsui Financial Group, Inc. | | | 1,569,200 | | | | 46,646,881 | |
| Westpac Banking Corp. | | | 2,693,025 | | | | 59,596,875 | |
| | | | | | | | |
| | | | | | | $ | 465,844,502 | |
14
Portfolio of Investments – continued
| | | | | | | | |
| Issuer | | Shares/Par | | | Value ($) | |
| | | | | | | | |
| Common Stocks - continued | | | | | | | | |
| Medical & Health Technology & Services - 2.6% | | | | | | | | |
| Diagnosticos da America S.A. | | | 1,794,300 | | | $ | 18,541,513 | |
| Miraca Holdings, Inc. | | | 1,268,300 | | | | 53,868,680 | |
| Rhoen-Klinikum AG | | | 1,748,780 | | | | 42,756,352 | |
| | | | | | | | |
| | | | | | | $ | 115,166,545 | |
| Medical Equipment - 1.0% | | | | | | | | |
| Sonova Holding AG | | | 229,523 | | | $ | 19,595,685 | |
| Synthes, Inc. (n) | | | 138,787 | | | | 24,765,863 | |
| | | | | | | | |
| | | | | | | $ | 44,361,548 | |
| Metals & Mining - 4.4% | | | | | | | | |
| Iluka Resources Ltd. | | | 2,300,473 | | | $ | 40,765,056 | |
| Rio Tinto Ltd. | | | 1,457,874 | | | | 89,976,883 | |
| Steel Authority of India Ltd. | | | 3,296,659 | | | | 7,763,783 | |
| Sumitomo Metal Industries Ltd. | | | 5,525,000 | | | | 11,588,216 | |
| Teck Resources Ltd., “B” | | | 1,060,356 | | | | 47,100,466 | |
| | | | | | | | |
| | | | | | | $ | 197,194,404 | |
| Natural Gas - Distribution - 0.9% | | | | | | | | |
| Tokyo Gas Co. Ltd. | | | 8,553,000 | | | $ | 39,288,342 | |
| | |
| Network & Telecom - 1.1% | | | | | | | | |
| Ericsson, Inc., “B” | | | 4,463,338 | | | $ | 50,359,037 | |
| | |
| Oil Services - 0.8% | | | | | | | | |
| AMEC PLC | | | 1,104,973 | | | $ | 16,385,476 | |
| Technip | | | 210,668 | | | | 20,566,380 | |
| | | | | | | | |
| | | | | | | $ | 36,951,856 | |
| Other Banks & Diversified Financials - 5.1% | | | | | | | | |
| Aeon Credit Service Co. Ltd. | | | 2,114,600 | | | $ | 31,699,145 | |
| Banco Santander Brasil S.A., ADR | | | 2,740,304 | | | | 26,361,724 | |
| China Construction Bank | | | 37,083,450 | | | | 27,585,641 | |
| HDFC Bank Ltd., ADR | | | 808,420 | | | | 26,968,891 | |
| ICICI Bank Ltd. | | | 2,004,197 | | | | 38,607,500 | |
| Komercni Banka A.S. | | | 127,172 | | | | 26,733,114 | |
| Sberbank of Russia | | | 10,679,180 | | | | 30,969,622 | |
| United Overseas Bank Ltd. | | | 1,208,000 | | | | 18,606,992 | |
| | | | | | | | |
| | | | | | | $ | 227,532,629 | |
| Pharmaceuticals - 5.6% | | | | | | | | |
| Bayer AG | | | 743,422 | | | $ | 47,939,215 | |
| Roche Holding AG | | | 628,889 | | | | 110,115,081 | |
15
Portfolio of Investments – continued
| | | | | | | | |
| Issuer | | Shares/Par | | | Value ($) | |
| | | | | | | | |
| Common Stocks - continued | | | | | | | | |
| Pharmaceuticals - continued | | | | | | | | |
| Sanofi-Aventis | | | 589,714 | | | $ | 42,915,337 | |
| Santen, Inc. | | | 1,186,300 | | | | 47,095,588 | |
| | | | | | | | |
| | | | | | | $ | 248,065,221 | |
| Precious Metals & Minerals - 0.8% | | | | | | | | |
| Newcrest Mining Ltd. | | | 816,275 | | | $ | 35,120,443 | |
| | |
| Railroad & Shipping - 0.6% | | | | | | | | |
| East Japan Railway Co. | | | 434,600 | | | $ | 26,021,970 | |
| | |
| Real Estate - 0.9% | | | | | | | | |
| GSW Immobilien AG (a) | | | 405,796 | | | $ | 13,086,696 | |
| Hang Lung Properties Ltd. | | | 7,665,000 | | | | 28,537,761 | |
| | | | | | | | |
| | | | | | | $ | 41,624,457 | |
| Specialty Chemicals - 4.0% | | | | | | | | |
| Akzo Nobel N.V. | | | 1,256,627 | | | $ | 63,974,368 | |
| Chugoku Marine Paints Ltd. | | | 1,703,000 | | | | 14,362,251 | |
| Linde AG | | | 469,105 | | | | 71,834,517 | |
| Nippon Paint Co. Ltd. | | | 1,846,000 | | | | 14,718,720 | |
| Symrise AG | | | 575,522 | | | | 15,633,613 | |
| | | | | | | | |
| | | | | | | $ | 180,523,469 | |
| Specialty Stores - 1.5% | | | | | | | | |
| Hennes & Mauritz AB, “B” | | | 1,110,404 | | | $ | 34,599,987 | |
| Industria de Diseno Textil S.A. | | | 396,819 | | | | 33,802,830 | |
| | | | | | | | |
| | | | | | | $ | 68,402,817 | |
| Telecommunications - Wireless - 3.2% | | | | | | | | |
| KDDI Corp. | | | 6,313 | | | $ | 47,421,047 | |
| Tim Participacoes S.A., ADR | | | 585,891 | | | | 18,244,646 | |
| Vodafone Group PLC | | | 30,374,308 | | | | 79,383,659 | |
| | | | | | | | |
| | | | | | | $ | 145,049,352 | |
| Telephone Services - 3.1% | | | | | | | | |
| China Unicom Ltd. | | | 26,234,000 | | | $ | 55,469,320 | |
| Royal KPN N.V. | | | 3,265,746 | | | | 46,255,697 | |
| Telecom Italia S.p.A. | | | 9,946,009 | | | | 12,065,752 | |
| Telecom Italia S.p.A. | | | 23,092,605 | | | | 25,376,999 | |
| | | | | | | | |
| | | | | | | $ | 139,167,768 | |
| Tobacco - 0.9% | | | | | | | | |
| Japan Tobacco, Inc. | | | 9,760 | | | $ | 42,140,843 | |
16
Portfolio of Investments – continued
| | | | | | | | |
| Issuer | | Shares/Par | | | Value ($) | |
| | | | | | | | |
| Common Stocks - continued | | | | | | | | |
| Trucking - 1.3% | | | | | | | | |
| Yamato Holdings Co. Ltd. | | | 3,408,300 | | | $ | 59,291,748 | |
| | |
| Utilities - Electric Power - 3.5% | | | | | | | | |
| CEZ AS | | | 710,676 | | | $ | 33,433,519 | |
| Energias de Portugal S.A. | | | 14,897,031 | | | | 49,005,081 | |
| Fortum Corp. | | | 1,437,548 | | | | 38,657,530 | |
| International Power PLC | | | 3,437,459 | | | | 18,972,095 | |
| Tractebel Energia S.A. | | | 957,560 | | | | 15,218,461 | |
| | | | | | | | |
| | | | | | | $ | 155,286,686 | |
| Total Common Stocks (Identified Cost, $4,197,232,185) | | | | | | $ | 4,409,529,818 | |
| | |
| Money Market Funds (v) - 1.0% | | | | | | | | |
MFS Institutional Money Market Portfolio, 0.08%,
at Cost and Net Asset Value | | | 43,126,896 | | | $ | 43,126,896 | |
| | |
| Collateral for Securities Loaned - 1.0% | | | | | | | | |
Navigator Securities Lending Prime Portfolio, 0.18%,
at Cost and Net Asset Value | | | 45,720,000 | | | $ | 45,720,000 | |
| Total Investments (Identified Cost, $4,286,079,081) | | | | | | $ | 4,498,376,714 | |
| | |
| Other Assets, Less Liabilities - (0.6)% | | | | | | | (28,441,765 | ) |
| Net Assets - 100.0% | | | | | | $ | 4,469,934,949 | |
| (a) | Non-income producing security. |
| (l) | A portion of this security is on loan. |
| (n) | Securities exempt from registration under Rule 144A of the Securities Act of 1933. These securities may be sold in the ordinary course of business in transactions exempt from registration, normally to qualified institutional buyers. At period end, the aggregate value of these securities was $24,765,863, representing 0.6% of net assets. |
| (v) | Underlying affiliated fund that is available only to investment companies managed by MFS. The rate quoted is the annualized seven-day yield of the fund at period end. |
The following abbreviations are used in this report and are defined:
| ADR | | American Depository Receipt |
| PLC | | Public Limited Company |
See Notes to Financial Statements
17
Financial Statements
STATEMENT OF ASSETS AND LIABILITIES
At 8/31/11
This statement represents your fund’s balance sheet, which details the assets and liabilities comprising the total value of the fund.
| | | | |
| Assets | | | | |
Investments- | | | | |
Non-affiliated issuers, at value (identified cost, $4,242,952,185) | | | $4,455,249,818 | |
Underlying affiliated funds, at cost and value | | | 43,126,896 | |
Total investments, at value, including $45,097,967 of securities on loan
(identified cost, $4,286,079,081) | | | $4,498,376,714 | |
Foreign currency, at value (identified cost, $289,082) | | | 287,157 | |
Receivables for | | | | |
Investments sold | | | 13,328,655 | |
Fund shares sold | | | 13,099,982 | |
Interest and dividends | | | 19,476,130 | |
Other assets | | | 10,487 | |
Total assets | | | $4,544,579,125 | |
| Liabilities | | | | |
Payables for | | | | |
Investments purchased | | | $21,877,169 | |
Fund shares reacquired | | | 4,510,822 | |
Collateral for securities loaned, at value | | | 45,720,000 | |
Payable to affiliates | | | | |
Investment adviser | | | 187,495 | |
Shareholder servicing costs | | | 1,700,057 | |
Distribution and service fees | | | 25,786 | |
Program manager fees | | | 8 | |
Payable for independent Trustees’ compensation | | | 15,457 | |
Accrued expenses and other liabilities | | | 607,382 | |
Total liabilities | | | $74,644,176 | |
Net assets | | | $4,469,934,949 | |
| Net assets consist of | | | | |
Paid-in capital | | | $5,164,258,045 | |
Unrealized appreciation (depreciation) on investments and translation of assets and liabilities in foreign currencies | | | 214,099,673 | |
Accumulated net realized gain (loss) on investments and foreign currency transactions | | | (994,261,311 | ) |
Undistributed net investment income | | | 85,838,542 | |
Net assets | | | $4,469,934,949 | |
Shares of beneficial interest outstanding | | | 300,234,337 | |
18
Statement of Assets and Liabilities – continued
| | | | | | | | | | | | |
| | | Net assets | | | Shares
outstanding | | | Net asset value
per share (a) | |
| Class A | | | $1,008,653,894 | | | | 68,799,557 | | | | $14.66 | |
| Class B | | | 33,058,891 | | | | 2,367,694 | | | | 13.96 | |
| Class C | | | 99,830,402 | | | | 7,246,805 | | | | 13.78 | |
| Class I | | | 2,484,794,578 | | | | 164,055,578 | | | | 15.15 | |
| Class W | | | 26,172,738 | | | | 1,788,899 | | | | 14.63 | |
| Class R1 | | | 6,287,963 | | | | 463,502 | | | | 13.57 | |
| Class R2 | | | 91,692,585 | | | | 6,431,805 | | | | 14.26 | |
| Class R3 | | | 154,868,957 | | | | 10,656,951 | | | | 14.53 | |
| Class R4 | | | 561,556,591 | | | | 38,209,225 | | | | 14.70 | |
| Class 529A | | | 1,746,816 | | | | 120,568 | | | | 14.49 | |
| Class 529B | | | 365,509 | | | | 26,933 | | | | 13.57 | |
| Class 529C | | | 906,025 | | | | 66,820 | | | | 13.56 | |
| (a) | Maximum offering price per share was equal to the net asset value per share for all share classes, except for Classes A and 529A, for which the maximum offering prices per share were $15.55 [100 / 94.25 x $14.66] and $15.37 [100 / 94.25 x $14.49], respectively. On sales of $50,000 or more, the maximum offering prices of Class A and Class 529A shares are reduced. A contingent deferred sales charge may be imposed on redemptions of Class A, Class B, Class C, Class 529B, and Class 529C shares. Redemption price per share was equal to the net asset value per share for Classes I, W, R1, R2, R3, R4, and 529A. |
See Notes to Financial Statements
19
Financial Statements
STATEMENT OF OPERATIONS
Year ended 8/31/11
This statement describes how much your fund earned in investment income and accrued in expenses.
It also describes any gains and/or losses generated by fund operations.
| | | | |
| Net investment income | | | | |
Income | | | | |
Dividends | | | $151,457,129 | |
Interest | | | 2,954,109 | |
Dividends from underlying affiliated funds | | | 66,602 | |
Foreign taxes withheld | | | (14,384,172 | ) |
Total investment income | | | $140,093,668 | |
Expenses | | | | |
Management fee | | | $37,813,990 | |
Distribution and service fees | | | 6,329,557 | |
Program manager fees | | | 3,253 | |
Shareholder servicing costs | | | 6,392,068 | |
Administrative services fee | | | 595,133 | |
Independent Trustees’ compensation | | | 99,370 | |
Custodian fee | | | 1,372,040 | |
Shareholder communications | | | 170,877 | |
Auditing fees | | | 62,337 | |
Legal fees | | | 80,750 | |
Miscellaneous | | | 459,593 | |
Total expenses | | | $53,378,968 | |
Fees paid indirectly | | | (330 | ) |
Reduction of expenses by investment adviser and distributor | | | (22,110 | ) |
Net expenses | | | $53,356,528 | |
Net investment income | | | $86,737,140 | |
Realized and unrealized gain (loss) on investments
and foreign currency transactions | | | | |
Realized gain (loss) (identified cost basis) | | | | |
Investment transactions | | | $544,096,852 | |
Foreign currency transactions | | | (335,586 | ) |
Net realized gain (loss) on investments
and foreign currency transactions | | | $543,761,266 | |
Change in unrealized appreciation (depreciation) | | | | |
Investments | | | $58,918,315 | |
Translation of assets and liabilities in foreign currencies | | | 1,587,201 | |
Net unrealized gain (loss) on investments and foreign currency translation | | | $60,505,516 | |
Net realized and unrealized gain (loss) on investments and foreign currency | | | $604,266,782 | |
Change in net assets from operations | | | $691,003,922 | |
See Notes to Financial Statements
20
Financial Statements
STATEMENTS OF CHANGES IN NET ASSETS
These statements describe the increases and/or decreases in net assets resulting from operations, any distributions, and any shareholder transactions.
| | | | | | | | |
| | | Years ended 8/31 | |
| | | 2011 | | | 2010 | |
| Change in net assets | | | | | | |
| From operations | | | | | | | | |
Net investment income | | | $86,737,140 | | | | $70,343,077 | |
Net realized gain (loss) on investments and
foreign currency transactions | | | 543,761,266 | | | | 28,160,832 | |
Net unrealized gain (loss) on investments and
foreign currency translation | | | 60,505,516 | | | | (102,183,759 | ) |
Change in net assets from operations | | | $691,003,922 | | | | $(3,679,850 | ) |
| Distributions declared to shareholders | | | | | | | | |
From net investment income | | | $(69,000,293 | ) | | | $(59,827,529 | ) |
Change in net assets from fund share transactions | | | $(425,542,047 | ) | | | $756,781,959 | |
Total change in net assets | | | $196,461,582 | | | | $693,274,580 | |
| Net assets | | | | | | | | |
At beginning of period | | | 4,273,473,367 | | | | 3,580,198,787 | |
At end of period (including undistributed net investment income of $85,838,542 and $68,248,161, respectively) | | | $4,469,934,949 | | | | $4,273,473,367 | |
See Notes to Financial Statements
21
Financial Statements
FINANCIAL HIGHLIGHTS
The financial highlights table is intended to help you understand the fund’s financial performance for the past 5 years. Certain information reflects financial results for a single fund share. The total returns in the table represent the rate by which an investor would have earned (or lost) on an investment in the fund share class (assuming reinvestment of all distributions) held for the entire period.
| | | | | | | | | | | | | | | | | | | | |
| Class A | | Years ended 8/31 | |
| | | 2011 | | | 2010 | | | 2009 | | | 2008 | | | 2007 | |
Net asset value, beginning of period | | | $12.93 | | | | $13.03 | | | | $16.14 | | | | $20.56 | | | | $19.44 | |
| Income (loss) from investment operations | | | | | | | | | | | | | | | | | |
Net investment income (d) | | | $0.26 | | | | $0.21 | | | | $0.22 | | | | $0.30 | | | | $0.26 | |
Net realized and unrealized gain (loss)
on investments and foreign currency | | | 1.67 | | | | (0.11 | ) | | | (2.92 | ) | | | (2.45 | ) | | | 3.03 | |
Total from investment operations | | | $1.93 | | | | $0.10 | | | | $(2.70 | ) | | | $(2.15 | ) | | | $3.29 | |
| Less distributions declared to shareholders | | | | | | | | | | | | | | | | | |
From net investment income | | | $(0.20 | ) | | | $(0.20 | ) | | | $(0.20 | ) | | | $(0.28 | ) | | | $(0.23 | ) |
From net realized gain on investments | | | — | | | | — | | | | (0.21 | ) | | | (1.99 | ) | | | (1.94 | ) |
Total distributions declared to shareholders | | | $(0.20 | ) | | | $(0.20 | ) | | | $(0.41 | ) | | | $(2.27 | ) | | | $(2.17 | ) |
Net asset value, end of period | | | $14.66 | | | | $12.93 | | | | $13.03 | | | | $16.14 | | | | $20.56 | |
Total return (%) (r)(s)(t)(x) | | | 14.89 | | | | 0.65 | | | | (16.22 | ) | | | (12.46 | ) | | | 17.82 | |
Ratios (%) (to average net assets)
and Supplemental data: | | | | | | | | | | | | | | | | | |
Expenses before expense reductions (f) | | | 1.19 | | | | 1.25 | | | | 1.35 | | | | 1.32 | | | | 1.34 | |
Expenses after expense reductions (f) | | | 1.19 | | | | 1.25 | | | | 1.35 | | | | 1.32 | | | | 1.34 | |
Net investment income | | | 1.67 | | | | 1.59 | | | | 1.95 | | | | 1.57 | | | | 1.28 | |
Portfolio turnover | | | 43 | | | | 56 | | | | 88 | | | | 68 | | | | 66 | |
Net assets at end of period (000 omitted) | | | $1,008,654 | | | | $1,466,337 | | | | $1,254,399 | | | | $1,628,324 | | | | $1,813,833 | |
See Notes to Financial Statements
22
Financial Highlights – continued
| | | | | | | | | | | | | | | | | | | | |
| Class B | | Years ended 8/31 | |
| | | 2011 | | | 2010 | | | 2009 | | | 2008 | | | 2007 | |
Net asset value, beginning of period | | | $12.30 | | | | $12.39 | | | | $15.34 | | | | $19.61 | | | | $18.63 | |
| Income (loss) from investment operations | | | | | | | | | | | | | | | | | |
Net investment income (d) | | | $0.11 | | | | $0.09 | | | | $0.13 | | | | $0.14 | | | | $0.11 | |
Net realized and unrealized gain (loss)
on investments and foreign currency | | | 1.62 | | | | (0.09 | ) | | | (2.77 | ) | | | (2.30 | ) | | | 2.92 | |
Total from investment operations | | | $1.73 | | | | $— | | | | $(2.64 | ) | | | $(2.16 | ) | | | $3.03 | |
| Less distributions declared to shareholders | | | | | | | | | | | | | | | | | |
From net investment income | | | $(0.07 | ) | | | $(0.09 | ) | | | $(0.10 | ) | | | $(0.12 | ) | | | $(0.11 | ) |
From net realized gain on investments | | | — | | | | — | | | | (0.21 | ) | | | (1.99 | ) | | | (1.94 | ) |
Total distributions declared to shareholders | | | $(0.07 | ) | | | $(0.09 | ) | | | $(0.31 | ) | | | $(2.11 | ) | | | $(2.05 | ) |
Net asset value, end of period | | | $13.96 | | | | $12.30 | | | | $12.39 | | | | $15.34 | | | | $19.61 | |
Total return (%) (r)(s)(t)(x) | | | 14.02 | | | | (0.09 | ) | | | (16.85 | ) | | | (13.00 | ) | | | 17.08 | |
Ratios (%) (to average net assets)
and Supplemental data: | | | | | | | | | | | | | | | | | |
Expenses before expense reductions (f) | | | 1.95 | | | | 1.99 | | | | 2.05 | | | | 1.97 | | | | 1.99 | |
Expenses after expense reductions (f) | | | 1.94 | | | | 1.99 | | | | 2.05 | | | | 1.97 | | | | 1.99 | |
Net investment income | | | 0.76 | | | | 0.71 | | | | 1.25 | | | | 0.77 | | | | 0.55 | |
Portfolio turnover | | | 43 | | | | 56 | | | | 88 | | | | 68 | | | | 66 | |
Net assets at end of period (000 omitted) | | | $33,059 | | | | $40,476 | | | | $55,961 | | | | $111,389 | | | | $185,670 | |
| |
| Class C | | Years ended 8/31 | |
| | | 2011 | | | 2010 | | | 2009 | | | 2008 | | | 2007 | |
Net asset value, beginning of period | | | $12.16 | | | | $12.27 | | | | $15.23 | | | | $19.52 | | | | $18.57 | |
| Income (loss) from investment operations | | | | | | | | | | | | | | | | | |
Net investment income (d) | | | $0.12 | | | | $0.10 | | | | $0.14 | | | | $0.15 | | | | $0.12 | |
Net realized and unrealized gain (loss)
on investments and foreign currency | | | 1.59 | | | | (0.10 | ) | | | (2.77 | ) | | | (2.29 | ) | | | 2.89 | |
Total from investment operations | | | $1.71 | | | | $— | | | | $(2.63 | ) | | | $(2.14 | ) | | | $3.01 | |
| Less distributions declared to shareholders | | | | | | | | | | | | | | | | | |
From net investment income | | | $(0.09 | ) | | | $(0.11 | ) | | | $(0.12 | ) | | | $(0.16 | ) | | | $(0.12 | ) |
From net realized gain on investments | | | — | | | | — | | | | (0.21 | ) | | | (1.99 | ) | | | (1.94 | ) |
Total distributions declared to shareholders | | | $(0.09 | ) | | | $(0.11 | ) | | | $(0.33 | ) | | | $(2.15 | ) | | | $(2.06 | ) |
Net asset value, end of period | | | $13.78 | | | | $12.16 | | | | $12.27 | | | | $15.23 | | | | $19.52 | |
Total return (%) (r)(s)(t)(x) | | | 14.05 | | | | (0.03 | ) | | | (16.88 | ) | | | (13.00 | ) | | | 17.05 | |
Ratios (%) (to average net assets)
and Supplemental data: | | | | | | | | | | | | | | | | | |
Expenses before expense reductions (f) | | | 1.95 | | | | 2.00 | | | | 2.05 | | | | 1.97 | | | | 1.99 | |
Expenses after expense reductions (f) | | | 1.95 | | | | 2.00 | | | | 2.05 | | | | 1.97 | | | | 1.99 | |
Net investment income | | | 0.80 | | | | 0.78 | | | | 1.30 | | | | 0.86 | | | | 0.62 | |
Portfolio turnover | | | 43 | | | | 56 | | | | 88 | | | | 68 | | | | 66 | |
Net assets at end of period (000 omitted) | | | $99,830 | | | | $101,267 | | | | $110,142 | | | | $168,396 | | | | $200,491 | |
See Notes to Financial Statements
23
Financial Highlights – continued
| | | | | | | | | | | | | | | | | | | | |
| Class I | | Years ended 8/31 | |
| | | 2011 | | | 2010 | | | 2009 | | | 2008 | | | 2007 | |
Net asset value, beginning of period | | | $13.35 | | | | $13.44 | | | | $16.65 | | | | $21.14 | | | | $19.92 | |
| Income (loss) from investment operations | | | | | | | | | | | | | | | | | |
Net investment income (d) | | | $0.29 | | | | $0.26 | | | | $0.26 | | | | $0.37 | | | | $0.34 | |
Net realized and unrealized gain (loss)
on investments and foreign currency | | | 1.74 | | | | (0.12 | ) | | | (3.01 | ) | | | (2.52 | ) | | | 3.11 | |
Total from investment operations | | | $2.03 | | | | $0.14 | | | | $(2.75 | ) | | | $(2.15 | ) | | | $3.45 | |
| Less distributions declared to shareholders | | | | | | | | | | | | | | | | | |
From net investment income | | | $(0.23 | ) | | | $(0.23 | ) | | | $(0.25 | ) | | | $(0.35 | ) | | | $(0.29 | ) |
From net realized gain on investments | | | — | | | | — | | | | (0.21 | ) | | | (1.99 | ) | | | (1.94 | ) |
Total distributions declared to shareholders | | | $(0.23 | ) | | | $(0.23 | ) | | | $(0.46 | ) | | | $(2.34 | ) | | | $(2.23 | ) |
Net asset value, end of period | | | $15.15 | | | | $13.35 | | | | $13.44 | | | | $16.65 | | | | $21.14 | |
Total return (%) (r)(s)(x) | | | 15.19 | | | | 0.92 | | | | (16.00 | ) | | | (12.15 | ) | | | 18.27 | |
Ratios (%) (to average net assets)
and Supplemental data: | | | | | | | | | | | | | | | | | |
Expenses before expense reductions (f) | | | 0.95 | | | | 1.00 | | | | 1.05 | | | | 0.97 | | | | 0.99 | |
Expenses after expense reductions (f) | | | 0.95 | | | | 1.00 | | | | 1.05 | | | | 0.97 | | | | 0.99 | |
Net investment income | | | 1.86 | | | | 1.90 | | | | 2.31 | | | | 1.93 | | | | 1.64 | |
Portfolio turnover | | | 43 | | | | 56 | | | | 88 | | | | 68 | | | | 66 | |
Net assets at end of period (000 omitted) | | | $2,484,795 | | | | $1,926,221 | | | | $1,456,884 | | | | $2,167,218 | | | | $2,210,257 | |
| |
| Class W | | Years ended 8/31 | |
| | | 2011 | | | 2010 | | | 2009 | | | 2008 | | | 2007 | |
Net asset value, beginning of period | | | $12.90 | | | | $13.00 | | | | $16.14 | | | | $20.57 | | | | $19.45 | |
| Income (loss) from investment operations | | | | | | | | | | | | | | | | | |
Net investment income (d) | | | $0.26 | | | | $0.23 | | | | $0.24 | | | | $0.35 | | | | $0.35 | |
Net realized and unrealized gain (loss)
on investments and foreign currency | | | 1.69 | | | | (0.11 | ) | | | (2.93 | ) | | | (2.45 | ) | | | 3.00 | |
Total from investment operations | | | $1.95 | | | | $0.12 | | | | $(2.69 | ) | | | $(2.10 | ) | | | $3.35 | |
| Less distributions declared to shareholders | | | | | | | | | | | | | | | | | |
From net investment income | | | $(0.22 | ) | | | $(0.22 | ) | | | $(0.24 | ) | | | $(0.34 | ) | | | $(0.29 | ) |
From net realized gain on investments | | | — | | | | — | | | | (0.21 | ) | | | (1.99 | ) | | | (1.94 | ) |
Total distributions declared to shareholders | | | $(0.22 | ) | | | $(0.22 | ) | | | $(0.45 | ) | | | $(2.33 | ) | | | $(2.23 | ) |
Net asset value, end of period | | | $14.63 | | | | $12.90 | | | | $13.00 | | | | $16.14 | | | | $20.57 | |
Total return (%) (r)(s)(x) | | | 15.07 | | | | 0.81 | | | | (16.12 | ) | | | (12.25 | ) | | | 18.15 | |
Ratios (%) (to average net assets)
and Supplemental data: | | | | | | | | | | | | | | | | | |
Expenses before expense reductions (f) | | | 1.05 | | | | 1.10 | | | | 1.14 | | | | 1.07 | | | | 1.10 | |
Expenses after expense reductions (f) | | | 1.05 | | | | 1.10 | | | | 1.14 | | | | 1.07 | | | | 1.10 | |
Net investment income | | | 1.71 | | | | 1.73 | | | | 2.25 | | | | 1.89 | | | | 1.78 | |
Portfolio turnover | | | 43 | | | | 56 | | | | 88 | | | | 68 | | | | 66 | |
Net assets at end of period (000 omitted) | | | $26,173 | | | | $24,820 | | | | $23,560 | | | | $16,633 | | | | $10,272 | |
See Notes to Financial Statements
24
Financial Highlights – continued
| | | | | | | | | | | | | | | | | | | | |
| Class R1 | | Years ended 8/31 | |
| | | 2011 | | | 2010 | | | 2009 | | | 2008 | | | 2007 | |
Net asset value, beginning of period | | | $11.98 | | | | $12.10 | | | | $15.05 | | | | $19.38 | | | | $18.49 | |
| Income (loss) from investment operations | | | | | | | | | | | | | | | | | |
Net investment income (d) | | | $0.12 | | | | $0.10 | | | | $0.14 | | | | $0.16 | | | | $0.12 | |
Net realized and unrealized gain (loss)
on investments and foreign currency | | | 1.57 | | | | (0.10 | ) | | | (2.74 | ) | | | (2.28 | ) | | | 2.87 | |
Total from investment operations | | | $1.69 | | | | $— | | | | $(2.60 | ) | | | $(2.12 | ) | | | $2.99 | |
| Less distributions declared to shareholders | | | | | | | | | | | | | | | | | |
From net investment income | | | $(0.10 | ) | | | $(0.12 | ) | | | $(0.14 | ) | | | $(0.22 | ) | | | $(0.16 | ) |
From net realized gain on investments | | | — | | | | — | | | | (0.21 | ) | | | (1.99 | ) | | | (1.94 | ) |
Total distributions declared to shareholders | | | $(0.10 | ) | | | $(0.12 | ) | | | $(0.35 | ) | | | $(2.21 | ) | | | $(2.10 | ) |
Net asset value, end of period | | | $13.57 | | | | $11.98 | | | | $12.10 | | | | $15.05 | | | | $19.38 | |
Total return (%) (r)(s)(x) | | | 14.09 | | | | (0.09 | ) | | | (16.87 | ) | | | (13.03 | ) | | | 17.00 | |
Ratios (%) (to average net assets)
and Supplemental data: | | | | | | | | | | | | | | | | | |
Expenses before expense reductions (f) | | | 1.95 | | | | 2.00 | | | | 2.05 | | | | 2.02 | | | | 2.14 | |
Expenses after expense reductions (f) | | | 1.95 | | | | 2.00 | | | | 2.05 | | | | 2.02 | | | | 2.09 | |
Net investment income | | | 0.84 | | | | 0.77 | | | | 1.34 | | | | 0.92 | | | | 0.64 | |
Portfolio turnover | | | 43 | | | | 56 | | | | 88 | | | | 68 | | | | 66 | |
Net assets at end of period (000 omitted) | | | $6,288 | | | | $5,868 | | | | $6,311 | | | | $8,930 | | | | $5,441 | |
| |
| Class R2 | | Years ended 8/31 | |
| | | 2011 | | | 2010 | | | 2009 | | | 2008 | | | 2007 | |
Net asset value, beginning of period | | | $12.59 | | | | $12.70 | | | | $15.76 | | | | $20.14 | | | | $19.11 | |
| Income (loss) from investment operations | | | | | | | | | | | | | | | | | |
Net investment income (d) | | | $0.20 | | | | $0.18 | | | | $0.20 | | | | $0.36 | | | | $0.22 | |
Net realized and unrealized gain (loss)
on investments and foreign currency | | | 1.64 | | | | (0.11 | ) | | | (2.87 | ) | | | (2.49 | ) | | | 2.96 | |
Total from investment operations | | | $1.84 | | | | $0.07 | | | | $(2.67 | ) | | | $(2.13 | ) | | | $3.18 | |
| Less distributions declared to shareholders | | | | | | | | | | | | | | | | | |
From net investment income | | | $(0.17 | ) | | | $(0.18 | ) | | | $(0.18 | ) | | | $(0.26 | ) | | | $(0.21 | ) |
From net realized gain on investments | | | — | | | | — | | | | (0.21 | ) | | | (1.99 | ) | | | (1.94 | ) |
Total distributions declared to shareholders | | | $(0.17 | ) | | | $(0.18 | ) | | | $(0.39 | ) | | | $(2.25 | ) | | | $(2.15 | ) |
Net asset value, end of period | | | $14.26 | | | | $12.59 | | | | $12.70 | | | | $15.76 | | | | $20.14 | |
Total return (%) (r)(s)(x) | | | 14.61 | | | | 0.45 | | | | (16.45 | ) | | | (12.63 | ) | | | 17.50 | |
Ratios (%) (to average net assets) and Supplemental data: | | | | | | | | | | | | | | | | | |
Expenses before expense reductions (f) | | | 1.45 | | | | 1.50 | | | | 1.54 | | | | 1.51 | | | | 1.69 | |
Expenses after expense reductions (f) | | | 1.45 | | | | 1.50 | | | | 1.54 | | | | 1.51 | | | | 1.64 | |
Net investment income | | | 1.37 | | | | 1.34 | | | | 1.88 | | | | 2.02 | | | | 1.13 | |
Portfolio turnover | | | 43 | | | | 56 | | | | 88 | | | | 68 | | | | 66 | |
Net assets at end of period (000 omitted) | | | $91,693 | | | | $72,425 | | | | $60,790 | | | | $96,672 | | | | $36,143 | |
See Notes to Financial Statements
25
Financial Highlights – continued
| | | | | | | | | | | | | | | | | | | | |
| Class R3 | | Years ended 8/31 | |
| | | 2011 | | | 2010 | | | 2009 | | | 2008 | | | 2007 | |
Net asset value, beginning of period | | | $12.82 | | | | $12.92 | | | | $16.06 | | | | $20.47 | | | | $19.39 | |
| Income (loss) from investment operations | | | | | | | | | | | | | | | | | |
Net investment income (d) | | | $0.23 | | | | $0.21 | | | | $0.23 | | | | $0.30 | | | | $0.31 | |
Net realized and unrealized gain (loss)
on investments and foreign currency | | | 1.68 | | | | (0.10 | ) | | | (2.93 | ) | | | (2.43 | ) | | | 2.96 | |
Total from investment operations | | | $1.91 | | | | $0.11 | | | | $(2.70 | ) | | | $(2.13 | ) | | | $3.27 | |
| Less distributions declared to shareholders | | | | | | | | | | | | | | | | | |
From net investment income | | | $(0.20 | ) | | | $(0.21 | ) | | | $(0.23 | ) | | | $(0.29 | ) | | | $(0.25 | ) |
From net realized gain on investments | | | — | | | | — | | | | (0.21 | ) | | | (1.99 | ) | | | (1.94 | ) |
Total distributions declared to shareholders | | | $(0.20 | ) | | | $(0.21 | ) | | | $(0.44 | ) | | | $(2.28 | ) | | | $(2.19 | ) |
Net asset value, end of period | | | $14.53 | | | | $12.82 | | | | $12.92 | | | | $16.06 | | | | $20.47 | |
Total return (%) (r)(s)(x) | | | 14.88 | | | | 0.72 | | | | (16.26 | ) | | | (12.42 | ) | | | 17.78 | |
Ratios (%) (to average net assets)
and Supplemental data: | | | | | | | | | | | | | | | | | |
Expenses before expense reductions (f) | | | 1.20 | | | | 1.25 | | | | 1.29 | | | | 1.27 | | | | 1.39 | |
Expenses after expense reductions (f) | | | 1.20 | | | | 1.25 | | | | 1.29 | | | | 1.27 | | | | 1.39 | |
Net investment income | | | 1.54 | | | | 1.55 | | | | 2.09 | | | | 1.61 | | | | 1.54 | |
Portfolio turnover | | | 43 | | | | 56 | | | | 88 | | | | 68 | | | | 66 | |
Net assets at end of period (000 omitted) | | | $154,869 | | | | $151,073 | | | | $133,545 | | | | $62,056 | | | | $64,332 | |
| |
| Class R4 | | Years ended 8/31 | |
| | | 2011 | | | 2010 | | | 2009 | | | 2008 | | | 2007 | |
Net asset value, beginning of period | | | $12.96 | | | | $13.05 | | | | $16.19 | | | | $20.60 | | | | $19.47 | |
| Income (loss) from investment operations | | | | | | | | | | | | | | | | | |
Net investment income (d) | | | $0.28 | | | | $0.24 | | | | $0.20 | | | | $0.34 | | | | $0.32 | |
Net realized and unrealized gain (loss)
on investments and foreign currency | | | 1.69 | | | | (0.10 | ) | | | (2.88 | ) | | | (2.43 | ) | | | 3.03 | |
Total from investment operations | | | $1.97 | | | | $0.14 | | | | $(2.68 | ) | | | $(2.09 | ) | | | $3.35 | |
| Less distributions declared to shareholders | | | | | | | | | | | | | | | | | |
From net investment income | | | $(0.23 | ) | | | $(0.23 | ) | | | $(0.25 | ) | | | $(0.33 | ) | | | $(0.28 | ) |
From net realized gain on investments | | | — | | | | — | | | | (0.21 | ) | | | (1.99 | ) | | | (1.94 | ) |
Total distributions declared to shareholders | | | $(0.23 | ) | | | $(0.23 | ) | | | $(0.46 | ) | | | $(2.32 | ) | | | $(2.22 | ) |
Net asset value, end of period | | | $14.70 | | | | $12.96 | | | | $13.05 | | | | $16.19 | | | | $20.60 | |
Total return (%) (r)(s)(x) | | | 15.19 | | | | 0.95 | | | | (16.03 | ) | | | (12.15 | ) | | | 18.13 | |
Ratios (%) (to average net assets)
and Supplemental data: | | | | | | | | | | | | | | | | | |
Expenses before expense reductions (f) | | | 0.95 | | | | 1.00 | | | | 1.00 | | | | 1.01 | | | | 1.09 | |
Expenses after expense reductions (f) | | | 0.95 | | | | 1.00 | | | | 1.00 | | | | 1.01 | | | | 1.09 | |
Net investment income | | | 1.83 | | | | 1.77 | | | | 1.72 | | | | 1.81 | | | | 1.56 | |
Portfolio turnover | | | 43 | | | | 56 | | | | 88 | | | | 68 | | | | 66 | |
Net assets at end of period (000 omitted) | | | $561,557 | | | | $482,217 | | | | $476,076 | | | | $148,343 | | | | $178,238 | |
See Notes to Financial Statements
26
Financial Highlights – continued
| | | | | | | | | | | | | | | | | | | | |
| Class 529A | | Years ended 8/31 | |
| | | 2011 | | | 2010 | | | 2009 | | | 2008 | | | 2007 | |
Net asset value, beginning of period | | | $12.78 | | | | $12.88 | | | | $15.96 | | | | $20.34 | | | | $19.27 | |
| Income (loss) from investment operations | | | | | | | | | | | | | | | | | |
Net investment income (d) | | | $0.22 | | | | $0.20 | | | | $0.21 | | | | $0.26 | | | | $0.20 | |
Net realized and unrealized gain (loss)
on investments and foreign currency | | | 1.68 | | | | (0.12 | ) | | | (2.89 | ) | | | (2.42 | ) | | | 3.01 | |
Total from investment operations | | | $1.90 | | | | $0.08 | | | | $(2.68 | ) | | | $(2.16 | ) | | | $3.21 | |
| Less distributions declared to shareholders | | | | | | | | | | | | | | | | | |
From net investment income | | | $(0.19 | ) | | | $(0.18 | ) | | | $(0.19 | ) | | | $(0.23 | ) | | | $(0.20 | ) |
From net realized gain on investments | | | — | | | | — | | | | (0.21 | ) | | | (1.99 | ) | | | (1.94 | ) |
Total distributions declared to shareholders | | | $(0.19 | ) | | | $(0.18 | ) | | | $(0.40 | ) | | | $(2.22 | ) | | | $(2.14 | ) |
Net asset value, end of period | | | $14.49 | | | | $12.78 | | | | $12.88 | | | | $15.96 | | | | $20.34 | |
Total return (%) (r)(s)(t)(x) | | | 14.80 | | | | 0.54 | | | | (16.32 | ) | | | (12.60 | ) | | | 17.51 | |
Ratios (%) (to average net assets)
and Supplemental data: | | | | | | | | | | | | | | | | | |
Expenses before expense reductions (f) | | | 1.30 | | | | 1.35 | | | | 1.45 | | | | 1.51 | | | | 1.59 | |
Expenses after expense reductions (f) | | | 1.29 | | | | 1.35 | | | | 1.45 | | | | 1.51 | | | | 1.59 | |
Net investment income | | | 1.47 | | | | 1.47 | | | | 1.90 | | | | 1.40 | | | | 1.01 | |
Portfolio turnover | | | 43 | | | | 56 | | | | 88 | | | | 68 | | | | 66 | |
Net assets at end of period (000 omitted) | | | $1,747 | | | | $1,512 | | | | $1,451 | | | | $2,017 | | | | $2,060 | |
| |
| Class 529B | | Years ended 8/31 | |
| | | 2011 | | | 2010 | | | 2009 | | | 2008 | | | 2007 | |
Net asset value, beginning of period | | | $11.99 | | | | $12.11 | | | | $15.05 | | | | $19.31 | | | | $18.43 | |
| Income (loss) from investment operations | | | | | | | | | | | | | | | | | |
Net investment income (d) | | | $0.09 | | | | $0.09 | | | | $0.12 | | | | $0.15 | | | | $0.08 | |
Net realized and unrealized gain (loss)
on investments and foreign currency | | | 1.58 | | | | (0.10 | ) | | | (2.74 | ) | | | (2.30 | ) | | | 2.86 | |
Total from investment operations | | | $1.67 | | | | $(0.01 | ) | | | $(2.62 | ) | | | $(2.15 | ) | | | $2.94 | |
| Less distributions declared to shareholders | | | | | | | | | | | | | | | | | |
From net investment income | | | $(0.09 | ) | | | $(0.11 | ) | | | $(0.11 | ) | | | $(0.12 | ) | | | $(0.12 | ) |
From net realized gain on investments | | | — | | | | — | | | | (0.21 | ) | | | (1.99 | ) | | | (1.94 | ) |
Total distributions declared to shareholders | | | $(0.09 | ) | | | $(0.11 | ) | | | $(0.32 | ) | | | $(2.11 | ) | | | $(2.06 | ) |
Net asset value, end of period | | | $13.57 | | | | $11.99 | | | | $12.11 | | | | $15.05 | | | | $19.31 | |
Total return (%) (r)(s)(t)(x) | | | 13.90 | | | | (0.14 | ) | | | (16.99 | ) | | | (13.16 | ) | | | 16.78 | |
Ratios (%) (to average net assets)
and Supplemental data: | | | | | | | | | | | | | | | | | |
Expenses before expense reductions (f) | | | 2.04 | | | | 2.10 | | | | 2.15 | | | | 2.16 | | | | 2.24 | |
Expenses after expense reductions (f) | | | 2.04 | | | | 2.10 | | | | 2.15 | | | | 2.16 | | | | 2.24 | |
Net investment income | | | 0.66 | | | | 0.69 | | | | 1.19 | | | | 0.83 | | | | 0.42 | |
Portfolio turnover | | | 43 | | | | 56 | | | | 88 | | | | 68 | | | | 66 | |
Net assets at end of period (000 omitted) | | | $366 | | | | $461 | | | | $449 | | | | $616 | | | | $581 | |
See Notes to Financial Statements
27
Financial Highlights – continued
| | | | | | | | | | | | | | | | | | | | |
| Class 529C | | Years ended 8/31 | |
| | | 2011 | | | 2010 | | | 2009 | | | 2008 | | | 2007 | |
Net asset value, beginning of period | | | $12.00 | | | | $12.12 | | | | $15.06 | | | | $19.31 | | | | $18.40 | |
| Income (loss) from investment operations | | | | | | | | | | | | | | | | | |
Net investment income (d) | | | $0.11 | | | | $0.09 | | | | $0.13 | | | | $0.13 | | | | $0.08 | |
Net realized and unrealized gain (loss)
on investments and foreign currency | | | 1.56 | | | | (0.10 | ) | | | (2.75 | ) | | | (2.28 | ) | | | 2.86 | |
Total from investment operations | | | $1.67 | | | | $(0.01 | ) | | | $(2.62 | ) | | | $(2.15 | ) | | | $2.94 | |
| Less distributions declared to shareholders | | | | | | | | | | | | | | | | | |
From net investment income | | | $(0.11 | ) | | | $(0.11 | ) | | | $(0.11 | ) | | | $(0.11 | ) | | | $(0.09 | ) |
From net realized gain on investments | | | — | | | | — | | | | (0.21 | ) | | | (1.99 | ) | | | (1.94 | ) |
Total distributions declared to shareholders | | | $(0.11 | ) | | | $(0.11 | ) | | | $(0.32 | ) | | | $(2.10 | ) | | | $(2.03 | ) |
Net asset value, end of period | | | $13.56 | | | | $12.00 | | | | $12.12 | | | | $15.06 | | | | $19.31 | |
Total return (%) (r)(s)(t)(x) | | | 13.89 | | | | (0.11 | ) | | | (16.98 | ) | | | (13.16 | ) | | | 16.79 | |
Ratios (%) (to average net assets) and Supplemental data: | | | | | | | | | | | | | | | | | |
Expenses before expense reductions (f) | | | 2.05 | | | | 2.10 | | | | 2.15 | | | | 2.16 | | | | 2.24 | |
Expenses after expense reductions (f) | | | 2.04 | | | | 2.10 | | | | 2.15 | | | | 2.16 | | | | 2.24 | |
Net investment income | | | 0.81 | | | | 0.76 | | | | 1.23 | | | | 0.73 | | | | 0.40 | |
Portfolio turnover | | | 43 | | | | 56 | | | | 88 | | | | 68 | | | | 66 | |
Net assets at end of period (000 omitted) | | | $906 | | | | $796 | | | | $631 | | | | $843 | | | | $938 | |
| (d) | Per share data is based on average shares outstanding. |
| (f) | Ratios do not reflect reductions from fees paid indirectly, if applicable. |
| (r) | Certain expenses have been reduced without which performance would have been lower. |
| (s) | From time to time the fund may receive proceeds from litigation settlements, without which performance would be lower. |
| (t) | Total returns do not include any applicable sales charges. |
| (x) | Total returns have been calculated on net asset values which include adjustments made in accordance with U.S. generally accepted accounting principles required at period end for financial reporting purposes. |
See Notes to Financial Statements
28
NOTES TO FINANCIAL STATEMENTS
| (1) | | Business and Organization |
MFS Research International Fund (the fund) is a series of MFS Series Trust I (the trust). The trust is organized as a Massachusetts business trust and is registered under the Investment Company Act of 1940, as amended, as an open-end management investment company.
| (2) | | Significant Accounting Policies |
General – The preparation of financial statements in conformity with U.S. generally accepted accounting principles requires management to make estimates and assumptions that affect the reported amounts of assets and liabilities, and disclosure of contingent assets and liabilities at the date of the financial statements and the reported amounts of revenues and expenses during the reporting period. Actual results could differ from those estimates. In the preparation of these financial statements, management has evaluated subsequent events occurring after the date of the fund’s Statement of Assets and Liabilities through the date that the financial statements were issued. The fund invests in foreign securities. Investments in foreign securities are vulnerable to the effects of changes in the relative values of the local currency and the U.S. dollar and to the effects of changes in each country’s legal, political, and economic environment.
Investment Valuations – Equity securities, including restricted equity securities, are generally valued at the last sale or official closing price as provided by a third-party pricing service on the market or exchange on which they are primarily traded. Equity securities, for which there were no sales reported that day, are generally valued at the last quoted daily bid quotation as provided by a third-party pricing service on the market or exchange on which such securities are primarily traded. Equity securities held short, for which there were no sales reported for that day, are generally valued at the last quoted daily ask quotation as provided by a third-party pricing service on the market or exchange on which such securities are primarily traded. Short-term instruments with a maturity at issuance of 60 days or less generally are valued at amortized cost, which approximates market value. Open-end investment companies are generally valued at net asset value per share. Securities and other assets generally valued on the basis of information from a third-party pricing service may also be valued at a broker/dealer bid quotation. Values obtained from third-party pricing services can utilize both transaction data and market information such as yield, quality, coupon rate, maturity, type of issue, trading characteristics, and other market data. The values of foreign securities and other assets and liabilities expressed in foreign currencies are converted to U.S. dollars using the mean of bid and asked prices for rates provided by a third-party pricing service.
29
Notes to Financial Statements – continued
The Board of Trustees has delegated primary responsibility for determining or causing to be determined the value of the fund’s investments (including any fair valuation) to the adviser pursuant to valuation policies and procedures approved by the Board. If the adviser determines that reliable market quotations are not readily available, investments are valued at fair value as determined in good faith by the adviser in accordance with such procedures under the oversight of the Board of Trustees. Under the fund’s valuation policies and procedures, market quotations are not considered to be readily available for most types of debt instruments and floating rate loans and many types of derivatives. These investments are generally valued at fair value based on information from third-party pricing services. In addition, investments may be valued at fair value if the adviser determines that an investment’s value has been materially affected by events occurring after the close of the exchange or market on which the investment is principally traded (such as foreign exchange or market) and prior to the determination of the fund’s net asset value, or after the halting of trading of a specific security where trading does not resume prior to the close of the exchange or market on which the security is principally traded. Events that occur on a frequent basis after foreign markets close (such as developments in foreign markets and significant movements in the U.S. markets) and prior to the determination of the fund’s net asset value may be deemed to have a material effect on the value of securities traded in foreign markets. Accordingly, the fund’s foreign equity securities may often be valued at fair value. The adviser generally relies on third-party pricing services or other information (such as the correlation with price movements of similar securities in the same or other markets; the type, cost and investment characteristics of the security; the business and financial condition of the issuer; and trading and other market data) to assist in determining whether to fair value and at what value to fair value an investment. The value of an investment for purposes of calculating the fund’s net asset value can differ depending on the source and method used to determine value. When fair valuation is used, the value of an investment used to determine the fund’s net asset value may differ from quoted or published prices for the same investment. There can be no assurance that the fund could obtain the fair value assigned to an investment if it were to sell the investment at the same time at which the fund determines its net asset value per share.
Various inputs are used in determining the value of the fund’s assets or liabilities. These inputs are categorized into three broad levels. In certain cases, the inputs used to measure fair value may fall into different levels of the fair value hierarchy. In such cases, an investment’s level within the fair value hierarchy is based on the lowest level of input that is significant to the fair value measurement. The fund’s assessment of the significance of a particular input to the fair value measurement in its entirety requires judgment, and
30
Notes to Financial Statements – continued
considers factors specific to the investment. Level 1 includes unadjusted quoted prices in active markets for identical assets or liabilities. Level 2 includes other significant observable market-based inputs (including quoted prices for similar securities, interest rates, prepayment speed, and credit risk). Level 3 includes unobservable inputs, which may include the adviser’s own assumptions in determining the fair value of investments. The following is a summary of the levels used as of August 31, 2011 in valuing the fund’s assets or liabilities:
| | | | | | | | | | | | | | | | |
| Investments at Value | | Level 1 | | | Level 2 | | | Level 3 | | | Total | |
| Equity Securities: | | | | | | | | | | | | | | | | |
Japan | | | $45,626,250 | | | | $874,870,956 | | | | $— | | | | $920,497,206 | |
United Kingdom | | | 786,000,460 | | | | — | | | | — | | | | 786,000,460 | |
Switzerland | | | 470,332,849 | | | | — | | | | — | | | | 470,332,849 | |
France | | | 411,321,484 | | | | — | | | | — | | | | 411,321,484 | |
Germany | | | 353,511,006 | | | | — | | | | — | | | | 353,511,006 | |
Netherlands | | | 254,721,458 | | | | — | | | | — | | | | 254,721,458 | |
Australia | | | 35,120,443 | | | | 119,915,873 | | | | — | | | | 155,036,316 | |
Hong Kong | | | — | | | | 147,110,388 | | | | — | | | | 147,110,388 | |
India | | | 26,968,891 | | | | 69,885,144 | | | | — | | | | 96,854,035 | |
Other Countries | | | 670,281,850 | | | | 143,862,766 | | | | — | | | | 814,144,616 | |
| Mutual Funds | | | 88,846,896 | | | | — | | | | — | | | | 88,846,896 | |
| Total Investments | | | $3,142,731,587 | | | | $1,355,645,127 | | | | $— | | | | $4,498,376,714 | |
For further information regarding security characteristics, see the Portfolio of Investments.
Of the level 2 investments presented above, equity investments amounting to $944,414,954 would have been considered level 1 investments at the beginning of the period. The primary reason for changes in the classifications between levels 1 and 2 occurs when foreign equity securities are fair valued using other observable market-based inputs in place of the closing exchange price due to events occurring after the close of the exchange or market on which the investment is principally traded. The fund’s foreign equity securities may often be valued at fair value. The fund’s policy is to recognize transfers between the levels as of the end of the period.
Foreign Currency Translation – Purchases and sales of foreign investments, income, and expenses are converted into U.S. dollars based upon currency exchange rates prevailing on the respective dates of such transactions or on the reporting date for foreign denominated receivables and payables. Gains and losses attributable to foreign currency exchange rates on sales of securities are recorded for financial statement purposes as net realized gains and losses on investments. Gains and losses attributable to foreign exchange rate movements on receivables, payables, income and expenses are recorded for financial statement purposes as foreign currency transaction gains and losses. That
31
Notes to Financial Statements – continued
portion of both realized and unrealized gains and losses on investments that results from fluctuations in foreign currency exchange rates is not separately disclosed.
Security Loans – State Street Bank and Trust Company (“State Street”), as lending agent, loans the securities of the fund to certain qualified institutions (the “Borrowers”) approved by the fund. The loans are collateralized by cash and/or U.S. Treasury and federal agency obligations in an amount typically at least equal to the market value of the securities loaned. The market value of the loaned securities is determined at the close of business of the fund and any additional required collateral is delivered to the fund on the next business day. State Street provides the fund with indemnification against Borrower default. The fund bears the risk of loss with respect to the investment of cash collateral. On loans collateralized by cash, the cash collateral is invested in a money market fund or short-term securities. A portion of the income generated upon investment of the collateral is remitted to the Borrowers, and the remainder is allocated between the fund and the lending agent. On loans collateralized by U.S. Treasury and/or federal agency obligations, a fee is received from the Borrower, and is allocated between the fund and the lending agent. Income from securities lending is included in interest income on the Statement of Operations. The dividend and interest income earned on the securities loaned is accounted for in the same manner as other dividend and interest income.
Indemnifications – Under the fund’s organizational documents, its officers and Trustees may be indemnified against certain liabilities and expenses arising out of the performance of their duties to the fund. Additionally, in the normal course of business, the fund enters into agreements with service providers that may contain indemnification clauses. The fund’s maximum exposure under these agreements is unknown as this would involve future claims that may be made against the fund that have not yet occurred.
Investment Transactions and Income – Investment transactions are recorded on the trade date. Interest income is recorded on the accrual basis. Dividends received in cash are recorded on the ex-dividend date. Certain dividends from foreign securities will be recorded when the fund is informed of the dividend if such information is obtained subsequent to the ex-dividend date. Dividend and interest payments received in additional securities are recorded on the ex-dividend or ex-interest date in an amount equal to the value of the security on such date.
The fund may receive proceeds from litigation settlements. Any proceeds received from litigation involving portfolio holdings are reflected in the Statement of Operations in realized gain/loss if the security has been disposed of by the fund or in unrealized gain/loss if the security is still held by the fund. Any other proceeds from litigation not related to portfolio holdings are reflected as other income in the Statement of Operations.
32
Notes to Financial Statements – continued
Fees Paid Indirectly – The fund’s custody fee may be reduced according to an arrangement that measures the value of cash deposited with the custodian by the fund. This amount, for the year ended August 31, 2011, is shown as a reduction of total expenses on the Statement of Operations.
Tax Matters and Distributions – The fund intends to qualify as a regulated investment company, as defined under Subchapter M of the Internal Revenue Code, and to distribute all of its taxable income, including realized capital gains. As a result, no provision for federal income tax is required. The fund’s federal tax returns for the prior three fiscal years remain subject to examination by the Internal Revenue Service. Foreign taxes, if any, have been accrued by the fund in the accompanying financial statements.
Distributions to shareholders are recorded on the ex-dividend date. Income and capital gain distributions are determined in accordance with income tax regulations, which may differ from U.S. generally accepted accounting principles. Certain capital accounts in the financial statements are periodically adjusted for permanent differences in order to reflect their tax character. These adjustments have no impact on net assets or net asset value per share. Temporary differences which arise from recognizing certain items of income, expense, gain or loss in different periods for financial statement and tax purposes will reverse at some time in the future. Distributions in excess of net investment income or net realized gains are temporary overdistributions for financial statement purposes resulting from differences in the recognition or classification of income or distributions for financial statement and tax purposes.
Book/tax differences primarily relate to wash sale loss deferrals.
The tax character of distributions declared to shareholders for the last two fiscal years is as follows:
| | | | | | | | |
| | | 8/31/11 | | | 8/31/10 | |
| Ordinary income (including any short-term capital gains) | | | $69,000,293 | | | | $59,827,529 | |
The federal tax cost and the tax basis components of distributable earnings were as follows:
| | | | |
| As of 8/31/11 | | | |
| Cost of investments | | | $4,357,561,364 | |
| Gross appreciation | | | 435,716,317 | |
| Gross depreciation | | | (294,900,967 | ) |
| Net unrealized appreciation (depreciation) | | | $140,815,350 | |
| Undistributed ordinary income | | | 86,221,982 | |
| Capital loss carryforwards | | | (922,779,028 | ) |
| Other temporary differences | | | 1,418,600 | |
33
Notes to Financial Statements – continued
As of August 31, 2011, the fund had capital loss carryforwards available to offset future realized gains. Such losses expire as follows:
| | | | |
| 8/31/17 | | | $(26,007,648 | ) |
| 8/31/18 | | | (896,771,380 | ) |
| Total | | | $(922,779,028 | ) |
Multiple Classes of Shares of Beneficial Interest – The fund offers multiple classes of shares, which differ in their respective distribution, service and program manager fees. The fund’s income, realized and unrealized gain (loss), and common expenses are allocated to shareholders based on the daily net assets of each class. Dividends are declared separately for each class. Differences in per share dividend rates are generally due to differences in separate class expenses. Class B and Class 529B shares will convert to Class A and Class 529A shares, respectively, approximately eight years after purchase. The fund’s distributions declared to shareholders as reported on the Statements of Changes in Net Assets are presented by class as follows:
| | | | | | | | |
| | | From net investment
income | |
| | | Year ended
8/31/11 | | | Year ended
8/31/10 | |
| Class A | | | $21,849,084 | | | | $19,942,316 | |
| Class B | | | 198,048 | | | | 354,170 | |
| Class C | | | 717,034 | | | | 1,018,291 | |
| Class I | | | 33,768,135 | | | | 26,352,391 | |
| Class W | | | 388,312 | | | | 418,964 | |
| Class R1 | | | 48,487 | | | | 60,073 | |
| Class R2 | | | 1,025,686 | | | | 904,011 | |
| Class R3 | | | 2,321,379 | | | | 2,141,334 | |
| Class R4 | | | 8,651,925 | | | | 8,605,096 | |
| Class 529A | | | 21,785 | | | | 20,502 | |
| Class 529B | | | 3,283 | | | | 4,205 | |
| Class 529C | | | 7,135 | | | | 6,176 | |
| Total | | | $69,000,293 | | | | $59,827,529 | |
| (3) | | Transactions with Affiliates |
Investment Adviser – The fund has an investment advisory agreement with MFS to provide overall investment management and related administrative services and facilities to the fund.
The management fee is computed daily and paid monthly at the following annual rates:
| | | | |
| First $1 billion of average daily net assets | | | 0.90 | % |
| Next $1 billion of average daily net assets | | | 0.80 | % |
| Average daily net assets in excess of $2 billion | | | 0.70 | % |
34
Notes to Financial Statements – continued
The management fee incurred for the year ended August 31, 2011 was equivalent to an annual effective rate of 0.76% of the fund’s average daily net assets.
Prior to January 1, 2011, the investment adviser had agreed in writing to pay a portion of the fund’s operating expenses, exclusive of management fee, distribution and service fee, program manager fees, interest, taxes, extraordinary expenses, brokerage and transaction costs and investment-related expenses, such that operating expenses did not exceed 0.40% annually of the fund’s average daily net assets. Effective January 1, 2011, this agreement was terminated. For the period September 1, 2010 to December 31, 2010, the fund’s actual operating expenses did not exceed the limit and therefore, the investment adviser did not pay any portion of the fund’s expenses under this agreement.
Distributor – MFS Fund Distributors, Inc. (MFD), a wholly-owned subsidiary of MFS, as distributor, received $60,298 and $958 for the year ended August 31, 2011, as its portion of the initial sales charge on sales of Class A and Class 529A shares of the fund, respectively.
The Board of Trustees has adopted a distribution plan for certain class shares pursuant to Rule 12b-1 of the Investment Company Act of 1940.
The fund’s distribution plan provides that the fund will pay MFD for services provided by MFD and financial intermediaries in connection with the distribution and servicing of certain share classes. One component of the plan is a distribution fee paid to MFD and another component of the plan is a service fee paid to MFD. MFD may subsequently pay all, or a portion, of the distribution and/or service fees to financial intermediaries.
Distribution Plan Fee Table:
| | | | | | | | | | | | | | | | | | | | |
| | | Distribution
Fee Rate (d) | | | Service
Fee Rate (d) | | | Total
Distribution Plan (d) | | | Annual
Effective Rate (e) | | | Distribution and Service Fee | |
| Class A | | | — | | | | 0.25% | | | | 0.25% | | | | 0.25% | | | | $3,806,988 | |
| Class B | | | 0.75% | | | | 0.25% | | | | 1.00% | | | | 1.00% | | | | 410,295 | |
| Class C | | | 0.75% | | | | 0.25% | | | | 1.00% | | | | 1.00% | | | | 1,117,702 | |
| Class W | | | 0.10% | | | | — | | | | 0.10% | | | | 0.10% | | | | 27,151 | |
| Class R1 | | | 0.75% | | | | 0.25% | | | | 1.00% | | | | 1.00% | | | | 68,980 | |
| Class R2 | | | 0.25% | | | | 0.25% | | | | 0.50% | | | | 0.50% | | | | 460,016 | |
| Class R3 | | | — | | | | 0.25% | | | | 0.25% | | | | 0.25% | | | | 419,379 | |
| Class 529A | | | — | | | | 0.25% | | | | 0.25% | | | | 0.25% | | | | 4,497 | |
| Class 529B | | | 0.75% | | | | 0.25% | | | | 1.00% | | | | 1.00% | | | | 4,785 | |
| Class 529C | | | 0.75% | | | | 0.25% | | | | 1.00% | | | | 1.00% | | | | 9,764 | |
| Total Distribution and Service Fees | | | | | | | | | | | | | | | | $6,329,557 | |
| (d) | In accordance with the distribution plan for certain classes, the fund pays distribution and/or service fees equal to these annual percentage rates of each class’ average daily net assets. The distribution and service fee rates disclosed by class represent the current rates in effect at the end of the reporting period. |
| (e) | The annual effective rates represent actual fees incurred under the distribution plan for the year ended August 31, 2011 based on each class’ average daily net assets. |
35
Notes to Financial Statements – continued
Certain Class A shares are subject to a contingent deferred sales charge (CDSC) in the event of a shareholder redemption within 24 months of purchase. Class C and Class 529C shares are subject to a CDSC in the event of a shareholder redemption within 12 months of purchase. Class B and Class 529B shares are subject to a CDSC in the event of a shareholder redemption within six years of purchase. All contingent deferred sales charges are paid to MFD and during the year ended August 31, 2011, were as follows:
| | | | |
| | | Amount | |
| Class A | | | $64 | |
| Class B | | | 52,665 | |
| Class C | | | 6,825 | |
| Class 529B | | | 305 | |
| Class 529C | | | 4 | |
The fund has entered into and may from time to time enter into contracts with program managers and other parties which administer the tuition programs through which an investment in the fund’s 529 share classes is made. The fund has entered into an agreement with MFD pursuant to which MFD receives an annual fee of up to 0.10% of the average daily net assets attributable to each 529 share class. Effective July 1, 2011, MFD has agreed to waive 0.05% of this annual fee. This waiver agreement will continue until modified by the fund’s Board of Trustees but such agreement will continue at least until December 31, 2012, after which MFD may eliminate this waiver without a vote of the fund’s Board of Trustees. For the year ended August 31, 2011, this waiver amounted to $267 and is reflected as a reduction of total expenses in the Statement of Operations. The services provided by MFD, or a third party with which MFD contracts, include recordkeeping and tax reporting and account services, as well as services designed to maintain the program’s compliance with the Internal Revenue Code and other regulatory requirements. Program manager fees for the year ended August 31, 2011, were as follows:
| | | | |
| | | Amount | |
| Class 529A | | | $1,799 | |
| Class 529B | | | 478 | |
| Class 529C | | | 976 | |
| Total Program Manager Fees | | | $3,253 | |
Shareholder Servicing Agent – MFS Service Center, Inc. (MFSC), a wholly-owned subsidiary of MFS, receives a fee from the fund for its services as shareholder servicing agent calculated as a percentage of the average daily net assets of the fund as determined periodically under the supervision of the fund’s Board of Trustees. For the year ended August 31, 2011, the fee was $733,572, which equated to 0.0147% annually of the fund’s average daily net assets. MFSC also receives payment from the fund for out-of-pocket expenses, sub-accounting and other shareholder servicing costs which may be paid to
36
Notes to Financial Statements – continued
affiliated and unaffiliated service providers. For the year ended August 31, 2011, these out-of-pocket expenses, sub-accounting and other shareholder servicing costs amounted to $4,148,132.
Under a Special Servicing Agreement among MFS, each MFS fund which invests in other MFS funds (“MFS fund-of-funds”) and certain underlying funds in which a MFS fund-of-funds invests (“underlying funds”), each underlying fund may pay a portion of each MFS fund-of-fund’s transfer agent-related expenses, including sub-accounting fees payable to financial intermediaries, to the extent such payments do not exceed the benefits realized or expected to be realized by the underlying fund from the investment in the underlying fund by the MFS fund-of-fund. For the year ended August 31, 2011, these costs for the fund amounted to $1,510,364 and are reflected in the shareholder servicing costs on the Statement of Operations.
Administrator – MFS provides certain financial, legal, shareholder communications, compliance, and other administrative services to the fund. Under an administrative services agreement, the fund partially reimburses MFS the costs incurred to provide these services. The fund is charged an annual fixed amount of $17,500 plus a fee based on average daily net assets. The administrative services fee incurred for the year ended August 31, 2011 was equivalent to an annual effective rate of 0.0120% of the fund’s average daily net assets.
Trustees’ and Officers’ Compensation – The fund pays compensation to independent Trustees in the form of a retainer, attendance fees, and additional compensation to Board and Committee chairpersons. The fund does not pay compensation directly to Trustees or officers of the fund who are also officers of the investment adviser, all of whom receive remuneration for their services to the fund from MFS. Certain officers and Trustees of the fund are officers or directors of MFS, MFD, and MFSC.
Prior to December 31, 2001, the fund had an unfunded defined benefit plan (“DB plan”) for independent Trustees. As of December 31, 2001, the Board took action to terminate the DB plan with respect to then-current and any future independent Trustees, such that the DB plan covers only certain of those former independent Trustees who retired on or before December 31, 2001. Effective January 1, 2002, accrued benefits under the DB plan for then-current independent Trustees who continued were credited to an unfunded retirement deferral plan (the “Retirement Deferral plan”), which was established for and exists solely with respect to these credited amounts, and is not available for other deferrals by these or other independent Trustees. Although the Retirement Deferral plan is unfunded, amounts deferred under the plan are periodically adjusted for investment experience as if they had been invested in shares of the fund. The DB plan resulted in a pension expense of $506 and the
37
Notes to Financial Statements – continued
Retirement Deferral plan resulted in an expense of $4,058. Both amounts are included in independent Trustees’ compensation for the year ended August 31, 2011. The liability for deferred retirement benefits payable to certain independent Trustees under both plans amounted to $14,772 at August 31, 2011, and is included in payable for independent Trustees’ compensation on the Statement of Assets and Liabilities.
Other – This fund and certain other funds managed by MFS (the funds) have entered into services agreements (the Agreements) which provide for payment of fees by the funds to Tarantino LLC and Griffin Compliance LLC in return for the provision of services of an Independent Chief Compliance Officer (ICCO) and Assistant ICCO, respectively, for the funds. The ICCO and Assistant ICCO are officers of the funds and the sole members of Tarantino LLC and Griffin Compliance LLC, respectively. The funds can terminate the Agreements with Tarantino LLC and Griffin Compliance LLC at any time under the terms of the Agreements. For the year ended August 31, 2011, the aggregate fees paid by the fund to Tarantino LLC and Griffin Compliance LLC were $44,802 and are included in miscellaneous expense on the Statement of Operations. MFS has agreed to reimburse the fund for a portion of the payments made by the fund in the amount of $21,843, which is shown as a reduction of total expenses in the Statement of Operations. Additionally, MFS has agreed to bear all expenses associated with office space, other administrative support, and supplies provided to the ICCO and Assistant ICCO.
The fund invests in the MFS Institutional Money Market Portfolio which is managed by MFS and seeks a high level of current income consistent with preservation of capital and liquidity. Income earned on this investment is included in dividends from underlying affiliated funds on the Statement of Operations. This money market fund does not pay a management fee to MFS.
Purchases and sales of investments, other than U.S. Government securities, purchased option transactions, and short-term obligations, aggregated $2,356,571,053 and $2,099,909,863, respectively.
38
Notes to Financial Statements – continued
| (5) | | Shares of Beneficial Interest |
The fund’s Declaration of Trust permits the Trustees to issue an unlimited number of full and fractional shares of beneficial interest. Transactions in fund shares were as follows:
| | | | | | | | | | | | | | | | |
| | | Year ended
8/31/11 | | | Year ended
8/31/10 | |
| | | Shares | | | Amount | | | Shares | | | Amount | |
| Shares sold | | | | | | | | | | | | | | | | |
Class A | | | 32,941,667 | | | | $492,113,665 | | | | 51,229,005 | | | | $693,718,247 | |
Class B | | | 165,782 | | | | 2,433,368 | | | | 355,863 | | | | 4,614,297 | |
Class C | | | 1,036,469 | | | | 15,039,017 | | | | 1,583,862 | | | | 20,337,246 | |
Class I | | | 41,238,601 | | | | 654,185,936 | | | | 59,813,082 | | | | 826,378,339 | |
Class W | | | 579,911 | | | | 8,837,293 | | | | 717,773 | | | | 9,700,883 | |
Class R1 | | | 109,554 | | | | 1,558,805 | | | | 146,402 | | | | 1,825,166 | |
Class R2 | | | 2,346,613 | | | | 35,096,775 | | | | 2,463,596 | | | | 32,377,272 | |
Class R3 | | | 3,421,538 | | | | 51,930,561 | | | | 5,133,884 | | | | 67,774,970 | |
Class R4 | | | 7,701,716 | | | | 117,844,014 | | | | 8,703,911 | | | | 116,935,708 | |
Class 529A | | | 23,252 | | | | 348,773 | | | | 16,379 | | | | 220,737 | |
Class 529B | | | 3,688 | | | | 53,515 | | | | 2,338 | | | | 29,508 | |
Class 529C | | | 10,849 | | | | 154,114 | | | | 21,691 | | | | 271,302 | |
| | | 89,579,640 | | | | $1,379,595,836 | | | | 130,187,786 | | | | $1,774,183,675 | |
| Shares issued to shareholders in reinvestment of distributions | | | | | | | | | | | | | | | | |
Class A | | | 1,199,775 | | | | $17,888,641 | | | | 1,187,502 | | | | $16,435,027 | |
Class B | | | 11,205 | | | | 160,011 | | | | 22,085 | | | | 292,187 | |
Class C | | | 26,968 | | | | 379,982 | | | | 44,853 | | | | 586,676 | |
Class I | | | 1,664,003 | | | | 25,592,360 | | | | 1,329,042 | | | | 18,952,132 | |
Class W | | | 22,534 | | | | 335,087 | | | | 27,928 | | | | 385,126 | |
Class R1 | | | 3,352 | | | | 46,549 | | | | 4,457 | | | | 57,449 | |
Class R2 | | | 61,607 | | | | 895,142 | | | | 56,616 | | | | 763,746 | |
Class R3 | | | 156,855 | | | | 2,318,310 | | | | 155,597 | | | | 2,134,798 | |
Class R4 | | | 578,805 | | | | 8,635,777 | | | | 619,267 | | | | 8,570,656 | |
Class 529A | | | 1,477 | | | | 21,782 | | | | 1,498 | | | | 20,502 | |
Class 529B | | | 237 | | | | 3,283 | | | | 326 | | | | 4,205 | |
Class 529C | | | 514 | | | | 7,135 | | | | 478 | | | | 6,176 | |
| | | 3,727,332 | | | | $56,284,059 | | | | 3,449,649 | | | | $48,208,680 | |
39
Notes to Financial Statements – continued
| | | | | | | | | | | | | | | | |
| | | Year ended
8/31/11 | | | Year ended
8/31/10 | |
| | | Shares | | | Amount | | | Shares | | | Amount | |
| Shares reacquired | | | | | | | | | | | | | | | | |
Class A | | | (78,742,150 | ) | | | $(1,227,585,763 | ) | | | (35,311,696 | ) | | | $(469,559,710 | ) |
Class B | | | (1,099,836 | ) | | | (16,023,400 | ) | | | (1,604,734 | ) | | | (20,743,200 | ) |
Class C | | | (2,145,835 | ) | | | (30,885,366 | ) | | | (2,273,844 | ) | | | (28,783,383 | ) |
Class I | | | (23,152,786 | ) | | | (364,946,851 | ) | | | (25,263,721 | ) | | | (345,902,356 | ) |
Class W | | | (737,523 | ) | | | (11,149,116 | ) | | | (634,355 | ) | | | (8,421,102 | ) |
Class R1 | | | (139,101 | ) | | | (1,997,190 | ) | | | (182,683 | ) | | | (2,299,968 | ) |
Class R2 | | | (1,730,329 | ) | | | (25,908,546 | ) | | | (1,553,198 | ) | | | (20,557,981 | ) |
Class R3 | | | (4,705,461 | ) | | | (71,220,940 | ) | | | (3,838,307 | ) | | | (51,412,629 | ) |
Class R4 | | | (7,284,048 | ) | | | (110,982,203 | ) | | | (8,591,098 | ) | | | (117,652,934 | ) |
Class 529A | | | (22,482 | ) | | | (347,548 | ) | | | (12,247 | ) | | | (162,642 | ) |
Class 529B | | | (15,479 | ) | | | (220,507 | ) | | | (1,219 | ) | | | (15,388 | ) |
Class 529C | | | (10,899 | ) | | | (154,512 | ) | | | (7,834 | ) | | | (99,103 | ) |
| | | (119,785,929 | ) | | | $(1,861,421,942 | ) | | | (79,274,936 | ) | | | $(1,065,610,396 | ) |
| Net change | | | | | | | | | | | | | | | | |
Class A | | | (44,600,708 | ) | | | $(717,583,457 | ) | | | 17,104,811 | | | | $240,593,564 | |
Class B | | | (922,849 | ) | | | (13,430,021 | ) | | | (1,226,786 | ) | | | (15,836,716 | ) |
Class C | | | (1,082,398 | ) | | | (15,466,367 | ) | | | (645,129 | ) | | | (7,859,461 | ) |
Class I | | | 19,749,818 | | | | 314,831,445 | | | | 35,878,403 | | | | 499,428,115 | |
Class W | | | (135,078 | ) | | | (1,976,736 | ) | | | 111,346 | | | | 1,664,907 | |
Class R1 | | | (26,195 | ) | | | (391,836 | ) | | | (31,824 | ) | | | (417,353 | ) |
Class R2 | | | 677,891 | | | | 10,083,371 | | | | 967,014 | | | | 12,583,037 | |
Class R3 | | | (1,127,068 | ) | | | (16,972,069 | ) | | | 1,451,174 | | | | 18,497,139 | |
Class R4 | | | 996,473 | | | | 15,497,588 | | | | 732,080 | | | | 7,853,430 | |
Class 529A | | | 2,247 | | | | 23,007 | | | | 5,630 | | | | 78,597 | |
Class 529B | | | (11,554 | ) | | | (163,709 | ) | | | 1,445 | | | | 18,325 | |
Class 529C | | | 464 | | | | 6,737 | | | | 14,335 | | | | 178,375 | |
| | | (26,478,957 | ) | | | $(425,542,047 | ) | | | 54,362,499 | | | | $756,781,959 | |
The fund is one of several mutual funds in which the MFS funds-of-funds may invest. The MFS funds-of-funds do not invest in the underlying MFS funds for the purpose of exercising management or control. At the end of the period, the MFS International Diversification Fund, MFS Growth Allocation Fund, MFS Moderate Allocation Fund, MFS Aggressive Growth Allocation Fund, and MFS Conservative Allocation Fund were the owners of record of approximately 17%, 4%, 4%, 2%, and 1%, respectively, of the value of outstanding voting shares of the fund. In addition, the MFS Lifetime 2010 Fund, MFS Lifetime 2020 Fund, MFS Lifetime 2030 Fund, MFS Lifetime 2040 Fund, MFS Lifetime 2050 Fund, and MFS Lifetime Retirement Income Fund were each the owners of record of less than 1% of the value of outstanding voting shares of the fund.
40
Notes to Financial Statements – continued
The fund and certain other funds managed by MFS participate in a $1.1 billion unsecured committed line of credit, subject to a $1 billion sublimit, provided by a syndication of banks under a credit agreement. Borrowings may be made for temporary financing needs. Interest is charged to each fund, based on its borrowings, generally at a rate equal to the higher of the Federal Reserve funds rate or one month LIBOR plus an agreed upon spread. A commitment fee, based on the average daily, unused portion of the committed line of credit, is allocated among the participating funds at the end of each calendar quarter. In addition, the fund and other funds managed by MFS have established unsecured uncommitted borrowing arrangements with certain banks for temporary financing needs. Interest is charged to each fund, based on its borrowings, at a rate equal to the Federal Reserve funds rate plus an agreed upon spread. For the year ended August 31, 2011, the fund’s commitment fee and interest expense were $45,151 and $0, respectively, and are included in miscellaneous expense on the Statement of Operations.
| (7) | | Transactions in Underlying Affiliated Funds-Affiliated Issuers |
An affiliated issuer may be considered one in which the fund owns 5% or more of the outstanding voting securities, or a company which is under common control. For the purposes of this report, the fund assumes the following to be affiliated issuers:
| | | | | | | | | | | | | | | | |
| Underlying Affiliated Funds | | Beginning
Shares/Par
Amount | | | Acquisitions
Shares/Par
Amount | | | Dispositions
Shares/Par
Amount | | | Ending
Shares/Par
Amount | |
MFS Institutional Money
Market Portfolio | | | 17,347,471 | | | | 1,064,091,413 | | | | (1,038,311,988 | ) | | | 43,126,896 | |
| | | | |
| Underlying Affiliated Funds | | Realized
Gain (Loss) | | | Capital Gain
Distributions | | | Dividend
Income | | | Ending
Value | |
MFS Institutional Money
Market Portfolio | | | $— | | | | $— | | | | $66,602 | | | | $43,126,896 | |
41
REPORT OF INDEPENDENT REGISTERED PUBLIC ACCOUNTING FIRM
To the Board of Trustees of MFS Series Trust I and Shareholders of MFS Research International Fund:
We have audited the accompanying statement of assets and liabilities of MFS Research International Fund (the Fund) (one of the portfolios comprising MFS Series Trust I), including the portfolio of investments, as of August 31, 2011, and the related statement of operations for the year then ended, the statements of changes in net assets for each of the two years in the period then ended, and the financial highlights for each of the five years in the period then ended. These financial statements and financial highlights are the responsibility of the Fund’s management. Our responsibility is to express an opinion on these financial statements and financial highlights based on our audits.
We conducted our audits in accordance with the standards of the Public Company Accounting Oversight Board (United States). Those standards require that we plan and perform the audit to obtain reasonable assurance about whether the financial statements and financial highlights are free of material misstatement. We were not engaged to perform an audit of the Fund’s internal control over financial reporting. Our audits included consideration of internal control over financial reporting as a basis for designing audit procedures that are appropriate in the circumstances, but not for the purpose of expressing an opinion on the effectiveness of the Fund’s internal control over financial reporting. Accordingly, we express no such opinion. An audit also includes examining, on a test basis, evidence supporting the amounts and disclosures in the financial statements and financial highlights, assessing the accounting principles used and significant estimates made by management, and evaluating the overall financial statement presentation. Our procedures included confirmation of securities owned as of August 31, 2011, by correspondence with the custodian and brokers or by other appropriate auditing procedures where replies from brokers were not received. We believe that our audits provide a reasonable basis for our opinion.
In our opinion, the financial statements and financial highlights referred to above present fairly, in all material respects, the financial position of the MFS Research International Fund at August 31, 2011, the results of its operations for the year then ended, the changes in its net assets for each of the two years in the period then ended, and its financial highlights for each of the five years in the period then ended, in conformity with U.S. generally accepted accounting principles.

Boston, Massachusetts
October 17, 2011
42
TRUSTEES AND OFFICERS —
IDENTIFICATION AND BACKGROUND
The Trustees and officers of the Trust, as of October 1, 2011, are listed below, together with their principal occupations during the past five years. (Their titles may have varied during that period.) The address of each Trustee and officer is 500 Boylston Street, Boston, Massachusetts 02116.
| | | | | | | | |
Name, Age | | Position(s) Held with Fund | | Trustee/Officer
Since (h) | | Principal Occupations
During the Past Five Years | | Other
Directorships (j) |
| INTERESTED TRUSTEES |
Robert J. Manning (k)
(age 47) | | Trustee | | February 2004 | | Massachusetts Financial Services Company, Chairman, Chief Executive Officer and Director; President (until December 2009); Chief Investment Officer (until July 2010) | | |
Robert C. Pozen (k)
(age 65) | | Trustee | | February 2004 | | Massachusetts Financial Services Company, Chairman Emeritus; Chairman (until July 2010) | | Medtronic, Inc, (medical devices), Director (since 2004); The Neilsen Company (market research), Director (since 2010); Telesat (satellite communications), Director (until November 2007); Bell Canada Enterprises (telecommunications), Director (until February 2009) |
43
Trustees and Officers – continued
| | | | | | | | |
Name, Age | | Position(s) Held with Fund | | Trustee/Officer
Since (h) | | Principal Occupations
During the Past Five Years | | Other
Directorships (j) |
| INDEPENDENT TRUSTEES |
David H. Gunning
(age 69) | | Trustee and Chair of Trustees | | January 2004 | | Retired; Cleveland-Cliffs Inc. (mining products and service provider), Vice Chairman/Director (until May 2007) | | Lincoln Electric Holdings, Inc. (welding equipment manufacturer), Director; Development Alternatives, Inc. (consulting), Director/Non-Executive Chairman; Portman Limited (mining), Director (until 2008) |
Robert E. Butler
(age 69) | | Trustee | | January 2006 | | Consultant – investment company industry regulatory and compliance matters | | |
Maureen R. Goldfarb
(age 56) | | Trustee | | January 2009 | | Private investor | | |
William R. Gutow
(age 70) | | Trustee | | December 1993 | | Private investor and real estate consultant; Capitol Entertainment Management Company (video franchise), Vice Chairman | | Atlantic Coast Tan (tanning salons), Vice Chairman (until 2007); Texas Donuts (donut franchise), Vice Chairman (until 2010) |
Michael Hegarty
(age 66) | | Trustee | | December 2004 | | Private investor | | |
44
Trustees and Officers – continued
| | | | | | | | |
Name, Age | | Position(s) Held with Fund | | Trustee/Officer
Since (h) | | Principal Occupations
During the Past Five Years | | Other
Directorships (j) |
John P. Kavanaugh
(age 56) | | Trustee | | January 2009 | | Private investor; The Hanover Insurance Group, Inc., Vice President and Chief Investment Officer (until 2006); Allmerica Investment Trust, Allmerica Securities Trust and Opus Investment Trust (investment companies), Chairman, President and Trustee (until 2006) | | |
J. Dale Sherratt
(age 73) | | Trustee | | June 1989 | | Insight Resources, Inc. (acquisition planning specialists), President; Wellfleet Investments (investor in health care companies), Managing General Partner | | |
Laurie J. Thomsen
(age 54) | | Trustee | | March 2005 | | Private investor; New Profit, Inc. (venture philanthropy), Executive Partner (until 2010) | | The Travelers Companies (property and casualty insurance), Director |
Robert W. Uek
(age 70) | | Trustee | | January 2006 | | Consultant to investment company industry | | |
| OFFICERS | | | | | | | | |
Maria F. DiOrioDwyer (k)
(age 52) | | President | | March 2004 | | Massachusetts Financial Services Company, Executive Vice President and Chief Regulatory Officer Chief Compliance Officer (since December 2006) | | |
Christopher R. Bohane (k)
(age 37) | | Assistant Secretary and Assistant Clerk | | July 2005 | | Massachusetts Financial Services Company, Vice President and Senior Counsel | | |
45
Trustees and Officers – continued
| | | | | | | | |
Name, Age | | Position(s) Held with Fund | | Trustee/Officer
Since (h) | | Principal Occupations
During the Past Five Years | | Other
Directorships (j) |
John M. Corcoran (k)
(age 46) | | Treasurer | | October 2008 | | Massachusetts Financial Services Company, Senior Vice President (since October 2008); State Street Bank and Trust (financial services provider), Senior Vice President, (until September 2008) | | |
Ethan D. Corey (k)
(age 47) | | Assistant Secretary and Assistant Clerk | | July 2005 | | Massachusetts Financial Services Company, Senior Vice President and Associate General Counsel | | |
David L. DiLorenzo (k)
(age 43) | | Assistant Treasurer | | July 2005 | | Massachusetts Financial Services Company, Vice President | | |
Timothy M. Fagan (k)
(age 43) | | Assistant Secretary and Assistant Clerk | | September 2005 | | Massachusetts Financial Services Company, Vice President and Senior Counsel | | |
Robyn L. Griffin
(age 36) | | Assistant Independent Chief Compliance Officer | | August 2008 | | Griffin Compliance LLC (provider of compliance services), Principal (since August 2008); State Street Corporation (financial services provider), Mutual Fund Administration Assistant Vice President (October 2006 – July 2008); Liberty Mutual Group (insurance), Personal Market Assistant Controller (April 2006 – October 2006); Deloitte & Touche LLP (professional services firm). | | |
46
Trustees and Officers – continued
| | | | | | | | |
Name, Age | | Position(s) Held with Fund | | Trustee/Officer
Since (h) | | Principal Occupations
During the Past Five Years | | Other
Directorships (j) |
Brian E. Langenfeld (k)
(age 38) | | Assistant Secretary and Assistant Clerk | | June 2006 | | Massachusetts Financial Services Company, Vice President and Senior Counsel | | |
Ellen Moynihan (k)
(age 53) | | Assistant Treasurer | | April 1997 | | Massachusetts Financial Services Company, Senior Vice President | | |
Susan S. Newton (k)
(age 61) | | Assistant Secretary and Assistant Clerk | | May 2005 | | Massachusetts Financial Services Company, Senior Vice President and Associate General Counsel | | |
Susan A. Pereira (k)
(age 40) | | Assistant Secretary and Assistant Clerk | | July 2005 | | Massachusetts Financial Services Company, Vice President and Senior Counsel | | |
Mark N. Polebaum (k)
(age 59) | | Secretary and Clerk | | January 2006 | | Massachusetts Financial Services Company, Executive Vice President, General Counsel and Secretary | | |
Frank L. Tarantino
(age 67) | | Independent Chief Compliance Officer | | June 2004 | | Tarantino LLC (provider of compliance services), Principal | | |
Richard S. Weitzel (k)
(age 41) | | Assistant Secretary and Assistant Clerk | | October 2007 | | Massachusetts Financial Services Company, Vice President and Assistant General Counsel | | |
James O. Yost (k)
(age 51) | | Assistant Treasurer | | September 1990 | | Massachusetts Financial Services Company, Senior Vice President | | |
| (h) | Date first appointed to serve as Trustee/officer of an MFS fund. Each Trustee has served continuously since appointment unless indicated otherwise. For the period from December 15, 2004 until February 22, 2005, Messrs. Pozen and Manning served as Advisory Trustees. For the period March 2008 until October 2008, Ms. DiOrioDwyer served as Treasurer of the Funds. |
47
Trustees and Officers – continued
| (j) | Directorships or trusteeships of companies required to report to the Securities and Exchange Commission (i.e., “public companies”). |
| (k) | “Interested person” of the Trust within the meaning of the Investment Company Act of 1940 (referred to as the 1940 Act), which is the principal federal law governing investment companies like the fund, as a result of position with MFS. The address of MFS is 500 Boylston Street, Boston, Massachusetts 02116. |
Each Trustee has been elected by shareholders and each Trustee and officer holds office until his or her successor is chosen and qualified or until his or her earlier death, resignation, retirement or removal. The Trust does not hold annual meetings for the purpose of electing Trustees, and Trustees are not elected for fixed terms. Messrs. Butler, Kavanaugh, Uek and Ms. Thomsen are members of the Trust’s Audit Committee.
Each of the Fund’s Trustees and officers holds comparable positions with certain other funds of which MFS or a subsidiary is the investment adviser or distributor, and, in the case of the officers, with certain affiliates of MFS. As of January 1, 2011, the Trustees served as board members of 105 funds within the MFS Family of Funds.
The Statement of Additional Information for the Fund includes further information about the Trustees and is available without charge upon request by calling 1-800-225-2606.
| | |
| Investment Adviser | | Custodian |
Massachusetts Financial Services Company
500 Boylston Street, Boston, MA 02116-3741 | | State Street Bank and Trust
1 Lincoln Street, Boston, MA 02111-2900 |
| Distributor | | Independent Registered Public Accounting Firm |
MFS Fund Distributors, Inc.
500 Boylston Street, Boston, MA 02116-3741 | | Ernst & Young LLP 200 Clarendon Street, Boston, MA 02116 |
| Portfolio Managers | | |
Jose Luis Garcia Thomas Melendez | | |
48
BOARD REVIEW OF INVESTMENT ADVISORY AGREEMENT
The Investment Company Act of 1940 requires that both the full Board of Trustees and a majority of the non-interested (“independent”) Trustees, voting separately, annually approve the continuation of the Fund’s investment advisory agreement with MFS. The Trustees consider matters bearing on the Fund and its advisory arrangements at their meetings throughout the year, including a review of performance data at each regular meeting. In addition, the independent Trustees met several times over the course of three months beginning in May and ending in July, 2011 (“contract review meetings”) for the specific purpose of considering whether to approve the continuation of the investment advisory agreement for the Fund and the other investment companies that the Board oversees (the “MFS Funds”). The independent Trustees were assisted in their evaluation of the Fund’s investment advisory agreement by independent legal counsel, from whom they received separate legal advice and with whom they met separately from MFS during various contract review meetings. The independent Trustees were also assisted in this process by the MFS Funds’ Independent Chief Compliance Officer, a full-time senior officer appointed by and reporting to the independent Trustees.
In connection with their deliberations regarding the continuation of the investment advisory agreement, the Trustees, including the independent Trustees, considered such information and factors as they believed, in light of the legal advice furnished to them and their own business judgment, to be relevant. The investment advisory agreement for the Fund was considered separately, although the Trustees also took into account the common interests of all MFS Funds in their review. As described below, the Trustees considered the nature, quality, and extent of the various investment advisory, administrative, and shareholder services performed by MFS under the existing investment advisory agreement and other arrangements with the Fund.
In connection with their contract review meetings, the Trustees received and relied upon materials that included, among other items: (i) information provided by Lipper Inc., an independent third party, on the investment performance of the Fund for various time periods ended December 31, 2010 and the investment performance of a group of funds with substantially similar investment classifications/objectives (the “Lipper performance universe”), (ii) information provided by Lipper Inc. on the Fund’s advisory fees and other expenses and the advisory fees and other expenses of comparable funds identified by Lipper Inc. (the “Lipper expense group”), (iii) information provided by MFS on the advisory fees of comparable portfolios of other clients of MFS, including institutional separate accounts and other clients, (iv) information as to whether and to what extent applicable expense waivers, reimbursements or fee “breakpoints” are observed for the Fund,
49
Board Review of Investment Advisory Agreement – continued
(v) information regarding MFS’ financial results and financial condition, including MFS’ and certain of its affiliates’ estimated profitability from services performed for the Fund and the MFS Funds as a whole, and compared to MFS’ institutional business, (vi) MFS’ views regarding the outlook for the mutual fund industry and the strategic business plans of MFS, (vii) descriptions of various functions performed by MFS for the Funds, such as compliance monitoring and portfolio trading practices, and (viii) information regarding the overall organization of MFS, including information about MFS’ senior management and other personnel providing investment advisory, administrative and other services to the Fund and the other MFS Funds. The comparative performance, fee and expense information prepared and provided by Lipper Inc. was not independently verified and the independent Trustees did not independently verify any information provided to them by MFS.
The Trustees’ conclusion as to the continuation of the investment advisory agreement was based on a comprehensive consideration of all information provided to the Trustees and not the result of any single factor. Some of the factors that figured particularly in the Trustees’ deliberations are described below, although individual Trustees may have evaluated the information presented differently from one another, giving different weights to various factors. It is also important to recognize that the fee arrangements for the Fund and other MFS Funds are the result of years of review and discussion between the independent Trustees and MFS, that certain aspects of such arrangements may receive greater scrutiny in some years than in others, and that the Trustees’ conclusions may be based, in part, on their consideration of these same arrangements during the course of the year and in prior years.
Based on information provided by Lipper Inc., the Trustees reviewed the Fund’s total return investment performance as well as the performance of peer groups of funds over various time periods. The Trustees placed particular emphasis on the total return performance of the Fund’s Class A shares in comparison to the performance of funds in its Lipper performance universe over the three-year period ended December 31, 2010, which the Trustees believed was a long enough period to reflect differing market conditions. The total return performance of the Fund’s Class A shares was in the 1st quintile relative to the other funds in the universe for this three-year period (the 1st quintile being the best performers and the 5th quintile being the worst performers). The total return performance of the Fund’s Class A shares was in the 1st quintile for each of the one- and five-year periods ended December 31, 2010 relative to the Lipper performance universe. Because of the passage of time, these performance results are likely to differ from the performance results for more recent periods, including those shown elsewhere in this report.
50
Board Review of Investment Advisory Agreement – continued
In the course of their deliberations, the Trustees took into account information provided by MFS in connection with the contract review meetings, as well as during investment review meetings conducted with portfolio management personnel during the course of the year regarding the Fund’s performance. After reviewing these and related factors, the Trustees concluded, within the context of their overall conclusions regarding the investment advisory agreement, that they were satisfied with MFS’ responses and efforts relating to investment performance.
In assessing the reasonableness of the Fund’s advisory fee, the Trustees considered, among other information, the Fund’s advisory fee and the total expense ratio of the Fund’s Class A shares as a percentage of average daily net assets and the advisory fee and total expense ratios of peer groups of funds based on information provided by Lipper Inc. The Trustees also considered that, according to the Lipper data (which takes into account any fee reductions or expense limitations that were in effect during the fund’s last fiscal year), the Fund’s effective advisory fee rate was higher than the Lipper expense group median, and the Fund’s total expense ratio was approximately at the Lipper expense group median.
The Trustees also considered the advisory fees charged by MFS to institutional accounts. In comparing these fees, the Trustees considered information provided by MFS as to the generally broader scope of services provided by MFS to the Fund in comparison to institutional accounts, the higher demands placed on MFS’ investment personnel and trading infrastructure as a result of the daily cash in-flows and out-flows of the Fund, and the impact on MFS and expenses associated with the more extensive regulatory regime to which the Fund is subject in comparison to institutional accounts.
The Trustees also considered whether the Fund is likely to benefit from any economies of scale in the management of the Fund in the event of growth in assets of the Fund. They noted that the Fund’s advisory fee rate schedule is subject to contractual breakpoints that reduce the Fund’s advisory fee rate on average daily net assets over $1 billion and $2 billion. The Trustees concluded that the existing breakpoints were sufficient to allow the Fund to benefit from economies of scale as its assets grow.
The Trustees also considered information prepared by MFS relating to MFS’ costs and profits with respect to the Fund, the MFS Funds considered as a group, and other investment companies and accounts advised by MFS, as well as MFS’ methodologies used to determine and allocate its costs to the MFS Funds, the Fund and other accounts and products for purposes of estimating profitability.
After reviewing these and other factors described herein, the Trustees concluded, within the context of their overall conclusions regarding the
51
Board Review of Investment Advisory Agreement – continued
investment advisory agreement, that the advisory fees charged to the Fund represent reasonable compensation in light of the services being provided by MFS to the Fund.
In addition, the Trustees considered MFS’ resources and related efforts to continue to retain, attract and motivate capable personnel to serve the Fund. The Trustees also considered current and developing conditions in the financial services industry, including the presence of large and well-capitalized companies which are spending, and appear to be prepared to continue to spend, substantial sums to engage personnel and to provide services to competing investment companies. In this regard, the Trustees also considered the financial resources of MFS and its ultimate parent, Sun Life Financial Inc. The Trustees also considered the advantages and possible disadvantages to the Fund of having an adviser that also serves other investment companies as well as other accounts.
The Trustees also considered the nature, quality, cost, and extent of administrative, transfer agency, and distribution services provided to the Fund by MFS and its affiliates under agreements and plans other than the investment advisory agreement, including any 12b-1 fees the Fund pays to MFS Fund Distributors, Inc., an affiliate of MFS. The Trustees also considered the nature, extent and quality of certain other services MFS performs or arranges for on the Fund’s behalf, which may include securities lending programs, directed expense payment programs, class action recovery programs, and MFS’ interaction with third-party service providers, principally custodians and sub-custodians. The Trustees concluded that the various non-advisory services provided by MFS and its affiliates on behalf of the Fund were satisfactory.
The Trustees also considered benefits to MFS from the use of the Fund’s portfolio brokerage commissions, if applicable, to pay for investment research and other similar services, and various other factors. Additionally, the Trustees considered so-called “fall-out benefits” to MFS such as reputational value derived from serving as investment manager to the Fund.
Based on their evaluation of factors that they deemed to be material, including those factors described above, the Board of Trustees, including a majority of the independent Trustees, concluded that the Fund’s investment advisory agreement with MFS should be continued for an additional one-year period, commencing August 1, 2011.
A discussion regarding the Board’s most recent review and renewal of the fund’s Investment Advisory Agreement with MFS will be available on or about November 1, 2011 by clicking on the fund’s name under “Mutual Funds” in the “Products and Performance” section of the MFS Web site (mfs.com).
52
PROXY VOTING POLICIES AND INFORMATION
A general description of the MFS funds’ proxy voting policies and procedures is available without charge, upon request, by calling
1-800-225-2606, by visiting the Proxy Voting section of mfs.com or by visiting the SEC’s Web site at http://www.sec.gov.
Information regarding how the fund voted proxies relating to portfolio securities during the most recent twelve-month period ended June 30 is available without charge by visiting the Proxy Voting section of mfs.com or by visiting the SEC’s Web site at http://www.sec.gov.
QUARTERLY PORTFOLIO DISCLOSURE
The fund will file a complete schedule of portfolio holdings with the Securities and Exchange Commission (the Commission) for the first and third quarters of each fiscal year on Form N-Q. The fund’s Form N-Q may be reviewed and copied at the:
Public Reference Room
Securities and Exchange Commission
100 F Street, NE, Room 1580
Washington, D.C. 20549
Information on the operation of the Public Reference Room may be obtained by calling the Commission at 1-800-SEC-0330. The fund’s Form N-Q is available on the EDGAR database on the Commission’s Internet Web site at http://www.sec.gov, and copies of this information may be obtained, upon payment of a duplicating fee, by electronic request at the following e-mail address: publicinfo@sec.gov or by writing the Public Reference Section at the above address.
A shareholder can also obtain the quarterly portfolio holdings report at mfs.com.
FURTHER INFORMATION
From time to time, MFS may post important information about the fund or the MFS funds on the MFS web site (mfs.com). This information is available by visiting the “News & Commentary” section of mfs.com or by clicking on the fund’s name under “Mutual Funds” in the “Products and Performance” section of mfs.com.
FEDERAL TAX INFORMATION (unaudited)
The fund will notify shareholders of amounts for use in preparing 2011 income tax forms in January 2012. The following information is provided pursuant to provisions of the Internal Revenue Code.
The fund designates the maximum amount allowable as qualified dividend income eligible for the 15% tax rate.
Income derived from foreign sources was $122,225,805. The fund intends to pass through foreign tax credits of $10,025,846 for the fiscal year.
53
rev. 3/11
| | | | |
| FACTS | | WHAT DOES MFS DO WITH YOUR PERSONAL INFORMATION? | |  |
| | |
| Why? | | Financial companies choose how they share your personal information. Federal law gives consumers the right to limit some but not all sharing. Federal law also requires us to tell you how we collect, share, and protect your personal information. Please read this notice carefully to understand what we do. |
| | |
| What? | | The types of personal information we collect and share depend on the product or service you have with us. This information can include: •Social Security number and account balances •Account transactions and transaction history •Checking account information and wire transfer instructions When you are no longer our customer, we continue to share your information as described in this notice. |
| | |
| How? | | All financial companies need to share customers’ personal information to run their everyday business. In the section below, we list the reasons financial companies can share their customers’ personal information; the reasons MFS chooses to share; and whether you can limit this sharing. |
| | | | |
| Reasons we can share your personal information | | Does MFS share? | | Can you limit
this sharing? |
For our everyday business purposes – such as to process your transactions, maintain your account(s), respond to court orders and legal investigations, or report to credit bureaus | | Yes | | No |
For our marketing purposes – to offer our products and services to you | | No | | We don’t share |
| For joint marketing with other financial companies | | No | | We don’t share |
For our affiliates’ everyday business purposes – information about your transactions and experiences | | No | | We don’t share |
For our affiliates’ everyday business purposes – information about your creditworthiness | | No | | We don’t share |
| For nonaffiliates to market to you | | No | | We don’t share |
| | |
| Questions? | | Call 800-225-2606 or go to mfs.com. |
54
| | |
| Who we are |
| Who is providing this notice? | | MFS Funds, MFS Investment Management, MFS Institutional Advisors, Inc., MFS Fund Distributors, Inc., MFS Heritage Trust Company, and MFS Service Center, Inc. |
| | |
| What we do |
| How does MFS protect my personal information? | | To protect your personal information from unauthorized access and use, we use security measures that comply with federal law. These measures include procedural, electronic, and physical safeguards for the protection of the personal information we collect about you. |
How does MFS
collect my personal information? | | We collect your personal information, for example, when you •open an account or provide account information •direct us to buy securities or direct us to sell your securities •make a wire transfer We also collect your personal information from others, such as credit bureaus, affiliates and other companies. |
| Why can’t I limit all sharing? | | Federal law gives you the right to limit only •sharing for affiliates’ everyday business purposes – information about your creditworthiness •affiliates from using your information to market to you •sharing for nonaffiliates to market to you State laws and individual companies may give you additional rights to limit sharing. |
| | |
| Definitions |
| Affiliates | | Companies related by common ownership or control. They can be financial and nonfinancial companies. •MFS does not share personal information with affiliates, except for everyday business purposes as described on page one of this notice. |
| Nonaffiliates | | Companies not related by common ownership or control. They can be financial and nonfinancial companies. •MFS does not share with nonaffiliates so they can market to you. |
| Joint Marketing | | A formal agreement between nonaffiliated financial companies that together market financial products or services to you. •MFS doesn’t jointly market. |
| | |
| Other important information |
| If you own an MFS product or receive an MFS service in the name of a third party such as a bank or broker-dealer, their privacy policy may apply to you instead of ours. |
55
Save paper with eDelivery.
MFS® will send you prospectuses, reports, and proxies directly via e-mail so you will get information faster with less mailbox clutter.
To sign up:
1. Go to mfs.com.
2. Log in via MFS® Access.
3. Select eDelivery.
If you own your MFS fund shares through a financial institution or a retirement plan, MFS® TALK, MFS® Access, or eDelivery may not be available to you.

Web site
mfs.com
MFS TALK
1-800-637-8255
24 hours a day
Account service and literature
Shareholders
1-800-225-2606
Financial advisors
1-800-343-2829
Retirement plan services
1-800-637-1255
Mailing address
MFS Service Center, Inc.
P.O. Box 55824
Boston, MA 02205-5824
Overnight mail
MFS Service Center, Inc.
c/o Boston Financial Data Services
30 Dan Road
Canton, MA 02021-2809

MFS® Technology Fund

ANNUAL REPORT
August 31, 2011
SCT-ANN
MFS® TECHNOLOGY FUND
SIPC Contact Information: You may obtain information about the Securities Investor Protection Corporation (“SIPC”), including the SIPC Brochure, by contacting SIPC either by telephone (1-202-371-8300) or by accessing SIPC’s web site address (www.sipc.org).
The report is prepared for the general information of shareholders.
It is authorized for distribution to prospective investors only when preceded or accompanied by a current prospectus.
NOT FDIC INSURED Ÿ MAY LOSE VALUE Ÿ NO BANK GUARANTEE

LETTER FROM THE CEO
Dear Shareholders:
We are indeed living through some volatile times. Economic uncertainty is everywhere, as it seems no place in the world has been unmoved by crisis this year. We have seen a devastating earthquake and tsunami that have led to disruptions in the Japanese markets and supply chains. Protests have changed the face of the Middle East and left in their wake lingering tensions and resultant higher oil prices. We have seen debt limits tested in Europe and the United States and policymakers grappling to craft often unpopular monetary and fiscal responses at a time when consumers and businesses struggle with what appears to be a slowing global economy. On top of all of that, we have seen long-term U.S. debt lose its Standard & Poor’s AAA rating.
When markets become volatile, managing risk becomes a top priority for investors and their advisors. At MFS® risk management is foremost in our minds in all market climates. Our analysts and portfolio managers keep risks firmly in mind when evaluating securities. Additionally, we have a team of quantitative analysts that measures and assesses the risk profiles of our portfolios and securities on an ongoing basis. The chief investment risk officer, who oversees the team, reports directly to the firm’s president and chief investment officer so the risk associated with each portfolio can be assessed objectively and independently of the portfolio management team.
As always, we continue to be mindful of the many economic challenges faced at the local, national, and international levels. It is in times such as these that we want to remind investors of the merits of maintaining a long-term view, adhering to basic investing principles such as asset allocation and diversification, and working closely with their advisors to research and identify appropriate investment opportunities.
Respectfully,

Robert J. Manning
Chairman and Chief Executive Officer
MFS Investment Management®
October 17, 2011
The opinions expressed in this letter are subject to change, may not be relied upon for investment advice, and no forecasts can be guaranteed.
1
PORTFOLIO COMPOSITION
Portfolio structure (i)

| | | | |
| Top ten holdings (i) | | | | |
| Apple, Inc. | | | 13.4% | |
| Google, Inc., “A” | | | 7.9% | |
| Oracle Corp. | | | 7.4% | |
| Amazon.com, Inc. | | | 5.2% | |
| EMC Corp. | | | 4.4% | |
| International Business Machines Corp. | | | 4.4% | |
| Visa, Inc., “A” | | | 3.3% | |
| Qualcomm, Inc. | | | 3.0% | |
| Advanced Micro Devices, Inc. | | | 2.8% | |
| MasterCard, Inc., “A” | | | 2.6% | |
| | | | |
| Top five industries (i) | | | | |
| Computer Software-Systems (s) | | | 25.1% | |
| Computer Software | | | 19.6% | |
| Internet | | | 10.4% | |
| Electronics (s) | | | 8.1% | |
| Network & Telecom (s) | | | 6.9% | |
| (i) | For purposes of this presentation, the components include the market value of securities, less any securities sold short, and reflect the impact of the equivalent exposure of derivative positions. These amounts may be negative from time to time. Equivalent exposure is a calculated amount that translates the derivative position into a reasonable approximation of the amount of the underlying asset that the portfolio would have to hold at a given point in time to have the same price sensitivity that results from the portfolio’s ownership of the derivative contract. When dealing with derivatives, equivalent exposure is a more representative measure of the potential impact of a position on portfolio performance than market value. |
| (s) | Top five industry includes securities sold short. |
Percentages are based on net assets as of 8/31/11.
The portfolio is actively managed and current holdings may be different.
2
MANAGEMENT REVIEW
Summary of Results
For the twelve months ended August 31, 2011, Class A shares of the MFS Technology Fund (the “fund”) provided a total return of 22.88%, at net asset value. This compares with a return of 18.50% for the fund’s benchmark, the Standard & Poor’s 500 Stock Index, and a return of 20.72% for the fund’s other benchmark, the Standard & Poor’s North American Technology Sector Index.
Market Environment
Early in the period, the U.S. Federal Reserve (the Fed) indicated that further monetary loosening would be forthcoming if macroeconomic activity did not show signs of improvement. The prospects for, and subsequent implementation of, more easing by the Fed improved market sentiment and drove risk-asset prices markedly higher. The December agreement on a surprisingly large (relative to expectations) expansionary U.S. fiscal package also boosted sentiment. During the subsequent several months, the renewed positive market sentiment, coupled with better indications of global macroeconomic activity, pushed many asset valuations to post-crisis highs. At the same time, global sovereign bond yields rose amidst the more “risk-seeking” environment.
However, towards the middle of the period, a weakening macroeconomic backdrop and renewed concerns over Greek debt sustainability began to challenge equity valuations and pushed sovereign bond yields lower. Towards the end of the reporting period, uncertainty in financial markets continued to increase. European policy makers debated and disagreed over elements of a new Greek bailout package, while Spanish and Italian bond yields increased markedly signaling a widening European crisis. In the U.S., concerns about sovereign debt default and the long term sustainability of the trend in U.S. fiscal policy resulted in one agency downgrading U.S. credit quality. Amidst this turmoil, global equity markets declined sharply. As a result of these developments, global consumer and producer sentiment indicators fell precipitously, highly-rated sovereign bond yields hit multi-decade lows and, despite a more mixed picture emanating from the “hard” data, markets grew increasingly worried about a return to global recession.
Contributors to Performance
Stock selection in the computer software industry was a positive factor contributing to the fund’s performance relative to the Standard & Poor’s North American Technology Sector Index. Within this industry, holdings of infrastructure software distributor Autonomy (b)(h) and the fund’s avoidance of software giant Microsoft (h) boosted relative results. Shares of Autonomy surged at the end of the reporting period when Hewlett-Packard announced they were placing a bid to buy Autonomy for a premium.
3
Management Review – continued
Stock selection in the computer systems industry was another factor that contributed to relative performance. Here, it was the fund’s timing of ownership in shares of computer products and services provider Hewlett-Packard (h), and its holdings of strong-performing computer and personal electronics maker Apple, that aided relative results. Shares of Apple appreciated toward the end of the reporting period as the company announced solid fiscal third quarter 2011 earnings citing strong sales momentum in the company’s most notable products, the iPhone and the iPad.
Within the business services industry, stock selection supported relative results. The fund’s short exposure to poor-performing information technology services firm Computer Sciences, and the timing of the fund’s ownership in global consulting and outsourcing company Accenture (h), bolstered relative performance.
A underweight allocation to the network & telecommunications industry also contributed to relative performance as this sector underperformed the broad market. Within this sector, holdings of WAN optimization product designer and manufacturer Riverbed Technology and network security solutions company Fortinet were positive factors for relative results. In addition, the fund’s short exposures to poor-performing Canadian wireless solutions firm Research in Motion (h) and wireless product provider Sierra Wireless (b) also boosted relative performance.
Detractors from Performance
Stock selection and, to a lesser extent, an underweight allocation to the electronics industry detracted from relative performance. Within the industry, the fund’s short exposure to strong-performing semiconductor and electronics component firm Vishay Intertech (h) weakened relative results. In addition, holdings of solar electric power modules manufacturer First Solar (h) and semiconductor capital equipment provider KLA-Tencor, as well as the ownership of put options in semiconductor companies Altera (h) and Texas Instruments (h), hindered relative performance. We believe that shares of First Solar underperformed in the second quarter of 2011 as investors expressed concern regarding the negative impacts surrounding renewable energy legislation in Europe, which represents a significant component of the solar energy firm’s revenues and profits.
Elsewhere, the fund’s holdings of interactive entertainment software company THQ (b) and social media company Demand Media (b), and the timing of ownership in shares of wireless communications software company Qualcomm and diversified technology products and services company IBM, hindered relative performance.
4
Management Review – continued
The fund’s cash position was also a detractor from relative performance. The fund holds cash to buy new holdings and to provide liquidity. In a period when equity markets rose, as measured by the fund’s benchmark, holding cash hurt performance versus the benchmark, which has no cash position.
Respectfully,
Matthew Sabel
Portfolio Manager
| (b) | Security is not a benchmark constituent. |
| (h) | Security was not held in the portfolio at period end. |
Note to Shareholders: Effective May 1, 2011, Matthew Sabel became the manager of the fund. Previously, the fund was managed by Joseph MacDougall.
The views expressed in this report are those of the portfolio manager only through the end of the period of the report as stated on the cover and do not necessarily reflect the views of MFS or any other person in the MFS organization. These views are subject to change at any time based on market or other conditions, and MFS disclaims any responsibility to update such views. These views may not be relied upon as investment advice or an indication of trading intent on behalf of any MFS portfolio. References to specific securities are not recommendations of such securities, and may not be representative of any MFS portfolio’s current or future investments.
5
PERFORMANCE SUMMARY THROUGH 8/31/11
The following chart illustrates a representative class of the fund’s historical performance in comparison to its benchmark(s). Performance results include the deduction of the maximum applicable sales charge and reflect the percentage change in net asset value, including reinvestment of dividends and capital gains distributions. The performance of other share classes will be greater than or less than that of the class depicted below. Benchmarks are unmanaged and may not be invested in directly. Benchmark returns do not reflect sales charges, commissions or expenses. (See Notes to Performance Summary.)
Performance data shown represents past performance and is no guarantee of future results. Investment return and principal value fluctuate so your shares, when sold, may be worth more or less than the original cost; current performance may be lower or higher than quoted. The performance shown does not reflect the deduction of taxes, if any, that a shareholder would pay on fund distributions or the redemption of fund shares.
Growth of a Hypothetical $10,000 Investment
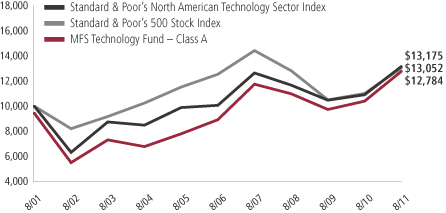
6
Performance Summary – continued
Total Returns through 8/31/11
Average annual without sales charge
| | | | | | | | | | | | | | |
| | | Share class | | Class inception date | | 1-yr | | 5-yr | | 10-Yr | | Life (t) | | |
| | | A | | 1/02/97 | | 22.88% | | 7.44% | | 3.10% | | N/A | | |
| | | B | | 4/14/00 | | 21.94% | | 6.69% | | 2.40% | | N/A | | |
| | | C | | 4/14/00 | | 21.98% | | 6.68% | | 2.38% | | N/A | | |
| | | I | | 1/02/97 | | 23.25% | | 7.78% | | 3.42% | | N/A | | |
| | | R1 | | 4/01/05 | | 22.02% | | 6.65% | | N/A | | 8.36% | | |
| | | R2 | | 10/31/03 | | 22.62% | | 7.19% | | N/A | | 6.26% | | |
| | | R3 | | 4/01/05 | | 22.99% | | 7.46% | | N/A | | 9.16% | | |
| | | R4 | | 4/01/05 | | 23.21% | | 7.73% | | N/A | | 9.46% | | |
| Comparative benchmarks | | | | | | | | | | |
| | | Standard & Poor’s 500 Stock Index (f) | | 18.50% | | 0.78% | | 2.70% | | N/A | | |
| | | Standard & Poor’s North American Technology Sector Index (f) | | 20.72% | | 5.53% | | 2.80% | | N/A | | |
| Average annual with sales charge | | | | | | | | | | |
| | | A
With Initial Sales Charge (5.75%) | | 15.82% | | 6.17% | | 2.49% | | N/A | | |
| | | B
With CDSC (Declining over six years from 4% to 0%) (x) | | 17.94% | | 6.38% | | 2.40% | | N/A | | |
| | | C
With CDSC (1% for 12 months) (x) | | 20.98% | | 6.68% | | 2.38% | | N/A | | |
Class I, R1, R2, R3, and R4 shares do not have a sales charge.
CDSC – Contingent Deferred Sales Charge.
| (f) | Source: FactSet Research Systems Inc. |
| (t) | For the period from the class inception date through the stated period end (for those share classes with less than 10 years of performance history.) No comparative benchmark performance information is provided for “life” periods. (See Notes to Performance Summary.) |
| (x) | Assuming redemption at the end of the applicable period. |
Benchmark Definitions
Standard & Poor’s 500 Stock Index – a market capitalization-weighted index of 500 widely held equity securities, designed to measure broad U.S. equity performance.
Standard & Poor’s North American Technology Sector Index – a modified market capitalization-weighted index that measures the performance of selected technology stocks.
It is not possible to invest directly in an index.
7
Performance Summary – continued
Notes to Performance Summary
Average annual total return represents the average annual change in value for each share class for the periods presented. Life returns are presented where the share class has less than 10 years of performance history and represent the average annual total return from the class inception date to the stated period end date. As the fund’s share classes may have different inception dates, the life returns may represent different time periods and may not be comparable. As a result, no comparative benchmark performance information is provided for life periods.
Performance results reflect any applicable expense subsidies and waivers in effect during the periods shown. Without such subsidies and waivers the fund’s performance results would be less favorable. Please see the prospectus and financial statements for complete details.
Performance results do not include adjustments made for financial reporting purposes in accordance with U.S. generally accepted accounting principles and may differ from amounts reported in the financial highlights.
From time to time the fund may receive proceeds from litigation settlements, without which performance would be lower.
8
EXPENSE TABLE
Fund expenses borne by the shareholders during the period,
March 1, 2011 through August 31, 2011
As a shareholder of the fund, you incur two types of costs: (1) transaction costs, including sales charges (loads) on certain purchase or redemption payments, and (2) ongoing costs, including management fees; distribution and service (12b-1) fees; and other fund expenses. This example is intended to help you understand your ongoing costs (in dollars) of investing in the fund and to compare these costs with the ongoing costs of investing in other mutual funds.
The example is based on an investment of $1,000 invested at the beginning of the period and held for the entire period March 1, 2011 through August 31, 2011.
Actual Expenses
The first line for each share class in the following table provides information about actual account values and actual expenses. You may use the information in this line, together with the amount you invested, to estimate the expenses that you paid over the period. Simply divide your account value by $1,000 (for example, an $8,600 account value divided by $1,000 = 8.6), then multiply the result by the number in the first line under the heading entitled “Expenses Paid During Period” to estimate the expenses you paid on your account during this period.
Hypothetical Example for Comparison Purposes
The second line for each share class in the following table provides information about hypothetical account values and hypothetical expenses based on the fund’s actual expense ratio and an assumed rate of return of 5% per year before expenses, which is not the fund’s actual return. The hypothetical account values and expenses may not be used to estimate the actual ending account balance or expenses you paid for the period. You may use this information to compare the ongoing costs of investing in the fund and other funds. To do so, compare this 5% hypothetical example with the 5% hypothetical examples that appear in the shareholder reports of the other funds.
Please note that the expenses shown in the table are meant to highlight your ongoing costs only and do not reflect any transactional costs, such as sales charges (loads). Therefore, the second line for each share class in the table is useful in comparing ongoing costs only, and will not help you determine the relative total costs of owning different funds. In addition, if these transactional costs were included, your costs would have been higher.
9
Expense Table – continued
| | | | | | | | | | | | | | | | | | |
Share
Class | | | | Annualized
Expense Ratio | | | Beginning
Account Value
3/01/11 | | | Ending Account Value
8/31/11 | | | Expenses Paid During
Period (p) 3/01/11-8/31/11 | |
| A | | Actual | | | 1.50% | | | | $1,000.00 | | | | $925.34 | | | | $7.28 | |
| | Hypothetical (h) | | | 1.50% | | | | $1,000.00 | | | | $1,017.64 | | | | $7.63 | |
| B | | Actual | | | 2.25% | | | | $1,000.00 | | | | $921.86 | | | | $10.90 | |
| | Hypothetical (h) | | | 2.25% | | | | $1,000.00 | | | | $1,013.86 | | | | $11.42 | |
| C | | Actual | | | 2.25% | | | | $1,000.00 | | | | $921.76 | | | | $10.90 | |
| | Hypothetical (h) | | | 2.25% | | | | $1,000.00 | | | | $1,013.86 | | | | $11.42 | |
| I | | Actual | | | 1.25% | | | | $1,000.00 | | | | $926.99 | | | | $6.07 | |
| | Hypothetical (h) | | | 1.25% | | | | $1,000.00 | | | | $1,018.90 | | | | $6.36 | |
| R1 | | Actual | | | 2.25% | | | | $1,000.00 | | | | $922.28 | | | | $10.90 | |
| | Hypothetical (h) | | | 2.25% | | | | $1,000.00 | | | | $1,013.86 | | | | $11.42 | |
| R2 | | Actual | | | 1.75% | | | | $1,000.00 | | | | $924.23 | | | | $8.49 | |
| | Hypothetical (h) | | | 1.75% | | | | $1,000.00 | | | | $1,016.38 | | | | $8.89 | |
| R3 | | Actual | | | 1.51% | | | | $1,000.00 | | | | $925.93 | | | | $7.33 | |
| | Hypothetical (h) | | | 1.51% | | | | $1,000.00 | | | | $1,017.59 | | | | $7.68 | |
| R4 | | Actual | | | 1.24% | | | | $1,000.00 | | | | $926.55 | | | | $6.02 | |
| | Hypothetical (h) | | | 1.24% | | | | $1,000.00 | | | | $1,018.95 | | | | $6.31 | |
| (h) | 5% class return per year before expenses. |
| (p) | Expenses paid is equal to each class’ annualized expense ratio, as shown above, multiplied by the average account value over the period, multiplied by the number of days in the period, divided by the number of days in the year. Expenses paid do not include any applicable sales charges (loads). If these transaction costs had been included, your costs would have been higher. |
Expenses Impacting Table
Expense ratios include 0.09% of investment related expense from short sales that are outside of the expense cap arrangement (See Note 3 of the Notes to Financial Statements).
10
PORTFOLIO OF INVESTMENTS
8/31/11
The Portfolio of Investments is a complete list of all securities owned by your fund. It is categorized by broad-based asset classes.
| | | | | | | | |
| Common Stocks - 100.0% | | | | | | | | |
| Issuer | | Shares/Par | | | Value ($) | |
| | | | | | | | |
| Broadcasting - 2.0% | | | | | | | | |
| Viacom, Inc., “B” | | | 66,380 | | | $ | 3,202,167 | |
| | |
| Business Services - 6.1% | | | | | | | | |
| Accenture PLC, “A” | | | 53,430 | | | $ | 2,863,314 | |
| Cognizant Technology Solutions Corp., “A” (a) | | | 41,450 | | | | 2,630,003 | |
| Concur Technologies, Inc. (a) | | | 6,460 | | | | 270,157 | |
| Constant Contact, Inc. (a) | | | 25,440 | | | | 486,667 | |
| FleetCor Technologies, Inc. (a) | | | 82,520 | | | | 2,344,393 | |
| MSCI, Inc., “A” (a) | | | 39,720 | | | | 1,373,120 | |
| | | | | | | | |
| | | | | | | $ | 9,967,654 | |
| Computer Software - 19.6% | | | | | | | | |
| Autodesk, Inc. (a) | | | 66,410 | | | $ | 1,872,762 | |
| BMC Software, Inc. (a) | | | 48,020 | | | | 1,950,092 | |
| Check Point Software Technologies Ltd. (a) | | | 22,900 | | | | 1,246,676 | |
| Citrix Systems, Inc. (a) | | | 21,970 | | | | 1,327,647 | |
| Oracle Corp. (s) | | | 428,990 | | | | 12,041,749 | |
| Parametric Technology Corp. (a) | | | 53,970 | | | | 971,460 | |
| Red Hat, Inc. (a) | | | 100,675 | | | | 3,980,690 | |
| Salesforce.com, Inc. (a) | | | 24,200 | | | | 3,115,750 | |
| Symantec Corp. (a) | | | 141,180 | | | | 2,421,237 | |
| TIBCO Software, Inc. (a) | | | 19,120 | | | | 427,906 | |
| VeriSign, Inc. | | | 76,690 | | | | 2,388,894 | |
| | | | | | | | |
| | | | | | | $ | 31,744,863 | |
| Computer Software - Systems - 25.9% | | | | | | | | |
| Active Network, Inc. (a) | | | 66,790 | | | $ | 1,080,662 | |
| Apple, Inc. (a)(s) | | | 56,480 | | | | 21,735,198 | |
| BroadSoft, Inc. (a) | | | 20,600 | | | | 623,150 | |
| EMC Corp. (a) | | | 318,050 | | | | 7,184,750 | |
| International Business Machines Corp. (s) | | | 41,640 | | | | 7,158,332 | |
| NetApp, Inc. (a) | | | 29,510 | | | | 1,110,166 | |
| Qlik Technologies, Inc. (a) | | | 26,470 | | | | 671,809 | |
| Quantum Corp. (a) | | | 190,530 | | | | 371,534 | |
| ServiceSource International, Inc. (a) | | | 27,630 | | | | 499,274 | |
| Tangoe, Inc. (a) | | | 64,780 | | | | 717,115 | |
| Verifone Systems, Inc. (a) | | | 23,960 | | | | 843,871 | |
| | | | | | | | |
| | | | | | | $ | 41,995,861 | |
11
Portfolio of Investments – continued
| | | | | | | | |
| Issuer | | Shares/Par | | | Value ($) | |
| | | | | | | | |
| Common Stocks - continued | | | | | | | | |
| Consumer Services - 2.7% | | | | | | | | |
| HomeAway, Inc. (a) | | | 27,390 | | | $ | 1,145,998 | |
| Priceline.com, Inc. (a) | | | 6,030 | | | | 3,239,678 | |
| | | | | | | | |
| | | | | | | $ | 4,385,676 | |
| Electronics - 12.4% | | | | | | | | |
| Advanced Micro Devices, Inc. (a) | | | 663,497 | | | $ | 4,531,685 | |
| Aeroflex Holding Corp. (a) | | | 49,070 | | | | 430,835 | |
| ASML Holding N.V. | | | 41,486 | | | | 1,463,211 | |
| Broadcom Corp., “A” | | | 62,610 | | | | 2,232,047 | |
| Entropic Communications, Inc. (a) | | | 56,670 | | | | 254,448 | |
| JDS Uniphase Corp. (a) | | | 316,030 | | | | 4,098,909 | |
| KLA-Tencor Corp. | | | 53,960 | | | | 1,979,253 | |
| Microchip Technology, Inc. | | | 113,810 | | | | 3,735,244 | |
| SanDisk Corp. (a) | | | 15,370 | | | | 563,311 | |
| Skyworks Solutions, Inc. (a) | | | 16,920 | | | | 349,060 | |
| Stratasys, Inc. (a) | | | 24,760 | | | | 572,946 | |
| | | | | | | | |
| | | | | | | $ | 20,210,949 | |
| Internet - 10.4% | | | | | | | | |
| Demand Media, Inc. (a) | | | 62,910 | | | $ | 544,172 | |
| eBay, Inc. (a) | | | 39,240 | | | | 1,211,339 | |
| Google, Inc., “A” (a)(s) | | | 23,665 | | | | 12,801,818 | |
| LinkedIn Corp., “A” (a) | | | 3,340 | | | | 280,961 | |
| Mail.ru Group Ltd., GDR (a)(z) | | | 29,900 | | | | 1,075,802 | |
| Yahoo!, Inc. (a) | | | 75,370 | | | | 1,025,409 | |
| | | | | | | | |
| | | | | | | $ | 16,939,501 | |
| Leisure & Toys - 0.3% | | | | | | | | |
| THQ, Inc. (a) | | | 214,750 | | | $ | 418,763 | |
| | |
| Medical & Health Technology & Services - 0.5% | | | | | | | | |
| athenahealth, Inc. (a) | | | 13,470 | | | $ | 781,260 | |
| | |
| Network & Telecom - 7.6% | | | | | | | | |
| Acme Packet, Inc. (a) | | | 20,300 | | | $ | 955,927 | |
| F5 Networks, Inc. (a) | | | 18,610 | | | | 1,518,948 | |
| Finisar Corp. (a) | | | 159,580 | | | | 2,945,847 | |
| Fortinet, Inc. (a) | | | 51,440 | | | | 984,047 | |
| Qualcomm, Inc. | | | 93,290 | | | | 4,800,703 | |
| Radware Ltd. (a) | | | 27,660 | | | | 734,650 | |
| Riverbed Technology, Inc. (a) | | | 17,390 | | | | 430,924 | |
| | | | | | | | |
| | | | | | | $ | 12,371,046 | |
| Other Banks & Diversified Financials - 5.8% | | | | | | | | |
| MasterCard, Inc., “A” | | | 12,810 | | | $ | 4,223,585 | |
| Visa, Inc., “A” | | | 60,060 | | | | 5,278,073 | |
| | | | | | | | |
| | | | | | | $ | 9,501,658 | |
12
Portfolio of Investments – continued
| | | | | | | | |
| Issuer | | Shares/Par | | | Value ($) | |
| | | | | | | | |
| Common Stocks - continued | | | | | | | | |
| Specialty Stores - 5.2% | | | | | | | | |
| Amazon.com, Inc. (a)(s) | | | 38,870 | | | $ | 8,368,322 | |
| | |
| Telecommunications - Wireless - 1.0% | | | | | | | | |
| SBA Communications Corp. (a) | | | 43,310 | | | $ | 1,636,685 | |
| | |
| Telephone Services - 0.5% | | | | | | | | |
| Cogent Communications Group, Inc. (a) | | | 56,670 | | | $ | 803,581 | |
| Total Common Stocks (Identified Cost, $160,468,609) | | | | | | $ | 162,327,986 | |
| | |
| Issuer/Expiration Date/Strike Price | | Number of
Contracts | | | | |
| Put Options Purchased - 0.2% | | | | | | | | |
| Electronics - 0.2% | | | | | | | | |
| First Solar Inc. - January 2012 @ $100 | | | 98 | | | $ | 120,050 | |
| Intel Corp. - October 2011 @ $20 | | | 1,828 | | | | 162,692 | |
| Sanmina Sci Corp. - October 2011 @ $10 | | | 350 | | | | 78,750 | |
| | | | | | | | |
| | | | | | | $ | 361,492 | |
| Network & Telecom - 0.1% | | | | | | | | |
| Interdigital Inc.- January 2012 @ $62.50 | | | 123 | | | $ | 107,010 | |
| Total Put Options Purchased (Premiums Paid, $655,949) | | | | | | $ | 468,502 | |
| | |
| Issuer | | Shares/Par | | | | |
| Money Market Funds (v) - 1.1% | | | | | | | | |
MFS Institutional Money Market Portfolio, 0.08%,
at Cost and Net Asset Value | | | 1,714,975 | | | $ | 1,714,975 | |
| Total Investments (Identified Cost, $162,839,533) | | | | | | $ | 164,511,463 | |
| | |
| Securities Sold Short - (4.5)% | | | | | | | | |
| Business Services - (0.3)% | | | | | | | | |
| Computer Sciences Corp. | | | (17,350 | ) | | $ | (531,951 | ) |
| | |
| Computer Software - Systems - (0.7)% | | | | | | | | |
| Dell, Inc. (a) | | | (81,050 | ) | | $ | (1,204,808 | ) |
| | |
| Electronics - (2.9)% | | | | | | | | |
| Cree, Inc. (a) | | | (27,100 | ) | | $ | (878,853 | ) |
| Fairchild Semiconductor International, Inc. (a) | | | (95,200 | ) | | | (1,262,352 | ) |
| Volterra Semiconductor Corp. (a) | | | (38,400 | ) | | | (777,600 | ) |
| Xilinx, Inc. | | | (59,700 | ) | | | (1,859,058 | ) |
| | | | | | | | |
| | | | | | | $ | (4,777,863 | ) |
13
Portfolio of Investments – continued
| | | | | | | | |
| | |
| Issuer | | Shares/Par | | | Value ($) | |
| Securities Sold Short - continued | | | | | | | | |
| Network & Telecom - (0.5)% | | | | | | | | |
| Sierra Wireless, Inc. (a) | | | (113,400 | ) | | $ | (827,820 | ) |
| Total Securities Sold Short (Proceeds Received, $8,170,795) | | | | | | $ | (7,342,442 | ) |
| | |
| Other Assets, Less Liabilities - 3.2% | | | | | | | 5,124,719 | |
| Net Assets - 100.0% | | | | | | $ | 162,293,740 | |
| (a) | Non-income producing security. |
| (s) | Security or a portion of the security was pledged to cover collateral requirements for securities sold short. At August 31, 2011, the value of securities pledged amounted to $7,617,053. |
| (v) | Underlying affiliated fund that is available only to investment companies managed by MFS. The rate quoted is the annualized seven-day yield of the fund at period end. |
| (z) | Restricted securities are not registered under the Securities Act of 1933 and are subject to legal restrictions on resale. These securities generally may be resold in transactions exempt from registration or to the public if the securities are subsequently registered. Disposal of these securities may involve time-consuming negotiations and prompt sale at an acceptable price may be difficult. The fund holds the following restricted securities: |
| | | | | | | | | | |
| Restricted Securities | | Acquisition
Date | | Cost | | | Value | |
| Mail.ru Group Ltd., GDR | | 11/05/10-4/27/11 | | | $1,036,522 | | | | $1,075,802 | |
| % of Net Assets | | | | | | | | | 0.7% | |
The following abbreviations are used in this report and are defined:
| GDR | | Global Depository Receipt |
| PLC | | Public Limited Company |
See Notes to Financial Statements
14
Financial Statements
STATEMENT OF ASSETS AND LIABILITIES
At 8/31/11
This statement represents your fund’s balance sheet, which details the assets and liabilities comprising the total value of the fund.
| | | | |
| Assets | | | | |
Investments- | | | | |
Non-affiliated issuers, at value (identified cost, $161,124,558) | | | $162,796,488 | |
Underlying affiliated funds, at cost and value | | | 1,714,975 | |
Total investments, at value (identified cost, $162,839,533) | | | $164,511,463 | |
Deposits with brokers | | | 3,213,986 | |
Receivables for | | | | |
Investments sold | | | 2,170,334 | |
Fund shares sold | | | 208,331 | |
Interest and dividends | | | 127,521 | |
Other assets | | | 480 | |
Total assets | | | $170,232,115 | |
| Liabilities | | | | |
Payable for | | | | |
Securities sold short, at value (proceeds received, $8,170,795) | | | $7,342,442 | |
Fund shares reacquired | | | 407,900 | |
Payable to affiliates | | | | |
Investment adviser | | | 6,811 | |
Shareholder servicing costs | | | 70,474 | |
Distribution and service fees | | | 3,599 | |
Payable for independent Trustees’ compensation | | | 32,913 | |
Accrued expenses and other liabilities | | | 74,236 | |
Total liabilities | | | $7,938,375 | |
Net assets | | | $162,293,740 | |
| Net assets consist of | | | | |
Paid-in capital | | | $178,882,484 | |
Unrealized appreciation (depreciation) on investments and translation of assets and liabilities in foreign currencies | | | 2,500,788 | |
Accumulated net realized gain (loss) on investments and foreign currency transactions | | | (19,057,741 | ) |
Accumulated net investment loss | | | (31,791 | ) |
Net assets | | | $162,293,740 | |
Shares of beneficial interest outstanding | | | 11,367,848 | |
| | | | | | | | | | | | |
| | | Net assets | | | Shares
outstanding | | | Net asset value
per share (a) | |
Class A | | | $96,785,296 | | | | 6,675,937 | | | | $14.50 | |
Class B | | | 11,364,588 | | | | 844,746 | | | | 13.45 | |
Class C | | | 19,251,443 | | | | 1,433,484 | | | | 13.43 | |
Class I | | | 10,833,361 | | | | 717,113 | | | | 15.11 | |
Class R1 | | | 1,831,478 | | | | 136,601 | | | | 13.41 | |
Class R2 | | | 15,910,513 | | | | 1,124,599 | | | | 14.15 | |
Class R3 | | | 5,948,724 | | | | 410,412 | | | | 14.49 | |
Class R4 | | | 368,337 | | | | 24,956 | | | | 14.76 | |
| (a) | Maximum offering price per share was equal to the net asset value per share for all share classes, except for Class A, for which the maximum offering price per share was $15.38 [100 / 94.25 x $14.5]. On sales of $50,000 or more, the maximum offering price of Class A shares is reduced. A contingent deferred sales charge may be imposed on redemptions of Class A, Class B, and Class C shares. Redemption price per share was equal to the net asset value per share for Classes I, R1, R2, R3, and R4. |
See Notes to Financial Statements
15
Financial Statements
STATEMENT OF OPERATIONS
Year ended 8/31/11
This statement describes how much your fund earned in investment income and accrued in expenses. It also describes any gains and/or losses generated by fund operations.
| | | | |
| Net investment loss | | | | |
Income | | | | |
Dividends | | | $1,267,500 | |
Interest | | | 283,391 | |
Income on securities loaned | | | 100,610 | |
Dividends from underlying affiliated funds | | | 1,680 | |
Foreign taxes withheld | | | (5,549 | ) |
Total investment income | | | $1,647,632 | |
Expenses | | | | |
Management fee | | | $1,371,364 | |
Distribution and service fees | | | 741,381 | |
Shareholder servicing costs | | | 468,207 | |
Administrative services fee | | | 35,681 | |
Independent Trustees’ compensation | | | 18,213 | |
Custodian fee | | | 33,314 | |
Shareholder communications | | | 49,694 | |
Auditing fees | | | 51,471 | |
Legal fees | | | 3,237 | |
Dividend and interest expense on securities sold short | | | 162,468 | |
Miscellaneous | | | 121,883 | |
Total expenses | | | $3,056,913 | |
Fees paid indirectly | | | (235 | ) |
Reduction of expenses by investment adviser | | | (809 | ) |
Net expenses | | | $3,055,869 | |
Net investment loss | | | $(1,408,237 | ) |
Realized and unrealized gain (loss) on investments
and foreign currency transactions | | | | |
Realized gain (loss) (identified cost basis) | | | | |
Investment transactions | | | $24,355,780 | |
Written option transactions | | | 1,966,025 | |
Securities sold short | | | (3,477,325 | ) |
Foreign currency transactions | | | (14,876 | ) |
Net realized gain (loss) on investments
and foreign currency transactions | | | $22,829,604 | |
Change in unrealized appreciation (depreciation) | | | | |
Investments | | | $10,737,273 | |
Written options | | | (80,452 | ) |
Securities sold short | | | 422,087 | |
Translation of assets and liabilities in foreign currencies | | | 505 | |
Net unrealized gain (loss) on investments
and foreign currency translation | | | $11,079,413 | |
Net realized and unrealized gain (loss) on investments
and foreign currency | | | $33,909,017 | |
Change in net assets from operations | | | $32,500,780 | |
See Notes to Financial Statements
16
Financial Statements
STATEMENTS OF CHANGES IN NET ASSETS
These statements describe the increases and/or decreases in net assets resulting from operations, any distributions, and any shareholder transactions.
| | | | | | | | |
| | | Years ended 8/31 | |
| | | 2011 | | | 2010 | |
| Change in net assets | | | | | | |
| From operations | | | | | | | | |
Net investment loss | | | $(1,408,237 | ) | | | $(1,725,600 | ) |
Net realized gain (loss) on investments and foreign
currency transactions | | | 22,829,604 | | | | 16,205,931 | |
Net unrealized gain (loss) on investments and foreign
currency translation | | | 11,079,413 | | | | (5,615,421 | ) |
Change in net assets from operations | | | $32,500,780 | | | | $8,864,910 | |
Change in net assets from fund share transactions | | | $(10,719,084 | ) | | | $(10,982,910 | ) |
Total change in net assets | | | $21,781,696 | | | | $(2,118,000 | ) |
| Net assets | | | | | | | | |
At beginning of period | | | 140,512,044 | | | | 142,630,044 | |
At end of period (including accumulated net investment
loss of $31,791 and $52,809, respectively) | | | $162,293,740 | | | | $140,512,044 | |
See Notes to Financial Statements
17
Financial Statements
FINANCIAL HIGHLIGHTS
The financial highlights table is intended to help you understand the fund’s financial performance for the past 5 years Certain information reflects financial results for a single fund share. The total returns in the table represent the rate by which an investor would have earned (or lost) on an investment in the fund share class (assuming reinvestment of all distributions) held for the entire period.
| | | | | | | | | | | | | | | | | | | | |
| Class A | | Years ended 8/31 | |
| | | 2011 | | | 2010 | | | 2009 | | | 2008 | | | 2007 | |
Net asset value, beginning of period | | | $11.80 | | | | $11.06 | | | | $12.46 | | | | $13.34 | | | | $10.13 | |
| Income (loss) from investment operations | | | | | | | | | | | | | | | | | | | | |
Net investment loss (d) | | | $(0.09 | ) | | | $(0.11 | ) | | | $(0.03 | ) | | | $(0.07 | ) | | | $(0.10 | ) |
Net realized and unrealized gain (loss)
on investments and foreign currency | | | 2.79 | | | | 0.85 | | | | (1.37 | ) | | | (0.81 | ) | | | 3.31 | |
Total from investment operations | | | $2.70 | | | | $0.74 | | | | $(1.40 | ) | | | $(0.88 | ) | | | $3.21 | |
Net asset value, end of period | | | $14.50 | | | | $11.80 | | | | $11.06 | | | | $12.46 | | | | $13.34 | |
Total return (%) (r)(s)(t)(x) | | | 22.88 | | | | 6.69 | | | | (11.24 | ) | | | (6.60 | ) | | | 31.69 | |
Ratios (%) (to average net assets)
and Supplemental data: | | | | | | | | | | | | | | | | | | | | |
Expenses before expense reductions (f) | | | 1.52 | | | | 1.63 | | | | 1.85 | | | | 1.66 | | | | 1.70 | |
Expenses after expense reductions (f) | | | 1.52 | | | | 1.57 | | | | 1.48 | | | | 1.51 | | | | 1.50 | |
Net investment loss | | | (0.61 | ) | | | (0.91 | ) | | | (0.34 | ) | | | (0.56 | ) | | | (0.82 | ) |
Portfolio turnover | | | 106 | | | | 182 | | | | 226 | | | | 231 | | | | 266 | |
Net assets at end of period (000 omitted) | | | $96,785 | | | | $82,976 | | | | $86,720 | | | | $64,791 | | | | $56,598 | |
| Supplemental Ratios (%): | | | | | | | | | | | | | | | | | | | | |
Ratio of expenses to average net assets after
expense reductions excluding short sale
dividend and interest expense (f) | | | 1.43 | | | | 1.53 | | | | 1.44 | | | | 1.50 | | | | N/A | |
See Notes to Financial Statements
18
Financial Highlights – continued
| | | | | | | | | | | | | | | | | | | | |
| Class B | | Years ended 8/31 | |
| | | 2011 | | | 2010 | | | 2009 | | | 2008 | | | 2007 | |
Net asset value, beginning of period | | | $11.03 | | | | $10.42 | | | | $11.82 | | | | $12.74 | | | | $9.73 | |
| Income (loss) from investment operations | | | | | | | | | | | | | | | | | | | | |
Net investment loss (d) | | | $(0.18 | ) | | | $(0.19 | ) | | | $(0.08 | ) | | | $(0.16 | ) | | | $(0.17 | ) |
Net realized and unrealized gain (loss)
on investments and foreign currency | | | 2.60 | | | | 0.80 | | | | (1.32 | ) | | | (0.76 | ) | | | 3.18 | |
Total from investment operations | | | $2.42 | | | | $0.61 | | | | $(1.40 | ) | | | $(0.92 | ) | | | $3.01 | |
Net asset value, end of period | | | $13.45 | | | | $11.03 | | | | $10.42 | | | | $11.82 | | | | $12.74 | |
Total return (%) (r)(s)(t)(x) | | | 21.94 | | | | 5.85 | | | | (11.84 | ) | | | (7.22 | ) | | | 30.94 | |
Ratios (%) (to average net assets)
and Supplemental data: | | | | | | | | | | | | | | | | | | | | |
Expenses before expense reductions (f) | | | 2.27 | | | | 2.37 | | | | 2.58 | | | | 2.32 | | | | 2.36 | |
Expenses after expense reductions (f) | | | 2.27 | | | | 2.32 | | | | 2.19 | | | | 2.16 | | | | 2.15 | |
Net investment loss | | | (1.35 | ) | | | (1.66 | ) | | | (0.98 | ) | | | (1.24 | ) | | | (1.47 | ) |
Portfolio turnover | | | 106 | | | | 182 | | | | 226 | | | | 231 | | | | 266 | |
Net assets at end of period (000 omitted) | | | $11,365 | | | | $11,849 | | | | $15,182 | | | | $23,254 | | | | $38,540 | |
| Supplemental Ratios (%): | | | | | | | | | | | | | | | | | | | | |
Ratio of expenses to average net assets after
expense reductions excluding short sale
dividend and interest expense (f) | | | 2.18 | | | | 2.27 | | | | 2.15 | | | | 2.15 | | | | N/A | |
| | | | | | | | | | | | | | | | | | | | |
| Class C | | Years ended 8/31 | |
| | | 2011 | | | 2010 | | | 2009 | | | 2008 | | | 2007 | |
Net asset value, beginning of period | | | $11.01 | | | | $10.40 | | | | $11.80 | | | | $12.72 | | | | $9.72 | |
| Income (loss) from investment operations | | | | | | | | | | | | | | | | | | | | |
Net investment loss (d) | | | $(0.19 | ) | | | $(0.19 | ) | | | $(0.08 | ) | | | $(0.16 | ) | | | $(0.17 | ) |
Net realized and unrealized gain (loss)
on investments and foreign currency | | | 2.61 | | | | 0.80 | | | | (1.32 | ) | | | (0.76 | ) | | | 3.17 | |
Total from investment operations | | | $2.42 | | | | $0.61 | | | | $(1.40 | ) | | | $(0.92 | ) | | | $3.00 | |
Net asset value, end of period | | | $13.43 | | | | $11.01 | | | | $10.40 | | | | $11.80 | | | | $12.72 | |
Total return (%) (r)(s)(t)(x) | | | 21.98 | | | | 5.87 | | | | (11.86 | ) | | | (7.23 | ) | | | 30.86 | |
Ratios (%) (to average net assets)
and Supplemental data: | | | | | | | | | | | | | | | | | | | | |
Expenses before expense reductions (f) | | | 2.27 | | | | 2.38 | | | | 2.57 | | | | 2.31 | | | | 2.35 | |
Expenses after expense reductions (f) | | | 2.27 | | | | 2.33 | | | | 2.19 | | | | 2.16 | | | | 2.15 | |
Net investment loss | | | (1.37 | ) | | | (1.66 | ) | | | (1.00 | ) | | | (1.22 | ) | | | (1.46 | ) |
Portfolio turnover | | | 106 | | | | 182 | | | | 226 | | | | 231 | | | | 266 | |
Net assets at end of period (000 omitted) | | | $19,251 | | | | $16,858 | | | | $15,356 | | | | $15,765 | | | | $16,064 | |
| Supplemental Ratios (%): | | | | | | | | | | | | | | | | | | | | |
Ratio of expenses to average net assets after
expense reductions excluding short sale
dividend and interest expense (f) | | | 2.18 | | | | 2.28 | | | | 2.15 | | | | 2.15 | | | | N/A | |
See Notes to Financial Statements
19
Financial Highlights – continued
| | | | | | | | | | | | | | | | | | | | |
| Class I | | Years ended 8/31 | |
| | | 2011 | | | 2010 | | | 2009 | | | 2008 | | | 2007 | |
Net asset value, beginning of period | | | $12.26 | | | | $11.47 | | | | $12.88 | | | | $13.74 | | | | $10.39 | |
| Income (loss) from investment operations | | | | | | | | | | | | | | | | | | | | |
Net investment loss (d) | | | $(0.06 | ) | | | $(0.08 | ) | | | $(0.00 | )(w) | | | $(0.03 | ) | | | $(0.06 | ) |
Net realized and unrealized gain (loss)
on investments and foreign currency | | | 2.91 | | | | 0.87 | | | | (1.41 | ) | | | (0.83 | ) | | | 3.41 | |
Total from investment operations | | | $2.85 | | | | $0.79 | | | | $(1.41 | ) | | | $(0.86 | ) | | | $3.35 | |
Net asset value, end of period | | | $15.11 | | | | $12.26 | | | | $11.47 | | | | $12.88 | | | | $13.74 | |
Total return (%) (r)(s)(x) | | | 23.25 | | | | 6.89 | | | | (10.95 | ) | | | (6.26 | ) | | | 32.24 | |
Ratios (%) (to average net assets)
and Supplemental data: | | | | | | | | | | | | | | | | | | | | |
Expenses before expense reductions (f) | | | 1.27 | | | | 1.38 | | | | 1.56 | | | | 1.31 | | | | 1.35 | |
Expenses after expense reductions (f) | | | 1.27 | | | | 1.33 | | | | 1.19 | | | | 1.16 | | | | 1.15 | |
Net investment loss | | | (0.38 | ) | | | (0.66 | ) | | | (0.03 | ) | | | (0.20 | ) | | | (0.47 | ) |
Portfolio turnover | | | 106 | | | | 182 | | | | 226 | | | | 231 | | | | 266 | |
Net assets at end of period (000 omitted) | | | $10,833 | | | | $8,873 | | | | $6,726 | | | | $4,958 | | | | $4,180 | |
| Supplemental Ratios (%): | | | | | | | | | | | | | | | | | | | | |
Ratio of expenses to average net assets after
expense reductions excluding short sale
dividend and interest expense (f) | | | 1.18 | | | | 1.29 | | | | 1.15 | | | | 1.15 | | | | N/A | |
| |
| Class R1 | | Years ended 8/31 | |
| | | 2011 | | | 2010 | | | 2009 | | | 2008 | | | 2007 | |
Net asset value, beginning of period | | | $10.99 | | | | $10.39 | | | | $11.78 | | | | $12.70 | | | | $9.72 | |
| Income (loss) from investment operations | | | | | | | | | | | | | | | | | | | | |
Net investment loss (d) | | | $(0.19 | ) | | | $(0.19 | ) | | | $(0.08 | ) | | | $(0.15 | ) | | | $(0.19 | ) |
Net realized and unrealized gain (loss)
on investments and foreign currency | | | 2.61 | | | | 0.79 | | | | (1.31 | ) | | | (0.77 | ) | | | 3.17 | |
Total from investment operations | | | $2.42 | | | | $0.60 | | | | $(1.39 | ) | | | $(0.92 | ) | | | $2.98 | |
Net asset value, end of period | | | $13.41 | | | | $10.99 | | | | $10.39 | | | | $11.78 | | | | $12.70 | |
Total return (%) (r)(s)(x) | | | 22.02 | | | | 5.77 | | | | (11.80 | ) | | | (7.24 | ) | | | 30.66 | |
Ratios (%) (to average net assets)
and Supplemental data: | | | | | | | | | | | | | | | | | | | | |
Expenses before expense reductions (f) | | | 2.27 | | | | 2.38 | | | | 2.58 | | | | 2.36 | | | | 2.48 | |
Expenses after expense reductions (f) | | | 2.27 | | | | 2.32 | | | | 2.19 | | | | 2.21 | | | | 2.25 | |
Net investment loss | | | (1.39 | ) | | | (1.66 | ) | | | (0.96 | ) | | | (1.22 | ) | | | (1.63 | ) |
Portfolio turnover | | | 106 | | | | 182 | | | | 226 | | | | 231 | | | | 266 | |
Net assets at end of period (000 omitted) | | | $1,831 | | | | $1,421 | | | | $1,585 | | | | $2,026 | | | | $1,235 | |
| Supplemental Ratios (%): | | | | | | | | | | | | | | | | | | | | |
Ratio of expenses to average net assets after
expense reductions excluding short sale
dividend and interest expense (f) | | | 2.18 | | | | 2.28 | | | | 2.15 | | | | 2.20 | | | | N/A | |
See Notes to Financial Statements
20
Financial Highlights – continued
| | | | | | | | | | | | | | | | | | | | |
| Class R2 | | Years ended 8/31 | |
| | | 2011 | | | 2010 | | | 2009 | | | 2008 | | | 2007 | |
Net asset value, beginning of period | | | $11.54 | | | | $10.85 | | | | $12.25 | | | | $13.14 | | | | $10.00 | |
| Income (loss) from investment operations | | | | | | | | | | | | | | | | | | | | |
Net investment loss (d) | | | $(0.12 | ) | | | $(0.14 | ) | | | $(0.04 | ) | | | $(0.09 | ) | | | $(0.13 | ) |
Net realized and unrealized gain (loss)
on investments and foreign currency | | | 2.73 | | | | 0.83 | | | | (1.36 | ) | | | (0.80 | ) | | | 3.27 | |
Total from investment operations | | | $2.61 | | | | $0.69 | | | | $(1.40 | ) | | | $(0.89 | ) | | | $3.14 | |
Net asset value, end of period | | | $14.15 | | | | $11.54 | | | | $10.85 | | | | $12.25 | | | | $13.14 | |
Total return (%) (r)(s)(x) | | | 22.62 | | | | 6.36 | | | | (11.43 | ) | | | (6.77 | ) | | | 31.40 | |
Ratios (%) (to average net assets)
and Supplemental data: | | | | | | | | | | | | | | | | | | | | |
Expenses before expense reductions (f) | | | 1.77 | | | | 1.87 | | | | 2.07 | | | | 1.85 | | | | 1.98 | |
Expenses after expense reductions (f) | | | 1.77 | | | | 1.82 | | | | 1.69 | | | | 1.71 | | | | 1.80 | |
Net investment loss | | | (0.87 | ) | | | (1.16 | ) | | | (0.50 | ) | | | (0.65 | ) | | | (1.07 | ) |
Portfolio turnover | | | 106 | | | | 182 | | | | 226 | | | | 231 | | | | 266 | |
Net assets at end of period (000 omitted) | | | $15,911 | | | | $13,501 | | | | $13,775 | | | | $12,098 | | | | $5,292 | |
| Supplemental Ratios (%): | | | | | | | | | | | | | | | | | | | | |
Ratio of expenses to average net assets after
expense reductions excluding short sale
dividend and interest expense (f) | | | 1.68 | | | | 1.78 | | | | 1.65 | | | | 1.69 | | | | N/A | |
| |
| Class R3 | | Years ended 8/31 | |
| | | 2011 | | | 2010 | | | 2009 | | | 2008 | | | 2007 | |
Net asset value, beginning of period | | | $11.79 | | | | $11.06 | | | | $12.45 | | | | $13.33 | | | | $10.12 | |
| Income (loss) from investment operations | | | | | | | | | | | | | | | | | | | | |
Net investment loss (d) | | | $(0.09 | ) | | | $(0.11 | ) | | | $(0.02 | ) | | | $(0.06 | ) | | | $(0.10 | ) |
Net realized and unrealized gain (loss)
on investments and foreign currency | | | 2.79 | | | | 0.84 | | | | (1.37 | ) | | | (0.82 | ) | | | 3.31 | |
Total from investment operations | | | $2.70 | | | | $0.73 | | | | $(1.39 | ) | | | $(0.88 | ) | | | $3.21 | |
Net asset value, end of period | | | $14.49 | | | | $11.79 | | | | $11.06 | | | | $12.45 | | | | $13.33 | |
Total return (%) (r)(s)(x) | | | 22.90 | | | | 6.60 | | | | (11.16 | ) | | | (6.60 | ) | | | 31.72 | |
Ratios (%) (to average net assets)
and Supplemental data: | | | | | | | | | | | | | | | | | | | | |
Expenses before expense reductions (f) | | | 1.52 | | | | 1.62 | | | | 1.82 | | | | 1.61 | | | | 1.70 | |
Expenses after expense reductions (f) | | | 1.52 | | | | 1.58 | | | | 1.44 | | | | 1.46 | | | | 1.55 | |
Net investment loss | | | (0.63 | ) | | | (0.90 | ) | | | (0.24 | ) | | | (0.44 | ) | | | (0.76 | ) |
Portfolio turnover | | | 106 | | | | 182 | | | | 226 | | | | 231 | | | | 266 | |
Net assets at end of period (000 omitted) | | | $5,949 | | | | $4,589 | | | | $3,133 | | | | $2,390 | | | | $1,547 | |
| Supplemental Ratios (%): | | | | | | | | | | | | | | | | | | | | |
Ratio of expenses to average net assets after
expense reductions excluding short sale
dividend and interest expense (f) | | | 1.43 | | | | 1.53 | | | | 1.40 | | | | 1.44 | | | | N/A | |
See Notes to Financial Statements
21
Financial Highlights – continued
| | | | | | | | | | | | | | | | | | | | |
| Class R4 | | Years ended 8/31 | |
| | | 2011 | | | 2010 | | | 2009 | | | 2008 | | | 2007 | |
Net asset value, beginning of period | | | $11.98 | | | | $11.21 | | | | $12.58 | | | | $13.43 | | | | $10.17 | |
| Income (loss) from investment operations | | | | | | | | | | | | | | | | | | | | |
Net investment income (loss) (d) | | | $(0.05 | ) | | | $(0.08 | ) | | | $(0.00 | )(w) | | | $(0.03 | ) | | | $(0.07 | ) |
Net realized and unrealized gain (loss)
on investments and foreign currency | | | 2.83 | | | | 0.85 | | | | (1.37 | ) | | | (0.82 | ) | | | 3.33 | |
Total from investment operations | | | $2.78 | | | | $0.77 | | | | $(1.37 | ) | | | $(0.85 | ) | | | $3.26 | |
Net asset value, end of period | | | $14.76 | | | | $11.98 | | | | $11.21 | | | | $12.58 | | | | $13.43 | |
Total return (%) (r)(s)(x) | | | 23.21 | | | | 6.87 | | | | (10.89 | ) | | | (6.33 | ) | | | 32.06 | |
Ratios (%) (to average net assets)
and Supplemental data: | | | | | | | | | | | | | | | | | | | | |
Expenses before expense reductions (f) | | | 1.26 | | | | 1.39 | | | | 1.54 | | | | 1.35 | | | | 1.45 | |
Expenses after expense reductions (f) | | | 1.26 | | | | 1.36 | | | | 1.18 | | | | 1.20 | | | | 1.25 | |
Net investment loss | | | (0.32 | ) | | | (0.65 | ) | | | (0.02 | ) | | | (0.24 | ) | | | (0.56 | ) |
Portfolio turnover | | | 106 | | | | 182 | | | | 226 | | | | 231 | | | | 266 | |
Net assets at end of period (000 omitted) | | | $368 | | | | $445 | | | | $153 | | | | $76 | | | | $81 | |
| Supplemental Ratios (%): | | | | | | | | | | | | | | | | | | | | |
Ratio of expenses to average net assets after
expense reductions excluding short sale
dividend and interest expense (f) | | | 1.17 | | | | 1.31 | | | | 1.15 | | | | 1.19 | | | | N/A | |
| (d) | Per share data is based on average shares outstanding. |
| (f) | Ratios do not reflect reductions from fees paid indirectly, if applicable. |
| (r) | Certain expenses have been reduced without which performance would have been lower. |
| (s) | From time to time the fund may receive proceeds from litigation settlements, without which performance would be lower. Excluding the effect of the proceeds received from a non-recurring litigation settlement against Nortel Networks Corp., the Class A, Class B, Class C, Class I, Class R1, Class R2, Class R3, and Class R4 total returns for the year ended August 31, 2008, would have each been lower by approximately 0.55%. Excluding the effect of the proceeds received from a non-recurring litigation settlement against Global Research Analyst II, the Class A, Class B, Class C, Class I, Class R1, Class R2, Class R3, and Class R4 total returns for the year ended August 31, 2007, would have each been lower by approximately 0.56%. |
| (t) | Total returns do not include any applicable sales charges. |
| (w) | Per share amount was less than $0.01. |
| (x) | Total returns have been calculated on net asset values which include adjustments made in accordance with U.S. generally accepted accounting principles required at period end for financial reporting purposes. |
See Notes to Financial Statements
22
NOTES TO FINANCIAL STATEMENTS
| (1) | | Business and Organization |
MFS Technology Fund (the fund) is a series of MFS Series Trust I (the trust). The trust is organized as a Massachusetts business trust and is registered under the Investment Company Act of 1940, as amended, as an open-end management investment company.
| (2) | | Significant Accounting Policies |
General – The preparation of financial statements in conformity with U.S. generally accepted accounting principles requires management to make estimates and assumptions that affect the reported amounts of assets and liabilities, and disclosure of contingent assets and liabilities at the date of the financial statements and the reported amounts of revenues and expenses during the reporting period. Actual results could differ from those estimates. In the preparation of these financial statements, management has evaluated subsequent events occurring after the date of the fund’s Statement of Assets and Liabilities through the date that the financial statements were issued. The fund invests primarily in securities of issuers in the technology industry. Issuers in a single industry can react similarly to market, economic, political and regulatory conditions and developments. The fund invests in foreign securities. Investments in foreign securities are vulnerable to the effects of changes in the relative values of the local currency and the U.S. dollar and to the effects of changes in each country’s legal, political, and economic environment.
Investment Valuations – Equity securities, including restricted equity securities, are generally valued at the last sale or official closing price as provided by a third-party pricing service on the market or exchange on which they are primarily traded. Equity securities, for which there were no sales reported that day, are generally valued at the last quoted daily bid quotation as provided by a third-party pricing service on the market or exchange on which such securities are primarily traded. Equity securities held short, for which there were no sales reported for that day, are generally valued at the last quoted daily ask quotation as provided by a third-party pricing service on the market or exchange on which such securities are primarily traded. Debt instruments and floating rate loans (other than short-term instruments), including restricted debt instruments, are generally valued at an evaluated or composite bid as provided by a third-party pricing service. Short-term instruments with a maturity at issuance of 60 days or less generally are valued at amortized cost, which approximates market value. Exchange-traded options are generally valued at the last sale or official closing price as provided by a third-party pricing service on the exchange on which such options are primarily traded. Exchange-traded options for which there were no sales
23
Notes to Financial Statements – continued
reported that day are generally valued at the last daily bid quotation as provided by a third-party pricing service on the exchange on which such options are primarily traded. Options not traded on an exchange are generally valued at a broker/dealer bid quotation. Foreign currency options are generally valued at valuations provided by a third-party pricing service. Open-end investment companies are generally valued at net asset value per share. Securities and other assets generally valued on the basis of information from a third-party pricing service may also be valued at a broker/dealer bid quotation. Values obtained from third-party pricing services can utilize both transaction data and market information such as yield, quality, coupon rate, maturity, type of issue, trading characteristics, and other market data. The values of foreign securities and other assets and liabilities expressed in foreign currencies are converted to U.S. dollars using the mean of bid and asked prices for rates provided by a third-party pricing service.
The Board of Trustees has delegated primary responsibility for determining or causing to be determined the value of the fund’s investments (including any fair valuation) to the adviser pursuant to valuation policies and procedures approved by the Board. If the adviser determines that reliable market quotations are not readily available, investments are valued at fair value as determined in good faith by the adviser in accordance with such procedures under the oversight of the Board of Trustees. Under the fund’s valuation policies and procedures, market quotations are not considered to be readily available for most types of debt instruments and floating rate loans and many types of derivatives. These investments are generally valued at fair value based on information from third-party pricing services. In addition, investments may be valued at fair value if the adviser determines that an investment’s value has been materially affected by events occurring after the close of the exchange or market on which the investment is principally traded (such as foreign exchange or market) and prior to the determination of the fund’s net asset value, or after the halting of trading of a specific security where trading does not resume prior to the close of the exchange or market on which the security is principally traded. Events that occur on a frequent basis after foreign markets close (such as developments in foreign markets and significant movements in the U.S. markets) and prior to the determination of the fund’s net asset value may be deemed to have a material effect on the value of securities traded in foreign markets. Accordingly, the fund’s foreign equity securities may often be valued at fair value. The adviser generally relies on third-party pricing services or other information (such as the correlation with price movements of similar securities in the same or other markets; the type, cost and investment characteristics of the security; the business and financial condition of the issuer; and trading and other market data) to assist in determining whether to fair value and at what value to fair value an
24
Notes to Financial Statements – continued
investment. The value of an investment for purposes of calculating the fund’s net asset value can differ depending on the source and method used to determine value. When fair valuation is used, the value of an investment used to determine the fund’s net asset value may differ from quoted or published prices for the same investment. There can be no assurance that the fund could obtain the fair value assigned to an investment if it were to sell the investment at the same time at which the fund determines its net asset value per share.
Various inputs are used in determining the value of the fund’s assets or liabilities. These inputs are categorized into three broad levels. In certain cases, the inputs used to measure fair value may fall into different levels of the fair value hierarchy. In such cases, an investment’s level within the fair value hierarchy is based on the lowest level of input that is significant to the fair value measurement. The fund’s assessment of the significance of a particular input to the fair value measurement in its entirety requires judgment, and considers factors specific to the investment. Level 1 includes unadjusted quoted prices in active markets for identical assets or liabilities. Level 2 includes other significant observable market-based inputs (including quoted prices for similar securities, interest rates, prepayment speed, and credit risk). Level 3 includes unobservable inputs, which may include the adviser’s own assumptions in determining the fair value of investments. The following is a summary of the levels used as of August 31, 2011 in valuing the fund’s assets or liabilities:
| | | | | | | | | | | | | | | | |
| Investments at Value | | Level 1 | | | Level 2 | | | Level 3 | | | Total | |
| Equity Securities: | | | | | | | | | | | | | | | | |
United States | | | $158,276,149 | | | | $— | | | | $— | | | | $158,276,149 | |
Israel | | | 1,981,326 | | | | — | | | | — | | | | 1,981,326 | |
Netherlands | | | 1,463,211 | | | | — | | | | — | | | | 1,463,211 | |
Russia | | | — | | | | 1,075,802 | | | | — | | | | 1,075,802 | |
| Mutual Funds | | | 1,714,975 | | | | — | | | | — | | | | 1,714,975 | |
| Total Investments | | | $163,435,661 | | | | $1,075,802 | | | | $— | | | | $164,511,463 | |
| Short Sales | | | $(7,342,442 | ) | | | $— | | | | $— | | | | $(7,342,442 | ) |
For further information regarding security characteristics, see the Portfolio of Investments.
Foreign Currency Translation – Purchases and sales of foreign investments, income, and expenses are converted into U.S. dollars based upon currency exchange rates prevailing on the respective dates of such transactions or on the reporting date for foreign denominated receivables and payables. Gains and losses attributable to foreign currency exchange rates on sales of securities are recorded for financial statement purposes as net realized gains and losses on investments. Gains and losses attributable to foreign exchange rate movements on receivables, payables, income and expenses are recorded for financial statement purposes as foreign currency transaction gains and losses. That
25
Notes to Financial Statements – continued
portion of both realized and unrealized gains and losses on investments that results from fluctuations in foreign currency exchange rates is not separately disclosed.
Derivatives – The fund uses derivatives for different purposes, including to earn income and enhance returns, to increase or decrease exposure to a particular market, to manage or adjust the risk profile of the fund, or as alternatives to direct investments. Derivatives are used for hedging or non-hedging purposes. While hedging can reduce or eliminate losses, it can also reduce or eliminate gains. When the fund uses derivatives as an investment to increase market exposure, or for hedging purposes, gains and losses from derivative instruments may be substantially greater than the derivative’s original cost.
The derivative instruments used by the fund were written options and purchased options. The fund’s period end derivatives, as presented in the Portfolio of Investments, generally are indicative of the volume of its derivative activity during the period.
The following table presents, by major type of derivative contract, the fair value, on a gross basis, of the asset and liability components of derivatives held by the fund at August 31, 2011 as reported in the Statement of Assets and Liabilities:
| | | | | | |
| | | | | Fair Value (a) | |
| Risk | | Derivative Contracts | | Asset Derivatives | |
| Equity | | Purchased Equity Options | | | $468,502 | |
| (a) | The value of purchased options outstanding is included in total investments, at value, within the fund’s Statement of Assets and Liabilities. |
The following table presents, by major type of derivative contract, the realized gain (loss) on derivatives held by the fund for the year ended August 31, 2011 as reported in the Statement of Operations:
| | | | | | | | |
| Risk | | Investment Transactions
(Purchased Options) | | | Written
Options | |
| Equity | | | $178,307 | | | | $1,966,025 | |
The following table presents, by major type of derivative contract, the change in unrealized appreciation (depreciation) on derivatives held by the fund for the year ended August 31, 2011 as reported in the Statement of Operations:
| | | | | | | | |
| Risk | | Investments
(Purchased Options) | | | Written
Options | |
| Equity | | | $(280,899 | ) | | | $(80,452 | ) |
Derivative counterparty credit risk is managed through formal evaluation of the creditworthiness of all potential counterparties. On certain over-the-counter derivatives, the fund attempts to reduce its exposure to counterparty credit risk
26
Notes to Financial Statements – continued
whenever possible by entering into an International Swaps and Derivatives Association (ISDA) Master Agreement on a bilateral basis with each of the counterparties with whom it undertakes a significant volume of transactions. The ISDA Master Agreement gives each party to the agreement the right to terminate all transactions traded under such agreement if there is a certain deterioration in the credit quality of the other party. The ISDA Master Agreement gives the fund the right, upon an event of default by the applicable counterparty or a termination of the agreement, to close out all transactions traded under such agreement and to net amounts owed under each transaction to one net amount payable by one party to the other. This right to close out and net payments across all transactions traded under the ISDA Master Agreement could result in a reduction of the fund’s credit risk to such counterparty equal to any amounts payable by the fund under the applicable transactions, if any. However, absent an event of default by the counterparty or a termination of the agreement, the ISDA Master Agreement does not result in an offset of reported amounts of assets and liabilities in the Statement of Assets and Liabilities across transactions between the fund and the applicable counterparty.
Collateral requirements differ by type of derivative. Collateral or margin requirements are set by the broker or exchange clearing house for exchange traded derivatives (i.e., futures and exchange-traded options) while collateral terms are contract specific for over-the-counter traded derivatives (i.e., forward foreign currency exchange contracts, swaps and over-the-counter options). For derivatives traded under an ISDA Master Agreement, the collateral requirements are netted across all transactions traded under such agreement and one amount is posted from one party to the other to collateralize such obligations. Cash collateral that has been pledged to cover obligations of the fund under derivative contracts, if any, will be reported separately on the Statement of Assets and Liabilities as restricted cash. Securities collateral pledged for the same purpose, if any, is noted in the Portfolio of Investments.
Written Options – In exchange for a premium, the fund wrote call options on securities that it anticipated the price would decline and also wrote put options on securities that it anticipated the price would increase. At the time the option was written, the fund believed the premium received exceeded the potential loss that could result from adverse price changes in the options’ underlying securities. In a written option, the fund as the option writer grants the buyer the right to purchase from, or sell to, the fund a specified number of shares or units of a particular security, currency or index at a specified price within a specified period of time.
The premium received is initially recorded as a liability on the Statement of Assets and Liabilities. The option is subsequently marked-to-market daily with
27
Notes to Financial Statements – continued
the difference between the premium received and the market value of the written option being recorded as unrealized appreciation or depreciation. When a written option expires, the fund realizes a gain equal to the amount of the premium received. The difference between the premium received and the amount paid on effecting a closing transaction is considered a realized gain or loss. When a written call option is exercised, the premium received is offset against the proceeds to determine the realized gain or loss. When a written put option is exercised, the premium reduces the cost basis of the security purchased by the fund.
At the initiation of the written option contract, for exchange traded options, the fund is required to deposit securities or cash as collateral with the custodian for the benefit of the broker. For over-the-counter options, the fund may post collateral subject to the terms of an ISDA Master Agreement as generally described above if the market value of the options contract moves against it. The fund, as writer of an option, may have no control over whether the underlying securities may be sold (call) or purchased (put) and, as a result, bears the market risk of an unfavorable change in the price of the securities underlying the written option. Losses from writing options can exceed the premium received and can exceed the potential loss from an ordinary buy and sell transaction. Although the fund’s market risk may be significant, the maximum counterparty credit risk to the fund is equal to the market value of any collateral posted to the broker. For over-the-counter options, this risk is mitigated in cases where there is an ISDA Master Agreement between the fund and the counterparty providing for netting as described above.
Written Option Transactions
| | | | | | | | |
| | | Number of
Contracts | | | Premiums
Received | |
| Outstanding, beginning of period | | | 1,467 | | | | $146,214 | |
| Options written | | | 100,101 | | | | 4,860,244 | |
| Options closed | | | (29,324 | ) | | | (1,941,128 | ) |
| Options exercised | | | (13,221 | ) | | | (726,742 | ) |
| Options expired | | | (59,023 | ) | | | (2,338,588 | ) |
| Outstanding, end of period | | | — | | | | $— | |
Purchased Options – The fund purchased call and put options for a premium. Purchased call and put options entitle the holder to buy and sell a specified number of shares or units of a particular security, currency or index at a specified price at a specified date or within a specified period of time. Purchasing call options may be used to hedge against an anticipated increase in the dollar cost of securities or currency to be acquired or to increase the fund’s exposure to an underlying instrument. Purchasing put options may hedge against a decline in the value of portfolio securities or currency.
28
Notes to Financial Statements – continued
The premium paid is initially recorded as an investment in the Statement of Assets and Liabilities. That investment is subsequently marked-to-market daily with the difference between the premium paid and the market value of the purchased option being recorded as unrealized appreciation or depreciation. Premiums paid for purchased call and put options which have expired are treated as realized losses on investments in the Statement of Operations. Upon the exercise or closing of a purchased call option, the premium paid is added to the cost of the security or financial instrument. Upon the exercise or closing of a purchased put option, the premium paid is offset against the proceeds on the sale of the underlying security or financial instrument in order to determine the realized gain or loss on investments.
The risk in purchasing an option is that the fund pays a premium whether or not the option is exercised. The fund’s maximum risk of loss due to counterparty credit risk is limited to the market value of the option. For over-the-counter options, this risk is mitigated in cases where there is an ISDA Master Agreement between the fund and the counterparty providing for netting as described above and for posting of collateral by the counterparty to the fund to cover the fund’s exposure to the counterparty under such ISDA Master Agreement.
Short Sales – The fund entered into short sales whereby it sells a security it does not own in anticipation of a decline in the value of that security. The fund will realize a gain if the security price decreases and a loss if the security price increases between the date of the short sale and the date on which the fund replaces the borrowed security. Losses from short sales can exceed the proceeds of the security sold; and they can also exceed the potential loss from an ordinary buy and sell transaction. The amount of any premium, dividends, or interest the fund may be required to pay in connection with a short sale will be recognized as a fund expense. During the year ended August 31, 2011, this expense amounted to $162,468. The fund segregates cash or marketable securities in an amount that, when combined with the amount of proceeds from the short sale deposited with the broker, at least equals the current market value of the security sold short.
Security Loans – State Street Bank and Trust Company (“State Street”), as lending agent, loans the securities of the fund to certain qualified institutions (the “Borrowers”) approved by the fund. The loans are collateralized by cash and/or U.S. Treasury and federal agency obligations in an amount typically at least equal to the market value of the securities loaned. The market value of the loaned securities is determined at the close of business of the fund and any additional required collateral is delivered to the fund on the next business day. State Street provides the fund with indemnification against Borrower default. The fund bears the risk of loss with respect to the investment of cash collateral.
29
Notes to Financial Statements – continued
On loans collateralized by cash, the cash collateral is invested in a money market fund or short-term securities. A portion of the income generated upon investment of the collateral is remitted to the Borrowers, and the remainder is allocated between the fund and the lending agent. On loans collateralized by U.S. Treasury and/or federal agency obligations, a fee is received from the Borrower, and is allocated between the fund and the lending agent. Income from securities lending is separately reported on the Statement of Operations. The dividend and interest income earned on the securities loaned is accounted for in the same manner as other dividend and interest income.
Indemnifications – Under the fund’s organizational documents, its officers and Trustees may be indemnified against certain liabilities and expenses arising out of the performance of their duties to the fund. Additionally, in the normal course of business, the fund enters into agreements with service providers that may contain indemnification clauses. The fund’s maximum exposure under these agreements is unknown as this would involve future claims that may be made against the fund that have not yet occurred.
Investment Transactions and Income – Investment transactions are recorded on the trade date. Interest income is recorded on the accrual basis. All premium and discount is amortized or accreted for financial statement purposes in accordance with U.S. generally accepted accounting principles. Dividends received in cash are recorded on the ex-dividend date. Certain dividends from foreign securities will be recorded when the fund is informed of the dividend if such information is obtained subsequent to the ex-dividend date. Dividend and interest payments received in additional securities are recorded on the ex-dividend or ex-interest date in an amount equal to the value of the security on such date.
The fund may receive proceeds from litigation settlements. Any proceeds received from litigation involving portfolio holdings are reflected in the Statement of Operations in realized gain/loss if the security has been disposed of by the fund or in unrealized gain/loss if the security is still held by the fund. Any other proceeds from litigation not related to portfolio holdings are reflected as other income in the Statement of Operations.
Fees Paid Indirectly – The fund’s custody fee may be reduced according to an arrangement that measures the value of cash deposited with the custodian by the fund. This amount, for the year ended August 31, 2011, is shown as a reduction of total expenses on the Statement of Operations.
Tax Matters and Distributions – The fund intends to qualify as a regulated investment company, as defined under Subchapter M of the Internal Revenue Code, and to distribute all of its taxable income, including realized capital gains. As a result, no provision for federal income tax is required. The fund’s
30
Notes to Financial Statements – continued
federal tax returns for the prior three fiscal years remain subject to examination by the Internal Revenue Service. Foreign taxes, if any, have been accrued by the fund in the accompanying financial statements.
Distributions to shareholders are recorded on the ex-dividend date. Income and capital gain distributions are determined in accordance with income tax regulations, which may differ from U.S. generally accepted accounting principles. Certain capital accounts in the financial statements are periodically adjusted for permanent differences in order to reflect their tax character. These adjustments have no impact on net assets or net asset value per share. Temporary differences which arise from recognizing certain items of income, expense, gain or loss in different periods for financial statement and tax purposes will reverse at some time in the future. Distributions in excess of net investment income or net realized gains are temporary overdistributions for financial statement purposes resulting from differences in the recognition or classification of income or distributions for financial statement and tax purposes.
Book/tax differences primarily relate to net operating losses, expiration of capital loss carryforwards, wash sale loss deferrals, and straddle loss deferrals.
The fund declared no distributions for the years ended August 31, 2011 and August 31, 2010.
The federal tax cost and the tax basis components of distributable earnings were as follows:
| | | | |
| As of 8/31/11 | | | |
| Cost of investments | | | $163,200,634 | |
| Gross appreciation | | | 13,898,156 | |
| Gross depreciation | | | (12,587,327 | ) |
| Net unrealized appreciation (depreciation) | | | $1,310,829 | |
| Capital loss carryforwards | | | (18,461,616 | ) |
| Other temporary differences | | | 562,043 | |
As of August 31, 2011, the fund had capital loss carryforwards available to offset future realized gains. Such losses expire as follows:
| | | | |
| 8/31/12 | | | $(4,463,246 | ) |
| 8/31/17 | | | (13,998,370 | ) |
| Total | | | $(18,461,616 | ) |
Multiple Classes of Shares of Beneficial Interest – The fund offers multiple classes of shares, which differ in their respective distribution and service fees. The fund’s income, realized gain (loss), and common expenses are allocated to shareholders based on the daily net assets of each class. Dividends are declared separately for each class. Differences in per share dividend rates are generally
31
Notes to Financial Statements – continued
due to differences in separate class expenses. Class B shares will convert to Class A shares approximately eight years after purchase.
| (3) | | Transactions with Affiliates |
Investment Adviser – The fund has an investment advisory agreement with MFS to provide overall investment management and related administrative services and facilities to the fund.
The management fee is computed daily and paid monthly at the following annual rates:
| | | | |
| First $1 billion of average daily net assets | | | 0.75 | % |
| Average daily net assets in excess of $1 billion | | | 0.70 | % |
The management fee incurred for the year ended August 31, 2011 was equivalent to an annual effective rate of 0.75% of the fund’s average daily net assets.
The investment adviser has agreed in writing to pay a portion of the fund’s total annual operating expenses, exclusive of interest, taxes, extraordinary expenses, brokerage and transaction costs, and investment-related expenses (such as short sale dividend and interest expenses incurred in connection with the fund’s investment activity), such that total annual fund operating expenses do not exceed the following rates annually of the fund’s average daily net assets.
| | | | | | | | | | | | | | | | | | | | | | | | | | | | |
| Class A | | Class B | | | Class C | | | Class I | | | Class R1 | | | Class R2 | | | Class R3 | | | Class R4 | |
| 1.63% | | | 2.38% | | | | 2.38% | | | | 1.38% | | | | 2.38% | | | | 1.88% | | | | 1.63% | | | | 1.38% | |
This written agreement will continue until modified by the fund’s Board of Trustees, but such agreement will continue at least until December 31, 2012. For the year ended August 31, 2011, the fund’s actual operating expenses did not exceed this limit and therefore, the investment advisor did not pay any portion of the fund’s expenses.
Distributor – MFS Fund Distributors, Inc. (MFD), a wholly-owned subsidiary of MFS, as distributor, received $34,422 for the year ended August 31, 2011, as its portion of the initial sales charge on sales of Class A shares of the fund.
The Board of Trustees has adopted a distribution plan for certain class shares pursuant to Rule 12b-1 of the Investment Company Act of 1940.
The fund’s distribution plan provides that the fund will pay MFD for services provided by MFD and financial intermediaries in connection with the distribution and servicing of certain share classes. One component of the plan is a distribution fee paid to MFD and another component of the plan is a service fee paid to MFD. MFD may subsequently pay all, or a portion, of the distribution and/or service fees to financial intermediaries.
32
Notes to Financial Statements – continued
Distribution Plan Fee Table:
| | | | | | | | | | | | | | | | | | | | |
| | | Distribution
Fee Rate (d) | | | Service
Fee Rate (d) | | | Total
Distribution
Plan (d) | | | Annual
Effective
Rate (e) | | | Distribution
and Service
Fee | |
| Class A | | | — | | | | 0.25% | | | | 0.25% | | | | 0.25% | | | | $277,116 | |
| Class B | | | 0.75% | | | | 0.25% | | | | 1.00% | | | | 1.00% | | | | 133,346 | |
| Class C | | | 0.75% | | | | 0.25% | | | | 1.00% | | | | 1.00% | | | | 211,835 | |
| Class R1 | | | 0.75% | | | | 0.25% | | | | 1.00% | | | | 1.00% | | | | 18,542 | |
| Class R2 | | | 0.25% | | | | 0.25% | | | | 0.50% | | | | 0.50% | | | | 85,604 | |
| Class R3 | | | — | | | | 0.25% | | | | 0.25% | | | | 0.25% | | | | 14,938 | |
| Total Distribution and Service Fees | | | | | | | | | | | | | | | | $741,381 | |
| (d) | In accordance with the distribution plan for certain classes, the fund pays distribution and/or service fees equal to these annual percentage rates of each class’ average daily net assets. The distribution and service fee rates disclosed by class represent the current rates in effect at the end of the reporting period. |
| (e) | The annual effective rates represent actual fees incurred under the distribution plan for the year ended August 31, 2011 based on each class’ average daily net assets. |
Certain Class A shares are subject to a contingent deferred sales charge (CDSC) in the event of a shareholder redemption within 24 months of purchase. Class C shares are subject to a CDSC in the event of a shareholder redemption within 12 months of purchase. Class B shares are subject to a CDSC in the event of a shareholder redemption within six years of purchase. All contingent deferred sales charges are paid to MFD and during the year ended August 31, 2011, were as follows:
| | | | |
| | | Amount | |
| Class A | | | $2,657 | |
| Class B | | | 15,992 | |
| Class C | | | 4,293 | |
Shareholder Servicing Agent – MFS Service Center, Inc. (MFSC), a wholly-owned subsidiary of MFS, receives a fee from the fund for its services as shareholder servicing agent calculated as a percentage of the average daily net assets of the fund as determined periodically under the supervision of the fund’s Board of Trustees. For the year ended August 31, 2011, the fee was $182,417, which equated to 0.0998% annually of the fund’s average daily net assets. MFSC also receives payment from the fund for out-of-pocket expenses, sub-accounting and other shareholder servicing costs which may be paid to affiliated and unaffiliated service providers. For the year ended August 31, 2011, these out-of-pocket expenses, sub-accounting and other shareholder servicing costs amounted to $285,790.
Administrator – MFS provides certain financial, legal, shareholder communications, compliance, and other administrative services to the fund. Under an administrative services agreement, the fund partially reimburses MFS the costs incurred to provide these services. The fund is charged an annual fixed amount of $17,500 plus a fee based on average daily net assets.
33
Notes to Financial Statements – continued
The administrative services fee incurred for the year ended August 31, 2011 was equivalent to an annual effective rate of 0.0195% of the fund’s average daily net assets.
Trustees’ and Officers’ Compensation – The fund pays compensation to independent Trustees in the form of a retainer, attendance fees, and additional compensation to Board and Committee chairpersons. The fund does not pay compensation directly to Trustees or officers of the fund who are also officers of the investment adviser, all of whom receive remuneration for their services to the fund from MFS. Certain officers and Trustees of the fund are officers or directors of MFS, MFD, and MFSC.
Prior to December 31, 2001, the fund had an unfunded defined benefit plan (“DB plan”) for independent Trustees. As of December 31, 2001, the Board took action to terminate the DB plan with respect to then-current and any future independent Trustees, such that the DB Plan covers only certain of those former independent Trustees who retired on or before December 31, 2001. Effective January 1, 2002, accrued benefits under the DB Plan for then-current independent Trustees who continued were credited to an unfunded retirement deferral plan (the “Retirement Deferral plan”), which was established for and exists solely with respect to these credited amounts, and is not available for other deferrals by these or other independent Trustees. Although the Retirement Deferral plan is unfunded, amounts deferred under the plan are periodically adjusted for investment experience as if they had been invested in shares of the fund. The DB Plan resulted in a pension expense of $502 and the Retirement Deferral plan resulted in an expense of $11,931. Both amounts are included in independent Trustees’ compensation for the year ended August 31, 2011. The liability for deferred retirement benefits payable to certain independent Trustees under both plans amounted to $32,882 at August 31, 2011, and is included in payable for independent Trustees’ compensation on the Statement of Assets and Liabilities.
Other – This fund and certain other funds managed by MFS (the funds) have entered into services agreements (the Agreements) which provide for payment of fees by the funds to Tarantino LLC and Griffin Compliance LLC in return for the provision of services of an Independent Chief Compliance Officer (ICCO) and Assistant ICCO, respectively, for the funds. The ICCO and Assistant ICCO are officers of the funds and the sole members of Tarantino LLC and Griffin Compliance LLC, respectively. The funds can terminate the Agreements with Tarantino LLC and Griffin Compliance LLC at any time under the terms of the Agreements. For the year ended August 31, 2011, the aggregate fees paid by the fund to Tarantino LLC and Griffin Compliance LLC were $1,644 and are included in miscellaneous expense on the Statement of Operations. MFS has agreed to reimburse the fund for a portion of the payments made by the fund
34
Notes to Financial Statements – continued
in the amount of $809, which is shown as a reduction of total expenses in the Statement of Operations. Additionally, MFS has agreed to bear all expenses associated with office space, other administrative support, and supplies provided to the ICCO and Assistant ICCO.
The fund invests in the MFS Institutional Money Market Portfolio which is managed by MFS and seeks a high level of current income consistent with preservation of capital and liquidity. Income earned on this investment is included in dividends from underlying affiliated funds on the Statement of Operations. This money market fund does not pay a management fee to MFS.
Purchases and sales of investments, other than U.S. Government securities, purchased option transactions, short sales and short-term obligations, aggregated $195,061,251 and $210,448,802, respectively.
| (5) | | Shares of Beneficial Interest |
The fund’s Declaration of Trust permits the Trustees to issue an unlimited number of full and fractional shares of beneficial interest. Transactions in fund shares were as follows:
| | | | | | | | | | | | | | | | |
| | | Year ended
8/31/11 | | | Year ended
8/31/10 | |
| | | Shares | | | Amount | | | Shares | | | Amount | |
| Shares sold | | | | | | | | | | | | | | | | |
Class A | | | 3,309,080 | | | | $46,853,793 | | | | 3,451,344 | | | | $41,648,400 | |
Class B | | | 218,526 | | | | 3,035,346 | | | | 237,792 | | | | 2,699,151 | |
Class C | | | 374,865 | | | | 5,194,282 | | | | 701,657 | | | | 7,954,717 | |
Class I | | | 319,269 | | | | 4,967,711 | | | | 403,016 | | | | 5,083,799 | |
Class R1 | | | 64,743 | | | | 909,635 | | | | 42,847 | | | | 483,426 | |
Class R2 | | | 504,283 | | | | 7,222,247 | | | | 584,085 | | | | 6,873,728 | |
Class R3 | | | 154,327 | | | | 2,258,272 | | | | 277,562 | | | | 3,360,292 | |
Class R4 | | | 20,762 | | | | 311,548 | | | | 30,277 | | | | 377,609 | |
| | | 4,965,855 | | | | $70,752,834 | | | | 5,728,580 | | | | $68,481,122 | |
| Shares reacquired | | | | | | | | | | | | | | | | |
Class A | | | (3,667,970 | ) | | | $(53,021,307 | ) | | | (4,254,808 | ) | | | $(50,905,467 | ) |
Class B | | | (448,112 | ) | | | (6,073,402 | ) | | | (620,311 | ) | | | (7,046,802 | ) |
Class C | | | (472,641 | ) | | | (6,284,669 | ) | | | (646,318 | ) | | | (7,220,539 | ) |
Class I | | | (325,864 | ) | | | (4,897,130 | ) | | | (265,714 | ) | | | (3,307,416 | ) |
Class R1 | | | (57,451 | ) | | | (778,601 | ) | | | (66,120 | ) | | | (751,557 | ) |
Class R2 | | | (549,663 | ) | | | (7,928,376 | ) | | | (683,590 | ) | | | (8,067,563 | ) |
Class R3 | | | (133,018 | ) | | | (1,967,865 | ) | | | (171,681 | ) | | | (2,082,014 | ) |
Class R4 | | | (32,973 | ) | | | (520,568 | ) | | | (6,800 | ) | | | (82,674 | ) |
| | | (5,687,692 | ) | | | $(81,471,918 | ) | | | (6,715,342 | ) | | | $(79,464,032 | ) |
35
Notes to Financial Statements – continued
| | | | | | | | | | | | | | | | |
| | | Year ended
8/31/11 | | | Year ended
8/31/10 | |
| | | Shares | | | Amount | | | Shares | | | Amount | |
| Net change | | | | | | | | | | | | | | | | |
Class A | | | (358,890 | ) | | | $(6,167,514 | ) | | | (803,464 | ) | | | $(9,257,067 | ) |
Class B | | | (229,586 | ) | | | (3,038,056 | ) | | | (382,519 | ) | | | (4,347,651 | ) |
Class C | | | (97,776 | ) | | | (1,090,387 | ) | | | 55,339 | | | | 734,178 | |
Class I | | | (6,595 | ) | | | 70,581 | | | | 137,302 | | | | 1,776,383 | |
Class R1 | | | 7,292 | | | | 131,034 | | | | (23,273 | ) | | | (268,131 | ) |
Class R2 | | | (45,380 | ) | | | (706,129 | ) | | | (99,505 | ) | | | (1,193,835 | ) |
Class R3 | | | 21,309 | | | | 290,407 | | | | 105,881 | | | | 1,278,278 | |
Class R4 | | | (12,211 | ) | | | (209,020 | ) | | | 23,477 | | | | 294,935 | |
| | | (721,837 | ) | | | $(10,719,084 | ) | | | (986,762 | ) | | | $(10,982,910 | ) |
The fund and certain other funds managed by MFS participate in a $1.1 billion unsecured committed line of credit, subject to a $1 billion sublimit, provided by a syndication of banks under a credit agreement. Borrowings may be made for temporary financing needs. Interest is charged to each fund, based on its borrowings, generally at a rate equal to the higher of the Federal Reserve funds rate or one month LIBOR plus an agreed upon spread. A commitment fee, based on the average daily, unused portion of the committed line of credit, is allocated among the participating funds at the end of each calendar quarter. In addition, the fund and other funds managed by MFS have established unsecured uncommitted borrowing arrangements with certain banks for temporary financing needs. Interest is charged to each fund, based on its borrowings, at a rate equal to the Federal Reserve funds rate plus an agreed upon spread. For the year ended August 31, 2011, the fund’s commitment fee and interest expense were $1,633 and $0, respectively, and are included in miscellaneous expense on the Statement of Operations.
| (7) | | Transactions in Underlying Affiliated Funds-Affiliated Issuers |
An affiliated issuer may be considered one in which the fund owns 5% or more of the outstanding voting securities, or a company which is under common control. For the purposes of this report, the fund assumes the following to be affiliated issuers:
| | | | | | | | | | | | | | | | |
| Underlying Affiliated Funds | | Beginning
Shares/Par
Amount | | | Acquisitions
Shares/Par
Amount | | | Dispositions
Shares/Par
Amount | | | Ending
Shares/Par
Amount | |
MFS Institutional Money
Market Portfolio | | | 2,727,663 | | | | 96,047,987 | | | | (97,060,675 | ) | | | 1,714,975 | |
| | | | |
| Underlying Affiliated Funds | | Realized
Gain (Loss) | | | Capital Gain
Distributions | | | Dividend
Income | | | Ending
Value | |
MFS Institutional Money
Market Portfolio | | | $— | | | | $— | | | | $1,680 | | | | $1,714,975 | |
36
REPORT OF INDEPENDENT REGISTERED PUBLIC ACCOUNTING FIRM
To the Board of Trustees of MFS Series Trust I and Shareholders of MFS Technology Fund:
We have audited the accompanying statement of assets and liabilities of MFS Technology Fund (the Fund) (one of the portfolios comprising MFS Series Trust I), including the portfolio of investments, as of August 31, 2011, and the related statement of operations for the year then ended, the statements of changes in net assets for each of the two years in the period then ended, and the financial highlights for each of the five years in the period then ended. These financial statements and financial highlights are the responsibility of the Fund’s management. Our responsibility is to express an opinion on these financial statements and financial highlights based on our audits.
We conducted our audits in accordance with the standards of the Public Company Accounting Oversight Board (United States). Those standards require that we plan and perform the audit to obtain reasonable assurance about whether the financial statements and financial highlights are free of material misstatement. We were not engaged to perform an audit of the Fund’s internal control over financial reporting. Our audits included consideration of internal control over financial reporting as a basis for designing audit procedures that are appropriate in the circumstances, but not for the purpose of expressing an opinion on the effectiveness of the Fund’s internal control over financial reporting. Accordingly, we express no such opinion. An audit also includes examining, on a test basis, evidence supporting the amounts and disclosures in the financial statements and financial highlights, assessing the accounting principles used and significant estimates made by management, and evaluating the overall financial statement presentation. Our procedures included confirmation of securities owned as of August 31, 2011, by correspondence with the custodian and brokers or by other appropriate auditing procedures where replies from brokers were not received. We believe that our audits provide a reasonable basis for our opinion.
In our opinion, the financial statements and financial highlights referred to above present fairly, in all material respects, the financial position of the MFS Technology Fund at August 31, 2011, the results of its operations for the year then ended, the changes in its net assets for each of the two years in the period then ended, and its financial highlights for each of the five years in the period then ended, in conformity with U.S. generally accepted accounting principles.

Boston, Massachusetts
October 17, 2011
37
TRUSTEES AND OFFICERS —
IDENTIFICATION AND BACKGROUND
The Trustees and officers of the Trust, as of October 1, 2011, are listed below, together with their principal occupations during the past five years. (Their titles may have varied during that period.) The address of each Trustee and officer is 500 Boylston Street, Boston, Massachusetts 02116.
| | | | | | | | |
Name, Age | | Position(s) Held with Fund | | Trustee/Officer
Since (h) | | Principal Occupations
During the Past Five Years | | Other
Directorships (j) |
| INTERESTED TRUSTEES |
Robert J. Manning (k)
(age 47) | | Trustee | | February 2004 | | Massachusetts Financial Services Company, Chairman, Chief Executive Officer and Director; President (until December 2009); Chief Investment Officer (until July 2010) | | |
Robert C. Pozen (k)
(age 65) | | Trustee | | February 2004 | | Massachusetts Financial Services Company, Chairman Emeritus; Chairman (until July 2010) | | Medtronic, Inc, (medical devices), Director (since 2004); The Neilsen Company (market research), Director (since 2010); Telesat (satellite communications), Director (until November 2007); Bell Canada Enterprises (telecommunications), Director (until February 2009) |
38
Trustees and Officers – continued
| | | | | | | | |
Name, Age | | Position(s) Held with Fund | | Trustee/Officer
Since (h) | | Principal Occupations
During the Past Five Years | | Other
Directorships (j) |
| INDEPENDENT TRUSTEES |
David H. Gunning
(age 69) | | Trustee and Chair of Trustees | | January 2004 | | Retired; Cleveland-Cliffs Inc. (mining products and service provider), Vice Chairman/Director (until May 2007) | | Lincoln Electric Holdings, Inc. (welding equipment manufacturer), Director; Development Alternatives, Inc. (consulting), Director/Non-Executive Chairman; Portman Limited (mining), Director (until 2008) |
Robert E. Butler
(age 69) | | Trustee | | January 2006 | | Consultant – investment company industry regulatory and compliance matters | | |
Maureen R. Goldfarb
(age 56) | | Trustee | | January 2009 | | Private investor | | |
William R. Gutow
(age 70) | | Trustee | | December 1993 | | Private investor and real estate consultant; Capitol Entertainment Management Company (video franchise), Vice Chairman | | Atlantic Coast Tan (tanning salons), Vice Chairman (until 2007); Texas Donuts (donut franchise), Vice Chairman (until 2010) |
Michael Hegarty
(age 66) | | Trustee | | December 2004 | | Private investor | | |
39
Trustees and Officers – continued
| | | | | | | | |
Name, Age | | Position(s) Held with Fund | | Trustee/Officer
Since (h) | | Principal Occupations
During the Past Five Years | | Other
Directorships (j) |
John P. Kavanaugh
(age 56) | | Trustee | | January 2009 | | Private investor; The Hanover Insurance Group, Inc., Vice President and Chief Investment Officer (until 2006); Allmerica Investment Trust, Allmerica Securities Trust and Opus Investment Trust (investment companies), Chairman, President and Trustee (until 2006) | | |
J. Dale Sherratt
(age 73) | | Trustee | | June 1989 | | Insight Resources, Inc. (acquisition planning specialists), President; Wellfleet Investments (investor in health care companies), Managing General Partner | | |
Laurie J. Thomsen
(age 54) | | Trustee | | March 2005 | | Private investor; New Profit, Inc. (venture philanthropy), Executive Partner (until 2010) | | The Travelers Companies (property and casualty insurance), Director |
Robert W. Uek
(age 70) | | Trustee | | January 2006 | | Consultant to investment company industry | | |
| OFFICERS | | | | | | | | |
Maria F. DiOrioDwyer (k)
(age 52) | | President | | March 2004 | | Massachusetts Financial Services Company, Executive Vice President and Chief Regulatory Officer Chief Compliance Officer (since December 2006) | | |
Christopher R. Bohane (k)
(age 37) | | Assistant Secretary and Assistant Clerk | | July 2005 | | Massachusetts Financial Services Company, Vice President and Senior Counsel | | |
40
Trustees and Officers – continued
| | | | | | | | |
Name, Age | | Position(s) Held with Fund | | Trustee/Officer
Since (h) | | Principal Occupations
During the Past Five Years | | Other
Directorships (j) |
John M. Corcoran (k)
(age 46) | | Treasurer | | October 2008 | | Massachusetts Financial Services Company, Senior Vice President (since October 2008); State Street Bank and Trust (financial services provider), Senior Vice President, (until September 2008) | | |
Ethan D. Corey (k)
(age 47) | | Assistant Secretary and Assistant Clerk | | July 2005 | | Massachusetts Financial Services Company, Senior Vice President and Associate General Counsel | | |
David L. DiLorenzo (k)
(age 43) | | Assistant Treasurer | | July 2005 | | Massachusetts Financial Services Company, Vice President | | |
Timothy M. Fagan (k)
(age 43) | | Assistant Secretary and Assistant Clerk | | September 2005 | | Massachusetts Financial Services Company, Vice President and Senior Counsel | | |
Robyn L. Griffin
(age 36) | | Assistant Independent Chief Compliance Officer | | August 2008 | | Griffin Compliance LLC (provider of compliance services), Principal (since August 2008); State Street Corporation (financial services provider), Mutual Fund Administration Assistant Vice President (October 2006 – July 2008); Liberty Mutual Group (insurance), Personal Market Assistant Controller (April 2006 – October 2006); Deloitte & Touche LLP (professional services firm). | | |
41
Trustees and Officers – continued
| | | | | | | | |
Name, Age | | Position(s) Held with Fund | | Trustee/Officer
Since (h) | | Principal Occupations
During the Past Five Years | | Other
Directorships (j) |
Brian E. Langenfeld (k)
(age 38) | | Assistant Secretary and Assistant Clerk | | June 2006 | | Massachusetts Financial Services Company, Vice President and Senior Counsel | | |
Ellen Moynihan (k)
(age 53) | | Assistant Treasurer | | April 1997 | | Massachusetts Financial Services Company, Senior Vice President | | |
Susan S. Newton (k)
(age 61) | | Assistant Secretary and Assistant Clerk | | May 2005 | | Massachusetts Financial Services Company, Senior Vice President and Associate General Counsel | | |
Susan A. Pereira (k)
(age 40) | | Assistant Secretary and Assistant Clerk | | July 2005 | | Massachusetts Financial Services Company, Vice President and Senior Counsel | | |
Mark N. Polebaum (k)
(age 59) | | Secretary and Clerk | | January 2006 | | Massachusetts Financial Services Company, Executive Vice President, General Counsel and Secretary | | |
Frank L. Tarantino
(age 67) | | Independent Chief Compliance Officer | | June 2004 | | Tarantino LLC (provider of compliance services), Principal | | |
Richard S. Weitzel (k)
(age 41) | | Assistant Secretary and Assistant Clerk | | October 2007 | | Massachusetts Financial Services Company, Vice President and Assistant General Counsel | | |
James O. Yost (k)
(age 51) | | Assistant Treasurer | | September 1990 | | Massachusetts Financial Services Company, Senior Vice President | | |
| (h) | Date first appointed to serve as Trustee/officer of an MFS fund. Each Trustee has served continuously since appointment unless indicated otherwise. For the period from December 15, 2004 until February 22, 2005, Messrs. Pozen and Manning served as Advisory Trustees. For the period March 2008 until October 2008, Ms. DiOrioDwyer served as Treasurer of the Funds. |
42
Trustees and Officers – continued
| (j) | Directorships or trusteeships of companies required to report to the Securities and Exchange Commission (i.e., “public companies”). |
| (k) | “Interested person” of the Trust within the meaning of the Investment Company Act of 1940 (referred to as the 1940 Act), which is the principal federal law governing investment companies like the fund, as a result of position with MFS. The address of MFS is 500 Boylston Street, Boston, Massachusetts 02116. |
Each Trustee has been elected by shareholders and each Trustee and officer holds office until his or her successor is chosen and qualified or until his or her earlier death, resignation, retirement or removal. The Trust does not hold annual meetings for the purpose of electing Trustees, and Trustees are not elected for fixed terms. Messrs. Butler, Kavanaugh, Uek and Ms. Thomsen are members of the Trust’s Audit Committee.
Each of the Fund’s Trustees and officers holds comparable positions with certain other funds of which MFS or a subsidiary is the investment adviser or distributor, and, in the case of the officers, with certain affiliates of MFS. As of January 1, 2011, the Trustees served as board members of 105 funds within the MFS Family of Funds.
The Statement of Additional Information for the Fund includes further information about the Trustees and is available without charge upon request by calling 1-800-225-2606.
| | |
| Investment Adviser | | Custodian |
Massachusetts Financial Services Company
500 Boylston Street, Boston, MA 02116-3741 | | State Street Bank and Trust
1 Lincoln Street, Boston, MA 02111-2900 |
| Distributor | | Independent Registered Public Accounting Firm |
MFS Fund Distributors, Inc.
500 Boylston Street, Boston, MA 02116-3741 | | Ernst & Young LLP 200 Clarendon Street, Boston, MA 02116 |
| Portfolio Manager | | |
Matthew Sabel | | |
43
BOARD REVIEW OF INVESTMENT ADVISORY AGREEMENT
The Investment Company Act of 1940 requires that both the full Board of Trustees and a majority of the non-interested (“independent”) Trustees, voting separately, annually approve the continuation of the Fund’s investment advisory agreement with MFS. The Trustees consider matters bearing on the Fund and its advisory arrangements at their meetings throughout the year, including a review of performance data at each regular meeting. In addition, the independent Trustees met several times over the course of three months beginning in May and ending in July, 2011 (“contract review meetings”) for the specific purpose of considering whether to approve the continuation of the investment advisory agreement for the Fund and the other investment companies that the Board oversees (the “MFS Funds”). The independent Trustees were assisted in their evaluation of the Fund’s investment advisory agreement by independent legal counsel, from whom they received separate legal advice and with whom they met separately from MFS during various contract review meetings. The independent Trustees were also assisted in this process by the MFS Funds’ Independent Chief Compliance Officer, a full-time senior officer appointed by and reporting to the independent Trustees.
In connection with their deliberations regarding the continuation of the investment advisory agreement, the Trustees, including the independent Trustees, considered such information and factors as they believed, in light of the legal advice furnished to them and their own business judgment, to be relevant. The investment advisory agreement for the Fund was considered separately, although the Trustees also took into account the common interests of all MFS Funds in their review. As described below, the Trustees considered the nature, quality, and extent of the various investment advisory, administrative, and shareholder services performed by MFS under the existing investment advisory agreement and other arrangements with the Fund.
In connection with their contract review meetings, the Trustees received and relied upon materials that included, among other items: (i) information provided by Lipper Inc., an independent third party, on the investment performance of the Fund for various time periods ended December 31, 2010 and the investment performance of a group of funds with substantially similar investment classifications/objectives (the “Lipper performance universe”), (ii) information provided by Lipper Inc. on the Fund’s advisory fees and other expenses and the advisory fees and other expenses of comparable funds identified by Lipper Inc. (the “Lipper expense group”), (iii) information provided by MFS on the advisory fees of comparable portfolios of other clients of MFS, including institutional separate accounts and other clients, (iv) information as to whether and to what extent applicable expense waivers,
44
Board Review of Investment Advisory Agreement – continued
reimbursements or fee “breakpoints” are observed for the Fund, (v) information regarding MFS’ financial results and financial condition, including MFS’ and certain of its affiliates’ estimated profitability from services performed for the Fund and the MFS Funds as a whole, and compared to MFS’ institutional business, (vi) MFS’ views regarding the outlook for the mutual fund industry and the strategic business plans of MFS, (vii) descriptions of various functions performed by MFS for the Funds, such as compliance monitoring and portfolio trading practices, and (viii) information regarding the overall organization of MFS, including information about MFS’ senior management and other personnel providing investment advisory, administrative and other services to the Fund and the other MFS Funds. The comparative performance, fee and expense information prepared and provided by Lipper Inc. was not independently verified and the independent Trustees did not independently verify any information provided to them by MFS.
The Trustees’ conclusion as to the continuation of the investment advisory agreement was based on a comprehensive consideration of all information provided to the Trustees and not the result of any single factor. Some of the factors that figured particularly in the Trustees’ deliberations are described below, although individual Trustees may have evaluated the information presented differently from one another, giving different weights to various factors. It is also important to recognize that the fee arrangements for the Fund and other MFS Funds are the result of years of review and discussion between the independent Trustees and MFS, that certain aspects of such arrangements may receive greater scrutiny in some years than in others, and that the Trustees’ conclusions may be based, in part, on their consideration of these same arrangements during the course of the year and in prior years.
Based on information provided by Lipper Inc., the Trustees reviewed the Fund’s total return investment performance as well as the performance of peer groups of funds over various time periods. The Trustees placed particular emphasis on the total return performance of the Fund’s Class A shares in comparison to the performance of funds in its Lipper performance universe over the three-year period ended December 31, 2010, which the Trustees believed was a long enough period to reflect differing market conditions. The total return performance of the Fund’s Class A shares was in the 4th quintile relative to the other funds in the universe for this three-year period (the 1st quintile being the best performers and the 5th quintile being the worst performers). The total return performance of the Fund’s Class A shares was in the 3rd quintile for the one-year period and the 1st quintile for the five-year period ended December 31, 2010 relative to the Lipper performance universe. Because of the passage of time, these performance results are likely to differ
45
Board Review of Investment Advisory Agreement – continued
from the performance results for more recent periods, including those shown elsewhere in this report.
The Trustees expressed concern to MFS about the substandard investment performance of the Fund. In the course of their deliberations, the Trustees took into account information provided by MFS in connection with the contract review meetings, as well as during investment review meetings conducted with portfolio management personnel during the course of the year as to MFS’ efforts to improve the Fund’s performance, including the replacement of the primary portfolio manager in 2010. In addition, the Trustees requested that they receive a separate update on the Fund’s performance at each of their regular meetings. After reviewing these and related factors, the Trustees concluded, within the context of their overall conclusions regarding the investment advisory agreement, that MFS’ responses and efforts and plans to improve investment performance were sufficient to support approval of the continuance of the investment advisory agreement for an additional one-year period, but that they would continue to closely monitor the performance of the Fund.
In assessing the reasonableness of the Fund’s advisory fee, the Trustees considered, among other information, the Fund’s advisory fee and the total expense ratio of the Fund’s Class A shares as a percentage of average daily net assets and the advisory fee and total expense ratios of peer groups of funds based on information provided by Lipper Inc. The Trustees considered that MFS currently observes an expense limitation for the Fund, which may not be changed without the Trustees’ approval. The Trustees also considered that, according to the Lipper data (which takes into account any fee reductions or expense limitations that were in effect during the Fund’s last fiscal year), the Fund’s effective advisory fee rate was lower than the Lipper expense group median, and the Fund’s total expense ratio was approximately at the Lipper expense group median.
The Trustees also considered the advisory fees charged by MFS to institutional accounts. In comparing these fees, the Trustees considered information provided by MFS as to the generally broader scope of services provided by MFS to the Fund in comparison to institutional accounts, the higher demands placed on MFS’ investment personnel and trading infrastructure as a result of the daily cash in-flows and out-flows of the Fund, and the impact on MFS and expenses associated with the more extensive regulatory regime to which the Fund is subject in comparison to institutional accounts.
The Trustees also considered whether the Fund is likely to benefit from any economies of scale in the management of the Fund in the event of growth in assets of the Fund. They noted that the Fund’s advisory fee rate schedule is subject to a contractual breakpoint that reduces the Fund’s advisory fee rate on average daily net assets over $1 billion. The Trustees concluded that the
46
Board Review of Investment Advisory Agreement – continued
existing breakpoint was sufficient to allow the Fund to benefit from economies of scale as its assets grow.
The Trustees also considered information prepared by MFS relating to MFS’ costs and profits with respect to the Fund, the MFS Funds considered as a group, and other investment companies and accounts advised by MFS, as well as MFS’ methodologies used to determine and allocate its costs to the MFS Funds, the Fund and other accounts and products for purposes of estimating profitability.
After reviewing these and other factors described herein, the Trustees concluded, within the context of their overall conclusions regarding the investment advisory agreement, that the advisory fees charged to the Fund represent reasonable compensation in light of the services being provided by MFS to the Fund.
In addition, the Trustees considered MFS’ resources and related efforts to continue to retain, attract and motivate capable personnel to serve the Fund. The Trustees also considered current and developing conditions in the financial services industry, including the presence of large and well-capitalized companies which are spending, and appear to be prepared to continue to spend, substantial sums to engage personnel and to provide services to competing investment companies. In this regard, the Trustees also considered the financial resources of MFS and its ultimate parent, Sun Life Financial Inc. The Trustees also considered the advantages and possible disadvantages to the Fund of having an adviser that also serves other investment companies as well as other accounts.
The Trustees also considered the nature, quality, cost, and extent of administrative, transfer agency, and distribution services provided to the Fund by MFS and its affiliates under agreements and plans other than the investment advisory agreement, including any 12b-1 fees the Fund pays to MFS Fund Distributors, Inc., an affiliate of MFS. The Trustees also considered the nature, extent and quality of certain other services MFS performs or arranges for on the Fund’s behalf, which may include securities lending programs, directed expense payment programs, class action recovery programs, and MFS’ interaction with third-party service providers, principally custodians and sub-custodians. The Trustees concluded that the various non-advisory services provided by MFS and its affiliates on behalf of the Fund were satisfactory.
The Trustees also considered benefits to MFS from the use of the Fund’s portfolio brokerage commissions, if applicable, to pay for investment research, and various other factors. Additionally, the Trustees considered so-called “fall-out benefits” to MFS such as reputational value derived from serving as investment manager to the Fund.
Based on their evaluation of factors that they deemed to be material, including those factors described above, the Board of Trustees, including a majority of
47
Board Review of Investment Advisory Agreement – continued
the independent Trustees, concluded that the Fund’s investment advisory agreement with MFS should be continued for an additional one-year period, commencing August 1, 2011.
A discussion regarding the Board’s most recent review and renewal of the fund’s Investment Advisory Agreement with MFS will be available on or about November 1, 2011 by clicking on the fund’s name under “Mutual Funds” in the “Products and Performance” section of the MFS Web site (mfs.com).
48
PROXY VOTING POLICIES AND INFORMATION
A general description of the MFS funds’ proxy voting policies and procedures is available without charge, upon request, by calling
1-800-225-2606, by visiting the Proxy Voting section of mfs.com or by visiting the SEC’s Web site at http://www.sec.gov.
Information regarding how the fund voted proxies relating to portfolio securities during the most recent twelve-month period ended June 30 is available without charge by visiting the Proxy Voting section of mfs.com or by visiting the SEC’s Web site at http://www.sec.gov.
QUARTERLY PORTFOLIO DISCLOSURE
The fund will file a complete schedule of portfolio holdings with the Securities and Exchange Commission (the Commission) for the first and third quarters of each fiscal year on Form N-Q. The fund’s Form N-Q may be reviewed and copied at the:
Public Reference Room
Securities and Exchange Commission
100 F Street, NE, Room 1580
Washington, D.C. 20549
Information on the operation of the Public Reference Room may be obtained by calling the Commission at 1-800-SEC-0330. The fund’s Form N-Q is available on the EDGAR database on the Commission’s Internet Web site at http://www.sec.gov, and copies of this information may be obtained, upon payment of a duplicating fee, by electronic request at the following e-mail address: publicinfo@sec.gov or by writing the Public Reference Section at the above address.
A shareholder can also obtain the quarterly portfolio holdings report at mfs.com.
FURTHER INFORMATION
From time to time, MFS may post important information about the fund or the MFS funds on the MFS web site (mfs.com). This information is available by visiting the “News & Commentary” section of mfs.com or by clicking on the fund’s name under “Mutual Funds” in the “Products and Performance” section of mfs.com.
FEDERAL TAX INFORMATION (unaudited)
The fund will notify shareholders of amounts for use in preparing 2011 income
tax forms in January 2012.
49
rev. 3/11
| | | | |
| FACTS | | WHAT DOES MFS DO WITH YOUR PERSONAL INFORMATION? | |  |
| | |
| Why? | | Financial companies choose how they share your personal information. Federal law gives consumers the right to limit some but not all sharing. Federal law also requires us to tell you how we collect, share, and protect your personal information. Please read this notice carefully to understand what we do. |
| | |
| What? | | The types of personal information we collect and share depend on the product or service you have with us. This information can include: •Social Security number and account balances •Account transactions and transaction history •Checking account information and wire transfer instructions When you are no longer our customer, we continue to share your information as described in this notice. |
| | |
| How? | | All financial companies need to share customers’ personal information to run their everyday business. In the section below, we list the reasons financial companies can share their customers’ personal information; the reasons MFS chooses to share; and whether you can limit this sharing. |
| | | | |
| Reasons we can share your personal information | | Does MFS share? | | Can you limit
this sharing? |
For our everyday business purposes – such as to process your transactions, maintain your account(s), respond to court orders and legal investigations, or report to credit bureaus | | Yes | | No |
For our marketing purposes – to offer our products and services to you | | No | | We don’t share |
| For joint marketing with other financial companies | | No | | We don’t share |
For our affiliates’ everyday business purposes – information about your transactions and experiences | | No | | We don’t share |
For our affiliates’ everyday business purposes – information about your creditworthiness | | No | | We don’t share |
| For nonaffiliates to market to you | | No | | We don’t share |
| | |
| Questions? | | Call 800-225-2606 or go to mfs.com. |
50
| | |
| Who we are |
| Who is providing this notice? | | MFS Funds, MFS Investment Management, MFS Institutional Advisors, Inc., MFS Fund Distributors, Inc., MFS Heritage Trust Company, and MFS Service Center, Inc. |
| | |
| What we do |
| How does MFS protect my personal information? | | To protect your personal information from unauthorized access and use, we use security measures that comply with federal law. These measures include procedural, electronic, and physical safeguards for the protection of the personal information we collect about you. |
How does MFS
collect my personal information? | | We collect your personal information, for example, when you •open an account or provide account information •direct us to buy securities or direct us to sell your securities •make a wire transfer We also collect your personal information from others, such as credit bureaus, affiliates and other companies. |
| Why can’t I limit all sharing? | | Federal law gives you the right to limit only •sharing for affiliates’ everyday business purposes – information about your creditworthiness •affiliates from using your information to market to you •sharing for nonaffiliates to market to you State laws and individual companies may give you additional rights to limit sharing. |
| | |
| Definitions |
| Affiliates | | Companies related by common ownership or control. They can be financial and nonfinancial companies. •MFS does not share personal information with affiliates, except for everyday business purposes as described on page one of this notice. |
| Nonaffiliates | | Companies not related by common ownership or control. They can be financial and nonfinancial companies. •MFS does not share with nonaffiliates so they can market to you. |
| Joint Marketing | | A formal agreement between nonaffiliated financial companies that together market financial products or services to you. •MFS doesn’t jointly market. |
| | |
| Other important information |
| If you own an MFS product or receive an MFS service in the name of a third party such as a bank or broker-dealer, their privacy policy may apply to you instead of ours. |
51
Save paper with eDelivery.
MFS® will send you prospectuses, reports, and proxies directly via e-mail so you will get information faster with less mailbox clutter.
To sign up:
1. Go to mfs.com.
2. Log in via MFS® Access.
3. Select eDelivery.
If you own your MFS fund shares through a financial institution or a retirement plan, MFS® TALK, MFS® Access, or eDelivery may not be available to you.

Web site
mfs.com
MFS TALK
1-800-637-8255
24 hours a day
Account service and literature
Shareholders
1-800-225-2606
Financial advisors
1-800-343-2829
Retirement plan services
1-800-637-1255
Mailing address
MFS Service Center, Inc.
P.O. Box 55824
Boston, MA 02205-5824
Overnight mail
MFS Service Center, Inc.
c/o Boston Financial Data Services
30 Dan Road
Canton, MA 02021-2809

MFS® Value Fund

ANNUAL REPORT
August 31, 2011
EIF-ANN
MFS® VALUE FUND
SIPC Contact Information: You may obtain information about the Securities Investor Protection Corporation (“SIPC”), including the SIPC Brochure, by contacting SIPC either by telephone (1-202-371-8300) or by accessing SIPC’s web site address (www.sipc.org).
The report is prepared for the general information of shareholders.
It is authorized for distribution to prospective investors only when preceded or accompanied by a current prospectus.
NOT FDIC INSURED Ÿ MAY LOSE VALUE Ÿ NO BANK GUARANTEE

LETTER FROM THE CEO
Dear Shareholders:
We are indeed living through some volatile times. Economic uncertainty is everywhere, as it seems no place in the world has been unmoved by crisis this year. We have seen a devastating earthquake and tsunami that have led to disruptions in the Japanese markets and supply chains. Protests have changed the face of the Middle East and left in their wake lingering tensions and resultant higher oil prices. We have seen debt limits tested in Europe and the United States and policymakers grappling to craft often unpopular monetary and fiscal responses at a time when consumers and businesses struggle with what appears to be a slowing global economy. On top of all of that, we have seen long-term U.S. debt lose its Standard & Poor’s AAA rating.
When markets become volatile, managing risk becomes a top priority for investors and their advisors. At MFS® risk management is foremost in our minds in all market climates. Our analysts and portfolio managers keep risks firmly in mind when evaluating securities. Additionally, we have a team of quantitative analysts that measures and assesses the risk profiles of our portfolios and securities on an ongoing basis. The chief investment risk officer, who oversees the team, reports directly to the firm’s president and chief investment officer so the risk associated with each portfolio can be assessed objectively and independently of the portfolio management team.
As always, we continue to be mindful of the many economic challenges faced at the local, national, and international levels. It is in times such as these that we want to remind investors of the merits of maintaining a long-term view, adhering to basic investing principles such as asset allocation and diversification, and working closely with their advisors to research and identify appropriate investment opportunities.
Respectfully,

Robert J. Manning
Chairman and Chief Executive Officer
MFS Investment Management®
October 17, 2011
The opinions expressed in this letter are subject to change, may not be relied upon for investment advice, and no forecasts can be guaranteed.
1
PORTFOLIO COMPOSITION
Portfolio structure

| | | | |
| Top ten holdings | | | | |
| Philip Morris International, Inc. | | | 3.9% | |
| Lockheed Martin Corp. | | | 3.6% | |
| Johnson & Johnson | | | 3.0% | |
| JPMorgan Chase & Co. | | | 2.9% | |
| Goldman Sachs Group, Inc. | | | 2.8% | |
| AT&T, Inc. | | | 2.8% | |
| Pfizer, Inc. | | | 2.5% | |
| Chevron Corp. | | | 2.3% | |
| International Business Machines Corp. | | | 2.3% | |
| United Technologies Corp. | | | 2.2% | |
| | | | |
| Equity sectors | | | | |
| Financial Services | | | 21.1% | |
| Health Care | | | 13.3% | |
| Consumer Staples | | | 12.5% | |
| Industrial Goods & Services | | | 11.1% | |
| Energy | | | 8.5% | |
| Technology | | | 6.5% | |
| Utilities & Communications | | | 6.3% | |
| Leisure | | | 5.5% | |
| Basic Materials | | | 3.6% | |
| Retailing | | | 3.5% | |
| Autos & Housing | | | 3.1% | |
| Special Products & Services | | | 2.9% | |
| Transportation | | | 0.6% | |
Percentages are based on net assets as of 8/31/11.
The portfolio is actively managed and current holdings may be different.
2
MANAGEMENT REVIEW
Summary of Results
For the twelve months ended August 31, 2011, Class A shares of the MFS Value Fund (the “fund”) provided a total return of 13.78%, at net asset value. This compares with a return of 14.37% for the fund’s benchmark, the Russell 1000 Value Index.
Market Environment
Early in the period, the U.S. Federal Reserve (the Fed) indicated that further monetary loosening would be forthcoming if macroeconomic activity did not show signs of improvement. The prospects for, and subsequent implementation of, more easing by the Fed improved market sentiment and drove risk-asset prices markedly higher. The December agreement on a surprisingly large (relative to expectations) expansionary U.S. fiscal package also boosted sentiment. During the subsequent several months, the renewed positive market sentiment, coupled with better indications of global macroeconomic activity, pushed many asset valuations to post-crisis highs. At the same time, global sovereign bond yields rose amidst the more “risk-seeking” environment.
However, towards the middle of the period, a weakening macroeconomic backdrop and renewed concerns over Greek debt sustainability began to challenge equity valuations and pushed sovereign bond yields lower. Towards the end of the reporting period, uncertainty in financial markets continued to increase. European policy makers debated and disagreed over elements of a new Greek bailout package, while Spanish and Italian bond yields increased markedly signaling a widening European crisis. In the U.S., concerns about sovereign debt default and the long term sustainability of the trend in U.S. fiscal policy resulted in one agency downgrading U.S. credit quality. Amidst this turmoil, global equity markets declined sharply. As a result of these developments, global consumer and producer sentiment indicators fell precipitously, highly-rated sovereign bond yields hit multi-decade lows and, despite a more mixed picture emanating from the “hard” data, markets grew increasingly worried about a return to global recession.
Detractors from Performance
Stock selection in the utilities & communications sector dampened returns relative to the Russell 1000 Value Index. Not holding telecommunications provider Verizon Communications, which outperformed the benchmark over the reporting period, and an overweight position in utility company PG&E, held back relative results. Shares of PG&E declined as the company made negative headlines for not being able to provide documentation on safety
3
Management Review – continued
pressure tests that should have been performed on approximately 150 miles of pipeline. Last fall, a pipe of similar characteristics exploded, causing significant damage.
Stock selection in the energy sector was another negative factor for relative performance. Not holding strong-performing oil and gas companies, Anadarko Petroleum and ConocoPhillips, hindered relative results.
Stocks in other sectors that detracted from relative performance included investment banking firm Goldman Sachs, global financial services provider Bank of New York Mellon, network equipment company Cisco Systems, and insurance company MetLife. Shares of MetLife came under pressure early in the period on the back of its equity capital raise to fund its acquisition of AIG’s international insurance operations. As the period progressed, its shares were further hampered by the tragic events in Japan as the company has direct exposure to the country and general turmoil in the financial services sector resulting from the escalating European sovereign debt crisis. Not holding health insurance provider UnitedHealth Group also weakened relative results as this stock significantly outperformed the benchmark over the reporting period.
The fund’s cash position was another detractor from relative performance. The fund holds cash to buy new holdings and to provide liquidity. In a period when equity markets rose, as measured by the fund’s benchmark, holding cash hurt performance versus the benchmark, which has no cash position.
Contributors to Performance
A combination of an overweight position and stock selection in the consumer staples sector boosted relative performance. An overweight position in tobacco company Philip Morris International aided relative returns as this stock outperformed the benchmark over the reporting period.
Stock selection in the special products & services sector also benefited relative results. Holdings of strong-performing global consulting and outsourcing company Accenture (b) were among the fund’s top relative contributors over the reporting period. Throughout the period, Accenture reported better-than-expected financial results with revenues, margins, earnings, and cash flows all exceeding investor expectations which pushed its shares up strongly ahead of the market. Additionally, shares of the company continued to rise after Standard & Poor’s announced that Accenture would be one of a handful of non-U.S. domiciled companies added to the S&P 500 Index.
An underweight position in the financial services sector was an additional positive factor for relative performance, led by the fund’s avoidance of poor-performing insurance and investment company Berkshire Hathaway and financial services firm Citigroup. Holdings of debit and credit transaction processing company MasterCard (b) also bolstered relative performance as this
4
Management Review – continued
stock significantly outperformed the benchmark over the reporting period. Shares of MasterCard rose as the company reported better-than-expected earnings driven by momentum in cross-border demand, increased emerging market opportunities, and strong volume trends. Management’s continued focus on repurchasing $1 billion of Class A shares further supported performance. Additionally, shares of MasterCard reacted strongly to better-than-expected news coming out of a Federal Reserve commission meeting on June 29th which set the interchange rates, or the fees that MasterCard and other banks can charge merchants when consumers pay for goods with debit cards, at much higher-than-expected levels.
Elsewhere, top relative contributors included diversified technology products and services company IBM (b), enterprise software products maker Oracle (b), oil and gas drilling equipment manufacturer National Oilwell Varco (h), and global integrated energy company Hess. The fund’s underweight position in pharmaceutical company Merck also benefited relative performance.
Currency exposure was another contributor to the fund’s relative performance. All of MFS’ investment decisions are driven by the fundamentals of each individual opportunity and, as such, it is common for our funds to have different currency exposure than the benchmark.
Respectfully,
| | |
| Nevin Chitkara | | Steven Gorham |
| Portfolio Manager | | Portfolio Manager |
| (b) | Security is not a benchmark constituent. |
| (h) | Security was not held in the portfolio at period end. |
The views expressed in this report are those of the portfolio managers only through the end of the period of the report as stated on the cover and do not necessarily reflect the views of MFS or any other person in the MFS organization. These views are subject to change at any time based on market or other conditions, and MFS disclaims any responsibility to update such views. These views may not be relied upon as investment advice or an indication of trading intent on behalf of any MFS portfolio. References to specific securities are not recommendations of such securities, and may not be representative of any MFS portfolio’s current or future investments.
5
PERFORMANCE SUMMARY THROUGH 8/31/11
The following chart illustrates a representative class of the fund’s historical performance in comparison to its benchmark(s). Performance results include the deduction of the maximum applicable sales charge and reflect the percentage change in net asset value, including reinvestment of dividends and capital gains distributions. The performance of other share classes will be greater than or less than that of the class depicted below. Benchmarks are unmanaged and may not be invested in directly. Benchmark returns do not reflect sales charges, commissions or expenses. (See Notes to Performance Summary.)
Performance data shown represents past performance and is no guarantee of future results. Investment return and principal value fluctuate so your shares, when sold, may be worth more or less than the original cost; current performance may be lower or higher than quoted. The performance shown does not reflect the deduction of taxes, if any, that a shareholder would pay on fund distributions or the redemption of fund shares.
Growth of a Hypothetical $10,000 Investment
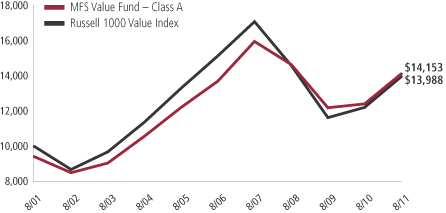
6
Performance Summary – continued
Total Returns through 8/31/11
Average annual without sales charge
| | | | | | | | | | | | | | |
| | | Share class | | Class inception date | | 1-yr | | 5-yr | | 10-Yr | | Life (t) | | |
| | | A | | 1/02/96 | | 13.78% | | 0.60% | | 4.15% | | N/A | | |
| | | B | | 11/04/97 | | 12.92% | | (0.11)% | | 3.44% | | N/A | | |
| | | C | | 11/05/97 | | 12.97% | | (0.10)% | | 3.44% | | N/A | | |
| | | I | | 1/02/97 | | 14.10% | | 0.90% | | 4.48% | | N/A | | |
| | | W | | 5/01/06 | | 13.96% | | 0.80% | | N/A | | 0.95% | | |
| | | R1 | | 4/01/05 | | 12.95% | | (0.14)% | | N/A | | 1.95% | | |
| | | R2 | | 10/31/03 | | 13.51% | | 0.36% | | N/A | | 5.01% | | |
| | | R3 | | 4/01/05 | | 13.82% | | 0.61% | | N/A | | 2.71% | | |
| | | R4 | | 4/01/05 | | 14.05% | | 0.87% | | N/A | | 2.98% | | |
| | | 529A | | 7/31/02 | | 13.71% | | 0.45% | | N/A | | 5.78% | | |
| | | 529B | | 7/31/02 | | 12.84% | | (0.26)% | | N/A | | 5.08% | | |
| | | 529C | | 7/31/02 | | 12.82% | | (0.26)% | | N/A | | 5.08% | | |
| Comparative benchmark | | | | | | | | | | |
| | | Russell 1000 Value Index (f) | | 14.37% | | (1.62)% | | 3.41% | | N/A | | |
| Average annual with sales charge | | | | | | | | | | |
| | | A
With Initial Sales Charge (5.75%) | | 7.24% | | (0.58)% | | 3.53% | | N/A | | |
| | | B
With CDSC (Declining over six years from 4% to 0%) (x) | | 8.92% | | (0.46)% | | 3.44% | | N/A | | |
| | | C
With CDSC (1% for 12 months) (x) | | 11.97% | | (0.10)% | | 3.44% | | N/A | | |
| | | 529A
With Initial Sales Charge (5.75%) | | 7.17% | | (0.74)% | | N/A | | 5.09% | | |
| | | 529B
With CDSC (Declining over six years from 4% to 0%) (x) | | 8.84% | | (0.61)% | | N/A | | 5.08% | | |
| | | 529C
With CDSC (1% for 12 months) (x) | | 11.82% | | (0.26)% | | N/A | | 5.08% | | |
Class I, W, R1, R2, R3, and R4 shares do not have a sales charge.
CDSC – Contingent Deferred Sales Charge.
| (f) | Source: FactSet Research Systems, Inc. |
| (t) | For the period from the class inception date through the stated period end (for those share classes with less than 10 years of performance history). No comparative benchmark performance information is provided for “life” periods. (See Notes to Performance Summary.) |
| (x) | Assuming redemption at the end of the applicable period. |
7
Performance Summary – continued
Benchmark Definition
Russell 1000 Value Index – constructed to provide a comprehensive barometer for the value securities in the large-cap segment of the U.S. equity universe. Companies in this index generally have lower price-to-book ratios and lower forecasted growth values.
It is not possible to invest directly in an index.
Notes to Performance Summary
Average annual total return represents the average annual change in value for each share class for the periods presented. Life returns are presented where the share class has less than 10 years of performance history and represent the average annual total return from the class inception date to the stated period end date. As the fund’s share classes may have different inception dates, the life returns may represent different time periods and may not be comparable. As a result, no comparative benchmark performance information is provided for life periods.
Performance results reflect any applicable expense subsidies and waivers in effect during the periods shown. Without such subsidies and waivers the fund’s performance results would be less favorable. Please see the prospectus and financial statements for complete details.
Performance results do not include adjustments made for financial reporting purposes in accordance with U.S. generally accepted accounting principles and may differ from amounts reported in the financial highlights.
From time to time the fund may receive proceeds from litigation settlements, without which performance would be lower.
8
EXPENSE TABLE
Fund expenses borne by the shareholders during the period,
March 1, 2011 through August 31, 2011
As a shareholder of the fund, you incur two types of costs: (1) transaction costs, including sales charges (loads) on certain purchase or redemption payments, and (2) ongoing costs, including management fees; distribution and service (12b-1) fees; and other fund expenses. This example is intended to help you understand your ongoing costs (in dollars) of investing in the fund and to compare these costs with the ongoing costs of investing in other mutual funds.
The example is based on an investment of $1,000 invested at the beginning of the period and held for the entire period March 1, 2011 through August 31, 2011.
The expenses include the payment of a portion of the transfer-agent-related expenses of MFS funds that invest in the fund. For further information, please see the Notes to the Financial Statements.
Actual Expenses
The first line for each share class in the following table provides information about actual account values and actual expenses. You may use the information in this line, together with the amount you invested, to estimate the expenses that you paid over the period. Simply divide your account value by $1,000 (for example, an $8,600 account value divided by $1,000 = 8.6), then multiply the result by the number in the first line under the heading entitled “Expenses Paid During Period” to estimate the expenses you paid on your account during this period.
Hypothetical Example for Comparison Purposes
The second line for each share class in the following table provides information about hypothetical account values and hypothetical expenses based on the fund’s actual expense ratio and an assumed rate of return of 5% per year before expenses, which is not the fund’s actual return. The hypothetical account values and expenses may not be used to estimate the actual ending account balance or expenses you paid for the period. You may use this information to compare the ongoing costs of investing in the fund and other funds. To do so, compare this 5% hypothetical example with the 5% hypothetical examples that appear in the shareholder reports of the other funds.
Please note that the expenses shown in the table are meant to highlight your ongoing costs only and do not reflect any transactional costs, such as sales charges (loads). Therefore, the second line for each share class in the table is useful in comparing ongoing costs only, and will not help you determine the relative total costs of owning different funds. In addition, if these transactional costs were included, your costs would have been higher.
9
Expense Table – continued
| | | | | | | | | | | | | | | | | | |
Share
Class | | | | Annualized Expense Ratio | | | Beginning Account Value 3/01/11 | | | Ending Account Value 8/31/11 | | | Expenses Paid During Period (p) 3/01/11-8/31/11 | |
| A | | Actual | | | 0.93% | | | | $1,000.00 | | | | $912.89 | | | | $4.48 | |
| | Hypothetical (h) | | | 0.93% | | | | $1,000.00 | | | | $1,020.52 | | | | $4.74 | |
| B | | Actual | | | 1.68% | | | | $1,000.00 | | | | $909.29 | | | | $8.08 | |
| | Hypothetical (h) | | | 1.68% | | | | $1,000.00 | | | | $1,016.74 | | | | $8.54 | |
| C | | Actual | | | 1.68% | | | | $1,000.00 | | | | $909.61 | | | | $8.09 | |
| | Hypothetical (h) | | | 1.68% | | | | $1,000.00 | | | | $1,016.74 | | | | $8.54 | |
| I | | Actual | | | 0.69% | | | | $1,000.00 | | | | $914.39 | | | | $3.33 | |
| | Hypothetical (h) | | | 0.69% | | | | $1,000.00 | | | | $1,021.73 | | | | $3.52 | |
| W | | Actual | | | 0.78% | | | | $1,000.00 | | | | $913.47 | | | | $3.76 | |
| | Hypothetical (h) | | | 0.78% | | | | $1,000.00 | | | | $1,021.27 | | | | $3.97 | |
| R1 | | Actual | | | 1.68% | | | | $1,000.00 | | | | $909.48 | | | | $8.09 | |
| | Hypothetical (h) | | | 1.68% | | | | $1,000.00 | | | | $1,016.74 | | | | $8.54 | |
| R2 | | Actual | | | 1.18% | | | | $1,000.00 | | | | $911.98 | | | | $5.69 | |
| | Hypothetical (h) | | | 1.18% | | | | $1,000.00 | | | | $1,019.26 | | | | $6.01 | |
| R3 | | Actual | | | 0.93% | | | | $1,000.00 | | | | $913.11 | | | | $4.48 | |
| | Hypothetical (h) | | | 0.93% | | | | $1,000.00 | | | | $1,020.52 | | | | $4.74 | |
| R4 | | Actual | | | 0.68% | | | | $1,000.00 | | | | $914.04 | | | | $3.28 | |
| | Hypothetical (h) | | | 0.68% | | | | $1,000.00 | | | | $1,021.78 | | | | $3.47 | |
| 529A | | Actual | | | 1.02% | | | | $1,000.00 | | | | $912.42 | | | | $4.92 | |
| | Hypothetical (h) | | | 1.02% | | | | $1,000.00 | | | | $1,020.06 | | | | $5.19 | |
| 529B | | Actual | | | 1.77% | | | | $1,000.00 | | | | $909.20 | | | | $8.52 | |
| | Hypothetical (h) | | | 1.77% | | | | $1,000.00 | | | | $1,016.28 | | | | $9.00 | |
| 529C | | Actual | | | 1.77% | | | | $1,000.00 | | | | $909.38 | | | | $8.52 | |
| | Hypothetical (h) | | | 1.77% | | | | $1,000.00 | | | | $1,016.28 | | | | $9.00 | |
| (h) | 5% class return per year before expenses. |
| (p) | Expenses paid is equal to each class’ annualized expense ratio, as shown above, multiplied by the average account value over the period, multiplied by the number of days in the period, divided by the number of days in the year. Expenses paid do not include any applicable sales charges (loads). If these transaction costs had been included, your costs would have been higher. |
Expense Changes Impacting the Table
Changes to the fund’s fee arrangements occurred during the six month period. Had these fee changes been in effect throughout the entire six month period, the annualized expense ratios would have been 0.98%, 1.73%, and 1.73% for Classes 529A, 529B, and 529C, respectively; the actual expenses paid during the period would have been approximately $4.72, $8.33, and $8.33 for Classes 529A, 529B, and 529C respectively; and the hypothetical expenses paid during the period would have been
10
Expense Table – continued
approximately $4.99, $8.79, and $8.79 for Classes 529A, 529B, and 529C, respectively. For further information about the fund’s fee arrangements and changes to those fee arrangements, please see Note 3 in the Notes to Financial Statements.
11
PORTFOLIO OF INVESTMENTS
8/31/11
The Portfolio of Investments is a complete list of all securities owned by your fund. It is categorized by broad-based asset classes.
| | | | | | | | |
| Common Stocks - 98.4% | | | | | | | | |
| Issuer | | Shares/Par | | | Value ($) | |
| | | | | | | | |
| Aerospace - 8.6% | | | | | | | | |
| Honeywell International, Inc. | | | 5,027,680 | | | $ | 240,373,382 | |
| Huntington Ingalls Industries, Inc. (a) | | | 560,060 | | | | 16,768,196 | |
| Lockheed Martin Corp. | | | 7,846,057 | | | | 582,098,969 | |
| Northrop Grumman Corp. | | | 3,299,225 | | | | 180,203,670 | |
| United Technologies Corp. | | | 4,873,827 | | | | 361,881,655 | |
| | | | | | | | |
| | | | | | | $ | 1,381,325,872 | |
| Alcoholic Beverages - 1.6% | | | | | | | | |
| Diageo PLC | | | 13,001,418 | | | $ | 261,704,535 | |
| | |
| Automotive - 1.0% | | | | | | | | |
| General Motors Co. (a) | | | 1,484,520 | | | $ | 35,673,016 | |
| Johnson Controls, Inc. | | | 4,177,605 | | | | 133,182,047 | |
| | | | | | | | |
| | | | | | | $ | 168,855,063 | |
| Broadcasting - 3.4% | | | | | | | | |
| Omnicom Group, Inc. | | | 3,976,140 | | | $ | 161,232,477 | |
| Viacom, Inc., “B” | | | 3,323,440 | | | | 160,322,746 | |
| Walt Disney Co. | | | 6,720,467 | | | | 228,899,106 | |
| | | | | | | | |
| | | | | | | $ | 550,454,329 | |
| Brokerage & Asset Managers - 0.9% | | | | | | | | |
| Blackrock, Inc. | | | 844,172 | | | $ | 139,077,337 | |
| | |
| Business Services - 2.9% | | | | | | | | |
| Accenture PLC, “A” | | | 5,632,390 | | | $ | 301,839,780 | |
| Dun & Bradstreet Corp. | | | 1,240,515 | | | | 82,978,048 | |
| Western Union Co. | | | 5,313,210 | | | | 87,774,229 | |
| | | | | | | | |
| | | | | | | $ | 472,592,057 | |
| Cable TV - 0.5% | | | | | | | | |
| Comcast Corp., “Special A” | | | 3,759,200 | | | $ | 79,544,672 | |
| | |
| Chemicals - 2.6% | | | | | | | | |
| 3M Co. | | | 2,774,693 | | | $ | 230,244,025 | |
| PPG Industries, Inc. | | | 2,406,017 | | | | 184,276,842 | |
| | | | | | | | |
| | | | | | | $ | 414,520,867 | |
| Computer Software - 1.9% | | | | | | | | |
| Oracle Corp. | | | 10,892,263 | | | $ | 305,745,822 | |
12
Portfolio of Investments – continued
| | | | | | | | |
| Issuer | | Shares/Par | | | Value ($) | |
| | | | | | | | |
| Common Stocks - continued | | | | | | | | |
| Computer Software - Systems - 2.7% | | | | | | | | |
| Hewlett-Packard Co. | | | 2,603,510 | | | $ | 67,769,365 | |
| International Business Machines Corp. | | | 2,141,412 | | | | 368,130,137 | |
| | | | | | | | |
| | | | | | | $ | 435,899,502 | |
| Construction - 2.1% | | | | | | | | |
| Pulte Homes, Inc. (a) | | | 4,486,855 | | | $ | 21,536,904 | |
| Sherwin-Williams Co. | | | 1,930,785 | | | | 146,237,656 | |
| Stanley Black & Decker, Inc. | | | 2,644,929 | | | | 163,932,699 | |
| | | | | | | | |
| | | | | | | $ | 331,707,259 | |
| Consumer Products - 0.7% | | | | | | | | |
| Avon Products, Inc. | | | 1,409,580 | | | $ | 31,800,125 | |
| Procter & Gamble Co. | | | 1,321,939 | | | | 84,181,076 | |
| | | | | | | | |
| | | | | | | $ | 115,981,201 | |
| Electrical Equipment - 1.7% | | | | | | | | |
| Danaher Corp. | | | 3,983,530 | | | $ | 182,485,509 | |
| Tyco International Ltd. | | | 2,092,640 | | | | 87,011,971 | |
| | | | | | | | |
| | | | | | | $ | 269,497,480 | |
| Electronics - 1.2% | | | | | | | | |
| ASML Holding N.V. | | | 1,668,600 | | | $ | 58,851,522 | |
| Intel Corp. | | | 7,016,367 | | | | 141,239,468 | |
| | | | | | | | |
| | | | | | | $ | 200,090,990 | |
| Energy - Independent - 3.4% | | | | | | | | |
| Apache Corp. | | | 2,124,410 | | | $ | 218,962,939 | |
| EOG Resources, Inc. | | | 913,880 | | | | 84,616,149 | |
| Occidental Petroleum Corp. | | | 2,880,282 | | | | 249,835,661 | |
| | | | | | | | |
| | | | | | | $ | 553,414,749 | |
| Energy - Integrated - 4.5% | | | | | | | | |
| Chevron Corp. | | | 3,749,694 | | | $ | 370,882,234 | |
| Exxon Mobil Corp. | | | 3,546,285 | | | | 262,566,941 | |
| Hess Corp. | | | 1,527,520 | | | | 90,643,037 | |
| | | | | | | | |
| | | | | | | $ | 724,092,212 | |
| Engineering - Construction - 0.2% | | | | | | | | |
| Fluor Corp. | | | 504,910 | | | $ | 30,658,135 | |
| | |
| Food & Beverages - 5.0% | | | | | | | | |
| General Mills, Inc. | | | 6,857,020 | | | $ | 259,949,628 | |
| J.M. Smucker Co. | | | 634,927 | | | | 45,771,887 | |
| Kellogg Co. | | | 1,995,231 | | | | 108,380,948 | |
13
Portfolio of Investments – continued
| | | | | | | | |
| Issuer | | Shares/Par | | | Value ($) | |
| | | | | | | | |
| Common Stocks - continued | | | | | | | | |
| Food & Beverages - continued | | | | | | | | |
| Nestle S.A. | | | 3,565,483 | | | $ | 220,826,775 | |
| PepsiCo, Inc. | | | 2,746,913 | | | | 176,983,605 | |
| | | | | | | | |
| | | | | | | $ | 811,912,843 | |
| Food & Drug Stores - 0.7% | | | | | | | | |
| CVS Caremark Corp. | | | 2,998,182 | | | $ | 107,664,716 | |
| | |
| General Merchandise - 1.9% | | | | | | | | |
| Kohl’s Corp. | | | 1,204,200 | | | $ | 55,802,628 | |
| Target Corp. | | | 4,695,580 | | | | 242,620,619 | |
| | | | | | | | |
| | | | | | | $ | 298,423,247 | |
| Insurance - 7.2% | | | | | | | | |
| ACE Ltd. | | | 2,164,230 | | | $ | 139,765,973 | |
| Aon Corp. | | | 3,636,140 | | | | 169,916,822 | |
| Chubb Corp. | | | 1,963,945 | | | | 121,548,556 | |
| MetLife, Inc. | | | 9,713,853 | | | | 326,385,461 | |
| Prudential Financial, Inc. | | | 4,229,522 | | | | 212,364,300 | |
| Travelers Cos., Inc. | | | 3,593,955 | | | | 181,350,969 | |
| | | | | | | | |
| | | | | | | $ | 1,151,332,081 | |
| Leisure & Toys - 0.9% | | | | | | | | |
| Hasbro, Inc. | | | 3,703,660 | | | $ | 143,479,788 | |
| | |
| Machinery & Tools - 0.6% | | | | | | | | |
| Eaton Corp. | | | 2,063,137 | | | $ | 88,611,734 | |
| | |
| Major Banks - 12.0% | | | | | | | | |
| Bank of America Corp. | | | 21,694,320 | | | $ | 177,242,594 | |
| Bank of New York Mellon Corp. | | | 13,419,908 | | | | 277,389,498 | |
| Goldman Sachs Group, Inc. | | | 3,843,195 | | | | 446,656,123 | |
| JPMorgan Chase & Co. | | | 12,356,020 | | | | 464,092,111 | |
| PNC Financial Services Group, Inc. | | | 2,274,202 | | | | 114,028,488 | |
| State Street Corp. | | | 3,642,915 | | | | 129,396,341 | |
| SunTrust Banks, Inc. | | | 1,151,380 | | | | 22,912,462 | |
| Wells Fargo & Co. | | | 11,664,107 | | | | 304,433,193 | |
| | | | | | | | |
| | | | | | | $ | 1,936,150,810 | |
| Medical & Health Technology & Services - 0.5% | | | | | | | | |
| Quest Diagnostics, Inc. | | | 1,694,770 | | | $ | 84,857,134 | |
| | |
| Medical Equipment - 3.7% | | | | | | | | |
| Becton, Dickinson & Co. | | | 2,056,485 | | | $ | 167,356,749 | |
14
Portfolio of Investments – continued
| | | | | | | | |
| Issuer | | Shares/Par | | | Value ($) | |
| | | | | | | | |
| Common Stocks - continued | | | | | | | | |
| Medical Equipment - continued | | | | | | | | |
| Medtronic, Inc. | | | 6,140,700 | | | $ | 215,354,349 | |
| St. Jude Medical, Inc. | | | 2,753,040 | | | | 125,373,442 | |
| Thermo Fisher Scientific, Inc. (a) | | | 1,456,945 | | | | 80,029,989 | |
| | | | | | | | |
| | | | | | | $ | 588,114,529 | |
| Network & Telecom - 0.7% | | | | | | | | |
| Cisco Systems, Inc. | | | 7,245,220 | | | $ | 113,605,050 | |
| | |
| Oil Services - 0.6% | | | | | | | | |
| Transocean, Inc. | | | 1,698,280 | | | $ | 95,137,646 | |
| | |
| Other Banks & Diversified Financials - 1.0% | | | | | | | | |
| MasterCard, Inc., “A” | | | 481,600 | | | $ | 158,788,336 | |
| | |
| Pharmaceuticals - 9.1% | | | | | | | | |
| Abbott Laboratories | | | 6,659,310 | | | $ | 349,680,368 | |
| GlaxoSmithKline PLC | | | 3,530,618 | | | | 75,108,069 | |
| Johnson & Johnson | | | 7,274,267 | | | | 478,646,769 | |
| Merck & Co., Inc. | | | 1,774,427 | | | | 58,769,022 | |
| Pfizer, Inc. | | | 21,466,348 | | | | 407,431,285 | |
| Roche Holding AG | | | 545,026 | | | | 95,431,121 | |
| | | | | | | | |
| | | | | | | $ | 1,465,066,634 | |
| Railroad & Shipping - 0.6% | | | | | | | | |
| Canadian National Railway Co. | | | 1,253,440 | | | $ | 92,503,872 | |
| | |
| Restaurants - 0.7% | | | | | | | | |
| McDonald’s Corp. | | | 1,171,840 | | | $ | 106,004,646 | |
| | |
| Specialty Chemicals - 1.0% | | | | | | | | |
| Air Products & Chemicals, Inc. | | | 2,024,830 | | | $ | 165,772,832 | |
| | |
| Specialty Stores - 0.9% | | | | | | | | |
| Advance Auto Parts, Inc. | | | 1,606,570 | | | $ | 97,550,930 | |
| Staples, Inc. | | | 3,351,695 | | | | 49,403,984 | |
| | | | | | | | |
| | | | | | | $ | 146,954,914 | |
| Telecommunications - Wireless - 1.3% | | | | | | | | |
| Vodafone Group PLC | | | 83,071,816 | | | $ | 217,109,298 | |
| | |
| Telephone Services - 2.8% | | | | | | | | |
| AT&T, Inc. | | | 15,616,572 | | | $ | 444,759,971 | |
15
Portfolio of Investments – continued
| | | | | | | | |
| Issuer | | Shares/Par | | | Value ($) | |
| | | | | | | | |
| Common Stocks - continued | | | | | | | | |
| Tobacco - 5.2% | | | | | | | | |
| Altria Group, Inc. | | | 4,364,385 | | | $ | 118,667,628 | |
| Philip Morris International, Inc. | | | 8,966,899 | | | | 621,585,439 | |
| Reynolds American, Inc. | | | 2,694,590 | | | | 101,235,746 | |
| | | | | | | | |
| | | | | | | $ | 841,488,813 | |
| Utilities - Electric Power - 2.1% | | | | | | | | |
| PG&E Corp. | | | 4,049,638 | | | $ | 171,502,169 | |
| PPL Corp. | | | 2,109,102 | | | | 60,910,866 | |
| Public Service Enterprise Group, Inc. | | | 3,022,843 | | | | 103,169,632 | |
| | | | | | | | |
| | | | | | | $ | 335,582,667 | |
| Total Common Stocks (Identified Cost, $14,396,124,744) | | | | | | $ | 15,828,483,643 | |
| | |
| Convertible Preferred Stocks - 0.1% | | | | | | | | |
| Utilities - Electric Power - 0.1% | | | | | | | | |
| PPL Corp., 9.5% (Identified Cost, $21,608,000) | | | 432,160 | | | $ | 24,844,878 | |
| | |
| Money Market Funds (v) - 1.0% | | | | | | | | |
MFS Institutional Money Market Portfolio, 0.08%,
at Cost and Net Asset Value | | | 153,932,560 | | | $ | 153,932,560 | |
| Total Investments (Identified Cost, $14,571,665,304) | | | | | | $ | 16,007,261,081 | |
| | |
| Other Assets, Less Liabilities - 0.5% | | | | | | | 79,141,239 | |
| Net Assets - 100.0% | | | | | | $ | 16,086,402,320 | |
| (a) | Non-income producing security. |
| (v) | Underlying affiliated fund that is available only to investment companies managed by MFS. The rate quoted is the annualized seven-day yield of the fund at period end. |
The following abbreviations are used in this report and are defined:
| PLC | | Public Limited Company |
See Notes to Financial Statements
16
Financial Statements
STATEMENT OF ASSETS AND LIABILITIES
At 8/31/11
This statement represents your fund’s balance sheet, which details the assets and liabilities comprising the total value of the fund.
| | | | |
| Assets | | | | |
| Investments- | | | | |
| Non-affiliated issuers, at value (identified cost, $14,417,732,744) | | | $15,853,328,521 | |
Underlying affiliated funds, at cost and value | | | 153,932,560 | |
Total investments, at value (identified cost, $14,571,665,304) | | | $16,007,261,081 | |
| Receivables for | | | | |
Fund shares sold | | | 54,648,306 | |
Interest and dividends | | | 50,394,683 | |
Other assets | | | 111,770 | |
Total assets | | | $16,112,415,840 | |
| Liabilities | | | | |
Payable for | | | | |
Fund shares reacquired | | | $19,394,866 | |
| Payable to affiliates | | | | |
Investment adviser | | | 476,863 | |
Shareholder servicing costs | | | 5,271,960 | |
Distribution and service fees | | | 160,069 | |
Program manager fees | | | 26 | |
| Payable for independent Trustees’ compensation | | | 6,449 | |
Accrued expenses and other liabilities | | | 703,287 | |
Total liabilities | | | $26,013,520 | |
Net assets | | | $16,086,402,320 | |
| Net assets consist of | | | | |
| Paid-in capital | | | $15,352,282,419 | |
Unrealized appreciation (depreciation) on investments and translation of assets and liabilities in foreign currencies | | | 1,436,655,161 | |
Accumulated net realized gain (loss) on investments and foreign currency transactions | | | (750,303,752 | ) |
Undistributed net investment income | | | 47,768,492 | |
Net assets | | | $16,086,402,320 | |
Shares of beneficial interest outstanding | | | 736,434,773 | |
17
Statement of Assets and Liabilities – continued
| | | | | | | | | | | | |
| | | Net assets | | | Shares
outstanding | | | Net asset value
per share (a) | |
| Class A | | | $5,086,069,318 | | | | 232,954,985 | | | | $21.83 | |
| Class B | | | 182,654,198 | | | | 8,415,939 | | | | 21.70 | |
| Class C | | | 871,025,793 | | | | 40,294,807 | | | | 21.62 | |
| Class I | | | 5,272,157,421 | | | | 240,333,786 | | | | 21.94 | |
| Class W | | | 1,334,446,285 | | | | 61,183,409 | | | | 21.81 | |
| Class R1 | | | 33,805,530 | | | | 1,573,659 | | | | 21.48 | |
| Class R2 | | | 496,236,147 | | | | 22,914,710 | | | | 21.66 | |
| Class R3 | | | 763,669,540 | | | | 35,068,912 | | | | 21.78 | |
| Class R4 | | | 2,036,438,107 | | | | 93,236,368 | | | | 21.84 | |
| Class 529A | | | 6,314,722 | | | | 290,958 | | | | 21.70 | |
| Class 529B | | | 1,147,324 | | | | 53,480 | | | | 21.45 | |
| Class 529C | | | 2,437,935 | | | | 113,760 | | | | 21.43 | |
| (a) | Maximum offering price per share was equal to the net asset value per share for all share classes, except for Classes A and 529A, for which the maximum offering prices per share were $23.16 [100 / 94.25 x $21.83] and $23.02 [100 / 94.25 x $21.70], respectively. On sales of $50,000 or more, the maximum offering prices of Class A and Class 529A shares are reduced. A contingent deferred sales charge may be imposed on redemptions of Class A, Class B, Class C, Class 529B, and Class 529C shares. Redemption price per share was equal to the net asset value per share for Classes I, W, R1, R2, R3, R4, and 529A. |
See Notes to Financial Statements
18
Financial Statements
STATEMENT OF OPERATIONS
Year ended 8/31/11
This statement describes how much your fund earned in investment income and accrued in expenses. It also describes any gains and/or losses generated by fund operations.
| | | | |
| Net investment income | | | | |
Income | | | | |
Dividends | | | $399,141,841 | |
Interest | | | 332,057 | |
Other | | | 32,741 | |
Dividends from underlying affiliated funds | | | 317,608 | |
Foreign taxes withheld | | | (2,396,465 | ) |
Total investment income | | | $397,427,782 | |
Expenses | | | | |
Management fee | | | $90,198,199 | |
Distribution and service fees | | | 32,602,186 | |
Program manager fees | | | 10,102 | |
Shareholder servicing costs | | | 20,230,418 | |
Administrative services fee | | | 1,012,574 | |
Independent Trustees’ compensation | | | 182,840 | |
Custodian fee | | | 465,903 | |
Shareholder communications | | | 936,685 | |
Auditing fees | | | 50,799 | |
Legal fees | | | 259,623 | |
Miscellaneous | | | 1,041,810 | |
Total expenses | | | $146,991,139 | |
Fees paid indirectly | | | (188 | ) |
Reduction of expenses by investment adviser and distributor | | | (2,009,930 | ) |
Net expenses | | | $144,981,021 | |
Net investment income | | | $252,446,761 | |
Realized and unrealized gain (loss) on investments
and foreign currency transactions | | | | |
Realized gain (loss) (identified cost basis) | | | | |
Investment transactions | | | $764,192,663 | |
Foreign currency transactions | | | 120,756 | |
Net realized gain (loss) on investments
and foreign currency transactions | | | $764,313,419 | |
Change in unrealized appreciation (depreciation) | | | | |
Investments | | | $774,412,010 | |
Translation of assets and liabilities in foreign currencies | | | 959,810 | |
Net unrealized gain (loss) on investments
and foreign currency translation | | | $775,371,820 | |
Net realized and unrealized gain (loss) on investments
and foreign currency | | | $1,539,685,239 | |
Change in net assets from operations | | | $1,792,132,000 | |
See Notes to Financial Statements
19
Financial Statements
STATEMENTS OF CHANGES IN NET ASSETS
These statements describe the increases and/or decreases in net assets resulting from operations, any distributions, and any shareholder transactions.
| | | | | | | | |
| | | Years ended 8/31 | |
| | | 2011 | | | 2010 | |
| Change in net assets | | | | | | |
| From operations | | | | | | | | |
Net investment income | | | $252,446,761 | | | | $197,528,498 | |
Net realized gain (loss) on investments and
foreign currency transactions | | | 764,313,419 | | | | (75,348,408 | ) |
Net unrealized gain (loss) on investments and
foreign currency translation | | | 775,371,820 | | | | (58,021,106 | ) |
Change in net assets from operations | | | $1,792,132,000 | | | | $64,158,984 | |
| Distributions declared to shareholders | | | | | | | | |
From net investment income | | | $(235,320,231 | ) | | | $(189,098,118 | ) |
Change in net assets from fund share transactions | | | $1,471,770,373 | | | | $2,714,175,974 | |
Total change in net assets | | | $3,028,582,142 | | | | $ 2,589,236,840 | |
| Net assets | | | | | | | | |
At beginning of period | | | 13,057,820,178 | | | | 10,468,583,338 | |
At end of period (including undistributed net investment income of $47,768,492 and $30,521,206, respectively) | | | $16,086,402,320 | | | | $13,057,820,178 | |
See Notes to Financial Statements
20
Financial Statements
FINANCIAL HIGHLIGHTS
The financial highlights table is intended to help you understand the fund’s financial performance for the past 5 years. Certain information reflects financial results for a single fund share. The total returns in the table represent the rate by which an investor would have earned (or lost) on an investment in the fund share class (assuming reinvestment of all distributions) held for the entire period.
| | | | | | | | | | | | | | | | | | | | |
| Class A | | Years ended 8/31 | |
| | | 2011 | | | 2010 | | | 2009 | | | 2008 | | | 2007 | |
Net asset value, beginning of period | | | $19.46 | | | | $19.39 | | | | $23.75 | | | | $28.11 | | | | $25.20 | |
| Income (loss) from investment operations | | | | | | | | | | | | | | | | | |
Net investment income (d) | | | $0.34 | | | | $0.32 | | | | $0.34 | | | | $0.32 | | | | $0.30 | |
Net realized and unrealized gain (loss)
on investments and foreign currency | | | 2.35 | | | | 0.06 | (g) | | | (4.35 | ) | | | (2.43 | ) | | | 3.77 | |
Total from investment operations | | | $2.69 | | | | $0.38 | | | | $(4.01 | ) | | | $(2.11 | ) | | | $4.07 | |
| Less distributions declared to shareholders | | | | | | | | | | | | | | | | | |
From net investment income | | | $(0.32 | ) | | | $(0.31 | ) | | | $(0.35 | ) | | | $(0.31 | ) | | | $(0.36 | ) |
From net realized gain on investments | | | — | | | | — | | | | — | | | | (1.94 | ) | | | (0.80 | ) |
Total distributions declared to
shareholders | | | $(0.32 | ) | | | $(0.31 | ) | | | $(0.35 | ) | | | $(2.25 | ) | | | $(1.16 | ) |
Net asset value, end of period | | | $21.83 | | | | $19.46 | | | | $19.39 | | | | $23.75 | | | | $28.11 | |
Total return (%) (r)(s)(t)(x) | | | 13.78 | | | | 1.88 | | | | (16.75 | ) | | | (8.27 | ) | | | 16.42 | |
Ratios (%) (to average net assets)
and Supplemental data: | | | | | | | | | | | | | | | | | |
Expenses before expense reductions (f) | | | 0.95 | | | | 0.98 | | | | 1.09 | | | | 1.11 | | | | 1.13 | |
Expenses after expense reductions (f) | | | 0.94 | | | | 0.98 | | | | 1.09 | | | | 1.10 | | | | 1.11 | |
Net investment income | | | 1.49 | | | | 1.54 | | | | 1.94 | | | | 1.24 | | | | 1.10 | |
Portfolio turnover | | | 17 | | | | 22 | | | | 33 | | | | 31 | | | | 26 | |
Net assets at end of period (000 omitted) | | | $5,086,069 | | | | $4,980,816 | | | | $4,665,411 | | | | $5,724,586 | | | | $6,239,176 | |
See Notes to Financial Statements
21
Financial Highlights – continued
| | | | | | | | | | | | | | | | | | | | |
| Class B | | Years ended 8/31 | |
| | | 2011 | | | 2010 | | | 2009 | | | 2008 | | | 2007 | |
Net asset value, beginning of period | | | $19.34 | | | | $19.26 | | | | $23.59 | | | | $27.92 | | | | $25.04 | |
| Income (loss) from investment operations | | | | | | | | | | | | | | | | | |
Net investment income (d) | | | $0.16 | | | | $0.16 | | | | $0.22 | | | | $0.15 | | | | $0.12 | |
Net realized and unrealized gain (loss)
on investments and foreign currency | | | 2.34 | | | | 0.07 | (g) | | | (4.34 | ) | | | (2.41 | ) | | | 3.74 | |
Total from investment operations | | | $2.50 | | | | $0.23 | | | | $(4.12 | ) | | | $(2.26 | ) | | | $3.86 | |
| Less distributions declared to shareholders | | | | | | | | | | | | | | | | | |
From net investment income | | | $(0.14 | ) | | | $(0.15 | ) | | | $(0.21 | ) | | | $(0.13 | ) | | | $(0.18 | ) |
From net realized gain on investments | | | — | | | | — | | | | — | | | | (1.94 | ) | | | (0.80 | ) |
Total distributions declared to
shareholders | | | $(0.14 | ) | | | $(0.15 | ) | | | $(0.21 | ) | | | $(2.07 | ) | | | $(0.98 | ) |
Net asset value, end of period | | | $21.70 | | | | $19.34 | | | | $19.26 | | | | $23.59 | | | | $27.92 | |
Total return (%) (r)(s)(t)(x) | | | 12.92 | | | | 1.14 | | | | (17.36 | ) | | | (8.87 | ) | | | 15.64 | |
Ratios (%) (to average net assets)
and Supplemental data: | | | | | | | | | | | | | | | | | |
Expenses before expense reductions (f) | | | 1.70 | | | | 1.73 | | | | 1.79 | | | | 1.76 | | | | 1.78 | |
Expenses after expense reductions (f) | | | 1.69 | | | | 1.73 | | | | 1.79 | | | | 1.75 | | | | 1.76 | |
Net investment income | | | 0.73 | | | | 0.80 | | | | 1.26 | | | | 0.58 | | | | 0.44 | |
Portfolio turnover | | | 17 | | | | 22 | | | | 33 | | | | 31 | | | | 26 | |
Net assets at end of period (000 omitted) | | | $182,654 | | | | $238,473 | | | | $371,270 | | | | $672,484 | | | | $1,049,401 | |
See Notes to Financial Statements
22
Financial Highlights – continued
| | | | | | | | | | | | | | | | | | | | |
| Class C | | Years ended 8/31 | |
| | | 2011 | | | 2010 | | | 2009 | | | 2008 | | | 2007 | |
Net asset value, beginning of period | | | $19.27 | | | | $19.21 | | | | $23.54 | | | | $27.88 | | | | $25.01 | |
| Income (loss) from investment operations | | | | | | | | | | | | | | | | | |
Net investment income (d) | | | $0.17 | | | | $0.16 | | | | $0.22 | | | | $0.15 | | | | $0.12 | |
Net realized and unrealized gain (loss)
on investments and foreign currency | | | 2.33 | | | | 0.06 | (g) | | | (4.33 | ) | | | (2.41 | ) | | | 3.74 | |
Total from investment operations | | | $2.50 | | | | $0.22 | | | | $(4.11 | ) | | | $(2.26 | ) | | | $3.86 | |
| Less distributions declared to shareholders | | | | | | | | | | | | | | | | | |
From net investment income | | | $(0.15 | ) | | | $(0.16 | ) | | | $(0.22 | ) | | | $(0.14 | ) | | | $(0.19 | ) |
From net realized gain on investments | | | — | | | | — | | | | — | | | | (1.94 | ) | | | (0.80 | ) |
Total distributions declared to
shareholders | | | $(0.15 | ) | | | $(0.16 | ) | | | $(0.22 | ) | | | $(2.08 | ) | | | $(0.99 | ) |
Net asset value, end of period | | | $21.62 | | | | $19.27 | | | | $19.21 | | | | $23.54 | | | | $27.88 | |
Total return (%) (r)(s)(t)(x) | | | 12.97 | | | | 1.11 | | | | (17.35 | ) | | | (8.88 | ) | | | 15.66 | |
Ratios (%) (to average net assets)
and Supplemental data: | | | | | | | | | | | | | | | | | |
Expenses before expense reductions (f) | | | 1.70 | | | | 1.73 | | | | 1.79 | | | | 1.76 | | | | 1.78 | |
Expenses after expense reductions (f) | | | 1.69 | | | | 1.73 | | | | 1.79 | | | | 1.75 | | | | 1.76 | |
Net investment income | | | 0.74 | | | | 0.79 | | | | 1.24 | | | | 0.59 | | | | 0.45 | |
Portfolio turnover | | | 17 | | | | 22 | | | | 33 | | | | 31 | | | | 26 | |
Net assets at end of period (000 omitted) | | | $871,026 | | | | $832,696 | | | | $776,373 | | | | $950,299 | | | | $1,052,467 | |
See Notes to Financial Statements
23
Financial Highlights – continued
| | | | | | | | | | | | | | | | | | | | |
| Class I | | Years ended 8/31 | |
| | | 2011 | | | 2010 | | | 2009 | | | 2008 | | | 2007 | |
Net asset value, beginning of period | | | $19.55 | | | | $19.48 | | | | $23.87 | | | | $28.24 | | | | $25.32 | |
| Income (loss) from investment operations | | | | | | | | | | | | | | | | | |
Net investment income (d) | | | $0.40 | | | | $0.37 | | | | $0.40 | | | | $0.41 | | | | $0.40 | |
Net realized and unrealized gain (loss)
on investments and foreign currency | | | 2.37 | | | | 0.06 | (g) | | | (4.38 | ) | | | (2.44 | ) | | | 3.77 | |
Total from investment operations | | | $2.77 | | | | $0.43 | | | | $(3.98 | ) | | | $(2.03 | ) | | | $4.17 | |
| Less distributions declared to shareholders | | | | | | | | | | | | | | | | | |
From net investment income | | | $(0.38 | ) | | | $(0.36 | ) | | | $(0.41 | ) | | | $(0.40 | ) | | | $(0.45 | ) |
From net realized gain on investments | | | — | | | | — | | | | — | | | | (1.94 | ) | | | (0.80 | ) |
Total distributions declared to
shareholders | | | $(0.38 | ) | | | $(0.36 | ) | | | $(0.41 | ) | | | $(2.34 | ) | | | $(1.25 | ) |
Net asset value, end of period | | | $21.94 | | | | $19.55 | | | | $19.48 | | | | $23.87 | | | | $28.24 | |
Total return (%) (r)(s)(x) | | | 14.10 | | | | 2.12 | | | | (16.53 | ) | | | (7.94 | ) | | | 16.78 | |
Ratios (%) (to average net assets)
and Supplemental data: | | | | | | | | | | | | | | | | | |
Expenses before expense reductions (f) | | | 0.70 | | | | 0.73 | | | | 0.79 | | | | 0.76 | | | | 0.78 | |
Expenses after expense reductions (f) | | | 0.69 | | | | 0.73 | | | | 0.79 | | | | 0.75 | | | | 0.76 | |
Net investment income | | | 1.75 | | | | 1.79 | | | | 2.26 | | | | 1.60 | | | | 1.45 | |
Portfolio turnover | | | 17 | | | | 22 | | | | 33 | | | | 31 | | | | 26 | |
Net assets at end of period (000 omitted) | | | $5,272,157 | | | | $3,289,827 | | | | $2,335,922 | | | | $1,663,139 | | | | $1,529,643 | |
See Notes to Financial Statements
24
Financial Highlights – continued
| | | | | | | | | | | | | | | | | | | | |
| Class W | | Years ended 8/31 | |
| | | 2011 | | | 2010 | | | 2009 | | | 2008 | | | 2007 | |
Net asset value, beginning of period | | | $19.44 | | | | $19.37 | | | | $23.74 | | | | $28.11 | | | | $25.20 | |
| Income (loss) from investment operations | | | | | | | | | | | | | | | | | |
Net investment income (d) | | | $0.37 | | | | $0.35 | | | | $0.37 | | | | $0.37 | | | | $0.37 | |
Net realized and unrealized gain (loss)
on investments and foreign currency | | | 2.35 | | | | 0.06 | (g) | | | (4.35 | ) | | | (2.42 | ) | | | 3.77 | |
Total from investment operations | | | $2.72 | | | | $0.41 | | | | $(3.98 | ) | | | $(2.05 | ) | | | $4.14 | |
| Less distributions declared to shareholders | | | | | | | | | | | | | | | | | |
From net investment income | | | $(0.35 | ) | | | $(0.34 | ) | | | $(0.39 | ) | | | $(0.38 | ) | | | $(0.43 | ) |
From net realized gain on investments | | | — | | | | — | | | | — | | | | (1.94 | ) | | | (0.80 | ) |
Total distributions declared to
shareholders | | | $(0.35 | ) | | | $(0.34 | ) | | | $(0.39 | ) | | | $(2.32 | ) | | | $(1.23 | ) |
Net asset value, end of period | | | $21.81 | | | | $19.44 | | | | $19.37 | | | | $23.74 | | | | $28.11 | |
Total return (%) (r)(s)(x) | | | 13.96 | | | | 2.04 | | | | (16.61 | ) | | | (8.05 | ) | | | 16.73 | |
Ratios (%) (to average net assets)
and Supplemental data: | | | | | | | | | | | | | | | | | |
Expenses before expense reductions (f) | | | 0.80 | | | | 0.83 | | | | 0.89 | | | | 0.87 | | | | 0.88 | |
Expenses after expense reductions (f) | | | 0.79 | | | | 0.83 | | | | 0.88 | | | | 0.85 | | | | 0.86 | |
Net investment income | | | 1.63 | | | | 1.70 | | | | 2.12 | | | | 1.54 | | | | 1.37 | |
Portfolio turnover | | | 17 | | | | 22 | | | | 33 | | | | 31 | | | | 26 | |
Net assets at end of period (000 omitted) | | | $1,334,446 | | | | $1,393,429 | | | | $999,969 | | | | $581,005 | | | | $69,115 | |
See Notes to Financial Statements
25
Financial Highlights – continued
| | | | | | | | | | | | | | | | | | | | |
| Class R1 | | Years ended 8/31 | |
| | | 2011 | | | 2010 | | | 2009 | | | 2008 | | | 2007 | |
Net asset value, beginning of period | | | $19.15 | | | | $19.09 | | | | $23.42 | | | | $27.76 | | | | $24.93 | |
| Income (loss) from investment operations | | | | | | | | | | | | | | | | | |
Net investment income (d) | | | $0.17 | | | | $0.16 | | | | $0.21 | | | | $0.14 | | | | $0.10 | |
Net realized and unrealized gain (loss)
on investments and foreign currency | | | 2.32 | | | | 0.06 | (g) | | | (4.31 | ) | | | (2.40 | ) | | | 3.72 | |
Total from investment operations | | | $2.49 | | | | $0.22 | | | | $(4.10 | ) | | | $(2.26 | ) | | | $3.82 | |
| Less distributions declared to shareholders | | | | | | | | | | | | | | | | | |
From net investment income | | | $(0.16 | ) | | | $(0.16 | ) | | | $(0.23 | ) | | | $(0.14 | ) | | | $(0.19 | ) |
From net realized gain on investments | | | — | | | | — | | | | — | | | | (1.94 | ) | | | (0.80 | ) |
Total distributions declared to
shareholders | | | $(0.16 | ) | | | $(0.16 | ) | | | $(0.23 | ) | | | $(2.08 | ) | | | $(0.99 | ) |
Net asset value, end of period | | | $21.48 | | | | $19.15 | | | | $19.09 | | | | $23.42 | | | | $27.76 | |
Total return (%) (r)(s)(x) | | | 12.95 | | | | 1.13 | | | | (17.38 | ) | | | (8.91 | ) | | | 15.55 | |
Ratios (%) (to average net assets)
and Supplemental data: | | | | | | | | | | | | | | | | | |
Expenses before expense reductions (f) | | | 1.70 | | | | 1.73 | | | | 1.78 | | | | 1.81 | | | | 1.92 | |
Expenses after expense reductions (f) | | | 1.69 | | | | 1.73 | | | | 1.78 | | | | 1.79 | | | | 1.86 | |
Net investment income | | | 0.74 | | | | 0.80 | | | | 1.24 | | | | 0.54 | | | | 0.36 | |
Portfolio turnover | | | 17 | | | | 22 | | | | 33 | | | | 31 | | | | 26 | |
Net assets at end of period (000 omitted) | | | $33,806 | | | | $32,934 | | | | $30,690 | | | | $25,252 | | | | $15,823 | |
See Notes to Financial Statements
26
Financial Highlights – continued
| | | | | | | | | | | | | | | | | | | | |
| Class R2 | | Years ended 8/31 | |
| | | 2011 | | | 2010 | | | 2009 | | | 2008 | | | 2007 | |
Net asset value, beginning of period | | | $19.31 | | | | $19.24 | | | | $23.59 | | | | $27.94 | | | | $25.07 | |
| Income (loss) from investment operations | | | | | | | | | | | | | | | | | |
Net investment income (d) | | | $0.28 | | | | $0.26 | | | | $0.30 | | | | $0.27 | | | | $0.22 | |
Net realized and unrealized gain (loss)
on investments and foreign currency | | | 2.34 | | | | 0.07 | (g) | | | (4.33 | ) | | | (2.42 | ) | | | 3.75 | |
Total from investment operations | | | $2.62 | | | | $0.33 | | | | $(4.03 | ) | | | $(2.15 | ) | | | $3.97 | |
| Less distributions declared to shareholders | | | | | | | | | | | | | | | | | |
From net investment income | | | $(0.27 | ) | | | $(0.26 | ) | | | $(0.32 | ) | | | $(0.26 | ) | | | $(0.30 | ) |
From net realized gain on investments | | | — | | | | — | | | | — | | | | (1.94 | ) | | | (0.80 | ) |
Total distributions declared to
shareholders | | | $(0.27 | ) | | | $(0.26 | ) | | | $(0.32 | ) | | | $(2.20 | ) | | | $(1.10 | ) |
Net asset value, end of period | | | $21.66 | | | | $19.31 | | | | $19.24 | | | | $23.59 | | | | $27.94 | |
Total return (%) (r)(s)(x) | | | 13.51 | | | | 1.66 | | | | (16.96 | ) | | | (8.46 | ) | | | 16.07 | |
Ratios (%) (to average net assets)
and Supplemental data: | | | | | | | | | | | | | | | | | |
Expenses before expense reductions (f) | | | 1.20 | | | | 1.23 | | | | 1.29 | | | | 1.30 | | | | 1.47 | |
Expenses after expense reductions (f) | | | 1.19 | | | | 1.23 | | | | 1.28 | | | | 1.28 | | | | 1.41 | |
Net investment income | | | 1.24 | | | | 1.29 | | | | 1.73 | | | | 1.10 | | | | 0.81 | |
Portfolio turnover | | | 17 | | | | 22 | | | | 33 | | | | 31 | | | | 26 | |
Net assets at end of period (000 omitted) | | | $496,236 | | | | $426,938 | | | | $286,115 | | | | $246,027 | | | | $98,970 | |
See Notes to Financial Statements
27
Financial Highlights – continued
| | | | | | | | | | | | | | | | | | | | |
| Class R3 | | Years ended 8/31 | |
| | | 2011 | | | 2010 | | | 2009 | | | 2008 | | | 2007 | |
Net asset value, beginning of period | | | $19.41 | | | | $19.34 | | | | $23.71 | | | | $28.07 | | | | $25.17 | |
| Income (loss) from investment operations | | | | | | | | | | | | | | | | | |
Net investment income (d) | | | $0.34 | | | | $0.31 | | | | $0.34 | | | | $0.33 | | | | $0.30 | |
Net realized and unrealized gain (loss)
on investments and foreign currency | | | 2.35 | | | | 0.07 | (g) | | | (4.35 | ) | | | (2.43 | ) | | | 3.75 | |
Total from investment operations | | | $2.69 | | | | $0.38 | | | | $(4.01 | ) | | | $(2.10 | ) | | | $4.05 | |
| Less distributions declared to shareholders | | | | | | | | | | | | | | | | | |
From net investment income | | | $(0.32 | ) | | | $(0.31 | ) | | | $(0.36 | ) | | | $(0.32 | ) | | | $(0.35 | ) |
From net realized gain on investments | | | — | | | | — | | | | — | | | | (1.94 | ) | | | (0.80 | ) |
Total distributions declared to
shareholders | | | $(0.32 | ) | | | $(0.31 | ) | | | $(0.36 | ) | | | $(2.26 | ) | | | $(1.15 | ) |
Net asset value, end of period | | | $21.78 | | | | $19.41 | | | | $19.34 | | | | $23.71 | | | | $28.07 | |
Total return (%) (r)(s)(x) | | | 13.82 | | | | 1.90 | | | | (16.75 | ) | | | (8.25 | ) | | | 16.38 | |
Ratios (%) (to average net assets)
and Supplemental data: | | | | | | | | | | | | | | | | | |
Expenses before expense reductions (f) | | | 0.95 | | | | 0.99 | | | | 1.03 | | | | 1.06 | | | | 1.18 | |
Expenses after expense reductions (f) | | | 0.94 | | | | 0.98 | | | | 1.03 | | | | 1.04 | | | | 1.16 | |
Net investment income | | | 1.49 | | | | 1.53 | | | | 1.94 | | | | 1.29 | | | | 1.07 | |
Portfolio turnover | | | 17 | | | | 22 | | | | 33 | | | | 31 | | | | 26 | |
Net assets at end of period (000 omitted) | | | $763,670 | | | | $587,645 | | | | $341,993 | | | | $190,002 | | | | $128,909 | |
See Notes to Financial Statements
28
Financial Highlights – continued
| | | | | | | | | | | | | | | | | | | | |
| Class R4 | | Years ended 8/31 | |
| | | 2011 | | | 2010 | | | 2009 | | | 2008 | | | 2007 | |
Net asset value, beginning of period | | | $19.47 | | | | $19.39 | | | | $23.77 | | | | $28.13 | | | | $25.22 | |
| Income (loss) from investment operations | | | | | | | | | | | | | | | | | |
Net investment income (d) | | | $0.40 | | | | $0.36 | | | | $0.37 | | | | $0.40 | | | | $0.39 | |
Net realized and unrealized gain (loss)
on investments and foreign currency | | | 2.35 | | | | 0.08 | (g) | | | (4.34 | ) | | | (2.43 | ) | | | 3.75 | |
Total from investment operations | | | $2.75 | | | | $0.44 | | | | $(3.97 | ) | | | $(2.03 | ) | | | $4.14 | |
| Less distributions declared to shareholders | | | | | | | | | | | | | | | | | |
From net investment income | | | $(0.38 | ) | | | $(0.36 | ) | | | $(0.41 | ) | | | $(0.39 | ) | | | $(0.43 | ) |
From net realized gain on investments | | | — | | | | — | | | | — | | | | (1.94 | ) | | | (0.80 | ) |
Total distributions declared to
shareholders | | | $(0.38 | ) | | | $(0.36 | ) | | | $(0.41 | ) | | | $(2.33 | ) | | | $(1.23 | ) |
Net asset value, end of period | | | $21.84 | | | | $19.47 | | | | $19.39 | | | | $23.77 | | | | $28.13 | |
Total return (%) (r)(s)(x) | | | 14.05 | | | | 2.18 | | | | (16.56 | ) | | | (7.99 | ) | | | 16.70 | |
Ratios (%) (to average net assets)
and Supplemental data: | | | | | | | | | | | | | | | | | |
Expenses before expense reductions (f) | | | 0.70 | | | | 0.74 | | | | 0.77 | | | | 0.80 | | | | 0.88 | |
Expenses after expense reductions (f) | | | 0.69 | | | | 0.73 | | | | 0.77 | | | | 0.78 | | | | 0.86 | |
Net investment income | | | 1.74 | | | | 1.77 | | | | 2.10 | | | | 1.58 | | | | 1.39 | |
Portfolio turnover | | | 17 | | | | 22 | | | | 33 | | | | 31 | | | | 26 | |
Net assets at end of period (000 omitted) | | | $2,036,438 | | | | $1,266,492 | | | | $652,906 | | | | $194,753 | | | | $137,524 | |
See Notes to Financial Statements
29
Financial Highlights – continued
| | | | | | | | | | | | | | | | | | | | |
| Class 529A | | Years ended 8/31 | |
| | | 2011 | | | 2010 | | | 2009 | | | 2008 | | | 2007 | |
Net asset value, beginning of period | | | $19.34 | | | | $19.28 | | | | $23.62 | | | | $27.96 | | | | $25.09 | |
| Income (loss) from investment operations | | | | | | | | | | | | | | | | | |
Net investment income (d) | | | $0.32 | | | | $0.29 | | | | $0.32 | | | | $0.27 | | | | $0.23 | |
Net realized and unrealized gain (loss)
on investments and foreign currency | | | 2.34 | | | | 0.06 | (g) | | | (4.33 | ) | | | (2.42 | ) | | | 3.74 | |
Total from investment operations | | | $2.66 | | | | $0.35 | | | | $(4.01 | ) | | | $(2.15 | ) | | | $3.97 | |
| Less distributions declared to shareholders | | | | | | | | | | | | | | | | | |
From net investment income | | | $(0.30 | ) | | | $(0.29 | ) | | | $(0.33 | ) | | | $(0.25 | ) | | | $(0.30 | ) |
From net realized gain on investments | | | — | | | | — | | | | — | | | | (1.94 | ) | | | (0.80 | ) |
Total distributions declared to
shareholders | | | $(0.30 | ) | | | $(0.29 | ) | | | $(0.33 | ) | | | $(2.19 | ) | | | $(1.10 | ) |
Net asset value, end of period | | | $21.70 | | | | $19.34 | | | | $19.28 | | | | $23.62 | | | | $27.96 | |
Total return (%) (r)(s)(t)(x) | | | 13.71 | | | | 1.74 | | | | (16.84 | ) | | | (8.45 | ) | | | 16.09 | |
Ratios (%) (to average net assets)
and Supplemental data: | | | | | | | | | | | | | | | | | |
Expenses before expense reductions (f) | | | 1.05 | | | | 1.08 | | | | 1.19 | | | | 1.30 | | | | 1.38 | |
Expenses after expense reductions (f) | | | 1.03 | | | | 1.08 | | | | 1.19 | | | | 1.28 | | | | 1.36 | |
Net investment income | | | 1.40 | | | | 1.44 | | | | 1.84 | | | | 1.05 | | | | 0.85 | |
Portfolio turnover | | | 17 | | | | 22 | | | | 33 | | | | 31 | | | | 26 | |
Net assets at end of period (000 omitted) | | | $6,315 | | | | $5,192 | | | | $5,008 | | | | $6,025 | | | | $6,194 | |
See Notes to Financial Statements
30
Financial Highlights – continued
| | | | | | | | | | | | | | | | | | | | |
| Class 529B | | Years ended 8/31 | |
| | | 2011 | | | 2010 | | | 2009 | | | 2008 | | | 2007 | |
Net asset value, beginning of period | | | $19.12 | | | | $19.06 | | | | $23.37 | | | | $27.69 | | | | $24.87 | |
| Income (loss) from investment operations | | | | | | | | | | | | | | | | | |
Net investment income (d) | | | $0.14 | | | | $0.14 | | | | $0.20 | | | | $0.10 | | | | $0.06 | |
Net realized and unrealized gain (loss)
on investments and foreign currency | | | 2.32 | | | | 0.06 | (g) | | | (4.30 | ) | | | (2.39 | ) | | | 3.71 | |
Total from investment operations | | | $2.46 | | | | $0.20 | | | | $(4.10 | ) | | | $(2.29 | ) | | | $3.77 | |
| Less distributions declared to shareholders | | | | | | | | | | | | | | | | | |
From net investment income | | | $(0.13 | ) | | | $(0.14 | ) | | | $(0.21 | ) | | | $(0.09 | ) | | | $(0.15 | ) |
From net realized gain on investments | | | — | | | | — | | | | — | | | | (1.94 | ) | | | (0.80 | ) |
Total distributions declared to
shareholders | | | $(0.13 | ) | | | $(0.14 | ) | | | $(0.21 | ) | | | $(2.03 | ) | | | $(0.95 | ) |
Net asset value, end of period | | | $21.45 | | | | $19.12 | | | | $19.06 | | | | $23.37 | | | | $27.69 | |
Total return (%) (r)(s)(t)(x) | | | 12.84 | | | | 1.01 | | | | (17.46 | ) | | | (9.05 | ) | | | 15.37 | |
Ratios (%) (to average net assets)
and Supplemental data: | | | | | | | | | | | | | | | | | |
Expenses before expense reductions (f) | | | 1.80 | | | | 1.83 | | | | 1.89 | | | | 1.95 | | | | 2.03 | |
Expenses after expense reductions (f) | | | 1.78 | | | | 1.83 | | | | 1.89 | | | | 1.94 | | | | 2.01 | |
Net investment income | | | 0.64 | | | | 0.70 | | | | 1.15 | | | | 0.40 | | | | 0.20 | |
Portfolio turnover | | | 17 | | | | 22 | | | | 33 | | | | 31 | | | | 26 | |
Net assets at end of period (000 omitted) | | | $1,147 | | | | $1,198 | | | | $1,215 | | | | $1,624 | | | | $1,823 | |
See Notes to Financial Statements
31
Financial Highlights – continued
| | | | | | | | | | | | | | | | | | | | |
| Class 529C | | Years ended 8/31 | |
| | | 2011 | | | 2010 | | | 2009 | | | 2008 | | | 2007 | |
Net asset value, beginning of period | | | $19.11 | | | | $19.05 | | | | $23.35 | | | | $27.67 | | | | $24.86 | |
| Income (loss) from investment operations | | | | | | | | | | | | | | | | | |
Net investment income (d) | | | $0.15 | | | | $0.14 | | | | $0.20 | | | | $0.10 | | | | $0.06 | |
Net realized and unrealized gain (loss)
on investments and foreign currency | | | 2.31 | | | | 0.07 | (g) | | | (4.30 | ) | | | (2.39 | ) | | | 3.70 | |
Total from investment operations | | | $2.46 | | | | $0.21 | | | | $(4.10 | ) | | | $(2.29 | ) | | | $3.76 | |
| Less distributions declared to shareholders | | | | | | | | | | | | | | | | | |
From net investment income | | | $(0.14 | ) | | | $(0.15 | ) | | | $(0.20 | ) | | | $(0.09 | ) | | | $(0.15 | ) |
From net realized gain on investments | | | — | | | | — | | | | — | | | | (1.94 | ) | | | (0.80 | ) |
Total distributions declared to
shareholders | | | $(0.14 | ) | | | $(0.15 | ) | | | $(0.20 | ) | | | $(2.03 | ) | | | $(0.95 | ) |
Net asset value, end of period | | | $21.43 | | | | $19.11 | | | | $19.05 | | | | $23.35 | | | | $27.67 | |
Total return (%) (r)(s)(t)(x) | | | 12.82 | | | | 1.06 | | | | (17.45 | ) | | | (9.05 | ) | | | 15.34 | |
Ratios (%) (to average net assets)
and Supplemental data: | | | | | | | | | | | | | | | | | |
Expenses before expense reductions (f) | | | 1.80 | | | | 1.83 | | | | 1.89 | | | | 1.95 | | | | 2.03 | |
Expenses after expense reductions (f) | | | 1.78 | | | | 1.83 | | | | 1.89 | | | | 1.94 | | | | 2.01 | |
Net investment income | | | 0.65 | | | | 0.69 | | | | 1.15 | | | | 0.40 | | | | 0.20 | |
Portfolio turnover | | | 17 | | | | 22 | | | | 33 | | | | 31 | | | | 26 | |
Net assets at end of period (000 omitted) | | | $2,438 | | | | $2,180 | | | | $1,710 | | | | $2,282 | | | | $2,463 | |
| (d) | Per share data is based on average shares outstanding. |
| (f) | Ratios do not reflect reductions from fees paid indirectly, if applicable. |
| (g) | The per share amount is not in accordance with the net realized and unrealized gain/loss for the period because of the timing of sales of fund shares and the per share amount of realized and unrealized gains and losses at such time. |
| (r) | Certain expenses have been reduced without which performance would have been lower. |
| (s) | From time to time the fund may receive proceeds from litigation settlements, without which performance would be lower. |
| (t) | Total returns do not include any applicable sales charges. |
| (x) | Total returns have been calculated on net asset values which include adjustments made in accordance with the U.S. generally accepted accounting principles required at period end for financial reporting purposes. |
See Notes to Financial Statements
32
NOTES TO FINANCIAL STATEMENTS
| (1) | | Business and Organization |
MFS Value Fund (the fund) is a series of MFS Series Trust I (the trust). The trust is organized as a Massachusetts business trust and is registered under the Investment Company Act of 1940, as amended, as an open-end management investment company.
| (2) | | Significant Accounting Policies |
General – The preparation of financial statements in conformity with U.S. generally accepted accounting principles requires management to make estimates and assumptions that affect the reported amounts of assets and liabilities, and disclosure of contingent assets and liabilities at the date of the financial statements and the reported amounts of revenues and expenses during the reporting period. Actual results could differ from those estimates. In the preparation of these financial statements, management has evaluated subsequent events occurring after the date of the fund’s Statement of Assets and Liabilities through the date that the financial statements were issued. The fund invests in foreign securities. Investments in foreign securities are vulnerable to the effects of changes in the relative values of the local currency and the U.S. dollar and to the effects of changes in each country’s legal, political, and economic environment.
Investment Valuations – Equity securities, including restricted equity securities, are generally valued at the last sale or official closing price as provided by a third-party pricing service on the market or exchange on which they are primarily traded. Equity securities, for which there were no sales reported that day, are generally valued at the last quoted daily bid quotation as provided by a third-party pricing service on the market or exchange on which such securities are primarily traded. Equity securities held short, for which there were no sales reported for that day, are generally valued at the last quoted daily ask quotation as provided by a third-party pricing service on the market or exchange on which such securities are primarily traded. Short-term instruments with a maturity at issuance of 60 days or less generally are valued at amortized cost, which approximates market value. Open-end investment companies are generally valued at net asset value per share. Securities and other assets generally valued on the basis of information from a third-party pricing service may also be valued at a broker/dealer bid quotation. Values obtained from third-party pricing services can utilize both transaction data and market information such as yield, quality, coupon rate, maturity, type of issue, trading characteristics, and other market data. The values of foreign securities and other assets and liabilities expressed in foreign currencies are converted to U.S. dollars using the mean of bid and asked prices for rates provided by a third-party pricing service.
33
Notes to Financial Statements – continued
The Board of Trustees has delegated primary responsibility for determining or causing to be determined the value of the fund’s investments (including any fair valuation) to the adviser pursuant to valuation policies and procedures approved by the Board. If the adviser determines that reliable market quotations are not readily available, investments are valued at fair value as determined in good faith by the adviser in accordance with such procedures under the oversight of the Board of Trustees. Under the fund’s valuation policies and procedures, market quotations are not considered to be readily available for most types of debt instruments and floating rate loans and many types of derivatives. These investments are generally valued at fair value based on information from third-party pricing services. In addition, investments may be valued at fair value if the adviser determines that an investment’s value has been materially affected by events occurring after the close of the exchange or market on which the investment is principally traded (such as foreign exchange or market) and prior to the determination of the fund’s net asset value, or after the halting of trading of a specific security where trading does not resume prior to the close of the exchange or market on which the security is principally traded. Events that occur on a frequent basis after foreign markets close (such as developments in foreign markets and significant movements in the U.S. markets) and prior to the determination of the fund’s net asset value may be deemed to have a material effect on the value of securities traded in foreign markets. Accordingly, the fund’s foreign equity securities may often be valued at fair value. The adviser generally relies on third-party pricing services or other information (such as the correlation with price movements of similar securities in the same or other markets; the type, cost and investment characteristics of the security; the business and financial condition of the issuer; and trading and other market data) to assist in determining whether to fair value and at what value to fair value an investment. The value of an investment for purposes of calculating the fund’s net asset value can differ depending on the source and method used to determine value. When fair valuation is used, the value of an investment used to determine the fund’s net asset value may differ from quoted or published prices for the same investment. There can be no assurance that the fund could obtain the fair value assigned to an investment if it were to sell the investment at the same time at which the fund determines its net asset value per share.
Various inputs are used in determining the value of the fund’s assets or liabilities. These inputs are categorized into three broad levels. In certain cases, the inputs used to measure fair value may fall into different levels of the fair value hierarchy. In such cases, an investment’s level within the fair value hierarchy is based on the lowest level of input that is significant to the fair value measurement. The fund’s assessment of the significance of a particular input to the fair value measurement in its entirety requires judgment, and
34
Notes to Financial Statements – continued
considers factors specific to the investment. Level 1 includes unadjusted quoted prices in active markets for identical assets or liabilities. Level 2 includes other significant observable market-based inputs (including quoted prices for similar securities, interest rates, prepayment speed, and credit risk). Level 3 includes unobservable inputs, which may include the adviser’s own assumptions in determining the fair value of investments. The following is a summary of the levels used as of August 31, 2011 in valuing the fund’s assets or liabilities:
| | | | | | | | | | | | | | | | |
| Investments at Value | | Level 1 | | | Level 2 | | | Level 3 | | | Total | |
| Equity Securities | | | $15,853,328,521 | | | | $— | | | | $— | | | | $15,853,328,521 | |
| Mutual Funds | | | 153,932,560 | | | | — | | | | — | | | | 153,932,560 | |
| Total Investments | | | $16,007,261,081 | | | | $— | | | | $— | | | | $16,007,261,081 | |
For further information regarding security characteristics, see the Portfolio of Investments.
Foreign Currency Translation – Purchases and sales of foreign investments, income, and expenses are converted into U.S. dollars based upon currency exchange rates prevailing on the respective dates of such transactions or on the reporting date for foreign denominated receivables and payables. Gains and losses attributable to foreign currency exchange rates on sales of securities are recorded for financial statement purposes as net realized gains and losses on investments. Gains and losses attributable to foreign exchange rate movements on receivables, payables, income and expenses are recorded for financial statement purposes as foreign currency transaction gains and losses. That portion of both realized and unrealized gains and losses on investments that results from fluctuations in foreign currency exchange rates is not separately disclosed.
Security Loans – State Street Bank and Trust Company (“State Street”), as lending agent, may loan the securities of the fund to certain qualified institutions (the “Borrowers”) approved by the fund. The loans are collateralized by cash and/or U.S. Treasury and federal agency obligations in an amount typically at least equal to the market value of the securities loaned. The market value of the loaned securities is determined at the close of business of the fund and any additional required collateral is delivered to the fund on the next business day. State Street provides the fund with indemnification against Borrower default. The fund bears the risk of loss with respect to the investment of cash collateral. On loans collateralized by cash, the cash collateral is invested in a money market fund or short-term securities. A portion of the income generated upon investment of the collateral is remitted to the Borrowers, and the remainder is allocated between the fund and the lending agent. On loans collateralized by U.S. Treasury and/or federal agency obligations, a fee is received from the Borrower, and is allocated between the fund and the lending agent. Income from securities lending is included in interest income on the Statement of Operations. The dividend and interest income earned on the securities loaned is accounted for in the same manner as other dividend and interest income.
35
Notes to Financial Statements – continued
Indemnifications – Under the fund’s organizational documents, its officers and Trustees may be indemnified against certain liabilities and expenses arising out of the performance of their duties to the fund. Additionally, in the normal course of business, the fund enters into agreements with service providers that may contain indemnification clauses. The fund’s maximum exposure under these agreements is unknown as this would involve future claims that may be made against the fund that have not yet occurred.
Investment Transactions and Income – Investment transactions are recorded on the trade date. Interest income is recorded on the accrual basis. Dividends received in cash are recorded on the ex-dividend date. Certain dividends from foreign securities will be recorded when the fund is informed of the dividend if such information is obtained subsequent to the ex-dividend date. Dividend and interest payments received in additional securities are recorded on the ex-dividend or ex-interest date in an amount equal to the value of the security on such date.
The fund may receive proceeds from litigation settlements. Any proceeds received from litigation involving portfolio holdings are reflected in the Statement of Operations in realized gain/loss if the security has been disposed of by the fund or in unrealized gain/loss if the security is still held by the fund. Any other proceeds from litigation not related to portfolio holdings are reflected as other income in the Statement of Operations.
Fees Paid Indirectly – The fund’s custody fee may be reduced according to an arrangement that measures the value of cash deposited with the custodian by the fund. This amount, for the year ended August 31, 2011, is shown as a reduction of total expenses on the Statement of Operations.
Tax Matters and Distributions – The fund intends to qualify as a regulated investment company, as defined under Subchapter M of the Internal Revenue Code, and to distribute all of its taxable income, including realized capital gains. As a result, no provision for federal income tax is required. The fund’s federal tax returns for the prior three fiscal years remain subject to examination by the Internal Revenue Service. Foreign taxes, if any, have been accrued by the fund in the accompanying financial statements.
Distributions to shareholders are recorded on the ex-dividend date. Income and capital gain distributions are determined in accordance with income tax regulations, which may differ from U.S. generally accepted accounting principles. Certain capital accounts in the financial statements are periodically adjusted for permanent differences in order to reflect their tax character. These adjustments have no impact on net assets or net asset value per share. Temporary differences which arise from recognizing certain items of income, expense, gain or loss in different periods for financial statement and tax purposes will reverse at some time in the future. Distributions in excess of net investment income or net realized gains are temporary overdistributions for financial statement purposes resulting
36
Notes to Financial Statements – continued
from differences in the recognition or classification of income or distributions for financial statement and tax purposes.
Book/tax differences primarily relate to wash sale loss deferrals.
The tax character of distributions declared to shareholders for the last two fiscal years is as follows:
| | | | | | | | |
| | | 8/31/11 | | | 8/31/10 | |
| Ordinary income (including any short-term capital gains) | | | $235,320,231 | | | | $189,098,118 | |
The federal tax cost and the tax basis components of distributable earnings were as follows:
| | | | |
| As of 8/31/11 | | | |
| Cost of investments | | | $14,758,369,089 | |
| Gross appreciation | | | 1,973,976,114 | |
| Gross depreciation | | | (725,084,122 | ) |
| Net unrealized appreciation (depreciation) | | | $1,248,891,992 | |
| Undistributed ordinary income | | | 47,774,408 | |
| Capital loss carryforwards | | | (563,599,967 | ) |
| Other temporary differences | | | 1,053,468 | |
As of August 31, 2011, the fund had capital loss carryforwards available to offset future realized gains. Such losses expire as follows:
| | | | |
| 8/31/16 | | | $(155,818,526 | ) |
| 8/31/18 | | | (407,781,441 | ) |
| Total | | | $(563,599,967 | ) |
The availability of a portion of the capital loss carryforwards, which were acquired on July 24, 2009 in connection with the MFS Strategic Value Fund merger, may be limited in a given year.
37
Notes to Financial Statements – continued
Multiple Classes of Shares of Beneficial Interest – The fund offers multiple classes of shares, which differ in their respective distribution, service, and program manager fees. The fund’s income, realized and unrealized gain (loss), and common expenses are allocated to shareholders based on the daily net assets of each class. Dividends are declared separately for each class. Differences in per share dividend rates are generally due to differences in separate class expenses. Class B and Class 529B shares will convert to Class A and Class 529A shares, respectively, approximately eight years after purchase. The fund’s distributions declared to shareholders as reported on the Statements of Changes in Net Assets are presented by class as follows:
| | | | | | | | |
| | | From net investment
income | |
| | | Year ended
8/31/11 | | | Year ended
8/31/10 | |
| Class A | | | $79,687,136 | | | | $77,078,811 | |
| Class B | | | 1,492,577 | | | | 2,307,300 | |
| Class C | | | 6,514,524 | | | | 6,708,476 | |
| Class I | | | 74,923,574 | | | | 51,148,662 | |
| Class W | | | 24,921,624 | | | | 20,874,429 | |
| Class R1 | | | 262,149 | | | | 287,880 | |
| Class R2 | | | 6,100,132 | | | | 4,756,188 | |
| Class R3 | | | 10,824,505 | | | | 7,159,981 | |
| Class R4 | | | 30,488,674 | | | | 18,677,737 | |
| Class 529A | | | 82,488 | | | | 75,622 | |
| Class 529B | | | 7,645 | | | | 8,439 | |
| Class 529C | | | 15,203 | | | | 14,593 | |
| Total | | | $235,320,231 | | | | $189,098,118 | |
| (3) | | Transactions with Affiliates |
Investment Adviser – The fund has an investment advisory agreement with MFS to provide overall investment management and related administrative services and facilities to the fund.
The management fee is computed daily and paid monthly at the following annual rates:
| | | | |
| First $7.5 billion of average daily net assets | | | 0.60 | % |
| Next $2.5 billion of average daily net assets | | | 0.53 | % |
| Average daily net assets in excess of $10 billion | | | 0.50 | % |
The investment adviser has agreed in writing to reduce its management fee to 0.45% of average daily net assets in excess of $12.5 billion. This written agreement will continue until modified by the fund’s Board of Trustees, but such agreement will continue at least until December 31, 2012. This management fee reduction amounted to $1,936,384, which is shown as a reduction of total expenses in the Statement of Operations.
38
Notes to Financial Statements – continued
The management fee incurred for the year ended August 31, 2011 was equivalent to an annual effective rate of 0.54% of the fund’s average daily net assets.
Distributor – MFS Fund Distributors, Inc. (MFD), a wholly-owned subsidiary of MFS, as distributor, received $1,157,919 and $4,256 for the year ended August 31, 2011, as its portion of the initial sales charge on sales of Class A and Class 529A shares of the fund, respectively.
The Board of Trustees has adopted a distribution plan for certain class shares pursuant to Rule 12b-1 of the Investment Company Act of 1940.
The fund’s distribution plan provides that the fund will pay MFD for services provided by MFD and financial intermediaries in connection with the distribution and servicing of certain share classes. One component of the plan is a distribution fee paid to MFD and another component of the plan is a service fee paid to MFD. MFD may subsequently pay all, or a portion, of the distribution and/or service fees to financial intermediaries.
Distribution Plan Fee Table:
| | | | | | | | | | | | | | | | | | | | |
| | | Distribution
Fee Rate (d) | | | Service
Fee Rate (d) | | | Total
Distribution
Plan (d) | | | Annual
Effective
Rate (e) | | | Distribution
and Service
Fee | |
| Class A | | | — | | | | 0.25% | | | | 0.25% | | | | 0.25% | | | | $14,163,016 | |
| Class B | | | 0.75% | | | | 0.25% | | | | 1.00% | | | | 1.00% | | | | 2,340,994 | |
| Class C | | | 0.75% | | | | 0.25% | | | | 1.00% | | | | 1.00% | | | | 9,550,352 | |
| Class W | | | 0.10% | | | | — | | | | 0.10% | | | | 0.10% | | | | 1,586,691 | |
| Class R1 | | | 0.75% | | | | 0.25% | | | | 1.00% | | | | 1.00% | | | | 378,578 | |
| Class R2 | | | 0.25% | | | | 0.25% | | | | 0.50% | | | | 0.50% | | | | 2,586,868 | |
| Class R3 | | | — | | | | 0.25% | | | | 0.25% | | | | 0.25% | | | | 1,941,660 | |
| Class 529A | | | — | | | | 0.25% | | | | 0.25% | | | | 0.25% | | | | 15,669 | |
| Class 529B | | | 0.75% | | | | 0.25% | | | | 1.00% | | | | 1.00% | | | | 13,188 | |
| Class 529C | | | 0.75% | | | | 0.25% | | | | 1.00% | | | | 1.00% | | | | 25,170 | |
| Total Distribution and Service Fees | | | | | | | | | | | | $32,602,186 | |
| (d) | In accordance with the distribution plan for certain classes, the fund pays distribution and/or service fees equal to these annual percentage rates of each class’ average daily net assets. The distribution and service fee rates disclosed by class represent the current rates in effect at the end of the reporting period. |
| (e) | The annual effective rates represent actual fees incurred under the distribution plan for the year ended August 31, 2011 based on each class’ average daily net assets. |
39
Notes to Financial Statements – continued
Certain Class A shares are subject to a contingent deferred sales charge (CDSC) in the event of a shareholder redemption within 24 months of purchase. Class C and Class 529C shares are subject to a CDSC in the event of a shareholder redemption within 12 months of purchase. Class B and Class 529B shares are subject to a CDSC in the event of a shareholder redemption within six years of purchase. All contingent deferred sales charges are paid to MFD and during the year ended August 31, 2011, were as follows:
| | | | |
| | | Amount | |
| Class A | | | $9,626 | |
| Class B | | | 240,187 | |
| Class C | | | 75,490 | |
| Class 529B | | | 64 | |
| Class 529C | | | 253 | |
The fund has entered into and may from time to time enter into contracts with program managers and other parties which administer the tuition programs through which an investment in the fund’s 529 share classes is made. The fund has entered into an agreement with MFD pursuant to which MFD receives an annual fee of up to 0.10% of the average daily net assets attributable to each 529 share class. Effective July 1, 2011, MFD has agreed to waive 0.05% of this annual fee. This waiver agreement will continue until modified by the fund’s Board of Trustees but such agreement will continue at least until December 31, 2012, after which MFD may eliminate this waiver without a vote of the fund’s Board of Trustees. For the period July 1, 2011 through August 31, 2011, this waiver amounted to $869 and is reflected as a reduction of total expenses in the Statement of Operations. The services provided by MFD, or a third party with which MFD contracts, include recordkeeping and tax reporting and account services, as well as services designed to maintain the program’s compliance with the Internal Revenue Code and other regulatory requirements. Program manager fees for the year ended August 31, 2011, were as follows:
| | | | |
| | | Amount | |
| Class 529A | | | $6,268 | |
| Class 529B | | | 1,318 | |
| Class 529C | | | 2,516 | |
| Total Program Manager Fees | | | $10,102 | |
Shareholder Servicing Agent – MFS Service Center, Inc. (MFSC), a wholly-owned subsidiary of MFS, receives a fee from the fund for its services as shareholder servicing agent calculated as a percentage of the average daily net assets of the fund as determined periodically under the supervision of the fund’s Board of Trustees. For the year ended August 31, 2011, the fee was $3,281,414, which equated to 0.0200% annually of the fund’s average daily net assets. MFSC also receives payment from the fund for out-of-pocket expenses, sub-accounting and other shareholder servicing costs which may be paid to
40
Notes to Financial Statements – continued
affiliated and unaffiliated service providers. For the year ended August 31, 2011, these out-of-pocket expenses, sub-accounting and other shareholder servicing costs amounted to $16,062,848.
Under a Special Servicing Agreement among MFS, each MFS fund which invests in other MFS funds (“MFS fund-of-funds”) and certain underlying funds in which a MFS fund-of-funds invests (“underlying funds”), each underlying fund may pay a portion of each MFS fund-of-fund’s transfer agent-related expenses, including sub-accounting fees payable to financial intermediaries, to the extent such payments do not exceed the benefits realized or expected to be realized by the underlying fund from the investment in the underlying fund by the MFS fund-of-fund. For the year ended August 31, 2011, these costs for the fund amounted to $886,156 and are reflected in the shareholder servicing costs on the Statement of Operations.
Administrator – MFS provides certain financial, legal, shareholder communications, compliance, and other administrative services to the fund. Under an administrative services agreement, the fund partially reimburses MFS the costs incurred to provide these services. The fund is charged an annual fixed amount of $17,500 plus a fee based on average daily net assets. The administrative services fee incurred for the year ended August 31, 2011 was equivalent to an annual effective rate of 0.0062% of the fund’s average daily net assets.
Trustees’ and Officers’ Compensation – The fund pays compensation to independent Trustees in the form of a retainer, attendance fees, and additional compensation to Board and Committee chairpersons. The fund does not pay compensation directly to Trustees or officers of the fund who are also officers of the investment adviser, all of whom receive remuneration for their services to the fund from MFS. Certain officers and Trustees of the fund are officers or directors of MFS, MFD, and MFSC.
Prior to December 31, 2001, the fund had an unfunded defined benefit plan (“DB plan”) for independent Trustees. As of December 31, 2001, the Board took action to terminate the DB plan with respect to then-current and any future independent Trustees, such that the DB Plan covers only certain of those former independent Trustees who retired on or before December 31, 2001. The DB Plan resulted in a pension expense of $1,119 and is included in independent Trustees’ compensation for the year ended August 31, 2011. The liability for deferred retirement benefits payable to certain independent Trustees under the DB plan amounted to $5,916 at August 31, 2011, and is included in payable for independent Trustees’ compensation on the Statement of Assets and Liabilities.
Other – This fund and certain other funds managed by MFS (the funds) have entered into services agreements (the Agreements) which provide for payment of fees by the funds to Tarantino LLC and Griffin Compliance LLC in return for
41
Notes to Financial Statements – continued
the provision of services of an Independent Chief Compliance Officer (ICCO) and Assistant ICCO, respectively, for the funds. The ICCO and Assistant ICCO are officers of the funds and the sole members of Tarantino LLC and Griffin Compliance LLC, respectively. The funds can terminate the Agreements with Tarantino LLC and Griffin Compliance LLC at any time under the terms of the Agreements. For the year ended August 31, 2011, the aggregate fees paid by the fund to Tarantino LLC and Griffin Compliance LLC were $145,157 and are included in miscellaneous expense on the Statement of Operations. MFS has agreed to reimburse the fund for a portion of the payments made by the fund in the amount of $72,677, which is shown as a reduction of total expenses in the Statement of Operations. Additionally, MFS has agreed to bear all expenses associated with office space, other administrative support, and supplies provided to the ICCO and Assistant ICCO.
The fund invests in the MFS Institutional Money Market Portfolio which is managed by MFS and seeks a high level of current income consistent with preservation of capital and liquidity. Income earned on this investment is included in dividends from underlying affiliated funds on the Statement of Operations. This money market fund does not pay a management fee to MFS.
Purchases and sales of investments, other than U.S. Government securities, purchased option transactions, and short-term obligations, aggregated $4,218,012,546 and $2,797,813,872, respectively.
| (5) | | Shares of Beneficial Interest |
The fund’s Declaration of Trust permits the Trustees to issue an unlimited number of full and fractional shares of beneficial interest. Transactions in fund shares were as follows:
| | | | | | | | | | | | | | | | |
| | | Year ended
8/31/11 | | | Year ended
8/31/10 | |
| | | Shares | | | Amount | | | Shares | | | Amount | |
| Shares sold | | | | | | | | | | | | | | | | |
Class A | | | 62,704,811 | | | | $1,425,736,635 | | | | 80,921,725 | | | | $1,666,317,936 | |
Class B | | | 1,159,957 | | | | 26,415,364 | | | | 1,441,646 | | | | 29,592,188 | |
Class C | | | 6,077,126 | | | | 137,620,165 | | | | 10,233,797 | | | | 209,195,401 | |
Class I | | | 117,443,500 | | | | 2,718,479,174 | | | | 82,199,222 | | | | 1,701,332,259 | |
Class W | | | 33,275,720 | | | | 756,848,005 | | | | 40,546,955 | | | | 834,335,991 | |
Class R1 | | | 453,979 | | | | 10,168,471 | | | | 765,739 | | | | 15,555,067 | |
Class R2 | | | 6,907,440 | | | | 156,973,644 | | | | 12,046,356 | | | | 246,513,123 | |
Class R3 | | | 13,542,996 | | | | 305,455,006 | | | | 17,836,560 | | | | 367,238,818 | |
Class R4 | | | 42,008,682 | | | | 956,520,758 | | | | 39,607,808 | | | | 813,237,598 | |
Class 529A | | | 50,175 | | | | 1,152,720 | | | | 43,127 | | | | 884,156 | |
Class 529B | | | 4,909 | | | | 110,215 | | | | 7,129 | | | | 145,973 | |
Class 529C | | | 15,655 | | | | 355,815 | | | | 38,206 | | | | 782,077 | |
| | | 283,644,950 | | | | $6,495,835,972 | | | | 285,688,270 | | | | $5,885,130,587 | |
42
Notes to Financial Statements – continued
| | | | | | | | | | | | | | | | |
| | | Year ended
8/31/11 | | | Year ended
8/31/10 | |
| | | Shares | | | Amount | | | Shares | | | Amount | |
| Shares issued to shareholders in reinvestment of distributions | | | | | | | | | | | | | | | | |
Class A | | | 2,998,229 | | | | $67,813,254 | | | | 3,264,339 | | | | $66,600,303 | |
Class B | | | 56,778 | | | | 1,277,651 | | | | 97,997 | | | | 1,986,404 | |
Class C | | | 169,237 | | | | 3,805,591 | | | | 200,345 | | | | 4,048,522 | |
Class I | | | 2,098,323 | | | | 47,861,762 | | | | 1,561,457 | | | | 31,966,568 | |
Class W | | | 1,064,264 | | | | 24,021,122 | | | | 989,823 | | | | 20,175,204 | |
Class R1 | | | 11,702 | | | | 261,517 | | | | 14,305 | | | | 287,367 | |
Class R2 | | | 260,103 | | | | 5,845,530 | | | | 220,289 | | | | 4,460,253 | |
Class R3 | | | 478,841 | | | | 10,821,078 | | | | 351,872 | | | | 7,157,606 | |
Class R4 | | | 1,281,335 | | | | 29,130,748 | | | | 825,880 | | | | 16,853,941 | |
Class 529A | | | 3,662 | | | | 82,488 | | | | 3,727 | | | | 75,575 | |
Class 529B | | | 343 | | | | 7,645 | | | | 421 | | | | 8,439 | |
Class 529C | | | 678 | | | | 15,196 | | | | 731 | | | | 14,593 | |
| | | 8,423,495 | | | | $190,943,582 | | | | 7,531,186 | | | | $153,634,775 | |
| Shares reacquired | | | | | | | | | | | | | | | | |
Class A | | | (88,720,645 | ) | | | $(2,030,909,368 | ) | | | (68,850,258 | ) | | | $(1,410,373,043 | ) |
Class B | | | (5,132,927 | ) | | | (116,429,250 | ) | | | (8,482,786 | ) | | | (174,457,904 | ) |
Class C | | | (9,165,115 | ) | | | (207,833,868 | ) | | | (7,641,969 | ) | | | (154,955,461 | ) |
Class I | | | (47,487,099 | ) | | | (1,091,994,204 | ) | | | (35,415,896 | ) | | | (726,882,434 | ) |
Class W | | | (44,837,630 | ) | | | (1,047,186,364 | ) | | | (21,479,518 | ) | | | (440,002,599 | ) |
Class R1 | | | (611,678 | ) | | | (13,817,475 | ) | | | (667,705 | ) | | | (13,464,981 | ) |
Class R2 | | | (6,368,047 | ) | | | (145,682,373 | ) | | | (5,020,720 | ) | | | (102,325,969 | ) |
Class R3 | | | (9,228,803 | ) | | | (211,435,251 | ) | | | (5,593,254 | ) | | | (114,772,226 | ) |
Class R4 | | | (15,115,168 | ) | | | (348,328,665 | ) | | | (9,036,461 | ) | | | (186,101,258 | ) |
Class 529A | | | (31,288 | ) | | | (702,769 | ) | | | (38,237 | ) | | | (780,523 | ) |
Class 529B | | | (14,420 | ) | | | (324,695 | ) | | | (8,648 | ) | | | (173,316 | ) |
Class 529C | | | (16,702 | ) | | | (364,899 | ) | | | (14,545 | ) | | | (299,674 | ) |
| | | (226,729,522 | ) | | | $(5,215,009,181 | ) | | | (162,249,997 | ) | | | $(3,324,589,388 | ) |
| Net change | | | | | | | | | | | | | | | | |
Class A | | | (23,017,605 | ) | | | $(537,359,479 | ) | | | 15,335,806 | | | | $322,545,196 | |
Class B | | | (3,916,192 | ) | | | (88,736,235 | ) | | | (6,943,143 | ) | | | (142,879,312 | ) |
Class C | | | (2,918,752 | ) | | | (66,408,112 | ) | | | 2,792,173 | | | | 58,288,462 | |
Class I | | | 72,054,724 | | | | 1,674,346,732 | | | | 48,344,783 | | | | 1,006,416,393 | |
Class W | | | (10,497,646 | ) | | | (266,317,237 | ) | | | 20,057,260 | | | | 414,508,596 | |
Class R1 | | | (145,997 | ) | | | (3,387,487 | ) | | | 112,339 | | | | 2,377,453 | |
Class R2 | | | 799,496 | | | | 17,136,801 | | | | 7,245,925 | | | | 148,647,407 | |
Class R3 | | | 4,793,034 | | | | 104,840,833 | | | | 12,595,178 | | | | 259,624,198 | |
Class R4 | | | 28,174,849 | | | | 637,322,841 | | | | 31,397,227 | | | | 643,990,281 | |
Class 529A | | | 22,549 | | | | 532,439 | | | | 8,617 | | | | 179,208 | |
Class 529B | | | (9,168 | ) | | | (206,835 | ) | | | (1,098 | ) | | | (18,904 | ) |
Class 529C | | | (369 | ) | | | 6,112 | | | | 24,392 | | | | 496,996 | |
| | | 65,338,923 | | | | $1,471,770,373 | | | | 130,969,459 | | | | $2,714,175,974 | |
43
Notes to Financial Statements – continued
The fund is one of several mutual funds in which the MFS funds-of-funds may invest. The MFS funds-of-funds do not invest in the underlying MFS funds for the purpose of exercising management or control. At the end of the period, the MFS Growth Allocation Fund, MFS Moderate Allocation Fund, and MFS Aggressive Growth Allocation Fund were the owners of record of approximately 2%, 1%, and 1% respectively, of the value of outstanding voting shares of the fund. In addition, the MFS Conservative Allocation Fund, MFS Lifetime Retirement Income Fund, MFS Lifetime 2010 Fund, MFS Lifetime 2020 Fund, MFS Lifetime 2030 Fund, MFS Lifetime 2040 Fund, and MFS Lifetime 2050 Fund were each the owners of record of less than 1% of the value of outstanding voting shares of the fund.
The fund and certain other funds managed by MFS participate in a $1.1 billion unsecured committed line of credit, subject to a $1 billion sublimit, provided by a syndication of banks under a credit agreement. Borrowings may be made for temporary financing needs. Interest is charged to each fund, based on its borrowings, generally at a rate equal to the higher of the Federal Reserve funds rate or one month LIBOR plus an agreed upon spread. A commitment fee, based on the average daily, unused portion of the committed line of credit, is allocated among the participating funds at the end of each calendar quarter. In addition, the fund and other funds managed by MFS have established unsecured uncommitted borrowing arrangements with certain banks for temporary financing needs. Interest is charged to each fund, based on its borrowings, at a rate equal to the Federal Reserve funds rate plus an agreed upon spread. For the year ended August 31, 2011, the fund’s commitment fee and interest expense were $144,347 and $0, respectively, and are included in miscellaneous expense on the Statement of Operations.
The fund’s investment adviser, MFS, was the subject of an administrative proceeding concerning market timing which resulted in the Securities and Exchange Commission (the “SEC”) entering an order approving a settlement with MFS and two of its former officers (the “Settlement Order”). Under the terms of the Settlement Order, MFS transferred $175 million in disgorgement and $50 million in penalty (the “Payments”) to the SEC, which established a Fair Fund from which settlement funds have been distributed to eligible current and former shareholders of the fund and certain other affected MFS retail funds. The Payments, along with additional amounts from a third-party settlement, have been distributed to eligible shareholders in accordance with a plan developed by an independent distribution consultant (the “IDC”) in consultation with MFS and the Board of Trustees of the MFS retail funds. The plan was approved in July 2007 by the SEC. Pursuant to the distribution plan,
44
Notes to Financial Statements – continued
after the distributions to eligible shareholders have been made, any undistributed amounts could be designated “residual” and distributed to the fund and certain other affected MFS retail funds for the benefit of fund shareholders. In November 2010, the SEC issued an order designating certain undistributed amounts residual and ordering that such amounts be distributed to the affected MFS retail funds. The SEC order designated other undistributed amounts for use in funding certain additional distribution efforts to eligible shareholders. As a result of the SEC’s approval of the residual payments, the fund received $135,690 in November 2010. These additional distribution efforts were completed in 2011. The final residual payment of $80,866 was recorded by the fund in August 2011, in accordance with an SEC order designating remaining undistributed amounts as residual and ordering that such amounts be distributed to the affected MFS retail funds. No further residual amounts are to be received by the fund.
| (8) | | Transactions in Underlying Affiliated Funds-Affiliated Issuers |
An affiliated issuer may be considered one in which the fund owns 5% or more of the outstanding voting securities, or a company which is under common control. For the purposes of this report, the fund assumes the following to be affiliated issuers:
| | | | | | | | | | | | | | | | |
| Underlying Affiliated Funds | | Beginning
Shares/Par
Amount | | | Acquisitions
Shares/Par
Amount | | | Dispositions
Shares/Par
Amount | | | Ending
Shares/Par
Amount | |
MFS Institutional Money
Market Portfolio | | | 106,341,435 | | | | 2,415,269,076 | | | | (2,367,677,951 | ) | | | 153,932,560 | |
| | | | |
| Underlying Affiliated Funds | | Realized
Gain (Loss) | | | Capital Gain
Distributions | | | Dividend
Income | | | Ending
Value | |
MFS Institutional Money
Market Portfolio | | | $— | | | | $— | | | | $317,608 | | | | $153,932,560 | |
On September 13, 2011, the fund paid redemption proceeds by a distribution in-kind of portfolio securities and cash that were valued at $15,788,491. The redeeming shareholder received a pro rata share of each of the securities held by the fund. The sale of such securities represented 0.10% of that day’s net assets.
45
REPORT OF INDEPENDENT REGISTERED PUBLIC ACCOUNTING FIRM
To the Board of Trustees of MFS Series Trust I and Shareholders of
MFS Value Fund:
We have audited the accompanying statement of assets and liabilities of MFS Value Fund (the Fund) (one of the portfolios comprising MFS Series Trust I), including the portfolio of investments, as of August 31, 2011, and the related statement of operations for the year then ended, the statements of changes in net assets for each of the two years in the period then ended, and the financial highlights for each of the five years in the period then ended. These financial statements and financial highlights are the responsibility of the Fund’s management. Our responsibility is to express an opinion on these financial statements and financial highlights based on our audits.
We conducted our audits in accordance with the standards of the Public Company Accounting Oversight Board (United States). Those standards require that we plan and perform the audit to obtain reasonable assurance about whether the financial statements and financial highlights are free of material misstatement. We were not engaged to perform an audit of the Fund’s internal control over financial reporting. Our audits included consideration of internal control over financial reporting as a basis for designing audit procedures that are appropriate in the circumstances, but not for the purpose of expressing an opinion on the effectiveness of the Fund’s internal control over financial reporting. Accordingly, we express no such opinion. An audit also includes examining, on a test basis, evidence supporting the amounts and disclosures in the financial statements and financial highlights, assessing the accounting principles used and significant estimates made by management, and evaluating the overall financial statement presentation. Our procedures included confirmation of securities owned as of August 31, 2011, by correspondence with the custodian and brokers. We believe that our audits provide a reasonable basis for our opinion.
In our opinion, the financial statements and financial highlights referred to above present fairly, in all material respects, the financial position of the MFS Value Fund at August 31, 2011, the results of its operations for the year then ended, the changes in its net assets for each of the two years in the period then ended, and its financial highlights for each of the five years in the period then ended, in conformity with U.S. generally accepted accounting principles.

Boston, Massachusetts
October 17, 2011
46
TRUSTEES AND OFFICERS —
IDENTIFICATION AND BACKGROUND
The Trustees and officers of the Trust, as of October 1, 2011, are listed below, together with their principal occupations during the past five years. (Their titles may have varied during that period.) The address of each Trustee and officer is 500 Boylston Street, Boston, Massachusetts 02116.
| | | | | | | | |
Name, Age | | Position(s) Held with Fund | | Trustee/Officer
Since (h) | | Principal
Occupations During the Past Five Years | | Other
Directorships (j) |
| INTERESTED TRUSTEES |
Robert J. Manning (k)
(age 47) | | Trustee | | February 2004 | | Massachusetts Financial Services Company, Chairman, Chief Executive Officer and Director; President (until December 2009); Chief Investment Officer (until July 2010) | | |
Robert C. Pozen (k)
(age 65) | | Trustee | | February 2004 | | Massachusetts Financial Services Company, Chairman Emeritus; Chairman (until July 2010) | | Medtronic, Inc, (medical devices), Director (since 2004); The Neilsen Company (market research), Director (since 2010); Telesat (satellite communications), Director (until November 2007); Bell Canada Enterprises (telecommunications), Director (until February 2009) |
47
Trustees and Officers – continued
| | | | | | | | |
Name, Age | | Position(s) Held with Fund | | Trustee/Officer
Since (h) | | Principal Occupations
During the Past Five Years | | Other
Directorships (j) |
| INDEPENDENT TRUSTEES |
David H. Gunning
(age 69) | | Trustee and Chair of Trustees | | January 2004 | | Retired; Cleveland-Cliffs Inc. (mining products and service provider), Vice Chairman/Director (until May 2007) | | Lincoln Electric Holdings, Inc. (welding equipment manufacturer), Director; Development Alternatives, Inc. (consulting), Director/Non-Executive Chairman; Portman Limited (mining), Director (until 2008) |
Robert E. Butler
(age 69) | | Trustee | | January 2006 | | Consultant – investment company industry regulatory and compliance matters | | |
Maureen R. Goldfarb
(age 56) | | Trustee | | January 2009 | | Private investor | | |
William R. Gutow
(age 70) | | Trustee | | December 1993 | | Private investor and real estate consultant; Capitol Entertainment Management Company (video franchise), Vice Chairman | | Atlantic Coast Tan (tanning salons), Vice Chairman (until 2007); Texas Donuts (donut franchise), Vice Chairman (until 2010) |
Michael Hegarty
(age 66) | | Trustee | | December 2004 | | Private investor | | |
48
Trustees and Officers – continued
| | | | | | | | |
Name, Age | | Position(s) Held with Fund | | Trustee/Officer
Since (h) | | Principal
Occupations During the Past Five Years | | Other
Directorships (j) |
John P. Kavanaugh
(age 56) | | Trustee | | January 2009 | | Private investor; The Hanover Insurance Group, Inc., Vice President and Chief Investment Officer (until 2006); Allmerica Investment Trust, Allmerica Securities Trust and Opus Investment Trust (investment companies), Chairman, President and Trustee (until 2006) | | |
J. Dale Sherratt
(age 73) | | Trustee | | June 1989 | | Insight Resources, Inc. (acquisition planning specialists), President; Wellfleet Investments (investor in health care companies), Managing General Partner | | |
Laurie J. Thomsen
(age 54) | | Trustee | | March 2005 | | Private investor; New Profit, Inc. (venture philanthropy), Executive Partner (until 2010) | | The Travelers Companies (property and casualty insurance), Director |
Robert W. Uek
(age 70) | | Trustee | | January 2006 | | Consultant to investment company industry | | |
| OFFICERS | | | | | | | | |
Maria F. DiOrioDwyer (k)
(age 52) | | President | | March 2004 | | Massachusetts Financial Services Company, Executive Vice President and Chief Regulatory Officer Chief Compliance Officer (since December 2006) | | |
Christopher R. Bohane (k)
(age 37) | | Assistant Secretary and Assistant Clerk | | July 2005 | | Massachusetts Financial Services Company, Vice President and Senior Counsel | | |
49
Trustees and Officers – continued
| | | | | | | | |
Name, Age | | Position(s) Held with Fund | | Trustee/Officer
Since (h) | | Principal Occupations
During the Past Five Years | | Other
Directorships (j) |
John M. Corcoran (k)
(age 46) | | Treasurer | | October 2008 | | Massachusetts Financial Services Company, Senior Vice President (since October 2008); State Street Bank and Trust (financial services provider), Senior Vice President, (until September 2008) | | |
Ethan D. Corey (k)
(age 47) | | Assistant Secretary and Assistant Clerk | | July 2005 | | Massachusetts Financial Services Company, Senior Vice President and Associate General Counsel | | |
David L. DiLorenzo (k)
(age 43) | | Assistant Treasurer | | July 2005 | | Massachusetts Financial Services Company, Vice President | | |
Timothy M. Fagan (k)
(age 43) | | Assistant Secretary and Assistant Clerk | | September 2005 | | Massachusetts Financial Services Company, Vice President and Senior Counsel | | |
Robyn L. Griffin
(age 36) | | Assistant Independent Chief Compliance Officer | | August 2008 | | Griffin Compliance LLC (provider of compliance services), Principal (since August 2008); State Street Corporation (financial services provider), Mutual Fund Administration Assistant Vice President (October 2006 – July 2008); Liberty Mutual Group (insurance), Personal Market Assistant Controller (April 2006 – October 2006); Deloitte & Touche LLP (professional services firm). | | |
50
Trustees and Officers – continued
| | | | | | | | |
Name, Age | | Position(s) Held with Fund | | Trustee/Officer
Since (h) | | Principal Occupations
During the Past Five Years | | Other
Directorships (j) |
Brian E. Langenfeld (k)
(age 38) | | Assistant Secretary and Assistant Clerk | | June 2006 | | Massachusetts Financial Services Company, Vice President and Senior Counsel | | |
Ellen Moynihan (k)
(age 53) | | Assistant Treasurer | | April 1997 | | Massachusetts Financial Services Company, Senior Vice President | | |
Susan S. Newton (k)
(age 61) | | Assistant Secretary and Assistant Clerk | | May 2005 | | Massachusetts Financial Services Company, Senior Vice President and Associate General Counsel | | |
Susan A. Pereira (k)
(age 40) | | Assistant Secretary and Assistant Clerk | | July 2005 | | Massachusetts Financial Services Company, Vice President and Senior Counsel | | |
Mark N. Polebaum (k)
(age 59) | | Secretary and Clerk | | January 2006 | | Massachusetts Financial Services Company, Executive Vice President, General Counsel and Secretary | | |
Frank L. Tarantino
(age 67) | | Independent Chief Compliance Officer | | June 2004 | | Tarantino LLC (provider of compliance services), Principal | | |
Richard S. Weitzel (k)
(age 41) | | Assistant Secretary and Assistant Clerk | | October 2007 | | Massachusetts Financial Services Company, Vice President and Assistant General Counsel | | |
James O. Yost (k)
(age 51) | | Assistant Treasurer | | September 1990 | | Massachusetts Financial Services Company, Senior Vice President | | |
| (h) | Date first appointed to serve as Trustee/officer of an MFS fund. Each Trustee has served continuously since appointment unless indicated otherwise. For the period from December 15, 2004 until February 22, 2005, Messrs. Pozen and Manning served as Advisory Trustees. For the period March 2008 until October 2008, Ms. DiOrioDwyer served as Treasurer of the Funds. |
51
Trustees and Officers – continued
| (j) | Directorships or trusteeships of companies required to report to the Securities and Exchange Commission (i.e., “public companies”). |
| (k) | “Interested person” of the Trust within the meaning of the Investment Company Act of 1940 (referred to as the 1940 Act), which is the principal federal law governing investment companies like the fund, as a result of position with MFS. The address of MFS is 500 Boylston Street, Boston, Massachusetts 02116. |
Each Trustee has been elected by shareholders and each Trustee and officer holds office until his or her successor is chosen and qualified or until his or her earlier death, resignation, retirement or removal. The Trust does not hold annual meetings for the purpose of electing Trustees, and Trustees are not elected for fixed terms. Messrs. Butler, Kavanaugh, Uek and Ms. Thomsen are members of the Trust’s Audit Committee.
Each of the Fund’s Trustees and officers holds comparable positions with certain other funds of which MFS or a subsidiary is the investment adviser or distributor, and, in the case of the officers, with certain affiliates of MFS. As of January 1, 2011, the Trustees served as board members of 105 funds within the MFS Family of Funds.
The Statement of Additional Information for the Fund includes further information about the Trustees and is available without charge upon request by calling 1-800-225-2606.
| | |
| Investment Adviser | | Custodian |
Massachusetts Financial Services Company
500 Boylston Street, Boston, MA 02116-3741 | | State Street Bank and Trust
1 Lincoln Street, Boston, MA 02111-2900 |
| Distributor | | Independent Registered Public Accounting Firm |
MFS Fund Distributors, Inc.
500 Boylston Street, Boston, MA 02116-3741 | | Ernst & Young LLP 200 Clarendon Street, Boston, MA 02116 |
| Portfolio Managers | | |
Nevin Chitkara Steven Gorham | | |
52
BOARD REVIEW OF INVESTMENT ADVISORY AGREEMENT
The Investment Company Act of 1940 requires that both the full Board of Trustees and a majority of the non-interested (“independent”) Trustees, voting separately, annually approve the continuation of the Fund’s investment advisory agreement with MFS. The Trustees consider matters bearing on the Fund and its advisory arrangements at their meetings throughout the year, including a review of performance data at each regular meeting. In addition, the independent Trustees met several times over the course of three months beginning in May and ending in July, 2011 (“contract review meetings”) for the specific purpose of considering whether to approve the continuation of the investment advisory agreement for the Fund and the other investment companies that the Board oversees (the “MFS Funds”). The independent Trustees were assisted in their evaluation of the Fund’s investment advisory agreement by independent legal counsel, from whom they received separate legal advice and with whom they met separately from MFS during various contract review meetings. The independent Trustees were also assisted in this process by the MFS Funds’ Independent Chief Compliance Officer, a full-time senior officer appointed by and reporting to the independent Trustees.
In connection with their deliberations regarding the continuation of the investment advisory agreement, the Trustees, including the independent Trustees, considered such information and factors as they believed, in light of the legal advice furnished to them and their own business judgment, to be relevant. The investment advisory agreement for the Fund was considered separately, although the Trustees also took into account the common interests of all MFS Funds in their review. As described below, the Trustees considered the nature, quality, and extent of the various investment advisory, administrative, and shareholder services performed by MFS under the existing investment advisory agreement and other arrangements with the Fund.
In connection with their contract review meetings, the Trustees received and relied upon materials that included, among other items: (i) information provided by Lipper Inc., an independent third party, on the investment performance of the Fund for various time periods ended December 31, 2010 and the investment performance of a group of funds with substantially similar investment classifications/objectives (the “Lipper performance universe”), (ii) information provided by Lipper Inc. on the Fund’s advisory fees and other expenses and the advisory fees and other expenses of comparable funds identified by Lipper Inc. (the “Lipper expense group”), (iii) information provided by MFS on the advisory fees of comparable portfolios of other clients of MFS, including institutional separate accounts and other clients, (iv) information as to whether and to what extent applicable expense waivers,
53
Board Review of Investment Advisory Agreement – continued
reimbursements or fee “breakpoints” are observed for the Fund, (v) information regarding MFS’ financial results and financial condition, including MFS’ and certain of its affiliates’ estimated profitability from services performed for the Fund and the MFS Funds as a whole, and compared to MFS’ institutional business, (vi) MFS’ views regarding the outlook for the mutual fund industry and the strategic business plans of MFS, (vii) descriptions of various functions performed by MFS for the Funds, such as compliance monitoring and portfolio trading practices, and (viii) information regarding the overall organization of MFS, including information about MFS’ senior management and other personnel providing investment advisory, administrative and other services to the Fund and the other MFS Funds. The comparative performance, fee and expense information prepared and provided by Lipper Inc. was not independently verified and the independent Trustees did not independently verify any information provided to them by MFS.
The Trustees’ conclusion as to the continuation of the investment advisory agreement was based on a comprehensive consideration of all information provided to the Trustees and not the result of any single factor. Some of the factors that figured particularly in the Trustees’ deliberations are described below, although individual Trustees may have evaluated the information presented differently from one another, giving different weights to various factors. It is also important to recognize that the fee arrangements for the Fund and other MFS Funds are the result of years of review and discussion between the independent Trustees and MFS, that certain aspects of such arrangements may receive greater scrutiny in some years than in others, and that the Trustees’ conclusions may be based, in part, on their consideration of these same arrangements during the course of the year and in prior years.
Based on information provided by Lipper Inc., the Trustees reviewed the Fund’s total return investment performance as well as the performance of peer groups of funds over various time periods. The Trustees placed particular emphasis on the total return performance of the Fund’s Class A shares in comparison to the performance of funds in its Lipper performance universe over the three-year period ended December 31, 2010, which the Trustees believed was a long enough period to reflect differing market conditions. The total return performance of the Fund’s Class A shares was in the 2nd quintile relative to the other funds in the universe for this three-year period (the 1st quintile being the best performers and the 5th quintile being the worst performers). The total return performance of the Fund’s Class A shares was in the 4th quintile for the one-year period and the 1st quintile for the five-year period ended December 31, 2010 relative to the Lipper performance universe. Because of the passage of time, these performance results are likely to differ from the performance results for more recent periods, including those shown elsewhere in this report.
54
Board Review of Investment Advisory Agreement – continued
In the course of their deliberations, the Trustees took into account information provided by MFS in connection with the contract review meetings, as well as during investment review meetings conducted with portfolio management personnel during the course of the year regarding the Fund’s performance. After reviewing these and related factors, the Trustees concluded, within the context of their overall conclusions regarding the investment advisory agreement, that they were satisfied with MFS’ responses and efforts relating to investment performance.
In assessing the reasonableness of the Fund’s advisory fee, the Trustees considered, among other information, the Fund’s advisory fee and the total expense ratio of the Fund’s Class A shares as a percentage of average daily net assets and the advisory fee and total expense ratios of peer groups of funds based on information provided by Lipper Inc. The Trustees considered that, according to the Lipper data (which takes into account any fee reductions or expense limitations that were in effect during the Fund’s last fiscal year), the Fund’s effective advisory fee rate was higher than the Lipper expense group median, and the Fund’s total expense ratio was approximately at the Lipper expense group median.
The Trustees also considered the advisory fees charged by MFS to institutional accounts. In comparing these fees, the Trustees considered information provided by MFS as to the generally broader scope of services provided by MFS to the Fund in comparison to institutional accounts, the higher demands placed on MFS’ investment personnel and trading infrastructure as a result of the daily cash in-flows and out-flows of the Fund, and the impact on MFS and expenses associated with the more extensive regulatory regime to which the Fund is subject in comparison to institutional accounts.
The Trustees also considered whether the Fund is likely to benefit from any economies of scale in the management of the Fund in the event of growth in assets of the Fund. They noted that the Fund’s advisory fee rate schedule is subject to contractual breakpoints that reduce the Fund’s advisory fee rate on average daily net assets over $7.5 billion and $10 billion, and that MFS has agreed in writing to reduce its advisory fee on average daily net assets over $12.5 billion, which may not be changed without the Trustees’ approval. The Trustees concluded that the existing breakpoints were sufficient to allow the Fund to benefit from economies of scale as its assets grow.
The Trustees also considered information prepared by MFS relating to MFS’ costs and profits with respect to the Fund, the MFS Funds considered as a group, and other investment companies and accounts advised by MFS, as well as MFS’ methodologies used to determine and allocate its costs to the MFS Funds, the Fund and other accounts and products for purposes of estimating profitability.
55
Board Review of Investment Advisory Agreement – continued
After reviewing these and other factors described herein, the Trustees concluded, within the context of their overall conclusions regarding the investment advisory agreement, that the advisory fees charged to the Fund represent reasonable compensation in light of the services being provided by MFS to the Fund.
In addition, the Trustees considered MFS’ resources and related efforts to continue to retain, attract and motivate capable personnel to serve the Fund. The Trustees also considered current and developing conditions in the financial services industry, including the presence of large and well-capitalized companies which are spending, and appear to be prepared to continue to spend, substantial sums to engage personnel and to provide services to competing investment companies. In this regard, the Trustees also considered the financial resources of MFS and its ultimate parent, Sun Life Financial Inc. The Trustees also considered the advantages and possible disadvantages to the Fund of having an adviser that also serves other investment companies as well as other accounts.
The Trustees also considered the nature, quality, cost, and extent of administrative, transfer agency, and distribution services provided to the Fund by MFS and its affiliates under agreements and plans other than the investment advisory agreement, including any 12b-1 fees the Fund pays to MFS Fund Distributors, Inc., an affiliate of MFS. The Trustees also considered the nature, extent and quality of certain other services MFS performs or arranges for on the Fund’s behalf, which may include securities lending programs, directed expense payment programs, class action recovery programs, and MFS’ interaction with third-party service providers, principally custodians and sub-custodians. The Trustees concluded that the various non-advisory services provided by MFS and its affiliates on behalf of the Fund were satisfactory.
The Trustees also considered benefits to MFS from the use of the Fund’s portfolio brokerage commissions, if applicable, to pay for investment research, and various other factors. Additionally, the Trustees considered so-called “fall-out benefits” to MFS such as reputational value derived from serving as investment manager to the Fund.
Based on their evaluation of factors that they deemed to be material, including those factors described above, the Board of Trustees, including a majority of the independent Trustees, concluded that the Fund’s investment advisory agreement with MFS should be continued for an additional one-year period, commencing August 1, 2011.
A discussion regarding the Board’s most recent review and renewal of the fund’s Investment Advisory Agreement with MFS will be available on or about November 1, 2011 by clicking on the fund’s name under “Mutual Funds” in the “Products and Performance” section of the MFS Web site (mfs.com).
56
PROXY VOTING POLICIES AND INFORMATION
A general description of the MFS funds’ proxy voting policies and procedures is available without charge, upon request, by calling
1-800-225-2606, by visiting the Proxy Voting section of mfs.com or by visiting the SEC’s Web site at http://www.sec.gov.
Information regarding how the fund voted proxies relating to portfolio securities during the most recent twelve-month period ended June 30 is available without charge by visiting the Proxy Voting section of mfs.com or by visiting the SEC’s Web site at http://www.sec.gov.
QUARTERLY PORTFOLIO DISCLOSURE
The fund will file a complete schedule of portfolio holdings with the Securities and Exchange Commission (the Commission) for the first and third quarters of each fiscal year on Form N-Q. The fund’s Form N-Q may be reviewed and copied at the:
Public Reference Room
Securities and Exchange Commission
100 F Street, NE, Room 1580
Washington, D.C. 20549
Information on the operation of the Public Reference Room may be obtained by calling the Commission at 1-800-SEC-0330. The fund’s Form N-Q is available on the EDGAR database on the Commission’s Internet Web site at http://www.sec.gov, and copies of this information may be obtained, upon payment of a duplicating fee, by electronic request at the following e-mail address: publicinfo@sec.gov or by writing the Public Reference Section at the above address.
A shareholder can also obtain the quarterly portfolio holdings report at mfs.com.
FURTHER INFORMATION
From time to time, MFS may post important information about the fund or the MFS funds on the MFS web site (mfs.com). This information is available by visiting the “News & Commentary” section of mfs.com or by clicking on the fund’s name under “Mutual Funds” in the “Products and Performance” section of mfs.com.
FEDERAL TAX INFORMATION (unaudited)
The fund will notify shareholders of amounts for use in preparing 2011 income tax forms in January 2012. The following information is provided pursuant to provisions of the Internal Revenue Code.
The fund designates the maximum amount allowable as qualified dividend income eligible for the 15% tax rate.
For corporate shareholders, 100% of the ordinary income dividends paid during the fiscal year qualify for the corporate dividends received deduction.
57
rev. 3/11
| | | | |
| FACTS | | WHAT DOES MFS DO WITH YOUR PERSONAL INFORMATION? | |  |
| | |
| Why? | | Financial companies choose how they share your personal information. Federal law gives consumers the right to limit some but not all sharing. Federal law also requires us to tell you how we collect, share, and protect your personal information. Please read this notice carefully to understand what we do. |
| | |
| What? | | The types of personal information we collect and share depend on the product or service you have with us. This information can include: •Social Security number and account balances •Account transactions and transaction history •Checking account information and wire transfer instructions When you are no longer our customer, we continue to share your information as described in this notice. |
| | |
| How? | | All financial companies need to share customers’ personal information to run their everyday business. In the section below, we list the reasons financial companies can share their customers’ personal information; the reasons MFS chooses to share; and whether you can limit this sharing. |
| | | | |
| Reasons we can share your personal information | | Does MFS share? | | Can you limit
this sharing? |
For our everyday business purposes – such as to process your transactions, maintain your account(s), respond to court orders and legal investigations, or report to credit bureaus | | Yes | | No |
For our marketing purposes – to offer our products and services to you | | No | | We don’t share |
| For joint marketing with other financial companies | | No | | We don’t share |
For our affiliates’ everyday business purposes – information about your transactions and experiences | | No | | We don’t share |
For our affiliates’ everyday business purposes – information about your creditworthiness | | No | | We don’t share |
| For nonaffiliates to market to you | | No | | We don’t share |
| | |
| Questions? | | Call 800-225-2606 or go to mfs.com. |
58
| | |
| Who we are |
| Who is providing this notice? | | MFS Funds, MFS Investment Management, MFS Institutional Advisors, Inc., MFS Fund Distributors, Inc., MFS Heritage Trust Company, and MFS Service Center, Inc. |
| | |
| What we do |
| How does MFS protect my personal information? | | To protect your personal information from unauthorized access and use, we use security measures that comply with federal law. These measures include procedural, electronic, and physical safeguards for the protection of the personal information we collect about you. |
How does MFS
collect my personal information? | | We collect your personal information, for example, when you •open an account or provide account information •direct us to buy securities or direct us to sell your securities •make a wire transfer We also collect your personal information from others, such as credit bureaus, affiliates and other companies. |
| Why can’t I limit all sharing? | | Federal law gives you the right to limit only •sharing for affiliates’ everyday business purposes – information about your creditworthiness •affiliates from using your information to market to you •sharing for nonaffiliates to market to you State laws and individual companies may give you additional rights to limit sharing. |
| | |
| Definitions |
| Affiliates | | Companies related by common ownership or control. They can be financial and nonfinancial companies. •MFS does not share personal information with affiliates, except for everyday business purposes as described on page one of this notice. |
| Nonaffiliates | | Companies not related by common ownership or control. They can be financial and nonfinancial companies. •MFS does not share with nonaffiliates so they can market to you. |
| Joint Marketing | | A formal agreement between nonaffiliated financial companies that together market financial products or services to you. •MFS doesn’t jointly market. |
| | |
| Other important information |
| If you own an MFS product or receive an MFS service in the name of a third party such as a bank or broker-dealer, their privacy policy may apply to you instead of ours. |
59
Save paper with eDelivery.
MFS® will send you prospectuses, reports, and proxies directly via e-mail so you will get information faster with less mailbox clutter.
To sign up:
1. Go to mfs.com.
2. Log in via MFS® Access.
3. Select eDelivery.
If you own your MFS fund shares through a financial institution or a retirement plan, MFS® TALK, MFS® Access, or eDelivery may not be available to you.

Web site
mfs.com
MFS TALK
1-800-637-8255
24 hours a day
Account service and literature
Shareholders
1-800-225-2606
Financial advisors
1-800-343-2829
Retirement plan services
1-800-637-1255
Mailing address
MFS Service Center, Inc.
P.O. Box 55824
Boston, MA 02205-5824
Overnight mail
MFS Service Center, Inc.
c/o Boston Financial Data Services
30 Dan Road
Canton, MA 02021-2809
The Registrant has adopted a Code of Ethics pursuant to Section 406 of the Sarbanes-Oxley Act and as defined in Form N-CSR that applies to the Registrant’s principal executive officer and principal financial and accounting officer. During the period covered by this report, the Registrant has not amended any provision in its Code of Ethics (the “Code”) that relates to an element of the Code’s definitions enumerated in paragraph (b) of Item 2 of this Form N-CSR. During the period covered by this report, the Registrant did not grant a waiver, including an implicit waiver, from any provision of the Code.
A copy of the Code of Ethics is filed as an exhibit to this Form N-CSR.
| ITEM 3. | AUDIT COMMITTEE FINANCIAL EXPERT. |
Messrs. Robert E. Butler, John P. Kavanaugh and Robert W. Uek and Ms. Laurie J. Thomsen, members of the Audit Committee, have been determined by the Board of Trustees in their reasonable business judgment to meet the definition of “audit committee financial expert” as such term is defined in Form N-CSR. In addition, Messrs. Butler, Kavanaugh and Uek and Ms. Thomsen are “independent” members of the Audit Committee (as such term has been defined by the Securities and Exchange Commission in regulations implementing Section 407 of the Sarbanes-Oxley Act of 2002). The Securities and Exchange Commission has stated that the designation of a person as an audit committee financial expert pursuant to this Item 3 on the Form N-CSR does not impose on such a person any duties, obligations or liability that are greater than the duties, obligations or liability imposed on such person as a member of the Audit Committee and the Board of Trustees in the absence of such designation or identification.
| ITEM 4. | PRINCIPAL ACCOUNTANT FEES AND SERVICES. |
Items 4(a) through 4(d) and 4(g):
The Board of Trustees has appointed Deloitte & Touche LLP (“Deloitte”) to serve as independent accountants to certain series of the Registrant and Ernst & Young LLP (“E&Y”) to serve in the same capacity to certain other series of the Registrant (the series referred to collectively as the “Funds” and singularly as a “Fund”). The tables below set forth the audit fees billed to the Funds as well as fees for non-audit services provided to the Funds and/or to the Funds’ investment adviser, Massachusetts Financial Services Company (“MFS”), and to
various entities either controlling, controlled by, or under common control with MFS that provide ongoing services to the Funds (“MFS Related Entities”).
For the fiscal years ended August 31, 2011 and 2010, audit fees billed to the Funds by Deloitte and E&Y were as follows:
| | | | | | | | |
| | | Audit Fees | |
| | | 2011 | | | 2010 | |
Fees billed by Deloitte: | | | | | | | | |
MFS Cash Reserve Fund | | | 28,855 | | | | 28,550 | |
| |
| | | Audit Fees | |
| | | 2011 | | | 2010 | |
Fees billed by E&Y: | | | | | | | | |
MFS Core Equity Fund | | | 40,386 | | | | 39,956 | |
MFS Core Growth Fund+ | | | 0 | | | | 40,536 | |
MFS New Discovery Fund | | | 40,386 | | | | 39,956 | |
MFS Research International Fund | | | 43,548 | | | | 43,084 | |
MFS Technology Fund | | | 40,386 | | | | 39,955 | |
MFS Value Fund | | | 40,973 | | | | 40,536 | |
Total | | | 205,679 | | | | 244,023 | |
For the fiscal years ended August 31, 2011 and 2010, fees billed by Deloitte and E&Y for audit-related, tax and other services provided to the Funds and for audit-related, tax and other services provided to MFS and MFS Related Entities were as follows:
| | | | | | | | | | | | | | | | | | | | | | | | |
| | | Audit-Related Fees1 | | | Tax Fees2 | | | All Other Fees3 | |
| | | 2011 | | | 2010 | | | 2011 | | | 2010 | | | 2011 | | | 2010 | |
Fees billed by Deloitte: | | | | | | | | | | | | | | | | | | | | | | | | |
To MFS Cash Reserve Fund | | | 0 | | | | 0 | | | | 2,917 | | | | 2,885 | | | | 1,158 | | | | 1,382 | |
To MFS and MFS Related Entities of MFS Cash Reserve Fund* | | | 815,204 | | | | 1,146,377 | | | | 0 | | | | 0 | | | | 0 | | | | 0 | |
| | | | | | | | |
| | | 2011 | | | 2010 | |
Aggregate fees for non-audit services: | | | | | | | | |
To MFS Cash Reserve Fund, MFS and MFS Related Entities# | | | 1,356,595 | | | | 1,475,469 | |
| | | | | | | | | | | | | | | | | | | | | | | | |
| | | Audit-Related Fees1 | | | Tax Fees2 | | | All Other Fees4 | |
| | | 2011 | | | 2010 | | | 2011 | | | 2010 | | | 2011 | | | 2010 | |
Fees billed by E&Y: | | | | | | | | | | | | | | | | | | | | | | | | |
To MFS Core Equity Fund | | | 0 | | | | 0 | | | | 7,354 | | | | 7,274 | | | | 0 | | | | 0 | |
To MFS Core Growth Fund | | | 0 | | | | 0 | | | | 7,354 | | | | 7,274 | | | | 0 | | | | 0 | |
To MFS New Discovery Fund | | | 0 | | | | 0 | | | | 7,354 | | | | 7,274 | | | | 0 | | | | 0 | |
To MFS Research International Fund | | | 0 | | | | 0 | | | | 7,756 | | | | 7,671 | | | | 0 | | | | 0 | |
To MFS Technology Fund | | | 0 | | | | 0 | | | | 7,354 | | | | 7,274 | | | | 0 | | | | 0 | |
To MFS Value Fund | | | 0 | | | | 0 | | | | 7,354 | | | | 7,274 | | | | 0 | | | | 0 | |
To MFS and MFS Related Entities of MFS Core Equity Fund* | | | 0 | | | | 0 | | | | 0 | | | | 0 | | | | 0 | | | | 0 | |
To MFS and MFS Related Entities of MFS Core Growth Fund* | | | 0 | | | | 0 | | | | 0 | | | | 0 | | | | 0 | | | | 0 | |
To MFS and MFS Related Entities of MFS New Discovery Fund* | | | 0 | | | | 0 | | | | 0 | | | | 0 | | | | 0 | | | | 0 | |
To MFS and MFS Related Entities of MFS Research International Fund* | | | 0 | | | | 0 | | | | 0 | | | | 0 | | | | 0 | | | | 0 | |
To MFS and MFS Related Entities of MFS Technology Fund* | | | 0 | | | | 0 | | | | 0 | | | | 0 | | | | 0 | | | | 0 | |
To MFS and MFS Related Entities of MFS Value Fund* | | | 0 | | | | 0 | | | | 0 | | | | 0 | | | | 0 | | | | 0 | |
| | | | | | | | |
| | | 2011 | | | 2010 | |
Aggregate fees for non-audit services: | | | | | | | | |
To MFS Core Equity Fund, MFS and MFS Related Entities# | | | 108,523 | | | | 245,762 | |
To MFS Core Growth Fund, MFS and MFS Related Entities# | | | 108,523 | | | | 245,762 | |
To MFS New Discovery Fund, MFS and MFS Related Entities# | | | 108,523 | | | | 245,762 | |
To MFS Research International Fund, MFS and MFS Related Entities# | | | 108,925 | | | | 246,159 | |
To MFS Technology Fund, MFS and MFS Related Entities# | | | 108,523 | | | | 245,762 | |
To MFS Value Fund, MFS and MFS Related Entities# | | | 108,523 | | | | 245,762 | |
| + | The MFS Core Growth Fund was reorganized into the MFS Growth Fund a series of MFS Series Trust II, as of August 26, 2011. |
| * | This amount reflects the fees billed to MFS and MFS Related Entities for non-audit services relating directly to the operations and financial reporting of the Funds (portions of which services also related to the operations and financial reporting of other funds within the MFS Funds complex). |
| # | This amount reflects the aggregate fees billed by Deloitte or E&Y for non-audit services rendered to the Funds and for non-audit services rendered to MFS and the MFS Related Entities. |
| 1 | The fees included under “Audit-Related Fees” are fees related to assurance and related services that are reasonably related to the performance of the audit or review of financial statements, but not reported under “Audit Fees,” including accounting consultations, agreed-upon procedure reports, attestation reports, comfort letters and internal control reviews. |
| 2 | The fees included under “Tax Fees” are fees associated with tax compliance, tax advice and tax planning, including services relating to the filing or amendment of federal, state or local income tax returns, regulated investment company qualification reviews and tax distribution and analysis. |
| 3 | The fees included under “All Other Fees” are fees for products and services provided by Deloitte other than those reported under “Audit Fees,” “Audit-Related Fees” and “Tax Fees,” including fees for services related to analysis of certain portfolio holdings, and review of internal controls and review of Rule 38a-1 compliance program. |
| 4 | The fees under “All Other Fees” are fees for products and services provided by E&Y other than those reported under “Audit Fees,” “Audit-Related Fees” and “Tax Fees”. |
Item 4(e)(1):
Set forth below are the policies and procedures established by the Audit Committee of the Board of Trustees relating to the pre-approval of audit and non-audit related services:
To the extent required by applicable law, pre-approval by the Audit Committee of the Board is needed for all audit and permissible non-audit services rendered to the Funds and all permissible non-audit services rendered to MFS or MFS Related Entities if the services relate directly to the operations and financial reporting of the Registrant. Pre-approval is currently on an engagement-by-engagement basis. In the event pre-approval of such services is necessary between regular meetings of the Audit Committee and it is not practical to wait to seek pre-approval at the next regular meeting of the Audit Committee, pre-approval of such services may be referred to the Chair of the Audit Committee for approval; provided that the Chair may not pre-approve any individual engagement for such services exceeding $50,000 or multiple engagements for such services in the aggregate exceeding $100,000 in each period between regular meetings of the Audit Committee. Any engagement pre-approved by the Chair between regular meetings of the Audit Committee shall be presented for ratification by the entire Audit Committee at its next regularly scheduled meeting.
Item 4(e)(2):
None, or 0%, of the services relating to the Audit-Related Fees, Tax Fees and All Other Fees paid by the Fund and MFS and MFS Related Entities relating directly to the operations and financial reporting of the Registrant disclosed above were approved by the audit committee pursuant to paragraphs (c)(7)(i)(C) of Rule 2-01 of Regulation S-X (which permits audit committee approval after the start of the engagement with respect to services other than audit, review or attest services, if certain conditions are satisfied).
| Item 4(f): | Not applicable. |
Item 4(h): The Registrant’s Audit Committee has considered whether the provision by a Registrant’s independent registered public accounting firm of non-audit services to MFS and MFS Related Entities that were not pre-approved by the Committee (because such services did not relate directly to the operations and financial reporting of the Registrant) was compatible with maintaining the independence of the independent registered public accounting firm as the Registrant’s principal auditors.
| ITEM 5. | AUDIT COMMITTEE OF LISTED REGISTRANTS. |
Not applicable to the Registrant.
A schedule of investments of the Registrant is included as part of the report to shareholders of such series under Item 1 of this Form N-CSR.
| ITEM 7. | DISCLOSURE OF PROXY VOTING POLICIES AND PROCEDURES FOR CLOSED-END MANAGEMENT INVESTMENT COMPANIES. |
Not applicable to the Registrant.
| ITEM 8. | PORTFOLIO MANAGERS OF CLOSED-END MANAGEMENT INVESTMENT COMPANIES. |
Not applicable to the Registrant.
| ITEM 9. | PURCHASES OF EQUITY SECURITIES BY CLOSED-END MANAGEMENT INVESTMENT COMPANY AND AFFILIATED PURCHASERS. |
Not applicable to the Registrant.
| ITEM 10. | SUBMISSION OF MATTERS TO A VOTE OF SECURITY HOLDERS. |
There were no material changes to the procedures by which shareholders may send recommendations to the Board for nominees to the Registrant’s Board since the Registrant last provided disclosure as to such procedures in response to the requirements of Item 407 (c)(2)(iv) of Regulation S-K or this Item.
| ITEM 11. | CONTROLS AND PROCEDURES. |
| (a) | Based upon their evaluation of the effectiveness of the registrant’s disclosure controls and procedures (as defined in Rule 30a-3(c) under the Investment Company Act of 1940 (the “Act”)) as conducted within 90 days of the filing date of this report on Form N-CSR, the registrant’s principal financial officer and principal executive officer have concluded that those disclosure controls and procedures provide reasonable assurance that the material information required to be disclosed by the registrant on this report is recorded, processed, summarized and reported within the time periods specified in the Securities and Exchange Commission’s rules and forms. |
| (b) | There were no changes in the registrant’s internal controls over financial reporting (as defined in Rule 30a-3(d) under the Act) that occurred during the second fiscal quarter of the period covered by the report that have materially affected, or are reasonably likely to materially affect, the registrant’s internal control over financial reporting. |
| (a) | File the exhibits listed below as part of this form. Letter or number the exhibits in the sequence indicated. |
| | (1) | Any code of ethics, or amendment thereto, that is the subject of the disclosure required by Item 2, to the extent that the registrant intends to satisfy the Item 2 requirements through filing of an exhibit: Code of Ethics attached hereto. |
| | (2) | A separate certification for each principal executive officer and principal financial officer of the registrant as required by Rule 30a-2 under the Act (17 CFR 270.30a-2): Attached hereto. |
| (b) | If the report is filed under Section 13(a) or 15(d) of the Exchange Act, provide the certifications required by Rule 30a-2(b) under the Act (17 CFR 270.30a-2(b)), Rule 13a-14(b) or Rule 15d-14(b) under the Exchange Act (17 CFR 240.13a-14(b) or 240.15d-14(b)) and Section 1350 of Chapter 63 of Title 18 of the United States Code (18 U.S.C. 1350) as an exhibit. A certification furnished pursuant to this paragraph will not be deemed “filed” for the purposes of Section 18 of the Exchange Act (15 U.S.C. 78r), or otherwise subject to the liability of that section. Such certification will not be deemed to be incorporated by reference into any filing under the Securities Act of 1933 or the Exchange Act, except to the extent that the registrant specifically incorporates it by reference: Attached hereto. |
Notice
A copy of the Amended and Restated Declaration of Trust, as amended, of the Registrant is on file with the Secretary of State of The Commonwealth of Massachusetts and notice is hereby given that this instrument is executed on behalf of the Registrant by an officer of the Registrant as an officer and not individually and the obligations of or arising out of this instrument are not binding upon any of the Trustees or shareholders individually, but are binding only upon the assets and property of the respective constituent series of the Registrant.
SIGNATURES
Pursuant to the requirements of the Securities Exchange Act of 1934 and the Investment Company Act of 1940, the registrant has duly caused this report to be signed on its behalf by the undersigned, thereunto duly authorized.
(Registrant) MFS SERIES TRUST I
| | |
| By (Signature and Title)* | | MARIA F. DIORIODWYER |
| | Maria F. DiOrioDwyer, President |
Date: October 17, 2011
Pursuant to the requirements of the Securities Exchange Act of 1934 and the Investment Company Act of 1940, this report has been signed below by the following persons on behalf of the registrant and in the capacities and on the dates indicated.
| | |
| By (Signature and Title)* | | MARIA F. DIORIODWYER |
| | Maria F. DiOrioDwyer, President (Principal Executive Officer) |
Date: October 17, 2011
| | |
| By (Signature and Title)* | | JOHN M. CORCORAN |
| | John M. Corcoran, Treasurer (Principal Financial Officer and Accounting Officer) |
Date: October 17, 2011
| * | Print name and title of each signing officer under his or her signature. |