UNITED STATES
SECURITIES AND EXCHANGE COMMISSION
Washington, D.C. 20549
FORM N-CSR
CERTIFIED SHAREHOLDER REPORT OF
REGISTERED MANAGEMENT INVESTMENT COMPANIES
Investment Company Act file number 811-4777
MFS SERIES TRUST I
(Exact name of registrant as specified in charter)
111 Huntington Avenue, Boston, Massachusetts 02199
(Address of principal executive offices) (Zip code)
Susan S. Newton
Massachusetts Financial Services Company
111 Huntington Avenue
Boston, Massachusetts 02199
(Name and address of agents for service)
Registrant’s telephone number, including area code: (617) 954-5000
Date of fiscal year end: August 31
Date of reporting period: August 31, 2014
Effective July 1, 2014, MFS Cash Reserve Fund was redesignated as MFS U.S. Government Cash Reserve Fund.
| ITEM 1. | REPORTS TO STOCKHOLDERS. |
ANNUAL REPORT
August 31, 2014

MFS® CORE EQUITY FUND

RGI-ANN
MFS® CORE EQUITY FUND
CONTENTS
The report is prepared for the general information of shareholders.
It is authorized for distribution to prospective investors only when preceded or accompanied by a current prospectus.
NOT FDIC INSURED Ÿ MAY LOSE VALUE Ÿ NO BANK GUARANTEE

LETTER FROM THE CHAIRMAN AND CEO
Dear Shareholders:
The U.S. economy continues to gain strength. Manufacturing output, construction activity and consumer confidence are all at multi-year highs, auto sales are robust, and
U.S. labor market reports show broad progress. Even a slowdown in the pace of rising house prices is seen as making the market more sustainable. Economists have a favorable outlook, and broad stock indices reflect that.
However, challenges dominate the rest of the global economy. China is struggling to boost its industrial output and Japan’s economic turnaround appears to have hit a setback after its sales tax increase in April. The eurozone economy is being held back by persistently high unemployment and dangerously low inflation, leading the European Central Bank to take more
aggressive stimulus action. With robust corporate earnings, the market’s greatest concerns relate to conflicts in the Middle East and Ukraine. In addition, speculation continues on when the U.S. Federal Reserve will begin tightening its monetary policy now that the U.S. economy has regained some traction.
As always at MFS®, active risk management is integral to how we manage your investments. We use a collaborative process, sharing insights across asset classes, regions and economic sectors. Our global team of investment professionals uses a multidisciplined, long-term, diversified investment approach.
We understand that these are challenging economic times. We believe we can serve you best by applying proven principles, such as asset allocation and diversification, over the long term. We are confident that this approach can help you as you work with your financial advisors to reach your goals in the years ahead.
Respectfully,

Robert J. Manning
Chairman and Chief Executive Officer
MFS Investment Management
October 16, 2014
The opinions expressed in this letter are subject to change and may not be relied upon for investment advice. No forecasts can be guaranteed.
1
PORTFOLIO COMPOSITION
Portfolio structure

| | | | |
| Top ten holdings | | | | |
| Apple, Inc. | | | 2.8% | |
| Hess Corp. | | | 2.1% | |
| Chevron Corp. | | | 1.6% | |
| American International Group, Inc. | | | 1.6% | |
| MetLife, Inc. | | | 1.4% | |
| Verizon Communications, Inc. | | | 1.4% | |
| Visa, Inc., “A” | | | 1.3% | |
| Procter & Gamble Co. | | | 1.3% | |
| Actavis PLC | | | 1.3% | |
| Wells Fargo & Co. | | | 1.2% | |
| | | | |
| Equity sectors | | | | |
| Financial Services | | | 17.3% | |
| Technology | | | 16.2% | |
| Health Care | | | 13.4% | |
| Energy | | | 9.8% | |
| Industrial Goods & Services | | | 6.8% | |
| Retailing | | | 6.6% | |
| Consumer Staples | | | 6.4% | |
| Utilities & Communications | | | 5.4% | |
| Leisure (s) | | | 5.2% | |
| Basic Materials | | | 3.9% | |
| Special Products & Services | | | 3.8% | |
| Autos & Housing | | | 2.6% | |
| Transportation | | | 2.2% | |
| (s) | Includes securities sold short. |
Cash & Other can include cash, other assets less liabilities, offsets to derivative positions, and short-term securities.
Percentages are based on net assets as of 8/31/14.
The portfolio is actively managed and current holdings may be different.
2
MANAGEMENT REVIEW
Summary of Results
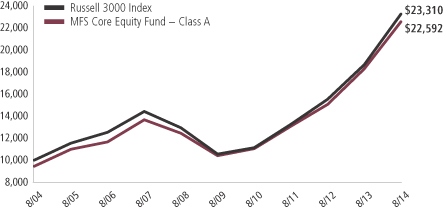
For the twelve months ended August 31, 2014, Class A shares of the MFS Core Equity Fund (“fund”) provided a total return of 23.33%, at net asset value. This compares with a return of 24.74% for the fund’s benchmark, the Russell 3000 Index.
Market Environment
Early in the period, equity markets advanced in response to improved economic fundamentals, having recovered from prior weakness stemming from concerns that the US Federal Reserve (“Fed”) would begin tapering its quantitative easing (“QE”) program. A general theme in the market was a rotation in investor allocations from fixed income to equities and emerging markets (“EM”) to developed markets, reflecting an anticipated acceleration in developed market growth rates relative to EM as well as a more equity-friendly macro backdrop amid increased volatility in EM debt. As the period progressed, the Fed’s decision to postpone QE tapering surprised markets. Favorable market reactions were tempered, however, by tense negotiations over US fiscal policy which resulted in a 16-day partial shutdown of the federal government and a short-term extension in the debt ceiling. The volatility was short-lived, however, as an extension of budget and debt ceiling deadlines allowed the government to re-open, and subsequent economic data reflected moderate but resilient US growth. Also well-received was the decision by the European Central Bank (“ECB”) to cut its policy rate as inflation pressures waned in the region. In addition, equity investors appeared to have concluded that there would be no major change in US monetary policy as a result of the nomination of Janet Yellen as the new Fed Chair for a term beginning in early 2014 and that tapering would have no major impact on the trajectory.
Later in the period, financial markets were forced to contend with a series of positive and negative return episodes. In addition to periodic flashpoints in country specific emerging markets, geopolitical tensions flared in the Middle East and Russia/Ukraine. Market setbacks were short-lived, as improving economic growth in the US coupled with prospects for easier monetary policy in regions with slowing growth such as Japan, Europe and China, supported risk assets. For example, the ECB cut policy interest rates into negative territory and by the end of the period expectations were for additional rate cuts and the announcement for non-conventional easing measures. The decline in developed market government bond yields and credit spreads were also supportive for equity markets. At the end of the period, the US equity market was trading at all-time highs.
Detractors from Performance
Stock selection in the retailing sector detracted from performance relative to the Russell 3000 Index. Overweight positions in food retail stores operator Fairway Group Holdings and retail giant Target hindered relative results as both stocks lagged the benchmark during the reporting period. Shares of Fairway Group Holdings fell after the company released disappointing results coupled with the announcement that the company’s long-serving CEO was retiring.
3
Management Review – continued
Stock selection in the technology sector further weighed on relative performance. Not holding strong-performing computer components company Intel, and overweight positions in semiconductor manufacturer Altera, network security software company Symantec (h) and business intelligence software solutions designer and developer Qlik Technologies, held back relative returns. Shares of Qlik Technologies fell as the company missed market expectations after some large deals that management had anticipated failed to materialize. The combination of an underweight position in software giant Microsoft (h) early in the period and not holding the stock later in the period also negatively impacted relative results.
Elsewhere, overweight positions in digital coupon marketplace RetailMeNot (h) and education services company ITT Educational Services (h) were among the fund’s top relative detractors during the reporting period. Shares of RetailMeNot tumbled after internet search giant Google announced a change to their search algorithm that is anticipated to take away a significant portion of RetailMeNot’s organic traffic. Google’s referrals to the site currently consist of roughly 40-50% of RetailMeNot’s site traffic.
The fund’s cash and/or cash equivalents position during the period was also a detractor from relative performance. Under normal market conditions, the fund strives to be fully invested and generally holds cash to buy new holdings and to provide liquidity. In a period when equity markets rose, as measured by the fund’s benchmark, holding cash hurt performance versus the benchmark, which has no cash position.
Contributors to Performance
Security selection in the energy sector was a significant factor that contributed positively to relative performance. The fund’s overweight position in global integrated energy company Hess and an underweight position in integrated energy company Chevron aided relative results. Shares of Chevron declined as the company issued weaker-than-expected production guidance and an increase in its capital expenditure budget, both of which appeared to have been viewed unfavorably by investors.
Stock selection in the health care sector further strengthened relative returns. An overweight position in strong-performing development stage biopharmaceutical company Puma Biotechnology and health care products company Covidien benefited relative performance. Shares of Covidien soared after the company announced that Medtronic had entered into an agreement to acquire the company at a significant premium.
Elsewhere, the fund’s overweight positions in computer products and services provider Hewlett-Packard, analog semiconductor company Avago Technologies, broadcast and communication tower management firm American Tower and casino resorts operator Wynn Resorts contributed to relative performance. Shares of Hewlett-Packard gained on news of several Wall Street analyst upgrades and a CIO survey indicating the company’s services business is gaining share following seven quarters of losses.
4
Management Review – continued
Avoiding diversified technology products and services company International Business Machines (IBM), and holdings of strong-performing railroad company Canadian Pacific Railway (b) (Canada), also contributed to relative returns.
Respectfully,
| | |
Joseph MacDougall Portfolio Manager | | |
| (b) | Security is not a benchmark constituent. |
| (h) | Security was not held in the portfolio at period end. |
The views expressed in this report are those of the portfolio manager only through the end of the period of the report as stated on the cover and do not necessarily reflect the views of MFS or any other person in the MFS organization. These views are subject to change at any time based on market or other conditions, and MFS disclaims any responsibility to update such views. These views may not be relied upon as investment advice or an indication of trading intent on behalf of any MFS portfolio. References to specific securities are not recommendations of such securities, and may not be representative of any MFS portfolio’s current or future investments.
5
PERFORMANCE SUMMARY THROUGH 8/31/14
The following chart illustrates a representative class of the fund’s historical performance in comparison to its benchmark(s). Performance results include the deduction of the maximum applicable sales charge and reflect the percentage change in net asset value, including reinvestment of dividends and capital gains distributions. The performance of other share classes will be greater than or less than that of the class depicted below. Benchmarks are unmanaged and may not be invested in directly. Benchmark returns do not reflect sales charges, commissions or expenses. (See Notes to Performance Summary.)
Performance data shown represents past performance and is no guarantee of future results. Investment return and principal value fluctuate so your shares, when sold, may be worth more or less than the original cost; current performance may be lower or higher than quoted. The performance shown does not reflect the deduction of taxes, if any, that a shareholder would pay on fund distributions or the redemption of fund shares.
Growth of a Hypothetical $10,000 Investment
6
Performance Summary – continued
Total Returns through 8/31/14
Average annual without sales charge
| | | | | | | | | | | | | | |
| | | Share class | | Class inception date | | 1-yr | | 5-yr | | 10-yr | | Life (t) | | |
| | | A | | 1/02/96 | | 23.33% | | 16.80% | | 9.14% | | N/A | | |
| | | B | | 1/02/97 | | 22.39% | | 15.91% | | 8.37% | | N/A | | |
| | | C | | 1/02/97 | | 22.38% | | 15.91% | | 8.37% | | N/A | | |
| | | I | | 1/02/97 | | 23.61% | | 17.08% | | 9.46% | | N/A | | |
| | | R1 | | 4/01/05 | | 22.38% | | 15.92% | | N/A | | 7.72% | | |
| | | R2 | | 10/31/03 | | 22.96% | | 16.49% | | 8.84% | | N/A | | |
| | | R3 | | 4/01/05 | | 23.32% | | 16.79% | | N/A | | 8.52% | | |
| | | R4 | | 4/01/05 | | 23.62% | | 17.05% | | N/A | | 8.80% | | |
| | | R5 | | 1/02/13 | | 23.73% | | N/A | | N/A | | 25.62% | | |
| Comparative benchmark | | | | | | | | | | |
| | | Russell 3000 Index (f) | | 24.74% | | 17.22% | | 8.83% | | N/A | | |
| Average annual with sales charge | | | | | | | | | | |
| | | A
With initial Sales Charge (5.75%) | | 16.24% | | 15.42% | | 8.49% | | N/A | | |
| | | B
With CDSC (Declining over six years from 4% to 0%) (v) | | 18.39% | | 15.69% | | 8.37% | | N/A | | |
| | | C
With CDSC (1% for 12 months) (v) | | 21.38% | | 15.91% | | 8.37% | | N/A | | |
CDSC – Contingent Deferred Sales Charge.
Class I, R1, R2, R3, R4, and R5 shares do not have a sales charge.
| (f) | Source: FactSet Research Systems Inc. |
| (t) | For the period from the class inception date through the stated period end (for those share classes with less than 10 years of performance history). No comparative benchmark performance information is provided for “life” periods. (See Notes to Performance Summary.) |
| (v) | Assuming redemption at the end of the applicable period. |
Benchmark Definition
Russell 3000 Index – constructed to provide a comprehensive barometer for the 3,000 largest U.S. companies based on total market capitalization, which represents approximately 98% of the investable U.S. equity market.
It is not possible to invest directly in an index.
Notes to Performance Summary
Average annual total return represents the average annual change in value for each share class for the periods presented. Life returns are presented where the share class has less than 10 years of performance history and represent the average annual total return from the class inception date to the stated period end date. As the fund’s share
7
Performance Summary – continued
classes may have different inception dates, the life returns may represent different time periods and may not be comparable. As a result, no comparative benchmark performance information is provided for life periods.
Performance results reflect any applicable expense subsidies and waivers in effect during the periods shown. Without such subsidies and waivers the fund’s performance results would be less favorable. Please see the prospectus and financial statements for complete details.
Performance results do not include adjustments made for financial reporting purposes in accordance with U.S. generally accepted accounting principles and may differ from amounts reported in the financial highlights.
From time to time the fund may receive proceeds from litigation settlements, without which performance would be lower.
8
EXPENSE TABLE
Fund expenses borne by the shareholders during the period, March 1, 2014 through August 31, 2014
As a shareholder of the fund, you incur two types of costs: (1) transaction costs, including sales charges (loads) on certain purchase or redemption payments, and (2) ongoing costs, including management fees; distribution and service (12b-1) fees; and other fund expenses. This example is intended to help you understand your ongoing costs (in dollars) of investing in the fund and to compare these costs with the ongoing costs of investing in other mutual funds.
The example is based on an investment of $1,000 invested at the beginning of the period and held for the entire period March 1, 2014 through August 31, 2014.
Actual Expenses
The first line for each share class in the following table provides information about actual account values and actual expenses. You may use the information in this line, together with the amount you invested, to estimate the expenses that you paid over the period. Simply divide your account value by $1,000 (for example, an $8,600 account value divided by $1,000 = 8.6), then multiply the result by the number in the first line under the heading entitled “Expenses Paid During Period” to estimate the expenses you paid on your account during this period.
Hypothetical Example for Comparison Purposes
The second line for each share class in the following table provides information about hypothetical account values and hypothetical expenses based on the fund’s actual expense ratio and an assumed rate of return of 5% per year before expenses, which is not the fund’s actual return. The hypothetical account values and expenses may not be used to estimate the actual ending account balance or expenses you paid for the period. You may use this information to compare the ongoing costs of investing in the fund and other funds. To do so, compare this 5% hypothetical example with the 5% hypothetical examples that appear in the shareholder reports of the other funds.
Please note that the expenses shown in the table are meant to highlight your ongoing costs only and do not reflect any transactional costs, such as sales charges (loads). Therefore, the second line for each share class in the table is useful in comparing ongoing costs only, and will not help you determine the relative total costs of owning different funds. In addition, if these transactional costs were included, your costs would have been higher.
9
Expense Table – continued
| | | | | | | | | | | | | | | | | | |
Share
Class | | | | Annualized
Expense Ratio | | | Beginning
Account Value
3/01/14 | | | Ending Account Value
8/31/14 | | | Expenses Paid During
Period (p) 3/01/14-8/31/14 | |
| A | | Actual | | | 1.05% | | | | $1,000.00 | | | | $1,060.68 | | | | $5.45 | |
| | Hypothetical (h) | | | 1.05% | | | | $1,000.00 | | | | $1,019.91 | | | | $5.35 | |
| B | | Actual | | | 1.80% | | | | $1,000.00 | | | | $1,056.41 | | | | $9.33 | |
| | Hypothetical (h) | | | 1.80% | | | | $1,000.00 | | | | $1,016.13 | | | | $9.15 | |
| C | | Actual | | | 1.80% | | | | $1,000.00 | | | | $1,056.51 | | | | $9.33 | |
| | Hypothetical (h) | | | 1.80% | | | | $1,000.00 | | | | $1,016.13 | | | | $9.15 | |
| I | | Actual | | | 0.80% | | | | $1,000.00 | | | | $1,062.13 | | | | $4.16 | |
| | Hypothetical (h) | | | 0.80% | | | | $1,000.00 | | | | $1,021.17 | | | | $4.08 | |
| R1 | | Actual | | | 1.80% | | | | $1,000.00 | | | | $1,056.53 | | | | $9.33 | |
| | Hypothetical (h) | | | 1.80% | | | | $1,000.00 | | | | $1,016.13 | | | | $9.15 | |
| R2 | | Actual | | | 1.30% | | | | $1,000.00 | | | | $1,058.89 | | | | $6.75 | |
| | Hypothetical (h) | | | 1.30% | | | | $1,000.00 | | | | $1,018.65 | | | | $6.61 | |
| R3 | | Actual | | | 1.05% | | | | $1,000.00 | | | | $1,060.50 | | | | $5.45 | |
| | Hypothetical (h) | | | 1.05% | | | | $1,000.00 | | | | $1,019.91 | | | | $5.35 | |
| R4 | | Actual | | | 0.80% | | | | $1,000.00 | | | | $1,062.14 | | | | $4.16 | |
| | Hypothetical (h) | | | 0.80% | | | | $1,000.00 | | | | $1,021.17 | | | | $4.08 | |
| R5 | | Actual | | | 0.71% | | | | $1,000.00 | | | | $1,062.41 | | | | $3.69 | |
| | Hypothetical (h) | | | 0.71% | | | | $1,000.00 | | | | $1,021.63 | | | | $3.62 | |
| (h) | 5% class return per year before expenses. |
| (p) | “Expenses Paid During Period” are equal to each class’s annualized expense ratio, as shown above, multiplied by the average account value over the period, multiplied by 184/365 (to reflect the one-half year period). Expenses paid do not include any applicable sales charges (loads). If these transaction costs had been included, your costs would have been higher. |
Notes to Expense Table
Each class with a Rule 12b-1 service fee is subject to a rebate of a portion of such fee. Such rebates are included in the expense ratios above. For Class A shares, this rebate reduced the expense ratios above by 0.01%. See Note 3 in the Notes to Financial Statements for additional information.
10
PORTFOLIO OF INVESTMENTS
8/31/14
The Portfolio of Investments is a complete list of all securities owned by your fund. It is categorized by broad-based asset classes.
| | | | | | | | |
| Common Stocks - 99.8% | | | | | | | | |
| Issuer | | Shares/Par | | | Value ($) | |
| | | | | | | | |
| Aerospace - 3.0% | | | | | | | | |
| Honeywell International, Inc. | | | 160,989 | | | $ | 15,330,982 | |
| Precision Castparts Corp. | | | 40,019 | | | | 9,767,037 | |
| United Technologies Corp. | | | 125,271 | | | | 13,526,763 | |
| | | | | | | | |
| | | | | | | $ | 38,624,782 | |
| Alcoholic Beverages - 0.3% | | | | | | | | |
| Constellation Brands, Inc., “A” (a) | | | 43,529 | | | $ | 3,790,941 | |
| | |
| Apparel Manufacturers - 1.0% | | | | | | | | |
| NIKE, Inc., “B” | | | 39,860 | | | $ | 3,131,003 | |
| PVH Corp. | | | 59,990 | | | | 7,003,233 | |
| VF Corp. | | | 42,644 | | | | 2,734,333 | |
| | | | | | | | |
| | | | | | | $ | 12,868,569 | |
| Automotive - 1.2% | | | | | | | | |
| Delphi Automotive PLC | | | 155,204 | | | $ | 10,799,094 | |
| Johnson Controls, Inc. | | | 90,019 | | | | 4,393,827 | |
| | | | | | | | |
| | | | | | | $ | 15,192,921 | |
| Biotechnology - 1.9% | | | | | | | | |
| Alexion Pharmaceuticals, Inc. (a) | | | 41,874 | | | $ | 7,088,849 | |
| Biogen Idec, Inc. (a) | | | 31,284 | | | | 10,731,663 | |
| Illumina, Inc. (a) | | | 4,611 | | | | 827,029 | |
| MiMedx Group, Inc. (a)(l) | | | 186,797 | | | | 1,315,051 | |
| Puma Biotechnology, Inc. (a) | | | 18,997 | | | | 4,948,908 | |
| | | | | | | | |
| | | | | | | $ | 24,911,500 | |
| Broadcasting - 2.3% | | | | | | | | |
| Time Warner, Inc. | | | 108,527 | | | $ | 8,359,835 | |
| Twenty-First Century Fox, Inc. | | | 436,958 | | | | 15,477,052 | |
| Walt Disney Co. | | | 70,281 | | | | 6,316,856 | |
| | | | | | | | |
| | | | | | | $ | 30,153,743 | |
| Brokerage & Asset Managers - 1.2% | | | | | | | | |
| Affiliated Managers Group, Inc. (a) | | | 10,437 | | | $ | 2,203,773 | |
| BlackRock, Inc. | | | 11,594 | | | | 3,832,165 | |
| Franklin Resources, Inc. | | | 72,915 | | | | 4,121,156 | |
| NASDAQ OMX Group, Inc. | | | 111,797 | | | | 4,859,816 | |
| | | | | | | | |
| | | | | | | $ | 15,016,910 | |
11
Portfolio of Investments – continued
| | | | | | | | |
| Issuer | | Shares/Par | | | Value ($) | |
| | | | | | | | |
| Common Stocks - continued | | | | | | | | |
| Business Services - 2.2% | | | | | | | | |
| Accenture PLC, “A” | | | 56,340 | | | $ | 4,566,920 | |
| Bright Horizons Family Solutions, Inc. (a) | | | 147,987 | | | | 6,018,631 | |
| CoStar Group, Inc. (a) | | | 12,113 | | | | 1,753,357 | |
| Fidelity National Information Services, Inc. | | | 114,624 | | | | 6,504,912 | |
| FleetCor Technologies, Inc. (a) | | | 28,606 | | | | 4,110,396 | |
| Forrester Research, Inc. | | | 56,469 | | | | 2,194,385 | |
| Gartner, Inc. (a) | | | 36,670 | | | | 2,735,215 | |
| | | | | | | | |
| | | | | | | $ | 27,883,816 | |
| Cable TV - 1.4% | | | | | | | | |
| Charter Communications, Inc., “A” (a) | | | 32,944 | | | $ | 5,167,925 | |
| Comcast Corp., “Special A” | | | 118,587 | | | | 6,474,850 | |
| Time Warner Cable, Inc. | | | 46,672 | | | | 6,904,189 | |
| | | | | | | | |
| | | | | | | $ | 18,546,964 | |
| Chemicals - 1.8% | | | | | | | | |
| Agrium, Inc. | | | 41,308 | | | $ | 3,906,271 | |
| Celanese Corp. | | | 92,591 | | | | 5,790,641 | |
| LyondellBasell Industries N.V., “A” | | | 62,755 | | | | 7,176,034 | |
| Monsanto Co. | | | 52,886 | | | | 6,116,266 | |
| | | | | | | | |
| | | | | | | $ | 22,989,212 | |
| Computer Software - 3.6% | | | | | | | | |
| Check Point Software Technologies Ltd. (a) | | | 160,474 | | | $ | 11,396,863 | |
| Citrix Systems, Inc. (a) | | | 86,344 | | | | 6,066,529 | |
| Oracle Corp. | | | 227,760 | | | | 9,458,873 | |
| Qlik Technologies, Inc. (a) | | | 252,390 | | | | 7,124,970 | |
| Salesforce.com, Inc. (a) | | | 205,949 | | | | 12,169,526 | |
| | | | | | | | |
| | | | | | | $ | 46,216,761 | |
| Computer Software - Systems - 5.4% | | | | | | | | |
| Apple, Inc. (s) | | | 350,147 | | | $ | 35,890,068 | |
| EMC Corp. | | | 503,085 | | | | 14,856,100 | |
| Hewlett-Packard Co. | | | 140,803 | | | | 5,350,514 | |
| NCR Corp. (a) | | | 54,297 | | | | 1,854,786 | |
| SS&C Technologies Holdings, Inc. (a) | | | 58,395 | | | | 2,642,958 | |
| Vantiv, Inc., “A” (a) | | | 281,016 | | | | 8,790,180 | |
| | | | | | | | |
| | | | | | | $ | 69,384,606 | |
| Construction - 1.5% | | | | | | | | |
| Fortune Brands Home & Security, Inc. | | | 124,657 | | | $ | 5,386,429 | |
| Pool Corp. | | | 27,496 | | | | 1,557,923 | |
| Sherwin-Williams Co. | | | 54,103 | | | | 11,800,405 | |
| | | | | | | | |
| | | | | | | $ | 18,744,757 | |
12
Portfolio of Investments – continued
| | | | | | | | |
| Issuer | | Shares/Par | | | Value ($) | |
| | | | | | | | |
| Common Stocks - continued | | | | | | | | |
| Consumer Products - 2.3% | | | | | | | | |
| Colgate-Palmolive Co. | | | 117,424 | | | $ | 7,600,856 | |
| Newell Rubbermaid, Inc. | | | 140,463 | | | | 4,708,320 | |
| Procter & Gamble Co. | | | 201,623 | | | | 16,756,888 | |
| | | | | | | | |
| | | | | | | $ | 29,066,064 | |
| Consumer Services - 1.7% | | | | | | | | |
| HomeAway, Inc. (a) | | | 110,780 | | | $ | 3,677,896 | |
| Nord Anglia Education, Inc. (a) | | | 184,561 | | | | 3,534,343 | |
| Priceline Group, Inc. (a) | | | 11,655 | | | | 14,502,433 | |
| | | | | | | | |
| | | | | | | $ | 21,714,672 | |
| Containers - 0.4% | | | | | | | | |
| Crown Holdings, Inc. (a) | | | 34,863 | | | $ | 1,682,837 | |
| Packaging Corp. of America | | | 57,986 | | | | 3,942,468 | |
| | | | | | | | |
| | | | | | | $ | 5,625,305 | |
| Electrical Equipment - 1.0% | | | | | | | | |
| Danaher Corp. | | | 127,778 | | | $ | 9,789,073 | |
| Sensata Technologies Holding B.V. (a) | | | 31,769 | | | | 1,562,082 | |
| W.W. Grainger, Inc. | | | 7,362 | | | | 1,812,524 | |
| | | | | | | | |
| | | | | | | $ | 13,163,679 | |
| Electronics - 3.8% | | | | | | | | |
| Altera Corp. | | | 409,641 | | | $ | 14,476,713 | |
| Avago Technologies Ltd. | | | 120,554 | | | | 9,896,278 | |
| KLA-Tencor Corp. | | | 58,182 | | | | 4,446,268 | |
| Mellanox Technologies Ltd. (a) | | | 91,455 | | | | 3,821,904 | |
| Microchip Technology, Inc. | | | 272,608 | | | | 13,311,449 | |
| Rubicon Technology, Inc. (a)(l) | | | 231,422 | | | | 1,444,073 | |
| Ultratech, Inc. (a) | | | 88,375 | | | | 2,285,378 | |
| | | | | | | | |
| | | | | | | $ | 49,682,063 | |
| Energy - Independent - 4.4% | | | | | | | | |
| Access Midstream Partners LP | | | 48,100 | | | $ | 3,095,235 | |
| Anadarko Petroleum Corp. | | | 56,191 | | | | 6,332,164 | |
| Athlon Energy, Inc. (a) | | | 39,788 | | | | 1,851,734 | |
| Cabot Oil & Gas Corp. | | | 37,441 | | | | 1,255,771 | |
| Clayton Williams Energy, Inc. (a) | | | 4,759 | | | | 563,656 | |
| Concho Resources, Inc. (a) | | | 16,380 | | | | 2,326,615 | |
| CONSOL Energy, Inc. | | | 24,452 | | | | 984,927 | |
| EOG Resources, Inc. | | | 33,975 | | | | 3,733,173 | |
| Goodrich Petroleum Corp. (a) | | | 61,643 | | | | 1,362,310 | |
| Gulfport Energy Corp. (a) | | | 24,636 | | | | 1,441,206 | |
| Marathon Petroleum Corp. | | | 110,509 | | | | 10,057,424 | |
13
Portfolio of Investments – continued
| | | | | | | | |
| Issuer | | Shares/Par | | | Value ($) | |
| | | | | | | | |
| Common Stocks - continued | | | | | | | | |
| Energy - Independent - continued | | | | | | | | |
| Memorial Resource Development Corp. (a) | | | 73,270 | | | $ | 2,159,267 | |
| Noble Energy, Inc. | | | 95,664 | | | | 6,901,201 | |
| PDC Energy, Inc. (a) | | | 27,787 | | | | 1,669,721 | |
| Peabody Energy Corp. | | | 26,663 | | | | 423,408 | |
| Pioneer Natural Resources Co. | | | 27,699 | | | | 5,779,396 | |
| Rice Energy, Inc. (a) | | | 72,186 | | | | 2,113,606 | |
| Targa Resources Corp. | | | 22,927 | | | | 3,199,463 | |
| Whiting Petroleum Corp. (a) | | | 22,616 | | | | 2,095,599 | |
| | | | | | | | |
| | | | | | | $ | 57,345,876 | |
| Energy - Integrated - 3.7% | | | | | | | | |
| Chevron Corp. (s) | | | 161,306 | | | $ | 20,881,062 | |
| Hess Corp. (s) | | | 267,267 | | | | 27,020,694 | |
| | | | | | | | |
| | | | | | | $ | 47,901,756 | |
| Food & Beverages - 2.8% | | | | | | | | |
| Annie’s, Inc. (a) | | | 75,616 | | | $ | 2,411,394 | |
| Coca-Cola Co. | | | 327,877 | | | | 13,679,028 | |
| Flowers Foods, Inc. | | | 136,003 | | | | 2,662,939 | |
| General Mills, Inc. | | | 106,591 | | | | 5,689,828 | |
| Mondelez International, Inc. | | | 200,720 | | | | 7,264,057 | |
| WhiteWave Foods Co., “A” (a) | | | 119,889 | | | | 4,198,513 | |
| | | | | | | | |
| | | | | | | $ | 35,905,759 | |
| Food & Drug Stores - 1.0% | | | | | | | | |
| CVS Caremark Corp. | | | 142,804 | | | $ | 11,345,778 | |
| Fairway Group Holdings Corp. (a)(l) | | | 366,914 | | | | 1,647,444 | |
| | | | | | | | |
| | | | | | | $ | 12,993,222 | |
| Gaming & Lodging - 0.8% | | | | | | | | |
| Starwood Hotels & Resorts Worldwide, Inc. | | | 30,717 | | | $ | 2,596,815 | |
| Wynn Resorts Ltd. | | | 43,304 | | | | 8,352,476 | |
| | | | | | | | |
| | | | | | | $ | 10,949,291 | |
| General Merchandise - 1.3% | | | | | | | | |
| Kohl’s Corp. | | | 124,232 | | | $ | 7,303,599 | |
| Target Corp. | | | 160,923 | | | | 9,666,645 | |
| | | | | | | | |
| | | | | | | $ | 16,970,244 | |
| Health Maintenance Organizations - 0.9% | | | | | | | | |
| Aetna, Inc. | | | 91,124 | | | $ | 7,484,014 | |
| UnitedHealth Group, Inc. | | | 42,072 | | | | 3,646,801 | |
| | | | | | | | |
| | | | | | | $ | 11,130,815 | |
14
Portfolio of Investments – continued
| | | | | | | | |
| Issuer | | Shares/Par | | | Value ($) | |
| | | | | | | | |
| Common Stocks - continued | | | | | | | | |
| Insurance - 3.4% | | | | | | | | |
| American International Group, Inc. | | | 359,958 | | | $ | 20,179,245 | |
| MetLife, Inc. | | | 334,986 | | | | 18,337,134 | |
| Safety Insurance Group, Inc. | | | 100,900 | | | | 5,569,680 | |
| | | | | | | | |
| | | | | | | $ | 44,086,059 | |
| Internet - 3.2% | | | | | | | | |
| eBay, Inc. (a) | | | 63,430 | | | $ | 3,520,365 | |
| Facebook, Inc., “A “ (a) | | | 112,911 | | | | 8,448,001 | |
| Google, Inc., “A” (a) | | | 21,035 | | | | 12,249,943 | |
| Google, Inc., “C” (a) | | | 19,924 | | | | 11,388,558 | |
| LinkedIn Corp., “A” (a) | | | 26,515 | | | | 5,985,761 | |
| | | | | | | | |
| | | | | | | $ | 41,592,628 | |
| Machinery & Tools - 2.8% | | | | | | | | |
| Colfax Corp. (a) | | | 79,372 | | | $ | 5,048,853 | |
| Eaton Corp. PLC | | | 120,956 | | | | 8,443,938 | |
| IPG Photonics Corp. (a) | | | 51,287 | | | | 3,522,391 | |
| Joy Global, Inc. | | | 88,464 | | | | 5,586,502 | |
| Kennametal, Inc. | | | 73,097 | | | | 3,275,477 | |
| Roper Industries, Inc. | | | 71,523 | | | | 10,768,503 | |
| | | | | | | | |
| | | | | | | $ | 36,645,664 | |
| Major Banks - 4.1% | | | | | | | | |
| Bank of America Corp. | | | 289,633 | | | $ | 4,660,195 | |
| Goldman Sachs Group, Inc. | | | 32,006 | | | | 5,732,595 | |
| JPMorgan Chase & Co. | | | 253,739 | | | | 15,084,784 | |
| Morgan Stanley | | | 175,287 | | | | 6,014,097 | |
| State Street Corp. | | | 81,595 | | | | 5,877,288 | |
| Wells Fargo & Co. | | | 309,455 | | | | 15,918,365 | |
| | | | | | | | |
| | | | | | | $ | 53,287,324 | |
| Medical & Health Technology & Services - 1.0% | | | | | | | | |
| Cerner Corp. (a) | | | 28,438 | | | $ | 1,639,735 | |
| Express Scripts Holding Co. (a) | | | 124,618 | | | | 9,213,009 | |
| Henry Schein, Inc. (a) | | | 18,502 | | | | 2,214,504 | |
| | | | | | | | |
| | | | | | | $ | 13,067,248 | |
| Medical Equipment - 4.2% | | | | | | | | |
| Abbott Laboratories | | | 325,469 | | | $ | 13,747,809 | |
| AtriCure, Inc. (a) | | | 84,540 | | | | 1,312,061 | |
| Cooper Cos., Inc. | | | 50,290 | | | | 8,198,779 | |
| Covidien PLC | | | 99,963 | | | | 8,679,787 | |
| DexCom, Inc. (a) | | | 19,444 | | | | 859,425 | |
| GenMark Diagnostics, Inc. (a) | | | 90,578 | | | | 973,714 | |
15
Portfolio of Investments – continued
| | | | | | | | |
| Issuer | | Shares/Par | | | Value ($) | |
| | | | | | | | |
| Common Stocks - continued | | | | | | | | |
| Medical Equipment - continued | | | | | | | | |
| Heartware International, Inc. (a) | | | 20,595 | | | $ | 1,670,255 | |
| OraSure Technologies, Inc. (a) | | | 74,991 | | | | 624,675 | |
| Sirona Dental Systems, Inc. (a) | | | 22,479 | | | | 1,832,263 | |
| Stryker Corp. | | | 123,172 | | | | 10,261,459 | |
| TearLab Corp. (a)(l) | | | 286,309 | | | | 1,108,016 | |
| Thermo Fisher Scientific, Inc. | | | 39,186 | | | | 4,710,549 | |
| | | | | | | | |
| | | | | | | $ | 53,978,792 | |
| Metals & Mining - 0.4% | | | | | | | | |
| First Quantum Minerals Ltd. | | | 125,739 | | | $ | 2,822,854 | |
| Lundin Mining Corp. (a) | | | 530,352 | | | | 2,838,820 | |
| | | | | | | | |
| | | | | | | $ | 5,661,674 | |
| Natural Gas - Pipeline - 0.4% | | | | | | | | |
| Williams Cos., Inc. | | | 88,665 | | | $ | 5,270,248 | |
| | |
| Network & Telecom - 0.2% | | | | | | | | |
| Ixia (a) | | | 178,034 | | | $ | 1,712,687 | |
| Qualcomm, Inc. | | | 6,624 | | | | 504,086 | |
| | | | | | | | |
| | | | | | | $ | 2,216,773 | |
| Oil Services - 1.7% | | | | | | | | |
| Cameron International Corp. (a) | | | 48,634 | | | $ | 3,614,965 | |
| Halliburton Co. | | | 138,956 | | | | 9,394,815 | |
| Schlumberger Ltd. | | | 78,293 | | | | 8,584,045 | |
| | | | | | | | |
| | | | | | | $ | 21,593,825 | |
| Other Banks & Diversified Financials - 5.3% | | | | | | | | |
| American Express Co. | | | 50,728 | | | $ | 4,542,692 | |
| BB&T Corp. | | | 198,514 | | | | 7,410,528 | |
| Citigroup, Inc. | | | 271,358 | | | | 14,015,641 | |
| Discover Financial Services | | | 238,062 | | | | 14,847,927 | |
| EuroDekania Ltd. | | | 580,280 | | | | 274,485 | |
| PrivateBancorp, Inc. | | | 191,502 | | | | 5,651,224 | |
| Texas Capital Bancshares, Inc. (a) | | | 93,286 | | | | 5,035,578 | |
| Visa, Inc., “A” | | | 81,542 | | | | 17,329,306 | |
| | | | | | | | |
| | | | | | | $ | 69,107,381 | |
| Pharmaceuticals - 5.4% | | | | | | | | |
| AbbVie, Inc. | | | 173,675 | | | $ | 9,600,754 | |
| Actavis PLC (a) | | | 71,166 | | | | 16,153,259 | |
| Bristol-Myers Squibb Co. | | | 230,691 | | | | 11,684,499 | |
| Endo International PLC (a) | | | 96,301 | | | | 6,135,337 | |
| Merck & Co., Inc. | | | 122,122 | | | | 7,340,753 | |
16
Portfolio of Investments – continued
| | | | | | | | |
| Issuer | | Shares/Par | | | Value ($) | |
| | | | | | | | |
| Common Stocks - continued | | | | | | | | |
| Pharmaceuticals - continued | | | | | | | | |
| Valeant Pharmaceuticals International, Inc. (a) | | | 100,797 | | | $ | 11,823,488 | |
| Zoetis, Inc. | | | 188,671 | | | | 6,686,500 | |
| | | | | | | | |
| | | | | | | $ | 69,424,590 | |
| Railroad & Shipping - 1.7% | | | | | | | | |
| Canadian Pacific Railway Ltd. | | | 37,152 | | | $ | 7,452,691 | |
| Diana Shipping, Inc. (a) | | | 178,152 | | | | 1,895,537 | |
| Kansas City Southern Co. | | | 19,733 | | | | 2,276,399 | |
| Union Pacific Corp. | | | 93,454 | | | | 9,837,903 | |
| | | | | | | | |
| | | | | | | $ | 21,462,530 | |
| Real Estate - 3.3% | | | | | | | | |
| Equity Lifestyle Properties, Inc., REIT | | | 164,547 | | | $ | 7,518,152 | |
| Gramercy Property Trust, Inc., REIT | | | 436,331 | | | | 2,700,889 | |
| Medical Properties Trust, Inc., REIT | | | 541,402 | | | | 7,628,354 | |
| Mid-America Apartment Communities, Inc., REIT | | | 134,474 | | | | 9,725,160 | |
| Tanger Factory Outlet Centers, Inc., REIT | | | 184,826 | | | | 6,452,276 | |
| Weyerhaeuser Co., REIT | | | 234,582 | | | | 7,964,059 | |
| | | | | | | | |
| | | | | | | $ | 41,988,890 | |
| Restaurants - 0.8% | | | | | | | | |
| McDonald’s Corp. | | | 69,911 | | | $ | 6,552,059 | |
| YUM! Brands, Inc. | | | 53,606 | | | | 3,882,683 | |
| | | | | | | | |
| | | | | | | $ | 10,434,742 | |
| Specialty Chemicals - 1.2% | | | | | | | | |
| Albemarle Corp. | | | 65,455 | | | $ | 4,161,629 | |
| Amira Nature Foods Ltd (a)(l) | | | 71,578 | | | | 1,232,573 | |
| Taminco Corp. (a) | | | 116,924 | | | | 2,800,330 | |
| W.R. Grace & Co. (a) | | | 79,770 | | | | 7,899,623 | |
| | | | | | | | |
| | | | | | | $ | 16,094,155 | |
| Specialty Stores - 3.2% | | | | | | | | |
| AutoZone, Inc. (a) | | | 9,641 | | | $ | 5,194,956 | |
| Bed Bath & Beyond, Inc. (a) | | | 96,091 | | | | 6,174,808 | |
| Burlington Stores, Inc. (a) | | | 166,809 | | | | 5,950,077 | |
| Children’s Place, Inc. | | | 63,876 | | | | 3,433,974 | |
| L Brands, Inc. | | | 79,131 | | | | 5,052,514 | |
| Ross Stores, Inc. | | | 70,609 | | | | 5,325,331 | |
| Sally Beauty Holdings, Inc. (a) | | | 142,834 | | | | 3,982,212 | |
| Urban Outfitters, Inc. (a) | | | 168,564 | | | | 6,707,162 | |
| | | | | | | | |
| | | | | | | $ | 41,821,034 | |
| Telecommunications - Wireless - 1.1% | | | | | | | | |
| American Tower Corp., REIT | | | 149,578 | | | $ | 14,748,391 | |
17
Portfolio of Investments – continued
| | | | | | | | |
| Issuer | | Shares/Par | | | Value ($) | |
| | | | | | | | |
| Common Stocks - continued | | | | | | | | |
| Telephone Services - 1.4% | | | | | | | | |
| Verizon Communications, Inc. | | | 350,883 | | | $ | 17,480,991 | |
| | |
| Tobacco - 1.1% | | | | | | | | |
| Lorillard, Inc. | | | 60,346 | | | $ | 3,602,656 | |
| Philip Morris International, Inc. | | | 126,978 | | | | 10,866,777 | |
| | | | | | | | |
| | | | | | | $ | 14,469,433 | |
| Trucking - 0.5% | | | | | | | | |
| Swift Transportation Co. (a) | | | 299,261 | | | $ | 6,338,348 | |
| | |
| Utilities - Electric Power - 2.5% | | | | | | | | |
| American Electric Power Co., Inc. | | | 89,160 | | | $ | 4,787,892 | |
| Calpine Corp. (a) | | | 153,155 | | | | 3,640,494 | |
| CMS Energy Corp. | | | 159,012 | | | | 4,856,226 | |
| Dominion Resources, Inc. | | | 47,654 | | | | 3,346,264 | |
| Edison International | | | 72,007 | | | | 4,258,494 | |
| Exelon Corp. | | | 87,793 | | | | 2,934,042 | |
| NextEra Energy, Inc. | | | 26,336 | | | | 2,592,779 | |
| NRG Energy, Inc. | | | 86,840 | | | | 2,672,935 | |
| Pattern Energy Group, Inc. | | | 87,614 | | | | 2,824,237 | |
| | | | | | | | |
| | | | | | | $ | 31,913,363 | |
| Total Common Stocks (Identified Cost, $975,242,954) | | | | | | $ | 1,289,458,311 | |
| | |
| Money Market Funds - 0.3% | | | | | | | | |
MFS Institutional Money Market Portfolio, 0.09%,
at Cost and Net Asset Value (v) | | | 4,714,652 | | | $ | 4,714,652 | |
| | |
| Collateral for Securities Loaned - 0.1% | | | | | | | | |
Navigator Securities Lending Prime Portfolio, 0.15%,
at Cost and Net Asset Value (j) | | | 775,253 | | | $ | 775,253 | |
| Total Investments (Identified Cost, $980,732,859) | | | | | | $ | 1,294,948,216 | |
| | |
| Securities Sold Short - (0.2)% | | | | | | | | |
| Gaming & Lodging - (0.2)% | | | | | | | | |
Marriott International, Inc., “A”
(Proceeds Received $2,518,445) | | | (37,499 | ) | | $ | (2,602,431 | ) |
| | |
| Other Assets, Less Liabilities - (0.0)% | | | | | | | (248,121 | ) |
| Net Assets - 100.0% | | | | | | $ | 1,292,097,664 | |
| (a) | Non-income producing security. |
| (j) | The rate quoted is the annualized seven-day yield of the fund at period end. |
| (l) | A portion of this security is on loan. |
18
Portfolio of Investments – continued
| (s) | Security or a portion of the security was pledged to cover collateral requirements for securities sold short and certain derivative transactions. |
| (v) | Underlying affiliated fund that is available only to investment companies managed by MFS. The rate quoted for the MFS Institutional Money Market Portfolio is the annualized seven-day yield of the fund at period end. |
At August 31, 2014, the fund had cash collateral of $39,588 and other liquid securities with an aggregate value of $5,267,851 to cover any commitments for securities sold short and/or certain derivative contracts. Cash collateral is comprised of “Deposits with brokers” on the Statement of Assets and Liabilities.
The following abbreviations are used in this report and are defined:
| PLC | | Public Limited Company |
| REIT | | Real Estate Investment Trust |
See Notes to Financial Statements
19
Financial Statements
STATEMENT OF ASSETS AND LIABILITIES
At 8/31/14
This statement represents your fund’s balance sheet, which details the assets and liabilities comprising the total value of the fund.
| | | | |
| Assets | | | | |
Investments- | | | | |
Non-affiliated issuers, at value (identified cost, $976,018,207) | | | $1,290,233,564 | |
Underlying affiliated funds, at cost and value | | | 4,714,652 | |
Total investments, at value, including $765,502 of securities on loan (identified cost, $980,732,859) | | | $1,294,948,216 | |
Deposits with brokers | | | 39,588 | |
Receivables for | | | | |
Fund shares sold | | | 1,001,640 | |
Interest and dividends | | | 1,764,042 | |
Other assets | | | 1,722 | |
Total assets | | | $1,297,755,208 | |
| Liabilities | | | | |
Payables for | | | | |
Dividends on securities sold short | | | $7,500 | |
Securities sold short, at value (proceeds received, $2,518,445) | | | 2,602,431 | |
Fund shares reacquired | | | 1,050,864 | |
Collateral for securities loaned, at value | | | 775,253 | |
Payable to affiliates | | | | |
Investment adviser | | | 80,098 | |
Shareholder servicing costs | | | 886,360 | |
Distribution and service fees | | | 39,978 | |
Payable for independent Trustees’ compensation | | | 94,103 | |
Accrued expenses and other liabilities | | | 120,957 | |
Total liabilities | | | $5,657,544 | |
Net assets | | | $1,292,097,664 | |
| Net assets consist of | | | | |
Paid-in capital | | | $885,800,273 | |
Unrealized appreciation (depreciation) on investments and translation of assets and liabilities in foreign currencies | | | 314,131,410 | |
Accumulated net realized gain (loss) on investments and foreign currency | | | 87,168,447 | |
Undistributed net investment income | | | 4,997,534 | |
Net assets | | | $1,292,097,664 | |
Shares of beneficial interest outstanding | | | 44,664,481 | |
20
Statement of Assets and Liabilities – continued
| | | | | | | | | | | | |
| | | Net assets | | | Shares
outstanding | | | Net asset value
per share (a) | |
Class A | | | $1,002,027,973 | | | | 34,332,245 | | | | $29.19 | |
Class B | | | 40,536,298 | | | | 1,513,719 | | | | 26.78 | |
Class C | | | 89,702,406 | | | | 3,378,724 | | | | 26.55 | |
Class I | | | 45,089,476 | | | | 1,481,875 | | | | 30.43 | |
Class R1 | | | 4,132,303 | | | | 155,721 | | | | 26.54 | |
Class R2 | | | 19,434,167 | | | | 679,637 | | | | 28.59 | |
Class R3 | | | 68,976,652 | | | | 2,370,398 | | | | 29.10 | |
Class R4 | | | 19,706,229 | | | | 670,361 | | | | 29.40 | |
Class R5 | | | 2,492,160 | | | | 81,801 | | | | 30.47 | |
| (a) | Maximum offering price per share was equal to the net asset value per share for all share classes, except for Class A, for which the maximum offering price per share was $30.97 [100 / 94.25 x $29.19]. On sales of $50,000 or more, the maximum offering price of Class A shares is reduced. A contingent deferred sales charge may be imposed on redemptions of Class A, Class B, and Class C shares. Redemption price per share was equal to the net asset value per share for Classes I, R1, R2, R3, R4, and R5. |
See Notes to Financial Statements
21
Financial Statements
STATEMENT OF OPERATIONS
Year ended 8/31/14
This statement describes how much your fund earned in investment income and accrued in expenses. It also describes any gains and/or losses generated by fund operations.
| | | | |
| Net investment income | | | | |
Income | | | | |
Dividends | | | $18,889,169 | |
Interest | | | 34,312 | |
Dividends from underlying affiliated funds | | | 13,871 | |
Foreign taxes withheld | | | (32,699 | ) |
Total investment income | | | $18,904,653 | |
Expenses | | | | |
Management fee | | | $7,273,736 | |
Distribution and service fees | | | 3,984,778 | |
Shareholder servicing costs | | | 1,960,942 | |
Administrative services fee | | | 157,456 | |
Independent Trustees’ compensation | | | 38,766 | |
Custodian fee | | | 123,482 | |
Shareholder communications | | | 105,283 | |
Audit and tax fees | | | 54,471 | |
Legal fees | | | 12,052 | |
Dividend and interest expense on securities sold short | | | 8,077 | |
Miscellaneous | | | 177,025 | |
Total expenses | | | $13,896,068 | |
Fees paid indirectly | | | (46 | ) |
Reduction of expenses by investment adviser and distributor | | | (101,537 | ) |
Net expenses | | | $13,794,485 | |
Net investment income | | | $5,110,168 | |
Realized and unrealized gain (loss) on investments and
foreign currency | | | | |
Realized gain (loss) (identified cost basis) | | | | |
Investments | | | $105,468,989 | |
Written options | | | 53,454 | |
Foreign currency | | | (984 | ) |
Net realized gain (loss) on investments and foreign currency | | | $105,521,459 | |
Change in unrealized appreciation (depreciation) | | | | |
Investments | | | $142,394,687 | |
Written options | | | (47,199 | ) |
Securities sold short | | | (83,986 | ) |
Translation of assets and liabilities in foreign currencies | | | 562 | |
Net unrealized gain (loss) on investments and foreign currency translation | | | $142,264,064 | |
Net realized and unrealized gain (loss) on investments and foreign currency | | | $247,785,523 | |
Change in net assets from operations | | | $252,895,691 | |
See Notes to Financial Statements
22
Financial Statements
STATEMENTS OF CHANGES IN NET ASSETS
These statements describe the increases and/or decreases in net assets resulting from operations, any distributions, and any shareholder transactions.
| | | | | | | | |
| | | Years ended 8/31 | |
| | | 2014 | | | 2013 | |
| Change in net assets | | | | | | |
| From operations | | | | | | | | |
Net investment income | | | $5,110,168 | | | | $7,150,590 | |
Net realized gain (loss) on investments and foreign currency | | | 105,521,459 | | | | 100,554,062 | |
Net unrealized gain (loss) on investments and foreign currency translation | | | 142,264,064 | | | | 82,341,558 | |
Change in net assets from operations | | | $252,895,691 | | | | $190,046,210 | |
| Distributions declared to shareholders | | | | | | | | |
From net investment income | | | $(7,149,277 | ) | | | $(4,250,197 | ) |
Change in net assets from fund share transactions | | | $(64,001,160 | ) | | | $39,750,638 | |
Total change in net assets | | | $181,745,254 | | | | $225,546,651 | |
| Net assets | | | | | | | | |
At beginning of period | | | 1,110,352,410 | | | | 884,805,759 | |
At end of period (including undistributed net investment income of $4,997,534 and $7,037,226, respectively) | | | $1,292,097,664 | | | | $1,110,352,410 | |
See Notes to Financial Statements
23
Financial Statements
FINANCIAL HIGHLIGHTS
The financial highlights table is intended to help you understand the fund’s financial performance for the past 5 years (or life of a particular share class, if shorter). Certain information reflects financial results for a single fund share. The total returns in the table represent the rate by which an investor would have earned (or lost) on an investment in the fund share class (assuming reinvestment of all distributions) held for the entire period.
| | | | | | | | | | | | | | | | | | | | |
| Class A | | Years ended 8/31 | |
| | | 2014 | | | 2013 | | | 2012 | | | 2011 | | | 2010 | |
Net asset value, beginning of period | | | $23.82 | | | | $19.68 | | | | $17.20 | | | | $14.62 | | | | $13.87 | |
| Income (loss) from investment operations | | | | | | | | | | | | | | | | | | | | |
Net investment income (d) | | | $0.13 | | | | $0.18 | | | | $0.11 | | | | $0.11 | | | | $0.10 | |
Net realized and unrealized gain (loss)
on investments and foreign currency | | | 5.41 | | | | 4.07 | | | | 2.47 | | | | 2.58 | | | | 0.77 | |
Total from investment operations | | | $5.54 | | | | $4.25 | | | | $2.58 | | | | $2.69 | | | | $0.87 | |
| Less distributions declared to shareholders | | | | | | | | | | | | | | | | | | | | |
From net investment income | | | $(0.17 | ) | | | $(0.11 | ) | | | $(0.10 | ) | | | $(0.11 | ) | | | $(0.12 | ) |
Net asset value, end of period (x) | | | $29.19 | | | | $23.82 | | | | $19.68 | | | | $17.20 | | | | $14.62 | |
Total return (%) (r)(s)(t)(x) | | | 23.33 | | | | 21.69 | | | | 15.10 | | | | 18.39 | | | | 6.27 | |
Ratios (%) (to average net assets)
and Supplemental data: | | | | | | | | | | | | | | | | | | | | |
Expenses before expense reductions (f) | | | 1.05 | | | | 1.11 | | | | 1.15 | | | | 1.18 | | | | 1.24 | |
Expenses after expense reductions (f) | | | 1.04 | | | | 1.11 | | | | 1.15 | | | | 1.18 | | | | 1.23 | |
Net investment income | | | 0.49 | | | | 0.81 | | | | 0.61 | | | | 0.60 | | | | 0.68 | |
Portfolio turnover | | | 48 | | | | 58 | | | | 65 | | | | 66 | | | | 77 | |
Net assets at end of period (000 omitted) | | | $1,002,028 | | | | $873,139 | | | | $686,616 | | | | $612,504 | | | | $547,296 | |
| Supplemental Ratios (%): | | | | | | | | | | | | | | | | | | | | |
Ratio of expenses to average net assets after
expense reductions excluding short sale
dividend and interest expense (f) | | | 1.04 | | | | 1.10 | | | | 1.15 | | | | 1.17 | | | | 1.22 | |
See Notes to Financial Statements
24
Financial Highlights – continued
| | | | | | | | | | | | | | | | | | | | |
| Class B | | Years ended 8/31 | |
| | | 2014 | | | 2013 | | | 2012 | | | 2011 | | | 2010 | |
Net asset value, beginning of period | | | $21.88 | | | | $18.11 | | | | $15.86 | | | | $13.50 | | | | $12.80 | |
| Income (loss) from investment operations | | | | | | | | | | | | | | | | | | | | |
Net investment income (loss) (d) | | | $(0.06 | ) | | | $0.01 | | | | $(0.02 | ) | | | $(0.02 | ) | | | $(0.01 | ) |
Net realized and unrealized gain (loss)
on investments and foreign currency | | | 4.96 | | | | 3.76 | | | | 2.27 | | | | 2.38 | | | | 0.71 | |
Total from investment operations | | | $4.90 | | | | $3.77 | | | | $2.25 | | | | $2.36 | | | | $0.70 | |
| Less distributions declared to shareholders | | | | | | | | | | | | | | | | | | | | |
From net investment income | | | $— | | | | $— | | | | $— | | | | $— | | | | $(0.00 | )(w) |
Net asset value, end of period (x) | | | $26.78 | | | | $21.88 | | | | $18.11 | | | | $15.86 | | | | $13.50 | |
Total return (%) (r)(s)(t)(x) | | | 22.39 | | | | 20.82 | | | | 14.19 | | | | 17.48 | | | | 5.49 | |
Ratios (%) (to average net assets)
and Supplemental data: | | | | | | | | | | | | | | | | | | | | |
Expenses before expense reductions (f) | | | 1.80 | | | | 1.86 | | | | 1.91 | | | | 1.93 | | | | 1.99 | |
Expenses after expense reductions (f) | | | 1.80 | | | | 1.86 | | | | 1.90 | | | | 1.93 | | | | 1.98 | |
Net investment income (loss) | | | (0.26 | ) | | | 0.07 | | | | (0.14 | ) | | | (0.15 | ) | | | (0.06 | ) |
Portfolio turnover | | | 48 | | | | 58 | | | | 65 | | | | 66 | | | | 77 | |
Net assets at end of period (000 omitted) | | | $40,536 | | | | $40,495 | | | | $43,320 | | | | $49,181 | | | | $55,327 | |
| Supplemental Ratios (%): | | | | | | | | | | | | | | | | | | | | |
Ratio of expenses to average net assets after
expense reductions excluding short sale
dividend and interest expense (f) | | | 1.80 | | | | 1.86 | | | | 1.90 | | | | 1.92 | | | | 1.97 | |
See Notes to Financial Statements
25
Financial Highlights – continued
| | | | | | | | | | | | | | | | | | | | |
| Class C | | Years ended 8/31 | |
| | | 2014 | | | 2013 | | | 2012 | | | 2011 | | | 2010 | |
Net asset value, beginning of period | | | $21.72 | | | | $17.98 | | | | $15.74 | | | | $13.39 | | | | $12.75 | |
| Income (loss) from investment operations | | | | | | | | | | | | | | | | | | | | |
Net investment income (loss) (d) | | | $(0.06 | ) | | | $0.01 | | | | $(0.02 | ) | | | $(0.02 | ) | | | $(0.01 | ) |
Net realized and unrealized gain (loss)
on investments and foreign currency | | | 4.92 | | | | 3.73 | | | | 2.26 | | | | 2.37 | | | | 0.70 | |
Total from investment operations | | | $4.86 | | | | $3.74 | | | | $2.24 | | | | $2.35 | | | | $0.69 | |
| Less distributions declared to shareholders | | | | | | | | | | | | | | | | | | | | |
From net investment income | | | $(0.03 | ) | | | $— | | | | $— | | | | $— | | | | $(0.05 | ) |
Net asset value, end of period (x) | | | $26.55 | | | | $21.72 | | | | $17.98 | | | | $15.74 | | | | $13.39 | |
Total return (%) (r)(s)(t)(x) | | | 22.38 | | | | 20.80 | | | | 14.23 | | | | 17.55 | | | | 5.40 | |
Ratios (%) (to average net assets)
and Supplemental data: | | | | | | | | | | | | | | | | | | | | |
Expenses before expense reductions (f) | | | 1.80 | | | | 1.86 | | | | 1.90 | | | | 1.93 | | | | 1.99 | |
Expenses after expense reductions (f) | | | 1.80 | | | | 1.86 | | | | 1.90 | | | | 1.93 | | | | 1.98 | |
Net investment income (loss) | | | (0.26 | ) | | | 0.06 | | | | (0.14 | ) | | | (0.15 | ) | | | (0.07 | ) |
Portfolio turnover | | | 48 | | | | 58 | | | | 65 | | | | 66 | | | | 77 | |
Net assets at end of period (000 omitted) | | | $89,702 | | | | $78,777 | | | | $64,258 | | | | $62,249 | | | | $59,265 | |
| Supplemental Ratios (%): | | | | | | | | | | | | | | | | | | | | |
Ratio of expenses to average net assets after
expense reductions excluding short sale
dividend and interest expense (f) | | | 1.80 | | | | 1.86 | | | | 1.90 | | | | 1.92 | | | | 1.97 | |
See Notes to Financial Statements
26
Financial Highlights – continued
| | | | | | | | | | | | | | | | | | | | |
| Class I | | Years ended 8/31 | |
| | | 2014 | | | 2013 | | | 2012 | | | 2011 | | | 2010 | |
Net asset value, beginning of period | | | $24.82 | | | | $20.49 | | | | $17.91 | | | | $15.21 | | | | $14.43 | |
| Income (loss) from investment operations | | | | | | | | | | | | | | | | | | | | |
Net investment income (d) | | | $0.21 | | | | $0.24 | | | | $0.16 | | | | $0.15 | | | | $0.15 | |
Net realized and unrealized gain (loss)
on investments and foreign currency | | | 5.62 | | | | 4.25 | | | | 2.57 | | | | 2.70 | | | | 0.79 | |
Total from investment operations | | | $5.83 | | | | $4.49 | | | | $2.73 | | | | $2.85 | | | | $0.94 | |
| Less distributions declared to shareholders | | | | | | | | | | | | | | | | | | | | |
From net investment income | | | $(0.22 | ) | | | $(0.16 | ) | | | $(0.15 | ) | | | $(0.15 | ) | | | $(0.16 | ) |
Net asset value, end of period (x) | | | $30.43 | | | | $24.82 | | | | $20.49 | | | | $17.91 | | | | $15.21 | |
Total return (%) (r)(s)(x) | | | 23.61 | | | | 22.03 | | | | 15.36 | | | | 18.73 | | | | 6.47 | |
Ratios (%) (to average net assets)
and Supplemental data: | | | | | | | | | | | | | | | | | | | | |
Expenses before expense reductions (f) | | | 0.80 | | | | 0.86 | | | | 0.90 | | | | 0.93 | | | | 0.99 | |
Expenses after expense reductions (f) | | | 0.80 | | | | 0.86 | | | | 0.90 | | | | 0.93 | | | | 0.98 | |
Net investment income | | | 0.73 | | | | 1.05 | | | | 0.86 | | | | 0.83 | | | | 0.93 | |
Portfolio turnover | | | 48 | | | | 58 | | | | 65 | | | | 66 | | | | 77 | |
Net assets at end of period (000 omitted) | | | $45,089 | | | | $29,812 | | | | $20,441 | | | | $17,250 | | | | $16,291 | |
| Supplemental Ratios (%): | | | | | | | | | | | | | | | | | | | | |
Ratio of expenses to average net assets after
expense reductions excluding short sale
dividend and interest expense (f) | | | 0.80 | | | | 0.86 | | | | 0.90 | | | | 0.92 | | | | 0.97 | |
See Notes to Financial Statements
27
Financial Highlights – continued
| | | | | | | | | | | | | | | | | | | | |
| Class R1 | | Years ended 8/31 | |
| | | 2014 | | | 2013 | | | 2012 | | | 2011 | | | 2010 | |
Net asset value, beginning of period | | | $21.69 | | | | $17.95 | | | | $15.72 | | | | $13.38 | | | | $12.75 | |
| Income (loss) from investment operations | | | | | | | | | | | | | | | | | | | | |
Net investment income (loss) (d) | | | $(0.06 | ) | | | $0.02 | | | | $(0.02 | ) | | | $(0.02 | ) | | | $(0.01 | ) |
Net realized and unrealized gain (loss)
on investments and foreign currency | | | 4.91 | | | | 3.72 | | | | 2.25 | | | | 2.37 | | | | 0.70 | |
Total from investment operations | | | $4.85 | | | | $3.74 | | | | $2.23 | | | | $2.35 | | | | $0.69 | |
| Less distributions declared to shareholders | | | | | | | | | | | | | | | | | | | | |
From net investment income | | | $(0.00 | )(w) | | | $— | | | | $— | | | | $(0.01 | ) | | | $(0.06 | ) |
Net asset value, end of period (x) | | | $26.54 | | | | $21.69 | | | | $17.95 | | | | $15.72 | | | | $13.38 | |
Total return (%) (r)(s)(x) | | | 22.38 | | | | 20.84 | | | | 14.19 | | | | 17.56 | | | | 5.43 | |
Ratios (%) (to average net assets)
and Supplemental data: | | | | | | | | | | | | | | | | | | | | |
Expenses before expense reductions (f) | | | 1.80 | | | | 1.86 | | | | 1.90 | | | | 1.93 | | | | 1.99 | |
Expenses after expense reductions (f) | | | 1.80 | | | | 1.86 | | | | 1.90 | | | | 1.93 | | | | 1.98 | |
Net investment income (loss) | | | (0.26 | ) | | | 0.08 | | | | (0.14 | ) | | | (0.15 | ) | | | (0.07 | ) |
Portfolio turnover | | | 48 | | | | 58 | | | | 65 | | | | 66 | | | | 77 | |
Net assets at end of period (000 omitted) | | | $4,132 | | | | $3,839 | | | | $4,098 | | | | $3,904 | | | | $3,688 | |
| Supplemental Ratios (%): | | | | | | | | | | | | | | | | | | | | |
Ratio of expenses to average net assets after
expense reductions excluding short sale
dividend and interest expense (f) | | | 1.80 | | | | 1.85 | | | | 1.90 | | | | 1.92 | | | | 1.97 | |
See Notes to Financial Statements
28
Financial Highlights – continued
| | | | | | | | | | | | | | | | | | | | |
| Class R2 | | Years ended 8/31 | |
| | | 2014 | | | 2013 | | | 2012 | | | 2011 | | | 2010 | |
Net asset value, beginning of period | | | $23.35 | | | | $19.28 | | | | $16.86 | | | | $14.33 | | | | $13.62 | |
| Income (loss) from investment operations | | | | | | | | | | | | | | | | | | | | |
Net investment income (d) | | | $0.06 | | | | $0.12 | | | | $0.06 | | | | $0.06 | | | | $0.06 | |
Net realized and unrealized gain (loss)
on investments and foreign currency | | | 5.29 | | | | 4.00 | | | | 2.42 | | | | 2.54 | | | | 0.75 | |
Total from investment operations | | | $5.35 | | | | $4.12 | | | | $2.48 | | | | $2.60 | | | | $0.81 | |
| Less distributions declared to shareholders | | | | | | | | | | | | | | | | | | | | |
From net investment income | | | $(0.11 | ) | | | $(0.05 | ) | | | $(0.06 | ) | | | $(0.07 | ) | | | $(0.10 | ) |
Net asset value, end of period (x) | | | $28.59 | | | | $23.35 | | | | $19.28 | | | | $16.86 | | | | $14.33 | |
Total return (%) (r)(s)(x) | | | 22.96 | | | | 21.44 | | | | 14.74 | | | | 18.14 | | | | 5.97 | |
Ratios (%) (to average net assets)
and Supplemental data: | | | | | | | | | | | | | | | | | | | | |
Expenses before expense reductions (f) | | | 1.30 | | | | 1.36 | | | | 1.40 | | | | 1.43 | | | | 1.49 | |
Expenses after expense reductions (f) | | | 1.30 | | | | 1.36 | | | | 1.40 | | | | 1.43 | | | | 1.48 | |
Net investment income | | | 0.24 | | | | 0.56 | | | | 0.36 | | | | 0.35 | | | | 0.43 | |
Portfolio turnover | | | 48 | | | | 58 | | | | 65 | | | | 66 | | | | 77 | |
Net assets at end of period (000 omitted) | | | $19,434 | | | | $19,625 | | | | $17,369 | | | | $16,424 | | | | $14,013 | |
| Supplemental Ratios (%): | | | | | | | | | | | | | | | | | | | | |
Ratio of expenses to average net assets after
expense reductions excluding short sale
dividend and interest expense (f) | | | 1.30 | | | | 1.36 | | | | 1.40 | | | | 1.42 | | | | 1.47 | |
See Notes to Financial Statements
29
Financial Highlights – continued
| | | | | | | | | | | | | | | | | | | | |
| Class R3 | | Years ended 8/31 | |
| | | 2014 | | | 2013 | | | 2012 | | | 2011 | | | 2010 | |
Net asset value, beginning of period | | | $23.75 | | | | $19.63 | | | | $17.16 | | | | $14.59 | | | | $13.85 | |
| Income (loss) from investment operations | | | | | | | | | | | | | | | | | | | | |
Net investment income (d) | | | $0.13 | | | | $0.18 | | | | $0.11 | | | | $0.11 | | | | $0.10 | |
Net realized and unrealized gain (loss)
on investments and foreign currency | | | 5.39 | | | | 4.05 | | | | 2.47 | | | | 2.57 | | | | 0.77 | |
Total from investment operations | | | $5.52 | | | | $4.23 | | | | $2.58 | | | | $2.68 | | | | $0.87 | |
| Less distributions declared to shareholders | | | | | | | | | | | | | | | | | | | | |
From net investment income | | | $(0.17 | ) | | | $(0.11 | ) | | | $(0.11 | ) | | | $(0.11 | ) | | | $(0.13 | ) |
Net asset value, end of period (x) | | | $29.10 | | | | $23.75 | | | | $19.63 | | | | $17.16 | | | | $14.59 | |
Total return (%) (r)(s)(x) | | | 23.32 | | | | 21.68 | | | | 15.12 | | | | 18.38 | | | | 6.25 | |
Ratios (%) (to average net assets)
and Supplemental data: | | | | | | | | | | | | | | | | | | | | |
Expenses before expense reductions (f) | | | 1.05 | | | | 1.11 | | | | 1.15 | | | | 1.18 | | | | 1.24 | |
Expenses after expense reductions (f) | | | 1.05 | | | | 1.11 | | | | 1.15 | | | | 1.18 | | | | 1.23 | |
Net investment income | | | 0.49 | | | | 0.81 | | | | 0.61 | | | | 0.60 | | | | 0.68 | |
Portfolio turnover | | | 48 | | | | 58 | | | | 65 | | | | 66 | | | | 77 | |
Net assets at end of period (000 omitted) | | | $68,977 | | | | $58,381 | | | | $46,833 | | | | $32,277 | | | | $26,573 | |
| Supplemental Ratios (%): | | | | | | | | | | | | | | | | | | | | |
Ratio of expenses to average net assets after
expense reductions excluding short sale
dividend and interest expense (f) | | | 1.05 | | | | 1.10 | | | | 1.15 | | | | 1.17 | | | | 1.22 | |
See Notes to Financial Statements
30
Financial Highlights – continued
| | | | | | | | | | | | | | | | | | | | |
| Class R4 | | Years ended 8/31 | |
| | | 2014 | | | 2013 | | | 2012 | | | 2011 | | | 2010 | |
Net asset value, beginning of period | | | $23.99 | | | | $19.81 | | | | $17.32 | | | | $14.72 | | | | $13.98 | |
| Income (loss) from investment operations | | | | | | | | | | | | | | | | | | | | |
Net investment income (d) | | | $0.20 | | | | $0.23 | | | | $0.16 | | | | $0.13 | | | | $0.14 | |
Net realized and unrealized gain (loss)
on investments and foreign currency | | | 5.44 | | | | 4.11 | | | | 2.48 | | | | 2.62 | | | | 0.76 | |
Total from investment operations | | | $5.64 | | | | $4.34 | | | | $2.64 | | | | $2.75 | | | | $0.90 | |
| Less distributions declared to shareholders | | | | | | | | | | | | | | | | | | | | |
From net investment income | | | $(0.23 | ) | | | $(0.16 | ) | | | $(0.15 | ) | | | $(0.15 | ) | | | $(0.16 | ) |
Net asset value, end of period (x) | | | $29.40 | | | | $23.99 | | | | $19.81 | | | | $17.32 | | | | $14.72 | |
Total return (%) (r)(s)(x) | | | 23.62 | | | | 22.03 | | | | 15.36 | | | | 18.68 | | | | 6.40 | |
Ratios (%) (to average net assets)
and Supplemental data: | | | | | | | | | | | | | | | | | | | | |
Expenses before expense reductions (f) | | | 0.81 | | | | 0.86 | | | | 0.91 | | | | 0.92 | | | | 0.98 | |
Expenses after expense reductions (f) | | | 0.80 | | | | 0.86 | | | | 0.90 | | | | 0.92 | | | | 0.97 | |
Net investment income | | | 0.72 | | | | 1.04 | | | | 0.86 | | | | 0.75 | | | | 0.92 | |
Portfolio turnover | | | 48 | | | | 58 | | | | 65 | | | | 66 | | | | 77 | |
Net assets at end of period (000 omitted) | | | $19,706 | | | | $6,165 | | | | $1,871 | | | | $1,367 | | | | $408 | |
| Supplemental Ratios (%): | | | | | | | | | | | | | | | | | | | | |
Ratio of expenses to average net assets after
expense reductions excluding short sale
dividend and interest expense (f) | | | 0.80 | | | | 0.86 | | | | 0.90 | | | | 0.91 | | | | 0.97 | |
See Notes to Financial Statements
31
Financial Highlights – continued
| | | | | | | | |
| Class R5 | | Years ended 8/31 | |
| | | 2014 | | | 2013 (i) | |
Net asset value, beginning of period | | | $24.84 | | | | $21.02 | |
| Income (loss) from investment operations | | | | | | | | |
Net investment income (d) | | | $0.23 | | | | $0.22 | |
Net realized and unrealized gain (loss) on investments and foreign currency | | | 5.64 | | | | 3.60 | |
Total from investment operations | | | $5.87 | | | | $3.82 | |
| Less distributions declared to shareholders | | | | | | | | |
From net investment income | | | $(0.24 | ) | | | $— | |
Net asset value, end of period (x) | | | $30.47 | | | | $24.84 | |
Total return (%) (r)(s)(x) | | | 23.73 | | | | 18.17 | (n) |
| Ratios (%) (to average net assets) and Supplemental data: | | | | | | | | |
Expenses before expense reductions (f) | | | 0.71 | | | | 0.76 | (a) |
Expenses after expense reductions (f) | | | 0.71 | | | | 0.76 | (a) |
Net investment income | | | 0.80 | | | | 1.39 | (a) |
Portfolio turnover | | | 48 | | | | 58 | |
Net assets at end of period (000 omitted) | | | $2,492 | | | | $119 | |
| Supplemental Ratios (%): | | | | | | | | |
Ratio of expenses to average net assets after expense reductions excluding
short sale dividend and interest expense (f) | | | 0.71 | | | | 0.75 | (a) |
| (d) | Per share data is based on average shares outstanding. |
| (f) | Ratios do not reflect reductions from fees paid indirectly, if applicable. |
| (i) | For the period from the class inception, January 2, 2013, through the stated period end. |
| (r) | Certain expenses have been reduced without which performance would have been lower. |
| (s) | From time to time the fund may receive proceeds from litigation settlements, without which performance would be lower. |
| (t) | Total returns do not include any applicable sales charges. |
| (w) | Per share amount was less than $0.01. |
| (x) | The net asset values per share and total returns have been calculated on net assets which include adjustments made in accordance with U.S. generally accepted accounting principles required at period end for financial reporting purposes. |
See Notes to Financial Statements
32
NOTES TO FINANCIAL STATEMENTS
(1) Business and Organization
MFS Core Equity Fund (the fund) is a diversified series of MFS Series Trust I (the trust). The trust is organized as a Massachusetts business trust and is registered under the Investment Company Act of 1940, as amended, as an open-end management investment company.
The fund is an investment company and accordingly follows the investment company accounting and reporting guidance of the Financial Accounting Standards Board (FASB) Accounting Standards Codification Topic 946 Financial Services – Investment Companies.
(2) Significant Accounting Policies
General – The preparation of financial statements in conformity with U.S. generally accepted accounting principles requires management to make estimates and assumptions that affect the reported amounts of assets and liabilities, and disclosure of contingent assets and liabilities at the date of the financial statements and the reported amounts of increases and decreases in net assets from operations during the reporting period. Actual results could differ from those estimates. In the preparation of these financial statements, management has evaluated subsequent events occurring after the date of the fund’s Statement of Assets and Liabilities through the date that the financial statements were issued.
In June 2014, FASB issued Accounting Standards Update 2014-11, Transfers and Servicing (Topic 860) – Repurchase-to-Maturity Transactions, Repurchase Financings, and Disclosures (“ASU 2014-11”). ASU 2014-11 changes the accounting for repurchase-to-maturity transactions (i.e., repurchase agreements that settle at the same time as the maturity of the transferred financial asset) and enhances the required disclosures for repurchase agreements and other similar transactions. Although still evaluating the potential impacts of ASU 2014-11 to the fund, management expects that the impact of the fund’s adoption will be limited to additional financial statement disclosures which would first be effective for interim reporting periods beginning after March 15, 2015.
Balance Sheet Offsetting – The fund’s accounting policy with respect to balance sheet offsetting is that, absent an event of default by the counterparty or a termination of the agreement, the International Swaps and Derivatives Association (ISDA) Master Agreement does not result in an offset of reported amounts of financial assets and financial liabilities in the Statement of Assets and Liabilities across transactions between the fund and the applicable counterparty. The fund’s right to setoff may be restricted or prohibited by the bankruptcy or insolvency laws of the particular jurisdiction to which a specific master netting agreement counterparty is subject. Balance sheet offsetting disclosures, to the extent applicable to the fund, have been included in the fund’s Significant Accounting Policies note under the captions for each of the fund’s in-scope financial instruments and transactions.
Investment Valuations – Equity securities, including restricted equity securities, are generally valued at the last sale or official closing price as provided by a third-party pricing service on the market or exchange on which they are primarily traded. Equity
33
Notes to Financial Statements – continued
securities, for which there were no sales reported that day, are generally valued at the last quoted daily bid quotation as provided by a third-party pricing service on the market or exchange on which such securities are primarily traded. Equity securities held short, for which there were no sales reported for that day, are generally valued at the last quoted daily ask quotation as provided by a third-party pricing service on the market or exchange on which such securities are primarily traded. Short-term instruments with a maturity at issuance of 60 days or less generally are valued at amortized cost, which approximates market value. Exchange-traded options are generally valued at the last sale or official closing price as provided by a third-party pricing service on the exchange on which such options are primarily traded. Exchange-traded options for which there were no sales reported that day are generally valued at the last daily bid quotation as provided by a third-party pricing service on the exchange on which such options are primarily traded. Options not traded on an exchange are generally valued at a broker/dealer bid quotation. Foreign currency options are generally valued at valuations provided by a third-party pricing service. Open-end investment companies are generally valued at net asset value per share. Securities and other assets generally valued on the basis of information from a third-party pricing service may also be valued at a broker/dealer bid quotation. Values obtained from third-party pricing services can utilize both transaction data and market information such as yield, quality, coupon rate, maturity, type of issue, trading characteristics, and other market data. The values of foreign securities and other assets and liabilities expressed in foreign currencies are converted to U.S. dollars using the mean of bid and asked prices for rates provided by a third-party pricing service.
The Board of Trustees has delegated primary responsibility for determining or causing to be determined the value of the fund’s investments (including any fair valuation) to the adviser pursuant to valuation policies and procedures approved by the Board. If the adviser determines that reliable market quotations are not readily available, investments are valued at fair value as determined in good faith by the adviser in accordance with such procedures under the oversight of the Board of Trustees. Under the fund’s valuation policies and procedures, market quotations are not considered to be readily available for most types of debt instruments and floating rate loans and many types of derivatives. These investments are generally valued at fair value based on information from third-party pricing services. In addition, investments may be valued at fair value if the adviser determines that an investment’s value has been materially affected by events occurring after the close of the exchange or market on which the investment is principally traded (such as foreign exchange or market) and prior to the determination of the fund’s net asset value, or after the halting of trading of a specific security where trading does not resume prior to the close of the exchange or market on which the security is principally traded. Events that occur on a frequent basis after foreign markets close (such as developments in foreign markets and significant movements in the U.S. markets) and prior to the determination of the fund’s net asset value may be deemed to have a material effect on the value of securities traded in foreign markets. Accordingly, the fund’s foreign equity securities may often be valued at fair value. The adviser generally relies on third-party pricing services or other information (such as the correlation with price movements of similar securities in the same or other markets; the type, cost and investment characteristics of the security; the business and financial
34
Notes to Financial Statements – continued
condition of the issuer; and trading and other market data) to assist in determining whether to fair value and at what value to fair value an investment. The value of an investment for purposes of calculating the fund’s net asset value can differ depending on the source and method used to determine value. When fair valuation is used, the value of an investment used to determine the fund’s net asset value may differ from quoted or published prices for the same investment. There can be no assurance that the fund could obtain the fair value assigned to an investment if it were to sell the investment at the same time at which the fund determines its net asset value per share.
Various inputs are used in determining the value of the fund’s assets or liabilities. These inputs are categorized into three broad levels. In certain cases, the inputs used to measure fair value may fall into different levels of the fair value hierarchy. In such cases, an investment’s level within the fair value hierarchy is based on the lowest level of input that is significant to the fair value measurement. The fund’s assessment of the significance of a particular input to the fair value measurement in its entirety requires judgment, and considers factors specific to the investment. Level 1 includes unadjusted quoted prices in active markets for identical assets or liabilities. Level 2 includes other significant observable market-based inputs (including quoted prices for similar securities, interest rates, prepayment speed, and credit risk). Level 3 includes unobservable inputs, which may include the adviser’s own assumptions in determining the fair value of investments. The following is a summary of the levels used as of August 31, 2014 in valuing the fund’s assets or liabilities:
| | | | | | | | | | | | | | | | |
| Investments at Value | | Level 1 | | | Level 2 | | | Level 3 | | | Total | |
| Equity Securities: | | | | | | | | | | | | | | | | |
United States | | | $1,242,280,386 | | | | $— | | | | $— | | | | $1,242,280,386 | |
Canada | | | 28,844,124 | | | | — | | | | — | | | | 28,844,124 | |
Israel | | | 11,396,863 | | | | — | | | | — | | | | 11,396,863 | |
Hong Kong | | | 3,534,343 | | | | — | | | | — | | | | 3,534,343 | |
Greece | | | 1,895,537 | | | | — | | | | — | | | | 1,895,537 | |
United Arab Emirates | | | 1,232,573 | | | | — | | | | — | | | | 1,232,573 | |
Cayman Islands | | | — | | | | — | | | | 274,485 | | | | 274,485 | |
| Mutual Funds | | | 5,489,905 | | | | — | | | | — | | | | 5,489,905 | |
| Total Investments | | | $1,294,673,731 | | | | $— | | | | $274,485 | | | | $1,294,948,216 | |
| Short Sales | | | $(2,602,431 | ) | | | $— | | | | $— | | | | $(2,602,431 | ) |
For further information regarding security characteristics, see the Portfolio of Investments.
The following is a reconciliation of level 3 assets for which significant unobservable inputs were used to determine fair value. The fund’s policy is to recognize transfers between the levels as of the end of the period. The table presents the activity of level 3 securities held at the beginning and the end of the period.
| | | | |
| | | Equity Securities | |
| Balance as of 8/31/13 | | | $638,467 | |
Change in unrealized appreciation (depreciation) | | | (359,055 | ) |
Partial liquidation proceeds | | | (4,927 | ) |
| Balance as of 8/31/14 | | | $274,485 | |
35
Notes to Financial Statements – continued
The net change in unrealized appreciation (depreciation) from investments still held as level 3 at August 31, 2014 is $(359,055). At August 31, 2014, the fund held one level 3 security.
Foreign Currency Translation – Purchases and sales of foreign investments, income, and expenses are converted into U.S. dollars based upon currency exchange rates prevailing on the respective dates of such transactions or on the reporting date for foreign denominated receivables and payables. Gains and losses attributable to foreign currency exchange rates on sales of securities are recorded for financial statement purposes as net realized gains and losses on investments. Gains and losses attributable to foreign exchange rate movements on receivables, payables, income and expenses are recorded for financial statement purposes as foreign currency transaction gains and losses. That portion of both realized and unrealized gains and losses on investments that results from fluctuations in foreign currency exchange rates is not separately disclosed.
Derivatives – The fund uses derivatives for different purposes, primarily to increase or decrease exposure to a particular market or segment of the market, or security, to increase or decrease interest rate or currency exposure, or as alternatives to direct investments. Derivatives are used for hedging or non-hedging purposes. While hedging can reduce or eliminate losses, it can also reduce or eliminate gains. When the fund uses derivatives as an investment to increase market exposure, or for hedging purposes, gains and losses from derivative instruments may be substantially greater than the derivative’s original cost.
The derivative instruments used by the fund were written options and purchased options. At August 31, 2014, the fund did not have any outstanding derivative instruments.
The following table presents, by major type of derivative contract, the realized gain (loss) on derivatives held by the fund for the year ended August 31, 2014 as reported in the Statement of Operations:
| | | | | | | | |
| Risk | | Investments
(Purchased
Options) | | | Written
Options | |
| Equity | | | $(52,367 | ) | | | $53,454 | |
The following table presents, by major type of derivative contract, the change in unrealized appreciation (depreciation) on derivatives held by the fund for the year ended August 31, 2014 as reported in the Statement of Operations:
| | | | | | | | |
| Risk | | Investments
(Purchased
Options) | | | Written
Options | |
| Equity | | | $17,827 | | | | $(47,199 | ) |
Derivative counterparty credit risk is managed through formal evaluation of the creditworthiness of all potential counterparties. On certain, but not all, over-the-counter derivatives, the fund attempts to reduce its exposure to counterparty credit risk whenever possible by entering into an ISDA Master Agreement on a bilateral basis with each of the counterparties with whom it undertakes a significant volume of
36
Notes to Financial Statements – continued
transactions. The ISDA Master Agreement gives each party to the agreement the right to terminate all transactions traded under such agreement if there is a certain deterioration in the credit quality of the other party. Upon an event of default or a termination of the ISDA Master Agreement, the non-defaulting party has the right to close out all transactions traded under such agreement and to net amounts owed under each transaction to one net amount payable by one party to the other. This right to close out and net payments across all transactions traded under the ISDA Master Agreement could result in a reduction of the fund’s credit risk to such counterparty equal to any amounts payable by the fund under the applicable transactions, if any. The fund’s right to setoff may be restricted or prohibited by the bankruptcy or insolvency laws of the particular jurisdiction to which a specific ISDA counterparty is subject.
Collateral and margin requirements differ by type of derivative. Margin requirements are set by the broker or clearing house for cleared derivatives (i.e., futures contracts, cleared swaps, and exchange-traded options) while collateral terms are contract specific for over-the-counter traded derivatives (i.e., forward foreign currency exchange contracts, uncleared swap agreements, and over-the-counter options). For derivatives traded under an ISDA Master Agreement, the collateral requirements are netted across all transactions traded under such agreement and one amount is posted from one party to the other to collateralize such obligations. Cash that has been segregated to cover the fund’s collateral or margin obligations under derivative contracts, if any, will be reported separately in the Statement of Assets and Liabilities as “Restricted cash” or “Deposits with brokers.” Securities pledged as collateral or margin for the same purpose, if any, are noted in the Portfolio of Investments.
Written Options – In exchange for a premium, the fund wrote call options on securities that it anticipated the price would decline and also wrote put options on securities that it anticipated the price would increase. At the time the option was written, the fund believed the premium received exceeded the potential loss that could result from adverse price changes in the options’ underlying securities. In a written option, the fund as the option writer grants the buyer the right to purchase from, or sell to, the fund a specified number of shares or units of a particular security, currency or index at a specified price within a specified period of time.
The premium received is initially recorded as a liability in the Statement of Assets and Liabilities. The option is subsequently marked-to-market daily with the difference between the premium received and the market value of the written option being recorded as unrealized appreciation or depreciation. When a written option expires, the fund realizes a gain equal to the amount of the premium received. The difference between the premium received and the amount paid on effecting a closing transaction is considered a realized gain or loss. When a written call option is exercised, the premium received is offset against the proceeds to determine the realized gain or loss. When a written put option is exercised, the premium reduces the cost basis of the security purchased by the fund.
At the initiation of the written option contract, for exchange traded options, the fund is required to deposit securities or cash as collateral with the custodian for the benefit of the broker. For over-the-counter options, the fund may post collateral subject to the terms of an ISDA Master Agreement as generally described above if the market value
37
Notes to Financial Statements – continued
of the options contract moves against it. The fund, as writer of an option, may have no control over whether the underlying securities may be sold (call) or purchased (put) and, as a result, bears the market risk of an unfavorable change in the price of the securities underlying the written option. Losses from writing options can exceed the premium received and can exceed the potential loss from an ordinary buy and sell transaction. Although the fund’s market risk may be significant, the maximum counterparty credit risk to the fund is equal to the market value of any collateral posted to the broker. For over-the-counter options, this risk is mitigated in cases where there is an ISDA Master Agreement between the fund and the counterparty providing for netting as described above.
The following table represents the written option activity in the fund during the year ended August 31, 2014:
| | | | | | | | |
| | | Number of Contracts | | | Premiums Received | |
| Outstanding, beginning of period | | | 1,057 | | | | $53,131 | |
| Options written | | | 58 | | | | 11,712 | |
| Options exercised | | | (283 | ) | | | (11,389 | ) |
| Options expired | | | (832 | ) | | | (53,454 | ) |
| Outstanding, end of period | | | — | | | | $— | |
Purchased Options – The fund purchased call and put options for a premium. Purchased call and put options entitle the holder to buy and sell a specified number of shares or units of a particular security, currency or index at a specified price at a specified date or within a specified period of time. Purchasing call options may hedge against an anticipated increase in the dollar cost of securities or currency to be acquired or increase the fund’s exposure to an underlying instrument. Purchasing put options may hedge against an anticipated decline in the value of portfolio securities or currency or decrease the fund’s exposure to an underlying instrument.
The premium paid is initially recorded as an investment in the Statement of Assets and Liabilities. That investment is subsequently marked-to-market daily with the difference between the premium paid and the market value of the purchased option being recorded as unrealized appreciation or depreciation. Premiums paid for purchased call and put options which have expired are treated as realized losses on investments in the Statement of Operations. Upon the exercise or closing of a purchased call option, the premium paid is added to the cost of the security or financial instrument purchased. Upon the exercise or closing of a purchased put option, the premium paid is offset against the proceeds on the sale of the underlying security or financial instrument in order to determine the realized gain or loss on investments.
Whether or not the option is exercised, the fund’s maximum risk of loss from purchasing an option is the amount of premium paid. All option contracts involve credit risk if the counterparty to the option contract fails to perform. For over-the-counter options, this risk is mitigated in cases where there is an ISDA Master Agreement between the fund and the counterparty providing for netting as described above and for posting of collateral by the counterparty to the fund to cover the fund’s exposure to the counterparty under such ISDA Master Agreement.
38
Notes to Financial Statements – continued
Short Sales – The fund entered into short sales whereby it sells a security it does not own in anticipation of a decline in the value of that security. The fund will realize a gain if the security price decreases and a loss if the security price increases between the date of the short sale and the date on which the fund replaces the borrowed security. Losses from short sales can exceed the proceeds of the security sold; and they can also exceed the potential loss from an ordinary buy and sell transaction. The amount of any premium, dividends, or interest the fund may be required to pay in connection with a short sale will be recognized as a fund expense. During the year ended August 31, 2014, this expense amounted to $8,077. The fund segregates cash or marketable securities in an amount that, when combined with the amount of proceeds from the short sale deposited with the broker, at least equals the current market value of the security sold short.
Security Loans – Under its Securities Lending Agency Agreement with the fund, State Street Bank and Trust Company (“State Street”), as lending agent, loans the securities of the fund to certain qualified institutions (the “Borrowers”) approved by the fund. The loans are collateralized by cash and/or U.S. Treasury and federal agency obligations in an amount typically at least equal to the market value of the securities loaned. On loans collateralized by cash, the cash collateral is invested in a money market fund. The market value of the loaned securities is determined at the close of business of the fund and any additional required collateral is delivered to the fund on the next business day. State Street provides the fund with indemnification against Borrower default. In the event of Borrower default, State Street will for the benefit of the fund either purchase securities identical to those loaned or, when such purchase is commercially impracticable, pay the fund the market value of the loaned securities. In return, State Street assumes the fund’s rights to the related collateral. If the collateral value is less than the cost to purchase identical securities, State Street is responsible for the shortfall, but only to the extent that such shortfall is not due to a decline in collateral value resulting from collateral reinvestment for which the fund bears the risk of loss. At period end, the fund had investment securities on loan with a fair value of $765,502 and a related liability of $775,253 for cash collateral received on securities loaned, both of which are presented gross in the Statement of Assets and Liabilities. The collateral received on securities loaned exceeded the value of securities on loan at period end. The liability for cash collateral for securities loaned is carried at fair value, which is categorized as level 2 within the fair value hierarchy. A portion of the income generated upon investment of the collateral is remitted to the Borrowers, and the remainder is allocated between the fund and the lending agent. On loans collateralized by U.S. Treasury and/or federal agency obligations, a fee is received from the Borrower, and is allocated between the fund and the lending agent. Income from securities lending is included in “Interest” income in the Statement of Operations. The dividend and interest income earned on the securities loaned is accounted for in the same manner as other dividend and interest income.
Indemnifications – Under the fund’s organizational documents, its officers and Trustees may be indemnified against certain liabilities and expenses arising out of the performance of their duties to the fund. Additionally, in the normal course of business, the fund enters into agreements with service providers that may contain
39
Notes to Financial Statements – continued
indemnification clauses. The fund’s maximum exposure under these agreements is unknown as this would involve future claims that may be made against the fund that have not yet occurred.
Investment Transactions and Income – Investment transactions are recorded on the trade date. Interest income is recorded on the accrual basis. Dividends received in cash are recorded on the ex-dividend date. Certain dividends from foreign securities will be recorded when the fund is informed of the dividend if such information is obtained subsequent to the ex-dividend date. Dividend and interest payments received in additional securities are recorded on the ex-dividend or ex-interest date in an amount equal to the value of the security on such date.
The fund may receive proceeds from litigation settlements. Any proceeds received from litigation involving portfolio holdings are reflected in the Statement of Operations in realized gain/loss if the security has been disposed of by the fund or in unrealized gain/loss if the security is still held by the fund. Any other proceeds from litigation not related to portfolio holdings are reflected as other income in the Statement of Operations.
Fees Paid Indirectly – The fund’s custody fee may be reduced according to an arrangement that measures the value of cash deposited with the custodian by the fund. This amount, for the year ended August 31, 2014, is shown as a reduction of total expenses in the Statement of Operations.
Tax Matters and Distributions – The fund intends to qualify as a regulated investment company, as defined under Subchapter M of the Internal Revenue Code, and to distribute all of its taxable income, including realized capital gains. As a result, no provision for federal income tax is required. The fund’s federal tax returns, when filed, will remain subject to examination by the Internal Revenue Service for a three year period. Management has analyzed the fund’s tax positions taken on federal and state tax returns for all open tax years and does not believe that there are any uncertain tax positions that require recognition of a tax liability. Foreign taxes, if any, have been accrued by the fund in the accompanying financial statements in accordance with the applicable foreign tax law. Foreign income taxes may be withheld by certain countries in which the fund invests. Additionally, capital gains realized by the fund on securities issued in or by certain foreign countries may be subject to capital gains tax imposed by those countries.
Distributions to shareholders are recorded on the ex-dividend date. Income and capital gain distributions are determined in accordance with income tax regulations, which may differ from U.S. generally accepted accounting principles. Certain capital accounts in the financial statements are periodically adjusted for permanent differences in order to reflect their tax character. These adjustments have no impact on net assets or net asset value per share. Temporary differences which arise from recognizing certain items of income, expense, gain or loss in different periods for financial statement and tax purposes will reverse at some time in the future. Distributions in excess of net investment income or net realized gains are temporary overdistributions for financial statement purposes resulting from differences in the recognition or classification of income or distributions for financial statement and tax purposes.
40
Notes to Financial Statements – continued
Book/tax differences primarily relate to wash sale loss deferrals, straddle loss deferrals, and treating a portion of the proceeds from redemptions as a distribution for tax purposes.
The tax character of distributions declared to shareholders for the last two fiscal years is as follows:
| | | | | | | | |
| | | 8/31/14 | | | 8/31/13 | |
| Ordinary income (including any short-term capital gains) | | | $7,149,277 | | | | $4,250,197 | |
The federal tax cost and the tax basis components of distributable earnings were as follows:
| | | | |
| As of 8/31/14 | | | |
| Cost of investments | | | $982,181,777 | |
| Gross appreciation | | | 330,551,919 | |
| Gross depreciation | | | (17,785,480 | ) |
| Net unrealized appreciation (depreciation) | | | $312,766,439 | |
| Undistributed ordinary income | | | 40,337,229 | |
| Undistributed long-term capital gain | | | 60,026,109 | |
| Capital loss carryforwards | | | (6,399,816 | ) |
| Other temporary differences | | | (432,570 | ) |
Under the Regulated Investment Company Modernization Act of 2010 (the “Act”), net capital losses recognized for fund fiscal years beginning after August 31, 2011 may be carried forward indefinitely, and their character is retained as short-term and/or long-term losses (“post-enactment losses”). Previously, net capital losses were carried forward for eight years and treated as short-term losses (“pre-enactment losses”). As a transition rule, the Act requires that all post-enactment net capital losses be used before pre-enactment net capital losses.
As of August 31, 2014, the fund had capital loss carryforwards available to offset future realized gains. Such pre-enactment losses expire as follows:
The availability of $6,399,816 of the capital loss carryforwards, which were acquired on July 24, 2009 in connection with the MFS New Endeavor Fund merger, may be limited in a given year.
Multiple Classes of Shares of Beneficial Interest – The fund offers multiple classes of shares, which differ in their respective distribution and service fees. The fund’s income, realized and unrealized gain (loss), and common expenses are allocated to shareholders based on the daily net assets of each class. Dividends are declared separately for each class. Differences in per share dividend rates are generally due to differences in separate class expenses. Class B shares will convert to Class A shares
41
Notes to Financial Statements – continued
approximately eight years after purchase. The fund’s distributions declared to shareholders as reported in the Statements of Changes in Net Assets are presented by class as follows:
| | | | | | | | |
| | | From net investment
income | |
| | | Year
ended
8/31/14 | | | Year
ended
8/31/13 | |
| Class A | | | $6,151,825 | | | | $3,763,479 | |
| Class C | | | 97,951 | | | | — | |
| Class I | | | 313,713 | | | | 153,997 | |
| Class R1 | | | 485 | | | | — | |
| Class R2 | | | 88,902 | | | | 46,102 | |
| Class R3 | | | 423,237 | | | | 268,678 | |
| Class R4 | | | 72,032 | | | | 17,941 | |
| Class R5 | | | 1,132 | | | | — | |
| Total | | | $7,149,277 | | | | $4,250,197 | |
(3) Transactions with Affiliates
Investment Adviser – The fund has an investment advisory agreement with MFS to provide overall investment management and related administrative services and facilities to the fund. The management fee is computed daily and paid monthly at the following annual rates:
| | | | |
| First $500 million of average daily net assets | | | 0.65 | % |
| Average daily net assets in excess of $500 million | | | 0.55 | % |
The investment adviser has agreed in writing to reduce its management fee to 0.50% of average daily net assets in excess of $2.5 billion. This written agreement will continue until modified by the fund’s Board of Trustees, but such agreement will continue at least until December 31, 2015. For the year ended August 31, 2014, the fund’s average daily net assets did not exceed $2.5 billion and therefore, the management fee was not reduced in accordance with this agreement. MFS has also agreed in writing to reduce its management fee by a specified amount if certain MFS mutual fund assets exceed thresholds agreed to by MFS and the fund’s Board of Trustees. For the year ended August 31, 2014, this management fee reduction amounted to $41,146, which is included in the reduction of total expenses in
the Statement of Operations. The management fee incurred for the year ended August 31, 2014 was equivalent to an annual effective rate of 0.59% of the fund’s average daily net assets.
For the period September 1, 2013 through December 31, 2013, the investment adviser had agreed in writing to pay a portion of the fund’s total annual operating expenses, exclusive of interest, taxes, extraordinary expenses, brokerage and transaction costs, and investment-related expenses, such that total fund operating expenses did not exceed the following rates annually of each class’s average daily net assets:
| | | | | | | | | | | | | | | | | | | | | | | | | | | | | | | | |
| Classes | |
| A | | B | | | C | | | I | | | R1 | | | R2 | | | R3 | | | R4 | | | R5 | |
| 1.26% | | | 2.01% | | | | 2.01% | | | | 1.01% | | | | 2.01% | | | | 1.51% | | | | 1.26% | | | | 1.01% | | | | 0.94% | |
42
Notes to Financial Statements – continued
This written agreement was terminated on December 31, 2013. For the period September 1, 2013 through December 31, 2013, the fund’s actual expenses did not exceed the limit and therefore, the investment adviser did not pay any portion of the fund’s expenses related to this agreement.
Distributor – MFS Fund Distributors, Inc. (MFD), a wholly-owned subsidiary of MFS, as distributor, received $286,254 for the year ended August 31, 2014, as its portion of the initial sales charge on sales of Class A shares of the fund.
The Board of Trustees has adopted a distribution plan for certain share classes pursuant to Rule 12b-1 of the Investment Company Act of 1940.
The fund’s distribution plan provides that the fund will pay MFD for services provided by MFD and financial intermediaries in connection with the distribution and servicing of certain share classes. One component of the plan is a distribution fee paid to MFD and another component of the plan is a service fee paid to MFD. MFD may subsequently pay all, or a portion, of the distribution and/or service fees to financial intermediaries.
Distribution Plan Fee Table:
| | | | | | | | | | | | | | | | | | | | |
| | | Distribution Fee Rate (d) | | | Service
Fee Rate (d) | | | Total Distribution Plan (d) | | | Annual Effective Rate (e) | | | Distribution and Service Fee | |
| Class A | | | — | | | | 0.25% | | | | 0.25% | | | | 0.24% | | | | $2,401,231 | |
| Class B | | | 0.75% | | | | 0.25% | | | | 1.00% | | | | 1.00% | | | | 413,096 | |
| Class C | | | 0.75% | | | | 0.25% | | | | 1.00% | | | | 1.00% | | | | 862,593 | |
| Class R1 | | | 0.75% | | | | 0.25% | | | | 1.00% | | | | 1.00% | | | | 40,552 | |
| Class R2 | | | 0.25% | | | | 0.25% | | | | 0.50% | | | | 0.50% | | | | 103,088 | |
| Class R3 | | | — | | | | 0.25% | | | | 0.25% | | | | 0.25% | | | | 164,218 | |
| Total Distribution and Service Fees | | | | $3,984,778 | |
| (d) | In accordance with the distribution plan for certain classes, the fund pays distribution and/or service fees equal to these annual percentage rates of each class’s average daily net assets. The distribution and service fee rates disclosed by class represent the current rates in effect at the end of the reporting period. Any rate changes, if applicable, are detailed below. |
| (e) | The annual effective rates represent actual fees incurred under the distribution plan for the year ended August 31, 2014 based on each class’s average daily net assets. MFD has voluntarily agreed to rebate a portion of each class’s 0.25% service fee attributable to accounts for which MFD retains the 0.25% service fee except for accounts attributable to MFS or its affiliates’ seed money. For the year ended August 31, 2014, this rebate amounted to $54,439, $694, $1,997, and $1,413 for Class A, Class B, Class C, and Class R3, respectively, and is included in the reduction of total expenses in the Statement of Operations. |
Certain Class A shares are subject to a contingent deferred sales charge (CDSC) in the event of a shareholder redemption within 18 months of purchase for shares purchased on or after August 1, 2012, and within 24 months of purchase for shares purchased prior to August 1, 2012. Class C shares are subject to a CDSC in the event of a shareholder redemption within 12 months of purchase. Class B shares are subject to a
43
Notes to Financial Statements – continued
CDSC in the event of a shareholder redemption within six years of purchase. All contingent deferred sales charges are paid to MFD and during the year ended August 31, 2014, were as follows:
| | | | |
| | | Amount | |
| Class A | | | $7,584 | |
| Class B | | | 30,501 | |
| Class C | | | 4,397 | |
Shareholder Servicing Agent – MFS Service Center, Inc. (MFSC), a wholly-owned subsidiary of MFS, receives a fee from the fund for its services as shareholder servicing agent calculated as a percentage of the average daily net assets of the fund as determined periodically under the supervision of the fund’s Board of Trustees. For the year ended August 31, 2014, the fee was $510,014, which equated to 0.0414% annually of the fund’s average daily net assets. MFSC also receives payment from the fund for out-of-pocket expenses, sub-accounting and other shareholder servicing costs which may be paid to affiliated and unaffiliated service providers. Class R5 shares do not incur sub-accounting fees. For the year ended August 31, 2014, these out-of-pocket expenses, sub-accounting and other shareholder servicing costs amounted to $1,450,928.
Administrator – MFS provides certain financial, legal, shareholder communications, compliance, and other administrative services to the fund. Under an administrative services agreement, the fund partially reimburses MFS the costs incurred to provide these services. The fund is charged an annual fixed amount of $17,500 plus a fee based on average daily net assets. The administrative services fee incurred for the year ended August 31, 2014 was equivalent to an annual effective rate of 0.0128% of the fund’s average daily net assets.
Trustees’ and Officers’ Compensation – The fund pays compensation to independent Trustees in the form of a retainer, attendance fees, and additional compensation to Board and Committee chairpersons. The fund does not pay compensation directly to Trustees or officers of the fund who are also officers of the investment adviser, all of whom receive remuneration for their services to the fund from MFS. Certain officers and Trustees of the fund are officers or directors of MFS, MFD, and MFSC.
Prior to December 31, 2001, the fund had an unfunded defined benefit plan (“DB plan”) for independent Trustees. As of December 31, 2001, the Board took action to terminate the DB plan with respect to then-current and any future independent Trustees, such that the DB plan covers only certain of those former independent Trustees who retired on or before December 31, 2001. Effective January 1, 2002, accrued benefits under the DB plan for then-current independent Trustees who continued were credited to an unfunded retirement deferral plan (the “Retirement Deferral plan”), which was established for and exists solely with respect to these credited amounts, and is not available for other deferrals by these or other independent Trustees. Although the Retirement Deferral plan is unfunded, amounts deferred under the plan are periodically adjusted for investment experience as if they had been invested in shares of the fund. The DB plan resulted in a pension expense of $3,472 and the Retirement Deferral plan resulted in an expense of $12,873. Both
44
Notes to Financial Statements – continued
amounts are included in independent Trustees’ compensation for the year ended August 31, 2014. The liability for deferred retirement benefits payable to certain independent Trustees under both plans amounted to $94,048 at August 31, 2014, and is included in “Payable for independent Trustees’ compensation” in the Statement of Assets and Liabilities.
Other – This fund and certain other funds managed by MFS (the funds) have entered into services agreements (the Agreements) which provide for payment of fees by the funds to Tarantino LLC and Griffin Compliance LLC in return for the provision of services of an Independent Chief Compliance Officer (ICCO) and Assistant ICCO, respectively, for the funds. The funds can terminate the Agreements with Tarantino LLC and Griffin Compliance LLC at any time under the terms of the Agreements. The ICCO is an officer of the funds and the sole member of Tarantino LLC. Prior to June 1, 2014, Robyn L. Griffin served as the Assistant ICCO and was an officer of the funds. Ms. Griffin is the sole member of Griffin Compliance LLC. Effective May 31, 2014, Ms. Griffin resigned as Assistant ICCO and the service agreement between the funds and Griffin Compliance LLC was terminated. For the year ended August 31, 2014, the aggregate fees paid by the fund to Tarantino LLC and Griffin Compliance LLC were $6,287 and are included in “Miscellaneous” expense in the Statement of Operations. MFS has agreed to reimburse the fund for a portion of the payments made by the fund in the amount of $1,848, which is included in the reduction of total expenses in the Statement of Operations. Additionally, MFS has agreed to bear all expenses associated with office space, other administrative support, and supplies provided to the ICCO and Assistant ICCO.
The fund invests in the MFS Institutional Money Market Portfolio which is managed by MFS and seeks current income consistent with preservation of capital and liquidity. Income earned on this investment is included in “Dividends from underlying affiliated funds” in the Statement of Operations. This money market fund does not pay a management fee to MFS.
(4) Portfolio Securities
For the year ended August 31, 2014, purchases and sales of investments, other than purchased option transactions, short sales, and short-term obligations, aggregated $579,460,787 and $632,434,930, respectively.
45
Notes to Financial Statements – continued
(5) Shares of Beneficial Interest
The fund’s Declaration of Trust permits the Trustees to issue an unlimited number of full and fractional shares of beneficial interest. Transactions in fund shares were as follows:
| | | | | | | | | | | | | | | | |
| | | Year ended
8/31/14 | | | Year ended
8/31/13 (i) | |
| | | Shares | | | Amount | | | Shares | | | Amount | |
| Shares sold | | | | | | | | | | | | | | | | |
Class A | | | 3,726,575 | | | | $98,779,253 | | | | 7,546,868 | | | | $166,053,426 | |
Class B | | | 128,799 | | | | 3,156,038 | | | | 196,291 | | | | 4,012,467 | |
Class C | | | 320,385 | | | | 7,756,813 | | | | 584,686 | | | | 12,153,640 | |
Class I | | | 489,647 | | | | 13,383,291 | | | | 357,017 | | | | 8,396,899 | |
Class R1 | | | 25,142 | | | | 616,104 | | | | 37,458 | | | | 768,353 | |
Class R2 | | | 114,651 | | | | 3,009,148 | | | | 151,192 | | | | 3,277,836 | |
Class R3 | | | 388,156 | | | | 10,206,825 | | | | 358,175 | | | | 7,872,236 | |
Class R4 | | | 568,620 | | | | 15,584,037 | | | | 197,759 | | | | 4,502,021 | |
Class R5 | | | 80,363 | | | | 2,205,958 | | | | 4,800 | | | | 89,803 | |
| | | 5,842,338 | | | | $154,697,467 | | | | 9,434,246 | | | | $207,126,681 | |
| | | | |
| Shares issued to shareholders in reinvestment of distributions | | | | | | | | | | | | | | | | |
Class A | | | 219,909 | | | | $5,744,030 | | | | 173,769 | | | | $3,492,749 | |
Class C | | | 3,671 | | | | 87,708 | | | | — | | | | — | |
Class I | | | 10,378 | | | | 282,064 | | | | 6,426 | | | | 134,304 | |
Class R1 | | | 20 | | | | 485 | | | | — | | | | — | |
Class R2 | | | 3,341 | | | | 85,652 | | | | 2,220 | | | | 43,807 | |
Class R3 | | | 16,253 | | | | 423,237 | | | | 13,407 | | | | 268,678 | |
Class R4 | | | 2,743 | | | | 72,032 | | | | 888 | | | | 17,941 | |
Class R5 | | | 41 | | | | 1,122 | | | | — | | | | — | |
| | | 256,356 | | | | $6,696,330 | | | | 196,710 | | | | $3,957,479 | |
| | | | |
| Shares reacquired | | | | | | | | | | | | | | | | |
Class A | | | (6,266,489 | ) | | | $(167,777,284 | ) | | | (5,962,394 | ) | | | $(129,142,090 | ) |
Class B | | | (465,704 | ) | | | (11,473,848 | ) | | | (737,297 | ) | | | (14,746,274 | ) |
Class C | | | (572,495 | ) | | | (13,987,990 | ) | | | (531,761 | ) | | | (10,486,616 | ) |
Class I | | | (219,406 | ) | | | (6,160,376 | ) | | | (159,773 | ) | | | (3,592,449 | ) |
Class R1 | | | (46,483 | ) | | | (1,136,563 | ) | | | (88,685 | ) | | | (1,715,763 | ) |
Class R2 | | | (278,899 | ) | | | (7,430,972 | ) | | | (213,567 | ) | | | (4,451,724 | ) |
Class R3 | | | (491,785 | ) | | | (13,044,811 | ) | | | (300,016 | ) | | | (6,406,822 | ) |
Class R4 | | | (158,003 | ) | | | (4,285,803 | ) | | | (36,085 | ) | | | (791,784 | ) |
Class R5 | | | (3,403 | ) | | | (97,310 | ) | | | — | | | | — | |
| | | (8,502,667 | ) | | | $(225,394,957 | ) | | | (8,029,578 | ) | | | $(171,333,522 | ) |
46
Notes to Financial Statements – continued
| | | | | | | | | | | | | | | | |
| | | Year ended
8/31/14 | | | Year ended
8/31/13 (i) | |
| | | Shares | | | Amount | | | Shares | | | Amount | |
| Net change | | | | | | | | | | | | | | | | |
Class A | | | (2,320,005 | ) | | | $(63,254,001 | ) | | | 1,758,243 | | | | $40,404,085 | |
Class B | | | (336,905 | ) | | | (8,317,810 | ) | | | (541,006 | ) | | | (10,733,807 | ) |
Class C | | | (248,439 | ) | | | (6,143,469 | ) | | | 52,925 | | | | 1,667,024 | |
Class I | | | 280,619 | | | | 7,504,979 | | | | 203,670 | | | | 4,938,754 | |
Class R1 | | | (21,321 | ) | | | (519,974 | ) | | | (51,227 | ) | | | (947,410 | ) |
Class R2 | | | (160,907 | ) | | | (4,336,172 | ) | | | (60,155 | ) | | | (1,130,081 | ) |
Class R3 | | | (87,376 | ) | | | (2,414,749 | ) | | | 71,566 | | | | 1,734,092 | |
Class R4 | | | 413,360 | | | | 11,370,266 | | | | 162,562 | | | | 3,728,178 | |
Class R5 | | | 77,001 | | | | 2,109,770 | | | | 4,800 | | | | 89,803 | |
| | | (2,403,973 | ) | | | $(64,001,160 | ) | | | 1,601,378 | | | | $39,750,638 | |
| (i) | For Class R5, the period is from inception, January 2, 2013, through the stated period end. |
(6) Line of Credit
The fund and certain other funds managed by MFS participate in a $1.1 billion unsecured committed line of credit, subject to a $1 billion sublimit, provided by a syndication of banks under a credit agreement. Borrowings may be made for temporary financing needs. Interest is charged to each fund, based on its borrowings, generally at a rate equal to the higher of the Federal Reserve funds rate or one month LIBOR plus an agreed upon spread. A commitment fee, based on the average daily, unused portion of the committed line of credit, is allocated among the participating funds at the end of each calendar quarter. In addition, the fund and other funds managed by MFS have established unsecured uncommitted borrowing arrangements with certain banks for temporary financing needs. Interest is charged to each fund, based on its borrowings, at a rate equal to the Federal Reserve funds rate plus an agreed upon spread. For the year ended August 31, 2014, the fund’s commitment fee and interest expense were $4,872 and $0, respectively, and are included in “Miscellaneous” expense in the Statement of Operations. The period-end carrying value of the outstanding borrowings under this agreement on the fund’s Statement of Assets and Liabilities approximates its fair value which would have been considered level 2 under the fair value hierarchy disclosure if the liability were carried at fair value.
(7) Transactions in Underlying Affiliated Funds-Affiliated Issuers
An affiliated issuer may be considered one in which the fund owns 5% or more of the outstanding voting securities, or a company which is under common control. For the purposes of this report, the fund assumes the following to be an affiliated issuer:
| | | | | | | | | | | | | | | | |
| Underlying Affiliated Fund | | Beginning
Shares/Par
Amount | | | Acquisitions Shares/Par Amount | | | Dispositions Shares/Par Amount | | | Ending Shares/Par Amount | |
MFS Institutional Money
Market Portfolio | | | 10,013,362 | | | | 165,742,056 | | | | (171,040,766 | ) | | | 4,714,652 | |
| | | | |
| Underlying Affiliated Fund | | Realized Gain (Loss) | | | Capital Gain Distributions | | | Dividend Income | | | Ending Value | |
MFS Institutional Money
Market Portfolio | | | $— | | | | $— | | | | $13,871 | | | | $4,714,652 | |
47
REPORT OF INDEPENDENT REGISTERED PUBLIC ACCOUNTING FIRM
To the Board of Trustees of MFS Series Trust I and Shareholders of MFS Core Equity Fund:
We have audited the accompanying statement of assets and liabilities of MFS Core Equity Fund (the Fund) (one of the series constituting MFS Series Trust I), including the portfolio of investments, as of August 31, 2014, and the related statement of operations for the year then ended, the statements of changes in net assets for each of the two years in the period then ended, and the financial highlights for each of the periods indicated therein. These financial statements and financial highlights are the responsibility of the Fund’s management. Our responsibility is to express an opinion on these financial statements and financial highlights based on our audits.
We conducted our audits in accordance with the standards of the Public Company Accounting Oversight Board (United States). Those standards require that we plan and perform the audit to obtain reasonable assurance about whether the financial statements and financial highlights are free of material misstatement. We were not engaged to perform an audit of the Fund’s internal control over financial reporting. Our audits included consideration of internal control over financial reporting as a basis for designing audit procedures that are appropriate in the circumstances, but not for the purpose of expressing an opinion on the effectiveness of the Fund’s internal control over financial reporting. Accordingly, we express no such opinion. An audit also includes examining, on a test basis, evidence supporting the amounts and disclosures in the financial statements and financial highlights, assessing the accounting principles used and significant estimates made by management, and evaluating the overall financial statement presentation. Our procedures included confirmation of securities owned as of August 31, 2014, by correspondence with the custodian and others. We believe that our audits provide a reasonable basis for our opinion.
In our opinion, the financial statements and financial highlights referred to above present fairly, in all material respects, the financial position of MFS Core Equity Fund (one of the series constituting MFS Series Trust I) at August 31, 2014, the results of its operations for the year then ended, the changes in its net assets for each of the two years in the period then ended, and the financial highlights for each of the periods indicated therein, in conformity with U.S. generally accepted accounting principles.

Boston, Massachusetts
October 16, 2014
48
TRUSTEES AND OFFICERS — IDENTIFICATION AND BACKGROUND
The Trustees and Officers of the Trust, as of October 1, 2014, are listed below, together with their principal occupations during the past five years. (Their titles may have varied during that period.) The address of each Trustee and Officer is 111 Huntington Avenue, Boston, Massachusetts 02199-7618. It is expected that the Board will appoint Mr. Timothy M. Fagan as Chief Compliance Officer of the MFS Funds on November 1, 2014.
| | | | | | | | |
Name, Age | | Position(s) Held with Fund | | Trustee/Officer
Since (h) | | Principal
Occupations During the Past Five Years | | Other Directorships (j) |
| INTERESTED TRUSTEES |
Robert J. Manning (k)
(age 50) | | Trustee | | February 2004 | | Massachusetts Financial Services Company, Chairman, Chief Executive Officer and Director; President (until 2009); Chief Investment Officer (until 2010) | | N/A |
Robin A. Stelmach (k)
(age 53) | | Trustee and President | | January 2014 | | Massachusetts Financial Services Company, Executive Vice President and Chief Operating Officer | | N/A |
| INDEPENDENT TRUSTEES | | |
David H. Gunning
(age 72) | | Trustee and Chair of Trustees | | January 2004 | | Private investor | | Lincoln Electric Holdings, Inc. (welding equipment manufacturer), Director; Development Alternatives, Inc. (consulting), Director/Non-Executive Chairman |
Steven E. Buller (age 63) | | Trustee | | February 2014 | | Chairman, Financial Accounting Standards Advisory Council; Standing Advisory Group, Public Company Accounting Oversight Board, Member; BlackRock, Inc. (investment management), Managing Director (until 2014), BlackRock Finco UK (investment management), Director (until 2014) | | N/A |
49
Trustees and Officers – continued
| | | | | | | | |
Name, Age | | Position(s) Held with Fund | | Trustee/Officer
Since (h) | | Principal
Occupations During the Past Five Years | | Other Directorships (j) |
Robert E. Butler
(age 72) | | Trustee | | January 2006 | | Consultant – investment company industry regulatory and compliance matters | | N/A |
Maureen R. Goldfarb
(age 59) | | Trustee | | January 2009 | | Private investor | | N/A |
William R. Gutow
(age 73) | | Trustee | | December 1993 | | Private investor and real estate consultant; Capitol Entertainment Management Company (video franchise), Vice Chairman | | Texas Donuts (donut franchise), Vice Chairman (until 2010) |
Michael Hegarty
(age 69) | | Trustee | | December 2004 | | Private investor | | Brookfield Office Properties, Inc. (real estate), Director; Rouse Properties Inc. (real estate), Director; Capmark Financial Group Inc. (real estate), Director |
John P. Kavanaugh
(age 59) | | Trustee | | January 2009 | | Private investor | | N/A |
Maryanne L. Roepke
(age 58) | | Trustee | | May 2014 | | American Century Investments (investment management), Senior Vice President and Chief Compliance Officer (until 2014) | | N/A |
Laurie J. Thomsen
(age 57) | | Trustee | | March 2005 | | Private investor; New Profit, Inc. (venture philanthropy), Executive Partner (until 2010) | | The Travelers Companies (insurance), Director |
Robert W. Uek
(age 73) | | Trustee | | January 2006 | | Consultant to investment company industry | | N/A |
| OFFICERS | | | | | | |
Christopher R. Bohane (k)
(age 40) | | Assistant Secretary and Assistant Clerk | | July 2005 | | Massachusetts Financial Services Company, Vice President and Assistant General Counsel | | N/A |
Kino Clark (k)
(age 46) | | Assistant Treasurer | | January 2012 | | Massachusetts Financial Services Company, Vice President | | N/A |
50
Trustees and Officers – continued
| | | | | | | | |
Name, Age | | Position(s) Held with Fund | | Trustee/Officer
Since (h) | | Principal
Occupations During the Past Five Years | | Other Directorships (j) |
Thomas H. Connors (k)
(age 55) | | Assistant Secretary and Assistant Clerk | | September 2012 | | Massachusetts Financial Services Company, Vice President and Senior Counsel; Deutsche Investment Management Americas Inc. (financial service provider), Director and Senior Counsel (until 2012) | | N/A |
Ethan D. Corey (k)
(age 50) | | Assistant Secretary and Assistant Clerk | | July 2005 | | Massachusetts Financial Services Company, Senior Vice President and Associate General Counsel | | N/A |
David L. DiLorenzo (k)
(age 46) | | Treasurer | | July 2005 | | Massachusetts Financial Services Company, Senior Vice President | | N/A |
Brian E. Langenfeld (k) (age 41) | | Assistant Secretary and Assistant Clerk | | June 2006 | | Massachusetts Financial Services Company, Vice President and Senior Counsel | | N/A |
Susan S. Newton (k) (age 64) | | Assistant Secretary and Assistant Clerk | | May 2005 | | Massachusetts Financial Services Company, Senior Vice President and Associate General Counsel | | N/A |
Susan A. Pereira (k)
(age 43) | | Assistant Secretary and Assistant Clerk | | July 2005 | | Massachusetts Financial Services Company, Vice President and Senior Counsel | | N/A |
Kasey L. Phillips (k) (age 43) | | Assistant Treasurer | | September 2012 | | Massachusetts Financial Services Company, Vice President; Wells Fargo Funds Management, LLC, Senior Vice President, Fund Treasurer (until 2012) | | N/A |
Mark N. Polebaum (k)
(age 62) | | Secretary and Clerk | | January 2006 | | Massachusetts Financial Services Company, Executive Vice President, General Counsel and Secretary | | N/A |
51
Trustees and Officers – continued
| | | | | | | | |
Name, Age | | Position(s) Held with Fund | | Trustee/Officer
Since (h) | | Principal
Occupations During the Past Five Years | | Other Directorships (j) |
Matthew A. Stowe (k)
(age 39) | | Assistant Secretary and Assistant Clerk | | October 2014 | | Massachusetts Financial Services Company, Vice President and Senior Counsel | | N/A |
Frank L. Tarantino (l)
(age 70) | | Independent Chief Compliance Officer | | June 2004 | | Tarantino LLC (provider of compliance services), Principal | | N/A |
Richard S. Weitzel (k)
(age 44) | | Assistant Secretary and Assistant Clerk | | October 2007 | | Massachusetts Financial Services Company, Senior Vice President and Associate General Counsel | | N/A |
James O. Yost (k)
(age 54) | | Deputy Treasurer | | September 1990 | | Massachusetts Financial Services Company, Senior Vice President | | N/A |
| (h) | Date first appointed to serve as Trustee/officer of an MFS Fund. Each Trustee has served continuously since appointment unless indicated otherwise. For the period from December 15, 2004 until February 22, 2005, Mr. Manning served as Advisory Trustee. Prior to January 2012, Messrs. DiLorenzo and Yost served as Assistant Treasurers of the Funds. Ms. Stelmach was appointed as President of the Funds as of October 1, 2014. |
| (j) | Directorships or trusteeships of companies required to report to the Securities and Exchange Commission (i.e., “public companies”). |
| (k) | “Interested person” of the Trust within the meaning of the Investment Company Act of 1940 (referred to as the 1940 Act), which is the principal federal law governing investment companies like the fund, as a result of position with MFS. The address of MFS is 111 Huntington Avenue, Boston, Massachusetts 02199-7618. |
| (l) | Mr. Tarantino will retire as Independent Chief Compliance Officer of the MFS Funds on October 31, 2014. It is expected that Mr. Tarantino will continue after that date as an Independent Senior Officer of the MFS Funds. |
Each Trustee (except Ms. Stelmach, Mr. Buller and Ms. Roepke) has been elected by shareholders and each Trustee and officer holds office until his or her successor is chosen and qualified or until his or her earlier death, resignation, retirement or removal. The Trust does not hold annual meetings for the purpose of electing Trustees, and Trustees are not elected for fixed terms. Messrs. Butler, Kavanaugh, Uek and Mses. Thomsen and Roepke are members of the Trust’s Audit Committee.
Each of the Fund’s Trustees and officers holds comparable positions with certain other funds of which MFS or a subsidiary is the investment adviser or distributor, and, in the case of the officers, with certain affiliates of MFS. As of January 1, 2014, the Trustees served as board members of 142 funds within the MFS Family of Funds.
52
Trustees and Officers – continued
The Statement of Additional Information for the Fund includes further information about the Trustees and is available without charge upon request by calling 1-800-225-2606.
| | |
| Investment Adviser | | Custodian |
Massachusetts Financial Services Company
111 Huntington Avenue
Boston, MA 02199-7618 | | State Street Bank and Trust Company 1 Lincoln Street Boston, MA 02111-2900 |
| Distributor | | Independent Registered Public Accounting Firm |
MFS Fund Distributors, Inc.
111 Huntington Avenue
Boston, MA 02199-7618 | | Ernst & Young LLP 200 Clarendon Street Boston, MA 02116 |
| Portfolio Manager | | |
| Joseph MacDougall | | |
53
BOARD REVIEW OF INVESTMENT ADVISORY AGREEMENT
The Investment Company Act of 1940 requires that both the full Board of Trustees and a majority of the non-interested (“independent”) Trustees, voting separately, annually approve the continuation of the Fund’s investment advisory agreement with MFS. The Trustees consider matters bearing on the Fund and its advisory arrangements at their meetings throughout the year, including a review of performance data at each regular meeting. In addition, the independent Trustees met several times over the course of three months beginning in May and ending in July, 2014 (“contract review meetings”) for the specific purpose of considering whether to approve the continuation of the investment advisory agreement for the Fund and the other investment companies that the Board oversees (the “MFS Funds”). The independent Trustees were assisted in their evaluation of the Fund’s investment advisory agreement by independent legal counsel, from whom they received separate legal advice and with whom they met separately from MFS during various contract review meetings. The independent Trustees were also assisted in this process by the MFS Funds’ Independent Chief Compliance Officer, a full-time senior officer appointed by and reporting to the independent Trustees.
In connection with their deliberations regarding the continuation of the investment advisory agreement, the Trustees, including the independent Trustees, considered such information and factors as they believed, in light of the legal advice furnished to them and their own business judgment, to be relevant. The investment advisory agreement for the Fund was considered separately, although the Trustees also took into account the common interests of all MFS Funds in their review. As described below, the Trustees considered the nature, quality, and extent of the various investment advisory, administrative, and shareholder services performed by MFS under the existing investment advisory agreement and other arrangements with the Fund.
In connection with their contract review meetings, the Trustees received and relied upon materials that included, among other items: (i) information provided by Lipper Inc., an independent third party, on the investment performance of the Fund for various time periods ended December 31, 2013 and the investment performance of a group of funds with substantially similar investment classifications/objectives (the “Lipper performance universe”), (ii) information provided by Lipper Inc. on the Fund’s advisory fees and other expenses and the advisory fees and other expenses of comparable funds identified by Lipper Inc. (the “Lipper expense group”), (iii) information provided by MFS on the advisory fees of comparable portfolios of other clients of MFS, including institutional separate accounts and other clients, (iv) information as to whether and to what extent applicable expense waivers, reimbursements or fee “breakpoints” are observed for the Fund, (v) information regarding MFS’ financial results and financial condition, including MFS’ and certain of its affiliates’ estimated profitability from services performed for the Fund and the MFS Funds as a whole, and compared to MFS’ institutional business, (vi) MFS’ views regarding the outlook for the mutual fund industry and the strategic business plans of MFS, (vii) descriptions of various functions performed by MFS for the Funds, such as compliance monitoring and portfolio trading practices, and (viii) information regarding the overall organization of MFS, including information about MFS’ senior management and other personnel providing investment advisory, administrative and other services to
54
Board Review of Investment Advisory Agreement – continued
the Fund and the other MFS Funds. The comparative performance, fee and expense information prepared and provided by Lipper Inc. was not independently verified and the independent Trustees did not independently verify any information provided to them by MFS.
The Trustees’ conclusion as to the continuation of the investment advisory agreement was based on a comprehensive consideration of all information provided to the Trustees and not the result of any single factor. Some of the factors that figured particularly in the Trustees’ deliberations are described below, although individual Trustees may have evaluated the information presented differently from one another, giving different weights to various factors. It is also important to recognize that the fee arrangements for the Fund and other MFS Funds are the result of years of review and discussion between the independent Trustees and MFS, that certain aspects of such arrangements may receive greater scrutiny in some years than in others, and that the Trustees’ conclusions may be based, in part, on their consideration of these same arrangements during the course of the year and in prior years.
Based on information provided by Lipper Inc. and MFS, the Trustees reviewed the Fund’s total return investment performance as well as the performance of peer groups of funds over various time periods. The Trustees placed particular emphasis on the total return performance of the Fund’s Class A shares in comparison to the performance of funds in its Lipper performance universe over the three-year period ended December 31, 2013, which the Trustees believed was a long enough period to reflect differing market conditions. The total return performance of the Fund’s Class A shares was in the 2nd quintile relative to the other funds in the universe for this three-year period (the 1st quintile being the best performers and the 5th quintile being the worst performers). The total return performance of the Fund’s Class A shares was in the 3rd quintile for the one-year period and the 2nd quintile for the five-year period ended December 31, 2013 relative to the Lipper performance universe. Because of the passage of time, these performance results may differ from the performance results for more recent periods, including those shown elsewhere in this report.
In the course of their deliberations, the Trustees took into account information provided by MFS in connection with the contract review meetings, as well as during investment review meetings conducted with portfolio management personnel during the course of the year regarding the Fund’s performance. After reviewing these and related factors, the Trustees concluded, within the context of their overall conclusions regarding the investment advisory agreement, that they were satisfied with MFS’ responses and efforts relating to investment performance.
In assessing the reasonableness of the Fund’s advisory fee, the Trustees considered, among other information, the Fund’s advisory fee and the total expense ratio of the Fund’s Class A shares as a percentage of average daily net assets and the advisory fee and total expense ratios of peer groups of funds based on information provided by Lipper Inc. The Trustees considered that, according to the Lipper data (which takes into account any fee reductions or expense limitations that were in effect during the Fund’s last fiscal year), the Fund’s effective advisory fee rate and total expense ratio were each lower than the Lipper expense group median.
55
Board Review of Investment Advisory Agreement – continued
The Trustees also considered the advisory fees charged by MFS to any comparable institutional accounts. In comparing these fees, the Trustees considered information provided by MFS as to the generally broader scope of services provided by MFS to the Fund in comparison to institutional accounts, the higher demands placed on MFS’ investment personnel and trading infrastructure as a result of the daily cash in-flows and out-flows of the Fund, and the impact on MFS and expenses associated with the more extensive regulatory regime to which the Fund is subject in comparison to institutional accounts.
The Trustees also considered whether the Fund may benefit from any economies of scale in the management of the Fund in the event of growth in assets of the Fund and/or growth in assets of the MFS Funds as a whole. They noted that the Fund’s advisory fee rate schedule is subject to a contractual breakpoint that reduces the Fund’s advisory fee rate on average daily net assets over $500 million, and that MFS has agreed in writing to further reduce its advisory fee rate on average daily net assets over $2.5 billion, which may not be changed without the Trustees’ approval. The Trustees also noted that MFS has agreed in writing to waive a portion of the management fees of certain MFS Funds, including the Fund, if the total combined assets of certain funds within the MFS Funds’ complex increase above agreed upon thresholds (the “group fee waiver”), enabling the Fund’s shareholders to share in the benefits from any economies of scale at the complex level. The group fee waiver is reviewed and renewed annually between the Board and MFS. The Trustees concluded that the breakpoints and the group fee waiver were sufficient to allow the Fund to benefit from economies of scale as its assets and overall complex assets grow.
The Trustees also considered information prepared by MFS relating to MFS’ costs and profits with respect to the Fund, the MFS Funds considered as a group, and other investment companies and accounts advised by MFS, as well as MFS’ methodologies used to determine and allocate its costs to the MFS Funds, the Fund and other accounts and products for purposes of estimating profitability.
After reviewing these and other factors described herein, the Trustees concluded, within the context of their overall conclusions regarding the investment advisory agreement, that the advisory fees charged to the Fund represent reasonable compensation in light of the services being provided by MFS to the Fund.
In addition, the Trustees considered MFS’ resources and related efforts to continue to retain, attract and motivate capable personnel to serve the Fund. The Trustees also considered current and developing conditions in the financial services industry, including the presence of large and well-capitalized companies which are spending, and appear to be prepared to continue to spend, substantial sums to engage personnel and to provide services to competing investment companies. In this regard, the Trustees also considered the financial resources of MFS and its ultimate parent, Sun Life Financial Inc. The Trustees also considered the advantages and possible disadvantages to the Fund of having an adviser that also serves other investment companies as well as other accounts.
The Trustees also considered the nature, quality, cost, and extent of administrative, transfer agency, and distribution services provided to the Fund by MFS and its affiliates under agreements and plans other than the investment advisory agreement, including
56
Board Review of Investment Advisory Agreement – continued
any 12b-1 fees the Fund pays to MFS Fund Distributors, Inc., an affiliate of MFS. The Trustees also considered the nature, extent and quality of certain other services MFS performs or arranges for on the Fund’s behalf, which may include securities lending programs, directed expense payment programs, class action recovery programs, and MFS’ interaction with third-party service providers, principally custodians and sub-custodians. The Trustees concluded that the various non-advisory services provided by MFS and its affiliates on behalf of the Fund were satisfactory.
The Trustees also considered benefits to MFS from the use of the Fund’s portfolio brokerage commissions, if applicable, to pay for investment research and various other factors. Additionally, the Trustees considered so-called “fall-out benefits” to MFS such as reputational value derived from serving as investment manager to the Fund.
Based on their evaluation of factors that they deemed to be material, including those factors described above, the Board of Trustees, including the independent Trustees, concluded that the Fund’s investment advisory agreement with MFS should be continued for an additional one-year period, commencing August 1, 2014.
57
PROXY VOTING POLICIES AND INFORMATION
MFS votes proxies on behalf of the fund pursuant to proxy voting policies and procedures that are available without charge, upon request, by calling 1-800-225-2606, by visiting the Proxy Voting section of mfs.com or by visiting the SEC’s Web site at http://www.sec.gov.
Information regarding how the fund voted proxies relating to portfolio securities during the most recent twelve-month period ended June 30 is available without charge by visiting the Proxy Voting section of mfs.com or by visiting the SEC’s Web site at http://www.sec.gov.
QUARTERLY PORTFOLIO DISCLOSURE
The fund will file a complete schedule of portfolio holdings with the Securities and Exchange Commission (the Commission) for the first and third quarters of each fiscal year on Form N-Q. A shareholder can obtain the quarterly portfolio holdings report at mfs.com. The fund’s Form N-Q is also available on the EDGAR database on the Commission’s Internet Web site at http://www.sec.gov, and may be reviewed and copied at the:
Public Reference Room
Securities and Exchange Commission
100 F Street, NE, Room 1580
Washington, D.C. 20549
Information on the operation of the Public Reference Room may be obtained by calling the Commission at 1-800-SEC-0330. Copies of the fund’s Form N-Q also may be obtained, upon payment of a duplicating fee, by electronic request at the following e-mail address: publicinfo@sec.gov or by writing the Public Reference Section at the above address.
FURTHER INFORMATION
From time to time, MFS may post important information about the fund or the MFS funds on the MFS web site (mfs.com). This information is available by visiting the “Commentary & Announcements” and “Market Outlooks” sections of mfs.com or by clicking on the fund’s name under “Mutual Funds” in the “Products” section of mfs.com.
FEDERAL TAX INFORMATION (unaudited)
The fund will notify shareholders of amounts for use in preparing 2014 income tax forms in January 2015. The following information is provided pursuant to provisions of the Internal Revenue Code.
The fund designates the maximum amount allowable as qualified dividend income eligible to be taxed at the same rate as long-term capital gain.
The fund designates $8,067,660 as capital gain dividends paid during the fiscal year.
For corporate shareholders, 100% of the ordinary income dividends paid during the fiscal year qualify for the corporate dividends received deduction.
58
rev. 3/11
| | | | |
| | | |
FACTS | | WHAT DOES MFS DO WITH YOUR PERSONAL INFORMATION? | |  |
| | |
| Why? | | Financial companies choose how they share your personal information. Federal law gives consumers the right to limit some but not all sharing. Federal law also requires us to tell you how we collect, share, and protect your personal information. Please read this notice carefully to understand what we do. |
| | |
| What? | | The types of personal information we collect and share depend on the product or service you have with us. This information can include: • Social Security number and account balances • Account transactions and transaction history • Checking account information and wire transfer instructions When you are no longer our customer, we continue to share your information as described in this notice. |
| | |
| How? | | All financial companies need to share customers’ personal information to run their everyday business. In the section below, we list the reasons financial companies can share their customers’ personal information; the reasons MFS chooses to share; and whether you can limit this sharing. |
| | | | |
Reasons we can share your
personal information | | Does MFS
share? | | Can you limit
this sharing? |
For our everyday business purposes – such as to process your transactions, maintain your account(s), respond to court orders and legal investigations, or report to credit bureaus | | Yes | | No |
For our marketing purposes – to offer our products and services to you | | No | | We don’t share |
| For joint marketing with other financial companies | | No | | We don’t share |
For our affiliates’ everyday business purposes – information about your transactions and experiences | | No | | We don’t share |
For our affiliates’ everyday business purposes – information about your creditworthiness | | No | | We don’t share |
| For nonaffiliates to market to you | | No | | We don’t share |
| | |
| Questions? | | Call 800-225-2606 or go to mfs.com. |
59
| | |
| Who we are |
| Who is providing this notice? | | MFS Funds, MFS Investment Management, MFS Institutional Advisors, Inc., MFS Fund Distributors, Inc., MFS Heritage Trust Company, and MFS Service Center, Inc. |
| | |
| What we do |
| How does MFS protect my personal information? | | To protect your personal information from unauthorized access and use, we use security measures that comply with federal law. These measures include procedural, electronic, and physical safeguards for the protection of the personal information we collect about you. |
| How does MFS collect my personal information? | | We collect your personal information, for example, when you • open an account or provide account information • direct us to buy securities or direct us to sell your securities • make a wire transfer We also collect your personal information from others, such as credit bureaus, affiliates and other companies. |
| Why can’t I limit all sharing? | | Federal law gives you the right to limit only • sharing for affiliates’ everyday business purposes – information about your creditworthiness • affiliates from using your information to market to you • sharing for nonaffiliates to market to you State laws and individual companies may give you additional rights to limit sharing. |
| | |
| Definitions |
| Affiliates | | Companies related by common ownership or control. They can be financial and nonfinancial companies. • MFS does not share personal information with affiliates, except for everyday business purposes as described on page one of this notice. |
| Nonaffiliates | | Companies not related by common ownership or control. They can be financial and nonfinancial companies. • MFS does not share with nonaffiliates so they can market to you. |
| Joint Marketing | | A formal agreement between nonaffiliated financial companies that together market financial products or services to you. • MFS doesn’t jointly market. |
| | |
| Other important information |
| If you own an MFS product or receive an MFS service in the name of a third party such as a bank or broker-dealer, their privacy policy may apply to you instead of ours. |
60
Save paper with eDelivery.

| MFS® will send you prospectuses, |
reports, and proxies directly via e-mail so you will get information faster with less mailbox clutter.
To sign up:
1. Go to mfs.com.
2. Log in via MFS® Access.
3. Select eDelivery.
If you own your MFS fund shares through a financial institution or a retirement plan, MFS® TALK, MFS® Access, or eDelivery may not be available to you.
CONTACT
WEB SITE
mfs.com
MFS TALK
1-800-637-8255
24 hours a day
ACCOUNT SERVICE AND LITERATURE
Shareholders
1-800-225-2606
Financial advisors
1-800-343-2829
Retirement plan services
1-800-637-1255
MAILING ADDRESS
MFS Service Center, Inc.
P.O. Box 55824
Boston, MA 02205-5824
OVERNIGHT MAIL
MFS Service Center, Inc.
c/o Boston Financial Data Services
30 Dan Road
Canton, MA 02021-2809
ANNUAL REPORT
August 31, 2014

MFS® GLOBAL LEADERS FUND

GLD-ANN
MFS® GLOBAL LEADERS FUND
CONTENTS
The report is prepared for the general information of shareholders.
It is authorized for distribution to prospective investors only when preceded or accompanied by a current prospectus.
NOT FDIC INSURED Ÿ MAY LOSE VALUE Ÿ NO BANK GUARANTEE

LETTER FROM THE CHAIRMAN AND CEO
Dear Shareholders:
The U.S. economy continues to gain strength. Manufacturing output, construction activity and consumer confidence are all at multi-year highs, auto sales are robust, and
U.S. labor market reports show broad progress. Even a slowdown in the pace of rising house prices is seen as making the market more sustainable. Economists have a favorable outlook, and broad stock indices reflect that.
However, challenges dominate the rest of the global economy. China is struggling to boost its industrial output and Japan’s economic turnaround appears to have hit a setback after its sales tax increase in April. The eurozone economy is being held back by persistently high unemployment and dangerously low inflation, leading the European Central Bank to take more
aggressive stimulus action. With robust corporate earnings, the market’s greatest concerns relate to conflicts in the Middle East and Ukraine. In addition, speculation continues on when the U.S. Federal Reserve will begin tightening its monetary policy now that the U.S. economy has regained some traction.
As always at MFS®, active risk management is integral to how we manage your investments. We use a collaborative process, sharing insights across asset classes, regions and economic sectors. Our global team of investment professionals uses a multidisciplined, long-term, diversified investment approach.
We understand that these are challenging economic times. We believe we can serve you best by applying proven principles, such as asset allocation and diversification, over the long term. We are confident that this approach can help you as you work with your financial advisors to reach your goals in the years ahead.
Respectfully,

Robert J. Manning
Chairman and Chief Executive Officer
MFS Investment Management
October 16, 2014
The opinions expressed in this letter are subject to change and may not be relied upon for investment advice. No forecasts can be guaranteed.
1
PORTFOLIO COMPOSITION
Portfolio structure
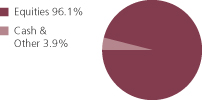
| | | | |
| Top ten holdings | | | | |
| Nestle S.A. | | | 3.8% | |
| Walt Disney Co. | | | 3.2% | |
| McDonald’s Corp. | | | 3.2% | |
| Pernod Ricard S.A. | | | 3.0% | |
| SAP AG | | | 3.0% | |
| Japan Tobacco, Inc. | | | 3.0% | |
| Groupe Danone | | | 3.0% | |
| Urban Outfitters, Inc. | | | 3.0% | |
| Twenty-First Century Fox, Inc. | | | 2.8% | |
| Kering S.A. | | | 2.7% | |
| |
| Equity sectors | | | | |
| Consumer Staples | | | 40.9% | |
| Retailing | | | 22.0% | |
| Leisure | | | 16.3% | |
| Industrial Goods & Services | | | 5.1% | |
| Financial Services | | | 4.7% | |
| Technology | | | 3.0% | |
| Basic Materials | | | 2.5% | |
| Special Products & Services | | | 1.6% | |
| | | | |
| Issuer country weightings (x) | | | | |
| United States | | | 40.7% | |
| France | | | 18.7% | |
| United Kingdom | | | 12.1% | |
| Switzerland | | | 7.7% | |
| Japan | | | 4.3% | |
| Brazil | | | 3.7% | |
| Germany | | | 3.0% | |
| Netherlands | | | 1.9% | |
| China | | | 1.8% | |
| Other Countries | | | 6.1% | |
|
| Currency exposure weightings (y) | |
| United States Dollar | | | 40.7% | |
| Euro | | | 25.0% | |
| British Pound Sterling | | | 12.1% | |
| Swiss Franc | | | 7.7% | |
| Japanese Yen | | | 4.3% | |
| Brazilian Real | | | 3.7% | |
| Hong Kong Dollar | | | 3.5% | |
| Swedish Krona | | | 1.6% | |
| Danish Krone | | | 1.4% | |
| (x) | Represents the portfolio’s exposure to issuer countries as a percentage of a portfolio’s net assets. For purposes of this presentation, United States includes Cash & Other. |
| (y) | Represents the portfolio’s exposure to a particular currency as a percentage of a portfolio’s net assets. For purposes of this presentation, United States Dollar includes Cash & Other. |
Cash & Other can include cash, other assets less liabilities, offsets to derivative positions, and short-term securities.
Percentages are based on net assets as of 8/31/14.
The portfolio is actively managed and current holdings may be different.
2
MANAGEMENT REVIEW
Summary of Results
For the twelve months ended August 31, 2014, Class A shares of the MFS Global Leaders Fund (“fund”) provided a total return of 8.30%, at net asset value. This compares with a return of 21.61% for the fund’s benchmark, the MSCI All Country World Index.
Market Environment
Early in the period, equity markets advanced in response to improved economic fundamentals, having recovered from prior weakness stemming from concerns that the US Federal Reserve (“Fed”) would begin tapering its quantitative easing (“QE”) program. A general theme in the market was a rotation in investor allocations from fixed income to equities and emerging markets (“EM”) to developed markets, reflecting an anticipated acceleration in developed market growth rates relative to EM as well as a more equity-friendly macro backdrop amid increased volatility in EM debt. As the period progressed, the Fed’s decision to postpone QE tapering surprised markets. Favorable market reactions were tempered, however, by tense negotiations over US fiscal policy which resulted in a 16-day partial shutdown of the federal government and a short-term extension in the debt ceiling. The volatility was short-lived, however, as an extension of budget and debt ceiling deadlines allowed the government to re-open, and subsequent economic data reflected moderate but resilient US growth. Also well-received was the decision by the European Central Bank (“ECB”) to cut its policy rate as inflation pressures waned in the region. In addition, equity investors appeared to have concluded that there would be no major change in US monetary policy as a result of the nomination of Janet Yellen as the new Fed Chair for a term beginning in early 2014 and that tapering would have no major impact on the trajectory.
Later in the period, financial markets were forced to contend with a series of positive and negative return episodes. In addition to periodic flashpoints in country specific emerging markets, geopolitical tensions flared in the Middle East and Russia/Ukraine. Market setbacks were short-lived, as improving economic growth in the US coupled with prospects for easier monetary policy in regions with slowing growth such as Japan, Europe and China, supported risk assets. For example, the ECB cut policy interest rates into negative territory and by the end of the period expectations were for additional rate cuts and the announcement for non-conventional easing measures. The decline in developed market government bond yields and credit spreads were also supportive for equity markets. At the end of the period, the US equity market was trading at all-time highs.
Detractors from Performance
The combination of overweight positions and stock selection in the retailing and consumer staples sectors detracted from performance relative to the MSCI All country World Index. Within the retailing sector, holdings of Italian shoemaker Tod’s S.p.A. (b) hampered relative performance as earnings and sales came in below market consensus. Weak performance resulted from a slowdown in retail markets, continued underperformance of leather goods and vague expectations about order backlogs in
3
Management Review – continued
the wholesale division. Overweight positions in luxury goods manufacturer Kering (France) and discount retailer Target also weakened relative results as both stocks lagged the benchmark during the reporting period. Within the consumer staples sector, overweight positions in French dairy products manufacturer Groupe Danone underperformed the market during the period and detracted from relative results. It appeared that investors remained concerned about the negative impact on sales that resulted from the Fonterra product recall in mainland China. The fund’s overweight positions in snack food and beverages manufacturer Want Want China Holdings (China), beverages company Diageo (United Kingdom) and French distilled beverages company Pernod Ricard were also among the fund’s top relative detractors.
Stock selection and an underweight position in the technology sector also dampened relative performance. However, there were no individual stocks within this sector that were among the fund’s top relative detractors during the reporting period.
Stock selection in the leisure sector further weighed on relative returns. Holdings of broadcasting and communications company Nippon Television Holdings (b) (Japan) and an overweight position in fast food restaurant chain McDonald’s detracted from relative results.
The fund’s cash and/or cash equivalents position during the period detracted from relative performance. Under normal market conditions, the fund strives to be fully invested and generally holds cash to buy new holdings and to provide liquidity. In a period when markets rose, as measured by the fund’s benchmark, holding cash hurt performance versus the benchmark, which has no cash position.
Contributors to Performance
The combination of stock selection and an underweight position in the basic materials sector was a primary factor that contributed to relative performance. An overweight position in mining and manufacturing company 3M (United States) boosted relative returns.
Elsewhere, overweight positions in media conglomerate Walt Disney, hotel operator InterContinental Hotels Group (United Kingdom), premium spirits company Beam (h), household products manufacturer Reckitt Benckiser (United Kingdom), athletic shoes and apparel manufacturer NIKE, automotive replacement parts distributor AutoZone and alcoholic and non-alcoholic beverage company Anheuser-Busch InBev (h) (Belgium) were among the fund’s top relative contributors during the reporting period. Not owning shares of car maker Toyota (Japan) further supported relative performance.
During the reporting period, the fund’s relative currency exposure, resulting primarily from differences between the funds and the benchmark’s exposures to holdings of securities denominated in foreign currencies, was another contributor to relative performance. All of MFS’ investment decisions are driven by the fundamentals of each individual opportunity and as such, it is common for our portfolios to have different currency exposure than the benchmark.
Respectfully,
| | |
| Matthew Barrett | | Maile Clark |
| Portfolio Manager | | Portfolio Manager |
4
Management Review – continued
| (b) | Security is not a benchmark constituent. |
| (h) | Security was not held in the portfolio at period end. |
The views expressed in this report are those of the portfolio managers only through the end of the period of the report as stated on the cover and do not necessarily reflect the views of MFS or any other person in the MFS organization. These views are subject to change at any time based on market or other conditions, and MFS disclaims any responsibility to update such views. These views may not be relied upon as investment advice or an indication of trading intent on behalf of any MFS portfolio. References to specific securities are not recommendations of such securities, and may not be representative of any MFS portfolio’s current or future investments.
5
PERFORMANCE SUMMARY THROUGH 8/31/14
The following chart illustrates a representative class of the fund’s historical performance in comparison to its benchmark(s). Performance results include the deduction of the maximum applicable sales charge and reflect the percentage change in net asset value, including reinvestment of dividends and capital gains distributions. The performance of other share classes will be greater than or less than that of the class depicted below. Benchmarks are unmanaged and may not be invested in directly. Benchmark returns do not reflect sales charges, commissions or expenses. (See Notes to Performance Summary.)
Performance data shown represents past performance and is no guarantee of future results. Investment return and principal value fluctuate so your shares, when sold, may be worth more or less than the original cost; current performance may be lower or higher than quoted. The performance shown does not reflect the deduction of taxes, if any, that a shareholder would pay on fund distributions or the redemption of fund shares.
Growth of a Hypothetical $10,000 Investment (t)
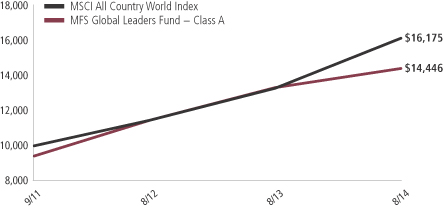
6
Performance Summary – continued
Total Returns through 8/31/14
Average annual without sales charge
| | | | | | | | | | |
| | | Share class | | Class inception date | | 1-yr | | Life (t) | | |
| | | A | | 9/28/11 | | 8.30% | | 15.70% | | |
| | | B | | 9/28/11 | | 7.48% | | 14.83% | | |
| | | C | | 9/28/11 | | 7.50% | | 14.83% | | |
| | | I | | 9/28/11 | | 8.57% | | 15.97% | | |
| Comparative benchmark | | | | | | |
| | | MSCI All Country World Index (f) | | 21.61% | | 17.84% | | |
| Average annual with sales charge | | | | | | |
| | | A
With initial Sales Charge (5.75%) | | 2.08% | | 13.38% | | |
| | | B
With CDSC (Declining over six years from 4% to 0%) (v) | | 3.48% | | 14.04% | | |
| | | C
With CDSC (1% for 12 months) (v) | | 6.50% | | 14.83% | | |
CDSC – Contingent Deferred Sales Charge.
Class I shares do not have a sales charge.
| (f) | Source: FactSet Research Systems Inc. |
| (t) | For the period from the class inception date through the stated period end. (See Notes to Performance Summary.) |
| (v) | Assuming redemption at the end of the applicable period. |
Benchmark Definition
MSCI All Country World Index – a market capitalization-weighted index that is designed to measure equity market performance in the global developed and emerging markets.
It is not possible to invest directly in an index.
Notes to Performance Summary
Average annual total return represents the average annual change in value for each share class for the periods presented. Life returns are presented where the share class has less than 10 years of performance history and represent the average annual total return from the class inception date to the stated period end date.
Performance results reflect any applicable expense subsidies and waivers in effect during the periods shown. Without such subsidies and waivers the fund’s performance results would be less favorable. Please see the prospectus and financial statements for complete details.
Performance results do not include adjustments made for financial reporting purposes in accordance with U.S. generally accepted accounting principles and may differ from amounts reported in the financial highlights.
From time to time the fund may receive proceeds from litigation settlements, without which performance would be lower.
7
EXPENSE TABLE
Fund expenses borne by the shareholders during the period, March 1, 2014 through August 31, 2014
As a shareholder of the fund, you incur two types of costs: (1) transaction costs, including sales charges (loads) on certain purchase or redemption payments, and (2) ongoing costs, including management fees; distribution and service (12b-1) fees; and other fund expenses. This example is intended to help you understand your ongoing costs (in dollars) of investing in the fund and to compare these costs with the ongoing costs of investing in other mutual funds.
The example is based on an investment of $1,000 invested at the beginning of the period and held for the entire period March 1, 2014 through August 31, 2014.
Actual Expenses
The first line for each share class in the following table provides information about actual account values and actual expenses. You may use the information in this line, together with the amount you invested, to estimate the expenses that you paid over the period. Simply divide your account value by $1,000 (for example, an $8,600 account value divided by $1,000 = 8.6), then multiply the result by the number in the first line under the heading entitled “Expenses Paid During Period” to estimate the expenses you paid on your account during this period.
Hypothetical Example for Comparison Purposes
The second line for each share class in the following table provides information about hypothetical account values and hypothetical expenses based on the fund’s actual expense ratio and an assumed rate of return of 5% per year before expenses, which is not the fund’s actual return. The hypothetical account values and expenses may not be used to estimate the actual ending account balance or expenses you paid for the period. You may use this information to compare the ongoing costs of investing in the fund and other funds. To do so, compare this 5% hypothetical example with the 5% hypothetical examples that appear in the shareholder reports of the other funds.
Please note that the expenses shown in the table are meant to highlight your ongoing costs only and do not reflect any transactional costs, such as sales charges (loads). Therefore, the second line for each share class in the table is useful in comparing ongoing costs only, and will not help you determine the relative total costs of owning different funds. In addition, if these transactional costs were included, your costs would have been higher.
8
Expense Table – continued
| | | | | | | | | | | | | | | | | | |
Share
Class | | | | Annualized
Expense Ratio | | | Beginning
Account Value
3/01/14 | | | Ending
Account Value
8/31/14 | | | Expenses
Paid During
Period (p)
3/01/14-8/31/14 | |
| A | | Actual | | | 1.45% | | | | $1,000.00 | | | | $1,010.07 | | | | $7.35 | |
| | Hypothetical (h) | | | 1.45% | | | | $1,000.00 | | | | $1,017.90 | | | | $7.38 | |
| B | | Actual | | | 2.20% | | | | $1,000.00 | | | | $1,005.82 | | | | $11.12 | |
| | Hypothetical (h) | | | 2.20% | | | | $1,000.00 | | | | $1,014.12 | | | | $11.17 | |
| C | | Actual | | | 2.20% | | | | $1,000.00 | | | | $1,006.56 | | | | $11.13 | |
| | Hypothetical (h) | | | 2.20% | | | | $1,000.00 | | | | $1,014.12 | | | | $11.17 | |
| I | | Actual | | | 1.20% | | | | $1,000.00 | | | | $1,011.47 | | | | $6.08 | |
| | Hypothetical (h) | | | 1.20% | | | | $1,000.00 | | | | $1,019.16 | | | | $6.11 | |
| (h) | 5% class return per year before expenses. |
| (p) | “Expenses Paid During Period” are equal to each class’s annualized expense ratio, as shown above, multiplied by the average account value over the period, multiplied by 184/365 (to reflect the one-half year period). Expenses paid do not include any applicable sales charges (loads). If these transaction costs had been included, your costs would have been higher. |
9
PORTFOLIO OF INVESTMENTS
8/31/14
The Portfolio of Investments is a complete list of all securities owned by your fund. It is categorized by broad-based asset classes.
| | | | | | | | |
| Common Stocks - 96.1% | | | | | | | | |
| Issuer | | Shares/Par | | | Value ($) | |
| | | | | | | | |
| Alcoholic Beverages - 11.1% | | | | | | | | |
| AmBev S.A. | | | 24,366 | | | $ | 177,425 | |
| Carlsberg A.S., “B” | | | 2,098 | | | | 191,336 | |
| Diageo PLC | | | 12,337 | | | | 363,645 | |
| Pernod Ricard S.A. | | | 3,525 | | | | 415,646 | |
| SABMiller PLC | | | 6,760 | | | | 372,928 | |
| | | | | | | | |
| | | | | | | $ | 1,520,980 | |
| Apparel Manufacturers - 14.1% | | | | | | | | |
| Burberry Group PLC | | | 12,805 | | | $ | 302,079 | |
| Compagnie Financiere Richemont S.A. | | | 2,363 | | | | 225,348 | |
| Global Brands Group Holding Ltd. (a) | | | 472,000 | | | | 109,016 | |
| Kering S.A. | | | 1,769 | | | | 374,806 | |
| Li & Fung Ltd. | | | 104,000 | | | | 129,093 | |
| LVMH Moet Hennessy Louis Vuitton S.A. | | | 2,157 | | | | 374,255 | |
| NIKE, Inc., “B” | | | 2,996 | | | | 235,336 | |
| Tod’s S.p.A. | | | 1,707 | | | | 189,078 | |
| | | | | | | | |
| | | | | | | $ | 1,939,011 | |
| Broadcasting - 9.6% | | | | | | | | |
| Nippon Television Holdings, Inc. | | | 11,200 | | | $ | 172,126 | |
| Publicis Groupe S.A. | | | 4,307 | | | | 320,876 | |
| Twenty-First Century Fox, Inc. | | | 10,940 | | | | 387,495 | |
| Walt Disney Co. | | | 4,956 | | | | 445,445 | |
| | | | | | | | |
| | | | | | | $ | 1,325,942 | |
| Business Services - 1.6% | | | | | | | | |
| Accenture PLC, “A” | | | 2,750 | | | $ | 222,915 | |
| | |
| Chemicals - 2.5% | | | | | | | | |
| 3M Co. | | | 2,363 | | | $ | 340,272 | |
| | |
| Computer Software - 3.0% | | | | | | | | |
| SAP AG | | | 5,334 | | | $ | 414,910 | |
| | |
| Consumer Products - 11.5% | | | | | | | | |
| Colgate-Palmolive Co. | | | 4,876 | | | $ | 315,623 | |
| L’Oreal S.A. | | | 1,981 | | | | 327,970 | |
| Newell Rubbermaid, Inc. | | | 7,477 | | | | 250,629 | |
| Procter & Gamble Co. | | | 4,208 | | | | 349,727 | |
10
Portfolio of Investments – continued
| | | | | | | | |
| Issuer | | Shares/Par | | | Value ($) | |
| | | | | | | | |
| Common Stocks - continued | | | | | | | | |
| Consumer Products - continued | | | | | | | | |
| Reckitt Benckiser Group PLC | | | 3,894 | | | $ | 339,393 | |
| | | | | | | | |
| | | | | | | $ | 1,583,342 | |
| Electrical Equipment - 5.1% | | | | | | | | |
| Danaher Corp. | | | 4,580 | | | $ | 350,874 | |
| Schneider Electric S.A. | | | 4,178 | | | | 353,096 | |
| | | | | | | | |
| | | | | | | $ | 703,970 | |
| Food & Beverages - 12.8% | | | | | | | | |
| Groupe Danone | | | 5,903 | | | $ | 412,167 | |
| M. Dias Branco S.A. Industria e Comercio de Alimentos | | | 7,400 | | | | 333,884 | |
| Nestle S.A. | | | 6,685 | | | | 518,824 | |
| Unilever N.V. | | | 6,279 | | | | 260,998 | |
| Want Want China Holdings Ltd. | | | 195,000 | | | | 241,798 | |
| | | | | | | | |
| | | | | | | $ | 1,767,671 | |
| Gaming & Lodging - 1.2% | | | | | | | | |
| InterContinental Hotels Group PLC | | | 4,333 | | | $ | 166,096 | |
| | |
| General Merchandise - 2.0% | | | | | | | | |
| Target Corp. | | | 4,540 | | | $ | 272,718 | |
| | |
| Other Banks & Diversified Financials - 4.7% | | | | | | | | |
| Julius Baer Group Ltd. | | | 6,983 | | | $ | 317,413 | |
| Visa, Inc., “A” | | | 1,521 | | | | 323,243 | |
| | | | | | | | |
| | | | | | | $ | 640,656 | |
| Restaurants - 5.5% | | | | | | | | |
| McDonald’s Corp. | | | 4,736 | | | $ | 443,858 | |
| YUM! Brands, Inc. | | | 4,259 | | | | 308,479 | |
| | | | | | | | |
| | | | | | | $ | 752,337 | |
| Specialty Stores - 5.9% | | | | | | �� | | |
| AutoZone, Inc. (a) | | | 487 | | | $ | 262,415 | |
| L Brands, Inc. | | | 2,152 | | | | 137,405 | |
| Urban Outfitters, Inc. (a) | | | 10,273 | | | | 408,763 | |
| | | | | | | | |
| | | | | | | $ | 808,583 | |
| Tobacco - 5.5% | | | | | | | | |
| Imperial Tobacco Group PLC | | | 2,722 | | | $ | 118,712 | |
| Japan Tobacco, Inc. | | | 12,100 | | | | 414,478 | |
| Swedish Match AB | | | 6,537 | | | | 218,298 | |
| | | | | | | | |
| | | | | | | $ | 751,488 | |
| Total Common Stocks (Identified Cost, $11,498,097) | | | | | | $ | 13,210,891 | |
11
Portfolio of Investments – continued
| | | | | | | | |
| Money Market Funds - 3.9% | | | | | | | | |
| Issuer | | Shares/Par | | | Value ($) | |
| | | | | | | | |
MFS Institutional Money Market Portfolio, 0.09%,
at Cost and Net Asset Value (v) | | | 541,652 | | | $ | 541,652 | |
| Total Investments (Identified Cost, $12,039,749) | | | | | | $ | 13,752,543 | |
| | |
| Other Assets, Less Liabilities - (0.0)% | | | | | | | (2,377 | ) |
| Net Assets - 100.0% | | | | | | $ | 13,750,166 | |
| (a) | Non-income producing security. |
| (v) | Underlying affiliated fund that is available only to investment companies managed by MFS. The rate quoted for the MFS Institutional Money Market Portfolio is the annualized seven-day yield of the fund at period end. |
The following abbreviations are used in this report and are defined:
| PLC | | Public Limited Company |
See Notes to Financial Statements
12
Financial Statements
STATEMENT OF ASSETS AND LIABILITIES
At 8/31/14
This statement represents your fund’s balance sheet, which details the assets and liabilities comprising the total value of the fund.
| | | | |
| Assets | | | | |
Investments- | | | | |
Non-affiliated issuers, at value (identified cost, $11,498,097) | | | $13,210,891 | |
Underlying affiliated funds, at cost and value | | | 541,652 | |
Total investments, at value (identified cost, $12,039,749) | | | $13,752,543 | |
Foreign currency, at value (identified cost, $472) | | | 472 | |
Receivables for | | | | |
Investments sold | | | 2,474 | |
Fund shares sold | | | 37,551 | |
Interest and dividends | | | 31,681 | |
Receivable from investment adviser | | | 7,211 | |
Other assets | | | 47 | |
Total assets | | | $13,831,979 | |
| Liabilities | | | | |
Payables for | | | | |
Investments purchased | | | $3,751 | |
Fund shares reacquired | | | 8,912 | |
Payable to affiliates | | | | |
Shareholder servicing costs | | | 7,409 | |
Distribution and service fees | | | 475 | |
Payable for independent Trustees’ compensation | | | 5 | |
Accrued expenses and other liabilities | | | 61,261 | |
Total liabilities | | | $81,813 | |
Net assets | | | $13,750,166 | |
| Net assets consist of | | | | |
Paid-in capital | | | $11,775,902 | |
Unrealized appreciation (depreciation) on investments and translation of assets and liabilities in foreign currencies | | | 1,712,522 | |
Accumulated net realized gain (loss) on investments and foreign currency | | | 212,494 | |
Undistributed net investment income | | | 49,248 | |
Net assets | | | $13,750,166 | |
Shares of beneficial interest outstanding | | | 980,614 | |
| | | | | | | | | | | | |
| | | Net assets | | | Shares
outstanding | | | Net asset value
per share (a) | |
Class A | | | $8,639,039 | | | | 615,155 | | | | $14.04 | |
Class B | | | 486,031 | | | | 35,158 | | | | 13.82 | |
Class C | | | 1,711,928 | | | | 123,853 | | | | 13.82 | |
Class I | | | 2,913,168 | | | | 206,448 | | | | 14.11 | |
| (a) | Maximum offering price per share was equal to the net asset value per share for all share classes, except for Class A, for which the maximum offering price per share was $14.90 [100 / 94.25 x $14.04]. On sales of $50,000 or more, the maximum offering price of Class A shares is reduced. A contingent deferred sales charge may be imposed on redemptions of Class A, Class B, and Class C shares. Redemption price per share was equal to the net asset value per share for Class I. |
See Notes to Financial Statements
13
Financial Statements
STATEMENT OF OPERATIONS
Year ended 8/31/14
This statement describes how much your fund earned in investment income and accrued in expenses. It also describes any gains and/or losses generated by fund operations.
| | | | |
| Net investment income | | | | |
Income | | | | |
Dividends | | | $285,056 | |
Dividends from underlying affiliated funds | | | 414 | |
Foreign taxes withheld | | | (18,741 | ) |
Total investment income | | | $266,729 | |
Expenses | | | | |
Management fee | | | $115,433 | |
Distribution and service fees | | | 38,663 | |
Shareholder servicing costs | | | 17,318 | |
Administrative services fee | | | 17,500 | |
Independent Trustees’ compensation | | | 1,128 | |
Custodian fee | | | 14,128 | |
Shareholder communications | | | 12,484 | |
Audit and tax fees | | | 52,475 | |
Legal fees | | | 102 | |
Registration fees | | | 43,678 | |
Miscellaneous | | | 12,327 | |
Total expenses | | | $325,236 | |
Fees paid indirectly | | | (1 | ) |
Reduction of expenses by investment adviser and distributor | | | (132,796 | ) |
Net expenses | | | $192,439 | |
Net investment income | | | $74,290 | |
Realized and unrealized gain (loss) on investments and
foreign currency | | | | |
Realized gain (loss) (identified cost basis) | | | | |
Investments | | | $250,401 | |
Foreign currency | | | (621 | ) |
Net realized gain (loss) on investments and foreign currency | | | $249,780 | |
Change in unrealized appreciation (depreciation) | | | | |
Investments | | | $577,672 | |
Translation of assets and liabilities in foreign currencies | | | (87 | ) |
Net unrealized gain (loss) on investments and foreign currency translation | | | $577,585 | |
Net realized and unrealized gain (loss) on investments and foreign currency | | | $827,365 | |
Change in net assets from operations | | | $901,655 | |
See Notes to Financial Statements
14
Financial Statements
STATEMENTS OF CHANGES IN NET ASSETS
These statements describe the increases and/or decreases in net assets resulting from operations, any distributions, and any shareholder transactions.
| | | | | | | | |
| | | Years ended 8/31 | |
| | | 2014 | | | 2013 | |
| Change in net assets | | | | | | |
| From operations | | | | | | | | |
Net investment income | | | $74,290 | | | | $66,045 | |
Net realized gain (loss) on investments and foreign currency | | | 249,780 | | | | 864,632 | |
Net unrealized gain (loss) on investments and foreign currency translation | | | 577,585 | | | | 693,645 | |
Change in net assets from operations | | | $901,655 | | | | $1,624,322 | |
| Distributions declared to shareholders | | | | | | | | |
From net investment income | | | $(68,001 | ) | | | $(60,003 | ) |
From net realized gain on investments | | | (810,506 | ) | | | (128,508 | ) |
Total distributions declared to shareholders | | | $(878,507 | ) | | | $(188,511 | ) |
Change in net assets from fund share transactions | | | $3,114,847 | | | | $(1,612,004 | ) |
Total change in net assets | | | $3,137,995 | | | | $(176,193 | ) |
| Net assets | | | | | | | | |
At beginning of period | | | 10,612,171 | | | | 10,788,364 | |
At end of period (including undistributed net investment income of $49,248 and $66,563, respectively) | | | $13,750,166 | | | | $10,612,171 | |
See Notes to Financial Statements
15
Financial Statements
FINANCIAL HIGHLIGHTS
The financial highlights table is intended to help you understand the fund’s financial performance for the past 5 years (or life of a particular share class, if shorter). Certain information reflects financial results for a single fund share. The total returns in the table represent the rate by which an investor would have earned (or lost) on an investment in the fund share class (assuming reinvestment of all distributions) held for the entire period.
| | | | | | | | | | | | |
| Class A | | Years ended 8/31 | | | Period ended 8/31/12 (c) | |
| | | 2014 | | | 2013 | | |
Net asset value, beginning of period | | | $13.95 | | | | $12.16 | | | | $10.00 | |
| Income (loss) from investment operations | | | | | | | | | | | | |
Net investment income (d) | | | $0.09 | | | | $0.07 | | | | $0.20 | |
Net realized and unrealized gain (loss) on investments
and foreign currency | | | 1.04 | | | | 1.91 | | | | 1.96 | |
Total from investment operations | | | $1.13 | | | | $1.98 | | | | $2.16 | |
| Less distributions declared to shareholders | | | | | | | | | | | | |
From net investment income | | | $(0.08 | ) | | | $(0.06 | ) | | | $— | |
From net realized gain on investments | | | (0.96 | ) | | | (0.13 | ) | | | — | |
Total distributions declared to shareholders | | | $(1.04 | ) | | | $(0.19 | ) | | | $— | |
Net asset value, end of period (x) | | | $14.04 | | | | $13.95 | | | | $12.16 | |
Total return (%) (r)(s)(t)(x) | | | 8.30 | | | | 16.39 | | | | 21.60 | (n) |
Ratios (%) (to average net assets)
and Supplemental data: | | | | | | | | | | | | |
Expenses before expense reductions (f) | | | 2.48 | | | | 2.89 | | | | 6.60 | (a) |
Expenses after expense reductions (f) | | | 1.45 | | | | 1.45 | | | | 1.45 | (a) |
Net investment income | | | 0.64 | | | | 0.55 | (l) | | | 1.83 | (a)(l) |
Portfolio turnover | | | 17 | | | | 82 | | | | 19 | (n) |
Net assets at end of period (000 omitted) | | | $8,639 | | | | $6,632 | | | | $8,331 | |
See Notes to Financial Statements
16
Financial Highlights – continued
| | | | | | | | | | | | |
| Class B | | Years ended 8/31 | | | Period ended 8/31/12 (c) | |
| | | 2014 | | | 2013 | | |
Net asset value, beginning of period | | | $13.81 | | | | $12.07 | | | | $10.00 | |
| Income (loss) from investment operations | | | | | | | | | | | | |
Net investment income (loss) (d) | | | $(0.02 | ) | | | $0.01 | | | | $(0.01 | ) |
Net realized and unrealized gain (loss) on investments
and foreign currency | | | 1.03 | | | | 1.86 | | | | 2.08 | |
Total from investment operations | | | $1.01 | | | | $1.87 | | | | $2.07 | |
| Less distributions declared to shareholders | | | | | | | | | | | | |
From net investment income | | | $(0.04 | ) | | | $— | | | | $— | |
From net realized gain on investments | | | (0.96 | ) | | | (0.13 | ) | | | — | |
Total distributions declared to shareholders | | | $(1.00 | ) | | | $(0.13 | ) | | | $— | |
Net asset value, end of period (x) | | | $13.82 | | | | $13.81 | | | | $12.07 | |
Total return (%) (r)(s)(t)(x) | | | 7.48 | | | | 15.55 | | | | 20.70 | (n) |
Ratios (%) (to average net assets)
and Supplemental data: | | | | | | | | | | | | |
Expenses before expense reductions (f) | | | 3.23 | | | | 3.96 | | | | 5.96 | (a) |
Expenses after expense reductions (f) | | | 2.20 | | | | 2.21 | | | | 2.20 | (a) |
Net investment income (loss) | | | (0.12 | ) | | | 0.09 | | | | (0.10 | )(a) |
Portfolio turnover | | | 17 | | | | 82 | | | | 19 | (n) |
Net assets at end of period (000 omitted) | | | $486 | | | | $364 | | | | $131 | |
| | |
| Class C | | Years ended 8/31 | | | Period ended 8/31/12 (c) | |
| | | 2014 | | | 2013 | | |
Net asset value, beginning of period | | | $13.81 | | | | $12.07 | | | | $10.00 | |
| Income (loss) from investment operations | | | | | | | | | | | | |
Net investment income (loss) (d) | | | $(0.01 | ) | | | $0.02 | | | | $(0.01 | ) |
Net realized and unrealized gain (loss) on investments
and foreign currency | | | 1.02 | | | | 1.85 | | | | 2.08 | |
Total from investment operations | | | $1.01 | | | | $1.87 | | | | $2.07 | |
| Less distributions declared to shareholders | | | | | | | | | | | | |
From net investment income | | | $(0.04 | ) | | | $(0.00 | )(w) | | | $— | |
From net realized gain on investments | | | (0.96 | ) | | | (0.13 | ) | | | — | |
Total distributions declared to shareholders | | | $(1.00 | ) | | | $(0.13 | ) | | | $— | |
Net asset value, end of period (x) | | | $13.82 | | | | $13.81 | | | | $12.07 | |
Total return (%) (r)(s)(t)(x) | | | 7.50 | | | | 15.57 | | | | 20.70 | (n) |
Ratios (%) (to average net assets)
and Supplemental data: | | | | | | | | | | | | |
Expenses before expense reductions (f) | | | 3.22 | | | | 4.02 | | | | 5.96 | (a) |
Expenses after expense reductions (f) | | | 2.20 | | | | 2.21 | | | | 2.20 | (a) |
Net investment income (loss) | | | (0.08 | ) | | | 0.16 | | | | (0.07 | )(a) |
Portfolio turnover | | | 17 | | | | 82 | | | | 19 | (n) |
Net assets at end of period (000 omitted) | | | $1,712 | | | | $927 | | | | $133 | |
See Notes to Financial Statements
17
Financial Highlights – continued
| | | | | | | | | | | | |
| Class I | | Years ended 8/31 | | | Period ended 8/31/12 (c) | |
| | | 2014 | | | 2013 | | |
Net asset value, beginning of period | | | $14.00 | | | | $12.18 | | | | $10.00 | |
| Income (loss) from investment operations | | | | | | | | | | | | |
Net investment income (d) | | | $0.12 | | | | $0.14 | | | | $0.09 | |
Net realized and unrealized gain (loss) on investments
and foreign currency | | | 1.05 | | | | 1.88 | | | | 2.09 | |
Total from investment operations | | | $1.17 | | | | $2.02 | | | | $2.18 | |
| Less distributions declared to shareholders | | | | | | | | | | | | |
From net investment income | | | $(0.10 | ) | | | $(0.07 | ) | | | $— | |
From net realized gain on investments | | | (0.96 | ) | | | (0.13 | ) | | | — | |
Total distributions declared to shareholders | | | $(1.06 | ) | | | $(0.20 | ) | | | $— | |
Net asset value, end of period (x) | | | $14.11 | | | | $14.00 | | | | $12.18 | |
Total return (%) (r)(s)(x) | | | 8.57 | | | | 16.72 | | | | 21.80 | (n) |
Ratios (%) (to average net assets)
and Supplemental data: | | | | | | | | | | | | |
Expenses before expense reductions (f) | | | 2.24 | | | | 2.86 | | | | 4.94 | (a) |
Expenses after expense reductions (f) | | | 1.20 | | | | 1.21 | | | | 1.20 | (a) |
Net investment income | | | 0.85 | | | | 1.03 | | | | 0.90 | (a) |
Portfolio turnover | | | 17 | | | | 82 | | | | 19 | (n) |
Net assets at end of period (000 omitted) | | | $2,913 | | | | $2,690 | | | | $2,193 | |
| (c) | For the period from the commencement of the fund’s investment operations, September 28, 2011, through the stated period end. |
| (d) | Per share data is based on average shares outstanding. |
| (f) | Ratios do not reflect reductions from fees paid indirectly, if applicable. |
| (l) | The net investment income ratio does not vary by the class specific expense differential because of the timing of sales of fund shares and the allocation of fund level income at such time. |
| (r) | Certain expenses have been reduced without which performance would have been lower. |
| (s) | From time to time the fund may receive proceeds from litigation settlements, without which performance would be lower. |
| (t) | Total returns do not include any applicable sales charges. |
| (w) | Per share amount was less than $0.01. |
| (x) | The net asset values per share and total returns have been calculated on net assets which include adjustments made in accordance with U.S. generally accepted accounting principles required at period end for financial reporting purposes. |
See Notes to Financial Statements
18
NOTES TO FINANCIAL STATEMENTS
(1) Business and Organization
MFS Global Leaders Fund (the fund) was a non-diversified series of MFS Series Trust I (the trust) during the reporting period (See Note 8 – Subsequent Event). The trust is organized as a Massachusetts business trust and is registered under the Investment Company Act of 1940, as amended, as an open-end management investment company.
The fund is an investment company and accordingly follows the investment company accounting and reporting guidance of the Financial Accounting Standards Board (FASB) Accounting Standards Codification Topic 946 Financial Services – Investment Companies.
(2) Significant Accounting Policies
General – The preparation of financial statements in conformity with U.S. generally accepted accounting principles requires management to make estimates and assumptions that affect the reported amounts of assets and liabilities, and disclosure of contingent assets and liabilities at the date of the financial statements and the reported amounts of increases and decreases in net assets from operations during the reporting period. Actual results could differ from those estimates. In the preparation of these financial statements, management has evaluated subsequent events occurring after the date of the fund’s Statement of Assets and Liabilities through the date that the financial statements were issued. The fund invests in foreign securities. Investments in foreign securities are vulnerable to the effects of changes in the relative values of the local currency and the U.S. dollar and to the effects of changes in each country’s legal, political, and economic environment.
In June 2014, FASB issued Accounting Standards Update 2014-11, Transfers and Servicing (Topic 860) – Repurchase-to-Maturity Transactions, Repurchase Financings, and Disclosures (“ASU 2014-11”). ASU 2014-11 changes the accounting for repurchase-to-maturity transactions (i.e., repurchase agreements that settle at the same time as the maturity of the transferred financial asset) and enhances the required disclosures for repurchase agreements and other similar transactions. Although still evaluating the potential impacts of ASU 2014-11 to the fund, management expects that the impact of the fund’s adoption will be limited to additional financial statement disclosures which would first be effective for interim reporting periods beginning after March 15, 2015.
Balance Sheet Offsetting – The fund’s accounting policy with respect to balance sheet offsetting is that, absent an event of default by the counterparty or a termination of the agreement, the International Swaps and Derivatives Association (ISDA) Master Agreement does not result in an offset of reported amounts of financial assets and financial liabilities in the Statement of Assets and Liabilities across transactions between the fund and the applicable counterparty. The fund’s right to setoff may be restricted or prohibited by the bankruptcy or insolvency laws of the particular jurisdiction to which a specific master netting agreement counterparty is subject. Balance sheet offsetting disclosures, to the extent applicable to the fund, have been included in the fund’s Significant Accounting Policies note under the captions for each of the fund’s in-scope financial instruments and transactions.
19
Notes to Financial Statements – continued
Investment Valuations – Equity securities, including restricted equity securities, are generally valued at the last sale or official closing price as provided by a third-party pricing service on the market or exchange on which they are primarily traded. Equity securities, for which there were no sales reported that day, are generally valued at the last quoted daily bid quotation as provided by a third-party pricing service on the market or exchange on which such securities are primarily traded. Short-term instruments with a maturity at issuance of 60 days or less generally are valued at amortized cost, which approximates market value. Open-end investment companies are generally valued at net asset value per share. Securities and other assets generally valued on the basis of information from a third-party pricing service may also be valued at a broker/dealer bid quotation. Values obtained from third-party pricing services can utilize both transaction data and market information such as yield, quality, coupon rate, maturity, type of issue, trading characteristics, and other market data. The values of foreign securities and other assets and liabilities expressed in foreign currencies are converted to U.S. dollars using the mean of bid and asked prices for rates provided by a third-party pricing service.
The Board of Trustees has delegated primary responsibility for determining or causing to be determined the value of the fund’s investments (including any fair valuation) to the adviser pursuant to valuation policies and procedures approved by the Board. If the adviser determines that reliable market quotations are not readily available, investments are valued at fair value as determined in good faith by the adviser in accordance with such procedures under the oversight of the Board of Trustees. Under the fund’s valuation policies and procedures, market quotations are not considered to be readily available for most types of debt instruments and floating rate loans and many types of derivatives. These investments are generally valued at fair value based on information from third-party pricing services. In addition, investments may be valued at fair value if the adviser determines that an investment’s value has been materially affected by events occurring after the close of the exchange or market on which the investment is principally traded (such as foreign exchange or market) and prior to the determination of the fund’s net asset value, or after the halting of trading of a specific security where trading does not resume prior to the close of the exchange or market on which the security is principally traded. Events that occur on a frequent basis after foreign markets close (such as developments in foreign markets and significant movements in the U.S. markets) and prior to the determination of the fund’s net asset value may be deemed to have a material effect on the value of securities traded in foreign markets. Accordingly, the fund’s foreign equity securities may often be valued at fair value. The adviser generally relies on third-party pricing services or other information (such as the correlation with price movements of similar securities in the same or other markets; the type, cost and investment characteristics of the security; the business and financial condition of the issuer; and trading and other market data) to assist in determining whether to fair value and at what value to fair value an investment. The value of an investment for purposes of calculating the fund’s net asset value can differ depending on the source and method used to determine value. When fair valuation is used, the value of an investment used to determine the fund’s net asset value may differ from quoted or published prices for the same investment. There can be no assurance that the fund could obtain the fair value assigned to an investment if it were to sell the investment at the same time at which the fund determines its net asset value per share.
20
Notes to Financial Statements – continued
Various inputs are used in determining the value of the fund’s assets or liabilities. These inputs are categorized into three broad levels. In certain cases, the inputs used to measure fair value may fall into different levels of the fair value hierarchy. In such cases, an investment’s level within the fair value hierarchy is based on the lowest level of input that is significant to the fair value measurement. The fund’s assessment of the significance of a particular input to the fair value measurement in its entirety requires judgment, and considers factors specific to the investment. Level 1 includes unadjusted quoted prices in active markets for identical assets or liabilities. Level 2 includes other significant observable market-based inputs (including quoted prices for similar securities, interest rates, prepayment speed, and credit risk). Level 3 includes unobservable inputs, which may include the adviser’s own assumptions in determining the fair value of investments. The following is a summary of the levels used as of August 31, 2014 in valuing the fund’s assets or liabilities:
| | | | | | | | | | | | | | | | |
| Investments at Value | | Level 1 | | | Level 2 | | | Level 3 | | | Total | |
| Equity Securities | | | $13,210,891 | | | | $— | | | | $— | | | | $13,210,891 | |
| Mutual Funds | | | 541,652 | | | | — | | | | — | | | | 541,652 | |
| Total Investments | | | $13,752,543 | | | | $— | | | | $— | | | | $13,752,543 | |
For further information regarding security characteristics, see the Portfolio of Investments.
Of the level 1 investments presented above, equity investments amounting to $828,402 would have been considered level 2 investments at the beginning of the period. The primary reason for changes in the classifications between levels 1 and 2 occurs when foreign equity securities are fair valued using other observable market-based inputs in place of the closing exchange price due to events occurring after the close of the exchange or market on which the investment is principally traded. The fund’s foreign equity securities may often be valued at fair value. The fund’s policy is to recognize transfers between the levels as of the end of the period.
Foreign Currency Translation – Purchases and sales of foreign investments, income, and expenses are converted into U.S. dollars based upon currency exchange rates prevailing on the respective dates of such transactions or on the reporting date for foreign denominated receivables and payables. Gains and losses attributable to foreign currency exchange rates on sales of securities are recorded for financial statement purposes as net realized gains and losses on investments. Gains and losses attributable to foreign exchange rate movements on receivables, payables, income and expenses are recorded for financial statement purposes as foreign currency transaction gains and losses. That portion of both realized and unrealized gains and losses on investments that results from fluctuations in foreign currency exchange rates is not separately disclosed.
Indemnifications – Under the fund’s organizational documents, its officers and Trustees may be indemnified against certain liabilities and expenses arising out of the performance of their duties to the fund. Additionally, in the normal course of business, the fund enters into agreements with service providers that may contain indemnification clauses. The fund’s maximum exposure under these agreements is unknown as this would involve future claims that may be made against the fund that have not yet occurred.
21
Notes to Financial Statements – continued
Investment Transactions and Income – Investment transactions are recorded on the trade date. Dividends received in cash are recorded on the ex-dividend date. Certain dividends from foreign securities will be recorded when the fund is informed of the dividend if such information is obtained subsequent to the ex-dividend date. Dividend payments received in additional securities are recorded on the ex-dividend date in an amount equal to the value of the security on such date.
The fund may receive proceeds from litigation settlements. Any proceeds received from litigation involving portfolio holdings are reflected in the Statement of Operations in realized gain/loss if the security has been disposed of by the fund or in unrealized gain/loss if the security is still held by the fund. Any other proceeds from litigation not related to portfolio holdings are reflected as other income in the Statement of Operations.
Fees Paid Indirectly – The fund’s custody fee may be reduced according to an arrangement that measures the value of cash deposited with the custodian by the fund. This amount, for the year ended August 31, 2014, is shown as a reduction of total expenses in the Statement of Operations.
Tax Matters and Distributions – The fund intends to qualify as a regulated investment company, as defined under Subchapter M of the Internal Revenue Code, and to distribute all of its taxable income, including realized capital gains. As a result, no provision for federal income tax is required. The fund’s federal tax returns, when filed, will remain subject to examination by the Internal Revenue Service for a three year period. Management has analyzed the fund’s tax positions taken on federal and state tax returns for all open tax years and does not believe that there are any uncertain tax positions that require recognition of a tax liability. Foreign taxes, if any, have been accrued by the fund in the accompanying financial statements in accordance with the applicable foreign tax law. Foreign income taxes may be withheld by certain countries in which the fund invests. Additionally, capital gains realized by the fund on securities issued in or by certain foreign countries may be subject to capital gains tax imposed by those countries.
Distributions to shareholders are recorded on the ex-dividend date. Income and capital gain distributions are determined in accordance with income tax regulations, which may differ from U.S. generally accepted accounting principles. Certain capital accounts in the financial statements are periodically adjusted for permanent differences in order to reflect their tax character. These adjustments have no impact on net assets or net asset value per share. Temporary differences which arise from recognizing certain items of income, expense, gain or loss in different periods for financial statement and tax purposes will reverse at some time in the future. Distributions in excess of net investment income or net realized gains are temporary overdistributions for financial statement purposes resulting from differences in the recognition or classification of income or distributions for financial statement and tax purposes.
Book/tax differences primarily relate to passive foreign investment companies, wash sale loss deferrals, and treating a portion of the proceeds from redemptions as a distribution for tax purposes.
22
Notes to Financial Statements – continued
The tax character of distributions declared to shareholders for the last two fiscal years is as follows:
| | | | | | | | |
| | | 8/31/14 | | | 8/31/13 | |
| Ordinary income (including any short-term capital gains) | | | $795,002 | | | | $188,511 | |
| Long-term capital gains | | | 83,505 | | | | — | |
| Total distributions | | | $878,507 | | | | $188,511 | |
The federal tax cost and the tax basis components of distributable earnings were as follows:
| | | | |
| As of 8/31/14 | | | |
| Cost of investments | | | $12,062,954 | |
| Gross appreciation | | | 1,781,136 | |
| Gross depreciation | | | (91,547 | ) |
| Net unrealized appreciation (depreciation) | | | $1,689,589 | |
| Undistributed ordinary income | | | 138,864 | |
| Undistributed long-term capital gain | | | 146,442 | |
| Other temporary differences | | | (631 | ) |
Multiple Classes of Shares of Beneficial Interest – The fund offers multiple classes of shares, which differ in their respective distribution and service fees. The fund’s income, realized and unrealized gain (loss), and common expenses are allocated to shareholders based on the daily net assets of each class. Dividends are declared separately for each class. Differences in per share dividend rates are generally due to differences in separate class expenses. Class B shares will convert to Class A shares approximately eight years after purchase. The fund’s distributions declared to shareholders as reported in the Statements of Changes in Net Assets are presented by class as follows:
| | | | | | | | | | | | | | | | |
| | | From net investment
income | | | From net realized gain on
investments | |
| | | Year
ended
8/31/14 | | | Year
ended
8/31/13 | | | Year
ended
8/31/14 | | | Year
ended
8/31/13 | |
| Class A | | | $43,141 | | | | $47,256 | | | | $505,890 | | | | $101,361 | |
| Class B | | | 1,474 | | | | — | | | | 32,256 | | | | 1,620 | |
| Class C | | | 4,066 | | | | 30 | | | | 87,699 | | | | 2,914 | |
| Class I | | | 19,320 | | | | 12,717 | | | | 184,661 | | | | 22,613 | |
| Total | | | $68,001 | | | | $60,003 | | | | $810,506 | | | | $128,508 | |
(3) Transactions with Affiliates
Investment Adviser – The fund has an investment advisory agreement with MFS to provide overall investment management and related administrative services and facilities to the fund. The management fee is computed daily and paid monthly at the following annual rates:
| | | | |
| First $1 billion of average daily net assets | | | 0.90 | % |
| Next $1.5 billion of average daily net assets | | | 0.75 | % |
| Average daily net assets in excess of $2.5 billion | | | 0.65 | % |
23
Notes to Financial Statements – continued
MFS has agreed in writing to reduce its management fee by a specified amount if certain MFS mutual fund assets exceed thresholds agreed to by MFS and the fund’s Board of Trustees. For the year ended August 31, 2014, this management fee reduction amounted to $435, which is included in the reduction of total expenses in the Statement of Operations. The management fee incurred for the year ended August 31, 2014 was equivalent to an annual effective rate of 0.90% of the fund’s average daily net assets.
The investment adviser has agreed in writing to pay a portion of the fund’s total annual operating expenses, exclusive of interest, taxes, extraordinary expenses, brokerage and transaction costs, and investment-related expenses, such that total fund operating expenses do not exceed the following rates annually of each class’s average daily net assets:
| | | | | | | | | | | | | | |
| Class A | | | Class B | | | Class C | | | Class I | |
| | 1.45% | | | | 2.20 | % | | | 2.20 | % | | | 1.20 | % |
This written agreement will continue until modified by the fund’s Board of Trustees, but such agreement will continue at least until December 31, 2015. For the year ended August 31, 2014, this reduction amounted to $132,261 and is included in the reduction of total expenses in the Statement of Operations.
Distributor – MFS Fund Distributors, Inc. (MFD), a wholly-owned subsidiary of MFS, as distributor, received $11,211 for the year ended August 31, 2014, as its portion of the initial sales charge on sales of Class A shares of the fund.
The Board of Trustees has adopted a distribution plan for certain share classes pursuant to Rule 12b-1 of the Investment Company Act of 1940.
The fund’s distribution plan provides that the fund will pay MFD for services provided by MFD and financial intermediaries in connection with the distribution and servicing of certain share classes. One component of the plan is a distribution fee paid to MFD and another component of the plan is a service fee paid to MFD. MFD may subsequently pay all, or a portion, of the distribution and/or service fees to financial intermediaries.
Distribution Plan Fee Table:
| | | | | | | | | | | | | | | | | | | | |
| | | Distribution
Fee Rate (d) | | | Service
Fee Rate (d) | | | Total
Distribution
Plan (d) | | | Annual
Effective
Rate (e) | | | Distribution
and Service
Fee | |
| Class A | | | — | | | | 0.25% | | | | 0.25% | | | | 0.25% | | | | $20,298 | |
| Class B | | | 0.75% | | | | 0.25% | | | | 1.00% | | | | 1.00% | | | | 4,652 | |
| Class C | | | 0.75% | | | | 0.25% | | | | 1.00% | | | | 1.00% | | | | 13,713 | |
| Total Distribution and Service Fees | | | | $38,663 | |
| (d) | In accordance with the distribution plan for certain classes, the fund pays distribution and/or service fees equal to these annual percentage rates of each class’s average daily net assets. The distribution and service fee rates disclosed by class represent the current rates in effect at the end of the reporting period. Any rate changes, if applicable, are detailed below. |
| (e) | The annual effective rates represent actual fees incurred under the distribution plan for the year ended August 31, 2014 based on each class’s average daily net assets. MFD has voluntarily agreed to rebate a portion of each class’s 0.25% service fee attributable to accounts for which MFD retains the 0.25% service fee except for accounts attributable to MFS or its affiliates’ seed money. For the year ended August 31, 2014, this rebate amounted to $80 for Class A and is included in the reduction of total expenses in the Statement of Operations. |
24
Notes to Financial Statements – continued
Certain Class A shares are subject to a contingent deferred sales charge (CDSC) in the event of a shareholder redemption within 18 months of purchase for shares purchased on or after August 1, 2012, and within 24 months of purchase for shares purchased prior to August 1, 2012. Class C shares are subject to a CDSC in the event of a shareholder redemption within 12 months of purchase. Class B shares are subject to a CDSC in the event of a shareholder redemption within six years of purchase. All contingent deferred sales charges are paid to MFD and during the year ended August 31, 2014, were as follows:
| | | | |
| | | Amount | |
| Class A | | | $207 | |
| Class B | | | 276 | |
| Class C | | | 349 | |
Shareholder Servicing Agent – MFS Service Center, Inc. (MFSC), a wholly-owned subsidiary of MFS, receives a fee from the fund for its services as shareholder servicing agent calculated as a percentage of the average daily net assets of the fund as determined periodically under the supervision of the fund’s Board of Trustees. For the year ended August 31, 2014, the fee was $3,313, which equated to 0.0258% annually of the fund’s average daily net assets. MFSC also receives payment from the fund for out-of-pocket expenses, sub-accounting and other shareholder servicing costs which may be paid to affiliated and unaffiliated service providers. For the year ended August 31, 2014, these out-of-pocket expenses, sub-accounting and other shareholder servicing costs amounted to $14,005.
Administrator – MFS provides certain financial, legal, shareholder communications, compliance, and other administrative services to the fund. Under an administrative services agreement, the fund partially reimburses MFS the costs incurred to provide these services. The fund is charged an annual fixed amount of $17,500 plus a fee based on average daily net assets. The administrative services fee incurred for the year ended August 31, 2014 was equivalent to an annual effective rate of 0.1364% of the fund’s average daily net assets.
Trustees’ and Officers’ Compensation – The fund pays compensation to independent Trustees in the form of a retainer, attendance fees, and additional compensation to Board and Committee chairpersons. The fund does not pay compensation directly to Trustees or officers of the fund who are also officers of the investment adviser, all of whom receive remuneration for their services to the fund from MFS. Certain officers and Trustees of the fund are officers or directors of MFS, MFD, and MFSC.
Other – This fund and certain other funds managed by MFS (the funds) have entered into services agreements (the Agreements) which provide for payment of fees by the funds to Tarantino LLC and Griffin Compliance LLC in return for the provision of services of an Independent Chief Compliance Officer (ICCO) and Assistant ICCO, respectively, for the funds. The funds can terminate the Agreements with Tarantino LLC and Griffin Compliance LLC at any time under the terms of the Agreements. The ICCO is an officer of the funds and the sole member of Tarantino LLC. Prior to June 1, 2014, Robyn L. Griffin served as the Assistant ICCO and was an officer of the funds. Ms. Griffin is the sole member of Griffin Compliance LLC. Effective May 31, 2014,
25
Notes to Financial Statements – continued
Ms. Griffin resigned as Assistant ICCO and the service agreement between the funds and Griffin Compliance LLC was terminated. For the year ended August 31, 2014, the aggregate fees paid by the fund to Tarantino LLC and Griffin Compliance LLC were $66 and are included in “Miscellaneous” expense in the Statement of Operations. MFS has agreed to reimburse the fund for a portion of the payments made by the fund in the amount of $20, which is included in the reduction of total expenses in the Statement of Operations. Additionally, MFS has agreed to bear all expenses associated with office space, other administrative support, and supplies provided to the ICCO and Assistant ICCO.
The fund invests in the MFS Institutional Money Market Portfolio which is managed by MFS and seeks current income consistent with preservation of capital and liquidity. Income earned on this investment is included in “Dividends from underlying affiliated funds” in the Statement of Operations. This money market fund does not pay a management fee to MFS.
On September 11, 2013, MFS redeemed 10,143 shares of Class A for an aggregate amount of $147,378. At August 31, 2014, MFS held approximately 95% of the outstanding shares of Class I.
(4) Portfolio Securities
For the year ended August 31, 2014, purchases and sales of investments, other than short-term obligations, aggregated $4,255,431 and $2,109,651, respectively.
(5) Shares of Beneficial Interest
The fund’s Declaration of Trust permits the Trustees to issue an unlimited number of full and fractional shares of beneficial interest. Transactions in fund shares were as follows:
| | | | | | | | | | | | | | | | |
| | | Year ended
8/31/14 | | | Year ended
8/31/13 | |
| | | Shares | | | Amount | | | Shares | | | Amount | |
| Shares sold | | | | | | | | | | | | | | | | |
Class A | | | 255,307 | | | | $3,612,305 | | | | 491,804 | | | | $6,548,966 | |
Class B | | | 11,692 | | | | 169,040 | | | | 15,708 | | | | 209,931 | |
Class C | | | 70,847 | | | | 990,306 | | | | 56,826 | | | | 739,685 | |
Class I | | | 1,341 | | | | 19,082 | | | | 9,352 | | | | 130,223 | |
| | | 339,187 | | | | $4,790,733 | | | | 573,690 | | | | $7,628,805 | |
| | | | |
| Shares issued to shareholders in reinvestment of distributions | | | | | | | | | | | | | | | | |
Class A | | | 39,229 | | | | $537,433 | | | | 11,590 | | | | $147,077 | |
Class B | | | 2,406 | | | | 32,621 | | | | 128 | | | | 1,620 | |
Class C | | | 6,502 | | | | 88,100 | | | | 233 | | | | 2,944 | |
Class I | | | 14,846 | | | | 203,981 | | | | 2,778 | | | | 35,330 | |
| | | 62,983 | | | | $862,135 | | | | 14,729 | | | | $186,971 | |
26
Notes to Financial Statements – continued
| | | | | | | | | | | | | | | | |
| | | Year ended
8/31/14 | | | Year ended
8/31/13 | |
| | | Shares | | | Amount | | | Shares | | | Amount | |
| Shares reacquired | | | | | | | | | | | | | | | | |
Class A | | | (154,628 | ) | | | $(2,164,259 | ) | | | (713,390 | ) | | | $(9,410,438 | ) |
Class B | | | (5,284 | ) | | | (74,272 | ) | | | (310 | ) | | | (4,144 | ) |
Class C | | | (20,627 | ) | | | (273,867 | ) | | | (970 | ) | | | (13,198 | ) |
Class I | | | (1,869 | ) | | | (25,623 | ) | | | — | | | | — | |
| | | (182,408 | ) | | | $(2,538,021 | ) | | | (714,670 | ) | | | $(9,427,780 | ) |
| | | | |
| Net change | | | | | | | | | | | | | | | | |
Class A | | | 139,908 | | | | $1,985,479 | | | | (209,996 | ) | | | $(2,714,395 | ) |
Class B | | | 8,814 | | | | 127,389 | | | | 15,526 | | | | 207,407 | |
Class C | | | 56,722 | | | | 804,539 | | | | 56,089 | | | | 729,431 | |
Class I | | | 14,318 | | | | 197,440 | | | | 12,130 | | | | 165,553 | |
| | | 219,762 | | | | $3,114,847 | | | | (126,251 | ) | | | $(1,612,004 | ) |
(6) Line of Credit
The fund and certain other funds managed by MFS participate in a $1.1 billion unsecured committed line of credit, subject to a $1 billion sublimit, provided by a syndication of banks under a credit agreement. Borrowings may be made for temporary financing needs. Interest is charged to each fund, based on its borrowings, generally at a rate equal to the higher of the Federal Reserve funds rate or one month LIBOR plus an agreed upon spread. A commitment fee, based on the average daily, unused portion of the committed line of credit, is allocated among the participating funds at the end of each calendar quarter. In addition, the fund and other funds managed by MFS have established unsecured uncommitted borrowing arrangements with certain banks for temporary financing needs. Interest is charged to each fund, based on its borrowings, at a rate equal to the Federal Reserve funds rate plus an agreed upon spread. For the year ended August 31, 2014, the fund’s commitment fee and interest expense were $50 and $0, respectively, and are included in “Miscellaneous” expense in the Statement of Operations.
(7) Transactions in Underlying Affiliated Funds-Affiliated Issuers
An affiliated issuer may be considered one in which the fund owns 5% or more of the outstanding voting securities, or a company which is under common control. For the purposes of this report, the fund assumes the following to be an affiliated issuer:
| | | | | | | | | | | | | | | | |
| Underlying Affiliated Fund | | Beginning
Shares/Par
Amount | | | Acquisitions
Shares/Par
Amount | | | Dispositions
Shares/Par
Amount | | | Ending
Shares/Par
Amount | |
MFS Institutional Money
Market Portfolio | | | 466,176 | | | | 3,823,282 | | | | (3,747,806 | ) | | | 541,652 | |
| | | | |
| Underlying Affiliated Fund | | Realized
Gain (Loss) | | | Capital Gain
Distributions | | | Dividend
Income | | | Ending
Value | |
MFS Institutional Money
Market Portfolio | | | $— | | | | $— | | | | $414 | | | | $541,652 | |
27
Notes to Financial Statements – continued
(8) Subsequent Event
Effective September 29, 2014, MFS Global Leaders Fund became a diversified series of the trust.
28
REPORT OF INDEPENDENT REGISTERED PUBLIC ACCOUNTING FIRM
To the Board of Trustees of MFS Series Trust I and the Shareholders of MFS Global Leaders Fund:
We have audited the accompanying statement of assets and liabilities, including the portfolio of investments, of MFS Global Leaders Fund (one of the series of MFS Series Trust I) (the “Fund”) as of August 31, 2014, and the related statement of operations for the year then ended, the statements of changes in net assets for each of the two years in the period then ended, and the financial highlights for each of the periods presented. These financial statements and financial highlights are the responsibility of the Fund’s management. Our responsibility is to express an opinion on these financial statements and financial highlights based on our audits.
We conducted our audits in accordance with the standards of the Public Company Accounting Oversight Board (United States). Those standards require that we plan and perform the audit to obtain reasonable assurance about whether the financial statements and financial highlights are free of material misstatement. The Fund is not required to have, nor were we engaged to perform, an audit of its internal control over financial reporting. Our audits included consideration of internal control over financial reporting as a basis for designing audit procedures that are appropriate in the circumstances, but not for the purpose of expressing an opinion on the effectiveness of the Fund’s internal control over financial reporting. Accordingly, we express no such opinion. An audit also includes examining, on a test basis, evidence supporting the amounts and disclosures in the financial statements, assessing the accounting principles used and significant estimates made by management, as well as evaluating the overall financial statement presentation. Our procedures included confirmation of securities owned as of August 31, 2014, by correspondence with the custodian and brokers; where replies were not received from brokers, we performed other auditing procedures. We believe that our audits provide a reasonable basis for our opinion.
In our opinion, the financial statements and financial highlights referred to above present fairly, in all material respects, the financial position of MFS Global Leaders Fund as of August 31, 2014, the results of its operations for the year then ended, the changes in its net assets for each of the two years in the period then ended, and the financial highlights for each of the periods presented, in conformity with accounting principles generally accepted in the United States of America.
DELOITTE & TOUCHE LLP
Boston, Massachusetts
October 16, 2014
29
TRUSTEES AND OFFICERS — IDENTIFICATION AND BACKGROUND
The Trustees and Officers of the Trust, as of October 1, 2014, are listed below, together with their principal occupations during the past five years. (Their titles may have varied during that period.) The address of each Trustee and Officer is 111 Huntington Avenue, Boston, Massachusetts 02199-7618. It is expected that the Board will appoint Mr. Timothy M. Fagan as Chief Compliance Officer of the MFS Funds on November 1, 2014.
| | | | | | | | |
Name, Age | | Position(s) Held with Fund | | Trustee/Officer
Since (h) | | Principal
Occupations During the Past Five Years | | Other Directorships (j) |
| INTERESTED TRUSTEES |
Robert J. Manning (k)
(age 50) | | Trustee | | February 2004 | | Massachusetts Financial Services Company, Chairman, Chief Executive Officer and Director; President (until 2009); Chief Investment Officer (until 2010) | | N/A |
Robin A. Stelmach (k)
(age 53) | | Trustee and President | | January 2014 | | Massachusetts Financial Services Company, Executive Vice President and Chief Operating Officer | | N/A |
| INDEPENDENT TRUSTEES | | |
David H. Gunning
(age 72) | | Trustee and Chair of Trustees | | January 2004 | | Private investor | | Lincoln Electric Holdings, Inc. (welding equipment manufacturer), Director; Development Alternatives, Inc. (consulting), Director/Non-Executive Chairman |
Steven E. Buller (age 63) | | Trustee | | February 2014 | | Chairman, Financial Accounting Standards Advisory Council; Standing Advisory Group, Public Company Accounting Oversight Board, Member; BlackRock, Inc. (investment management), Managing Director (until 2014), BlackRock Finco UK (investment management), Director (until 2014) | | N/A |
30
Trustees and Officers – continued
| | | | | | | | |
Name, Age | | Position(s) Held with Fund | | Trustee/Officer
Since (h) | | Principal
Occupations During the Past Five Years | | Other Directorships (j) |
Robert E. Butler
(age 72) | | Trustee | | January 2006 | | Consultant – investment company industry regulatory and compliance matters | | N/A |
Maureen R. Goldfarb
(age 59) | | Trustee | | January 2009 | | Private investor | | N/A |
William R. Gutow
(age 73) | | Trustee | | December 1993 | | Private investor and real estate consultant; Capitol Entertainment Management Company (video franchise), Vice Chairman | | Texas Donuts (donut franchise), Vice Chairman (until 2010) |
Michael Hegarty
(age 69) | | Trustee | | December 2004 | | Private investor | | Brookfield Office Properties, Inc. (real estate), Director; Rouse Properties Inc. (real estate), Director; Capmark Financial Group Inc. (real estate), Director |
John P. Kavanaugh
(age 59) | | Trustee | | January 2009 | | Private investor | | N/A |
Maryanne L. Roepke
(age 58) | | Trustee | | May 2014 | | American Century Investments (investment management), Senior Vice President and Chief Compliance Officer (until 2014) | | N/A |
Laurie J. Thomsen
(age 57) | | Trustee | | March 2005 | | Private investor; New Profit, Inc. (venture philanthropy), Executive Partner (until 2010) | | The Travelers Companies (insurance), Director |
Robert W. Uek
(age 73) | | Trustee | | January 2006 | | Consultant to investment company industry | | N/A |
| OFFICERS | | | | | | |
Christopher R. Bohane (k)
(age 40) | | Assistant Secretary and Assistant Clerk | | July 2005 | | Massachusetts Financial Services Company, Vice President and Assistant General Counsel | | N/A |
Kino Clark (k)
(age 46) | | Assistant Treasurer | | January 2012 | | Massachusetts Financial Services Company, Vice President | | N/A |
31
Trustees and Officers – continued
| | | | | | | | |
Name, Age | | Position(s) Held with Fund | | Trustee/Officer
Since (h) | | Principal
Occupations During the Past Five Years | | Other Directorships (j) |
Thomas H. Connors (k)
(age 55) | | Assistant Secretary and Assistant Clerk | | September 2012 | | Massachusetts Financial Services Company, Vice President and Senior Counsel; Deutsche Investment Management Americas Inc. (financial service provider), Director and Senior Counsel (until 2012) | | N/A |
Ethan D. Corey (k)
(age 50) | | Assistant Secretary and Assistant Clerk | | July 2005 | | Massachusetts Financial Services Company, Senior Vice President and Associate General Counsel | | N/A |
David L. DiLorenzo (k)
(age 46) | | Treasurer | | July 2005 | | Massachusetts Financial Services Company, Senior Vice President | | N/A |
Brian E. Langenfeld (k) (age 41) | | Assistant Secretary and Assistant Clerk | | June 2006 | | Massachusetts Financial Services Company, Vice President and Senior Counsel | | N/A |
Susan S. Newton (k) (age 64) | | Assistant Secretary and Assistant Clerk | | May 2005 | | Massachusetts Financial Services Company, Senior Vice President and Associate General Counsel | | N/A |
Susan A. Pereira (k)
(age 43) | | Assistant Secretary and Assistant Clerk | | July 2005 | | Massachusetts Financial Services Company, Vice President and Senior Counsel | | N/A |
Kasey L. Phillips (k) (age 43) | | Assistant Treasurer | | September 2012 | | Massachusetts Financial Services Company, Vice President; Wells Fargo Funds Management, LLC, Senior Vice President, Fund Treasurer (until 2012) | | N/A |
Mark N. Polebaum (k)
(age 62) | | Secretary and Clerk | | January 2006 | | Massachusetts Financial Services Company, Executive Vice President, General Counsel and Secretary | | N/A |
32
Trustees and Officers – continued
| | | | | | | | |
Name, Age | | Position(s) Held with Fund | | Trustee/Officer
Since (h) | | Principal
Occupations During the Past Five Years | | Other Directorships (j) |
Matthew A. Stowe (k)
(age 39) | | Assistant Secretary and Assistant Clerk | | October 2014 | | Massachusetts Financial Services Company, Vice President and Senior Counsel | | N/A |
Frank L. Tarantino (l)
(age 70) | | Independent Chief Compliance Officer | | June 2004 | | Tarantino LLC (provider of compliance services), Principal | | N/A |
Richard S. Weitzel (k)
(age 44) | | Assistant Secretary and Assistant Clerk | | October 2007 | | Massachusetts Financial Services Company, Senior Vice President and Associate General Counsel | | N/A |
James O. Yost (k)
(age 54) | | Deputy Treasurer | | September 1990 | | Massachusetts Financial Services Company, Senior Vice President | | N/A |
| (h) | Date first appointed to serve as Trustee/officer of an MFS Fund. Each Trustee has served continuously since appointment unless indicated otherwise. For the period from December 15, 2004 until February 22, 2005, Mr. Manning served as Advisory Trustee. Prior to January 2012, Messrs. DiLorenzo and Yost served as Assistant Treasurers of the Funds. Ms. Stelmach was appointed as President of the Funds as of October 1, 2014. |
| (j) | Directorships or trusteeships of companies required to report to the Securities and Exchange Commission (i.e., “public companies”). |
| (k) | “Interested person” of the Trust within the meaning of the Investment Company Act of 1940 (referred to as the 1940 Act), which is the principal federal law governing investment companies like the fund, as a result of position with MFS. The address of MFS is 111 Huntington Avenue, Boston, Massachusetts 02199-7618. |
| (l) | Mr. Tarantino will retire as Independent Chief Compliance Officer of the MFS Funds on October 31, 2014. It is expected that Mr. Tarantino will continue after that date as an Independent Senior Officer of the MFS Funds. |
Each Trustee (except Ms. Stelmach, Mr. Buller and Ms. Roepke) has been elected by shareholders and each Trustee and officer holds office until his or her successor is chosen and qualified or until his or her earlier death, resignation, retirement or removal. The Trust does not hold annual meetings for the purpose of electing Trustees, and Trustees are not elected for fixed terms. Messrs. Butler, Kavanaugh, Uek and Mses. Thomsen and Roepke are members of the Trust’s Audit Committee.
Each of the Fund’s Trustees and officers holds comparable positions with certain other funds of which MFS or a subsidiary is the investment adviser or distributor, and, in the case of the officers, with certain affiliates of MFS. As of January 1, 2014, the Trustees served as board members of 142 funds within the MFS Family of Funds.
33
Trustees and Officers – continued
The Statement of Additional Information for the Fund includes further information about the Trustees and is available without charge upon request by calling 1-800-225-2606.
| | |
| Investment Adviser | | Custodian |
Massachusetts Financial Services Company
111 Huntington Avenue
Boston, MA 02199-7618 | | State Street Bank and Trust Company 1 Lincoln Street Boston, MA 02111-2900 |
| Distributor | | Independent Registered Public Accounting Firm |
MFS Fund Distributors, Inc.
111 Huntington Avenue
Boston, MA 02199-7618 | | Deloitte & Touche LLP 200 Berkeley Street Boston, MA 02116 |
| Portfolio Managers | | |
Matthew Barrett Maile Clark | | |
34
BOARD REVIEW OF INVESTMENT ADVISORY AGREEMENT
The Investment Company Act of 1940 requires that both the full Board of Trustees and a majority of the non-interested (“independent”) Trustees, voting separately, annually approve the continuation of the Fund’s investment advisory agreement with MFS. The Trustees consider matters bearing on the Fund and its advisory arrangements at their meetings throughout the year, including a review of performance data at each regular meeting. In addition, the independent Trustees met several times over the course of three months beginning in May and ending in July, 2014 (“contract review meetings”) for the specific purpose of considering whether to approve the continuation of the investment advisory agreement for the Fund and the other investment companies that the Board oversees (the “MFS Funds”). The independent Trustees were assisted in their evaluation of the Fund’s investment advisory agreement by independent legal counsel, from whom they received separate legal advice and with whom they met separately from MFS during various contract review meetings. The independent Trustees were also assisted in this process by the MFS Funds’ Independent Chief Compliance Officer, a full-time senior officer appointed by and reporting to the independent Trustees.
In connection with their deliberations regarding the continuation of the investment advisory agreement, the Trustees, including the independent Trustees, considered such information and factors as they believed, in light of the legal advice furnished to them and their own business judgment, to be relevant. The investment advisory agreement for the Fund was considered separately, although the Trustees also took into account the common interests of all MFS Funds in their review. As described below, the Trustees considered the nature, quality, and extent of the various investment advisory, administrative, and shareholder services performed by MFS under the existing investment advisory agreement and other arrangements with the Fund.
In connection with their contract review meetings, the Trustees received and relied upon materials that included, among other items: (i) information provided by Lipper Inc., an independent third party, on the investment performance of the Fund for the one-year period ended December 31, 2013 and the investment performance of a group of funds with substantially similar investment classifications/objectives (the “Lipper performance universe”), (ii) information provided by Lipper Inc. on the Fund’s advisory fees and other expenses and the advisory fees and other expenses of comparable funds identified by Lipper Inc. (the “Lipper expense group”), (iii) information provided by MFS on the advisory fees of comparable portfolios of other clients of MFS, including institutional separate accounts and other clients, (iv) information as to whether and to what extent applicable expense waivers, reimbursements or fee “breakpoints” are observed for the Fund, (v) information regarding MFS’ financial results and financial condition, including MFS’ and certain of its affiliates’ estimated profitability from services performed for the Fund and the MFS Funds as a whole, and compared to MFS’ institutional business, (vi) MFS’ views regarding the outlook for the mutual fund industry and the strategic business plans of MFS, (vii) descriptions of various functions performed by MFS for the Funds, such as compliance monitoring and portfolio trading practices, and (viii) information regarding the overall organization of MFS, including information about MFS’ senior management and other personnel providing investment advisory, administrative and other services to
35
Board Review of Investment Advisory Agreement – continued
the Fund and the other MFS Funds. The comparative performance, fee and expense information prepared and provided by Lipper Inc. was not independently verified and the independent Trustees did not independently verify any information provided to them by MFS.
The Trustees’ conclusion as to the continuation of the investment advisory agreement was based on a comprehensive consideration of all information provided to the Trustees and not the result of any single factor. Some of the factors that figured particularly in the Trustees’ deliberations are described below, although individual Trustees may have evaluated the information presented differently from one another, giving different weights to various factors. It is also important to recognize that the fee arrangements for the Fund and other MFS Funds are the result of years of review and discussion between the independent Trustees and MFS, that certain aspects of such arrangements may receive greater scrutiny in some years than in others, and that the Trustees’ conclusions may be based, in part, on their consideration of these same arrangements during the course of the year and in prior years.
Based on information provided by Lipper Inc. and MFS, the Trustees reviewed the Fund’s total return investment performance as well as the performance of peer groups of funds for the one-year period ended December 31, 2013. The total return performance of the Fund’s Class A shares was in the 5th quintile relative to the other funds in the universe for this one-year period (the 1st quintile being the best performers and the 5th quintile being the worst performers). The Fund commenced operations on September 28, 2011 and has a limited operating history and performance record; therefore no performance data for the three- or five-year periods was available. Because of the passage of time, these performance results may differ from the performance results for more recent periods, including those shown elsewhere in this report.
In the course of their deliberations, the Trustees took into account information provided by MFS in connection with the contract review meetings, including more recent performance information, as well as during investment review meetings conducted with portfolio management personnel during the course of the year regarding the Fund’s performance. After reviewing these and related factors, the Trustees concluded, within the context of their overall conclusions regarding the investment advisory agreement, that they were satisfied with MFS’ responses and efforts relating to investment performance.
In assessing the reasonableness of the Fund’s advisory fee, the Trustees considered, among other information, the Fund’s advisory fee and the total expense ratio of the Fund’s Class A shares as a percentage of average daily net assets and the advisory fee and total expense ratios of peer groups of funds based on information provided by Lipper Inc. The Trustees considered that MFS currently observes an expense limitation for the Fund, which may not be changed without the Trustees’ approval. The Trustees also considered that, according to the Lipper data (which takes into account any fee reductions or expense limitations that were in effect during the Fund’s last fiscal year), the Fund’s effective advisory fee rate and total expense ratio were each lower than the Lipper expense group median.
36
Board Review of Investment Advisory Agreement – continued
The Trustees also considered the advisory fees charged by MFS to any comparable institutional accounts. In comparing these fees, the Trustees considered information provided by MFS as to the generally broader scope of services provided by MFS to the Fund in comparison to institutional accounts, the higher demands placed on MFS’ investment personnel and trading infrastructure as a result of the daily cash in-flows and out-flows of the Fund, and the impact on MFS and expenses associated with the more extensive regulatory regime to which the Fund is subject in comparison to institutional accounts.
The Trustees also considered whether the Fund may benefit from any economies of scale in the management of the Fund in the event of growth in assets of the Fund and/or growth in assets of the MFS Funds as a whole. They noted that the Fund’s advisory fee rate schedule is subject to contractual breakpoints that reduce the Fund’s advisory fee rate on average daily net assets over $1 billion and $2.5 billion. The Trustees also noted that MFS has agreed in writing to waive a portion of the management fees of certain MFS Funds, including the Fund, if the total combined assets of certain funds within the MFS Funds’ complex increase above agreed upon thresholds (the “group fee waiver”), enabling the Fund’s shareholders to share in the benefits from any economies of scale at the complex level. The group fee waiver is reviewed and renewed annually between the Board and MFS. The Trustees concluded that the breakpoints and the group fee waiver were sufficient to allow the Fund to benefit from economies of scale as its assets and overall complex assets grow.
The Trustees also considered information prepared by MFS relating to MFS’ costs and profits with respect to the Fund, the MFS Funds considered as a group, and other investment companies and accounts advised by MFS, as well as MFS’ methodologies used to determine and allocate its costs to the MFS Funds, the Fund and other accounts and products for purposes of estimating profitability.
After reviewing these and other factors described herein, the Trustees concluded, within the context of their overall conclusions regarding the investment advisory agreement, that the advisory fees charged to the Fund represent reasonable compensation in light of the services being provided by MFS to the Fund.
In addition, the Trustees considered MFS’ resources and related efforts to continue to retain, attract and motivate capable personnel to serve the Fund. The Trustees also considered current and developing conditions in the financial services industry, including the presence of large and well-capitalized companies which are spending, and appear to be prepared to continue to spend, substantial sums to engage personnel and to provide services to competing investment companies. In this regard, the Trustees also considered the financial resources of MFS and its ultimate parent, Sun Life Financial Inc. The Trustees also considered the advantages and possible disadvantages to the Fund of having an adviser that also serves other investment companies as well as other accounts.
The Trustees also considered the nature, quality, cost, and extent of administrative, transfer agency, and distribution services provided to the Fund by MFS and its affiliates under agreements and plans other than the investment advisory agreement, including any 12b-1 fees the Fund pays to MFS Fund Distributors, Inc., an affiliate of MFS. The Trustees also considered the nature, extent and quality of certain other services MFS
37
Board Review of Investment Advisory Agreement – continued
performs or arranges for on the Fund’s behalf, which may include securities lending programs, directed expense payment programs, class action recovery programs, and MFS’ interaction with third-party service providers, principally custodians and sub-custodians. The Trustees concluded that the various non-advisory services provided by MFS and its affiliates on behalf of the Fund were satisfactory.
The Trustees also considered benefits to MFS from the use of the Fund’s portfolio brokerage commissions, if applicable, to pay for investment research and various other factors. Additionally, the Trustees considered so-called “fall-out benefits” to MFS such as reputational value derived from serving as investment manager to the Fund.
Based on their evaluation of factors that they deemed to be material, including those factors described above, the Board of Trustees, including the independent Trustees, concluded that the Fund’s investment advisory agreement with MFS should be continued for an additional one-year period, commencing August 1, 2014.
38
PROXY VOTING POLICIES AND INFORMATION
MFS votes proxies on behalf of the fund pursuant to proxy voting policies and procedures that are available without charge, upon request, by calling 1-800-225-2606, by visiting the Proxy Voting section of mfs.com or by visiting the SEC’s Web site at http://www.sec.gov.
Information regarding how the fund voted proxies relating to portfolio securities during the most recent twelve-month period ended June 30 is available without charge by visiting the Proxy Voting section of mfs.com or by visiting the SEC’s Web site at http://www.sec.gov.
QUARTERLY PORTFOLIO DISCLOSURE
The fund will file a complete schedule of portfolio holdings with the Securities and Exchange Commission (the Commission) for the first and third quarters of each fiscal year on Form N-Q. A shareholder can obtain the quarterly portfolio holdings report at mfs.com. The fund’s Form N-Q is also available on the EDGAR database on the Commission’s Internet Web site at http://www.sec.gov, and may be reviewed and copied at the:
Public Reference Room
Securities and Exchange Commission
100 F Street, NE, Room 1580
Washington, D.C. 20549
Information on the operation of the Public Reference Room may be obtained by calling the Commission at 1-800-SEC-0330. Copies of the fund’s Form N-Q also may be obtained, upon payment of a duplicating fee, by electronic request at the following e-mail address: publicinfo@sec.gov or by writing the Public Reference Section at the above address.
FURTHER INFORMATION
From time to time, MFS may post important information about the fund or the MFS funds on the MFS web site (mfs.com). This information is available by visiting the “Commentary & Announcements” and “Market Outlooks” sections of mfs.com or by clicking on the fund’s name under “Mutual Funds” in the “Products” section of mfs.com.
FEDERAL TAX INFORMATION (unaudited)
The fund will notify shareholders of amounts for use in preparing 2014 income tax forms in January 2015. The following information is provided pursuant to provisions of the Internal Revenue Code.
The fund designates the maximum amount allowable as qualified dividend income eligible to be taxed at the same rate as long-term capital gain.
The fund designates $107,000 as capital gain dividends paid during the fiscal year.
For corporate shareholders, 7.24% of the ordinary income dividends paid during the fiscal year qualify for the corporate dividends received deduction.
Income derived from foreign sources was $214,258. The fund intends to pass through foreign tax credits of $18,853 for the fiscal year.
39
rev. 3/11
| | | | |
| | | |
FACTS | | WHAT DOES MFS DO WITH YOUR PERSONAL INFORMATION? | |  |
| | |
| Why? | | Financial companies choose how they share your personal information. Federal law gives consumers the right to limit some but not all sharing. Federal law also requires us to tell you how we collect, share, and protect your personal information. Please read this notice carefully to understand what we do. |
| | |
| What? | | The types of personal information we collect and share depend on the product or service you have with us. This information can include: • Social Security number and account balances • Account transactions and transaction history • Checking account information and wire transfer instructions When you are no longer our customer, we continue to share your information as described in this notice. |
| | |
| How? | | All financial companies need to share customers’ personal information to run their everyday business. In the section below, we list the reasons financial companies can share their customers’ personal information; the reasons MFS chooses to share; and whether you can limit this sharing. |
| | | | |
Reasons we can share your
personal information | | Does MFS
share? | | Can you limit
this sharing? |
For our everyday business purposes – such as to process your transactions, maintain your account(s), respond to court orders and legal investigations, or report to credit bureaus | | Yes | | No |
For our marketing purposes – to offer our products and services to you | | No | | We don’t share |
| For joint marketing with other financial companies | | No | | We don’t share |
For our affiliates’ everyday business purposes – information about your transactions and experiences | | No | | We don’t share |
For our affiliates’ everyday business purposes – information about your creditworthiness | | No | | We don’t share |
| For nonaffiliates to market to you | | No | | We don’t share |
| | |
| Questions? | | Call 800-225-2606 or go to mfs.com. |
40
| | |
| Who we are |
| Who is providing this notice? | | MFS Funds, MFS Investment Management, MFS Institutional Advisors, Inc., MFS Fund Distributors, Inc., MFS Heritage Trust Company, and MFS Service Center, Inc. |
| | |
| What we do |
| How does MFS protect my personal information? | | To protect your personal information from unauthorized access and use, we use security measures that comply with federal law. These measures include procedural, electronic, and physical safeguards for the protection of the personal information we collect about you. |
| How does MFS collect my personal information? | | We collect your personal information, for example, when you •open an account or provide account information •direct us to buy securities or direct us to sell your securities •make a wire transfer We also collect your personal information from others, such as credit bureaus, affiliates and other companies. |
| Why can’t I limit all sharing? | | Federal law gives you the right to limit only •sharing for affiliates’ everyday business purposes – information about your creditworthiness •affiliates from using your information to market to you •sharing for nonaffiliates to market to you State laws and individual companies may give you additional rights to limit sharing. |
| | |
| Definitions |
| Affiliates | | Companies related by common ownership or control. They can be financial and nonfinancial companies. •MFS does not share personal information with affiliates, except for everyday business purposes as described on page one of this notice. |
| Nonaffiliates | | Companies not related by common ownership or control. They can be financial and nonfinancial companies. •MFS does not share with nonaffiliates so they can market to you. |
| Joint Marketing | | A formal agreement between nonaffiliated financial companies that together market financial products or services to you. •MFS doesn’t jointly market. |
| | |
| Other important information |
| If you own an MFS product or receive an MFS service in the name of a third party such as a bank or broker-dealer, their privacy policy may apply to you instead of ours. |
41
Save paper with eDelivery.

| MFS® will send you prospectuses, |
reports, and proxies directly via e-mail so you will get information faster with less mailbox clutter.
To sign up:
1. Go to mfs.com.
2. Log in via MFS® Access.
3. Select eDelivery.
If you own your MFS fund shares through a financial institution or a retirement plan, MFS® TALK, MFS® Access, or eDelivery may not be available to you.
CONTACT
WEB SITE
mfs.com
MFS TALK
1-800-637-8255
24 hours a day
ACCOUNT SERVICE AND LITERATURE
Shareholders
1-800-225-2606
Financial advisors
1-800-343-2829
Retirement plan services
1-800-637-1255
MAILING ADDRESS
MFS Service Center, Inc.
P.O. Box 55824
Boston, MA 02205-5824
OVERNIGHT MAIL
MFS Service Center, Inc.
c/o Boston Financial Data Services
30 Dan Road
Canton, MA 02021-2809
ANNUAL REPORT
August 31, 2014

MFS® LOW VOLATILITY GLOBAL EQUITY FUND

LVO-ANN
MFS® LOW VOLATILITY GLOBAL EQUITY FUND
CONTENTS
The report is prepared for the general information of shareholders.
It is authorized for distribution to prospective investors only when preceded or accompanied by a current prospectus.
NOT FDIC INSURED Ÿ MAY LOSE VALUE Ÿ NO BANK GUARANTEE

LETTER FROM THE CHAIRMAN AND CEO
Dear Shareholders:
The U.S. economy continues to gain strength. Manufacturing output, construction activity and consumer confidence are all at multi-year highs, auto sales are robust, and
U.S. labor market reports show broad progress. Even a slowdown in the pace of rising house prices is seen as making the market more sustainable. Economists have a favorable outlook, and broad stock indices reflect that.
However, challenges dominate the rest of the global economy. China is struggling to boost its industrial output and Japan’s economic turnaround appears to have hit a setback after its sales tax increase in April. The eurozone economy is being held back by persistently high unemployment and dangerously low inflation, leading the European Central Bank to take more
aggressive stimulus action. With robust corporate earnings, the market’s greatest concerns relate to conflicts in the Middle East and Ukraine. In addition, speculation continues on when the U.S. Federal Reserve will begin tightening its monetary policy now that the U.S. economy has regained some traction.
As always at MFS®, active risk management is integral to how we manage your investments. We use a collaborative process, sharing insights across asset classes, regions and economic sectors. Our global team of investment professionals uses a multidisciplined, long-term, diversified investment approach.
We understand that these are challenging economic times. We believe we can serve you best by applying proven principles, such as asset allocation and diversification, over the long term. We are confident that this approach can help you as you work with your financial advisors to reach your goals in the years ahead.
Respectfully,

Robert J. Manning
Chairman and Chief Executive Officer
MFS Investment Management
October 16, 2014
The opinions expressed in this letter are subject to change and may not be relied upon for investment advice. No forecasts can be guaranteed.
1
PORTFOLIO COMPOSITION
Portfolio structure (a)

| | | | |
| Top ten holdings | | | | |
| Discover Financial Services | | | 1.5% | |
| General Mills, Inc. | | | 1.4% | |
| Taiwan Semiconductor Manufacturing Co. Ltd., ADR | | | 1.3% | |
| Amgen, Inc. | | | 1.2% | |
| Roche Holding AG | | | 1.1% | |
| Exxon Mobil Corp. | | | 1.0% | |
| Johnson & Johnson | | | 1.0% | |
| Cheung Kong Infrastructure Holdings Ltd. | | | 0.9% | |
| Lockheed Martin Corp. | | | 0.9% | |
| Pfizer, Inc. | | | 0.8% | |
| | | | |
| Equity sectors | | | | |
| Health Care | | | 6.5% | |
| Financial Services | | | 6.4% | |
| Utilities & Communications | | | 6.1% | |
| Consumer Staples | | | 5.2% | |
| Retailing | | | 3.6% | |
| Energy | | | 3.5% | |
| Leisure | | | 3.5% | |
| Technology | | | 3.0% | |
| Industrial Goods & Services | | | 1.1% | |
| Autos & Housing | | | 1.0% | |
| Transportation | | | 0.9% | |
| Basic Materials | | | 0.4% | |
| (a) | The high percentage in Cash & Other is due to a large shareholder subscription at period end. As a matter of policy, MFS normally invests at least 80% of the fund’s net assets in equity securities. For the fund’s most recent publicly-available holdings, go to mfs.com. |
Cash & Other can include cash, other assets less liabilities, offsets to derivative positions, and short-term securities.
Percentages are based on net assets as of 8/31/14.
The portfolio is actively managed and current holdings may be different.
2
MANAGEMENT REVIEW
Summary of Results
For the period December 5, 2013 through August 31, 2014, Class A shares of the MFS Low Volatility Global Equity Fund (“fund”) provided a total return of 10.13%, at net asset value. This compares with a return of 11.19% for the fund’s benchmark, the MSCI All Country World Index.
Market Environment
Early in the period, equity markets advanced in response to improved economic fundamentals, having recovered from prior weakness stemming from concerns that the US Federal Reserve (“Fed”) would begin tapering its quantitative easing (“QE”) program. A general theme in the market was a rotation in investor allocations from fixed income to equities and emerging markets (“EM”) to developed markets, reflecting an anticipated acceleration in developed market growth rates relative to EM as well as a more equity-friendly macro backdrop amid increased volatility in EM debt. As the period progressed, the Fed’s decision to postpone QE tapering surprised markets. Favorable market reactions were tempered, however, by tense negotiations over US fiscal policy which resulted in a 16-day partial shutdown of the federal government and a short-term extension in the debt ceiling. The volatility was short-lived, however, as an extension of budget and debt ceiling deadlines allowed the government to re-open, and subsequent economic data reflected moderate but resilient US growth. Also well-received was the decision by the European Central Bank (“ECB”) to cut its policy rate as inflation pressures waned in the region. In addition, equity investors appeared to have concluded that there would be no major change in US monetary policy as a result of the nomination of Janet Yellen as the new Fed Chair for a term beginning in early 2014 and that tapering would have no major impact on the trajectory.
Later in the period, financial markets were forced to contend with a series of positive and negative return episodes. In addition to periodic flashpoints in country specific emerging markets, geopolitical tensions flared in the Middle East and Russia/Ukraine. Market setbacks were short-lived, as improving economic growth in the US coupled with prospects for easier monetary policy in regions with slowing growth such as Japan, Europe and China, supported risk assets. For example, the ECB cut policy interest rates into negative territory and by the end of the period expectations were for additional rate cuts and the announcement for non-conventional easing measures. The decline in developed market government bond yields and credit spreads were also supportive for equity markets. At the end of the period, the US equity market was trading at all-time highs.
Detractors from Performance
The combination of stock selection and an underweight position in the technology sector detracted from performance relative to the MSCI All Country World Index. Not holding strong-performing computer and personal electronics maker Apple (United States) hindered relative performance. Shares of Apple spiked late in the reporting period prior to the company’s release of their highly anticipated new IPhone 6 and IPhone 6 Plus smartphones. Additionally, strong consumer demand resulted in record pre-orders for the company’s products.
3
Management Review – continued
Security selection and an overweight position in the consumer staples sector dampened relative performance, led by holdings of poor-performing tobacco supply company Schweitzer-Mauduit (h)(b) (United States). The stock declined due to increased competition and a weak pricing environment for the company’s cigarette paper products.
Stock selection in the energy sector also held back relative performance. The timing of the fund’s ownership in shares of oil and gas producer Range Resources (United States) dampened relative returns. The company had relatively large capital expenditures during a period in which excess supply was available.
Elsewhere, the fund’s overweight position in Japanese banking and financial services firm Sumitomo Mitsui Financial, and holdings of Panama-based airline services provider Copa Holdings (b), weakened relative performance as both stocks underperformed the benchmark during the reporting period. The fund’s overweight positions in pharmaceutical giant Pfizer (United States), telecommunications company KDDI (Japan), fast food restaurant chain operator McDonalds (United States), and holdings of international betting and gaming company Paddy Power (b) (Ireland) and global fleet vehicle fuel card provider Fleetcor Technologies (h) (United States), also weighed on relative performance.
Contributors to Performance
Stock selection and, to a lesser extent, the fund’s underweight position in the industrial goods & services sector supported relative performance, led by an overweight position in defense contractor Lockheed Martin (United States). The stock appreciated early in the reporting period as the company reported strong earnings and positive performance from the company’s surveillance systems programs.
Strong security selection in the retailing sector contributed to relative performance. The fund’s overweight position in strong-performing US-based retailer Kroger aided relative performance. The company benefited from decreased competition, increased demand and an improved product mix during the reporting period.
The combination of stock selection and underweight position in the financial services sector contributed to relative performance. The fund’s overweight positions in strong-performing global payment services company Discover Financial Services (United States) and diversified financial services company Suncorp-Metway, and holdings of lending company Provident Financial (h)(b) (United Kingdom), bolstered relative results. Shares of Discover Financial Services outperformed the benchmark during the reporting period due to an increase in loan growth, improved cost management and a lower tax rate.
Other top relative contributors for the period included the fund’s holdings of generic drug manufacturer Teva Pharmaceuticals (Israel), semiconductor manufacturer Taiwan Semiconductor (Taiwan) and airline company Southwest Airlines (United States). Overweight positions in biotechnology firm Amgen (United States) and in strong-performing UK-based hotel and restaurant chain operator Whitbread also helped.
Respectfully,
| | |
| James Fallon | | Jonathan Sage |
| Portfolio Manager | | Portfolio Manager |
4
Management Review – continued
| (b) | Security is not a benchmark constituent. |
| (h) | Security was not held in the portfolio at period end. |
The views expressed in this report are those of the portfolio managers only through the end of the period of the report as stated on the cover and do not necessarily reflect the views of MFS or any other person in the MFS organization. These views are subject to change at any time based on market or other conditions, and MFS disclaims any responsibility to update such views. These views may not be relied upon as investment advice or an indication of trading intent on behalf of any MFS portfolio. References to specific securities are not recommendations of such securities, and may not be representative of any MFS portfolio’s current or future investments.
5
PERFORMANCE SUMMARY THROUGH 8/31/14
The following chart illustrates a representative class of the fund’s historical performance in comparison to its benchmark(s). Performance results include the deduction of the maximum applicable sales charge and reflect the percentage change in net asset value, including reinvestment of dividends and capital gains distributions. The performance of other share classes will be greater than or less than that of the class depicted below. Benchmarks are unmanaged and may not be invested in directly. Benchmark returns do not reflect sales charges, commissions or expenses. (See Notes to Performance Summary.)
Performance data shown represents past performance and is no guarantee of future results. Investment return and principal value fluctuate so your shares, when sold, may be worth more or less than the original cost; current performance may be lower or higher than quoted. The performance shown does not reflect the deduction of taxes, if any, that a shareholder would pay on fund distributions or the redemption of fund shares.
Growth of a Hypothetical $10,000 Investment (t)
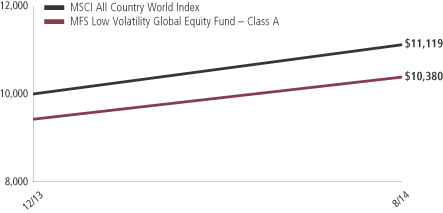
6
Performance Summary – continued
Total Returns through 8/31/14
Average annual without sales charge
| | | | | | | | |
| | | Share class | | Class inception date | | Life (t) | | |
| | | A | | 12/05/13 | | 10.13% | | |
| | | B | | 12/05/13 | | 9.40% | | |
| | | C | | 12/05/13 | | 9.40% | | |
| | | I | | 12/05/13 | | 10.19% | | |
| | | R1 | | 12/05/13 | | 9.40% | | |
| | | R2 | | 12/05/13 | | 9.79% | | |
| | | R3 | | 12/05/13 | | 10.04% | | |
| | | R4 | | 12/05/13 | | 10.29% | | |
| | | R5 | | 12/05/13 | | 10.21% | | |
| Comparative benchmark | | | | |
| | | MSCI All Country World Index (f) | | 11.19% | | |
| Average annual with sales charge | | | | |
| | | A
With Initial Sales Charge (5.75%) | | 3.80% | | |
| | | B
With CDSC (Declining over six years from 4% to 0%) (v) | | 5.40% | | |
| | | C
With CDSC (1% for 12 months) (v) | | 8.40% | | |
CDSC – Contingent Deferred Sales Charge.
Class I, R1, R2, R3, R4, and R5 shares do not have a sales charge.
| (f) | Source: FactSet Research Systems Inc. |
| (t) | For the period from the class inception date through the stated period end. (See Notes to Performance Summary.) |
| (v) | Assuming redemption at the end of the applicable period. |
Benchmark Definition
MSCI All Country World Index – a market capitalization-weighted index that is designed to measure equity market performance in the global developed and emerging markets.
It is not possible to invest directly in an index.
Notes to Performance Summary
Average annual total return represents the average annual change in value for each share class for the periods presented. Life returns are presented where the share class has less than 10 years of performance history and represent the average annual total return from the class inception date to the stated period end date.
7
Performance Summary – continued
Performance results reflect any applicable expense subsidies and waivers in effect during the periods shown. Without such subsidies and waivers the fund’s performance results would be less favorable. Please see the prospectus and financial statements for complete details.
Performance results do not include adjustments made for financial reporting purposes in accordance with U.S. generally accepted accounting principles and may differ from amounts reported in the financial highlights.
From time to time the fund may receive proceeds from litigation settlements, without which performance would be lower.
8
EXPENSE TABLE
Fund expenses borne by the shareholders during the period, March 1, 2014 through August 31, 2014
As a shareholder of the fund, you incur two types of costs: (1) transaction costs, including sales charges (loads) on certain purchase or redemption payments, and (2) ongoing costs, including management fees; distribution and service (12b-1) fees; and other fund expenses. This example is intended to help you understand your ongoing costs (in dollars) of investing in the fund and to compare these costs with the ongoing costs of investing in other mutual funds.
The example is based on an investment of $1,000 invested at the beginning of the period and held for the entire period March 1, 2014 through August 31, 2014.
Actual Expenses
The first line for each share class in the following table provides information about actual account values and actual expenses. You may use the information in this line, together with the amount you invested, to estimate the expenses that you paid over the period. Simply divide your account value by $1,000 (for example, an $8,600 account value divided by $1,000 = 8.6), then multiply the result by the number in the first line under the heading entitled “Expenses Paid During Period” to estimate the expenses you paid on your account during this period.
Hypothetical Example for Comparison Purposes
The second line for each share class in the following table provides information about hypothetical account values and hypothetical expenses based on the fund’s actual expense ratio and an assumed rate of return of 5% per year before expenses, which is not the fund’s actual return. The hypothetical account values and expenses may not be used to estimate the actual ending account balance or expenses you paid for the period. You may use this information to compare the ongoing costs of investing in the fund and other funds. To do so, compare this 5% hypothetical example with the 5% hypothetical examples that appear in the shareholder reports of the other funds.
Please note that the expenses shown in the table are meant to highlight your ongoing costs only and do not reflect any transactional costs, such as sales charges (loads). Therefore, the second line for each share class in the table is useful in comparing ongoing costs only, and will not help you determine the relative total costs of owning different funds. In addition, if these transactional costs were included, your costs would have been higher.
9
Expense Table – continued
| | | | | | | | | | | | | | | | | | |
Share Class | | | | Annualized
Expense Ratio | | | Beginning Account Value 3/01/14 | | | Ending Account Value 8/31/14 | | | Expenses Paid During Period (p) 3/01/14-8/31/14 | |
| A | | Actual | | | 1.21% | | | | $1,000.00 | | | | $1,054.87 | | | | $6.27 | |
| | Hypothetical (h) | | | 1.21% | | | | $1,000.00 | | | | $1,019.11 | | | | $6.16 | |
| B | | Actual | | | 2.05% | | | | $1,000.00 | | | | $1,049.89 | | | | $10.59 | |
| | Hypothetical (h) | | | 2.05% | | | | $1,000.00 | | | | $1,014.87 | | | | $10.41 | |
| C | | Actual | | | 2.05% | | | | $1,000.00 | | | | $1,049.93 | | | | $10.59 | |
| | Hypothetical (h) | | | 2.05% | | | | $1,000.00 | | | | $1,014.87 | | | | $10.41 | |
| I | | Actual | | | 1.06% | | | | $1,000.00 | | | | $1,054.47 | | | | $5.49 | |
| | Hypothetical (h) | | | 1.06% | | | | $1,000.00 | | | | $1,019.86 | | | | $5.40 | |
| R1 | | Actual | | | 2.05% | | | | $1,000.00 | | | | $1,049.89 | | | | $10.59 | |
| | Hypothetical (h) | | | 2.05% | | | | $1,000.00 | | | | $1,014.87 | | | | $10.41 | |
| R2 | | Actual | | | 1.55% | | | | $1,000.00 | | | | $1,051.66 | | | | $8.02 | |
| | Hypothetical (h) | | | 1.55% | | | | $1,000.00 | | | | $1,017.39 | | | | $7.88 | |
| R3 | | Actual | | | 1.30% | | | | $1,000.00 | | | | $1,054.04 | | | | $6.73 | |
| | Hypothetical (h) | | | 1.30% | | | | $1,000.00 | | | | $1,018.65 | | | | $6.61 | |
| R4 | | Actual | | | 1.05% | | | | $1,000.00 | | | | $1,055.42 | | | | $5.44 | |
| | Hypothetical (h) | | | 1.05% | | | | $1,000.00 | | | | $1,019.91 | | | | $5.35 | |
| R5 | | Actual | | | 1.06% | | | | $1,000.00 | | | | $1,054.68 | | | | $5.49 | |
| | Hypothetical (h) | | | 1.06% | | | | $1,000.00 | | | | $1,019.86 | | | | $5.40 | |
| (h) | 5% class return per year before expenses. |
| (p) | “Expenses Paid During Period” are equal to each class’s annualized expense ratio, as shown above, multiplied by the average account value over the period, multiplied by 184/365 (to reflect the one-half year period). Expenses paid do not include any applicable sales charges (loads). If these transaction costs had been included, your costs would have been higher. |
Notes to Expense Table
Each class with a Rule 12b-1 service fee is subject to a rebate of a portion of such fee. Such rebates are included in the expense ratios above and are outside of the expense limitation arrangement. For Class A shares, this rebate reduced the expense ratio above by 0.10%. See Note 3 in the Notes to Financial Statements for additional information.
10
PORTFOLIO OF INVESTMENTS
8/31/14
The Portfolio of Investments is a complete list of all securities owned by your fund. It is categorized by broad-based asset classes.
| | | | | | | | |
| Common Stocks - 41.2% | | | | | | | | |
| Issuer | | Shares/Par | | | Value ($) | |
| | | | | | | | |
| Aerospace - 0.8% | | | | | | | | |
| Lockheed Martin Corp. | | | 372 | | | $ | 64,725 | |
| | |
| Airlines - 0.6% | | | | | | | | |
| Copa Holdings S.A., “A” | | | 175 | | | $ | 21,522 | |
| Southwest Airlines Co. | | | 660 | | | | 21,127 | |
| | | | | | | | |
| | | | | | | $ | 42,649 | |
| Automotive - 0.7% | | | | | | | | |
| USS Co. Ltd. | | | 3,200 | | | $ | 52,746 | |
| | |
| Biotechnology - 1.2% | | | | | | | | |
| Amgen, Inc. | | | 644 | | | $ | 89,761 | |
| | |
| Broadcasting - 0.5% | | | | | | | | |
| Television Broadcasts Ltd. | | | 6,300 | | | $ | 39,710 | |
| | |
| Cable TV - 1.2% | | | | | | | | |
| Liberty Global PLC, “A” (a) | | | 538 | | | $ | 23,494 | |
| Liberty Global PLC, “C” (a) | | | 538 | | | | 22,558 | |
| Time Warner Cable, Inc. | | | 160 | | | | 23,669 | |
| Ziggo N.V. | | | 378 | | | | 17,980 | |
| | | | | | | | |
| | | | | | | $ | 87,701 | |
| Computer Software - 0.3% | | | | | | | | |
| Dassault Systems S.A. | | | 357 | | | $ | 23,642 | |
| | |
| Computer Software - Systems - 0.6% | | | | | | | | |
| EMC Corp. | | | 587 | | | $ | 17,334 | |
| NICE Systems Ltd., ADR | | | 709 | | | | 27,942 | |
| | | | | | | | |
| | | | | | | $ | 45,276 | |
| Construction - 0.3% | | | | | | | | |
| Geberit AG | | | 63 | | | $ | 21,376 | |
| | |
| Consumer Products - 1.3% | | | | | | | | |
| Colgate-Palmolive Co. | | | 225 | | | $ | 14,564 | |
| Kimberly-Clark Corp. | | | 318 | | | | 34,344 | |
| Procter & Gamble Co. | | | 612 | | | | 50,863 | |
| | | | | | | | |
| | | | | | | $ | 99,771 | |
11
Portfolio of Investments – continued
| | | | | | | | |
| Issuer | | Shares/Par | | | Value ($) | |
| | | | | | | | |
| Common Stocks - continued | | | | | | | | |
| Electronics - 1.9% | | | | | | | | |
| Siliconware Precision Industries Co. Ltd., ADR | | | 5,621 | | | $ | 41,314 | |
| Taiwan Semiconductor Manufacturing Co. Ltd., ADR | | | 4,842 | | | | 101,391 | |
| | | | | | | | |
| | | | | | | $ | 142,705 | |
| Energy - Independent - 1.3% | | | | | | | | |
| Dragon Oil PLC | | | 1,296 | | | $ | 12,772 | |
| EQT Corp. | | | 407 | | | | 40,317 | |
| Range Resources Corp. | | | 538 | | | | 42,281 | |
| | | | | | | | |
| | | | | | | $ | 95,370 | |
| Energy - Integrated - 2.0% | | | | | | | | |
| Chevron Corp. | | | 189 | | | $ | 24,466 | |
| Exxon Mobil Corp. | | | 784 | | | | 77,977 | |
| Royal Dutch Shell PLC, “B” | | | 1,238 | | | | 52,317 | |
| | | | | | | | |
| | | | | | | $ | 154,760 | |
| Food & Beverages - 3.3% | | | | | | | | |
| Chr. Hansen Holding A.S. | | | 669 | | | $ | 27,214 | |
| General Mills, Inc. | | | 2,054 | | | | 109,643 | |
| House Foods Group, Inc. | | | 800 | | | | 14,348 | |
| Mondelez International, Inc. | | | 501 | | | | 18,131 | |
| Nestle S.A. | | | 366 | | | | 28,405 | |
| Sligro Food Group N.V. | | | 505 | | | | 19,953 | |
| Toyo Suisan Kaisha Ltd. | | | 1,000 | | | | 31,285 | |
| | | | | | | | |
| | | | | | | $ | 248,979 | |
| Food & Drug Stores - 2.3% | | | | | | | | |
| CVS Caremark Corp. | | | 234 | | | $ | 18,591 | |
| Dairy Farm International Holdings Ltd. | | | 1,800 | | | | 18,720 | |
| Kroger Co. | | | 1,118 | | | | 56,996 | |
| Lawson, Inc. | | | 600 | | | | 43,078 | |
| METRO, Inc., “A” | | | 221 | | | | 14,328 | |
| Sundrug Co. Ltd. | | | 500 | | | | 22,202 | |
| | | | | | | | |
| | | | | | | $ | 173,915 | |
| Gaming & Lodging - 0.6% | | | | | | | | |
| Norwegian Cruise Line Holdings Ltd. (a) | | | 663 | | | $ | 22,085 | |
| Paddy Power PLC | | | 397 | | | | 25,378 | |
| | | | | | | | |
| | | | | | | $ | 47,463 | |
| General Merchandise - 0.2% | | | | | | | | |
| Macy’s, Inc. | | | 221 | | | $ | 13,766 | |
| | |
| Insurance - 1.9% | | | | | | | | |
| Beazley Group PLC | | | 3,985 | | | $ | 16,672 | |
| Catlin Group Ltd. | | | 3,331 | | | | 28,424 | |
12
Portfolio of Investments – continued
| | | | | | | | |
| Issuer | | Shares/Par | | | Value ($) | |
| | | | | | | | |
| Common Stocks - continued | | | | | | | | |
| Insurance - continued | | | | | | | | |
| Intact Financial Corp. | | | 489 | | | $ | 33,371 | |
| Suncorp-Metway Ltd. | | | 3,945 | | | | 53,166 | |
| Travelers Cos., Inc. | | | 147 | | | | 13,922 | |
| | | | | | | | |
| | | | | | | $ | 145,555 | |
| Internet - 0.3% | | | | | | | | |
| Google, Inc., “A” (a) | | | 34 | | | $ | 19,800 | |
| | |
| Machinery & Tools - 0.2% | | | | | | | | |
| Schindler Holding AG | | | 123 | | | $ | 17,886 | |
| | |
| Major Banks - 1.7% | | | | | | | | |
| Bank of Nova Scotia | | | 330 | | | $ | 21,853 | |
| BOC Hong Kong Holdings Ltd. | | | 12,000 | | | | 40,335 | |
| Royal Bank of Canada | | | 244 | | | | 18,122 | |
| Sumitomo Mitsui Financial Group, Inc. | | | 800 | | | | 32,298 | |
| Wells Fargo & Co. | | | 267 | | | | 13,734 | |
| | | | | | | | |
| | | | | | | $ | 126,342 | |
| Medical & Health Technology & Services - 0.6% | | | | | | | | |
| Kobayashi Pharmaceutical Co. Ltd. | | | 500 | | | $ | 32,053 | |
| Miraca Holdings, Inc. | | | 300 | | | | 13,956 | |
| | | | | | | | |
| | | | | | | $ | 46,009 | |
| Medical Equipment - 1.0% | | | | | | | | |
| Abbott Laboratories | | | 378 | | | $ | 15,967 | |
| Fisher & Paykel Healthcare Corp. Ltd. | | | 13,353 | | | | 57,186 | |
| | | | | | | | |
| | | | | | | $ | 73,153 | |
| Natural Gas - Distribution - 0.4% | | | | | | | | |
| China Resources Gas Group Ltd. | | | 6,000 | | | $ | 17,458 | |
| Osaka Gas Co. Ltd. | | | 3,000 | | | | 12,341 | |
| | | | | | | | |
| | | | | | | $ | 29,799 | |
| Oil Services - 0.2% | | | | | | | | |
| Rowan Cos., Inc., “A” | | | 501 | | | $ | 15,190 | |
| | |
| Other Banks & Diversified Financials - 2.0% | | | | | | | | |
| China Construction Bank | | | 23,000 | | | $ | 17,094 | |
| Credicorp Ltd. | | | 152 | | | | 23,571 | |
| Discover Financial Services | | | 1,798 | | | | 112,141 | |
| | | | | | | | |
| | | | | | | $ | 152,806 | |
13
Portfolio of Investments – continued
| | | | | | | | |
| Issuer | | Shares/Par | | | Value ($) | |
| | | | | | | | |
| Common Stocks - continued | | | | | | | | |
| Pharmaceuticals - 3.7% | | | | | | | | |
| Johnson & Johnson | | | 709 | | | $ | 73,545 | |
| Novartis AG | | | 256 | | | | 22,963 | |
| Pfizer, Inc. | | | 2,092 | | | | 61,484 | |
| Roche Holding AG | | | 296 | | | | 86,313 | |
| Teva Pharmaceutical Industries Ltd., ADR | | | 715 | | | | 37,552 | |
| | | | | | | | |
| | | | | | | $ | 281,857 | |
| Railroad & Shipping - 0.3% | | | | | | | | |
| Canadian National Railway Co. | | | 355 | | | $ | 25,510 | |
| | |
| Real Estate - 0.8% | | | | | | | | |
| Allreal Holding AG | | | 244 | | | $ | 33,462 | |
| Champion, REIT | | | 57,000 | | | | 26,036 | |
| | | | | | | | |
| | | | | | | $ | 59,498 | |
| Restaurants - 1.2% | | | | | | | | |
| McDonald’s Corp. | | | 536 | | | $ | 50,234 | |
| Whitbread PLC | | | 522 | | | | 38,035 | |
| | | | | | | | |
| | | | | | | $ | 88,269 | |
| Specialty Chemicals - 0.5% | | | | | | | | |
| PolyOne Corp. | | | 317 | | | $ | 12,433 | |
| Symrise AG | | | 416 | | | | 22,225 | |
| | | | | | | | |
| | | | | | | $ | 34,658 | |
| Specialty Stores - 1.1% | | | | | | | | |
| Home Depot, Inc. | | | 267 | | | $ | 24,965 | |
| Inditex | | | 541 | | | | 15,674 | |
| Ross Stores, Inc. | | | 563 | | | | 42,461 | |
| | | | | | | | |
| | | | | | | $ | 83,100 | |
| Telecommunications - Wireless - 1.5% | | | | | | | | |
| Crown Castle International Corp. | | | 635 | | | $ | 50,489 | |
| KDDI Corp. | | | 500 | | | | 28,829 | |
| SBA Communications Corp. (a) | | | 338 | | | | 37,278 | |
| | | | | | | | |
| | | | | | | $ | 116,596 | |
| Telephone Services - 1.1% | | | | | | | | |
| BCE, Inc. | | | 318 | | | $ | 14,316 | |
| DiGi.Com Berhad | | | 23,100 | | | | 41,993 | |
| TDC A.S. | | | 2,072 | | | | 17,785 | |
| Verizon Communications, Inc. | | | 267 | | | | 13,302 | |
| | | | | | | | |
| | | | | | | $ | 87,396 | |
14
Portfolio of Investments – continued
| | | | | | | | |
| Issuer | | Shares/Par | | | Value ($) | |
| | | | | | | | |
| Common Stocks - continued | | | | | | | | |
| Tobacco - 0.6% | | | | | | | | |
| Altria Group, Inc. | | | 367 | | | $ | 15,810 | |
| Japan Tobacco, Inc. | | | 400 | | | | 13,702 | |
| Lorillard, Inc. | | | 325 | | | | 19,403 | |
| | | | | | | | |
| | | | | | | $ | 48,915 | |
| Utilities - Electric Power - 3.0% | | | | | | | | |
| Alliant Energy Corp. | | | 244 | | | $ | 14,272 | |
| American Electric Power Co., Inc. | | | 477 | | | | 25,615 | |
| Cheung Kong Infrastructure Holdings Ltd. | | | 9,000 | | | | 64,974 | |
| Consolidated Edison, Inc. | | | 330 | | | | 19,104 | |
| Dominion Resources, Inc. | | | 195 | | | | 13,693 | |
| Duke Energy Corp. | | | 256 | | | | 18,941 | |
| Hongkong Electric Holdings Ltd. | | | 2,000 | | | | 18,219 | |
| PG&E Corp. | | | 1,188 | | | | 55,218 | |
| | | | | | | | |
| | | | | | | $ | 230,036 | |
| Total Common Stocks (Identified Cost, $2,956,629) | | | | | | $ | 3,126,690 | |
| | |
| Money Market Funds - 1.7% | | | | | | | | |
MFS Institutional Money Market Portfolio, 0.09%,
at Cost and Net Asset Value (v) | | | 128,237 | | | $ | 128,237 | |
| Total Investments (Identified Cost, $3,084,866) | | | | | | $ | 3,254,927 | |
| | |
| Other Assets, Less Liabilities - 57.1% | | | | | | | 4,335,443 | |
| Net Assets - 100.0% | | | | | | $ | 7,590,370 | |
| (a) | Non-income producing security. |
| (v) | Underlying affiliated fund that is available only to investment companies managed by MFS. The rate quoted for the MFS Institutional Money Market Portfolio is the annualized seven-day yield of the fund at period end. |
The following abbreviations are used in this report and are defined:
| ADR | | American Depositary Receipt |
| PLC | | Public Limited Company |
| REIT | | Real Estate Investment Trust |
See Notes to Financial Statements
15
Financial Statements
STATEMENT OF ASSETS AND LIABILITIES
At 8/31/14
This statement represents your fund’s balance sheet, which details the assets and liabilities comprising the total value of the fund.
| | | | |
| Assets | | | | |
Investments- | | | | |
Non-affiliated issuers, at value (identified cost, $2,956,629) | | | $3,126,690 | |
Underlying affiliated funds, at cost and value | | | 128,237 | |
Total investments, at value (identified cost, $3,084,866) | | | $3,254,927 | |
Cash | | | 166 | |
Foreign currency, at value (identified cost, $184) | | | 184 | |
Receivables for | | | | |
Fund shares sold | | | 4,428,122 | |
Interest and dividends | | | 11,604 | |
Receivable from distributor | | | 5 | |
Total assets | | | $7,695,008 | |
| Liabilities | | | | |
Payable for fund shares reacquired | | | $40 | |
Payable to affiliates | | | | |
Investment adviser | | | 65,937 | |
Shareholder servicing costs | | | 165 | |
Payable for independent Trustees’ compensation | | | 3 | |
Accrued expenses and other liabilities | | | 38,493 | |
Total liabilities | | | $104,638 | |
Net assets | | | $7,590,370 | |
| Net assets consist of | | | | |
Paid-in capital | | | $7,364,621 | |
Unrealized appreciation (depreciation) on investments and translation of assets and liabilities in foreign currencies | | | 170,024 | |
Accumulated net realized gain (loss) on investments and foreign currency | | | 46,984 | |
Undistributed net investment income | | | 8,741 | |
Net assets | | | $7,590,370 | |
Shares of beneficial interest outstanding | | | 695,063 | |
16
Statement of Assets and Liabilities – continued
| | | | | | | | | | | | |
| | | Net assets | | | Shares
outstanding | | | Net asset value
per share (a) | |
Class A | | | $799,895 | | | | 73,272 | | | | $10.92 | |
Class B | | | 116,478 | | | | 10,681 | | | | 10.91 | |
Class C | | | 130,402 | | | | 11,958 | | | | 10.91 | |
Class I | | | 138,103 | | | | 12,639 | | | | 10.93 | |
Class R1 | | | 109,453 | | | | 10,037 | | | | 10.91 | |
Class R2 | | | 109,859 | | | | 10,063 | | | | 10.92 | |
Class R3 | | | 110,062 | | | | 10,077 | | | | 10.92 | |
Class R4 | | | 110,266 | | | | 10,091 | | | | 10.93 | |
Class R5 | | | 5,965,852 | | | | 546,245 | | | | 10.92 | |
| (a) | Maximum offering price per share was equal to the net asset value per share for all share classes, except for Class A, for which the maximum offering price per share was $11.59 [100 / 94.25 x $10.92]. On sales of $50,000 or more, the maximum offering price of Class A shares is reduced. A contingent deferred sales charge may be imposed on redemptions of Class A, Class B, and Class C shares. Redemption price per share was equal to the net asset value per share for Classes I, R1, R2, R3, R4, and R5. |
See Notes to Financial Statements
17
Financial Statements
STATEMENT OF OPERATIONS
Period ended 8/31/14 (c)
This statement describes how much your fund earned in investment income and accrued in expenses. It also describes any gains and/or losses generated by fund operations.
| | | | |
| Net investment income | | | | |
Income | | | | |
Dividends | | | $56,940 | |
Dividends from underlying affiliated funds | | | 69 | |
Foreign taxes withheld | | | (2,472 | ) |
Total investment income | | | $54,537 | |
Expenses | | | | |
Management fee | | | $16,963 | |
Distribution and service fees | | | 3,550 | |
Shareholder servicing costs | | | 548 | |
Administrative services fee | | | 12,947 | |
Independent Trustees’ compensation | | | 686 | |
Custodian fee | | | 16,342 | |
Shareholder communications | | | 5,834 | |
Audit and tax fees | | | 30,995 | |
Legal fees | | | 17 | |
Registration fees | | | 14,956 | |
Miscellaneous | | | 10,728 | |
Total expenses | | | $113,566 | |
Fees paid indirectly | | | (1 | ) |
Reduction of expenses by investment adviser and distributor | | | (90,226 | ) |
Net expenses | | | $23,339 | |
Net investment income | | | $31,198 | |
| Realized and unrealized gain (loss) on investments and foreign currency | | | | |
Realized gain (loss) (identified cost basis) | | | | |
Investments | | | $47,128 | |
Foreign currency | | | (2,240 | ) |
Net realized gain (loss) on investments and foreign currency | | | $44,888 | |
Change in unrealized appreciation (depreciation) | | | | |
Investments | | | $170,061 | |
Translation of assets and liabilities in foreign currencies | | | (37 | ) |
Net unrealized gain (loss) on investments and foreign currency translation | | | $170,024 | |
Net realized and unrealized gain (loss) on investments and foreign currency | | | $214,912 | |
Change in net assets from operations | | | $246,110 | |
| (c) | For the period from the commencement of the fund’s investment operations, December 5, 2013, through the stated period end. |
See Notes to Financial Statements
18
Financial Statements
STATEMENT OF CHANGES IN NET ASSETS
This statement describes the increases and/or decreases in net assets resulting from operations, any distributions, and any shareholder transactions.
| | | | |
| | | Period ended | |
| | | 8/31/14 (c) | |
| Change in net assets | | | |
| From operations | | | | |
Net investment income | | | $31,198 | |
Net realized gain (loss) on investments and foreign currency | | | 44,888 | |
Net unrealized gain (loss) on investments and foreign currency translation | | | 170,024 | |
Change in net assets from operations | | | $246,110 | |
| Distributions declared to shareholders | | | | |
From net investment income | | | $(21,333 | ) |
Change in net assets from fund share transactions | | | $7,365,593 | |
Total change in net assets | | | $7,590,370 | |
| Net assets | | | | |
At beginning of period | | | — | |
At end of period (including undistributed net investment income of $8,741) | | | $7,590,370 | |
| (c) | For the period from the commencement of the fund’s investment operations, December 5, 2013, through the stated period end. |
See Notes to Financial Statements
19
Financial Statements
FINANCIAL HIGHLIGHTS
The financial highlights table is intended to help you understand the fund’s financial performance for the past 5 years (or life of a particular share class, if shorter). Certain information reflects financial results for a single fund share. The total returns in the table represent the rate by which an investor would have earned (or lost) on an investment in the fund share class (assuming reinvestment of all distributions) held for the entire period.
| | | | |
| Class A | | Period ended
8/31/14 (c) | |
Net asset value, beginning of period | | | $10.00 | |
| Income (loss) from investment operations | | | | |
Net investment income (d) | | | $0.15 | |
Net realized and unrealized gain (loss) on investments and foreign currency | | | 0.86 | |
Total from investment operations | | | $1.01 | |
| Less distributions declared to shareholders | | | | |
From net investment income | | | $(0.09 | ) |
Net asset value, end of period (x) | | | $10.92 | |
Total return (%) (r)(s)(t)(x) | | | 10.13 | (n) |
Ratios (%) (to average net assets)
and Supplemental data: | | | | |
Expenses before expense reductions (f) | | | 5.81 | (a) |
Expenses after expense reductions (f) | | | 1.22 | (a) |
Net investment income | | | 1.86 | (a) |
Portfolio turnover | | | 28 | (n) |
Net assets at end of period (000 omitted) | | | $800 | |
See Notes to Financial Statements
20
Financial Highlights – continued
| | | | |
| Class B | | Period ended
8/31/14 (c) | |
Net asset value, beginning of period | | | $10.00 | |
| Income (loss) from investment operations | | | | |
Net investment income (d) | | | $0.06 | |
Net realized and unrealized gain (loss) on investments and foreign currency | | | 0.89 | |
Total from investment operations | | | $0.95 | |
| Less distributions declared to shareholders | | | | |
From net investment income | | | $(0.04 | ) |
Net asset value, end of period (x) | | | $10.91 | |
Total return (%) (r)(s)(t)(x) | | | 9.50 | (n) |
Ratios (%) (to average net assets)
and Supplemental data: | | | | |
Expenses before expense reductions (f) | | | 6.87 | (a) |
Expenses after expense reductions (f) | | | 2.07 | (a) |
Net investment income | | | 0.80 | (a) |
Portfolio turnover | | | 28 | (n) |
Net assets at end of period (000 omitted) | | | $116 | |
| |
| Class C | | Period ended
8/31/14 (c) | |
Net asset value, beginning of period | | | $10.00 | |
| Income (loss) from investment operations | | | | |
Net investment income (d) | | | $0.06 | |
Net realized and unrealized gain (loss) on investments and foreign currency | | | 0.89 | |
Total from investment operations | | | $0.95 | |
| Less distributions declared to shareholders | | | | |
From net investment income | | | $(0.04 | ) |
Net asset value, end of period (x) | | | $10.91 | |
Total return (%) (r)(s)(t)(x) | | | 9.50 | (n) |
Ratios (%) (to average net assets)
and Supplemental data: | | | | |
Expenses before expense reductions (f) | | | 6.85 | (a) |
Expenses after expense reductions (f) | | | 2.07 | (a) |
Net investment income | | | 0.82 | (a) |
Portfolio turnover | | | 28 | (n) |
Net assets at end of period (000 omitted) | | | $130 | |
See Notes to Financial Statements
21
Financial Highlights – continued
| | | | |
| Class I | | Period ended
8/31/14 (c) | |
Net asset value, beginning of period | | | $10.00 | |
| Income (loss) from investment operations | | | | |
Net investment income (d) | | | $0.14 | |
Net realized and unrealized gain (loss) on investments and foreign currency | | | 0.89 | |
Total from investment operations | | | $1.03 | |
| Less distributions declared to shareholders | | | | |
From net investment income | | | $(0.10 | ) |
Net asset value, end of period (x) | | | $10.93 | |
Total return (%) (r)(s)(x) | | | 10.29 | (n) |
Ratios (%) (to average net assets)
and Supplemental data: | | | | |
Expenses before expense reductions (f) | | | 5.85 | (a) |
Expenses after expense reductions (f) | | | 1.07 | (a) |
Net investment income | | | 1.81 | (a) |
Portfolio turnover | | | 28 | (n) |
Net assets at end of period (000 omitted) | | | $138 | |
| |
| Class R1 | | Period ended
8/31/14 (c) | |
Net asset value, beginning of period | | | $10.00 | |
| Income (loss) from investment operations | | | | |
Net investment income (d) | | | $0.06 | |
Net realized and unrealized gain (loss) on investments and foreign currency | | | 0.89 | |
Total from investment operations | | | $0.95 | |
| Less distributions declared to shareholders | | | | |
From net investment income | | | $(0.04 | ) |
Net asset value, end of period (x) | | | $10.91 | |
Total return (%) (r)(s)(x) | | | 9.50 | (n) |
Ratios (%) (to average net assets)
and Supplemental data: | | | | |
Expenses before expense reductions (f) | | | 6.89 | (a) |
Expenses after expense reductions (f) | | | 2.07 | (a) |
Net investment income | | | 0.79 | (a) |
Portfolio turnover | | | 28 | (n) |
Net assets at end of period (000 omitted) | | | $109 | |
See Notes to Financial Statements
22
Financial Highlights – continued
| | | | |
| Class R2 | | Period ended
8/31/14 (c) | |
Net asset value, beginning of period | | | $10.00 | |
| Income (loss) from investment operations | | | | |
Net investment income (d) | | | $0.10 | |
Net realized and unrealized gain (loss) on investments and foreign currency | | | 0.89 | |
Total from investment operations | | | $0.99 | |
| Less distributions declared to shareholders | | | | |
From net investment income | | | $(0.07 | ) |
Net asset value, end of period (x) | | | $10.92 | |
Total return (%) (r)(s)(x) | | | 9.89 | (n) |
Ratios (%) (to average net assets)
and Supplemental data: | | | | |
Expenses before expense reductions (f) | | | 6.39 | (a) |
Expenses after expense reductions (f) | | | 1.57 | (a) |
Net investment income | | | 1.29 | (a) |
Portfolio turnover | | | 28 | (n) |
Net assets at end of period (000 omitted) | | | $110 | |
| |
| Class R3 | | Period ended
8/31/14 (c) | |
Net asset value, beginning of period | | | $10.00 | |
| Income (loss) from investment operations | | | | |
Net investment income (d) | | | $0.12 | |
Net realized and unrealized gain (loss) on investments and foreign currency | | | 0.88 | |
Total from investment operations | | | $1.00 | |
| Less distributions declared to shareholders | | | | |
From net investment income | | | $(0.08 | ) |
Net asset value, end of period (x) | | | $10.92 | |
Total return (%) (r)(s)(x) | | | 10.04 | (n) |
Ratios (%) (to average net assets)
and Supplemental data: | | | | |
Expenses before expense reductions (f) | | | 6.14 | (a) |
Expenses after expense reductions (f) | | | 1.32 | (a) |
Net investment income | | | 1.54 | (a) |
Portfolio turnover | | | 28 | (n) |
Net assets at end of period (000 omitted) | | | $110 | |
See Notes to Financial Statements
23
Financial Highlights – continued
| | | | |
| Class R4 | | Period ended
8/31/14 (c) | |
Net asset value, beginning of period | | | $10.00 | |
| Income (loss) from investment operations | | | | |
Net investment income (d) | | | $0.14 | |
Net realized and unrealized gain (loss) on investments and foreign currency | | | 0.89 | |
Total from investment operations | | | $1.03 | |
| Less distributions declared to shareholders | | | | |
From net investment income | | | $(0.10 | ) |
Net asset value, end of period (x) | | | $10.93 | |
Total return (%) (r)(s)(x) | | | 10.29 | (n) |
Ratios (%) (to average net assets)
and Supplemental data: | | | | |
Expenses before expense reductions (f) | | | 5.89 | (a) |
Expenses after expense reductions (f) | | | 1.07 | (a) |
Net investment income | | | 1.79 | (a) |
Portfolio turnover | | | 28 | (n) |
Net assets at end of period (000 omitted) | | | $110 | |
| |
| Class R5 | | Period ended
8/31/14 (c) | |
Net asset value, beginning of period | | | $10.00 | |
| Income (loss) from investment operations | | | | |
Net investment income (d) | | | $0.14 | |
Net realized and unrealized gain (loss) on investments and foreign currency | | | 0.88 | |
Total from investment operations | | | $1.02 | |
| Less distributions declared to shareholders | | | | |
From net investment income | | | $(0.10 | ) |
Net asset value, end of period (x) | | | $10.92 | |
Total return (%) (r)(s)(x) | | | 10.21 | (n) |
Ratios (%) (to average net assets)
and Supplemental data: | | | | |
Expenses before expense reductions (f) | | | 5.88 | (a) |
Expenses after expense reductions (f) | | | 1.06 | (a) |
Net investment income | | | 1.80 | (a) |
Portfolio turnover | | | 28 | (n) |
Net assets at end of period (000 omitted) | | | $5,966 | |
See Notes to Financial Statements
24
Financial Highlights – continued
| (c) | For the period from the commencement of the fund’s investment operations, December 5, 2013, through the stated period end. |
| (d) | Per share data is based on average shares outstanding. |
| (f) | Ratios do not reflect reductions from fees paid indirectly, if applicable. |
| (r) | Certain expenses have been reduced without which performance would have been lower. |
| (s) | From time to time the fund may receive proceeds from litigation settlements, without which performance would be lower. |
| (t) | Total returns do not include any applicable sales charges. |
| (x) | The net asset values per share and total returns have been calculated on net asset values which include adjustments made in accordance with U.S. generally accepted accounting principles required at period end for financial reporting purposes. |
See Notes to Financial Statements
25
NOTES TO FINANCIAL STATEMENTS
(1) Business and Organization
MFS Low Volatility Global Equity Fund (the fund) is a diversified series of MFS Series Trust I (the trust). The trust is organized as a Massachusetts business trust and is registered under the Investment Company Act of 1940, as amended, as an open-end management investment company.
The fund is an investment company and accordingly follows the investment company accounting and reporting guidance of the Financial Accounting Standards Board (FASB) Accounting Standards Codification Topic 946 Financial Services – Investment Companies.
(2) Significant Accounting Policies
General – The preparation of financial statements in conformity with U.S. generally accepted accounting principles requires management to make estimates and assumptions that affect the reported amounts of assets and liabilities, and disclosure of contingent assets and liabilities at the date of the financial statements and the reported amounts of increases and decreases in net assets from operations during the reporting period. Actual results could differ from those estimates. In the preparation of these financial statements, management has evaluated subsequent events occurring after the date of the fund’s Statement of Assets and Liabilities through the date that the financial statements were issued. The fund invests in foreign securities. Investments in foreign securities are vulnerable to the effects of changes in the relative values of the local currency and the U.S. dollar and to the effects of changes in each country’s legal, political, and economic environment.
In June 2014, FASB issued Accounting Standards Update 2014-11, Transfers and Servicing (Topic 860) – Repurchase-to-Maturity Transactions, Repurchase Financings, and Disclosures (“ASU 2014-11”). ASU 2014-11 changes the accounting for repurchase-to-maturity transactions (i.e., repurchase agreements that settle at the same time as the maturity of the transferred financial asset) and enhances the required disclosures for repurchase agreements and other similar transactions. Although still evaluating the potential impacts of ASU 2014-11 to the fund, management expects that the impact of the fund’s adoption will be limited to additional financial statement disclosures which would first be effective for interim reporting periods beginning after March 15, 2015.
Balance Sheet Offsetting – The fund’s accounting policy with respect to balance sheet offsetting is that, absent an event of default by the counterparty or a termination of the agreement, the International Swaps and Derivatives Association (ISDA) Master Agreement does not result in an offset of reported amounts of financial assets and financial liabilities in the Statement of Assets and Liabilities across transactions between the fund and the applicable counterparty. The fund’s right to setoff may be restricted or prohibited by the bankruptcy or insolvency laws of the particular jurisdiction to which a specific master netting agreement counterparty is subject. Balance sheet offsetting disclosures, to the extent applicable to the fund, have been included in the fund’s Significant Accounting Policies note under the captions for each of the fund’s in-scope financial instruments and transactions.
26
Notes to Financial Statements – continued
Investment Valuations – Equity securities, including restricted equity securities, are generally valued at the last sale or official closing price as provided by a third-party pricing service on the market or exchange on which they are primarily traded. Equity securities, for which there were no sales reported that day, are generally valued at the last quoted daily bid quotation as provided by a third-party pricing service on the market or exchange on which such securities are primarily traded. Short-term instruments with a maturity at issuance of 60 days or less generally are valued at amortized cost, which approximates market value. Open-end investment companies are generally valued at net asset value per share. Securities and other assets generally valued on the basis of information from a third-party pricing service may also be valued at a broker/dealer bid quotation. Values obtained from third-party pricing services can utilize both transaction data and market information such as yield, quality, coupon rate, maturity, type of issue, trading characteristics, and other market data. The values of foreign securities and other assets and liabilities expressed in foreign currencies are converted to U.S. dollars using the mean of bid and asked prices for rates provided by a third-party pricing service.
The Board of Trustees has delegated primary responsibility for determining or causing to be determined the value of the fund’s investments (including any fair valuation) to the adviser pursuant to valuation policies and procedures approved by the Board. If the adviser determines that reliable market quotations are not readily available, investments are valued at fair value as determined in good faith by the adviser in accordance with such procedures under the oversight of the Board of Trustees. Under the fund’s valuation policies and procedures, market quotations are not considered to be readily available for most types of debt instruments and floating rate loans and many types of derivatives. These investments are generally valued at fair value based on information from third-party pricing services. In addition, investments may be valued at fair value if the adviser determines that an investment’s value has been materially affected by events occurring after the close of the exchange or market on which the investment is principally traded (such as foreign exchange or market) and prior to the determination of the fund’s net asset value, or after the halting of trading of a specific security where trading does not resume prior to the close of the exchange or market on which the security is principally traded. Events that occur on a frequent basis after foreign markets close (such as developments in foreign markets and significant movements in the U.S. markets) and prior to the determination of the fund’s net asset value may be deemed to have a material effect on the value of securities traded in foreign markets. Accordingly, the fund’s foreign equity securities may often be valued at fair value. The adviser generally relies on third-party pricing services or other information (such as the correlation with price movements of similar securities in the same or other markets; the type, cost and investment characteristics of the security; the business and financial condition of the issuer; and trading and other market data) to assist in determining whether to fair value and at what value to fair value an investment. The value of an investment for purposes of calculating the fund’s net asset value can differ depending on the source and method used to determine value. When fair valuation is used, the value of an investment used to determine the fund’s net asset value may differ from quoted or published prices for the same investment. There can be no assurance that the fund could obtain the fair value assigned to an investment if it were to sell the investment at the same time at which the fund determines its net asset value per share.
27
Notes to Financial Statements – continued
Various inputs are used in determining the value of the fund’s assets or liabilities. These inputs are categorized into three broad levels. In certain cases, the inputs used to measure fair value may fall into different levels of the fair value hierarchy. In such cases, an investment’s level within the fair value hierarchy is based on the lowest level of input that is significant to the fair value measurement. The fund’s assessment of the significance of a particular input to the fair value measurement in its entirety requires judgment, and considers factors specific to the investment. Level 1 includes unadjusted quoted prices in active markets for identical assets or liabilities. Level 2 includes other significant observable market-based inputs (including quoted prices for similar securities, interest rates, prepayment speed, and credit risk). Level 3 includes unobservable inputs, which may include the adviser’s own assumptions in determining the fair value of investments. The following is a summary of the levels used as of August 31, 2014 in valuing the fund’s assets or liabilities:
| | | | | | | | | | | | | | | | |
| Investments at Value | | Level 1 | | | Level 2 | | | Level 3 | | | Total | |
| Equity Securities | | | $3,126,690 | | | | $— | | | | $— | | | | $3,126,690 | |
| Mutual Funds | | | 128,237 | | | | — | | | | — | | | | 128,237 | |
| Total Investments | | | $3,254,927 | | | | $— | | | | $— | | | | $3,254,927 | |
For further information regarding security characteristics, see the Portfolio of Investments.
Foreign Currency Translation – Purchases and sales of foreign investments, income, and expenses are converted into U.S. dollars based upon currency exchange rates prevailing on the respective dates of such transactions or on the reporting date for foreign denominated receivables and payables. Gains and losses attributable to foreign currency exchange rates on sales of securities are recorded for financial statement purposes as net realized gains and losses on investments. Gains and losses attributable to foreign exchange rate movements on receivables, payables, income and expenses are recorded for financial statement purposes as foreign currency transaction gains and losses. That portion of both realized and unrealized gains and losses on investments that results from fluctuations in foreign currency exchange rates is not separately disclosed.
Indemnifications – Under the fund’s organizational documents, its officers and Trustees may be indemnified against certain liabilities and expenses arising out of the performance of their duties to the fund. Additionally, in the normal course of business, the fund enters into agreements with service providers that may contain indemnification clauses. The fund’s maximum exposure under these agreements is unknown as this would involve future claims that may be made against the fund that have not yet occurred.
Investment Transactions and Income – Investment transactions are recorded on the trade date. Dividends received in cash are recorded on the ex-dividend date. Certain dividends from foreign securities will be recorded when the fund is informed of the dividend if such information is obtained subsequent to the ex-dividend date. Dividend payments received in additional securities are recorded on the ex-dividend date in an amount equal to the value of the security on such date.
The fund may receive proceeds from litigation settlements. Any proceeds received from litigation involving portfolio holdings are reflected in the Statement of Operations in
28
Notes to Financial Statements – continued
realized gain/loss if the security has been disposed of by the fund or in unrealized gain/loss if the security is still held by the fund. Any other proceeds from litigation not related to portfolio holdings are reflected as other income in the Statement of Operations.
Fees Paid Indirectly – The fund’s custody fee may be reduced according to an arrangement that measures the value of cash deposited with the custodian by the fund. This amount, for the period ended August 31, 2014, is shown as a reduction of total expenses in the Statement of Operations.
Tax Matters and Distributions – The fund intends to qualify as a regulated investment company, as defined under Subchapter M of the Internal Revenue Code, and to distribute all of its taxable income, including realized capital gains. As a result, no provision for federal income tax is required. The fund’s federal tax returns, when filed, will remain subject to examination by the Internal Revenue Service for a three year period. Management has analyzed the fund’s tax positions taken on federal and state tax returns for all open tax years and does not believe that there are any uncertain tax positions that require recognition of a tax liability. Foreign taxes, if any, have been accrued by the fund in the accompanying financial statements in accordance with the applicable foreign tax law. Foreign income taxes may be withheld by certain countries in which the fund invests. Additionally, capital gains realized by the fund on securities issued in or by certain foreign countries may be subject to capital gains tax imposed by those countries.
Distributions to shareholders are recorded on the ex-dividend date. Income and capital gain distributions are determined in accordance with income tax regulations, which may differ from U.S. generally accepted accounting principles. Certain capital accounts in the financial statements are periodically adjusted for permanent differences in order to reflect their tax character. These adjustments have no impact on net assets or net asset value per share. Temporary differences which arise from recognizing certain items of income, expense, gain or loss in different periods for financial statement and tax purposes will reverse at some time in the future. Distributions in excess of net investment income or net realized gains are temporary overdistributions for financial statement purposes resulting from differences in the recognition or classification of income or distributions for financial statement and tax purposes.
During the period ended August 31, 2014, there were no significant adjustments due to differences between book and tax accounting.
The tax character of distributions declared to shareholders for the last fiscal period is as follows:
| | | | |
| | | 8/31/14 | |
| Ordinary income (including any short-term capital gains) | | | $21,333 | |
29
Notes to Financial Statements – continued
The federal tax cost and the tax basis components of distributable earnings were as follows:
| | | | |
| As of 8/31/14 | | | |
| Cost of investments | | | $3,085,056 | |
| Gross appreciation | | | 208,129 | |
| Gross depreciation | | | (38,258 | ) |
| Net unrealized appreciation (depreciation) | | | $169,871 | |
| |
| Undistributed ordinary income | | | 55,915 | |
| Other temporary differences | | | (37 | ) |
Multiple Classes of Shares of Beneficial Interest – The fund offers multiple classes of shares, which differ in their respective distribution and service fees. The fund’s income, realized and unrealized gain (loss), and common expenses are allocated to shareholders based on the daily net assets of each class. Dividends are declared separately for each class. Differences in per share dividend rates are generally due to differences in separate class expenses. Class B shares will convert to Class A shares approximately eight years after purchase. The fund’s distributions declared to shareholders as reported in the Statement of Changes in Net Assets are presented by class as follows:
| | | | |
| | | From net investment
income | |
| | | Period
ended
8/31/14 (c) | |
| Class A | | | $2,891 | |
| Class B | | | 389 | |
| Class C | | | 403 | |
| Class I | | | 1,071 | |
| Class R1 | | | 389 | |
| Class R2 | | | 673 | |
| Class R3 | | | 816 | |
| Class R4 | | | 959 | |
| Class R5 | | | 13,742 | |
| Total | | | $21,333 | |
| (c) | For the period from the commencement of the fund’s investment operations, December 5, 2013, through the stated period end. |
(3) Transactions with Affiliates
Investment Adviser – The fund has an investment advisory agreement with MFS to provide overall investment management and related administrative services and facilities to the fund. The management fee is computed daily and paid monthly at the following annual rates:
| | | | |
| First $1 billion of average daily net assets | | | 0.90 | % |
| Next $1.5 billion of average daily net assets | | | 0.75 | % |
| Average daily net assets in excess of $2.5 billion | | | 0.65 | % |
MFS has agreed in writing to reduce its management fee to 0.75% of average daily net assets for the first $1 billion, and 0.70% of average daily net assets in excess of
30
Notes to Financial Statements – continued
$1 billion. This written agreement will continue until modified by the fund’s Board of Trustees, but such agreement will continue at least until December 31, 2015. For the period ended August 31, 2014, this management fee reduction amounted to $2,827, which is included in the reduction of total expenses in the Statement of Operations. MFS has also agreed in writing to reduce its management fee by a specified amount if certain MFS mutual fund assets exceed thresholds agreed to by MFS and the fund’s Board of Trustees. For the period ended August 31, 2014, this management fee reduction amounted to $73, which is included in the reduction of total expenses in the Statement of Operations. The management fee incurred for the period ended August 31, 2014 was equivalent to an annual effective rate of 0.75% of the fund’s average daily net assets.
The investment adviser has agreed in writing to pay a portion of the fund’s total annual operating expenses, exclusive of interest, taxes, extraordinary expenses, brokerage and transaction costs, and investment-related expenses, such that total fund operating expenses do not exceed the following rates annually of each class’s average daily net assets:
| | | | | | | | | | | | | | | | |
| Classes |
| A | | B | | C | | I | | R1 | | R2 | | R3 | | R4 | | R5 |
| 1.35% | | 2.10% | | 2.10% | | 1.10% | | 2.10% | | 1.60% | | 1.35% | | 1.10% | | 1.06% |
This written agreement will continue until modified by the fund’s Board of Trustees, but such agreement will continue at least until December 31, 2015. For the period ended August 31, 2014, this reduction amounted to $87,079 and is included in the reduction of total expenses in the Statement of Operations.
Distributor – MFS Fund Distributors, Inc. (MFD), a wholly-owned subsidiary of MFS, as distributor, received $2,993 for the period ended August 31, 2014, as its portion of the initial sales charge on sales of Class A shares of the fund.
The Board of Trustees has adopted a distribution plan for certain share classes pursuant to Rule 12b-1 of the Investment Company Act of 1940.
The fund’s distribution plan provides that the fund will pay MFD for services provided by MFD and financial intermediaries in connection with the distribution and servicing of certain share classes. One component of the plan is a distribution fee paid to MFD and another component of the plan is a service fee paid to MFD. MFD may subsequently pay all, or a portion, of the distribution and/or service fees to financial intermediaries.
Distribution Plan Fee Table:
| | | | | | | | | | | | | | | | | | | | |
| | | Distribution
Fee Rate (d) | | | Service
Fee Rate (d) | | | Total
Distribution
Plan (d) | | | Annual
Effective
Rate (e) | | | Distribution
and Service
Fee | |
| Class A | | | — | | | | 0.25% | | | | 0.25% | | | | 0.15% | | | | $618 | |
| Class B | | | 0.75% | | | | 0.25% | | | | 1.00% | | | | 1.00% | | | | 781 | |
| Class C | | | 0.75% | | | | 0.25% | | | | 1.00% | | | | 1.00% | | | | 799 | |
| Class R1 | | | 0.75% | | | | 0.25% | | | | 1.00% | | | | 1.00% | | | | 772 | |
| Class R2 | | | 0.25% | | | | 0.25% | | | | 0.50% | | | | 0.50% | | | | 386 | |
| Class R3 | | | — | | | | 0.25% | | | | 0.25% | | | | 0.25% | | | | 194 | |
| Total Distribution and Service Fees | | | | | | | | | | | | $3,550 | |
31
Notes to Financial Statements – continued
| (d) | In accordance with the distribution plan for certain classes, the fund pays distribution and/or service fees equal to these annual percentage rates of each class’s average daily net assets. The distribution and service fee rates disclosed by class represent the current rates in effect at the end of the reporting period. Any rate changes, if applicable, are detailed below. |
| (e) | MFD has voluntarily agreed to rebate a portion of each class’s 0.25% service fee attributable to accounts for which MFD retains the 0.25% service fee except for accounts attributable to MFS or its affiliates’ seed money. For the period ended August 31, 2014, this rebate amounted to $243 for Class A and is included in the reduction of total expenses in the Statement of Operations. |
Certain Class A shares are subject to a contingent deferred sales charge (CDSC) in the event of a shareholder redemption within 18 months of purchase. Class C shares are subject to a CDSC in the event of a shareholder redemption within 12 months of purchase. Class B shares are subject to a CDSC in the event of a shareholder redemption within six years of purchase. There were no contingent deferred sales charges imposed during the period ended August 31, 2014.
Shareholder Servicing Agent – MFS Service Center, Inc. (MFSC), a wholly-owned subsidiary of MFS, receives a fee from the fund for its services as shareholder servicing agent calculated as a percentage of the average daily net assets of the fund as determined periodically under the supervision of the fund’s Board of Trustees. For the period ended August 31, 2014, the fee was $330 which equated to 0.0175% annually of the fund’s average daily net assets. MFSC also receives payment from the fund for out-of-pocket expenses, sub-accounting and other shareholder servicing costs which may be paid to affiliated and unaffiliated service providers. Class R5 shares do not incur sub-accounting fees. For the period ended August 31, 2014, these out-of-pocket expenses, sub-accounting and other shareholder servicing costs amounted to $218.
Administrator – MFS provides certain financial, legal, shareholder communications, compliance, and other administrative services to the fund. Under an administrative services agreement, the fund partially reimburses MFS the costs incurred to provide these services. The fund is charged an annual fixed amount of $17,500 plus a fee based on average daily net assets. The administrative services fee incurred for the period ended August 31, 2014 was equivalent to an annual effective rate of 0.6865% of the fund’s average daily net assets.
Trustees’ and Officers’ Compensation – The fund pays compensation to independent Trustees in the form of a retainer, attendance fees, and additional compensation to Board and Committee chairpersons. The fund does not pay compensation directly to Trustees or officers of the fund who are also officers of the investment adviser, all of whom receive remuneration for their services to the fund from MFS. Certain officers and Trustees of the fund are officers or directors of MFS, MFD, and MFSC.
Other – This fund and certain other funds managed by MFS (the funds) have entered into services agreements (the Agreements) which provide for payment of fees by the funds to Tarantino LLC and Griffin Compliance LLC in return for the provision of services of an Independent Chief Compliance Officer (ICCO) and Assistant ICCO, respectively, for the funds. The funds can terminate the Agreements with Tarantino LLC and Griffin Compliance LLC at any time under the terms of the Agreements. The ICCO is an officer of the funds and the sole member of Tarantino LLC. Prior to
32
Notes to Financial Statements – continued
June 1, 2014, Robyn L. Griffin served as the Assistant ICCO and was an officer of the funds. Ms. Griffin is the sole member of Griffin Compliance LLC. Effective May 31, 2014, Ms. Griffin resigned as Assistant ICCO and the service agreement between the funds and Griffin Compliance LLC was terminated. For the period ended August 31, 2014, the aggregate fees paid by the fund to Tarantino LLC and Griffin Compliance LLC were $8 and are included in “Miscellaneous” expense in the Statement of Operations. MFS has agreed to reimburse the fund for a portion of the payments made by the fund in the amount of $4, which is included in the reduction of total expenses in the Statement of Operations. Additionally, MFS has agreed to bear all expenses associated with office space, other administrative support, and supplies provided to the ICCO and Assistant ICCO.
The fund invests in the MFS Institutional Money Market Portfolio which is managed by MFS and seeks current income consistent with preservation of capital and liquidity. Income earned on this investment is included in “Dividends from underlying affiliated funds” in the Statement of Operations. This money market fund does not pay a management fee to MFS.
On December 5, 2013, MFS purchased 140,000 shares of Class R5 and 10,000 shares of Class A, Class B, Class C, Class I, Class R1, Class R2, Class R3, and Class R4 for an aggregate amount of $2,200,000.
At August 31, 2014, MFS held approximately 94%, 84%, and 80%, of the outstanding shares of Class B, Class C, and Class I, respectively, and 100% of the outstanding shares each of Class R1, Class R2, Class R3, and Class R4.
(4) Portfolio Securities
For the period ended August 31, 2014, purchases and sales of investments, other than short-term obligations, aggregated $3,630,701 and $720,885, respectively.
(5) Shares of Beneficial Interest
The fund’s Declaration of Trust permits the Trustees to issue an unlimited number of full and fractional shares of beneficial interest. Transactions in fund shares were as follows:
| | | | | | | | |
| | | Period ended
8/31/14 (c) | |
| | | Shares | | | Amount | |
| Shares sold | | | | | | | | |
Class A | | | 74,023 | | | | $777,936 | |
Class B | | | 10,644 | | | | 106,935 | |
Class C | | | 11,922 | | | | 120,556 | |
Class I | | | 12,538 | | | | 127,000 | |
Class R1 | | | 10,000 | | | | 100,000 | |
Class R2 | | | 10,000 | | | | 100,000 | |
Class R3 | | | 10,000 | | | | 100,000 | |
Class R4 | | | 10,000 | | | | 100,000 | |
Class R5 | | | 544,945 | | | | 5,822,000 | |
| | | 694,072 | | | | $7,354,427 | |
33
Notes to Financial Statements – continued
| | | | | | | | |
| | | Period ended
8/31/14 (c) | |
| | | Shares | | | Amount | |
Shares issued to shareholders in
reinvestment of distributions | | | | | | | | |
Class A | | | 272 | | | | $2,891 | |
Class B | | | 37 | | | | 389 | |
Class C | | | 38 | | | | 403 | |
Class I | | | 101 | | | | 1,071 | |
Class R1 | | | 37 | | | | 389 | |
Class R2 | | | 63 | | | | 673 | |
Class R3 | | | 77 | | | | 816 | |
Class R4 | | | 91 | | | | 959 | |
Class R5 | | | 1,300 | | | | 13,742 | |
| | | 2,016 | | | | $21,333 | |
| | |
| Shares reacquired | | | | | | | | |
Class A | | | (1,023 | ) | | | $(10,146 | ) |
Class C | | | (2 | ) | | | (21 | ) |
| | | (1,025 | ) | | | $(10,167 | ) |
| | |
| Net change | | | | | | | | |
Class A | | | 73,272 | | | | $770,681 | |
Class B | | | 10,681 | | | | 107,324 | |
Class C | | | 11,958 | | | | 120,938 | |
Class I | | | 12,639 | | | | 128,071 | |
Class R1 | | | 10,037 | | | | 100,389 | |
Class R2 | | | 10,063 | | | | 100,673 | |
Class R3 | | | 10,077 | | | | 100,816 | |
Class R4 | | | 10,091 | | | | 100,959 | |
Class R5 | | | 546,245 | | | | 5,835,742 | |
| | | 695,063 | | | | $7,365,593 | |
| (c) | For the period from the commencement of the fund’s investment operations, December 5, 2013, through the stated period end. |
(6) Line of Credit
The fund and certain other funds managed by MFS participate in a $1.1 billion unsecured committed line of credit, subject to a $1 billion sublimit, provided by a syndication of banks under a credit agreement. Borrowings may be made for temporary financing needs. Interest is charged to each fund, based on its borrowings, generally at a rate equal to the higher of the Federal Reserve funds rate or one month LIBOR plus an agreed upon spread. A commitment fee, based on the average daily, unused portion of the committed line of credit, is allocated among the participating funds at the end of each calendar quarter. In addition, the fund and other funds managed by MFS have established unsecured uncommitted borrowing arrangements with certain banks for temporary financing needs. Interest is charged to each fund, based on its borrowings, at a rate equal to the Federal Reserve funds rate plus an
34
Notes to Financial Statements – continued
agreed upon spread. For the period ended August 31, 2014, the fund’s commitment fee and interest expense were $5 and $0, respectively, and are included in “Miscellaneous” expense in the Statement of Operations.
(7) Transactions in Underlying Affiliated Funds-Affiliated Issuers
An affiliated issuer may be considered one in which the fund owns 5% or more of the outstanding voting securities, or a company which is under common control. For the purposes of this report, the fund assumes the following to be an affiliated issuer:
| | | | | | | | | | | | | | | | |
| Underlying Affiliated Fund | | Beginning
Shares/Par
Amount | | | Acquisitions
Shares/Par
Amount | | | Dispositions
Shares/Par
Amount | | | Ending
Shares/Par
Amount | |
| MFS Institutional Money Market Portfolio | | | — | | | | 3,141,195 | | | | (3,012,958 | ) | | | 128,237 | |
| | | | |
| Underlying Affiliated Fund | | Realized
Gain (Loss) | | | Capital Gain
Distributions | | | Dividend
Income | | | Ending
Value | |
| MFS Institutional Money Market Portfolio | | | $— | | | | $— | | | | $69 | | | | $128,237 | |
35
REPORT OF INDEPENDENT REGISTERED PUBLIC ACCOUNTING FIRM
To the Board of Trustees of MFS Series Trust I and the Shareholders of MFS Low Volatility Global Equity Fund:
We have audited the accompanying statement of assets and liabilities, including the portfolio of investments, of MFS Low Volatility Global Equity Fund (one of the series of MFS Series Trust I) (the “Fund”) as of August 31, 2014, and the related statements of operations, changes in net assets, and the financial highlights for the period from December 5, 2013 (the commencement of the Fund’s investment operations) through August 31, 2014. These financial statements and financial highlights are the responsibility of the Fund’s management. Our responsibility is to express an opinion on these financial statements and financial highlights based on our audit.
We conducted our audit in accordance with the standards of the Public Company Accounting Oversight Board (United States). Those standards require that we plan and perform the audit to obtain reasonable assurance about whether the financial statements and financial highlights are free of material misstatement. The Fund is not required to have, nor were we engaged to perform, an audit of its internal control over financial reporting. Our audit included consideration of internal control over financial reporting as a basis for designing audit procedures that are appropriate in the circumstances, but not for the purpose of expressing an opinion on the effectiveness of the Fund’s internal control over financial reporting. Accordingly, we express no such opinion. An audit also includes examining, on a test basis, evidence supporting the amounts and disclosures in the financial statements, assessing the accounting principles used and significant estimates made by management, as well as evaluating the overall financial statement presentation. Our procedures included confirmation of securities owned as of August 31, 2014, by correspondence with the custodian and brokers; where replies were not received from brokers, we performed other auditing procedures. We believe that our audit provides a reasonable basis for our opinion.
In our opinion, the financial statements and financial highlights referred to above present fairly, in all material respects, the financial position of MFS Low Volatility Global Equity Fund as of August 31, 2014, and the results of its operations, changes in its net assets, and the financial highlights for the period from December 5, 2013 (the commencement of the Fund’s investment operations) through August 31, 2014, in conformity with accounting principles generally accepted in the United States of America.
DELOITTE & TOUCHE LLP
Boston, Massachusetts
October 16, 2014
36
TRUSTEES AND OFFICERS — IDENTIFICATION AND BACKGROUND
The Trustees and Officers of the Trust, as of October 1, 2014, are listed below, together with their principal occupations during the past five years. (Their titles may have varied during that period.) The address of each Trustee and Officer is 111 Huntington Avenue, Boston, Massachusetts 02199-7618. It is expected that the Board will appoint Mr. Timothy M. Fagan as Chief Compliance Officer of the MFS Funds on November 1, 2014.
| | | | | | | | |
Name, Age | | Position(s) Held with Fund | | Trustee/Officer
Since (h) | | Principal
Occupations During the Past Five Years | | Other Directorships (j) |
| INTERESTED TRUSTEES |
Robert J. Manning (k)
(age 50) | | Trustee | | February 2004 | | Massachusetts Financial Services Company, Chairman, Chief Executive Officer and Director; President (until 2009); Chief Investment Officer (until 2010) | | N/A |
Robin A. Stelmach (k)
(age 53) | | Trustee and President | | January 2014 | | Massachusetts Financial Services Company, Executive Vice President and Chief Operating Officer | | N/A |
| INDEPENDENT TRUSTEES | | |
David H. Gunning
(age 72) | | Trustee and Chair of Trustees | | January 2004 | | Private investor | | Lincoln Electric Holdings, Inc. (welding equipment manufacturer), Director; Development Alternatives, Inc. (consulting), Director/Non-Executive Chairman |
Steven E. Buller (age 63) | | Trustee | | February 2014 | | Chairman, Financial Accounting Standards Advisory Council; Standing Advisory Group, Public Company Accounting Oversight Board, Member; BlackRock, Inc. (investment management), Managing Director (until 2014), BlackRock Finco UK (investment management), Director (until 2014) | | N/A |
37
Trustees and Officers – continued
| | | | | | | | |
Name, Age | | Position(s) Held with Fund | | Trustee/Officer
Since (h) | | Principal
Occupations During the Past Five Years | | Other Directorships (j) |
Robert E. Butler
(age 72) | | Trustee | | January 2006 | | Consultant – investment company industry regulatory and compliance matters | | N/A |
Maureen R. Goldfarb
(age 59) | | Trustee | | January 2009 | | Private investor | | N/A |
William R. Gutow
(age 73) | | Trustee | | December 1993 | | Private investor and real estate consultant; Capitol Entertainment Management Company (video franchise), Vice Chairman | | Texas Donuts (donut franchise), Vice Chairman (until 2010) |
Michael Hegarty
(age 69) | | Trustee | | December 2004 | | Private investor | | Brookfield Office Properties, Inc. (real estate), Director; Rouse Properties Inc. (real estate), Director; Capmark Financial Group Inc. (real estate), Director |
John P. Kavanaugh
(age 59) | | Trustee | | January 2009 | | Private investor | | N/A |
Maryanne L. Roepke
(age 58) | | Trustee | | May 2014 | | American Century Investments (investment management), Senior Vice President and Chief Compliance Officer (until 2014) | | N/A |
Laurie J. Thomsen
(age 57) | | Trustee | | March 2005 | | Private investor; New Profit, Inc. (venture philanthropy), Executive Partner (until 2010) | | The Travelers Companies (insurance), Director |
Robert W. Uek
(age 73) | | Trustee | | January 2006 | | Consultant to investment company industry | | N/A |
| OFFICERS | | | | | | |
Christopher R. Bohane (k)
(age 40) | | Assistant Secretary and Assistant Clerk | | July 2005 | | Massachusetts Financial Services Company, Vice President and Assistant General Counsel | | N/A |
Kino Clark (k)
(age 46) | | Assistant Treasurer | | January 2012 | | Massachusetts Financial Services Company, Vice President | | N/A |
38
Trustees and Officers – continued
| | | | | | | | |
Name, Age | | Position(s) Held with Fund | | Trustee/Officer
Since (h) | | Principal
Occupations During the Past Five Years | | Other Directorships (j) |
Thomas H. Connors (k)
(age 55) | | Assistant Secretary and Assistant Clerk | | September 2012 | | Massachusetts Financial Services Company, Vice President and Senior Counsel; Deutsche Investment Management Americas Inc. (financial service provider), Director and Senior Counsel (until 2012) | | N/A |
Ethan D. Corey (k)
(age 50) | | Assistant Secretary and Assistant Clerk | | July 2005 | | Massachusetts Financial Services Company, Senior Vice President and Associate General Counsel | | N/A |
David L. DiLorenzo (k)
(age 46) | | Treasurer | | July 2005 | | Massachusetts Financial Services Company, Senior Vice President | | N/A |
Brian E. Langenfeld (k) (age 41) | | Assistant Secretary and Assistant Clerk | | June 2006 | | Massachusetts Financial Services Company, Vice President and Senior Counsel | | N/A |
Susan S. Newton (k) (age 64) | | Assistant Secretary and Assistant Clerk | | May 2005 | | Massachusetts Financial Services Company, Senior Vice President and Associate General Counsel | | N/A |
Susan A. Pereira (k)
(age 43) | | Assistant Secretary and Assistant Clerk | | July 2005 | | Massachusetts Financial Services Company, Vice President and Senior Counsel | | N/A |
Kasey L. Phillips (k) (age 43) | | Assistant Treasurer | | September 2012 | | Massachusetts Financial Services Company, Vice President; Wells Fargo Funds Management, LLC, Senior Vice President, Fund Treasurer (until 2012) | | N/A |
Mark N. Polebaum (k)
(age 62) | | Secretary and Clerk | | January 2006 | | Massachusetts Financial Services Company, Executive Vice President, General Counsel and Secretary | | N/A |
39
Trustees and Officers – continued
| | | | | | | | |
Name, Age | | Position(s) Held with Fund | | Trustee/Officer
Since (h) | | Principal
Occupations During the Past Five Years | | Other Directorships (j) |
Matthew A. Stowe (k)
(age 39) | | Assistant Secretary and Assistant Clerk | | October 2014 | | Massachusetts Financial Services Company, Vice President and Senior Counsel | | N/A |
Frank L. Tarantino (l)
(age 70) | | Independent Chief Compliance Officer | | June 2004 | | Tarantino LLC (provider of compliance services), Principal | | N/A |
Richard S. Weitzel (k)
(age 44) | | Assistant Secretary and Assistant Clerk | | October 2007 | | Massachusetts Financial Services Company, Senior Vice President and Associate General Counsel | | N/A |
James O. Yost (k)
(age 54) | | Deputy Treasurer | | September 1990 | | Massachusetts Financial Services Company, Senior Vice President | | N/A |
| (h) | Date first appointed to serve as Trustee/officer of an MFS Fund. Each Trustee has served continuously since appointment unless indicated otherwise. For the period from December 15, 2004 until February 22, 2005, Mr. Manning served as Advisory Trustee. Prior to January 2012, Messrs. DiLorenzo and Yost served as Assistant Treasurers of the Funds. Ms. Stelmach was appointed as President of the Funds as of October 1, 2014. |
| (j) | Directorships or trusteeships of companies required to report to the Securities and Exchange Commission (i.e., “public companies”). |
| (k) | “Interested person” of the Trust within the meaning of the Investment Company Act of 1940 (referred to as the 1940 Act), which is the principal federal law governing investment companies like the fund, as a result of position with MFS. The address of MFS is 111 Huntington Avenue, Boston, Massachusetts 02199-7618. |
| (l) | Mr. Tarantino will retire as Independent Chief Compliance Officer of the MFS Funds on October 31, 2014. It is expected that Mr. Tarantino will continue after that date as an Independent Senior Officer of the MFS Funds. |
Each Trustee (except Ms. Stelmach, Mr. Buller and Ms. Roepke) has been elected by shareholders and each Trustee and officer holds office until his or her successor is chosen and qualified or until his or her earlier death, resignation, retirement or removal. The Trust does not hold annual meetings for the purpose of electing Trustees, and Trustees are not elected for fixed terms. Messrs. Butler, Kavanaugh, Uek and Mses. Thomsen and Roepke are members of the Trust’s Audit Committee.
Each of the Fund’s Trustees and officers holds comparable positions with certain other funds of which MFS or a subsidiary is the investment adviser or distributor, and, in the case of the officers, with certain affiliates of MFS. As of January 1, 2014, the Trustees served as board members of 142 funds within the MFS Family of Funds.
40
Trustees and Officers – continued
The Statement of Additional Information for the Fund includes further information about the Trustees and is available without charge upon request by calling 1-800-225-2606.
| | |
| Investment Adviser | | Custodian |
Massachusetts Financial Services Company
111 Huntington Avenue
Boston, MA 02199-7618 | | State Street Bank and Trust Company 1 Lincoln Street Boston, MA 02111-2900 |
| Distributor | | Independent Registered Public Accounting Firm |
MFS Fund Distributors, Inc.
111 Huntington Avenue
Boston, MA 02199-7618 | | Deloitte & Touche LLP 200 Berkeley Street Boston, MA 02116 |
| Portfolio Managers | | |
James Fallon Jonathan Sage | | |
41
PROXY VOTING POLICIES AND INFORMATION
MFS votes proxies on behalf of the fund pursuant to proxy voting policies and procedures that are available without charge, upon request, by calling 1-800-225-2606, by visiting the Proxy Voting section of mfs.com or by visiting the SEC’s Web site at http://www.sec.gov.
Information regarding how the fund voted proxies relating to portfolio securities during the most recent twelve-month period ended June 30 is available without charge by visiting the Proxy Voting section of mfs.com or by visiting the SEC’s Web site at http://www.sec.gov.
QUARTERLY PORTFOLIO DISCLOSURE
The fund will file a complete schedule of portfolio holdings with the Securities and Exchange Commission (the Commission) for the first and third quarters of each fiscal year on Form N-Q. A shareholder can obtain the quarterly portfolio holdings report at mfs.com. The fund’s Form N-Q is also available on the EDGAR database on the Commission’s Internet Web site at http://www.sec.gov, and may be reviewed and copied at the:
Public Reference Room
Securities and Exchange Commission
100 F Street, NE, Room 1580
Washington, D.C. 20549
Information on the operation of the Public Reference Room may be obtained by calling the Commission at 1-800-SEC-0330. Copies of the fund’s Form N-Q also may be obtained, upon payment of a duplicating fee, by electronic request at the following e-mail address: publicinfo@sec.gov or by writing the Public Reference Section at the above address.
FURTHER INFORMATION
From time to time, MFS may post important information about the fund or the MFS funds on the MFS web site (mfs.com). This information is available by visiting the “Commentary & Announcements” and “Market Outlooks” sections of mfs.com or by clicking on the fund’s name under “Mutual Funds” in the “Products” section of mfs.com.
FEDERAL TAX INFORMATION (unaudited)
The fund will notify shareholders of amounts for use in preparing 2014 income tax forms in January 2015. The following information is provided pursuant to provisions of the Internal Revenue Code.
The fund designates the maximum amount allowable as qualified dividend income eligible to be taxed at the same rate as long-term capital gain.
For corporate shareholders, 28.08% of the ordinary income dividends paid during the fiscal year qualify for the corporate dividends received deduction.
42
rev. 3/11
| | | | |
| | | |
FACTS | | WHAT DOES MFS DO WITH YOUR PERSONAL INFORMATION? | |  |
| | |
| Why? | | Financial companies choose how they share your personal information. Federal law gives consumers the right to limit some but not all sharing. Federal law also requires us to tell you how we collect, share, and protect your personal information. Please read this notice carefully to understand what we do. |
| | |
| What? | | The types of personal information we collect and share depend on the product or service you have with us. This information can include: • Social Security number and account balances • Account transactions and transaction history • Checking account information and wire transfer instructions When you are no longer our customer, we continue to share your information as described in this notice. |
| | |
| How? | | All financial companies need to share customers’ personal information to run their everyday business. In the section below, we list the reasons financial companies can share their customers’ personal information; the reasons MFS chooses to share; and whether you can limit this sharing. |
| | | | |
Reasons we can share your
personal information | | Does MFS
share? | | Can you limit
this sharing? |
For our everyday business purposes – such as to process your transactions, maintain your account(s), respond to court orders and legal investigations, or report to credit bureaus | | Yes | | No |
For our marketing purposes – to offer our products and services to you | | No | | We don’t share |
| For joint marketing with other financial companies | | No | | We don’t share |
For our affiliates’ everyday business purposes – information about your transactions and experiences | | No | | We don’t share |
For our affiliates’ everyday business purposes – information about your creditworthiness | | No | | We don’t share |
| For nonaffiliates to market to you | | No | | We don’t share |
| | |
| Questions? | | Call 800-225-2606 or go to mfs.com. |
43
| | |
| Who we are |
| Who is providing this notice? | | MFS Funds, MFS Investment Management, MFS Institutional Advisors, Inc., MFS Fund Distributors, Inc., MFS Heritage Trust Company, and MFS Service Center, Inc. |
| | |
| What we do |
| How does MFS protect my personal information? | | To protect your personal information from unauthorized access and use, we use security measures that comply with federal law. These measures include procedural, electronic, and physical safeguards for the protection of the personal information we collect about you. |
| How does MFS collect my personal information? | | We collect your personal information, for example, when you • open an account or provide account information • direct us to buy securities or direct us to sell your securities • make a wire transfer We also collect your personal information from others, such as credit bureaus, affiliates and other companies. |
| Why can’t I limit all sharing? | | Federal law gives you the right to limit only • sharing for affiliates’ everyday business purposes – information about your creditworthiness • affiliates from using your information to market to you • sharing for nonaffiliates to market to you State laws and individual companies may give you additional rights to limit sharing. |
| | |
| Definitions |
| Affiliates | | Companies related by common ownership or control. They can be financial and nonfinancial companies. • MFS does not share personal information with affiliates, except for everyday business purposes as described on page one of this notice. |
| Nonaffiliates | | Companies not related by common ownership or control. They can be financial and nonfinancial companies. • MFS does not share with nonaffiliates so they can market to you. |
| Joint Marketing | | A formal agreement between nonaffiliated financial companies that together market financial products or services to you. • MFS doesn’t jointly market. |
| | |
| Other important information |
| If you own an MFS product or receive an MFS service in the name of a third party such as a bank or broker-dealer, their privacy policy may apply to you instead of ours. |
44
Save paper with eDelivery.

| MFS® will send you prospectuses, |
reports, and proxies directly via e-mail so you will get information faster with less mailbox clutter.
To sign up:
1. Go to mfs.com.
2. Log in via MFS® Access.
3. Select eDelivery.
If you own your MFS fund shares through a financial institution or a retirement plan, MFS® TALK, MFS® Access, or eDelivery may not be available to you.
CONTACT
WEB SITE
mfs.com
MFS TALK
1-800-637-8255
24 hours a day
ACCOUNT SERVICE AND LITERATURE
Shareholders
1-800-225-2606
Financial advisors
1-800-343-2829
Retirement plan services
1-800-637-1255
MAILING ADDRESS
MFS Service Center, Inc.
P.O. Box 55824
Boston, MA 02205-5824
OVERNIGHT MAIL
MFS Service Center, Inc.
c/o Boston Financial Data Services
30 Dan Road
Canton, MA 02021-2809
ANNUAL REPORT
August 31, 2014

MFS® LOW VOLATILITY EQUITY FUND

LVU-ANN
MFS® LOW VOLATILITY EQUITY FUND
CONTENTS
The report is prepared for the general information of shareholders.
It is authorized for distribution to prospective investors only when preceded or accompanied by a current prospectus.
NOT FDIC INSURED Ÿ MAY LOSE VALUE Ÿ NO BANK GUARANTEE

LETTER FROM THE CHAIRMAN AND CEO
Dear Shareholders:
The U.S. economy continues to gain strength. Manufacturing output, construction activity and consumer confidence are all at multi-year highs, auto sales are robust, and
U.S. labor market reports show broad progress. Even a slowdown in the pace of rising house prices is seen as making the market more sustainable. Economists have a favorable outlook, and broad stock indices reflect that.
However, challenges dominate the rest of the global economy. China is struggling to boost its industrial output and Japan’s economic turnaround appears to have hit a setback after its sales tax increase in April. The eurozone economy is being held back by persistently high unemployment and dangerously low inflation, leading the European Central Bank to take more
aggressive stimulus action. With robust corporate earnings, the market’s greatest concerns relate to conflicts in the Middle East and Ukraine. In addition, speculation continues on when the U.S. Federal Reserve will begin tightening its monetary policy now that the U.S. economy has regained some traction.
As always at MFS®, active risk management is integral to how we manage your investments. We use a collaborative process, sharing insights across asset classes, regions and economic sectors. Our global team of investment professionals uses a multidisciplined, long-term, diversified investment approach.
We understand that these are challenging economic times. We believe we can serve you best by applying proven principles, such as asset allocation and diversification, over the long term. We are confident that this approach can help you as you work with your financial advisors to reach your goals in the years ahead.
Respectfully,

Robert J. Manning
Chairman and Chief Executive Officer
MFS Investment Management
October 16, 2014
The opinions expressed in this letter are subject to change and may not be relied upon for investment advice. No forecasts can be guaranteed.
1
PORTFOLIO COMPOSITION
Portfolio structure
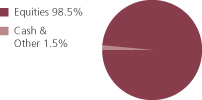
| | | | |
| Top ten holdings | | | | |
| Everest Re Group Ltd. | | | 3.4% | |
| M&T Bank Corp. | | | 3.3% | |
| Procter & Gamble Co. | | | 3.1% | |
| McDonald’s Corp. | | | 3.0% | |
| Public Storage, Inc., REIT | | | 2.9% | |
| Automatic Data Processing, Inc. | | | 2.8% | |
| Johnson & Johnson | | | 2.8% | |
| Kroger Co. | | | 2.7% | |
| Chevron Corp. | | | 2.6% | |
| Exxon Mobil Corp. | | | 2.5% | |
| | | | |
| Equity sectors | | | | |
| Financial Services | | | 18.7% | |
| Consumer Staples | | | 13.8% | |
| Utilities & Communications | | | 12.5% | |
| Health Care | | | 12.3% | |
| Technology | | | 11.8% | |
| Retailing | | | 8.6% | |
| Industrial Goods & Services | | | 6.0% | |
| Energy | | | 5.6% | |
| Leisure | | | 4.4% | |
| Special Products & Services | | | 3.3% | |
| Basic Materials | | | 1.1% | |
| Transportation | | | 0.4% | |
Cash & Other can include cash, other assets less liabilities, offsets to derivative positions, and short-term securities.
Percentages are based on net assets as of 8/31/14.
The portfolio is actively managed and current holdings may be different.
2
MANAGEMENT REVIEW
Summary of Results
For the period December 5, 2013 through August 31, 2014, Class A shares of the MFS Low Volatility Equity Fund (“fund”) provided a total return of 8.82%, at net asset value. This compares with a return of 13.44% for the fund’s benchmark, the Standard & Poor’s 500 Stock Index (S&P 500 Index).
Market Environment
Early in the period, equity markets advanced in response to improved economic fundamentals, having recovered from prior weakness stemming from concerns that the US Federal Reserve (“Fed”) would begin tapering its quantitative easing (“QE”) program. A general theme in the market was a rotation in investor allocations from fixed income to equities and emerging markets (“EM”) to developed markets, reflecting an anticipated acceleration in developed market growth rates relative to EM as well as a more equity-friendly macro backdrop amid increased volatility in EM debt. As the period progressed, the Fed’s decision to postpone QE tapering surprised markets. Favorable market reactions were tempered, however, by tense negotiations over US fiscal policy which resulted in a 16-day partial shutdown of the federal government and a short-term extension in the debt ceiling. The volatility was short-lived, however, as an extension of budget and debt ceiling deadlines allowed the government to re-open, and subsequent economic data reflected moderate but resilient US growth. Also well-received was the decision by the European Central Bank (“ECB”) to cut its policy rate as inflation pressures waned in the region. In addition, equity investors appeared to have concluded that there would be no major change in US monetary policy as a result of the nomination of Janet Yellen as the new Fed Chair for a term beginning in early 2014 and that tapering would have no major impact on the trajectory.
Later in the period, financial markets were forced to contend with a series of positive and negative return episodes. In addition to periodic flashpoints in country specific emerging markets, geopolitical tensions flared in the Middle East and Russia/Ukraine. Market setbacks were short-lived, as improving economic growth in the US coupled with prospects for easier monetary policy in regions with slowing growth such as Japan, Europe and China, supported risk assets. For example, the ECB cut policy interest rates into negative territory and by the end of the period expectations were for additional rate cuts and the announcement for non-conventional easing measures. The decline in developed market government bond yields and credit spreads were also supportive for equity markets. At the end of the period, the US equity market was trading at all-time highs.
Detractors from Performance
Stock selection in the health care sector detracted from performance relative to the S&P 500 Index. The fund’s holdings of healthcare products suppliers Perrigo (h) (Ireland) and Schein Henry (h)(b), and not holding strong-performing biotechnology firm Gilead Sciences, held back relative results. Shares of Perrigo depreciated during the period due to a decline in organic growth, weak demand and fewer products in the company’s pipeline.
3
Management Review – continued
The combination of stock selection and an underweight position in the technology sector dampened relative returns. Not holding strong-performing computer and personal electronics maker Apple weighed on relative performance as the stock outperformed the benchmark during the period. Shares of Apple spiked late in the reporting period prior to the company’s release of their highly anticipated new IPhone 6 and IPhone 6 Plus smartphones. Additionally, strong consumer demand resulted in record pre-orders for the company’s products.
Elsewhere, the fund’s overweight positions in fast food restaurant chain operator McDonald’s, retail store operator Wal-Mart Stores, membership-based wholesaler Costco Wholesale and waste management company Stericycle held back relative performance. Shares of McDonald’s came under pressure due to decreased sales in China and Japan and weak domestic demand. Holdings of reinsurance and insurance provider Everest Reinsurance (Bermuda) were also among the fund’s top relative detractors.
The fund’s cash and/or cash equivalents position during the period weakened relative performance. Under normal market conditions, the fund strives to be fully invested and generally holds cash to buy new holdings and to provide liquidity. In a period when markets rose, as measured by the fund’s benchmark, holding cash hurt performance versus the benchmark, which has no cash position.
Contributors to Performance
Stock selection in the consumer staples sector contributed to relative performance, led by the fund’s overweight position in tobacco producer Lorillard. Shares of Lorillard rose as the company announced the planned acquisition of tobacco company R.J. Reynolds during the reporting period.
The combination of security selection and an underweight position in the industrial goods & services sector also aided relative performance. Not holding shares of poor-performing diversified industrial conglomerate General Electric (United States), and an overweight position in aerospace and defense company General Dynamics, benefited relative results. Shares of General Dynamics appreciated steadily during the reporting period due to strong performance from the company’s defense business and increased demand.
Stocks in other sectors that strengthened relative performance included the fund’s overweight positions in pharmaceutical company Eli Lilly (United States), retailer Kroger (United States) and semiconductor company Intel (United States). Avoiding shares of weak-performing financial services firms Citigroup (United States), Bank of America (United States) and JPMorgan Chase (United States) also helped. Additionally, the fund’s underweight position in pharmaceutical giant Pfizer (United States), which turned in poor performance for the period, benefited relative returns.
Respectfully,
| | |
James Fallon Portfolio Manager | | Matthew Krummell Portfolio Manager |
| (b) | Security is not a benchmark constituent. |
| (h) | Security was not held in the portfolio at period end. |
4
Management Review – continued
The views expressed in this report are those of the portfolio managers only through the end of the period of the report as stated on the cover and do not necessarily reflect the views of MFS or any other person in the MFS organization. These views are subject to change at any time based on market or other conditions, and MFS disclaims any responsibility to update such views. These views may not be relied upon as investment advice or an indication of trading intent on behalf of any MFS portfolio. References to specific securities are not recommendations of such securities, and may not be representative of any MFS portfolio’s current or future investments.
5
PERFORMANCE SUMMARY THROUGH 8/31/14
The following chart illustrates a representative class of the fund’s historical performance in comparison to its benchmark(s). Performance results include the deduction of the maximum applicable sales charge and reflect the percentage change in net asset value, including reinvestment of dividends and capital gains distributions. The performance of other share classes will be greater than or less than that of the class depicted below. Benchmarks are unmanaged and may not be invested in directly. Benchmark returns do not reflect sales charges, commissions or expenses. (See Notes to Performance Summary.)
Performance data shown represents past performance and is no guarantee of future results. Investment return and principal value fluctuate so your shares, when sold, may be worth more or less than the original cost; current performance may be lower or higher than quoted. The performance shown does not reflect the deduction of taxes, if any, that a shareholder would pay on fund distributions or the redemption of fund shares.
Growth of a Hypothetical $10,000 Investment (t)
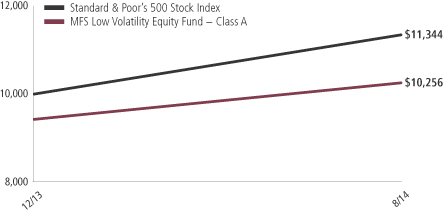
6
Performance Summary – continued
Total Returns through 8/31/14
Average annual without sales charge
| | | | | | | | |
| | | Share class | | Class inception date | | Life (t) | | |
| | | A | | 12/05/13 | | 8.82% | | |
| | | B | | 12/05/13 | | 8.23% | | |
| | | C | | 12/05/13 | | 8.27% | | |
| | | I | | 12/05/13 | | 9.09% | | |
| | | R1 | | 12/05/13 | | 8.30% | | |
| | | R2 | | 12/05/13 | | 8.69% | | |
| | | R3 | | 12/05/13 | | 8.84% | | |
| | | R4 | | 12/05/13 | | 9.09% | | |
| | | R5 | | 12/05/13 | | 9.11% | | |
| Comparative benchmark | | | | |
| | | Standard & Poor’s 500 Stock Index (f) | | 13.44% | | |
| Average annual with sales charge | | | | |
| | | A
With initial Sales Charge (5.75%) | | 2.56% | | |
| | | B
With CDSC (Declining over six years from 4% to 0%) (v) | | 4.23% | | |
| | | C
With CDSC (1% for 12 months) (v) | | 7.27% | | |
CDSC – Contingent Deferred Sales Charge.
Class I, R1, R2, R3, R4, and R5 shares do not have a sales charge.
| (f) | Source: FactSet Research Systems Inc. |
| (t) | For the period from the class inception date through the stated period end. (See Notes to Performance Summary.) |
| (v) | Assuming redemption at the end of the applicable period. |
Benchmark Definition
Standard & Poor’s 500 Stock Index – a market capitalization-weighted index of 500 widely held equity securities, designed to measure broad U.S. equity performance.
It is not possible to invest directly in an index.
Notes to Performance Summary
Average annual total return represents the average annual change in value for each share class for the periods presented. Life returns are presented where the share class has less than 10 years of performance history and represent the average annual total return from the class inception date to the stated period end date.
Performance results reflect any applicable expense subsidies and waivers in effect during the periods shown. Without such subsidies and waivers the fund’s performance results would be less favorable. Please see the prospectus and financial statements for complete details.
7
Performance Summary – continued
Performance results do not include adjustments made for financial reporting purposes in accordance with U.S. generally accepted accounting principles and may differ from amounts reported in the financial highlights.
From time to time the fund may receive proceeds from litigation settlements, without which performance would be lower.
8
EXPENSE TABLE
Fund expenses borne by the shareholders during the period, March 1, 2014 through August 31, 2014
As a shareholder of the fund, you incur two types of costs: (1) transaction costs, including sales charges (loads) on certain purchase or redemption payments, and (2) ongoing costs, including management fees; distribution and service (12b-1) fees; and other fund expenses. This example is intended to help you understand your ongoing costs (in dollars) of investing in the fund and to compare these costs with the ongoing costs of investing in other mutual funds.
The example is based on an investment of $1,000 invested at the beginning of the period and held for the entire period March 1, 2014 through August 31, 2014.
Actual Expenses
The first line for each share class in the following table provides information about actual account values and actual expenses. You may use the information in this line, together with the amount you invested, to estimate the expenses that you paid over the period. Simply divide your account value by $1,000 (for example, an $8,600 account value divided by $1,000 = 8.6), then multiply the result by the number in the first line under the heading entitled “Expenses Paid During Period” to estimate the expenses you paid on your account during this period.
Hypothetical Example for Comparison Purposes
The second line for each share class in the following table provides information about hypothetical account values and hypothetical expenses based on the fund’s actual expense ratio and an assumed rate of return of 5% per year before expenses, which is not the fund’s actual return. The hypothetical account values and expenses may not be used to estimate the actual ending account balance or expenses you paid for the period. You may use this information to compare the ongoing costs of investing in the fund and other funds. To do so, compare this 5% hypothetical example with the 5% hypothetical examples that appear in the shareholder reports of the other funds.
Please note that the expenses shown in the table are meant to highlight your ongoing costs only and do not reflect any transactional costs, such as sales charges (loads). Therefore, the second line for each share class in the table is useful in comparing ongoing costs only, and will not help you determine the relative total costs of owning different funds. In addition, if these transactional costs were included, your costs would have been higher.
9
Expense Table – continued
| | | | | | | | | | | | | | | | | | |
Share Class | | | | Annualized Expense Ratio | | | Beginning
Account Value
3/01/14 | | | Ending Account Value 8/31/14 | | | Expenses Paid During
Period (p) 3/01/14-8/31/14 | |
| A | | Actual | | | 1.15% | | | | $1,000.00 | | | | $1,060.59 | | | | $5.97 | |
| | Hypothetical (h) | | | 1.15% | | | | $1,000.00 | | | | $1,019.41 | | | | $5.85 | |
| B | | Actual | | | 1.92% | | | | $1,000.00 | | | | $1,056.91 | | | | $9.95 | |
| | Hypothetical (h) | | | 1.92% | | | | $1,000.00 | | | | $1,015.53 | | | | $9.75 | |
| C | | Actual | | | 1.92% | | | | $1,000.00 | | | | $1,057.34 | | | | $9.96 | |
| | Hypothetical (h) | | | 1.92% | | | | $1,000.00 | | | | $1,015.53 | | | | $9.75 | |
| I | | Actual | | | 0.92% | | | | $1,000.00 | | | | $1,062.23 | | | | $4.78 | |
| | Hypothetical (h) | | | 0.92% | | | | $1,000.00 | | | | $1,020.57 | | | | $4.69 | |
| R1 | | Actual | | | 1.92% | | | | $1,000.00 | | | | $1,057.62 | | | | $9.96 | |
| | Hypothetical (h) | | | 1.92% | | | | $1,000.00 | | | | $1,015.53 | | | | $9.75 | |
| R2 | | Actual | | | 1.42% | | | | $1,000.00 | | | | $1,060.41 | | | | $7.37 | |
| | Hypothetical (h) | | | 1.42% | | | | $1,000.00 | | | | $1,018.05 | | | | $7.22 | |
| R3 | | Actual | | | 1.17% | | | | $1,000.00 | | | | $1,060.81 | | | | $6.08 | |
| | Hypothetical (h) | | | 1.17% | | | | $1,000.00 | | | | $1,019.31 | | | | $5.96 | |
| R4 | | Actual | | | 0.92% | | | | $1,000.00 | | | | $1,062.19 | | | | $4.78 | |
| | Hypothetical (h) | | | 0.92% | | | | $1,000.00 | | | | $1,020.57 | | | | $4.69 | |
| R5 | | Actual | | | 0.91% | | | | $1,000.00 | | | | $1,062.42 | | | | $4.73 | |
| | Hypothetical (h) | | | 0.91% | | | | $1,000.00 | | | | $1,020.62 | | | | $4.63 | |
| (h) | 5% class return per year before expenses. |
| (p) | “Expenses Paid During Period” are equal to each class’s annualized expense ratio, as shown above, multiplied by the average account value over the period, multiplied by 184/365 (to reflect the one-half year period). Expenses paid do not include any applicable sales charges (loads). If these transaction costs had been included, your costs would have been higher. |
Notes to Expense Table
Each class with a Rule 12b-1 service fee is subject to a rebate of a portion of such fee. Such rebates are included in the expense ratios above and are outside of the expense limitation arrangement. For Class A shares, this rebate reduced the expense ratio above by 0.03%. See Note 3 in the Notes to Financial Statements for additional information.
10
PORTFOLIO OF INVESTMENTS
8/31/14
The Portfolio of Investments is a complete list of all securities owned by your fund. It is categorized by broad-based asset classes.
| | | | | | | | |
| Common Stocks - 98.5% | | | | | | | | |
| Issuer | | Shares/Par | | | Value ($) | |
| | | | | | | | |
| Aerospace - 3.5% | | | | | | | | |
| General Dynamics Corp. | | | 223 | | | $ | 27,485 | |
| Honeywell International, Inc. | | | 419 | | | | 39,901 | |
| Lockheed Martin Corp. | | | 144 | | | | 25,056 | |
| United Technologies Corp. | | | 417 | | | | 45,028 | |
| | | | | | | | |
| | | | | | | $ | 137,470 | |
| Business Services - 3.3% | | | | | | | | |
| Amdocs Ltd. | | | 406 | | | $ | 19,123 | |
| Automatic Data Processing, Inc. | | | 1,315 | | | | 109,776 | |
| | | | | | | | |
| | | | | | | $ | 128,899 | |
| Cable TV - 0.5% | | | | | | | | |
| Time Warner Cable, Inc. | | | 133 | | | $ | 19,675 | |
| | |
| Chemicals - 0.5% | | | | | | | | |
| 3M Co. | | | 141 | | | $ | 20,304 | |
| | |
| Computer Software - 1.6% | | | | | | | | |
| Intuit, Inc. | | | 493 | | | $ | 41,008 | |
| Oracle Corp. | | | 481 | | | | 19,976 | |
| | | | | | | | |
| | | | | | | $ | 60,984 | |
| Computer Software - Systems - 1.4% | | | | | | | | |
| International Business Machines Corp. | | | 289 | | | $ | 55,575 | |
| | |
| Consumer Products - 4.5% | | | | | | | | |
| Colgate-Palmolive Co. | | | 617 | | | $ | 39,938 | |
| Kimberly-Clark Corp. | | | 138 | | | | 14,904 | |
| Procter & Gamble Co. | | | 1,441 | | | | 119,762 | |
| | | | | | | | |
| | | | | | | $ | 174,604 | |
| Electronics - 5.9% | | | | | | | | |
| Analog Devices, Inc. | | | 357 | | | $ | 18,250 | |
| Intel Corp. | | | 1,958 | | | | 68,373 | |
| KLA-Tencor Corp. | | | 309 | | | | 23,614 | |
| Microchip Technology, Inc. | | | 1,609 | | | | 78,567 | |
| Texas Instruments, Inc. | | | 802 | | | | 38,640 | |
| | | | | | | | |
| | | | | | | $ | 227,444 | |
11
Portfolio of Investments – continued
| | | | | | | | |
| Issuer | | Shares/Par | | | Value ($) | |
| | | | | | | | |
| Common Stocks - continued | | | | | | | | |
| Energy - Integrated - 5.1% | | | | | | | | |
| Chevron Corp. | | | 774 | | | $ | 100,194 | |
| Exxon Mobil Corp. | | | 991 | | | | 98,565 | |
| | | | | | | | |
| | | | | | | $ | 198,759 | |
| Entertainment - 0.4% | | | | | | | | |
| Regal Entertainment Group, “A” | | | 763 | | | $ | 16,061 | |
| | |
| Food & Beverages - 5.8% | | | | | | | | |
| Bunge Ltd. | | | 184 | | | $ | 15,576 | |
| Coca-Cola Co. | | | 556 | | | | 23,196 | |
| Dr Pepper Snapple Group, Inc. | | | 367 | | | | 23,092 | |
| General Mills, Inc. | | | 1,637 | | | | 87,383 | |
| McCormick & Co., Inc. | | | 344 | | | | 23,973 | |
| Mondelez International, Inc. | | | 493 | | | | 17,842 | |
| PepsiCo, Inc. | | | 357 | | | | 33,019 | |
| | | | | | | | |
| | | | | | | $ | 224,081 | |
| Food & Drug Stores - 3.1% | | | | | | | | |
| CVS Caremark Corp. | | | 234 | | | $ | 18,591 | |
| Kroger Co. | | | 2,021 | | | | 103,031 | |
| | | | | | | | |
| | | | | | | $ | 121,622 | |
| Gaming & Lodging - 0.4% | | | | | | | | |
| Norwegian Cruise Line Holdings Ltd. (a) | | | 526 | | | $ | 17,521 | |
| | |
| General Merchandise - 4.1% | | | | | | | | |
| Costco Wholesale Corp. | | | 341 | | | $ | 41,288 | |
| Macy’s, Inc. | | | 282 | | | | 17,566 | |
| Target Corp. | | | 344 | | | | 20,664 | |
| Wal-Mart Stores, Inc. | | | 1,034 | | | | 78,067 | |
| | | | | | | | |
| | | | | | | $ | 157,585 | |
| Health Maintenance Organizations - 0.4% | | | | | | | | |
| Aetna, Inc. | | | 195 | | | $ | 16,015 | |
| | |
| Insurance - 6.5% | | | | | | | | |
| Chubb Corp. | | | 309 | | | $ | 28,413 | |
| Everest Re Group Ltd. | | | 798 | | | | 130,744 | |
| RenaissanceRe Holdings Ltd. | | | 258 | | | | 26,417 | |
| Travelers Cos., Inc. | | | 505 | | | | 47,829 | |
| Validus Holdings Ltd. | | | 493 | | | | 19,281 | |
| | | | | | | | |
| | | | | | | $ | 252,684 | |
12
Portfolio of Investments – continued
| | | | | | | | |
| Issuer | | Shares/Par | | | Value ($) | |
| | | | | | | | |
| Common Stocks - continued | | | | | | | | |
| Internet - 2.1% | | | | | | | | |
| Google, Inc., “A” (a) | | | 137 | | | $ | 79,783 | |
| | |
| Major Banks - 1.6% | | | | | | | | |
| PNC Financial Services Group, Inc. | | | 282 | | | $ | 23,900 | |
| Wells Fargo & Co. | | | 754 | | | | 38,786 | |
| | | | | | | | |
| | | | | | | $ | 62,686 | |
| Medical & Health Technology & Services - 2.7% | | | | | | | | |
| AmerisourceBergen Corp. | | | 529 | | | $ | 40,939 | |
| Henry Schein, Inc. (a) | | | 402 | | | | 48,115 | |
| McKesson Corp. | | | 79 | | | | 15,407 | |
| | | | | | | | |
| | | | | | | $ | 104,461 | |
| Medical Equipment - 2.3% | | | | | | | | |
| Abbott Laboratories | | | 1,295 | | | $ | 54,701 | |
| Becton, Dickinson & Co. | | | 184 | | | | 21,559 | |
| Zimmer Holdings, Inc. | | | 138 | | | | 13,705 | |
| | | | | | | | |
| | | | | | | $ | 89,965 | |
| Natural Gas - Distribution - 0.4% | | | | | | | | |
| Sempra Energy | | | 160 | | | $ | 16,955 | |
| | |
| Natural Gas - Pipeline - 0.5% | | | | | | | | |
| ONEOK, Inc. | | | 257 | | | $ | 18,041 | |
| | |
| Network & Telecom - 0.9% | | | | | | | | |
| Cisco Systems, Inc. | | | 664 | | | $ | 16,593 | |
| Qualcomm, Inc. | | | 234 | | | | 17,807 | |
| | | | | | | | |
| | | | | | | $ | 34,400 | |
| Oil Services - 0.5% | | | | | | | | |
| Schlumberger Ltd. | | | 171 | | | $ | 18,748 | |
| | |
| Other Banks & Diversified Financials - 6.3% | | | | | | | | |
| Discover Financial Services | | | 516 | | | $ | 32,183 | |
| East West Bancorp, Inc. | | | 629 | | | | 21,914 | |
| Fifth Third Bancorp | | | 826 | | | | 16,855 | |
| M&T Bank Corp. | | | 1,043 | | | | 128,946 | |
| Visa, Inc., “A” | | | 220 | | | | 46,754 | |
| | | | | | | | |
| | | | | | | $ | 246,652 | |
| Pharmaceuticals - 6.9% | | | | | | | | |
| Eli Lilly & Co. | | | 1,267 | | | $ | 80,531 | |
| Johnson & Johnson | | | 1,051 | | | | 109,020 | |
13
Portfolio of Investments – continued
| | | | | | | | |
| Issuer | | Shares/Par | | | Value ($) | |
| | | | | | | | |
| Common Stocks - continued | | | | | | | | |
| Pharmaceuticals - continued | | | | | | | | |
| Merck & Co., Inc. | | | 1,034 | | | $ | 62,154 | |
| Pfizer, Inc. | | | 556 | | | | 16,341 | |
| | | | | | | | |
| | | | | | | $ | 268,046 | |
| Pollution Control - 2.5% | | | | | | | | |
| Stericycle, Inc. (a) | | | 804 | | | $ | 95,555 | |
| | |
| Real Estate - 4.2% | | | | | | | | |
| Federal Realty Investment Trust, REIT | | | 409 | | | $ | 51,035 | |
| Public Storage, Inc., REIT | | | 639 | | | | 111,940 | |
| | | | | | | | |
| | | | | | | $ | 162,975 | |
| Restaurants - 3.0% | | | | | | | | |
| McDonald’s Corp. | | | 1,249 | | | $ | 117,056 | |
| | |
| Specialty Chemicals - 0.6% | | | | | | | | |
| Praxair, Inc. | | | 182 | | | $ | 23,942 | |
| | |
| Specialty Stores - 1.4% | | | | | | | | |
| AutoZone, Inc. (a) | | | 55 | | | $ | 29,636 | |
| O’Reilly Automotive, Inc. (a) | | | 154 | | | | 24,021 | |
| | | | | | | | |
| | | | | | | $ | 53,657 | |
| Telecommunications - Wireless - 0.5% | | | | | | | | |
| American Tower Corp., REIT | | | 184 | | | $ | 18,142 | |
| | |
| Telephone Services - 2.8% | | | | | | | | |
| AT&T, Inc. | | | 947 | | | $ | 33,107 | |
| Verizon Communications, Inc. | | | 1,503 | | | | 74,879 | |
| | | | | | | | |
| | | | | | | $ | 107,986 | |
| Tobacco - 3.6% | | | | | | | | |
| Altria Group, Inc. | | | 470 | | | $ | 20,248 | |
| Lorillard, Inc. | | | 1,144 | | | | 68,297 | |
| Philip Morris International, Inc. | | | 579 | | | | 49,551 | |
| | | | | | | | |
| | | | | | | $ | 138,096 | |
| Trucking - 0.4% | | | | | | | | |
| United Parcel Service, Inc., “B” | | | 172 | | | $ | 16,741 | |
| | |
| Utilities - Electric Power - 8.3% | | | | | | | | |
| Alliant Energy Corp. | | | 309 | | | $ | 18,073 | |
| American Electric Power Co., Inc. | | | 614 | | | | 32,972 | |
| Consolidated Edison, Inc. | | | 296 | | | | 17,135 | |
14
Portfolio of Investments – continued
| | | | | | | | |
| Issuer | | Shares/Par | | | Value ($) | |
| | | | | | | | |
| Common Stocks - continued | | | | | | | | |
| Utilities - Electric Power - continued | | | | | | | | |
| Dominion Resources, Inc. | | | 428 | | | $ | 30,054 | |
| Duke Energy Corp. | | | 184 | | | | 13,614 | |
| ITC Holdings Corp. | | | 442 | | | | 16,509 | |
| MGE Energy, Inc. | | | 664 | | | | 26,713 | |
| NextEra Energy, Inc. | | | 419 | | | | 41,251 | |
| OGE Energy Corp. | | | 1,711 | | | | 64,197 | |
| Pinnacle West Capital Corp. | | | 282 | | | | 16,060 | |
| Southern Co. | | | 689 | | | | 30,592 | |
| Wisconsin Energy Corp. | | | 357 | | | | 16,183 | |
| | | | | | | | |
| | | | | | | $ | 323,353 | |
| Total Common Stocks (Identified Cost, $3,601,101) | | | | | | $ | 3,826,523 | |
| | |
| Money Market Funds - 3.4% | | | | | | | | |
MFS Institutional Money Market Portfolio, 0.09%,
at Cost and Net Asset Value (v) | | | 132,053 | | | $ | 132,053 | |
| Total Investments (Identified Cost, $3,733,154) | | | $ | 3,958,576 | |
| |
| Other Assets, Less Liabilities - (1.9)% | | | | (75,055 | ) |
| Net Assets - 100.0% | | | $ | 3,883,521 | |
| (a) | Non-income producing security. |
| (v) | Underlying affiliated fund that is available only to investment companies managed by MFS. The rate quoted for the MFS Institutional Money Market Portfolio is the annualized seven-day yield of the fund at period end. |
The following abbreviations are used in this report and are defined:
| REIT | | Real Estate Investment Trust |
See Notes to Financial Statements
15
Financial Statements
STATEMENT OF ASSETS AND LIABILITIES
At 8/31/14
This statement represents your fund’s balance sheet, which details the assets and liabilities comprising the total value of the fund.
| | | | |
| Assets | | | | |
Investments- | | | | |
Non-affiliated issuers, at value (identified cost, $3,601,101) | | | $3,826,523 | |
Underlying affiliated funds, at cost and value | | | 132,053 | |
Total investments, at value (identified cost, $3,733,154) | | | $3,958,576 | |
Receivables for | | | | |
Fund shares sold | | | 16,388 | |
Dividends | | | 11,888 | |
Total assets | | | $3,986,852 | |
| Liabilities | | | | |
Payable to affiliates | | | | |
Investment adviser | | | $68,063 | |
Shareholder servicing costs | | | 320 | |
Distribution and service fees | | | 82 | |
Payable for independent Trustees’ compensation | | | 3 | |
Accrued expenses and other liabilities | | | 34,863 | |
Total liabilities | | | $103,331 | |
Net assets | | | $3,883,521 | |
| Net assets consist of | | | | |
Paid-in capital | | | $3,646,617 | |
Unrealized appreciation (depreciation) on investments | | | 225,422 | |
Accumulated net realized gain (loss) on investments | | | 743 | |
Undistributed net investment income | | | 10,739 | |
Net assets | | | $3,883,521 | |
Shares of beneficial interest outstanding | | | 358,637 | |
16
Statement of Assets and Liabilities – continued
| | | | | | | | | | | | |
| | | Net assets | | | Shares
outstanding | | | Net asset value
per share (a) | |
Class A | | | $1,154,022 | | | | 106,608 | | | | $10.82 | |
Class B | | | 170,019 | | | | 15,722 | | | | 10.81 | |
Class C | | | 420,671 | | | | 38,945 | | | | 10.80 | |
Class I | | | 176,520 | | | | 16,286 | | | | 10.84 | |
Class R1 | | | 108,277 | | | | 10,009 | | | | 10.82 | |
Class R2 | | | 108,679 | | | | 10,036 | | | | 10.83 | |
Class R3 | | | 108,881 | | | | 10,050 | | | | 10.83 | |
Class R4 | | | 109,081 | | | | 10,063 | | | | 10.84 | |
Class R5 | | | 1,527,371 | | | | 140,918 | | | | 10.84 | |
| (a) | Maximum offering price per share was equal to the net asset value per share for all share classes, except for Class A, for which the maximum offering price per share was $11.48 [100 / 94.25 x $10.82]. On sales of $10,000 or more, the maximum offering price of Class A shares is reduced. A contingent deferred sales charge may be imposed on redemptions of Class A, Class B, and Class C shares. Redemption price per share was equal to the net asset value per share for Classes I, R1, R2, R3, R4, and R5. |
See Notes to Financial Statements
17
Financial Statements
STATEMENT OF OPERATIONS
Period ended 8/31/14 (c)
This statement describes how much your fund earned in investment income and accrued in expenses. It also describes any gains and/or losses generated by fund operations.
| | | | |
| Net investment income | | | | |
Income | | | | |
Dividends | | | $50,129 | |
Dividends from underlying affiliated funds | | | 76 | |
Total investment income | | | $50,205 | |
Expenses | | | | |
Management fee | | | $15,833 | |
Distribution and service fees | | | 4,715 | |
Shareholder servicing costs | | | 759 | |
Administrative services fee | | | 12,948 | |
Independent Trustees’ compensation | | | 686 | |
Custodian fee | | | 8,972 | |
Shareholder communications | | | 5,767 | |
Audit and tax fees | | | 29,505 | |
Legal fees | | | 17 | |
Registration fees | | | 15,091 | |
Miscellaneous | | | 10,255 | |
Total expenses | | | $104,548 | |
Fees paid indirectly | | | (5 | ) |
Reduction of expenses by investment adviser and distributor | | | (80,524 | ) |
Net expenses | | | $24,019 | |
Net investment income | | | $26,186 | |
| Realized and unrealized gain (loss) on investments | | | | |
Realized gain (loss) on investments (identified cost basis) | | | $743 | |
Change in unrealized appreciation (depreciation) on investments | | | $225,422 | |
Net realized and unrealized gain (loss) on investments | | | $226,165 | |
Change in net assets from operations | | | $252,351 | |
| (c) | For the period from the commencement of the fund’s investment operations, December 5, 2013, through the stated period end. |
See Notes to Financial Statements
18
Financial Statements
STATEMENT OF CHANGES IN NET ASSETS
This statement describes the increases and/or decreases in net assets resulting from operations, any distributions, and any shareholder transactions.
| | | | |
| | | Period ended
8/31/14 (c) | |
| Change in net assets | | | |
| From operations | | | | |
Net investment income | | | $26,186 | |
Net realized gain (loss) on investments | | | 743 | |
Net unrealized gain (loss) on investments | | | 225,422 | |
Change in net assets from operations | | | $252,351 | |
| Distributions declared to shareholders | | | | |
From net investment income | | | $(16,493 | ) |
Change in net assets from fund share transactions | | | $3,647,663 | |
Total change in net assets | | | $3,883,521 | |
| Net assets | | | | |
At beginning of period | | | — | |
At end of period (including undistributed net investment income of $10,739) | | | $3,883,521 | |
| (c) | For the period from the commencement of the fund’s investment operations, December 5, 2013, through the stated period end. |
See Notes to Financial Statements
19
Financial Statements
FINANCIAL HIGHLIGHTS
The financial highlights table is intended to help you understand the fund’s financial performance for the past 5 years (or life of a particular share class, if shorter). Certain information reflects financial results for a single fund share. The total returns in the table represent the rate by which an investor would have earned (or lost) on an investment in the fund share class (assuming reinvestment of all distributions) held for the entire period.
| | | | |
| Class A | | Period ended | |
| | | 8/31/14 (c) | |
Net asset value, beginning of period | | | $10.00 | |
| Income (loss) from investment operations | | | | |
Net investment income (d) | | | $0.11 | |
Net realized and unrealized gain (loss) on investments and foreign currency | | | 0.77 | |
Total from investment operations | | | $0.88 | |
| Less distributions declared to shareholders | | | | |
From net investment income | | | $(0.06 | ) |
Net asset value, end of period (x) | | | $10.82 | |
Total return (%) (r)(s)(t)(x) | | | 8.82 | (n) |
Ratios (%) (to average net assets)
and Supplemental data: | | | | |
Expenses before expense reductions (f) | | | 4.45 | (a) |
Expenses after expense reductions (f) | | | 1.15 | (a) |
Net investment income | | | 1.40 | (a) |
Portfolio turnover | | | 30 | (n) |
Net assets at end of period (000 omitted) | | | $1,154 | |
See Notes to Financial Statements
20
Financial Highlights – continued
| | | | |
| Class B | | Period ended | |
| | | 8/31/14 (c) | |
Net asset value, beginning of period | | | $10.00 | |
| Income (loss) from investment operations | | | | |
Net investment income (d) | | | $0.04 | |
Net realized and unrealized gain (loss) on investments and foreign currency | | | 0.78 | |
Total from investment operations | | | $0.82 | |
| Less distributions declared to shareholders | | | | |
From net investment income | | | $(0.01 | ) |
Net asset value, end of period (x) | | | $10.81 | |
Total return (%) (r)(s)(t)(x) | | | 8.23 | (n) |
Ratios (%) (to average net assets)
and Supplemental data: | | | | |
Expenses before expense reductions (f) | | | 5.75 | (a) |
Expenses after expense reductions (f) | | | 1.93 | (a) |
Net investment income | | | 0.46 | (a) |
Portfolio turnover | | | 30 | (n) |
Net assets at end of period (000 omitted) | | | $170 | |
| |
| Class C | | Period ended | |
| | | 8/31/14 (c) | |
Net asset value, beginning of period | | | $10.00 | |
| Income (loss) from investment operations | | | | |
Net investment income (d) | | | $0.04 | |
Net realized and unrealized gain (loss) on investments and foreign currency | | | 0.79 | |
Total from investment operations | | | $0.83 | |
| Less distributions declared to shareholders | | | | |
From net investment income | | | $(0.03 | ) |
Net asset value, end of period (x) | | | $10.80 | |
Total return (%) (r)(s)(t)(x) | | | 8.27 | (n) |
Ratios (%) (to average net assets)
and Supplemental data: | | | | |
Expenses before expense reductions (f) | | | 5.39 | (a) |
Expenses after expense reductions (f) | | | 1.93 | (a) |
Net investment income | | | 0.48 | (a) |
Portfolio turnover | | | 30 | (n) |
Net assets at end of period (000 omitted) | | | $421 | |
See Notes to Financial Statements
21
Financial Highlights – continued
| | | | |
| Class I | | Period ended | |
| | | 8/31/14 (c) | |
Net asset value, beginning of period | | | $10.00 | |
| Income (loss) from investment operations | | | | |
Net investment income (d) | | | $0.11 | |
Net realized and unrealized gain (loss) on investments and foreign currency | | | 0.80 | |
Total from investment operations | | | $0.91 | |
| Less distributions declared to shareholders | | | | |
From net investment income | | | $(0.07 | ) |
Net asset value, end of period (x) | | | $10.84 | |
Total return (%) (r)(s)(x) | | | 9.09 | (n) |
Ratios (%) (to average net assets)
and Supplemental data: | | | | |
Expenses before expense reductions (f) | | | 4.72 | (a) |
Expenses after expense reductions (f) | | | 0.93 | (a) |
Net investment income | | | 1.43 | (a) |
Portfolio turnover | | | 30 | (n) |
Net assets at end of period (000 omitted) | | | $177 | |
| |
| Class R1 | | Period ended | |
| | | 8/31/14 (c) | |
Net asset value, beginning of period | | | $10.00 | |
| Income (loss) from investment operations | | | | |
Net investment income (d) | | | $0.03 | |
Net realized and unrealized gain (loss) on investments and foreign currency | | | 0.80 | |
Total from investment operations | | | $0.83 | |
| Less distributions declared to shareholders | | | | |
From net investment income | | | $(0.01 | ) |
Net asset value, end of period (x) | | | $10.82 | |
Total return (%) (r)(s)(x) | | | 8.30 | (n) |
Ratios (%) (to average net assets)
and Supplemental data: | | | | |
Expenses before expense reductions (f) | | | 5.92 | (a) |
Expenses after expense reductions (f) | | | 1.93 | (a) |
Net investment income | | | 0.40 | (a) |
Portfolio turnover | | | 30 | (n) |
Net assets at end of period (000 omitted) | | | $108 | |
See Notes to Financial Statements
22
Financial Highlights – continued
| | | | |
| Class R2 | | Period ended | |
| | | 8/31/14 (c) | |
Net asset value, beginning of period | | | $10.00 | |
| Income (loss) from investment operations | | | | |
Net investment income (d) | | | $0.07 | |
Net realized and unrealized gain (loss) on investments and foreign currency | | | 0.80 | |
Total from investment operations | | | $0.87 | |
| Less distributions declared to shareholders | | | | |
From net investment income | | | $(0.04 | ) |
Net asset value, end of period (x) | | | $10.83 | |
Total return (%) (r)(s)(x) | | | 8.69 | (n) |
Ratios (%) (to average net assets)
and Supplemental data: | | | | |
Expenses before expense reductions (f) | | | 5.42 | (a) |
Expenses after expense reductions (f) | | | 1.43 | (a) |
Net investment income | | | 0.90 | (a) |
Portfolio turnover | | | 30 | (n) |
Net assets at end of period (000 omitted) | | | $109 | |
| |
| Class R3 | | Period ended | |
| | | 8/31/14 (c) | |
Net asset value, beginning of period | | | $10.00 | |
| Income (loss) from investment operations | | | | |
Net investment income (d) | | | $0.09 | |
Net realized and unrealized gain (loss) on investments and foreign currency | | | 0.79 | |
Total from investment operations | | | $0.88 | |
| Less distributions declared to shareholders | | | | |
From net investment income | | | $(0.05 | ) |
Net asset value, end of period (x) | | | $10.83 | |
Total return (%) (r)(s)(x) | | | 8.84 | (n) |
Ratios (%) (to average net assets)
and Supplemental data: | | | | |
Expenses before expense reductions (f) | | | 5.17 | (a) |
Expenses after expense reductions (f) | | | 1.18 | (a) |
Net investment income | | | 1.15 | (a) |
Portfolio turnover | | | 30 | (n) |
Net assets at end of period (000 omitted) | | | $109 | |
See Notes to Financial Statements
23
Financial Highlights – continued
| | | | |
| Class R4 | | Period ended | |
| | | 8/31/14 (c) | |
Net asset value, beginning of period | | | $10.00 | |
| Income (loss) from investment operations | | | | |
Net investment income (d) | | | $0.11 | |
Net realized and unrealized gain (loss) on investments and foreign currency | | | 0.80 | |
Total from investment operations | | | $0.91 | |
| Less distributions declared to shareholders | | | | |
From net investment income | | | $(0.07 | ) |
Net asset value, end of period (x) | | | $10.84 | |
Total return (%) (r)(s)(x) | | | 9.09 | (n) |
Ratios (%) (to average net assets)
and Supplemental data: | | | | |
Expenses before expense reductions (f) | | | 4.92 | (a) |
Expenses after expense reductions (f) | | | 0.93 | (a) |
Net investment income | | | 1.40 | (a) |
Portfolio turnover | | | 30 | (n) |
Net assets at end of period (000 omitted) | | | $109 | |
| |
| Class R5 | | Period ended | |
| | | 8/31/14 (c) | |
Net asset value, beginning of period | | | $10.00 | |
| Income (loss) from investment operations | | | | |
Net investment income (d) | | | $0.11 | |
Net realized and unrealized gain (loss) on investments and foreign currency | | | 0.80 | |
Total from investment operations | | | $0.91 | |
| Less distributions declared to shareholders | | | | |
From net investment income | | | $(0.07 | ) |
Net asset value, end of period (x) | | | $10.84 | |
Total return (%) (r)(s)(x) | | | 9.11 | (n) |
Ratios (%) (to average net assets)
and Supplemental data: | | | | |
Expenses before expense reductions (f) | | | 4.90 | (a) |
Expenses after expense reductions (f) | | | 0.91 | (a) |
Net investment income | | | 1.42 | (a) |
Portfolio turnover | | | 30 | (n) |
Net assets at end of period (000 omitted) | | | $1,527 | |
See Notes to Financial Statements
24
Financial Highlights – continued
| (c) | For the period from the commencement of the fund’s investment operations, December 5, 2013, through the stated period end. |
| (d) | Per share data is based on average shares outstanding. |
| (f) | Ratios do not reflect reductions from fees paid indirectly, if applicable. |
| (r) | Certain expenses have been reduced without which performance would have been lower. |
| (s) | From time to time the fund may receive proceeds from litigation settlements, without which performance would be lower. |
| (t) | Total returns do not include any applicable sales charges. |
| (x) | The net asset values per share and total returns have been calculated on net asset values which include adjustments made in accordance with U.S. generally accepted accounting principles required at period end for financial reporting purposes. |
See Notes to Financial Statements
25
NOTES TO FINANCIAL STATEMENTS
(1) Business and Organization
MFS Low Volatility Equity Fund (the fund) is a diversified series of MFS Series Trust I (the trust). The trust is organized as a Massachusetts business trust and is registered under the Investment Company Act of 1940, as amended, as an open-end management investment company.
The fund is an investment company and accordingly follows the investment company accounting and reporting guidance of the Financial Accounting Standards Board (FASB) Accounting Standards Codification Topic 946 Financial Services – Investment Companies.
(2) Significant Accounting Policies
General – The preparation of financial statements in conformity with U.S. generally accepted accounting principles requires management to make estimates and assumptions that affect the reported amounts of assets and liabilities, and disclosure of contingent assets and liabilities at the date of the financial statements and the reported amounts of increases and decreases in net assets from operations during the reporting period. Actual results could differ from those estimates. In the preparation of these financial statements, management has evaluated subsequent events occurring after the date of the fund’s Statement of Assets and Liabilities through the date that the financial statements were issued.
In June 2014, FASB issued Accounting Standards Update 2014-11, Transfers and Servicing (Topic 860) – Repurchase-to-Maturity Transactions, Repurchase Financings, and Disclosures (“ASU 2014-11”). ASU 2014-11 changes the accounting for repurchase-to-maturity transactions (i.e., repurchase agreements that settle at the same time as the maturity of the transferred financial asset) and enhances the required disclosures for repurchase agreements and other similar transactions. Although still evaluating the potential impacts of ASU 2014-11 to the fund, management expects that the impact of the fund’s adoption will be limited to additional financial statement disclosures which would first be effective for interim reporting periods beginning after March 15, 2015.
Balance Sheet Offsetting – The fund’s accounting policy with respect to balance sheet offsetting is that, absent an event of default by the counterparty or a termination of the agreement, the International Swaps and Derivatives Association (ISDA) Master Agreement does not result in an offset of reported amounts of financial assets and financial liabilities in the Statement of Assets and Liabilities across transactions between the fund and the applicable counterparty. The fund’s right to setoff may be restricted or prohibited by the bankruptcy or insolvency laws of the particular jurisdiction to which a specific master netting agreement counterparty is subject. Balance sheet offsetting disclosures, to the extent applicable to the fund, have been included in the fund’s Significant Accounting Policies note under the captions for each of the fund’s in-scope financial instruments and transactions.
Investment Valuations – Equity securities, including restricted equity securities, are generally valued at the last sale or official closing price as provided by a third-party pricing service on the market or exchange on which they are primarily traded. Equity
26
Notes to Financial Statements – continued
securities, for which there were no sales reported that day, are generally valued at the last quoted daily bid quotation as provided by a third-party pricing service on the market or exchange on which such securities are primarily traded. Short-term instruments with a maturity at issuance of 60 days or less generally are valued at amortized cost, which approximates market value. Open-end investment companies are generally valued at net asset value per share. Securities and other assets generally valued on the basis of information from a third-party pricing service may also be valued at a broker/dealer bid quotation. Values obtained from third-party pricing services can utilize both transaction data and market information such as yield, quality, coupon rate, maturity, type of issue, trading characteristics, and other market data.
The Board of Trustees has delegated primary responsibility for determining or causing to be determined the value of the fund’s investments (including any fair valuation) to the adviser pursuant to valuation policies and procedures approved by the Board. If the adviser determines that reliable market quotations are not readily available, investments are valued at fair value as determined in good faith by the adviser in accordance with such procedures under the oversight of the Board of Trustees. Under the fund’s valuation policies and procedures, market quotations are not considered to be readily available for most types of debt instruments and floating rate loans and many types of derivatives. These investments are generally valued at fair value based on information from third-party pricing services. In addition, investments may be valued at fair value if the adviser determines that an investment’s value has been materially affected by events occurring after the close of the exchange or market on which the investment is principally traded (such as foreign exchange or market) and prior to the determination of the fund’s net asset value, or after the halting of trading of a specific security where trading does not resume prior to the close of the exchange or market on which the security is principally traded. Events that occur on a frequent basis after foreign markets close (such as developments in foreign markets and significant movements in the U.S. markets) and prior to the determination of the fund’s net asset value may be deemed to have a material effect on the value of securities traded in foreign markets. Accordingly, the fund’s foreign equity securities may often be valued at fair value. The adviser generally relies on third-party pricing services or other information (such as the correlation with price movements of similar securities in the same or other markets; the type, cost and investment characteristics of the security; the business and financial condition of the issuer; and trading and other market data) to assist in determining whether to fair value and at what value to fair value an investment. The value of an investment for purposes of calculating the fund’s net asset value can differ depending on the source and method used to determine value. When fair valuation is used, the value of an investment used to determine the fund’s net asset value may differ from quoted or published prices for the same investment. There can be no assurance that the fund could obtain the fair value assigned to an investment if it were to sell the investment at the same time at which the fund determines its net asset value per share.
Various inputs are used in determining the value of the fund’s assets or liabilities. These inputs are categorized into three broad levels. In certain cases, the inputs used to measure fair value may fall into different levels of the fair value hierarchy. In such cases, an investment’s level within the fair value hierarchy is based on the lowest level of input that is significant to the fair value measurement. The fund’s assessment of the
27
Notes to Financial Statements – continued
significance of a particular input to the fair value measurement in its entirety requires judgment, and considers factors specific to the investment. Level 1 includes unadjusted quoted prices in active markets for identical assets or liabilities. Level 2 includes other significant observable market-based inputs (including quoted prices for similar securities, interest rates, prepayment speed, and credit risk). Level 3 includes unobservable inputs, which may include the adviser’s own assumptions in determining the fair value of investments. The following is a summary of the levels used as of August 31, 2014 in valuing the fund’s assets or liabilities:
| | | | | | | | | | | | | | | | |
| Investments at Value | | Level 1 | | | Level 2 | | | Level 3 | | | Total | |
| Equity Securities | | | $3,826,523 | | | | $— | | | | $— | | | | $3,826,523 | |
| Mutual Funds | | | 132,053 | | | | — | | | | — | | | | 132,053 | |
| Total Investments | | | $3,958,576 | | | | $— | | | | $— | | | | $3,958,576 | |
For further information regarding security characteristics, see the Portfolio of Investments.
Indemnifications – Under the fund’s organizational documents, its officers and Trustees may be indemnified against certain liabilities and expenses arising out of the performance of their duties to the fund. Additionally, in the normal course of business, the fund enters into agreements with service providers that may contain indemnification clauses. The fund’s maximum exposure under these agreements is unknown as this would involve future claims that may be made against the fund that have not yet occurred.
Investment Transactions and Income – Investment transactions are recorded on the trade date. Dividends received in cash are recorded on the ex-dividend date. Certain dividends from foreign securities will be recorded when the fund is informed of the dividend if such information is obtained subsequent to the ex-dividend date. Dividend payments received in additional securities are recorded on the ex-dividend date in an amount equal to the value of the security on such date.
The fund may receive proceeds from litigation settlements. Any proceeds received from litigation involving portfolio holdings are reflected in the Statement of Operations in realized gain/loss if the security has been disposed of by the fund or in unrealized gain/loss if the security is still held by the fund. Any other proceeds from litigation not related to portfolio holdings are reflected as other income in the Statement of Operations.
Fees Paid Indirectly – The fund’s custody fee may be reduced according to an arrangement that measures the value of cash deposited with the custodian by the fund. This amount, for the period ended August 31, 2014, is shown as a reduction of total expenses in the Statement of Operations.
Tax Matters and Distributions – The fund intends to qualify as a regulated investment company, as defined under Subchapter M of the Internal Revenue Code, and to distribute all of its taxable income, including realized capital gains. As a result, no provision for federal income tax is required. The fund’s federal tax returns, when filed, will remain subject to examination by the Internal Revenue Service for a three year period. Management has analyzed the fund’s tax positions taken on federal and state tax returns for all open tax years and does not believe that there are any uncertain tax positions that require recognition of a tax liability.
28
Notes to Financial Statements – continued
Distributions to shareholders are recorded on the ex-dividend date. Income and capital gain distributions are determined in accordance with income tax regulations, which may differ from U.S. generally accepted accounting principles. Certain capital accounts in the financial statements are periodically adjusted for permanent differences in order to reflect their tax character. These adjustments have no impact on net assets or net asset value per share. Temporary differences which arise from recognizing certain items of income, expense, gain or loss in different periods for financial statement and tax purposes will reverse at some time in the future. Distributions in excess of net investment income or net realized gains are temporary overdistributions for financial statement purposes resulting from differences in the recognition or classification of income or distributions for financial statement and tax purposes.
During the period ended August 31, 2014, there were no significant adjustments due to differences between book and tax accounting.
The tax character of distributions declared to shareholders for the last fiscal year is as follows:
| | | | |
| | | 8/31/14 | |
| Ordinary income (including any short-term capital gains) | | | $16,493 | |
The federal tax cost and the tax basis components of distributable earnings were as follows:
| | | | |
| As of 8/31/14 | | | |
| Cost of investments | | | $3,733,926 | |
| Gross appreciation | | | 236,075 | |
| Gross depreciation | | | (11,425 | ) |
| Net unrealized appreciation (depreciation) | | | $224,650 | |
| Undistributed ordinary income | | | 12,254 | |
Multiple Classes of Shares of Beneficial Interest – The fund offers multiple classes of shares, which differ in their respective distribution and service fees. The fund’s income, realized and unrealized gain (loss), and common expenses are allocated to shareholders based on the daily net assets of each class. Dividends are declared separately for each class. Differences in per share dividend rates are generally due to differences in separate class expenses. Class B shares will convert to Class A shares
29
Notes to Financial Statements – continued
approximately eight years after purchase. The fund’s distributions declared to shareholders as reported in the Statement of Changes in Net Assets are presented by class as follows:
| | | | |
| | | From net investment
income | |
| | | Period
ended
8/31/14 (c) | |
| Class A | | | $3,470 | |
| Class B | | | 140 | |
| Class C | | | 618 | |
| Class I | | | 1,009 | |
| Class R1 | | | 97 | |
| Class R2 | | | 379 | |
| Class R3 | | | 521 | |
| Class R4 | | | 663 | |
| Class R5 | | | 9,596 | |
| Total | | | $16,493 | |
| (c) | For the period from the commencement of the fund’s investment operations, December 5, 2013, through the stated period end. |
(3) Transactions with Affiliates
Investment Adviser – The fund has an investment advisory agreement with MFS to provide overall investment management and related administrative services and facilities to the fund. The management fee is computed daily and paid monthly at the following annual rates:
| | | | |
| First $1 billion of average daily net assets | | | 0.75 | % |
| Next $1.5 billion of average daily net assets | | | 0.70 | % |
| Average daily net assets in excess of $2.5 billion | | | 0.65 | % |
MFS has agreed in writing to reduce its management fee to 0.60% of average daily net assets for the first $1 billion and 0.55% of average daily net assets in excess of $1 billion. This written agreement will continue until modified by the fund’s Board of Trustees, but such agreement will continue at least until December 31, 2015. For the period ended August 31, 2014, this management fee reduction amounted to $3,167, which is included in the reduction of total expenses in the Statement of Operations. MFS has also agreed in writing to reduce its management fee by a specified amount if certain MFS mutual fund assets exceed thresholds agreed to by MFS and the fund’s Board of Trustees. For the period ended August 31, 2014, this management fee reduction amounted to $83, which is included in the reduction of total expenses in the Statement of Operations. The management fee incurred for the period ended August 31, 2014 was equivalent to an annual effective rate of 0.60% of the fund’s average daily net assets.
The investment adviser has agreed in writing to pay a portion of the fund’s total annual operating expenses, exclusive of interest, taxes, extraordinary expenses, brokerage and
30
Notes to Financial Statements – continued
transaction costs, and investment-related expenses, such that total fund operating expenses do not exceed the following rates annually of each class’s average daily net assets:
| | | | | | | | | | | | | | | | | | | | | | | | | | | | | | | | | | |
| Classes | |
| A | | | B | | | C | | | I | | | R1 | | | R2 | | | R3 | | | R4 | | | R5 | |
| | 1.20% | | | | 1.95% | | | | 1.95% | | | | 0.95% | | | | 1.95% | | | | 1.45% | | | | 1.20% | | | | 0.95% | | | | 0.91% | |
This written agreement will continue until modified by the fund’s Board of Trustees, but such agreement will continue at least until December 31, 2015. For the period ended August 31, 2014, this reduction amounted to $77,172 and is included in the reduction of total expenses in the Statement of Operations.
Distributor – MFS Fund Distributors, Inc. (MFD), a wholly-owned subsidiary of MFS, as distributor, received $2,995 for the period ended August 31, 2014, as its portion of the initial sales charge on sales of Class A shares of the fund.
The Board of Trustees has adopted a distribution plan for certain share classes pursuant to Rule 12b-1 of the Investment Company Act of 1940.
The fund’s distribution plan provides that the fund will pay MFD for services provided by MFD and financial intermediaries in connection with the distribution and servicing of certain share classes. One component of the plan is a distribution fee paid to MFD and another component of the plan is a service fee paid to MFD. MFD may subsequently pay all, or a portion, of the distribution and/or service fees to financial intermediaries.
Distribution Plan Fee Table:
| | | | | | | | | | | | | | | | | | | | |
| | | Distribution
Fee Rate (d) | | | Service
Fee Rate (d) | | | Total
Distribution
Plan (d) | | | Annual
Effective
Rate (e) | | | Distribution
and Service
Fee | |
| Class A | | | — | | | | 0.25% | | | | 0.25% | | | | 0.22% | | | | $948 | |
| Class B | | | 0.75% | | | | 0.25% | | | | 1.00% | | | | 1.00% | | | | 861 | |
| Class C | | | 0.75% | | | | 0.25% | | | | 1.00% | | | | 1.00% | | | | 1,563 | |
| Class R1 | | | 0.75% | | | | 0.25% | | | | 1.00% | | | | 1.00% | | | | 767 | |
| Class R2 | | | 0.25% | | | | 0.25% | | | | 0.50% | | | | 0.50% | | | | 384 | |
| Class R3 | | | — | | | | 0.25% | | | | 0.25% | | | | 0.25% | | | | 192 | |
| Total Distribution and Service Fees | | | | $4,715 | |
| (d) | In accordance with the distribution plan for certain classes, the fund pays distribution and/or service fees equal to these annual percentage rates of each class’s average daily net assets. The distribution and service fee rates disclosed by class represent the current rates in effect at the end of the reporting period. Any rate changes, if applicable, are detailed below. |
| (e) | MFD has voluntarily agreed to rebate a portion of each class’s 0.25% service fee attributable to accounts for which MFD retains the 0.25% service fee except for accounts attributable to MFS or its affiliates’ seed money. For the period ended August 31, 2014, this rebate amounted to $98 for Class A, and is included in the reduction of total expenses in the Statement of Operations. |
Certain Class A shares are subject to a contingent deferred sales charge (CDSC) in the event of a shareholder redemption within 18 months of purchase. Class C shares are subject to a CDSC in the event of a shareholder redemption within 12 months of purchase. Class B shares are subject to a CDSC in the event of a shareholder redemption within six years of purchase. There were no contingent deferred sales charges imposed during the period ended August 31, 2014.
31
Notes to Financial Statements – continued
Shareholder Servicing Agent – MFS Service Center, Inc. (MFSC), a wholly-owned subsidiary of MFS, receives a fee from the fund for its services as shareholder servicing agent calculated as a percentage of the average daily net assets of the fund as determined periodically under the supervision of the fund’s Board of Trustees. For the period ended August 31, 2014, the fee was $362, which equated to 0.0172% annually of the fund’s average daily net assets. MFSC also receives payment from the fund for out-of-pocket expenses, sub-accounting and other shareholder servicing costs which may be paid to affiliated and unaffiliated service providers. Class R5 shares do not incur sub-accounting fees. For the period ended August 31, 2014, these out-of-pocket expenses, sub-accounting and other shareholder servicing costs amounted to $397.
Administrator – MFS provides certain financial, legal, shareholder communications, compliance, and other administrative services to the fund. Under an administrative services agreement, the fund partially reimburses MFS the costs incurred to provide these services. The fund is charged an annual fixed amount of $17,500 plus a fee based on average daily net assets. The administrative services fee incurred for the period ended August 31, 2014 was equivalent to an annual effective rate of 0.6129% of the fund’s average daily net assets.
Trustees’ and Officers’ Compensation – The fund pays compensation to independent Trustees in the form of a retainer, attendance fees, and additional compensation to Board and Committee chairpersons. The fund does not pay compensation directly to Trustees or officers of the fund who are also officers of the investment adviser, all of whom receive remuneration for their services to the fund from MFS. Certain officers and Trustees of the fund are officers or directors of MFS, MFD, and MFSC.
Other – This fund and certain other funds managed by MFS (the funds) have entered into services agreements (the Agreements) which provide for payment of fees by the funds to Tarantino LLC and Griffin Compliance LLC in return for the provision of services of an Independent Chief Compliance Officer (ICCO) and Assistant ICCO, respectively, for the funds. The funds can terminate the Agreements with Tarantino LLC and Griffin Compliance LLC at any time under the terms of the Agreements. The ICCO is an officer of the funds and the sole member of Tarantino LLC. Prior to June 1, 2014, Robyn L. Griffin served as the Assistant ICCO and was an officer of the funds. Ms. Griffin is the sole member of Griffin Compliance LLC. Effective May 31, 2014, Ms. Griffin resigned as Assistant ICCO and the service agreement between the funds and Griffin Compliance LLC was terminated. For the period ended August 31, 2014, the aggregate fees paid by the fund to Tarantino LLC and Griffin Compliance LLC were $9 and are included in “Miscellaneous” expense in the Statement of Operations. MFS has agreed to reimburse the fund for a portion of the payments made by the fund in the amount of $4, which is included in the reduction of total expenses in the Statement of Operations. Additionally, MFS has agreed to bear all expenses associated with office space, other administrative support, and supplies provided to the ICCO and Assistant ICCO.
The fund invests in the MFS Institutional Money Market Portfolio which is managed by MFS and seeks current income consistent with preservation of capital and liquidity.
32
Notes to Financial Statements – continued
Income earned on this investment is included in “Dividends from underlying affiliated funds” in the Statement of Operations. This money market fund does not pay a management fee to MFS.
On December 5, 2013, MFS purchased 140,000 shares of Class R5 and 10,000 shares of Class A, Class B, Class C, and Class I, Class R1, Class R2, Class R3, and Class R4 for an aggregate amount of $2,200,000.
At August 31, 2014, MFS held approximately 64% and 62% of the outstanding shares of Class B and Class I, respectively, and 100% of the outstanding shares each of Class R1, Class R2, Class R3, Class R4, and Class R5.
(4) Portfolio Securities
For the period ended August 31, 2014, purchases and sales of investments, other than short-term obligations, aggregated $4,488,760 and $888,349, respectively.
(5) Shares of Beneficial Interest
The fund’s Declaration of Trust permits the Trustees to issue an unlimited number of full and fractional shares of beneficial interest. Transactions in fund shares were as follows:
| | | | | | | | |
| | | Period ended
8/31/14 (c) | |
| | | Shares | | | Amount | |
| Shares sold | | | | | | | | |
Class A | | | 110,758 | | | | $1,150,103 | |
Class B | | | 15,774 | | | | 160,956 | |
Class C | | | 38,895 | | | | 404,114 | |
Class I | | | 16,190 | | | | 163,700 | |
Class R1 | | | 10,000 | | | | 100,000 | |
Class R2 | | | 10,000 | | | | 100,000 | |
Class R3 | | | 10,000 | | | | 100,000 | |
Class R4 | | | 10,000 | | | | 100,000 | |
Class R5 | | | 140,000 | | | | 1,400,000 | |
| | | 361,617 | | | | $3,678,873 | |
| | |
Shares issued to shareholders in
reinvestment of distributions | | | | | | | | |
Class A | | | 331 | | | | $3,470 | |
Class B | | | 13 | | | | 138 | |
Class C | | | 58 | | | | 618 | |
Class I | | | 96 | | | | 1,009 | |
Class R1 | | | 9 | | | | 97 | |
Class R2 | | | 36 | | | | 379 | |
Class R3 | | | 50 | | | | 521 | |
Class R4 | | | 63 | | | | 663 | |
Class R5 | | | 918 | | | | 9,596 | |
| | | 1,574 | | | | $16,491 | |
33
Notes to Financial Statements – continued
| | | | | | | | |
| | | Period ended
8/31/14 (c) | |
| | | Shares | | | Amount | |
| Shares reacquired | | | | | | | | |
Class A | | | (4,481 | ) | | | $(46,920 | ) |
Class B | | | (65 | ) | | | (700 | ) |
Class C | | | (8 | ) | | | (81 | ) |
| | | (4,554 | ) | | | $(47,701 | ) |
| | |
| Net change | | | | | | | | |
Class A | | | 106,608 | | | | $1,106,653 | |
Class B | | | 15,722 | | | | 160,394 | |
Class C | | | 38,945 | | | | 404,651 | |
Class I | | | 16,286 | | | | 164,709 | |
Class R1 | | | 10,009 | | | | 100,097 | |
Class R2 | | | 10,036 | | | | 100,379 | |
Class R3 | | | 10,050 | | | | 100,521 | |
Class R4 | | | 10,063 | | | | 100,663 | |
Class R5 | | | 140,918 | | | | 1,409,596 | |
| | | 358,637 | | | | $3,647,663 | |
| (c) | For the period from the commencement of the fund’s investment operations, December 5, 2013, through the stated period end. |
(6) Line of Credit
The fund and certain other funds managed by MFS participate in a $1.1 billion unsecured committed line of credit, subject to a $1 billion sublimit, provided by a syndication of banks under a credit agreement. Borrowings may be made for temporary financing needs. Interest is charged to each fund, based on its borrowings, generally at a rate equal to the higher of the Federal Reserve funds rate or one month LIBOR plus an agreed upon spread. A commitment fee, based on the average daily, unused portion of the committed line of credit, is allocated among the participating funds at the end of each calendar quarter. In addition, the fund and other funds managed by MFS have established unsecured uncommitted borrowing arrangements with certain banks for temporary financing needs. Interest is charged to each fund, based on its borrowings, at a rate equal to the Federal Reserve funds rate plus an agreed upon spread. For the period ended August 31, 2014, the fund’s commitment fee and interest expense were $5 and $0, respectively, and are included in “Miscellaneous” expense in the Statement of Operations.
34
Notes to Financial Statements – continued
(7) Transactions in Underlying Affiliated Funds-Affiliated Issuers
An affiliated issuer may be considered one in which the fund owns 5% or more of the outstanding voting securities, or a company which is under common control. For the purposes of this report, the fund assumes the following to be an affiliated issuer:
| | | | | | | | | | | | | | | | |
| Underlying Affiliated Fund | | Beginning
Shares/Par
Amount | | | Acquisitions
Shares/Par
Amount | | | Dispositions
Shares/Par
Amount | | | Ending
Shares/Par
Amount | |
MFS Institutional Money
Market Portfolio | | | — | | | | 3,591,099 | | | | (3,459,046 | ) | | | 132,053 | |
| | | | |
| Underlying Affiliated Fund | | Realized
Gain (Loss) | | | Capital Gain
Distributions | | | Dividend
Income | | | Ending
Value | |
MFS Institutional Money
Market Portfolio | | | $— | | | | $— | | | | $76 | | | | $132,053 | |
35
REPORT OF INDEPENDENT REGISTERED PUBLIC ACCOUNTING FIRM
To the Board of Trustees of MFS Series Trust I and Shareholders of MFS Low Volatility Equity Fund:
We have audited the accompanying statement of assets and liabilities of MFS Low Volatility Equity Fund (the Fund) (one of the series constituting MFS Series Trust I), including the portfolio of investments, as of August 31, 2014, and the related statement of operations, the statement of changes in net assets, and the financial highlights for the period from December 5, 2013, (commencement of operations) to August 31, 2014. These financial statements and financial highlights are the responsibility of the Fund’s management. Our responsibility is to express an opinion on these financial statements and financial highlights based on our audit.
We conducted our audit in accordance with the standards of the Public Company Accounting Oversight Board (United States). Those standards require that we plan and perform the audit to obtain reasonable assurance about whether the financial statements and financial highlights are free of material misstatement. We were not engaged to perform an audit of the Fund’s internal control over financial reporting. Our audit included consideration of internal control over financial reporting as a basis for designing audit procedures that are appropriate in the circumstances, but not for the purpose of expressing an opinion on the effectiveness of the Fund’s internal control over financial reporting. Accordingly, we express no such opinion. An audit also includes examining, on a test basis, evidence supporting the amounts and disclosures in the financial statements and financial highlights, assessing the accounting principles used and significant estimates made by management, and evaluating the overall financial statement presentation. Our procedures included confirmation of securities owned as of August 31, 2014, by correspondence with the custodian and others. We believe that our audit provides a reasonable basis for our opinion.
In our opinion, the financial statements and financial highlights referred to above present fairly, in all material respects, the financial position of MFS Low Volatility Equity Fund (one of the series constituting MFS Series Trust I) at August 31, 2014, the results of its operations, the changes in its net assets, and the financial highlights for the period from December 5, 2013, (commencement of operations) to August 31, 2014, in conformity with U.S. generally accepted accounting principles.

Boston, Massachusetts
October 16, 2014
36
TRUSTEES AND OFFICERS — IDENTIFICATION AND BACKGROUND
The Trustees and Officers of the Trust, as of October 1, 2014, are listed below, together with their principal occupations during the past five years. (Their titles may have varied during that period.) The address of each Trustee and Officer is 111 Huntington Avenue, Boston, Massachusetts 02199-7618. It is expected that the Board will appoint Mr. Timothy M. Fagan as Chief Compliance Officer of the MFS Funds on November 1, 2014.
| | | | | | | | |
Name, Age | | Position(s) Held with Fund | | Trustee/Officer
Since (h) | | Principal
Occupations During the Past Five Years | | Other Directorships (j) |
| INTERESTED TRUSTEES |
Robert J. Manning (k)
(age 50) | | Trustee | | February 2004 | | Massachusetts Financial Services Company, Chairman, Chief Executive Officer and Director; President (until 2009); Chief Investment Officer (until 2010) | | N/A |
Robin A. Stelmach (k)
(age 53) | | Trustee and President | | January 2014 | | Massachusetts Financial Services Company, Executive Vice President and Chief Operating Officer | | N/A |
| INDEPENDENT TRUSTEES | | |
David H. Gunning
(age 72) | | Trustee and Chair of Trustees | | January 2004 | | Private investor | | Lincoln Electric Holdings, Inc. (welding equipment manufacturer), Director; Development Alternatives, Inc. (consulting), Director/Non-Executive Chairman |
Steven E. Buller (age 63) | | Trustee | | February 2014 | | Chairman, Financial Accounting Standards Advisory Council; Standing Advisory Group, Public Company Accounting Oversight Board, Member; BlackRock, Inc. (investment management), Managing Director (until 2014), BlackRock Finco UK (investment management), Director (until 2014) | | N/A |
37
Trustees and Officers – continued
| | | | | | | | |
Name, Age | | Position(s) Held with Fund | | Trustee/Officer
Since (h) | | Principal
Occupations During the Past Five Years | | Other Directorships (j) |
Robert E. Butler
(age 72) | | Trustee | | January 2006 | | Consultant – investment company industry regulatory and compliance matters | | N/A |
Maureen R. Goldfarb
(age 59) | | Trustee | | January 2009 | | Private investor | | N/A |
William R. Gutow
(age 73) | | Trustee | | December 1993 | | Private investor and real estate consultant; Capitol Entertainment Management Company (video franchise), Vice Chairman | | Texas Donuts (donut franchise), Vice Chairman (until 2010) |
Michael Hegarty
(age 69) | | Trustee | | December 2004 | | Private investor | | Brookfield Office Properties, Inc. (real estate), Director; Rouse Properties Inc. (real estate), Director; Capmark Financial Group Inc. (real estate), Director |
John P. Kavanaugh
(age 59) | | Trustee | | January 2009 | | Private investor | | N/A |
Maryanne L. Roepke
(age 58) | | Trustee | | May 2014 | | American Century Investments (investment management), Senior Vice President and Chief Compliance Officer (until 2014) | | N/A |
Laurie J. Thomsen
(age 57) | | Trustee | | March 2005 | | Private investor; New Profit, Inc. (venture philanthropy), Executive Partner (until 2010) | | The Travelers Companies (insurance), Director |
Robert W. Uek
(age 73) | | Trustee | | January 2006 | | Consultant to investment company industry | | N/A |
| OFFICERS | | | | | | |
Christopher R. Bohane (k)
(age 40) | | Assistant Secretary and Assistant Clerk | | July 2005 | | Massachusetts Financial Services Company, Vice President and Assistant General Counsel | | N/A |
Kino Clark (k)
(age 46) | | Assistant Treasurer | | January 2012 | | Massachusetts Financial Services Company, Vice President | | N/A |
38
Trustees and Officers – continued
| | | | | | | | |
Name, Age | | Position(s) Held with Fund | | Trustee/Officer
Since (h) | | Principal
Occupations During the Past Five Years | | Other Directorships (j) |
Thomas H. Connors (k)
(age 55) | | Assistant Secretary and Assistant Clerk | | September 2012 | | Massachusetts Financial Services Company, Vice President and Senior Counsel; Deutsche Investment Management Americas Inc. (financial service provider), Director and Senior Counsel (until 2012) | | N/A |
Ethan D. Corey (k)
(age 50) | | Assistant Secretary and Assistant Clerk | | July 2005 | | Massachusetts Financial Services Company, Senior Vice President and Associate General Counsel | | N/A |
David L. DiLorenzo (k)
(age 46) | | Treasurer | | July 2005 | | Massachusetts Financial Services Company, Senior Vice President | | N/A |
Brian E. Langenfeld (k) (age 41) | | Assistant Secretary and Assistant Clerk | | June 2006 | | Massachusetts Financial Services Company, Vice President and Senior Counsel | | N/A |
Susan S. Newton (k) (age 64) | | Assistant Secretary and Assistant Clerk | | May 2005 | | Massachusetts Financial Services Company, Senior Vice President and Associate General Counsel | | N/A |
Susan A. Pereira (k)
(age 43) | | Assistant Secretary and Assistant Clerk | | July 2005 | | Massachusetts Financial Services Company, Vice President and Senior Counsel | | N/A |
Kasey L. Phillips (k) (age 43) | | Assistant Treasurer | | September 2012 | | Massachusetts Financial Services Company, Vice President; Wells Fargo Funds Management, LLC, Senior Vice President, Fund Treasurer (until 2012) | | N/A |
Mark N. Polebaum (k)
(age 62) | | Secretary and Clerk | | January 2006 | | Massachusetts Financial Services Company, Executive Vice President, General Counsel and Secretary | | N/A |
39
Trustees and Officers – continued
| | | | | | | | |
Name, Age | | Position(s) Held with Fund | | Trustee/Officer
Since (h) | | Principal
Occupations During the Past Five Years | | Other Directorships (j) |
Matthew A. Stowe (k)
(age 39) | | Assistant Secretary and Assistant Clerk | | October 2014 | | Massachusetts Financial Services Company, Vice President and Senior Counsel | | N/A |
Frank L. Tarantino (l)
(age 70) | | Independent Chief Compliance Officer | | June 2004 | | Tarantino LLC (provider of compliance services), Principal | | N/A |
Richard S. Weitzel (k)
(age 44) | | Assistant Secretary and Assistant Clerk | | October 2007 | | Massachusetts Financial Services Company, Senior Vice President and Associate General Counsel | | N/A |
James O. Yost (k)
(age 54) | | Deputy Treasurer | | September 1990 | | Massachusetts Financial Services Company, Senior Vice President | | N/A |
| (h) | Date first appointed to serve as Trustee/officer of an MFS Fund. Each Trustee has served continuously since appointment unless indicated otherwise. For the period from December 15, 2004 until February 22, 2005, Mr. Manning served as Advisory Trustee. Prior to January 2012, Messrs. DiLorenzo and Yost served as Assistant Treasurers of the Funds. Ms. Stelmach was appointed as President of the Funds as of October 1, 2014. |
| (j) | Directorships or trusteeships of companies required to report to the Securities and Exchange Commission (i.e., “public companies”). |
| (k) | “Interested person” of the Trust within the meaning of the Investment Company Act of 1940 (referred to as the 1940 Act), which is the principal federal law governing investment companies like the fund, as a result of position with MFS. The address of MFS is 111 Huntington Avenue, Boston, Massachusetts 02199-7618. |
| (l) | Mr. Tarantino will retire as Independent Chief Compliance Officer of the MFS Funds on October 31, 2014. It is expected that Mr. Tarantino will continue after that date as an Independent Senior Officer of the MFS Funds. |
Each Trustee (except Ms. Stelmach, Mr. Buller and Ms. Roepke) has been elected by shareholders and each Trustee and officer holds office until his or her successor is chosen and qualified or until his or her earlier death, resignation, retirement or removal. The Trust does not hold annual meetings for the purpose of electing Trustees, and Trustees are not elected for fixed terms. Messrs. Butler, Kavanaugh, Uek and Mses. Thomsen and Roepke are members of the Trust’s Audit Committee.
Each of the Fund’s Trustees and officers holds comparable positions with certain other funds of which MFS or a subsidiary is the investment adviser or distributor, and, in the case of the officers, with certain affiliates of MFS. As of January 1, 2014, the Trustees served as board members of 142 funds within the MFS Family of Funds.
40
Trustees and Officers – continued
The Statement of Additional Information for the Fund includes further information about the Trustees and is available without charge upon request by calling 1-800-225-2606.
| | |
| Investment Adviser | | Custodian |
Massachusetts Financial Services Company
111 Huntington Avenue
Boston, MA 02199-7618 | | State Street Bank and Trust Company 1 Lincoln Street Boston, MA 02111-2900 |
| Distributor | | Independent Registered Public Accounting Firm |
MFS Fund Distributors, Inc.
111 Huntington Avenue
Boston, MA 02199-7618 | | Ernst & Young LLP 200 Clarendon Street Boston, MA 02116 |
| Portfolio Managers | | |
James Fallon Matthew Krummell | | |
41
PROXY VOTING POLICIES AND INFORMATION
MFS votes proxies on behalf of the fund pursuant to proxy voting policies and procedures that are available without charge, upon request, by calling 1-800-225-2606, by visiting the Proxy Voting section of mfs.com or by visiting the SEC’s Web site at http://www.sec.gov.
Information regarding how the fund voted proxies relating to portfolio securities during the most recent twelve-month period ended June 30 is available without charge by visiting the Proxy Voting section of mfs.com or by visiting the SEC’s Web site at http://www.sec.gov.
QUARTERLY PORTFOLIO DISCLOSURE
The fund will file a complete schedule of portfolio holdings with the Securities and Exchange Commission (the Commission) for the first and third quarters of each fiscal year on Form N-Q. A shareholder can obtain the quarterly portfolio holdings report at mfs.com. The fund’s Form N-Q is also available on the EDGAR database on the Commission’s Internet Web site at http://www.sec.gov, and may be reviewed and copied at the:
Public Reference Room
Securities and Exchange Commission
100 F Street, NE, Room 1580
Washington, D.C. 20549
Information on the operation of the Public Reference Room may be obtained by calling the Commission at 1-800-SEC-0330. Copies of the fund’s Form N-Q also may be obtained, upon payment of a duplicating fee, by electronic request at the following e-mail address: publicinfo@sec.gov or by writing the Public Reference Section at the above address.
FURTHER INFORMATION
From time to time, MFS may post important information about the fund or the MFS funds on the MFS web site (mfs.com). This information is available by visiting the “Commentary & Announcements” and “Market Outlooks” sections of mfs.com or by clicking on the fund’s name under “Mutual Funds” in the “Products” section of mfs.com.
FEDERAL TAX INFORMATION (unaudited)
The fund will notify shareholders of amounts for use in preparing 2014 income tax forms in January 2015. The following information is provided pursuant to provisions of the Internal Revenue Code.
The fund designates the maximum amount allowable as qualified dividend income eligible to be taxed at the same rate as long-term capital gain.
For corporate shareholders, 100% of the ordinary income dividends paid during the fiscal year qualify for the corporate dividends received deduction.
42
rev. 3/11
| | | | |
| | | |
FACTS | | WHAT DOES MFS DO WITH YOUR PERSONAL INFORMATION? | |  |
| | |
| Why? | | Financial companies choose how they share your personal information. Federal law gives consumers the right to limit some but not all sharing. Federal law also requires us to tell you how we collect, share, and protect your personal information. Please read this notice carefully to understand what we do. |
| | |
| What? | | The types of personal information we collect and share depend on the product or service you have with us. This information can include: • Social Security number and account balances • Account transactions and transaction history • Checking account information and wire transfer instructions When you are no longer our customer, we continue to share your information as described in this notice. |
| | |
| How? | | All financial companies need to share customers’ personal information to run their everyday business. In the section below, we list the reasons financial companies can share their customers’ personal information; the reasons MFS chooses to share; and whether you can limit this sharing. |
| | | | |
Reasons we can share your
personal information | | Does MFS
share? | | Can you limit
this sharing? |
For our everyday business purposes – such as to process your transactions, maintain your account(s), respond to court orders and legal investigations, or report to credit bureaus | | Yes | | No |
For our marketing purposes – to offer our products and services to you | | No | | We don’t share |
| For joint marketing with other financial companies | | No | | We don’t share |
For our affiliates’ everyday business purposes – information about your transactions and experiences | | No | | We don’t share |
For our affiliates’ everyday business purposes – information about your creditworthiness | | No | | We don’t share |
| For nonaffiliates to market to you | | No | | We don’t share |
| | |
| Questions? | | Call 800-225-2606 or go to mfs.com. |
43
| | |
| Who we are |
| Who is providing this notice? | | MFS Funds, MFS Investment Management, MFS Institutional Advisors, Inc., MFS Fund Distributors, Inc., MFS Heritage Trust Company, and MFS Service Center, Inc. |
| | |
| What we do |
| How does MFS protect my personal information? | | To protect your personal information from unauthorized access and use, we use security measures that comply with federal law. These measures include procedural, electronic, and physical safeguards for the protection of the personal information we collect about you. |
| How does MFS collect my personal information? | | We collect your personal information, for example, when you •open an account or provide account information •direct us to buy securities or direct us to sell your securities •make a wire transfer We also collect your personal information from others, such as credit bureaus, affiliates and other companies. |
| Why can’t I limit all sharing? | | Federal law gives you the right to limit only •sharing for affiliates’ everyday business purposes – information about your creditworthiness •affiliates from using your information to market to you •sharing for nonaffiliates to market to you State laws and individual companies may give you additional rights to limit sharing. |
| | |
| Definitions |
| Affiliates | | Companies related by common ownership or control. They can be financial and nonfinancial companies. •MFS does not share personal information with affiliates, except for everyday business purposes as described on page one of this notice. |
| Nonaffiliates | | Companies not related by common ownership or control. They can be financial and nonfinancial companies. •MFS does not share with nonaffiliates so they can market to you. |
| Joint Marketing | | A formal agreement between nonaffiliated financial companies that together market financial products or services to you. •MFS doesn’t jointly market. |
| | |
| Other important information |
| If you own an MFS product or receive an MFS service in the name of a third party such as a bank or broker-dealer, their privacy policy may apply to you instead of ours. |
44
Save paper with eDelivery.

| MFS® will send you prospectuses, |
reports, and proxies directly via e-mail so you will get information faster with less mailbox clutter.
To sign up:
1. Go to mfs.com.
2. Log in via MFS® Access.
3. Select eDelivery.
If you own your MFS fund shares through a financial institution or a retirement plan, MFS® TALK, MFS® Access, or eDelivery may not be available to you.
CONTACT
WEB SITE
mfs.com
MFS TALK
1-800-637-8255
24 hours a day
ACCOUNT SERVICE AND LITERATURE
Shareholders
1-800-225-2606
Financial advisors
1-800-343-2829
Retirement plan services
1-800-637-1255
MAILING ADDRESS
MFS Service Center, Inc.
P.O. Box 55824
Boston, MA 02205-5824
OVERNIGHT MAIL
MFS Service Center, Inc.
c/o Boston Financial Data Services
30 Dan Road
Canton, MA 02021-2809
ANNUAL REPORT
August 31, 2014

MFS® NEW DISCOVERY FUND

NDF-ANN
MFS® NEW DISCOVERY FUND
CONTENTS
The report is prepared for the general information of shareholders.
It is authorized for distribution to prospective investors only when preceded or accompanied by a current prospectus.
NOT FDIC INSURED Ÿ MAY LOSE VALUE Ÿ NO BANK GUARANTEE

LETTER FROM THE CHAIRMAN AND CEO
Dear Shareholders:
The U.S. economy continues to gain strength. Manufacturing output, construction activity and consumer confidence are all at multi-year highs, auto sales are robust, and
U.S. labor market reports show broad progress. Even a slowdown in the pace of rising house prices is seen as making the market more sustainable. Economists have a favorable outlook, and broad stock indices reflect that.
However, challenges dominate the rest of the global economy. China is struggling to boost its industrial output and Japan’s economic turnaround appears to have hit a setback after its sales tax increase in April. The eurozone economy is being held back by persistently high unemployment and dangerously low inflation, leading the European Central Bank to take more
aggressive stimulus action. With robust corporate earnings, the market’s greatest concerns relate to conflicts in the Middle East and Ukraine. In addition, speculation continues on when the U.S. Federal Reserve will begin tightening its monetary policy now that the U.S. economy has regained some traction.
As always at MFS®, active risk management is integral to how we manage your investments. We use a collaborative process, sharing insights across asset classes, regions and economic sectors. Our global team of investment professionals uses a multidisciplined, long-term, diversified investment approach.
We understand that these are challenging economic times. We believe we can serve you best by applying proven principles, such as asset allocation and diversification, over the long term. We are confident that this approach can help you as you work with your financial advisors to reach your goals in the years ahead.
Respectfully,

Robert J. Manning
Chairman and Chief Executive Officer
MFS Investment Management
October 16, 2014
The opinions expressed in this letter are subject to change and may not be relied upon for investment advice. No forecasts can be guaranteed.
1
PORTFOLIO COMPOSITION
Portfolio structure (i)
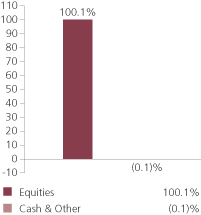
| | | | |
| Top ten holdings (i) | | | | |
| Constant Contact, Inc. | | | 1.9% | |
| Urban Outfitters, Inc. | | | 1.9% | |
| Atwood Oceanics, Inc. | | | 1.8% | |
| Swift Transportation Co. | | | 1.7% | |
| SciQuest, Inc. | | | 1.6% | |
| HomeAway, Inc. | | | 1.6% | |
| Diana Shipping, Inc. | | | 1.6% | |
| Ultimate Software Group, Inc. | | | 1.5% | |
| Concur Technologies, Inc. | | | 1.5% | |
| Peabody Energy Corp. | | | 1.5% | |
| | | | |
| Equity sectors (i) | | | | |
| Technology | | | 19.4% | |
| Special Products & Services | | | 15.0% | |
| Health Care | | | 14.8% | |
| Energy | | | 9.6% | |
| Industrial Goods & Services | | | 7.9% | |
| Retailing | | | 7.8% | |
| Basic Materials | | | 6.8% | |
| Leisure | | | 5.9% | |
| Transportation | | | 4.4% | |
| Financial Services | | | 3.0% | |
| Consumer Staples | | | 2.6% | |
| Autos & Housing | | | 2.4% | |
| Utilities & Communications | | | 0.5% | |
| (i) | For purposes of this presentation, the components include the value of securities, less any securities sold short, and reflect the impact of the equivalent exposure of derivative positions. These amounts may be negative from time to time. Equivalent exposure is a calculated amount that translates the derivative position into a reasonable approximation of the amount of the underlying asset that the portfolio would have to hold at a given point in time to have the same price sensitivity that results from the portfolio’s ownership of the derivative contract. When dealing with derivatives, equivalent exposure is a more representative measure of the potential impact of a position on portfolio performance than value. |
From time to time Cash & Other may be negative due to timing of cash receipts and/or equivalent exposure from any derivative holdings.
Cash & Other can include cash, other assets less liabilities, offsets to derivative positions, and short-term securities.
Percentages are based on net assets as of 8/31/14.
The portfolio is actively managed and current holdings may be different.
2
MANAGEMENT REVIEW
Summary of Results
For the twelve months ended August 31, 2014, Class A shares of the MFS New Discovery Fund (“fund”) provided a total return of 8.01%, at net asset value. This compares with a return of 17.30% for the fund’s benchmark, the Russell 2000 Growth Index.
Market Environment
Early in the period, equity markets advanced in response to improved economic fundamentals, having recovered from prior weakness stemming from concerns that the US Federal Reserve (“Fed”) would begin tapering its quantitative easing (“QE”) program. A general theme in the market was a rotation in investor allocations from fixed income to equities and emerging markets (“EM”) to developed markets, reflecting an anticipated acceleration in developed market growth rates relative to EM as well as a more equity-friendly macro backdrop amid increased volatility in EM debt. As the period progressed, the Fed’s decision to postpone QE tapering surprised markets. Favorable market reactions were tempered, however, by tense negotiations over US fiscal policy which resulted in a 16-day partial shutdown of the federal government and a short-term extension in the debt ceiling. The volatility was short-lived, however, as an extension of budget and debt ceiling deadlines allowed the government to re-open, and subsequent economic data reflected moderate but resilient US growth. Also well-received was the decision by the European Central Bank (“ECB”) to cut its policy rate as inflation pressures waned in the region. In addition, equity investors appeared to have concluded that there would be no major change in US monetary policy as a result of the nomination of Janet Yellen as the new Fed Chair for a term beginning in early 2014 and that tapering would have no major impact on the trajectory.
Later in the period, financial markets were forced to contend with a series of positive and negative return episodes. In addition to periodic flashpoints in country specific emerging markets, geopolitical tensions flared in the Middle East and Russia/Ukraine. Market setbacks were short-lived, as improving economic growth in the US coupled with prospects for easier monetary policy in regions with slowing growth such as Japan, Europe and China, supported risk assets. For example, the ECB cut policy interest rates into negative territory and by the end of the period expectations were for additional rate cuts and the announcement for non-conventional easing measures. The decline in developed market government bond yields and credit spreads were also supportive for equity markets. At the end of the period, the US equity market was trading at all-time highs.
Detractors from Performance
Stock selection in both the technology and energy sectors detracted from performance relative to the Russell 2000 Growth Index. Within the technology sector, the fund’s overweight positions in fleet management software provider Fleetmatics Group, information management software company Commvault Systems (h), revenue management systems developer Model N and mobile advertising company Millennial Media (h) hindered relative performance. Shares of Fleetmatics Group declined due to
3
Management Review – continued
higher operating costs and the impact from the company’s acquisition of technology company Routist during the reporting period. There were no individual securities within the energy sector that were among the fund’s top relative detractors. The fund’s overweight position in the strong performing energy sector served to offset a portion of the negative impact from stock selection.
Stock selection, and to a lesser extent, an underweight position in the health care sector dampened relative performance, led by the fund’s overweight position in poor-performing ophthalmic device manufacturer TearLab. Shares of TearLab declined steadily during the reporting period as management reduced guidance due to a decline in sales. Not holding strong-performing biotechnology company Intermune also weakened relative performance as the stock outperformed the benchmark during the reporting period.
Weak stock selection in the transportation sector held back relative returns. Holdings of outsourced aircraft and aviation operating services provider Atlas Air (b)(h) and Mexico-based aircraft transportation services company Controladora Vuela (b)(h) hindered relative performance. Shares of Atlas Air came under pressure as the company experienced a decline in military charter demand, increased competition and a weaker-than-expected peak season.
Elsewhere, the fund’s overweight position in grocery store operator Fairway Group Holdings, and holdings of manufacturing company Molycorp (b), were also among the top relative detractors. Shares of Fairway dropped after the gourmet grocer reported weaker-than-expected results due, in part, to lower-than-expected new store sales, particularly in the Chelsea neighborhood of Manhattan, New York.
Contributors to Performance
Strong stock selection in the special products & services sector contributed to relative performance. The fund’s overweight position in marketing company Constant Contact, and holdings of travel company MakeMyTrip (b) (India) and educational services provider Kroton Educational (b)(h) (Brazil), supported relative returns. Shares of MakeMyTrip rose throughout the reporting period as a result of increased volume and demand in the company’s air and hotel segments.
Elsewhere, the fund’s holdings of aluminum production company Century Aluminum (b) and an overweight position in diversified metals company Globe Specialty Metals, aided relative performance. Century Aluminum turned in strong performance during the reporting period as a result of a better pricing environment, reduced costs and an improved product mix. Holdings of natural gas and oil company Rice Energy (b), coal and natural gas company CONSOL Energy (b), integrated logistics company Navios Maritime Holdings (b) (Monaco), online professional network LinkedIn (b), and the timing of the fund’s ownership in shares of zinc and nickel-based products maker Horsehead Holding, were also among the fund’s top relative contributors for the period.
Respectfully,
| | |
Michael Grossman Portfolio Manager | | Thomas Wetherald Portfolio Manager |
4
Management Review – continued
Note to Shareholders: Effective December 31, 2013, Michael Grossman is also a Portfolio Manager of the Fund.
| (b) | Security is not a benchmark constituent. |
| (h) | Security was not held in the portfolio at period end. |
The views expressed in this report are those of the portfolio managers only through the end of the period of the report as stated on the cover and do not necessarily reflect the views of MFS or any other person in the MFS organization. These views are subject to change at any time based on market or other conditions, and MFS disclaims any responsibility to update such views. These views may not be relied upon as investment advice or an indication of trading intent on behalf of any MFS portfolio. References to specific securities are not recommendations of such securities, and may not be representative of any MFS portfolio’s current or future investments.
5
PERFORMANCE SUMMARY THROUGH 8/31/14
The following chart illustrates a representative class of the fund’s historical performance in comparison to its benchmark(s). Performance results include the deduction of the maximum applicable sales charge and reflect the percentage change in net asset value, including reinvestment of dividends and capital gains distributions. The performance of other share classes will be greater than or less than that of the class depicted below. Benchmarks are unmanaged and may not be invested in directly. Benchmark returns do not reflect sales charges, commissions or expenses. (See Notes to Performance Summary.)
Performance data shown represents past performance and is no guarantee of future results. Investment return and principal value fluctuate so your shares, when sold, may be worth more or less than the original cost; current performance may be lower or higher than quoted. The performance shown does not reflect the deduction of taxes, if any, that a shareholder would pay on fund distributions or the redemption of fund shares.
Growth of a Hypothetical $10,000 Investment
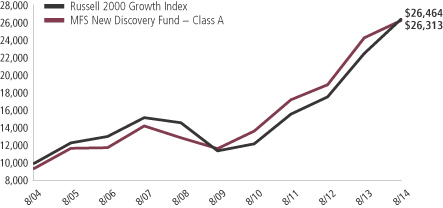
6
Performance Summary – continued
Total Returns through 8/31/14
Average annual without sales charge
| | | | | | | | | | | | | | |
| | | Share class | | Class inception date | | 1-yr | | 5-yr | | 10-yr | | Life (t) | | |
| | | A | | 1/02/97 | | 8.01% | | 17.63% | | 10.81% | | N/A | | |
| | | B | | 11/03/97 | | 7.18% | | 16.74% | | 10.03% | | N/A | | |
| | | C | | 11/03/97 | | 7.22% | | 16.74% | | 10.04% | | N/A | | |
| | | I | | 1/02/97 | | 8.25% | | 17.91% | | 11.14% | | N/A | | |
| | | R1 | | 4/01/05 | | 7.17% | | 16.74% | | N/A | | 9.44% | | |
| | | R2 | | 10/31/03 | | 7.72% | | 17.32% | | 10.53% | | N/A | | |
| | | R3 | | 4/01/05 | | 8.02% | | 17.61% | | N/A | | 10.26% | | |
| | | R4 | | 4/01/05 | | 8.31% | | 17.92% | | N/A | | 10.56% | | |
| | | R5 | | 6/01/12 | | 8.43% | | N/A | | N/A | | 20.40% | | |
| | | 529A | | 7/31/02 | | 7.97% | | 17.55% | | 10.66% | | N/A | | |
| | | 529B | | 7/31/02 | | 7.18% | | 16.67% | | 9.89% | | N/A | | |
| | | 529C | | 7/31/02 | | 7.13% | | 16.65% | | 9.88% | | N/A | | |
| Comparative benchmark | | | | | | | | | | |
| | | Russell 2000 Growth Index (f) | | 17.30% | | 18.29% | | 10.22% | | N/A | | |
| Average annual with sales charge | | | | | | | | | | |
| | | A
With initial Sales Charge (5.75%) | | 1.80% | | 16.24% | | 10.16% | | N/A | | |
| | | B
With CDSC (Declining over six years from 4% to 0%) (v) | | 3.32% | | 16.52% | | 10.03% | | N/A | | |
| | | C
With CDSC (1% for 12 months) (v) | | 6.25% | | 16.74% | | 10.04% | | N/A | | |
| | | 529A
With initial Sales Charge (5.75%) | | 1.76% | | 16.17% | | 10.01% | | N/A | | |
| | | 529B
With CDSC (Declining over six years from 4% to 0%) (v) | | 3.33% | | 16.46% | | 9.89% | | N/A | | |
| | | 529C
With CDSC (1% for 12 months) (v) | | 6.16% | | 16.65% | | 9.88% | | N/A | | |
CDSC – Contingent Deferred Sales Charge.
Class I, R1, R2, R3, R4, and R5 shares do not have a sales charge.
| (f) | Source: FactSet Research Systems Inc. |
| (t) | For the period from the class inception date through the stated period end (for those share classes with less than 10 years of performance history). No comparative benchmark performance information is provided for “life” periods. (See Notes to Performance Summary.) |
| (v) | Assuming redemption at the end of the applicable period. |
7
Performance Summary – continued
Benchmark Definition
Russell 2000 Growth Index – constructed to provide a comprehensive barometer for growth securities in the small-cap segment of the U.S. equity universe. Companies in this index generally have higher price-to-book ratios and higher forecasted growth values.
It is not possible to invest directly in an index.
Notes to Performance Summary
Class 529 shares are only available in conjunction with qualified tuition programs, such as the MFS 529 Savings Plan. There also is an additional fee, which is detailed in the program description, on qualified tuition programs. If this fee was reflected, the performance for Class 529 shares would have been lower. This annual fee is waived for Oregon residents and for those accounts with assets of $25,000 or more.
Average annual total return represents the average annual change in value for each share class for the periods presented. Life returns are presented where the share class has less than 10 years of performance history and represent the average annual total return from the class inception date to the stated period end date. As the fund’s share classes may have different inception dates, the life returns may represent different time periods and may not be comparable. As a result, no comparative benchmark performance information is provided for life periods.
Performance results reflect any applicable expense subsidies and waivers in effect during the periods shown. Without such subsidies and waivers the fund’s performance results would be less favorable. Please see the prospectus and financial statements for complete details.
Performance results do not include adjustments made for financial reporting purposes in accordance with U.S. generally accepted accounting principles and may differ from amounts reported in the financial highlights.
From time to time the fund may receive proceeds from litigation settlements, without which performance would be lower.
8
EXPENSE TABLE
Fund expenses borne by the shareholders during the period, March 1, 2014 through August 31, 2014
As a shareholder of the fund, you incur two types of costs: (1) transaction costs, including sales charges (loads) on certain purchase or redemption payments, and (2) ongoing costs, including management fees; distribution and service (12b-1) fees; and other fund expenses. This example is intended to help you understand your ongoing costs (in dollars) of investing in the fund and to compare these costs with the ongoing costs of investing in other mutual funds.
The example is based on an investment of $1,000 invested at the beginning of the period and held for the entire period March 1, 2014 through August 31, 2014.
Actual Expenses
The first line for each share class in the following table provides information about actual account values and actual expenses. You may use the information in this line, together with the amount you invested, to estimate the expenses that you paid over the period. Simply divide your account value by $1,000 (for example, an $8,600 account value divided by $1,000 = 8.6), then multiply the result by the number in the first line under the heading entitled “Expenses Paid During Period” to estimate the expenses you paid on your account during this period.
Hypothetical Example for Comparison Purposes
The second line for each share class in the following table provides information about hypothetical account values and hypothetical expenses based on the fund’s actual expense ratio and an assumed rate of return of 5% per year before expenses, which is not the fund’s actual return. The hypothetical account values and expenses may not be used to estimate the actual ending account balance or expenses you paid for the period. You may use this information to compare the ongoing costs of investing in the fund and other funds. To do so, compare this 5% hypothetical example with the 5% hypothetical examples that appear in the shareholder reports of the other funds.
Please note that the expenses shown in the table are meant to highlight your ongoing costs only and do not reflect any transactional costs, such as sales charges (loads). Therefore, the second line for each share class in the table is useful in comparing ongoing costs only, and will not help you determine the relative total costs of owning different funds. In addition, if these transactional costs were included, your costs would have been higher.
9
Expense Table – continued
| | | | | | | | | | | | | | | | | | |
Share
Class | | | | Annualized
Expense Ratio | | | Beginning
Account Value
3/01/14 | | | Ending Account Value
8/31/14 | | | Expenses Paid During Period (p) 3/01/14-8/31/14 | |
| A | | Actual | | | 1.29% | | | | $1,000.00 | | | | $959.35 | | | | $6.37 | |
| | Hypothetical (h) | | | 1.29% | | | | $1,000.00 | | | | $1,018.70 | | | | $6.56 | |
| B | | Actual | | | 2.04% | | | | $1,000.00 | | | | $955.77 | | | | $10.06 | |
| | Hypothetical (h) | | | 2.04% | | | | $1,000.00 | | | | $1,014.92 | | | | $10.36 | |
| C | | Actual | | | 2.04% | | | | $1,000.00 | | | | $955.84 | | | | $10.06 | |
| | Hypothetical (h) | | | 2.04% | | | | $1,000.00 | | | | $1,014.92 | | | | $10.36 | |
| I | | Actual | | | 1.04% | | | | $1,000.00 | | | | $960.45 | | | | $5.14 | |
| | Hypothetical (h) | | | 1.04% | | | | $1,000.00 | | | | $1,019.96 | | | | $5.30 | |
| R1 | | Actual | | | 2.04% | | | | $1,000.00 | | | | $955.52 | | | | $10.06 | |
| | Hypothetical (h) | | | 2.04% | | | | $1,000.00 | | | | $1,014.92 | | | | $10.36 | |
| R2 | | Actual | | | 1.54% | | | | $1,000.00 | | | | $957.71 | | | | $7.60 | |
| | Hypothetical (h) | | | 1.54% | | | | $1,000.00 | | | | $1,017.44 | | | | $7.83 | |
| R3 | | Actual | | | 1.29% | | | | $1,000.00 | | | | $959.32 | | | | $6.37 | |
| | Hypothetical (h) | | | 1.29% | | | | $1,000.00 | | | | $1,018.70 | | | | $6.56 | |
| R4 | | Actual | | | 1.04% | | | | $1,000.00 | | | | $960.60 | | | | $5.14 | |
| | Hypothetical (h) | | | 1.04% | �� | | | $1,000.00 | | | | $1,019.96 | | | | $5.30 | |
| R5 | | Actual | | | 0.92% | | | | $1,000.00 | | | | $961.23 | | | | $4.55 | |
| | Hypothetical (h) | | | 0.92% | | | | $1,000.00 | | | | $1,020.57 | | | | $4.69 | |
| 529A | | Actual | | | 1.32% | | | | $1,000.00 | | | | $959.04 | | | | $6.52 | |
| | Hypothetical (h) | | | 1.32% | | | | $1,000.00 | | | | $1,018.55 | | | | $6.72 | |
| 529B | | Actual | | | 2.07% | | | | $1,000.00 | | | | $955.44 | | | | $10.20 | |
| | Hypothetical (h) | | | 2.07% | | | | $1,000.00 | | | | $1,014.77 | | | | $10.51 | |
| 529C | | Actual | | | 2.09% | | | | $1,000.00 | | | | $955.01 | | | | $10.30 | |
| | Hypothetical (h) | | | 2.09% | | | | $1,000.00 | | | | $1,014.67 | | | | $10.61 | |
| (h) | 5% class return per year before expenses. |
| (p) | “Expenses Paid During Period” are equal to each class’s annualized expense ratio, as shown above, multiplied by the average account value over the period, multiplied by 184/365 (to reflect the one-half year period). Expenses paid do not include any applicable sales charges (loads). If these transaction costs had been included, your costs would have been higher. |
Notes to Expense Table
Each class with a Rule 12b-1 service fee is subject to a rebate of a portion of such fee. Such rebates are included in the expense ratios above. For Class A, Class 529A, and Class 529B shares, this rebate reduced the expense ratios above by 0.01%, 0.03%, and 0.02%, respectively. See Note 3 in the Notes to Financial Statements for additional information.
10
PORTFOLIO OF INVESTMENTS
8/31/14
The Portfolio of Investments is a complete list of all securities owned by your fund. It is categorized by broad-based asset classes.
| | | | | | | | |
| Common Stocks - 100.0% | | | | | | | | |
| Issuer | | Shares/Par | | | Value ($) | |
| | | | | | | | |
| Aerospace - 0.9% | | | | | | | | |
| FLIR Systems, Inc. | | | 522,062 | | | $ | 17,640,475 | |
| | |
| Automotive - 0.6% | | | | | | | | |
| Mobileye N.V. (a) | | | 287,852 | | | $ | 12,440,963 | |
| | |
| Biotechnology - 1.0% | | | | | | | | |
| Exact Sciences Corp. (a) | | | 579,148 | | | $ | 12,075,236 | |
| MiMedx Group, Inc. (a)(l) | | | 1,306,718 | | | | 9,199,295 | |
| | | | | | | | |
| | | | | | | $ | 21,274,531 | |
| Broadcasting - 1.3% | | | | | | | | |
| Live Nation, Inc. (a) | | | 515,011 | | | $ | 11,309,642 | |
| RetailMeNot, Inc. (a) | | | 861,438 | | | | 16,065,819 | |
| | | | | | | | |
| | | | | | | $ | 27,375,461 | |
| Brokerage & Asset Managers - 1.7% | | | | | | | | |
| FXCM, Inc., “A” | | | 1,160,372 | | | $ | 16,813,790 | |
| LPL Financial Holdings, Inc. | | | 166,132 | | | | 8,088,967 | |
| NASDAQ OMX Group, Inc. | | | 238,151 | | | | 10,352,424 | |
| | | | | | | | |
| | | | | | | $ | 35,255,181 | |
| Business Services - 10.1% | | | | | | | | |
| Borderfree, Inc. (a) | | | 687,899 | | | $ | 9,637,465 | |
| Bright Horizons Family Solutions, Inc. (a) | | | 698,301 | | | | 28,399,902 | |
| Concur Technologies, Inc. (a) | | | 307,580 | | | | 30,874,880 | |
| Constant Contact, Inc. (a) | | | 1,285,745 | | | | 40,076,672 | |
| CoStar Group, Inc. (a) | | | 209,499 | | | | 30,324,980 | |
| Gartner, Inc. (a) | | | 154,388 | | | | 11,515,801 | |
| Paylocity Holding Corp. (a) | | | 221,408 | | | | 5,032,604 | |
| Performant Financial Corp. (a) | | | 950,668 | | | | 9,145,426 | |
| Ultimate Software Group, Inc. (a) | | | 211,531 | | | | 31,092,942 | |
| Xoom Corp. (a) | | | 549,616 | | | | 12,564,222 | |
| | | | | | | | |
| | | | | | | $ | 208,664,894 | |
| Chemicals - 0.2% | | | | | | | | |
| Marrone Bio Innovations, Inc. (a)(l) | | | 556,739 | | | $ | 3,201,249 | |
| | |
| Computer Software - 1.3% | | | | | | | | |
| Qlik Technologies, Inc. (a) | | | 368,142 | | | $ | 10,392,649 | |
| SolarWinds, Inc. (a) | | | 403,089 | | | | 17,248,178 | |
| | | | | | | | |
| | | | | | | $ | 27,640,827 | |
11
Portfolio of Investments – continued
| | | | | | | | |
| Issuer | | Shares/Par | | | Value ($) | |
| | | | | | | | |
| Common Stocks - continued | | | | | | | | |
| Computer Software - Systems - 9.2% | | | | | | | | |
| Benefitfocus, Inc. (a)(l) | | | 259,500 | | | $ | 8,568,690 | |
| Cvent, Inc. (a) | | | 951,261 | | | | 23,895,676 | |
| Demandware, Inc. (a) | | | 357,238 | | | | 18,987,200 | |
| E2open, Inc. (a) | | | 957,910 | | | | 14,464,441 | |
| Exa Corp. (a) | | | 522,141 | | | | 6,265,692 | |
| Fleetmatics Group PLC (a) | | | 634,594 | | | | 20,827,375 | |
| Model N, Inc. (a)(h) | | | 1,653,151 | | | | 15,275,115 | |
| PROS Holdings, Inc. (a) | | | 518,108 | | | | 13,258,384 | |
| SciQuest, Inc. (a)(h) | | | 2,111,073 | | | | 33,713,836 | |
| ServiceNow, Inc. (a) | | | 334,998 | | | | 20,478,428 | |
| SS&C Technologies Holdings, Inc. (a) | | | 189,986 | | | | 8,598,766 | |
| Varonis Systems, Inc. (a) | | | 217,889 | | | | 5,185,758 | |
| | | | | | | | |
| | | | | | | $ | 189,519,361 | |
| Construction - 1.8% | | | | | | | | |
| Eagle Materials, Inc. | | | 219,193 | | | $ | 22,337,959 | |
| Trex Co., Inc. (a) | | | 415,808 | | | | 15,634,381 | |
| | | | | | | | |
| | | | | | | $ | 37,972,340 | |
| Consumer Services - 4.5% | | | | | | | | |
| Diamond Resorts International, Inc. (a) | | | 475,255 | | | $ | 11,890,880 | |
| HomeAway, Inc. (a) | | | 990,064 | | | | 32,870,125 | |
| MakeMyTrip Ltd. (a) | | | 487,454 | | | | 14,126,417 | |
| Nord Anglia Education, Inc. (a) | | | 1,050,933 | | | | 20,125,367 | |
| TripAdvisor, Inc. (a) | | | 147,648 | | | | 14,630,440 | |
| | | | | | | | |
| | | | | | | $ | 93,643,229 | |
| Electrical Equipment - 2.0% | | | | | | | | |
| Advanced Drainage Systems, Inc. (a) | | | 969,393 | | | $ | 18,389,385 | |
| MSC Industrial Direct Co., Inc., “A” | | | 113,983 | | | | 10,274,428 | |
| Sensata Technologies Holding B.V. (a) | | | 271,197 | | | | 13,334,756 | |
| | | | | | | | |
| | | | | | | $ | 41,998,569 | |
| Electronics - 1.8% | | | | | | | | |
| Rubicon Technology, Inc. (a)(l) | | | 1,224,094 | | | $ | 7,638,347 | |
| Silicon Laboratories, Inc. (a) | | | 235,382 | | | | 10,669,866 | |
| Stratasys Ltd. (a) | | | 156,681 | | | | 18,795,453 | |
| | | | | | | | |
| | | | | | | $ | 37,103,666 | |
| Energy - Independent - 6.9% | | | | | | | | |
| Alpha Natural Resources, Inc. (a) | | | 1,836,720 | | | $ | 7,255,044 | |
| Cabot Oil & Gas Corp. | | | 456,586 | | | | 15,313,894 | |
| CONSOL Energy, Inc. | | | 368,845 | | | | 14,857,077 | |
| Foresight Energy LP | | | 822,834 | | | | 15,625,618 | |
12
Portfolio of Investments – continued
| | | | | | | | |
| Issuer | | Shares/Par | | | Value ($) | |
| | | | | | | | |
| Common Stocks - continued | | | | | | | | |
| Energy - Independent - continued | | | | | | | | |
| Memorial Resource Development Corp. (a) | | | 567,451 | | | $ | 16,722,781 | |
| Peabody Energy Corp. | | | 1,941,874 | | | | 30,836,959 | |
| Range Resources Corp. | | | 189,157 | | | | 14,865,849 | |
| Rice Energy, Inc. (a) | | | 702,926 | | | | 20,581,673 | |
| Walter Energy, Inc. (l) | | | 1,055,089 | | | | 5,897,948 | |
| | | | | | | | |
| | | | | | | $ | 141,956,843 | |
| Engineering - Construction - 0.9% | | | | | | | | |
| Team, Inc. (a) | | | 454,052 | | | $ | 18,121,215 | |
| | |
| Entertainment - 0.2% | | | | | | | | |
| DHX Media Ltd. | | | 634,278 | | | $ | 4,439,304 | |
| | |
| Food & Beverages - 2.6% | | | | | | | | |
| Annie’s, Inc. (a) | | | 677,438 | | | $ | 21,603,498 | |
| Flowers Foods, Inc. | | | 841,092 | | | | 16,468,581 | |
| Keurig Green Mountain, Inc. | | | 113,533 | | | | 15,136,220 | |
| | | | | | | | |
| | | | | | | $ | 53,208,299 | |
| Food & Drug Stores - 1.0% | | | | | | | | |
| Brazil Pharma S.A. (a) | | | 6,517,050 | | | $ | 12,169,430 | |
| Fairway Group Holdings Corp. (a)(h)(l) | | | 1,725,209 | | | | 7,746,188 | |
| | | | | | | | |
| | | | | | | $ | 19,915,618 | |
| Gaming & Lodging - 0.7% | | | | | | | | |
| Norwegian Cruise Line Holdings Ltd. (a) | | | 457,011 | | | $ | 15,223,036 | |
| | |
| General Merchandise - 1.2% | | | | | | | | |
| Five Below, Inc. (a) | | | 601,035 | | | $ | 24,377,980 | |
| | |
| Internet - 7.1% | | | | | | | | |
| ChannelAdvisor Corp. (a) | | | 505,405 | | | $ | 8,187,561 | |
| Dealertrack Holdings, Inc. (a) | | | 480,315 | | | | 21,498,899 | |
| GrubHub, Inc. (a)(l) | | | 414,836 | | | | 15,946,296 | |
| LinkedIn Corp., “A” (a) | | | 84,441 | | | | 19,062,556 | |
| Pandora Media, Inc. (a) | | | 586,649 | | | | 15,862,989 | |
| Shutterstock, Inc. (a) | | | 286,067 | | | | 20,253,544 | |
| Trulia, Inc. (a) | | | 369,439 | | | | 22,768,526 | |
| Yelp, Inc. (a) | | | 268,030 | | | | 22,091,033 | |
| | | | | | | | |
| | | | | | | $ | 145,671,404 | |
| Machinery & Tools - 4.1% | | | | | | | | |
| Allison Transmission Holdings, Inc. | | | 440,899 | | | $ | 13,526,781 | |
| IPG Photonics Corp. (a) | | | 291,077 | | | | 19,991,168 | |
13
Portfolio of Investments – continued
| | | | | | | | |
| Issuer | | Shares/Par | | | Value ($) | |
| | | | | | | | |
| Common Stocks - continued | | | | | | | | |
| Machinery & Tools - continued | | | | | | | | |
| Joy Global, Inc. | | | 237,350 | | | $ | 14,988,653 | |
| Nordson Corp. | | | 82,451 | | | | 6,683,478 | |
| Polypore International, Inc. (a) | | | 338,224 | | | | 15,162,582 | |
| Proto Labs, Inc. (a) | | | 73,549 | | | | 5,533,827 | |
| WABCO Holdings, Inc. (a) | | | 84,329 | | | | 8,702,753 | |
| | | | | | | | |
| | | | | | | $ | 84,589,242 | |
| Medical & Health Technology & Services - 5.6% | | | | | | | | |
| Advisory Board Co. (a) | | | 455,401 | | | $ | 22,587,890 | |
| Brookdale Senior Living, Inc. (a) | | | 494,132 | | | | 17,269,913 | |
| Capital Senior Living Corp. (a) | | | 1,150,374 | | | | 26,309,053 | |
| Healthcare Services Group, Inc. | | | 878,299 | | | | 24,003,912 | |
| HealthStream, Inc. (a) | | | 965,810 | | | | 25,072,428 | |
| | | | | | | | |
| | | | | | | $ | 115,243,196 | |
| Medical Equipment - 6.1% | | | | | | | | |
| Align Technology, Inc. (a) | | | 292,161 | | | $ | 15,911,088 | |
| Cardiovascular Systems, Inc. (a) | | | 620,102 | | | | 17,666,706 | |
| Cepheid, Inc. (a) | | | 363,223 | | | | 14,539,817 | |
| DexCom, Inc. (a) | | | 470,692 | | | | 20,804,586 | |
| GenMark Diagnostics, Inc. (a) | | | 1,276,403 | | | | 13,721,332 | |
| Masimo Corp. (a) | | | 427,051 | | | | 9,583,024 | |
| Novadaq Technologies, Inc. (a) | | | 746,506 | | | | 9,749,368 | |
| Roka Bioscience, Inc. (a) | | | 860,763 | | | | 10,088,142 | |
| TearLab Corp. (a)(h)(l) | | | 2,508,481 | | | | 9,707,821 | |
| Uroplasty, Inc. (a)(h) | | | 1,452,126 | | | | 3,819,091 | |
| | | | | | | | |
| | | | | | | $ | 125,590,975 | |
| Metals & Mining - 5.5% | | | | | | | | |
| Century Aluminum Co. (a) | | | 1,012,634 | | | $ | 25,295,597 | |
| Globe Specialty Metals, Inc. | | | 963,639 | | | | 19,793,145 | |
| GrafTech International Ltd. (a) | | | 2,129,446 | | | | 18,590,064 | |
| Horsehead Holding Corp. (a) | | | 1,020,575 | | | | 20,605,409 | |
| Iluka Resources Ltd. | | | 2,893,793 | | | | 24,053,659 | |
| Molycorp, Inc. (a) | | | 2,682,634 | | | | 4,801,915 | |
| | | | | | | | |
| | | | | | | $ | 113,139,789 | |
| Natural Gas - Pipeline - 0.5% | | | | | | | | |
| StealthGas, Inc. (a) | | | 981,867 | | | $ | 9,612,478 | |
| | |
| Oil Services - 2.7% | | | | | | | | |
| Atwood Oceanics, Inc. (a) | | | 743,546 | | | $ | 36,738,608 | |
| Frank’s International N.V. | | | 976,333 | | | | 19,673,110 | |
| | | | | | | | |
| | | | | | | $ | 56,411,718 | |
14
Portfolio of Investments – continued
| | | | | | | | |
| Issuer | | Shares/Par | | | Value ($) | |
| | | | | | | | |
| Common Stocks - continued | | | | | | | | |
| Other Banks & Diversified Financials - 1.3% | | | | | | | | |
| Air Lease Corp. | | | 225,179 | | | $ | 8,534,284 | |
| First Republic Bank | | | 263,034 | | | | 12,862,363 | |
| PrivateBancorp, Inc. | | | 180,135 | | | | 5,315,784 | |
| | | | | | | | |
| | | | | | | $ | 26,712,431 | |
| Pharmaceuticals - 2.0% | | | | | | | | |
| Aratana Therapeutics, Inc. (a) | | | 535,708 | | | $ | 6,224,927 | |
| Kythera Biopharmaceuticals, Inc. (a) | | | 480,642 | | | | 18,076,946 | |
| MediWound Ltd. (a) | | | 433,731 | | | | 3,166,236 | |
| TherapeuticsMD, Inc. (a) | | | 2,687,383 | | | | 14,914,976 | |
| | | | | | | | |
| | | | | | | $ | 42,383,085 | |
| Railroad & Shipping - 2.8% | | | | | | | | |
| Diana Shipping, Inc. (a) | | | 3,052,311 | | | $ | 32,476,589 | |
| Navios Maritime Holdings, Inc. | | | 2,598,828 | | | | 24,584,913 | |
| | | | | | | | |
| | | | | | | $ | 57,061,502 | |
| Restaurants - 3.6% | | | | | | | | |
| Arcos Dorados Holdings, Inc. (l) | | | 2,207,090 | | | $ | 15,868,977 | |
| Chuy’s Holdings, Inc. (a) | | | 447,736 | | | | 11,775,457 | |
| Dunkin Brands Group, Inc. | | | 689,704 | | | | 30,029,712 | |
| Noodles & Co. (a) | | | 365,577 | | | | 7,154,342 | |
| Zoe’s Kitchen, Inc. (a)(l) | | | 324,673 | | | | 9,470,711 | |
| | | | | | | | |
| | | | | | | $ | 74,299,199 | |
| Special Products & Services - 0.4% | | | | | | | | |
| WL Ross Holding Corp. (a) | | | 710,684 | | | $ | 7,725,135 | |
| | |
| Specialty Chemicals - 1.1% | | | | �� | | | | |
| Albemarle Corp. | | | 365,189 | | | $ | 23,218,717 | |
| | |
| Specialty Stores - 5.6% | | | | | | | | |
| Burlington Stores, Inc. (a) | | | 521,720 | | | $ | 18,609,752 | |
| Citi Trends, Inc. (a)(h) | | | 1,217,419 | | | | 28,317,166 | |
| Lumber Liquidators Holdings, Inc. (a) | | | 189,284 | | | | 10,830,830 | |
| Tile Shop Holdings, Inc. (a)(l) | | | 1,658,507 | | | | 19,155,756 | |
| Urban Outfitters, Inc. (a) | | | 989,562 | | | | 39,374,672 | |
| | | | | | | | |
| | | | | | | $ | 116,288,176 | |
| Trucking - 1.7% | | | | | | | | |
| Swift Transportation Co. (a) | | | 1,620,621 | | | $ | 34,324,750 | |
| Total Common Stocks (Identified Cost, $1,912,554,313) | | | | | | $ | 2,063,244,838 | |
15
Portfolio of Investments – continued
| | | | | | | | | | | | | | | | |
| Warrants - 0.0% | | | | | | | | | | | | | | | | |
| Issuer | | Strike Price | | | First Exercise | | | Shares/Par | | | Value ($) | |
| | | | | | | | | | | | | | | | |
| Food & Drug Stores - 0.0% | | | | | | | | | | | | | | | | |
Brasil Pharma SA
(1 share for 1 warrant) (a) (Identified Cost, $0) | | BRL | 5.50 | | | | 6/25/14 | | | | 731,699 | | | $ | 81,718 | |
| | | |
| Money Market Funds - 0.1% | | | | | | | | | | | | | |
MFS Institutional Money Market Portfolio, 0.09%,
at Cost and Net Asset Value (v) | | | | 1,739,356 | | | $ | 1,739,356 | |
| | |
| Collateral for Securities Loaned - 0.9% | | | | | | | | | |
Navigator Securities Lending Prime Portfolio, 0.15%,
at Cost and Net Asset Value (j) | | | | 17,262,496 | | | $ | 17,262,496 | |
| Total Investments (Identified Cost, $1,931,556,165) | | | | | | | $ | 2,082,328,408 | |
| | |
| Other Assets, Less Liabilities - (1.0)% | | | | | | | | (19,771,885 | ) |
| Net Assets - 100.0% | | | | | | | | | | | | | | $ | 2,062,556,523 | |
| (a) | Non-income producing security. |
| (h) | Affiliated issuers are those in which the fund’s holdings of an issuer represent 5% or more of the outstanding voting securities of the issuer. |
| (j) | The rate quoted is the annualized seven-day yield of the fund at period end. |
| (l) | A portion of this security is on loan. |
| (v) | Underlying affiliated fund that is available only to investment companies managed by MFS. The rate quoted for the MFS Institutional Money Market Portfolio is the annualized seven-day yield of the fund at period end. |
The following abbreviations are used in this report and are defined:
| PLC | | Public Limited Company |
See Notes to Financial Statements
16
Financial Statements
STATEMENT OF ASSETS AND LIABILITIES
At 8/31/14
This statement represents your fund’s balance sheet, which details the assets and liabilities comprising the total value of the fund.
| | | | |
| Assets | | | | |
Investments- | | | | |
Non-affiliated issuers, at value (identified cost, $1,780,418,354) | | | $1,982,009,835 | |
Underlying affiliated funds, at cost and value | | | 1,739,356 | |
Other affiliated issuers, at value (identified cost, $149,398,455) | | | 98,579,217 | |
Total investments, at value, including $16,640,077 of securities on loan (identified cost, $1,931,556,165) | | | $2,082,328,408 | |
Receivables for | | | | |
Investments sold | | | 17,150,602 | |
Fund shares sold | | | 3,413,001 | |
Interest and dividends | | | 818,469 | |
Other assets | | | 2,977 | |
Total assets | | | $2,103,713,457 | |
| Liabilities | | | | |
Payables for | | | | |
Investments purchased | | | $10,405,110 | |
Fund shares reacquired | | | 11,480,911 | |
Collateral for securities loaned, at value | | | 17,262,496 | |
Payable to affiliates | | | | |
Investment adviser | | | 186,455 | |
Shareholder servicing costs | | | 1,625,690 | |
Distribution and service fees | | | 41,382 | |
Program manager fees | | | 37 | |
Payable for independent Trustees’ compensation | | | 3,965 | |
Accrued expenses and other liabilities | | | 150,888 | |
Total liabilities | | | $41,156,934 | |
Net assets | | | $2,062,556,523 | |
| Net assets consist of | | | | |
Paid-in capital | | | $1,802,998,794 | |
Unrealized appreciation (depreciation) on investments and translation of assets and liabilities in foreign currencies | | | 150,773,203 | |
Accumulated net realized gain (loss) on investments and foreign currency | | | 108,788,422 | |
Accumulated net investment loss | | | (3,896 | ) |
Net assets | | | $2,062,556,523 | |
Shares of beneficial interest outstanding | | | 79,615,170 | |
17
Statement of Assets and Liabilities – continued
| | | | | | | | | | | | |
| | | Net assets | | | Shares
outstanding | | | Net asset value
per share (a) | |
Class A | | | $620,802,096 | | | | 24,356,317 | | | | $25.49 | |
Class B | | | 34,971,332 | | | | 1,586,674 | | | | 22.04 | |
Class C | | | 141,292,553 | | | | 6,399,627 | | | | 22.08 | |
Class I | | | 483,893,452 | | | | 17,631,768 | | | | 27.44 | |
Class R1 | | | 8,489,771 | | | | 387,411 | | | | 21.91 | |
Class R2 | | | 66,923,411 | | | | 2,735,477 | | | | 24.46 | |
Class R3 | | | 150,358,857 | | | | 5,903,920 | | | | 25.47 | |
Class R4 | | | 229,964,154 | | | | 8,734,942 | | | | 26.33 | |
Class R5 | | | 319,139,044 | | | | 11,598,202 | | | | 27.52 | |
Class 529A | | | 5,150,248 | | | | 207,542 | | | | 24.82 | |
Class 529B | | | 348,193 | | | | 16,240 | | | | 21.44 | |
Class 529C | | | 1,223,412 | | | | 57,050 | | | | 21.44 | |
| (a) | Maximum offering price per share was equal to the net asset value per share for all share classes, except for Classes A and 529A, for which the maximum offering prices per share were $27.05 [100 / 94.25 x $25.49] and $26.33 [100 / 94.25 x $24.82], respectively. On sales of $50,000 or more, the maximum offering prices of Class A and Class 529A shares are reduced. A contingent deferred sales charge may be imposed on redemptions of Class A, Class B, Class C, Class 529B, and Class 529C shares. Redemption price per share was equal to the net asset value per share for Classes I, R1, R2, R3, R4, R5, and 529A. |
See Notes to Financial Statements
18
Financial Statements
STATEMENT OF OPERATIONS
Year ended 8/31/14
This statement describes how much your fund earned in investment income and accrued in expenses. It also describes any gains and/or losses generated by fund operations.
| | | | |
| Net investment loss | | | | |
Income | | | | |
Dividends | | | $7,686,572 | |
Income on securities loaned | | | 1,686,476 | |
Dividends from underlying affiliated funds | | | 16,778 | |
Foreign taxes withheld | | | (108,488 | ) |
Total investment income | | | $9,281,338 | |
Expenses | | | | |
Management fee | | | $19,195,843 | |
Distribution and service fees | | | 4,570,758 | |
Program manager fees | | | 6,919 | |
Shareholder servicing costs | | | 2,549,709 | |
Administrative services fee | | | 263,892 | |
Independent Trustees’ compensation | | | 37,317 | |
Custodian fee | | | 191,708 | |
Shareholder communications | | | 162,257 | |
Audit and tax fees | | | 56,096 | |
Legal fees | | | 20,620 | |
Miscellaneous | | | 246,118 | |
Total expenses | | | $27,301,237 | |
Fees paid indirectly | | | (368 | ) |
Reduction of expenses by investment adviser and distributor | | | (1,254,300 | ) |
Net expenses | | | $26,046,569 | |
Net investment loss | | | $(16,765,231 | ) |
| Realized and unrealized gain (loss) on investments and foreign currency | |
Realized gain (loss) (identified cost basis) | | | | |
Investments: | | | | |
Non-affiliated issuers | | | $305,197,613 | |
Other affiliated issuers | | | 1,376,272 | |
Foreign currency | | | 64,272 | |
Net realized gain (loss) on investments and foreign currency | | | $306,638,157 | |
Change in unrealized appreciation (depreciation) | | | | |
Investments | | | $(131,753,644 | ) |
Translation of assets and liabilities in foreign currencies | | | 1,304 | |
Net unrealized gain (loss) on investments and foreign currency translation | | | $(131,752,340 | ) |
Net realized and unrealized gain (loss) on investments and foreign currency | | | $174,885,817 | |
Change in net assets from operations | | | $158,120,586 | |
See Notes to Financial Statements
19
Financial Statements
STATEMENTS OF CHANGES IN NET ASSETS
These statements describe the increases and/or decreases in net assets resulting from operations, any distributions, and any shareholder transactions.
| | | | | | | | |
| | | Years ended 8/31 | |
| | | 2014 | | | 2013 | |
| Change in net assets | | | | | | |
| From operations | | | | | | | | |
Net investment loss | | | $(16,765,231 | ) | | | $(8,591,721 | ) |
Net realized gain (loss) on investments and foreign currency | | | 306,638,157 | | | | 205,210,073 | |
Net unrealized gain (loss) on investments and foreign currency translation | | | (131,752,340 | ) | | | 179,463,112 | |
Change in net assets from operations | | | $158,120,586 | | | | $376,081,464 | |
| Distributions declared to shareholders | | | | | | | | |
From net realized gain on investments | | | $(182,188,311 | ) | | | $— | |
Change in net assets from fund share transactions | | | $48,101,270 | | | | $415,383,480 | |
Total change in net assets | | | $24,033,545 | | | | $791,464,944 | |
| Net assets | | | | | | | | |
At beginning of period | | | 2,038,522,978 | | | | 1,247,058,034 | |
At end of period (including accumulated net investment loss of $3,896 and $4,733, respectively) | | | $2,062,556,523 | | | | $2,038,522,978 | |
See Notes to Financial Statements
20
Financial Statements
FINANCIAL HIGHLIGHTS
The financial highlights table is intended to help you understand the fund’s financial performance for the past 5 years (or life of a particular share class, if shorter). Certain information reflects financial results for a single fund share. The total returns in the table represent the rate by which an investor would have earned (or lost) on an investment in the fund share class (assuming reinvestment of all distributions) held for the entire period.
| | | | | | | | | | | | | | | | | | | | |
| Class A | | Years ended 8/31 | |
| | | 2014 | | | 2013 | | | 2012 | | | 2011 | | | 2010 | |
Net asset value, beginning of period | | | $25.86 | | | | $20.17 | | | | $22.63 | | | | $19.03 | | | | $16.22 | |
| Income (loss) from investment operations | | | | | | | | | | | | | | | | | | | | |
Net investment loss (d) | | | $(0.22 | ) | | | $(0.14 | ) | | | $(0.16 | ) | | | $(0.22 | ) | | | $(0.17 | ) |
Net realized and unrealized gain (loss)
on investments and foreign currency | | | 2.30 | | | | 5.83 | | | | 1.80 | | | | 5.23 | | | | 2.98 | |
Total from investment operations | | | $2.08 | | | | $5.69 | | | | $1.64 | | | | $5.01 | | | | $2.81 | |
| Less distributions declared to shareholders | | | | | | | | | | | | | | | | | | | | |
From net realized gain on investments | | | $(2.45 | ) | | | $— | | | | $(4.10 | ) | | | $(1.41 | ) | | | $— | |
Net asset value, end of period (x) | | | $25.49 | | | | $25.86 | | | | $20.17 | | | | $22.63 | | | | $19.03 | |
Total return (%) (r)(s)(t)(x) | | | 8.01 | | | | 28.21 | | | | 9.88 | | | | 26.13 | | | | 17.32 | |
Ratios (%) (to average net assets)
and Supplemental data: | | | | | | | | | | | | | | | | | | | | |
Expenses before expense reductions (f) | | | 1.33 | | | | 1.35 | | | | 1.39 | | | | 1.40 | | | | 1.51 | |
Expenses after expense reductions (f) | | | 1.27 | | | | 1.31 | | | | 1.35 | | | | 1.30 | | | | 1.41 | |
Net investment loss | | | (0.83 | ) | | | (0.59 | ) | | | (0.83 | ) | | | (0.90 | ) | | | (0.92 | ) |
Portfolio turnover | | | 98 | | | | 96 | | | | 128 | | | | 205 | | | | 167 | |
Net assets at end of period (000 omitted) | | | $620,802 | | | | $866,006 | | | | $529,749 | | | | $626,258 | | | | $338,380 | |
See Notes to Financial Statements
21
Financial Highlights – continued
| | | | | | | | | | | | | | | | | | | | |
| Class B | | Years ended 8/31 | |
| | | 2014 | | | 2013 | | | 2012 | | | 2011 | | | 2010 | |
Net asset value, beginning of period | | | $22.83 | | | | $17.94 | | | | $20.73 | | | | $17.65 | | | | $15.16 | |
| Income (loss) from investment operations | | | | | | | | | | | | | | | | | | | | |
Net investment loss (d) | | | $(0.36 | ) | | | $(0.27 | ) | | | $(0.28 | ) | | | $(0.37 | ) | | | $(0.29 | ) |
Net realized and unrealized gain (loss)
on investments and foreign currency | | | 2.02 | | | | 5.16 | | | | 1.59 | | | | 4.86 | | | | 2.78 | |
Total from investment operations | | | $1.66 | | | | $4.89 | | | | $1.31 | | | | $4.49 | | | | $2.49 | |
| Less distributions declared to shareholders | | | | | | | | | | | | | | | | | | | | |
From net realized gain on investments | | | $(2.45 | ) | | | $— | | | | $(4.10 | ) | | | $(1.41 | ) | | | $— | |
Net asset value, end of period (x) | | | $22.04 | | | | $22.83 | | | | $17.94 | | | | $20.73 | | | | $17.65 | |
Total return (%) (r)(s)(t)(x) | | | 7.18 | | | | 27.26 | | | | 9.08 | | | | 25.18 | | | | 16.42 | |
Ratios (%) (to average net assets)
and Supplemental data: | | | | | | | | | | | | | | | | | | | | |
Expenses before expense reductions (f) | | | 2.08 | | | | 2.10 | | | | 2.14 | | | | 2.15 | | | | 2.26 | |
Expenses after expense reductions (f) | | | 2.02 | | | | 2.06 | | | | 2.10 | | | | 2.05 | | | | 2.16 | |
Net investment loss | | | (1.58 | ) | | | (1.34 | ) | | | (1.59 | ) | | | (1.65 | ) | | | (1.67 | ) |
Portfolio turnover | | | 98 | | | | 96 | | | | 128 | | | | 205 | | | | 167 | |
Net assets at end of period (000 omitted) | | | $34,971 | | | | $37,952 | | | | $30,308 | | | | $33,037 | | | | $26,777 | |
| |
| Class C | | Years ended 8/31 | |
| | | 2014 | | | 2013 | | | 2012 | | | 2011 | | | 2010 | |
Net asset value, beginning of period | | | $22.86 | | | | $17.96 | | | | $20.76 | | | | $17.67 | | | | $15.18 | |
| Income (loss) from investment operations | | | | | | | | | | | | | | | | | | | | |
Net investment loss (d) | | | $(0.36 | ) | | | $(0.27 | ) | | | $(0.28 | ) | | | $(0.37 | ) | | | $(0.30 | ) |
Net realized and unrealized gain (loss)
on investments and foreign currency | | | 2.03 | | | | 5.17 | | | | 1.58 | | | | 4.87 | | | | 2.79 | |
Total from investment operations | | | $1.67 | | | | $4.90 | | | | $1.30 | | | | $4.50 | | | | $2.49 | |
| Less distributions declared to shareholders | | | | | | | | | | | | | | | | | | | | |
From net realized gain on investments | | | $(2.45 | ) | | | $— | | | | $(4.10 | ) | | | $(1.41 | ) | | | $— | |
Net asset value, end of period (x) | | | $22.08 | | | | $22.86 | | | | $17.96 | | | | $20.76 | | | | $17.67 | |
Total return (%) (r)(s)(t)(x) | | | 7.22 | | | | 27.28 | | | | 9.01 | | | | 25.21 | | | | 16.40 | |
Ratios (%) (to average net assets)
and Supplemental data: | | | | | | | | | | | | | | | | | | | | |
Expenses before expense reductions (f) | | | 2.08 | | | | 2.10 | | | | 2.14 | | | | 2.15 | | | | 2.26 | |
Expenses after expense reductions (f) | | | 2.02 | | | | 2.06 | | | | 2.10 | | | | 2.05 | | | | 2.16 | |
Net investment loss | | | (1.59 | ) | | | (1.35 | ) | | | (1.59 | ) | | | (1.65 | ) | | | (1.67 | ) |
Portfolio turnover | | | 98 | | | | 96 | | | | 128 | | | | 205 | | | | 167 | |
Net assets at end of period (000 omitted) | | | $141,293 | | | | $136,913 | | | | $91,138 | | | | $95,479 | | | | $37,144 | |
See Notes to Financial Statements
22
Financial Highlights – continued
| | | | | | | | | | | | | | | | | | | | |
| Class I | | Years ended 8/31 | |
| | | 2014 | | | 2013 | | | 2012 | | | 2011 | | | 2010 | |
Net asset value, beginning of period | | | $27.61 | | | | $21.48 | | | | $23.77 | | | | $19.88 | | | | $16.91 | |
| Income (loss) from investment operations | | | | | | | | | | | | | | | | | | | | |
Net investment loss (d) | | | $(0.17 | ) | | | $(0.09 | ) | | | $(0.12 | ) | | | $(0.17 | ) | | | $(0.13 | ) |
Net realized and unrealized gain (loss)
on investments and foreign currency | | | 2.45 | | | | 6.22 | | | | 1.93 | | | | 5.47 | | | | 3.10 | |
Total from investment operations | | | $2.28 | | | | $6.13 | | | | $1.81 | | | | $5.30 | | | | $2.97 | |
| Less distributions declared to shareholders | | | | | | | | | | | | | | | | | | | | |
From net realized gain on investments | | | $(2.45 | ) | | | $— | | | | $(4.10 | ) | | | $(1.41 | ) | | | $— | |
Net asset value, end of period (x) | | | $27.44 | | | | $27.61 | | | | $21.48 | | | | $23.77 | | | | $19.88 | |
Total return (%) (r)(s)(x) | | | 8.25 | | | | 28.54 | | | | 10.16 | | | | 26.48 | | | | 17.56 | |
Ratios (%) (to average net assets)
and Supplemental data: | | | | | | | | | | | | | | | | | | | | |
Expenses before expense reductions (f) | | | 1.08 | | | | 1.10 | | | | 1.15 | | | | 1.15 | | | | 1.26 | |
Expenses after expense reductions (f) | | | 1.02 | | | | 1.06 | | | | 1.10 | | | | 1.05 | | | | 1.16 | |
Net investment loss | | | (0.59 | ) | | | (0.36 | ) | | | (0.59 | ) | | | (0.65 | ) | | | (0.67 | ) |
Portfolio turnover | | | 98 | | | | 96 | | | | 128 | | | | 205 | | | | 167 | |
Net assets at end of period (000 omitted) | | | $483,893 | | | | $368,806 | | | | $170,830 | | | | $323,848 | | | | $263,575 | |
| |
| Class R1 | | Years ended 8/31 | |
| | | 2014 | | | 2013 | | | 2012 | | | 2011 | | | 2010 | |
Net asset value, beginning of period | | | $22.71 | | | | $17.84 | | | | $20.65 | | | | $17.58 | | | | $15.10 | |
| Income (loss) from investment operations | | | | | | | | | | | | | | | | | | | | |
Net investment loss (d) | | | $(0.36 | ) | | | $(0.27 | ) | | | $(0.28 | ) | | | $(0.37 | ) | | | $(0.29 | ) |
Net realized and unrealized gain (loss)
on investments and foreign currency | | | 2.01 | | | | 5.14 | | | | 1.57 | | | | 4.85 | | | | 2.77 | |
Total from investment operations | | | $1.65 | | | | $4.87 | | | | $1.29 | | | | $4.48 | | | | $2.48 | |
| Less distributions declared to shareholders | | | | | | | | | | | | | | | | | | | | |
From net realized gain on investments | | | $(2.45 | ) | | | $— | | | | $(4.10 | ) | | | $(1.41 | ) | | | $— | |
Net asset value, end of period (x) | | | $21.91 | | | | $22.71 | | | | $17.84 | | | | $20.65 | | | | $17.58 | |
Total return (%) (r)(s)(x) | | | 7.17 | | | | 27.30 | | | | 9.00 | | | | 25.22 | | | | 16.42 | |
Ratios (%) (to average net assets)
and Supplemental data: | | | | | | | | | | | | | | | | | | | | |
Expenses before expense reductions (f) | | | 2.08 | | | | 2.10 | | | | 2.14 | | | | 2.15 | | | | 2.26 | |
Expenses after expense reductions (f) | | | 2.02 | | | | 2.06 | | | | 2.10 | | | | 2.05 | | | | 2.16 | |
Net investment loss | | | (1.59 | ) | | | (1.34 | ) | | | (1.59 | ) | | | (1.65 | ) | | | (1.67 | ) |
Portfolio turnover | | | 98 | | | | 96 | | | | 128 | | | | 205 | | | | 167 | |
Net assets at end of period (000 omitted) | | | $8,490 | | | | $8,972 | | | | $7,506 | | | | $6,904 | | | | $5,253 | |
See Notes to Financial Statements
23
Financial Highlights – continued
| | | | | | | | | | | | | | | | | | | | |
| Class R2 | | Years ended 8/31 | |
| | | 2014 | | | 2013 | | | 2012 | | | 2011 | | | 2010 | |
Net asset value, beginning of period | | | $24.97 | | | | $19.52 | | | | $22.09 | | | | $18.65 | | | | $15.94 | |
| Income (loss) from investment operations | | | | | | | | | | | | | | | | | | | | |
Net investment loss (d) | | | $(0.27 | ) | | | $(0.19 | ) | | | $(0.21 | ) | | | $(0.28 | ) | | | $(0.22 | ) |
Net realized and unrealized gain (loss)
on investments and foreign currency | | | 2.21 | | | | 5.64 | | | | 1.74 | | | | 5.13 | | | | 2.93 | |
Total from investment operations | | | $1.94 | | | | $5.45 | | | | $1.53 | | | | $4.85 | | | | $2.71 | |
| Less distributions declared to shareholders | | | | | | | | | | | | | | | | | | | | |
From net realized gain on investments | | | $(2.45 | ) | | | $— | | | | $(4.10 | ) | | | $(1.41 | ) | | | $— | |
Net asset value, end of period (x) | | | $24.46 | | | | $24.97 | | | | $19.52 | | | | $22.09 | | | | $18.65 | |
Total return (%) (r)(s)(x) | | | 7.72 | | | | 27.92 | | | | 9.58 | | | | 25.79 | | | | 17.00 | |
Ratios (%) (to average net assets)
and Supplemental data: | | | | | | | | | | | | | | | | | | | | |
Expenses before expense reductions (f) | | | 1.58 | | | | 1.60 | | | | 1.64 | | | | 1.65 | | | | 1.76 | |
Expenses after expense reductions (f) | | | 1.52 | | | | 1.56 | | | | 1.60 | | | | 1.55 | | | | 1.66 | |
Net investment loss | | | (1.09 | ) | | | (0.85 | ) | | | (1.09 | ) | | | (1.15 | ) | | | (1.17 | ) |
Portfolio turnover | | | 98 | | | | 96 | | | | 128 | | | | 205 | | | | 167 | |
Net assets at end of period (000 omitted) | | | $66,923 | | | | $60,501 | | | | $35,599 | | | | $24,316 | | | | $13,125 | |
| |
| Class R3 | | Years ended 8/31 | |
| | | 2014 | | | 2013 | | | 2012 | | | 2011 | | | 2010 | |
Net asset value, beginning of period | | | $25.84 | | | | $20.15 | | | | $22.62 | | | | $19.02 | | | | $16.22 | |
| Income (loss) from investment operations | | | | | | | | | | | | | | | | | | | | |
Net investment loss (d) | | | $(0.22 | ) | | | $(0.14 | ) | | | $(0.16 | ) | | | $(0.22 | ) | | | $(0.18 | ) |
Net realized and unrealized gain (loss)
on investments and foreign currency | | | 2.30 | | | | 5.83 | | | | 1.79 | | | | 5.23 | | | | 2.98 | |
Total from investment operations | | | $2.08 | | | | $5.69 | | | | $1.63 | | | | $5.01 | | | | $2.80 | |
| Less distributions declared to shareholders | | | | | | | | | | | | | | | | | | | | |
From net realized gain on investments | | | $(2.45 | ) | | | $— | | | | $(4.10 | ) | | | $(1.41 | ) | | | $— | |
Net asset value, end of period (x) | | | $25.47 | | | | $25.84 | | | | $20.15 | | | | $22.62 | | | | $19.02 | |
Total return (%) (r)(s)(x) | | | 8.02 | | | | 28.24 | | | | 9.84 | | | | 26.14 | | | | 17.26 | |
Ratios (%) (to average net assets)
and Supplemental data: | | | | | | | | | | | | | | | | | | | | |
Expenses before expense reductions (f) | | | 1.33 | | | | 1.35 | | | | 1.39 | | | | 1.40 | | | | 1.51 | |
Expenses after expense reductions (f) | | | 1.27 | | | | 1.31 | | | | 1.35 | | | | 1.30 | | | | 1.41 | |
Net investment loss | | | (0.84 | ) | | | (0.60 | ) | | | (0.83 | ) | | | (0.90 | ) | | | (0.93 | ) |
Portfolio turnover | | | 98 | | | | 96 | | | | 128 | | | | 205 | | | | 167 | |
Net assets at end of period (000 omitted) | | | $150,359 | | | | $110,562 | | | | $61,125 | | | | $28,966 | | | | $6,456 | |
See Notes to Financial Statements
24
Financial Highlights – continued
| | | | | | | | | | | | | | | | | | | | |
| Class R4 | | Years ended 8/31 | |
| | | 2014 | | | 2013 | | | 2012 | | | 2011 | | | 2010 | |
Net asset value, beginning of period | | | $26.57 | | | | $20.67 | | | | $23.04 | | | | $19.31 | | | | $16.42 | |
| Income (loss) from investment operations | | | | | | | | | | | | | | | | | | | | |
Net investment loss (d) | | | $(0.16 | ) | | | $(0.08 | ) | | | $(0.12 | ) | | | $(0.16 | ) | | | $(0.13 | ) |
Net realized and unrealized gain (loss)
on investments and foreign currency | | | 2.37 | | | | 5.98 | | | | 1.85 | | | | 5.30 | | | | 3.02 | |
Total from investment operations | | | $2.21 | | | | $5.90 | | | | $1.73 | | | | $5.14 | | | | $2.89 | |
| Less distributions declared to shareholders | | | | | | | | | | | | | | | | | | | | |
From net realized gain on investments | | | $(2.45 | ) | | | $— | | | | $(4.10 | ) | | | $(1.41 | ) | | | $— | |
Net asset value, end of period (x) | | | $26.33 | | | | $26.57 | | | | $20.67 | | | | $23.04 | | | | $19.31 | |
Total return (%) (r)(s)(x) | | | 8.31 | | | | 28.54 | | | | 10.13 | | | | 26.43 | | | | 17.60 | |
Ratios (%) (to average net assets)
and Supplemental data: | | | | | | | | | | | | | | | | | | | | |
Expenses before expense reductions (f) | | | 1.08 | | | | 1.10 | | | | 1.14 | | | | 1.15 | | | | 1.26 | |
Expenses after expense reductions (f) | | | 1.02 | | | | 1.06 | | | | 1.10 | | | | 1.05 | | | | 1.16 | |
Net investment loss | | | (0.59 | ) | | | (0.35 | ) | | | (0.58 | ) | | | (0.66 | ) | | | (0.67 | ) |
Portfolio turnover | | | 98 | | | | 96 | | | | 128 | | | | 205 | | | | 167 | |
Net assets at end of period (000 omitted) | | | $229,964 | | | | $197,884 | | | | $141,694 | | | | $78,534 | | | | $50,147 | |
| | | | | | | | | | | | |
| Class R5 | | Years ended 8/31 | |
| | | 2014 | | | 2013 | | | 2012 (i) | |
Net asset value, beginning of period | | | $27.64 | | | | $21.48 | | | | $19.73 | |
| Income (loss) from investment operations | | | | | | | | | | | | |
Net investment loss (d) | | | $(0.13 | ) | | | $(0.06 | ) | | | $(0.03 | ) |
Net realized and unrealized gain (loss)
on investments and foreign currency | | | 2.46 | | | | 6.22 | | | | 1.78 | |
Total from investment operations | | | $2.33 | | | | $6.16 | | | | $1.75 | |
| Less distributions declared to shareholders | | | | | | | | | | | | |
From net realized gain on investments | | | $(2.45 | ) | | | $— | | | | $— | |
Net asset value, end of period (x) | | | $27.52 | | | | $27.64 | | | | $21.48 | |
Total return (%) (r)(s)(x) | | | 8.43 | | | | 28.68 | | | | 8.87 | (n) |
Ratios (%) (to average net assets)
and Supplemental data: | | | | | | | | | | | | |
Expenses before expense reductions (f) | | | 0.97 | | | | 0.99 | | | | 1.07 | (a) |
Expenses after expense reductions (f) | | | 0.91 | | | | 0.96 | | | | 1.05 | (a) |
Net investment loss | | | (0.48 | ) | | | (0.24 | ) | | | (0.49 | )(a) |
Portfolio turnover | | | 98 | | | | 96 | | | | 128 | |
Net assets at end of period (000 omitted) | | | $319,139 | | | | $244,655 | | | | $174,681 | |
See Notes to Financial Statements
25
Financial Highlights – continued
| | | | | | | | | | | | | | | | | | | | |
| Class 529A | | Years ended 8/31 | |
| | | 2014 | | | 2013 | | | 2012 | | | 2011 | | | 2010 | |
Net asset value, beginning of period | | | $25.25 | | | | $19.70 | | | | $22.22 | | | | $18.71 | | | | $15.97 | |
| Income (loss) from investment operations | | | | | | | | | | | | | | | | | | | | |
Net investment loss (d) | | | $(0.22 | ) | | | $(0.14 | ) | | | $(0.17 | ) | | | $(0.24 | ) | | | $(0.19 | ) |
Net realized and unrealized gain (loss)
on investments and foreign currency | | | 2.24 | | | | 5.69 | | | | 1.75 | | | | 5.16 | | | | 2.93 | |
Total from investment operations | | | $2.02 | | | | $5.55 | | | | $1.58 | | | | $4.92 | | | | $2.74 | |
| Less distributions declared to shareholders | | | | | | | | | | | | | | | | | | | | |
From net realized gain on investments | | | $(2.45 | ) | | | $— | | | | $(4.10 | ) | | | $(1.41 | ) | | | $— | |
Net asset value, end of period (x) | | | $24.82 | | | | $25.25 | | | | $19.70 | | | | $22.22 | | | | $18.71 | |
Total return (%) (r)(s)(t)(x) | | | 7.97 | | | | 28.17 | | | | 9.80 | | | | 26.09 | | | | 17.16 | |
Ratios (%) (to average net assets)
and Supplemental data: | | | | | | | | | | | | | | | | | | | | |
Expenses before expense reductions (f) | | | 1.43 | | | | 1.45 | | | | 1.49 | | | | 1.50 | | | | 1.61 | |
Expenses after expense reductions (f) | | | 1.30 | | | | 1.34 | | | | 1.40 | | | | 1.39 | | | | 1.51 | |
Net investment loss | | | (0.86 | ) | | | (0.62 | ) | | | (0.89 | ) | | | (0.99 | ) | | | (1.02 | ) |
Portfolio turnover | | | 98 | | | | 96 | | | | 128 | | | | 205 | | | | 167 | |
Net assets at end of period (000 omitted) | | | $5,150 | | | | $4,519 | | | | $3,304 | | | | $2,848 | | | | $1,735 | |
| |
| Class 529B | | Years ended 8/31 | |
| | | 2014 | | | 2013 | | | 2012 | | | 2011 | | | 2010 | |
Net asset value, beginning of period | | | $22.27 | | | | $17.51 | | | | $20.35 | | | | $17.36 | | | | $14.92 | |
| Income (loss) from investment operations | | | | | | | | | | | | | | | | | | | | |
Net investment loss (d) | | | $(0.36 | ) | | | $(0.28 | ) | | | $(0.28 | ) | | | $(0.38 | ) | | | $(0.31 | ) |
Net realized and unrealized gain (loss)
on investments and foreign currency | | | 1.98 | | | | 5.04 | | | | 1.54 | | | | 4.78 | | | | 2.75 | |
Total from investment operations | | | $1.62 | | | | $4.76 | | | | $1.26 | | | | $4.40 | | | | $2.44 | |
| Less distributions declared to shareholders | | | | | | | | | | | | | | | | | | | | |
From net realized gain on investments | | | $(2.45 | ) | | | $— | | | | $(4.10 | ) | | | $(1.41 | ) | | | $— | |
Net asset value, end of period (x) | | | $21.44 | | | | $22.27 | | | | $17.51 | | | | $20.35 | | | | $17.36 | |
Total return (%) (r)(s)(t)(x) | | | 7.18 | | | | 27.18 | | | | 8.99 | | | | 25.08 | | | | 16.35 | |
Ratios (%) (to average net assets)
and Supplemental data: | | | | | | | | | | | | | | | | | | | | |
Expenses before expense reductions (f) | | | 2.18 | | | | 2.20 | | | | 2.24 | | | | 2.24 | | | | 2.36 | |
Expenses after expense reductions (f) | | | 2.06 | | | | 2.10 | | | | 2.15 | | | | 2.14 | | | | 2.26 | |
Net investment loss | | | (1.62 | ) | | | (1.39 | ) | | | (1.64 | ) | | | (1.74 | ) | | | (1.77 | ) |
Portfolio turnover | | | 98 | | | | 96 | | | | 128 | | | | 205 | | | | 167 | |
Net assets at end of period (000 omitted) | | | $348 | | | | $300 | | | | $217 | | | | $197 | | | | $204 | |
See Notes to Financial Statements
26
Financial Highlights – continued
| | | | | | | | | | | | | | | | | | | | |
| Class 529C | | Years ended 8/31 | |
| | | 2014 | | | 2013 | | | 2012 | | | 2011 | | | 2010 | |
Net asset value, beginning of period | | | $22.28 | | | | $17.52 | | | | $20.36 | | | | $17.36 | | | | $14.93 | |
| Income (loss) from investment operations | | | | | | | | | | | | | | | | | | | | |
Net investment loss (d) | | | $(0.36 | ) | | | $(0.28 | ) | | | $(0.28 | ) | | | $(0.38 | ) | | | $(0.31 | ) |
Net realized and unrealized gain (loss)
on investments and foreign currency | | | 1.97 | | | | 5.04 | | | | 1.54 | | | | 4.79 | | | | 2.74 | |
Total from investment operations | | | $1.61 | | | | $4.76 | | | | $1.26 | | | | $4.41 | | | | $2.43 | |
| Less distributions declared to shareholders | | | | | | | | | | | | | | | | | | | | |
From net realized gain on investments | | | $(2.45 | ) | | | $— | | | | $(4.10 | ) | | | $(1.41 | ) | | | $— | |
Net asset value, end of period (x) | | | $21.44 | | | | $22.28 | | | | $17.52 | | | | $20.36 | | | | $17.36 | |
Total return (%) (r)(s)(t)(x) | | | 7.13 | | | | 27.17 | | | | 8.98 | | | | 25.14 | | | | 16.28 | |
Ratios (%) (to average net assets)
and Supplemental data: | | | | | | | | | | | | | | | | | | | | |
Expenses before expense reductions (f) | | | 2.18 | | | | 2.20 | | | | 2.24 | | | | 2.25 | | | | 2.36 | |
Expenses after expense reductions (f) | | | 2.07 | | | | 2.11 | | | | 2.15 | | | | 2.14 | | | | 2.26 | |
Net investment loss | | | (1.63 | ) | | | (1.39 | ) | | | (1.64 | ) | | | (1.74 | ) | | | (1.78 | ) |
Portfolio turnover | | | 98 | | | | 96 | | | | 128 | | | | 205 | | | | 167 | |
Net assets at end of period (000 omitted) | | | $1,223 | | | | $1,454 | | | | $906 | | | | $709 | | | | $469 | |
| (d) | Per share data is based on average shares outstanding. |
| (f) | Ratios do not reflect reductions from fees paid indirectly, if applicable. |
| (i) | For the period from the class inception, June 1, 2012, through the stated period end. |
| (r) | Certain expenses have been reduced without which performance would have been lower. |
| (s) | From time to time the fund may receive proceeds from litigation settlements, without which performance would be lower. |
| (t) | Total returns do not include any applicable sales charges. |
| (x) | The net asset values per share and total returns have been calculated on net assets which include adjustments made in accordance with U.S. generally accepted accounting principles required at period end for financial reporting purposes. |
See Notes to Financial Statements
27
NOTES TO FINANCIAL STATEMENTS
(1) Business and Organization
MFS New Discovery Fund (the fund) is a diversified series of MFS Series Trust I (the trust). The trust is organized as a Massachusetts business trust and is registered under the Investment Company Act of 1940, as amended, as an open-end management investment company.
The fund is an investment company and accordingly follows the investment company accounting and reporting guidance of the Financial Accounting Standards Board (FASB) Accounting Standards Codification Topic 946 Financial Services – Investment Companies.
(2) Significant Accounting Policies
General – The preparation of financial statements in conformity with U.S. generally accepted accounting principles requires management to make estimates and assumptions that affect the reported amounts of assets and liabilities, and disclosure of contingent assets and liabilities at the date of the financial statements and the reported amounts of increases and decreases in net assets from operations during the reporting period. Actual results could differ from those estimates. In the preparation of these financial statements, management has evaluated subsequent events occurring after the date of the fund’s Statement of Assets and Liabilities through the date that the financial statements were issued. The fund will generally focus on securities of small size companies which may be more volatile than those of larger companies.
In June 2014, FASB issued Accounting Standards Update 2014-11, Transfers and Servicing (Topic 860) – Repurchase-to-Maturity Transactions, Repurchase Financings, and Disclosures (“ASU 2014-11”). ASU 2014-11 changes the accounting for repurchase-to-maturity transactions (i.e., repurchase agreements that settle at the same time as the maturity of the transferred financial asset) and enhances the required disclosures for repurchase agreements and other similar transactions. Although still evaluating the potential impacts of ASU 2014-11 to the fund, management expects that the impact of the fund’s adoption will be limited to additional financial statement disclosures which would first be effective for interim reporting periods beginning after March 15, 2015.
Balance Sheet Offsetting – The fund’s accounting policy with respect to balance sheet offsetting is that, absent an event of default by the counterparty or a termination of the agreement, the International Swaps and Derivatives Association (ISDA) Master Agreement does not result in an offset of reported amounts of financial assets and financial liabilities in the Statement of Assets and Liabilities across transactions between the fund and the applicable counterparty. The fund’s right to setoff may be restricted or prohibited by the bankruptcy or insolvency laws of the particular jurisdiction to which a specific master netting agreement counterparty is subject. Balance sheet offsetting disclosures, to the extent applicable to the fund, have been included in the fund’s Significant Accounting Policies note under the captions for each of the fund’s in-scope financial instruments and transactions.
Investment Valuations – Equity securities, including restricted equity securities, are generally valued at the last sale or official closing price as provided by a third-party
28
Notes to Financial Statements – continued
pricing service on the market or exchange on which they are primarily traded. Equity securities, for which there were no sales reported that day, are generally valued at the last quoted daily bid quotation as provided by a third-party pricing service on the market or exchange on which such securities are primarily traded. Short-term instruments with a maturity at issuance of 60 days or less generally are valued at amortized cost, which approximates market value. Open-end investment companies are generally valued at net asset value per share. Securities and other assets generally valued on the basis of information from a third-party pricing service may also be valued at a broker/dealer bid quotation. Values obtained from third-party pricing services can utilize both transaction data and market information such as yield, quality, coupon rate, maturity, type of issue, trading characteristics, and other market data. The values of foreign securities and other assets and liabilities expressed in foreign currencies are converted to U.S. dollars using the mean of bid and asked prices for rates provided by a third-party pricing service.
The Board of Trustees has delegated primary responsibility for determining or causing to be determined the value of the fund’s investments (including any fair valuation) to the adviser pursuant to valuation policies and procedures approved by the Board. If the adviser determines that reliable market quotations are not readily available, investments are valued at fair value as determined in good faith by the adviser in accordance with such procedures under the oversight of the Board of Trustees. Under the fund’s valuation policies and procedures, market quotations are not considered to be readily available for most types of debt instruments and floating rate loans and many types of derivatives. These investments are generally valued at fair value based on information from third-party pricing services. In addition, investments may be valued at fair value if the adviser determines that an investment’s value has been materially affected by events occurring after the close of the exchange or market on which the investment is principally traded (such as foreign exchange or market) and prior to the determination of the fund’s net asset value, or after the halting of trading of a specific security where trading does not resume prior to the close of the exchange or market on which the security is principally traded. Events that occur on a frequent basis after foreign markets close (such as developments in foreign markets and significant movements in the U.S. markets) and prior to the determination of the fund’s net asset value may be deemed to have a material effect on the value of securities traded in foreign markets. Accordingly, the fund’s foreign equity securities may often be valued at fair value. The adviser generally relies on third-party pricing services or other information (such as the correlation with price movements of similar securities in the same or other markets; the type, cost and investment characteristics of the security; the business and financial condition of the issuer; and trading and other market data) to assist in determining whether to fair value and at what value to fair value an investment. The value of an investment for purposes of calculating the fund’s net asset value can differ depending on the source and method used to determine value. When fair valuation is used, the value of an investment used to determine the fund’s net asset value may differ from quoted or published prices for the same investment. There can be no assurance that the fund could obtain the fair value assigned to an investment if it were to sell the investment at the same time at which the fund determines its net asset value per share.
29
Notes to Financial Statements – continued
Various inputs are used in determining the value of the fund’s assets or liabilities. These inputs are categorized into three broad levels. In certain cases, the inputs used to measure fair value may fall into different levels of the fair value hierarchy. In such cases, an investment’s level within the fair value hierarchy is based on the lowest level of input that is significant to the fair value measurement. The fund’s assessment of the significance of a particular input to the fair value measurement in its entirety requires judgment, and considers factors specific to the investment. Level 1 includes unadjusted quoted prices in active markets for identical assets or liabilities. Level 2 includes other significant observable market-based inputs (including quoted prices for similar securities, interest rates, prepayment speed, and credit risk). Level 3 includes unobservable inputs, which may include the adviser’s own assumptions in determining the fair value of investments. The following is a summary of the levels used as of August 31, 2014 in valuing the fund’s assets or liabilities:
| | | | | | | | | | | | | | | | |
| Investments at Value | | Level 1 | | | Level 2 | | | Level 3 | | | Total | |
| Equity Securities: | | | | | | | | | | | | | | | | |
United States | | | $1,864,801,920 | | | | $— | | | | $— | | | | $1,864,801,920 | |
Greece | | | 66,673,980 | | | | — | | | | — | | | | 66,673,980 | |
Australia | | | 24,053,658 | | | | — | | | | — | | | | 24,053,658 | |
Hong Kong | | | 20,125,367 | | | | — | | | | — | | | | 20,125,367 | |
Israel | | | 18,795,453 | | | | — | | | | — | | | | 18,795,453 | |
Argentina | | | 15,868,978 | | | | — | | | | — | | | | 15,868,978 | |
Canada | | | 14,188,673 | | | | — | | | | — | | | | 14,188,673 | |
India | | | 14,126,417 | | | | — | | | | — | | | | 14,126,417 | |
Netherlands | | | 12,440,963 | | | | — | | | | — | | | | 12,440,963 | |
Other Countries | | | 12,169,429 | | | | 81,718 | | | | — | | | | 12,251,147 | |
| Mutual Funds | | | 19,001,852 | | | | — | | | | — | | | | 19,001,852 | |
| Total Investments | | | $2,082,246,690 | | | | $81,718 | | | | $— | | | | $2,082,328,408 | |
For further information regarding security characteristics, see the Portfolio of Investments.
Of the level 1 investments presented above, equity investments amounting to $24,053,659 would have been considered level 2 investments at the beginning of the period. The primary reason for changes in the classifications between levels 1 and 2 occurs when foreign equity securities are fair valued using other observable market-based inputs in place of the closing exchange price due to events occurring after the close of the exchange or market on which the investment is principally traded. The fund’s foreign equity securities may often be valued at fair value. The fund’s policy is to recognize transfers between the levels as of the end of the period.
Foreign Currency Translation – Purchases and sales of foreign investments, income, and expenses are converted into U.S. dollars based upon currency exchange rates prevailing on the respective dates of such transactions or on the reporting date for foreign denominated receivables and payables. Gains and losses attributable to foreign currency exchange rates on sales of securities are recorded for financial statement purposes as net realized gains and losses on investments. Gains and losses attributable to foreign exchange rate movements on receivables, payables, income and expenses are recorded for financial statement purposes as foreign currency transaction gains and
30
Notes to Financial Statements – continued
losses. That portion of both realized and unrealized gains and losses on investments that results from fluctuations in foreign currency exchange rates is not separately disclosed.
Security Loans – Under its Securities Lending Agency Agreement with the fund, State Street Bank and Trust Company (“State Street”), as lending agent, loans the securities of the fund to certain qualified institutions (the “Borrowers”) approved by the fund. The loans are collateralized by cash and/or U.S. Treasury and federal agency obligations in an amount typically at least equal to the market value of the securities loaned. On loans collateralized by cash, the cash collateral is invested in a money market fund. The market value of the loaned securities is determined at the close of business of the fund and any additional required collateral is delivered to the fund on the next business day. State Street provides the fund with indemnification against Borrower default. In the event of Borrower default, State Street will for the benefit of the fund either purchase securities identical to those loaned or, when such purchase is commercially impracticable, pay the fund the market value of the loaned securities. In return, State Street assumes the fund’s rights to the related collateral. If the collateral value is less than the cost to purchase identical securities, State Street is responsible for the shortfall, but only to the extent that such shortfall is not due to a decline in collateral value resulting from collateral reinvestment for which the fund bears the risk of loss. At period end, the fund had investment securities on loan with a fair value of $16,640,077 and a related liability of $17,262,496 for cash collateral received on securities loaned, both of which are presented gross in the Statement of Assets and Liabilities. The collateral received on securities loaned exceeded the value of securities on loan at period end. The liability for cash collateral for securities loaned is carried at fair value, which is categorized as level 2 within the fair value hierarchy. A portion of the income generated upon investment of the collateral is remitted to the Borrowers, and the remainder is allocated between the fund and the lending agent. On loans collateralized by U.S. Treasury and/or federal agency obligations, a fee is received from the Borrower, and is allocated between the fund and the lending agent. Income from securities lending is separately reported in the Statement of Operations. The dividend and interest income earned on the securities loaned is accounted for in the same manner as other dividend and interest income.
Indemnifications – Under the fund’s organizational documents, its officers and Trustees may be indemnified against certain liabilities and expenses arising out of the performance of their duties to the fund. Additionally, in the normal course of business, the fund enters into agreements with service providers that may contain indemnification clauses. The fund’s maximum exposure under these agreements is unknown as this would involve future claims that may be made against the fund that have not yet occurred.
Investment Transactions and Income – Investment transactions are recorded on the trade date. Dividends received in cash are recorded on the ex-dividend date. Certain dividends from foreign securities will be recorded when the fund is informed of the dividend if such information is obtained subsequent to the ex-dividend date. Dividend payments received in additional securities are recorded on the ex-dividend date in an amount equal to the value of the security on such date.
31
Notes to Financial Statements – continued
The fund may receive proceeds from litigation settlements. Any proceeds received from litigation involving portfolio holdings are reflected in the Statement of Operations in realized gain/loss if the security has been disposed of by the fund or in unrealized gain/loss if the security is still held by the fund. Any other proceeds from litigation not related to portfolio holdings are reflected as other income in the Statement of Operations.
Fees Paid Indirectly – The fund’s custody fee may be reduced according to an arrangement that measures the value of cash deposited with the custodian by the fund. This amount, for the year ended August 31, 2014, is shown as a reduction of total expenses in the Statement of Operations.
Tax Matters and Distributions – The fund intends to qualify as a regulated investment company, as defined under Subchapter M of the Internal Revenue Code, and to distribute all of its taxable income, including realized capital gains. As a result, no provision for federal income tax is required. The fund’s federal tax returns, when filed, will remain subject to examination by the Internal Revenue Service for a three year period. Management has analyzed the fund’s tax positions taken on federal and state tax returns for all open tax years and does not believe that there are any uncertain tax positions that require recognition of a tax liability. Foreign taxes, if any, have been accrued by the fund in the accompanying financial statements in accordance with the applicable foreign tax law. Foreign income taxes may be withheld by certain countries in which the fund invests. Additionally, capital gains realized by the fund on securities issued in or by certain foreign countries may be subject to capital gains tax imposed by those countries.
Distributions to shareholders are recorded on the ex-dividend date. Income and capital gain distributions are determined in accordance with income tax regulations, which may differ from U.S. generally accepted accounting principles. Certain capital accounts in the financial statements are periodically adjusted for permanent differences in order to reflect their tax character. These adjustments have no impact on net assets or net asset value per share. Temporary differences which arise from recognizing certain items of income, expense, gain or loss in different periods for financial statement and tax purposes will reverse at some time in the future. Distributions in excess of net investment income or net realized gains are temporary overdistributions for financial statement purposes resulting from differences in the recognition or classification of income or distributions for financial statement and tax purposes.
Book/tax differences primarily relate to wash sale loss deferrals, treating a portion of the proceeds from redemptions as a distribution for tax purposes, and redemptions in-kind.
The tax character of distributions declared to shareholders for the last two fiscal years is as follows:
| | | | | | | | |
| | | 8/31/14 | | | 8/31/13 | |
| Ordinary income (including any short-term capital gains) | | | $94,156,613 | | | | $— | |
| Long-term capital gains | | | 88,031,698 | | | | — | |
| Total distributions | | | $182,188,311 | | | | $— | |
32
Notes to Financial Statements – continued
The federal tax cost and the tax basis components of distributable earnings were as follows:
| | | | |
| As of 8/31/14 | | | |
| Cost of investments | | | $1,949,623,124 | |
| Gross appreciation | | | 311,197,731 | |
| Gross depreciation | | | (178,492,447 | ) |
| Net unrealized appreciation (depreciation) | | | $132,705,284 | |
| Undistributed ordinary income | | | 48,232,335 | |
| Undistributed long-term capital gain | | | 78,623,046 | |
| Other temporary differences | | | (2,936 | ) |
Multiple Classes of Shares of Beneficial Interest – The fund offers multiple classes of shares, which differ in their respective distribution, service, and program manager fees. The fund’s income, realized and unrealized gain (loss), and common expenses are allocated to shareholders based on the daily net assets of each class. Dividends are declared separately for each class. Differences in per share dividend rates are generally due to differences in separate class expenses. Class B and Class 529B shares will convert to Class A and Class 529A shares, respectively, approximately eight years after purchase. The fund’s distributions declared to shareholders as reported in the Statements of Changes in Net Assets are presented by class as follows:
| | | | | | | | |
| | | From net realized gain on
investments | |
| | | Year
ended
8/31/14 | | | Year
ended
8/31/13 | |
| Class A | | | $64,919,407 | | | | $— | |
| Class B | | | 4,186,982 | | | | — | |
| Class C | | | 15,593,082 | | | | — | |
| Class I | | | 35,717,827 | | | | — | |
| Class R1 | | | 937,201 | | | | — | |
| Class R2 | | | 6,122,546 | | | | — | |
| Class R3 | | | 12,790,928 | | | | — | |
| Class R4 | | | 19,003,758 | | | | — | |
| Class R5 | | | 22,264,000 | | | | — | |
| Class 529A | | | 451,752 | | | | — | |
| Class 529B | | | 33,273 | | | | — | |
| Class 529C | | | 167,555 | | | | — | |
| Total | | | $182,188,311 | | | | $— | |
(3) Transactions with Affiliates
Investment Adviser – The fund has an investment advisory agreement with MFS to provide overall investment management and related administrative services and facilities to the fund. The management fee is computed daily and paid monthly at an annual rate of 0.90% of the fund’s average daily net assets. Prior to August 1, 2014, the investment adviser had agreed in writing to reduce its management fee to 0.80% of average daily net asset in excess of $1 billion up to $2.5 billion and 0.75% of average daily net assets in excess of $2.5 billion. This written agreement terminated on
33
Notes to Financial Statements – continued
July 31, 2014. For the period September 1, 2013 through July 31, 2014, this management fee reduction amounted to $1,044,558, which is included in the reduction of total expenses in the Statement of Operations. Effective August 1, 2014, the investment adviser has agreed in writing to reduce its management fee to 0.80% of average daily net assets in excess of $1 billion up to $2.5 billion, 0.75% of average daily net assets in excess of $2.5 billion up to $5 billion, and 0.70% of average daily net assets in excess of $5 billion. This written agreement will continue until modified by the fund’s Board of Trustees, but such agreement will continue at least until December 31, 2015. For the period August 1, 2014 through August 31, 2014, this management fee reduction amounted to $88,313, which is included in the reduction of total expenses in the Statement of Operations. MFS has also agreed in writing to reduce its management fee by a specified amount if certain MFS mutual fund assets exceed thresholds agreed to by MFS and the fund’s Board of Trustees. For the year ended August 31, 2014, this management fee reduction amounted to $70,363, which is included in the reduction of total expenses in the Statement of Operations. The management fee incurred for the year ended August 31, 2014 was equivalent to an annual effective rate of 0.84% of the fund’s average daily net assets.
Prior to January 1, 2014, the investment adviser had agreed in writing to pay a portion of the fund’s total annual operating expenses, exclusive of interest, taxes, extraordinary expenses, brokerage and transaction costs, and investment-related expenses, such that total annual fund operating expenses do not exceed the following rates annually of each class’s average daily net assets.
| | | | | | | | | | | | | | | | | | | | | | | | | | | | | | | | | | | | | | | | | | | | | | |
| Classes | |
| A | | | B | | | C | | | I | | | R1 | | | R2 | | | R3 | | | R4 | | | R5 | | | 529A | | | 529B | | | 529C | |
| | 1.41% | | | | 2.16% | | | | 2.16% | | | | 1.16% | | | | 2.16% | | | | 1.66% | | | | 1.41% | | | | 1.16% | | | | 1.10% | | | | 1.46% | | | | 2.21% | | | | 2.21% | |
This written agreement terminated on December 31, 2013. For the period September 1, 2013 through December 31, 2013, the fund’s actual operating expenses did not exceed the limit and therefore, the investment adviser did not pay any portion of the fund’s expenses related to this agreement.
Distributor – MFS Fund Distributors, Inc. (MFD), a wholly-owned subsidiary of MFS, as distributor, received $272,669 and $4,065 for the year ended August 31, 2014, as its portion of the initial sales charge on sales of Class A and Class 529A shares of the fund, respectively.
The Board of Trustees has adopted a distribution plan for certain share classes pursuant to Rule 12b-1 of the Investment Company Act of 1940.
The fund’s distribution plan provides that the fund will pay MFD for services provided by MFD and financial intermediaries in connection with the distribution and servicing of certain share classes. One component of the plan is a distribution fee paid to MFD and another component of the plan is a service fee paid to MFD. MFD may subsequently pay all, or a portion, of the distribution and/or service fees to financial intermediaries.
34
Notes to Financial Statements – continued
Distribution Plan Fee Table:
| | | | | | | | | | | | | | | | | | | | |
| | | Distribution
Fee Rate (d) | | | Service
Fee Rate (d) | | | Total
Distribution
Plan (d) | | | Annual
Effective
Rate (e) | | | Distribution
and Service
Fee | |
| Class A | | | — | | | | 0.25% | | | | 0.25% | | | | 0.24% | | | | $1,806,113 | |
| Class B | | | 0.75% | | | | 0.25% | | | | 1.00% | | | | 1.00% | | | | 399,785 | |
| Class C | | | 0.75% | | | | 0.25% | | | | 1.00% | | | | 1.00% | | | | 1,536,876 | |
| Class R1 | | | 0.75% | | | | 0.25% | | | | 1.00% | | | | 1.00% | | | | 91,192 | |
| Class R2 | | | 0.25% | | | | 0.25% | | | | 0.50% | | | | 0.50% | | | | 340,250 | |
| Class R3 | | | — | | | | 0.25% | | | | 0.25% | | | | 0.25% | | | | 365,495 | |
| Class 529A | | | — | | | | 0.25% | | | | 0.25% | | | | 0.22% | | | | 12,712 | |
| Class 529B | | | 0.75% | | | | 0.25% | | | | 1.00% | | | | 0.98% | | | | 3,408 | |
| Class 529C | | | 0.75% | | | | 0.25% | | | | 1.00% | | | | 1.00% | | | | 14,927 | |
| Total Distribution and Service Fees | | | | $4,570,758 | |
| (d) | In accordance with the distribution plan for certain classes, the fund pays distribution and/or service fees equal to these annual percentage rates of each class’s average daily net assets. The distribution and service fee rates disclosed by class represent the current rates in effect at the end of the reporting period. Any rate changes, if applicable, are detailed below. |
| (e) | The annual effective rates represent actual fees incurred under the distribution plan for the year ended August 31, 2014 based on each class’s average daily net assets. MFD has voluntarily agreed to rebate a portion of each class’s 0.25% service fee attributable to accounts for which MFD retains the 0.25% service fee except for accounts attributable to MFS or its affiliates’ seed money. For the year ended August 31, 2014, this rebate amounted to $39,776, $597, $235, $2,358, $1,363, $58, and $3 for Class A, Class B, Class C, Class R3, Class 529A, Class 529B, and Class 529C, respectively, and is included in the reduction of total expenses in the Statement of Operations. |
Certain Class A shares are subject to a contingent deferred sales charge (CDSC) in the event of a shareholder redemption within 18 months of purchase for shares purchased on or after August 1, 2012, and within 24 months of purchase for shares purchased prior to August 1, 2012. Class C and Class 529C shares are subject to a CDSC in the event of a shareholder redemption within 12 months of purchase. Class B and Class 529B shares are subject to a CDSC in the event of a shareholder redemption within six years of purchase. All contingent deferred sales charges are paid to MFD and during the year ended August 31, 2014, were as follows:
| | | | |
| | | Amount | |
| Class A | | | $28,185 | |
| Class B | | | 85,024 | |
| Class C | | | 31,147 | |
| Class 529B | | | — | |
| Class 529C | | | 101 | |
The fund has entered into and may from time to time enter into contracts with program managers and other parties which administer the tuition programs through which an investment in the fund’s 529 share classes is made. The fund has entered into an agreement with MFD pursuant to which MFD receives an annual fee of up to 0.10% of the average daily net assets attributable to each 529 share class. MFD has agreed to waive a portion of this fee in an amount equal to 0.05% of the average daily net assets for each 529 share class. This waiver agreement will expire on December 31, 2015,
35
Notes to Financial Statements – continued
unless MFD elects to extend the waiver. For the year ended August 31, 2014, this waiver amounted to $3,459 and is included in the reduction of total expenses in the Statement of Operations. The program manager fee incurred for the year ended August 31, 2014 was equivalent to an annual effective rate of 0.05% of the average daily net assets attributable to each 529 share class. The services provided by MFD, or a third party with which MFD contracts, include recordkeeping and tax reporting and account services, as well as services designed to maintain the program’s compliance with the Internal Revenue Code and other regulatory requirements. Program manager fees and waivers for the year ended August 31, 2014, were as follows:
| | | | | | | | |
| | | Fee | | | Waiver | |
| Class 529A | | | $5,085 | | | | $2,542 | |
| Class 529B | | | 341 | | | | 170 | |
| Class 529C | | | 1,493 | | | | 747 | |
| Total Program Manager Fees and Waivers | | | $6,919 | | | | $3,459 | |
Shareholder Servicing Agent – MFS Service Center, Inc. (MFSC), a wholly-owned subsidiary of MFS, receives a fee from the fund for its services as shareholder servicing agent calculated as a percentage of the average daily net assets of the fund as determined periodically under the supervision of the fund’s Board of Trustees. For the year ended August 31, 2014, the fee was $308,252, which equated to 0.0144% annually of the fund’s average daily net assets. MFSC also receives payment from the fund for out-of-pocket expenses, sub-accounting and other shareholder servicing costs which may be paid to affiliated and unaffiliated service providers. Class R5 shares do not incur sub-accounting fees. For the year ended August 31, 2014, these out-of-pocket expenses, sub-accounting and other shareholder servicing costs amounted to $2,241,457.
Administrator – MFS provides certain financial, legal, shareholder communications, compliance, and other administrative services to the fund. Under an administrative services agreement, the fund partially reimburses MFS the costs incurred to provide these services. The fund is charged an annual fixed amount of $17,500 plus a fee based on average daily net assets. The administrative services fee incurred for the year ended August 31, 2014 was equivalent to an annual effective rate of 0.0124% of the fund’s average daily net assets.
Trustees’ and Officers’ Compensation – The fund pays compensation to independent Trustees in the form of a retainer, attendance fees, and additional compensation to Board and Committee chairpersons. The fund does not pay compensation directly to Trustees or officers of the fund who are also officers of the investment adviser, all of whom receive remuneration for their services to the fund from MFS. Certain officers and Trustees of the fund are officers or directors of MFS, MFD, and MFSC.
Prior to December 31, 2001, the fund had an unfunded defined benefit plan (“DB plan”) for independent Trustees. As of December 31, 2001, the Board took action to terminate the DB plan with respect to then-current and any future independent Trustees, such that the DB plan covers only certain of those former independent Trustees who retired on or before December 31, 2001. The DB plan resulted in a pension expense of $270 and is included in independent Trustees’ compensation for
36
Notes to Financial Statements – continued
the year ended August 31, 2014. The liability for deferred retirement benefits payable to certain independent Trustees under the DB plan amounted to $3,896 at August 31, 2014, and is included in “Payable for independent Trustees’ compensation” in the Statement of Assets and Liabilities.
Other – This fund and certain other funds managed by MFS (the funds) have entered into services agreements (the Agreements) which provide for payment of fees by the funds to Tarantino LLC and Griffin Compliance LLC in return for the provision of services of an Independent Chief Compliance Officer (ICCO) and Assistant ICCO, respectively, for the funds. The funds can terminate the Agreements with Tarantino LLC and Griffin Compliance LLC at any time under the terms of the Agreements. The ICCO is an officer of the funds and the sole member of Tarantino LLC. Prior to June 1, 2014, Robyn L. Griffin served as the Assistant ICCO and was an officer of the funds. Ms. Griffin is the sole member of Griffin Compliance LLC. Effective May 31, 2014, Ms. Griffin resigned as Assistant ICCO and the service agreement between the funds and Griffin Compliance LLC was terminated. For the year ended August 31, 2014, the aggregate fees paid by the fund to Tarantino LLC and Griffin Compliance LLC were $10,909 and are included in “Miscellaneous” expense in the Statement of Operations. MFS has agreed to reimburse the fund for a portion of the payments made by the fund in the amount of $3,217, which is included in the reduction of total expenses in the Statement of Operations. Additionally, MFS has agreed to bear all expenses associated with office space, other administrative support, and supplies provided to the ICCO and Assistant ICCO.
The fund invests in the MFS Institutional Money Market Portfolio which is managed by MFS and seeks current income consistent with preservation of capital and liquidity. Income earned on this investment is included in “Dividends from underlying affiliated funds” in the Statement of Operations. This money market fund does not pay a management fee to MFS.
On September 11, 2013, MFS redeemed 5,066 shares of Class R5 for an aggregate amount of $148,181.
(4) Portfolio Securities
For the year ended August 31, 2014, purchases and sales of investments, other than in-kind transactions and short-term obligations, aggregated $2,102,802,220 and $2,056,350,381, respectively.
37
Notes to Financial Statements – continued
(5) Shares of Beneficial Interest
The fund’s Declaration of Trust permits the Trustees to issue an unlimited number of full and fractional shares of beneficial interest. Transactions in fund shares were as follows:
| | | | | | | | | | | | | | | | |
| | | Year ended
8/31/14 | | | Year ended
8/31/13 | |
| | | Shares | | | Amount | | | Shares | | | Amount | |
| Shares sold | | | | | | | | | | | | | | | | |
Class A | | | 7,663,272 | | | | $202,602,844 | | | | 13,280,657 | | | | $317,286,546 | |
Class B | | | 302,403 | | | | 6,974,766 | | | | 413,203 | | | | 8,490,226 | |
Class C | | | 1,723,327 | | | | 39,755,016 | | | | 2,088,673 | | | | 43,663,588 | |
Class I | | | 9,806,541 | | | | 275,081,634 | | | | 9,044,050 | | | | 226,138,227 | |
Class R1 | | | 106,194 | | | | 2,417,551 | | | | 119,137 | | | | 2,448,027 | |
Class R2 | | | 1,059,827 | | | | 26,814,007 | | | | 1,281,338 | | | | 28,806,578 | |
Class R3 | | | 3,285,711 | | | | 86,307,510 | | | | 2,302,409 | | | | 53,724,050 | |
Class R4 | | | 3,655,137 | | | | 99,348,416 | | | | 2,656,356 | | | | 63,852,249 | |
Class R5 | | | 2,964,479 | | | | 81,129,522 | | | | 1,766,087 | | | | 42,150,539 | |
Class 529A | | | 47,165 | | | | 1,207,593 | | | | 34,989 | | | | 806,060 | |
Class 529B | | | 4,218 | | | | 94,274 | | | | 3,557 | | | | 69,765 | |
Class 529C | | | 12,166 | | | | 272,203 | | | | 18,424 | | | | 354,241 | |
| | | 30,630,440 | | | | $822,005,336 | | | | 33,008,880 | | | | $787,790,096 | |
| | | | |
| Shares issued to shareholders in reinvestment of distributions | | | | | | | | | | | | | | | | |
Class A | | | 2,328,346 | | | | $59,512,523 | | | | — | | | | $— | |
Class B | | | 163,157 | | | | 3,625,353 | | | | — | | | | — | |
Class C | | | 515,039 | | | | 11,464,768 | | | | — | | | | — | |
Class I | | | 902,424 | | | | 24,789,597 | | | | — | | | | — | |
Class R1 | | | 42,426 | | | | 937,201 | | | | — | | | | — | |
Class R2 | | | 223,362 | | | | 5,490,231 | | | | — | | | | — | |
Class R3 | | | 500,819 | | | | 12,790,928 | | | | — | | | | — | |
Class R4 | | | 718,763 | | | | 18,939,409 | | | | — | | | | — | |
Class R5 | | | 809,012 | | | | 22,264,000 | | | | — | | | | — | |
Class 529A | | | 18,150 | | | | 451,745 | | | | — | | | | — | |
Class 529B | | | 1,539 | | | | 33,273 | | | | — | | | | — | |
Class 529C | | | 7,745 | | | | 167,520 | | | | — | | | | — | |
| | | 6,230,782 | | | | $160,466,548 | | | | — | | | | $— | |
38
Notes to Financial Statements – continued
| | | | | | | | | | | | | | | | |
| | | Year ended
8/31/14 | | | Year ended
8/31/13 | |
| | | Shares | | | Amount | | | Shares | | | Amount | |
| Shares reacquired | | | | | | | | | | | | | | | | |
Class A | | | (19,125,143 | ) | | | $(506,940,419 | ) | | | (6,057,209 | ) | | | $(136,602,612 | ) |
Class B | | | (541,566 | ) | | | (12,107,368 | ) | | | (440,250 | ) | | | (8,819,700 | ) |
Class C | | | (1,827,747 | ) | | | (40,779,135 | ) | | | (1,172,917 | ) | | | (23,417,729 | ) |
Class I | | | (6,437,022 | ) | | | (178,077,081 | ) | | | (3,638,323 | ) | | | (86,932,110 | ) |
Class R1 | | | (156,327 | ) | | | (3,527,623 | ) | | | (144,665 | ) | | | (2,881,900 | ) |
Class R2 | | | (970,658 | ) | | | (24,347,286 | ) | | | (681,686 | ) | | | (14,889,511 | ) |
Class R3 | | | (2,161,380 | ) | | | (55,844,205 | ) | | | (1,056,634 | ) | | | (23,946,508 | ) |
Class R4 | | | (3,085,619 | ) | | | (82,182,423 | ) | | | (2,063,176 | ) | | | (48,545,028 | ) |
Class R5 | | | (1,025,858 | ) | | | (28,960,837 | ) | | | (1,046,242 | ) | | | (25,688,737 | ) |
Class 529A | | | (36,759 | ) | | | (920,840 | ) | | | (23,748 | ) | | | (532,514 | ) |
Class 529B | | | (2,976 | ) | | | (65,601 | ) | | | (2,507 | ) | | | (50,279 | ) |
Class 529C | | | (28,105 | ) | | | (617,796 | ) | | | (4,901 | ) | | | (99,988 | ) |
| | | (35,399,160 | ) | | | $(934,370,614 | ) | | | (16,332,258 | ) | | | $(372,406,616 | ) |
| | | | |
| Net change | | | | | | | | | | | | | | | | |
Class A | | | (9,133,525 | ) | | | $(244,825,052 | ) | | | 7,223,448 | | | | $180,683,934 | |
Class B | | | (76,006 | ) | | | (1,507,249 | ) | | | (27,047 | ) | | | (329,474 | ) |
Class C | | | 410,619 | | | | 10,440,649 | | | | 915,756 | | | | 20,245,859 | |
Class I | | | 4,271,943 | | | | 121,794,150 | | | | 5,405,727 | | | | 139,206,117 | |
Class R1 | | | (7,707 | ) | | | (172,871 | ) | | | (25,528 | ) | | | (433,873 | ) |
Class R2 | | | 312,531 | | | | 7,956,952 | | | | 599,652 | | | | 13,917,067 | |
Class R3 | | | 1,625,150 | | | | 43,254,233 | | | | 1,245,775 | | | | 29,777,542 | |
Class R4 | | | 1,288,281 | | | | 36,105,402 | | | | 593,180 | | | | 15,307,221 | |
Class R5 | | | 2,747,633 | | | | 74,432,685 | | | | 719,845 | | | | 16,461,802 | |
Class 529A | | | 28,556 | | | | 738,498 | | | | 11,241 | | | | 273,546 | |
Class 529B | | | 2,781 | | | | 61,946 | | | | 1,050 | | | | 19,486 | |
Class 529C | | | (8,194 | ) | | | (178,073 | ) | | | 13,523 | | | | 254,253 | |
| | | 1,462,062 | | | | $48,101,270 | | | | 16,676,622 | | | | $415,383,480 | |
The fund is one of several mutual funds in which the MFS funds-of-funds may invest. The MFS funds-of-funds do not invest in the underlying funds for the purpose of exercising management or control. At the end of the period, the MFS Growth Allocation Fund, the MFS Moderate Allocation Fund, the MFS Aggressive Growth Allocation Fund, and the MFS Conservative Allocation Fund, were the owners of record of approximately 5%, 5%, 2%, and 1%, respectively, of the value of outstanding voting shares of the fund. In addition, the MFS Lifetime 2015 Fund, the MFS Lifetime 2020 Fund, the MFS Lifetime 2025 Fund, the MFS Lifetime 2030 Fund, the MFS Lifetime 2035 Fund, the MFS Lifetime 2040 Fund, the MFS Lifetime 2045 Fund, the MFS Lifetime 2050 Fund, the MFS Lifetime 2055 Fund, and the MFS Lifetime Income Fund were each the owners of record of less than 1% of the value of outstanding voting shares of the fund.
(6) Line of Credit
The fund and certain other funds managed by MFS participate in a $1.1 billion unsecured committed line of credit, subject to a $1 billion sublimit, provided by a
39
Notes to Financial Statements – continued
syndication of banks under a credit agreement. Borrowings may be made for temporary financing needs. Interest is charged to each fund, based on its borrowings, generally at a rate equal to the higher of the Federal Reserve funds rate or one month LIBOR plus an agreed upon spread. A commitment fee, based on the average daily, unused portion of the committed line of credit, is allocated among the participating funds at the end of each calendar quarter. In addition, the fund and other funds managed by MFS have established unsecured uncommitted borrowing arrangements with certain banks for temporary financing needs. Interest is charged to each fund, based on its borrowings, at a rate equal to the Federal Reserve funds rate plus an agreed upon spread. For the year ended August 31, 2014, the fund’s commitment fee and interest expense were $8,566 and $0, respectively, and are included in “Miscellaneous” expense in the Statement of Operations.
(7) Transactions in Underlying Affiliated Funds-Affiliated Issuers
An affiliated issuer may be considered one in which the fund owns 5% or more of the outstanding voting securities, or a company which is under common control. For the purposes of this report, the fund assumes the following to be affiliated issuers:
| | | | | | | | | | | | | | | | |
| Underlying Affiliated Fund | | Beginning
Shares/Par
Amount | | | Acquisitions
Shares/Par
Amount | | | Dispositions
Shares/Par
Amount | | | Ending
Shares/Par
Amount | |
MFS Institutional Money
Market Portfolio | | | 11,908,354 | | | | 694,688,532 | | | | (704,857,530 | ) | | | 1,739,356 | |
| | | | |
| Underlying Affiliated Fund | | Realized
Gain (Loss) | | | Capital Gain
Distributions | | | Dividend
Income | | | Ending
Value | |
MFS Institutional Money
Market Portfolio | | | $— | | | | $— | | | | $16,778 | | | | $1,739,356 | |
| | | | |
| Other Affiliated Issuers | | Beginning
Shares/Par
Amount | | | Acquisitions
Shares/Par
Amount | | | Dispositions
Shares/Par
Amount | | | Ending
Shares/Par
Amount | |
| Citi Trends, Inc. | | | 1,312,543 | | | | 83,082 | | | | (178,206 | ) | | | 1,217,419 | |
| Fairway Group Holdings Corp. | | | 857,450 | | | | 1,216,449 | | | | (348,690 | ) | | | 1,725,209 | |
| Model N, Inc. | | | 1,833,988 | | | | 112,052 | | | | (292,889 | ) | | | 1,653,151 | |
| SciQuest, Inc. | | | 1,196,265 | | | | 1,549,775 | | | | (634,967 | ) | | | 2,111,073 | |
| TearLab Corp. | | | 801,389 | | | | 1,883,141 | | | | (176,049 | ) | | | 2,508,481 | |
| Uroplasty, Inc. | | | 1,567,473 | | | | 97,474 | | | | (212,821 | ) | | | 1,452,126 | |
| | | | |
| Other Affiliated Issuers | | Realized
Gain (Loss) | | | Capital Gain
Distributions | | | Dividend
Income | | | Ending
Value | |
| Citi Trends, Inc. | | | $(86,754 | ) | | | $— | | | | $— | | | | $28,317,166 | |
| Fairway Group Holdings Corp. | | | (3,209,072 | ) | | | — | | | | — | | | | 7,746,188 | |
| Model N, Inc. | | | (2,264,229 | ) | | | — | | | | — | | | | 15,275,115 | |
| SciQuest, Inc. | | | 6,252,471 | | | | — | | | | — | | | | 33,713,836 | |
| TearLab Corp. | | | 873,292 | | | | — | | | | — | | | | 9,707,821 | |
| Uroplasty, Inc. | | | (189,436 | ) | | | — | | | | — | | | | 3,819,091 | |
| | | | | | | | | | | | | | | | |
| | | $1,376,272 | | | | $— | | | | $— | | | | $98,579,217 | |
| | | | | | | | | | | | | | | | |
40
Notes to Financial Statements – continued
(8) Redemptions In-Kind
On September 27, 2013, the fund recorded redemption proceeds for a distribution in-kind of portfolio securities and cash that were valued at $196,913,535. The redeeming shareholder generally receives a pro rata share of the securities held by the fund. The distribution of such securities generated a realized gain of $60,096,207 for the fund.
41
REPORT OF INDEPENDENT REGISTERED PUBLIC ACCOUNTING FIRM
To the Board of Trustees of MFS Series Trust I and Shareholders of MFS New Discovery Fund:
We have audited the accompanying statement of assets and liabilities of MFS New Discovery Fund (the Fund) (one of the series constituting MFS Series Trust I), including the portfolio of investments, as of August 31, 2014, and the related statement of operations for the year then ended, the statements of changes in net assets for each of the two years in the period then ended, and the financial highlights for each of the periods indicated therein. These financial statements and financial highlights are the responsibility of the Fund’s management. Our responsibility is to express an opinion on these financial statements and financial highlights based on our audits.
We conducted our audits in accordance with the standards of the Public Company Accounting Oversight Board (United States). Those standards require that we plan and perform the audit to obtain reasonable assurance about whether the financial statements and financial highlights are free of material misstatement. We were not engaged to perform an audit of the Fund’s internal control over financial reporting. Our audits included consideration of internal control over financial reporting as a basis for designing audit procedures that are appropriate in the circumstances, but not for the purpose of expressing an opinion on the effectiveness of the Fund’s internal control over financial reporting. Accordingly, we express no such opinion. An audit also includes examining, on a test basis, evidence supporting the amounts and disclosures in the financial statements and financial highlights, assessing the accounting principles used and significant estimates made by management, and evaluating the overall financial statement presentation. Our procedures included confirmation of securities owned as of August 31, 2014, by correspondence with the custodian and others or by other appropriate auditing procedures where replies from others were not received. We believe that our audits provide a reasonable basis for our opinion.
In our opinion, the financial statements and financial highlights referred to above present fairly, in all material respects, the financial position of MFS New Discovery Fund (one of the series constituting MFS Series Trust I) at August 31, 2014, the results of its operations for the year then ended, the changes in its net assets for each of the two years in the period then ended, and the financial highlights for each of the periods indicated therein, in conformity with U.S. generally accepted accounting principles.

Boston, Massachusetts
October 16, 2014
42
TRUSTEES AND OFFICERS — IDENTIFICATION AND BACKGROUND
The Trustees and Officers of the Trust, as of October 1, 2014, are listed below, together with their principal occupations during the past five years. (Their titles may have varied during that period.) The address of each Trustee and Officer is 111 Huntington Avenue, Boston, Massachusetts 02199-7618. It is expected that the Board will appoint Mr. Timothy M. Fagan as Chief Compliance Officer of the MFS Funds on November 1, 2014.
| | | | | | | | |
Name, Age | | Position(s) Held with Fund | | Trustee/Officer
Since (h) | | Principal
Occupations During the Past Five Years | | Other Directorships (j) |
| INTERESTED TRUSTEES |
Robert J. Manning (k)
(age 50) | | Trustee | | February 2004 | | Massachusetts Financial Services Company, Chairman, Chief Executive Officer and Director; President (until 2009); Chief Investment Officer (until 2010) | | N/A |
Robin A. Stelmach (k)
(age 53) | | Trustee and President | | January 2014 | | Massachusetts Financial Services Company, Executive Vice President and Chief Operating Officer | | N/A |
| INDEPENDENT TRUSTEES | | |
David H. Gunning
(age 72) | | Trustee and Chair of Trustees | | January 2004 | | Private investor | | Lincoln Electric Holdings, Inc. (welding equipment manufacturer), Director; Development Alternatives, Inc. (consulting), Director/Non-Executive Chairman |
Steven E. Buller (age 63) | | Trustee | | February 2014 | | Chairman, Financial Accounting Standards Advisory Council; Standing Advisory Group, Public Company Accounting Oversight Board, Member; BlackRock, Inc. (investment management), Managing Director (until 2014), BlackRock Finco UK (investment management), Director (until 2014) | | N/A |
43
Trustees and Officers – continued
| | | | | | | | |
Name, Age | | Position(s) Held with Fund | | Trustee/Officer
Since (h) | | Principal
Occupations During the Past Five Years | | Other Directorships (j) |
Robert E. Butler
(age 72) | | Trustee | | January 2006 | | Consultant – investment company industry regulatory and compliance matters | | N/A |
Maureen R. Goldfarb
(age 59) | | Trustee | | January 2009 | | Private investor | | N/A |
William R. Gutow
(age 73) | | Trustee | | December 1993 | | Private investor and real estate consultant; Capitol Entertainment Management Company (video franchise), Vice Chairman | | Texas Donuts (donut franchise), Vice Chairman (until 2010) |
Michael Hegarty
(age 69) | | Trustee | | December 2004 | | Private investor | | Brookfield Office Properties, Inc. (real estate), Director; Rouse Properties Inc. (real estate), Director; Capmark Financial Group Inc. (real estate), Director |
John P. Kavanaugh
(age 59) | | Trustee | | January 2009 | | Private investor | | N/A |
Maryanne L. Roepke
(age 58) | | Trustee | | May 2014 | | American Century Investments (investment management), Senior Vice President and Chief Compliance Officer (until 2014) | | N/A |
Laurie J. Thomsen
(age 57) | | Trustee | | March 2005 | | Private investor; New Profit, Inc. (venture philanthropy), Executive Partner (until 2010) | | The Travelers Companies (insurance), Director |
Robert W. Uek
(age 73) | | Trustee | | January 2006 | | Consultant to investment company industry | | N/A |
| OFFICERS | | | | | | |
Christopher R. Bohane (k)
(age 40) | | Assistant Secretary and Assistant Clerk | | July 2005 | | Massachusetts Financial Services Company, Vice President and Assistant General Counsel | | N/A |
Kino Clark (k)
(age 46) | | Assistant Treasurer | | January 2012 | | Massachusetts Financial Services Company, Vice President | | N/A |
44
Trustees and Officers – continued
| | | | | | | | |
Name, Age | | Position(s) Held with Fund | | Trustee/Officer
Since (h) | | Principal
Occupations During the Past Five Years | | Other Directorships (j) |
Thomas H. Connors (k)
(age 55) | | Assistant Secretary and Assistant Clerk | | September 2012 | | Massachusetts Financial Services Company, Vice President and Senior Counsel; Deutsche Investment Management Americas Inc. (financial service provider), Director and Senior Counsel (until 2012) | | N/A |
Ethan D. Corey (k)
(age 50) | | Assistant Secretary and Assistant Clerk | | July 2005 | | Massachusetts Financial Services Company, Senior Vice President and Associate General Counsel | | N/A |
David L. DiLorenzo (k)
(age 46) | | Treasurer | | July 2005 | | Massachusetts Financial Services Company, Senior Vice President | | N/A |
Brian E. Langenfeld (k) (age 41) | | Assistant Secretary and Assistant Clerk | | June 2006 | | Massachusetts Financial Services Company, Vice President and Senior Counsel | | N/A |
Susan S. Newton (k) (age 64) | | Assistant Secretary and Assistant Clerk | | May 2005 | | Massachusetts Financial Services Company, Senior Vice President and Associate General Counsel | | N/A |
Susan A. Pereira (k)
(age 43) | | Assistant Secretary and Assistant Clerk | | July 2005 | | Massachusetts Financial Services Company, Vice President and Senior Counsel | | N/A |
Kasey L. Phillips (k) (age 43) | | Assistant Treasurer | | September 2012 | | Massachusetts Financial Services Company, Vice President; Wells Fargo Funds Management, LLC, Senior Vice President, Fund Treasurer (until 2012) | | N/A |
Mark N. Polebaum (k)
(age 62) | | Secretary and Clerk | | January 2006 | | Massachusetts Financial Services Company, Executive Vice President, General Counsel and Secretary | | N/A |
45
Trustees and Officers – continued
| | | | | | | | |
Name, Age | | Position(s) Held with Fund | | Trustee/Officer
Since (h) | | Principal
Occupations During the Past Five Years | | Other Directorships (j) |
Matthew A. Stowe (k)
(age 39) | | Assistant Secretary and Assistant Clerk | | October 2014 | | Massachusetts Financial Services Company, Vice President and Senior Counsel | | N/A |
Frank L. Tarantino (l)
(age 70) | | Independent Chief Compliance Officer | | June 2004 | | Tarantino LLC (provider of compliance services), Principal | | N/A |
Richard S. Weitzel (k)
(age 44) | | Assistant Secretary and Assistant Clerk | | October 2007 | | Massachusetts Financial Services Company, Senior Vice President and Associate General Counsel | | N/A |
James O. Yost (k)
(age 54) | | Deputy Treasurer | | September 1990 | | Massachusetts Financial Services Company, Senior Vice President | | N/A |
| (h) | Date first appointed to serve as Trustee/officer of an MFS Fund. Each Trustee has served continuously since appointment unless indicated otherwise. For the period from December 15, 2004 until February 22, 2005, Mr. Manning served as Advisory Trustee. Prior to January 2012, Messrs. DiLorenzo and Yost served as Assistant Treasurers of the Funds. Ms. Stelmach was appointed as President of the Funds as of October 1, 2014. |
| (j) | Directorships or trusteeships of companies required to report to the Securities and Exchange Commission (i.e., “public companies”). |
| (k) | “Interested person” of the Trust within the meaning of the Investment Company Act of 1940 (referred to as the 1940 Act), which is the principal federal law governing investment companies like the fund, as a result of position with MFS. The address of MFS is 111 Huntington Avenue, Boston, Massachusetts 02199-7618. |
| (l) | Mr. Tarantino will retire as Independent Chief Compliance Officer of the MFS Funds on October 31, 2014. It is expected that Mr. Tarantino will continue after that date as an Independent Senior Officer of the MFS Funds. |
Each Trustee (except Ms. Stelmach, Mr. Buller and Ms. Roepke) has been elected by shareholders and each Trustee and officer holds office until his or her successor is chosen and qualified or until his or her earlier death, resignation, retirement or removal. The Trust does not hold annual meetings for the purpose of electing Trustees, and Trustees are not elected for fixed terms. Messrs. Butler, Kavanaugh, Uek and Mses. Thomsen and Roepke are members of the Trust’s Audit Committee.
Each of the Fund’s Trustees and officers holds comparable positions with certain other funds of which MFS or a subsidiary is the investment adviser or distributor, and, in the case of the officers, with certain affiliates of MFS. As of January 1, 2014, the Trustees served as board members of 142 funds within the MFS Family of Funds.
46
Trustees and Officers – continued
The Statement of Additional Information for the Fund includes further information about the Trustees and is available without charge upon request by calling 1-800-225-2606.
| | |
| Investment Adviser | | Custodian |
Massachusetts Financial Services Company
111 Huntington Avenue
Boston, MA 02199-7618 | | State Street Bank and Trust Company 1 Lincoln Street Boston, MA 02111-2900 |
| Distributor | | Independent Registered Public Accounting Firm |
MFS Fund Distributors, Inc.
111 Huntington Avenue
Boston, MA 02199-7618 | | Ernst & Young LLP 200 Clarendon Street Boston, MA 02116 |
| Portfolio Managers | | |
Michael Grossman Thomas Wetherald | | |
47
BOARD REVIEW OF INVESTMENT ADVISORY AGREEMENT
The Investment Company Act of 1940 requires that both the full Board of Trustees and a majority of the non-interested (“independent”) Trustees, voting separately, annually approve the continuation of the Fund’s investment advisory agreement with MFS. The Trustees consider matters bearing on the Fund and its advisory arrangements at their meetings throughout the year, including a review of performance data at each regular meeting. In addition, the independent Trustees met several times over the course of three months beginning in May and ending in July, 2014 (“contract review meetings”) for the specific purpose of considering whether to approve the continuation of the investment advisory agreement for the Fund and the other investment companies that the Board oversees (the “MFS Funds”). The independent Trustees were assisted in their evaluation of the Fund’s investment advisory agreement by independent legal counsel, from whom they received separate legal advice and with whom they met separately from MFS during various contract review meetings. The independent Trustees were also assisted in this process by the MFS Funds’ Independent Chief Compliance Officer, a full-time senior officer appointed by and reporting to the independent Trustees.
In connection with their deliberations regarding the continuation of the investment advisory agreement, the Trustees, including the independent Trustees, considered such information and factors as they believed, in light of the legal advice furnished to them and their own business judgment, to be relevant. The investment advisory agreement for the Fund was considered separately, although the Trustees also took into account the common interests of all MFS Funds in their review. As described below, the Trustees considered the nature, quality, and extent of the various investment advisory, administrative, and shareholder services performed by MFS under the existing investment advisory agreement and other arrangements with the Fund.
In connection with their contract review meetings, the Trustees received and relied upon materials that included, among other items: (i) information provided by Lipper Inc., an independent third party, on the investment performance of the Fund for various time periods ended December 31, 2013 and the investment performance of a group of funds with substantially similar investment classifications/objectives (the “Lipper performance universe”), (ii) information provided by Lipper Inc. on the Fund’s advisory fees and other expenses and the advisory fees and other expenses of comparable funds identified by Lipper Inc. (the “Lipper expense group”), (iii) information provided by MFS on the advisory fees of comparable portfolios of other clients of MFS, including institutional separate accounts and other clients, (iv) information as to whether and to what extent applicable expense waivers, reimbursements or fee “breakpoints” are observed for the Fund, (v) information regarding MFS’ financial results and financial condition, including MFS’ and certain of its affiliates’ estimated profitability from services performed for the Fund and the MFS Funds as a whole, and compared to MFS’ institutional business, (vi) MFS’ views regarding the outlook for the mutual fund industry and the strategic business plans of MFS, (vii) descriptions of various functions performed by MFS for the Funds, such as compliance monitoring and portfolio trading practices, and (viii) information regarding the overall organization of MFS, including information about MFS’ senior management and other personnel providing investment advisory, administrative and other services to
48
Board Review of Investment Advisory Agreement – continued
the Fund and the other MFS Funds. The comparative performance, fee and expense information prepared and provided by Lipper Inc. was not independently verified and the independent Trustees did not independently verify any information provided to them by MFS.
The Trustees’ conclusion as to the continuation of the investment advisory agreement was based on a comprehensive consideration of all information provided to the Trustees and not the result of any single factor. Some of the factors that figured particularly in the Trustees’ deliberations are described below, although individual Trustees may have evaluated the information presented differently from one another, giving different weights to various factors. It is also important to recognize that the fee arrangements for the Fund and other MFS Funds are the result of years of review and discussion between the independent Trustees and MFS, that certain aspects of such arrangements may receive greater scrutiny in some years than in others, and that the Trustees’ conclusions may be based, in part, on their consideration of these same arrangements during the course of the year and in prior years.
Based on information provided by Lipper Inc. and MFS, the Trustees reviewed the Fund’s total return investment performance as well as the performance of peer groups of funds over various time periods. The Trustees placed particular emphasis on the total return performance of the Fund’s Class A shares in comparison to the performance of funds in its Lipper performance universe over the three-year period ended December 31, 2013, which the Trustees believed was a long enough period to reflect differing market conditions. The total return performance of the Fund’s Class A shares was in the 4th quintile relative to the other funds in the universe for this three-year period (the 1st quintile being the best performers and the 5th quintile being the worst performers). The total return performance of the Fund’s Class A shares was in the 3rd quintile for the one-year period and the 1st quintile for the five-year period ended December 31, 2013 relative to the Lipper performance universe. Because of the passage of time, these performance results may differ from the performance results for more recent periods, including those shown elsewhere in this report.
The Trustees expressed concern to MFS about the substandard investment performance of the Fund. In the course of their deliberations, the Trustees took into account information provided by MFS in connection with the contract review meetings, as well as during investment review meetings conducted with portfolio management personnel during the course of the year, as to MFS’ efforts to improve the Fund’s performance, including assigning an additional portfolio manager for the Fund in 2013. In addition, the Trustees requested that they receive a separate update on the Fund’s performance at each of their regular meetings. After reviewing these and related factors, the Trustees concluded, within the context of their overall conclusions regarding the investment advisory agreement, that MFS’ responses and efforts and plans to improve investment performance were sufficient to support approval of the continuance of the investment advisory agreement for an additional one-year period, but that they would continue to closely monitor the performance of the Fund.
In assessing the reasonableness of the Fund’s advisory fee, the Trustees considered, among other information, the Fund’s advisory fee and the total expense ratio of the Fund’s Class A shares as a percentage of average daily net assets and the advisory fee
49
Board Review of Investment Advisory Agreement – continued
and total expense ratios of peer groups of funds based on information provided by Lipper Inc. The Trustees considered that, according to the Lipper data (which takes into account any fee reductions or expense limitations that were in effect during the Fund’s last fiscal year), the Fund’s effective advisory fee rate and total expense ratio were each higher than the Lipper expense group median.
The Trustees also considered the advisory fees charged by MFS to any comparable institutional accounts. In comparing these fees, the Trustees considered information provided by MFS as to the generally broader scope of services provided by MFS to the Fund in comparison to institutional accounts, the higher demands placed on MFS’ investment personnel and trading infrastructure as a result of the daily cash in-flows and out-flows of the Fund, and the impact on MFS and expenses associated with the more extensive regulatory regime to which the Fund is subject in comparison to institutional accounts.
The Trustees also considered whether the Fund may benefit from any economies of scale in the management of the Fund in the event of growth in assets of the Fund and/or growth in assets of the MFS Funds as a whole. They noted that MFS has agreed in writing to reduce its advisory fee rate on the Fund’s average daily net assets over $1 billion and $2.5 billion and implement an additional breakpoint that reduces its advisory fee rate on the Fund’s average daily net assets over $5 billion, which may not be changed without the Trustees’ approval. The Trustees also noted that MFS has agreed in writing to waive a portion of the management fees of certain MFS Funds, including the Fund, if the total combined assets of certain funds within the MFS Funds’ complex increase above agreed upon thresholds (the “group fee waiver”), enabling the Fund’s shareholders to share in the benefits from any economies of scale at the complex level. The group fee waiver is reviewed and renewed annually between the Board and MFS. The Trustees concluded that the breakpoints and the group fee waiver were sufficient to allow the Fund to benefit from economies of scale as its assets and overall complex assets grow.
The Trustees also considered information prepared by MFS relating to MFS’ costs and profits with respect to the Fund, the MFS Funds considered as a group, and other investment companies and accounts advised by MFS, as well as MFS’ methodologies used to determine and allocate its costs to the MFS Funds, the Fund and other accounts and products for purposes of estimating profitability.
After reviewing these and other factors described herein, the Trustees concluded, within the context of their overall conclusions regarding the investment advisory agreement, that the advisory fees charged to the Fund represent reasonable compensation in light of the services being provided by MFS to the Fund.
In addition, the Trustees considered MFS’ resources and related efforts to continue to retain, attract and motivate capable personnel to serve the Fund. The Trustees also considered current and developing conditions in the financial services industry, including the presence of large and well-capitalized companies which are spending, and appear to be prepared to continue to spend, substantial sums to engage personnel and to provide services to competing investment companies. In this regard, the Trustees also considered the financial resources of MFS and its ultimate parent, Sun Life
50
Board Review of Investment Advisory Agreement – continued
Financial Inc. The Trustees also considered the advantages and possible disadvantages to the Fund of having an adviser that also serves other investment companies as well as other accounts.
The Trustees also considered the nature, quality, cost, and extent of administrative, transfer agency, and distribution services provided to the Fund by MFS and its affiliates under agreements and plans other than the investment advisory agreement, including any 12b-1 fees the Fund pays to MFS Fund Distributors, Inc., an affiliate of MFS. The Trustees also considered the nature, extent and quality of certain other services MFS performs or arranges for on the Fund’s behalf, which may include securities lending programs, directed expense payment programs, class action recovery programs, and MFS’ interaction with third-party service providers, principally custodians and sub-custodians. The Trustees concluded that the various non-advisory services provided by MFS and its affiliates on behalf of the Fund were satisfactory.
The Trustees also considered benefits to MFS from the use of the Fund’s portfolio brokerage commissions, if applicable, to pay for investment research and various other factors. Additionally, the Trustees considered so-called “fall-out benefits” to MFS such as reputational value derived from serving as investment manager to the Fund.
Based on their evaluation of factors that they deemed to be material, including those factors described above, the Board of Trustees, including the independent Trustees, concluded that the Fund’s investment advisory agreement with MFS should be continued for an additional one-year period, commencing August 1, 2014.
51
PROXY VOTING POLICIES AND INFORMATION
MFS votes proxies on behalf of the fund pursuant to proxy voting policies and procedures that are available without charge, upon request, by calling 1-800-225-2606, by visiting the Proxy Voting section of mfs.com or by visiting the SEC’s Web site at http://www.sec.gov.
Information regarding how the fund voted proxies relating to portfolio securities during the most recent twelve-month period ended June 30 is available without charge by visiting the Proxy Voting section of mfs.com or by visiting the SEC’s Web site at http://www.sec.gov.
QUARTERLY PORTFOLIO DISCLOSURE
The fund will file a complete schedule of portfolio holdings with the Securities and Exchange Commission (the Commission) for the first and third quarters of each fiscal year on Form N-Q. A shareholder can obtain the quarterly portfolio holdings report at mfs.com. The fund’s Form N-Q is also available on the EDGAR database on the Commission’s Internet Web site at http://www.sec.gov, and may be reviewed and copied at the:
Public Reference Room
Securities and Exchange Commission
100 F Street, NE, Room 1580
Washington, D.C. 20549
Information on the operation of the Public Reference Room may be obtained by calling the Commission at 1-800-SEC-0330. Copies of the fund’s Form N-Q also may be obtained, upon payment of a duplicating fee, by electronic request at the following e-mail address: publicinfo@sec.gov or by writing the Public Reference Section at the above address.
FURTHER INFORMATION
From time to time, MFS may post important information about the fund or the MFS funds on the MFS web site (mfs.com). This information is available by visiting the “Commentary & Announcements” and “Market Outlooks” sections of mfs.com or by clicking on the fund’s name under “Mutual Funds” in the “Products” section of mfs.com.
FEDERAL TAX INFORMATION (unaudited)
The fund will notify shareholders of amounts for use in preparing 2014 income tax forms in January 2015. The following information is provided pursuant to provisions of the Internal Revenue Code.
The fund designates the maximum amount allowable as qualified dividend income eligible to be taxed at the same rate as long-term capital gain.
The fund designates $121,554,000 as capital gain dividends paid during the fiscal year.
For corporate shareholders, 9.30% of the ordinary income dividends paid during the fiscal year qualify for the corporate dividends received deduction.
52
rev. 3/11
| | | | |
| | | |
FACTS | | WHAT DOES MFS DO WITH YOUR PERSONAL INFORMATION? | |  |
| | |
| Why? | | Financial companies choose how they share your personal information. Federal law gives consumers the right to limit some but not all sharing. Federal law also requires us to tell you how we collect, share, and protect your personal information. Please read this notice carefully to understand what we do. |
| | |
| What? | | The types of personal information we collect and share depend on the product or service you have with us. This information can include: • Social Security number and account balances • Account transactions and transaction history • Checking account information and wire transfer instructions When you are no longer our customer, we continue to share your information as described in this notice. |
| | |
| How? | | All financial companies need to share customers’ personal information to run their everyday business. In the section below, we list the reasons financial companies can share their customers’ personal information; the reasons MFS chooses to share; and whether you can limit this sharing. |
| | | | |
Reasons we can share your
personal information | | Does MFS
share? | | Can you limit
this sharing? |
For our everyday business purposes – such as to process your transactions, maintain your account(s), respond to court orders and legal investigations, or report to credit bureaus | | Yes | | No |
For our marketing purposes – to offer our products and services to you | | No | | We don’t share |
| For joint marketing with other financial companies | | No | | We don’t share |
For our affiliates’ everyday business purposes – information about your transactions and experiences | | No | | We don’t share |
For our affiliates’ everyday business purposes – information about your creditworthiness | | No | | We don’t share |
| For nonaffiliates to market to you | | No | | We don’t share |
| | |
| Questions? | | Call 800-225-2606 or go to mfs.com. |
53
| | |
| Who we are |
| Who is providing this notice? | | MFS Funds, MFS Investment Management, MFS Institutional Advisors, Inc., MFS Fund Distributors, Inc., MFS Heritage Trust Company, and MFS Service Center, Inc. |
| | |
| What we do |
| How does MFS protect my personal information? | | To protect your personal information from unauthorized access and use, we use security measures that comply with federal law. These measures include procedural, electronic, and physical safeguards for the protection of the personal information we collect about you. |
| How does MFS collect my personal information? | | We collect your personal information, for example, when you •open an account or provide account information •direct us to buy securities or direct us to sell your securities •make a wire transfer We also collect your personal information from others, such as credit bureaus, affiliates and other companies. |
| Why can’t I limit all sharing? | | Federal law gives you the right to limit only •sharing for affiliates’ everyday business purposes – information about your creditworthiness •affiliates from using your information to market to you •sharing for nonaffiliates to market to you State laws and individual companies may give you additional rights to limit sharing. |
| | |
| Definitions |
| Affiliates | | Companies related by common ownership or control. They can be financial and nonfinancial companies. •MFS does not share personal information with affiliates, except for everyday business purposes as described on page one of this notice. |
| Nonaffiliates | | Companies not related by common ownership or control. They can be financial and nonfinancial companies. •MFS does not share with nonaffiliates so they can market to you. |
| Joint Marketing | | A formal agreement between nonaffiliated financial companies that together market financial products or services to you. •MFS doesn’t jointly market. |
| | |
| Other important information |
| If you own an MFS product or receive an MFS service in the name of a third party such as a bank or broker-dealer, their privacy policy may apply to you instead of ours. |
54
Save paper with eDelivery.

| MFS® will send you prospectuses, |
reports, and proxies directly via e-mail so you will get information faster with less mailbox clutter.
To sign up:
1. Go to mfs.com.
2. Log in via MFS® Access.
3. Select eDelivery.
If you own your MFS fund shares through a financial institution or a retirement plan, MFS® TALK, MFS® Access, or eDelivery may not be available to you.
CONTACT
WEB SITE
mfs.com
MFS TALK
1-800-637-8255
24 hours a day
ACCOUNT SERVICE AND LITERATURE
Shareholders
1-800-225-2606
Financial advisors
1-800-343-2829
Retirement plan services
1-800-637-1255
MAILING ADDRESS
MFS Service Center, Inc.
P.O. Box 55824
Boston, MA 02205-5824
OVERNIGHT MAIL
MFS Service Center, Inc.
c/o Boston Financial Data Services
30 Dan Road
Canton, MA 02021-2809
ANNUAL REPORT
August 31, 2014

MFS® RESEARCH INTERNATIONAL FUND

RIF-ANN
MFS® RESEARCH INTERNATIONAL FUND
CONTENTS
The report is prepared for the general information of shareholders.
It is authorized for distribution to prospective investors only when preceded or accompanied by a current prospectus.
NOT FDIC INSURED Ÿ MAY LOSE VALUE Ÿ NO BANK GUARANTEE

LETTER FROM THE CHAIRMAN AND CEO
Dear Shareholders:
The U.S. economy continues to gain strength. Manufacturing output, construction activity and consumer confidence are all at multi-year highs, auto sales are robust, and
U.S. labor market reports show broad progress. Even a slowdown in the pace of rising house prices is seen as making the market more sustainable. Economists have a favorable outlook, and broad stock indices reflect that.
However, challenges dominate the rest of the global economy. China is struggling to boost its industrial output and Japan’s economic turnaround appears to have hit a setback after its sales tax increase in April. The eurozone economy is being held back by persistently high unemployment and dangerously low inflation, leading the European Central Bank to take more
aggressive stimulus action. With robust corporate earnings, the market’s greatest concerns relate to conflicts in the Middle East and Ukraine. In addition, speculation continues on when the U.S. Federal Reserve will begin tightening its monetary policy now that the U.S. economy has regained some traction.
As always at MFS®, active risk management is integral to how we manage your investments. We use a collaborative process, sharing insights across asset classes, regions and economic sectors. Our global team of investment professionals uses a multidisciplined, long-term, diversified investment approach.
We understand that these are challenging economic times. We believe we can serve you best by applying proven principles, such as asset allocation and diversification, over the long term. We are confident that this approach can help you as you work with your financial advisors to reach your goals in the years ahead.
Respectfully,

Robert J. Manning
Chairman and Chief Executive Officer
MFS Investment Management
October 16, 2014
The opinions expressed in this letter are subject to change and may not be relied upon for investment advice. No forecasts can be guaranteed.
1
PORTFOLIO COMPOSITION
Portfolio structure

| | | | |
| Top ten holdings | | | | |
| Royal Dutch Shell PLC, “A” | | | 3.5% | |
| Novartis AG | | | 3.4% | |
| Nestle S.A. | | | 2.6% | |
| HSBC Holdings PLC | | | 2.4% | |
| Rio Tinto Ltd. | | | 2.1% | |
| Westpac Banking Corp. | | | 2.0% | |
| Bayer AG | | | 1.8% | |
| KDDI Corp. | | | 1.8% | |
| Schneider Electric S.A. | | | 1.7% | |
| GlaxoSmithKline PLC | | | 1.7% | |
| |
| Global equity sectors | | | | |
| Financial Services | | | 25.2% | |
| Capital Goods | | | 22.4% | |
| Health Care | | | 10.6% | |
| Energy | | | 10.6% | |
| Consumer Staples | | | 9.0% | |
| Consumer Cyclicals | | | 8.0% | |
| Technology | | | 7.3% | |
| Telecommunications/Cable Television | | | 5.0% | |
| | | | |
| Issuer country weightings (x) | |
| United Kingdom | | | 21.0% | |
| Japan | | | 18.0% | |
| Switzerland | | | 12.2% | |
| France | | | 10.2% | |
| Germany | | | 6.8% | |
| United States | | | 5.0% | |
| Hong Kong | | | 4.2% | |
| Netherlands | | | 4.1% | |
| Australia | | | 3.9% | |
| Other Countries | | | 14.6% | |
|
| Currency exposure weightings (y) | |
| Euro | | | 24.6% | |
| British Pound Sterling | | | 21.0% | |
| Japanese Yen | | | 18.0% | |
| Swiss Franc | | | 12.2% | |
| United States Dollar | | | 5.0% | |
| Hong Kong Dollar | | | 4.6% | |
| Australian Dollar | | | 3.9% | |
| Swedish Krona | | | 2.5% | |
| Taiwan Dollar | | | 2.0% | |
| Other Currencies | | | 6.2% | |
| (x) | Represents the portfolio’s exposure to issuer countries as a percentage of a portfolio’s net assets. For purposes of this presentation, United States includes Cash & Other. |
| (y) | Represents the portfolio’s exposure to a particular currency as a percentage of a portfolio’s net assets. For purposes of this presentation, United States Dollar includes Cash & Other. |
Cash & Other can include cash, other assets less liabilities, offsets to derivative positions, and short-term securities.
Percentages are based on net assets as of 8/31/14.
The portfolio is actively managed and current holdings may be different.
2
MANAGEMENT REVIEW
Summary of Results
For the twelve months ended August 31, 2014, Class A shares of the MFS Research International Fund (“fund”) provided a total return of 12.60%, at net asset value. This compares with a return of 16.92% for the fund’s benchmark, the MSCI EAFE Index.
Market Environment
Early in the period, equity markets advanced in response to improved economic fundamentals, having recovered from prior weakness stemming from concerns that the US Federal Reserve (“Fed”) would begin tapering its quantitative easing (“QE”) program. A general theme in the market was a rotation in investor allocations from fixed income to equities and emerging markets (“EM”) to developed markets, reflecting an anticipated acceleration in developed market growth rates relative to EM as well as a more equity-friendly macro backdrop amid increased volatility in EM debt. As the period progressed, the Fed’s decision to postpone QE tapering surprised markets. Favorable market reactions were tempered, however, by tense negotiations over US fiscal policy which resulted in a 16-day partial shutdown of the federal government and a short-term extension in the debt ceiling. The volatility was short-lived, however, as an extension of budget and debt ceiling deadlines allowed the government to re-open, and subsequent economic data reflected moderate but resilient US growth. Also well-received was the decision by the European Central Bank (“ECB”) to cut its policy rate as inflation pressures waned in the region. In addition, equity investors appeared to have concluded that there would be no major change in US monetary policy as a result of the nomination of Janet Yellen as the new Fed Chair for a term beginning in early 2014 and that tapering would have no major impact on the trajectory.
Later in the period, financial markets were forced to contend with a series of positive and negative return episodes. In addition to periodic flashpoints in country specific emerging markets, geopolitical tensions flared in the Middle East and Russia/Ukraine. Market setbacks were short-lived, as improving economic growth in the US coupled with prospects for easier monetary policy in regions with slowing growth such as Japan, Europe and China, supported risk assets. For example, the ECB cut policy interest rates into negative territory and by the end of the period expectations were for additional rate cuts and the announcement for non-conventional easing measures. The decline in developed market government bond yields and credit spreads were also supportive for equity markets. At the end of the period, the US equity market was trading at all-time highs.
Detractors from Performance
Stock selection within the capital goods sector was a primary detractor from performance relative to the MSCI EAFE Index. The fund’s overweight positions in automobile electric part manufacturer DENSO (Japan), global engineering company JGC (Japan), automobiles and motors manufacturer Honda Motor (Japan), mining company Iluka Resources (Australia) and parcel delivery services company Yamato Holdings (Japan) weakened relative results as all five stocks underperformed the benchmark over the period. Shares of JGC traded lower as the company reported a
3
Management Review – continued
decline in operating margins towards the middle of the period. A combination of the weakened yen and project delays due to customer-related factors were key drivers of the shortfall.
Security selection in the financial services sector was another detractor from relative results. Here, overweight positions in financial services company Erste Group Bank (Austria) and banking and financial services firm Sumitomo Mitsui Financial Group (Japan) held back relative returns. Shares of Erste Group Bank declined towards the end of the period after management lowered profit guidance driven by impairment charges in Romania and lower net interest income in Hungary.
Within the consumer staples sector, security selection weakened relative performance. An overweight position in weak-performing international food producer Groupe Danone (France) weighed on relative results.
Stock selection in the health care sector was also an area of relative weakness. Not holding strong-performing pharmaceutical firm AstraZeneca (United Kingdom) detracted from relative performance.
The fund’s cash and/or cash equivalents position during the period also held back relative returns. Under normal market conditions, the fund strives to be fully invested and generally holds cash to buy new holdings and to provide liquidity. In a period when markets rose, as measured by the fund’s benchmark, holding cash hurt performance versus the benchmark, which has no cash position.
Contributors to Performance
Stock selection in the energy sector benefited relative performance. Within this sector, an overweight position in global energy and petrochemical company Royal Dutch Shell (United Kingdom) supported relative results. Shares of Royal Dutch Shell traded higher in the latter half of the reporting period as the company reported quarterly results that beat analyst forecasts on higher natural gas earnings.
Security selection in the consumer cyclicals sector was another positive factor for relative performance. Here, an overweight position in hotel and restaurant operator Whitbread (United Kingdom) and not holding weak-performing supermarkets and convenient stores operator Tesco (United Kingdom), aided relative returns. Shares of Whitbread appreciated toward the middle of the reporting period as the company reported another strong quarter across all divisions. Its hotel segment performed well where the refurbishment cycle for Premier Inn rooms accelerated. After a strong Christmas Costa Coffee campaign for Whitbread, like-for-like growth in sales increased relative to previous quarters.
Stocks in other sectors that benefited relative results included the fund’s holdings of banking firm HDFC Bank (b) (India), integrated circuit manufacturer MediaTek (b) (Taiwan) and overweight positions in pharmaceutical company Novartis (Switzerland), banking firm KBC Groep (h) (Belgium), medical device manufacturer Santen
4
Management Review – continued
Pharmaceutical (Japan) and hearing and wireless communication systems manufacturer Sonova Holdings (h) (Switzerland). In addition, not holding weak-performing car maker Toyota Motor (Japan) strengthened relative results.
Respectfully,
| | |
Jose Luis Garcia Portfolio Manager | | Thomas Melendez Portfolio Manager |
| (b) | Security is not a benchmark constituent. |
| (h) | Security was not held in the portfolio at period end. |
The views expressed in this report are those of the portfolio managers only through the end of the period of the report as stated on the cover and do not necessarily reflect the views of MFS or any other person in the MFS organization. These views are subject to change at any time based on market or other conditions, and MFS disclaims any responsibility to update such views. These views may not be relied upon as investment advice or an indication of trading intent on behalf of any MFS portfolio. References to specific securities are not recommendations of such securities, and may not be representative of any MFS portfolio’s current or future investments.
5
PERFORMANCE SUMMARY THROUGH 8/31/14
The following chart illustrates a representative class of the fund’s historical performance in comparison to its benchmark(s). Performance results include the deduction of the maximum applicable sales charge and reflect the percentage change in net asset value, including reinvestment of dividends and capital gains distributions. The performance of other share classes will be greater than or less than that of the class depicted below. Benchmarks are unmanaged and may not be invested in directly. Benchmark returns do not reflect sales charges, commissions or expenses. (See Notes to Performance Summary.)
Performance data shown represents past performance and is no guarantee of future results. Investment return and principal value fluctuate so your shares, when sold, may be worth more or less than the original cost; current performance may be lower or higher than quoted. The performance shown does not reflect the deduction of taxes, if any, that a shareholder would pay on fund distributions or the redemption of fund shares.
Growth of a Hypothetical $10,000 Investment
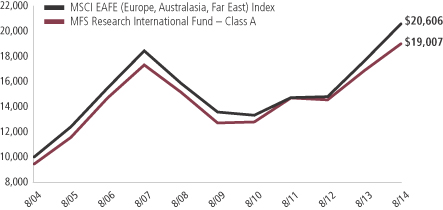
6
Performance Summary – continued
Total Returns through 8/31/14
Average annual without sales charge
| | | | | | | | | | | | | | |
| | | Share class | | Class inception date | | 1-yr | | 5-yr | | 10-yr | | Life (t) | | |
| | | A | | 1/02/97 | | 12.60% | | 8.39% | | 7.27% | | N/A | | |
| | | B | | 1/02/98 | | 11.77% | | 7.58% | | 6.50% | | N/A | | |
| | | C | | 1/02/98 | | 11.74% | | 7.59% | | 6.51% | | N/A | | |
| | | I | | 1/02/97 | | 12.89% | | 8.65% | | 7.58% | | N/A | | |
| | | R1 | | 4/01/05 | | 11.73% | | 7.58% | | N/A | | 5.35% | | |
| | | R2 | | 10/31/03 | | 12.32% | | 8.12% | | 6.97% | | N/A | | |
| | | R3 | | 4/01/05 | | 12.56% | | 8.40% | | N/A | | 6.13% | | |
| | | R4 | | 4/01/05 | | 12.87% | | 8.67% | | N/A | | 6.42% | | |
| | | R5 | | 5/01/06 | | 13.01% | | 8.65% | | N/A | | 3.30% | | |
| | | 529A | | 7/31/02 | | 12.57% | | 8.31% | | 7.11% | | N/A | | |
| | | 529B | | 7/31/02 | | 11.71% | | 7.51% | | 6.36% | | N/A | | |
| | | 529C | | 7/31/02 | | 11.68% | | 7.51% | | 6.36% | | N/A | | |
| Comparative benchmark | | | | | | | | | | |
| | | MSCI EAFE (Europe, Australasia,
Far East) Index (f) | | 16.92% | | 8.69% | | 7.50% | | N/A | | |
| Average annual with sales charge | | | | | | | | | | |
| | | A
With Initial Sales Charge (5.75%) | | 6.13% | | 7.11% | | 6.63% | | N/A | | |
| | | B
With CDSC (Declining over six years from 4% to 0%) (v) | | 7.77% | | 7.28% | | 6.50% | | N/A | | |
| | | C
With CDSC (1% for 12 months) (v) | | 10.74% | | 7.59% | | 6.51% | �� | N/A | | |
| | | 529A
With initial Sales Charge (5.75%) | | 6.10% | | 7.04% | | 6.48% | | N/A | | |
| | | 529B
With CDSC (Declining over six years from 4% to 0%) (v) | | 7.71% | | 7.21% | | 6.36% | | N/A | | |
| | | 529C
With CDSC (1% for 12 months) (v) | | 10.68% | | 7.51% | | 6.36% | | N/A | | |
On May 30, 2012, Class W shares were redesignated Class R5 shares. Total returns for Class R5 shares prior to May 30, 2012 reflect the performance history of Class W shares which had different fees and expenses than Class R5 shares.
CDSC – Contingent Deferred Sales Charge.
Class I, R1, R2, R3, R4, and R5 shares do not have a sales charge.
| (f) | Source: FactSet Research Systems Inc. |
7
Performance Summary – continued
| (t) | For the period from the class inception date through the stated period end (for those share classes with less than 10 years of performance history). No comparative benchmark performance information is provided for “life” periods. (See Notes to Performance Summary.) |
| (v) | Assuming redemption at the end of the applicable period. |
Benchmark Definition
MSCI EAFE (Europe, Australasia, Far East) Index – a market capitalization-weighted index that is designed to measure equity market performance in the developed markets, excluding the U.S. and Canada.
It is not possible to invest directly in an index.
Notes to Performance Summary
Class 529 shares are only available in conjunction with qualified tuition programs, such as the MFS 529 Savings Plan. There also is an additional fee, which is detailed in the program description, on qualified tuition programs. If this fee was reflected, the performance for Class 529 shares would have been lower. This annual fee is waived for Oregon residents and for those accounts with assets of $25,000 or more.
Average annual total return represents the average annual change in value for each share class for the periods presented. Life returns are presented where the share class has less than 10 years of performance history and represent the average annual total return from the class inception date to the stated period end date. As the fund’s share classes may have different inception dates, the life returns may represent different time periods and may not be comparable. As a result, no comparative benchmark performance information is provided for life periods.
Performance results reflect any applicable expense subsidies and waivers in effect during the periods shown. Without such subsidies and waivers the fund’s performance results would be less favorable. Please see the prospectus and financial statements for complete details.
Performance results do not include adjustments made for financial reporting purposes in accordance with U.S. generally accepted accounting principles and may differ from amounts reported in the financial highlights.
From time to time the fund may receive proceeds from litigation settlements, without which performance would be lower.
8
`
EXPENSE TABLE
Fund expenses borne by the shareholders during the period, March 1, 2014 through August 31, 2014
As a shareholder of the fund, you incur two types of costs: (1) transaction costs, including sales charges (loads) on certain purchase or redemption payments, and (2) ongoing costs, including management fees; distribution and service (12b-1) fees; and other fund expenses. This example is intended to help you understand your ongoing costs (in dollars) of investing in the fund and to compare these costs with the ongoing costs of investing in other mutual funds.
The example is based on an investment of $1,000 invested at the beginning of the period and held for the entire period March 1, 2014 through August 31, 2014.
Actual Expenses
The first line for each share class in the following table provides information about actual account values and actual expenses. You may use the information in this line, together with the amount you invested, to estimate the expenses that you paid over the period. Simply divide your account value by $1,000 (for example, an $8,600 account value divided by $1,000 = 8.6), then multiply the result by the number in the first line under the heading entitled “Expenses Paid During Period” to estimate the expenses you paid on your account during this period.
Hypothetical Example for Comparison Purposes
The second line for each share class in the following table provides information about hypothetical account values and hypothetical expenses based on the fund’s actual expense ratio and an assumed rate of return of 5% per year before expenses, which is not the fund’s actual return. The hypothetical account values and expenses may not be used to estimate the actual ending account balance or expenses you paid for the period. You may use this information to compare the ongoing costs of investing in the fund and other funds. To do so, compare this 5% hypothetical example with the 5% hypothetical examples that appear in the shareholder reports of the other funds.
Please note that the expenses shown in the table are meant to highlight your ongoing costs only and do not reflect any transactional costs, such as sales charges (loads). Therefore, the second line for each share class in the table is useful in comparing ongoing costs only, and will not help you determine the relative total costs of owning different funds. In addition, if these transactional costs were included, your costs would have been higher.
9
Expense Table – continued
| | | | | | | | | | | | | | | | | | |
Share Class | | | | Annualized Expense Ratio | | | Beginning Account Value
3/01/14 | | | Ending Account Value 8/31/14 | | | Expenses Paid During Period (p) 3/01/14-8/31/14 | |
| A | | Actual | | | 1.11% | | | | $1,000.00 | | | | $1,011.20 | | | | $5.63 | |
| | Hypothetical (h) | | | 1.11% | | | | $1,000.00 | | | | $1,019.61 | | | | $5.65 | |
| B | | Actual | | | 1.86% | | | | $1,000.00 | | | | $1,007.59 | | | | $9.41 | |
| | Hypothetical (h) | | | 1.86% | | | | $1,000.00 | | | | $1,015.83 | | | | $9.45 | |
| C | | Actual | | | 1.86% | | | | $1,000.00 | | | | $1,007.74 | | | | $9.41 | |
| | Hypothetical (h) | | | 1.86% | | | | $1,000.00 | | | | $1,015.83 | | | | $9.45 | |
| I | | Actual | | | 0.86% | | | | $1,000.00 | | | | $1,012.48 | | | | $4.36 | |
| | Hypothetical (h) | | | 0.86% | | | | $1,000.00 | | | | $1,020.87 | | | | $4.38 | |
| R1 | | Actual | | | 1.86% | | | | $1,000.00 | | | | $1,007.85 | | | | $9.41 | |
| | Hypothetical (h) | | | 1.86% | | | | $1,000.00 | | | | $1,015.83 | | | | $9.45 | |
| R2 | | Actual | | | 1.36% | | | | $1,000.00 | | | | $1,009.82 | | | | $6.89 | |
| | Hypothetical (h) | | | 1.36% | | | | $1,000.00 | | | | $1,018.35 | | | | $6.92 | |
| R3 | | Actual | | | 1.11% | | | | $1,000.00 | | | | $1,011.33 | | | | $5.63 | |
| | Hypothetical (h) | | | 1.11% | | | | $1,000.00 | | | | $1,019.61 | | | | $5.65 | |
| R4 | | Actual | | | 0.86% | | | | $1,000.00 | | | | $1,012.88 | | | | $4.36 | |
| | Hypothetical (h) | | | 0.86% | | | | $1,000.00 | | | | $1,020.87 | | | | $4.38 | |
| R5 | | Actual | | | 0.77% | | | | $1,000.00 | | | | $1,013.50 | | | | $3.91 | |
| | Hypothetical (h) | | | 0.77% | | | | $1,000.00 | | | | $1,021.32 | | | | $3.92 | |
| 529A | | Actual | | | 1.14% | | | | $1,000.00 | | | | $1,010.78 | | | | $5.78 | |
| | Hypothetical (h) | | | 1.14% | | | | $1,000.00 | | | | $1,019.46 | | | | $5.80 | |
| 529B | | Actual | | | 1.91% | | | | $1,000.00 | | | | $1,007.19 | | | | $9.66 | |
| | Hypothetical (h) | | | 1.91% | | | | $1,000.00 | | | | $1,015.58 | | | | $9.70 | |
| 529C | | Actual | | | 1.92% | | | | $1,000.00 | | | | $1,007.28 | | | | $9.71 | |
| | Hypothetical (h) | | | 1.92% | | | | $1,000.00 | | | | $1,015.53 | | | | $9.75 | |
| (h) | 5% class return per year before expenses. |
| (p) | “Expenses Paid During Period” are equal to each class’s annualized expense ratio, as shown above, multiplied by the average account value over the period, multiplied by 184/365 (to reflect the one-half year period). Expenses paid do not include any applicable sales charges (loads). If these transaction costs had been included, your costs would have been higher. |
Notes to Expense Table
Each class with a Rule 12b-1 service fee is subject to a rebate of a portion of such fee. Such rebates are included in the expense ratios above. For Class 529A shares, this rebate reduced the expense ratio above by 0.03%. See Note 3 in the Notes to Financial Statements for additional information.
10
Expense Table – continued
Changes to the fund’s fee arrangements occurred during the six month period. Had these fee changes been in effect throughout the entire six month period, the annualized expense ratios, the actual expenses paid during the period and the hypothetical expenses paid during the period would have been approximately 1.10%, $5.58 and $5.60 for Class A, 1.85%, $9.36 and $9.40 for Class B, 1.85%, $9.36 and $9.40 for Class C, 0.85%, $4.31 and $4.33 for Class I, 1.85%, $9.36 and $9.40 for Class R1, 1.35%, $6.84 and $6.87 for Class R2, 1.10%, $5.58 and $5.60 for Class R3, 0.85%, $4.31 and $4.33 for Class R4, 0.76%, $3.86 and $3.87 for Class R5, 1.13%, $5.73 and $5.75 for Class 529A, 1.90%, $9.61 and $9.65 for Class 529B, and 1.91%, $9.66 and $9.70 for Class 529C. For further information about the fund’s fee arrangements and changes to those fee arrangements, please see Note 3 in the Notes to Financial Statements.
11
PORTFOLIO OF INVESTMENTS
8/31/14
The Portfolio of Investments is a complete list of all securities owned by your fund. It is categorized by broad-based asset classes.
| | | | | | | | |
| Common Stocks - 98.1% | | | | | | | | |
| Issuer | | Shares/Par | | | Value ($) | |
| | | | | | | | |
| Alcoholic Beverages - 1.3% | | | | | | | | |
| Pernod Ricard S.A. | | | 813,474 | | | $ | 95,919,866 | |
| | |
| Apparel Manufacturers - 2.1% | | | | | | | | |
| Global Brands Group Holding Ltd. (a) | | | 87,978,000 | | | $ | 20,319,949 | |
| Li & Fung Ltd. | | | 42,182,000 | | | | 52,359,771 | |
| LVMH Moet Hennessy Louis Vuitton S.A. | | | 482,260 | | | | 83,675,529 | |
| | | | | | | | |
| | | | | | | $ | 156,355,249 | |
| Automotive - 4.7% | | | | | | | | |
| Autoliv, Inc. | | | 696,492 | | | $ | 72,219,255 | |
| DENSO Corp. | | | 2,563,200 | | | | 111,179,986 | |
| Honda Motor Co. Ltd. | | | 3,295,400 | | | | 111,266,665 | |
| Kia Motors Corp. | | | 918,014 | | | | 55,409,494 | |
| | | | | | | | |
| | | | | | | $ | 350,075,400 | |
| Broadcasting - 1.4% | | | | | | | | |
| Nippon Television Holdings, Inc. | | | 1,141,500 | | | $ | 17,542,972 | |
| ProSiebenSat.1 Media AG | | | 599,705 | | | | 24,045,281 | |
| WPP PLC | | | 3,065,259 | | | | 64,271,437 | |
| | | | | | | | |
| | | | | | | $ | 105,859,690 | |
| Brokerage & Asset Managers - 0.4% | | | | | | | | |
| Computershare Ltd. | | | 2,702,448 | | | $ | 31,095,084 | |
| | |
| Business Services - 3.2% | | | | | | | | |
| Cognizant Technology Solutions Corp., “A” (a) | | | 1,296,943 | | | $ | 59,309,203 | |
| Compass Group PLC | | | 3,085,673 | | | | 50,176,668 | |
| Experian Group Ltd. | | | 2,851,194 | | | | 49,606,151 | |
| Mitsubishi Corp. | | | 2,075,600 | | | | 42,920,404 | |
| Nomura Research, Inc. | | | 1,098,100 | | | | 34,670,176 | |
| | | | | | | | |
| | | | | | | $ | 236,682,602 | |
| Computer Software - 0.7% | | | | | | | | |
| Dassault Systems S.A. | | | 754,479 | | | $ | 49,963,921 | |
| | |
| Conglomerates - 0.9% | | | | | | | | |
| Hutchison Whampoa Ltd. | | | 5,008,000 | | | $ | 65,135,889 | |
12
Portfolio of Investments – continued
| | | | | | | | |
| Issuer | | Shares/Par | | | Value ($) | |
| | | | | | | | |
| Common Stocks - continued | | | | | | | | |
| Consumer Products - 1.8% | | | | | | | | |
| L’Oreal S.A. | | | 345,462 | | | $ | 57,193,892 | |
| Reckitt Benckiser Group PLC | | | 880,067 | | | | 76,704,796 | |
| | | | | | | | |
| | | | | | | $ | 133,898,688 | |
| Electrical Equipment - 3.7% | | | | | | | | |
| Legrand S.A. | | | 425,897 | | | $ | 23,542,681 | |
| Schneider Electric S.A. | | | 1,534,101 | | | | 129,651,877 | |
| Siemens AG | | | 984,718 | | | | 123,357,581 | |
| | | | | | | | |
| | | | | | | $ | 276,552,139 | |
| Electronics - 2.5% | | | | | | | | |
| Infineon Technologies AG | | | 3,412,274 | | | $ | 39,657,064 | |
| MediaTek, Inc. | | | 5,154,000 | | | | 86,128,469 | |
| Taiwan Semiconductor Manufacturing Co. Ltd. | | | 14,114,326 | | | | 58,552,932 | |
| | | | | | | | |
| | | | | | | $ | 184,338,465 | |
| Energy - Independent - 1.8% | | | | | | | | |
| Cairn Energy PLC (a) | | | 3,388,834 | | | $ | 10,104,251 | |
| Cenovus Energy, Inc. | | | 799,128 | | | | 25,488,604 | |
| Galp Energia SGPS S.A., “B” | | | 1,123,991 | | | | 19,937,717 | |
| INPEX Corp. | | | 2,612,500 | | | | 37,412,898 | |
| Oil Search Ltd. | | | 2,523,822 | | | | 22,840,530 | |
| Reliance Industries Ltd. | | | 1,215,700 | | | | 20,106,085 | |
| | | | | | | | |
| | | | | | | $ | 135,890,085 | |
| Energy - Integrated - 4.5% | | | | | | | | |
| BG Group PLC | | | 3,773,797 | | | $ | 75,274,831 | |
| Royal Dutch Shell PLC, “A” | | | 6,354,449 | | | | 257,192,962 | |
| | | | | | | | |
| | | | | | | $ | 332,467,793 | |
| Engineering - Construction - 0.8% | | | | | | | | |
| JGC Corp. | | | 1,978,000 | | | $ | 57,242,136 | |
| | |
| Food & Beverages - 4.7% | | | | | | | | |
| Groupe Danone | | | 1,661,470 | | | $ | 116,009,318 | |
| M. Dias Branco S.A. Industria e Comercio de Alimentos | | | 884,877 | | | | 39,925,208 | |
| Nestle S.A. | | | 2,483,417 | | | | 192,738,371 | |
| | | | | | | | |
| | | | | | | $ | 348,672,897 | |
| Food & Drug Stores - 0.5% | | | | | | | | |
| Sundrug Co. Ltd. | | | 869,600 | | | $ | 38,613,600 | |
| | |
| Gaming & Lodging - 0.5% | | | | | | | | |
| Sands China Ltd. | | | 5,862,400 | | | $ | 38,199,908 | |
13
Portfolio of Investments – continued
| | | | | | | | |
| Issuer | | Shares/Par | | | Value ($) | |
| | | | | | | | |
| Common Stocks - continued | | | | | | | | |
| General Merchandise - 0.1% | | | | | | | | |
| Dollarama, Inc. | | | 57,066 | | | $ | 4,858,456 | |
| | |
| Health Maintenance Organizations - 0.2% | | | | | | | | |
| OdontoPrev S.A. | | | 4,271,836 | | | $ | 18,625,472 | |
| | |
| Insurance - 6.0% | | | | | | | | |
| AIA Group Ltd. | | | 20,995,800 | | | $ | 114,595,692 | |
| Hiscox Ltd. | | | 2,805,980 | | | | 30,232,687 | |
| ING Groep N.V. (a) | | | 7,725,113 | | | | 106,224,059 | |
| Prudential PLC | | | 2,676,357 | | | | 64,425,756 | |
| Sony Financial Holdings, Inc. | | | 1,601,300 | | | | 25,640,500 | |
| Zurich Insurance Group AG | | | 334,930 | | | | 101,057,252 | |
| | | | | | | | |
| | | | | | | $ | 442,175,946 | |
| Machinery & Tools - 3.4% | | | | | | | | |
| Atlas Copco AB, “A” | | | 3,932,655 | | | $ | 114,503,744 | |
| Joy Global, Inc. | | | 977,684 | | | | 61,740,745 | |
| Schindler Holding AG | | | 525,045 | | | | 75,892,894 | |
| | | | | | | | |
| | | | | | | $ | 252,137,383 | |
| Major Banks - 10.0% | | | | | | | | |
| BNP Paribas | | | 1,422,198 | | | $ | 96,013,651 | |
| HSBC Holdings PLC | | | 16,344,770 | | | | 176,918,761 | |
| Mitsubishi UFJ Financial Group, Inc. | | | 12,886,800 | | | | 74,091,823 | |
| Royal Bank of Scotland Group PLC (a) | | | 13,605,922 | | | | 81,948,826 | |
| Standard Chartered PLC | | | 3,228,454 | | | | 65,013,401 | |
| Sumitomo Mitsui Financial Group, Inc. | | | 2,437,500 | | | | 98,406,639 | |
| Westpac Banking Corp. | | | 4,462,772 | | | | 146,046,945 | |
| | | | | | | | |
| | | | | | | $ | 738,440,046 | |
| Medical Equipment - 1.1% | | | | | | | | |
| Sonova Holding AG | | | 245,121 | | | $ | 39,195,864 | |
| Terumo Corp. | | | 1,689,300 | | | | 42,506,487 | |
| | | | | | | | |
| | | | | | | $ | 81,702,351 | |
| Metals & Mining - 3.2% | | | | | | | | |
| Gerdau S.A., ADR | | | 4,680,100 | | | $ | 27,097,779 | |
| Iluka Resources Ltd. | | | 6,450,862 | | | | 53,620,571 | |
| Rio Tinto Ltd. | | | 2,942,259 | | | | 156,966,395 | |
| | | | | | | | |
| | | | | | | $ | 237,684,745 | |
| Natural Gas - Distribution - 2.7% | | | | | | | | |
| Centrica PLC | | | 8,130,610 | | | $ | 43,112,730 | |
| China Resources Gas Group Ltd. | | | 10,336,000 | | | | 30,074,232 | |
14
Portfolio of Investments – continued
| | | | | | | | |
| Issuer | | Shares/Par | | | Value ($) | |
| | | | | | | | |
| Common Stocks - continued | | | | | | | | |
| Natural Gas - Distribution - continued | | | | | | | | |
| GDF SUEZ | | | 2,747,837 | | | $ | 67,679,203 | |
| Tokyo Gas Co. Ltd. | | | 10,152,000 | | | | 57,655,983 | |
| | | | | | | | |
| | | | | | | $ | 198,522,148 | |
| Natural Gas - Pipeline - 0.4% | | | | | | | | |
| APA Group | | | 4,489,152 | | | $ | 32,492,991 | |
| | |
| Network & Telecom - 1.0% | | | | | | | | |
| Ericsson, Inc., “B” | | | 5,917,989 | | | $ | 73,792,287 | |
| | |
| Oil Services - 0.5% | | | | | | | | |
| Technip | | | 375,831 | | | $ | 34,814,530 | |
| | |
| Other Banks & Diversified Financials - 7.2% | | | | | | | | |
| Aeon Credit Service Co. Ltd. | | | 1,450,100 | | | $ | 33,644,494 | |
| DBS Group Holdings Ltd. | | | 4,964,000 | | | | 71,218,030 | |
| Erste Group Bank AG | | | 1,641,162 | | | | 42,114,584 | |
| HDFC Bank Ltd., ADR | | | 601,689 | | | | 29,897,926 | |
| Julius Baer Group Ltd. | | | 1,210,027 | | | | 55,001,826 | |
| Kasikornbank PLC, NVDR | | | 4,283,600 | | | | 30,175,642 | |
| KBC Group N.V. (a) | | | 1,480,265 | | | | 84,364,120 | |
| Sberbank of Russia, ADR | | | 2,802,929 | | | | 22,843,871 | |
| UBS AG | | | 6,884,789 | | | | 123,439,493 | |
| UniCredit S.p.A. | | | 5,590,775 | | | | 43,267,931 | |
| | | | | | | | |
| | | | | | | $ | 535,967,917 | |
| Pharmaceuticals - 9.3% | | | | | | | | |
| Bayer AG | | | 995,100 | | | $ | 133,431,558 | |
| GlaxoSmithKline PLC | | | 5,293,001 | | | | 129,566,949 | |
| Novartis AG | | | 2,804,585 | | | | 251,574,070 | |
| Roche Holding AG | | | 231,497 | | | | 67,503,673 | |
| Santen Pharmaceutical Co. Ltd. | | | 1,869,500 | | | | 107,809,121 | |
| | | | | | | | |
| | | | | | | $ | 689,885,371 | |
| Printing & Publishing - 0.7% | | | | | | | | |
| Reed Elsevier N.V. | | | 2,463,138 | | | $ | 56,152,235 | |
| | |
| Real Estate - 1.6% | | | | | | | | |
| Deutsche Wohnen AG | | | 1,395,772 | | | $ | 31,489,343 | |
| Intu Properties PLC, REIT | | | 5,739,884 | | | | 32,589,425 | |
| Mitsui Fudosan Co. Ltd. | | | 1,699,000 | | | | 54,132,202 | |
| | | | | | | | |
| | | | | | | $ | 118,210,970 | |
15
Portfolio of Investments – continued
| | | | | | | | |
| Issuer | | Shares/Par | | | Value ($) | |
| | | | | | | | |
| Common Stocks - continued | | | | | | | | |
| Restaurants - 1.7% | | | | | | | | |
| Whitbread PLC | | | 1,206,931 | | | $ | 87,941,831 | |
| YUM! Brands, Inc. | | | 515,488 | | | | 37,336,796 | |
| | | | | | | | |
| | | | | | | $ | 125,278,627 | |
| Specialty Chemicals - 4.5% | | | | | | | | |
| Akzo Nobel N.V. | | | 1,534,744 | | | $ | 108,471,666 | |
| JSR Corp. | | | 3,860,200 | | | | 67,079,068 | |
| Linde AG | | | 587,743 | | | | 116,341,704 | |
| Symrise AG | | | 721,926 | | | | 38,569,044 | |
| | | | | | | | |
| | | | | | | $ | 330,461,482 | |
| Specialty Stores - 0.9% | | | | | | | | |
| Esprit Holdings Ltd. | | | 12,164,300 | | | $ | 19,745,278 | |
| Inditex | | | 1,127,533 | | | | 32,667,558 | |
| Ryohin Keikaku Co. Ltd. | | | 115,500 | | | | 12,965,928 | |
| | | | | | | | |
| | | | | | | $ | 65,378,764 | |
| Telecommunications - Wireless - 3.4% | | | | | | | | |
| KDDI Corp. | | | 2,304,900 | | | $ | 132,895,335 | |
| Mobile TeleSystems OJSC (a) | | | 2,922,077 | | | | 22,254,834 | |
| Philippine Long Distance Telephone Co. | | | 265,730 | | | | 21,026,800 | |
| Vodafone Group PLC | | | 21,557,082 | | | | 73,991,694 | |
| | | | | | | | |
| | | | | | | $ | 250,168,663 | |
| Telephone Services - 1.6% | | | | | | | | |
| BT Group PLC | | | 5,067,210 | | | $ | 32,555,723 | |
| Hellenic Telecommunications Organization S.A. (a) | | | 785,706 | | | | 11,232,279 | |
| Royal KPN N.V. (a) | | | 9,390,437 | | | | 31,154,875 | |
| Telecom Italia S.p.A. - Savings Shares | | | 30,266,478 | | | | 27,838,046 | |
| Telefonica Brasil S.A., ADR | | | 813,771 | | | | 17,414,699 | |
| | | | | | | | |
| | | | | | | $ | 120,195,622 | |
| Tobacco - 1.2% | | | | | | | | |
| Japan Tobacco, Inc. | | | 2,548,000 | | | $ | 87,280,235 | |
| | |
| Trucking - 1.2% | | | | | | | | |
| Yamato Holdings Co. Ltd. | | | 4,270,800 | | | $ | 88,231,867 | |
| | |
| Utilities - Electric Power - 0.7% | | | | | | | | |
| Canadian Utilities Ltd. | | | 1,027,776 | | | $ | 36,997,289 | |
| Energias do Brasil S.A. | | | 2,828,596 | | | | 14,278,818 | |
| | | | | | | | |
| | | | | | | $ | 51,276,107 | |
| Total Common Stocks (Identified Cost, $6,382,111,935) | | | $ | 7,270,697,627 | |
16
Portfolio of Investments – continued
| | | | | | | | |
| Money Market Funds - 1.4% | | | | | | | | |
| Issuer | | Shares/Par | | | Value ($) | |
| | | | | | | | |
MFS Institutional Money Market Portfolio, 0.09%,
at Cost and Net Asset Value (v) | | | 102,287,398 | | | $ | 102,287,398 | |
| Total Investments (Identified Cost, $6,484,399,333) | | | | | | $ | 7,372,985,025 | |
| | |
| Other Assets, Less Liabilities - 0.5% | | | | | | | 35,860,622 | |
| Net Assets - 100.0% | | | | | | $ | 7,408,845,647 | |
| (a) | Non-income producing security. |
| (v) | Underlying affiliated fund that is available only to investment companies managed by MFS. The rate quoted for the MFS Institutional Money Market Portfolio is the annualized seven-day yield of the fund at period end. |
The following abbreviations are used in this report and are defined:
| ADR | | American Depositary Receipt |
| NVDR | | Non-Voting Depositary Receipt |
| PLC | | Public Limited Company |
| REIT | | Real Estate Investment Trust |
See Notes to Financial Statements
17
Financial Statements
STATEMENT OF ASSETS AND LIABILITIES
At 8/31/14
This statement represents your fund’s balance sheet, which details the assets and liabilities comprising the total value of the fund.
| | | | |
| Assets | | | | |
Investments- | | | | |
Non-affiliated issuers, at value (identified cost, $6,382,111,935) | | | $7,270,697,627 | |
Underlying affiliated funds, at cost and value | | | 102,287,398 | |
Total investments, at value (identified cost, $6,484,399,333) | | | $7,372,985,025 | |
Foreign currency, at value (identified cost, $2,135,581) | | | 2,126,750 | |
Receivables for | | | | |
Investments sold | | | 58,592,291 | |
Fund shares sold | | | 6,066,583 | |
Interest and dividends | | | 25,324,041 | |
Other assets | | | 9,016 | |
Total assets | | | $7,465,103,706 | |
| Liabilities | | | | |
Payables for | | | | |
Investments purchased | | | $44,639,374 | |
Fund shares reacquired | | | 6,228,355 | |
Payable to affiliates | | | | |
Investment adviser | | | 551,357 | |
Shareholder servicing costs | | | 3,753,185 | |
Distribution and service fees | | | 60,482 | |
Program manager fees | | | 21 | |
Payable for independent Trustees’ compensation | | | 1,162 | |
Deferred country tax expense payable | | | 523,775 | |
Accrued expenses and other liabilities | | | 500,348 | |
Total liabilities | | | $56,258,059 | |
Net assets | | | $7,408,845,647 | |
| Net assets consist of | | | | |
Paid-in capital | | | $6,831,292,096 | |
Unrealized appreciation (depreciation) on investments and translation of assets and liabilities in foreign currencies (net of $441,648 deferred country tax) | | | 887,951,987 | |
Accumulated net realized gain (loss) on investments and foreign currency | | | (482,259,896 | ) |
Undistributed net investment income | | | 171,861,460 | |
Net assets | | | $7,408,845,647 | |
Shares of beneficial interest outstanding | | | 407,546,607 | |
18
Statement of Assets and Liabilities – continued
| | | | | | | | | | | | |
| | | Net assets | | | Shares
outstanding | | | Net asset value
per share (a) | |
Class A | | | $1,184,926,974 | | | | 65,617,011 | | | | $18.06 | |
Class B | | | 16,932,440 | | | | 981,164 | | | | 17.26 | |
Class C | | | 91,487,367 | | | | 5,404,798 | | | | 16.93 | |
Class I | | | 2,194,431,968 | | | | 117,586,096 | | | | 18.66 | |
Class R1 | | | 4,242,652 | | | | 254,226 | | | | 16.69 | |
Class R2 | | | 182,465,581 | | | | 10,438,075 | | | | 17.48 | |
Class R3 | | | 229,232,197 | | | | 12,833,185 | | | | 17.86 | |
Class R4 | | | 546,069,497 | | | | 30,189,088 | | | | 18.09 | |
Class R5 | | | 2,955,339,436 | | | | 164,029,163 | | | | 18.02 | |
Class 529A | | | 2,427,678 | | | | 136,278 | | | | 17.81 | |
Class 529B | | | 192,076 | | | | 11,433 | | | | 16.80 | |
Class 529C | | | 1,097,781 | | | | 66,090 | | | | 16.61 | |
| (a) | Maximum offering price per share was equal to the net asset value per share for all share classes, except for Classes A and 529A, for which the maximum offering prices per share were $19.16 [100 / 94.25 x $18.06] and $18.90 [100 / 94.25 x $17.81], respectively. On sales of $50,000 or more, the maximum offering prices of Class A and Class 529A shares are reduced. A contingent deferred sales charge may be imposed on redemptions of Class A, Class B, Class C, Class 529B, and Class 529C shares. Redemption price per share was equal to the net asset value per share for Classes I, R1, R2, R3, R4, R5, and 529A. |
See Notes to Financial Statements
19
Financial Statements
STATEMENT OF OPERATIONS
Year ended 8/31/14
This statement describes how much your fund earned in investment income and accrued in expenses. It also describes any gains and/or losses generated by fund operations.
| | | | |
| Net investment income | | | | |
Income | | | | |
Dividends | | | $254,297,091 | |
Interest | | | 1,918,871 | |
Dividends from underlying affiliated funds | | | 67,962 | |
Foreign taxes withheld | | | (16,045,736 | ) |
Total investment income | | | $240,238,188 | |
Expenses | | | | |
Management fee | | | $52,777,080 | |
Distribution and service fees | | | 5,586,672 | |
Program manager fees | | | 3,637 | |
Shareholder servicing costs | | | 4,525,568 | |
Administrative services fee | | | 485,257 | |
Independent Trustees’ compensation | | | 100,261 | |
Custodian fee | | | 1,443,468 | |
Shareholder communications | | | 305,694 | |
Audit and tax fees | | | 71,705 | |
Legal fees | | | 68,978 | |
Miscellaneous | | | 428,311 | |
Total expenses | | | $65,796,631 | |
Fees paid indirectly | | | (492 | ) |
Reduction of expenses by investment adviser and distributor | | | (1,418,041 | ) |
Net expenses | | | $64,378,098 | |
Net investment income | | | $175,860,090 | |
| Realized and unrealized gain (loss) on investments and foreign currency | |
Realized gain (loss) (identified cost basis) | | | | |
Investments (net of $82,127 country tax) | | | $258,736,070 | |
Foreign currency | | | (168,283 | ) |
Net realized gain (loss) on investments and foreign currency | | | $258,567,787 | |
Change in unrealized appreciation (depreciation) | | | | |
Investments (net of $441,648 increase in deferred country tax) | | | $373,354,874 | |
Translation of assets and liabilities in foreign currencies | | | 167,369 | |
Net unrealized gain (loss) on investments and foreign currency translation | | | $373,522,243 | |
Net realized and unrealized gain (loss) on investments and foreign currency | | | $632,090,030 | |
Change in net assets from operations | | | $807,950,120 | |
See Notes to Financial Statements
20
Financial Statements
STATEMENTS OF CHANGES IN NET ASSETS
These statements describe the increases and/or decreases in net assets resulting from operations, any distributions, and any shareholder transactions.
| | | | | | | | |
| | | Years ended 8/31 | |
| | | 2014 | | | 2013 | |
| Change in net assets | | | | | | |
| From operations | | | | | | | | |
Net investment income | | | $175,860,090 | | | | $101,775,627 | |
Net realized gain (loss) on investments and foreign currency | | | 258,567,787 | | | | 294,914,718 | |
Net unrealized gain (loss) on investments and foreign currency translation | | | 373,522,243 | | | | 380,101,957 | |
Change in net assets from operations | | | $807,950,120 | | | | $776,792,302 | |
| Distributions declared to shareholders | | | | | | | | |
From net investment income | | | $(103,250,534 | ) | | | $(97,500,392 | ) |
Change in net assets from fund share transactions | | | $512,989,442 | | | | $746,775,414 | |
Total change in net assets | | | $1,217,689,028 | | | | $1,426,067,324 | |
| Net assets | | | | | | | | |
At beginning of period | | | 6,191,156,619 | | | | 4,765,089,295 | |
At end of period (including undistributed net investment income of $171,861,460 and $102,701,310, respectively) | | | $7,408,845,647 | | | | $6,191,156,619 | |
See Notes to Financial Statements
21
Financial Statements
FINANCIAL HIGHLIGHTS
The financial highlights table is intended to help you understand the fund’s financial performance for the past 5 years. Certain information reflects financial results for a single fund share. The total returns in the table represent the rate by which an investor would have earned (or lost) on an investment in the fund share class (assuming reinvestment of all distributions) held for the entire period.
| | | | | | | | | | | | | | | | | | | | |
| Class A | | Years ended 8/31 | |
| | | 2014 | | | 2013 | | | 2012 | | | 2011 | | | 2010 | |
Net asset value, beginning of period | | | $16.25 | | | | $14.25 | | | | $14.66 | | | | $12.93 | | | | $13.03 | |
| Income (loss) from investment operations | | | | | | | | | | | | | |
Net investment income (d) | | | $0.40 | | | | $0.26 | | | | $0.28 | | | | $0.26 | | | | $0.21 | |
Net realized and unrealized gain (loss)
on investments and foreign currency | | | 1.64 | | | | 2.01 | | | | (0.45 | ) | | | 1.67 | | | | (0.11 | ) |
Total from investment operations | | | $2.04 | | | | $2.27 | | | | $(0.17 | ) | | | $1.93 | | | | $0.10 | |
| Less distributions declared to shareholders | | | | | | | | | | | | | |
From net investment income | | | $(0.23 | ) | | | $(0.27 | ) | | | $(0.24 | ) | | | $(0.20 | ) | | | $(0.20 | ) |
Net asset value, end of period (x) | | | $18.06 | | | | $16.25 | | | | $14.25 | | | | $14.66 | | | | $12.93 | |
Total return (%) (r)(s)(t)(x) | | | 12.60 | | | | 16.08 | | | | (1.03 | ) | | | 14.89 | | | | 0.65 | |
Ratios (%) (to average net assets)
and Supplemental data: | | | | | | | | | | | | | |
Expenses before expense reductions (f) | | | 1.13 | | | | 1.18 | | | | 1.21 | | | | 1.19 | | | | 1.25 | |
Expenses after expense reductions (f) | | | 1.11 | | | | 1.18 | | | | 1.21 | | | | 1.19 | | | | 1.25 | |
Net investment income | | | 2.24 | | | | 1.65 | | | | 2.02 | | | | 1.67 | | | | 1.59 | |
Portfolio turnover | | | 27 | | | | 32 | | | | 37 | | | | 43 | | | | 56 | |
Net assets at end of period (000 omitted) | | | $1,184,927 | | | | $1,108,795 | | | | $970,501 | | | | $1,008,654 | | | | $1,466,337 | |
See Notes to Financial Statements
22
Financial Highlights – continued
| | | | | | | | | | | | | | | | | | | | |
| Class B | | Years ended 8/31 | |
| | | 2014 | | | 2013 | | | 2012 | | | 2011 | | | 2010 | |
Net asset value, beginning of period | | | $15.52 | | | | $13.59 | | | | $13.96 | | | | $12.30 | | | | $12.39 | |
| Income (loss) from investment operations | | | | | | | | | | | | | |
Net investment income (d) | | | $0.25 | | | | $0.12 | | | | $0.16 | | | | $0.11 | | | | $0.09 | |
Net realized and unrealized gain (loss)
on investments and foreign currency | | | 1.57 | | | | 1.94 | | | | (0.42 | ) | | | 1.62 | | | | (0.09 | ) |
Total from investment operations | | | $1.82 | | | | $2.06 | | | | $(0.26 | ) | | | $1.73 | | | | $— | |
| Less distributions declared to shareholders | | | | | | | | | | | | | |
From net investment income | | | $(0.08 | ) | | | $(0.13 | ) | | | $(0.11 | ) | | | $(0.07 | ) | | | $(0.09 | ) |
Net asset value, end of period (x) | | | $17.26 | | | | $15.52 | | | | $13.59 | | | | $13.96 | | | | $12.30 | |
Total return (%) (r)(s)(t)(x) | | | 11.77 | | | | 15.27 | | | | (1.82 | ) | | | 14.02 | | | | (0.09 | ) |
Ratios (%) (to average net assets)
and Supplemental data: | | | | | | | | | | | | | |
Expenses before expense reductions (f) | | | 1.88 | | | | 1.93 | | | | 1.96 | | | | 1.95 | | | | 1.99 | |
Expenses after expense reductions (f) | | | 1.86 | | | | 1.93 | | | | 1.96 | | | | 1.94 | | | | 1.99 | |
Net investment income | | | 1.46 | | | | 0.83 | | | | 1.19 | | | | 0.76 | | | | 0.71 | |
Portfolio turnover | | | 27 | | | | 32 | | | | 37 | | | | 43 | | | | 56 | |
Net assets at end of period (000 omitted) | | | $16,932 | | | | $19,751 | | | | $23,369 | | | | $33,059 | | | | $40,476 | |
| |
| Class C | | Years ended 8/31 | |
| | | 2014 | | | 2013 | | | 2012 | | | 2011 | | | 2010 | |
Net asset value, beginning of period | | | $15.26 | | | | $13.39 | | | | $13.78 | | | | $12.16 | | | | $12.27 | |
| Income (loss) from investment operations | | | | | | | | | | | | | |
Net investment income (d) | | | $0.25 | | | | $0.13 | | | | $0.16 | | | | $0.12 | | | | $0.10 | |
Net realized and unrealized gain (loss)
on investments and foreign currency | | | 1.54 | | | | 1.90 | | | | (0.42 | ) | | | 1.59 | | | | (0.10 | ) |
Total from investment operations | | | $1.79 | | | | $2.03 | | | | $(0.26 | ) | | | $1.71 | | | | $— | |
| Less distributions declared to shareholders | | | | | | | | | | | | | |
From net investment income | | | $(0.12 | ) | | | $(0.16 | ) | | | $(0.13 | ) | | | $(0.09 | ) | | | $(0.11 | ) |
Net asset value, end of period (x) | | | $16.93 | | | | $15.26 | | | | $13.39 | | | | $13.78 | | | | $12.16 | |
Total return (%) (r)(s)(t)(x) | | | 11.74 | | | | 15.22 | | | | (1.80 | ) | | | 14.05 | | | | (0.03 | ) |
Ratios (%) (to average net assets)
and Supplemental data: | | | | | | | | | | | | | |
Expenses before expense reductions (f) | | | 1.88 | | | | 1.93 | | | | 1.96 | | | | 1.95 | | | | 2.00 | |
Expenses after expense reductions (f) | | | 1.86 | | | | 1.93 | | | | 1.96 | | | | 1.95 | | | | 2.00 | |
Net investment income | | | 1.50 | | | | 0.87 | | | | 1.23 | | | | 0.80 | | | | 0.78 | |
Portfolio turnover | | | 27 | | | | 32 | | | | 37 | | | | 43 | | | | 56 | |
Net assets at end of period (000 omitted) | | | $91,487 | | | | $86,793 | | | | $84,133 | | | | $99,830 | | | | $101,267 | |
See Notes to Financial Statements
23
Financial Highlights – continued
| | | | | | | | | | | | | | | | | | | | |
| Class I | | Years ended 8/31 | |
| | | 2014 | | | 2013 | | | 2012 | | | 2011 | | | 2010 | |
Net asset value, beginning of period | | | $16.78 | | | | $14.71 | | | | $15.15 | | | | $13.35 | | | | $13.44 | |
| Income (loss) from investment operations | | | | | | | | | | | | | |
Net investment income (d) | | | $0.46 | | | | $0.31 | | | | $0.35 | | | | $0.29 | | | | $0.26 | |
Net realized and unrealized gain (loss)
on investments and foreign currency | | | 1.69 | | | | 2.06 | | | | (0.49 | ) | | | 1.74 | | | | (0.12 | ) |
Total from investment operations | | | $2.15 | | | | $2.37 | | | | $(0.14 | ) | | | $2.03 | | | | $0.14 | |
| Less distributions declared to shareholders | | | | | | | | | | | | | |
From net investment income | | | $(0.27 | ) | | | $(0.30 | ) | | | $(0.30 | ) | | | $(0.23 | ) | | | $(0.23 | ) |
Net asset value, end of period (x) | | | $18.66 | | | | $16.78 | | | | $14.71 | | | | $15.15 | | | | $13.35 | |
Total return (%) (r)(s)(x) | | | 12.89 | | | | 16.32 | | | | (0.82 | ) | | | 15.19 | | | | 0.92 | |
Ratios (%) (to average net assets)
and Supplemental data: | | | | | | | | | | | | | |
Expenses before expense reductions (f) | | | 0.88 | | | | 0.93 | | | | 0.96 | | | | 0.95 | | | | 1.00 | |
Expenses after expense reductions (f) | | | 0.86 | | | | 0.93 | | | | 0.96 | | | | 0.95 | | | | 1.00 | |
Net investment income | | | 2.51 | | | | 1.89 | | | | 2.45 | | | | 1.86 | | | | 1.90 | |
Portfolio turnover | | | 27 | | | | 32 | | | | 37 | | | | 43 | | | | 56 | |
Net assets at end of period (000 omitted) | | | $2,194,432 | | | | $1,834,498 | | | | $1,143,621 | | | | $2,484,795 | | | | $1,926,221 | |
| |
| Class R1 | | Years ended 8/31 | |
| | | 2014 | | | 2013 | | | 2012 | | | 2011 | | | 2010 | |
Net asset value, beginning of period | | | $15.02 | | | | $13.17 | | | | $13.57 | | | | $11.98 | | | | $12.10 | |
| Income (loss) from investment operations | | | | | | | | | | | | | |
Net investment income (d) | | | $0.24 | | | | $0.12 | | | | $0.15 | | | | $0.12 | | | | $0.10 | |
Net realized and unrealized gain (loss)
on investments and foreign currency | | | 1.52 | | | | 1.87 | | | | (0.40 | ) | | | 1.57 | | | | (0.10 | ) |
Total from investment operations | | | $1.76 | | | | $1.99 | | | | $(0.25 | ) | | | $1.69 | | | | $— | |
| Less distributions declared to shareholders | | | | | | | | | | | | | |
From net investment income | | | $(0.09 | ) | | | $(0.14 | ) | | | $(0.15 | ) | | | $(0.10 | ) | | | $(0.12 | ) |
Net asset value, end of period (x) | | | $16.69 | | | | $15.02 | | | | $13.17 | | | | $13.57 | | | | $11.98 | |
Total return (%) (r)(s)(x) | | | 11.73 | | | | 15.24 | | | | (1.80 | ) | | | 14.09 | | | | (0.09 | ) |
Ratios (%) (to average net assets)
and Supplemental data: | | | | | | | | | | | | | |
Expenses before expense reductions (f) | | | 1.88 | | | | 1.93 | | | | 1.96 | | | | 1.95 | | | | 2.00 | |
Expenses after expense reductions (f) | | | 1.86 | | | | 1.93 | | | | 1.96 | | | | 1.95 | | | | 2.00 | |
Net investment income | | | 1.47 | | | | 0.85 | | | | 1.18 | | | | 0.84 | | | | 0.77 | |
Portfolio turnover | | | 27 | | | | 32 | | | | 37 | | | | 43 | | | | 56 | |
Net assets at end of period (000 omitted) | | | $4,243 | | | | $4,034 | | | | $4,914 | | | | $6,288 | | | | $5,868 | |
See Notes to Financial Statements
24
Financial Highlights – continued
| | | | | | | | | | | | | | | | | | | | |
| Class R2 | | Years ended 8/31 | |
| | | 2014 | | | 2013 | | | 2012 | | | 2011 | | | 2010 | |
Net asset value, beginning of period | | | $15.75 | | | | $13.83 | | | | $14.26 | | | | $12.59 | | | | $12.70 | |
| Income (loss) from investment operations | | | | | | | | | | | | | |
Net investment income (d) | | | $0.36 | | | | $0.21 | | | | $0.24 | | | | $0.20 | | | | $0.18 | |
Net realized and unrealized gain (loss)
on investments and foreign currency | | | 1.57 | | | | 1.95 | | | | (0.44 | ) | | | 1.64 | | | | (0.11 | ) |
Total from investment operations | | | $1.93 | | | | $2.16 | | | | $(0.20 | ) | | | $1.84 | | | | $0.07 | |
| Less distributions declared to shareholders | | | | | | | | | | | | | |
From net investment income | | | $(0.20 | ) | | | $(0.24 | ) | | | $(0.23 | ) | | | $(0.17 | ) | | | $(0.18 | ) |
Net asset value, end of period (x) | | | $17.48 | | | | $15.75 | | | | $13.83 | | | | $14.26 | | | | $12.59 | |
Total return (%) (r)(s)(x) | | | 12.32 | | | | 15.79 | | | | (1.32 | ) | | | 14.61 | | | | 0.45 | |
Ratios (%) (to average net assets)
and Supplemental data: | | | | | | | | | | | | | |
Expenses before expense reductions (f) | | | 1.38 | | | | 1.43 | | | | 1.46 | | | | 1.45 | | | | 1.50 | |
Expenses after expense reductions (f) | | | 1.36 | | | | 1.43 | | | | 1.46 | | | | 1.45 | | | | 1.50 | |
Net investment income | | | 2.06 | | | | 1.41 | | | | 1.78 | | | | 1.37 | | | | 1.34 | |
Portfolio turnover | | | 27 | | | | 32 | | | | 37 | | | | 43 | | | | 56 | |
Net assets at end of period (000 omitted) | | | $182,466 | | | | $136,444 | | | | $107,567 | | | | $91,693 | | | | $72,425 | |
| |
| Class R3 | | Years ended 8/31 | |
| | | 2014 | | | 2013 | | | 2012 | | | 2011 | | | 2010 | |
Net asset value, beginning of period | | | $16.08 | | | | $14.10 | | | | $14.53 | | | | $12.82 | | | | $12.92 | |
| Income (loss) from investment operations | | | | | | | | | | | | | |
Net investment income (d) | | | $0.40 | | | | $0.25 | | | | $0.28 | | | | $0.23 | | | | $0.21 | |
Net realized and unrealized gain (loss)
on investments and foreign currency | | | 1.61 | | | | 2.00 | | | | (0.45 | ) | | | 1.68 | | | | (0.10 | ) |
Total from investment operations | | | $2.01 | | | | $2.25 | | | | $(0.17 | ) | | | $1.91 | | | | $0.11 | |
| Less distributions declared to shareholders | | | | | | | | | | | | | |
From net investment income | | | $(0.23 | ) | | | $(0.27 | ) | | | $(0.26 | ) | | | $(0.20 | ) | | | $(0.21 | ) |
Net asset value, end of period (x) | | | $17.86 | | | | $16.08 | | | | $14.10 | | | | $14.53 | | | | $12.82 | |
Total return (%) (r)(s)(x) | | | 12.56 | | | | 16.13 | | | | (1.06 | ) | | | 14.88 | | | | 0.72 | |
Ratios (%) (to average net assets)
and Supplemental data: | | | | | | | | | | | | | |
Expenses before expense reductions (f) | | | 1.13 | | | | 1.18 | | | | 1.21 | | | | 1.20 | | | | 1.25 | |
Expenses after expense reductions (f) | | | 1.11 | | | | 1.18 | | | | 1.21 | | | | 1.20 | | | | 1.25 | |
Net investment income | | | 2.28 | | | | 1.63 | | | | 2.05 | | | | 1.54 | | | | 1.55 | |
Portfolio turnover | | | 27 | | | | 32 | | | | 37 | | | | 43 | | | | 56 | |
Net assets at end of period (000 omitted) | | | $229,232 | | | | $195,358 | | | | $168,989 | | | | $154,869 | | | | $151,073 | |
See Notes to Financial Statements
25
Financial Highlights – continued
| | | | | | | | | | | | | | | | | | | | |
| Class R4 | | Years ended 8/31 | |
| | | 2014 | | | 2013 | | | 2012 | | | 2011 | | | 2010 | |
Net asset value, beginning of period | | | $16.27 | | | | $14.26 | | | | $14.70 | | | | $12.96 | | | | $13.05 | |
| Income (loss) from investment operations | | | | | | | | | | | | | |
Net investment income (d) | | | $0.45 | | | | $0.25 | | | | $0.32 | | | | $0.28 | | | | $0.24 | |
Net realized and unrealized gain (loss)
on investments and foreign currency | | | 1.63 | | | | 2.06 | | | | (0.46 | ) | | | 1.69 | | | | (0.10 | ) |
Total from investment operations | | | $2.08 | | | | $2.31 | | | | $(0.14 | ) | | | $1.97 | | | | $0.14 | |
| Less distributions declared to shareholders | | | | | | | | | | | | | |
From net investment income | | | $(0.26 | ) | | | $(0.30 | ) | | | $(0.30 | ) | | | $(0.23 | ) | | | $(0.23 | ) |
Net asset value, end of period (x) | | | $18.09 | | | | $16.27 | | | | $14.26 | | | | $14.70 | | | | $12.96 | |
Total return (%) (r)(s)(x) | | | 12.87 | | | | 16.42 | | | | (0.84 | ) | | | 15.19 | | | | 0.95 | |
Ratios (%) (to average net assets)
and Supplemental data: | | | | | | | | | | | | | |
Expenses before expense reductions (f) | | | 0.88 | | | | 0.93 | | | | 0.96 | | | | 0.95 | | | | 1.00 | |
Expenses after expense reductions (f) | | | 0.86 | | | | 0.93 | | | | 0.96 | | | | 0.95 | | | | 1.00 | |
Net investment income | | | 2.54 | | | | 1.60 | | | | 2.28 | | | | 1.83 | | | | 1.77 | |
Portfolio turnover | | | 27 | | | | 32 | | | | 37 | | | | 43 | | | | 56 | |
Net assets at end of period (000 omitted) | | | $546,069 | | | | $470,915 | | | | $825,288 | | | | $561,557 | | | | $482,217 | |
| |
| Class R5 (y) | | Years ended 8/31 | |
| | | 2014 | | | 2013 | | | 2012 | | | 2011 | | | 2010 | |
Net asset value, beginning of period | | | $16.21 | | | | $14.20 | | | | $14.63 | | | | $12.90 | | | | $13.00 | |
| Income (loss) from investment operations | | | | | | | | | | | | | |
Net investment income (d) | | | $0.46 | | | | $0.33 | | | | $0.17 | | | | $0.26 | | | | $0.23 | |
Net realized and unrealized gain (loss)
on investments and foreign currency | | | 1.64 | | | | 1.99 | | | | (0.31 | )(g) | | | 1.69 | | | | (0.11 | ) |
Total from investment operations | | | $2.10 | | | | $2.32 | | | | $(0.14 | ) | | | $1.95 | | | | $0.12 | |
| Less distributions declared to shareholders | | | | | | | | | | | | | |
From net investment income | | | $(0.29 | ) | | | $(0.31 | ) | | | $(0.29 | ) | | | $(0.22 | ) | | | $(0.22 | ) |
Net asset value, end of period (x) | | | $18.02 | | | | $16.21 | | | | $14.20 | | | | $14.63 | | | | $12.90 | |
Total return (%) (r)(s)(x) | | | 13.01 | | | | 16.50 | | | | (0.85 | ) | | | 15.07 | | | | 0.81 | |
Ratios (%) (to average net assets)
and Supplemental data: | | | | | | | | | | | | | |
Expenses before expense reductions (f) | | | 0.79 | | | | 0.81 | | | | 0.89 | | | | 1.05 | | | | 1.10 | |
Expenses after expense reductions (f) | | | 0.77 | | | | 0.81 | | | | 0.89 | | | | 1.05 | | | | 1.10 | |
Net investment income | | | 2.62 | | | | 2.09 | | | | 1.20(l | ) | | | 1.71 | | | | 1.73 | |
Portfolio turnover | | | 27 | | | | 32 | | | | 37 | | | | 43 | | | | 56 | |
Net assets at end of period (000 omitted) | | | $2,955,339 | | | | $2,331,325 | | | | $1,433,832 | | | | $26,173 | | | | $24,820 | |
See Notes to Financial Statements
26
Financial Highlights – continued
| | | | | | | | | | | | | | | | | | | | |
| Class 529A | | Years ended 8/31 | |
| | | 2014 | | | 2013 | | | 2012 | | | 2011 | | | 2010 | |
Net asset value, beginning of period | | | $16.03 | | | | $14.06 | | | | $14.49 | | | | $12.78 | | | | $12.88 | |
| Income (loss) from investment operations | | | | | | | | | | | | | |
Net investment income (d) | | | $0.39 | | | | $0.25 | | | | $0.27 | | | | $0.22 | | | | $0.20 | |
Net realized and unrealized gain (loss)
on investments and foreign currency | | | 1.62 | | | | 1.98 | | | | (0.45 | ) | | | 1.68 | | | | (0.12 | ) |
Total from investment operations | | | $2.01 | | | | $2.23 | | | | $(0.18 | ) | | | $1.90 | | | | $0.08 | |
| Less distributions declared to shareholders | | | | | | | | | | | | | |
From net investment income | | | $(0.23 | ) | | | $(0.26 | ) | | | $(0.25 | ) | | | $(0.19 | ) | | | $(0.18 | ) |
Net asset value, end of period (x) | | | $17.81 | | | | $16.03 | | | | $14.06 | | | | $14.49 | | | | $12.78 | |
Total return (%) (r)(s)(t)(x) | | | 12.57 | | | | 16.05 | | | | (1.15 | ) | | | 14.80 | | | | 0.54 | |
Ratios (%) (to average net assets)
and Supplemental data: | | | | | | | | | | | | | |
Expenses before expense reductions (f) | | | 1.23 | | | | 1.28 | | | | 1.31 | | | | 1.30 | | | | 1.35 | |
Expenses after expense reductions (f) | | | 1.14 | | | | 1.21 | | | | 1.26 | | | | 1.29 | | | | 1.35 | |
Net investment income | | | 2.22 | | | | 1.62 | | | | 1.96 | | | | 1.47 | | | | 1.47 | |
Portfolio turnover | | | 27 | | | | 32 | | | | 37 | | | | 43 | | | | 56 | |
Net assets at end of period (000 omitted) | | | $2,428 | | | | $2,105 | | | | $1,762 | | | | $1,747 | | | | $1,512 | |
| |
| Class 529B | | Years ended 8/31 | |
| | | 2014 | | | 2013 | | | 2012 | | | 2011 | | | 2010 | |
Net asset value, beginning of period | | | $15.14 | | | | $13.25 | | | | $13.57 | | | | $11.99 | | | | $12.11 | |
| Income (loss) from investment operations | | | | | | | | | | | | | |
Net investment income (d) | | | $0.25 | | | | $0.12 | | | | $0.13 | | | | $0.09 | | | | $0.09 | |
Net realized and unrealized gain (loss)
on investments and foreign currency | | | 1.52 | | | | 1.88 | | | | (0.38 | ) | | | 1.58 | | | | (0.10 | ) |
Total from investment operations | | | $1.77 | | | | $2.00 | | | | $(0.25 | ) | | | $1.67 | | | | $(0.01 | ) |
| Less distributions declared to shareholders | | | | | | | | | | | | | |
From net investment income | | | $(0.11 | ) | | | $(0.11 | ) | | | $(0.07 | ) | | | $(0.09 | ) | | | $(0.11 | ) |
Net asset value, end of period (x) | | | $16.80 | | | | $15.14 | | | | $13.25 | | | | $13.57 | | | | $11.99 | |
Total return (%) (r)(s)(t)(x) | | | 11.71 | | | | 15.15 | | | | (1.84 | ) | | | 13.90 | | | | (0.14 | ) |
Ratios (%) (to average net assets)
and Supplemental data: | | | | | | | | | | | | | |
Expenses before expense reductions (f) | | | 1.98 | | | | 2.03 | | | | 2.06 | | | | 2.04 | | | | 2.10 | |
Expenses after expense reductions (f) | | | 1.91 | | | | 1.98 | | | | 2.01 | | | | 2.04 | | | | 2.10 | |
Net investment income | | | 1.49 | | | | 0.82 | | | | 1.03 | | | | 0.66 | | | | 0.69 | |
Portfolio turnover | | | 27 | | | | 32 | | | | 37 | | | | 43 | | | | 56 | |
Net assets at end of period (000 omitted) | | | $192 | | | | $188 | | | | $199 | | | | $366 | | | | $461 | |
See Notes to Financial Statements
27
Financial Highlights – continued
| | | | | | | | | | | | | | | | | | | | |
| Class 529C | | Years ended 8/31 | |
| | | 2014 | | | 2013 | | | 2012 | | | 2011 | | | 2010 | |
Net asset value, beginning of period | | | $14.98 | | | | $13.17 | | | | $13.56 | | | | $12.00 | | | | $12.12 | |
| Income (loss) from investment operations | | | | | | | | | | | | | |
Net investment income (d) | | | $0.23 | | | | $0.12 | | | | $0.15 | | | | $0.11 | | | | $0.09 | |
Net realized and unrealized gain (loss)
on investments and foreign currency | | | 1.52 | | | | 1.86 | | | | (0.41 | ) | | | 1.56 | | | | (0.10 | ) |
Total from investment operations | | | $1.75 | | | | $1.98 | | | | $(0.26 | ) | | | $1.67 | | | | $(0.01 | ) |
| Less distributions declared to shareholders | | | | | | | | | | | | | |
From net investment income | | | $(0.12 | ) | | | $(0.17 | ) | | | $(0.13 | ) | | | $(0.11 | ) | | | $(0.11 | ) |
Net asset value, end of period (x) | | | $16.61 | | | | $14.98 | | | | $13.17 | | | | $13.56 | | | | $12.00 | |
Total return (%) (r)(s)(t)(x) | | | 11.68 | | | | 15.17 | | | | (1.83 | ) | | | 13.89 | | | | (0.11 | ) |
Ratios (%) (to average net assets)
and Supplemental data: | | | | | | | | | | | | | |
Expenses before expense reductions (f) | | | 1.98 | | | | 2.03 | | | | 2.06 | | | | 2.05 | | | | 2.10 | |
Expenses after expense reductions (f) | | | 1.91 | | | | 1.98 | | | | 2.01 | | | | 2.04 | | | | 2.10 | |
Net investment income | | | 1.43 | | | | 0.81 | | | | 1.19 | | | | 0.81 | | | | 0.76 | |
Portfolio turnover | | | 27 | | | | 32 | | | | 37 | | | | 43 | | | | 56 | |
Net assets at end of period (000 omitted) | | | $1,098 | | | | $950 | | | | $914 | | | | $906 | | | | $796 | |
| (d) | Per share data is based on average shares outstanding. |
| (f) | Ratios do not reflect reductions from fees paid indirectly, if applicable. |
| (g) | The per share amount varies from the net realized and unrealized gain/loss for the period because of the timing of sales of fund shares and the per share amount of realized and unrealized gains and losses at such time. |
| (l) | The net investment income ratio does not vary by the class specific expense differential because of the timing of sales of fund shares and the allocation of fund level income at such time. |
| (r) | Certain expenses have been reduced without which performance would have been lower. |
| (s) | From time to time the fund may receive proceeds from litigation settlements, without which performance would be lower. |
| (t) | Total returns do not include any applicable sales charges. |
| (x) | The net asset values per share and total returns have been calculated on net assets which include adjustments made in accordance with U.S. generally accepted accounting principles required at period end for financial reporting purposes. |
| (y) | On May 10, 2012, sales of Class W shares (including exchanges) were suspended. On May 11, 2012, certain Class W shares were automatically converted to Class I shares. Shareholders of certain Class W shares became shareholders of Class I and received Class I shares with a total net asset value equal to their Class W shares at the time of the conversion. On May 30, 2012, remaining Class W shares, which represented MFS seed money, were redesignated Class R5. Class R5 shares are generally available only to certain eligible retirement plans and to funds distributed by MFD. Class R5 shares do not pay a 12b-1 distribution fee or sub-accounting costs. On June 1, 2012, Class R5 shares were offered for sale to the public. |
See Notes to Financial Statements
28
NOTES TO FINANCIAL STATEMENTS
(1) Business and Organization
MFS Research International Fund (the fund) is a diversified series of MFS Series Trust I (the trust). The trust is organized as a Massachusetts business trust and is registered under the Investment Company Act of 1940, as amended, as an open-end management investment company.
The fund is an investment company and accordingly follows the investment company accounting and reporting guidance of the Financial Accounting Standards Board (FASB) Accounting Standards Codification Topic 946 Financial Services – Investment Companies.
(2) Significant Accounting Policies
General – The preparation of financial statements in conformity with U.S. generally accepted accounting principles requires management to make estimates and assumptions that affect the reported amounts of assets and liabilities, and disclosure of contingent assets and liabilities at the date of the financial statements and the reported amounts of increases and decreases in net assets from operations during the reporting period. Actual results could differ from those estimates. In the preparation of these financial statements, management has evaluated subsequent events occurring after the date of the fund’s Statement of Assets and Liabilities through the date that the financial statements were issued. The fund invests in foreign securities. Investments in foreign securities are vulnerable to the effects of changes in the relative values of the local currency and the U.S. dollar and to the effects of changes in each country’s legal, political, and economic environment.
In June 2014, FASB issued Accounting Standards Update 2014-11, Transfers and Servicing (Topic 860) – Repurchase-to-Maturity Transactions, Repurchase Financings, and Disclosures (“ASU 2014-11”). ASU 2014-11 changes the accounting for repurchase-to-maturity transactions (i.e., repurchase agreements that settle at the same time as the maturity of the transferred financial asset) and enhances the required disclosures for repurchase agreements and other similar transactions. Although still evaluating the potential impacts of ASU 2014-11 to the fund, management expects that the impact of the fund’s adoption will be limited to additional financial statement disclosures which would first be effective for interim reporting periods beginning after March 15, 2015.
Balance Sheet Offsetting – The fund’s accounting policy with respect to balance sheet offsetting is that, absent an event of default by the counterparty or a termination of the agreement, the International Swaps and Derivatives Association (ISDA) Master Agreement does not result in an offset of reported amounts of financial assets and financial liabilities in the Statement of Assets and Liabilities across transactions between the fund and the applicable counterparty. The fund’s right to setoff may be restricted or prohibited by the bankruptcy or insolvency laws of the particular jurisdiction to which a specific master netting agreement counterparty is subject. Balance sheet offsetting disclosures, to the extent applicable to the fund, have been included in the fund’s Significant Accounting Policies note under the captions for each of the fund’s in-scope financial instruments and transactions.
29
Notes to Financial Statements – continued
Investment Valuations – Equity securities, including restricted equity securities, are generally valued at the last sale or official closing price as provided by a third-party pricing service on the market or exchange on which they are primarily traded. Equity securities, for which there were no sales reported that day, are generally valued at the last quoted daily bid quotation as provided by a third-party pricing service on the market or exchange on which such securities are primarily traded. Short-term instruments with a maturity at issuance of 60 days or less generally are valued at amortized cost, which approximates market value. Open-end investment companies are generally valued at net asset value per share. Securities and other assets generally valued on the basis of information from a third-party pricing service may also be valued at a broker/dealer bid quotation. Values obtained from third-party pricing services can utilize both transaction data and market information such as yield, quality, coupon rate, maturity, type of issue, trading characteristics, and other market data. The values of foreign securities and other assets and liabilities expressed in foreign currencies are converted to U.S. dollars using the mean of bid and asked prices for rates provided by a third-party pricing service.
The Board of Trustees has delegated primary responsibility for determining or causing to be determined the value of the fund’s investments (including any fair valuation) to the adviser pursuant to valuation policies and procedures approved by the Board. If the adviser determines that reliable market quotations are not readily available, investments are valued at fair value as determined in good faith by the adviser in accordance with such procedures under the oversight of the Board of Trustees. Under the fund’s valuation policies and procedures, market quotations are not considered to be readily available for most types of debt instruments and floating rate loans and many types of derivatives. These investments are generally valued at fair value based on information from third-party pricing services. In addition, investments may be valued at fair value if the adviser determines that an investment’s value has been materially affected by events occurring after the close of the exchange or market on which the investment is principally traded (such as foreign exchange or market) and prior to the determination of the fund’s net asset value, or after the halting of trading of a specific security where trading does not resume prior to the close of the exchange or market on which the security is principally traded. Events that occur on a frequent basis after foreign markets close (such as developments in foreign markets and significant movements in the U.S. markets) and prior to the determination of the fund’s net asset value may be deemed to have a material effect on the value of securities traded in foreign markets. Accordingly, the fund’s foreign equity securities may often be valued at fair value. The adviser generally relies on third-party pricing services or other information (such as the correlation with price movements of similar securities in the same or other markets; the type, cost and investment characteristics of the security; the business and financial condition of the issuer; and trading and other market data) to assist in determining whether to fair value and at what value to fair value an investment. The value of an investment for purposes of calculating the fund’s net asset value can differ depending on the source and method used to determine value. When fair valuation is used, the value of an investment used to determine the fund’s net asset value may differ from quoted or published prices for the same investment. There can be no assurance that the fund could obtain the fair value assigned to an investment if it were to sell the investment at the same time at which the fund determines its net asset value per share.
30
Notes to Financial Statements – continued
Various inputs are used in determining the value of the fund’s assets or liabilities. These inputs are categorized into three broad levels. In certain cases, the inputs used to measure fair value may fall into different levels of the fair value hierarchy. In such cases, an investment’s level within the fair value hierarchy is based on the lowest level of input that is significant to the fair value measurement. The fund’s assessment of the significance of a particular input to the fair value measurement in its entirety requires judgment, and considers factors specific to the investment. Level 1 includes unadjusted quoted prices in active markets for identical assets or liabilities. Level 2 includes other significant observable market-based inputs (including quoted prices for similar securities, interest rates, prepayment speed, and credit risk). Level 3 includes unobservable inputs, which may include the adviser’s own assumptions in determining the fair value of investments. The following is a summary of the levels used as of August 31, 2014 in valuing the fund’s assets or liabilities:
| | | | | | | | | | | | | | | | |
| Investments at Value | | Level 1 | | | Level 2 | | | Level 3 | | | Total | |
| Equity Securities: | | | | | | | | | | | | | | | | |
United Kingdom | | | $1,558,595,275 | | | | $— | | | | $— | | | | $1,558,595,275 | |
Japan | | | 1,333,188,519 | | | | — | | | | — | | | | 1,333,188,519 | |
Switzerland | | | 906,403,443 | | | | — | | | | — | | | | 906,403,443 | |
France | | | 754,464,468 | | | | — | | | | — | | | | 754,464,468 | |
Germany | | | 506,891,576 | | | | — | | | | — | | | | 506,891,576 | |
Hong Kong | | | 310,356,487 | | | | — | | | | — | | | | 310,356,487 | |
Netherlands | | | 302,002,834 | | | | — | | | | — | | | | 302,002,834 | |
Australia | | | 286,096,121 | | | | — | | | | — | | | | 286,096,121 | |
United States | | | 230,605,999 | | | | — | | | | — | | | | 230,605,999 | |
Other Countries | | | 1,039,731,987 | | | | 42,360,918 | | | | — | | | | 1,082,092,905 | |
| Mutual Funds | | | 102,287,398 | | | | — | | | | — | | | | 102,287,398 | |
| Total Investments | | | $7,330,624,107 | | | | $42,360,918 | | | | $— | | | | $7,372,985,025 | |
For further information regarding security characteristics, see the Portfolio of Investments.
Of the level 2 investments presented above, equity investments amounting to $20,106,085 would have been considered level 1 investments at the beginning of the period. Of the level 1 investments presented above, equity investments amounting to $1,636,158,939 would have been considered level 2 investments at the beginning of the period. The primary reason for changes in the classifications between levels 1 and 2 occurs when foreign equity securities are fair valued using other observable market-based inputs in place of the closing exchange price due to events occurring after the close of the exchange or market on which the investment is principally traded. The fund’s foreign equity securities may often be valued at fair value. The fund’s policy is to recognize transfers between the levels as of the end of the period.
Foreign Currency Translation – Purchases and sales of foreign investments, income, and expenses are converted into U.S. dollars based upon currency exchange rates prevailing on the respective dates of such transactions or on the reporting date for foreign denominated receivables and payables. Gains and losses attributable to foreign currency exchange rates on sales of securities are recorded for financial statement purposes as net realized gains and losses on investments. Gains and losses attributable
31
Notes to Financial Statements – continued
to foreign exchange rate movements on receivables, payables, income and expenses are recorded for financial statement purposes as foreign currency transaction gains and losses. That portion of both realized and unrealized gains and losses on investments that results from fluctuations in foreign currency exchange rates is not separately disclosed.
Security Loans – Under its Securities Lending Agency Agreement with the fund, State Street Bank and Trust Company (“State Street”), as lending agent, loans the securities of the fund to certain qualified institutions (the “Borrowers”) approved by the fund. The loans are collateralized by cash and/or U.S. Treasury and federal agency obligations in an amount typically at least equal to the market value of the securities loaned. On loans collateralized by cash, the cash collateral is invested in a money market fund. The market value of the loaned securities is determined at the close of business of the fund and any additional required collateral is delivered to the fund on the next business day. State Street provides the fund with indemnification against Borrower default. In the event of Borrower default, State Street will for the benefit of the fund either purchase securities identical to those loaned or, when such purchase is commercially impracticable, pay the fund the market value of the loaned securities. In return, State Street assumes the fund’s rights to the related collateral. If the collateral value is less than the cost to purchase identical securities, State Street is responsible for the shortfall, but only to the extent that such shortfall is not due to a decline in collateral value resulting from collateral reinvestment for which the fund bears the risk of loss. A portion of the income generated upon investment of the collateral is remitted to the Borrowers, and the remainder is allocated between the fund and the lending agent. On loans collateralized by U.S. Treasury and/or federal agency obligations, a fee is received from the Borrower, and is allocated between the fund and the lending agent. Income from securities lending is included in “Interest” income in the Statement of Operations. The dividend and interest income earned on the securities loaned is accounted for in the same manner as other dividend and interest income. At August 31, 2014, there were no securities on loan or collateral outstanding.
Indemnifications – Under the fund’s organizational documents, its officers and Trustees may be indemnified against certain liabilities and expenses arising out of the performance of their duties to the fund. Additionally, in the normal course of business, the fund enters into agreements with service providers that may contain indemnification clauses. The fund’s maximum exposure under these agreements is unknown as this would involve future claims that may be made against the fund that have not yet occurred.
Investment Transactions and Income – Investment transactions are recorded on the trade date. Interest income is recorded on the accrual basis. Dividends received in cash are recorded on the ex-dividend date. Certain dividends from foreign securities will be recorded when the fund is informed of the dividend if such information is obtained subsequent to the ex-dividend date. Dividend and interest payments received in additional securities are recorded on the ex-dividend or ex-interest date in an amount equal to the value of the security on such date.
The fund may receive proceeds from litigation settlements. Any proceeds received from litigation involving portfolio holdings are reflected in the Statement of Operations in realized gain/loss if the security has been disposed of by the fund or in unrealized
32
Notes to Financial Statements – continued
gain/loss if the security is still held by the fund. Any other proceeds from litigation not related to portfolio holdings are reflected as other income in the Statement of Operations.
Fees Paid Indirectly – The fund’s custody fee may be reduced according to an arrangement that measures the value of cash deposited with the custodian by the fund. This amount, for the year ended August 31, 2014, is shown as a reduction of total expenses in the Statement of Operations.
Tax Matters and Distributions – The fund intends to qualify as a regulated investment company, as defined under Subchapter M of the Internal Revenue Code, and to distribute all of its taxable income, including realized capital gains. As a result, no provision for federal income tax is required. The fund’s federal tax returns, when filed, will remain subject to examination by the Internal Revenue Service for a three year period. Management has analyzed the fund’s tax positions taken on federal and state tax returns for all open tax years and does not believe that there are any uncertain tax positions that require recognition of a tax liability. Foreign taxes, if any, have been accrued by the fund in the accompanying financial statements in accordance with the applicable foreign tax law. Foreign income taxes may be withheld by certain countries in which the fund invests. Additionally, capital gains realized by the fund on securities issued in or by certain foreign countries may be subject to capital gains tax imposed by those countries.
Distributions to shareholders are recorded on the ex-dividend date. Income and capital gain distributions are determined in accordance with income tax regulations, which may differ from U.S. generally accepted accounting principles. Certain capital accounts in the financial statements are periodically adjusted for permanent differences in order to reflect their tax character. These adjustments have no impact on net assets or net asset value per share. Temporary differences which arise from recognizing certain items of income, expense, gain or loss in different periods for financial statement and tax purposes will reverse at some time in the future. Distributions in excess of net investment income or net realized gains are temporary overdistributions for financial statement purposes resulting from differences in the recognition or classification of income or distributions for financial statement and tax purposes.
Book/tax differences primarily relate to wash sale loss deferrals.
The tax character of distributions declared to shareholders for the last two fiscal years is as follows:
| | | | | | | | |
| | | 8/31/14 | | | 8/13/13 | |
Ordinary income (including any
short-term capital gains) | | | $103,250,534 | | | | $97,500,392 | |
33
Notes to Financial Statements – continued
The federal tax cost and the tax basis components of distributable earnings were as follows:
| | | | |
| As of 8/31/14 | | | |
| Cost of investments | | | $6,532,198,760 | |
| Gross appreciation | | | 1,085,001,994 | |
| Gross depreciation | | | (244,215,729 | ) |
| Net unrealized appreciation (depreciation) | | | $840,786,265 | |
| Undistributed ordinary income | | | 172,550,010 | |
| Capital loss carryforwards | | | (434,460,469 | ) |
| Other temporary differences | | | (1,322,255 | ) |
Under the Regulated Investment Company Modernization Act of 2010 (the “Act”), net capital losses recognized for fund fiscal years beginning after August 31, 2011 may be carried forward indefinitely, and their character is retained as short-term and/or long-term losses (“post-enactment losses”). Previously, net capital losses were carried forward for eight years and treated as short-term losses (“pre-enactment losses”). As a transition rule, the Act requires that all post-enactment net capital losses be used before pre-enactment net capital losses.
As of August 31, 2014, the fund had capital loss carryforwards available to offset future realized gains. Such pre-enactment losses expire as follows:
Multiple Classes of Shares of Beneficial Interest – The fund offers multiple classes of shares, which differ in their respective distribution, service, and program manager fees. The fund’s income, realized and unrealized gain (loss), and common expenses are allocated to shareholders based on the daily net assets of each class. Dividends are declared separately for each class. Differences in per share dividend rates are generally due to differences in separate class expenses. Class B and Class 529B shares will convert to Class A and Class 529A shares, respectively, approximately eight years after
purchase.
34
Notes to Financial Statements – continued
The fund’s distributions declared to shareholders as reported in the Statements of Changes in Net Assets are presented by class as follows:
| | | | | | | | |
| | | From net investment
income | |
| | | Year
ended
8/31/14 | | | Year
ended
8/31/13 | |
| Class A | | | $15,702,653 | | | | $18,082,585 | |
| Class B | | | 102,139 | | | | 216,225 | |
| Class C | | | 675,749 | | | | 914,829 | |
| Class I | | | 31,156,722 | | | | 24,235,060 | |
| Class R1 | | | 23,279 | | | | 49,846 | |
| Class R2 | | | 1,827,492 | | | | 1,877,801 | |
| Class R3 | | | 2,842,760 | | | | 3,284,789 | |
| Class R4 | | | 7,705,916 | | | | 17,572,798 | |
| Class R5 | | | 43,174,399 | | | | 31,219,429 | |
| Class 529A | | | 30,527 | | | | 33,635 | |
| Class 529B | | | 1,412 | | | | 1,468 | |
| Class 529C | | | 7,486 | | | | 11,927 | |
| Total | | | $103,250,534 | | | | $97,500,392 | |
(3) Transactions with Affiliates
Investment Adviser – The fund has an investment advisory agreement with MFS to provide overall investment management and related administrative services and facilities to the fund. The management fee is computed daily and paid monthly at the following annual rates:
| | | | |
| First $1 billion of average daily net assets | | | 0.90 | % |
| Next $1 billion of average daily net assets | | | 0.80 | % |
| Average daily net assets in excess of $2 billion | | | 0.70 | % |
Prior to August 1, 2014, the investment adviser had agreed in writing to reduce its management fee to 0.65% of average daily net assets in excess of $5 billion up to $10 billion and 0.60% of average daily net assets in excess of $10 billion. This written agreement terminated on July 31, 2014. For the period September 1, 2013 through July 31, 2014, this management fee reduction amounted to $955,642, which is included in the reduction of total expenses in the Statement of Operations. Effective August 1, 2014, the investment adviser has agreed in writing to reduce its management fee to 0.60% of average daily net assets in excess of $5 billion up to $10 billion and 0.55% of average daily net assets in excess of $10 billion. This written agreement will continue until modified by the fund’s Board of Trustees, but such agreement will continue at least until December 31, 2015. For the period August 1, 2014 through August 31, 2014, this management fee reduction amounted to $199,728, which is included in the reduction of total expenses in the Statement of Operations. MFS has also agreed in writing to reduce its management fee by a specified amount if certain MFS mutual fund assets exceed thresholds agreed to by MFS and the fund’s Board of Trustees. For the year ended August 31, 2014, this management fee reduction amounted to $238,985, which is included in the reduction
35
Notes to Financial Statements – continued
of total expenses in the Statement of Operations. The management fee incurred for the year ended August 31, 2014 was equivalent to an annual effective rate of 0.72% of the fund’s average daily net assets.
Distributor – MFS Fund Distributors, Inc. (MFD), a wholly-owned subsidiary of MFS, as distributor, received $81,365 and $1,060 for the year ended August 31, 2014, as its portion of the initial sales charge on sales of Class A and Class 529A shares of the fund, respectively.
The Board of Trustees has adopted a distribution plan for certain share classes pursuant to Rule 12b-1 of the Investment Company Act of 1940.
The fund’s distribution plan provides that the fund will pay MFD for services provided by MFD and financial intermediaries in connection with the distribution and servicing of certain share classes. One component of the plan is a distribution fee paid to MFD and another component of the plan is a service fee paid to MFD. MFD may subsequently pay all, or a portion, of the distribution and/or service fees to financial intermediaries.
Distribution Plan Fee Table:
| | | | | | | | | | | | | | | | | | | | |
| | | Distribution Fee Rate (d) | | | Service Fee Rate (d) | | | Total Distribution Plan (d) | | | Annual Effective Rate (e) | | | Distribution and Service Fee | |
| Class A | | | — | | | | 0.25% | | | | 0.25% | | | | 0.25% | | | | $2,997,067 | |
| Class B | | | 0.75% | | | | 0.25% | | | | 1.00% | | | | 1.00% | | | | 194,083 | |
| Class C | | | 0.75% | | | | 0.25% | | | | 1.00% | | | | 1.00% | | | | 939,852 | |
| Class R1 | | | 0.75% | | | | 0.25% | | | | 1.00% | | | | 1.00% | | | | 42,738 | |
| Class R2 | | | 0.25% | | | | 0.25% | | | | 0.50% | | | | 0.50% | | | | 833,096 | |
| Class R3 | | | — | | | | 0.25% | | | | 0.25% | | | | 0.25% | | | | 561,262 | |
| Class 529A | | | — | | | | 0.25% | | | | 0.25% | | | | 0.22% | | | | 5,928 | |
| Class 529B | | | 0.75% | | | | 0.25% | | | | 1.00% | | | | 1.00% | | | | 2,029 | |
| Class 529C | | | 0.75% | | | | 0.25% | | | | 1.00% | | | | 1.00% | | | | 10,617 | |
| Total Distribution and Service Fees | | | | | | | | | | | | $5,586,672 | |
| (d) | In accordance with the distribution plan for certain classes, the fund pays distribution and/or service fees equal to these annual percentage rates of each class’s average daily net assets. The distribution and service fee rates disclosed by class represent the current rates in effect at the end of the reporting period. Any rate changes, if applicable, are detailed below. |
| (e) | The annual effective rates represent actual fees incurred under the distribution plan for the year ended August 31, 2014 based on each class’s average daily net assets. MFD has voluntarily agreed to rebate a portion of each class’s 0.25% service fee attributable to accounts for which MFD retains the 0.25% service fee except for accounts attributable to MFS or its affiliates’ seed money. For the year ended August 31, 2014, this rebate amounted to $9,822, $136, $106, $494, $622, and $2 for Class A, Class B, Class C, Class R3, Class 529A, and Class 529B, respectively, and is included in the reduction of total expenses in the Statement of Operations. |
Certain Class A shares are subject to a contingent deferred sales charge (CDSC) in the event of a shareholder redemption within 18 months of purchase for shares purchased on or after August 1, 2012, and within 24 months of purchase for shares purchased prior to August 1, 2012. Class C and Class 529C shares are subject to a CDSC in the event of a shareholder redemption within 12 months of purchase. Class B and Class 529B shares are subject to a CDSC in the event of a shareholder redemption within six years of purchase.
36
Notes to Financial Statements – continued
All contingent deferred sales charges are paid to MFD and during the year ended August 31, 2014, were as follows:
| | | | |
| | | Amount | |
| Class A | | | $310 | |
| Class B | | | 17,935 | |
| Class C | | | 4,792 | |
| Class 529B | | | — | |
| Class 529C | | | 5 | |
The fund has entered into and may from time to time enter into contracts with program managers and other parties which administer the tuition programs through which an investment in the fund’s 529 share classes is made. The fund has entered into an agreement with MFD pursuant to which MFD receives an annual fee of up to 0.10% of the average daily net assets attributable to each 529 share class. MFD has agreed to waive a portion of this fee in an amount equal to 0.05% of the average daily net assets for each 529 share class. This waiver agreement will expire December 31, 2015, unless MFD elects to extend the waiver. For the year ended August 31, 2014, this waiver amounted to $1,818 and is included in the reduction of total expenses in the Statement of Operations. The program manager fee incurred for the year ended August 31, 2014 was equivalent to an annual effective rate of 0.05% of the average daily net assets attributable to each 529 share class. The services provided by MFD, or a third party with which MFD contracts, include recordkeeping and tax reporting and account services, as well as services designed to maintain the program’s compliance with the Internal Revenue Code and other regulatory requirements. Program manager fees and waivers for the year ended August 31, 2014, were as follows:
| | | | | | | | |
| | | Fee | | | Waiver | |
| Class 529A | | | $2,372 | | | | $1,186 | |
| Class 529B | | | 203 | | | | 102 | |
| Class 529C | | | 1,062 | | | | 530 | |
| Total Program Manager Fees and Waivers | | | $3,637 | | | | $1,818 | |
Shareholder Servicing Agent – MFS Service Center, Inc. (MFSC), a wholly-owned subsidiary of MFS, receives a fee from the fund for its services as shareholder servicing agent calculated as a percentage of the average daily net assets of the fund as determined periodically under the supervision of the fund’s Board of Trustees. For the year ended August 31, 2014, the fee was $291,110, which equated to 0.0041% annually of the fund’s average daily net assets. MFSC also receives payment from the fund for out-of-pocket expenses, sub-accounting and other shareholder servicing costs which may be paid to affiliated and unaffiliated service providers. Class R5 shares do not incur sub-accounting fees. For the year ended August 31, 2014, these out-of-pocket expenses, sub-accounting and other shareholder servicing costs amounted to $4,234,458.
Administrator – MFS provides certain financial, legal, shareholder communications, compliance, and other administrative services to the fund. Under an administrative services agreement, the fund partially reimburses MFS the costs incurred to provide these services. The fund is charged an annual fixed amount of $17,500 plus a fee
37
Notes to Financial Statements – continued
based on average daily net assets. The administrative services fee incurred for the year ended August 31, 2014 was equivalent to an annual effective rate of 0.0068% of the fund’s average daily net assets.
Trustees’ and Officers’ Compensation – The fund pays compensation to independent Trustees in the form of a retainer, attendance fees, and additional compensation to Board and Committee chairpersons. The fund does not pay compensation directly to Trustees or officers of the fund who are also officers of the investment adviser, all of whom receive remuneration for their services to the fund from MFS. Certain officers and Trustees of the fund are officers or directors of MFS, MFD, and MFSC.
Prior to December 31, 2001, the fund had an unfunded defined benefit plan (“DB plan”) for independent Trustees. As of December 31, 2001, the Board took action to terminate the DB plan with respect to then-current and any future independent Trustees, such that the DB plan covers only certain of those former independent Trustees who retired on or before December 31, 2001. Effective January 1, 2002, accrued benefits under the DB plan for then-current independent Trustees who continued were credited to an unfunded retirement deferral plan (the “Retirement Deferral plan”), which was established for and exists solely with respect to these credited amounts, and is not available for other deferrals by these or other independent Trustees. Although the Retirement Deferral plan is unfunded, amounts deferred under the plan are periodically adjusted for investment experience as if they had been invested in shares of the fund. The DB plan resulted in a pension expense of $153 and the Retirement Deferral plan resulted in an expense of $1,276. Both amounts are included in independent Trustees’ compensation for the year ended August 31, 2014. The liability for deferred retirement benefits payable to certain independent Trustees under both plans amounted to $1,147 at August 31, 2014, and is included in “Payable for independent Trustees’ compensation” in the Statement of Assets and Liabilities.
Other – This fund and certain other funds managed by MFS (the funds) have entered into services agreements (the Agreements) which provide for payment of fees by the funds to Tarantino LLC and Griffin Compliance LLC in return for the provision of services of an Independent Chief Compliance Officer (ICCO) and Assistant ICCO, respectively, for the funds. The funds can terminate the Agreements with Tarantino LLC and Griffin Compliance LLC at any time under the terms of the Agreements. The ICCO is an officer of the funds and the sole member of Tarantino LLC. Prior to June 1, 2014, Robyn L. Griffin served as the Assistant ICCO and was an officer of the funds. Ms. Griffin is the sole member of Griffin Compliance LLC. Effective May 31, 2014, Ms. Griffin resigned as Assistant ICCO and the service agreement between the funds and Griffin Compliance LLC was terminated. For the year ended August 31, 2014, the aggregate fees paid by the fund to Tarantino LLC and Griffin Compliance LLC were $36,010 and are included in “Miscellaneous” expense in the Statement of Operations. MFS has agreed to reimburse the fund for a portion of the payments made by the fund in the amount of $10,686, which is included in the reduction of total expenses in the Statement of Operations. Additionally, MFS has agreed to bear all expenses associated with office space, other administrative support, and supplies provided to the ICCO and Assistant ICCO.
38
Notes to Financial Statements – continued
The fund invests in the MFS Institutional Money Market Portfolio which is managed by MFS and seeks current income consistent with preservation of capital and liquidity. Income earned on this investment is included in “Dividends from underlying affiliated funds” in the Statement of Operations. This money market fund does not pay a management fee to MFS.
On September 11, 2013, MFS redeemed 7,903 shares of Class R5 for an aggregate amount of $135,774.
(4) Portfolio Securities
For the year ended August 31, 2014, purchases and sales of investments, other than short-term obligations, aggregated $2,400,440,926 and $1,908,589,304, respectively.
(5) Shares of Beneficial Interest
The fund’s Declaration of Trust permits the Trustees to issue an unlimited number of full and fractional shares of beneficial interest. Transactions in fund shares were as follows:
| | | | | | | | | | | | | | | | |
| | | Year ended
8/31/14 | | | Year ended
8/31/13 | |
| | | Shares | | | Amount | | | Shares | | | Amount | |
| Shares sold | | | | | | | | | | | | | | | | |
Class A | | | 11,795,045 | | | | $210,179,639 | | | | 16,279,457 | | | | $254,419,782 | |
Class B | | | 73,919 | | | | 1,254,919 | | | | 113,999 | | | | 1,720,590 | |
Class C | | | 779,624 | | | | 12,932,437 | | | | 856,729 | | | | 12,689,293 | |
Class I | | | 32,553,405 | | | | 597,030,708 | | | | 61,242,598 | | | | 1,017,828,706 | |
Class R1 | | | 48,002 | | | | 787,268 | | | | 60,541 | | | | 876,339 | |
Class R2 | | | 3,262,913 | | | | 55,773,824 | | | | 2,636,872 | | | | 40,136,497 | |
Class R3 | | | 4,217,815 | | | | 73,822,772 | | | | 3,459,308 | | | | 53,661,367 | |
Class R4 | | | 6,760,440 | | | | 120,226,134 | | | | 7,651,892 | | | | 118,459,587 | |
Class R5 | | | 23,987,940 | | | | 423,700,354 | | | | 48,012,029 | | | | 741,180,408 | |
Class 529A | | | 20,890 | | | | 363,424 | | | | 19,927 | | | | 308,135 | |
Class 529B | | | 2,494 | | | | 41,383 | | | | 940 | | | | 13,451 | |
Class 529C | | | 10,025 | | | | 164,945 | | | | 5,559 | | | | 79,642 | |
| | | 83,512,512 | | | | $1,496,277,807 | | | | 140,339,851 | | | | $2,241,373,797 | |
| | | |
Shares issued to shareholders in
reinvestment of distributions | | | | | | | | | | | | | |
Class A | | | 740,280 | | | | $12,917,878 | | | | 988,881 | | | | $14,783,775 | |
Class B | | | 5,142 | | | | 86,227 | | | | 12,620 | | | | 181,228 | |
Class C | | | 21,795 | | | | 358,525 | | | | 34,473 | | | | 486,411 | |
Class I | | | 1,243,827 | | | | 22,388,889 | | | | 1,092,849 | | | | 16,840,811 | |
Class R1 | | | 1,431 | | | | 23,203 | | | | 3,550 | | | | 49,310 | |
Class R2 | | | 101,560 | | | | 1,719,409 | | | | 120,670 | | | | 1,752,131 | |
Class R3 | | | 164,702 | | | | 2,842,760 | | | | 222,095 | | | | 3,284,789 | |
Class R4 | | | 428,261 | | | | 7,473,150 | | | | 1,161,239 | | | | 17,348,909 | |
Class R5 | | | 2,485,573 | | | | 43,174,399 | | | | 2,099,491 | | | | 31,219,429 | |
Class 529A | | | 1,773 | | | | 30,527 | | | | 2,280 | | | | 33,635 | |
Class 529B | | | 86 | | | | 1,412 | | | | 103 | | | | 1,468 | |
Class 529C | | | 464 | | | | 7,486 | | | | 861 | | | | 11,927 | |
| | | 5,194,894 | | | | $91,023,865 | | | | 5,739,112 | | | | $85,993,823 | |
39
Notes to Financial Statements – continued
| | | | | | | | | | | | | | | | |
| | | Year ended
8/31/14 | | | Year ended
8/31/13 | |
| | | Shares | | | Amount | | | Shares | | | Amount | |
| Shares reacquired | | | | | | | | | | | | | |
Class A | | | (15,156,261 | ) | | | $(270,617,354 | ) | | | (17,149,034 | ) | | | $(268,162,272 | ) |
Class B | | | (370,599 | ) | | | (6,313,790 | ) | | | (572,885 | ) | | | (8,623,274 | ) |
Class C | | | (1,085,852 | ) | | | (18,135,045 | ) | | | (1,487,418 | ) | | | (21,691,721 | ) |
Class I | | | (25,510,410 | ) | | | (468,165,738 | ) | | | (30,802,793 | ) | | | (503,136,411 | ) |
Class R1 | | | (63,860 | ) | | | (1,051,501 | ) | | | (168,622 | ) | | | (2,424,736 | ) |
Class R2 | | | (1,589,201 | ) | | | (27,401,731 | ) | | | (1,873,333 | ) | | | (28,103,295 | ) |
Class R3 | | | (3,700,880 | ) | | | (65,149,095 | ) | | | (3,512,663 | ) | | | (54,511,524 | ) |
Class R4 | | | (5,948,182 | ) | | | (105,874,108 | ) | | | (37,734,633 | ) | | | (579,114,162 | ) |
Class R5 | | | (6,253,975 | ) | | | (111,106,638 | ) | | | (7,286,685 | ) | | | (114,338,763 | ) |
Class 529A | | | (17,644 | ) | | | (308,796 | ) | | | (16,241 | ) | | | (255,887 | ) |
Class 529B | | | (3,584 | ) | | | (59,757 | ) | | | (3,651 | ) | | | (52,851 | ) |
Class 529C | | | (7,843 | ) | | | (128,677 | ) | | | (12,369 | ) | | | (177,310 | ) |
| | | (59,708,291 | ) | | | $(1,074,312,230 | ) | | | (100,620,327 | ) | | | $(1,580,592,206 | ) |
| | | | |
| Net change | | | | | | | | | | | | | | | | |
Class A | | | (2,620,936 | ) | | | $(47,519,837 | ) | | | 119,304 | | | | $1,041,285 | |
Class B | | | (291,538 | ) | | | (4,972,644 | ) | | | (446,266 | ) | | | (6,721,456 | ) |
Class C | | | (284,433 | ) | | | (4,844,083 | ) | | | (596,216 | ) | | | (8,516,017 | ) |
Class I | | | 8,286,822 | | | | 151,253,859 | | | | 31,532,654 | | | | 531,533,106 | |
Class R1 | | | (14,427 | ) | | | (241,030 | ) | | | (104,531 | ) | | | (1,499,087 | ) |
Class R2 | | | 1,775,272 | | | | 30,091,502 | | | | 884,209 | | | | 13,785,333 | |
Class R3 | | | 681,637 | | | | 11,516,437 | | | | 168,740 | | | | 2,434,632 | |
Class R4 | | | 1,240,519 | | | | 21,825,176 | | | | (28,921,502 | ) | | | (443,305,666 | ) |
Class R5 | | | 20,219,538 | | | | 355,768,115 | | | | 42,824,835 | | | | 658,061,074 | |
Class 529A | | | 5,019 | | | | 85,155 | | | | 5,966 | | | | 85,883 | |
Class 529B | | | (1,004 | ) | | | (16,962 | ) | | | (2,608 | ) | | | (37,932 | ) |
Class 529C | | | 2,646 | | | | 43,754 | | | | (5,949 | ) | | | (85,741 | ) |
| | | 28,999,115 | | | | $512,989,442 | | | | 45,458,636 | | | | $746,775,414 | |
The fund is one of several mutual funds in which certain of the MFS funds-of-funds may invest. The MFS funds-of-funds do not invest in the underlying funds for the purpose of exercising management or control. At the end of the period, the MFS International Diversification Fund, the MFS Moderate Allocation Fund, the MFS Growth Allocation Fund, the MFS Aggressive Growth Allocation Fund, and the MFS Conservative Allocation Fund were the owners of record of approximately 18%, 5%, 5%, 2%, and 2% respectively, of the value of outstanding voting shares of the fund. In addition, the MFS Lifetime 2015 Fund, the MFS Lifetime 2020 Fund, the MFS Lifetime 2025 Fund, the MFS Lifetime 2030 Fund, the MFS Lifetime 2035 Fund, the MFS Lifetime 2040 Fund, the MFS Lifetime 2045 Fund, the MFS Lifetime 2050 Fund, the MFS Lifetime 2055 Fund, and the MFS Lifetime Income Fund were each the owners of record of less than 1% of the value of outstanding voting shares of the fund.
40
Notes to Financial Statements – continued
(6) Line of Credit
The fund and certain other funds managed by MFS participate in a $1.1 billion unsecured committed line of credit, subject to a $1 billion sublimit, provided by a syndication of banks under a credit agreement. Borrowings may be made for temporary financing needs. Interest is charged to each fund, based on its borrowings, generally at a rate equal to the higher of the Federal Reserve funds rate or one month LIBOR plus an agreed upon spread. A commitment fee, based on the average daily, unused portion of the committed line of credit, is allocated among the participating funds at the end of each calendar quarter. In addition, the fund and other funds managed by MFS have established unsecured uncommitted borrowing arrangements with certain banks for temporary financing needs. Interest is charged to each fund, based on its borrowings, at a rate equal to the Federal Reserve funds rate plus an agreed upon spread. For the year ended August 31, 2014, the fund’s commitment fee and interest expense were $27,963 and $0, respectively, and are included in “Miscellaneous” expense in the Statement of Operations.
(7) Transactions in Underlying Affiliated Funds-Affiliated Issuers
An affiliated issuer may be considered one in which the fund owns 5% or more of the outstanding voting securities, or a company which is under common control. For the purposes of this report, the fund assumes the following to be an affiliated issuer:
| | | | | | | | | | | | | | | | |
| Underlying Affiliated Fund | | Beginning Shares/Par Amount | | | Acquisitions Shares/Par Amount | | | Dispositions Shares/Par Amount | | | Ending Shares/Par Amount | |
MFS Institutional Money
Market Portfolio | | | 30,851,777 | | | | 1,092,274,296 | | | | (1,020,838,675 | ) | | | 102,287,398 | |
| | | | |
| Underlying Affiliated Fund | | Realized Gain (Loss) | | | Capital Gain Distributions | | | Dividend Income | | | Ending Value | |
MFS Institutional Money
Market Portfolio | | | $— | | | | $— | | | | $67,962 | | | | $102,287,398 | |
41
REPORT OF INDEPENDENT REGISTERED PUBLIC ACCOUNTING FIRM
To the Board of Trustees of MFS Series Trust I and Shareholders of MFS Research International Fund:
We have audited the accompanying statement of assets and liabilities of MFS Research International Fund (the Fund) (one of the series constituting MFS Series Trust I), including the portfolio of investments, as of August 31, 2014, and the related statement of operations for the year then ended, the statements of changes in net assets for each of the two years in the period then ended, and the financial highlights for each of the five years in the period then ended. These financial statements and financial highlights are the responsibility of the Fund’s management. Our responsibility is to express an opinion on these financial statements and financial highlights based on our audits.
We conducted our audits in accordance with the standards of the Public Company Accounting Oversight Board (United States). Those standards require that we plan and perform the audit to obtain reasonable assurance about whether the financial statements and financial highlights are free of material misstatement. We were not engaged to perform an audit of the Fund’s internal control over financial reporting. Our audits included consideration of internal control over financial reporting as a basis for designing audit procedures that are appropriate in the circumstances, but not for the purpose of expressing an opinion on the effectiveness of the Fund’s internal control over financial reporting. Accordingly, we express no such opinion. An audit also includes examining, on a test basis, evidence supporting the amounts and disclosures in the financial statements and financial highlights, assessing the accounting principles used and significant estimates made by management, and evaluating the overall financial statement presentation. Our procedures included confirmation of securities owned as of August 31, 2014, by correspondence with the custodian and others or by other appropriate auditing procedures where replies from others were not received. We believe that our audits provide a reasonable basis for our opinion.
In our opinion, the financial statements and financial highlights referred to above present fairly, in all material respects, the financial position of MFS Research International Fund (one of the series constituting MFS Series Trust I) at August 31, 2014, the results of its operations for the year then ended, the changes in its net assets for each of the two years in the period then ended, and the financial highlights for each of the five years in the period then ended, in conformity with U.S. generally accepted accounting principles.

Boston, Massachusetts
October 16, 2014
42
TRUSTEES AND OFFICERS — IDENTIFICATION AND BACKGROUND
The Trustees and Officers of the Trust, as of October 1, 2014, are listed below, together with their principal occupations during the past five years. (Their titles may have varied during that period.) The address of each Trustee and Officer is 111 Huntington Avenue, Boston, Massachusetts 02199-7618. It is expected that the Board will appoint Mr. Timothy M. Fagan as Chief Compliance Officer of the MFS Funds on November 1, 2014.
| | | | | | | | |
Name, Age | | Position(s) Held with Fund | | Trustee/Officer
Since (h) | | Principal
Occupations During the Past Five Years | | Other Directorships (j) |
| INTERESTED TRUSTEES |
Robert J. Manning (k)
(age 50) | | Trustee | | February 2004 | | Massachusetts Financial Services Company, Chairman, Chief Executive Officer and Director; President (until 2009); Chief Investment Officer (until 2010) | | N/A |
Robin A. Stelmach (k)
(age 53) | | Trustee and President | | January 2014 | | Massachusetts Financial Services Company, Executive Vice President and Chief Operating Officer | | N/A |
| INDEPENDENT TRUSTEES | | |
David H. Gunning
(age 72) | | Trustee and Chair of Trustees | | January 2004 | | Private investor | | Lincoln Electric Holdings, Inc. (welding equipment manufacturer), Director; Development Alternatives, Inc. (consulting), Director/Non-Executive Chairman |
Steven E. Buller (age 63) | | Trustee | | February 2014 | | Chairman, Financial Accounting Standards Advisory Council; Standing Advisory Group, Public Company Accounting Oversight Board, Member; BlackRock, Inc. (investment management), Managing Director (until 2014), BlackRock Finco UK (investment management), Director (until 2014) | | N/A |
43
Trustees and Officers – continued
| | | | | | | | |
Name, Age | | Position(s) Held with Fund | | Trustee/Officer
Since (h) | | Principal
Occupations During the Past Five Years | | Other Directorships (j) |
Robert E. Butler
(age 72) | | Trustee | | January 2006 | | Consultant – investment company industry regulatory and compliance matters | | N/A |
Maureen R. Goldfarb
(age 59) | | Trustee | | January 2009 | | Private investor | | N/A |
William R. Gutow
(age 73) | | Trustee | | December 1993 | | Private investor and real estate consultant; Capitol Entertainment Management Company (video franchise), Vice Chairman | | Texas Donuts (donut franchise), Vice Chairman (until 2010) |
Michael Hegarty
(age 69) | | Trustee | | December 2004 | | Private investor | | Brookfield Office Properties, Inc. (real estate), Director; Rouse Properties Inc. (real estate), Director; Capmark Financial Group Inc. (real estate), Director |
John P. Kavanaugh
(age 59) | | Trustee | | January 2009 | | Private investor | | N/A |
Maryanne L. Roepke
(age 58) | | Trustee | | May 2014 | | American Century Investments (investment management), Senior Vice President and Chief Compliance Officer (until 2014) | | N/A |
Laurie J. Thomsen
(age 57) | | Trustee | | March 2005 | | Private investor; New Profit, Inc. (venture philanthropy), Executive Partner (until 2010) | | The Travelers Companies (insurance), Director |
Robert W. Uek
(age 73) | | Trustee | | January 2006 | | Consultant to investment company industry | | N/A |
| OFFICERS | | | | | | |
Christopher R. Bohane (k)
(age 40) | | Assistant Secretary and Assistant Clerk | | July 2005 | | Massachusetts Financial Services Company, Vice President and Assistant General Counsel | | N/A |
Kino Clark (k)
(age 46) | | Assistant Treasurer | | January 2012 | | Massachusetts Financial Services Company, Vice President | | N/A |
44
Trustees and Officers – continued
| | | | | | | | |
Name, Age | | Position(s) Held with Fund | | Trustee/Officer
Since (h) | | Principal
Occupations During the Past Five Years | | Other Directorships (j) |
Thomas H. Connors (k)
(age 55) | | Assistant Secretary and Assistant Clerk | | September 2012 | | Massachusetts Financial Services Company, Vice President and Senior Counsel; Deutsche Investment Management Americas Inc. (financial service provider), Director and Senior Counsel (until 2012) | | N/A |
Ethan D. Corey (k)
(age 50) | | Assistant Secretary and Assistant Clerk | | July 2005 | | Massachusetts Financial Services Company, Senior Vice President and Associate General Counsel | | N/A |
David L. DiLorenzo (k)
(age 46) | | Treasurer | | July 2005 | | Massachusetts Financial Services Company, Senior Vice President | | N/A |
Brian E. Langenfeld (k) (age 41) | | Assistant Secretary and Assistant Clerk | | June 2006 | | Massachusetts Financial Services Company, Vice President and Senior Counsel | | N/A |
Susan S. Newton (k) (age 64) | | Assistant Secretary and Assistant Clerk | | May 2005 | | Massachusetts Financial Services Company, Senior Vice President and Associate General Counsel | | N/A |
Susan A. Pereira (k)
(age 43) | | Assistant Secretary and Assistant Clerk | | July 2005 | | Massachusetts Financial Services Company, Vice President and Senior Counsel | | N/A |
Kasey L. Phillips (k) (age 43) | | Assistant Treasurer | | September 2012 | | Massachusetts Financial Services Company, Vice President; Wells Fargo Funds Management, LLC, Senior Vice President, Fund Treasurer (until 2012) | | N/A |
Mark N. Polebaum (k)
(age 62) | | Secretary and Clerk | | January 2006 | | Massachusetts Financial Services Company, Executive Vice President, General Counsel and Secretary | | N/A |
45
Trustees and Officers – continued
| | | | | | | | |
Name, Age | | Position(s) Held with Fund | | Trustee/Officer
Since (h) | | Principal
Occupations During the Past Five Years | | Other Directorships (j) |
Matthew A. Stowe (k)
(age 39) | | Assistant Secretary and Assistant Clerk | | October 2014 | | Massachusetts Financial Services Company, Vice President and Senior Counsel | | N/A |
Frank L. Tarantino (l)
(age 70) | | Independent Chief Compliance Officer | | June 2004 | | Tarantino LLC (provider of compliance services), Principal | | N/A |
Richard S. Weitzel (k)
(age 44) | | Assistant Secretary and Assistant Clerk | | October 2007 | | Massachusetts Financial Services Company, Senior Vice President and Associate General Counsel | | N/A |
James O. Yost (k)
(age 54) | | Deputy Treasurer | | September 1990 | | Massachusetts Financial Services Company, Senior Vice President | | N/A |
| (h) | Date first appointed to serve as Trustee/officer of an MFS Fund. Each Trustee has served continuously since appointment unless indicated otherwise. For the period from December 15, 2004 until February 22, 2005, Mr. Manning served as Advisory Trustee. Prior to January 2012, Messrs. DiLorenzo and Yost served as Assistant Treasurers of the Funds. Ms. Stelmach was appointed as President of the Funds as of October 1, 2014. |
| (j) | Directorships or trusteeships of companies required to report to the Securities and Exchange Commission (i.e., “public companies”). |
| (k) | “Interested person” of the Trust within the meaning of the Investment Company Act of 1940 (referred to as the 1940 Act), which is the principal federal law governing investment companies like the fund, as a result of position with MFS. The address of MFS is 111 Huntington Avenue, Boston, Massachusetts 02199-7618. |
| (l) | Mr. Tarantino will retire as Independent Chief Compliance Officer of the MFS Funds on October 31, 2014. It is expected that Mr. Tarantino will continue after that date as an Independent Senior Officer of the MFS Funds. |
Each Trustee (except Ms. Stelmach, Mr. Buller and Ms. Roepke) has been elected by shareholders and each Trustee and officer holds office until his or her successor is chosen and qualified or until his or her earlier death, resignation, retirement or removal. The Trust does not hold annual meetings for the purpose of electing Trustees, and Trustees are not elected for fixed terms. Messrs. Butler, Kavanaugh, Uek and Mses. Thomsen and Roepke are members of the Trust’s Audit Committee.
Each of the Fund’s Trustees and officers holds comparable positions with certain other funds of which MFS or a subsidiary is the investment adviser or distributor, and, in the case of the officers, with certain affiliates of MFS. As of January 1, 2014, the Trustees served as board members of 142 funds within the MFS Family of Funds.
46
Trustees and Officers – continued
The Statement of Additional Information for the Fund includes further information about the Trustees and is available without charge upon request by calling 1-800-225-2606.
| | |
| Investment Adviser | | Custodian |
Massachusetts Financial Services Company
111 Huntington Avenue
Boston, MA 02199-7618 | | State Street Bank and Trust Company 1 Lincoln Street Boston, MA 02111-2900 |
| Distributor | | Independent Registered Public Accounting Firm |
MFS Fund Distributors, Inc.
111 Huntington Avenue
Boston, MA 02199-7618 | | Ernst & Young LLP 200 Clarendon Street Boston, MA 02116 |
| Portfolio Managers | | |
Jose Luis Garcia Thomas Melendez | | |
47
BOARD REVIEW OF INVESTMENT ADVISORY AGREEMENT
The Investment Company Act of 1940 requires that both the full Board of Trustees and a majority of the non-interested (“independent”) Trustees, voting separately, annually approve the continuation of the Fund’s investment advisory agreement with MFS. The Trustees consider matters bearing on the Fund and its advisory arrangements at their meetings throughout the year, including a review of performance data at each regular meeting. In addition, the independent Trustees met several times over the course of three months beginning in May and ending in July, 2014 (“contract review meetings”) for the specific purpose of considering whether to approve the continuation of the investment advisory agreement for the Fund and the other investment companies that the Board oversees (the “MFS Funds”). The independent Trustees were assisted in their evaluation of the Fund’s investment advisory agreement by independent legal counsel, from whom they received separate legal advice and with whom they met separately from MFS during various contract review meetings. The independent Trustees were also assisted in this process by the MFS Funds’ Independent Chief Compliance Officer, a full-time senior officer appointed by and reporting to the independent Trustees.
In connection with their deliberations regarding the continuation of the investment advisory agreement, the Trustees, including the independent Trustees, considered such information and factors as they believed, in light of the legal advice furnished to them and their own business judgment, to be relevant. The investment advisory agreement for the Fund was considered separately, although the Trustees also took into account the common interests of all MFS Funds in their review. As described below, the Trustees considered the nature, quality, and extent of the various investment advisory, administrative, and shareholder services performed by MFS under the existing investment advisory agreement and other arrangements with the Fund.
In connection with their contract review meetings, the Trustees received and relied upon materials that included, among other items: (i) information provided by Lipper Inc., an independent third party, on the investment performance of the Fund for various time periods ended December 31, 2013 and the investment performance of a group of funds with substantially similar investment classifications/objectives (the “Lipper performance universe”), (ii) information provided by Lipper Inc. on the Fund’s advisory fees and other expenses and the advisory fees and other expenses of comparable funds identified by Lipper Inc. (the “Lipper expense group”), (iii) information provided by MFS on the advisory fees of comparable portfolios of other clients of MFS, including institutional separate accounts and other clients, (iv) information as to whether and to what extent applicable expense waivers, reimbursements or fee “breakpoints” are observed for the Fund, (v) information regarding MFS’ financial results and financial condition, including MFS’ and certain of its affiliates’ estimated profitability from services performed for the Fund and the MFS Funds as a whole, and compared to MFS’ institutional business, (vi) MFS’ views regarding the outlook for the mutual fund industry and the strategic business plans of MFS, (vii) descriptions of various functions performed by MFS for the Funds, such as compliance monitoring and portfolio trading practices, and (viii) information regarding the overall organization of MFS, including information about MFS’ senior management and other personnel providing investment advisory, administrative and other services to
48
Board Review of Investment Advisory Agreement – continued
the Fund and the other MFS Funds. The comparative performance, fee and expense information prepared and provided by Lipper Inc. was not independently verified and the independent Trustees did not independently verify any information provided to them by MFS.
The Trustees’ conclusion as to the continuation of the investment advisory agreement was based on a comprehensive consideration of all information provided to the Trustees and not the result of any single factor. Some of the factors that figured particularly in the Trustees’ deliberations are described below, although individual Trustees may have evaluated the information presented differently from one another, giving different weights to various factors. It is also important to recognize that the fee arrangements for the Fund and other MFS Funds are the result of years of review and discussion between the independent Trustees and MFS, that certain aspects of such arrangements may receive greater scrutiny in some years than in others, and that the Trustees’ conclusions may be based, in part, on their consideration of these same arrangements during the course of the year and in prior years.
Based on information provided by Lipper Inc. and MFS, the Trustees reviewed the Fund’s total return investment performance as well as the performance of peer groups of funds over various time periods. The Trustees placed particular emphasis on the total return performance of the Fund’s Class A shares in comparison to the performance of funds in its Lipper performance universe over the three-year period ended December 31, 2013, which the Trustees believed was a long enough period to reflect differing market conditions. The total return performance of the Fund’s Class A shares was in the 3rd quintile relative to the other funds in the universe for this three-year period (the 1st quintile being the best performers and the 5th quintile being the worst performers). The total return performance of the Fund’s Class A shares was in the 4th quintile for the one-year period and the 2nd quintile for the five-year period ended December 31, 2013 relative to the Lipper performance universe. Because of the passage of time, these performance results may differ from the performance results for more recent periods, including those shown elsewhere in this report.
In the course of their deliberations, the Trustees took into account information provided by MFS in connection with the contract review meetings, as well as during investment review meetings conducted with portfolio management personnel during the course of the year regarding the Fund’s performance. After reviewing these and related factors, the Trustees concluded, within the context of their overall conclusions regarding the investment advisory agreement, that they were satisfied with MFS’ responses and efforts relating to investment performance.
In assessing the reasonableness of the Fund’s advisory fee, the Trustees considered, among other information, the Fund’s advisory fee and the total expense ratio of the Fund’s Class A shares as a percentage of average daily net assets and the advisory fee and total expense ratios of peer groups of funds based on information provided by Lipper Inc. The Trustees considered that, according to the Lipper data (which takes into account any fee reductions or expense limitations that were in effect during the Fund’s last fiscal year), the Fund’s effective advisory fee rate was approximately at the Lipper expense group median and the Fund’s total expense ratio was lower than Lipper expense group median.
49
Board Review of Investment Advisory Agreement – continued
The Trustees also considered the advisory fees charged by MFS to any comparable institutional accounts. In comparing these fees, the Trustees considered information provided by MFS as to the generally broader scope of services provided by MFS to the Fund in comparison to institutional accounts, the higher demands placed on MFS’ investment personnel and trading infrastructure as a result of the daily cash in-flows and out-flows of the Fund, and the impact on MFS and expenses associated with the more extensive regulatory regime to which the Fund is subject in comparison to institutional accounts.
The Trustees also considered whether the Fund may benefit from any economies of scale in the management of the Fund in the event of growth in assets of the Fund and/or growth in assets of the MFS Funds as a whole. They noted that the Fund’s advisory fee rate schedule is subject to contractual breakpoints that reduce the Fund’s advisory fee rate on average daily net assets over $1 billion and $2 billion, and that MFS has agreed in writing to further reduce its advisory fee rate on average daily net assets over $5 billion and $10 billion, each of which may not be changed without the Trustees’ approval. The Trustees also noted that MFS has agreed in writing to waive a portion of the management fees of certain MFS Funds, including the Fund, if the total combined assets of certain funds within the MFS Funds’ complex increase above agreed upon thresholds (the “group fee waiver”), enabling the Fund’s shareholders to share in the benefits from any economies of scale at the complex level. The group fee waiver is reviewed and renewed annually between the Board and MFS. The Trustees concluded that the breakpoints and the group fee waiver were sufficient to allow the Fund to benefit from economies of scale as its assets and overall complex assets grow.
The Trustees also considered information prepared by MFS relating to MFS’ costs and profits with respect to the Fund, the MFS Funds considered as a group, and other investment companies and accounts advised by MFS, as well as MFS’ methodologies used to determine and allocate its costs to the MFS Funds, the Fund and other accounts and products for purposes of estimating profitability.
After reviewing these and other factors described herein, the Trustees concluded, within the context of their overall conclusions regarding the investment advisory agreement, that the advisory fees charged to the Fund represent reasonable compensation in light of the services being provided by MFS to the Fund.
In addition, the Trustees considered MFS’ resources and related efforts to continue to retain, attract and motivate capable personnel to serve the Fund. The Trustees also considered current and developing conditions in the financial services industry, including the presence of large and well-capitalized companies which are spending, and appear to be prepared to continue to spend, substantial sums to engage personnel and to provide services to competing investment companies. In this regard, the Trustees also considered the financial resources of MFS and its ultimate parent, Sun Life Financial Inc. The Trustees also considered the advantages and possible disadvantages to the Fund of having an adviser that also serves other investment companies as well as other accounts.
The Trustees also considered the nature, quality, cost, and extent of administrative, transfer agency, and distribution services provided to the Fund by MFS and its affiliates under agreements and plans other than the investment advisory agreement, including
50
Board Review of Investment Advisory Agreement – continued
any 12b-1 fees the Fund pays to MFS Fund Distributors, Inc., an affiliate of MFS. The Trustees also considered the nature, extent and quality of certain other services MFS performs or arranges for on the Fund’s behalf, which may include securities lending programs, directed expense payment programs, class action recovery programs, and MFS’ interaction with third-party service providers, principally custodians and sub-custodians. The Trustees concluded that the various non-advisory services provided by MFS and its affiliates on behalf of the Fund were satisfactory.
The Trustees also considered benefits to MFS from the use of the Fund’s portfolio brokerage commissions, if applicable, to pay for investment research and various other factors. Additionally, the Trustees considered so-called “fall-out benefits” to MFS such as reputational value derived from serving as investment manager to the Fund.
Based on their evaluation of factors that they deemed to be material, including those factors described above, the Board of Trustees, including the independent Trustees, concluded that the Fund’s investment advisory agreement with MFS should be continued for an additional one-year period, commencing August 1, 2014.
51
PROXY VOTING POLICIES AND INFORMATION
MFS votes proxies on behalf of the fund pursuant to proxy voting policies and procedures that are available without charge, upon request, by calling 1-800-225-2606, by visiting the Proxy Voting section of mfs.com or by visiting the SEC’s Web site at http://www.sec.gov.
Information regarding how the fund voted proxies relating to portfolio securities during the most recent twelve-month period ended June 30 is available without charge by visiting the Proxy Voting section of mfs.com or by visiting the SEC’s Web site at http://www.sec.gov.
QUARTERLY PORTFOLIO DISCLOSURE
The fund will file a complete schedule of portfolio holdings with the Securities and Exchange Commission (the Commission) for the first and third quarters of each fiscal year on Form N-Q. A shareholder can obtain the quarterly portfolio holdings report at mfs.com. The fund’s Form N-Q is also available on the EDGAR database on the Commission’s Internet Web site at http://www.sec.gov, and may be reviewed and copied at the:
Public Reference Room
Securities and Exchange Commission
100 F Street, NE, Room 1580
Washington, D.C. 20549
Information on the operation of the Public Reference Room may be obtained by calling the Commission at 1-800-SEC-0330. Copies of the fund’s Form N-Q also may be obtained, upon payment of a duplicating fee, by electronic request at the following e-mail address: publicinfo@sec.gov or by writing the Public Reference Section at the above address.
FURTHER INFORMATION
From time to time, MFS may post important information about the fund or the MFS funds on the MFS web site (mfs.com). This information is available by visiting the “Commentary & Announcements” and “Market Outlooks” sections of mfs.com or by clicking on the fund’s name under “Mutual Funds” in the “Products” section of mfs.com.
FEDERAL TAX INFORMATION (unaudited)
The fund will notify shareholders of amounts for use in preparing 2014 income tax forms in January 2015. The following information is provided pursuant to provisions of the Internal Revenue Code.
The fund designates the maximum amount allowable as qualified dividend income eligible to be taxed at the same rate as long-term capital gain.
Income derived from foreign sources was $191,958,393. The fund intends to pass through foreign tax credits of $12,549,259 for the fiscal year.
52
rev. 3/11
| | | | |
| | | |
FACTS | | WHAT DOES MFS DO WITH YOUR PERSONAL INFORMATION? | |  |
| | |
| Why? | | Financial companies choose how they share your personal information. Federal law gives consumers the right to limit some but not all sharing. Federal law also requires us to tell you how we collect, share, and protect your personal information. Please read this notice carefully to understand what we do. |
| | |
| What? | | The types of personal information we collect and share depend on the product or service you have with us. This information can include: • Social Security number and account balances • Account transactions and transaction history • Checking account information and wire transfer instructions When you are no longer our customer, we continue to share your information as described in this notice. |
| | |
| How? | | All financial companies need to share customers’ personal information to run their everyday business. In the section below, we list the reasons financial companies can share their customers’ personal information; the reasons MFS chooses to share; and whether you can limit this sharing. |
| | | | |
Reasons we can share your
personal information | | Does MFS
share? | | Can you limit
this sharing? |
For our everyday business purposes – such as to process your transactions, maintain your account(s), respond to court orders and legal investigations, or report to credit bureaus | | Yes | | No |
For our marketing purposes – to offer our products and services to you | | No | | We don’t share |
| For joint marketing with other financial companies | | No | | We don’t share |
For our affiliates’ everyday business purposes – information about your transactions and experiences | | No | | We don’t share |
For our affiliates’ everyday business purposes – information about your creditworthiness | | No | | We don’t share |
| For nonaffiliates to market to you | | No | | We don’t share |
| | |
| Questions? | | Call 800-225-2606 or go to mfs.com. |
53
| | |
| Who we are |
| Who is providing this notice? | | MFS Funds, MFS Investment Management, MFS Institutional Advisors, Inc., MFS Fund Distributors, Inc., MFS Heritage Trust Company, and MFS Service Center, Inc. |
| | |
| What we do |
| How does MFS protect my personal information? | | To protect your personal information from unauthorized access and use, we use security measures that comply with federal law. These measures include procedural, electronic, and physical safeguards for the protection of the personal information we collect about you. |
| How does MFS collect my personal information? | | We collect your personal information, for example, when you • open an account or provide account information • direct us to buy securities or direct us to sell your securities • make a wire transfer We also collect your personal information from others, such as credit bureaus, affiliates and other companies. |
| Why can’t I limit all sharing? | | Federal law gives you the right to limit only • sharing for affiliates’ everyday business purposes – information about your creditworthiness • affiliates from using your information to market to you • sharing for nonaffiliates to market to you State laws and individual companies may give you additional rights to limit sharing. |
| | |
| Definitions |
| Affiliates | | Companies related by common ownership or control. They can be financial and nonfinancial companies. • MFS does not share personal information with affiliates, except for everyday business purposes as described on page one of this notice. |
| Nonaffiliates | | Companies not related by common ownership or control. They can be financial and nonfinancial companies. • MFS does not share with nonaffiliates so they can market to you. |
| Joint Marketing | | A formal agreement between nonaffiliated financial companies that together market financial products or services to you. • MFS doesn’t jointly market. |
| | |
| Other important information |
| If you own an MFS product or receive an MFS service in the name of a third party such as a bank or broker-dealer, their privacy policy may apply to you instead of ours. |
54
Save paper with eDelivery.

| MFS® will send you prospectuses, |
reports, and proxies directly via e-mail so you will get information faster with less mailbox clutter.
To sign up:
1. Go to mfs.com.
2. Log in via MFS® Access.
3. Select eDelivery.
If you own your MFS fund shares through a financial institution or a retirement plan, MFS® TALK, MFS® Access, or eDelivery may not be available to you.
CONTACT
WEB SITE
mfs.com
MFS TALK
1-800-637-8255
24 hours a day
ACCOUNT SERVICE AND LITERATURE
Shareholders
1-800-225-2606
Financial advisors
1-800-343-2829
Retirement plan services
1-800-637-1255
MAILING ADDRESS
MFS Service Center, Inc.
P.O. Box 55824
Boston, MA 02205-5824
OVERNIGHT MAIL
MFS Service Center, Inc.
c/o Boston Financial Data Services
30 Dan Road
Canton, MA 02021-2809
ANNUAL REPORT
August 31, 2014

MFS® TECHNOLOGY FUND

SCT-ANN
MFS® TECHNOLOGY FUND
CONTENTS
The report is prepared for the general information of shareholders.
It is authorized for distribution to prospective investors only when preceded or accompanied by a current prospectus.
NOT FDIC INSURED Ÿ MAY LOSE VALUE Ÿ NO BANK GUARANTEE

LETTER FROM THE CHAIRMAN AND CEO
Dear Shareholders:
The U.S. economy continues to gain strength. Manufacturing output, construction activity and consumer confidence are all at multi-year highs, auto sales are robust, and
U.S. labor market reports show broad progress. Even a slowdown in the pace of rising house prices is seen as making the market more sustainable. Economists have a favorable outlook, and broad stock indices reflect that.
However, challenges dominate the rest of the global economy. China is struggling to boost its industrial output and Japan’s economic turnaround appears to have hit a setback after its sales tax increase in April. The eurozone economy is being held back by persistently high unemployment and dangerously low inflation, leading the European Central Bank to take more
aggressive stimulus action. With robust corporate earnings, the market’s greatest concerns relate to conflicts in the Middle East and Ukraine. In addition, speculation continues on when the U.S. Federal Reserve will begin tightening its monetary policy now that the U.S. economy has regained some traction.
As always at MFS®, active risk management is integral to how we manage your investments. We use a collaborative process, sharing insights across asset classes, regions and economic sectors. Our global team of investment professionals uses a multidisciplined, long-term, diversified investment approach.
We understand that these are challenging economic times. We believe we can serve you best by applying proven principles, such as asset allocation and diversification, over the long term. We are confident that this approach can help you as you work with your financial advisors to reach your goals in the years ahead.
Respectfully,

Robert J. Manning
Chairman and Chief Executive Officer
MFS Investment Management
October 16, 2014
The opinions expressed in this letter are subject to change and may not be relied upon for investment advice. No forecasts can be guaranteed.
1
PORTFOLIO COMPOSITION
Portfolio structure (i)
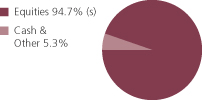
| | | | |
| Top ten holdings (i) | | | | |
| Google, Inc., “A” | | | 6.1% | |
| Apple, Inc. | | | 5.9% | |
| Hewlett-Packard Co. | | | 5.1% | |
| Oracle Corp. | | | 5.0% | |
| Google, Inc., “C” | | | 4.6% | |
| Visa, Inc., “A” | | | 4.2% | |
| Facebook, Inc., “A” | | | 4.2% | |
| EMC Corp. | | | 3.9% | |
| Priceline Group, Inc. | | | 3.6% | |
| Amazon.com, Inc. | | | 3.2% | |
| | | | |
| Top five industries (i) | | | | |
| Internet | | | 22.4% | |
| Computer Software-Systems | | | 17.7% | |
| Computer Software | | | 10.6% | |
| Other Banks & Diversified Financials | | | 7.3% | |
| Electronics (s) | | | 7.1% | |
| (i) | For purposes of this presentation, the components include the value of securities, less any securities sold short, and reflect the impact of the equivalent exposure of derivative positions. These amounts may be negative from time to time. Equivalent exposure is a calculated amount that translates the derivative position into a reasonable approximation of the amount of the underlying asset that the portfolio would have to hold at a given point in time to have the same price sensitivity that results from the portfolio’s ownership of the derivative contract. When dealing with derivatives, equivalent exposure is a more representative measure of the potential impact of a position on portfolio performance than value. |
| (s) | Includes securities sold short. |
Cash & Other can include cash, other assets less liabilities, offsets to derivative positions, and short-term securities.
Percentages are based on net assets as of 8/31/14.
The portfolio is actively managed and current holdings may be different.
2
MANAGEMENT REVIEW
Summary of Results
For the twelve months ended August 31, 2014, Class A shares of the MFS Technology Fund (“fund”) provided a total return of 26.07%, at net asset value. This compares with a return of 25.25% for the fund’s benchmark, the Standard & Poor’s 500 Stock Index and a return of 31.38% for the fund’s other benchmark, the Standard & Poor’s North American Technology Sector Index.
Market Environment
Early in the period, equity markets advanced in response to improved economic fundamentals, having recovered from prior weakness stemming from concerns that the US Federal Reserve (“Fed”) would begin tapering its quantitative easing (“QE”) program. A general theme in the market was a rotation in investor allocations from fixed income to equities and emerging markets (“EM”) to developed markets, reflecting an anticipated acceleration in developed market growth rates relative to EM as well as a more equity-friendly macro backdrop amid increased volatility in EM debt. As the period progressed, the Fed’s decision to postpone QE tapering surprised markets. Favorable market reactions were tempered, however, by tense negotiations over US fiscal policy which resulted in a 16-day partial shutdown of the federal government and a short-term extension in the debt ceiling. The volatility was short-lived, however, as an extension of budget and debt ceiling deadlines allowed the government to re-open, and subsequent economic data reflected moderate but resilient US growth. Also well-received was the decision by the European Central Bank (“ECB”) to cut its policy rate as inflation pressures waned in the region. In addition, equity investors appeared to have concluded that there would be no major change in US monetary policy as a result of the nomination of Janet Yellen as the new Fed Chair for a term beginning in early 2014 and that tapering would have no major impact on the trajectory.
Later in the period, financial markets were forced to contend with a series of positive and negative return episodes. In addition to periodic flashpoints in country specific emerging markets, geopolitical tensions flared in the Middle East and Russia/Ukraine. Market setbacks were short-lived, as improving economic growth in the US coupled with prospects for easier monetary policy in regions with slowing growth such as Japan, Europe and China, supported risk assets. For example, the ECB cut policy interest rates into negative territory and by the end of the period expectations were for additional rate cuts and the announcement for non-conventional easing measures. The decline in developed market government bond yields and credit spreads were also supportive for equity markets. At the end of the period, the US equity market was trading at all-time highs.
Detractors from Performance
Weak stock selection and an underweight position in the electronics industry was a negative factor that detracted from the fund’s performance relative to the Standard & Poor’s North American Technology Sector Index. Most notably, an overweight position in network testing company JDS Uniphase held back relative performance as the company reported lower-than-expected results. The company’s Network and Service
3
Management Review – continued
Enablement division showed lower profitability due to a weaker than expected Telecom spending environment. Not holding stocks of strong-performing semiconductor companies, Intel (h) and Micron Technology (h), also hampered relative performance as both stocks surged in the second half of the period. The fund’s overweight position in semiconductor company Altera also held back relative results as the company posted flat third-quarter results due to rising costs in new product launches.
Elsewhere, underweight positions in strong-performing computer and personal electronics maker Apple and software giant Microsoft, and an overweight position in weak-performing systems security solution company Symantec, detracted from relative performance. The fund’s holdings of software solutions provider FleetMatics Group (b)(h) and global media company Twenty-First Century Fox, Inc. (b) also held back relative results as both companies underperformed the fund’s benchmark.
The fund’s cash and/or cash equivalents position during the period weakened relative performance. Under normal market conditions, the fund strives to be fully invested and generally holds cash to buy new holdings and to provide liquidity. In a period when markets rose, as measured by the fund’s benchmark, holding cash hurt performance versus the benchmark, which has no cash position.
Contributors to Performance
The combination of positive stock selection and an underweight position in the network & telecom industry was a positive factor for relative performance. The fund’s short position in network equipment company Cisco Systems (h), benefited relative results as the stock underperformed the benchmark due, in part, to weak orders in the company’s high-end switching and routing products. An overweight position in wireless, enterprise and broadband infrastructure solutions provider CommScope Holding also strengthened relative performance as the stock significantly outperformed the benchmark.
Strong stock selection in the computer systems industry contributed to relative returns over the reporting period. Most notable was the fund’s overweight position in computer and personal electronics maker Hewlett-Packard, which posted improving earnings due to the progression of the company’s multi-year restructuring plan of reducing its employee workforce. Not holding poor-performing diversified technology products and services company International Business Machines (IBM) also contributed to relative results.
Elsewhere, the fund’s overweight positions in social networking service provider Facebook, online information portal Yahoo!, internet retailer Amazon.com, semiconductor company Freescale Semiconductor (h) and online business database Yelp strengthened relative performance. A short position in 3D printers manufacturer 3D Systems (h) was another positive factor for relative results as the stock turned in weak performance for the reporting period.
Respectfully,
| | |
| Matthew Sabel | | |
| Portfolio Manager | | |
4
Management Review – continued
| (b) | Security is not a benchmark constituent. |
| (h) | Security was not held in the portfolio at period end. |
The views expressed in this report are those of the portfolio manager only through the end of the period of the report as stated on the cover and do not necessarily reflect the views of MFS or any other person in the MFS organization. These views are subject to change at any time based on market or other conditions, and MFS disclaims any responsibility to update such views. These views may not be relied upon as investment advice or an indication of trading intent on behalf of any MFS portfolio. References to specific securities are not recommendations of such securities, and may not be representative of any MFS portfolio’s current or future investments.
5
PERFORMANCE SUMMARY THROUGH 8/31/14
The following chart illustrates a representative class of the fund’s historical performance in comparison to its benchmark(s). Performance results include the deduction of the maximum applicable sales charge and reflect the percentage change in net asset value, including reinvestment of dividends and capital gains distributions. The performance of other share classes will be greater than or less than that of the class depicted below. Benchmarks are unmanaged and may not be invested in directly. Benchmark returns do not reflect sales charges, commissions or expenses. (See Notes to Performance Summary.)
Performance data shown represents past performance and is no guarantee of future results. Investment return and principal value fluctuate so your shares, when sold, may be worth more or less than the original cost; current performance may be lower or higher than quoted. The performance shown does not reflect the deduction of taxes, if any, that a shareholder would pay on fund distributions or the redemption of fund shares.
Growth of a Hypothetical $10,000 Investment
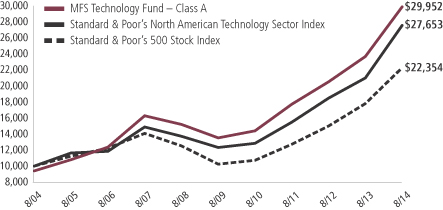
6
Performance Summary – continued
Total Returns through 8/31/14
Average annual without sales charge
| | | | | | | | | | | | | | |
| | | Share class | | Class inception date | | 1-yr | | 5-yr | | 10-yr | | Life (t) | | |
| | | A | | 1/02/97 | | 26.07% | | 17.21% | | 12.26% | | N/A | | |
| | | B | | 4/14/00 | | 25.07% | | 16.33% | | 11.46% | | N/A | | |
| | | C | | 4/14/00 | | 25.13% | | 16.33% | | 11.47% | | N/A | | |
| | | I | | 1/02/97 | | 26.32% | | 17.49% | | 12.58% | | N/A | | |
| | | R1 | | 4/01/05 | | 25.11% | | 16.31% | | N/A | | 11.39% | | |
| | | R2 | | 10/31/03 | | 25.73% | | 16.91% | | 11.96% | | N/A | | |
| | | R3 | | 4/01/05 | | 26.02% | | 17.20% | | N/A | | 12.22% | | |
| | | R4 | | 4/01/05 | | 26.38% | | 17.49% | | N/A | | 12.52% | | |
| | | R5 | | 1/02/13 | | 26.45% | | N/A | | N/A | | 25.24% | | |
| Comparative benchmarks | | | | | | | | | | |
| | | Standard & Poor’s 500 Stock Index (f) | | 25.25% | | 16.88% | | 8.38% | | N/A | | |
| | | Standard & Poor’s North American Technology Sector Index (f) | | 31.38% | | 17.50% | | 10.71% | | N/A | | |
| Average annual with sales charge | | | | | | | | | | |
| | | A With Initial Sales Charge (5.75%) | | 18.82% | | 15.83% | | 11.59% | | N/A | | |
| | | B With CDSC (Declining over six years from 4% to 0%) (v) | | 21.07% | | 16.11% | | 11.46% | | N/A | | |
| | | C With CDSC (1% for 12 months) (v) | | 24.13% | | 16.33% | | 11.47% | | N/A | | |
CDSC – Contingent Deferred Sales Charge.
Class I, R1, R2, R3, R4, and R5 shares do not have a sales charge.
| (f) | Source: FactSet Research Systems Inc. |
| (t) | For the period from the class inception date through the stated period end (for those share classes with less than 10 years of performance history). No comparative benchmark performance information is provided for “life” periods. (See Notes to Performance Summary.) |
| (v) | Assuming redemption at the end of the applicable period. |
Benchmark Definitions
Standard & Poor’s 500 Stock Index – a market capitalization-weighted index of 500 widely held equity securities, designed to measure broad U.S. equity performance.
Standard & Poor’s North American Technology Sector Index – a modified market capitalization-weighted index that measures the performance of selected technology stocks.
It is not possible to invest directly in an index.
7
Performance Summary – continued
Notes to Performance Summary
Average annual total return represents the average annual change in value for each share class for the periods presented. Life returns are presented where the share class has less than 10 years of performance history and represent the average annual total return from the class inception date to the stated period end date. As the fund’s share classes may have different inception dates, the life returns may represent different time periods and may not be comparable. As a result, no comparative benchmark performance information is provided for life periods.
Performance results reflect any applicable expense subsidies and waivers in effect during the periods shown. Without such subsidies and waivers the fund’s performance results would be less favorable. Please see the prospectus and financial statements for complete details.
Performance results do not include adjustments made for financial reporting purposes in accordance with U.S. generally accepted accounting principles and may differ from amounts reported in the financial highlights.
From time to time the fund may receive proceeds from litigation settlements, without which performance would be lower.
8
EXPENSE TABLE
Fund expenses borne by the shareholders during the period, March 1, 2014 through August 31, 2014
As a shareholder of the fund, you incur two types of costs: (1) transaction costs, including sales charges (loads) on certain purchase or redemption payments, and (2) ongoing costs, including management fees; distribution and service (12b-1) fees; and other fund expenses. This example is intended to help you understand your ongoing costs (in dollars) of investing in the fund and to compare these costs with the ongoing costs of investing in other mutual funds.
The example is based on an investment of $1,000 invested at the beginning of the period and held for the entire period March 1, 2014 through August 31, 2014.
Actual Expenses
The first line for each share class in the following table provides information about actual account values and actual expenses. You may use the information in this line, together with the amount you invested, to estimate the expenses that you paid over the period. Simply divide your account value by $1,000 (for example, an $8,600 account value divided by $1,000 = 8.6), then multiply the result by the number in the first line under the heading entitled “Expenses Paid During Period” to estimate the expenses you paid on your account during this period.
Hypothetical Example for Comparison Purposes
The second line for each share class in the following table provides information about hypothetical account values and hypothetical expenses based on the fund’s actual expense ratio and an assumed rate of return of 5% per year before expenses, which is not the fund’s actual return. The hypothetical account values and expenses may not be used to estimate the actual ending account balance or expenses you paid for the period. You may use this information to compare the ongoing costs of investing in the fund and other funds. To do so, compare this 5% hypothetical example with the 5% hypothetical examples that appear in the shareholder reports of the other funds.
Please note that the expenses shown in the table are meant to highlight your ongoing costs only and do not reflect any transactional costs, such as sales charges (loads). Therefore, the second line for each share class in the table is useful in comparing ongoing costs only, and will not help you determine the relative total costs of owning different funds. In addition, if these transactional costs were included, your costs would have been higher.
9
Expense Table – continued
| | | | | | | | | | | | | | | | | | |
Share
Class | | | | Annualized
Expense Ratio | | | Beginning
Account Value
3/01/14 | | | Ending Account Value
8/31/14 | | | Expenses Paid During Period (p) 3/01/14-8/31/14 | |
| A | | Actual | | | 1.28% | | | | $1,000.00 | | | | $1,031.62 | | | | $6.55 | |
| | Hypothetical (h) | | | 1.28% | | | | $1,000.00 | | | | $1,018.75 | | | | $6.51 | |
| B | | Actual | | | 2.04% | | | | $1,000.00 | | | | $1,027.30 | | | | $10.42 | |
| | Hypothetical (h) | | | 2.04% | | | | $1,000.00 | | | | $1,014.92 | | | | $10.36 | |
| C | | Actual | | | 2.04% | | | | $1,000.00 | | | | $1,027.35 | | | | $10.42 | |
| | Hypothetical (h) | | | 2.04% | | | | $1,000.00 | | | | $1,014.92 | | | | $10.36 | |
| I | | Actual | | | 1.04% | | | | $1,000.00 | | | | $1,032.57 | | | | $5.33 | |
| | Hypothetical (h) | | | 1.04% | | | | $1,000.00 | | | | $1,019.96 | | | | $5.30 | |
| R1 | | Actual | | | 2.04% | | | | $1,000.00 | | | | $1,027.40 | | | | $10.42 | |
| | Hypothetical (h) | | | 2.04% | | | | $1,000.00 | | | | $1,014.92 | | | | $10.36 | |
| R2 | | Actual | | | 1.54% | | | | $1,000.00 | | | | $1,029.99 | | | | $7.88 | |
| | Hypothetical (h) | | | 1.54% | | | | $1,000.00 | | | | $1,017.44 | | | | $7.83 | |
| R3 | | Actual | | | 1.29% | | | | $1,000.00 | | | | $1,031.20 | | | | $6.60 | |
| | Hypothetical (h) | | | 1.29% | | | | $1,000.00 | | | | $1,018.70 | | | | $6.56 | |
| R4 | | Actual | | | 1.04% | | | | $1,000.00 | | | | $1,032.92 | | | | $5.33 | |
| | Hypothetical (h) | | | 1.04% | | | | $1,000.00 | | | | $1,019.96 | | | | $5.30 | |
| R5 | | Actual | | | 0.95% | | | | $1,000.00 | | | | $1,032.93 | | | | $4.87 | |
| | Hypothetical (h) | | | 0.95% | | | | $1,000.00 | | | | $1,020.42 | | | | $4.84 | |
| (h) | 5% class return per year before expenses. |
| (p) | “Expenses Paid During Period” are equal to each class’s annualized expense ratio, as shown above, multiplied by the average account value over the period, multiplied by 184/365 (to reflect the one-half year period). Expenses paid do not include any applicable sales charges (loads). If these transaction costs had been included, your costs would have been higher. |
Notes to Expense Table
Expense ratios include 0.01% of investment related expenses from short sales (See Note 2 of the Notes to Financial Statements).
Each class with a Rule 12b-1 service fee is subject to a rebate of a portion of such fee. Such rebates are included in the expense ratios above. For Class A shares, this rebate reduced the expense ratio above by 0.01%. See Note 3 in the Notes to Financial Statements for additional information.
10
PORTFOLIO OF INVESTMENTS
8/31/14
The Portfolio of Investments is a complete list of all securities owned by your fund. It is categorized by broad-based asset classes.
| | | | | | | | |
| Common Stocks - 96.5% | | | | | | | | |
| Issuer | | Shares/Par | | | Value ($) | |
| | | | | | | | |
| Broadcasting - 6.5% | | | | | | | | |
| Discovery Communications, Inc., “C” (a) | | | 93,980 | | | $ | 4,038,317 | |
| Time Warner, Inc. | | | 76,970 | | | | 5,928,999 | |
| Twenty-First Century Fox, Inc. | | | 192,600 | | | | 6,821,892 | |
| Walt Disney Co. | | | 26,750 | | | | 2,404,290 | |
| | | | | | | | |
| | | | | | | $ | 19,193,498 | |
| Brokerage & Asset Managers - 0.9% | | | | | | | | |
| Intercontinental Exchange, Inc. | | | 14,626 | | | $ | 2,764,314 | |
| | |
| Business Services - 6.2% | | | | | | | | |
| Accenture PLC, “A” | | | 23,037 | | | $ | 1,867,379 | |
| Cognizant Technology Solutions Corp., “A” (a) | | | 78,879 | | | | 3,607,137 | |
| Concur Technologies, Inc. (a) | | | 15,499 | | | | 1,555,790 | |
| Fidelity National Information Services, Inc. | | | 57,054 | | | | 3,237,815 | |
| FleetCor Technologies, Inc. (a) | | | 23,478 | | | | 3,373,554 | |
| Gartner, Inc. (a) | | | 27,818 | | | | 2,074,945 | |
| IHS, Inc., “A” (a) | | | 16,030 | | | | 2,283,794 | |
| Wex, Inc. (a) | | | 3,942 | | | | 448,008 | |
| | | | | | | | |
| | | | | | | $ | 18,448,422 | |
| Cable TV - 0.9% | | | | | | | | |
| Time Warner Cable, Inc. | | | 17,760 | | | $ | 2,627,237 | |
| | |
| Computer Software - 10.6% | | | | | | | | |
| Citrix Systems, Inc. (a) | | | 19,240 | | | $ | 1,351,802 | |
| Dassault Systems S.A. | | | 14,828 | | | | 981,956 | |
| Microsoft Corp. | | | 57,440 | | | | 2,609,499 | |
| Oracle Corp. | | | 355,338 | | | | 14,757,187 | |
| Qlik Technologies, Inc. (a) | | | 77,660 | | | | 2,192,342 | |
| Red Hat, Inc. (a) | | | 17,090 | | | | 1,041,123 | |
| Salesforce.com, Inc. (a) | | | 146,301 | | | | 8,644,926 | |
| | | | | | | | |
| | | | | | | $ | 31,578,835 | |
| Computer Software - Systems - 18.6% | | | | | | | | |
| Apple, Inc. (s) | | | 169,912 | | | $ | 17,415,980 | |
| Benefitfocus, Inc. (a)(l) | | | 18,472 | | | | 609,945 | |
| CDW Corp. | | | 81,307 | | | | 2,686,383 | |
| EMC Corp. | | | 389,710 | | | | 11,508,136 | |
| Guidewire Software, Inc. (a) | | | 35,270 | | | | 1,606,549 | |
| Hewlett-Packard Co. (s) | | | 399,153 | | | | 15,167,814 | |
11
Portfolio of Investments – continued
| | | | | | | | |
| Issuer | | Shares/Par | | | Value ($) | |
| | | | | | | | |
| Common Stocks - continued | | | | | | | | |
| Computer Software - Systems - continued | | | | | | | | |
| Ingram Micro, Inc., “A” (a) | | | 63,449 | | | $ | 1,829,235 | |
| Qualys, Inc. (a) | | | 43,414 | | | | 1,054,960 | |
| SS&C Technologies Holdings, Inc. (a) | | | 35,570 | | | | 1,609,898 | |
| Vantiv, Inc., “A” (a) | | | 58,200 | | | | 1,820,496 | |
| | | | | | | | |
| | | | | | | $ | 55,309,396 | |
| Consumer Services - 3.6% | | | | | | | | |
| Priceline Group, Inc. (a) | | | 8,589 | | | $ | 10,687,379 | |
| | |
| Electrical Equipment - 2.6% | | | | | | | | |
| Amphenol Corp., “A” | | | 36,160 | | | $ | 3,724,842 | |
| TE Connectivity Ltd. | | | 61,298 | | | | 3,842,159 | |
| | | | | | | | |
| | | | | | | $ | 7,567,001 | |
| Electronics - 8.0% | | | | | | | | |
| Aeroflex Holding Corp. (a) | | | 107,274 | | | $ | 1,132,813 | |
| Altera Corp. | | | 203,169 | | | | 7,179,992 | |
| Broadcom Corp., “A” | | | 76,480 | | | | 3,011,782 | |
| JDS Uniphase Corp. (a) | | | 332,171 | | | | 3,836,575 | |
| Mellanox Technologies Ltd. (a) | | | 34,973 | | | | 1,461,522 | |
| Microchip Technology, Inc. | | | 135,102 | | | | 6,597,031 | |
| Rubicon Technology, Inc. (a)(l) | | | 106,777 | | | | 666,288 | |
| | | | | | | | |
| | | | | | | $ | 23,886,003 | |
| Entertainment - 0.5% | | | | | | | | |
| AMC Networks, Inc., “A” (a) | | | 25,549 | | | $ | 1,598,729 | |
| | |
| Internet - 22.4% | | | | | | | | |
| ChannelAdvisor Corp. (a) | | | 18,254 | | | $ | 295,715 | |
| eBay, Inc. (a) | | | 141,930 | | | | 7,877,115 | |
| Facebook, Inc., “A “ (a) | | | 165,943 | | | | 12,415,855 | |
| Google, Inc., “A” (a)(s) | | | 31,060 | | | | 18,088,102 | |
| Google, Inc., “C” (a) | | | 23,742 | | | | 13,570,927 | |
| LinkedIn Corp., “A” (a) | | | 22,189 | | | | 5,009,167 | |
| Twitter, Inc. (a) | | | 21,600 | | | | 1,074,600 | |
| Yahoo!, Inc. (a) | | | 155,619 | | | | 5,992,888 | |
| Yelp, Inc. (a) | | | 26,776 | | | | 2,206,878 | |
| | | | | | | | |
| | | | | | | $ | 66,531,247 | |
| Network & Telecom - 4.2% | | | | | | | | |
| CommScope Holding Co., Inc. (a) | | | 27,940 | | | $ | 719,734 | |
| Juniper Networks, Inc. | | | 147,340 | | | | 3,416,815 | |
| Qualcomm, Inc. | | | 109,955 | | | | 8,367,576 | |
| | | | | | | | |
| | | | | | | $ | 12,504,125 | |
12
Portfolio of Investments – continued
| | | | | | | | |
| Issuer | | Shares/Par | | | Value ($) | |
| | | | | | | | |
| Common Stocks - continued | | | | | | | | |
| Other Banks & Diversified Financials - 7.3% | | | | | | | | |
| MasterCard, Inc., “A” | | | 121,558 | | | $ | 9,215,312 | |
| Visa, Inc., “A” | | | 58,928 | | | | 12,523,379 | |
| | | | | | | | |
| | | | | | | $ | 21,738,691 | |
| Specialty Stores - 3.2% | | | | | | | | |
| Amazon.com, Inc. (a) | | | 27,616 | | | $ | 9,362,929 | |
| | |
| Telecommunications - Wireless - 1.0% | | | | | | | | |
| American Tower Corp., REIT | | | 25,403 | | | $ | 2,504,736 | |
| SBA Communications Corp. (a) | | | 5,426 | | | | 598,434 | |
| | | | | | | | |
| | | | | | | $ | 3,103,170 | |
| Total Common Stocks (Identified Cost, $187,402,365) | | | $ | 286,900,976 | |
| | |
| Collateral for Securities Loaned - 0.1% | | | | | | | | |
Navigator Securities Lending Prime Portfolio, 0.15%,
at Cost and Net Asset Value (j) | | | 176,859 | | | $ | 176,859 | |
| | |
| Issuer/Expiration Date/Strike Price | | Number of Contracts | | | | |
| Put Options Purchased - 0.1% | | | | | | | | |
| Computer Software - Systems - 0.1% | | | | | | | | |
| International Business Machines Corp. - January 2015 @ $195 | | | 264 | | | $ | 240,240 | |
| | |
| Electronics - 0.0% | | | | | | | | |
| Integrated Device Technology - September 2014 @ $16 | | | 287 | | | $ | 10,045 | |
| Total Put Options Purchased (Premiums Paid, $536,975) | | | $ | 250,285 | |
| | |
| Issuer | | Shares/Par | | | | |
| Money Market Funds - 3.9% | | | | | | | | |
MFS Institutional Money Market Portfolio, 0.09%,
at Cost and Net Asset Value (v) | | | 11,677,042 | | | $ | 11,677,042 | |
| Total Investments (Identified Cost, $199,793,241) | | | | | | $ | 299,005,162 | |
| | |
| Issuer/Expiration Date/Strike Price | | Number of Contracts | | | | |
| Call Options Written - 0.0% | | | | | | | | |
| Computer Software - Systems - 0.0% | | | | | | | | |
| Hewlett-Packard Co. - September 2014 @ $38 | | | (124 | ) | | $ | (10,292 | ) |
| Hewlett-Packard Co. - September 2014 @ $38 | | | (7 | ) | | | (371 | ) |
| Total Call Options Written (Premiums Received, $3,125) | | | $ | (10,663 | ) |
13
Portfolio of Investments – continued
| | | | | | | | |
| Put Options Written - 0.0% | | | | | | | | |
| Issuer/Expiration Date/Strike Price | | Number of Contracts | | | Value ($) | |
| | | | | | | | |
| Computer Software - Systems - 0.0% | | | | | | | | |
| Apple Inc. - September 2014 @ $91 | | | (352 | ) | | $ | (6,336 | ) |
| Apple Inc. - September 2014 @ $93 | | | (220 | ) | | | (5,500 | ) |
| | | | | | | | |
| | | | | | | $ | (11,836 | ) |
| Electronics - 0.0% | | | | | | | | |
| Avago Technologies Ltd. - September 2014 @ $78 | | | (193 | ) | | $ | (7,720 | ) |
| | |
| Internet - 0.0% | | | | | | | | |
| LinkedIn Corp. - September 2014 @ $200 | | | (40 | ) | | $ | (2,200 | ) |
| Total Put Options Written (Premiums Received, $36,727) | | | $ | (21,756 | ) |
| | |
| Issuer | | Shares/Par | | | | |
| Securities Sold Short - (0.9)% | | | | | | | | |
| Electronics - (0.9)% | | | | | | | | |
| Fairchild Semiconductor International, Inc. (a) | | | (104,600 | ) | | $ | (1,835,730 | ) |
| Spansion, Inc. “A” (a) | | | (42,800 | ) | | | (954,440 | ) |
| Total Securities Sold Short (Proceeds Received, $2,575,939) | | | $ | (2,790,170 | ) |
| | |
| Other Assets, Less Liabilities - 0.3% | | | | | | | 998,193 | |
| Net Assets - 100.0% | | | | | | $ | 297,180,766 | |
| (a) | Non-income producing security. |
| (j) | The rate quoted is the annualized seven-day yield of the fund at period end. |
| (l) | A portion of this security is on loan. |
| (s) | Security or a portion of the security was pledged to cover collateral requirements for securities sold short and/or certain derivative transactions. |
| (v) | Underlying affiliated fund that is available only to investment companies managed by MFS. The rate quoted for the MFS Institutional Money Market Portfolio is the annualized seven-day yield of the fund at period end. |
At August 31, 2014, the fund had cash collateral of $755,585 and other liquid securities with an aggregate value of $4,335,063 to cover any commitments for securities sold short and/or certain derivative contracts. Cash collateral is comprised of “Deposits with brokers” on the Statement of Assets and Liabilities.
The following abbreviations are used in this report and are defined:
| PLC | | Public Limited Company |
| REIT | | Real Estate Investment Trust |
See Notes to Financial Statements
14
Financial Statements
STATEMENT OF ASSETS AND LIABILITIES
At 8/31/14
This statement represents your fund’s balance sheet, which details the assets and liabilities comprising the total value of the fund.
| | | | |
| Assets | | | | |
Investments- | | | | |
| Non-affiliated issuers, at value (identified cost, $188,116,199) | | | $287,328,120 | |
Underlying affiliated funds, at cost and value | | | 11,677,042 | |
Total investments, at value, including $170,271 of securities on loan
(identified cost, $199,793,241) | | | $299,005,162 | |
| Deposits with brokers | | | 755,585 | |
| Receivables for | | | | |
Premiums on options written | | | 190,476 | |
Investments sold | | | 506,032 | |
Fund shares sold | | | 554,653 | |
Interest and dividends | | | 259,311 | |
Other assets | | | 454 | |
Total assets | | | $301,271,673 | |
| Liabilities | | | | |
| Payables for | | | | |
Securities sold short, at value (proceeds received, $2,575,939) | | | $2,790,170 | |
Investments purchased | | | 592,949 | |
Fund shares reacquired | | | 157,660 | |
Written options outstanding, at value (premiums received, $39,852) | | | 32,419 | |
| Collateral for securities loaned, at value | | | 176,859 | |
| Payable to affiliates | | | | |
Investment adviser | | | 23,763 | |
Shareholder servicing costs | | | 226,479 | |
Distribution and service fees | | | 10,980 | |
| Payable for independent Trustees’ compensation | | | 1,240 | |
Accrued expenses and other liabilities | | | 78,388 | |
Total liabilities | | | $4,090,907 | |
Net assets | | | $297,180,766 | |
| Net assets consist of | | | | |
| Paid-in capital | | | $189,587,866 | |
Unrealized appreciation (depreciation) on investments and translation of assets and liabilities in foreign currencies | | | 99,005,185 | |
Accumulated net realized gain (loss) on investments and foreign currency | | | 8,588,857 | |
Accumulated net investment loss | | | (1,142 | ) |
Net assets | | | $297,180,766 | |
Shares of beneficial interest outstanding | | | 12,313,731 | |
15
Statement of Assets and Liabilities – continued
| | | | | | | | | | | | |
| | | Net assets | | | Shares outstanding | | | Net asset value per share (a) | |
Class A | | | $171,019,561 | | | | 6,989,583 | | | | $24.47 | |
Class B | | | 16,189,734 | | | | 729,282 | | | | 22.20 | |
Class C | | | 35,998,044 | | | | 1,624,440 | | | | 22.16 | |
Class I | | | 40,359,437 | | | | 1,571,239 | | | | 25.69 | |
Class R1 | | | 2,033,290 | | | | 91,914 | | | | 22.12 | |
Class R2 | | | 17,123,098 | | | | 722,573 | | | | 23.70 | |
Class R3 | | | 10,626,112 | | | | 434,405 | | | | 24.46 | |
Class R4 | | | 1,402,659 | | | | 55,888 | | | | 25.10 | |
Class R5 | | | 2,428,831 | | | | 94,407 | | | | 25.73 | |
| (a) | Maximum offering price per share was equal to the net asset value per share for all share classes, except for Class A, for which the maximum offering price per share was $25.96 [100 / 94.25 x $24.47]. On sales of $50,000 or more, the maximum offering price of Class A shares is reduced. A contingent deferred sales charge may be imposed on redemptions of Class A, Class B, and Class C shares. Redemption price per share was equal to the net asset value per share for Classes I, R1, R2, R3, R4, and R5. |
See Notes to Financial Statements
16
Financial Statements
STATEMENT OF OPERATIONS
Year ended 8/31/14
This statement describes how much your fund earned in investment income and accrued in expenses. It also describes any gains and/or losses generated by fund operations.
| | | | |
| Net investment loss | | | | |
Income | | | | |
Dividends | | | $2,008,384 | |
Interest | | | 16,344 | |
Dividends from underlying affiliated funds | | | 5,080 | |
Total investment income | | | $2,029,808 | |
| Expenses | | | | |
Management fee | | | $2,066,237 | |
Distribution and service fees | | | 991,641 | |
Shareholder servicing costs | | | 473,683 | |
Administrative services fee | | | 44,233 | |
Independent Trustees’ compensation | | | 16,261 | |
Custodian fee | | | 38,498 | |
Shareholder communications | | | 40,920 | |
Audit and tax fees | | | 51,234 | |
Legal fees | | | 1,913 | |
Dividend and interest expense on securities sold short | | | 102,700 | |
Miscellaneous | | | 135,339 | |
Total expenses | | | $3,962,659 | |
Fees paid indirectly | | | (40 | ) |
Reduction of expenses by investment adviser and distributor | | | (19,259 | ) |
Net expenses | | | $3,943,360 | |
Net investment loss | | | $(1,913,552 | ) |
| Realized and unrealized gain (loss) on investments and foreign currency | |
| Realized gain (loss) (identified cost basis) | | | | |
Investments | | | $18,958,360 | |
Written options | | | 928,330 | |
Securities sold short | | | (1,661,381 | ) |
Foreign currency | | | (66 | ) |
Net realized gain (loss) on investments and foreign currency | | | $18,225,243 | |
| Change in unrealized appreciation (depreciation) | | | | |
Investments | | | $45,322,824 | |
Written options | | | (17,470 | ) |
Securities sold short | | | (311,636 | ) |
Translation of assets and liabilities in foreign currencies | | | 62 | |
Net unrealized gain (loss) on investments and foreign currency translation | | | $44,993,780 | |
Net realized and unrealized gain (loss) on investments and foreign currency | | | $63,219,023 | |
Change in net assets from operations | | | $61,305,471 | |
See Notes to Financial Statements
17
Financial Statements
STATEMENTS OF CHANGES IN NET ASSETS
These statements describe the increases and/or decreases in net assets resulting from operations, any distributions, and any shareholder transactions.
| | | | | | | | |
| | | Years ended 8/31 | |
| | | 2014 | | | 2013 | |
| Change in net assets | | | | | | |
| From operations | | | | | | | | |
Net investment loss | | | $(1,913,552 | ) | | | $(1,873,475 | ) |
Net realized gain (loss) on investments and foreign currency | | | 18,225,243 | | | | 1,306,279 | |
Net unrealized gain (loss) on investments and foreign currency translation | | | 44,993,780 | | | | 32,996,324 | |
Change in net assets from operations | | | $61,305,471 | | | | $32,429,128 | |
Change in net assets from fund share transactions | | | $(1,601,290 | ) | | | $(26,253,234 | ) |
Total change in net assets | | | $59,704,181 | | | | $6,175,894 | |
| Net assets | | | | | | | | |
At beginning of period | | | 237,476,585 | | | | 231,300,691 | |
At end of period (including accumulated net investment loss of $1,142 and $1,333,488, respectively) | | | $297,180,766 | | | | $237,476,585 | |
See Notes to Financial Statements
18
Financial Statements
FINANCIAL HIGHLIGHTS
The financial highlights table is intended to help you understand the fund’s financial performance for the past 5 years (or life of a particular share class, if shorter). Certain information reflects financial results for a single fund share. The total returns in the table represent the rate by which an investor would have earned (or lost) on an investment in the fund share class (assuming reinvestment of all distributions) held for the entire period.
| | | | | | | | | | | | | | | | | | | | |
| Class A | | Years ended 8/31 | |
| | | 2014 | | | 2013 | | | 2012 | | | 2011 | | | 2010 | |
Net asset value, beginning of period | | | $19.41 | | | | $16.80 | | | | $14.50 | | | | $11.80 | | | | $11.06 | |
| Income (loss) from investment operations | | | | | | | | | | | | | | | | | | | | |
Net investment loss (d) | | | $(0.13 | ) | | | $(0.12 | ) | | | $(0.17 | ) | | | $(0.09 | ) | | | $(0.11 | ) |
Net realized and unrealized gain (loss)
on investments and foreign currency | | | 5.19 | | | | 2.73 | | | | 2.47 | | | | 2.79 | | | | 0.85 | |
Total from investment operations | | | $5.06 | | | | $2.61 | | | | $2.30 | | | | $2.70 | | | | $0.74 | |
Net asset value, end of period (x) | | | $24.47 | | | | $19.41 | | | | $16.80 | | | | $14.50 | | | | $11.80 | |
Total return (%) (r)(s)(t)(x) | | | 26.07 | | | | 15.54 | | | | 15.86 | | | | 22.88 | | | | 6.69 | |
Ratios (%) (to average net assets)
and Supplemental data: | | | | | | | | | | | | | | | | | | | | |
Expenses before expense reductions (f) | | | 1.33 | | | | 1.55 | | | | 1.45 | | | | 1.52 | | | | 1.63 | |
Expenses after expense reductions (f) | | | 1.32 | | | | 1.54 | | | | 1.45 | | | | 1.52 | | | | 1.57 | |
Net investment loss | | | (0.58 | ) | | | (0.70 | ) | | | (1.08 | ) | | | (0.61 | ) | | | (0.91 | ) |
Portfolio turnover | | | 38 | | | | 54 | | | | 68 | | | | 106 | | | | 182 | |
Net assets at end of period (000 omitted) | | | $171,020 | | | | $141,147 | | | | $143,595 | | | | $96,785 | | | | $82,976 | |
| Supplemental Ratios (%): | | | | | | | | | | | | | | | | | | | | |
Ratio of expenses to average net assets after
expense reductions excluding short sale
dividend and interest expense (f) | | | 1.28 | | | | 1.36 | | | | 1.38 | | | | 1.43 | | | | 1.53 | |
See Notes to Financial Statements
19
Financial Highlights – continued
| | | | | | | | | | | | | | | | | | | | |
| Class B | | Years ended 8/31 | |
| | | 2014 | | | 2013 | | | 2012 | | | 2011 | | | 2010 | |
Net asset value, beginning of period | | | $17.75 | | | | $15.48 | | | | $13.45 | | | | $11.03 | | | | $10.42 | |
| Income (loss) from investment operations | | | | | | | | | | | | | | | | | | | | |
Net investment loss (d) | | | $(0.27 | ) | | | $(0.23 | ) | | | $(0.27 | ) | | | $(0.18 | ) | | | $(0.19 | ) |
Net realized and unrealized gain (loss)
on investments and foreign currency | | | 4.72 | | | | 2.50 | | | | 2.30 | | | | 2.60 | | | | 0.80 | |
Total from investment operations | | | $4.45 | | | | $2.27 | | | | $2.03 | | | | $2.42 | | | | $0.61 | |
Net asset value, end of period (x) | | | $22.20 | | | | $17.75 | | | | $15.48 | | | | $13.45 | | | | $11.03 | |
Total return (%) (r)(s)(t)(x) | | | 25.07 | | | | 14.66 | | | | 15.09 | | | | 21.94 | | | | 5.85 | |
Ratios (%) (to average net assets)
and Supplemental data: | | | | | | | | | | | | | | | | | | | | |
Expenses before expense reductions (f) | | | 2.08 | | | | 2.30 | | | | 2.20 | | | | 2.27 | | | | 2.37 | |
Expenses after expense reductions (f) | | | 2.07 | | | | 2.29 | | | | 2.20 | | | | 2.27 | | | | 2.32 | |
Net investment loss | | | (1.34 | ) | | | (1.44 | ) | | | (1.83 | ) | | | (1.35 | ) | | | (1.66 | ) |
Portfolio turnover | | | 38 | | | | 54 | | | | 68 | | | | 106 | | | | 182 | |
Net assets at end of period (000 omitted) | | | $16,190 | | | | $13,009 | | | | $12,911 | | | | $11,365 | | | | $11,849 | |
| Supplemental Ratios (%): | | | | | | | | | | | | | | | | | | | | |
Ratio of expenses to average net assets after
expense reductions excluding short sale
dividend and interest expense (f) | | | 2.03 | | | | 2.12 | | | | 2.13 | | | | 2.18 | | | | 2.27 | |
| |
| Class C | | Years ended 8/31 | |
| | | 2014 | | | 2013 | | | 2012 | | | 2011 | | | 2010 | |
Net asset value, beginning of period | | | $17.71 | | | | $15.45 | | | | $13.43 | | | | $11.01 | | | | $10.40 | |
| Income (loss) from investment operations | | | | | | | | | | | | | | | | | | | | |
Net investment loss (d) | | | $(0.28 | ) | | | $(0.24 | ) | | | $(0.27 | ) | | | $(0.19 | ) | | | $(0.19 | ) |
Net realized and unrealized gain (loss)
on investments and foreign currency | | | 4.73 | | | | 2.50 | | | | 2.29 | | | | 2.61 | | | | 0.80 | |
Total from investment operations | | | $4.45 | | | | $2.26 | | | | $2.02 | | | | $2.42 | | | | $0.61 | |
Net asset value, end of period (x) | | | $22.16 | | | | $17.71 | | | | $15.45 | | | | $13.43 | | | | $11.01 | |
Total return (%) (r)(s)(t)(x) | | | 25.13 | | | | 14.63 | | | | 15.04 | | | | 21.98 | | | | 5.87 | |
Ratios (%) (to average net assets)
and Supplemental data: | | | | | | | | | | | | | | | | | | | | |
Expenses before expense reductions (f) | | | 2.07 | | | | 2.30 | | | | 2.20 | | | | 2.27 | | | | 2.38 | |
Expenses after expense reductions (f) | | | 2.07 | | | | 2.30 | | | | 2.20 | | | | 2.27 | | | | 2.33 | |
Net investment loss | | | (1.34 | ) | | | (1.45 | ) | | | (1.83 | ) | | | (1.37 | ) | | | (1.66 | ) |
Portfolio turnover | | | 38 | | | | 54 | | | | 68 | | | | 106 | | | | 182 | |
Net assets at end of period (000 omitted) | | | $35,998 | | | | $25,026 | | | | $23,940 | | | | $19,251 | | | | $16,858 | |
| Supplemental Ratios (%): | | | | | | | | | | | | | | | | | | | | |
Ratio of expenses to average net assets after
expense reductions excluding short sale
dividend and interest expense (f) | | | 2.03 | | | | 2.12 | | | | 2.13 | | | | 2.18 | | | | 2.28 | |
See Notes to Financial Statements
20
Financial Highlights – continued
| | | | | | | | | | | | | | | | | | | | |
| Class I | | Years ended 8/31 | |
| | | 2014 | | | 2013 | | | 2012 | | | 2011 | | | 2010 | |
Net asset value, beginning of period | | | $20.33 | | | | $17.56 | | | | $15.11 | | | | $12.26 | | | | $11.47 | |
| Income (loss) from investment operations | | | | | | | | | | | | | | | | | | | | |
Net investment loss (d) | | | $(0.08 | ) | | | $(0.08 | ) | | | $(0.14 | ) | | | $(0.06 | ) | | | $(0.08 | ) |
Net realized and unrealized gain (loss)
on investments and foreign currency | | | 5.44 | | | | 2.85 | | | | 2.59 | | | | 2.91 | | | | 0.87 | |
Total from investment operations | | | $5.36 | | | | $2.77 | | | | $2.45 | | | | $2.85 | | | | $0.79 | |
Net asset value, end of period (x) | | | $25.69 | | | | $20.33 | | | | $17.56 | | | | $15.11 | | | | $12.26 | |
Total return (%) (r)(s)(x) | | | 26.36 | | | | 15.77 | | | | 16.21 | | | | 23.25 | | | | 6.89 | |
Ratios (%) (to average net assets)
and Supplemental data: | | | | | | | | | | | | | | | | | | | | |
Expenses before expense reductions (f) | | | 1.08 | | | | 1.30 | | | | 1.20 | | | | 1.27 | | | | 1.38 | |
Expenses after expense reductions (f) | | | 1.07 | | | | 1.30 | | | | 1.20 | | | | 1.27 | | | | 1.33 | |
Net investment loss | | | (0.35 | ) | | | (0.45 | ) | | | (0.83 | ) | | | (0.38 | ) | | | (0.66 | ) |
Portfolio turnover | | | 38 | | | | 54 | | | | 68 | | | | 106 | | | | 182 | |
Net assets at end of period (000 omitted) | | | $40,359 | | | | $30,615 | | | | $21,898 | | | | $10,833 | | | | $8,873 | |
| Supplemental Ratios (%): | | | | | | | | | | | | | | | | | | | | |
Ratio of expenses to average net assets after
expense reductions excluding short sale
dividend and interest expense (f) | | | 1.04 | | | | 1.12 | | | | 1.12 | | | | 1.18 | | | | 1.29 | |
| |
| Class R1 | | Years ended 8/31 | |
| | | 2014 | | | 2013 | | | 2012 | | | 2011 | | | 2010 | |
Net asset value, beginning of period | | | $17.68 | | | | $15.42 | | | | $13.41 | | | | $10.99 | | | | $10.39 | |
| Income (loss) from investment operations | | | | | | | | | | | | | | | | | | | | |
Net investment loss (d) | | | $(0.27 | ) | | | $(0.23 | ) | | | $(0.26 | ) | | | $(0.19 | ) | | | $(0.19 | ) |
Net realized and unrealized gain (loss)
on investments and foreign currency | | | 4.71 | | | | 2.49 | | | | 2.27 | | | | 2.61 | | | | 0.79 | |
Total from investment operations | | | $4.44 | | | | $2.26 | | | | $2.01 | | | | $2.42 | | | | $0.60 | |
Net asset value, end of period (x) | | | $22.12 | | | | $17.68 | | | | $15.42 | | | | $13.41 | | | | $10.99 | |
Total return (%) (r)(s)(x) | | | 25.11 | | | | 14.66 | | | | 14.99 | | | | 22.02 | | | | 5.77 | |
Ratios (%) (to average net assets)
and Supplemental data: | | | | | | | | | | | | | | | | | | | | |
Expenses before expense reductions (f) | | | 2.08 | | | | 2.30 | | | | 2.21 | | | | 2.27 | | | | 2.38 | |
Expenses after expense reductions (f) | | | 2.07 | | | | 2.30 | | | | 2.21 | | | | 2.27 | | | | 2.32 | |
Net investment loss | | | (1.34 | ) | | | (1.45 | ) | | | (1.82 | ) | | | (1.39 | ) | | | (1.66 | ) |
Portfolio turnover | | | 38 | | | | 54 | | | | 68 | | | | 106 | | | | 182 | |
Net assets at end of period (000 omitted) | | | $2,033 | | | | $1,542 | | | | $1,666 | | | | $1,831 | | | | $1,421 | |
| Supplemental Ratios (%): | | | | | | | | | | | | | | | | | | | | |
Ratio of expenses to average net assets after
expense reductions excluding short sale
dividend and interest expense (f) | | | 2.04 | | | | 2.12 | | | | 2.13 | | | | 2.18 | | | | 2.28 | |
See Notes to Financial Statements
21
Financial Highlights – continued
| | | | | | | | | | | | | | | | | | | | |
| Class R2 | | Years ended 8/31 | |
| | | 2014 | | | 2013 | | | 2012 | | | 2011 | | | 2010 | |
Net asset value, beginning of period | | | $18.85 | | | | $16.36 | | | | $14.15 | | | | $11.54 | | | | $10.85 | |
| Income (loss) from investment operations | | | | | | | | | | | | | | | | | | | | |
Net investment loss (d) | | | $(0.18 | ) | | | $(0.16 | ) | | | $(0.20 | ) | | | $(0.12 | ) | | | $(0.14 | ) |
Net realized and unrealized gain (loss)
on investments and foreign currency | | | 5.03 | | | | 2.65 | | | | 2.41 | | | | 2.73 | | | | 0.83 | |
Total from investment operations | | | $4.85 | | | | $2.49 | | | | $2.21 | | | | $2.61 | | | | $0.69 | |
Net asset value, end of period (x) | | | $23.70 | | | | $18.85 | | | | $16.36 | | | | $14.15 | | | | $11.54 | |
Total return (%) (r)(s)(x) | | | 25.73 | | | | 15.22 | | | | 15.62 | | | | 22.62 | | | | 6.36 | |
Ratios (%) (to average net assets)
and Supplemental data: | | | | | | | | | | | | | | | | | | | | |
Expenses before expense reductions (f) | | | 1.58 | | | | 1.79 | | | | 1.70 | | | | 1.77 | | | | 1.87 | |
Expenses after expense reductions (f) | | | 1.58 | | | | 1.79 | | | | 1.70 | | | | 1.77 | | | | 1.82 | |
Net investment loss | | | (0.83 | ) | | | (0.94 | ) | | | (1.33 | ) | | | (0.87 | ) | | | (1.16 | ) |
Portfolio turnover | | | 38 | | | | 54 | | | | 68 | | | | 106 | | | | 182 | |
Net assets at end of period (000 omitted) | | | $17,123 | | | | $15,890 | | | | $17,748 | | | | $15,911 | | | | $13,501 | |
| Supplemental Ratios (%): | | | | | | | | | | | | | | | | | | | | |
Ratio of expenses to average net assets after
expense reductions excluding short sale
dividend and interest expense (f) | | | 1.54 | | | | 1.62 | | | | 1.63 | | | | 1.68 | | | | 1.78 | |
| |
| Class R3 | | Years ended 8/31 | |
| | | 2014 | | | 2013 | | | 2012 | | | 2011 | | | 2010 | |
Net asset value, beginning of period | | | $19.41 | | | | $16.80 | | | | $14.49 | | | | $11.79 | | | | $11.06 | |
| Income (loss) from investment operations | | | | | | | | | | | | | | | | | | | | |
Net investment loss (d) | | | $(0.13 | ) | | | $(0.12 | ) | | | $(0.17 | ) | | | $(0.09 | ) | | | $(0.11 | ) |
Net realized and unrealized gain (loss)
on investments and foreign currency | | | 5.18 | | | | 2.73 | | | | 2.48 | | | | 2.79 | | | | 0.84 | |
Total from investment operations | | | $5.05 | | | | $2.61 | | | | $2.31 | | | | $2.70 | | | | $0.73 | |
Net asset value, end of period (x) | | | $24.46 | | | | $19.41 | | | | $16.80 | | | | $14.49 | | | | $11.79 | |
Total return (%) (r)(s)(x) | | | 26.02 | | | | 15.54 | | | | 15.94 | | | | 22.90 | | | | 6.60 | |
Ratios (%) (to average net assets)
and Supplemental data: | | | | | | | | | | | | | | | | | | | | |
Expenses before expense reductions (f) | | | 1.33 | | | | 1.55 | | | | 1.45 | | | | 1.52 | | | | 1.62 | |
Expenses after expense reductions (f) | | | 1.32 | | | | 1.55 | | | | 1.45 | | | | 1.52 | | | | 1.58 | |
Net investment loss | | | (0.59 | ) | | | (0.70 | ) | | | (1.08 | ) | | | (0.63 | ) | | | (0.90 | ) |
Portfolio turnover | | | 38 | | | | 54 | | | | 68 | | | | 106 | | | | 182 | |
Net assets at end of period (000 omitted) | | | $10,626 | | | | $8,863 | | | | $8,720 | | | | $5,949 | | | | $4,589 | |
| Supplemental Ratios (%): | | | | | | | | | | | | | | | | | | | | |
Ratio of expenses to average net assets after
expense reductions excluding short sale
dividend and interest expense (f) | | | 1.29 | | | | 1.37 | | | | 1.38 | | | | 1.43 | | | | 1.53 | |
See Notes to Financial Statements
22
Financial Highlights – continued
| | | | | | | | | | | | | | | | | | | | |
| Class R4 | | Years ended 8/31 | |
| | | 2014 | | | 2013 | | | 2012 | | | 2011 | | | 2010 | |
Net asset value, beginning of period | | | $19.86 | | | | $17.15 | | | | $14.76 | | | | $11.98 | | | | $11.21 | |
| Income (loss) from investment operations | | | | | | | | | | | | | | | | | | | | |
Net investment loss (d) | | | $(0.08 | ) | | | $(0.08 | ) | | | $(0.14 | ) | | | $(0.05 | ) | | | $(0.08 | ) |
Net realized and unrealized gain (loss)
on investments and foreign currency | | | 5.32 | | | | 2.79 | | | | 2.53 | | | | 2.83 | | | | 0.85 | |
Total from investment operations | | | $5.24 | | | | $2.71 | | | | $2.39 | | | | $2.78 | | | | $0.77 | |
Net asset value, end of period (x) | | | $25.10 | | | | $19.86 | | | | $17.15 | | | | $14.76 | | | | $11.98 | |
Total return (%) (r)(s)(x) | | | 26.38 | | | | 15.80 | | | | 16.19 | | | | 23.21 | | | | 6.87 | |
Ratios (%) (to average net assets)
and Supplemental data: | | | | | | | | | | | | | | | | | | | | |
Expenses before expense reductions (f) | | | 1.07 | | | | 1.29 | | | | 1.20 | | | | 1.26 | | | | 1.39 | |
Expenses after expense reductions (f) | | | 1.07 | | | | 1.29 | | | | 1.20 | | | | 1.26 | | | | 1.36 | |
Net investment loss | | | (0.34 | ) | | | (0.45 | ) | | | (0.84 | ) | | | (0.32 | ) | | | (0.65 | ) |
Portfolio turnover | | | 38 | | | | 54 | | | | 68 | | | | 106 | | | | 182 | |
Net assets at end of period (000 omitted) | | | $1,403 | | | | $1,269 | | | | $823 | | | | $368 | | | | $445 | |
| Supplemental Ratios (%): | | | | | | | | | | | | | | | | | | | | |
Ratio of expenses to average net assets after
expense reductions excluding short sale
dividend and interest expense (f) | | | 1.04 | | | | 1.12 | | | | 1.12 | | | | 1.17 | | | | 1.31 | |
| | | | | | | | |
| Class R5 | | Years ended 8/31 | |
| | | 2014 | | | 2013 (i) | |
Net asset value, beginning of period | | | $20.34 | | | | $17.68 | |
| Income (loss) from investment operations | | | | | | | | |
Net investment loss (d) | | | $(0.07 | ) | | | $(0.04 | ) |
Net realized and unrealized gain (loss) on investments and foreign currency | | | 5.46 | | | | 2.70 | |
Total from investment operations | | | $5.39 | | | | $2.66 | |
Net asset value, end of period (x) | | | $25.73 | | | | $20.34 | |
Total return (%) (r)(s)(x) | | | 26.50 | | | | 15.05 | (n) |
Ratios (%) (to average net assets)
and Supplemental data: | | | | | | | | |
Expenses before expense reductions (f) | | | 0.97 | | | | 1.13 | (a) |
Expenses after expense reductions (f) | | | 0.96 | | | | 1.13 | (a) |
Net investment loss | | | (0.28 | ) | | | (0.35 | )(a) |
Portfolio turnover | | | 38 | | | | 54 | (n) |
Net assets at end of period (000 omitted) | | | $2,429 | | | | $116 | |
| Supplemental Ratios (%): | | | | | | | | |
Ratio of expenses to average net assets after expense reductions
excluding short sale dividend and interest expense (f) | | | 0.95 | | | | 1.01 | (a) |
See Notes to Financial Statements
23
Financial Highlights – continued
| (d) | Per share data is based on average shares outstanding. |
| (f) | Ratios do not reflect reductions from fees paid indirectly, if applicable. |
| (i) | For the period from the class’s inception, January 2, 2013, through the stated period end. |
| (r) | Certain expenses have been reduced without which performance would have been lower. |
| (s) | From time to time the fund may receive proceeds from litigation settlements, without which performance would be lower. |
| (t) | Total returns do not include any applicable sales charges. |
| (x) | The net asset values per share and total returns have been calculated on net assets which include adjustments made in accordance with U.S. generally accepted accounting principles required at period end for financial reporting purposes. |
See Notes to Financial Statements
24
NOTES TO FINANCIAL STATEMENTS
(1) Business and Organization
MFS Technology Fund (the fund) is a non-diversified series of MFS Series Trust I (the trust). The trust is organized as a Massachusetts business trust and is registered under the Investment Company Act of 1940, as amended, as an open-end management investment company.
The fund is an investment company and accordingly follows the investment company accounting and reporting guidance of the Financial Accounting Standards Board (FASB) Accounting Standards Codification Topic 946 Financial Services – Investment Companies.
(2) Significant Accounting Policies
General – The preparation of financial statements in conformity with U.S. generally accepted accounting principles requires management to make estimates and assumptions that affect the reported amounts of assets and liabilities, and disclosure of contingent assets and liabilities at the date of the financial statements and the reported amounts of increases and decreases in net assets from operations during the reporting period. Actual results could differ from those estimates. In the preparation of these financial statements, management has evaluated subsequent events occurring after the date of the fund’s Statement of Assets and Liabilities through the date that the financial statements were issued. The fund invests primarily in securities of issuers in the technology industry. Issuers in a single industry can react similarly to market, economic, political and regulatory conditions and developments.
In June 2014, FASB issued Accounting Standards Update 2014-11, Transfers and Servicing (Topic 860) – Repurchase-to-Maturity Transactions, Repurchase Financings, and Disclosures (“ASU 2014-11”). ASU 2014-11 changes the accounting for repurchase-to-maturity transactions (i.e., repurchase agreements that settle at the same time as the maturity of the transferred financial asset) and enhances the required disclosures for repurchase agreements and other similar transactions. Although still evaluating the potential impacts of ASU 2014-11 to the fund, management expects that the impact of the fund’s adoption will be limited to additional financial statement disclosures which would first be effective for interim reporting periods beginning after March 15, 2015.
Balance Sheet Offsetting – The fund’s accounting policy with respect to balance sheet offsetting is that, absent an event of default by the counterparty or a termination of the agreement, the International Swaps and Derivatives Association (ISDA) Master Agreement does not result in an offset of reported amounts of financial assets and financial liabilities in the Statement of Assets and Liabilities across transactions between the fund and the applicable counterparty. The fund’s right to setoff may be restricted or prohibited by the bankruptcy or insolvency laws of the particular jurisdiction to which a specific master netting agreement counterparty is subject. Balance sheet offsetting disclosures, to the extent applicable to the fund, have been included in the fund’s Significant Accounting Policies note under the captions for each of the fund’s in-scope financial instruments and transactions.
25
Notes to Financial Statements – continued
Investment Valuations – Equity securities, including restricted equity securities, are generally valued at the last sale or official closing price as provided by a third-party pricing service on the market or exchange on which they are primarily traded. Equity securities, for which there were no sales reported that day, are generally valued at the last quoted daily bid quotation as provided by a third-party pricing service on the market or exchange on which such securities are primarily traded. Equity securities held short, for which there were no sales reported for that day, are generally valued at the last quoted daily ask quotation as provided by a third-party pricing service on the market or exchange on which such securities are primarily traded. Short-term instruments with a maturity at issuance of 60 days or less generally are valued at amortized cost, which approximates market value. Exchange-traded options are generally valued at the last sale or official closing price as provided by a third-party pricing service on the exchange on which such options are primarily traded. Exchange-traded options for which there were no sales reported that day are generally valued at the last daily bid quotation as provided by a third-party pricing service on the exchange on which such options are primarily traded. Options not traded on an exchange are generally valued at a broker/dealer bid quotation. Foreign currency options are generally valued at valuations provided by a third-party pricing service. Open-end investment companies are generally valued at net asset value per share. Securities and other assets generally valued on the basis of information from a third-party pricing service may also be valued at a broker/dealer bid quotation. Values obtained from third-party pricing services can utilize both transaction data and market information such as yield, quality, coupon rate, maturity, type of issue, trading characteristics, and other market data. The values of foreign securities and other assets and liabilities expressed in foreign currencies are converted to U.S. dollars using the mean of bid and asked prices for rates provided by a third-party pricing service.
The Board of Trustees has delegated primary responsibility for determining or causing to be determined the value of the fund’s investments (including any fair valuation) to the adviser pursuant to valuation policies and procedures approved by the Board. If the adviser determines that reliable market quotations are not readily available, investments are valued at fair value as determined in good faith by the adviser in accordance with such procedures under the oversight of the Board of Trustees. Under the fund’s valuation policies and procedures, market quotations are not considered to be readily available for most types of debt instruments and floating rate loans and many types of derivatives. These investments are generally valued at fair value based on information from third-party pricing services. In addition, investments may be valued at fair value if the adviser determines that an investment’s value has been materially affected by events occurring after the close of the exchange or market on which the investment is principally traded (such as foreign exchange or market) and prior to the determination of the fund’s net asset value, or after the halting of trading of a specific security where trading does not resume prior to the close of the exchange or market on which the security is principally traded. Events that occur on a frequent basis after foreign markets close (such as developments in foreign markets and significant movements in the U.S. markets) and prior to the determination of the fund’s net asset value may be deemed to have a material effect on the value of securities traded in foreign markets. Accordingly, the fund’s foreign equity securities may often be valued at fair value. The
26
Notes to Financial Statements – continued
adviser generally relies on third-party pricing services or other information (such as the correlation with price movements of similar securities in the same or other markets; the type, cost and investment characteristics of the security; the business and financial condition of the issuer; and trading and other market data) to assist in determining whether to fair value and at what value to fair value an investment. The value of an investment for purposes of calculating the fund’s net asset value can differ depending on the source and method used to determine value. When fair valuation is used, the value of an investment used to determine the fund’s net asset value may differ from quoted or published prices for the same investment. There can be no assurance that the fund could obtain the fair value assigned to an investment if it were to sell the investment at the same time at which the fund determines its net asset value per share.
Various inputs are used in determining the value of the fund’s assets or liabilities. These inputs are categorized into three broad levels. In certain cases, the inputs used to measure fair value may fall into different levels of the fair value hierarchy. In such cases, an investment’s level within the fair value hierarchy is based on the lowest level of input that is significant to the fair value measurement. The fund’s assessment of the significance of a particular input to the fair value measurement in its entirety requires judgment, and considers factors specific to the investment. Level 1 includes unadjusted quoted prices in active markets for identical assets or liabilities. Level 2 includes other significant observable market-based inputs (including quoted prices for similar securities, interest rates, prepayment speed, and credit risk). Level 3 includes unobservable inputs, which may include the adviser’s own assumptions in determining the fair value of investments. Other financial instruments are derivative instruments not reflected in total investments, such as written options. The following is a summary of the levels used as of August 31, 2014 in valuing the fund’s assets or liabilities:
| | | | | | | | | | | | | | | | |
| Investments at Value | | Level 1 | | | Level 2 | | | Level 3 | | | Total | |
| Equity Securities | | | $287,151,261 | | | | $— | | | | $— | | | | $287,151,261 | |
| Mutual Funds | | | 11,853,901 | | | | — | | | | — | | | | 11,853,901 | |
| Total Investments | | | $299,005,162 | | | | $— | | | | $— | | | | $299,005,162 | |
| Short Sales | | | $(2,790,170 | ) | | | $— | | | | $— | | | | $(2,790,170 | ) |
| | | | |
| Other Financial Instruments | | | | | | | | | | | | |
| Written Options | | | $(24,699 | ) | | | $(7,720 | ) | | | $— | | | | $(32,419 | ) |
For further information regarding security characteristics, see the Portfolio of Investments.
Foreign Currency Translation – Purchases and sales of foreign investments, income, and expenses are converted into U.S. dollars based upon currency exchange rates prevailing on the respective dates of such transactions or on the reporting date for foreign denominated receivables and payables. Gains and losses attributable to foreign currency exchange rates on sales of securities are recorded for financial statement purposes as net realized gains and losses on investments. Gains and losses attributable to foreign exchange rate movements on receivables, payables, income and expenses are recorded for financial statement purposes as foreign currency transaction gains and losses. That portion of both realized and unrealized gains and losses on investments that results from fluctuations in foreign currency exchange rates is not separately disclosed.
27
Notes to Financial Statements – continued
Derivatives – The fund uses derivatives for different purposes, primarily to increase or decrease exposure to a particular market or segment of the market, or security, to increase or decrease interest rate or currency exposure, or as alternatives to direct investments. Derivatives are used for hedging or non-hedging purposes. While hedging can reduce or eliminate losses, it can also reduce or eliminate gains. When the fund uses derivatives as an investment to increase market exposure, or for hedging purposes, gains and losses from derivative instruments may be substantially greater than the derivative’s original cost.
The derivative instruments used by the fund were written options and purchased options. The fund’s period end derivatives, as presented in the Portfolio of Investments generally are indicative of the volume of its derivative activity during the period.
The following table presents, by major type of derivative contract, the fair value, on a gross basis, of the asset and liability components of derivatives held by the fund at August 31, 2014 as reported in the Statement of Assets and Liabilities:
| | | | | | | | | | |
| | | | | Fair Value (a) | |
| Risk | | Derivative Contracts | | Asset Derivatives | | | Liability Derivatives | |
| Equity | | Purchased Equity Options | | | $250,285 | | | | $— | |
| Equity | | Written Equity Options | | | — | | | | (32,419 | ) |
| (a) | The value of purchased options outstanding is included in total investments, at value, within the fund’s Statement of Assets and Liabilities. |
The following table presents, by major type of derivative contract, the realized gain (loss) on derivatives held by the fund for the year ended August 31, 2014 as reported in the Statement of Operations:
| | | | | | | | |
| Risk | | Investments
(Purchased
Options) | | | Written
Options | |
| Equity | | | $594,753 | | | | $928,330 | |
The following table presents, by major type of derivative contract, the change in unrealized appreciation (depreciation) on derivatives held by the fund for the year ended August 31, 2014 as reported in the Statement of Operations:
| | | | | | | | |
| Risk | | Investments
(Purchased
Options) | | | Written
Options | |
| Equity | | | $(286,690 | ) | | | $(17,470 | ) |
Derivative counterparty credit risk is managed through formal evaluation of the creditworthiness of all potential counterparties. On certain, but not all, over-the- counter derivatives, the fund attempts to reduce its exposure to counterparty credit risk whenever possible by entering into an ISDA Master Agreement on a bilateral basis with each of the counterparties with whom it undertakes a significant volume of transactions. The ISDA Master Agreement gives each party to the agreement the right to terminate all transactions traded under such agreement if there is a certain deterioration in the credit quality of the other party. Upon an event of default or a termination of the ISDA Master Agreement, the non-defaulting party has the right to close out all transactions traded under such agreement and to net amounts owed
28
Notes to Financial Statements – continued
under each transaction to one net amount payable by one party to the other. This right to close out and net payments across all transactions traded under the ISDA Master Agreement could result in a reduction of the fund’s credit risk to such counterparty equal to any amounts payable by the fund under the applicable transactions, if any. The fund’s right to setoff may be restricted or prohibited by the bankruptcy or insolvency laws of the particular jurisdiction to which a specific ISDA counterparty is subject.
Collateral and margin requirements differ by type of derivative. Margin requirements are set by the broker or clearing house for cleared derivatives (i.e., futures contracts, cleared swaps, and exchange-traded options) while collateral terms are contract specific for over-the-counter traded derivatives (i.e., forward foreign currency exchange contracts, uncleared swap agreements, and over-the-counter options). For derivatives traded under an ISDA Master Agreement, the collateral requirements are netted across all transactions traded under such agreement and one amount is posted from one party to the other to collateralize such obligations. Cash that has been segregated to cover the fund’s collateral or margin obligations under derivative contracts, if any, will be reported separately in the Statement of Assets and Liabilities as “Restricted cash” or “Deposits with brokers.” Securities pledged as collateral or margin for the same purpose, if any, are noted in the Portfolio of Investments.
Written Options – In exchange for a premium, the fund wrote call options on securities that it anticipated the price would decline and also wrote put options on securities that it anticipated the price would increase. At the time the option was written, the fund believed the premium received exceeded the potential loss that could result from adverse price changes in the options’ underlying securities. In a written option, the fund as the option writer grants the buyer the right to purchase from, or sell to, the fund a specified number of shares or units of a particular security, currency or index at a specified price within a specified period of time.
The premium received is initially recorded as a liability in the Statement of Assets and Liabilities. The option is subsequently marked-to-market daily with the difference between the premium received and the market value of the written option being recorded as unrealized appreciation or depreciation. When a written option expires, the fund realizes a gain equal to the amount of the premium received. The difference between the premium received and the amount paid on effecting a closing transaction is considered a realized gain or loss. When a written call option is exercised, the premium received is offset against the proceeds to determine the realized gain or loss. When a written put option is exercised, the premium reduces the cost basis of the security purchased by the fund.
At the initiation of the written option contract, for exchange traded options, the fund is required to deposit securities or cash as collateral with the custodian for the benefit of the broker. For over-the-counter options, the fund may post collateral subject to the terms of an ISDA Master Agreement as generally described above if the market value of the options contract moves against it. The fund, as writer of an option, may have no control over whether the underlying securities may be sold (call) or purchased (put) and, as a result, bears the market risk of an unfavorable change in the price of the securities underlying the written option. Losses from writing options can exceed the premium received and can exceed the potential loss from an ordinary buy and sell
29
Notes to Financial Statements – continued
transaction. Although the fund’s market risk may be significant, the maximum counterparty credit risk to the fund is equal to the market value of any collateral posted to the broker. For over-the-counter options, this risk is mitigated in cases where there is an ISDA Master Agreement between the fund and the counterparty providing for netting as described above.
The following table represents the written option activity in the fund during the year ended August 31, 2014:
| | | | | | | | |
| | | Number of
Contracts | | | Premiums
Received | |
| Outstanding, beginning of period | | | 5,582 | | | | $250,473 | |
| Options written | | | 41,076 | | | | 2,287,577 | |
| Options closed | | | (8,770 | ) | | | (782,931 | ) |
| Options exercised | | | (6,402 | ) | | | (329,495 | ) |
| Options expired | | | (30,550 | ) | | | (1,385,772 | ) |
| Outstanding, end of period | | | 936 | | | | $39,852 | |
Purchased Options – The fund purchased call and put options for a premium. Purchased call and put options entitle the holder to buy and sell a specified number of shares or units of a particular security, currency or index at a specified price at a specified date or within a specified period of time. Purchasing call options may hedge against an anticipated increase in the dollar cost of securities or currency to be acquired or increase the fund’s exposure to an underlying instrument. Purchasing put options may hedge against an anticipated decline in the value of portfolio securities or currency or decrease the fund’s exposure to an underlying instrument.
The premium paid is initially recorded as an investment in the Statement of Assets and Liabilities. That investment is subsequently marked-to-market daily with the difference between the premium paid and the market value of the purchased option being recorded as unrealized appreciation or depreciation. Premiums paid for purchased call and put options which have expired are treated as realized losses on investments in the Statement of Operations. Upon the exercise or closing of a purchased call option, the premium paid is added to the cost of the security or financial instrument purchased. Upon the exercise or closing of a purchased put option, the premium paid is offset against the proceeds on the sale of the underlying security or financial instrument in order to determine the realized gain or loss on investments.
Whether or not the option is exercised, the fund’s maximum risk of loss from purchasing an option is the amount of premium paid. All option contracts involve credit risk if the counterparty to the option contract fails to perform. For over-the-counter options, this risk is mitigated in cases where there is an ISDA Master Agreement between the fund and the counterparty providing for netting as described above and for posting of collateral by the counterparty to the fund to cover the fund’s exposure to the counterparty under such ISDA Master Agreement.
Short Sales – The fund entered into short sales whereby it sells a security it does not own in anticipation of a decline in the value of that security. The fund will realize a gain if the security price decreases and a loss if the security price increases between the date of the short sale and the date on which the fund replaces the borrowed security. Losses from short sales can exceed the proceeds of the security sold; and they can also exceed
30
Notes to Financial Statements – continued
the potential loss from an ordinary buy and sell transaction. The amount of any premium, dividends, or interest the fund may be required to pay in connection with a short sale will be recognized as a fund expense. During the year ended August 31, 2014, this expense amounted to $102,700. The fund segregates cash or marketable securities in an amount that, when combined with the amount of proceeds from the short sale deposited with the broker, at least equals the current market value of the security sold short.
Security Loans – Under its Securities Lending Agency Agreement with the fund, State Street Bank and Trust Company (“State Street”), as lending agent, loans the securities of the fund to certain qualified institutions (the “Borrowers”) approved by the fund. The loans are collateralized by cash and/or U.S. Treasury and federal agency obligations in an amount typically at least equal to the market value of the securities loaned. On loans collateralized by cash, the cash collateral is invested in a money market fund. The market value of the loaned securities is determined at the close of business of the fund and any additional required collateral is delivered to the fund on the next business day. State Street provides the fund with indemnification against Borrower default. In the event of Borrower default, State Street will for the benefit of the fund either purchase securities identical to those loaned or, when such purchase is commercially impracticable, pay the fund the market value of the loaned securities. In return, State Street assumes the fund’s rights to the related collateral. If the collateral value is less than the cost to purchase identical securities, State Street is responsible for the shortfall, but only to the extent that such shortfall is not due to a decline in collateral value resulting from collateral reinvestment for which the fund bears the risk of loss. At period end, the fund had investment securities on loan with a fair value of $170,271 and a related liability of $176,859 for cash collateral received on securities loaned, both of which are presented gross in the Statement of Assets and Liabilities. The collateral received on securities loaned exceeded the value of securities on loan at period end. The liability for cash collateral for securities loaned is carried at fair value, which is categorized as level 2 within the fair value hierarchy. A portion of the income generated upon investment of the collateral is remitted to the Borrowers, and the remainder is allocated between the fund and the lending agent. On loans collateralized by U.S. Treasury and/or federal agency obligations, a fee is received from the Borrower, and is allocated between the fund and the lending agent. Income from securities lending is included in “Interest” income in the Statement of Operations. The dividend and interest income earned on the securities loaned is accounted for in the same manner as other dividend and interest income.
Indemnifications – Under the fund’s organizational documents, its officers and Trustees may be indemnified against certain liabilities and expenses arising out of the performance of their duties to the fund. Additionally, in the normal course of business, the fund enters into agreements with service providers that may contain indemnification clauses. The fund’s maximum exposure under these agreements is unknown as this would involve future claims that may be made against the fund that have not yet occurred.
Investment Transactions and Income – Investment transactions are recorded on the trade date. Interest income is recorded on the accrual basis. Dividends received in cash are recorded on the ex-dividend date. Certain dividends from foreign securities will be
31
Notes to Financial Statements – continued
recorded when the fund is informed of the dividend if such information is obtained subsequent to the ex-dividend date. Dividend and interest payments received in additional securities are recorded on the ex-dividend or ex-interest date in an amount equal to the value of the security on such date.
The fund may receive proceeds from litigation settlements. Any proceeds received from litigation involving portfolio holdings are reflected in the Statement of Operations in realized gain/loss if the security has been disposed of by the fund or in unrealized gain/loss if the security is still held by the fund. Any other proceeds from litigation not related to portfolio holdings are reflected as other income in the Statement of Operations.
Fees Paid Indirectly – The fund’s custody fee may be reduced according to an arrangement that measures the value of cash deposited with the custodian by the fund. This amount, for the year ended August 31, 2014, is shown as a reduction of total expenses in the Statement of Operations.
Tax Matters and Distributions – The fund intends to qualify as a regulated investment company, as defined under Subchapter M of the Internal Revenue Code, and to distribute all of its taxable income, including realized capital gains. As a result, no provision for federal income tax is required. The fund’s federal tax returns, when filed, will remain subject to examination by the Internal Revenue Service for a three year period. Management has analyzed the fund’s tax positions taken on federal and state tax returns for all open tax years and does not believe that there are any uncertain tax positions that require recognition of a tax liability. Foreign taxes, if any, have been accrued by the fund in the accompanying financial statements in accordance with the applicable foreign tax law. Foreign income taxes may be withheld by certain countries in which the fund invests. Additionally, capital gains realized by the fund on securities issued in or by certain foreign countries may be subject to capital gains tax imposed by those countries.
Distributions to shareholders are recorded on the ex-dividend date. Income and capital gain distributions are determined in accordance with income tax regulations, which may differ from U.S. generally accepted accounting principles. Certain capital accounts in the financial statements are periodically adjusted for permanent differences in order to reflect their tax character. These adjustments have no impact on net assets or net asset value per share. Temporary differences which arise from recognizing certain items of income, expense, gain or loss in different periods for financial statement and tax purposes will reverse at some time in the future. Distributions in excess of net investment income or net realized gains are temporary overdistributions for financial statement purposes resulting from differences in the recognition or classification of income or distributions for financial statement and tax purposes.
Book/tax differences primarily relate to wash sale loss deferrals, straddle loss deferrals, and treating a portion of the proceeds from redemptions as a distribution for tax purposes.
The fund declared no distributions for the years ended August 31, 2014 and August 31, 2013.
32
Notes to Financial Statements – continued
The federal tax cost and the tax basis components of distributable earnings were as follows:
| | | | |
| As of 8/31/14 | | | |
| Cost of investments | | | $200,288,095 | |
| Gross appreciation | | | 99,735,940 | |
| Gross depreciation | | | (1,018,873 | ) |
| Net unrealized appreciation (depreciation) | | | $98,717,067 | |
| Undistributed ordinary income | | | 260,665 | |
| Undistributed long-term capital gain | | | 10,649,055 | |
| Other temporary differences | | | (2,033,887 | ) |
Multiple Classes of Shares of Beneficial Interest – The fund offers multiple classes of shares, which differ in their respective distribution and service fees. The fund’s income, realized and unrealized gain (loss), and common expenses are allocated to shareholders based on the daily net assets of each class. Dividends are declared separately for each class. Differences in per share dividend rates are generally due to differences in separate class expenses. Class B shares will convert to Class A shares approximately eight years after purchase.
(3) Transactions with Affiliates
Investment Adviser – The fund has an investment advisory agreement with MFS to provide overall investment management and related administrative services and facilities to the fund. The management fee is computed daily and paid monthly at the following annual rates:
| | | | |
| First $1 billion of average daily net assets | | | 0.75 | % |
| Average daily net assets in excess of $1 billion | | | 0.70 | % |
MFS has agreed in writing to reduce its management fee by a specified amount if certain MFS mutual fund assets exceed thresholds agreed to by MFS and the fund’s Board of Trustees. For the year ended August 31, 2014, this management fee reduction amounted to $9,257, which is included in the reduction of total expenses in the Statement of Operations. The management fee incurred for the year ended August 31, 2014 was equivalent to an annual effective rate of 0.75% of the fund’s average daily net assets.
Distributor – MFS Fund Distributors, Inc. (MFD), a wholly-owned subsidiary of MFS, as distributor, received $85,903 for the year ended August 31, 2014, as its portion of the initial sales charge on sales of Class A shares of the fund.
The Board of Trustees has adopted a distribution plan for certain share classes pursuant to Rule 12b-1 of the Investment Company Act of 1940.
The fund’s distribution plan provides that the fund will pay MFD for services provided by MFD and financial intermediaries in connection with the distribution and servicing of certain share classes. One component of the plan is a distribution fee paid to MFD and another component of the plan is a service fee paid to MFD. MFD may subsequently pay all, or a portion, of the distribution and/or service fees to financial intermediaries.
33
Notes to Financial Statements – continued
Distribution Plan Fee Table:
| | | | | | | | | | | | | | | | | | | | |
| | | Distribution
Fee Rate (d) | | | Service
Fee Rate (d) | | | Total
Distribution
Plan (d) | | | Annual
Effective
Rate (e) | | | Distribution
and Service
Fee | |
| Class A | | | — | | | | 0.25% | | | | 0.25% | | | | 0.24% | | | | $401,999 | |
| Class B | | | 0.75% | | | | 0.25% | | | | 1.00% | | | | 1.00% | | | | 148,693 | |
| Class C | | | 0.75% | | | | 0.25% | | | | 1.00% | | | | 1.00% | | | | 312,069 | |
| Class R1 | | | 0.75% | | | | 0.25% | | | | 1.00% | | | | 1.00% | | | | 18,993 | |
| Class R2 | | | 0.25% | | | | 0.25% | | | | 0.50% | | | | 0.50% | | | | 84,516 | |
| Class R3 | | | — | | | | 0.25% | | | | 0.25% | | | | 0.25% | | | | 25,371 | |
| Total Distribution and Service Fees | | | | $991,641 | |
| (d) | In accordance with the distribution plan for certain classes, the fund pays distribution and/or service fees equal to these annual percentage rates of each class’s average daily net assets. The distribution and service fee rates disclosed by class represent the current rates in effect at the end of the reporting period. Any rate changes, if applicable, are detailed below. |
| (e) | The annual effective rates represent actual fees incurred under the distribution plan for the year ended August 31, 2014 based on each class’s average daily net assets. MFD has voluntarily agreed to rebate a portion of each class’s 0.25% service fee except for accounts attributable to MFS or its affiliates’ seed money. For the year ended August 31, 2014, this rebate amounted to $9,003, $211, $294, and $78 for Class A, Class B, Class C, and R3, respectively, and is included in the reduction of total expenses in the Statement of Operations. |
Certain Class A shares are subject to a contingent deferred sales charge (CDSC) in the event of a shareholder redemption within 18 months of purchase for shares purchased on or after August 1, 2012, and within 24 months of purchase for shares purchased prior to August 1, 2012. Class C shares are subject to a CDSC in the event of a shareholder redemption within 12 months of purchase. Class B shares are subject to a CDSC in the event of a shareholder redemption within six years of purchase. All contingent deferred sales charges are paid to MFD and during the year ended August 31, 2014, were as follows:
| | | | |
| | | Amount | |
| Class A | | | $1,112 | |
| Class B | | | 19,670 | |
| Class C | | | 2,939 | |
Shareholder Servicing Agent – MFS Service Center, Inc. (MFSC), a wholly-owned subsidiary of MFS, receives a fee from the fund for its services as shareholder servicing agent calculated as a percentage of the average daily net assets of the fund as determined periodically under the supervision of the fund’s Board of Trustees. For the year ended August 31, 2014, the fee was $127,108, which equated to 0.0461% annually of the fund’s average daily net assets. MFSC also receives payment from the fund for out-of-pocket expenses, sub-accounting and other shareholder servicing costs which may be paid to affiliated and unaffiliated service providers. Class R5 shares do not incur sub-accounting fees. For the year ended August 31, 2014, these out-of-pocket expenses, sub-accounting and other shareholder servicing costs amounted to $346,575.
Administrator – MFS provides certain financial, legal, shareholder communications, compliance, and other administrative services to the fund. Under an administrative
34
Notes to Financial Statements – continued
services agreement, the fund partially reimburses MFS the costs incurred to provide these services. The fund is charged an annual fixed amount of $17,500 plus a fee based on average daily net assets. The administrative services fee incurred for the year ended August 31, 2014 was equivalent to an annual effective rate of 0.0160% of the fund’s average daily net assets.
Trustees’ and Officers’ Compensation – The fund pays compensation to independent Trustees in the form of a retainer, attendance fees, and additional compensation to Board and Committee chairpersons. The fund does not pay compensation directly to Trustees or officers of the fund who are also officers of the investment adviser, all of whom receive remuneration for their services to the fund from MFS. Certain officers and Trustees of the fund are officers or directors of MFS, MFD, and MFSC.
Prior to December 31, 2001, the fund had an unfunded defined benefit plan (“DB plan”) for independent Trustees. As of December 31, 2001, the Board took action to terminate the DB plan with respect to then-current and any future independent Trustees, such that the DB plan covers only certain of those former independent Trustees who retired on or before December 31, 2001. Effective January 1, 2002, accrued benefits under the DB plan for then-current independent Trustees who continued were credited to an unfunded retirement deferral plan (the “Retirement Deferral plan”), which was established for and exists solely with respect to these credited amounts, and is not available for other deferrals by these or other independent Trustees. Although the Retirement Deferral plan is unfunded, amounts deferred under the plan are periodically adjusted for investment experience as if they had been invested in shares of the fund. The DB plan resulted in a pension expense of $152 and the Retirement Deferral plan resulted in an expense of $6,959. Both amounts are included in independent Trustees’ compensation for the year ended August 31, 2014. The liability for deferred retirement benefits payable to certain independent Trustees under both plans amounted to $1,142 at August 31, 2014, and is included in “Payable for independent Trustees’ compensation” in the Statement of Assets and Liabilities.
Other – This fund and certain other funds managed by MFS (the funds) have entered into services agreements (the Agreements) which provide for payment of fees by the funds to Tarantino LLC and Griffin Compliance LLC in return for the provision of services of an Independent Chief Compliance Officer (ICCO) and Assistant ICCO, respectively, for the funds. The funds can terminate the Agreements with Tarantino LLC and Griffin Compliance LLC at any time under the terms of the Agreements. The ICCO is an officer of the funds and the sole member of Tarantino LLC. Prior to June 1, 2014, Robyn L. Griffin served as the Assistant ICCO and was an officer of the funds. Ms. Griffin is the sole member of Griffin Compliance LLC. Effective May 31, 2014, Ms. Griffin resigned as Assistant ICCO and the service agreement between the funds and Griffin Compliance LLC was terminated. For the year ended August 31, 2014, the aggregate fees paid by the fund to Tarantino LLC and Griffin Compliance LLC were $1,399 and are included in “Miscellaneous” expense in the Statement of Operations. MFS has agreed to reimburse the fund for a portion of the payments made by the fund in the amount of $416, which is included in the reduction of total expenses in the
35
Notes to Financial Statements – continued
Statement of Operations. Additionally, MFS has agreed to bear all expenses associated with office space, other administrative support, and supplies provided to the ICCO and Assistant ICCO.
The fund invests in the MFS Institutional Money Market Portfolio which is managed by MFS and seeks current income consistent with preservation of capital and liquidity. Income earned on this investment is included in “Dividends from underlying affiliated funds” in the Statement of Operations. This money market fund does not pay a management fee to MFS.
On December 31, 2012, MFS purchased 5,656 shares of Class R5 for an aggregate amount of $100,000. On September 11, 2013, MFS redeemed 13,238 shares of Class R4 for an aggregate amount of $274,821.
(4) Portfolio Securities
For the year ended August 31, 2014, purchases and sales of investments, other than purchased option transactions, short sales, and short-term obligations, aggregated $101,959,310 and $116,710,022, respectively.
(5) Shares of Beneficial Interest
The fund’s Declaration of Trust permits the Trustees to issue an unlimited number of full and fractional shares of beneficial interest. Transactions in fund shares were as follows:
| | | | | | | | | | | | | | | | |
| | | Year ended
8/31/14 | | | Year ended
8/31/13 (i) | |
| | | Shares | | | Amount | | | Shares | | | Amount | |
| Shares sold | | | | | | | | | | | | | | | | |
Class A | | | 1,925,678 | | | | $43,258,626 | | | | 1,998,801 | | | | $35,474,800 | |
Class B | | | 156,272 | | | | 3,221,334 | | | | 143,289 | | | | 2,310,258 | |
Class C | | | 437,949 | | | | 9,054,054 | | | | 296,811 | | | | 4,831,432 | |
Class I | | | 684,731 | | | | 16,296,362 | | | | 1,041,965 | | | | 18,680,506 | |
Class R1 | | | 58,654 | | | | 1,191,202 | | | | 38,814 | | | | 620,331 | |
Class R2 | | | 268,302 | | | | 5,825,941 | | | | 270,131 | | | | 4,615,415 | |
Class R3 | | | 185,343 | | | | 4,130,801 | | | | 163,093 | | | | 2,927,544 | |
Class R4 | | | 36,448 | | | | 830,516 | | | | 35,406 | | | | 647,688 | |
Class R5 | | | 97,026 | | | | 2,314,761 | | | | 5,711 | | | | 101,001 | |
| | | 3,850,403 | | | | $86,123,597 | | | | 3,994,021 | | | | $70,208,975 | |
| | | | |
| Shares reacquired | | | | | | | | | | | | | | | | |
Class A | | | (2,207,242 | ) | | | $(49,633,349 | ) | | | (3,272,672 | ) | | | $(56,758,621 | ) |
Class B | | | (160,079 | ) | | | (3,283,048 | ) | | | (244,390 | ) | | | (3,969,475 | ) |
Class C | | | (226,224 | ) | | | (4,601,607 | ) | | | (433,533 | ) | | | (7,011,725 | ) |
Class I | | | (619,451 | ) | | | (14,855,590 | ) | | | (783,374 | ) | | | (14,730,202 | ) |
Class R1 | | | (53,964 | ) | | | (1,115,740 | ) | | | (59,602 | ) | | | (962,229 | ) |
Class R2 | | | (388,747 | ) | | | (8,456,797 | ) | | | (512,114 | ) | | | (8,690,192 | ) |
Class R3 | | | (207,625 | ) | | | (4,585,001 | ) | | | (225,398 | ) | | | (3,998,155 | ) |
Class R4 | | | (44,430 | ) | | | (988,142 | ) | | | (19,529 | ) | | | (341,610 | ) |
Class R5 | | | (8,330 | ) | | | (205,613 | ) | | | — | | | | — | |
| | | (3,916,092 | ) | | | $(87,724,887 | ) | | | (5,550,612 | ) | | | $(96,462,209 | ) |
36
Notes to Financial Statements – continued
| | | | | | | | | | | | | | | | |
| | | Year ended
8/31/14 | | | Year ended
8/31/13 (i) | |
| | | Shares | | | Amount | | | Shares | | | Amount | |
| Net change | | | | | | | | | | | | | | | | |
Class A | | | (281,564 | ) | | | $(6,374,723 | ) | | | (1,273,871 | ) | | | $(21,283,821 | ) |
Class B | | | (3,807 | ) | | | (61,714 | ) | | | (101,101 | ) | | | (1,659,217 | ) |
Class C | | | 211,725 | | | | 4,452,447 | | | | (136,722 | ) | | | (2,180,293 | ) |
Class I | | | 65,280 | | | | 1,440,772 | | | | 258,591 | | | | 3,950,304 | |
Class R1 | | | 4,690 | | | | 75,462 | | | | (20,788 | ) | | | (341,898 | ) |
Class R2 | | | (120,445 | ) | | | (2,630,856 | ) | | | (241,983 | ) | | | (4,074,777 | ) |
Class R3 | | | (22,282 | ) | | | (454,200 | ) | | | (62,305 | ) | | | (1,070,611 | ) |
Class R4 | | | (7,982 | ) | | | (157,626 | ) | | | 15,877 | | | | 306,078 | |
Class R5 | | | 88,696 | | | | 2,109,148 | | | | 5,711 | | | | 101,001 | |
| | | (65,689 | ) | | | $(1,601,290 | ) | | | (1,556,591 | ) | | | $(26,253,234 | ) |
| (i) | For Class R5, the period is from inception, January 2, 2013, through the stated period end. |
(6) Line of Credit
The fund and certain other funds managed by MFS participate in a $1.1 billion unsecured committed line of credit, subject to a $1 billion sublimit, provided by a syndication of banks under a credit agreement. Borrowings may be made for temporary financing needs. Interest is charged to each fund, based on its borrowings, generally at a rate equal to the higher of the Federal Reserve funds rate or one month LIBOR plus an agreed upon spread. A commitment fee, based on the average daily, unused portion of the committed line of credit, is allocated among the participating funds at the end of each calendar quarter. In addition, the fund and other funds managed by MFS have established unsecured uncommitted borrowing arrangements with certain banks for temporary financing needs. Interest is charged to each fund, based on its borrowings, at a rate equal to the Federal Reserve funds rate plus an agreed upon spread. For the year ended August 31, 2014, the fund’s commitment fee and interest expense were $1,083 and $0, respectively, and are included in “Miscellaneous” expense in the Statement of Operations.
(7) Transactions in Underlying Affiliated Funds-Affiliated Issuers
An affiliated issuer may be considered one in which the fund owns 5% or more of the outstanding voting securities, or a company which is under common control. For the purposes of this report, the fund assumes the following to be an affiliated issuer:
| | | | | | | | | | | | | | | | |
Underlying Affiliated
Fund | | Beginning
Shares/Par
Amount | | | Acquisitions
Shares/Par
Amount | | | Dispositions
Shares/Par
Amount | | | Ending
Shares/Par
Amount | |
| MFS Institutional Money Market Portfolio | | | 5,062,331 | | | | 89,198,790 | | | | (82,584,079 | ) | | | 11,677,042 | |
| | | | |
Underlying Affiliated
Fund | | Realized
Gain (Loss) | | | Capital Gain
Distributions | | | Dividend
Income | | | Ending
Value | |
| MFS Institutional Money Market Portfolio | | | $— | | | | $— | | | | $5,080 | | | | $11,677,042 | |
37
REPORT OF INDEPENDENT REGISTERED PUBLIC ACCOUNTING FIRM
To the Board of Trustees of MFS Series Trust I and Shareholders of MFS Technology Fund:
We have audited the accompanying statement of assets and liabilities of MFS Technology Fund (the Fund) (one of the series constituting MFS Series Trust I), including the portfolio of investments, as of August 31, 2014, and the related statement of operations for the year then ended, the statements of changes in net assets for each of the two years in the period then ended, and the financial highlights for each of the periods indicated therein. These financial statements and financial highlights are the responsibility of the Fund’s management. Our responsibility is to express an opinion on these financial statements and financial highlights based on our audits.
We conducted our audits in accordance with the standards of the Public Company Accounting Oversight Board (United States). Those standards require that we plan and perform the audit to obtain reasonable assurance about whether the financial statements and financial highlights are free of material misstatement. We were not engaged to perform an audit of the Fund’s internal control over financial reporting. Our audits included consideration of internal control over financial reporting as a basis for designing audit procedures that are appropriate in the circumstances, but not for the purpose of expressing an opinion on the effectiveness of the Fund’s internal control over financial reporting. Accordingly, we express no such opinion. An audit also includes examining, on a test basis, evidence supporting the amounts and disclosures in the financial statements and financial highlights, assessing the accounting principles used and significant estimates made by management, and evaluating the overall financial statement presentation. Our procedures included confirmation of securities owned as of August 31, 2014, by correspondence with the custodian and others or by other appropriate auditing procedures where replies from others were not received. We believe that our audits provide a reasonable basis for our opinion.
In our opinion, the financial statements and financial highlights referred to above present fairly, in all material respects, the financial position of MFS Technology Fund (one of the series constituting MFS Series Trust I) at August 31, 2014, the results of its operations for the year then ended, the changes in its net assets for each of the two years in the period then ended, and the financial highlights for each of the periods indicated therein, in conformity with U.S. generally accepted accounting principles.

Boston, Massachusetts
October 16, 2014
38
TRUSTEES AND OFFICERS — IDENTIFICATION AND BACKGROUND
The Trustees and Officers of the Trust, as of October 1, 2014, are listed below, together with their principal occupations during the past five years. (Their titles may have varied during that period.) The address of each Trustee and Officer is 111 Huntington Avenue, Boston, Massachusetts 02199-7618. It is expected that the Board will appoint Mr. Timothy M. Fagan as Chief Compliance Officer of the MFS Funds on November 1, 2014.
| | | | | | | | |
Name, Age | | Position(s) Held with Fund | | Trustee/Officer
Since (h) | | Principal
Occupations During the Past Five Years | | Other Directorships (j) |
| INTERESTED TRUSTEES |
Robert J. Manning (k)
(age 50) | | Trustee | | February 2004 | | Massachusetts Financial Services Company, Chairman, Chief Executive Officer and Director; President (until 2009); Chief Investment Officer (until 2010) | | N/A |
Robin A. Stelmach (k)
(age 53) | | Trustee and President | | January 2014 | | Massachusetts Financial Services Company, Executive Vice President and Chief Operating Officer | | N/A |
| INDEPENDENT TRUSTEES | | |
David H. Gunning
(age 72) | | Trustee and Chair of Trustees | | January 2004 | | Private investor | | Lincoln Electric Holdings, Inc. (welding equipment manufacturer), Director; Development Alternatives, Inc. (consulting), Director/Non-Executive Chairman |
Steven E. Buller (age 63) | | Trustee | | February 2014 | | Chairman, Financial Accounting Standards Advisory Council; Standing Advisory Group, Public Company Accounting Oversight Board, Member; BlackRock, Inc. (investment management), Managing Director (until 2014), BlackRock Finco UK (investment management), Director (until 2014) | | N/A |
39
Trustees and Officers – continued
| | | | | | | | |
Name, Age | | Position(s) Held with Fund | | Trustee/Officer
Since (h) | | Principal
Occupations During the Past Five Years | | Other Directorships (j) |
Robert E. Butler
(age 72) | | Trustee | | January 2006 | | Consultant – investment company industry regulatory and compliance matters | | N/A |
Maureen R. Goldfarb
(age 59) | | Trustee | | January 2009 | | Private investor | | N/A |
William R. Gutow
(age 73) | | Trustee | | December 1993 | | Private investor and real estate consultant; Capitol Entertainment Management Company (video franchise), Vice Chairman | | Texas Donuts (donut franchise), Vice Chairman (until 2010) |
Michael Hegarty
(age 69) | | Trustee | | December 2004 | | Private investor | | Brookfield Office Properties, Inc. (real estate), Director; Rouse Properties Inc. (real estate), Director; Capmark Financial Group Inc. (real estate), Director |
John P. Kavanaugh
(age 59) | | Trustee | | January 2009 | | Private investor | | N/A |
Maryanne L. Roepke
(age 58) | | Trustee | | May 2014 | | American Century Investments (investment management), Senior Vice President and Chief Compliance Officer (until 2014) | | N/A |
Laurie J. Thomsen
(age 57) | | Trustee | | March 2005 | | Private investor; New Profit, Inc. (venture philanthropy), Executive Partner (until 2010) | | The Travelers Companies (insurance), Director |
Robert W. Uek
(age 73) | | Trustee | | January 2006 | | Consultant to investment company industry | | N/A |
| OFFICERS | | | | | | |
Christopher R. Bohane (k)
(age 40) | | Assistant Secretary and Assistant Clerk | | July 2005 | | Massachusetts Financial Services Company, Vice President and Assistant General Counsel | | N/A |
Kino Clark (k)
(age 46) | | Assistant Treasurer | | January 2012 | | Massachusetts Financial Services Company, Vice President | | N/A |
40
Trustees and Officers – continued
| | | | | | | | |
Name, Age | | Position(s) Held with Fund | | Trustee/Officer
Since (h) | | Principal
Occupations During the Past Five Years | | Other Directorships (j) |
Thomas H. Connors (k)
(age 55) | | Assistant Secretary and Assistant Clerk | | September 2012 | | Massachusetts Financial Services Company, Vice President and Senior Counsel; Deutsche Investment Management Americas Inc. (financial service provider), Director and Senior Counsel (until 2012) | | N/A |
Ethan D. Corey (k)
(age 50) | | Assistant Secretary and Assistant Clerk | | July 2005 | | Massachusetts Financial Services Company, Senior Vice President and Associate General Counsel | | N/A |
David L. DiLorenzo (k)
(age 46) | | Treasurer | | July 2005 | | Massachusetts Financial Services Company, Senior Vice President | | N/A |
Brian E. Langenfeld (k) (age 41) | | Assistant Secretary and Assistant Clerk | | June 2006 | | Massachusetts Financial Services Company, Vice President and Senior Counsel | | N/A |
Susan S. Newton (k) (age 64) | | Assistant Secretary and Assistant Clerk | | May 2005 | | Massachusetts Financial Services Company, Senior Vice President and Associate General Counsel | | N/A |
Susan A. Pereira (k)
(age 43) | | Assistant Secretary and Assistant Clerk | | July 2005 | | Massachusetts Financial Services Company, Vice President and Senior Counsel | | N/A |
Kasey L. Phillips (k) (age 43) | | Assistant Treasurer | | September 2012 | | Massachusetts Financial Services Company, Vice President; Wells Fargo Funds Management, LLC, Senior Vice President, Fund Treasurer (until 2012) | | N/A |
Mark N. Polebaum (k)
(age 62) | | Secretary and Clerk | | January 2006 | | Massachusetts Financial Services Company, Executive Vice President, General Counsel and Secretary | | N/A |
41
Trustees and Officers – continued
| | | | | | | | |
Name, Age | | Position(s) Held with Fund | | Trustee/Officer
Since (h) | | Principal
Occupations During the Past Five Years | | Other Directorships (j) |
Matthew A. Stowe (k)
(age 39) | | Assistant Secretary and Assistant Clerk | | October 2014 | | Massachusetts Financial Services Company, Vice President and Senior Counsel | | N/A |
Frank L. Tarantino (l)
(age 70) | | Independent Chief Compliance Officer | | June 2004 | | Tarantino LLC (provider of compliance services), Principal | | N/A |
Richard S. Weitzel (k)
(age 44) | | Assistant Secretary and Assistant Clerk | | October 2007 | | Massachusetts Financial Services Company, Senior Vice President and Associate General Counsel | | N/A |
James O. Yost (k)
(age 54) | | Deputy Treasurer | | September 1990 | | Massachusetts Financial Services Company, Senior Vice President | | N/A |
| (h) | Date first appointed to serve as Trustee/officer of an MFS Fund. Each Trustee has served continuously since appointment unless indicated otherwise. For the period from December 15, 2004 until February 22, 2005, Mr. Manning served as Advisory Trustee. Prior to January 2012, Messrs. DiLorenzo and Yost served as Assistant Treasurers of the Funds. Ms. Stelmach was appointed as President of the Funds as of October 1, 2014. |
| (j) | Directorships or trusteeships of companies required to report to the Securities and Exchange Commission (i.e., “public companies”). |
| (k) | “Interested person” of the Trust within the meaning of the Investment Company Act of 1940 (referred to as the 1940 Act), which is the principal federal law governing investment companies like the fund, as a result of position with MFS. The address of MFS is 111 Huntington Avenue, Boston, Massachusetts 02199-7618. |
| (l) | Mr. Tarantino will retire as Independent Chief Compliance Officer of the MFS Funds on October 31, 2014. It is expected that Mr. Tarantino will continue after that date as an Independent Senior Officer of the MFS Funds. |
Each Trustee (except Ms. Stelmach, Mr. Buller and Ms. Roepke) has been elected by shareholders and each Trustee and officer holds office until his or her successor is chosen and qualified or until his or her earlier death, resignation, retirement or removal. The Trust does not hold annual meetings for the purpose of electing Trustees, and Trustees are not elected for fixed terms. Messrs. Butler, Kavanaugh, Uek and Mses. Thomsen and Roepke are members of the Trust’s Audit Committee.
Each of the Fund’s Trustees and officers holds comparable positions with certain other funds of which MFS or a subsidiary is the investment adviser or distributor, and, in the case of the officers, with certain affiliates of MFS. As of January 1, 2014, the Trustees served as board members of 142 funds within the MFS Family of Funds.
42
Trustees and Officers – continued
The Statement of Additional Information for the Fund includes further information about the Trustees and is available without charge upon request by calling 1-800-225-2606.
| | |
| Investment Adviser | | Custodian |
Massachusetts Financial Services Company
111 Huntington Avenue
Boston, MA 02199-7618 | | State Street Bank and Trust Company 1 Lincoln Street Boston, MA 02111-2900 |
| Distributor | | Independent Registered Public Accounting Firm |
MFS Fund Distributors, Inc.
111 Huntington Avenue
Boston, MA 02199-7618 | | Ernst & Young LLP 200 Clarendon Street Boston, MA 02116 |
| Portfolio Manager | | |
| Matthew Sabel | | |
43
BOARD REVIEW OF INVESTMENT ADVISORY AGREEMENT
The Investment Company Act of 1940 requires that both the full Board of Trustees and a majority of the non-interested (“independent”) Trustees, voting separately, annually approve the continuation of the Fund’s investment advisory agreement with MFS. The Trustees consider matters bearing on the Fund and its advisory arrangements at their meetings throughout the year, including a review of performance data at each regular meeting. In addition, the independent Trustees met several times over the course of three months beginning in May and ending in July, 2014 (“contract review meetings”) for the specific purpose of considering whether to approve the continuation of the investment advisory agreement for the Fund and the other investment companies that the Board oversees (the “MFS Funds”). The independent Trustees were assisted in their evaluation of the Fund’s investment advisory agreement by independent legal counsel, from whom they received separate legal advice and with whom they met separately from MFS during various contract review meetings. The independent Trustees were also assisted in this process by the MFS Funds’ Independent Chief Compliance Officer, a full-time senior officer appointed by and reporting to the independent Trustees.
In connection with their deliberations regarding the continuation of the investment advisory agreement, the Trustees, including the independent Trustees, considered such information and factors as they believed, in light of the legal advice furnished to them and their own business judgment, to be relevant. The investment advisory agreement for the Fund was considered separately, although the Trustees also took into account the common interests of all MFS Funds in their review. As described below, the Trustees considered the nature, quality, and extent of the various investment advisory, administrative, and shareholder services performed by MFS under the existing investment advisory agreement and other arrangements with the Fund.
In connection with their contract review meetings, the Trustees received and relied upon materials that included, among other items: (i) information provided by Lipper Inc., an independent third party, on the investment performance of the Fund for various time periods ended December 31, 2013 and the investment performance of a group of funds with substantially similar investment classifications/objectives (the “Lipper performance universe”), (ii) information provided by Lipper Inc. on the Fund’s advisory fees and other expenses and the advisory fees and other expenses of comparable funds identified by Lipper Inc. (the “Lipper expense group”), (iii) information provided by MFS on the advisory fees of comparable portfolios of other clients of MFS, including institutional separate accounts and other clients, (iv) information as to whether and to what extent applicable expense waivers, reimbursements or fee “breakpoints” are observed for the Fund, (v) information regarding MFS’ financial results and financial condition, including MFS’ and certain of its affiliates’ estimated profitability from services performed for the Fund and the MFS Funds as a whole, and compared to MFS’ institutional business, (vi) MFS’ views regarding the outlook for the mutual fund industry and the strategic business plans of MFS, (vii) descriptions of various functions performed by MFS for the Funds, such as compliance monitoring and portfolio trading practices, and (viii) information regarding the overall organization of MFS, including information about MFS’ senior management and other personnel providing investment advisory, administrative and other services to
44
Board Review of Investment Advisory Agreement – continued
the Fund and the other MFS Funds. The comparative performance, fee and expense information prepared and provided by Lipper Inc. was not independently verified and the independent Trustees did not independently verify any information provided to them by MFS.
The Trustees’ conclusion as to the continuation of the investment advisory agreement was based on a comprehensive consideration of all information provided to the Trustees and not the result of any single factor. Some of the factors that figured particularly in the Trustees’ deliberations are described below, although individual Trustees may have evaluated the information presented differently from one another, giving different weights to various factors. It is also important to recognize that the fee arrangements for the Fund and other MFS Funds are the result of years of review and discussion between the independent Trustees and MFS, that certain aspects of such arrangements may receive greater scrutiny in some years than in others, and that the Trustees’ conclusions may be based, in part, on their consideration of these same arrangements during the course of the year and in prior years.
Based on information provided by Lipper Inc. and MFS, the Trustees reviewed the Fund’s total return investment performance as well as the performance of peer groups of funds over various time periods. The Trustees placed particular emphasis on the total return performance of the Fund’s Class A shares in comparison to the performance of funds in its Lipper performance universe over the three-year period ended December 31, 2013, which the Trustees believed was a long enough period to reflect differing market conditions. The total return performance of the Fund’s Class A shares was in the 1st quintile relative to the other funds in the universe for this three-year period (the 1st quintile being the best performers and the 5th quintile being the worst performers). The total return performance of the Fund’s Class A shares was in the 3rd quintile for the one-year period and the 1st quintile for the five-year period ended December 31, 2013 relative to the Lipper performance universe. Because of the passage of time, these performance results may differ from the performance results for more recent periods, including those shown elsewhere in this report.
In the course of their deliberations, the Trustees took into account information provided by MFS in connection with the contract review meetings, as well as during investment review meetings conducted with portfolio management personnel during the course of the year regarding the Fund’s performance. After reviewing these and related factors, the Trustees concluded, within the context of their overall conclusions regarding the investment advisory agreement, that they were satisfied with MFS’ responses and efforts relating to investment performance.
In assessing the reasonableness of the Fund’s advisory fee, the Trustees considered, among other information, the Fund’s advisory fee and the total expense ratio of the Fund’s Class A shares as a percentage of average daily net assets and the advisory fee and total expense ratios of peer groups of funds based on information provided by Lipper Inc. The Trustees considered that, according to the Lipper data (which takes into account any fee reductions or expense limitations that were in effect during the Fund’s last fiscal year), the Fund’s effective advisory fee rate was approximately at the Lipper expense group median, and the Fund’s total expense ratio was lower than the Lipper expense group median.
45
Board Review of Investment Advisory Agreement – continued
The Trustees also considered the advisory fees charged by MFS to any comparable institutional accounts. In comparing these fees, the Trustees considered information provided by MFS as to the generally broader scope of services provided by MFS to the Fund in comparison to institutional accounts, the higher demands placed on MFS’ investment personnel and trading infrastructure as a result of the daily cash in-flows and out-flows of the Fund, and the impact on MFS and expenses associated with the more extensive regulatory regime to which the Fund is subject in comparison to institutional accounts.
The Trustees also considered whether the Fund may benefit from any economies of scale in the management of the Fund in the event of growth in assets of the Fund and/or growth in assets of the MFS Funds as a whole. They noted that the Fund’s advisory fee rate schedule is subject to a contractual breakpoint that reduces the Fund’s advisory fee rate on average daily net assets over $1 billion. The Trustees also noted that MFS has agreed in writing to waive a portion of the management fees of certain MFS Funds, including the Fund, if the total combined assets of certain funds within the MFS Funds’ complex increase above agreed upon thresholds (the “group fee waiver”), enabling the Fund’s shareholders to share in the benefits from any economies of scale at the complex level. The group fee waiver is reviewed and renewed annually between the Board and MFS. The Trustees concluded that the breakpoint and the group fee waiver were sufficient to allow the Fund to benefit from economies of scale as its assets and overall complex assets grow.
The Trustees also considered information prepared by MFS relating to MFS’ costs and profits with respect to the Fund, the MFS Funds considered as a group, and other investment companies and accounts advised by MFS, as well as MFS’ methodologies used to determine and allocate its costs to the MFS Funds, the Fund and other accounts and products for purposes of estimating profitability.
After reviewing these and other factors described herein, the Trustees concluded, within the context of their overall conclusions regarding the investment advisory agreement, that the advisory fees charged to the Fund represent reasonable compensation in light of the services being provided by MFS to the Fund.
In addition, the Trustees considered MFS’ resources and related efforts to continue to retain, attract and motivate capable personnel to serve the Fund. The Trustees also considered current and developing conditions in the financial services industry, including the presence of large and well-capitalized companies which are spending, and appear to be prepared to continue to spend, substantial sums to engage personnel and to provide services to competing investment companies. In this regard, the Trustees also considered the financial resources of MFS and its ultimate parent, Sun Life Financial Inc. The Trustees also considered the advantages and possible disadvantages to the Fund of having an adviser that also serves other investment companies as well as other accounts.
The Trustees also considered the nature, quality, cost, and extent of administrative, transfer agency, and distribution services provided to the Fund by MFS and its affiliates under agreements and plans other than the investment advisory agreement, including any 12b-1 fees the Fund pays to MFS Fund Distributors, Inc., an affiliate of MFS. The Trustees also considered the nature, extent and quality of certain other services MFS
46
Board Review of Investment Advisory Agreement – continued
performs or arranges for on the Fund’s behalf, which may include securities lending programs, directed expense payment programs, class action recovery programs, and MFS’ interaction with third-party service providers, principally custodians and sub-custodians. The Trustees concluded that the various non-advisory services provided by MFS and its affiliates on behalf of the Fund were satisfactory.
The Trustees also considered benefits to MFS from the use of the Fund’s portfolio brokerage commissions, if applicable, to pay for investment research and various other factors. Additionally, the Trustees considered so-called “fall-out benefits” to MFS such as reputational value derived from serving as investment manager to the Fund.
Based on their evaluation of factors that they deemed to be material, including those factors described above, the Board of Trustees, including the independent Trustees, concluded that the Fund’s investment advisory agreement with MFS should be continued for an additional one-year period, commencing August 1, 2014.
47
PROXY VOTING POLICIES AND INFORMATION
MFS votes proxies on behalf of the fund pursuant to proxy voting policies and procedures that are available without charge, upon request, by calling 1-800-225-2606, by visiting the Proxy Voting section of mfs.com or by visiting the SEC’s Web site at http://www.sec.gov.
Information regarding how the fund voted proxies relating to portfolio securities during the most recent twelve-month period ended June 30 is available without charge by visiting the Proxy Voting section of mfs.com or by visiting the SEC’s Web site at http://www.sec.gov.
QUARTERLY PORTFOLIO DISCLOSURE
The fund will file a complete schedule of portfolio holdings with the Securities and Exchange Commission (the Commission) for the first and third quarters of each fiscal year on Form N-Q. A shareholder can obtain the quarterly portfolio holdings report at mfs.com. The fund’s Form N-Q is also available on the EDGAR database on the Commission’s Internet Web site at http://www.sec.gov, and may be reviewed and copied at the:
Public Reference Room
Securities and Exchange Commission
100 F Street, NE, Room 1580
Washington, D.C. 20549
Information on the operation of the Public Reference Room may be obtained by calling the Commission at 1-800-SEC-0330. Copies of the fund’s Form N-Q also may be obtained, upon payment of a duplicating fee, by electronic request at the following e-mail address: publicinfo@sec.gov or by writing the Public Reference Section at the above address.
FURTHER INFORMATION
From time to time, MFS may post important information about the fund or the MFS funds on the MFS web site (mfs.com). This information is available by visiting the “Commentary & Announcements” and “Market Outlooks” sections of mfs.com or by clicking on the fund’s name under “Mutual Funds” in the “Products” section of mfs.com.
FEDERAL TAX INFORMATION (unaudited)
The fund will notify shareholders of amounts for use in preparing 2014 income tax forms in January 2015.
The fund designates $1,543,526 as capital gain dividends paid during the fiscal year.
48
rev. 3/11
| | | | |
| | | |
FACTS | | WHAT DOES MFS DO WITH YOUR PERSONAL INFORMATION? | |  |
| | |
| Why? | | Financial companies choose how they share your personal information. Federal law gives consumers the right to limit some but not all sharing. Federal law also requires us to tell you how we collect, share, and protect your personal information. Please read this notice carefully to understand what we do. |
| | |
| What? | | The types of personal information we collect and share depend on the product or service you have with us. This information can include: • Social Security number and account balances • Account transactions and transaction history • Checking account information and wire transfer instructions When you are no longer our customer, we continue to share your information as described in this notice. |
| | |
| How? | | All financial companies need to share customers’ personal information to run their everyday business. In the section below, we list the reasons financial companies can share their customers’ personal information; the reasons MFS chooses to share; and whether you can limit this sharing. |
| | | | |
Reasons we can share your
personal information | | Does MFS
share? | | Can you limit
this sharing? |
For our everyday business purposes – such as to process your transactions, maintain your account(s), respond to court orders and legal investigations, or report to credit bureaus | | Yes | | No |
For our marketing purposes – to offer our products and services to you | | No | | We don’t share |
| For joint marketing with other financial companies | | No | | We don’t share |
For our affiliates’ everyday business purposes – information about your transactions and experiences | | No | | We don’t share |
For our affiliates’ everyday business purposes – information about your creditworthiness | | No | | We don’t share |
| For nonaffiliates to market to you | | No | | We don’t share |
| | |
| Questions? | | Call 800-225-2606 or go to mfs.com. |
49
| | |
| Who we are |
| Who is providing this notice? | | MFS Funds, MFS Investment Management, MFS Institutional Advisors, Inc., MFS Fund Distributors, Inc., MFS Heritage Trust Company, and MFS Service Center, Inc. |
| | |
| What we do |
| How does MFS protect my personal information? | | To protect your personal information from unauthorized access and use, we use security measures that comply with federal law. These measures include procedural, electronic, and physical safeguards for the protection of the personal information we collect about you. |
| How does MFS collect my personal information? | | We collect your personal information, for example, when you •open an account or provide account information •direct us to buy securities or direct us to sell your securities •make a wire transfer We also collect your personal information from others, such as credit bureaus, affiliates and other companies. |
| Why can’t I limit all sharing? | | Federal law gives you the right to limit only •sharing for affiliates’ everyday business purposes – information about your creditworthiness •affiliates from using your information to market to you •sharing for nonaffiliates to market to you State laws and individual companies may give you additional rights to limit sharing. |
| | |
| Definitions |
| Affiliates | | Companies related by common ownership or control. They can be financial and nonfinancial companies. •MFS does not share personal information with affiliates, except for everyday business purposes as described on page one of this notice. |
| Nonaffiliates | | Companies not related by common ownership or control. They can be financial and nonfinancial companies. •MFS does not share with nonaffiliates so they can market to you. |
| Joint Marketing | | A formal agreement between nonaffiliated financial companies that together market financial products or services to you. •MFS doesn’t jointly market. |
| | |
| Other important information |
| If you own an MFS product or receive an MFS service in the name of a third party such as a bank or broker-dealer, their privacy policy may apply to you instead of ours. |
50
Save paper with eDelivery.

| MFS® will send you prospectuses, |
reports, and proxies directly via e-mail so you will get information faster with less mailbox clutter.
To sign up:
1. Go to mfs.com.
2. Log in via MFS® Access.
3. Select eDelivery.
If you own your MFS fund shares through a financial institution or a retirement plan, MFS® TALK, MFS® Access, or eDelivery may not be available to you.
CONTACT
WEB SITE
mfs.com
MFS TALK
1-800-637-8255
24 hours a day
ACCOUNT SERVICE AND LITERATURE
Shareholders
1-800-225-2606
Financial advisors
1-800-343-2829
Retirement plan services
1-800-637-1255
MAILING ADDRESS
MFS Service Center, Inc.
P.O. Box 55824
Boston, MA 02205-5824
OVERNIGHT MAIL
MFS Service Center, Inc.
c/o Boston Financial Data Services
30 Dan Road
Canton, MA 02021-2809
ANNUAL REPORT
August 31, 2014

MFS® U.S. GOVERNMENT CASH RESERVE FUND
(formerly MFS® Cash Reserve Fund)

LMM-ANN
MFS® U.S. GOVERNMENT CASH RESERVE FUND
(formerly MFS® Cash Reserve Fund)
CONTENTS
Note to Shareholders: Effective July 1, 2014, the fund’s name changed from MFS Cash Reserve Fund to MFS U.S. Government Cash Reserve Fund.
The report is prepared for the general information of shareholders.
It is authorized for distribution to prospective investors only when preceded or accompanied by a current prospectus.
NOT FDIC INSURED Ÿ MAY LOSE VALUE Ÿ NO BANK GUARANTEE

LETTER FROM THE CHAIRMAN AND CEO
Dear Shareholders:
The U.S. economy continues to gain strength. Manufacturing output, construction activity and consumer confidence are all at multi-year highs, auto sales are robust, and
U.S. labor market reports show broad progress. Even a slowdown in the pace of rising house prices is seen as making the market more sustainable. Economists have a favorable outlook, and broad stock indices reflect that.
However, challenges dominate the rest of the global economy. China is struggling to boost its industrial output and Japan’s economic turnaround appears to have hit a setback after its sales tax increase in April. The eurozone economy is being held back by persistently high unemployment and dangerously low inflation, leading the European Central Bank to take more
aggressive stimulus action. With robust corporate earnings, the market’s greatest concerns relate to conflicts in the Middle East and Ukraine. In addition, speculation continues on when the U.S. Federal Reserve will begin tightening its monetary policy now that the U.S. economy has regained some traction.
As always at MFS®, active risk management is integral to how we manage your investments. We use a collaborative process, sharing insights across asset classes, regions and economic sectors. Our global team of investment professionals uses a multidisciplined, long-term, diversified investment approach.
We understand that these are challenging economic times. We believe we can serve you best by applying proven principles, such as asset allocation and diversification, over the long term. We are confident that this approach can help you as you work with your financial advisors to reach your goals in the years ahead.
Respectfully,

Robert J. Manning
Chairman and Chief Executive Officer
MFS Investment Management
October 16, 2014
The opinions expressed in this letter are subject to change and may not be relied upon for investment advice. No forecasts can be guaranteed.
1
PORTFOLIO COMPOSITION
Portfolio structure (u)
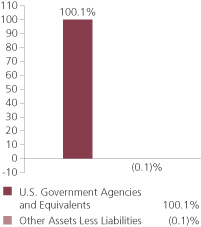
| | | | |
| Composition including fixed income credit quality (a)(u) | | | | |
| A-1+ | | | 18.1% | |
| A-1 | | | 82.0% | |
| Not Rated | | | 0.0% | |
| Other Assets Less Liabilities | | | (0.1)% | |
| | | | |
| Maturity breakdown (u) | | | | |
| 0 - 7 days | | | 22.4% | |
| 8 - 29 days | | | 17.3% | |
| 30 - 59 days | | | 32.3% | |
| 60 - 89 days | | | 20.4% | |
| 90 - 365 days | | | 7.7% | |
| Other Assets Less Liabilities | | | (0.1)% | |
| (a) | Ratings are assigned to portfolio securities utilizing ratings from Moody’s, Fitch, and Standard & Poor’s rating agencies and applying the following hierarchy: If all three agencies provide a rating, the middle rating (after dropping the highest and lowest ratings) is assigned; if two of the three agencies rate a security, the lower of the two is assigned. Ratings are shown in the S&P scale. All ratings are subject to change. The fund is not rated by these agencies. |
| (u) | For purposes of this presentation, accrued interest, where applicable, is included. |
From time to time Other Assets Less Liabilities may be negative due to timing of cash receipts.
Percentages are based on net assets as of 8/31/14.
The portfolio is actively managed and current holdings may be different.
2
PERFORMANCE SUMMARY THROUGH 8/31/14
Total returns as well as the current 7-day yield have been provided for the applicable time periods. Performance results reflect the percentage change in net asset value, including the reinvestment of any dividends and capital gains distributions. (See Notes to Performance Summary.)
Performance data shown represents past performance and is no guarantee of future results. Although the fund seeks to preserve the value of your investment at $1.00 per share, you could lose money on your investment in the fund. An investment in the fund is not a bank deposit and is not insured or guaranteed by the Federal Deposit Insurance Corporation or any other governmental agency. The performance shown does not reflect the deduction of taxes, if any, that a shareholder would pay on fund distributions or the redemption of fund shares.
| | | | | | | | | | |
| | | Share Class | | Inception | | 1-Year Total
Return (without
sales charge) (w) | | Current
7-day yield | | |
| | | A | | 9/07/93 | | 0.00% | | 0.00% | | |
| | | B | | 12/29/86 | | 0.00% | | 0.00% | | |
| | | C | | 4/01/96 | | 0.00% | | 0.00% | | |
| | | R1 | | 4/01/05 | | 0.00% | | 0.00% | | |
| | | R2 | | 4/01/05 | | 0.00% | | 0.00% | | |
| | | R3 | | 4/01/05 | | 0.00% | | 0.00% | | |
| | | R4 | | 4/01/05 | | 0.00% | | 0.00% | | |
| | | 529A | | 7/31/02 | | 0.00% | | 0.00% | | |
| | | 529B | | 7/31/02 | | 0.00% | | 0.00% | | |
| | | 529C | | 7/31/02 | | 0.00% | | 0.00% | | |
| | | | | |
| | | | | | | | | 1-Year
Total Return | | |
| | | B
With CDSC (Declining over six years from 4% to 0%) (v) | | | | (4.00)% | | |
| | | C
With CDSC (1% for 12 months) (v) | | | | (1.00)% | | |
| | | 529B
With CDSC (Declining over six years from 4% to 0%) (v) | | | | (4.00)% | | |
| | | 529C
With CDSC (1% for 12 months) (v) | | | | (1.00)% | | |
CDSC – Contingent Deferred Sales Charge.
Class R1, R2, R3, R4 and 529A shares do not have a sales charge. Certain Class A shares acquired through an exchange may be subject to a CDSC upon redemption depending on when the shares exchanged were originally purchased.
| (v) | Assuming redemption at the end of the applicable period. |
3
Performance Summary – continued
| (w) | Total return was less than 0.01%. |
Yields quoted are based on the latest seven days ended as of August 31, 2014, with dividends annualized. The yield quotations more closely reflect the current earnings of the fund than the total return quotations. Shares of the fund can be purchased at net asset value without a sales charge.
Notes to Performance Summary
Class 529 shares are only available in conjunction with qualified tuition programs, such as the MFS 529 Savings Plan. There also is an additional fee, which is detailed in the program description, on qualified tuition programs. If this fee was reflected, the performance for Class 529 shares would have been lower. This annual fee is waived for Oregon residents and for those accounts with assets of $25,000 or more.
Performance results reflect any applicable expense subsidies, waivers and adjustments in effect during the periods shown. Subsidies and fee waivers may be imposed to enhance a fund’s yield or to avoid a negative yield during periods when the fund’s operating expenses have a significant impact on the fund’s yield due to lower interest rates. Without such subsidies and waivers the fund’s performance results would be less favorable. Please see the prospectus and financial statements for complete details. All results are historical and assume the reinvestment of any dividends and capital gain distributions.
Prior to July 1, 2014, the fund was named MFS Cash Reserve Fund and MFS normally invested the fund’s assets in U.S. dollar-denominated money market instruments and repurchase agreements. Effective July 1, 2014, the fund’s name was changed to MFS U.S. Government Cash Reserve Fund and the fund adopted an investment strategy of normally investing at least 80% of the fund’s net assets in U.S. Government money market instruments and repurchase agreements collateralized by U.S. Government securities.
4
EXPENSE TABLE
Fund expenses borne by the shareholders during the period, March 1, 2014 through August 31, 2014
As a shareholder of the fund, you incur two types of costs: (1) transaction costs, including sales charges (loads) on certain purchase or redemption payments, and (2) ongoing costs, including management fees; distribution and service (12b-1) fees; and other fund expenses. This example is intended to help you understand your ongoing costs (in dollars) of investing in the fund and to compare these costs with the ongoing costs of investing in other mutual funds.
The example is based on an investment of $1,000 invested at the beginning of the period and held for the entire period March 1, 2014 through August 31, 2014.
Actual Expenses
The first line for each share class in the following table provides information about actual account values and actual expenses. You may use the information in this line, together with the amount you invested, to estimate the expenses that you paid over the period. Simply divide your account value by $1,000 (for example, an $8,600 account value divided by $1,000 = 8.6), then multiply the result by the number in the first line under the heading entitled “Expenses Paid During Period” to estimate the expenses you paid on your account during this period.
Hypothetical Example for Comparison Purposes
The second line for each share class in the following table provides information about hypothetical account values and hypothetical expenses based on the fund’s actual expense ratio and an assumed rate of return of 5% per year before expenses, which is not the fund’s actual return. The hypothetical account values and expenses may not be used to estimate the actual ending account balance or expenses you paid for the period. You may use this information to compare the ongoing costs of investing in the fund and other funds. To do so, compare this 5% hypothetical example with the 5% hypothetical examples that appear in the shareholder reports of the other funds.
Please note that the expenses shown in the table are meant to highlight your ongoing costs only and do not reflect any transactional costs, such as sales charges (loads). Therefore, the second line for each share class in the table is useful in comparing ongoing costs only, and will not help you determine the relative total costs of owning different funds. In addition, if these transactional costs were included, your costs would have been higher.
5
Expense Table – continued
| | | | | | | | | | | | | | | | | | |
Share
Class | | | | Annualized
Expense Ratio | | | Beginning
Account Value
3/01/14 | | | Ending Account Value
8/31/14 | | | Expenses Paid During
Period (p)
3/01/14-8/31/14 | |
| A | | Actual | | | 0.08% | | | | $1,000.00 | | | | $1,000.00 | | | | $0.40 | |
| | Hypothetical (h) | | | 0.08% | | | | $1,000.00 | | | | $1,024.80 | | | | $0.41 | |
| B | | Actual | | | 0.08% | | | | $1,000.00 | | | | $1,000.00 | | | | $0.40 | |
| | Hypothetical (h) | | | 0.08% | | | | $1,000.00 | | | | $1,024.80 | | | | $0.41 | |
| C | | Actual | | | 0.08% | | | | $1,000.00 | | | | $1,000.00 | | | | $0.40 | |
| | Hypothetical (h) | | | 0.08% | | | | $1,000.00 | | | | $1,024.80 | | | | $0.41 | |
| R1 | | Actual | | | 0.08% | | | | $1,000.00 | | | | $1,000.00 | | | | $0.40 | |
| | Hypothetical (h) | | | 0.08% | | | | $1,000.00 | | | | $1,024.80 | | | | $0.41 | |
| R2 | | Actual | | | 0.08% | | | | $1,000.00 | | | | $1,000.00 | | | | $0.40 | |
| | Hypothetical (h) | | | 0.08% | | | | $1,000.00 | | | | $1,024.80 | | | | $0.41 | |
| R3 | | Actual | | | 0.08% | | | | $1,000.00 | | | | $1,000.00 | | | | $0.40 | |
| | Hypothetical (h) | | | 0.08% | | | | $1,000.00 | | | | $1,024.80 | | | | $0.41 | |
| R4 | | Actual | | | 0.08% | | | | $1,000.00 | | | | $1,000.00 | | | | $0.40 | |
| | Hypothetical (h) | | | 0.08% | | | | $1,000.00 | | | | $1,024.80 | | | | $0.41 | |
| 529A | | Actual | | | 0.08% | | | | $1,000.00 | | | | $1,000.00 | | | | $0.40 | |
| | Hypothetical (h) | | | 0.08% | | | | $1,000.00 | | | | $1,024.80 | | | | $0.41 | |
| 529B | | Actual | | | 0.08% | | | | $1,000.00 | | | | $1,000.00 | | | | $0.40 | |
| | Hypothetical (h) | | | 0.08% | | | | $1,000.00 | | | | $1,024.80 | | | | $0.41 | |
| 529C | | Actual | | | 0.08% | | | | $1,000.00 | | | | $1,000.00 | | | | $0.40 | |
| | Hypothetical (h) | | | 0.08% | | | | $1,000.00 | | | | $1,024.80 | | | | $0.41 | |
| (h) | 5% class return per year before expenses. |
| (p) | “Expenses Paid During Period” are equal to each class’s annualized expense ratio, as shown above, multiplied by the average account value over the period, multiplied by 184/365 (to reflect the one-half year period). Expenses paid do not include any applicable sales charges (loads). If these transaction costs had been included, your costs would have been higher. |
Notes to Expense Table
As more fully disclosed in footnote 3 to the financial statements, the expense ratios reported above include additional expense reductions to avoid a negative yield.
6
PORTFOLIO OF INVESTMENTS
8/31/14
The Portfolio of Investments is a complete list of all securities owned by your fund. It is categorized by broad-based asset classes.
| | | | | | | | |
| U.S. Government Agencies and Equivalents (y) - 100.1% | | | | | |
| Issuer | | Shares/Par | | | Value ($) | |
| | | | | | | | |
| Fannie Mae, 0.065%, due 9/02/14 | | $ | 3,115,000 | | | $ | 3,114,990 | |
| Fannie Mae, 0.085%, due 1/28/15 | | | 2,800,000 | | | | 2,799,015 | |
| Federal Home Loan Bank, 0.06%, due 9/03/14 | | | 9,660,000 | | | | 9,659,968 | |
| Federal Home Loan Bank, 0.065%, due 9/03/14 | | | 2,800,000 | | | | 2,799,990 | |
| Federal Home Loan Bank, 0.065%, due 9/04/14 | | | 5,000,000 | | | | 4,999,973 | |
| Federal Home Loan Bank, 0.07%, due 9/05/14 | | | 38,328,000 | | | | 38,327,702 | |
| Federal Home Loan Bank, 0.075%, due 9/05/14 | | | 13,785,000 | | | | 13,784,885 | |
| Federal Home Loan Bank, 0.035%, due 9/10/14 | | | 14,039,000 | | | | 14,038,877 | |
| Federal Home Loan Bank, 0.05%, due 9/10/14 | | | 6,000,000 | | | | 5,999,925 | |
| Federal Home Loan Bank, 0.07%, due 9/15/14 | | | 670,000 | | | | 669,982 | |
| Federal Home Loan Bank, 0.08%, due 9/19/14 | | | 11,797,000 | | | | 11,796,528 | |
| Federal Home Loan Bank, 0.045%, due 9/24/14 | | | 7,618,000 | | | | 7,617,781 | |
| Federal Home Loan Bank, 0.08%, due 9/24/14 | | | 1,466,000 | | | | 1,465,925 | |
| Federal Home Loan Bank, 0.07%, due 10/03/14 | | | 3,298,000 | | | | 3,297,795 | |
| Federal Home Loan Bank, 0.075%, due 10/03/14 | | | 33,246,000 | | | | 33,243,785 | |
| Federal Home Loan Bank, 0.08%, due 10/03/14 | | | 4,655,000 | | | | 4,654,669 | |
| Federal Home Loan Bank, 0.03%, due 10/06/14 | | | 7,706,000 | | | | 7,705,775 | |
| Federal Home Loan Bank, 0.08%, due 10/10/14 | | | 3,962,000 | | | | 3,961,657 | |
| Federal Home Loan Bank, 0.075%, due 10/15/14 | | | 4,000,000 | | | | 3,999,633 | |
| Federal Home Loan Bank, 0.085%, due 10/15/14 | | | 13,582,000 | | | | 13,580,589 | |
| Federal Home Loan Bank, 0.055%, due 10/17/14 | | | 2,875,000 | | | | 2,874,798 | |
| Federal Home Loan Bank, 0.06%, due 10/22/14 | | | 6,686,000 | | | | 6,685,432 | |
| Federal Home Loan Bank, 0.06%, due 10/24/14 | | | 15,000,000 | | | | 14,998,675 | |
| Federal Home Loan Bank, 0.08%, due 10/24/14 | | | 1,098,000 | | | | 1,097,871 | |
| Federal Home Loan Bank, 0.06%, due 10/29/14 | | | 6,000,000 | | | | 5,999,420 | |
| Federal Home Loan Bank, 0.08%, due 10/29/14 | | | 13,800,000 | | | | 13,798,221 | |
| Federal Home Loan Bank, 0.065%, due 11/05/14 | | | 3,600,000 | | | | 3,599,578 | |
| Federal Home Loan Bank, 0.08%, due 11/05/14 | | | 2,925,000 | | | | 2,924,578 | |
| Federal Home Loan Bank, 0.06%, due 11/12/14 | | | 1,000,000 | | | | 999,880 | |
| Federal Home Loan Bank, 0.09%, due 11/12/14 | | | 1,075,000 | | | | 1,074,807 | |
| Federal Home Loan Bank, 0.08%, due 11/14/14 | | | 1,000,000 | | | | 999,836 | |
| Federal Home Loan Bank, 0.095%, due 11/17/14 | | | 2,700,000 | | | | 2,699,451 | |
| Federal Home Loan Bank, 0.08%, due 12/03/14 | | | 1,000,000 | | | | 999,793 | |
| Freddie Mac, 0.07%, due 9/02/14 | | | 3,994,000 | | | | 3,993,992 | |
| Freddie Mac, 0.065%, due 9/10/14 | | | 16,421,000 | | | | 16,420,733 | |
| Freddie Mac, 0.06%, due 10/14/14 | | | 1,862,000 | | | | 1,861,867 | |
| Freddie Mac, 0.065%, due 11/18/14 | | | 10,000,000 | | | | 9,998,592 | |
| Freddie Mac, 0.1%, due 1/12/15 | | | 2,000,000 | | | | 1,999,261 | |
| U.S. Treasury Bill, 0.038%, due 9/11/14 | | | 1,000,000 | | | | 999,990 | |
| U.S. Treasury Bill, 0.035%, due 10/23/14 | | | 12,527,000 | | | | 12,526,367 | |
7
Portfolio of Investments – continued
| | | | | | | | |
| Issuer | | Shares/Par | | | Value ($) | |
| | | | | | | | |
| U.S. Government Agencies and Equivalents (y) - continued | | | | | |
| U.S. Treasury Bill, 0.03%, due 11/06/14 | | $ | 14,000,000 | | | $ | 13,999,230 | |
| U.S. Treasury Bill, 0.03%, due 11/13/14 | | | 13,845,000 | | | | 13,844,158 | |
| U.S. Treasury Bill, 0.025%, due 11/28/14 | | | 13,690,000 | | | | 13,689,163 | |
| U.S. Treasury Bill, 0.108%, due 7/23/15 | | | 7,000,000 | | | | 6,993,175 | |
Total U.S. Government Agencies and Equivalents, at Amortized Cost and Value | | | | | | $ | 342,598,312 | |
| | |
| Other Assets, Less Liabilities - (0.1)% | | | | | | | (432,411 | ) |
| Net Assets - 100.0% | | | | | | $ | 342,165,901 | |
| (y) | The rate shown represents an annualized yield at time of purchase. |
See Notes to Financial Statements
8
Financial Statements
STATEMENT OF ASSETS AND LIABILITIES
At 8/31/14
This statement represents your fund’s balance sheet, which details the assets and liabilities comprising the total value of the fund.
| | | | |
| Assets | | | | |
Investments, at amortized cost and value | | | $342,598,312 | |
Cash | | | 724 | |
Receivable for fund shares sold | | | 202,670 | |
Receivable from investment adviser | | | 95,692 | |
Other assets | | | 637 | |
Total assets | | | $342,898,035 | |
| Liabilities | | | | |
Payable for fund shares reacquired | | | $447,508 | |
Payable to affiliate for shareholder servicing costs | | | 221,585 | |
Payable for independent Trustees’ compensation | | | 11,493 | |
Accrued expenses and other liabilities | | | 51,548 | |
Total liabilities | | | $732,134 | |
Net assets | | | $342,165,901 | |
| Net assets consist of | | | | |
Paid-in capital | | | $342,385,916 | |
Accumulated net realized gain (loss) on investments | | | (207,393 | ) |
Accumulated net investment loss | | | (12,622 | ) |
Net assets | | | $342,165,901 | |
Shares of beneficial interest outstanding | | | 342,395,904 | |
9
Statement of Assets and Liabilities – continued
| | | | | | | | | | | | |
| | | Net assets | | | Shares outstanding | | | Net asset value
per share | |
Class A | | | $124,549,778 | | | | 124,620,939 | | | | $1.00 | |
Class B | | | 22,981,634 | | | | 23,028,723 | | | | 1.00 | |
Class C | | | 45,661,503 | | | | 45,691,282 | | | | 1.00 | |
Class R1 | | | 16,818,699 | | | | 16,828,336 | | | | 1.00 | |
Class R2 | | | 57,633,712 | | | | 57,670,801 | | | | 1.00 | |
Class R3 | | | 53,915,822 | | | | 53,946,740 | | | | 1.00 | |
Class R4 | | | 2,906,990 | | | | 2,908,703 | | | | 1.00 | |
Class 529A | | | 10,926,780 | | | | 10,928,339 | | | | 1.00 | |
Class 529B | | | 530,692 | | | | 531,008 | | | | 1.00 | |
Class 529C | | | 6,240,291 | | | | 6,241,033 | | | | 1.00 | |
A contingent deferred sales charge may be imposed on redemptions of Class A, Class B, Class C, Class 529B, and Class 529C shares. Redemption price per share was equal to the net asset value per share for Classes R1, R2, R3, R4, and 529A.
See Notes to Financial Statements
10
Financial Statements
STATEMENT OF OPERATIONS
Year ended 8/31/14
This statement describes how much your fund earned in investment income and accrued in expenses. It also describes any gains and/or losses generated by fund operations.
| | | | |
| Net investment income | | | | |
Interest income | | | $363,074 | |
Expenses | | | | |
Management fee | | | $1,531,240 | |
Distribution and service fees | | | 1,894,037 | |
Program manager fees | | | 18,363 | |
Shareholder servicing costs | | | 625,452 | |
Administrative services fee | | | 56,831 | |
Independent Trustees’ compensation | | | 10,535 | |
Custodian fee | | | 38,337 | |
Shareholder communications | | | 28,004 | |
Audit and tax fees | | | 35,220 | |
Legal fees | | | 10,757 | |
Miscellaneous | | | 138,623 | |
Total expenses | | | $4,387,399 | |
Fees paid indirectly | | | (18 | ) |
Reduction of expenses by investment adviser and distributor | | | (4,024,307 | ) |
Net expenses | | | $363,074 | |
Net investment income | | | $0 | |
Net realized gain (loss) on investments | | | $315 | |
Change in net assets from operations | | | $315 | |
See Notes to Financial Statements
11
Financial Statements
STATEMENTS OF CHANGES IN NET ASSETS
These statements describe the increases and/or decreases in net assets resulting from operations, any distributions, and any shareholder transactions.
| | | | | | | | |
| | | Years ended 8/31 | |
| | | 2014 | | | 2013 | |
| Change in net assets | | | | | | |
| From operations | | | | | | | | |
Net investment income | | | $0 | | | | $0 | |
Net realized gain (loss) on investments | | | 315 | | | | 0 | |
Change in net assets from operations | | | $315 | | | | $0 | |
Change in net assets from fund share transactions | | | $(70,967,905 | ) | | | $(2,037,038 | ) |
Total change in net assets | | | $(70,967,590 | ) | | | $(2,037,038 | ) |
| Net assets | | | | | | | | |
At beginning of period | | | 413,133,491 | | | | 415,170,529 | |
At end of period (including accumulated net investment loss of
$12,622 and $14,599, respectively) | | | $342,165,901 | | | | $413,133,491 | |
See Notes to Financial Statements
12
Financial Statements
FINANCIAL HIGHLIGHTS
The financial highlights table is intended to help you understand the fund’s financial performance for the past 5 years. Certain information reflects financial results for a single fund share. The total returns in the table represent the rate by which an investor would have earned (or lost) on an investment in the fund share class (assuming reinvestment of all distributions) held for the entire period.
| | | | | | | | | | | | | | | | | | | | |
| Class A | | Years ended 8/31 | |
| | | 2014 | | | 2013 | | | 2012 | | | 2011 | | | 2010 | |
Net asset value, beginning of period | | | $1.00 | | | | $1.00 | | | | $1.00 | | | | $1.00 | | | | $1.00 | |
| Income (loss) from investment operations | | | | | | | | | | | | | | | | | |
Net investment income (d) | | | $0.00 | | | | $0.00 | | | | $0.00 | | | | $0.00 | (w) | | | $0.00 | (w) |
Net realized and unrealized gain (loss)
on investments | | | 0.00 | (w) | | | — | | | | — | | | | (0.00 | )(w) | | | 0.00 | (w) |
Total from investment operations | | | $0.00 | (w) | | | $0.00 | | | | $0.00 | | | | $0.00 | (w) | | | $0.00 | (w) |
| Less distributions declared to shareholders | | | | | | | | | | | | | | | | | |
From net investment income | | | $— | | | | $— | | | | $— | | | | $(0.00 | )(w) | | | $(0.00 | )(w) |
From tax return of capital | | | — | | | | — | | | | — | | | | (0.00 | )(w) | | | (0.00 | )(w) |
Total distributions declared to shareholders | | | $— | | | | $— | | | | $— | | | | $(0.00 | )(w) | | | $(0.00 | )(w) |
Net asset value, end of period | | | $1.00 | | | | $1.00 | | | | $1.00 | | | | $1.00 | | | | $1.00 | |
Total return (%) (r)(t) | | | 0.00 | (w) | | | 0.00 | | | | 0.00 | | | | 0.00 | (w) | | | 0.00 | (w) |
Ratios (%) (to average net assets)
and Supplemental data: | | | | | | | | | | | | | | | | | | | | |
Expenses before expense reductions (f) | | | 0.90 | | | | 0.93 | | | | 0.93 | | | | 0.94 | | | | 0.85 | |
Expenses after expense reductions (f) | | | 0.09 | | | | 0.15 | | | | 0.13 | | | | 0.20 | | | | 0.27 | |
Net investment income | | | 0.00 | | | | 0.00 | | | | 0.00 | | | | 0.00 | (w) | | | 0.00 | (w) |
Net assets at end of period (000 omitted) | | | $124,550 | | | | $145,062 | | | | $126,283 | | | | $153,634 | | | | $141,832 | |
See Notes to Financial Statements
13
Financial Highlights – continued
| | | | | | | | | | | | | | | | | | | | |
| Class B | | Years ended 8/31 | |
| | | 2014 | | | 2013 | | | 2012 | | | 2011 | | | 2010 | |
Net asset value, beginning of period | | | $1.00 | | | | $1.00 | | | | $1.00 | | | | $1.00 | | | | $1.00 | |
| Income (loss) from investment operations | | | | | | | | | | | | | | | | | |
Net investment income (d) | | | $0.00 | | | | $0.00 | | | | $0.00 | | | | $0.00 | (w) | | | $0.00 | (w) |
Net realized and unrealized gain (loss)
on investments | | | 0.00 | (w) | | | — | | | | — | | | | (0.00 | )(w) | | | 0.00 | (w) |
Total from investment operations | | | $0.00 | (w) | | | $0.00 | | | | $0.00 | | | | $(0.00 | )(w) | | | $0.00 | (w) |
| Less distributions declared to shareholders | | | | | | | | | | | | | | | | | |
From net investment income | | | $— | | | | $— | | | | $— | | | | $— | | | | $(0.00 | )(w) |
From tax return of capital | | | — | | | | — | | | | — | | | | — | | | | (0.00 | )(w) |
Total distributions declared to shareholders | | | $— | | | | $— | | | | $— | | | | $— | | | | $(0.00 | )(w) |
Net asset value, end of period | | | $1.00 | | | | $1.00 | | | | $1.00 | | | | $1.00 | | | | $1.00 | |
Total return (%) (r)(t) | | | 0.00 | (w) | | | 0.00 | | | | 0.00 | | | | 0.00 | (w) | | | 0.00 | (w) |
Ratios (%) (to average net assets)
and Supplemental data: | | | | | | | | | | | | | | | | | | | | |
Expenses before expense reductions (f) | | | 1.65 | | | | 1.68 | | | | 1.68 | | | | 1.69 | | | | 1.69 | |
Expenses after expense reductions (f) | | | 0.10 | | | | 0.15 | | | | 0.12 | | | | 0.20 | | | | 0.27 | |
Net investment income | | | 0.00 | | | | 0.00 | | | | 0.00 | | | | 0.00 | (w) | | | 0.00 | (w) |
Net assets at end of period (000 omitted) | | | $22,982 | | | | $30,833 | | | | $35,098 | | | | $50,379 | | | | $66,601 | |
| |
| Class C | | Years ended 8/31 | |
| | | 2014 | | | 2013 | | | 2012 | | | 2011 | | | 2010 | |
Net asset value, beginning of period | | | $1.00 | | | | $1.00 | | | | $1.00 | | | | $1.00 | | | | $1.00 | |
| Income (loss) from investment operations | | | | | | | | | | | | | | | | | |
Net investment income (d) | | | $0.00 | | | | $0.00 | | | | $0.00 | | | | $0.00 | | | | $0.00 | (w) |
Net realized and unrealized gain (loss)
on investments | | | 0.00 | (w) | | | — | | | | — | | | | (0.00 | )(w) | | | 0.00 | (w) |
Total from investment operations | | | $0.00 | (w) | | | $0.00 | | | | $0.00 | | | | $(0.00 | )(w) | | | $0.00 | (w) |
| Less distributions declared to shareholders | | | | | | | | | | | | | | | | | |
From net investment income | | | $— | | | | $— | | | | $— | | | | $— | | | | $(0.00 | )(w) |
From tax return of capital | | | — | | | | — | | | | — | | | | — | | | | (0.00 | )(w) |
Total distributions declared to shareholders | | | $— | | | | $— | | | | $— | | | | $— | | | | $— | |
Net asset value, end of period | | | $1.00 | | | | $1.00 | | | | $1.00 | | | | $1.00 | | | | $1.00 | |
Total return (%) (r)(t) | | | 0.00 | (w) | | | 0.00 | | | | 0.00 | | | | 0.00 | (w) | | | 0.00 | (w) |
Ratios (%) (to average net assets)
and Supplemental data: | | | | | | | | | | | | | | | | | | | | |
Expenses before expense reductions (f) | | | 1.65 | | | | 1.68 | | | | 1.68 | | | | 1.69 | | | | 1.69 | |
Expenses after expense reductions (f) | | | 0.10 | | | | 0.15 | | | | 0.13 | | | | 0.20 | | | | 0.27 | |
Net investment income | | | 0.00 | | | | 0.00 | | | | 0.00 | | | | 0.00 | | | | 0.00 | (w) |
Net assets at end of period (000 omitted) | | | $45,662 | | | | $58,363 | | | | $49,851 | | | | $61,943 | | | | $50,196 | |
See Notes to Financial Statements
14
Financial Highlights – continued
| | | | | | | | | | | | | | | | | | | | |
| Class R1 | | Years ended 8/31 | |
| | | 2014 | | | 2013 | | | 2012 | | | 2011 | | | 2010 | |
Net asset value, beginning of period | | | $1.00 | | | | $1.00 | | | | $1.00 | | | | $1.00 | | | | $1.00 | |
| Income (loss) from investment operations | | | | | | | | | | | | | | | | | |
Net investment income (d) | | | $0.00 | | | | $0.00 | | | | $0.00 | | | | $0.00 | | | | $0.00 | (w) |
Net realized and unrealized gain (loss)
on investments | | | 0.00 | (w) | | | — | | | | — | | | | (0.00 | )(w) | | | 0.00 | (w) |
Total from investment operations | | | $0.00 | (w) | | | $0.00 | | | | $0.00 | | | | $(0.00 | )(w) | | | $0.00 | (w) |
| Less distributions declared to shareholders | | | | | | | | | | | | | | | | | |
From net investment income | | | $— | | | | $— | | | | $— | | | | $— | | | | $(0.00 | )(w) |
From tax return of capital | | | — | | | | — | | | | — | | | | — | | | | (0.00 | )(w) |
Total distributions declared to shareholders | | | $— | | | | $— | | | | $— | | | | $— | | | | $(0.00 | )(w) |
Net asset value, end of period | | | $1.00 | | | | $1.00 | | | | $1.00 | | | | $1.00 | | | | $1.00 | |
Total return (%) (r) | | | 0.00 | (w) | | | 0.00 | | | | 0.00 | | | | 0.00 | (w) | | | 0.00 | (w) |
Ratios (%) (to average net assets)
and Supplemental data: | | | | | | | | | | | | | | | | | | | | |
Expenses before expense reductions (f) | | | 1.65 | | | | 1.68 | | | | 1.68 | | | | 1.69 | | | | 1.69 | |
Expenses after expense reductions (f) | | | 0.09 | | | | 0.15 | | | | 0.13 | | | | 0.20 | | | | 0.27 | |
Net investment income | | | 0.00 | | | | 0.00 | | | | 0.00 | | | | 0.00 | | | | 0.00 | (w) |
Net assets at end of period (000 omitted) | | | $16,819 | | | | $21,080 | | | | $24,361 | | | | $28,705 | | | | $30,233 | |
| |
| Class R2 | | Years ended 8/31 | |
| | | 2014 | �� | | 2013 | | | 2012 | | | 2011 | | | 2010 | |
Net asset value, beginning of period | | | $1.00 | | | | $1.00 | | | | $1.00 | | | | $1.00 | | | | $1.00 | |
| Income (loss) from investment operations | | | | | | | | | | | | | | | | | |
Net investment income (d) | | | $0.00 | | | | $0.00 | | | | $0.00 | | | | $0.00 | | | | $0.00 | (w) |
Net realized and unrealized gain (loss)
on investments | | | 0.00 | (w) | | | — | | | | — | | | | (0.00 | )(w) | | | 0.00 | (w) |
Total from investment operations | | | $0.00 | (w) | | | $0.00 | | | | $0.00 | | | | $(0.00 | )(w) | | | $0.00 | (w) |
| Less distributions declared to shareholders | | | | | | | | | | | | | | | | | |
From net investment income | | | $— | | | | $— | | | | $— | | | | $— | | | | $(0.00 | )(w) |
From tax return of capital | | | — | | | | — | | | | — | | | | — | | | | (0.00 | )(w) |
Total distributions declared to shareholders | | | $— | | | | $— | | | | $— | | | | $— | | | | $(0.00 | )(w) |
Net asset value, end of period | | | $1.00 | | | | $1.00 | | | | $1.00 | | | | $1.00 | | | | $1.00 | |
Total return (%) (r) | | | 0.00 | (w) | | | 0.00 | | | | 0.00 | | | | 0.00 | (w) | | | 0.00 | (w) |
Ratios (%) (to average net assets)
and Supplemental data: | | | | | | | | | | | | | | | | | | | | |
Expenses before expense reductions (f) | | | 1.15 | | | | 1.18 | | | | 1.18 | | | | 1.19 | | | | 1.19 | |
Expenses after expense reductions (f) | | | 0.09 | | | | 0.15 | | | | 0.13 | | | | 0.20 | | | | 0.27 | |
Net investment income | | | 0.00 | | | | 0.00 | | | | 0.00 | | | | 0.00 | | | | 0.00 | (w) |
Net assets at end of period (000 omitted) | | | $57,634 | | | | $74,406 | | | | $83,723 | | | | $104,130 | | | | $109,362 | |
See Notes to Financial Statements
15
Financial Highlights – continued
| | | | | | | | | | | | | | | | | | | | |
| Class R3 | | Years ended 8/31 | |
| | | 2014 | | | 2013 | | | 2012 | | | 2011 | | | 2010 | |
Net asset value, beginning of period | | | $1.00 | | | | $1.00 | | | | $1.00 | | | | $1.00 | | | | $1.00 | |
| Income (loss) from investment operations | | | | | | | | | | | | | | | | | |
Net investment income (d) | | | $0.00 | | | | $0.00 | | | | $0.00 | | | | $0.00 | | | | $0.00 | (w) |
Net realized and unrealized gain (loss)
on investments | | | 0.00 | (w) | | | — | | | | — | | | | (0.00 | )(w) | | | 0.00 | (w) |
Total from investment operations | | | $0.00 | (w) | | | $0.00 | | | | $0.00 | | | | $(0.00 | )(w) | | | $0.00 | (w) |
| Less distributions declared to shareholders | | | | | | | | | | | | | | | | | |
From net investment income | | | $— | | | | $— | | | | $— | | | | $— | | | | $(0.00 | )(w) |
From tax return of capital | | | — | | | | — | | | | — | | | | — | | | | (0.00 | )(w) |
Total distributions declared to shareholders | | | $— | | | | $— | | | | $— | | | | $— | | | | $(0.00 | )(w) |
Net asset value, end of period | | | $1.00 | | | | $1.00 | | | | $1.00 | | | | $1.00 | | | | $1.00 | |
Total return (%) (r) | | | 0.00 | (w) | | | 0.00 | | | | 0.00 | | | | 0.00 | (w) | | | 0.00 | (w) |
Ratios (%) (to average net assets)
and Supplemental data: | | | | | | | | | | | | | | | | | | | | |
Expenses before expense reductions (f) | | | 0.90 | | | | 0.93 | | | | 0.93 | | | | 0.94 | | | | 0.94 | |
Expenses after expense reductions (f) | | | 0.09 | | | | 0.15 | | | | 0.13 | | | | 0.20 | | | | 0.27 | |
Net investment income | | | 0.00 | | | | 0.00 | | | | 0.00 | | | | 0.00 | | | | 0.00 | (w) |
Net assets at end of period (000 omitted) | | | $53,916 | | | | $64,925 | | | | $79,029 | | | | $85,602 | | | | $90,331 | |
| |
| Class R4 | | Years ended 8/31 | |
| | | 2014 | | | 2013 | | | 2012 | | | 2011 | | | 2010 | |
Net asset value, beginning of period | | | $1.00 | | | | $1.00 | | | | $1.00 | | | | $1.00 | | | | $1.00 | |
| Income (loss) from investment operations | | | | | | | | | | | | | | | | | |
Net investment income (d) | | | $0.00 | | | | $0.00 | | | | $0.00 | | | | $0.00 | (w) | | | $0.00 | (w) |
Net realized and unrealized gain (loss)
on investments | | | 0.00 | (w) | | | — | | | | — | | | | (0.00 | )(w) | | | 0.00 | (w) |
Total from investment operations | | | $0.00 | (w) | | | $0.00 | | | | $0.00 | | | | $0.00 | (w) | | | $0.00 | (w) |
| Less distributions declared to shareholders | | | | | | | | | | | | | | | | | |
From net investment income | | | $— | | | | $— | | | | $— | | | | $(0.00 | )(w) | | | $(0.00 | )(w) |
From tax return of capital | | | — | | | | — | | | | — | | | | (0.00 | )(w) | | | (0.00 | )(w) |
Total distributions declared to shareholders | | | $— | | | | $— | | | | $— | | | | $(0.00 | )(w) | | | $(0.00 | )(w) |
Net asset value, end of period | | | $1.00 | | | | $1.00 | | | | $1.00 | | | | $1.00 | | | | $1.00 | |
Total return (%) (r) | | | 0.00 | (w) | | | 0.00 | | | | 0.00 | | | | 0.00 | (w) | | | 0.00 | (w) |
Ratios (%) (to average net assets)
and Supplemental data: | | | | | | | | | | | | | | | | | | | | |
Expenses before expense reductions (f) | | | 0.65 | | | | 0.68 | | | | 0.69 | | | | 0.69 | | | | 0.68 | |
Expenses after expense reductions (f) | | | 0.09 | | | | 0.15 | | | | 0.12 | | | | 0.20 | | | | 0.27 | |
Net investment income | | | 0.00 | | | | 0.00 | | | | 0.00 | | | | 0.00 | (w) | | | 0.00 | (w) |
Net assets at end of period (000 omitted) | | | $2,907 | | | | $820 | | | | $810 | | | | $5,743 | | | | $6,172 | |
See Notes to Financial Statements
16
Financial Highlights – continued
| | | | | | | | | | | | | | | | | | | | |
| Class 529A | | Years ended 8/31 | |
| | | 2014 | | | 2013 | | | 2012 | | | 2011 | | | 2010 | |
Net asset value, beginning of period | | | $1.00 | | | | $1.00 | | | | $1.00 | | | | $1.00 | | | | $1.00 | |
| Income (loss) from investment operations | | | | | | | | | | | | | | | | | |
Net investment income (d) | | | $0.00 | | | | $0.00 | | | | $0.00 | | | | $0.00 | | | | $0.00 | (w) |
Net realized and unrealized gain (loss)
on investments | | | 0.00 | (w) | | | — | | | | — | | | | (0.00 | )(w) | | | 0.00 | (w) |
Total from investment operations | | | $0.00 | (w) | | | $0.00 | | | | $0.00 | | | | $(0.00 | )(w) | | | $0.00 | (w) |
| Less distributions declared to shareholders | | | | | | | | | | | | | | | | | |
From net investment income | | | $— | | | | $— | | | | $— | | | | $— | | | | $(0.00 | )(w) |
From tax return of capital | | | — | | | | — | | | | — | | | | — | | | | (0.00 | )(w) |
Total distributions declared to shareholders | | | $— | | | | $— | | | | $— | | | | $— | | | | $(0.00 | )(w) |
Net asset value, end of period | | | $1.00 | | | | $1.00 | | | | $1.00 | | | | $1.00 | | | | $1.00 | |
Total return (%) (r) | | | 0.00 | (w) | | | 0.00 | | | | 0.00 | | | | 0.00 | (w) | | | 0.00 | (w) |
Ratios (%) (to average net assets)
and Supplemental data: | | | | | | | | | | | | | | | | | | | | |
Expenses before expense reductions (f) | | | 1.00 | | | | 1.03 | | | | 1.03 | | | | 1.04 | | | | 1.03 | |
Expenses after expense reductions (f) | | | 0.09 | | | | 0.15 | | | | 0.13 | | | | 0.20 | | | | 0.27 | |
Net investment income | | | 0.00 | | | | 0.00 | | | | 0.00 | | | | 0.00 | | | | 0.00 | (w) |
Net assets at end of period (000 omitted) | | | $10,927 | | | | $10,897 | | | | $10,330 | | | | $9,710 | | | | $9,919 | |
| |
| Class 529B | | Years ended 8/31 | |
| | | 2014 | | | 2013 | | | 2012 | | | 2011 | | | 2010 | |
Net asset value, beginning of period | | | $1.00 | | | | $1.00 | | | | $1.00 | | | | $1.00 | | | | $1.00 | |
| Income (loss) from investment operations | | | | | | | | | | | | | | | | | |
Net investment income (d) | | | $0.00 | | | | $0.00 | | | | $0.00 | | | | $0.00 | | | | $0.00 | (w) |
Net realized and unrealized gain (loss)
on investments | | | 0.00 | (w) | | | — | | | | — | | | | (0.00 | )(w) | | | 0.00 | (w) |
Total from investment operations | | | $0.00 | (w) | | | $0.00 | | | | $0.00 | | | | $(0.00 | )(w) | | | $0.00 | (w) |
| Less distributions declared to shareholders | | | | | | | | | | | | | | | | | |
From net investment income | | | $— | | | | $— | | | | $— | | | | $— | | | | $(0.00 | )(w) |
From tax return of capital | | | — | | | | — | | | | — | | | | — | | | | (0.00 | )(w) |
Total distributions declared to shareholders | | | $— | | | | $— | | | | $— | | | | $— | | | | $(0.00 | )(w) |
Net asset value, end of period | | | $1.00 | | | | $1.00 | | | | $1.00 | | | | $1.00 | | | | $1.00 | |
Total return (%) (r)(t) | | | 0.00 | (w) | | | 0.00 | | | | 0.00 | | | | 0.00 | (w) | | | 0.00 | (w) |
Ratios (%) (to average net assets)
and Supplemental data: | | | | | | | | | | | | | | | | | | | | |
Expenses before expense reductions (f) | | | 1.75 | | | | 1.78 | | | | 1.78 | | | | 1.79 | | | | 1.79 | |
Expenses after expense reductions (f) | | | 0.10 | | | | 0.15 | | | | 0.12 | | | | 0.20 | | | | 0.27 | |
Net investment income | | | 0.00 | | | | 0.00 | | | | 0.00 | | | | 0.00 | | | | 0.00 | (w) |
Net assets at end of period (000 omitted) | | | $531 | | | | $676 | | | | $665 | | | | $1,073 | | | | $1,613 | |
See Notes to Financial Statements
17
Financial Highlights – continued
| | | | | | | | | | | | | | | | | | | | |
| Class 529C | | Years ended 8/31 | |
| | | 2014 | | | 2013 | | | 2012 | | | 2011 | | | 2010 | |
Net asset value, beginning of period | | | $1.00 | | | | $1.00 | | | | $1.00 | | | | $1.00 | | | | $1.00 | |
| Income (loss) from investment operations | | | | | | | | | | | | | | | | | |
Net investment income (d) | | | $0.00 | | | | $0.00 | | | | $0.00 | | | | $0.00 | | | | $0.00 | (w) |
Net realized and unrealized gain (loss)
on investments | | | 0.00 | (w) | | | — | | | | — | | | | (0.00 | )(w) | | | 0.00 | (w) |
Total from investment operations | | | $0.00 | (w) | | | $0.00 | | | | $0.00 | | | | $(0.00 | )(w) | | | $0.00 | (w) |
| Less distributions declared to shareholders | | | | | | | | | | | | | | | | | |
From net investment income | | | $— | | | | $— | | | | $— | | | | $— | | | | $(0.00 | )(w) |
From tax return of capital | | | — | | | | — | | | | — | | | | — | | | | (0.00 | )(w) |
Total distributions declared to shareholders | | | $— | | | | $— | | | | $— | | | | $— | | | | $(0.00 | )(w) |
Net asset value, end of period | | | $1.00 | | | | $1.00 | | | | $1.00 | | | | $1.00 | | | | $1.00 | |
Total return (%) (r)(t) | | | 0.00 | (w) | | | 0.00 | | | | 0.00 | | | | 0.00 | (w) | | | 0.00 | (w) |
Ratios (%) (to average net assets)
and Supplemental data: | | | | | | | | | | | | | | | | | | | | |
Expenses before expense reductions (f) | | | 1.75 | | | | 1.78 | | | | 1.78 | | | | 1.79 | | | | 1.78 | |
Expenses after expense reductions (f) | | | 0.09 | | | | 0.15 | | | | 0.13 | | | | 0.20 | | | | 0.27 | |
Net investment income | | | 0.00 | | | | 0.00 | | | | 0.00 | | | | 0.00 | | | | 0.00 | (w) |
Net assets at end of period (000 omitted) | | | $6,240 | | | | $6,072 | | | | $5,020 | | | | $5,525 | | | | $6,224 | |
| (d) | Per share data is based on average shares outstanding. |
| (f) | Ratios do not reflect reductions from fees paid indirectly, if applicable. |
| (r) | Certain expenses have been reduced without which performance would have been lower. |
| (t) | Total returns do not include any applicable sales charges. |
| (w) | Per share amount was less than $0.01 and total return or ratio was less than 0.01%, as applicable. |
See Notes to Financial Statements
18
NOTES TO FINANCIAL STATEMENTS
(1) Business and Organization
MFS U.S. Government Cash Reserve Fund (formerly MFS Cash Reserve Fund) (the fund) is a diversified series of MFS Series Trust I (the trust). The trust is organized as a Massachusetts business trust and is registered under the Investment Company Act of 1940, as amended, as an open-end management investment company.
The fund is an investment company and accordingly follows the investment company accounting and reporting guidance of the Financial Accounting Standards Board (FASB) Accounting Standards Codification Topic 946 Financial Services – Investment Companies.
Prior to July 1, 2014, the fund was named MFS Cash Reserve Fund and MFS normally invested the fund’s assets in U.S. dollar-denominated money market instruments and repurchase agreements. Effective July 1, 2014, the fund’s name was changed to MFS U.S. Government Cash Reserve Fund and the fund adopted an investment strategy of normally investing at least 80% of the fund’s net assets in U.S. Government money market instruments and repurchase agreements collateralized by U.S. Government securities.
On July 23, 2014, the U.S. Securities and Exchange Commission adopted amendments to its money market fund regulations. At this time, management is evaluating the potential implications of the changes.
(2) Significant Accounting Policies
General – The preparation of financial statements in conformity with U.S. generally accepted accounting principles requires management to make estimates and assumptions that affect the reported amounts of assets and liabilities, and disclosure of contingent assets and liabilities at the date of the financial statements and the reported amounts of increases and decreases in net assets from operations during the reporting period. Actual results could differ from those estimates. In the preparation of these financial statements, management has evaluated subsequent events occurring after the date of the fund’s Statement of Assets and Liabilities through the date that the financial statements were issued.
In June 2014, FASB issued Accounting Standards Update 2014-11, Transfers and Servicing (Topic 860) – Repurchase-to-Maturity Transactions, Repurchase Financings, and Disclosures (“ASU 2014-11”). ASU 2014-11 changes the accounting for repurchase-to-maturity transactions (i.e., repurchase agreements that settle at the same time as the maturity of the transferred financial asset) and enhances the required disclosures for repurchase agreements and other similar transactions. Although still evaluating the potential impacts of ASU 2014-11 to the fund, management expects that the impact of the fund’s adoption will be limited to additional financial statement disclosures which would first be effective for interim reporting periods beginning after March 15, 2015.
Balance Sheet Offsetting – The fund’s accounting policy with respect to balance sheet offsetting is that, absent an event of default by the counterparty or a termination of the agreement, the International Swaps and Derivatives Association (ISDA) Master Agreement does not result in an offset of reported amounts of financial assets and
19
Notes to Financial Statements – continued
financial liabilities in the Statement of Assets and Liabilities across transactions between the fund and the applicable counterparty. The fund’s right to setoff may be restricted or prohibited by the bankruptcy or insolvency laws of the particular jurisdiction to which a specific master netting agreement counterparty is subject. Balance sheet offsetting disclosures, to the extent applicable to the fund, have been included in the fund’s Significant Accounting Policies note under the captions for each of the fund’s in-scope financial instruments and transactions.
Investment Valuations – Pursuant to procedures approved by the Board of Trustees, investments held by the fund are generally valued at amortized cost, which approximates market value. Amortized cost involves valuing an instrument at its cost as adjusted for amortization of premium or accretion of discount rather than its current market value. The amortized cost value of an instrument can be different from the market value of an instrument.
Various inputs are used in determining the value of the fund’s assets or liabilities. These inputs are categorized into three broad levels. In certain cases, the inputs used to measure fair value may fall into different levels of the fair value hierarchy. In such cases, an investment’s level within the fair value hierarchy is based on the lowest level of input that is significant to the fair value measurement. The fund’s assessment of the significance of a particular input to the fair value measurement in its entirety requires judgment, and considers factors specific to the investment. Level 1 includes unadjusted quoted prices in active markets for identical assets or liabilities. Level 2 includes other significant observable market-based inputs (including quoted prices for similar securities, interest rates, prepayment speed, and credit risk). Level 3 includes unobservable inputs, which may include the adviser’s own assumptions in determining the fair value of investments. The following is a summary of the levels used as of August 31, 2014 in valuing the fund’s assets or liabilities:
| | | | | | | | | | | | | | | | |
| Investments at Value | | Level 1 | | | Level 2 | | | Level 3 | | | Total | |
| Short Term Securities | | | $— | | | | $342,598,312 | | | | $— | | | | $342,598,312 | |
For further information regarding security characteristics, see the Portfolio of Investments.
Repurchase Agreements – The fund enters into repurchase agreements under the terms of Master Repurchase Agreements with approved counterparties. Each repurchase agreement is recorded at cost. The fund requires that the securities collateral in a repurchase transaction be transferred to a custodian. The fund monitors, on a daily basis, the value of the collateral to ensure that its value, including accrued interest, is greater than amounts owed to the fund under each such repurchase agreement. Upon an event of default under a Master Repurchase Agreement, the non-defaulting party may close out all transactions traded under such agreement and net amounts owed under each transaction to one net amount payable by one party to the other. Absent an event of default, the Master Repurchase Agreement does not result in an offset of reported amounts of assets and liabilities in the Statement of Assets and Liabilities across transactions between the fund and the applicable counterparty. The fund and other funds managed by MFS may utilize a joint trading account for the purpose of entering into one or more repurchase agreements.
20
Notes to Financial Statements – continued
Indemnifications – Under the fund’s organizational documents, its officers and Trustees may be indemnified against certain liabilities and expenses arising out of the performance of their duties to the fund. Additionally, in the normal course of business, the fund enters into agreements with service providers that may contain indemnification clauses. The fund’s maximum exposure under these agreements is unknown as this would involve future claims that may be made against the fund that have not yet occurred.
Investment Transactions and Income – Investment transactions are recorded on the trade date. Interest income is recorded on the accrual basis. All premium and discount is amortized or accreted for financial statement purposes in accordance with U.S. generally accepted accounting principles.
Fees Paid Indirectly – The fund’s custody fee may be reduced according to an arrangement that measures the value of cash deposited with the custodian by the fund. This amount, for the year ended August 31, 2014, is shown as a reduction of total expenses in the Statement of Operations.
Tax Matters and Distributions – The fund intends to qualify as a regulated investment company, as defined under Subchapter M of the Internal Revenue Code, and to distribute all of its taxable income, including realized capital gains. As a result, no provision for federal income tax is required. The fund’s federal tax returns, when filed, will remain subject to examination by the Internal Revenue Service for a three year period. Management has analyzed the fund’s tax positions taken on federal and state tax returns for all open tax years and does not believe that there are any uncertain tax positions that require recognition of a tax liability.
Distributions to shareholders are recorded on the ex-dividend date. Income and capital gain distributions are determined in accordance with income tax regulations, which may differ from U.S. generally accepted accounting principles. Certain capital accounts in the financial statements are periodically adjusted for permanent differences in order to reflect their tax character. These adjustments have no impact on net assets or net asset value per share. Temporary differences which arise from recognizing certain items of income, expense, gain or loss in different periods for financial statement and tax purposes will reverse at some time in the future. Distributions in excess of net investment income or net realized gains are temporary overdistributions for financial statement purposes resulting from differences in the recognition or classification of income or distributions for financial statement and tax purposes.
During the year ended August 31, 2014, there were no significant adjustments due to differences between book and tax accounting.
The fund declared no distributions for the years ended August 31, 2014 and August 31, 2013.
The federal tax cost and the tax basis components of distributable earnings were as follows:
| | | | |
| As of 8/31/14 | | | |
| Cost of investments | | | $342,598,312 | |
| Capital loss carryforwards | | | (207,393 | ) |
| Late year ordinary loss deferral | | | (1,253 | ) |
| Other temporary differences | | | (11,369 | ) |
21
Notes to Financial Statements – continued
Under the Regulated Investment Company Modernization Act of 2010 (the “Act”), net capital losses recognized for fund fiscal years beginning after August 31, 2011 may be carried forward indefinitely, and their character is retained as short-term and/or long-term losses (“post-enactment losses”). Previously, net capital losses were carried forward for eight years and treated as short-term losses (“pre-enactment losses”). As a transition rule, the Act requires that all post-enactment net capital losses be used before pre-enactment net capital losses.
As of August 31, 2014, the fund had capital loss carryforwards available to offset future realized gains. Such pre-enactment losses expire as follows:
| | | | |
| 8/31/15 | | | $(14 | ) |
| 8/31/16 | | | (22,989 | ) |
| 8/31/17 | | | (184,390 | ) |
| Total | | | $(207,393 | ) |
Multiple Classes of Shares of Beneficial Interest – The fund offers multiple classes of shares, which differ in their respective distribution, service, and program manager fees. The fund’s income and common expenses are allocated to shareholders based on the value of settled shares outstanding of each class. The fund’s realized and unrealized gain (loss) are allocated to shareholders based on the daily net assets of each class. Dividends are declared separately for each class. Differences in per share dividend rates are generally due to differences in separate class expenses. Class B and Class 529B shares will convert to Class A and Class 529A shares, respectively approximately eight years after purchase.
(3) Transactions with Affiliates
Investment Adviser – The fund has an investment advisory agreement with MFS to provide overall investment management and related administrative services and facilities to the fund. The management fee is computed daily and paid monthly at an annual rate of 0.40% of the fund’s average daily net assets.
During the year ended August 31, 2014, MFS voluntarily waived receipt of $1,518,847 of the fund’s management fee in order to avoid a negative yield. This amount, for the year ended August 31, 2014, is included in the reduction of total expenses in the Statement of Operations. MFS has also agreed in writing to reduce its management fee by a specified amount if certain MFS mutual fund assets exceed thresholds agreed to by MFS and the fund’s Board of Trustees. For the year ended August 31, 2014, this management fee reduction amounted to $12,393, which is included in the reduction of total expenses in the Statement of Operations. For the year ended August 31, 2014, these waivers had the effect of reducing the management fee by 0.40% of average daily net assets on an annualized basis. The management fee incurred for the year ended August 31, 2014 was equivalent to an annual effective rate of 0.00% of the fund’s average daily net assets.
In order to avoid a negative yield for the year ended August 31, 2014, MFS voluntarily agreed to reduce certain other expenses in the amount of $580,110, which is included in the reduction of total expenses in the Statement of Operations.
Distributor – The Board of Trustees has adopted a distribution plan for certain share classes pursuant to Rule 12b-1 of the Investment Company Act of 1940.
22
Notes to Financial Statements – continued
The fund’s distribution plan provides that the fund will pay MFS Fund Distributors, Inc. (MFD) for services provided by MFD and financial intermediaries in connection with the distribution and servicing of certain share classes. One component of the plan is a distribution fee paid to MFD and another component of the plan is a service fee paid to MFD. MFD may subsequently pay all, or a portion, of the distribution and/or service fees to financial intermediaries.
Distribution Plan Fee Table:
| | | | | | | | | | | | | | | | | | | | |
| | | Distribution
Fee Rate (d) | | | Service
Fee Rate (d) | | | Total
Distribution
Plan (d) | | | Annual
Effective
Rate (e) | | | Distribution
and Service
Fee | |
| Class A | | | — | | | | 0.25% | | | | 0.25% | | | | 0.00% | | | | $341,770 | |
| Class B | | | 0.75% | | | | 0.25% | | | | 1.00% | | | | 0.00% | | | | 271,816 | |
| Class C | | | 0.75% | | | | 0.25% | | | | 1.00% | | | | 0.00% | | | | 512,691 | |
| Class R1 | | | 0.75% | | | | 0.25% | | | | 1.00% | | | | 0.00% | | | | 186,241 | |
| Class R2 | | | 0.25% | | | | 0.25% | | | | 0.50% | | | | 0.00% | | | | 324,680 | |
| Class R3 | | | — | | | | 0.25% | | | | 0.25% | | | | 0.00% | | | | 157,505 | |
| Class 529A | | | — | | | | 0.25% | | | | 0.25% | | | | 0.00% | | | | 28,101 | |
| Class 529B | | | 0.75% | | | | 0.25% | | | | 1.00% | | | | 0.00% | | | | 6,329 | |
| Class 529C | | | 0.75% | | | | 0.25% | | | | 1.00% | | | | 0.00% | | | | 64,904 | |
| Total Distribution and Service Fees | | | | | | | | $1,894,037 | |
| (d) | In accordance with the distribution plan for certain classes, the fund pays distribution and/or service fees equal to these annual percentage rates of each class’s average daily net assets. The distribution and service fee rates disclosed by class represent the current rates in effect at the end of the reporting period. Any rate changes, if applicable, are detailed below. |
| (e) | The annual effective rates represent actual fees incurred under the distribution plan for the year ended August 31, 2014 based on each class’s average daily net assets. MFD has agreed in writing to waive the Class A and Class 529A service fee. This written agreement will continue until modified by the fund’s Board of Trustees, but such agreement will continue until at least December 31, 2014. These reductions, for the year ended August 31, 2014, for Class A and Class 529A amounted to $341,770 and $28,101, respectively, and are included in the reduction of total expenses in the Statement of Operations. During the year ended August 31, 2014, MFD also voluntarily waived a receipt of $1,524,166 of the fund’s distribution and service fees to ensure the fund avoids a negative yield for Class B, Class C, Class R1, Class R2, Class R3, Class 529B, and Class 529C shares. This amount is included in the reduction of total expenses in the Statement of Operations. |
Certain Class A shares acquired through an exchange may be subject to a contingent deferred sales charge (CDSC) upon redemption depending on when the shares exchanged were originally purchased. Class C and Class 529C shares are subject to a CDSC in the event of a shareholder redemption within 12 months of purchase. Class B and Class 529B shares are subject to a CDSC in the event of a shareholder redemption within six years of purchase. All contingent deferred sales charges are paid to MFD and during the year ended August 31, 2014, were as follows:
| | | | |
| | | Amount | |
| Class A | | | $176 | |
| Class B | | | 79,996 | |
| Class C | | | 19,887 | |
| Class 529B | | | 426 | |
| Class 529C | | | 193 | |
23
Notes to Financial Statements – continued
The fund has entered into and may from time to time enter into contracts with program managers and other parties which administer the tuition programs through which an investment in the fund’s 529 share classes is made. The fund has entered into an agreement with MFD pursuant to which MFD receives an annual fee of up to 0.10% of the average daily net assets attributable to each 529 share class. MFD has agreed to waive a portion of this fee in an amount equal to 0.05% of the average daily net assets for each 529 share class. This waiver agreement will expire on December 31, 2015, unless MFD elects to extend the waiver. For the year ended August 31, 2014, this waiver amounted to $9,182 and is included in the reduction of total expenses in the Statement of Operations. In addition, MFS voluntarily waived receipt of $9,181 of the fund’s program manager fees in order to avoid a negative yield for Class 529A, Class 529B, and Class 529C shares. This amount, for the year ended August 31, 2014, is included in the reduction of total expenses in the Statement of Operations. This voluntary waiver had the effect of reducing the program manager fee by 0.05% of average daily net assets attributable to Class 529A, Class 529B, and Class 529C shares on an annualized basis. The program manager fee incurred for the year ended August 31, 2014 was equivalent to an annual effective rate of 0.00% of the average daily net assets attributable to each 529 share class. The services provided by MFD, or a third party with which MFD contracts, include recordkeeping and tax reporting and account services, as well as services designed to maintain the program’s compliance with the Internal Revenue Code and other regulatory requirements. Program manager fees and waivers for the year ended August 31, 2014, were as follows:
| | | | | | | | |
| | | Fee | | | Waiver | |
| Class 529A | | | $11,240 | | | | $11,240 | |
| Class 529B | | | 633 | | | | 633 | |
| Class 529C | | | 6,490 | | | | 6,490 | |
| Total Program Manager Fees and Waivers | | | $18,363 | | | | $18,363 | |
Shareholder Servicing Agent – MFS Service Center, Inc. (MFSC), a wholly-owned subsidiary of MFS, receives a fee from the fund for its services as shareholder servicing agent calculated as a percentage of the average daily net assets of the fund as determined periodically under the supervision of the fund’s Board of Trustees. For the year ended August 31, 2014, the fee was $209,947, which equated to 0.0548% annually of the fund’s average daily net assets. MFSC also receives payment from the fund for out-of-pocket expenses, sub-accounting and other shareholder servicing costs which may be paid to affiliated and unaffiliated service providers. For the year ended August 31, 2014, these out-of-pocket expenses, sub-accounting and other shareholder servicing costs amounted to $415,505.
Administrator – MFS provides certain financial, legal, shareholder communications, compliance, and other administrative services to the fund. Under an administrative services agreement, the fund partially reimburses MFS the costs incurred to provide these services. The fund is charged an annual fixed amount of $17,500 plus a fee based on average daily net assets. The administrative services fee incurred for the year ended August 31, 2014 was equivalent to an annual effective rate of 0.0148% of the fund’s average daily net assets.
24
Notes to Financial Statements – continued
Trustees’ and Officers’ Compensation – The fund pays compensation to independent Trustees in the form of a retainer, attendance fees, and additional compensation to Board and Committee chairpersons. The fund does not pay compensation directly to Trustees or officers of the fund who are also officers of the investment adviser, all of whom receive remuneration for their services to the fund from MFS. Certain officers and Trustees of the fund are officers or directors of MFS, MFD, and MFSC.
Prior to December 31, 2001, the fund had an unfunded defined benefit plan (“DB plan”) for independent Trustees. As of December 31, 2001, the Board took action to terminate the DB plan with respect to then-current and any future independent Trustees, such that the DB plan covers only certain of those former independent Trustees who retired on or before December 31, 2001. The DB plan resulted in a pension expense of $923 and is included in independent Trustees’ compensation for the year ended August 31, 2014. The liability for deferred retirement benefits payable to certain independent Trustees under the DB plan amounted to $11,369 at August 31, 2014, and is included in “Payable for independent Trustees’ compensation” in the Statement of Assets and Liabilities.
Other – This fund and certain other funds managed by MFS (the funds) have entered into services agreements (the Agreements) which provide for payment of fees by the funds to Tarantino LLC and Griffin Compliance LLC in return for the provision of services of an Independent Chief Compliance Officer (ICCO) and Assistant ICCO, respectively, for the funds. The funds can terminate the Agreements with Tarantino LLC and Griffin Compliance LLC at any time under the terms of the Agreements. The ICCO is an officer of the funds and the sole member of Tarantino LLC. Prior to June 1, 2014, Robyn L. Griffin served as the Assistant ICCO and was an officer of the funds. Ms. Griffin is the sole member of Griffin Compliance LLC. Effective May 31, 2014, Ms. Griffin resigned as Assistant ICCO and the service agreement between the funds and Griffin Compliance LLC was terminated. For the year ended August 31, 2014, the aggregate fees paid by the fund to Tarantino LLC and Griffin Compliance LLC were $2,070 and are included in “Miscellaneous” expense in the Statement of Operations. MFS has agreed to reimburse the fund for a portion of the payments made by the fund in the amount of $557, which is included in the reduction of total expenses in the Statement of Operations. Additionally, MFS has agreed to bear all expenses associated with office space, other administrative support, and supplies provided to the ICCO and Assistant ICCO.
On October 9, 2013, MFS purchased 2,600,000 shares of Class R4 for an aggregate amount of $2,600,000. At August 31, 2014, MFS held approximately 89% of the outstanding shares of Class R4.
25
Notes to Financial Statements – continued
(4) Shares of Beneficial Interest
The fund’s Declaration of Trust permits the Trustees to issue an unlimited number of full and fractional shares of beneficial interest. Transactions in fund shares were as follows:
| | | | | | | | | | | | | | | | |
| | | Year ended
8/31/14 | | | Year ended
8/31/13 | |
| | | Shares | | | Amount | | | Shares | | | Amount | |
| Shares sold | | | | | | | | | | | | | | | | |
Class A | | | 68,204,993 | | | | $68,204,998 | | | | 90,857,358 | | | | $90,857,364 | |
Class B | | | 10,789,946 | | | | 10,789,945 | | | | 18,713,001 | | | | 18,713,002 | |
Class C | | | 34,883,605 | | | | 34,883,605 | | | | 50,242,109 | | | | 50,242,109 | |
Class R1 | | | 5,104,049 | | | | 5,104,049 | | | | 8,748,971 | | | | 8,748,971 | |
Class R2 | | | 14,432,020 | | | | 14,432,021 | | | | 22,356,847 | | | | 22,356,847 | |
Class R3 | | | 25,816,000 | | | | 25,816,000 | | | | 20,910,727 | | | | 20,910,725 | |
Class R4 | | | 2,901,681 | | | | 2,901,681 | | | | 373,688 | | | | 373,688 | |
Class 529A | | | 4,546,774 | | | | 4,546,774 | | | | 5,719,574 | | | | 5,719,574 | |
Class 529B | | | 329,642 | | | | 329,642 | | | | 386,062 | | | | 386,062 | |
Class 529C | | | 3,360,364 | | | | 3,360,364 | | | | 3,685,179 | | | | 3,685,179 | |
| | | 170,369,074 | | | | $170,369,079 | | | | 221,993,516 | | | | $221,993,521 | |
| | | | |
| Shares reacquired | | | | | | | | | | | | | | | | |
Class A | | | (88,717,004 | ) | | | $(88,717,004 | ) | | | (72,078,513 | ) | | | $(72,078,513 | ) |
Class B | | | (18,641,374 | ) | | | (18,641,379 | ) | | | (22,978,285 | ) | | | (22,978,292 | ) |
Class C | | | (47,585,499 | ) | | | (47,585,499 | ) | | | (41,729,343 | ) | | | (41,729,343 | ) |
Class R1 | | | (9,365,466 | ) | | | (9,365,466 | ) | | | (12,030,084 | ) | | | (12,030,084 | ) |
Class R2 | | | (31,204,212 | ) | | | (31,204,212 | ) | | | (31,674,198 | ) | | | (31,674,198 | ) |
Class R3 | | | (36,824,742 | ) | | | (36,824,742 | ) | | | (35,015,288 | ) | | | (35,015,288 | ) |
Class R4 | | | (814,201 | ) | | | (814,201 | ) | | | (364,480 | ) | | | (364,479 | ) |
Class 529A | | | (4,517,477 | ) | | | (4,517,477 | ) | | | (5,151,748 | ) | | | (5,151,747 | ) |
Class 529B | | | (474,489 | ) | | | (474,490 | ) | | | (375,895 | ) | | | (375,896 | ) |
Class 529C | | | (3,192,514 | ) | | | (3,192,514 | ) | | | (2,632,719 | ) | | | (2,632,719 | ) |
| | | (241,336,978 | ) | | | $(241,336,984 | ) | | | (224,030,553 | ) | | | $(224,030,559 | ) |
| | | | |
| Net change | | | | | | | | | | | | | | | | |
Class A | | | (20,512,011 | ) | | | $(20,512,006 | ) | | | 18,778,845 | | | | $18,778,851 | |
Class B | | | (7,851,428 | ) | | | (7,851,434 | ) | | | (4,265,284 | ) | | | (4,265,290 | ) |
Class C | | | (12,701,894 | ) | | | (12,701,894 | ) | | | 8,512,766 | | | | 8,512,766 | |
Class R1 | | | (4,261,417 | ) | | | (4,261,417 | ) | | | (3,281,113 | ) | | | (3,281,113 | ) |
Class R2 | | | (16,772,192 | ) | | | (16,772,191 | ) | | | (9,317,351 | ) | | | (9,317,351 | ) |
Class R3 | | | (11,008,742 | ) | | | (11,008,742 | ) | | | (14,104,561 | ) | | | (14,104,563 | ) |
Class R4 | | | 2,087,480 | | | | 2,087,480 | | | | 9,208 | | | | 9,209 | |
Class 529A | | | 29,297 | | | | 29,297 | | | | 567,826 | | | | 567,827 | |
Class 529B | | | (144,847 | ) | | | (144,848 | ) | | | 10,167 | | | | 10,166 | |
Class 529C | | | 167,850 | | | | 167,850 | | | | 1,052,460 | | | | 1,052,460 | |
| | | (70,967,904 | ) | | | $(70,967,905 | ) | | | (2,037,037 | ) | | | $(2,037,038 | ) |
26
Notes to Financial Statements – continued
(5) Line of Credit
The fund and certain other funds managed by MFS participate in a $1.1 billion unsecured committed line of credit, subject to a $1 billion sublimit, provided by a syndication of banks under a credit agreement. Borrowings may be made for temporary financing needs. Interest is charged to each fund, based on its borrowings, generally at a rate equal to the higher of the Federal Reserve funds rate or one month LIBOR plus an agreed upon spread. A commitment fee, based on the average daily, unused portion of the committed line of credit, is allocated among the participating funds at the end of each calendar quarter. In addition, the fund and other funds managed by MFS have established unsecured uncommitted borrowing arrangements with certain banks for temporary financing needs. Interest is charged to each fund, based on its borrowings, at a rate equal to the Federal Reserve funds rate plus an agreed upon spread. For the year ended August 31, 2014, the fund’s commitment fee and interest expense were $1,584 and $0, respectively, and are included in “Miscellaneous” expense in the Statement of Operations.
27
REPORT OF INDEPENDENT REGISTERED PUBLIC ACCOUNTING FIRM
To the Board of Trustees of MFS Series Trust I and the Shareholders of MFS U.S. Government Cash Reserve Fund (formerly MFS Cash Reserve Fund):
We have audited the accompanying statement of assets and liabilities, including the portfolio of investments, of MFS U.S. Government Cash Reserve Fund (one of the series of MFS Series Trust I) (the “Fund”) as of August 31, 2014, and the related statement of operations for the year then ended, the statements of changes in net assets for each of the two years in the period then ended, and the financial highlights for each of the five years in the period then ended. These financial statements and financial highlights are the responsibility of the Fund’s management. Our responsibility is to express an opinion on these financial statements and financial highlights based on our audits.
We conducted our audits in accordance with the standards of the Public Company Accounting Oversight Board (United States). Those standards require that we plan and perform the audit to obtain reasonable assurance about whether the financial statements and financial highlights are free of material misstatement. The Fund is not required to have, nor were we engaged to perform, an audit of its internal control over financial reporting. Our audits included consideration of internal control over financial reporting as a basis for designing audit procedures that are appropriate in the circumstances, but not for the purpose of expressing an opinion on the effectiveness of the Fund’s internal control over financial reporting. Accordingly, we express no such opinion. An audit also includes examining, on a test basis, evidence supporting the amounts and disclosures in the financial statements, assessing the accounting principles used and significant estimates made by management, as well as evaluating the overall financial statement presentation. Our procedures included confirmation of securities owned as of August 31, 2014, by correspondence with the custodian. We believe that our audits provide a reasonable basis for our opinion.
In our opinion, the financial statements and financial highlights referred to above present fairly, in all material respects, the financial position of MFS U.S. Government Cash Reserve Fund as of August 31, 2014, the results of its operations for the year then ended, the changes in its net assets for each of the two years in the period then ended, and the financial highlights for each of the five years in the period then ended, in conformity with accounting principles generally accepted in the United States of America.
DELOITTE & TOUCHE LLP
Boston, Massachusetts
October 16, 2014
28
TRUSTEES AND OFFICERS — IDENTIFICATION AND BACKGROUND
The Trustees and Officers of the Trust, as of October 1, 2014, are listed below, together with their principal occupations during the past five years. (Their titles may have varied during that period.) The address of each Trustee and Officer is 111 Huntington Avenue, Boston, Massachusetts 02199-7618. It is expected that the Board will appoint Mr. Timothy M. Fagan as Chief Compliance Officer of the MFS Funds on November 1, 2014.
| | | | | | | | |
Name, Age | | Position(s) Held with Fund | | Trustee/Officer
Since (h) | | Principal
Occupations During the Past Five Years | | Other Directorships (j) |
| INTERESTED TRUSTEES |
Robert J. Manning (k)
(age 50) | | Trustee | | February 2004 | | Massachusetts Financial Services Company, Chairman, Chief Executive Officer and Director; President (until 2009); Chief Investment Officer (until 2010) | | N/A |
Robin A. Stelmach (k)
(age 53) | | Trustee and President | | January 2014 | | Massachusetts Financial Services Company, Executive Vice President and Chief Operating Officer | | N/A |
| INDEPENDENT TRUSTEES | | |
David H. Gunning
(age 72) | | Trustee and Chair of Trustees | | January 2004 | | Private investor | | Lincoln Electric Holdings, Inc. (welding equipment manufacturer), Director; Development Alternatives, Inc. (consulting), Director/Non-Executive Chairman |
Steven E. Buller (age 63) | | Trustee | | February 2014 | | Chairman, Financial Accounting Standards Advisory Council; Standing Advisory Group, Public Company Accounting Oversight Board, Member; BlackRock, Inc. (investment management), Managing Director (until 2014), BlackRock Finco UK (investment management), Director (until 2014) | | N/A |
29
Trustees and Officers – continued
| | | | | | | | |
Name, Age | | Position(s) Held with Fund | | Trustee/Officer
Since (h) | | Principal
Occupations During the Past Five Years | | Other Directorships (j) |
Robert E. Butler
(age 72) | | Trustee | | January 2006 | | Consultant – investment company industry regulatory and compliance matters | | N/A |
Maureen R. Goldfarb
(age 59) | | Trustee | | January 2009 | | Private investor | | N/A |
William R. Gutow
(age 73) | | Trustee | | December 1993 | | Private investor and real estate consultant; Capitol Entertainment Management Company (video franchise), Vice Chairman | | Texas Donuts (donut franchise), Vice Chairman (until 2010) |
Michael Hegarty
(age 69) | | Trustee | | December 2004 | | Private investor | | Brookfield Office Properties, Inc. (real estate), Director; Rouse Properties Inc. (real estate), Director; Capmark Financial Group Inc. (real estate), Director |
John P. Kavanaugh
(age 59) | | Trustee | | January 2009 | | Private investor | | N/A |
Maryanne L. Roepke
(age 58) | | Trustee | | May 2014 | | American Century Investments (investment management), Senior Vice President and Chief Compliance Officer (until 2014) | | N/A |
Laurie J. Thomsen
(age 57) | | Trustee | | March 2005 | | Private investor; New Profit, Inc. (venture philanthropy), Executive Partner (until 2010) | | The Travelers Companies (insurance), Director |
Robert W. Uek
(age 73) | | Trustee | | January 2006 | | Consultant to investment company industry | | N/A |
| OFFICERS | | | | | | |
Christopher R. Bohane (k)
(age 40) | | Assistant Secretary and Assistant Clerk | | July 2005 | | Massachusetts Financial Services Company, Vice President and Assistant General Counsel | | N/A |
Kino Clark (k)
(age 46) | | Assistant Treasurer | | January 2012 | | Massachusetts Financial Services Company, Vice President | | N/A |
30
Trustees and Officers – continued
| | | | | | | | |
Name, Age | | Position(s) Held with Fund | | Trustee/Officer
Since (h) | | Principal
Occupations During the Past Five Years | | Other Directorships (j) |
Thomas H. Connors (k)
(age 55) | | Assistant Secretary and Assistant Clerk | | September 2012 | | Massachusetts Financial Services Company, Vice President and Senior Counsel; Deutsche Investment Management Americas Inc. (financial service provider), Director and Senior Counsel (until 2012) | | N/A |
Ethan D. Corey (k)
(age 50) | | Assistant Secretary and Assistant Clerk | | July 2005 | | Massachusetts Financial Services Company, Senior Vice President and Associate General Counsel | | N/A |
David L. DiLorenzo (k)
(age 46) | | Treasurer | | July 2005 | | Massachusetts Financial Services Company, Senior Vice President | | N/A |
Brian E. Langenfeld (k) (age 41) | | Assistant Secretary and Assistant Clerk | | June 2006 | | Massachusetts Financial Services Company, Vice President and Senior Counsel | | N/A |
Susan S. Newton (k) (age 64) | | Assistant Secretary and Assistant Clerk | | May 2005 | | Massachusetts Financial Services Company, Senior Vice President and Associate General Counsel | | N/A |
Susan A. Pereira (k)
(age 43) | | Assistant Secretary and Assistant Clerk | | July 2005 | | Massachusetts Financial Services Company, Vice President and Senior Counsel | | N/A |
Kasey L. Phillips (k) (age 43) | | Assistant Treasurer | | September 2012 | | Massachusetts Financial Services Company, Vice President; Wells Fargo Funds Management, LLC, Senior Vice President, Fund Treasurer (until 2012) | | N/A |
Mark N. Polebaum (k)
(age 62) | | Secretary and Clerk | | January 2006 | | Massachusetts Financial Services Company, Executive Vice President, General Counsel and Secretary | | N/A |
31
Trustees and Officers – continued
| | | | | | | | |
Name, Age | | Position(s) Held with Fund | | Trustee/Officer
Since (h) | | Principal
Occupations During the Past Five Years | | Other Directorships (j) |
Matthew A. Stowe (k)
(age 39) | | Assistant Secretary and Assistant Clerk | | October 2014 | | Massachusetts Financial Services Company, Vice President and Senior Counsel | | N/A |
Frank L. Tarantino (l)
(age 70) | | Independent Chief Compliance Officer | | June 2004 | | Tarantino LLC (provider of compliance services), Principal | | N/A |
Richard S. Weitzel (k)
(age 44) | | Assistant Secretary and Assistant Clerk | | October 2007 | | Massachusetts Financial Services Company, Senior Vice President and Associate General Counsel | | N/A |
James O. Yost (k)
(age 54) | | Deputy Treasurer | | September 1990 | | Massachusetts Financial Services Company, Senior Vice President | | N/A |
| (h) | Date first appointed to serve as Trustee/officer of an MFS Fund. Each Trustee has served continuously since appointment unless indicated otherwise. For the period from December 15, 2004 until February 22, 2005, Mr. Manning served as Advisory Trustee. Prior to January 2012, Messrs. DiLorenzo and Yost served as Assistant Treasurers of the Funds. Ms. Stelmach was appointed as President of the Funds as of October 1, 2014. |
| (j) | Directorships or trusteeships of companies required to report to the Securities and Exchange Commission (i.e., “public companies”). |
| (k) | “Interested person” of the Trust within the meaning of the Investment Company Act of 1940 (referred to as the 1940 Act), which is the principal federal law governing investment companies like the fund, as a result of position with MFS. The address of MFS is 111 Huntington Avenue, Boston, Massachusetts 02199-7618. |
| (l) | Mr. Tarantino will retire as Independent Chief Compliance Officer of the MFS Funds on October 31, 2014. It is expected that Mr. Tarantino will continue after that date as an Independent Senior Officer of the MFS Funds. |
Each Trustee (except Ms. Stelmach, Mr. Buller and Ms. Roepke) has been elected by shareholders and each Trustee and officer holds office until his or her successor is chosen and qualified or until his or her earlier death, resignation, retirement or removal. The Trust does not hold annual meetings for the purpose of electing Trustees, and Trustees are not elected for fixed terms. Messrs. Butler, Kavanaugh, Uek and Mses. Thomsen and Roepke are members of the Trust’s Audit Committee.
Each of the Fund’s Trustees and officers holds comparable positions with certain other funds of which MFS or a subsidiary is the investment adviser or distributor, and, in the case of the officers, with certain affiliates of MFS. As of January 1, 2014, the Trustees served as board members of 142 funds within the MFS Family of Funds.
32
Trustees and Officers – continued
The Statement of Additional Information for the Fund includes further information about the Trustees and is available without charge upon request by calling 1-800-225-2606.
| | |
| Investment Adviser | | Custodian |
Massachusetts Financial Services Company
111 Huntington Avenue
Boston, MA 02199-7618 | | State Street Bank and Trust Company 1 Lincoln Street Boston, MA 02111-2900 |
| Distributor | | Independent Registered Public Accounting Firm |
MFS Fund Distributors, Inc.
111 Huntington Avenue
Boston, MA 02199-7618 | | Deloitte & Touche LLP 200 Berkeley Street Boston, MA 02116 |
| Portfolio Manager | | |
Edward O’Dette | | |
33
BOARD REVIEW OF INVESTMENT ADVISORY AGREEMENT
The Investment Company Act of 1940 requires that both the full Board of Trustees and a majority of the non-interested (“independent”) Trustees, voting separately, annually approve the continuation of the Fund’s investment advisory agreement with MFS. The Trustees consider matters bearing on the Fund and its advisory arrangements at their meetings throughout the year, including a review of performance data at each regular meeting. In addition, the independent Trustees met several times over the course of three months beginning in May and ending in July, 2014 (“contract review meetings”) for the specific purpose of considering whether to approve the continuation of the investment advisory agreement for the Fund and the other investment companies that the Board oversees (the “MFS Funds”). The independent Trustees were assisted in their evaluation of the Fund’s investment advisory agreement by independent legal counsel, from whom they received separate legal advice and with whom they met separately from MFS during various contract review meetings. The independent Trustees were also assisted in this process by the MFS Funds’ Independent Chief Compliance Officer, a full-time senior officer appointed by and reporting to the independent Trustees.
In connection with their deliberations regarding the continuation of the investment advisory agreement, the Trustees, including the independent Trustees, considered such information and factors as they believed, in light of the legal advice furnished to them and their own business judgment, to be relevant. The investment advisory agreement for the Fund was considered separately, although the Trustees also took into account the common interests of all MFS Funds in their review. As described below, the Trustees considered the nature, quality, and extent of the various investment advisory, administrative, and shareholder services performed by MFS under the existing investment advisory agreement and other arrangements with the Fund.
In connection with their contract review meetings, the Trustees received and relied upon materials that included, among other items: (i) information provided by Lipper Inc., an independent third party, on the investment performance of the Fund for various time periods ended December 31, 2013 and the investment performance of a group of funds with substantially similar investment classifications/objectives (the “Lipper performance universe”), (ii) information provided by Lipper Inc. on the Fund’s advisory fees and other expenses and the advisory fees and other expenses of comparable funds identified by Lipper Inc. (the “Lipper expense group”), (iii) information provided by MFS on the advisory fees of comparable portfolios of other clients of MFS, including institutional separate accounts and other clients, (iv) information as to whether and to what extent applicable expense waivers, reimbursements or fee “breakpoints” are observed for the Fund, (v) information regarding MFS’ financial results and financial condition, including MFS’ and certain of its affiliates’ estimated profitability from services performed for the Fund and the MFS Funds as a whole, and compared to MFS’ institutional business, (vi) MFS’ views regarding the outlook for the mutual fund industry and the strategic business plans of MFS, (vii) descriptions of various functions performed by MFS for the Funds, such as compliance monitoring and portfolio trading practices, and (viii) information regarding the overall organization of MFS, including information about MFS’ senior management and other personnel providing investment advisory, administrative and other services to
34
Board Review of Investment Advisory Agreement – continued
the Fund and the other MFS Funds. The comparative performance, fee and expense information prepared and provided by Lipper Inc. was not independently verified and the independent Trustees did not independently verify any information provided to them by MFS.
The Trustees’ conclusion as to the continuation of the investment advisory agreement was based on a comprehensive consideration of all information provided to the Trustees and not the result of any single factor. Some of the factors that figured particularly in the Trustees’ deliberations are described below, although individual Trustees may have evaluated the information presented differently from one another, giving different weights to various factors. It is also important to recognize that the fee arrangements for the Fund and other MFS Funds are the result of years of review and discussion between the independent Trustees and MFS, that certain aspects of such arrangements may receive greater scrutiny in some years than in others, and that the Trustees’ conclusions may be based, in part, on their consideration of these same arrangements during the course of the year and in prior years.
Based on information provided by Lipper Inc. and MFS, the Trustees reviewed the Fund’s total return investment performance as well as the performance of peer groups of funds over various time periods. The Trustees placed particular emphasis on the total return performance of the Fund’s Class A shares in comparison to the performance of funds in its Lipper performance universe over the three-year period ended December 31, 2013, which the Trustees believed was a long enough period to reflect differing market conditions. The total return performance of the Fund’s Class A shares was in the 4th quintile relative to the other funds in the universe for this three-year period (the 1st quintile being the best performers and the 5th quintile being the worst performers). The total return performance of the Fund’s Class A shares was in the 4th quintile for the one-year period and the 5th quintile for the five-year period ended December 31, 2013 relative to the Lipper performance universe. Because of the passage of time, these performance results may differ from the performance results for more recent periods, including those shown elsewhere in this report.
In the course of their deliberations, the Trustees took into account information provided by MFS in connection with the contract review meetings, as well as during investment review meetings conducted with portfolio management personnel during the course of the year regarding the Fund’s performance. In addition, the Trustees noted the market conditions affecting all money market funds, in particular the low interest rate environment, and MFS’ voluntary waiver of its fees to ensure that the Fund avoids a negative yield. After reviewing these and related factors, the Trustees concluded, within the context of their overall conclusions regarding the investment advisory agreement, that they were satisfied with MFS’ responses and efforts relating to investment performance.
In assessing the reasonableness of the Fund’s advisory fee, the Trustees considered, among other information, the Fund’s advisory fee and the total expense ratio of the Fund’s Class A shares as a percentage of average daily net assets and the advisory fee and total expense ratios of peer groups of funds based on information provided by Lipper Inc. The Trustees considered that MFS Fund Distributors, Inc. (“MFD”), an affiliate of MFS, currently observes a Class A 12b-1 fee waiver, which may not be changed without the Trustees’ approval. The Trustees also considered that, according
35
Board Review of Investment Advisory Agreement – continued
to the Lipper data (which takes into account any fee reductions or expense limitations that were in effect during the Fund’s last fiscal year), the Fund’s effective advisory fee rate was lower than the Lipper expense group median, and the Fund’s total expense ratio was approximately at the Lipper expense group median.
The Trustees also considered the advisory fees charged by MFS to any comparable institutional accounts. In comparing these fees, the Trustees considered information provided by MFS as to the generally broader scope of services provided by MFS to the Fund in comparison to institutional accounts, the higher demands placed on MFS’ investment personnel and trading infrastructure as a result of the daily cash in-flows and out-flows of the Fund, and the impact on MFS and expenses associated with the more extensive regulatory regime to which the Fund is subject in comparison to institutional accounts.
The Trustees also considered whether the Fund may benefit from any economies of scale in the management of the Fund in the event of growth in assets of the Fund and/or growth in assets of the MFS Funds as a whole. They noted that the Fund’s advisory fee rate schedule is not subject to any breakpoints. Taking into account that the Fund’s effective advisory fee rate was lower than the Lipper expense group median described above, the Trustees determined not to recommend any advisory fee breakpoints for the Fund at this time. The Trustees also noted that MFS has agreed in writing to waive a portion of the management fees of certain MFS Funds, including the Fund, if the total combined assets of certain funds within the MFS Funds’ complex increase above agreed upon thresholds (the “group fee waiver”), enabling the Fund’s shareholders to share in the benefits from any economies of scale at the complex level. The group fee waiver is reviewed and renewed annually between the Board and MFS. The Trustees concluded that the group fee waiver was sufficient to allow the Fund to benefit from economies of scale as its assets and overall complex assets grow.
The Trustees also considered information prepared by MFS relating to MFS’ costs and profits with respect to the Fund, the MFS Funds considered as a group, and other investment companies and accounts advised by MFS, as well as MFS’ methodologies used to determine and allocate its costs to the MFS Funds, the Fund and other accounts and products for purposes of estimating profitability.
After reviewing these and other factors described herein, the Trustees concluded, within the context of their overall conclusions regarding the investment advisory agreement, that the advisory fees charged to the Fund represent reasonable compensation in light of the services being provided by MFS to the Fund.
In addition, the Trustees considered MFS’ resources and related efforts to continue to retain, attract and motivate capable personnel to serve the Fund. The Trustees also considered current and developing conditions in the financial services industry, including the presence of large and well-capitalized companies which are spending, and appear to be prepared to continue to spend, substantial sums to engage personnel and to provide services to competing investment companies. In this regard, the Trustees also considered the financial resources of MFS and its ultimate parent, Sun Life Financial Inc. The Trustees also considered the advantages and possible disadvantages to the Fund of having an adviser that also serves other investment companies as well as other accounts.
36
Board Review of Investment Advisory Agreement – continued
The Trustees also considered the nature, quality, cost, and extent of administrative, transfer agency, and distribution services provided to the Fund by MFS and its affiliates under agreements and plans other than the investment advisory agreement, including any 12b-1 fees the Fund pays to MFD. The Trustees also considered the nature, extent and quality of certain other services MFS performs or arranges for on the Fund’s behalf, which may include securities lending programs, directed expense payment programs, class action recovery programs, and MFS’ interaction with third-party service providers, principally custodians and sub-custodians. The Trustees concluded that the various non-advisory services provided by MFS and its affiliates on behalf of the Fund were satisfactory.
The Trustees also considered benefits to MFS from the use of the Fund’s portfolio brokerage commissions, if applicable, to pay for investment research and various other factors. Additionally, the Trustees considered so-called “fall-out benefits” to MFS such as reputational value derived from serving as investment manager to the Fund.
Based on their evaluation of factors that they deemed to be material, including those factors described above, the Board of Trustees, including the independent Trustees, concluded that the Fund’s investment advisory agreement with MFS should be continued for an additional one-year period, commencing August 1, 2014.
37
PROXY VOTING POLICIES AND INFORMATION
MFS votes proxies on behalf of the fund pursuant to proxy voting policies and procedures that are available without charge, upon request, by calling 1-800-225-2606, by visiting the Proxy Voting section of mfs.com or by visiting the SEC’s Web site at http://www.sec.gov.
Information regarding how the fund voted proxies relating to portfolio securities during the most recent twelve-month period ended June 30 is available without charge by visiting the Proxy Voting section of mfs.com or by visiting the SEC’s Web site at http://www.sec.gov.
QUARTERLY PORTFOLIO DISCLOSURE
The fund will file a complete schedule of portfolio holdings with the Securities and Exchange Commission (the Commission) for the first and third quarters of each fiscal year on Form N-Q. A shareholder can obtain the quarterly portfolio holdings report at mfs.com. The fund’s Form N-Q is also available on the EDGAR database on the Commission’s Internet Web site at http://www.sec.gov, and may be reviewed and copied at the:
Public Reference Room
Securities and Exchange Commission
100 F Street, NE, Room 1580
Washington, D.C. 20549
Information on the operation of the Public Reference Room may be obtained by calling the Commission at 1-800-SEC-0330. Copies of the fund’s Form N-Q also may be obtained, upon payment of a duplicating fee, by electronic request at the following e-mail address: publicinfo@sec.gov or by writing the Public Reference Section at the above address.
FURTHER INFORMATION
From time to time, MFS may post important information about the fund or the MFS funds on the MFS web site (mfs.com). This information is available by visiting the “Commentary & Announcements” and “Market Outlooks” sections of mfs.com or by clicking on the fund’s name under “Mutual Funds” in the “Products” section of mfs.com.
FEDERAL TAX INFORMATION (unaudited)
The fund will notify shareholders of amounts for use in preparing 2014 income tax forms in January 2015.
38
rev. 3/11
| | | | |
| | | |
FACTS | | WHAT DOES MFS DO WITH YOUR PERSONAL INFORMATION? | |  |
| | |
| Why? | | Financial companies choose how they share your personal information. Federal law gives consumers the right to limit some but not all sharing. Federal law also requires us to tell you how we collect, share, and protect your personal information. Please read this notice carefully to understand what we do. |
| | |
| What? | | The types of personal information we collect and share depend on the product or service you have with us. This information can include: • Social Security number and account balances • Account transactions and transaction history • Checking account information and wire transfer instructions When you are no longer our customer, we continue to share your information as described in this notice. |
| | |
| How? | | All financial companies need to share customers’ personal information to run their everyday business. In the section below, we list the reasons financial companies can share their customers’ personal information; the reasons MFS chooses to share; and whether you can limit this sharing. |
| | | | |
Reasons we can share your
personal information | | Does MFS
share? | | Can you limit
this sharing? |
For our everyday business purposes – such as to process your transactions, maintain your account(s), respond to court orders and legal investigations, or report to credit bureaus | | Yes | | No |
For our marketing purposes – to offer our products and services to you | | No | | We don’t share |
| For joint marketing with other financial companies | | No | | We don’t share |
For our affiliates’ everyday business purposes – information about your transactions and experiences | | No | | We don’t share |
For our affiliates’ everyday business purposes – information about your creditworthiness | | No | | We don’t share |
| For nonaffiliates to market to you | | No | | We don’t share |
| | |
| Questions? | | Call 800-225-2606 or go to mfs.com. |
39
| | |
| Who we are |
| Who is providing this notice? | | MFS Funds, MFS Investment Management, MFS Institutional Advisors, Inc., MFS Fund Distributors, Inc., MFS Heritage Trust Company, and MFS Service Center, Inc. |
| | |
| What we do |
| How does MFS protect my personal information? | | To protect your personal information from unauthorized access and use, we use security measures that comply with federal law. These measures include procedural, electronic, and physical safeguards for the protection of the personal information we collect about you. |
| How does MFS collect my personal information? | | We collect your personal information, for example, when you •open an account or provide account information •direct us to buy securities or direct us to sell your securities •make a wire transfer We also collect your personal information from others, such as credit bureaus, affiliates and other companies. |
| Why can’t I limit all sharing? | | Federal law gives you the right to limit only •sharing for affiliates’ everyday business purposes – information about your creditworthiness •affiliates from using your information to market to you •sharing for nonaffiliates to market to you State laws and individual companies may give you additional rights to limit sharing. |
| | |
| Definitions |
| Affiliates | | Companies related by common ownership or control. They can be financial and nonfinancial companies. •MFS does not share personal information with affiliates, except for everyday business purposes as described on page one of this notice. |
| Nonaffiliates | | Companies not related by common ownership or control. They can be financial and nonfinancial companies. •MFS does not share with nonaffiliates so they can market to you. |
| Joint Marketing | | A formal agreement between nonaffiliated financial companies that together market financial products or services to you. •MFS doesn’t jointly market. |
| | |
| Other important information |
| If you own an MFS product or receive an MFS service in the name of a third party such as a bank or broker-dealer, their privacy policy may apply to you instead of ours. |
40
Save paper with eDelivery.

| MFS® will send you prospectuses, |
reports, and proxies directly via e-mail so you will get information faster with less mailbox clutter.
To sign up:
1. Go to mfs.com.
2. Log in via MFS® Access.
3. Select eDelivery.
If you own your MFS fund shares through a financial institution or a retirement plan, MFS® TALK, MFS® Access, or eDelivery may not be available to you.
CONTACT
WEB SITE
mfs.com
MFS TALK
1-800-637-8255
24 hours a day
ACCOUNT SERVICE AND LITERATURE
Shareholders
1-800-225-2606
Financial advisors
1-800-343-2829
Retirement plan services
1-800-637-1255
MAILING ADDRESS
MFS Service Center, Inc.
P.O. Box 55824
Boston, MA 02205-5824
OVERNIGHT MAIL
MFS Service Center, Inc.
c/o Boston Financial Data Services
30 Dan Road
Canton, MA 02021-2809
ANNUAL REPORT
August 31, 2014

MFS® VALUE FUND

EIF-ANN
MFS® VALUE FUND
CONTENTS
The report is prepared for the general information of shareholders.
It is authorized for distribution to prospective investors only when preceded or accompanied by a current prospectus.
NOT FDIC INSURED Ÿ MAY LOSE VALUE Ÿ NO BANK GUARANTEE

LETTER FROM THE CHAIRMAN AND CEO
Dear Shareholders:
The U.S. economy continues to gain strength. Manufacturing output, construction activity and consumer confidence are all at multi-year highs, auto sales are robust, and
U.S. labor market reports show broad progress. Even a slowdown in the pace of rising house prices is seen as making the market more sustainable. Economists have a favorable outlook, and broad stock indices reflect that.
However, challenges dominate the rest of the global economy. China is struggling to boost its industrial output and Japan’s economic turnaround appears to have hit a setback after its sales tax increase in April. The eurozone economy is being held back by persistently high unemployment and dangerously low inflation, leading the European Central Bank to take more
aggressive stimulus action. With robust corporate earnings, the market’s greatest concerns relate to conflicts in the Middle East and Ukraine. In addition, speculation continues on when the U.S. Federal Reserve will begin tightening its monetary policy now that the U.S. economy has regained some traction.
As always at MFS®, active risk management is integral to how we manage your investments. We use a collaborative process, sharing insights across asset classes, regions and economic sectors. Our global team of investment professionals uses a multidisciplined, long-term, diversified investment approach.
We understand that these are challenging economic times. We believe we can serve you best by applying proven principles, such as asset allocation and diversification, over the long term. We are confident that this approach can help you as you work with your financial advisors to reach your goals in the years ahead.
Respectfully,

Robert J. Manning
Chairman and Chief Executive Officer
MFS Investment Management
October 16, 2014
The opinions expressed in this letter are subject to change and may not be relied upon for investment advice. No forecasts can be guaranteed.
1
PORTFOLIO COMPOSITION
Portfolio structure

| | | | |
| Top ten holdings | | | | |
| JPMorgan Chase & Co. | | | 4.2% | |
| Philip Morris International, Inc. | | | 3.6% | |
| Johnson & Johnson | | | 3.6% | |
| Wells Fargo & Co. | | | 3.2% | |
| Pfizer, Inc. | | | 2.8% | |
| Exxon Mobil Corp. | | | 2.2% | |
| Lockheed Martin Corp. | | | 2.2% | |
| Accenture PLC, “A” | | | 2.1% | |
| 3M Co. | | | 2.0% | |
| United Technologies Corp. | | | 2.0% | |
| | | | |
| Equity sectors | | | | |
| Financial Services | | | 24.8% | |
| Health Care | | | 14.0% | |
| Consumer Staples | | | 12.1% | |
| Industrial Goods & Services | | | 10.8% | |
| Leisure | | | 7.2% | |
| Energy | | | 6.4% | |
| Retailing | | | 4.7% | |
| Basic Materials | | | 4.0% | |
| Technology | | | 3.8% | |
| Special Products & Services | | | 3.2% | |
| Utilities & Communications | | | 3.0% | |
| Autos & Housing | | | 2.5% | |
| Transportation | | | 2.3% | |
Cash & Other can include cash, other assets less liabilities, offsets to derivative positions, and short-term securities.
Percentages are based on net assets as of 8/31/14.
The portfolio is actively managed and current holdings may be different.
2
MANAGEMENT REVIEW
Summary of Results
For the twelve months ended August 31, 2014, Class A shares of the MFS Value Fund (“fund”) provided a total return of 20.78%, at net asset value. This compares with a return of 24.43% for the fund’s benchmark, the Russell 1000 Value Index.
Market Environment
Early in the period, equity markets advanced in response to improved economic fundamentals, having recovered from prior weakness stemming from concerns that the US Federal Reserve (“Fed”) would begin tapering its quantitative easing (“QE”) program. A general theme in the market was a rotation in investor allocations from fixed income to equities and emerging markets (“EM”) to developed markets, reflecting an anticipated acceleration in developed market growth rates relative to EM as well as a more equity-friendly macro backdrop amid increased volatility in EM debt. As the period progressed, the Fed’s decision to postpone QE tapering surprised markets. Favorable market reactions were tempered, however, by tense negotiations over US fiscal policy which resulted in a 16-day partial shutdown of the federal government and a short-term extension in the debt ceiling. The volatility was short-lived, however, as an extension of budget and debt ceiling deadlines allowed the government to re-open, and subsequent economic data reflected moderate but resilient US growth. Also well-received was the decision by the European Central Bank (“ECB”) to cut its policy rate as inflation pressures waned in the region. In addition, equity investors appeared to have concluded that there would be no major change in US monetary policy as a result of the nomination of Janet Yellen as the new Fed Chair for a term beginning in early 2014 and that tapering would have no major impact on the trajectory.
Later in the period, financial markets were forced to contend with a series of positive and negative return episodes. In addition to periodic flashpoints in country specific emerging markets, geopolitical tensions flared in the Middle East and Russia/Ukraine. Market setbacks were short-lived, as improving economic growth in the US coupled with prospects for easier monetary policy in regions with slowing growth such as Japan, Europe and China, supported risk assets. For example, the ECB cut policy interest rates into negative territory and by the end of the period expectations were for additional rate cuts and the announcement for non-conventional easing measures. The decline in developed market government bond yields and credit spreads were also supportive for equity markets. At the end of the period, the US equity market was trading at all-time highs.
Detractors from Performance
The combination of weak stock selection and an underweight position in the technology sector detracted from performance relative to the Russell 1000 Value Index. Underweight positions in strong-performing semiconductor company Intel (h) and computer products and services provider Hewlett-Packard (h), and owning shares in diversified technology products and services company International Business Machines (IBM) (b), held back relative performance. Shares of Intel appreciated in the second half of the period as the company reported robust earnings results as demand for business PCs came in stronger than expected and its gross margins were tracking ahead of plan.
3
Management Review – continued
An overweight allocation to the consumer staples sector also weighed on relative results. Within this sector, an overweight position in tobacco company Philip Morris International, and holdings of alcoholic drink producer Diageo (b) (United Kingdom) and international food manufacturer Danone (b) (France) detracted from relative returns as all three stocks lagged the benchmark over the reporting period. Shares of Phillip Morris International hurt relative returns as a result of substantial headwinds from its foreign currency exposure and weaker volume trends in the Philippines and Japan towards the end of the year. In addition, the company slowed the pace of its share repurchase program, which had previously been an offset to these weaker trends. The share price of Diageo depreciated following lower-than-expected fiscal first-half results attributed to the slowdown in emerging markets including China, Thailand and Nigeria.
Stock selection in the health care sector was another factor that weakened relative results. However, there were no individual securities within this sector that were among the fund’s top relative detractors.
Elsewhere, an overweight position in retail store operator Target dampened relative performance. Shares of Target detracted from relative returns as the company suffered a significant data breach during the all-important holiday selling season, which resulted in weaker-than-expected sales and margins, ultimately leading to the resignation of its CEO. Additionally, holdings of fast-food giant McDonald’s (b) and management consulting firm Accenture (b) (Ireland) also hampered relative results as both stocks lagged the benchmark over the period.
The fund’s cash and/or cash equivalents position during the period weakened relative performance. Under normal market conditions, the fund strives to be fully invested and generally holds cash to buy new holdings and to provide liquidity. In a period when markets rose, as measured by the fund’s benchmark, holding cash hurt performance versus the benchmark, which has no cash position.
Contributors to Performance
Security selection in the industrial goods & services aided relative results. Within this sector, the fund’s holdings of defense contractor Lockheed Martin (b), and avoiding shares of poor-performing diversified industrial conglomerate General Electric, boosted relative performance. Shares of Lockheed Martin grew steadily over the reporting period due to consistent and solid quarterly earnings as profit margins continued to offset revenue declines resulting from defense budget pressures.
Stock selection in the financial services sector also supported relative performance. Within this sector, an underweight position in diversified financial services firm Citigroup, and not holding shares of weak-performing financial services firm Bank of America bolstered relative results as both stocks lagged the benchmark during the reporting period. Shares of Citigroup underperformed the market after the company failed its Comprehensive Capital Analysis and Review (“CCAR”) stress test for process reasons and its Securities & Banking division has been weaker-than-expected during the period.
Elsewhere, underweight positions in household products maker Procter & Gamble, telecommunications company AT&T and integrated oil and gas company Exxon Mobil helped relative performance. Shares of Procter & Gamble lagged the benchmark reflecting weaker-than-expected revenue growth and on-going margin pressure,
4
Management Review – continued
despite the company’s large cost reduction program. Holdings of tobacco producer Lorillard (b) and auto parts retailer Advance Auto Parts (b) were also among the fund’s top relative contributors. Lorillard strongly outperformed the market during the period following an offer by Reynolds American to acquire the company at a premium. Not owning shares in network equipment company Cisco Systems also bolstered relative returns.
Respectfully,
| | |
| Nevin Chitkara | | Steven Gorham |
| Portfolio Manager | | Portfolio Manager |
| (b) | Security is not a benchmark constituent. |
| (h) | Security was not held in the portfolio at period end. |
The views expressed in this report are those of the portfolio managers only through the end of the period of the report as stated on the cover and do not necessarily reflect the views of MFS or any other person in the MFS organization. These views are subject to change at any time based on market or other conditions, and MFS disclaims any responsibility to update such views. These views may not be relied upon as investment advice or an indication of trading intent on behalf of any MFS portfolio. References to specific securities are not recommendations of such securities, and may not be representative of any MFS portfolio’s current or future investments.
5
PERFORMANCE SUMMARY THROUGH 8/31/14
The following chart illustrates a representative class of the fund’s historical performance in comparison to its benchmark(s). Performance results include the deduction of the maximum applicable sales charge and reflect the percentage change in net asset value, including reinvestment of dividends and capital gains distributions. The performance of other share classes will be greater than or less than that of the class depicted below. Benchmarks are unmanaged and may not be invested in directly. Benchmark returns do not reflect sales charges, commissions or expenses. (See Notes to Performance Summary.)
Performance data shown represents past performance and is no guarantee of future results. Investment return and principal value fluctuate so your shares, when sold, may be worth more or less than the original cost; current performance may be lower or higher than quoted. The performance shown does not reflect the deduction of taxes, if any, that a shareholder would pay on fund distributions or the redemption of fund shares.
Growth of a Hypothetical $10,000 Investment
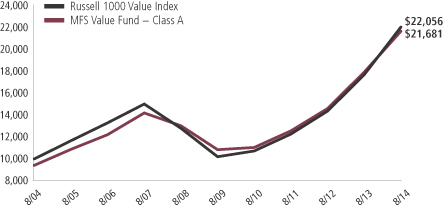
6
Performance Summary – continued
Total Returns through 8/31/14
Average annual without sales charge
| | | | | | | | | | | | | | |
| | | Share class | | Class inception date | | 1-yr | | 5-yr | | 10-yr | | Life (t) | | |
| | | A | | 1/02/96 | | 20.78% | | 14.83% | | 8.69% | | N/A | | |
| | | B | | 11/04/97 | | 19.89% | | 13.97% | | 7.92% | | N/A | | |
| | | C | | 11/05/97 | | 19.92% | | 13.97% | | 7.92% | | N/A | | |
| | | I | | 1/02/97 | | 21.07% | | 15.11% | | 9.00% | | N/A | | |
| | | R1 | | 4/01/05 | | 19.88% | | 13.98% | | N/A | | 7.09% | | |
| | | R2 | | 10/31/03 | | 20.48% | | 14.55% | | 8.40% | | N/A | | |
| | | R3 | | 4/01/05 | | 20.77% | | 14.83% | | N/A | | 7.89% | | |
| | | R4 | | 4/01/05 | | 21.11% | | 15.12% | | N/A | | 8.17% | | |
| | | R5 | | 5/01/06 | | 21.23% | | 15.13% | | N/A | | 7.51% | | |
| | | 529A | | 7/31/02 | | 20.84% | | 14.77% | | 8.55% | | N/A | | |
| | | 529B | | 7/31/02 | | 19.85% | | 13.90% | | 7.77% | | N/A | | |
| | | 529C | | 7/31/02 | | 19.85% | | 13.90% | | 7.77% | | N/A | | |
| Comparative benchmark | | | | | | | | | | |
| | | Russell 1000 Value Index (f) | | 24.43% | | 16.62% | | 8.23% | | N/A | | |
| Average annual with sales charge | | | | | | | | | | |
| | | A
With initial Sales Charge (5.75%) | | 13.84% | | 13.48% | | 8.05% | | N/A | | |
| | | B
With CDSC (Declining over six years from 4% to 0%) (v) | | 15.89% | | 13.73% | | 7.92% | | N/A | | |
| | | C
With CDSC (1% for 12 months) (v) | | 18.92% | | 13.97% | | 7.92% | | N/A | | |
| | | 529A
With initial Sales Charge (5.75%) | | 13.89% | | 13.42% | | 7.91% | | N/A | | |
| | | 529B
With CDSC (Declining over six years from 4% to 0%) (v) | | 15.85% | | 13.66% | | 7.77% | | N/A | | |
| | | 529C
With CDSC (1% for 12 months) (v) | | 18.85% | | 13.90% | | 7.77% | | N/A | | |
CDSC – Contingent Deferred Sales Charge.
Class I, R1, R2, R3, R4, and R5 shares do not have a sales charge.
On May 30, 2012, Class W shares were redesignated Class R5 shares. Total returns for Class R5 shares prior to May 30, 2012 reflect the performance history of Class W shares which had different fees and expenses than Class R5 shares.
| (f) | Source: FactSet Research Systems Inc. |
7
Performance Summary – continued
| (t) | For the period from the class inception date through the stated period end (for those share classes with less than 10 years of performance history). No comparative benchmark performance information is provided for “life” periods. (See Notes to Performance Summary.) |
| (v) | Assuming redemption at the end of the applicable period. |
Benchmark Definition
Russell 1000 Value Index – constructed to provide a comprehensive barometer for the value securities in the large-cap segment of the U.S. equity universe. Companies in this index generally have lower price-to-book ratios and lower forecasted growth values.
It is not possible to invest directly in an index.
Notes to Performance Summary
Class 529 shares are only available in conjunction with qualified tuition programs, such as the MFS 529 Savings Plan. There also is an additional fee, which is detailed in the program description, on qualified tuition programs. If this fee was reflected, the performance for Class 529 shares would have been lower. This annual fee is waived for Oregon residents and for those accounts with assets of $25,000 or more.
Average annual total return represents the average annual change in value for each share class for the periods presented. Life returns are presented where the share class has less than 10 years of performance history and represent the average annual total return from the class inception date to the stated period end date. As the fund’s share classes may have different inception dates, the life returns may represent different time periods and may not be comparable. As a result, no comparative benchmark performance information is provided for life periods.
Performance results reflect any applicable expense subsidies and waivers in effect during the periods shown. Without such subsidies and waivers the fund’s performance results would be less favorable. Please see the prospectus and financial statements for complete details.
Performance results do not include adjustments made for financial reporting purposes in accordance with U.S. generally accepted accounting principles and may differ from amounts reported in the financial highlights.
From time to time the fund may receive proceeds from litigation settlements, without which performance would be lower.
8
EXPENSE TABLE
Fund expenses borne by the shareholders during the period, March 1, 2014 through August 31, 2014
As a shareholder of the fund, you incur two types of costs: (1) transaction costs, including sales charges (loads) on certain purchase or redemption payments, and (2) ongoing costs, including management fees; distribution and service (12b-1) fees; and other fund expenses. This example is intended to help you understand your ongoing costs (in dollars) of investing in the fund and to compare these costs with the ongoing costs of investing in other mutual funds.
The example is based on an investment of $1,000 invested at the beginning of the period and held for the entire period March 1, 2014 through August 31, 2014.
Actual Expenses
The first line for each share class in the following table provides information about actual account values and actual expenses. You may use the information in this line, together with the amount you invested, to estimate the expenses that you paid over the period. Simply divide your account value by $1,000 (for example, an $8,600 account value divided by $1,000 = 8.6), then multiply the result by the number in the first line under the heading entitled “Expenses Paid During Period” to estimate the expenses you paid on your account during this period.
Hypothetical Example for Comparison Purposes
The second line for each share class in the following table provides information about hypothetical account values and hypothetical expenses based on the fund’s actual expense ratio and an assumed rate of return of 5% per year before expenses, which is not the fund’s actual return. The hypothetical account values and expenses may not be used to estimate the actual ending account balance or expenses you paid for the period. You may use this information to compare the ongoing costs of investing in the fund and other funds. To do so, compare this 5% hypothetical example with the 5% hypothetical examples that appear in the shareholder reports of the other funds.
Please note that the expenses shown in the table are meant to highlight your ongoing costs only and do not reflect any transactional costs, such as sales charges (loads). Therefore, the second line for each share class in the table is useful in comparing ongoing costs only, and will not help you determine the relative total costs of owning different funds. In addition, if these transactional costs were included, your costs would have been higher.
9
Expense Table – continued
| | | | | | | | | | | | | | | | | | |
Share
Class | | | | Annualized
Expense
Ratio | | | Beginning
Account Value
3/01/14 | | | Ending
Account Value
8/31/14 | | | Expenses
Paid During
Period (p)
3/01/14-8/31/14 | |
| A | | Actual | | | 0.88% | | | | $1,000.00 | | | | $1,057.67 | | | | $4.56 | |
| | Hypothetical (h) | | | 0.88% | | | | $1,000.00 | | | | $1,020.77 | | | | $4.48 | |
| B | | Actual | | | 1.63% | | | | $1,000.00 | | | | $1,053.54 | | | | $8.44 | |
| | Hypothetical (h) | | | 1.63% | | | | $1,000.00 | | | | $1,016.99 | | | | $8.29 | |
| C | | Actual | | | 1.63% | | | | $1,000.00 | | | | $1,053.67 | | | | $8.44 | |
| | Hypothetical (h) | | | 1.63% | | | | $1,000.00 | | | | $1,016.99 | | | | $8.29 | |
| I | | Actual | | | 0.63% | | | | $1,000.00 | | | | $1,058.91 | | | | $3.27 | |
| | Hypothetical (h) | | | 0.63% | | | | $1,000.00 | | | | $1,022.03 | | | | $3.21 | |
| R1 | | Actual | | | 1.63% | | | | $1,000.00 | | | | $1,053.64 | | | | $8.44 | |
| | Hypothetical (h) | | | 1.63% | | | | $1,000.00 | | | | $1,016.99 | | | | $8.29 | |
| R2 | | Actual | | | 1.13% | | | | $1,000.00 | | | | $1,056.28 | | | | $5.86 | |
| | Hypothetical (h) | | | 1.13% | | | | $1,000.00 | | | | $1,019.51 | | | | $5.75 | |
| R3 | | Actual | | | 0.88% | | | | $1,000.00 | | | | $1,057.52 | | | | $4.56 | |
| | Hypothetical (h) | | | 0.88% | | | | $1,000.00 | | | | $1,020.77 | | | | $4.48 | |
| R4 | | Actual | | | 0.63% | | | | $1,000.00 | | | | $1,059.19 | | | | $3.27 | |
| | Hypothetical (h) | | | 0.63% | | | | $1,000.00 | | | | $1,022.03 | | | | $3.21 | |
| R5 | | Actual | | | 0.52% | | | | $1,000.00 | | | | $1,059.37 | | | | $2.70 | |
| | Hypothetical (h) | | | 0.52% | | | | $1,000.00 | | | | $1,022.58 | | | | $2.65 | |
| 529A | | Actual | | | 0.87% | | | | $1,000.00 | | | | $1,057.82 | | | | $4.51 | |
| | Hypothetical (h) | | | 0.87% | | | | $1,000.00 | | | | $1,020.82 | | | | $4.43 | |
| 529B | | Actual | | | 1.67% | | | | $1,000.00 | | | | $1,053.48 | | | | $8.64 | |
| | Hypothetical (h) | | | 1.67% | | | | $1,000.00 | | | | $1,016.79 | | | | $8.49 | |
| 529C | | Actual | | | 1.68% | | | | $1,000.00 | | | | $1,053.42 | | | | $8.70 | |
| | Hypothetical (h) | | | 1.68% | | | | $1,000.00 | | | | $1,016.74 | | | | $8.54 | |
| (h) | 5% class return per year before expenses. |
| (p) | “Expenses Paid During Period” are equal to each class’s annualized expense ratio, as shown above, multiplied by the average account value over the period, multiplied by 184/365 (to reflect the one-half year period). Expenses paid do not include any applicable sales charges (loads). If these transaction costs had been included, your costs would have been higher. |
Notes to Expense Table
Each class with a Rule 12b-1 service fee is subject to a rebate of a portion of such fee. Such rebates are included in the expense ratios above. For Class 529A and Class 529B shares, this rebate reduced the expense ratios above by 0.05% and 0.01%, respectively. See Note 3 in the Notes to Financial Statements for additional information.
10
Expense Table – continued
Changes to the fund’s fee arrangements occurred during the six month period. Had these fee changes been in effect throughout the entire six month period, the annualized expense ratios, the actual expenses paid during the period and the hypothetical expenses paid during the period would have been approximately 0.87%, $4.51 and $4.43 for Class A, 1.62%, $8.39 and $8.24 for Class B, 1.62%, $8.39 and $8.24 for Class C, 0.62%, $3.22 and $3.16 for Class I, 1.62%, $8.39 and $8.24 for Class R1, 1.12%, $5.80 and $5.70 for Class R2, 0.87%, $4.51 and $4.43 for Class R3, 0.62%, $3.22 and $3.16 for Class R4, 0.51%, $2.65 and $2.60 for Class R5, 0.86%, $4.46 and $4.38 for Class 529A, 1.66%, $8.59 and $8.44 for Class 529B, and 1.67%, $8.64 and $8.49 for Class 529C, respectively. For further information about the fund’s fee arrangements and changes to those fee arrangements, please see Note 3 in the Notes to Financial Statements.
11
PORTFOLIO OF INVESTMENTS
8/31/14
The Portfolio of Investments is a complete list of all securities owned by your fund. It is categorized by broad-based asset classes.
| | | | | | | | |
| Common Stocks - 98.7% | | | | | | | | |
| Issuer | | Shares/Par | | | Value ($) | |
| | | | | | | | |
| Aerospace - 6.9% | | | | | | | | |
| Honeywell International, Inc. | | | 6,757,641 | | | $ | 643,530,149 | |
| Lockheed Martin Corp. | | | 4,412,353 | | | | 767,749,422 | |
| Northrop Grumman Corp. | | | 2,196,278 | | | | 279,410,487 | |
| United Technologies Corp. | | | 6,328,276 | | | | 683,327,242 | |
| | | | | | | | |
| | | | | | | $ | 2,374,017,300 | |
| Alcoholic Beverages - 1.4% | | | | | | | | |
| Diageo PLC | | | 16,562,018 | | | $ | 488,181,603 | |
| | |
| Automotive - 1.8% | | | | | | | | |
| Delphi Automotive PLC | | | 3,268,773 | | | $ | 227,441,225 | |
| General Motors Co. | | | 1,409,444 | | | | 49,048,651 | |
| Johnson Controls, Inc. | | | 7,129,058 | | | | 347,969,321 | |
| | | | | | | | |
| | | | | | | $ | 624,459,197 | |
| Broadcasting - 3.7% | | | | | | | | |
| Omnicom Group, Inc. | | | 5,450,006 | | | $ | 392,454,932 | |
| Time Warner, Inc. | | | 3,595,843 | | | | 276,987,786 | |
| Viacom, Inc., “B” | | | 3,107,298 | | | | 252,157,233 | |
| Walt Disney Co. | | | 3,814,604 | | | | 342,856,608 | |
| | | | | | | | |
| | | | | | | $ | 1,264,456,559 | |
| Brokerage & Asset Managers - 2.9% | | | | | | | | |
| BlackRock, Inc. | | | 984,774 | | | $ | 325,497,350 | |
| Franklin Resources, Inc. | | | 8,126,300 | | | | 459,298,476 | |
| NASDAQ OMX Group, Inc. | | | 5,039,531 | | | | 219,068,413 | |
| | | | | | | | |
| | | | | | | $ | 1,003,864,239 | |
| Business Services - 3.2% | | | | | | | | |
| Accenture PLC, “A” | | | 8,976,063 | | | $ | 727,599,667 | |
| Fidelity National Information Services, Inc. | | | 2,853,789 | | | | 161,952,526 | |
| Fiserv, Inc. (a) | | | 3,479,515 | | | | 224,324,332 | |
| | | | | | | | |
| | | | | | | $ | 1,113,876,525 | |
| Cable TV - 1.2% | | | | | | | | |
| Comcast Corp., “Special A” | | | 7,306,526 | | | $ | 398,936,320 | |
| | |
| Chemicals - 3.4% | | | | | | | | |
| 3M Co. | | | 4,886,703 | | | $ | 703,685,232 | |
| PPG Industries, Inc. | | | 2,281,293 | | | | 469,626,977 | |
| | | | | | | | |
| | | | | | | $ | 1,173,312,209 | |
12
Portfolio of Investments – continued
| | | | | | | | |
| Issuer | | Shares/Par | | | Value ($) | |
| | | | | | | | |
| Common Stocks - continued | | | | | | | | |
| Computer Software - 1.3% | | | | | | | | |
| Oracle Corp. | | | 10,865,946 | | | $ | 451,262,737 | |
| | |
| Computer Software - Systems - 1.9% | | | | | | | | |
| International Business Machines Corp. | | | 3,321,803 | | | $ | 638,782,717 | |
| | |
| Construction - 0.7% | | | | | | | | |
| Stanley Black & Decker, Inc. | | | 2,491,741 | | | $ | 227,994,302 | |
| | |
| Consumer Products - 0.5% | | | | | | | | |
| Procter & Gamble Co. | | | 2,154,746 | | | $ | 179,080,940 | |
| | |
| Containers - 0.5% | | | | | | | | |
| Crown Holdings, Inc. (a) | | | 3,501,914 | | | $ | 169,037,389 | |
| | |
| Electrical Equipment - 2.5% | | | | | | | | |
| Danaher Corp. | | | 5,378,678 | | | $ | 412,060,522 | |
| Pentair PLC | | | 1,575,817 | | | | 107,265,863 | |
| Tyco International Ltd. | | | 7,799,337 | | | | 348,006,417 | |
| | | | | | | | |
| | | | | | | $ | 867,332,802 | |
| Electronics - 0.6% | | | | | | | | |
| Texas Instruments, Inc. | | | 4,345,266 | | | $ | 209,354,916 | |
| | |
| Energy - Independent - 2.3% | | | | | | | | |
| Apache Corp. | | | 1,618,924 | | | $ | 164,855,031 | |
| EOG Resources, Inc. | | | 1,316,060 | | | | 144,608,673 | |
| Occidental Petroleum Corp. | | | 4,757,129 | | | | 493,456,991 | |
| | | | | | | | |
| | | | | | | $ | 802,920,695 | |
| Energy - Integrated - 4.0% | | | | | | | | |
| Chevron Corp. | | | 4,694,318 | | | $ | 607,679,465 | |
| Exxon Mobil Corp. | | | 7,761,117 | | | | 771,920,697 | |
| | | | | | | | |
| | | | | | | $ | 1,379,600,162 | |
| Food & Beverages - 4.9% | | | | | | | | |
| Dr Pepper Snapple Group, Inc. | | | 3,047,987 | | | $ | 191,779,342 | |
| General Mills, Inc. | | | 9,801,623 | | | | 523,210,636 | |
| Groupe Danone | | | 3,796,000 | | | | 265,049,247 | |
| Kellogg Co. | | | 1,421,824 | | | | 92,375,905 | |
| Nestle S.A. | | | 7,865,232 | | | | 610,421,851 | |
| | | | | | | | |
| | | | | | | $ | 1,682,836,981 | |
| Food & Drug Stores - 1.9% | | | | | | | | |
| CVS Caremark Corp. | | | 8,200,411 | | | $ | 651,522,654 | |
13
Portfolio of Investments – continued
| | | | | | | | |
| Issuer | | Shares/Par | | | Value ($) | |
| | | | | | | | |
| Common Stocks - continued | | | | | | | | |
| General Merchandise - 1.6% | | | | | | | | |
| Kohl’s Corp. | | | 1,408,233 | | | $ | 82,790,018 | |
| Target Corp. | | | 7,693,133 | | | | 462,126,499 | |
| | | | | | | | |
| | | | | | | $ | 544,916,517 | |
| Insurance - 7.4% | | | | | | | | |
| ACE Ltd. | | | 3,524,449 | | | $ | 374,754,662 | |
| Aon PLC | | | 3,563,436 | | | | 310,589,082 | |
| Chubb Corp. | | | 2,668,446 | | | | 245,363,610 | |
| MetLife, Inc. | | | 12,306,313 | | | | 673,647,574 | |
| Prudential Financial, Inc. | | | 3,972,741 | | | | 356,354,868 | |
| Travelers Cos., Inc. | | | 6,300,903 | | | | 596,758,523 | |
| | | | | | | | |
| | | | | | | $ | 2,557,468,319 | |
| Leisure & Toys - 0.7% | | | | | | | | |
| Hasbro, Inc. | | | 2,824,254 | | | $ | 148,711,094 | |
| Mattel, Inc. | | | 2,616,617 | | | | 90,247,120 | |
| | | | | | | | |
| | | | | | | $ | 238,958,214 | |
| Machinery & Tools - 1.3% | | | | | | | | |
| Eaton Corp. PLC | | | 4,445,891 | | | $ | 310,367,651 | |
| Illinois Tool Works, Inc. | | | 1,726,726 | | | | 152,314,500 | |
| | | | | | | | |
| | | | | | | $ | 462,682,151 | |
| Major Banks - 12.3% | | | | | | | | |
| Bank of New York Mellon Corp. | �� | | 11,805,303 | | | $ | 462,531,772 | |
| Goldman Sachs Group, Inc. | | | 3,575,930 | | | | 640,484,822 | |
| JPMorgan Chase & Co. | | | 24,433,205 | | | | 1,452,554,037 | |
| PNC Financial Services Group, Inc. | | | 2,879,605 | | | | 244,046,524 | |
| State Street Corp. | | | 4,373,465 | | | | 315,020,684 | |
| Wells Fargo & Co. | | | 21,479,465 | | | | 1,104,903,680 | |
| | | | | | | | |
| | | | | | | $ | 4,219,541,519 | |
| Medical & Health Technology & Services - 1.1% | | | | | | | | |
| Express Scripts Holding Co. (a) | | | 4,470,840 | | | $ | 330,529,201 | |
| Quest Diagnostics, Inc. | | | 551,235 | | | | 34,843,564 | |
| | | | | | | | |
| | | | | | | $ | 365,372,765 | |
| Medical Equipment - 4.8% | | | | | | | | |
| Abbott Laboratories | | | 9,630,377 | | | $ | 406,787,124 | |
| Covidien PLC | | | 3,262,021 | | | | 283,241,283 | |
| Medtronic, Inc. | | | 6,441,802 | | | | 411,309,058 | |
| St. Jude Medical, Inc. | | | 3,737,585 | | | | 245,148,200 | |
| Thermo Fisher Scientific, Inc. | | | 2,616,533 | | | | 314,533,432 | |
| | | | | | | | |
| | | | | | | $ | 1,661,019,097 | |
14
Portfolio of Investments – continued
| | | | | | | | |
| Issuer | | Shares/Par | | | Value ($) | |
| | | | | | | | |
| Common Stocks - continued | | | | | | | | |
| Other Banks & Diversified Financials - 2.2% | | | | | | | | |
| Citigroup, Inc. | | | 1,707,012 | | | $ | 88,167,170 | |
| U.S. Bancorp | | | 13,494,006 | | | | 570,526,574 | |
| Western Union Co. | | | 5,331,988 | | | | 93,149,830 | |
| | | | | | | | |
| | | | | | | $ | 751,843,574 | |
| Pharmaceuticals - 8.1% | | | | | | | | |
| Johnson & Johnson | | | 12,020,805 | | | $ | 1,246,918,103 | |
| Merck & Co., Inc. | | | 6,073,850 | | | | 365,099,124 | |
| Novartis AG | | | 1,221,245 | | | | 109,546,894 | |
| Pfizer, Inc. | | | 32,765,471 | | | | 962,977,193 | |
| Roche Holding AG | | | 350,336 | | | | 102,156,688 | |
| Zoetis, Inc. | | | 291,793 | | | | 10,341,144 | |
| | | | | | | | |
| | | | | | | $ | 2,797,039,146 | |
| Printing & Publishing - 0.7% | | | | | | | | |
| McGraw-Hill Cos., Inc. | | | 1,744,845 | | | $ | 141,559,275 | |
| Moody’s Corp. | | | 769,834 | | | | 72,033,367 | |
| Time, Inc. (a) | | | 381,858 | | | | 8,966,026 | |
| | | | | | | | |
| | | | | | | $ | 222,558,668 | |
| Railroad & Shipping - 0.8% | | | | | | | | |
| Canadian National Railway Co. | | | 3,614,486 | | | $ | 259,736,964 | |
| | |
| Restaurants - 1.0% | | | | | | | | |
| McDonald’s Corp. | | | 3,613,216 | | | $ | 338,630,604 | |
| | |
| Specialty Chemicals - 0.1% | | | | | | | | |
| Valspar Corp. | | | 425,318 | | | $ | 34,348,682 | |
| | |
| Specialty Stores - 1.2% | | | | | | | | |
| Advance Auto Parts, Inc. | | | 1,486,600 | | | $ | 202,801,972 | |
| Bed Bath & Beyond, Inc. (a) | | | 1,261,857 | | | | 81,086,931 | |
| Staples, Inc. | | | 10,958,017 | | | | 127,989,639 | |
| | | | | | | | |
| | | | | | | $ | 411,878,542 | |
| Telecommunications - Wireless - 0.6% | | | | | | | | |
| Vodafone Group PLC | | | 57,734,132 | | | $ | 198,164,401 | |
| | |
| Telephone Services - 2.1% | | | | | | | | |
| AT&T, Inc. | | | 2,908,087 | | | $ | 101,666,722 | |
| Verizon Communications, Inc. | | | 12,667,785 | | | | 631,109,049 | |
| | | | | | | | |
| | | | | | | $ | 732,775,771 | |
15
Portfolio of Investments – continued
| | | | | | | | |
| Issuer | | Shares/Par | | | Value ($) | |
| | | | | | | | |
| Common Stocks - continued | | | | | | | | |
| Tobacco - 5.3% | | | | | | | | |
| Altria Group, Inc. | | | 3,604,045 | | | $ | 155,262,259 | |
| Imperial Tobacco Group PLC | | | 1,633,714 | | | | 71,249,789 | |
| Lorillard, Inc. | | | 5,836,322 | | | | 348,428,423 | |
| Philip Morris International, Inc. | | | 14,591,685 | | | | 1,248,756,402 | |
| | | | | | | | |
| | | | | | | $ | 1,823,696,873 | |
| Trucking - 1.5% | | | | | | | | |
| United Parcel Service, Inc., “B” | | | 5,257,824 | | | $ | 511,744,010 | |
| | |
| Utilities - Electric Power - 0.3% | | | | | | | | |
| Duke Energy Corp. | | | 1,548,493 | | | $ | 114,572,997 | |
| Total Common Stocks (Identified Cost, $22,826,666,403) | | | $ | 33,947,779,061 | |
| | |
| Convertible Preferred Stocks - 0.1% | | | | | | | | |
| Aerospace - 0.1% | | | | | | | | |
United Technologies Corp., 7.5%
(Identified Cost, $18,338,355) | | | 364,100 | | | $ | 21,867,846 | |
| | |
| Money Market Funds - 0.9% | | | | | | | | |
MFS Institutional Money Market Portfolio, 0.09%,
at Cost and Net Asset Value (v) | | | 329,051,729 | | | $ | 329,051,729 | |
| Total Investments (Identified Cost, $23,174,056,487) | | | $ | 34,298,698,636 | |
| | |
| Other Assets, Less Liabilities - 0.3% | | | | | | | 93,998,912 | |
| Net Assets - 100.0% | | | | | | $ | 34,392,697,548 | |
| (a) | Non-income producing security. |
| (v) | Underlying affiliated fund that is available only to investment companies managed by MFS. The rate quoted for the MFS Institutional Money Market Portfolio is the annualized seven-day yield of the fund at period end. |
The following abbreviations are used in this report and are defined:
| PLC | | Public Limited Company |
See Notes to Financial Statements
16
Financial Statements
STATEMENT OF ASSETS AND LIABILITIES
At 8/31/14
This statement represents your fund’s balance sheet, which details the assets and liabilities comprising the total value of the fund.
| | | | |
| Assets | | | | |
Investments- | | | | |
Non-affiliated issuers, at value (identified cost, $22,845,004,758) | | | $33,969,646,907 | |
Underlying affiliated funds, at cost and value | | | 329,051,729 | |
Total investments, at value (identified cost, $23,174,056,487) | | | $34,298,698,636 | |
Cash | | | 665 | |
Receivables for | | | | |
Investments sold | | | 43,082,586 | |
Fund shares sold | | | 101,889,317 | |
Interest and dividends | | | 104,134,939 | |
Other assets | | | 36,859 | |
Total assets | | | $34,547,843,002 | |
| Liabilities | | | | |
Payables for | | | | |
Investments purchased | | | $31,747,899 | |
Fund shares reacquired | | | 97,589,936 | |
Payable to affiliates | | | | |
Investment adviser | | | 1,716,542 | |
Shareholder servicing costs | | | 22,425,482 | |
Distribution and service fees | | | 499,842 | |
Program manager fees | | | 106 | |
Payable for independent Trustees’ compensation | | | 4,990 | |
Accrued expenses and other liabilities | | | 1,160,657 | |
Total liabilities | | | $155,145,454 | |
Net assets | | | $34,392,697,548 | |
| Net assets consist of | | | | |
Paid-in capital | | | $22,506,336,790 | |
Unrealized appreciation (depreciation) on investments and translation of assets and liabilities in foreign currencies | | | 11,124,440,416 | |
Accumulated net realized gain (loss) on investments and foreign currency | | | 600,093,899 | |
Undistributed net investment income | | | 161,826,443 | |
Net assets | | | $34,392,697,548 | |
Shares of beneficial interest outstanding | | | 989,719,099 | |
17
Statement of Assets and Liabilities – continued
| | | | | | | | | | | | |
| | | Net assets | | | Shares
outstanding | | | Net asset value
per share (a) | |
Class A | | | $9,448,534,655 | | | | 272,299,931 | | | | $34.70 | |
Class B | | | 179,283,627 | | | | 5,195,962 | | | | 34.50 | |
Class C | | | 1,359,860,308 | | | | 39,615,277 | | | | 34.33 | |
Class I | | | 13,905,910,253 | | | | 398,664,506 | | | | 34.88 | |
Class R1 | | | 33,389,548 | | | | 978,933 | | | | 34.11 | |
Class R2 | | | 607,339,911 | | | | 17,656,097 | | | | 34.40 | |
Class R3 | | | 1,559,863,261 | | | | 45,081,156 | | | | 34.60 | |
Class R4 | | | 3,283,132,807 | | | | 94,572,901 | | | | 34.72 | |
Class R5 | | | 3,995,829,808 | | | | 115,085,207 | | | | 34.72 | |
Class 529A | | | 14,546,935 | | | | 421,936 | | | | 34.48 | |
Class 529B | | | 1,025,783 | | | | 30,098 | | | | 34.08 | |
Class 529C | | | 3,980,652 | | | | 117,095 | | | | 34.00 | |
| (a) | Maximum offering price per share was equal to the net asset value per share for all share classes, except for Classes A and 529A, for which the maximum offering prices per share were $36.82 [100 / 94.25 x $34.70] and $36.58 [100 / 94.25 x $34.48], respectively. On sales of $50,000 or more, the maximum offering prices of Class A and Class 529A shares are reduced. A contingent deferred sales charge may be imposed on redemptions of Class A, Class B, Class C, Class 529B, and Class 529C shares. Redemption price per share was equal to the net asset value per share for Classes I, R1, R2, R3, R4, R5, and 529A. |
See Notes to Financial Statements
18
Financial Statements
STATEMENT OF OPERATIONS
Year ended 8/31/14
This statement describes how much your fund earned in investment income and accrued in expenses. It also describes any gains and/or losses generated by fund operations.
| | | | |
| Net investment income | | | | |
Income | | | | |
Dividends | | | $946,323,922 | |
Interest | | | 510,777 | |
Dividends from underlying affiliated funds | | | 348,101 | |
Foreign taxes withheld | | | (5,847,640 | ) |
Total investment income | | | $941,335,160 | |
Expenses | | | | |
Management fee | | | $166,290,513 | |
Distribution and service fees | | | 44,376,359 | |
Program manager fees | | | 17,714 | |
Shareholder servicing costs | | | 30,838,677 | |
Administrative services fee | | | 485,257 | |
Independent Trustees’ compensation | | | 231,321 | |
Custodian fee | | | 802,741 | |
Shareholder communications | | | 1,518,388 | |
Audit and tax fees | | | 67,403 | |
Legal fees | | | 306,739 | |
Miscellaneous | | | 1,563,628 | |
Total expenses | | | $246,498,740 | |
Fees paid indirectly | | | (881 | ) |
Reduction of expenses by investment adviser and distributor | | | (7,327,556 | ) |
Net expenses | | | $239,170,303 | |
Net investment income | | | $702,164,857 | |
Realized and unrealized gain (loss) on investments and
foreign currency | | | | |
Realized gain (loss) (identified cost basis) | | | | |
Investments | | | $1,252,238,306 | |
Foreign currency | | | 453,305 | |
Net realized gain (loss) on investments and foreign currency | | | $1,252,691,611 | |
Change in unrealized appreciation (depreciation) | | | | |
Investments | | | $3,834,588,258 | |
Translation of assets and liabilities in foreign currencies | | | (153,175 | ) |
Net unrealized gain (loss) on investments and foreign currency translation | | | $3,834,435,083 | |
Net realized and unrealized gain (loss) on investments and foreign currency | | | $5,087,126,694 | |
Change in net assets from operations | | | $5,789,291,551 | |
See Notes to Financial Statements
19
Financial Statements
STATEMENTS OF CHANGES IN NET ASSETS
These statements describe the increases and/or decreases in net assets resulting from operations, any distributions, and any shareholder transactions.
| | | | | | | | |
| | | Years ended 8/31 | |
| | | 2014 | | | 2013 | |
| Change in net assets | | | | | | |
| From operations | | | | | | | | |
Net investment income | | | $702,164,857 | | | | $456,013,931 | |
Net realized gain (loss) on investments and foreign currency | | | 1,252,691,611 | | | | 174,130,167 | |
Net unrealized gain (loss) on investments and foreign currency translation | | | 3,834,435,083 | | | | 4,167,786,045 | |
Change in net assets from operations | | | $5,789,291,551 | | | | $4,797,930,143 | |
| Distributions declared to shareholders | | | | | | | | |
From net investment income | | | $(632,546,037 | ) | | | $(430,454,430 | ) |
From net realized gain on investments | | | (534,397,478 | ) | | | (157,367,309 | ) |
Total distributions declared to shareholders | | | $(1,166,943,515 | ) | | | $(587,821,739 | ) |
Change in net assets from fund share transactions | | | $2,708,168,604 | | | | $2,245,166,320 | |
Total change in net assets | | | $7,330,516,640 | | | | $6,455,274,724 | |
| Net assets | | | | | | | | |
At beginning of period | | | 27,062,180,908 | | | | 20,606,906,184 | |
At end of period (including undistributed net investment income of $161,826,443 and $91,754,318, respectively) | | | $34,392,697,548 | | | | $27,062,180,908 | |
See Notes to Financial Statements
20
Financial Statements
FINANCIAL HIGHLIGHTS
The financial highlights table is intended to help you understand the fund’s financial performance for the past 5 years. Certain information reflects financial results for a single fund share. The total returns in the table represent the rate by which an investor would have earned (or lost) on an investment in the fund share class (assuming reinvestment of all distributions) held for the entire period.
| | | | | | | | | | | | | | | | | | | | |
| Class A | | Years ended 8/31 | |
| | | 2014 | | | 2013 | | | 2012 | | | 2011 | | | 2010 | |
Net asset value, beginning of period | | | $29.81 | | | | $24.90 | | | | $21.83 | | | | $19.46 | | | | $19.39 | |
| Income (loss) from investment operations | | | | | | | | | | | | | |
Net investment income (d) | | | $0.69 | | | | $0.50 | | | | $0.43 | | | | $0.34 | | | | $0.32 | |
Net realized and unrealized gain (loss)
on investments and foreign currency | | | 5.41 | | | | 5.08 | | | | 3.05 | | | | 2.35 | | | | 0.06 | (g) |
Total from investment operations | | | $6.10 | | | | $5.58 | | | | $3.48 | | | | $2.69 | | | | $0.38 | |
| Less distributions declared to shareholders | | | | | | | | | | | | | |
From net investment income | | | $(0.63 | ) | | | $(0.48 | ) | | | $(0.41 | ) | | | $(0.32 | ) | | | $(0.31 | ) |
From net realized gain on investments | | | (0.58 | ) | | | (0.19 | ) | | | — | | | | — | | | | — | |
Total distributions declared to shareholders | | | $(1.21 | ) | | | $(0.67 | ) | | | $(0.41 | ) | | | $(0.32 | ) | | | $(0.31 | ) |
Net asset value, end of period (x) | | | $34.70 | | | | $29.81 | | | | $24.90 | | | | $21.83 | | | | $19.46 | |
Total return (%) (r)(s)(t)(x) | | | 20.78 | | | | 22.75 | | | | 16.16 | | | | 13.78 | | | | 1.88 | |
Ratios (%) (to average net assets)
and Supplemental data: | | | | | | | | | | | | | | | | | | | | |
Expenses before expense reductions (f) | | | 0.90 | | | | 0.93 | | | | 0.95 | | | | 0.95 | | | | 0.98 | |
Expenses after expense reductions (f) | | | 0.88 | | | | 0.92 | | | | 0.93 | | | | 0.94 | | | | 0.98 | |
Net investment income | | | 2.10 | | | | 1.80 | | | | 1.86 | | | | 1.49 | | | | 1.54 | |
Portfolio turnover | | | 13 | | | | 12 | | | | 14 | | | | 17 | | | | 22 | |
Net assets at end of period (000 omitted) | | | $9,448,535 | | | | $8,058,858 | | | | $6,628,244 | | | | $5,086,069 | | | | $4,980,816 | |
See Notes to Financial Statements
21
Financial Highlights – continued
| | | | | | | | | | | | | | | | | | | | |
| Class B | | Years ended 8/31 | |
| | | 2014 | | | 2013 | | | 2012 | | | 2011 | | | 2010 | |
Net asset value, beginning of period | | | $29.64 | | | | $24.76 | | | | $21.70 | | | | $19.34 | | | | $19.26 | |
| Income (loss) from investment operations | | | | | | | | | | | | | |
Net investment income (d) | | | $0.44 | | | | $0.29 | | | | $0.26 | | | | $0.16 | | | | $0.16 | |
Net realized and unrealized gain (loss)
on investments and foreign currency | | | 5.38 | | | | 5.05 | | | | 3.03 | | | | 2.34 | | | | 0.07 | (g) |
Total from investment operations | | | $5.82 | | | | $5.34 | | | | $3.29 | | | | $2.50 | | | | $0.23 | |
| Less distributions declared to shareholders | | | | | | | | | | | | | |
From net investment income | | | $(0.38 | ) | | | $(0.27 | ) | | | $(0.23 | ) | | | $(0.14 | ) | | | $(0.15 | ) |
From net realized gain on investments | | | (0.58 | ) | | | (0.19 | ) | | | — | | | | — | | | | — | |
Total distributions declared to shareholders | | | $(0.96 | ) | | | $(0.46 | ) | | | $(0.23 | ) | | | $(0.14 | ) | | | $(0.15 | ) |
Net asset value, end of period (x) | | | $34.50 | | | | $29.64 | | | | $24.76 | | | | $21.70 | | | | $19.34 | |
Total return (%) (r)(s)(t)(x) | | | 19.89 | | | | 21.82 | | | | 15.28 | | | | 12.92 | | | | 1.14 | |
Ratios (%) (to average net assets)
and Supplemental data: | | | | | | | | | | | | | | | | | | | | |
Expenses before expense reductions (f) | | | 1.65 | | | | 1.68 | | | | 1.70 | | | | 1.70 | | | | 1.73 | |
Expenses after expense reductions (f) | | | 1.63 | | | | 1.67 | | | | 1.68 | | | | 1.69 | | | | 1.73 | |
Net investment income | | | 1.35 | | | | 1.05 | | | | 1.11 | | | | 0.73 | | | | 0.80 | |
Portfolio turnover | | | 13 | | | | 12 | | | | 14 | | | | 17 | | | | 22 | |
Net assets at end of period (000 omitted) | | | $179,284 | | | | $169,208 | | | | $167,949 | | | | $182,654 | | | | $238,473 | |
| |
| Class C | | Years ended 8/31 | |
| | | 2014 | | | 2013 | | | 2012 | | | 2011 | | | 2010 | |
Net asset value, beginning of period | | | $29.50 | | | | $24.65 | | | | $21.62 | | | | $19.27 | | | | $19.21 | |
| Income (loss) from investment operations | | | | | | | | | | | | | |
Net investment income (d) | | | $0.44 | | | | $0.29 | | | | $0.25 | | | | $0.17 | | | | $0.16 | |
Net realized and unrealized gain (loss)
on investments and foreign currency | | | 5.36 | | | | 5.03 | | | | 3.02 | | | | 2.33 | | | | 0.06 | (g) |
Total from investment operations | | | $5.80 | | | | $5.32 | | | | $3.27 | | | | $2.50 | | | | $0.22 | |
| Less distributions declared to shareholders | | | | | | | | | | | | | |
From net investment income | | | $(0.39 | ) | | | $(0.28 | ) | | | $(0.24 | ) | | | $(0.15 | ) | | | $(0.16 | ) |
From net realized gain on investments | | | (0.58 | ) | | | (0.19 | ) | | | — | | | | — | | | | — | |
Total distributions declared to shareholders | | | $(0.97 | ) | | | $(0.47 | ) | | | $(0.24 | ) | | | $(0.15 | ) | | | $(0.16 | ) |
Net asset value, end of period (x) | | | $34.33 | | | | $29.50 | | | | $24.65 | | | | $21.62 | | | | $19.27 | |
Total return (%) (r)(s)(t)(x) | | | 19.92 | | | | 21.83 | | | | 15.23 | | | | 12.97 | | | | 1.11 | |
Ratios (%) (to average net assets)
and Supplemental data: | | | | | | | | | | | | | | | | | | | | |
Expenses before expense reductions (f) | | | 1.65 | | | | 1.68 | | | | 1.69 | | | | 1.70 | | | | 1.73 | |
Expenses after expense reductions (f) | | | 1.63 | | | | 1.67 | | | | 1.68 | | | | 1.69 | | | | 1.73 | |
Net investment income | | | 1.35 | | | | 1.05 | | | | 1.11 | | | | 0.74 | | | | 0.79 | |
Portfolio turnover | | | 13 | | | | 12 | | | | 14 | | | | 17 | | | | 22 | |
Net assets at end of period (000 omitted) | | | $1,359,860 | | | | $1,090,690 | | | | $906,572 | | | | $871,026 | | | | $832,696 | |
See Notes to Financial Statements
22
Financial Highlights – continued
| | | | | | | | | | | | | | | | | | | | |
| Class I | | Years ended 8/31 | |
| | | 2014 | | | 2013 | | | 2012 | | | 2011 | | | 2010 | |
Net asset value, beginning of period | | | $29.96 | | | | $25.02 | | | | $21.94 | | | | $19.55 | | | | $19.48 | |
| Income (loss) from investment operations | | | | | | | | | | | | | |
Net investment income (d) | | | $0.78 | | | | $0.57 | | | | $0.49 | | | | $0.40 | | | | $0.37 | |
Net realized and unrealized gain (loss)
on investments and foreign currency | | | 5.43 | | | | 5.10 | | | | 3.06 | | | | 2.37 | | | | 0.06 | (g) |
Total from investment operations | | | $6.21 | | | | $5.67 | | | | $3.55 | | | | $2.77 | | | | $0.43 | |
| Less distributions declared to shareholders | | | | | | | | | | | | | |
From net investment income | | | $(0.71 | ) | | | $(0.54 | ) | | | $(0.47 | ) | | | $(0.38 | ) | | | $(0.36 | ) |
From net realized gain on investments | | | (0.58 | ) | | | (0.19 | ) | | | — | | | | — | | | | — | |
Total distributions declared to shareholders | | | $(1.29 | ) | | | $(0.73 | ) | | | $(0.47 | ) | | | $(0.38 | ) | | | $(0.36 | ) |
Net asset value, end of period (x) | | | $34.88 | | | | $29.96 | | | | $25.02 | | | | $21.94 | | | | $19.55 | |
Total return (%) (r)(s)(x) | | | 21.07 | | | | 23.06 | | | | 16.42 | | | | 14.10 | | | | 2.12 | |
Ratios (%) (to average net assets)
and Supplemental data: | | | | | | | | | | | | | | | | | | | | |
Expenses before expense reductions (f) | | | 0.65 | | | | 0.68 | | | | 0.70 | | | | 0.70 | | | | 0.73 | |
Expenses after expense reductions (f) | | | 0.63 | | | | 0.67 | | | | 0.68 | | | | 0.69 | | | | 0.73 | |
Net investment income | | | 2.35 | | | | 2.05 | | | | 2.11 | | | | 1.75 | | | | 1.79 | |
Portfolio turnover | | | 13 | | | | 12 | | | | 14 | | | | 17 | | | | 22 | |
Net assets at end of period (000 omitted) | | | $13,905,910 | | | | $10,568,573 | | | | $7,472,693 | | | | $5,272,157 | | | | $3,289,827 | |
| |
| Class R1 | | Years ended 8/31 | |
| | | 2014 | | | 2013 | | | 2012 | | | 2011 | | | 2010 | |
Net asset value, beginning of period | | | $29.32 | | | | $24.50 | | | | $21.48 | | | | $19.15 | | | | $19.09 | |
| Income (loss) from investment operations | | | | | | | | | | | | | |
Net investment income (d) | | | $0.43 | | | | $0.29 | | | | $0.25 | | | | $0.17 | | | | $0.16 | |
Net realized and unrealized gain (loss)
on investments and foreign currency | | | 5.33 | | | | 5.00 | | | | 3.01 | | | | 2.32 | | | | 0.06 | (g) |
Total from investment operations | | | $5.76 | | | | $5.29 | | | | $3.26 | | | | $2.49 | | | | $0.22 | |
| Less distributions declared to shareholders | | | | | | | | | | | | | |
From net investment income | | | $(0.39 | ) | | | $(0.28 | ) | | | $(0.24 | ) | | | $(0.16 | ) | | | $(0.16 | ) |
From net realized gain on investments | | | (0.58 | ) | | | (0.19 | ) | | | — | | | | — | | | | — | |
Total distributions declared to shareholders | | | $(0.97 | ) | | | $(0.47 | ) | | | $(0.24 | ) | | | $(0.16 | ) | | | $(0.16 | ) |
Net asset value, end of period (x) | | | $34.11 | | | | $29.32 | | | | $24.50 | | | | $21.48 | | | | $19.15 | |
Total return (%) (r)(s)(x) | | | 19.88 | | | | 21.83 | | | | 15.29 | | | | 12.95 | | | | 1.13 | |
Ratios (%) (to average net assets)
and Supplemental data: | | | | | | | | | | | | | | | | | | | | |
Expenses before expense reductions (f) | | | 1.65 | | | | 1.68 | | | | 1.69 | | | | 1.70 | | | | 1.73 | |
Expenses after expense reductions (f) | | | 1.63 | | | | 1.67 | | | | 1.68 | | | | 1.69 | | | | 1.73 | |
Net investment income | | | 1.33 | | | | 1.06 | | | | 1.10 | | | | 0.74 | | | | 0.80 | |
Portfolio turnover | | | 13 | | | | 12 | | | | 14 | | | | 17 | | | | 22 | |
Net assets at end of period (000 omitted) | | | $33,390 | | | | $33,485 | | | | $32,389 | | | | $33,806 | | | | $32,934 | |
See Notes to Financial Statements
23
Financial Highlights – continued
| | | | | | | | | | | | | | | | | | | | |
| Class R2 | | Years ended 8/31 | |
| | | 2014 | | | 2013 | | | 2012 | | | 2011 | | | 2010 | |
Net asset value, beginning of period | | | $29.56 | | | | $24.69 | | | | $21.66 | | | | $19.31 | | | | $19.24 | |
| Income (loss) from investment operations | | | | | | | | | | | | | |
Net investment income (d) | | | $0.60 | | | | $0.43 | | | | $0.37 | | | | $0.28 | | | | $0.26 | |
Net realized and unrealized gain (loss)
on investments and foreign currency | | | 5.36 | | | | 5.04 | | | | 3.01 | | | | 2.34 | | | | 0.07 | (g) |
Total from investment operations | | | $5.96 | | | | $5.47 | | | | $3.38 | | | | $2.62 | | | | $0.33 | |
| Less distributions declared to shareholders | | | | | | | | | | | | | |
From net investment income | | | $(0.54 | ) | | | $(0.41 | ) | | | $(0.35 | ) | | | $(0.27 | ) | | | $(0.26 | ) |
From net realized gain on investments | | | (0.58 | ) | | | (0.19 | ) | | | — | | | | — | | | | — | |
Total distributions declared to shareholders | | | $(1.12 | ) | | | $(0.60 | ) | | | $(0.35 | ) | | | $(0.27 | ) | | | $(0.26 | ) |
Net asset value, end of period (x) | | | $34.40 | | | | $29.56 | | | | $24.69 | | | | $21.66 | | | | $19.31 | |
Total return (%) (r)(s)(x) | | | 20.48 | | | | 22.47 | | | | 15.80 | | | | 13.51 | | | | 1.66 | |
Ratios (%) (to average net assets)
and Supplemental data: | | | | | | | | | | | | | | | | | | | | |
Expenses before expense reductions (f) | | | 1.15 | | | | 1.18 | | | | 1.20 | | | | 1.20 | | | | 1.23 | |
Expenses after expense reductions (f) | | | 1.13 | | | | 1.17 | | | | 1.18 | | | | 1.19 | | | | 1.23 | |
Net investment income | | | 1.84 | | | | 1.55 | | | | 1.61 | | | | 1.24 | | | | 1.29 | |
Portfolio turnover | | | 13 | | | | 12 | | | | 14 | | | | 17 | | | | 22 | |
Net assets at end of period (000 omitted) | | | $607,340 | | | | $572,590 | | | | $517,005 | | | | $496,236 | | | | $426,938 | |
| |
| Class R3 | | Years ended 8/31 | |
| | | 2014 | | | 2013 | | | 2012 | | | 2011 | | | 2010 | |
Net asset value, beginning of period | | | $29.73 | | | | $24.83 | | | | $21.78 | | | | $19.41 | | | | $19.34 | |
| Income (loss) from investment operations | | | | | | | | | | | | | |
Net investment income (d) | | | $0.69 | | | | $0.50 | | | | $0.43 | | | | $0.34 | | | | $0.31 | |
Net realized and unrealized gain (loss)
on investments and foreign currency | | | 5.39 | | | | 5.07 | | | | 3.03 | | | | 2.35 | | | | 0.07 | (g) |
Total from investment operations | | | $6.08 | | | | $5.57 | | | | $3.46 | | | | $2.69 | | | | $0.38 | |
| Less distributions declared to shareholders | | | | | | | | | | | | | |
From net investment income | | | $(0.63 | ) | | | $(0.48 | ) | | | $(0.41 | ) | | | $(0.32 | ) | | | $(0.31 | ) |
From net realized gain on investments | | | (0.58 | ) | | | (0.19 | ) | | | — | | | | — | | | | — | |
Total distributions declared to shareholders | | | $(1.21 | ) | | | $(0.67 | ) | | | $(0.41 | ) | | | $(0.32 | ) | | | $(0.31 | ) |
Net asset value, end of period (x) | | | $34.60 | | | | $29.73 | | | | $24.83 | | | | $21.78 | | | | $19.41 | |
Total return (%) (r)(s)(x) | | | 20.77 | | | | 22.77 | | | | 16.11 | | | | 13.82 | | | | 1.90 | |
Ratios (%) (to average net assets)
and Supplemental data: | | | | | | | | | | | | | | | | | | | | |
Expenses before expense reductions (f) | | | 0.90 | | | | 0.93 | | | | 0.95 | | | | 0.95 | | | | 0.99 | |
Expenses after expense reductions (f) | | | 0.87 | | | | 0.91 | | | | 0.93 | | | | 0.94 | | | | 0.98 | |
Net investment income | | | 2.11 | | | | 1.80 | | | | 1.86 | | | | 1.49 | | | | 1.53 | |
Portfolio turnover | | | 13 | | | | 12 | | | | 14 | | | | 17 | | | | 22 | |
Net assets at end of period (000 omitted) | | | $1,559,863 | | | | $1,299,126 | | | | $1,022,504 | | | | $763,670 | | | | $587,645 | |
See Notes to Financial Statements
24
Financial Highlights – continued
| | | | | | | | | | | | | | | | | | | | |
| Class R4 | | Years ended 8/31 | |
| | | 2014 | | | 2013 | | | 2012 | | | 2011 | | | 2010 | |
Net asset value, beginning of period | | | $29.82 | | | | $24.90 | | | | $21.84 | | | | $19.47 | | | | $19.39 | |
| Income (loss) from investment operations | | | | | | | | | | | | | |
Net investment income (d) | | | $0.77 | | | | $0.57 | | | | $0.49 | | | | $0.40 | | | | $0.36 | |
Net realized and unrealized gain (loss)
on investments and foreign currency | | | 5.42 | | | | 5.08 | | | | 3.04 | | | | 2.35 | | | | 0.08 | (g) |
Total from investment operations | | | $6.19 | | | | $5.65 | | | | $3.53 | | | | $2.75 | | | | $0.44 | |
| Less distributions declared to shareholders | | | | | | | | | | | | | |
From net investment income | | | $(0.71 | ) | | | $(0.54 | ) | | | $(0.47 | ) | | | $(0.38 | ) | | | $(0.36 | ) |
From net realized gain on investments | | | (0.58 | ) | | | (0.19 | ) | | | — | | | | — | | | | — | |
Total distributions declared to shareholders | | | $(1.29 | ) | | | $(0.73 | ) | | | $(0.47 | ) | | | $(0.38 | ) | | | $(0.36 | ) |
Net asset value, end of period (x) | | | $34.72 | | | | $29.82 | | | | $24.90 | | | | $21.84 | | | | $19.47 | |
Total return (%) (r)(s)(x) | | | 21.11 | | | | 23.09 | | | | 16.40 | | | | 14.05 | | | | 2.18 | |
Ratios (%) (to average net assets)
and Supplemental data: | | | | | | | | | | | | | | | | | | | | |
Expenses before expense reductions (f) | | | 0.65 | | | | 0.68 | | | | 0.70 | | | | 0.70 | | | | 0.74 | |
Expenses after expense reductions (f) | | | 0.63 | | | | 0.67 | | | | 0.68 | | | | 0.69 | | | | 0.73 | |
Net investment income | | | 2.34 | | | | 2.07 | | | | 2.10 | | | | 1.74 | | | | 1.77 | |
Portfolio turnover | | | 13 | | | | 12 | | | | 14 | | | | 17 | | | | 22 | |
Net assets at end of period (000 omitted) | | | $3,283,133 | | | | $2,892,340 | | | | $2,907,088 | | | | $2,036,438 | | | | $1,266,492 | |
| |
| Class R5 (y) | | Years ended 8/31 | |
| | | 2014 | | | 2013 | | | 2012 | | | 2011 | | | 2010 | |
Net asset value, beginning of period | | | $29.82 | | | | $24.90 | | | | $21.81 | | | | $19.44 | | | | $19.37 | |
| Income (loss) from investment operations | | | | | | | | | | | | | |
Net investment income (d) | | | $0.82 | | | | $0.60 | | | | $0.46 | | | | $0.37 | | | | $0.35 | |
Net realized and unrealized gain (loss)
on investments and foreign currency | | | 5.40 | | | | 5.07 | | | | 3.08 | | | | 2.35 | | | | 0.06 | (g) |
Total from investment operations | | | $6.22 | | | | $5.67 | | | | $3.54 | | | | $2.72 | | | | $0.41 | |
| Less distributions declared to shareholders | | | | | | | | | | | | | |
From net investment income | | | $(0.74 | ) | | | $(0.56 | ) | | | $(0.45 | ) | | | $(0.35 | ) | | | $(0.34 | ) |
From net realized gain on investments | | | (0.58 | ) | | | (0.19 | ) | | | — | | | | — | | | | — | |
Total distributions declared to shareholders | | | $(1.32 | ) | | | $(0.75 | ) | | | $(0.45 | ) | | | $(0.35 | ) | | | $(0.34 | ) |
Net asset value, end of period (x) | | | $34.72 | | | | $29.82 | | | | $24.90 | | | | $21.81 | | | | $19.44 | |
Total return (%) (r)(s)(x) | | | 21.23 | | | | 23.18 | | | | 16.48 | | | | 13.96 | | | | 2.04 | |
Ratios (%) (to average net assets)
and Supplemental data: | | | | | | | | | | | | | | | | | | | | |
Expenses before expense reductions (f) | | | 0.55 | | | | 0.57 | | | | 0.77 | | | | 0.80 | | | | 0.83 | |
Expenses after expense reductions (f) | | | 0.53 | | | | 0.56 | | | | 0.76 | | | | 0.79 | | | | 0.83 | |
Net investment income | | | 2.48 | | | | 2.12 | | | | 1.98 | | | | 1.63 | | | | 1.70 | |
Portfolio turnover | | | 13 | | | | 12 | | | | 14 | | | | 17 | | | | 22 | |
Net assets at end of period (000 omitted) | | | $3,995,830 | | | | $2,362,012 | | | | $940,695 | | | | $1,334,446 | | | | $1,393,429 | |
See Notes to Financial Statements
25
Financial Highlights – continued
| | | | | | | | | | | | | | | | | | | | |
| Class 529A | | Years ended 8/31 | |
| | | 2014 | | | 2013 | | | 2012 | | | 2011 | | | 2010 | |
Net asset value, beginning of period | | | $29.62 | | | | $24.74 | | | | $21.70 | | | | $19.34 | | | | $19.28 | |
| Income (loss) from investment operations | | | | | | | | | | | | | |
Net investment income (d) | | | $0.69 | | | | $0.49 | | | | $0.42 | | | | $0.32 | | | | $0.29 | |
Net realized and unrealized gain (loss)
on investments and foreign currency | | | 5.38 | | | | 5.05 | | | | 3.02 | | | | 2.34 | | | | 0.06 | |
Total from investment operations | | | $6.07 | | | | $5.54 | | | | $3.44 | | | | $2.66 | | | | $0.35 | |
| Less distributions declared to shareholders | | | | | | | | | | | | | |
From net investment income | | | $(0.63 | ) | | | $(0.47 | ) | | | $(0.40 | ) | | | $(0.30 | ) | | | $(0.29 | ) |
From net realized gain on investments | | | (0.58 | ) | | | (0.19 | ) | | | — | | | | — | | | | — | |
Total distributions declared to shareholders | | | $(1.21 | ) | | | $(0.66 | ) | | | $(0.40 | ) | | | $(0.30 | ) | | | $(0.29 | ) |
Net asset value, end of period (x) | | | $34.48 | | | | $29.62 | | | | $24.74 | | | | $21.70 | | | | $19.34 | |
Total return (%) (r)(s)(t)(x) | | | 20.84 | | | | 22.73 | | | | 16.06 | | | | 13.71 | | | | 1.74 | |
Ratios (%) (to average net assets)
and Supplemental data: | | | | | | | | | | | | | | | | | | | | |
Expenses before expense reductions (f) | | | 1.00 | | | | 1.03 | | | | 1.05 | | | | 1.05 | | | | 1.08 | |
Expenses after expense reductions (f) | | | 0.87 | | | | 0.93 | | | | 0.98 | | | | 1.03 | | | | 1.08 | |
Net investment income | | | 2.11 | | | | 1.79 | | | | 1.80 | | | | 1.40 | | | | 1.44 | |
Portfolio turnover | | | 13 | | | | 12 | | | | 14 | | | | 17 | | | | 22 | |
Net assets at end of period (000 omitted) | | | $14,547 | | | | $10,899 | | | | $8,195 | | | | $6,315 | | | | $5,192 | |
| |
| Class 529B | | Years ended 8/31 | |
| | | 2014 | | | 2013 | | | 2012 | | | 2011 | | | 2010 | |
Net asset value, beginning of period | | | $29.29 | | | | $24.48 | | | | $21.45 | | | | $19.12 | | | | $19.06 | |
| Income (loss) from investment operations | | | | | | | | | | | | | |
Net investment income (d) | | | $0.42 | | | | $0.27 | | | | $0.24 | | | | $0.14 | | | | $0.14 | |
Net realized and unrealized gain (loss)
on investments and foreign currency | | | 5.32 | | | | 4.99 | | | | 3.01 | | | | 2.32 | | | | 0.06 | (g) |
Total from investment operations | | | $5.74 | | | | $5.26 | | | | $3.25 | | | | $2.46 | | | | $0.20 | |
| Less distributions declared to shareholders | | | | | | | | | | | | | |
From net investment income | | | $(0.37 | ) | | | $(0.26 | ) | | | $(0.22 | ) | | | $(0.13 | ) | | | $(0.14 | ) |
From net realized gain on investments | | | (0.58 | ) | | | (0.19 | ) | | | — | | | | — | | | | — | |
Total distributions declared to shareholders | | | $(0.95 | ) | | | $(0.45 | ) | | | $(0.22 | ) | | | $(0.13 | ) | | | $(0.14 | ) |
Net asset value, end of period (x) | | | $34.08 | | | | $29.29 | | | | $24.48 | | | | $21.45 | | | | $19.12 | |
Total return (%) (r)(s)(t)(x) | | | 19.85 | | | | 21.74 | | | | 15.27 | | | | 12.84 | | | | 1.01 | |
Ratios (%) (to average net assets)
and Supplemental data: | | | | | | | | | | | | | | | | | | | | |
Expenses before expense reductions (f) | | | 1.75 | | | | 1.78 | | | | 1.79 | | | | 1.80 | | | | 1.83 | |
Expenses after expense reductions (f) | | | 1.67 | | | | 1.71 | | | | 1.73 | | | | 1.78 | | | | 1.83 | |
Net investment income | | | 1.30 | | | | 1.00 | | | | 1.05 | | | | 0.64 | | | | 0.70 | |
Portfolio turnover | | | 13 | | | | 12 | | | | 14 | | | | 17 | | | | 22 | |
Net assets at end of period (000 omitted) | | | $1,026 | | | | $1,013 | | | | $963 | | | | $1,147 | | | | $1,198 | |
See Notes to Financial Statements
26
Financial Highlights – continued
| | | | | | | | | | | | | | | | | | | | |
| Class 529C | | Years ended 8/31 | |
| | | 2014 | | | 2013 | | | 2012 | | | 2011 | | | 2010 | |
Net asset value, beginning of period | | | $29.23 | | | | $24.43 | | | | $21.43 | | | | $19.11 | | | | $19.05 | |
| Income (loss) from investment operations | | | | | | | | | | | | | |
Net investment income (d) | | | $0.41 | | | | $0.27 | | | | $0.24 | | | | $0.15 | | | | $0.14 | |
Net realized and unrealized gain (loss)
on investments and foreign currency | | | 5.32 | | | | 4.99 | | | | 2.99 | | | | 2.31 | �� | | | 0.07 | (g) |
Total from investment operations | | | $5.73 | | | | $5.26 | | | | $3.23 | | | | $2.46 | | | | $0.21 | |
| Less distributions declared to shareholders | | | | | | | | | | | | | |
From net investment income | | | $(0.38 | ) | | | $(0.27 | ) | | | $(0.23 | ) | | | $(0.14 | ) | | | $(0.15 | ) |
From net realized gain on investments | | | (0.58 | ) | | | (0.19 | ) | | | — | | | | — | | | | — | |
Total distributions declared to shareholders | | | $(0.96 | ) | | | $(0.46 | ) | | | $(0.23 | ) | | | $(0.14 | ) | | | $(0.15 | ) |
Net asset value, end of period (x) | | | $34.00 | | | | $29.23 | | | | $24.43 | | | | $21.43 | | | | $19.11 | |
Total return (%) (r)(s)(t)(x) | | | 19.85 | | | | 21.80 | | | | 15.18 | | | | 12.82 | | | | 1.06 | |
Ratios (%) (to average net assets)
and Supplemental data: | | | | | | | | | | | | | | | | | | | | |
Expenses before expense reductions (f) | | | 1.75 | | | | 1.78 | | | | 1.79 | | | | 1.80 | | | | 1.83 | |
Expenses after expense reductions (f) | | | 1.67 | | | | 1.72 | | | | 1.73 | | | | 1.78 | | | | 1.83 | |
Net investment income | | | 1.28 | | | | 1.00 | | | | 1.06 | | | | 0.65 | | | | 0.69 | |
Portfolio turnover | | | 13 | | | | 12 | | | | 14 | | | | 17 | | | | 22 | |
Net assets at end of period (000 omitted) | | | $3,981 | | | | $3,387 | | | | $2,610 | | | | $2,438 | | | | $2,180 | |
| (d) | Per share data is based on average shares outstanding. |
| (f) | Ratios do not reflect reductions from fees paid indirectly, if applicable. |
| (g) | The per share amount varies from the net realized and unrealized gain/loss for the period because of the timing of sales of fund shares and the per share amount of realized and unrealized gains and losses at such time. |
| (r) | Certain expenses have been reduced without which performance would have been lower. |
| (s) | From time to time the fund may receive proceeds from litigation settlements, without which performance would be lower. |
| (t) | Total returns do not include any applicable sales charges. |
| (x) | The net asset values per share and total returns have been calculated on net assets which include adjustments made in accordance with U.S. generally accepted accounting principles required at period end for financial reporting purposes. |
| (y) | On May 10, 2012, sales of Class W shares (including exchanges) were suspended. On May 11, 2012, certain Class W shares were automatically converted to Class I shares. Shareholders of certain Class W shares became shareholders of Class I and received Class I shares with a total net asset value equal to their Class W shares at the time of the conversion. On May 30, 2012, remaining Class W shares, which represented MFS seed money, were redesignated Class R5. Class R5 shares are generally available only to certain eligible retirement plans and to funds distributed by MFD. Class R5 shares do not pay a 12b-1 distribution fee or sub-accounting costs. On June 1, 2012, Class R5 shares were offered for sale to the public. |
See Notes to Financial Statements
27
NOTES TO FINANCIAL STATEMENTS
(1) Business and Organization
MFS Value Fund (the fund) is a diversified series of MFS Series Trust I (the trust). The trust is organized as a Massachusetts business trust and is registered under the Investment Company Act of 1940, as amended, as an open-end management investment company.
The fund is an investment company and accordingly follows the investment company accounting and reporting guidance of the Financial Accounting Standards Board (FASB) Accounting Standard Codification Topic 946 Financial Services – Investment Companies.
(2) Significant Accounting Policies
General – The preparation of financial statements in conformity with U.S. generally accepted accounting principles requires management to make estimates and assumptions that affect the reported amounts of assets and liabilities, and disclosure of contingent assets and liabilities at the date of the financial statements and the reported amounts of increases and decreases in net assets from operations during the reporting period. Actual results could differ from those estimates. In the preparation of these financial statements, management has evaluated subsequent events occurring after the date of the fund’s Statement of Assets and Liabilities through the date that the financial statements were issued.
In June 2014, FASB issued Accounting Standards Update 2014-11, Transfers and Servicing (Topic 860) – Repurchase-to-Maturity Transactions, Repurchase Financings, and Disclosures (“ASU 2014-11”). ASU 2014-11 changes the accounting for repurchase-to-maturity transactions (i.e., repurchase agreements that settle at the same time as the maturity of the transferred financial asset) and enhances the required disclosures for repurchase agreements and other similar transactions. Although still evaluating the potential impacts of ASU 2014-11 to the fund, management expects that the impact of the fund’s adoption will be limited to additional financial statement disclosures which would first be effective for interim reporting periods beginning after March 15, 2015.
Balance Sheet Offsetting – The fund’s accounting policy with respect to balance sheet offsetting is that, absent an event of default by the counterparty or a termination of the agreement, the International Swaps and Derivatives Association (ISDA) Master Agreement does not result in an offset of reported amounts of financial assets and financial liabilities in the Statement of Assets and Liabilities across transactions between the fund and the applicable counterparty. The fund’s right to setoff may be restricted or prohibited by the bankruptcy or insolvency laws of the particular jurisdiction to which a specific master netting agreement counterparty is subject. Balance sheet offsetting disclosures, to the extent applicable to the fund, have been included in the fund’s Significant Accounting Policies note under the captions for each of the fund’s in-scope financial instruments and transactions.
Investment Valuations – Equity securities, including restricted equity securities, are generally valued at the last sale or official closing price as provided by a third-party pricing service on the market or exchange on which they are primarily traded. Equity
28
Notes to Financial Statements – continued
securities, for which there were no sales reported that day, are generally valued at the last quoted daily bid quotation as provided by a third-party pricing service on the market or exchange on which such securities are primarily traded. Short-term instruments with a maturity at issuance of 60 days or less generally are valued at amortized cost, which approximates market value. Open-end investment companies are generally valued at net asset value per share. Securities and other assets generally valued on the basis of information from a third-party pricing service may also be valued at a broker/dealer bid quotation. Values obtained from third-party pricing services can utilize both transaction data and market information such as yield, quality, coupon rate, maturity, type of issue, trading characteristics, and other market data. The values of foreign securities and other assets and liabilities expressed in foreign currencies are converted to U.S. dollars using the mean of bid and asked prices for rates provided by a third-party pricing service.
The Board of Trustees has delegated primary responsibility for determining or causing to be determined the value of the fund’s investments (including any fair valuation) to the adviser pursuant to valuation policies and procedures approved by the Board. If the adviser determines that reliable market quotations are not readily available, investments are valued at fair value as determined in good faith by the adviser in accordance with such procedures under the oversight of the Board of Trustees. Under the fund’s valuation policies and procedures, market quotations are not considered to be readily available for most types of debt instruments and floating rate loans and many types of derivatives. These investments are generally valued at fair value based on information from third-party pricing services. In addition, investments may be valued at fair value if the adviser determines that an investment’s value has been materially affected by events occurring after the close of the exchange or market on which the investment is principally traded (such as foreign exchange or market) and prior to the determination of the fund’s net asset value, or after the halting of trading of a specific security where trading does not resume prior to the close of the exchange or market on which the security is principally traded. Events that occur on a frequent basis after foreign markets close (such as developments in foreign markets and significant movements in the U.S. markets) and prior to the determination of the fund’s net asset value may be deemed to have a material effect on the value of securities traded in foreign markets. Accordingly, the fund’s foreign equity securities may often be valued at fair value. The adviser generally relies on third-party pricing services or other information (such as the correlation with price movements of similar securities in the same or other markets; the type, cost and investment characteristics of the security; the business and financial condition of the issuer; and trading and other market data) to assist in determining whether to fair value and at what value to fair value an investment. The value of an investment for purposes of calculating the fund’s net asset value can differ depending on the source and method used to determine value. When fair valuation is used, the value of an investment used to determine the fund’s net asset value may differ from quoted or published prices for the same investment. There can be no assurance that the fund could obtain the fair value assigned to an investment if it were to sell the investment at the same time at which the fund determines its net asset value per share.
Various inputs are used in determining the value of the fund’s assets or liabilities. These inputs are categorized into three broad levels. In certain cases, the inputs used to
29
Notes to Financial Statements – continued
measure fair value may fall into different levels of the fair value hierarchy. In such cases, an investment’s level within the fair value hierarchy is based on the lowest level of input that is significant to the fair value measurement. The fund’s assessment of the significance of a particular input to the fair value measurement in its entirety requires judgment, and considers factors specific to the investment. Level 1 includes unadjusted quoted prices in active markets for identical assets or liabilities. Level 2 includes other significant observable market-based inputs (including quoted prices for similar securities, interest rates, prepayment speed, and credit risk). Level 3 includes unobservable inputs, which may include the adviser’s own assumptions in determining the fair value of investments. The following is a summary of the levels used as of August 31, 2014 in valuing the fund’s assets or liabilities:
| | | | | | | | | | | | | | | | |
| Investments at Value | | Level 1 | | | Level 2 | | | Level 3 | | | Total | |
| Equity Securities | | | $33,969,646,907 | | | | $— | | | | $— | | | | $33,969,646,907 | |
| Mutual Funds | | | 329,051,729 | | | | — | | | | — | | | | 329,051,729 | |
| Total Investments | | | $34,298,698,636 | | | | $— | | | | $— | | | | $34,298,698,636 | |
For further information regarding security characteristics, see the Portfolio of Investments.
Foreign Currency Translation – Purchases and sales of foreign investments, income, and expenses are converted into U.S. dollars based upon currency exchange rates prevailing on the respective dates of such transactions or on the reporting date for foreign denominated receivables and payables. Gains and losses attributable to foreign currency exchange rates on sales of securities are recorded for financial statement purposes as net realized gains and losses on investments. Gains and losses attributable to foreign exchange rate movements on receivables, payables, income and expenses are recorded for financial statement purposes as foreign currency transaction gains and losses. That portion of both realized and unrealized gains and losses on investments that results from fluctuations in foreign currency exchange rates is not separately disclosed.
Security Loans – Under its Securities Lending Agency Agreement with the fund, State Street Bank and Trust Company (“State Street”), as lending agent, loans the securities of the fund to certain qualified institutions (the “Borrowers”) approved by the fund. The loans are collateralized by cash and/or U.S. Treasury and federal agency obligations in an amount typically at least equal to the market value of the securities loaned. On loans collateralized by cash, the cash collateral is invested in a money market fund. The market value of the loaned securities is determined at the close of business of the fund and any additional required collateral is delivered to the fund on the next business day. State Street provides the fund with indemnification against Borrower default. In the event of Borrower default, State Street will for the benefit of the fund either purchase securities identical to those loaned or, when such purchase is commercially impracticable, pay the fund the market value of the loaned securities. In return, State Street assumes the fund’s rights to the related collateral. If the collateral value is less than the cost to purchase identical securities, State Street is responsible for the shortfall, but only to the extent that such shortfall is not due to a decline in collateral value resulting from collateral reinvestment for which the fund bears the risk of loss. A portion of the income generated upon investment of the collateral is remitted to the
30
Notes to Financial Statements – continued
Borrowers, and the remainder is allocated between the fund and the lending agent. On loans collateralized by U.S. Treasury and/or federal agency obligations, a fee is received from the Borrower, and is allocated between the fund and the lending agent. Income from securities lending is included in “Interest” income in the Statement of Operations. The dividend and interest income earned on the securities loaned is accounted for in the same manner as other dividend and interest income. At August 31, 2014, there were no securities on loan or collateral outstanding.
Indemnifications – Under the fund’s organizational documents, its officers and Trustees may be indemnified against certain liabilities and expenses arising out of the performance of their duties to the fund. Additionally, in the normal course of business, the fund enters into agreements with service providers that may contain indemnification clauses. The fund’s maximum exposure under these agreements is unknown as this would involve future claims that may be made against the fund that have not yet occurred.
Investment Transactions and Income – Investment transactions are recorded on the trade date. Interest income is recorded on the accrual basis. Dividends received in cash are recorded on the ex-dividend date. Certain dividends from foreign securities will be recorded when the fund is informed of the dividend if such information is obtained subsequent to the ex-dividend date. Dividend and interest payments received in additional securities are recorded on the ex-dividend or ex-interest date in an amount equal to the value of the security on such date.
The fund may receive proceeds from litigation settlements. Any proceeds received from litigation involving portfolio holdings are reflected in the Statement of Operations in realized gain/loss if the security has been disposed of by the fund or in unrealized gain/loss if the security is still held by the fund. Any other proceeds from litigation not related to portfolio holdings are reflected as other income in the Statement of Operations.
Fees Paid Indirectly – The fund’s custody fee may be reduced according to an arrangement that measures the value of cash deposited with the custodian by the fund. This amount, for the year ended August 31, 2014, is shown as a reduction of total expenses in the Statement of Operations.
Tax Matters and Distributions – The fund intends to qualify as a regulated investment company, as defined under Subchapter M of the Internal Revenue Code, and to distribute all of its taxable income, including realized capital gains. As a result, no provision for federal income tax is required. The fund’s federal tax returns, when filed, will remain subject to examination by the Internal Revenue Service for a three year period. Management has analyzed the fund’s tax positions taken on federal and state tax returns for all open tax years and does not believe that there are any uncertain tax positions that require recognition of a tax liability. Foreign taxes, if any, have been accrued by the fund in the accompanying financial statements in accordance with the applicable foreign tax law. Foreign income taxes may be withheld by certain countries in which the fund invests. Additionally, capital gains realized by the fund on securities issued in or by certain foreign countries may be subject to capital gains tax imposed by those countries.
31
Notes to Financial Statements – continued
Distributions to shareholders are recorded on the ex-dividend date. Income and capital gain distributions are determined in accordance with income tax regulations, which may differ from U.S. generally accepted accounting principles. Certain capital accounts in the financial statements are periodically adjusted for permanent differences in order to reflect their tax character. These adjustments have no impact on net assets or net asset value per share. Temporary differences which arise from recognizing certain items of income, expense, gain or loss in different periods for financial statement and tax purposes will reverse at some time in the future. Distributions in excess of net investment income or net realized gains are temporary overdistributions for financial statement purposes resulting from differences in the recognition or classification of income or distributions for financial statement and tax purposes.
Book/tax differences primarily relate to wash sale loss deferrals, and treating a portion of the proceeds from redemptions as a distribution for tax purposes.
The tax character of distributions declared to shareholders for the last two fiscal years is as follows:
| | | | | | | | |
| | | 8/31/14 | | | 8/31/13 | |
| Ordinary income (including any short-term capital gains) | | | $760,612,303 | | | | $430,454,430 | |
| Long-term capital gains | | | 406,331,212 | | | | 157,367,309 | |
| Total distributions | | | $1,166,943,515 | | | | $587,821,739 | |
The federal tax cost and the tax basis components of distributable earnings were as follows:
| | | | |
| As of 8/31/14 | | | |
| Cost of investments | | | $23,310,482,048 | |
| Gross appreciation | | | 11,083,866,830 | |
| Gross depreciation | | | (95,650,242 | ) |
| Net unrealized appreciation (depreciation) | | | $10,988,216,588 | |
| |
| Undistributed ordinary income | | | 231,870,445 | |
| Undistributed long-term capital gain | | | 683,583,120 | |
| Capital loss carryforwards | | | (17,104,180 | ) |
| Other temporary differences | | | (205,215 | ) |
Under the Regulated Investment Company Modernization Act of 2010 (the “Act”), net capital losses recognized for fund fiscal years beginning after August 31, 2011 may be carried forward indefinitely, and their character is retained as short-term and/or long-term losses (“post-enactment losses”). Previously, net capital losses were carried forward for eight years and treated as short-term losses (“pre-enactment losses”). As a transition rule, the Act requires that all post-enactment net capital losses be used before pre-enactment net capital losses.
As of August 31, 2014, the fund had capital loss carryforwards available to offset future realized gains. Such pre-enactment losses expire as follows:
32
Notes to Financial Statements – continued
The availability of $17,104,180 of the capital loss carryforwards, which were acquired on July 24, 2009 in connection with the MFS Strategic Value Fund merger, may be limited in a given year.
Multiple Classes of Shares of Beneficial Interest – The fund offers multiple classes of shares, which differ in their respective distribution, service, and program manager fees. The fund’s income, realized and unrealized gain (loss), and common expenses are allocated to shareholders based on the daily net assets of each class. Dividends are declared separately for each class. Differences in per share dividend rates are generally due to differences in separate class expenses. Class B and Class 529B shares will convert to Class A and Class 529A shares, respectively, approximately eight years after purchase. The fund’s distributions declared to shareholders as reported in the Statements of Changes in Net Assets are presented by class as follows:
| | | | | | | | | | | | | | | | |
| | | From net investment
income | | | From net realized gain on
investments | |
| | | Year
ended
8/31/14 | | | Year
ended
8/31/13 | | | Year
ended
8/31/14 | | | Year
ended
8/31/13 | |
| Class A | | | $173,579,969 | | | | $124,516,423 | | | | $158,274,114 | | | | $49,243,771 | |
| Class B | | | 2,090,774 | | | | 1,678,264 | | | | 3,249,251 | | | | 1,211,702 | |
| Class C | | | 15,134,051 | | | | 10,011,832 | | | | 21,935,733 | | | | 6,733,945 | |
| Class I | | | 261,803,666 | | | | 176,018,883 | | | | 207,624,418 | | | | 57,935,944 | |
| Class R1 | | | 399,161 | | | | 339,938 | | | | 629,904 | | | | 240,515 | |
| Class R2 | | | 10,006,893 | | | | 8,205,027 | | | | 10,778,017 | | | | 3,801,881 | |
| Class R3 | | | 27,923,409 | | | | 19,969,447 | | | | 25,565,924 | | | | 7,763,177 | |
| Class R4 | | | 68,672,815 | | | | 61,227,720 | | | | 55,241,972 | | | | 22,718,740 | |
| Class R5 | | | 72,631,471 | | | | 28,283,283 | | | | 50,791,793 | | | | 7,624,734 | |
| Class 529A | | | 248,321 | | | | 163,205 | | | | 220,123 | | | | 64,487 | |
| Class 529B | | | 11,886 | | | | 9,739 | | | | 18,765 | | | | 7,173 | |
| Class 529C | | | 43,621 | | | | 30,669 | | | | 67,464 | | | | 21,240 | |
| Total | | | $632,546,037 | | | | $430,454,430 | | | | $534,397,478 | | | | $157,367,309 | |
(3) Transactions with Affiliates
Investment Adviser – The fund has an investment advisory agreement with MFS to provide overall investment management and related administrative services and facilities to the fund. The management fee is computed daily and paid monthly at the following annual rates:
| | | | |
| First $7.5 billion of average daily net assets | | | 0.60 | % |
| Next $2.5 billion of average daily net assets | | | 0.53 | % |
| Average daily net assets in excess of $10 billion | | | 0.50 | % |
The investment adviser had agreed in writing to reduce its management fee to 0.45% of average daily net assets in excess of $20 billion. This written agreement was terminated on July 31, 2014. For the period September 1, 2013 through July 31, 2014, this management fee reduction amounted to $5,218,422, which is included in the reduction of total expenses in the Statement of Operations. Effective August 1, 2014 the investment adviser has agreed in writing to reduce its management fee to 0.45% of average daily net assets in excess of $20 billion up to $25 billion, 0.42% of average
33
Notes to Financial Statements – continued
daily net assets in excess of $25 billion up to $30 billion and 0.40% of average daily net assets in excess of $30 billion. This written agreement will continue until modified by the fund’s Board of Trustees, but such agreement will continue at least until December 31, 2015. For the period August 1, 2014 through August 31, 2014, this management fee reduction amounted to $874,446, which is included in the reduction of total expenses in the Statement of Operations. MFS has also agreed in writing to reduce its management fee by a specified amount if certain MFS mutual fund assets exceed thresholds agreed to by MFS and the fund’s Board of Trustees. For the year ended August 31, 2014, this management fee reduction amounted to $1,069,834, which is included in the reduction of total expenses in the Statement of Operations. The management fee incurred for the year ended August 31, 2014 was equivalent to an annual effective rate of 0.50% of the fund’s average daily net assets.
Distributor – MFS Fund Distributors, Inc. (MFD), a wholly-owned subsidiary of MFS, as distributor, received $2,867,215 and $9,922 for the year ended August 31, 2014, as its portion of the initial sales charge on sales of Class A and Class 529A shares of the fund, respectively.
The Board of Trustees has adopted a distribution plan for certain share classes pursuant to Rule 12b-1 of the Investment Company Act of 1940.
The fund’s distribution plan provides that the fund will pay MFD for services provided by MFD and financial intermediaries in connection with the distribution and servicing of certain share classes. One component of the plan is a distribution fee paid to MFD and another component of the plan is a service fee paid to MFD. MFD may subsequently pay all, or a portion, of the distribution and/or service fees to financial intermediaries.
Distribution Plan Fee Table:
| | | | | | | | | | | | | | | | | | | | |
| | | Distribution
Fee Rate (d) | | | Service
Fee Rate (d) | | | Total
Distribution
Plan (d) | | | Annual
Effective
Rate (e) | | | Distribution
and Service
Fee | |
| Class A | | | — | | | | 0.25% | | | | 0.25% | | | | 0.25% | | | | $22,799,341 | |
| Class B | | | 0.75% | | | | 0.25% | | | | 1.00% | | | | 1.00% | | | | 1,801,857 | |
| Class C | | | 0.75% | | | | 0.25% | | | | 1.00% | | | | 1.00% | | | | 12,653,688 | |
| Class R1 | | | 0.75% | | | | 0.25% | | | | 1.00% | | | | 1.00% | | | | 337,764 | |
| Class R2 | | | 0.25% | | | | 0.25% | | | | 0.50% | | | | 0.50% | | | | 3,012,294 | |
| Class R3 | | | — | | | | 0.25% | | | | 0.25% | | | | 0.25% | | | | 3,691,221 | |
| Class 529A | | | — | | | | 0.25% | | | | 0.25% | | | | 0.20% | | | | 32,315 | |
| Class 529B | | | 0.75% | | | | 0.25% | | | | 1.00% | | | | 0.99% | | | | 10,378 | |
| Class 529C | | | 0.75% | | | | 0.25% | | | | 1.00% | | | | 1.00% | | | | 37,501 | |
| Total Distribution and Service Fees | | | | $44,376,359 | |
| (d) | In accordance with the distribution plan for certain classes, the fund pays distribution and/or service fees equal to these annual percentage rates of each class’s average daily net assets. The distribution and service fee rates disclosed by class represent the current rates in effect at the end of the reporting period. Any rate changes, if applicable, are detailed below. |
| (e) | The annual effective rates represent actual fees incurred under the distribution plan for the year ended August 31, 2014 based on each class’s average daily net assets. MFD has voluntarily agreed to rebate a portion of each class’s 0.25% service fee attributable to accounts for which MFD retains the 0.25% service fee except for accounts attributable to MFS or its affiliates’ seed money. For the year ended August 31, 2014, this rebate amounted to |
34
Notes to Financial Statements – continued
| | $68,807, $799, $1,069, $4, $1,693, $28,698, $6,936, $72, and $45 for Class A, Class B, Class C, Class R1, Class R2, Class R3, Class 529A, Class 529B, and Class 529C, respectively, and is included in the reduction of total expenses in the Statement of Operations. |
Certain Class A shares are subject to a contingent deferred sales charge (CDSC) in the event of a shareholder redemption within 18 months of purchase for shares purchased on or after August 1, 2012, and within 24 months of purchase for shares purchased prior to August 1, 2012. Class C and Class 529C shares are subject to a CDSC in the event of a shareholder redemption within 12 months of purchase. Class B and Class 529B shares are subject to a CDSC in the event of a shareholder redemption within six years of purchase. All contingent deferred sales charges are paid to MFD and during the year ended August 31, 2014, were as follows:
| | | | |
| | | Amount | |
| Class A | | | $42,582 | |
| Class B | | | 157,016 | |
| Class C | | | 82,316 | |
| Class 529B | | | 296 | |
| Class 529C | | | 45 | |
The fund has entered into and may from time to time enter into contracts with program managers and other parties which administer the tuition programs through which an investment in the fund’s 529 share classes is made. The fund has entered into an agreement with MFD pursuant to which MFD receives an annual fee of up to 0.10% of the average daily net assets attributable to each 529 share class. MFD has agreed to waive a portion of this fee in an amount equal to 0.05% of the average daily net assets for each 529 share class. This waiver agreement will expire on December 31, 2015, unless MFD elects to extend the waiver. For the year ended August 31, 2014, this waiver amounted to $8,857 and is included in the reduction of total expenses in the Statement of Operations. The program manager fee incurred for the year ended August 31, 2014 was equivalent to an annual effective rate of 0.05% of the average daily net assets attributable to each 529 share class. The services provided by MFD, or a third party with which MFD contracts, include recordkeeping and tax reporting and account services, as well as services designed to maintain the program’s compliance with the Internal Revenue Code and other regulatory requirements. Program manager fees and waivers for the year ended August 31, 2014, were as follows:
| | | | | | | | |
| | | Fee | | | Waiver | |
| Class 529A | | | $12,926 | | | | $6,463 | |
| Class 529B | | | 1,038 | | | | 519 | |
| Class 529C | | | 3,750 | | | | 1,875 | |
| Total Program Manager Fees and Waivers | | | $17,714 | | | | $8,857 | |
Shareholder Servicing Agent – MFS Service Center, Inc. (MFSC), a wholly-owned subsidiary of MFS, receives a fee from the fund for its services as shareholder servicing agent calculated as a percentage of the average daily net assets of the fund as determined periodically under the supervision of the fund’s Board of Trustees. For the year ended August 31, 2014, the fee was $1,820,313, which equated to 0.0058% annually of the fund’s average daily net assets. MFSC also receives payment from the fund for out-of-pocket expenses, sub-accounting and other shareholder servicing costs which may be paid to affiliated and unaffiliated service providers. Class R5 shares do
35
Notes to Financial Statements – continued
not incur sub-accounting fees. For the year ended August 31, 2014, these out-of-pocket expenses, sub-accounting and other shareholder servicing costs amounted to $29,018,364.
Administrator – MFS provides certain financial, legal, shareholder communications, compliance, and other administrative services to the fund. Under an administrative services agreement, the fund partially reimburses MFS the costs incurred to provide these services. The fund is charged an annual fixed amount of $17,500 plus a fee based on average daily net assets. The administrative services fee incurred for the year ended August 31, 2014 was equivalent to an annual effective rate of 0.0015% of the fund’s average daily net assets.
Trustees’ and Officers’ Compensation – The fund pays compensation to independent Trustees in the form of a retainer, attendance fees, and additional compensation to Board and Committee chairpersons. The fund does not pay compensation directly to Trustees or officers of the fund who are also officers of the investment adviser, all of whom receive remuneration for their services to the fund from MFS. Certain officers and Trustees of the fund are officers or directors of MFS, MFD, and MFSC.
Prior to December 31, 2001, the fund had an unfunded defined benefit plan (“DB plan”) for independent Trustees. As of December 31, 2001, the Board took action to terminate the DB plan with respect to then-current and any future independent Trustees, such that the DB plan covers only certain of those former independent Trustees who retired on or before December 31, 2001. The DB plan resulted in a pension expense of $264 and is included in independent Trustees’ compensation for the year ended August 31, 2014. The liability for deferred retirement benefits payable to certain independent Trustees under the DB plan amounted to $3,482 at August 31, 2014, and is included in “Payable for independent Trustees’ compensation” in the Statement of Assets and Liabilities.
Other – This fund and certain other funds managed by MFS (the funds) have entered into services agreements (the Agreements) which provide for payment of fees by the funds to Tarantino LLC and Griffin Compliance LLC in return for the provision of services of an Independent Chief Compliance Officer (ICCO) and Assistant ICCO, respectively, for the funds. The funds can terminate the Agreements with Tarantino LLC and Griffin Compliance LLC at any time under the terms of the Agreements. The ICCO is an officer of the funds and the sole member of Tarantino LLC. Prior to June 1, 2014, Robyn L. Griffin served as the Assistant ICCO and was an officer of the funds. Ms. Griffin is the sole member of Griffin Compliance LLC. Effective May 31, 2014, Ms. Griffin resigned as Assistant ICCO and the service agreement between the funds and Griffin Compliance LLC was terminated. For the year ended August 31, 2014, the aggregate fees paid by the fund to Tarantino LLC and Griffin Compliance LLC were $158,640 and are included in “Miscellaneous” expense in the Statement of Operations. MFS has agreed to reimburse the fund for a portion of the payments made by the fund in the amount of $47,874, which is included in the reduction of total expenses in the Statement of Operations. Additionally, MFS has agreed to bear all expenses associated with office space, other administrative support, and supplies provided to the ICCO and Assistant ICCO.
36
Notes to Financial Statements – continued
The fund invests in the MFS Institutional Money Market Portfolio which is managed by MFS and seeks current income consistent with preservation of capital and liquidity. Income earned on this investment is included in “Dividends from underlying affiliated funds” in the Statement of Operations. This money market fund does not pay a management fee to MFS.
On September 11, 2013, MFS redeemed 4,432 shares of Class R5 for an aggregate amount of $137,259.
(4) Portfolio Securities
For the year ended August 31, 2014, purchases and sales of investments, other than short-term obligations, aggregated $6,114,887,474 and $3,958,155,310, respectively.
(5) Shares of Beneficial Interest
The fund’s Declaration of Trust permits the Trustees to issue an unlimited number of full and fractional shares of beneficial interest. Transactions in fund shares were as follows:
| | | | | | | | | | | | | | | | |
| | | Year ended
8/31/14 | | | Year ended
8/31/13 | |
| | | Shares | | | Amount | | | Shares | | | Amount | |
| Shares sold | | | | | | | | | | | | | | | | |
Class A | | | 60,870,511 | | | | $1,998,346,176 | | | | 67,116,915 | | | | $1,889,877,634 | |
Class B | | | 554,113 | | | | 18,053,263 | | | | 708,666 | | | | 20,011,073 | |
Class C | | | 6,897,860 | | | | 223,711,170 | | | | 6,158,073 | | | | 172,478,672 | |
Class I | | | 109,423,187 | | | | 3,625,117,953 | | | | 131,671,398 | | | | 3,656,207,857 | |
Class R1 | | | 194,673 | | | | 6,295,259 | | | | 285,909 | | | | 7,814,415 | |
Class R2 | | | 3,053,945 | | | | 99,572,053 | | | | 4,158,241 | | | | 114,058,643 | |
Class R3 | | | 12,218,431 | | | | 399,503,879 | | | | 12,097,117 | | | | 336,373,199 | |
Class R4 | | | 23,035,381 | | | | 757,348,601 | | | | 27,985,159 | | | | 771,830,606 | |
Class R5 | | | 41,463,392 | | | | 1,361,664,476 | | | | 43,743,094 | | | | 1,209,937,672 | |
Class 529A | | | 80,831 | | | | 2,657,258 | | | | 63,689 | | | | 1,774,775 | |
Class 529B | | | 3,899 | | | | 125,823 | | | | 3,293 | | | | 90,545 | |
Class 529C | | | 22,400 | | | | 724,788 | | | | 23,338 | | | | 635,837 | |
| | | 257,818,623 | | | | $8,493,120,699 | | | | 294,014,892 | | | | $8,181,090,928 | |
| | | | |
| Shares issued to shareholders in reinvestment of distributions | | | | | | | | | | | | | | | | |
Class A | | | 9,415,560 | | | | $305,704,358 | | | | 5,951,959 | | | | $157,662,290 | |
Class B | | | 150,377 | | | | 4,855,668 | | | | 100,309 | | | | 2,617,280 | |
Class C | | | 740,995 | | | | 23,828,112 | | | | 403,650 | | | | 10,521,773 | |
Class I | | | 9,622,407 | | | | 314,091,576 | | | | 5,760,185 | | | | 153,740,898 | |
Class R1 | | | 32,246 | | | | 1,029,065 | | | | 22,442 | | | | 579,636 | |
Class R2 | | | 618,578 | | | | 19,902,257 | | | | 438,901 | | | | 11,500,677 | |
Class R3 | | | 1,651,963 | | | | 53,489,015 | | | | 1,048,279 | | | | 27,727,975 | |
Class R4 | | | 3,656,123 | | | | 118,701,122 | | | | 3,091,705 | | | | 81,724,939 | |
Class R5 | | | 3,668,044 | | | | 119,290,819 | | | | 1,333,660 | | | | 35,908,017 | |
Class 529A | | | 14,540 | | | | 468,444 | | | | 8,630 | | | | 227,628 | |
Class 529B | | | 961 | | | | 30,651 | | | | 653 | | | | 16,883 | |
Class 529C | | | 3,488 | | | | 111,072 | | | | 2,010 | | | | 51,909 | |
| | | 29,575,282 | | | | $961,502,159 | | | | 18,162,383 | | | | $482,279,905 | |
37
Notes to Financial Statements – continued
| | | | | | | | | | | | | | | | |
| | | Year ended
8/31/14 | | | Year ended
8/31/13 | |
| | | Shares | | | Amount | | | Shares | | | Amount | |
| Shares reacquired | | | | | | | | | | | | | | | | |
Class A | | | (68,358,836 | ) | | | $(2,261,976,774 | ) | | | (68,940,476 | ) | | | $(1,899,985,019 | ) |
Class B | | | (1,216,763 | ) | | | (39,918,338 | ) | | | (1,883,982 | ) | | | (51,710,790 | ) |
Class C | | | (4,992,374 | ) | | | (162,937,252 | ) | | | (6,368,042 | ) | | | (172,465,155 | ) |
Class I | | | (73,189,862 | ) | | | (2,414,804,530 | ) | | | (83,338,753 | ) | | | (2,318,973,834 | ) |
Class R1 | | | (390,185 | ) | | | (12,621,777 | ) | | | (488,335 | ) | | | (13,148,405 | ) |
Class R2 | | | (5,389,359 | ) | | | (175,451,679 | ) | | | (6,162,208 | ) | | | (167,459,751 | ) |
Class R3 | | | (12,493,293 | ) | | | (410,560,625 | ) | | | (10,622,008 | ) | | | (294,129,563 | ) |
Class R4 | | | (29,116,657 | ) | | | (960,068,960 | ) | | | (50,807,188 | ) | | | (1,394,609,059 | ) |
Class R5 | | | (9,245,299 | ) | | | (305,654,695 | ) | | | (3,658,419 | ) | | | (104,034,634 | ) |
Class 529A | | | (41,342 | ) | | | (1,358,958 | ) | | | (35,610 | ) | | | (1,007,941 | ) |
Class 529B | | | (9,354 | ) | | | (303,416 | ) | | | (8,708 | ) | | | (239,427 | ) |
Class 529C | | | (24,670 | ) | | | (797,250 | ) | | | (16,277 | ) | | | (440,935 | ) |
| | | (204,467,994 | ) | | | $(6,746,454,254 | ) | | | (232,330,006 | ) | | | $(6,418,204,513 | ) |
| | | | |
| Net change | | | | | | | | | | | | | | | | |
Class A | | | 1,927,235 | | | | $42,073,760 | | | | 4,128,398 | | | | $147,554,905 | |
Class B | | | (512,273 | ) | | | (17,009,407 | ) | | | (1,075,007 | ) | | | (29,082,437 | ) |
Class C | | | 2,646,481 | | | | 84,602,030 | | | | 193,681 | | | | 10,535,290 | |
Class I | | | 45,855,732 | | | | 1,524,404,999 | | | | 54,092,830 | | | | 1,490,974,921 | |
Class R1 | | | (163,266 | ) | | | (5,297,453 | ) | | | (179,984 | ) | | | (4,754,354 | ) |
Class R2 | | | (1,716,836 | ) | | | (55,977,369 | ) | | | (1,565,066 | ) | | | (41,900,431 | ) |
Class R3 | | | 1,377,101 | | | | 42,432,269 | | | | 2,523,388 | | | | 69,971,611 | |
Class R4 | | | (2,425,153 | ) | | | (84,019,237 | ) | | | (19,730,324 | ) | | | (541,053,514 | ) |
Class R5 | | | 35,886,137 | | | | 1,175,300,600 | | | | 41,418,335 | | | | 1,141,811,055 | |
Class 529A | | | 54,029 | | | | 1,766,744 | | | | 36,709 | | | | 994,462 | |
Class 529B | | | (4,494 | ) | | | (146,942 | ) | | | (4,762 | ) | | | (131,999 | ) |
Class 529C | | | 1,218 | | | | 38,610 | | | | 9,071 | | | | 246,811 | |
| | | 82,925,911 | | | | $2,708,168,604 | | | | 79,847,269 | | | | $2,245,166,320 | |
The fund is one of several mutual funds in which certain MFS funds may invest. The MFS funds do not invest in the underlying funds for the purpose of exercising management or control. At the end of the period, the MFS Growth Allocation Fund, the MFS Aggressive Growth Allocation Fund, the MFS Conservative Allocation Fund, and the MFS Moderate Allocation Fund were the owners of record of approximately 2%, 1%, 1%, and 1%, respectively, of the value of outstanding voting shares of the fund. In addition, the MFS Lifetime Income Fund, the MFS Lifetime 2015 Fund, the MFS Lifetime 2020 Fund, the MFS Lifetime 2025 Fund, the MFS Lifetime 2030 Fund, the MFS Lifetime 2035 Fund, the MFS Lifetime 2040 Fund, the MFS Lifetime 2045 Fund, the MFS Lifetime 2050 Fund, the MFS Lifetime 2055 Fund, and the MFS Managed Wealth Fund were each the owners of record of less than 1% of the value of outstanding voting shares of the fund.
(6) Line of Credit
The fund and certain other funds managed by MFS participate in a $1.1 billion unsecured committed line of credit, subject to a $1 billion sublimit, provided by a
38
Notes to Financial Statements – continued
syndication of banks under a credit agreement. Borrowings may be made for temporary financing needs. Interest is charged to each fund, based on its borrowings, generally at a rate equal to the higher of the Federal Reserve funds rate or one month LIBOR plus an agreed upon spread. A commitment fee, based on the average daily, unused portion of the committed line of credit, is allocated among the participating funds at the end of each calendar quarter. In addition, the fund and other funds managed by MFS have established unsecured uncommitted borrowing arrangements with certain banks for temporary financing needs. Interest is charged to each fund, based on its borrowings, at a rate equal to the Federal Reserve funds rate plus an agreed upon spread. For the year ended August 31, 2014, the fund’s commitment fee and interest expense were $123,114 and $0, respectively, and are included in “Miscellaneous” expense in the Statement of Operations.
(7) Transactions in Underlying Affiliated Funds-Affiliated Issuers
An affiliated issuer may be considered one in which the fund owns 5% or more of the outstanding voting securities, or a company which is under common control. For the purposes of this report, the fund assumes the following to be an affiliated issuer:
| | | | | | | | | | | | | | | | |
| Underlying Affiliated Fund | | Beginning
Shares/Par
Amount | | | Acquisitions
Shares/Par
Amount | | | Dispositions
Shares/Par
Amount | | | Ending Shares/Par
Amount | |
MFS Institutional Money
Market Portfolio | | | 382,071,026 | | | | 3,657,610,049 | | | | (3,710,629,346 | ) | | | 329,051,729 | |
| | | | |
| Underlying Affiliated Fund | | Realized
Gain (Loss) | | | Capital Gain
Distributions | | | Dividend
Income | | | Ending Value | |
MFS Institutional Money
Market Portfolio | | | $— | | | | $— | | | | $348,101 | | | | $329,051,729 | |
39
REPORT OF INDEPENDENT REGISTERED PUBLIC ACCOUNTING FIRM
To the Board of Trustees of MFS Series Trust I and Shareholders of MFS Value Fund:
We have audited the accompanying statement of assets and liabilities of MFS Value Fund (the Fund) (one of the series constituting MFS Series Trust I), including the portfolio of investments, as of August 31, 2014, and the related statement of operations for the year then ended, the statements of changes in net assets for each of the two years in the period then ended, and the financial highlights for each of the five years in the period then ended. These financial statements and financial highlights are the responsibility of the Fund’s management. Our responsibility is to express an opinion on these financial statements and financial highlights based on our audits.
We conducted our audits in accordance with the standards of the Public Company Accounting Oversight Board (United States). Those standards require that we plan and perform the audit to obtain reasonable assurance about whether the financial statements and financial highlights are free of material misstatement. We were not engaged to perform an audit of the Fund’s internal control over financial reporting. Our audits included consideration of internal control over financial reporting as a basis for designing audit procedures that are appropriate in the circumstances, but not for the purpose of expressing an opinion on the effectiveness of the Fund’s internal control over financial reporting. Accordingly, we express no such opinion. An audit also includes examining, on a test basis, evidence supporting the amounts and disclosures in the financial statements and financial highlights, assessing the accounting principles used and significant estimates made by management, and evaluating the overall financial statement presentation. Our procedures included confirmation of securities owned as of August 31, 2014, by correspondence with the custodian and others or by other appropriate auditing procedures where replies from others were not received. We believe that our audits provide a reasonable basis for our opinion.
In our opinion, the financial statements and financial highlights referred to above present fairly, in all material respects, the financial position of MFS Value Fund (one of the series constituting MFS Series Trust I) at August 31, 2014, the results of its operations for the year then ended, the changes in its net assets for each of the two years in the period then ended, and the financial highlights for each of the five years in the period then ended, in conformity with U.S. generally accepted accounting principles.

Boston, Massachusetts
October 16, 2014
40
TRUSTEES AND OFFICERS — IDENTIFICATION AND BACKGROUND
The Trustees and Officers of the Trust, as of October 1, 2014, are listed below, together with their principal occupations during the past five years. (Their titles may have varied during that period.) The address of each Trustee and Officer is 111 Huntington Avenue, Boston, Massachusetts 02199-7618. It is expected that the Board will appoint Mr. Timothy M. Fagan as Chief Compliance Officer of the MFS Funds on November 1, 2014.
| | | | | | | | |
Name, Age | | Position(s) Held with Fund | | Trustee/Officer
Since (h) | | Principal
Occupations During the Past Five Years | | Other Directorships (j) |
| INTERESTED TRUSTEES |
Robert J. Manning (k)
(age 50) | | Trustee | | February 2004 | | Massachusetts Financial Services Company, Chairman, Chief Executive Officer and Director; President (until 2009); Chief Investment Officer (until 2010) | | N/A |
Robin A. Stelmach (k)
(age 53) | | Trustee and President | | January 2014 | | Massachusetts Financial Services Company, Executive Vice President and Chief Operating Officer | | N/A |
| INDEPENDENT TRUSTEES | | |
David H. Gunning
(age 72) | | Trustee and Chair of Trustees | | January 2004 | | Private investor | | Lincoln Electric Holdings, Inc. (welding equipment manufacturer), Director; Development Alternatives, Inc. (consulting), Director/Non-Executive Chairman |
Steven E. Buller (age 63) | | Trustee | | February 2014 | | Chairman, Financial Accounting Standards Advisory Council; Standing Advisory Group, Public Company Accounting Oversight Board, Member; BlackRock, Inc. (investment management), Managing Director (until 2014), BlackRock Finco UK (investment management), Director (until 2014) | | N/A |
41
Trustees and Officers – continued
| | | | | | | | |
Name, Age | | Position(s) Held with Fund | | Trustee/Officer
Since (h) | | Principal
Occupations During the Past Five Years | | Other Directorships (j) |
Robert E. Butler
(age 72) | | Trustee | | January 2006 | | Consultant – investment company industry regulatory and compliance matters | | N/A |
Maureen R. Goldfarb
(age 59) | | Trustee | | January 2009 | | Private investor | | N/A |
William R. Gutow
(age 73) | | Trustee | | December 1993 | | Private investor and real estate consultant; Capitol Entertainment Management Company (video franchise), Vice Chairman | | Texas Donuts (donut franchise), Vice Chairman (until 2010) |
Michael Hegarty
(age 69) | | Trustee | | December 2004 | | Private investor | | Brookfield Office Properties, Inc. (real estate), Director; Rouse Properties Inc. (real estate), Director; Capmark Financial Group Inc. (real estate), Director |
John P. Kavanaugh
(age 59) | | Trustee | | January 2009 | | Private investor | | N/A |
Maryanne L. Roepke
(age 58) | | Trustee | | May 2014 | | American Century Investments (investment management), Senior Vice President and Chief Compliance Officer (until 2014) | | N/A |
Laurie J. Thomsen
(age 57) | | Trustee | | March 2005 | | Private investor; New Profit, Inc. (venture philanthropy), Executive Partner (until 2010) | | The Travelers Companies (insurance), Director |
Robert W. Uek
(age 73) | | Trustee | | January 2006 | | Consultant to investment company industry | | N/A |
| OFFICERS | | | | | | |
Christopher R. Bohane (k)
(age 40) | | Assistant Secretary and Assistant Clerk | | July 2005 | | Massachusetts Financial Services Company, Vice President and Assistant General Counsel | | N/A |
Kino Clark (k)
(age 46) | | Assistant Treasurer | | January 2012 | | Massachusetts Financial Services Company, Vice President | | N/A |
42
Trustees and Officers – continued
| | | | | | | | |
Name, Age | | Position(s) Held with Fund | | Trustee/Officer
Since (h) | | Principal
Occupations During the Past Five Years | | Other Directorships (j) |
Thomas H. Connors (k)
(age 55) | | Assistant Secretary and Assistant Clerk | | September 2012 | | Massachusetts Financial Services Company, Vice President and Senior Counsel; Deutsche Investment Management Americas Inc. (financial service provider), Director and Senior Counsel (until 2012) | | N/A |
Ethan D. Corey (k)
(age 50) | | Assistant Secretary and Assistant Clerk | | July 2005 | | Massachusetts Financial Services Company, Senior Vice President and Associate General Counsel | | N/A |
David L. DiLorenzo (k)
(age 46) | | Treasurer | | July 2005 | | Massachusetts Financial Services Company, Senior Vice President | | N/A |
Brian E. Langenfeld (k) (age 41) | | Assistant Secretary and Assistant Clerk | | June 2006 | | Massachusetts Financial Services Company, Vice President and Senior Counsel | | N/A |
Susan S. Newton (k) (age 64) | | Assistant Secretary and Assistant Clerk | | May 2005 | | Massachusetts Financial Services Company, Senior Vice President and Associate General Counsel | | N/A |
Susan A. Pereira (k)
(age 43) | | Assistant Secretary and Assistant Clerk | | July 2005 | | Massachusetts Financial Services Company, Vice President and Senior Counsel | | N/A |
Kasey L. Phillips (k) (age 43) | | Assistant Treasurer | | September 2012 | | Massachusetts Financial Services Company, Vice President; Wells Fargo Funds Management, LLC, Senior Vice President, Fund Treasurer (until 2012) | | N/A |
Mark N. Polebaum (k)
(age 62) | | Secretary and Clerk | | January 2006 | | Massachusetts Financial Services Company, Executive Vice President, General Counsel and Secretary | | N/A |
43
Trustees and Officers – continued
| | | | | | | | |
Name, Age | | Position(s) Held with Fund | | Trustee/Officer
Since (h) | | Principal
Occupations During the Past Five Years | | Other Directorships (j) |
Matthew A. Stowe (k) (age 39) | | Assistant Secretary and Assistant Clerk | | October 2014 | | Massachusetts Financial Services Company, Vice President and Senior Counsel | | N/A |
Frank L. Tarantino (l)
(age 70) | | Independent Chief Compliance Officer | | June 2004 | | Tarantino LLC (provider of compliance services), Principal | | N/A |
Richard S. Weitzel (k)
(age 44) | | Assistant Secretary and Assistant Clerk | | October 2007 | | Massachusetts Financial Services Company, Senior Vice President and Associate General Counsel | | N/A |
James O. Yost (k)
(age 54) | | Deputy Treasurer | | September 1990 | | Massachusetts Financial Services Company, Senior Vice President | | N/A |
| (h) | Date first appointed to serve as Trustee/officer of an MFS Fund. Each Trustee has served continuously since appointment unless indicated otherwise. For the period from December 15, 2004 until February 22, 2005, Mr. Manning served as Advisory Trustee. Prior to January 2012, Messrs. DiLorenzo and Yost served as Assistant Treasurers of the Funds. Ms. Stelmach was appointed as President of the Funds as of October 1, 2014. |
| (j) | Directorships or trusteeships of companies required to report to the Securities and Exchange Commission (i.e., “public companies”). |
| (k) | “Interested person” of the Trust within the meaning of the Investment Company Act of 1940 (referred to as the 1940 Act), which is the principal federal law governing investment companies like the fund, as a result of position with MFS. The address of MFS is 111 Huntington Avenue, Boston, Massachusetts 02199-7618. |
| (l) | Mr. Tarantino will retire as Independent Chief Compliance Officer of the MFS Funds on October 31, 2014. It is expected that Mr. Tarantino will continue after that date as an Independent Senior Officer of the MFS Funds. |
Each Trustee (except Ms. Stelmach, Mr. Buller and Ms. Roepke) has been elected by shareholders and each Trustee and officer holds office until his or her successor is chosen and qualified or until his or her earlier death, resignation, retirement or removal. The Trust does not hold annual meetings for the purpose of electing Trustees, and Trustees are not elected for fixed terms. Messrs. Butler, Kavanaugh, Uek and Mses. Thomsen and Roepke are members of the Trust’s Audit Committee.
Each of the Fund’s Trustees and officers holds comparable positions with certain other funds of which MFS or a subsidiary is the investment adviser or distributor, and, in the case of the officers, with certain affiliates of MFS. As of January 1, 2014, the Trustees served as board members of 142 funds within the MFS Family of Funds.
44
Trustees and Officers – continued
The Statement of Additional Information for the Fund includes further information about the Trustees and is available without charge upon request by calling 1-800-225-2606.
| | |
| Investment Adviser | | Custodian |
Massachusetts Financial Services Company
111 Huntington Avenue
Boston, MA 02199-7618 | | State Street Bank and Trust Company 1 Lincoln Street Boston, MA 02111-2900 |
| Distributor | | Independent Registered Public Accounting Firm |
MFS Fund Distributors, Inc.
111 Huntington Avenue
Boston, MA 02199-7618 | | Ernst & Young LLP 200 Clarendon Street Boston, MA 02116 |
| Portfolio Managers | | |
Nevin Chitkara
Steven Gorham | | |
45
BOARD REVIEW OF INVESTMENT ADVISORY AGREEMENT
The Investment Company Act of 1940 requires that both the full Board of Trustees and a majority of the non-interested (“independent”) Trustees, voting separately, annually approve the continuation of the Fund’s investment advisory agreement with MFS. The Trustees consider matters bearing on the Fund and its advisory arrangements at their meetings throughout the year, including a review of performance data at each regular meeting. In addition, the independent Trustees met several times over the course of three months beginning in May and ending in July, 2014 (“contract review meetings”) for the specific purpose of considering whether to approve the continuation of the investment advisory agreement for the Fund and the other investment companies that the Board oversees (the “MFS Funds”). The independent Trustees were assisted in their evaluation of the Fund’s investment advisory agreement by independent legal counsel, from whom they received separate legal advice and with whom they met separately from MFS during various contract review meetings. The independent Trustees were also assisted in this process by the MFS Funds’ Independent Chief Compliance Officer, a full-time senior officer appointed by and reporting to the independent Trustees.
In connection with their deliberations regarding the continuation of the investment advisory agreement, the Trustees, including the independent Trustees, considered such information and factors as they believed, in light of the legal advice furnished to them and their own business judgment, to be relevant. The investment advisory agreement for the Fund was considered separately, although the Trustees also took into account the common interests of all MFS Funds in their review. As described below, the Trustees considered the nature, quality, and extent of the various investment advisory, administrative, and shareholder services performed by MFS under the existing investment advisory agreement and other arrangements with the Fund.
In connection with their contract review meetings, the Trustees received and relied upon materials that included, among other items: (i) information provided by Lipper Inc., an independent third party, on the investment performance of the Fund for various time periods ended December 31, 2013 and the investment performance of a group of funds with substantially similar investment classifications/objectives (the “Lipper performance universe”), (ii) information provided by Lipper Inc. on the Fund’s advisory fees and other expenses and the advisory fees and other expenses of comparable funds identified by Lipper Inc. (the “Lipper expense group”), (iii) information provided by MFS on the advisory fees of comparable portfolios of other clients of MFS, including institutional separate accounts and other clients, (iv) information as to whether and to what extent applicable expense waivers, reimbursements or fee “breakpoints” are observed for the Fund, (v) information regarding MFS’ financial results and financial condition, including MFS’ and certain of its affiliates’ estimated profitability from services performed for the Fund and the MFS Funds as a whole, and compared to MFS’ institutional business, (vi) MFS’ views regarding the outlook for the mutual fund industry and the strategic business plans of MFS, (vii) descriptions of various functions performed by MFS for the Funds, such as compliance monitoring and portfolio trading practices, and (viii) information regarding the overall organization of MFS, including information about MFS’ senior management and other personnel providing investment advisory, administrative and other services to
46
Board Review of Investment Advisory Agreement – continued
the Fund and the other MFS Funds. The comparative performance, fee and expense information prepared and provided by Lipper Inc. was not independently verified and the independent Trustees did not independently verify any information provided to them by MFS.
The Trustees’ conclusion as to the continuation of the investment advisory agreement was based on a comprehensive consideration of all information provided to the Trustees and not the result of any single factor. Some of the factors that figured particularly in the Trustees’ deliberations are described below, although individual Trustees may have evaluated the information presented differently from one another, giving different weights to various factors. It is also important to recognize that the fee arrangements for the Fund and other MFS Funds are the result of years of review and discussion between the independent Trustees and MFS, that certain aspects of such arrangements may receive greater scrutiny in some years than in others, and that the Trustees’ conclusions may be based, in part, on their consideration of these same arrangements during the course of the year and in prior years.
Based on information provided by Lipper Inc. and MFS, the Trustees reviewed the Fund’s total return investment performance as well as the performance of peer groups of funds over various time periods. The Trustees placed particular emphasis on the total return performance of the Fund’s Class A shares in comparison to the performance of funds in its Lipper performance universe over the three-year period ended December 31, 2013, which the Trustees believed was a long enough period to reflect differing market conditions. The total return performance of the Fund’s Class A shares was in the 2nd quintile relative to the other funds in the universe for this three-year period (the 1st quintile being the best performers and the 5th quintile being the worst performers). The total return performance of the Fund’s Class A shares was in the 1st quintile for the one-year period and the 4th quintile for the five-year period ended December 31, 2013 relative to the Lipper performance universe. Because of the passage of time, these performance results may differ from the performance results for more recent periods, including those shown elsewhere in this report.
In the course of their deliberations, the Trustees took into account information provided by MFS in connection with the contract review meetings, as well as during investment review meetings conducted with portfolio management personnel during the course of the year regarding the Fund’s performance. After reviewing these and related factors, the Trustees concluded, within the context of their overall conclusions regarding the investment advisory agreement, that they were satisfied with MFS’ responses and efforts relating to investment performance.
In assessing the reasonableness of the Fund’s advisory fee, the Trustees considered, among other information, the Fund’s advisory fee and the total expense ratio of the Fund’s Class A shares as a percentage of average daily net assets and the advisory fee and total expense ratios of peer groups of funds based on information provided by Lipper Inc. The Trustees considered that, according to the Lipper data (which takes into account any fee reductions or expense limitations that were in effect during the Fund’s last fiscal year), the Fund’s effective advisory fee rate was approximately at the Lipper expense group median, and the Fund’s total expense ratio was lower than the Lipper expense group median.
47
Board Review of Investment Advisory Agreement – continued
The Trustees also considered the advisory fees charged by MFS to any comparable institutional accounts. In comparing these fees, the Trustees considered information provided by MFS as to the generally broader scope of services provided by MFS to the Fund in comparison to institutional accounts, the higher demands placed on MFS’ investment personnel and trading infrastructure as a result of the daily cash in-flows and out-flows of the Fund, and the impact on MFS and expenses associated with the more extensive regulatory regime to which the Fund is subject in comparison to institutional accounts.
The Trustees also considered whether the Fund may benefit from any economies of scale in the management of the Fund in the event of growth in assets of the Fund and/or growth in assets of the MFS Funds as a whole. They noted that the Fund’s advisory fee rate schedule is subject to contractual breakpoints that reduce the Fund’s advisory fee rate on average daily net assets over $7.5 billion and $10 billion, that MFS has agreed in writing to reduce its advisory fee rate on the Fund’s average daily net assets over $20 billion, and that MFS has agreed in writing to implement additional breakpoints that reduce its advisory fee rate on the Fund’s average daily net assets over $25 billion and $30 billion, each of which may not be changed without the Trustees’ approval. The Trustees also noted that MFS has agreed in writing to waive a portion of the management fees of certain MFS Funds, including the Fund, if the total combined assets of certain funds within the MFS Funds’ complex increase above agreed upon thresholds (the “group fee waiver”), enabling the Fund’s shareholders to share in the benefits from any economies of scale at the complex level. The group fee waiver is reviewed and renewed annually between the Board and MFS. The Trustees concluded that the breakpoints and the group fee waiver were sufficient to allow the Fund to benefit from economies of scale as its assets and overall complex assets grow.
The Trustees also considered information prepared by MFS relating to MFS’ costs and profits with respect to the Fund, the MFS Funds considered as a group, and other investment companies and accounts advised by MFS, as well as MFS’ methodologies used to determine and allocate its costs to the MFS Funds, the Fund and other accounts and products for purposes of estimating profitability.
After reviewing these and other factors described herein, the Trustees concluded, within the context of their overall conclusions regarding the investment advisory agreement, that the advisory fees charged to the Fund represent reasonable compensation in light of the services being provided by MFS to the Fund.
In addition, the Trustees considered MFS’ resources and related efforts to continue to retain, attract and motivate capable personnel to serve the Fund. The Trustees also considered current and developing conditions in the financial services industry, including the presence of large and well-capitalized companies which are spending, and appear to be prepared to continue to spend, substantial sums to engage personnel and to provide services to competing investment companies. In this regard, the Trustees also considered the financial resources of MFS and its ultimate parent, Sun Life Financial Inc. The Trustees also considered the advantages and possible disadvantages to the Fund of having an adviser that also serves other investment companies as well as other accounts.
48
Board Review of Investment Advisory Agreement – continued
The Trustees also considered the nature, quality, cost, and extent of administrative, transfer agency, and distribution services provided to the Fund by MFS and its affiliates under agreements and plans other than the investment advisory agreement, including any 12b-1 fees the Fund pays to MFS Fund Distributors, Inc., an affiliate of MFS. The Trustees also considered the nature, extent and quality of certain other services MFS performs or arranges for on the Fund’s behalf, which may include securities lending programs, directed expense payment programs, class action recovery programs, and MFS’ interaction with third-party service providers, principally custodians and sub-custodians. The Trustees concluded that the various non-advisory services provided by MFS and its affiliates on behalf of the Fund were satisfactory.
The Trustees also considered benefits to MFS from the use of the Fund’s portfolio brokerage commissions, if applicable, to pay for investment research and various other factors. Additionally, the Trustees considered so-called “fall-out benefits” to MFS such as reputational value derived from serving as investment manager to the Fund.
Based on their evaluation of factors that they deemed to be material, including those factors described above, the Board of Trustees, including the independent Trustees, concluded that the Fund’s investment advisory agreement with MFS should be continued for an additional one-year period, commencing August 1, 2014.
49
PROXY VOTING POLICIES AND INFORMATION
MFS votes proxies on behalf of the fund pursuant to proxy voting policies and procedures that are available without charge, upon request, by calling 1-800-225-2606, by visiting the Proxy Voting section of mfs.com or by visiting the SEC’s Web site at http://www.sec.gov.
Information regarding how the fund voted proxies relating to portfolio securities during the most recent twelve-month period ended June 30 is available without charge by visiting the Proxy Voting section of mfs.com or by visiting the SEC’s Web site at http://www.sec.gov.
QUARTERLY PORTFOLIO DISCLOSURE
The fund will file a complete schedule of portfolio holdings with the Securities and Exchange Commission (the Commission) for the first and third quarters of each fiscal year on Form N-Q. A shareholder can obtain the quarterly portfolio holdings report at mfs.com. The fund’s Form N-Q is also available on the EDGAR database on the Commission’s Internet Web site at http://www.sec.gov, and may be reviewed and copied at the:
Public Reference Room
Securities and Exchange Commission
100 F Street, NE, Room 1580
Washington, D.C. 20549
Information on the operation of the Public Reference Room may be obtained by calling the Commission at 1-800-SEC-0330. Copies of the fund’s Form N-Q also may be obtained, upon payment of a duplicating fee, by electronic request at the following e-mail address: publicinfo@sec.gov or by writing the Public Reference Section at the above address.
FURTHER INFORMATION
From time to time, MFS may post important information about the fund or the MFS funds on the MFS web site (mfs.com). This information is available by visiting the “Commentary & Announcements” and “Market Outlooks” sections of mfs.com or by clicking on the fund’s name under “Mutual Funds” in the “Products” section of mfs.com.
FEDERAL TAX INFORMATION (unaudited)
The fund will notify shareholders of amounts for use in preparing 2014 income tax forms in January 2015. The following information is provided pursuant to provisions of the Internal Revenue Code.
The fund designates the maximum amount allowable as qualified dividend income eligible to be taxed at the same rate as long-term capital gain.
The fund designates $549,740,000 as capital gain dividends paid during the fiscal year.
For corporate shareholders, 99.04% of the ordinary income dividends paid during the fiscal year qualify for the corporate dividends received deduction.
50
rev. 3/11
| | | | |
| | | |
FACTS | | WHAT DOES MFS DO WITH YOUR PERSONAL INFORMATION? | |  |
| | |
| Why? | | Financial companies choose how they share your personal information. Federal law gives consumers the right to limit some but not all sharing. Federal law also requires us to tell you how we collect, share, and protect your personal information. Please read this notice carefully to understand what we do. |
| | |
| What? | | The types of personal information we collect and share depend on the product or service you have with us. This information can include: • Social Security number and account balances • Account transactions and transaction history • Checking account information and wire transfer instructions When you are no longer our customer, we continue to share your information as described in this notice. |
| | |
| How? | | All financial companies need to share customers’ personal information to run their everyday business. In the section below, we list the reasons financial companies can share their customers’ personal information; the reasons MFS chooses to share; and whether you can limit this sharing. |
| | | | |
Reasons we can share your
personal information | | Does MFS
share? | | Can you limit
this sharing? |
For our everyday business purposes – such as to process your transactions, maintain your account(s), respond to court orders and legal investigations, or report to credit bureaus | | Yes | | No |
For our marketing purposes – to offer our products and services to you | | No | | We don’t share |
| For joint marketing with other financial companies | | No | | We don’t share |
For our affiliates’ everyday business purposes – information about your transactions and experiences | | No | | We don’t share |
For our affiliates’ everyday business purposes – information about your creditworthiness | | No | | We don’t share |
| For nonaffiliates to market to you | | No | | We don’t share |
| | |
| Questions? | | Call 800-225-2606 or go to mfs.com. |
51
| | |
| Who we are |
| Who is providing this notice? | | MFS Funds, MFS Investment Management, MFS Institutional Advisors, Inc., MFS Fund Distributors, Inc., MFS Heritage Trust Company, and MFS Service Center, Inc. |
| | |
| What we do |
| How does MFS protect my personal information? | | To protect your personal information from unauthorized access and use, we use security measures that comply with federal law. These measures include procedural, electronic, and physical safeguards for the protection of the personal information we collect about you. |
| How does MFS collect my personal information? | | We collect your personal information, for example, when you •open an account or provide account information •direct us to buy securities or direct us to sell your securities •make a wire transfer We also collect your personal information from others, such as credit bureaus, affiliates and other companies. |
| Why can’t I limit all sharing? | | Federal law gives you the right to limit only •sharing for affiliates’ everyday business purposes – information about your creditworthiness •affiliates from using your information to market to you •sharing for nonaffiliates to market to you State laws and individual companies may give you additional rights to limit sharing. |
| | |
| Definitions |
| Affiliates | | Companies related by common ownership or control. They can be financial and nonfinancial companies. •MFS does not share personal information with affiliates, except for everyday business purposes as described on page one of this notice. |
| Nonaffiliates | | Companies not related by common ownership or control. They can be financial and nonfinancial companies. •MFS does not share with nonaffiliates so they can market to you. |
| Joint Marketing | | A formal agreement between nonaffiliated financial companies that together market financial products or services to you. •MFS doesn’t jointly market. |
| | |
| Other important information |
| If you own an MFS product or receive an MFS service in the name of a third party such as a bank or broker-dealer, their privacy policy may apply to you instead of ours. |
52
Save paper with eDelivery.

| MFS® will send you prospectuses, |
reports, and proxies directly via e-mail so you will get information faster with less mailbox clutter.
To sign up:
1. Go to mfs.com.
2. Log in via MFS® Access.
3. Select eDelivery.
If you own your MFS fund shares through a financial institution or a retirement plan, MFS® TALK, MFS® Access, or eDelivery may not be available to you.
CONTACT
WEB SITE
mfs.com
MFS TALK
1-800-637-8255
24 hours a day
ACCOUNT SERVICE AND LITERATURE
Shareholders
1-800-225-2606
Financial advisors
1-800-343-2829
Retirement plan services
1-800-637-1255
MAILING ADDRESS
MFS Service Center, Inc.
P.O. Box 55824
Boston, MA 02205-5824
OVERNIGHT MAIL
MFS Service Center, Inc.
c/o Boston Financial Data Services
30 Dan Road
Canton, MA 02021-2809
The Registrant has adopted a Code of Ethics pursuant to Section 406 of the Sarbanes-Oxley Act and as defined in Form N-CSR that applies to the Registrant’s principal executive officer and principal financial and accounting officer. During the period covered by this report, the Registrant has not amended any provision in its Code of Ethics (the “Code”) that relates to an element of the Code’s definitions enumerated in paragraph (b) of Item 2 of this Form N-CSR. During the period covered by this report, the Registrant did not grant a waiver, including an implicit waiver, from any provision of the Code.
A copy of the Code of Ethics is filed as an exhibit to this Form N-CSR.
| ITEM 3. | AUDIT COMMITTEE FINANCIAL EXPERT. |
Messrs. Robert E. Butler, John P. Kavanaugh and Robert W. Uek and Meses. Maryanne L. Roepke and Laurie J. Thomsen, members of the Audit Committee, have been determined by the Board of Trustees in their reasonable business judgment to meet the definition of “audit committee financial expert” as such term is defined in Form N-CSR. In addition, Messrs. Butler, Kavanaugh and Uek and Meses. Roepke and Thomsen are “independent” members of the Audit Committee (as such term has been defined by the Securities and Exchange Commission in regulations implementing Section 407 of the Sarbanes-Oxley Act of 2002). The Securities and Exchange Commission has stated that the designation of a person as an audit committee financial expert pursuant to this Item 3 on the Form N-CSR does not impose on such a person any duties, obligations or liability that are greater than the duties, obligations or liability imposed on such person as a member of the Audit Committee and the Board of Trustees in the absence of such designation or identification.
| ITEM 4. | PRINCIPAL ACCOUNTANT FEES AND SERVICES. |
Items 4(a) through 4(d) and 4(g):
The Board of Trustees has appointed Deloitte & Touche LLP (“Deloitte”) to serve as independent accountants to certain series of the Registrant and Ernst & Young LLP (“E&Y”) to serve in the same capacity to certain other series of the Registrant (the series referred to collectively as the “Funds” and singularly as a “Fund”). The tables below set forth the audit fees billed to the Funds as well as fees for non-audit services provided to the Funds and/or to the Funds’ investment adviser, Massachusetts Financial Services Company (“MFS”), and to various entities either controlling, controlled by, or under common control with MFS that provide ongoing services to the Funds (“MFS Related Entities”).
For the fiscal years ended August 31, 2014 and 2013, audit fees billed to the Funds by Deloitte and E&Y were as follows:
| | | | | | | | |
| | | Audit Fees | |
| | 2014 | | | 2013 | |
Fees Billed by Deloitte | | | | | | | | |
MFS Global Leaders Fund | | | 44,154 | | | | 43,640 | |
MFS Low Volatility Global Equity Fund | | | 22,300 | | | | N/A | ** |
MFS U.S. Government Cash Reserve Fund | | | 30,889 | | | | 30,532 | |
Total | | | 97,343 | | | | 74,172 | |
| |
| | | Audit Fees | |
| | 2014 | | | 2013 | |
Fees Billed by E&Y | | | | | | | | |
MFS Core Equity Fund | | | 43,762 | | | | 43,252 | |
MFS Low Volatility Equity Fund | | | 19,425 | | | | N/A | ** |
MFS New Discovery Fund | | | 43,772 | | | | 43,262 | |
MFS Research International Fund | | | 46,651 | | | | 46,106 | |
MFS Technology Fund | | | 43,762 | | | | 43,252 | |
MFS Value Fund | | | 43,886 | | | | 43,375 | |
Total | | | 241,258 | | | | 219,247 | |
For the fiscal years ended August 31, 2014 and 2013, fees billed by Deloitte and E&Y for audit-related, tax and other services provided to the Funds and for audit-related, tax and other services provided to MFS and MFS Related Entities were as follows:
| | | | | | | | | | | | | | | | | | | | | | | | |
| | | Audit-Related Fees1 | | | Tax Fees2 | | | All Other Fees3 | |
| | 2014 | | | 2013 | | | 2014 | | | 2013 | | | 2014 | | | 2013 | |
Fees Billed by Deloitte | | | | | | | | | | | | | | | | | | | | | | | | |
To MFS Global Leaders Fund | | | 0 | | | | 0 | | | | 5,765 | | | | 5,697 | | | | 1,001 | | | | 1,001 | |
To MFS Low Volatility Global Equity Fund | | | 0 | | | | N/A | ** | | | 6,465 | | | | N/A | ** | | | 1,000 | | | | N/A | ** |
To MFS U.S. Government Cash Reserve Fund | | | 0 | | | | 0 | | | | 3,129 | | | | 3,092 | | | | 1,053 | | | | 1,040 | |
Total fees billed by Deloitte To above Funds | | | 0 | | | | 0 | | | | 15,359 | | | | 8,789 | | | | 3,054 | | | | 2,041 | |
| | | |
| | | Audit-Related Fees1 | | | Tax Fees2 | | | All Other Fees3 | |
| | 2014 | | | 2013 | | | 2014 | | | 2013 | | | 2014 | | | 2013 | |
Fees Billed by Deloitte | | | | | | | | | | | | | | | | | | | | | | | | |
To MFS and MFS Related Entities of MFS Global Leaders Fund* | | | 1,767,138 | | | | 1,493,881 | | | | 0 | | | | 0 | | | | 0 | | | | 0 | |
To MFS and MFS Related Entities of MFS Low Volatility Global Equity Fund* | | | 1,767,138 | | | | 1,493,881 | ** | | | 0 | | | | 0 | ** | | | 0 | | | | 0 | ** |
To MFS and MFS Related Entities of MFS U.S. Government Cash Reserve Fund* | | | 1,767,138 | | | | 1,493,881 | | | | 0 | | | | 0 | | | | 0 | | | | 0 | |
| | | | | | | | |
| | | Aggregate Fees for Non-audit
Services | |
| | 2014 | | | 2013 | |
Fees Billed by Deloitte | | | | | | | | |
To MFS Global Leaders Fund, MFS and MFS Related Entities# | | | 1,777,242 | | | | 1,529,690 | |
To MFS Low Volatility Global Equity Fund, MFS and MFS Related Entities# | | | 1,777,941 | | | | 1,522,992 | ** |
To MFS U.S. Government Cash Reserve Fund, MFS and MFS Related Entities# | | | 1,774,658 | | | | 1,527,124 | |
| | | | | | | | | | | | | | | | | | | | | | | | |
| | | Audit-Related Fees1 | | | Tax Fees2 | | | All Other Fees4 | |
| | 2014 | | | 2013 | | | 2014 | | | 2013 | | | 2014 | | | 2013 | |
Fees Billed by E&Y | | | | | | | | | | | | | | | | | | | | | | | | |
To MFS Core Equity Fund | | | 0 | | | | 0 | | | | 8,413 | | | | 8,358 | | | | 0 | | | | 0 | |
To MFS Low Volatility Equity Fund | | | 0 | | | | N/A | ** | | | 8,079 | | | | N/A | ** | | | 0 | | | | N/A | ** |
To MFS New Discovery Fund | | | 0 | | | | 0 | | | | 8,413 | | | | 8,358 | | | | 0 | | | | 0 | |
To MFS Research International Fund | | | 0 | | | | 0 | | | | 8,844 | | | | 8,784 | | | | 0 | | | | 0 | |
To MFS Technology Fund | | | 0 | | | | 0 | | | | 8,413 | | | | 8,358 | | | | 0 | | | | 0 | |
To MFS Value Fund | | | 0 | | | | 0 | | | | 8,413 | | | | 8,357 | | | | 0 | | | | 0 | |
Total fees billed by E&Y To above Funds | | | 0 | | | | 0 | | | | 50,575 | | | | 42,215 | | | | 0 | | | | 0 | |
| | | |
| | | Audit-Related Fees1 | | | Tax Fees2 | | | All Other Fees4 | |
| | 2014 | | | 2013 | | | 2014 | | | 2013 | | | 2014 | | | 2013 | |
Fees Billed by E&Y | | | | | | | | | | | | | | | | | | | | | | | | |
To MFS and MFS Related Entities of MFS Core Equity Fund* | | | 0 | | | | 0 | | | | 0 | | | | 0 | | | | 0 | | | | 0 | |
To MFS and MFS Related Entities of Low Volatility Equity Fund* | | | 0 | | | | 0 | ** | | | 0 | | | | 0 | ** | | | 0 | | | | 0 | ** |
To MFS and MFS Related Entities of MFS New Discovery Fund* | | | 0 | | | | 0 | | | | 0 | | | | 0 | | | | 0 | | | | 0 | |
To MFS and MFS Related Entities of MFS Research International Fund* | | | 0 | | | | 0 | | | | 0 | | | | 0 | | | | 0 | | | | 0 | |
To MFS and MFS Related Entities of MFS Technology Fund* | | | 0 | | | | 0 | | | | 0 | | | | 0 | | | | 0 | | | | 0 | |
To MFS and MFS Related Entities of MFS Value Fund* | | | 0 | | | | 0 | | | | 0 | | | | 0 | | | | 0 | | | | 0 | |
| | | | | | | | |
| | | Aggregate Fees for Non-audit
Services | |
| | 2014 | | | 2013 | |
Fees Billed by E&Y | | | | | | | | |
To MFS Core Equity Fund, MFS and MFS Related Entities# | | | 53,413 | | | | 56,358 | |
To Low Volatility Equity Fund, MFS and MFS Related Entities# | | | 53,079 | | | | 48,000 | ** |
To MFS New Discovery Fund, MFS and MFS Related Entities# | | | 53,413 | | | | 56,358 | |
To MFS Research International Fund, MFS and MFS Related Entities# | | | 53,844 | | | | 56,784 | |
To MFS Technology Fund, MFS and MFS Related Entities# | | | 53,413 | | | | 56,358 | |
To MFS Value Fund, MFS and MFS Related Entities# | | | 53,413 | | | | 56,357 | |
| * | This amount reflects the fees billed to MFS and MFS Related Entities for non-audit services relating directly to the operations and financial reporting of the Funds (portions of which services also related to the operations and financial reporting of other funds within the MFS Funds complex). |
| ** | MFS Low Volatility Equity Fund and MFS Low Volatility Global Equity Fund commenced investment operations in December 2013. |
| # | This amount reflects the aggregate fees billed by Deloitte or E&Y for non-audit services rendered to the Funds and for non-audit services rendered to MFS and the MFS Related Entities. |
| 1 | The fees included under “Audit-Related Fees” are fees related to assurance and related services that are reasonably related to the performance of the audit or review of financial statements, but not reported under ‘‘Audit Fees,’’ including accounting consultations, agreed-upon procedure reports, attestation reports, comfort letters and internal control reviews. |
| 2 | The fees included under “Tax Fees” are fees associated with tax compliance, tax advice and tax planning, including services relating to the filing or amendment of federal, state or local income tax returns, regulated investment company qualification reviews and tax distribution and analysis. |
| 3 | The fees included under “All Other Fees” are fees for products and services provided by Deloitte other than those reported under “Audit Fees,” “Audit-Related Fees” and “Tax Fees,” including fees for services related to analysis of certain portfolio holdings, and review of internal controls and review of Rule 38a-1 compliance program. |
| 4 | The fees under “All Other Fees” are fees for products and services provided by E&Y other than those reported under “Audit Fees,” “Audit-Related Fees” and “Tax Fees”. |
Item 4(e)(1):
Set forth below are the policies and procedures established by the Audit Committee of the Board of Trustees relating to the pre-approval of audit and non-audit related services:
To the extent required by applicable law, pre-approval by the Audit Committee of the Board is needed for all audit and permissible non-audit services rendered to the Funds and all permissible non-audit services rendered to MFS or MFS Related Entities if the services relate directly to the operations and financial reporting of the Registrant. Pre-approval is currently on an engagement-by-engagement basis. In the event pre-approval of such services is necessary between regular meetings of the Audit Committee and it is not practical to wait to seek pre-approval at the next regular meeting of the Audit Committee, pre-approval of such services may be referred to the Chair of the Audit Committee for approval; provided that the Chair may not pre-approve any individual engagement for such services exceeding $50,000 or multiple engagements for such services in the aggregate exceeding $100,000 in each period between regular meetings of the Audit Committee. Any engagement pre-approved by the Chair between regular meetings of the Audit Committee shall be presented for ratification by the entire Audit Committee at its next regularly scheduled meeting.
Item 4(e)(2):
None, or 0%, of the services relating to the Audit-Related Fees, Tax Fees and All Other Fees paid by the Fund and MFS and MFS Related Entities relating directly to the operations and financial reporting of the Registrant disclosed above were approved by the audit committee pursuant to paragraphs (c)(7)(i)(C) of Rule 2-01 of Regulation S-X (which permits audit committee approval after the start of the engagement with respect to services other than audit, review or attest services, if certain conditions are satisfied).
Item 4(f): Not applicable.
Item 4(h): The Registrant’s Audit Committee has considered whether the provision by a Registrant’s independent registered public accounting firm of non-audit services to MFS and MFS Related Entities that were not pre-approved by the Committee (because such services did not relate directly to the operations and financial reporting of the Registrant) was compatible with maintaining the independence of the independent registered public accounting firm as the Registrant’s principal auditors.
| ITEM 5. | AUDIT COMMITTEE OF LISTED REGISTRANTS. |
Not applicable to the Registrant.
A schedule of investments of the Registrant is included as part of the report to shareholders of such series under Item 1 of this Form N-CSR.
| ITEM 7. | DISCLOSURE OF PROXY VOTING POLICIES AND PROCEDURES FOR CLOSED-END MANAGEMENT INVESTMENT COMPANIES. |
Not applicable to the Registrant.
| ITEM 8. | PORTFOLIO MANAGERS OF CLOSED-END MANAGEMENT INVESTMENT COMPANIES. |
Not applicable to the Registrant.
| ITEM 9. | PURCHASES OF EQUITY SECURITIES BY CLOSED-END MANAGEMENT INVESTMENT COMPANY AND AFFILIATED PURCHASERS. |
Not applicable to the Registrant.
| ITEM 10. | SUBMISSION OF MATTERS TO A VOTE OF SECURITY HOLDERS. |
There were no material changes to the procedures by which shareholders may send recommendations to the Board for nominees to the Registrant’s Board since the Registrant last provided disclosure as to such procedures in response to the requirements of Item 407 (c)(2)(iv) of Regulation S-K or this Item.
| ITEM 11. | CONTROLS AND PROCEDURES. |
| (a) | Based upon their evaluation of the effectiveness of the registrant’s disclosure controls and procedures (as defined in Rule 30a-3(c) under the Investment Company Act of 1940 (the “Act”)) as conducted within 90 days of the filing date of this report on Form N-CSR, the registrant’s principal financial officer and principal executive officer have concluded that those disclosure controls and procedures provide reasonable assurance that the material information required to be disclosed by the registrant on this report is recorded, processed, summarized and reported within the time periods specified in the Securities and Exchange Commission’s rules and forms. |
| (b) | There were no changes in the registrant’s internal controls over financial reporting (as defined in Rule 30a-3(d) under the Act) that occurred during the second fiscal quarter of the period covered by the report that have materially affected, or are reasonably likely to materially affect, the registrant’s internal control over financial reporting. |
| (a) | File the exhibits listed below as part of this form. Letter or number the exhibits in the sequence indicated. |
| | (1) | Any code of ethics, or amendment thereto, that is the subject of the disclosure required by Item 2, to the extent that the registrant intends to satisfy the Item 2 requirements through filing of an exhibit: Code of Ethics attached hereto. |
| | (2) | A separate certification for each principal executive officer and principal financial officer of the registrant as required by Rule 30a-2 under the Act (17 CFR 270.30a-2): Attached hereto. |
| (b) | If the report is filed under Section 13(a) or 15(d) of the Exchange Act, provide the certifications required by Rule 30a-2(b) under the Act (17 CFR 270.30a-2(b)), Rule 13a-14(b) or Rule 15d-14(b) under the Exchange Act (17 CFR 240.13a-14(b) or 240.15d-14(b)) and Section 1350 of Chapter 63 of Title 18 of the United States Code (18 U.S.C. 1350) as an exhibit. A certification furnished pursuant to this paragraph will not be deemed “filed” for the purposes of Section 18 of the Exchange Act (15 U.S.C. 78r), or otherwise subject to the liability of that section. Such certification will not be deemed to be incorporated by reference into any filing under the Securities Act of 1933 or the Exchange Act, except to the extent that the registrant specifically incorporates it by reference: Attached hereto. |
Notice
A copy of the Amended and Restated Declaration of Trust, as amended, of the Registrant is on file with the Secretary of State of The Commonwealth of Massachusetts and notice is hereby given that this instrument is executed on behalf of the Registrant by an officer of the Registrant as an officer and not individually and the obligations of or arising out of this instrument are not binding upon any of the Trustees or shareholders individually, but are binding only upon the assets and property of the respective constituent series of the Registrant.
SIGNATURES
Pursuant to the requirements of the Securities Exchange Act of 1934 and the Investment Company Act of 1940, the registrant has duly caused this report to be signed on its behalf by the undersigned, thereunto duly authorized.
(Registrant) MFS SERIES TRUST I
| | |
| By (Signature and Title)* | | ROBIN A.��STELMACH |
| | Robin A. Stelmach, President |
Date: October 16, 2014
Pursuant to the requirements of the Securities Exchange Act of 1934 and the Investment Company Act of 1940, this report has been signed below by the following persons on behalf of the registrant and in the capacities and on the dates indicated.
| | |
| By (Signature and Title)* | | ROBIN A. STELMACH |
| | Robin A. Stelmach, President (Principal Executive Officer) |
Date: October 16, 2014
| | |
| By (Signature and Title)* | | DAVID L. DILORENZO |
| | David L. DiLorenzo, Treasurer (Principal Financial Officer and Accounting Officer) |
Date: October 16, 2014
| * | Print name and title of each signing officer under his or her signature. |