UNITED STATES
SECURITIES AND EXCHANGE COMMISSION
Washington, D.C. 20549
FORM N-CSR
CERTIFIED SHAREHOLDER REPORT OF
REGISTERED MANAGEMENT INVESTMENT COMPANIES
Investment Company Act file number 811-4777
MFS SERIES TRUST I
(Exact name of registrant as specified in charter)
111 Huntington Avenue, Boston, Massachusetts 02199
(Address of principal executive offices) (Zip code)
Christopher R. Bohane
Massachusetts Financial Services Company
111 Huntington Avenue
Boston, Massachusetts 02199
(Name and address of agents for service)
Registrant’s telephone number, including area code: (617) 954-5000
Date of fiscal year end: August 31
Date of reporting period: August 31, 2017
| ITEM 1. | REPORTS TO STOCKHOLDERS. |
ANNUAL REPORT
August 31, 2017

MFS® CORE EQUITY FUND

RGI-ANN
MFS® CORE EQUITY FUND
CONTENTS
The report is prepared for the general information of shareholders.
It is authorized for distribution to prospective investors only when preceded or accompanied by a current prospectus.
NOT FDIC INSURED • MAY LOSE VALUE • NO BANK GUARANTEE

LETTER FROM THE EXECUTIVE CHAIRMAN
Dear Shareholders:
Despite policy uncertainty accompanying a new presidential administration in the United States and unease over ongoing Brexit negotiations, most markets have proved
resilient. U.S. share prices have reached new highs in recent months although the U.S. Federal Reserve has continued to gradually hike interest rates. However, rates in most developed markets remain very low, with major non-U.S. central banks just beginning to contemplate curbing accommodative monetary policies.
Globally, we’ve experienced a year-long synchronized upturn in economic growth. Despite better growth, there are few immediate signs of worrisome inflation amid muted wage gains around the world. Europe has benefited from diminishing event risks as populist challengers fell short of upsetting establishment
candidates in both the Dutch and French elections. Emerging market economies have been boosted in part by a weaker U.S. dollar and are recovering despite lingering concerns over the potential for restrictive U.S. trade policies that could hamper global trade growth. Looking ahead, markets will have to contend with issues involving geopolitical hot spots on the Korean peninsula and in the Middle East.
At MFS®, we believe time is an asset. A patient, long-term approach to investing can have a powerful impact on decision making and outcomes. Time arbitrage, as we call it, comes down to having the conviction and discipline to allow enough time for good investment ideas to play out. In our view, such an approach, along with the professional guidance of a financial advisor, will help you reach your investment objectives.
Respectfully,

Robert J. Manning
Executive Chairman
MFS Investment Management
October 17, 2017
The opinions expressed in this letter are subject to change and may not be relied upon for investment advice. No forecasts can be guaranteed.
1
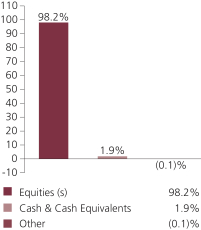
PORTFOLIO COMPOSITION
Portfolio structure
| | | | |
| Top ten holdings | | | | |
| Citigroup, Inc. | | | 2.7% | |
| Facebook, Inc., “A” | | | 2.6% | |
| Alphabet, Inc., “A” | | | 2.4% | |
| Chevron Corp. | | | 1.9% | |
| Aon PLC | | | 1.9% | |
| Pfizer, Inc. | | | 1.7% | |
| Texas Instruments, Inc. | | | 1.7% | |
| American Tower Corp., REIT | | | 1.6% | |
| Amazon.com, Inc. | | | 1.4% | |
| Honeywell International, Inc. | | | 1.4% | |
| | | | |
| Equity sectors | | | | |
| Financial Services | | | 18.8% | |
| Technology | | | 18.6% | |
| Health Care | | | 13.7% | |
| Industrial Goods & Services | | | 8.1% | |
| Consumer Staples | | | 6.5% | |
| Utilities & Communications (s) | | | 6.2% | |
| Retailing | | | 6.1% | |
| Leisure | | | 5.1% | |
| Energy | | | 4.6% | |
| Special Products & Services | | | 4.3% | |
| Basic Materials | | | 3.6% | |
| Transportation | | | 1.4% | |
| Autos & Housing | | | 1.2% | |
| (s) | Includes securities sold short. |
Cash & Cash Equivalents includes any cash, investments in money market funds, short-term securities, and other assets less liabilities. Please see the Statement of Assets and Liabilities for additional information related to the fund’s cash position and other assets and liabilities.
Other includes equivalent exposure from currency derivatives and/or any offsets to derivative positions and may be negative.
Percentages are based on net assets as of August 31, 2017.
The portfolio is actively managed and current holdings may be different.
2
MANAGEMENT REVIEW
Summary of Results
For the twelve months ended August 31, 2017, Class A shares of the MFS Core Equity Fund (“fund”) provided a total return of 18.11%, at net asset value. This compares with a return of 16.06% for the fund’s benchmark, the Russell 3000® Index.
Market Environment
For the first time in many years, the global economy is experiencing a period of synchronized economic growth. The rebound in emerging markets (“EM”) economies has been more pronounced (despite the deceleration in Chinese growth at the end of the period), helped by larger economies such as Brazil and Russia emerging from recessions. At the same time, developed markets (“DM”) economies continued to grow at or above potential. Market confidence increased in the US after the presidential elections in November in anticipation of lower taxes, a lighter regulatory burden and increased infrastructure spending, boosting US equities and corporate bond performance. Though hopes have largely faded for pro-growth US policies, market confidence persists. Globally, markets benefited from a reflation trade during the first half of the period as commodity prices strengthened, activity and growth prospects improved, and inflation moved higher, though within moderate bounds. While this bump in global inflation faded in the second half of the period as commodity prices, particularly oil, leveled off or declined, global growth remained relatively resilient. As a result, there have been more tightening signals and actions by DM central banks. The US Federal Reserve increased interest rates by 25 basis points during the second half of the period, bringing the total number of quarter-percent hikes in the federal funds rate to four since December 2015. The European Central Bank appears set to announce tapering of quantitative easing in the fall of 2017. The Bank of England may also begin reducing monetary accommodation. Markets have been comforted, along with central banks, by the decline in fears of a populist surge in Europe after establishment candidates won the Dutch and French elections. European growth has reflected the calmer political economic backdrop.
In recent months, the US dollar reversed the sharp rise seen early in the period, easing what had been a substantial headwind to earnings for multinationals. US consumer spending held up well during the second half of the period amid a modest increase in real wages and relatively low gasoline prices. Demand for autos reached near-record territory in the first half of the period before tapering off at the end of the period, while the housing market continued its recovery amid relatively low mortgage rates and tight inventories. Global trade, which was sluggish early in the period, showed signs of improvement in the period’s second half, a positive indicator of global economic activity and prospects. Early in the period, the US election resulted in a sell-off in EM assets due to fears that President Trump would follow through on various campaign threats and promises that were judged to be detrimental to EM. While President Trump withdrew the US from the Trans-Pacific Partnership and began the renegotiation of the North American Free Trade Agreement, significant additional policy action has so far been lacking on economic issues involving EM. As a result, emerging markets resumed their upward trajectory, powered by strong inflows throughout the first half of 2017.
3
Management Review – continued
Contributors to Performance
Strong security selection in the technology sector contributed to performance relative to the Russell 3000® Index. Within this sector, overweight positions in computer graphics processors maker NVIDIA, broadband communications and networking services provider Broadcom, software company Adobe Systems and social networking service provider Facebook supported relative returns. Shares of NVIDIA advanced during the period as increased demand in its Pascal and deep learning data center units, as well as stronger-than-anticipated performance in its automotive and gaming segments, led to positive results.
Security selection in both the utilities & communications and industrial goods & services sectors also bolstered relative performance. Within the utilities & communications sector, an overweight position in broadcast and communication tower management firm American Tower helped relative returns after the company reported solid international and domestic growth figures and a positive foreign exchange impact. Additionally, not owning shares of telecommunications company AT&T further supported relative results. Within the industrial goods & services sector, not owning shares of diversified industrial conglomerate General Electric benefited relative returns. Shares of General Electric came under pressure after the company reported disappointing results in its Power and Oil & Gas segments following weaker-than-expected order intakes.
Elsewhere, an overweight position in diversified financial services firm Citigroup aided relative results. Shares of Citigroup appreciated after the US presidential election, as banks outperformed the broader markets on prospects of higher interest rates, stronger growth and regulatory relief. Later in the reporting period, the company’s plan to return capital to shareholders, via share repurchases and dividends, was approved by the Federal Reserve, which further boosted the company’s share price. Additionally, not owning integrated oil and gas company Exxon Mobil, and the timing of the fund’s ownership in shares of financial services firm Goldman Sachs (h), also boosted relative returns.
Performance for the reporting period includes a 0.72% positive impact due to a litigation settlement to the fund by Household International, Inc.
Detractors from Performance
Stock selection in the retailing sector detracted from relative performance, led by overweight positions in apparel retailers Urban Outfitters and Express (h). Shares of Urban Outfitters declined due to weaker-than-expected sales.
Stocks in other sectors that detracted from relative performance included underweight positions in computer and personal electronics maker Apple and software giant Microsoft. Shares of Apple appreciated at the beginning of the calendar year after the company reported better-than-expected results, driven primarily by robust growth in iPhone sales which came in ahead of consensus estimates. The company’s Services segment also posted strong revenue growth during the reporting period, which further strengthened the stock. Additionally, overweight positions in real estate investment trusts Medical Properties Trust and Tanger Factory Outlet Centers (h) and global integrated energy company Hess, and not owning shares of aerospace company
4
Management Review – continued
Boeing and financial services firm JPMorgan Chase, also weakened relative returns. Shares of Medical Properties Trust weakened after the company lowered its full year outlook for its funds from operations.
The fund’s cash and/or cash equivalents position during the period was also a detractor from relative performance. Under normal market conditions, the fund strives to be fully invested and generally holds cash to buy new holdings and to provide liquidity. In a period when equity markets rose, as measured by the fund’s benchmark, holding cash hurt performance versus the benchmark, which has no cash position.
Respectfully,
Portfolio Manager(s)
Joseph MacDougall
| (h) | Security was not held in the fund at period end. |
The views expressed in this report are those of the portfolio manager(s) only through the end of the period of the report as stated on the cover and do not necessarily reflect the views of MFS or any other person in the MFS organization. These views are subject to change at any time based on market or other conditions, and MFS disclaims any responsibility to update such views. These views may not be relied upon as investment advice or an indication of trading intent on behalf of any MFS portfolio. References to specific securities are not recommendations of such securities, and may not be representative of any MFS portfolio’s current or future investments.
5
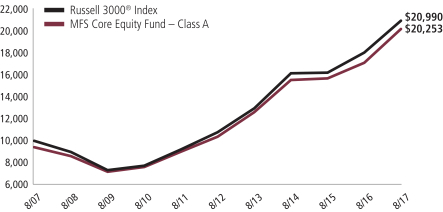
PERFORMANCE SUMMARY THROUGH 8/31/17
The following chart illustrates a representative class of the fund’s historical performance in comparison to its benchmark(s). Performance results include the deduction of the maximum applicable sales charge and reflect the percentage change in net asset value, including reinvestment of dividends and capital gains distributions. The performance of other share classes will be greater than or less than that of the class depicted below. Benchmarks are unmanaged and may not be invested in directly. Benchmark returns do not reflect sales charges, commissions or expenses. (See Notes to Performance Summary.)
Performance data shown represents past performance and is no guarantee of future results. Investment return and principal value fluctuate so your shares, when sold, may be worth more or less than the original cost; current performance may be lower or higher than quoted. The performance shown does not reflect the deduction of taxes, if any, that a shareholder would pay on fund distributions or the redemption of fund shares.
Growth of a Hypothetical $10,000 Investment
6
Performance Summary – continued
Total Returns through 8/31/17
Average annual without sales charge
| | | | | | | | | | | | | | |
| | | Share Class | | Class Inception Date | | 1-yr | | 5-yr | | 10-yr | | Life (t) | | |
| | | A | | 1/02/96 | | 18.11% | | 14.31% | | 7.95% | | N/A | | |
| | | B | | 1/02/97 | | 17.21% | | 13.46% | | 7.15% | | N/A | | |
| | | C | | 1/02/97 | | 17.22% | | 13.45% | | 7.16% | | N/A | | |
| | | I | | 1/02/97 | | 18.38% | | 14.59% | | 8.24% | | N/A | | |
| | | R1 | | 4/01/05 | | 17.19% | | 13.45% | | 7.15% | | N/A | | |
| | | R2 | | 10/31/03 | | 17.80% | | 14.03% | | 7.69% | | N/A | | |
| | | R3 | | 4/01/05 | | 18.10% | | 14.30% | | 7.96% | | N/A | | |
| | | R4 | | 4/01/05 | | 18.40% | | 14.59% | | 8.21% | | N/A | | |
| | | R6 | | 1/02/13 | | 18.49% | | N/A | | N/A | | 15.03% | | |
| Comparative benchmark(s) | | | | | | | | | | |
| | | Russell 3000® Index (f) | | 16.06% | | 14.27% | | 7.70% | | N/A | | |
| Average annual with sales charge | | | | | | | | | | |
| | | A
With Initial Sales Charge (5.75%) | | 11.32% | | 12.96% | | 7.31% | | N/A | | |
| | | B
With CDSC (Declining over six years from 4% to 0%) (v) | | 13.21% | | 13.21% | | 7.15% | | N/A | | |
| | | C
With CDSC (1% for 12 months) (v) | | 16.22% | | 13.45% | | 7.16% | | N/A | | |
CDSC – Contingent Deferred Sales Charge.
Class I, R1, R2, R3, R4, and R6 shares do not have a sales charge.
| (f) | Source: FactSet Research Systems Inc. |
| (t) | For the period from the class inception date through the stated period end (for those share classes with less than 10 years of performance history). No comparative benchmark performance information is provided for “life” periods. (See Notes to Performance Summary.) |
| (v) | Assuming redemption at the end of the applicable period. |
Included in all fund classes’ total returns for the month of May 31, 2017 are proceeds received from a non-recurring litigation settlement against Household International Inc. Had these proceeds not been included, all total returns within calendar year 2017 would have been lower by 0.72%.
Benchmark Definition(s)
Russell 3000® Index – constructed to provide a comprehensive barometer for the 3,000 largest U.S. companies based on total market capitalization, which represents approximately 98% of the investable U.S. equity market. The Russell 3000® Index is a trademark/service mark of the Frank Russell Company. Russell® is a trademark of the Frank Russell Company.
It is not possible to invest directly in an index.
7
Performance Summary – continued
Notes to Performance Summary
Average annual total return represents the average annual change in value for each share class for the periods presented. Life returns are presented where the share class has less than 10 years of performance history and represent the average annual total return from the class inception date to the stated period end date. As the fund’s share classes may have different inception dates, the life returns may represent different time periods and may not be comparable. As a result, no comparative benchmark performance information is provided for life periods.
Performance results reflect any applicable expense subsidies and waivers in effect during the periods shown. Without such subsidies and waivers the fund’s performance results would be less favorable. Please see the prospectus and financial statements for complete details.
Performance results do not include adjustments made for financial reporting purposes in accordance with U.S. generally accepted accounting principles and may differ from amounts reported in the financial highlights.
From time to time the fund may receive proceeds from litigation settlements, without which performance would be lower.
8
EXPENSE TABLE
Fund expenses borne by the shareholders during the period, March 1, 2017 through August 31, 2017
As a shareholder of the fund, you incur two types of costs: (1) transaction costs, including sales charges (loads) on certain purchase or redemption payments, and (2) ongoing costs, including management fees; distribution and service (12b-1) fees; and other fund expenses. This example is intended to help you understand your ongoing costs (in dollars) of investing in the fund and to compare these costs with the ongoing costs of investing in other mutual funds.
The example is based on an investment of $1,000 invested at the beginning of the period and held for the entire period March 1, 2017 through August 31, 2017.
Actual Expenses
The first line for each share class in the following table provides information about actual account values and actual expenses. You may use the information in this line, together with the amount you invested, to estimate the expenses that you paid over the period. Simply divide your account value by $1,000 (for example, an $8,600 account value divided by $1,000 = 8.6), then multiply the result by the number in the first line under the heading entitled “Expenses Paid During Period” to estimate the expenses you paid on your account during this period.
Hypothetical Example for Comparison Purposes
The second line for each share class in the following table provides information about hypothetical account values and hypothetical expenses based on the fund’s actual expense ratio and an assumed rate of return of 5% per year before expenses, which is not the fund’s actual return. The hypothetical account values and expenses may not be used to estimate the actual ending account balance or expenses you paid for the period. You may use this information to compare the ongoing costs of investing in the fund and other funds. To do so, compare this 5% hypothetical example with the 5% hypothetical examples that appear in the shareholder reports of the other funds.
Please note that the expenses shown in the table are meant to highlight your ongoing costs only and do not reflect any transactional costs, such as sales charges (loads). Therefore, the second line for each share class in the table is useful in comparing ongoing costs only, and will not help you determine the relative total costs of owning different funds. In addition, if these transactional costs were included, your costs would have been higher.
9
Expense Table – continued
| | | | | | | | | | | | | | | | | | |
Share
Class | | | | Annualized
Expense Ratio | | | Beginning
Account Value
3/01/17 | | | Ending Account Value
8/31/17 | | | Expenses
Paid During
Period (p)
3/01/17-8/31/17 | |
| A | | Actual | | | 1.02% | | | | $1,000.00 | | | | $1,078.23 | | | | $5.34 | |
| | Hypothetical (h) | | | 1.02% | | | | $1,000.00 | | | | $1,020.06 | | | | $5.19 | |
| B | | Actual | | | 1.77% | | | | $1,000.00 | | | | $1,074.34 | | | | $9.25 | |
| | Hypothetical (h) | | | 1.77% | | | | $1,000.00 | | | | $1,016.28 | | | | $9.00 | |
| C | | Actual | | | 1.77% | | | | $1,000.00 | | | | $1,074.34 | | | | $9.25 | |
| | Hypothetical (h) | | | 1.77% | | | | $1,000.00 | | | | $1,016.28 | | | | $9.00 | |
| I | | Actual | | | 0.77% | | | | $1,000.00 | | | | $1,079.80 | | | | $4.04 | |
| | Hypothetical (h) | | | 0.77% | | | | $1,000.00 | | | | $1,021.32 | | | | $3.92 | |
| R1 | | Actual | | | 1.77% | | | | $1,000.00 | | | | $1,074.40 | | | | $9.25 | |
| | Hypothetical (h) | | | 1.77% | | | | $1,000.00 | | | | $1,016.28 | | | | $9.00 | |
| R2 | | Actual | | | 1.27% | | | | $1,000.00 | | | | $1,077.12 | | | | $6.65 | |
| | Hypothetical (h) | | | 1.27% | | | | $1,000.00 | | | | $1,018.80 | | | | $6.46 | |
| R3 | | Actual | | | 1.02% | | | | $1,000.00 | | | | $1,078.21 | | | | $5.34 | |
| | Hypothetical (h) | | | 1.02% | | | | $1,000.00 | | | | $1,020.06 | | | | $5.19 | |
| R4 | | Actual | | | 0.77% | | | | $1,000.00 | | | | $1,079.82 | | | | $4.04 | |
| | Hypothetical (h) | | | 0.77% | | | | $1,000.00 | | | | $1,021.32 | | | | $3.92 | |
| R6 | | Actual | | | 0.69% | | | | $1,000.00 | | | | $1,080.03 | | | | $3.62 | |
| | Hypothetical (h) | | | 0.69% | | | | $1,000.00 | | | | $1,021.73 | | | | $3.52 | |
| (h) | 5% class return per year before expenses. |
| (p) | “Expenses Paid During Period” are equal to each class’s annualized expense ratio, as shown above, multiplied by the average account value over the period, multiplied by 184/365 (to reflect the one-half year period). Expenses paid do not include any applicable sales charges (loads). If these transaction costs had been included, your costs would have been higher. |
Notes to Expense Table
Expense ratios include 0.01% of investment related expenses from short sales (See Note 2 of the Notes to Financial Statements). Each class with a Rule 12b-1 service fee is subject to a rebate of a portion of such fee. Such rebates are included in the expense ratios above. For Class A, this rebate reduced the expense ratio above by 0.01%. See Note 3 in the Notes to Financial Statements for additional information.
10
PORTFOLIO OF INVESTMENTS
8/31/17
The Portfolio of Investments is a complete list of all securities owned by your fund. It is categorized by broad-based asset classes.
| | | | | | | | |
| Common Stocks - 98.4% | | | | | | | | |
| Issuer | | Shares/Par | | | Value ($) | |
| Aerospace - 3.6% | | | | | | | | |
| Honeywell International, Inc. | | | 170,070 | | | $ | 23,515,579 | |
| L3 Technologies, Inc. | | | 33,173 | | | | 6,020,236 | |
| Leidos Holdings, Inc. | | | 81,599 | | | | 4,758,854 | |
| Northrop Grumman Corp. | | | 52,892 | | | | 14,397,731 | |
| Textron, Inc. | | | 88,560 | | | | 4,347,410 | |
| United Technologies Corp. | | | 62,194 | | | | 7,445,866 | |
| | | | | | | | |
| | | | | | | $ | 60,485,676 | |
| Alcoholic Beverages - 0.7% | | | | | | | | |
| Constellation Brands, Inc., “A” | | | 39,846 | | | $ | 7,973,185 | |
| Molson Coors Brewing Co. | | | 36,732 | | | | 3,296,697 | |
| | | | | | | | |
| | | | | | | $ | 11,269,882 | |
| Apparel Manufacturers - 1.3% | | | | | | | | |
| Hanesbrands, Inc. | | | 241,322 | | | $ | 5,854,472 | |
| NIKE, Inc., “B” | | | 310,242 | | | | 16,383,880 | |
| | | | | | | | |
| | | | | | | $ | 22,238,352 | |
| Automotive - 0.4% | | | | | | | | |
| Delphi Automotive PLC | | | 77,610 | | | $ | 7,481,604 | |
| | |
| Biotechnology - 1.6% | | | | | | | | |
| Biogen, Inc. (a) | | | 70,616 | | | $ | 22,354,201 | |
| Bruker BioSciences Corp. | | | 47,054 | | | | 1,368,801 | |
| Illumina, Inc. (a) | | | 17,797 | | | | 3,638,774 | |
| | | | | | | | |
| | | | | | | $ | 27,361,776 | |
| Brokerage & Asset Managers - 1.2% | | | | | | | | |
| Blackstone Group LP | | | 388,081 | | | $ | 12,701,891 | |
| TMX Group Ltd. | | | 134,487 | | | | 7,146,793 | |
| | | | | | | | |
| | | | | | | $ | 19,848,684 | |
| Business Services - 2.9% | | | | | | | | |
| Amdocs Ltd. | | | 58,936 | | | $ | 3,818,464 | |
| Cognizant Technology Solutions Corp., “A” | | | 118,300 | | | | 8,372,091 | |
| DXC Technology Co. | | | 86,015 | | | | 7,311,275 | |
| Fidelity National Information Services, Inc. | | | 107,203 | | | | 9,961,303 | |
| Global Payments, Inc. | | | 82,739 | | | | 7,900,747 | |
| Grand Canyon Education, Inc. (a) | | | 47,765 | | | | 3,919,118 | |
| Total System Services, Inc. | | | 44,719 | | | | 3,090,977 | |
11
Portfolio of Investments – continued
| | | | | | | | |
| Issuer | | Shares/Par | | | Value ($) | |
| Common Stocks - continued | | | | | | | | |
| Business Services - continued | | | | | | | | |
| Zendesk, Inc. (a) | | | 147,077 | | | $ | 4,029,910 | |
| | | | | | | | |
| | | | | | | $ | 48,403,885 | |
| Cable TV - 1.1% | | | | | | | | |
| Altice USA, Inc. (a) | | | 104,676 | | | $ | 3,193,665 | |
| Comcast Corp., “A” | | | 398,465 | | | | 16,181,663 | |
| | | | | | | | |
| | | | | | | $ | 19,375,328 | |
| Chemicals - 2.0% | | | | | | | | |
| Celanese Corp. | | | 50,190 | | | $ | 4,869,434 | |
| CF Industries Holdings, Inc. | | | 140,217 | | | | 4,064,891 | |
| E.I. du Pont de Nemours & Co. | | | 39,906 | | | | 3,349,311 | |
| FMC Corp. | | | 64,637 | | | | 5,573,002 | |
| Ingevity Corp. (a) | | | 67,326 | | | | 4,239,518 | |
| Monsanto Co. | | | 27,658 | | | | 3,241,518 | |
| PPG Industries, Inc. | | | 84,417 | | | | 8,806,381 | |
| | | | | | | | |
| | | | | | | $ | 34,144,055 | |
| Computer Software - 3.4% | | | | | | | | |
| Adobe Systems, Inc. (a) | | | 126,412 | | | $ | 19,614,086 | |
| Cloudera, Inc. (a)(l) | | | 6,573 | | | | 127,516 | |
| Microsoft Corp. | | | 210,450 | | | | 15,735,347 | |
| Salesforce.com, Inc. (a) | | | 224,123 | | | | 21,401,505 | |
| | | | | | | | |
| | | | | | | $ | 56,878,454 | |
| Computer Software - Systems - 2.2% | | | | | | | | |
| Apple, Inc. | | | 123,822 | | | $ | 20,306,808 | |
| NCR Corp. (a) | | | 97,216 | | | | 3,551,300 | |
| Presidio, Inc. (a) | | | 163,913 | | | | 2,280,030 | |
| Rapid7, Inc. (a) | | | 245,508 | | | | 4,139,265 | |
| SS&C Technologies Holdings, Inc. | | | 200,055 | | | | 7,744,129 | |
| | | | | | | | |
| | | | | | | $ | 38,021,532 | |
| Construction - 0.5% | | | | | | | | |
| Sherwin-Williams Co. | | | 23,306 | | | $ | 7,907,027 | |
| | |
| Consumer Products - 1.8% | | | | | | | | |
| Coty, Inc., “A” | | | 322,405 | | | $ | 5,345,475 | |
| Estee Lauder Cos., Inc., “A” | | | 70,910 | | | | 7,586,661 | |
| Newell Brands, Inc. | | | 97,687 | | | | 4,716,328 | |
| Procter & Gamble Co. | | | 143,749 | | | | 13,263,720 | |
| | | | | | | | |
| | | | | | | $ | 30,912,184 | |
12
Portfolio of Investments – continued
| | | | | | | | |
| Issuer | | Shares/Par | | | Value ($) | |
| Common Stocks - continued | | | | | | | | |
| Consumer Services - 1.4% | | | | | | | | |
| Bright Horizons Family Solutions, Inc. (a) | | | 69,840 | | | $ | 5,582,311 | |
| Priceline Group, Inc. (a) | | | 7,721 | | | | 14,299,910 | |
| ServiceMaster Global Holdings, Inc. (a) | | | 84,760 | | | | 3,993,891 | |
| | | | | | | | |
| | | | | | | $ | 23,876,112 | |
| Containers - 0.9% | | | | | | | | |
| Berry Global Group, Inc. (a) | | | 96,318 | | | $ | 5,416,924 | |
| CCL Industries, Inc. | | | 88,210 | | | | 4,092,096 | |
| Graphic Packaging Holding Co. | | | 237,981 | | | | 3,105,652 | |
| Sealed Air Corp. | | | 70,430 | | | | 3,125,684 | |
| | | | | | | | |
| | | | | | | $ | 15,740,356 | |
| Electrical Equipment - 2.0% | | | | | | | | |
| AMETEK, Inc. | | | 171,094 | | | $ | 10,821,695 | |
| HD Supply Holdings, Inc. (a) | | | 131,804 | | | | 4,389,073 | |
| Johnson Controls International PLC | | | 227,986 | | | | 9,025,966 | |
| Sensata Technologies Holding B.V. (a) | | | 166,292 | | | | 7,426,601 | |
| WESCO International, Inc. (a) | | | 48,457 | | | | 2,444,656 | |
| | | | | | | | |
| | | | | | | $ | 34,107,991 | |
| Electronics - 6.2% | | | | | | | | |
| Analog Devices, Inc. | | | 240,335 | | | $ | 20,108,829 | |
| Applied Materials, Inc. | | | 190,464 | | | | 8,593,736 | |
| Broadcom Corp. | | | 83,654 | | | | 21,086,664 | |
| Inphi Corp. (a) | | | 169,158 | | | | 6,477,060 | |
| Mellanox Technologies Ltd. (a) | | | 104,872 | | | | 4,923,740 | |
| NVIDIA Corp. | | | 88,630 | | | | 15,017,467 | |
| Texas Instruments, Inc. | | | 339,138 | | | | 28,087,409 | |
| | | | | | | | |
| | | | | | | $ | 104,294,905 | |
| Energy - Independent - 1.9% | | | | | | | | |
| Concho Resources, Inc. (a) | | | 30,635 | | | $ | 3,399,566 | |
| Energen Corp. (a) | | | 26,223 | | | | 1,344,716 | |
| EOG Resources, Inc. | | | 100,770 | | | | 8,564,442 | |
| EQT Corp. | | | 26,974 | | | | 1,681,559 | |
| Hess Corp. | | | 146,151 | | | | 5,685,274 | |
| Parsley Energy, Inc., “A” (a) | | | 76,742 | | | | 1,922,387 | |
| Phillips 66 | | | 80,745 | | | | 6,767,239 | |
| Pioneer Natural Resources Co. | | | 15,342 | | | | 1,989,090 | |
| | | | | | | | |
| | | | | | | $ | 31,354,273 | |
| Energy - Integrated - 1.9% | | | | | | | | |
| Chevron Corp. (s) | | | 306,770 | | | $ | 33,014,587 | |
13
Portfolio of Investments – continued
| | | | | | | | |
| Issuer | | Shares/Par | | | Value ($) | |
| Common Stocks - continued | | | | | | | | |
| Engineering - Construction - 0.2% | | | | | | | | |
| KBR, Inc. | | | 221,795 | | | $ | 3,608,605 | |
| | |
| Entertainment - 1.6% | | | | | | | | |
| Six Flags Entertainment Corp. | | | 71,573 | | | $ | 3,905,739 | |
| Time Warner, Inc. | | | 166,585 | | | | 16,841,743 | |
| Twenty-First Century Fox, Inc. | | | 236,096 | | | | 6,513,889 | |
| | | | | | | | |
| | | | | | | $ | 27,261,371 | |
| Food & Beverages - 3.0% | | | | | | | | |
| Blue Buffalo Pet Products, Inc. (a) | | | 92,556 | | | $ | 2,384,242 | |
| Cal-Maine Foods, Inc. (a)(l) | | | 132,798 | | | | 4,840,487 | |
| Mondelez International, Inc. | | | 251,527 | | | | 10,227,088 | |
| Monster Worldwide, Inc. (a) | | | 145,472 | | | | 8,120,247 | |
| PepsiCo, Inc. | | | 151,349 | | | | 17,515,620 | |
| Snyders-Lance, Inc. | | | 56,346 | | | | 2,001,410 | |
| TreeHouse Foods, Inc. (a) | | | 75,529 | | | | 5,059,688 | |
| | | | | | | | |
| | | | | | | $ | 50,148,782 | |
| Food & Drug Stores - 0.6% | | | | | | | | |
| CVS Health Corp. | | | 129,998 | | | $ | 10,054,045 | |
| | |
| Furniture & Appliances - 0.2% | | | | | | | | |
| Whirlpool Corp. | | | 24,482 | | | $ | 4,201,601 | |
| | |
| Gaming & Lodging - 0.4% | | | | | | | | |
| Marriott International, Inc., “A” | | | 67,142 | | | $ | 6,954,568 | |
| | |
| General Merchandise - 1.5% | | | | | | | | |
| Costco Wholesale Corp. | | | 88,574 | | | $ | 13,883,089 | |
| Dollar Tree, Inc. (a) | | | 100,076 | | | | 7,970,052 | |
| Five Below, Inc. (a) | | | 91,038 | | | | 4,330,678 | |
| | | | | | | | |
| | | | | | | $ | 26,183,819 | |
| Health Maintenance Organizations - 1.6% | | | | | | | | |
| Cigna Corp. | | | 42,156 | | | $ | 7,674,921 | |
| UnitedHealth Group, Inc. | | | 99,681 | | | | 19,826,551 | |
| | | | | | | | |
| | | | | | | $ | 27,501,472 | |
| Insurance - 3.1% | | | | | | | | |
| American International Group, Inc. | | | 103,970 | | | $ | 6,288,106 | |
| Aon PLC | | | 232,896 | | | | 32,409,807 | |
| Chubb Ltd. | | | 96,237 | | | | 13,609,836 | |
| | | | | | | | |
| | | | | | | $ | 52,307,749 | |
14
Portfolio of Investments – continued
| | | | | | | | |
| Issuer | | Shares/Par | | | Value ($) | |
| Common Stocks - continued | | | | | | | | |
| Internet - 6.0% | | | | | | | | |
| Alphabet, Inc., “A” (a)(s) | | | 41,951 | | | $ | 40,073,274 | |
| Alphabet, Inc., “C” (a) | | | 5,234 | | | | 4,916,453 | |
| Facebook, Inc., “A” (a) | | | 258,529 | | | | 44,459,232 | |
| LogMeIn, Inc. | | | 113,835 | | | | 13,022,724 | |
| | | | | | | | |
| | | | | | | $ | 102,471,683 | |
| Leisure & Toys - 0.4% | | | | | | | | |
| Electronic Arts, Inc. (a) | | | 61,106 | | | $ | 7,424,379 | |
| | |
| Machinery & Tools - 1.8% | | | | | | | | |
| Illinois Tool Works, Inc. | | | 42,469 | | | $ | 5,839,912 | |
| IPG Photonics Corp. (a) | | | 20,308 | | | | 3,569,943 | |
| ITT, Inc. | | | 98,430 | | | | 3,972,635 | |
| Roper Technologies, Inc. | | | 53,624 | | | | 12,368,912 | |
| SPX FLOW, Inc. (a) | | | 137,245 | | | | 4,593,590 | |
| | | | | | | | |
| | | | | | | $ | 30,344,992 | |
| Major Banks - 3.0% | | | | | | | | |
| Bank of America Corp. | | | 912,533 | | | $ | 21,800,413 | |
| Morgan Stanley | | | 313,194 | | | | 14,250,327 | |
| PNC Financial Services Group, Inc. | | | 117,158 | | | | 14,692,785 | |
| | | | | | | | |
| | | | | | | $ | 50,743,525 | |
| Medical & Health Technology & Services - 1.2% | | | | | | | | |
| Healthcare Services Group, Inc. | | | 52,343 | | | $ | 2,679,962 | |
| Henry Schein, Inc. (a) | | | 24,214 | | | | 4,205,487 | |
| ICON PLC (a) | | | 15,720 | | | | 1,782,491 | |
| LifePoint Hospitals, Inc. (a) | | | 50,344 | | | | 2,917,435 | |
| McKesson Corp. | | | 51,116 | | | | 7,632,130 | |
| MEDNAX, Inc. (a) | | | 23,277 | | | | 1,043,973 | |
| | | | | | | | |
| | | | | | | $ | 20,261,478 | |
| Medical Equipment - 4.3% | | | | | | | | |
| Danaher Corp. | | | 68,523 | | | $ | 5,716,189 | |
| DexCom, Inc. (a) | | | 32,948 | | | | 2,458,250 | |
| Edwards Lifesciences Corp. (a) | | | 101,468 | | | | 11,532,853 | |
| Medtronic PLC | | | 227,192 | | | | 18,316,219 | |
| NxStage Medical, Inc. (a) | | | 106,326 | | | | 2,977,128 | |
| Obalon Therapeutics, Inc. (a)(l) | | | 141,906 | | | | 1,275,735 | |
| PerkinElmer, Inc. | | | 78,501 | | | | 5,258,782 | |
| Steris PLC | | | 22,431 | | | | 1,955,086 | |
| Stryker Corp. | | | 81,729 | | | | 11,554,029 | |
| Zimmer Biomet Holdings, Inc. | | | 104,869 | | | | 11,983,380 | |
| | | | | | | | |
| | | | | | | $ | 73,027,651 | |
15
Portfolio of Investments – continued
| | | | | | | | |
| Issuer | | Shares/Par | | | Value ($) | |
| Common Stocks - continued | | | | | | | | |
| Metals & Mining - 0.3% | | | | | | | | |
| First Quantum Minerals Ltd. | | | 131,008 | | | $ | 1,578,915 | |
| Lundin Mining Corp. | | | 552,525 | | | | 4,176,846 | |
| | | | | | | | |
| | | | | | | $ | 5,755,761 | |
| Natural Gas - Distribution - 0.3% | | | | | | | | |
| New Jersey Resources Corp. | | | 92,273 | | | $ | 4,027,717 | |
| Sempra Energy | | | 7,753 | | | | 914,311 | |
| | | | | | | | |
| | | | | | | $ | 4,942,028 | |
| Natural Gas - Pipeline - 0.5% | | | | | | | | |
| Cheniere Energy, Inc. (a) | | | 147,851 | | | $ | 6,326,544 | |
| Enterprise Products Partners LP | | | 56,892 | | | | 1,483,175 | |
| | | | | | | | |
| | | | | | | $ | 7,809,719 | |
| Network & Telecom - 0.8% | | | | | | | | |
| Cisco Systems, Inc. | | | 154,358 | | | $ | 4,971,871 | |
| Motorola Solutions, Inc. | | | 104,281 | | | | 9,189,242 | |
| | | | | | | | |
| | | | | | | $ | 14,161,113 | |
| Oil Services - 0.8% | | | | | | | | |
| Keane Group, Inc. (a)(l) | | | 94,930 | | | $ | 1,229,344 | |
| Patterson-UTI Energy, Inc. | | | 119,799 | | | | 1,913,190 | |
| Schlumberger Ltd. | | | 95,712 | | | | 6,078,669 | |
| Solaris Oilfield Infrastructure, Inc., “A” (a)(l) | | | 198,176 | | | | 2,806,172 | |
| U.S. Silica Holdings, Inc. | | | 40,926 | | | | 1,113,596 | |
| | | | | | | | |
| | | | | | | $ | 13,140,971 | |
| Other Banks & Diversified Financials - 8.0% | | | | | | | | |
| Bank of the Ozarks, Inc. | | | 155,188 | | | $ | 6,666,876 | |
| Citigroup, Inc. (s) | | | 665,193 | | | | 45,253,080 | |
| Discover Financial Services | | | 205,248 | | | | 12,099,370 | |
| EuroDekania Ltd. (u) | | | 580,280 | | | | 67,353 | |
| First Republic Bank | | | 44,275 | | | | 4,296,889 | |
| Northern Trust Corp. | | | 71,801 | | | | 6,354,389 | |
| Signature Bank (a) | | | 28,813 | | | | 3,697,860 | |
| U.S. Bancorp | | | 405,174 | | | | 20,765,167 | |
| Visa, Inc., “A” | | | 217,262 | | | | 22,490,962 | |
| Wintrust Financial Corp. | | | 107,512 | | | | 7,827,949 | |
| Zions Bancorporation | | | 132,346 | | | | 5,778,226 | |
| | | | | | | | |
| | | | | | | $ | 135,298,121 | |
| Pharmaceuticals - 5.0% | | | | | | | | |
| Allergan PLC | | | 22,034 | | | $ | 5,056,362 | |
| Bristol-Myers Squibb Co. | | | 297,072 | | | | 17,966,915 | |
16
Portfolio of Investments – continued
| | | | | | | | |
| Issuer | | Shares/Par | | | Value ($) | |
| Common Stocks - continued | | | | | | | | |
| Pharmaceuticals - continued | | | | | | | | |
| Eli Lilly & Co. | | | 163,582 | | | $ | 13,297,581 | |
| Pfizer, Inc. | | | 869,638 | | | | 29,498,121 | |
| Zoetis, Inc. | | | 295,392 | | | | 18,521,078 | |
| | | | | | | | |
| | | | | | | $ | 84,340,057 | |
| Pollution Control - 0.5% | | | | | | | | |
| Clean Harbors, Inc. (a) | | | 61,381 | | | $ | 3,320,098 | |
| Waste Connections, Inc. | | | 72,646 | | | | 4,844,762 | |
| | | | | | | | |
| | | | | | | $ | 8,164,860 | |
| Railroad & Shipping - 1.2% | | | | | | | | |
| Canadian Pacific Railway Ltd. | | | 50,681 | | | $ | 7,885,964 | |
| Union Pacific Corp. | | | 113,308 | | | | 11,931,332 | |
| | | | | | | | |
| | | | | | | $ | 19,817,296 | |
| Real Estate - 3.5% | | | | | | | | |
| Gramercy Property Trust, REIT | | | 305,151 | | | $ | 9,294,900 | |
| Life Storage, Inc., REIT | | | 130,691 | | | | 9,617,551 | |
| Medical Properties Trust, Inc., REIT | | | 1,503,639 | | | | 19,787,889 | |
| Store Capital Corp., REIT | | | 475,130 | | | | 12,058,799 | |
| Sun Communities, Inc., REIT | | | 50,043 | | | | 4,519,383 | |
| Washington Prime Group, Inc., REIT | | | 573,877 | | | | 4,791,873 | |
| | | | | | | | |
| | | | | | | $ | 60,070,395 | |
| Restaurants - 1.5% | | | | | | | | |
| Aramark | | | 148,418 | | | $ | 6,039,129 | |
| Starbucks Corp. | | | 283,022 | | | | 15,526,587 | |
| U.S. Foods Holding Corp. (a) | | | 169,576 | | | | 4,654,861 | |
| | | | | | | | |
| | | | | | | $ | 26,220,577 | |
| Specialty Chemicals - 0.3% | | | | | | | | |
| Univar, Inc. (a) | | | 186,734 | | | $ | 5,267,766 | |
| | |
| Specialty Stores - 2.7% | | | | | | | | |
| Amazon.com, Inc. (a) | | | 24,500 | | | $ | 24,024,700 | |
| Lululemon Athletica, Inc. (a) | | | 67,167 | | | | 3,865,461 | |
| Michaels Co., Inc. (a) | | | 201,346 | | | | 4,520,218 | |
| Tractor Supply Co. | | | 110,456 | | | | 6,573,236 | |
| Urban Outfitters, Inc. (a) | | | 329,645 | | | | 6,737,944 | |
| | | | | | | | |
| | | | | | | $ | 45,721,559 | |
| Telecommunications - Wireless - 2.4% | | | | | | | | |
| American Tower Corp., REIT | | | 187,256 | | | $ | 27,723,251 | |
| SBA Communications Corp., REIT (a) | | | 78,870 | | | | 12,110,488 | |
| | | | | | | | |
| | | | | | | $ | 39,833,739 | |
17
Portfolio of Investments – continued
| | | | | | | | | | | | | | | | |
| Issuer | | | | | | | | | Shares/Par | | | Value ($) | |
| Common Stocks - continued | | | | | | | | | |
| Telephone Services - 0.6% | | | | | | | | | |
| Verizon Communications, Inc. | | | | 198,910 | | | $ | 9,541,713 | |
| | |
| Tobacco - 1.1% | | | | | | | | | |
| Philip Morris International, Inc. | | | | 155,732 | | | $ | 18,209,743 | |
| | |
| Trucking - 0.2% | | | | | | | | | |
| Schneider National, Inc. | | | | 143,829 | | | $ | 3,200,195 | |
| | |
| Utilities - Electric Power - 2.8% | | | | | | | | | |
| Alliant Energy Corp. | | | | 81,623 | | | $ | 3,488,567 | |
| American Electric Power Co., Inc. | | | | 77,175 | | | | 5,682,395 | |
| Avangrid, Inc. | | | | 86,179 | | | | 4,207,259 | |
| CMS Energy Corp. | | | | 109,726 | | | | 5,326,100 | |
| Exelon Corp. | | | | 146,109 | | | | 5,533,148 | |
| NextEra Energy, Inc. | | | | 60,866 | | | | 9,160,942 | |
| PG&E Corp. | | | | 81,675 | | | | 5,748,287 | |
| Xcel Energy, Inc. | | | | 165,101 | | | | 8,172,499 | |
| | | | | | | | | | | | | | | | |
| | | | $ | 47,319,197 | |
| Total Common Stocks (Identified Cost, $1,280,733,070) | | | $ | 1,668,027,193 | |
| | | | | |
Underlying/Expiration
Date/Exercise Price | | Put/Call | | Counterparty | | Notional
Amount | | | Number
of
Contracts | | | | |
| Purchased Options - 0.0% | | | | | | | | | | | | |
| Electrical Equipment - 0.0% | | | | | |
| General Electric Co. - January 2018 @ $28 (Premiums Paid, $701,966) | | Call | | Goldman Sachs International | | $ | 14,133,435 | | | | 5,757 | | | $ | 74,841 | |
| | | | | | | | |
| | |
| Issuer | | Shares/Par | | | | |
| Investment Companies (h) - 1.6% | | | | | | | | |
| Money Market Funds - 1.6% | | | | | | | | |
MFS Institutional Money Market Portfolio, 1.11% (v)
(Identified Cost, $26,817,468) | | | 26,819,115 | | | $ | 26,819,115 | |
| | |
| Collateral for Securities Loaned - 0.1% | | | | | | | | |
| State Street Navigator Securities Lending Government Money Market Portfolio, 1.01% (j) (Identified Cost, $2,131,661) | | | 2,131,661 | | | $ | 2,131,661 | |
18
Portfolio of Investments – continued
| | | | | | | | |
| Securities Sold Short - (0.3)% | | | | | | | | |
| Issuer | | Shares/Par | | | Value ($) | |
| Telecommunications - Wireless - (0.3)% | | | | | | | | |
Crown Castle International Corp., REIT
(Proceeds Received, $3,678,192) | | | (44,300 | ) | | $ | (4,803,892 | ) |
| | |
| Other Assets, Less Liabilities - 0.2% | | | | | | | 2,958,451 | |
| Net Assets - 100.0% | | | | | | $ | 1,695,207,369 | |
| (a) | Non-income producing security. |
| (h) | An affiliated issuer may be considered one in which the fund owns 5% or more of the outstanding voting securities, or a company which is under common control. At period end, the aggregate values of the fund’s investments in affiliated issuers and in unaffiliated issuers were $26,819,115 and $1,670,233,695, respectively. |
| (j) | The rate quoted is the annualized seven-day yield of the fund at period end. |
| (l) | A portion of this security is on loan. |
| (s) | Security or a portion of the security was pledged to cover collateral requirements for securities sold short. |
| (u) | The security was valued using significant unobservable inputs and is considered level 3 under the fair value hierarchy. |
| (v) | Affiliated issuer that is available only to investment companies managed by MFS. The rate quoted for the MFS Institutional Money Market Portfolio is the annualized seven-day yield of the fund at period end. |
At August 31, 2017, the fund had cash collateral of $21,914 and other liquid securities with an aggregate value of $8,451,337 to cover collateral or margin obligations for securities sold short and certain derivative contracts. Cash collateral is comprised of deposits with brokers in the Statement of Assets and Liabilities.
The following abbreviations are used in this report and are defined:
| PLC | | Public Limited Company |
| REIT | | Real Estate Investment Trust |
See Notes to Financial Statements
19
Financial Statements
STATEMENT OF ASSETS AND LIABILITIES
At 8/31/17
This statement represents your fund’s balance sheet, which details the assets and liabilities comprising the total value of the fund.
| | | | |
| Assets | | | | |
Investments in unaffiliated issuers, at value, including $2,115,870 of securities on loan (identified cost, $1,283,566,697) | | | $1,670,233,695 | |
Investments in affiliated issuers, at value (identified cost, $26,817,468) | | | 26,819,115 | |
Cash | | | 13,991 | |
Foreign currency, at value (identified cost, $8) | | | 8 | |
Deposits with brokers for securities sold short | | | 21,914 | |
Receivables for | | | | |
Investments sold | | | 2,795,330 | |
Fund shares sold | | | 1,842,204 | |
Interest and dividends | | | 2,418,751 | |
Other assets | | | 1,703 | |
Total assets | | | $1,704,146,711 | |
| Liabilities | | | | |
Payables for | | | | |
Securities sold short, at value (proceeds received, $3,678,192) | | | $4,803,892 | |
Fund shares reacquired | | | 1,311,395 | |
Collateral for securities loaned, at value | | | 2,131,661 | |
Payable to affiliates | | | | |
Investment adviser | | | 54,114 | |
Shareholder servicing costs | | | 379,496 | |
Distribution and service fees | | | 15,259 | |
Payable for independent Trustees’ compensation | | | 64,002 | |
Accrued expenses and other liabilities | | | 179,523 | |
Total liabilities | | | $8,939,342 | |
Net assets | | | $1,695,207,369 | |
| Net assets consist of | | | | |
Paid-in capital | | | $1,198,271,005 | |
Unrealized appreciation (depreciation) | | | 385,543,225 | |
Accumulated net realized gain (loss) | | | 101,329,218 | |
Undistributed net investment income | | | 10,063,921 | |
Net assets | | | $1,695,207,369 | |
Shares of beneficial interest outstanding | | | 55,317,540 | |
20
Statement of Assets and Liabilities – continued
| | | | | | | | | | | | |
| | | Net assets | | | Shares
outstanding | | | Net asset value
per share (a) | |
Class A | | | $992,736,270 | | | | 32,595,826 | | | | $30.46 | |
Class B | | | 27,138,528 | | | | 998,853 | | | | 27.17 | |
Class C | | | 89,945,711 | | | | 3,346,635 | | | | 26.88 | |
Class I | | | 122,054,594 | | | | 3,806,086 | | | | 32.07 | |
Class R1 | | | 3,102,602 | | | | 115,517 | | | | 26.86 | |
Class R2 | | | 16,507,986 | | | | 554,974 | | | | 29.75 | |
Class R3 | | | 28,074,644 | | | | 925,755 | | | | 30.33 | |
Class R4 | | | 22,494,280 | | | | 732,575 | | | | 30.71 | |
Class R6 | | | 393,152,754 | | | | 12,241,319 | | | | 32.12 | |
| (a) | Maximum offering price per share was equal to the net asset value per share for all share classes, except for Class A, for which the maximum offering price per share was $32.32 [100 / 94.25 x $30.46]. On sales of $50,000 or more, the maximum offering price of Class A shares is reduced. A contingent deferred sales charge may be imposed on redemptions of Class A, Class B, and Class C shares. Redemption price per share was equal to the net asset value per share for Classes I, R1, R2, R3, R4, and R6. |
See Notes to Financial Statements
21
Financial Statements
STATEMENT OF OPERATIONS
Year ended 8/31/17
This statement describes how much your fund earned in investment income and accrued in expenses. It also describes any gains and/or losses generated by fund operations.
| | | | |
| Net investment income (loss) | | | | |
Income | | | | |
Dividends | | | $25,944,077 | |
Dividends from affiliated issuers | | | 113,205 | |
Income on securities loaned | | | 35,846 | |
Interest | | | 19,164 | |
Other | | | 14,900 | |
Foreign taxes withheld | | | (59,195 | ) |
Total investment income | | | $26,067,997 | |
Expenses | | | | |
Management fee | | | $9,214,952 | |
Distribution and service fees | | | 3,800,553 | |
Shareholder servicing costs | | | 1,829,102 | |
Administrative services fee | | | 259,950 | |
Independent Trustees’ compensation | | | 44,828 | |
Custodian fee | | | 86,138 | |
Reimbursement of custodian expenses | | | (96,938 | ) |
Shareholder communications | | | 173,254 | |
Audit and tax fees | | | 57,372 | |
Legal fees | | | 19,868 | |
Dividend and interest expense on securities sold short | | | 211,184 | |
Miscellaneous | | | 215,513 | |
Total expenses | | | $15,815,776 | |
Reduction of expenses by investment adviser and distributor | | | (176,691 | ) |
Net expenses | | | $15,639,085 | |
Net investment income (loss) | | | $10,428,912 | |
| Realized and unrealized gain (loss) | | | | |
Realized gain (loss) (identified cost basis) | | | | |
Unaffiliated issuers (s) | | | $121,535,866 | |
Affiliated issuers | | | 698 | |
Foreign currency | | | (1,959 | ) |
Net realized gain (loss) | | | $121,534,605 | |
Change in unrealized appreciation (depreciation) | | | | |
Unaffiliated issuers | | | $132,628,173 | |
Affiliated issuers | | | 1,647 | |
Securities sold short | | | (745,568 | ) |
Translation of assets and liabilities in foreign currencies | | | 286 | |
Net unrealized gain (loss) | | | $131,884,538 | |
Net realized and unrealized gain (loss) | | | $253,419,143 | |
Change in net assets from operations | | | $263,848,055 | |
| (s) | Realized gain (loss) on investment transactions includes proceeds received from a non-recurring cash settlement in the amount of $11,579,893 from a litigation settlement against Household International, Inc. Company. |
See Notes to Financial Statements
22
Financial Statements
STATEMENTS OF CHANGES IN NET ASSETS
These statements describe the increases and/or decreases in net assets resulting from operations, any distributions, and any shareholder transactions.
| | | | | | | | |
| | | Year ended | |
| | | 8/31/17 | | | 8/31/16 | |
| Change in net assets | | | | | | |
| From operations | | | | | | | | |
Net investment income (loss) | | | $10,428,912 | | | | $9,712,129 | |
Net realized gain (loss) | | | 121,534,605 | | | | 46,889,142 | |
Net unrealized gain (loss) | | | 131,884,538 | | | | 63,937,563 | |
Change in net assets from operations | | | $263,848,055 | | | | $120,538,834 | |
| Distributions declared to shareholders | | | | | | | | |
From net investment income | | | $(9,436,061 | ) | | | $(5,821,876 | ) |
From net realized gain on investments | | | (45,657,548 | ) | | | (119,401,189 | ) |
Total distributions declared to shareholders | | | $(55,093,609 | ) | | | $(125,223,065 | ) |
Change in net assets from fund share transactions | | | $(66,543,205 | ) | | | $309,510,191 | |
Total change in net assets | | | $142,211,241 | | | | $304,825,960 | |
| Net assets | | | | | | | | |
At beginning of period | | | 1,552,996,128 | | | | 1,248,170,168 | |
At end of period (including undistributed net investment
income of $10,063,921 and $9,358,570, respectively) | | | $1,695,207,369 | | | | $1,552,996,128 | |
See Notes to Financial Statements
23
Financial Statements
FINANCIAL HIGHLIGHTS
The financial highlights table is intended to help you understand the fund’s financial performance for the past 5 years (or life of a particular share class, if shorter). Certain information reflects financial results for a single fund share. The total returns in the table represent the rate that an investor would have earned (or lost) on an investment in the fund share class (assuming reinvestment of all distributions) held for the entire period.
| | | | | | | | | | | | | | | | | | | | |
| Class A | | Year ended | |
| | | 8/31/17 | | | 8/31/16 | | | 8/31/15 | | | 8/31/14 | | | 8/31/13 | |
Net asset value, beginning of period | | | $26.72 | | | | $27.19 | | | | $29.19 | | | | $23.82 | | | | $19.68 | |
| Income (loss) from investment operations | | | | | | | | | | | | | | | | | |
Net investment income (loss) (d) | | | $0.18 | (c) | | | $0.18 | | | | $0.15 | | | | $0.13 | | | | $0.18 | |
Net realized and unrealized gain (loss) | | | 4.53 | | | | 2.08 | | | | 0.13 | | | | 5.41 | | | | 4.07 | |
Total from investment operations | | | $4.71 | | | | $2.26 | | | | $0.28 | | | | $5.54 | | | | $4.25 | |
| Less distributions declared to shareholders | | | | | | | | | | | | | | | | | |
From net investment income | | | $(0.16 | ) | | | $(0.14 | ) | | | $(0.13 | ) | | | $(0.17 | ) | | | $(0.11 | ) |
From net realized gain | | | (0.81 | ) | | | (2.59 | ) | | | (2.15 | ) | | | — | | | | — | |
Total distributions declared to shareholders | | | $(0.97 | ) | | | $(2.73 | ) | | | $(2.28 | ) | | | $(0.17 | ) | | | $(0.11 | ) |
Net asset value, end of period (x) | | | $30.46 | | | | $26.72 | | | | $27.19 | | | | $29.19 | | | | $23.82 | |
Total return (%) (r)(s)(t)(x) | | | 18.11 | (c) | | | 9.09 | | | | 0.98 | | | | 23.33 | | | | 21.69 | |
Ratios (%) (to average net assets)
and Supplemental data: | | | | | | | | | | | | | | | | | |
Expenses before expense reductions (f) | | | 1.03 | (c) | | | 1.07 | | | | 1.05 | | | | 1.05 | | | | 1.11 | |
Expenses after expense reductions (f) | | | 1.01 | (c) | | | 1.05 | | | | 1.04 | | | | 1.04 | | | | 1.11 | |
Net investment income (loss) | | | 0.63 | (c) | | | 0.70 | | | | 0.52 | | | | 0.49 | | | | 0.81 | |
Portfolio turnover | | | 46 | | | | 68 | | | | 53 | | | | 48 | | | | 58 | |
Net assets at end of period (000 omitted) | | | $992,736 | | | | $959,812 | | | | $963,167 | | | | $1,002,028 | | | | $873,139 | |
| Supplemental Ratios (%): | | | | | | | | | | | | | | | | | | | | |
Ratio of expenses to average net assets after
expense reductions excluding short sale
expenses and interest expense and fees (f) | | | 1.00 | (c) | | | 1.04 | | | | 1.03 | | | | 1.04 | | | | 1.10 | |
See Notes to Financial Statements
24
Financial Highlights – continued
| | | | | | | | | | | | | | | | | | | | |
| Class B | | Year ended | |
| | | 8/31/17 | | | 8/31/16 | | | 8/31/15 | | | 8/31/14 | | | 8/31/13 | |
Net asset value, beginning of period | | | $23.96 | | | | $24.70 | | | | $26.78 | | | | $21.88 | | | | $18.11 | |
| Income (loss) from investment operations | | | | | | | | | | | | | | | | | |
Net investment income (loss) (d) | | | $(0.03 | )(c) | | | $(0.02 | ) | | | $(0.06 | ) | | | $(0.06 | ) | | | $0.01 | |
Net realized and unrealized gain (loss) | | | 4.05 | | | | 1.87 | | | | 0.13 | | | | 4.96 | | | | 3.76 | |
Total from investment operations | | | $4.02 | | | | $1.85 | | | | $0.07 | | | | $4.90 | | | | $3.77 | |
| Less distributions declared to shareholders | | | | | | | | | | | | | | | | | |
From net realized gain | | | $(0.81 | ) | | | $(2.59 | ) | | | $(2.15 | ) | | | $— | | | | $— | |
Net asset value, end of period (x) | | | $27.17 | | | | $23.96 | | | | $24.70 | | | | $26.78 | | | | $21.88 | |
Total return (%) (r)(s)(t)(x) | | | 17.21 | (c) | | | 8.24 | | | | 0.25 | | | | 22.39 | | | | 20.82 | |
Ratios (%) (to average net assets)
and Supplemental data: | | | | | | | | | | | | | | | | | |
Expenses before expense reductions (f) | | | 1.78 | (c) | | | 1.82 | | | | 1.80 | | | | 1.80 | | | | 1.86 | |
Expenses after expense reductions (f) | | | 1.77 | (c) | | | 1.81 | | | | 1.80 | | | | 1.80 | | | | 1.86 | |
Net investment income (loss) | | | (0.12 | )(c) | | | (0.07 | ) | | | (0.23 | ) | | | (0.26 | ) | | | 0.07 | |
Portfolio turnover | | | 46 | | | | 68 | | | | 53 | | | | 48 | | | | 58 | |
Net assets at end of period (000 omitted) | | | $27,139 | | | | $30,324 | | | | $34,126 | | | | $40,536 | | | | $40,495 | |
| Supplemental Ratios (%): | | | | | | | | | | | | | | | | | | | | |
Ratio of expenses to average net assets after
expense reductions excluding short sale
expenses and interest expense and fees (f) | | | 1.75 | (c) | | | 1.79 | | | | 1.79 | | | | 1.80 | | | | 1.86 | |
See Notes to Financial Statements
25
Financial Highlights – continued
| | | | | | | | | | | | | | | | | | | | |
| Class C | | Year ended | |
| | | 8/31/17 | | | 8/31/16 | | | 8/31/15 | | | 8/31/14 | | | 8/31/13 | |
Net asset value, beginning of period | | | $23.71 | | | | $24.47 | | | | $26.55 | | | | $21.72 | | | | $17.98 | |
| Income (loss) from investment operations | | | | | | | | | | | | | | | | | |
Net investment income (loss) (d) | | | $(0.03 | )(c) | | | $(0.01 | ) | | | $(0.06 | ) | | | $(0.06 | ) | | | $0.01 | |
Net realized and unrealized gain (loss) | | | 4.01 | | | | 1.84 | | | | 0.13 | | | | 4.92 | | | | 3.73 | |
Total from investment operations | | | $3.98 | | | | $1.83 | | | | $0.07 | | | | $4.86 | | | | $3.74 | |
| Less distributions declared to shareholders | | | | | | | | | | | | | | | | | |
From net investment income | | | $— | | | | $— | | | | $— | | | | $(0.03 | ) | | | $— | |
From net realized gain | | | (0.81 | ) | | | (2.59 | ) | | | (2.15 | ) | | | — | | | | — | |
Total distributions declared to shareholders | | | $(0.81 | ) | | | $(2.59 | ) | | | $(2.15 | ) | | | $(0.03 | ) | | | $— | |
Net asset value, end of period (x) | | | $26.88 | | | | $23.71 | | | | $24.47 | | | | $26.55 | | | | $21.72 | |
Total return (%) (r)(s)(t)(x) | | | 17.22 | (c) | | | 8.24 | | | | 0.26 | | | | 22.38 | | | | 20.80 | |
Ratios (%) (to average net assets)
and Supplemental data: | | | | | | | | | | | | | | | | | |
Expenses before expense reductions (f) | | | 1.78 | (c) | | | 1.82 | | | | 1.80 | | | | 1.80 | | | | 1.86 | |
Expenses after expense reductions (f) | | | 1.77 | (c) | | | 1.81 | | | | 1.80 | | | | 1.80 | | | | 1.86 | |
Net investment income (loss) | | | (0.12 | )(c) | | | (0.05 | ) | | | (0.23 | ) | | | (0.26 | ) | | | 0.06 | |
Portfolio turnover | | | 46 | | | | 68 | | | | 53 | | | | 48 | | | | 58 | |
Net assets at end of period (000 omitted) | | | $89,946 | | | | $89,160 | | | | $88,020 | | | | $89,702 | | | | $78,777 | |
| Supplemental Ratios (%): | | | | | | | | | | | | | | | | | | | | |
Ratio of expenses to average net assets after
expense reductions excluding short sale
expenses and interest expense and fees (f) | | | 1.75 | (c) | | | 1.79 | | | | 1.79 | | | | 1.80 | | | | 1.86 | |
See Notes to Financial Statements
26
Financial Highlights – continued
| | | | | | | | | | | | | | | | | | | | |
| Class I | | Year ended | |
| | | 8/31/17 | | | 8/31/16 | | | 8/31/15 | | | 8/31/14 | | | 8/31/13 | |
Net asset value, beginning of period | | | $28.10 | | | | $28.44 | | | | $30.43 | | | | $24.82 | | | | $20.49 | |
| Income (loss) from investment operations | | | | | | | | | | | | | | | | | |
Net investment income (loss) (d) | | | $0.26 | (c) | | | $0.29 | | | | $0.23 | | | | $0.21 | | | | $0.24 | |
Net realized and unrealized gain (loss) | | | 4.76 | | | | 2.15 | | | | 0.13 | | | | 5.62 | | | | 4.25 | |
Total from investment operations | | | $5.02 | | | | $2.44 | | | | $0.36 | | | | $5.83 | | | | $4.49 | |
| Less distributions declared to shareholders | | | | | | | | | | | | | | | | | |
From net investment income | | | $(0.24 | ) | | | $(0.19 | ) | | | $(0.20 | ) | | | $(0.22 | ) | | | $(0.16 | ) |
From net realized gain | | | (0.81 | ) | | | (2.59 | ) | | | (2.15 | ) | | | — | | | | — | |
Total distributions declared to shareholders | | | $(1.05 | ) | | | $(2.78 | ) | | | $(2.35 | ) | | | $(0.22 | ) | | | $(0.16 | ) |
Net asset value, end of period (x) | | | $32.07 | | | | $28.10 | | | | $28.44 | | | | $30.43 | | | | $24.82 | |
Total return (%) (r)(s)(t)(x) | | | 18.38 | (c) | | | 9.36 | | | | 1.23 | | | | 23.61 | | | | 22.03 | |
Ratios (%) (to average net assets)
and Supplemental data: | | | | | | | | | | | | | | | | | |
Expenses before expense reductions (f) | | | 0.78 | (c) | | | 0.81 | | | | 0.80 | | | | 0.80 | | | | 0.86 | |
Expenses after expense reductions (f) | | | 0.77 | (c) | | | 0.80 | | | | 0.80 | | | | 0.80 | | | | 0.86 | |
Net investment income (loss) | | | 0.88 | (c) | | | 1.07 | | | | 0.77 | | | | 0.73 | | | | 1.05 | |
Portfolio turnover | | | 46 | | | | 68 | | | | 53 | | | | 48 | | | | 58 | |
Net assets at end of period (000 omitted) | | | $122,055 | | | | $61,739 | | | | $49,768 | | | | $45,089 | | | | $29,812 | |
| Supplemental Ratios (%): | | | | | | | | | | | | | | | | | | | | |
Ratio of expenses to average net assets after
expense reductions excluding short sale
expenses and interest expense and fees (f) | | | 0.75 | (c) | | | 0.79 | | | | 0.79 | | | | 0.80 | | | | 0.86 | |
See Notes to Financial Statements
27
Financial Highlights – continued
| | | | | | | | | | | | | | | | | | | | |
| Class R1 | | Year ended | |
| | | 8/31/17 | | | 8/31/16 | | | 8/31/15 | | | 8/31/14 | | | 8/31/13 | |
Net asset value, beginning of period | | | $23.70 | | | | $24.45 | | | | $26.54 | | | | $21.69 | | | | $17.95 | |
| Income (loss) from investment operations | | | | | | | | | | | | | | | | | |
Net investment income (loss) (d) | | | $(0.03 | )(c) | | | $(0.02 | ) | | | $(0.06 | ) | | | $(0.06 | ) | | | $0.02 | |
Net realized and unrealized gain (loss) | | | 4.00 | | | | 1.86 | | | | 0.12 | | | | 4.91 | | | | 3.72 | |
Total from investment operations | | | $3.97 | | | | $1.84 | | | | $0.06 | | | | $4.85 | | | | $3.74 | |
| Less distributions declared to shareholders | | | | | | | | | | | | | | | | | |
From net investment income | | | $— | | | | $— | | | | $— | | | | $(0.00 | )(w) | | | $— | |
From net realized gain | | | (0.81 | ) | | | (2.59 | ) | | | (2.15 | ) | | | — | | | | — | |
Total distributions declared to shareholders | | | $(0.81 | ) | | | $(2.59 | ) | | | $(2.15 | ) | | | $(0.00 | )(w) | | | $— | |
Net asset value, end of period (x) | | | $26.86 | | | | $23.70 | | | | $24.45 | | | | $26.54 | | | | $21.69 | |
Total return (%) (r)(s)(t)(x) | | | 17.19 | (c) | | | 8.29 | | | | 0.22 | | | | 22.38 | | | | 20.84 | |
Ratios (%) (to average net assets)
and Supplemental data: | | | | | | | | | | | | | | | | | |
Expenses before expense reductions (f) | | | 1.78 | (c) | | | 1.82 | | | | 1.80 | | | | 1.80 | | | | 1.86 | |
Expenses after expense reductions (f) | | | 1.77 | (c) | | | 1.81 | | | | 1.80 | | | | 1.80 | | | | 1.86 | |
Net investment income (loss) | | | (0.13 | )(c) | | | (0.09 | ) | | | (0.23 | ) | | | (0.26 | ) | | | 0.08 | |
Portfolio turnover | | | 46 | | | | 68 | | | | 53 | | | | 48 | | | | 58 | |
Net assets at end of period (000 omitted) | | | $3,103 | | | | $2,935 | | | | $3,625 | | | | $4,132 | | | | $3,839 | |
| Supplemental Ratios (%): | | | | | | | | | | | | | | | | | | | | |
Ratio of expenses to average net assets after
expense reductions excluding short sale
expenses and interest expense and fees (f) | | | 1.75 | (c) | | | 1.80 | | | | 1.79 | | | | 1.80 | | | | 1.85 | |
See Notes to Financial Statements
28
Financial Highlights – continued
| | | | | | | | | | | | | | | | | | | | |
| Class R2 | | Year ended | |
| | | 8/31/17 | | | 8/31/16 | | | 8/31/15 | | | 8/31/14 | | | 8/31/13 | |
Net asset value, beginning of period | | | $26.12 | | | | $26.62 | | | | $28.59 | | | | $23.35 | | | | $19.28 | |
| Income (loss) from investment operations | | | | | | | | | | | | | | | | | |
Net investment income (loss) (d) | | | $0.10 | (c) | | | $0.11 | | | | $0.07 | | | | $0.06 | | | | $0.12 | |
Net realized and unrealized gain (loss) | | | 4.43 | | | | 2.04 | | | | 0.14 | | | | 5.29 | | | | 4.00 | |
Total from investment operations | | | $4.53 | | | | $2.15 | | | | $0.21 | | | | $5.35 | | | | $4.12 | |
| Less distributions declared to shareholders | | | | | | | | | | | | | | | | | |
From net investment income | | | $(0.09 | ) | | | $(0.06 | ) | | | $(0.03 | ) | | | $(0.11 | ) | | | $(0.05 | ) |
From net realized gain | | | (0.81 | ) | | | (2.59 | ) | | | (2.15 | ) | | | — | | | | — | |
Total distributions declared to shareholders | | | $(0.90 | ) | | | $(2.65 | ) | | | $(2.18 | ) | | | $(0.11 | ) | | | $(0.05 | ) |
Net asset value, end of period (x) | | | $29.75 | | | | $26.12 | | | | $26.62 | | | | $28.59 | | | | $23.35 | |
Total return (%) (r)(s)(t)(x) | | | 17.80 | (c) | | | 8.82 | | | | 0.75 | | | | 22.96 | | | | 21.44 | |
Ratios (%) (to average net assets)
and Supplemental data: | | | | | | | | | | | | | | | | | |
Expenses before expense reductions (f) | | | 1.28 | (c) | | | 1.32 | | | | 1.30 | | | | 1.30 | | | | 1.36 | |
Expenses after expense reductions (f) | | | 1.27 | (c) | | | 1.31 | | | | 1.30 | | | | 1.30 | | | | 1.36 | |
Net investment income (loss) | | | 0.38 | (c) | | | 0.46 | | | | 0.27 | | | | 0.24 | | | | 0.56 | |
Portfolio turnover | | | 46 | | | | 68 | | | | 53 | | | | 48 | | | | 58 | |
Net assets at end of period (000 omitted) | | | $16,508 | | | | $15,932 | | | | $16,332 | | | | $19,434 | | | | $19,625 | |
| Supplemental Ratios (%): | | | | | | | | | | | | | | | | | | | | |
Ratio of expenses to average net assets after
expense reductions excluding short sale
expenses and interest expense and fees (f) | | | 1.25 | (c) | | | 1.29 | | | | 1.29 | | | | 1.30 | | | | 1.36 | |
See Notes to Financial Statements
29
Financial Highlights – continued
| | | | | | | | | | | | | | | | | | | | |
| Class R3 | | Year ended | |
| | | 8/31/17 | | | 8/31/16 | | | 8/31/15 | | | 8/31/14 | | | 8/31/13 | |
Net asset value, beginning of period | | | $26.61 | | | | $27.10 | | | | $29.10 | | | | $23.75 | | | | $19.63 | |
| Income (loss) from investment operations | | | | | | | | | | | | | | | | | |
Net investment income (loss) (d) | | | $0.17 | (c) | | | $0.18 | | | | $0.15 | | | | $0.13 | | | | $0.18 | |
Net realized and unrealized gain (loss) | | | 4.52 | | | | 2.06 | | | | 0.13 | | | | 5.39 | | | | 4.05 | |
Total from investment operations | | | $4.69 | | | | $2.24 | | | | $0.28 | | | | $5.52 | | | | $4.23 | |
| Less distributions declared to shareholders | | | | | | | | | | | | | | | | | |
From net investment income | | | $(0.16 | ) | | | $(0.14 | ) | | | $(0.13 | ) | | | $(0.17 | ) | | | $(0.11 | ) |
From net realized gain | | | (0.81 | ) | | | (2.59 | ) | | | (2.15 | ) | | | — | | | | — | |
Total distributions declared to shareholders | | | $(0.97 | ) | | | $(2.73 | ) | | | $(2.28 | ) | | | $(0.17 | ) | | | $(0.11 | ) |
Net asset value, end of period (x) | | | $30.33 | | | | $26.61 | | | | $27.10 | | | | $29.10 | | | | $23.75 | |
Total return (%) (r)(s)(t)(x) | | | 18.10 | (c) | | | 9.06 | | | | 0.99 | | | | 23.32 | | | | 21.68 | |
Ratios (%) (to average net assets)
and Supplemental data: | | | | | | | | | | | | | | | | | |
Expenses before expense reductions (f) | | | 1.02 | (c) | | | 1.07 | | | | 1.05 | | | | 1.05 | | | | 1.11 | |
Expenses after expense reductions (f) | | | 1.02 | (c) | | | 1.06 | | | | 1.05 | | | | 1.05 | | | | 1.11 | |
Net investment income (loss) | | | 0.62 | (c) | | | 0.71 | | | | 0.52 | | | | 0.49 | | | | 0.81 | |
Portfolio turnover | | | 46 | | | | 68 | | | | 53 | | | | 48 | | | | 58 | |
Net assets at end of period (000 omitted) | | | $28,075 | | | | $77,217 | | | | $65,775 | | | | $68,977 | | | | $58,381 | |
| Supplemental Ratios (%): | | | | | | | | | | | | | | | | | | | | |
Ratio of expenses to average net assets after
expense reductions excluding short sale
expenses and interest expense and fees (f) | | | 1.00 | (c) | | | 1.04 | | | | 1.04 | | | | 1.05 | | | | 1.10 | |
See Notes to Financial Statements
30
Financial Highlights – continued
| | | | | | | | | | | | | | | | | | | | |
| Class R4 | | Year ended | |
| | | 8/31/17 | | | 8/31/16 | | | 8/31/15 | | | 8/31/14 | | | 8/31/13 | |
Net asset value, beginning of period | | | $26.93 | | | | $27.39 | | | | $29.40 | | | | $23.99 | | | | $19.81 | |
| Income (loss) from investment operations | | | | | | | | | | | | | | | | | |
Net investment income (loss) (d) | | | $0.25 | (c) | | | $0.23 | | | | $0.22 | | | | $0.20 | | | | $0.23 | |
Net realized and unrealized gain (loss) | | | 4.57 | | | | 2.11 | | | | 0.12 | | | | 5.44 | | | | 4.11 | |
Total from investment operations | | | $4.82 | | | | $2.34 | | | | $0.34 | | | | $5.64 | | | | $4.34 | |
| Less distributions declared to shareholders | | | | | | | | | | | | | | | | | |
From net investment income | | | $(0.23 | ) | | | $(0.21 | ) | | | $(0.20 | ) | | | $(0.23 | ) | | | $(0.16 | ) |
From net realized gain | | | (0.81 | ) | | | (2.59 | ) | | | (2.15 | ) | | | — | | | | — | |
Total distributions declared to shareholders | | | $(1.04 | ) | | | $(2.80 | ) | | | $(2.35 | ) | | | $(0.23 | ) | | | $(0.16 | ) |
Net asset value, end of period (x) | | | $30.71 | | | | $26.93 | | | | $27.39 | | | | $29.40 | | | | $23.99 | |
Total return (%) (r)(s)(t)(x) | | | 18.40 | (c) | | | 9.36 | | | | 1.22 | | | | 23.62 | | | | 22.03 | |
Ratios (%) (to average net assets)
and Supplemental data: | | | | | | | | | | | | | | | | | |
Expenses before expense reductions (f) | | | 0.78 | (c) | | | 0.82 | | | | 0.80 | | | | 0.81 | | | | 0.86 | |
Expenses after expense reductions (f) | | | 0.77 | (c) | | | 0.81 | | | | 0.80 | | | | 0.80 | | | | 0.86 | |
Net investment income (loss) | | | 0.87 | (c) | | | 0.90 | | | | 0.76 | | | | 0.72 | | | | 1.04 | |
Portfolio turnover | | | 46 | | | | 68 | | | | 53 | | | | 48 | | | | 58 | |
Net assets at end of period (000 omitted) | | | $22,494 | | | | $15,799 | | | | $21,159 | | | | $19,706 | | | | $6,165 | |
| Supplemental Ratios (%): | | | | | | | | | | | | | | | | | | | | |
Ratio of expenses to average net assets after
expense reductions excluding short sale
expenses and interest expense and fees (f) | | | 0.76 | (c) | | | 0.79 | | | | 0.79 | | | | 0.80 | | | | 0.86 | |
See Notes to Financial Statements
31
Financial Highlights – continued
| | | | | | | | | | | | | | | | | | | | |
| Class R6 | | Year ended | |
| | | 8/31/17 | | | 8/31/16 | | | 8/31/15 | | | 8/31/14 | | | 8/31/13 (i) | |
Net asset value, beginning of period | | | $28.13 | | | | $28.49 | | | | $30.47 | | | | $24.84 | | | | $21.02 | |
| Income (loss) from investment operations | | | | | | | | | | | | | | | | | |
Net investment income (loss) (d) | | | $0.29 | (c) | | | $0.58 | | | | $0.24 | | | | $0.23 | | | | $0.22 | |
Net realized and unrealized gain (loss) | | | 4.77 | | | | 1.89 | | | | 0.15 | | | | 5.64 | | | | 3.60 | |
Total from investment operations | | | $5.06 | | | | $2.47 | | | | $0.39 | | | | $5.87 | | | | $3.82 | |
| Less distributions declared to shareholders | | | | | | | | | | | | | | | | | |
From net investment income | | | $(0.26 | ) | | | $(0.24 | ) | | | $(0.22 | ) | | | $(0.24 | ) | | | $— | |
From net realized gain | | | (0.81 | ) | | | (2.59 | ) | | | (2.15 | ) | | | — | | | | — | |
Total distributions declared to shareholders | | | $(1.07 | ) | | | $(2.83 | ) | | | $(2.37 | ) | | | $(0.24 | ) | | | $— | |
Net asset value, end of period (x) | | | $32.12 | | | | $28.13 | | | | $28.49 | | | | $30.47 | | | | $24.84 | |
Total return (%) (r)(s)(t)(x) | | | 18.49 | (c) | | | 9.46 | | | | 1.34 | | | | 23.73 | | | | 18.17 | (n) |
Ratios (%) (to average net assets)
and Supplemental data: | | | | | | | | | | | | | | | | | |
Expenses before expense reductions (f) | | | 0.69 | (c) | | | 0.70 | | | | 0.71 | | | | 0.71 | | | | 0.76 | (a) |
Expenses after expense reductions (f) | | | 0.68 | (c) | | | 0.69 | | | | 0.70 | | | | 0.71 | | | | 0.76 | (a) |
Net investment income (loss) | | | 0.97 | (c) | | | 2.10 | | | | 0.82 | | | | 0.80 | | | | 1.39 | (a) |
Portfolio turnover | | | 46 | | | | 68 | | | | 53 | | | | 48 | | | | 58 | |
Net assets at end of period (000 omitted) | | | $393,153 | | | | $300,078 | | | | $6,198 | | | | $2,492 | | | | $119 | |
| Supplemental Ratios (%): | | | | | | | | | | | | | | | | | | | | |
Ratio of expenses to average net assets after
expense reductions excluding short sale
expenses and interest expense and fees (f) | | | 0.66 | (c) | | | 0.68 | | | | 0.69 | | | | 0.71 | | | | 0.75 | (a) |
| (c) | Amount reflects a one-time reimbursement of expenses by the custodian (or former custodian) without which net investment income and performance would be lower and expenses would be higher. See Note 2 in the Notes to Financial Statements for additional information. |
| (d) | Per share data is based on average shares outstanding. |
| (f) | Ratios do not reflect reductions from fees paid indirectly, if applicable. |
| (i) | For the period from the class inception, January 2, 2013, through the stated period end. |
| (r) | Certain expenses have been reduced without which performance would have been lower. |
| (s) | From time to time the fund may receive proceeds from litigation settlements, without which performance would be lower. Excluding the effect of the proceeds received from a non-recurring litigation settlement against Household International, Inc., the total return for the year ended August 31, 2017 would have been lower by approximately 0.72%. |
| (t) | Total returns do not include any applicable sales charges. |
| (w) | Per share amount was less than $0.01. |
| (x) | The net asset values and total returns have been calculated on net assets which include adjustments made in accordance with U.S. generally accepted accounting principles required at period end for financial reporting purposes. |
See Notes to Financial Statements
32
NOTES TO FINANCIAL STATEMENTS
(1) Business and Organization
MFS Core Equity Fund (the fund) is a diversified series of MFS Series Trust I (the trust). The trust is organized as a Massachusetts business trust and is registered under the Investment Company Act of 1940, as amended, as an open-end management investment company.
The fund is an investment company and accordingly follows the investment company accounting and reporting guidance of the Financial Accounting Standards Board (FASB) Accounting Standards Codification Topic 946 Financial Services – Investment Companies.
(2) Significant Accounting Policies
General – The preparation of financial statements in conformity with U.S. generally accepted accounting principles requires management to make estimates and assumptions that affect the reported amounts of assets and liabilities, and disclosure of contingent assets and liabilities at the date of the financial statements and the reported amounts of increases and decreases in net assets from operations during the reporting period. Actual results could differ from those estimates. In the preparation of these financial statements, management has evaluated subsequent events occurring after the date of the fund’s Statement of Assets and Liabilities through the date that the financial statements were issued.
In October 2016, the Securities and Exchange Commission (SEC) released its Final Rule on Investment Company Reporting Modernization (the “Rule”). The Rule, which introduced two new regulatory reporting forms for investment companies – Form N-PORT and Form N-CEN – also contained amendments to Regulation S-X which impact financial statement presentation, particularly the presentation of derivative investments, for all reporting periods ending after August 1, 2017. The fund has adopted the Rule’s Regulation S-X amendments and believes that the fund’s financial statements are in compliance with those amendments.
Balance Sheet Offsetting – The fund’s accounting policy with respect to balance sheet offsetting is that, absent an event of default by the counterparty or a termination of the agreement, the International Swaps and Derivatives Association (ISDA) Master Agreement does not result in an offset of reported amounts of financial assets and financial liabilities in the Statement of Assets and Liabilities across transactions between the fund and the applicable counterparty. The fund’s right to setoff may be restricted or prohibited by the bankruptcy or insolvency laws of the particular jurisdiction to which a specific master netting agreement counterparty is subject. Balance sheet offsetting disclosures, to the extent applicable to the fund, have been included in the fund’s Significant Accounting Policies note under the captions for each of the fund’s in-scope financial instruments and transactions.
Investment Valuations – Equity securities, including restricted equity securities and equity securities held short, are generally valued at the last sale or official closing price on their primary market or exchange as provided by a third-party pricing service. Equity securities, for which there were no sales reported that day, are generally valued at the last quoted daily bid quotation on their primary market or exchange as provided by a
33
Notes to Financial Statements – continued
third-party pricing service. Equity securities held short, for which there were no sales reported for that day, are generally valued at the last quoted daily ask quotation on their primary market or exchange as provided by a third-party pricing service. Debt instruments and floating rate loans, including restricted debt instruments, are generally valued at an evaluated or composite bid as provided by a third-party pricing service. Short-term instruments with a maturity at issuance of 60 days or less may be valued at amortized cost, which approximates market value. Exchange-traded options are generally valued at the last sale or official closing price on their primary exchange as provided by a third-party pricing service. Exchange-traded options for which there were no sales reported that day are generally valued at the last daily bid quotation on their primary exchange as provided by a third-party pricing service. Options not traded on an exchange are generally valued at a broker/dealer bid quotation. Foreign currency options are generally valued at valuations provided by a third-party pricing service. Open-end investment companies are generally valued at net asset value per share. Securities and other assets generally valued on the basis of information from a
third-party pricing service may also be valued at a broker/dealer bid quotation. Values obtained from third-party pricing services can utilize both transaction data and market information such as yield, quality, coupon rate, maturity, type of issue, trading characteristics, and other market data. The values of foreign securities and other assets and liabilities expressed in foreign currencies are converted to U.S. dollars using the mean of bid and asked prices for rates provided by a third-party pricing service.
The Board of Trustees has delegated primary responsibility for determining or causing to be determined the value of the fund’s investments (including any fair valuation) to the adviser pursuant to valuation policies and procedures approved by the Board. If the adviser determines that reliable market quotations are not readily available, investments are valued at fair value as determined in good faith by the adviser in accordance with such procedures under the oversight of the Board of Trustees. Under the fund’s valuation policies and procedures, market quotations are not considered to be readily available for most types of debt instruments and floating rate loans and many types of derivatives. These investments are generally valued at fair value based on information from third-party pricing services. In addition, investments may be valued at fair value if the adviser determines that an investment’s value has been materially affected by events occurring after the close of the exchange or market on which the investment is principally traded (such as foreign exchange or market) and prior to the determination of the fund’s net asset value, or after the halting of trading of a specific security where trading does not resume prior to the close of the exchange or market on which the security is principally traded. Events that occur on a frequent basis after foreign markets close (such as developments in foreign markets and significant movements in the U.S. markets) and prior to the determination of the fund’s net asset value may be deemed to have a material effect on the value of securities traded in foreign markets. Accordingly, the fund’s foreign equity securities may often be valued at fair value. The adviser generally relies on third-party pricing services or other information (such as the correlation with price movements of similar securities in the same or other markets; the type, cost and investment characteristics of the security; the business and financial condition of the issuer; and trading and other market data) to assist in determining whether to fair value and at what value to fair value an investment. The value of an
34
Notes to Financial Statements – continued
investment for purposes of calculating the fund’s net asset value can differ depending on the source and method used to determine value. When fair valuation is used, the value of an investment used to determine the fund’s net asset value may differ from quoted or published prices for the same investment. There can be no assurance that the fund could obtain the fair value assigned to an investment if it were to sell the investment at the same time at which the fund determines its net asset value per share.
Various inputs are used in determining the value of the fund’s assets or liabilities. These inputs are categorized into three broad levels. In certain cases, the inputs used to measure fair value may fall into different levels of the fair value hierarchy. In such cases, an investment’s level within the fair value hierarchy is based on the lowest level of input that is significant to the fair value measurement. The fund’s assessment of the significance of a particular input to the fair value measurement in its entirety requires judgment, and considers factors specific to the investment. Level 1 includes unadjusted quoted prices in active markets for identical assets or liabilities. Level 2 includes other significant observable market-based inputs (including quoted prices for similar securities, interest rates, prepayment speed, and credit risk). Level 3 includes unobservable inputs, which may include the adviser’s own assumptions in determining the fair value of investments. The following is a summary of the levels used as of August 31, 2017 in valuing the fund’s assets or liabilities:
| | | | | | | | | | | | | | | | |
| Financial Instruments | | Level 1 | | | Level 2 | | | Level 3 | | | Total | |
| Equity Securities: | | | | | | | | | | | | | | | | |
United States | | | $1,638,309,306 | | | | $— | | | | $— | | | | $1,638,309,306 | |
Canada | | | 29,725,375 | | | | — | | | | — | | | | 29,725,375 | |
Cayman Islands | | | — | | | | — | | | | 67,353 | | | | 67,353 | |
| Mutual Funds | | | 28,950,776 | | | | — | | | | — | | | | 28,950,776 | |
| Total | | | $1,696,985,457 | | | | $— | | | | $67,353 | | | | $1,697,052,810 | |
| Short Sales | | | $(4,803,892 | ) | | | $— | | | | $— | | | | $(4,803,892 | ) |
For further information regarding security characteristics, see the Portfolio of Investments.
The following is a reconciliation of level 3 assets for which significant unobservable inputs were used to determine fair value. The fund’s policy is to recognize transfers between the levels as of the end of the period. The table presents the activity of level 3 securities held at the beginning and the end of the period.
| | | | |
| | | Investments
in Securities | |
| Balance as of 8/31/16 | | | $106,800 | |
Change in unrealized appreciation (depreciation) | | | (39,447 | ) |
| Balance as of 8/31/17 | | | $67,353 | |
The net change in unrealized appreciation (depreciation) from investments still held as level 3 at August 31, 2017 is $(39,447). At August 31, 2017, the fund held one level 3 security.
Foreign Currency Translation – Purchases and sales of foreign investments, income, and expenses are converted into U.S. dollars based upon currency exchange rates prevailing on the respective dates of such transactions or on the reporting date for foreign denominated receivables and payables. Gains and losses attributable to foreign
35
Notes to Financial Statements – continued
currency exchange rates on sales of securities are recorded for financial statement purposes as net realized gains and losses on investments. Gains and losses attributable to foreign exchange rate movements on receivables, payables, income and expenses are recorded for financial statement purposes as foreign currency transaction gains and losses. That portion of both realized and unrealized gains and losses on investments that results from fluctuations in foreign currency exchange rates is not separately disclosed.
Derivatives – The fund uses derivatives for different purposes, primarily to increase or decrease exposure to a particular market or segment of the market, or security, to increase or decrease interest rate or currency exposure, or as alternatives to direct investments. Derivatives are used for hedging or non-hedging purposes. While hedging can reduce or eliminate losses, it can also reduce or eliminate gains. When the fund uses derivatives as an investment to increase market exposure, or for hedging purposes, gains and losses from derivative instruments may be substantially greater than the derivative’s original cost.
The derivative instruments used by the fund were purchased options. Depending on the type of derivative, the fund may exit a derivative position by entering into an offsetting transaction with a counterparty or exchange, negotiating an agreement with the derivative counterparty, or novating the position to a third party. The fund’s period end derivatives, as presented in the Portfolio of Investments and the associated Derivative Contract tables, generally are indicative of the volume of its derivative activity during the period.
The following table presents, by major type of derivative contract, the fair value, on a gross basis, of the asset and liability components of derivatives held by the fund at August 31, 2017 as reported in the Statement of Assets and Liabilities:
| | | | | | |
| | | | | Fair Value (a) | |
| Risk | | Derivative Contracts | | Asset Derivatives | |
| Equity | | Purchased Equity Options | | | $74,841 | |
| (a) | The value of purchased options outstanding is included in investments in unaffiliated issuers, at value, within the fund’s Statement of Assets and Liabilities. |
There is no realized gain (loss) from derivative transactions during the period.
The following table presents, by major type of derivative contract, the change in unrealized appreciation (depreciation) on derivatives held by the fund for the year ended August 31, 2017 as reported in the Statement of Operations:
| | | | |
| Risk | | Investments
(Purchased Options) | |
| Equity | | | $(627,125 | ) |
Derivative counterparty credit risk is managed through formal evaluation of the creditworthiness of all potential counterparties. On certain, but not all, uncleared derivatives, the fund attempts to reduce its exposure to counterparty credit risk whenever possible by entering into an ISDA Master Agreement on a bilateral basis. The ISDA Master Agreement gives each party to the agreement the right to terminate all transactions traded under such agreement if there is a certain deterioration in the credit quality of the other party. Upon an event of default or a termination of the ISDA
36
Notes to Financial Statements – continued
Master Agreement, the non-defaulting party has the right to close out all transactions traded under such agreement and to net amounts owed under each agreement to one net amount payable by one party to the other. This right to close out and net payments across all transactions traded under the ISDA Master Agreement could result in a reduction of the fund’s credit risk to such counterparty equal to any amounts payable by the fund under the applicable transactions, if any.
Collateral and margin requirements differ by type of derivative. For cleared derivatives (e.g., futures contracts, cleared swaps, and exchange-traded options), margin requirements are set by the clearing broker and the clearing house and collateral, in the form of cash or securities, is posted by the fund directly with the clearing broker. Collateral terms are counterparty agreement specific for uncleared derivatives (e.g., forward foreign currency exchange contracts, uncleared swap agreements, and uncleared options) and collateral, in the form of cash and securities, is held in segregated accounts with the fund’s custodian in connection with these agreements. For derivatives traded under an ISDA Master Agreement, which contains a collateral support annex, the collateral requirements are netted across all transactions traded under such counterparty-specific agreement and one amount is posted from one party to the other to collateralize such obligations. Cash that has been segregated or delivered to cover the fund’s collateral or margin obligations under derivative contracts, if any, will be reported separately in the Statement of Assets and Liabilities as restricted cash for uncleared derivatives or deposits with brokers for cleared derivatives, respectively. Securities pledged as collateral or margin for the same purpose, if any, are noted in the Portfolio of Investments. The fund may be required to make payments of interest on uncovered collateral or margin obligations with the broker. Any such payments are included in “Miscellaneous” expense or “Interest expense” if broken out separately in the in the Statement of Operations.
Purchased Options – The fund purchased call options for a premium. Purchased call options entitle the holder to buy a specified number of shares or units of a particular security, currency or index at a specified price at a specified date or within a specified period of time. Purchasing call options may hedge against an anticipated increase in the dollar cost of securities or currency to be acquired or increase the fund’s exposure to an underlying instrument.
The premium paid is initially recorded as an investment in the Statement of Assets and Liabilities. That investment is subsequently marked-to-market daily with the difference between the premium paid and the market value of the purchased option being recorded as unrealized appreciation or depreciation. Premiums paid for purchased call options which have expired are treated as realized losses on investments in the Statement of Operations.
Whether or not the option is exercised, the fund’s maximum risk of loss from purchasing an option is the amount of premium paid. All option contracts involve credit risk if the counterparty to the option contract fails to perform. For uncleared options, this risk is mitigated in cases where there is an ISDA Master Agreement between the fund and the counterparty providing for netting as described above and, where applicable, by the posting of collateral by the counterparty to the fund to cover the fund’s exposure to the counterparty under such ISDA Master Agreement.
37
Notes to Financial Statements – continued
Short Sales – The fund entered into short sales whereby it sells a security it does not own in anticipation of a decline in the value of that security. The fund will realize a gain if the security price decreases and a loss if the security price increases between the date of the short sale and the date on which the fund replaces the borrowed security. Losses from short sales can exceed the proceeds of the security sold; and they can also exceed the potential loss from an ordinary buy and sell transaction. The amount of any premium, dividends, or interest the fund may be required to pay in connection with a short sale will be recognized as a fund expense. During the year ended August 31, 2017, this expense amounted to $211,184. The fund segregates cash or marketable securities in an amount that, when combined with the amount of proceeds from the short sale deposited with the broker, at least equals the current market value of the security sold short.
Security Loans – Under its Securities Lending Agency Agreement with the fund, State Street Bank and Trust Company (“State Street”), as lending agent, loans the securities of the fund to certain qualified institutions (the “Borrowers”) approved by the fund. Security loans can be terminated at the discretion of either the lending agent or the fund and the related securities must be returned within the earlier of the standard trade settlement period for such securities or within three business days. The loans are collateralized by cash and/or U.S. Treasury and federal agency obligations in an amount typically at least equal to the market value of the securities loaned. On loans collateralized by cash, the cash collateral is invested in a money market fund. The market value of the loaned securities is determined at the close of business of the fund and any additional required collateral is delivered to the fund on the next business day. State Street provides the fund with indemnification against Borrower default. In the event of Borrower default, State Street will, for the benefit of the fund, either purchase securities identical to those loaned or, when such purchase is commercially impracticable, pay the fund the market value of the loaned securities. In return, State Street assumes the fund’s rights to the related collateral. If the collateral value is less than the cost to purchase identical securities, State Street is responsible for the shortfall, but only to the extent that such shortfall is not due to a decline in collateral value resulting from collateral reinvestment for which the fund bears the risk of loss. At period end, the fund had investment securities on loan, all of which were classified as equity securities in the fund’s Portfolio of Investments, with a fair value of $2,115,870. The fair value of the fund’s investment securities on loan and a related liability of $2,131,661 for cash collateral received on securities loaned are both presented gross in the Statement of Assets and Liabilities. The collateral on securities loaned exceeded the value of securities on loan at period end. The liability for cash collateral for securities loaned is carried at fair value, which is categorized as level 2 within the fair value hierarchy. A portion of the income generated upon investment of the collateral is remitted to the Borrowers, and the remainder is allocated between the fund and the lending agent. On loans collateralized by U.S. Treasury and/or federal agency obligations, a fee is received from the Borrower, and is allocated between the fund and the lending agent. Income from securities lending is separately reported in the Statement of Operations. The dividend and interest income earned on the securities loaned is accounted for in the same manner as other dividend and interest income.
38
Notes to Financial Statements – continued
Indemnifications – Under the fund’s organizational documents, its officers and Trustees may be indemnified against certain liabilities and expenses arising out of the performance of their duties to the fund. Additionally, in the normal course of business, the fund enters into agreements with service providers that may contain indemnification clauses. The fund’s maximum exposure under these agreements is unknown as this would involve future claims that may be made against the fund that have not yet occurred.
Investment Transactions and Income – Investment transactions are recorded on the trade date. Interest income is recorded on the accrual basis. Dividends received in cash are recorded on the ex-dividend date. Certain dividends from foreign securities will be recorded when the fund is informed of the dividend if such information is obtained subsequent to the ex-dividend date. Dividend and interest payments received in additional securities are recorded on the ex-dividend or ex-interest date in an amount equal to the value of the security on such date.
The fund may receive proceeds from litigation settlements. Any proceeds received from litigation involving portfolio holdings are reflected in the Statement of Operations in realized gain/loss if the security has been disposed of by the fund or in unrealized
gain/loss if the security is still held by the fund. Any other proceeds from litigation not related to portfolio holdings are reflected as other income in the Statement of Operations. On May 3, 2017, the fund received $11,579,893 from a non-recurring litigation settlement against Household International, Inc.
Reimbursement of Expenses by Custodian – In December 2015, the fund’s custodian (or former custodian), State Street Bank and Trust Company, announced that it intended to reimburse its asset servicing clients for expense amounts that it billed in error during the period 1998 through 2015. The amount of this one-time reimbursement attributable to the fund is reflected as “Reimbursement of custodian expenses” in the Statement of Operations.
Tax Matters and Distributions – The fund intends to qualify as a regulated investment company, as defined under Subchapter M of the Internal Revenue Code, and to distribute all of its taxable income, including realized capital gains. As a result, no provision for federal income tax is required. The fund’s federal tax returns, when filed, will remain subject to examination by the Internal Revenue Service for a three year period. Management has analyzed the fund’s tax positions taken on federal and state tax returns for all open tax years and does not believe that there are any uncertain tax positions that require recognition of a tax liability. Foreign taxes, if any, have been accrued by the fund in the accompanying financial statements in accordance with the applicable foreign tax law. Foreign income taxes may be withheld by certain countries in which the fund invests. Additionally, capital gains realized by the fund on securities issued in or by certain foreign countries may be subject to capital gains tax imposed by those countries.
Distributions to shareholders are recorded on the ex-dividend date. Income and capital gain distributions are determined in accordance with income tax regulations, which may differ from U.S. generally accepted accounting principles. Certain capital accounts in the financial statements are periodically adjusted for permanent differences in order to reflect their tax character. These adjustments have no impact on net assets or net
39
Notes to Financial Statements – continued
asset value per share. Temporary differences which arise from recognizing certain items of income, expense, gain or loss in different periods for financial statement and tax purposes will reverse at some time in the future. Distributions in excess of net investment income or net realized gains are temporary overdistributions for financial statement purposes resulting from differences in the recognition or classification of income or distributions for financial statement and tax purposes.
Book/tax differences primarily relate to wash sale loss deferrals and treating a portion of the proceeds from redemptions as a distribution for tax purposes.
The tax character of distributions declared to shareholders for the last two fiscal years is as follows:
| | | | | | | | |
| | | Year ended
8/31/17 | | | Year ended
8/31/16 | |
| Ordinary income (including any short-term capital gains) | | | $9,436,061 | | | | $31,546,985 | |
| Long-term capital gains | | | 45,657,548 | | | | 93,676,080 | |
| Total distributions | | | $55,093,609 | | | | $125,223,065 | |
The federal tax cost and the tax basis components of distributable earnings were as follows:
| | | | |
| As of 8/31/17 | | | |
| Cost of investments | | | $1,310,337,760 | |
| Gross appreciation | | | 415,321,630 | |
| Gross depreciation | | | (33,410,472 | ) |
| Net unrealized appreciation (depreciation) | | | $381,911,158 | |
| Undistributed ordinary income | | | 63,292,413 | |
| Undistributed long-term capital gain | | | 51,311,988 | |
| Other temporary differences | | | 420,805 | |
Multiple Classes of Shares of Beneficial Interest – The fund offers multiple classes of shares, which differ in their respective distribution and service fees. The fund’s income, realized and unrealized gain (loss), and common expenses are allocated to shareholders based on the daily net assets of each class. Dividends are declared separately for each class. Differences in per share dividend rates are generally due to differences in separate class expenses. Class B shares will convert to Class A shares approximately eight years after purchase. The fund’s distributions declared to
40
Notes to Financial Statements – continued
shareholders as reported in the Statements of Changes in Net Assets are presented by class as follows:
| | | | | | | | | | | | | | | | |
| | | From net investment
income | | | From net realized gain on
investments | |
| | | Year
ended
8/31/17 | | | Year
ended
8/31/16 | | | Year
ended
8/31/17 | | | Year
ended
8/31/16 | |
| Class A | | | $5,449,582 | | | | $4,837,428 | | | | $27,694,528 | | | | $90,892,526 | |
| Class B | | | — | | | | — | | | | 945,376 | | | | 3,440,854 | |
| Class C | | | — | | | | — | | | | 2,955,565 | | | | 9,325,733 | |
| Class I | | | 754,522 | | | | 201,876 | | | | 2,519,538 | | | | 2,740,510 | |
| Class R1 | | | — | | | | — | | | | 96,384 | | | | 335,219 | |
| Class R2 | | | 52,754 | | | | 34,231 | | | | 473,485 | | | | 1,562,467 | |
| Class R3 | | | 410,529 | | | | 378,052 | | | | 2,119,784 | | | | 6,813,962 | |
| Class R4 | | | 134,267 | | | | 159,292 | | | | 482,870 | | | | 1,970,391 | |
| Class R6 | | | 2,634,407 | | | | 210,997 | | | | 8,370,018 | | | | 2,319,527 | |
| Total | | | $9,436,061 | | | | $5,821,876 | | | | $45,657,548 | | | | $119,401,189 | |
(3) Transactions with Affiliates
Investment Adviser – The fund has an investment advisory agreement with MFS to provide overall investment management and related administrative services and facilities to the fund. For the period September 1, 2016 to December 28, 2016, the management fee was computed daily and paid monthly at the following annual rates:
| | | | |
| First $500 million of average daily net assets | | | 0.65 | % |
| Average daily net assets in excess of $500 million | | | 0.55 | % |
The investment adviser had agreed in writing to reduce its management fee to 0.50% of average daily net assets in excess of $2.5 billion. This written agreement terminated on December 28, 2016. For the period September 1, 2016 to December 28, 2016, the fund’s average daily net assets did not exceed $2.5 billion and therefore, the management fee was not reduced in accordance with this agreement.
Effective December 29, 2016, the management fee is computed daily and paid monthly at the following annual rates:
| | | | |
| First $500 million of average daily net assets | | | 0.65 | % |
| Next $2 billion of average daily net assets | | | 0.55 | % |
| Average daily net assets in excess of $2.5 billion | | | 0.50 | % |
MFS has agreed in writing to reduce its management fee by a specified amount if certain MFS mutual fund assets exceed thresholds agreed to by MFS and the fund’s Board of Trustees. For the year ended August 31, 2017, this management fee reduction amounted to $120,128, which is included in the reduction of total expenses in the Statement of Operations. The management fee incurred for the year ended August 31, 2017 was equivalent to an annual effective rate of 0.57% of the fund’s average daily net assets.
Distributor – MFS Fund Distributors, Inc. (MFD), a wholly-owned subsidiary of MFS, as distributor, received $232,426 for the year ended August 31, 2017, as its portion of the initial sales charge on sales of Class A shares of the fund.
41
Notes to Financial Statements – continued
The Board of Trustees has adopted a distribution plan for certain share classes pursuant to Rule 12b-1 of the Investment Company Act of 1940.
The fund’s distribution plan provides that the fund will pay MFD for services provided by MFD and financial intermediaries in connection with the distribution and servicing of certain share classes. One component of the plan is a distribution fee paid to MFD and another component of the plan is a service fee paid to MFD. MFD may subsequently pay all, or a portion, of the distribution and/or service fees to financial intermediaries.
Distribution Plan Fee Table:
| | | | | | | | | | | | | | | | | | | | |
| | | Distribution
Fee Rate (d) | | | Service
Fee Rate (d) | | | Total
Distribution
Plan (d) | | | Annual
Effective
Rate (e) | | | Distribution
and Service
Fee | |
| Class A | | | — | | | | 0.25% | | | | 0.25% | | | | 0.24% | | | | $2,384,950 | |
| Class B | | | 0.75% | | | | 0.25% | | | | 1.00% | | | | 1.00% | | | | 282,786 | |
| Class C | | | 0.75% | | | | 0.25% | | | | 1.00% | | | | 1.00% | | | | 904,797 | |
| Class R1 | | | 0.75% | | | | 0.25% | | | | 1.00% | | | | 1.00% | | | | 30,301 | |
| Class R2 | | | 0.25% | | | | 0.25% | | | | 0.50% | | | | 0.50% | | | | 78,299 | |
| Class R3 | | | — | | | | 0.25% | | | | 0.25% | | | | 0.25% | | | | 119,420 | |
| Total Distribution and Service Fees | | | | | | | | | | | | $3,800,553 | |
| (d) | In accordance with the distribution plan for certain classes, the fund pays distribution and/or service fees equal to these annual percentage rates of each class’s average daily net assets. The distribution and service fee rates disclosed by class represent the current rates in effect at the end of the reporting period. Any rate changes, if applicable, are detailed below. |
| (e) | The annual effective rates represent actual fees incurred under the distribution plan for the year ended August 31, 2017 based on each class’s average daily net assets. MFD has voluntarily agreed to rebate a portion of each class’s 0.25% service fee attributable to accounts for which MFD retains the 0.25% service fee except for accounts attributable to MFS or its affiliates’ seed money. For the year ended August 31, 2017, this rebate amounted to $53,314, $548, $2,414, and $287 for Class A, Class B, Class C, and Class R2, respectively, and is included in the reduction of total expenses in the Statement of Operations. |
Certain Class A shares are subject to a contingent deferred sales charge (CDSC) in the event of a shareholder redemption within 18 months of purchase. Class C shares are subject to a CDSC in the event of a shareholder redemption within 12 months of purchase. Class B shares are subject to a CDSC in the event of a shareholder redemption within six years of purchase. All contingent deferred sales charges are paid to MFD and during the year ended August 31, 2017, were as follows:
| | | | |
| | | Amount | |
| Class A | | | $6,198 | |
| Class B | | | 33,185 | |
| Class C | | | 7,444 | |
Shareholder Servicing Agent – MFS Service Center, Inc. (MFSC), a wholly-owned subsidiary of MFS, receives a fee from the fund for its services as shareholder servicing agent calculated as a percentage of the average daily net assets of the fund as determined periodically under the supervision of the fund’s Board of Trustees. For the year ended August 31, 2017, the fee was $405,411, which equated to 0.0256% annually of the fund’s average daily net assets. MFSC also receives payment from the fund for out-of-pocket expenses, sub-accounting and other shareholder servicing costs
42
Notes to Financial Statements – continued
which may be paid to affiliated and unaffiliated service providers. Class R6 shares do not incur sub-accounting fees. For the year ended August 31, 2017, these out-of-pocket expenses, sub-accounting and other shareholder servicing costs amounted to $1,423,691.
Administrator – MFS provides certain financial, legal, shareholder communications, compliance, and other administrative services to the fund. Under an administrative services agreement, the fund reimburses MFS the costs incurred to provide these services. The fund is charged an annual fixed amount of $17,500 plus a fee based on average daily net assets. The administrative services fee incurred for the year ended August 31, 2017 was equivalent to an annual effective rate of 0.0164% of the fund’s average daily net assets.
Trustees’ and Officers’ Compensation – The fund pays compensation to independent Trustees in the form of a retainer, attendance fees, and additional compensation to Board and Committee chairpersons. The fund does not pay compensation directly to Trustees or officers of the fund who are also officers of the investment adviser, all of whom receive remuneration for their services to the fund from MFS. Certain officers and Trustees of the fund are officers or directors of MFS, MFD, and MFSC.
Prior to December 31, 2001, the fund had an unfunded defined benefit plan (“DB plan”) for independent Trustees. As of December 31, 2001, the Board took action to terminate the DB plan with respect to then-current and any future independent Trustees, such that the DB plan covers only certain of those former independent Trustees who retired on or before December 31, 2001. Effective January 1, 2002, accrued benefits under the DB Plan for then-current independent Trustees who continued were credited to an unfunded retirement deferral plan (the “Retirement Deferral plan”), which was established for and exists solely with respect to these credited amounts, and is not available for other deferrals by these or other independent Trustees. Although the Retirement Deferral plan is unfunded, amounts deferred under the plan are periodically adjusted for investment experience as if they had been invested in shares of the fund. The DB plan resulted in a pension expense of $5,006 and the Retirement Deferral plan resulted in an expense of $8,524. Both amounts are included in “Independent Trustees’ compensation” in the Statement of Operations for the year ended August 31, 2017. The liability for deferred retirement benefits payable to certain independent Trustees under both plans amounted to $63,987 at August 31, 2017, and is included in “Payable for independent Trustees’ compensation” in the Statement of Assets and Liabilities.
Other – This fund and certain other funds managed by MFS (the funds) have entered into a service agreement (the ISO Agreement) which provides for payment of fees solely by the funds to Tarantino LLC in return for the provision of services of an Independent Senior Officer (ISO) for the funds. Frank L. Tarantino serves as the ISO and is an officer of the funds and the sole member of Tarantino LLC. The funds can terminate the ISO Agreement with Tarantino LLC at any time under the terms of the ISO Agreement. For the year ended August 31, 2017, the fee paid by the fund under this agreement was $2,851 and is included in “Miscellaneous” expense in the Statement of Operations. MFS has agreed to bear all expenses associated with office space, other administrative support, and supplies provided to the ISO.
43
Notes to Financial Statements – continued
The fund invests in the MFS Institutional Money Market Portfolio which is managed by MFS and seeks current income consistent with preservation of capital and liquidity. This money market fund does not pay a management fee to MFS.
On September 9, 2015, MFS redeemed 5,198 shares each of Class R6 for an aggregate amount of $149,960.
On March 16, 2016, MFS redeemed 5,080 shares each of Class I for an aggregate amount of $130,053.
The fund is permitted to engage in purchase and sale transactions with funds and accounts for which MFS serves as investment adviser or sub-adviser (“cross-trades”) pursuant to a policy adopted by the Board of Trustees. This policy has been designed to ensure that cross-trades conducted by the fund comply with Rule 17a-7 under the Investment Company Act of 1940. Under this policy, cross-trades are effected at current market prices with no remuneration paid in connection with the transaction. During the year ended August 31, 2017, the fund engaged in purchase and sale transactions pursuant to this policy, which amounted to $4,044,521 and $7,618,516, respectively. The sales transactions resulted in net realized gains (losses) of $717,813.
(4) Portfolio Securities
For the year ended August 31, 2017, purchases and sales of investments, other than purchased option transactions, short sales, and short-term obligations, aggregated $720,034,548 and $839,529,469, respectively.
(5) Shares of Beneficial Interest
The fund’s Declaration of Trust permits the Trustees to issue an unlimited number of full and fractional shares of beneficial interest. Transactions in fund shares were as follows:
| | | | | | | | | | | | | | | | |
| | | Year ended
8/31/17 | | | Year ended
8/31/16 | |
| | | Shares | | | Amount | | | Shares | | | Amount | |
| Shares sold | | | | | | | | | | | | | | | | |
Class A | | | 3,357,595 | | | | $94,400,704 | | | | 3,602,883 | | | | $91,608,281 | |
Class B | | | 95,846 | | | | 2,400,880 | | | | 99,638 | | | | 2,294,543 | |
Class C | | | 480,958 | | | | 11,980,396 | | | | 444,615 | | | | 10,149,560 | |
Class I | | | 4,772,073 | | | | 140,194,056 | | | | 1,937,682 | | | | 51,360,121 | |
Class R1 | | | 23,034 | | | | 567,562 | | | | 18,909 | | | | 430,724 | |
Class R2 | | | 89,273 | | | | 2,442,270 | | | | 110,868 | | | | 2,776,509 | |
Class R3 | | | 191,563 | | | | 5,328,845 | | | | 645,573 | | | | 16,350,991 | |
Class R4 | | | 212,581 | | | | 5,900,365 | | | | 139,594 | | | | 3,632,945 | |
Class R6 | | | 3,248,472 | | | | 99,927,167 | | | | 13,414,972 | | | | 362,811,859 | |
| | | 12,471,395 | | | | $363,142,245 | | | | 20,414,734 | | | | $541,415,533 | |
44
Notes to Financial Statements – continued
| | | | | | | | | | | | | | | | |
| | | Year ended
8/31/17 | | | Year ended
8/31/16 | |
| | | Shares | | | Amount | | | Shares | | | Amount | |
| Shares issued to shareholders in reinvestment of distributions | | | | | | | | | | | | | | | | |
Class A | | | 1,190,197 | | | | $31,992,477 | | | | 3,680,296 | | | | $91,308,144 | |
Class B | | | 38,514 | | | | 928,598 | | | | 149,513 | | | | 3,344,607 | |
Class C | | | 111,646 | | | | 2,662,764 | | | | 384,993 | | | | 8,519,904 | |
Class I | | | 109,935 | | | | 3,106,763 | | | | 100,168 | | | | 2,608,371 | |
Class R1 | | | 4,043 | | | | 96,384 | | | | 15,155 | | | | 335,219 | |
Class R2 | | | 18,727 | | | | 492,514 | | | | 61,784 | | | | 1,500,738 | |
Class R3 | | | 94,520 | | | | 2,530,313 | | | | 291,057 | | | | 7,192,014 | |
Class R4 | | | 22,806 | | | | 617,137 | | | | 85,323 | | | | 2,129,683 | |
Class R6 | | | 347,084 | | | | 9,815,545 | | | | 19,790 | | | | 515,529 | |
| | | 1,937,472 | | | | $52,242,495 | | | | 4,788,079 | | | | $117,454,209 | |
| | | | |
| Shares reacquired | | | | | | | | | | | | | | | | |
Class A | | | (7,870,881 | ) | | | $(218,624,140 | ) | | | (6,784,949 | ) | | | $(173,381,880 | ) |
Class B | | | (401,042 | ) | | | (10,025,074 | ) | | | (365,426 | ) | | | (8,386,396 | ) |
Class C | | | (1,006,239 | ) | | | (25,363,246 | ) | | | (666,933 | ) | | | (15,103,026 | ) |
Class I | | | (3,273,067 | ) | | | (99,289,452 | ) | | | (1,590,445 | ) | | | (42,872,281 | ) |
Class R1 | | | (35,410 | ) | | | (879,157 | ) | | | (58,470 | ) | | | (1,365,455 | ) |
Class R2 | | | (163,032 | ) | | | (4,397,972 | ) | | | (176,105 | ) | | | (4,439,122 | ) |
Class R3 | | | (2,261,578 | ) | | | (61,620,126 | ) | | | (462,335 | ) | | | (11,719,670 | ) |
Class R4 | | | (89,437 | ) | | | (2,544,126 | ) | | | (410,675 | ) | | | (10,249,449 | ) |
Class R6 | | | (2,022,353 | ) | | | (59,184,652 | ) | | | (2,984,209 | ) | | | (81,842,272 | ) |
| | | (17,123,039 | ) | | | $(481,927,945 | ) | | | (13,499,547 | ) | | | $(349,359,551 | ) |
| | | | |
| Net change | | | | | | | | | | | | | | | | |
Class A | | | (3,323,089 | ) | | | $(92,230,959 | ) | | | 498,230 | | | | $9,534,545 | |
Class B | | | (266,682 | ) | | | (6,695,596 | ) | | | (116,275 | ) | | | (2,747,246 | ) |
Class C | | | (413,635 | ) | | | (10,720,086 | ) | | | 162,675 | | | | 3,566,438 | |
Class I | | | 1,608,941 | | | | 44,011,367 | | | | 447,405 | | | | 11,096,211 | |
Class R1 | | | (8,333 | ) | | | (215,211 | ) | | | (24,406 | ) | | | (599,512 | ) |
Class R2 | | | (55,032 | ) | | | (1,463,188 | ) | | | (3,453 | ) | | | (161,875 | ) |
Class R3 | | | (1,975,495 | ) | | | (53,760,968 | ) | | | 474,295 | | | | 11,823,335 | |
Class R4 | | | 145,950 | | | | 3,973,376 | | | | (185,758 | ) | | | (4,486,821 | ) |
Class R6 | | | 1,573,203 | | | | 50,558,060 | | | | 10,450,553 | | | | 281,485,116 | |
| | | (2,714,172 | ) | | | $(66,543,205 | ) | | | 11,703,266 | | | | $309,510,191 | |
(6) Line of Credit
The fund and certain other funds managed by MFS participate in a $1.25 billion unsecured committed line of credit, subject to a $1 billion sublimit, provided by a syndication of banks under a credit agreement. Borrowings may be made for temporary financing needs. Interest is charged to each fund, based on its borrowings, generally at a rate equal to the higher of the Overnight Federal Reserve funds rate or daily one month LIBOR plus an agreed upon spread. A commitment fee, based on the average daily, unused portion of the committed line of credit, is allocated among the
45
Notes to Financial Statements – continued
participating funds at the end of each calendar quarter. In addition, the fund and other funds managed by MFS have established unsecured uncommitted borrowing arrangements with certain banks for temporary financing needs. Interest is charged to each fund, based on its borrowings, at a rate equal to the Overnight Federal Reserve funds rate plus an agreed upon spread. For the year ended August 31, 2017, the fund’s commitment fee and interest expense were $10,594 and $0, respectively, and are included in “Miscellaneous” expense in the Statement of Operations.
(7) Investments in Affiliated Issuers
An affiliated issuer may be considered one in which the fund owns 5% or more of the outstanding voting securities, or a company which is under common control. For the purposes of this report, the fund assumes the following to be an affiliated issuer:
| | | | | | | | | | | | | | | | | | | | |
| Affiliated Issuer | | | | | Beginning
Shares/Par
Amount | | | Acquisitions
Shares/Par
Amount | | | Dispositions
Shares/Par
Amount | | | Ending
Shares/Par
Amount | |
MFS Institutional Money
Market Portfolio | | | | | | | 10,178,267 | | | | 241,490,355 | | | | (224,849,507 | ) | | | 26,819,115 | |
| | | | | |
| Affiliated Issuer | | Realized
Gain (Loss) | | | Change in
Unrealized
Appreciation
(Depreciation) | | | Capital Gain
Distributions | | | Dividend
Income | | | Ending
Value | |
MFS Institutional Money
Market Portfolio | | | $698 | | | | $1,647 | | | | $— | | | | $113,205 | | | | $26,819,115 | |
46
REPORT OF INDEPENDENT REGISTERED PUBLIC ACCOUNTING FIRM
To the Board of Trustees of MFS Series Trust I and Shareholders of MFS Core Equity Fund:
We have audited the accompanying statement of assets and liabilities, including the portfolio of investments, of MFS Core Equity Fund (the Fund) (one of the series constituting the MFS Series Trust I) as of August 31, 2017, and the related statement of operations for the year then ended, the statements of changes in net assets for each of the two years in the period then ended and the financial highlights for each of the periods indicated therein. These financial statements and financial highlights are the responsibility of the Fund’s management. Our responsibility is to express an opinion on these financial statements and financial highlights based on our audits.
We conducted our audits in accordance with the standards of the Public Company Accounting Oversight Board (United States). Those standards require that we plan and perform the audit to obtain reasonable assurance about whether the financial statements and financial highlights are free of material misstatement. We were not engaged to perform an audit of the Fund’s internal control over financial reporting. Our audits included consideration of internal control over financial reporting as a basis for designing audit procedures that are appropriate in the circumstances, but not for the purpose of expressing an opinion on the effectiveness of the Fund’s internal control over financial reporting. Accordingly, we express no such opinion. An audit also includes examining, on a test basis, evidence supporting the amounts and disclosures in the financial statements and financial highlights, assessing the accounting principles used and significant estimates made by management, and evaluating the overall financial statement presentation. Our procedures included confirmation of securities owned as of August 31, 2017, by correspondence with the custodian and others. We believe that our audits provide a reasonable basis for our opinion.
In our opinion, the financial statements and financial highlights referred to above present fairly, in all material respects, the financial position of MFS Core Equity Fund (one of the series constituting the MFS Series Trust I) at August 31, 2017, the results of its operations for the year then ended, the changes in its net assets for each of the two years in the period then ended and the financial highlights for each of the periods indicated therein, in conformity with U.S. generally accepted accounting principles.

Boston, Massachusetts
October 17, 2017
47
RESULTS OF SHAREHOLDER MEETING
(unaudited)
At a special meeting of shareholders of MFS Series Trust I, which was held on March 23, 2017, the following action was taken:
Item 1: To elect the following individuals as Trustees:
| | | | | | | | |
| | | Number of Dollars | |
Nominee | | For | | | Withheld Authority | |
| Steven E. Buller | | | 40,448,016,134.453 | | | | 372,137,248.376 | |
| John A. Caroselli | | | 40,455,058,441.389 | | | | 365,094,941.560 | |
| Maureen R. Goldfarb | | | 40,458,621,672.449 | | | | 361,531,746.940 | |
| David H. Gunning | | | 40,369,558,961.219 | | | | 450,594,312.051 | |
| Michael Hegarty | | | 40,379,783,468.714 | | | | 440,369,950.676 | |
| John P. Kavanaugh | | | 40,453,732,784.104 | | | | 366,420,708.405 | |
| Robert J. Manning | | | 40,424,010,964.586 | | | | 396,142,308.684 | |
| Clarence Otis, Jr. | | | 40,441,919,324.712 | | | | 378,234,043.007 | |
| Maryanne L. Roepke | | | 40,471,040,575.143 | | | | 349,112,917.026 | |
| Robin A. Stelmach | | | 40,459,908,730.475 | | | | 360,244,615.574 | |
| Laurie J. Thomsen | | | 40,426,270,790.416 | | | | 393,882,628.973 | |
48
TRUSTEES AND OFFICERS — IDENTIFICATION AND BACKGROUND
The Trustees and Officers of the Trust, as of October 1, 2017, are listed below, together with their principal occupations during the past five years. (Their titles may have varied during that period.) The address of each Trustee and Officer is 111 Huntington Avenue, Boston, Massachusetts 02199-7618.
| | | | | | | | | | |
Name, Age | | Position(s)
Held with Fund | | Trustee/Officer Since (h) | | Number of
MFS Funds
overseen
by the
Trustee | | Principal
Occupations During the Past Five Years | | Other Directorships
During the Past
Five Years (j) |
| INTERESTED TRUSTEES |
Robert J. Manning (k)
(age 53) | | Trustee | | February 2004 | | 136 | | Massachusetts Financial Services Company, Executive Chairman (since January 2017); Director; Chairman of the Board; Chief Executive Officer (until 2015); Co-Chief Executive Officer (2015-2016) | | N/A |
Robin A. Stelmach (k) (age 56) | | Trustee | | January 2014 | | 136 | | Massachusetts Financial Services Company, Vice Chair (since January 2017); Chief Operating Officer and Executive Vice President (until January 2017) | | N/A |
| INDEPENDENT TRUSTEES |
David H. Gunning
(age 75) | | Trustee and Chair of Trustees | | January 2004 | | 136 | | Private investor | | Lincoln Electric Holdings, Inc., Director; Development Alternatives, Inc., Director/Non-Executive Chairman (until 2013) |
49
Trustees and Officers – continued
| | | | | | | | | | |
Name, Age | | Position(s)
Held with Fund | | Trustee/Officer Since (h) | | Number of
MFS Funds
overseen
by the
Trustee | | Principal
Occupations During the Past Five Years | | Other Directorships
During the Past
Five Years (j) |
Steven E. Buller
(age 66) | | Trustee | | February 2014 | | 136 | | Financial Accounting Standards Advisory Council, Chairman (2014-2015); Public Company Accounting Oversight Board, Standing Advisory Group, Member (until 2014); BlackRock, Inc. (investment management), Managing Director (until 2014), BlackRock Finco UK (investment management), Director (until 2014) | | N/A |
John A. Caroselli
(age 63) | | Trustee | | March 2017 | | 136 | | JC Global Advisors, LLC (management consulting), President (since 2015); First Capital Corporation (commercial finance), Executive Vice President (until 2015) | | N/A |
Maureen R. Goldfarb
(age 62) | | Trustee | | January 2009 | | 136 | | Private investor | | N/A |
Michael Hegarty
(age 72) | | Trustee | | December 2004 | | 136 | | Private investor | | Rouse Properties Inc., Director (until 2016); Capmark Financial Group Inc., Director (until 2015) |
John P. Kavanaugh
(age 62) | | Trustee and Vice Chair of Trustees | | January 2009 | | 136 | | Private investor | | N/A |
Clarence Otis, Jr.
(age 61) | | Trustee | | March 2017 | | 136 | | Darden Restaurants, Inc., Chief Executive Officer (until 2014) | | VF Corporation, Director; Verizon Communications, Inc., Director; The Travelers Companies, Director; Federal Reserve Bank of Atlanta, Director (until 2015) |
50
Trustees and Officers – continued
| | | | | | | | | | |
Name, Age | | Position(s)
Held with Fund | | Trustee/Officer Since (h) | | Number of
MFS Funds
overseen
by the
Trustee | | Principal
Occupations During the Past Five Years | | Other Directorships
During the Past
Five Years (j) |
Maryanne L. Roepke
(age 61) | | Trustee | | May 2014 | | 136 | | American Century Investments (investment management), Senior Vice President and Chief Compliance Officer (until 2014) | | N/A |
Laurie J. Thomsen
(age 60) | | Trustee | | March 2005 | | 136 | | Private investor | | The Travelers Companies, Director; Dycom Industries, Inc., Director (since 2015) |
| | | | | | | | |
Name, Age | | Position(s) Held with Fund | | Trustee/Officer
Since (h) | | Number of
MFS Funds
for which
the Person
is an Officer | | Principal
Occupations During the Past Five Years |
| OFFICERS | | | | | | | | |
Christopher R. Bohane (k)
(age 43) | | Assistant Secretary and Assistant Clerk | | July 2005 | | 136 | | Massachusetts Financial Services Company, Vice President and Assistant General Counsel |
Kino Clark (k)
(age 49) | | Assistant Treasurer | | January 2012 | | 136 | | Massachusetts Financial Services Company, Vice President |
John W. Clark, Jr. (k)
(age 50) | | Assistant Treasurer | | April 2017 | | 136 | | Massachusetts Financial Services Company, Vice President (since March 2017); Deutsche Bank (financial services), Department Head – Treasurer’s Office (until February 2017) |
Thomas H. Connors (k)
(age 58) | | Assistant Secretary and Assistant Clerk | | September 2012 | | 136 | | Massachusetts Financial Services Company, Vice President and Senior Counsel; Deutsche Investment Management Americas Inc. (financial service provider), Director and Senior Counsel (until 2012) |
51
Trustees and Officers – continued
| | | | | | | | |
Name, Age | | Position(s) Held with Fund | | Trustee/Officer
Since (h) | | Number of
MFS Funds
for which
the Person
is an Officer | | Principal
Occupations During the Past Five Years |
Ethan D. Corey (k)
(age 53) | | Assistant Secretary and Assistant Clerk | | July 2005 | | 136 | | Massachusetts Financial Services Company, Senior Vice President and Associate General Counsel |
David L. DiLorenzo (k)
(age 49) | | President | | July 2005 | | 136 | | Massachusetts Financial Services Company, Senior Vice President |
Heidi W. Hardin (k)
(age 50) | | Secretary and Clerk | | April 2017 | | 136 | | Massachusetts Financial Services Company, Executive Vice President and General Counsel (since March 2017); Harris Associates (investment management), General Counsel (from September 2015 to January 2017); Janus Capital Management LLC (investment management), Senior Vice President and General Counsel (until September 2015) |
Brian E. Langenfeld (k) (age 44) | | Assistant Secretary and Assistant Clerk | | June 2006 | | 136 | | Massachusetts Financial Services Company, Vice President and Senior Counsel |
Susan A. Pereira (k)
(age 46) | | Assistant Secretary and Assistant Clerk | | July 2005 | | 136 | | Massachusetts Financial Services Company, Vice President and Senior Counsel |
Kasey L. Phillips (k)
(age 46) | | Assistant Treasurer | | September 2012 | | 136 | | Massachusetts Financial Services Company, Vice President; Wells Fargo Funds Management, LLC, Senior Vice President, Fund Treasurer (until 2012) |
Matthew A. Stowe (k)
(age 42) | | Assistant Secretary and Assistant Clerk | | October 2014 | | 136 | | Massachusetts Financial Services Company, Vice President and Assistant General Counsel |
Frank L. Tarantino
(age 73) | | Independent Senior Officer | | June 2004 | | 136 | | Tarantino LLC (provider of compliance services), Principal |
Richard S. Weitzel (k)
(age 47) | | Assistant Secretary and Assistant Clerk | | October 2007 | | 136 | | Massachusetts Financial Services Company, Senior Vice President and Associate General Counsel |
52
Trustees and Officers – continued
| | | | | | | | |
Name, Age | | Position(s) Held with Fund | | Trustee/Officer
Since (h) | | Number of
MFS Funds
for which
the Person
is an Officer | | Principal
Occupations During the Past Five Years |
Martin J. Wolin (k)
(age 50) | | Chief Compliance Officer | | July 2015 | | 136 | | Massachusetts Financial Services Company, Senior Vice President and Chief Compliance Officer (since July 2015); Mercer (financial service provider), Chief Risk and Compliance Officer, North America and Latin America (until June 2015) |
James O. Yost (k)
(age 57) | | Treasurer | | September 1990 | | 136 | | Massachusetts Financial Services Company, Senior Vice President |
| (h) | Date first appointed to serve as Trustee/officer of an MFS Fund. Each Trustee has served continuously since appointment unless indicated otherwise. For the period from December 15, 2004 until February 22, 2005, Mr. Manning served as Advisory Trustee. Prior to January 2012, Messrs. DiLorenzo and Yost served as Assistant Treasurers of the Funds. From January 2012 through December 2016, Messrs. DiLorenzo and Yost served as Treasurer and Deputy Treasurer of the Funds, respectively. |
| (j) | Directorships or trusteeships of companies required to report to the Securities and Exchange Commission (i.e., “public companies”). |
| (k) | “Interested person” of the Trust within the meaning of the Investment Company Act of 1940 (referred to as the 1940 Act), which is the principal federal law governing investment companies like the fund, as a result of a position with MFS. The address of MFS is 111 Huntington Avenue, Boston, Massachusetts 02199-7618. |
Each Trustee has been elected by shareholders and each Trustee and officer holds office until his or her successor is chosen and qualified or until his or her earlier death, resignation, retirement or removal. The Trust does not hold annual meetings for the purpose of electing Trustees, and Trustees are not elected for fixed terms. Under the terms of the Board’s retirement policy, an Independent Trustee shall retire at the end of the calendar year in which he or she reaches the earlier of 75 years of age or 15 years of service on the Board (or, in the case of any Independent Trustee who joined the Board prior to 2015, 20 years of service on the Board).
Messrs. Buller, Kavanaugh and Otis and Ms. Roepke are members of the Trust’s Audit Committee.
Each of the Interested Trustees and certain Officers hold comparable officer positions with certain affiliates of MFS.
53
Trustees and Officers – continued
The Statement of Additional Information for a Fund includes further information about the Trustees and is available without charge upon request by calling 1-800-225-2606.
| | |
| Investment Adviser | | Custodian |
Massachusetts Financial Services Company
111 Huntington Avenue
Boston, MA 02199-7618 | | State Street Bank and Trust Company 1 Lincoln Street
Boston, MA 02111-2900 |
| Distributor | | Independent Registered Public Accounting Firm |
MFS Fund Distributors, Inc.
111 Huntington Avenue
Boston, MA 02199-7618 | | Ernst & Young LLP 200 Claredon Street
Boston, MA 02116 |
| Portfolio Manager(s) | | |
Joseph MacDougall | | |
54
BOARD REVIEW OF INVESTMENT ADVISORY AGREEMENT
The Investment Company Act of 1940 requires that both the full Board of Trustees and a majority of the non-interested (“independent”) Trustees, voting separately, annually approve the continuation of the Fund’s investment advisory agreement with MFS. The Trustees consider matters bearing on the Fund and its advisory arrangements at their meetings throughout the year, including a review of performance data at each regular meeting. In addition, the independent Trustees met several times over the course of three months beginning in May and ending in July, 2017 (“contract review meetings”) for the specific purpose of considering whether to approve the continuation of the investment advisory agreement for the Fund and the other investment companies that the Board oversees (the “MFS Funds”). The independent Trustees were assisted in their evaluation of the Fund’s investment advisory agreement by independent legal counsel, from whom they received separate legal advice and with whom they met separately from MFS during various contract review meetings. The independent Trustees were also assisted in this process by the MFS Funds’ Independent Senior Officer, a senior officer appointed by and reporting to the independent Trustees.
In connection with their deliberations regarding the continuation of the investment advisory agreement, the Trustees, including the independent Trustees, considered such information and factors as they believed, in light of the legal advice furnished to them and their own business judgment, to be relevant. The investment advisory agreement for the Fund was considered separately, although the Trustees also took into account the common interests of all MFS Funds in their review. As described below, the Trustees considered the nature, quality, and extent of the various investment advisory, administrative, and shareholder services performed by MFS under the existing investment advisory agreement and other arrangements with the Fund.
In connection with their contract review meetings, the Trustees received and relied upon materials that included, among other items: (i) information provided by Broadridge Financial Solutions, Inc. (“Broadridge”), an independent third party, on the investment performance of the Fund for various time periods ended December 31, 2016 and the investment performance of a group of funds with substantially similar investment classifications/objectives (the “Lipper performance universe”), (ii) information provided by Broadridge on the Fund’s advisory fees and other expenses and the advisory fees and other expenses of comparable funds identified by Broadridge (the “Broadridge expense group”), (iii) information provided by MFS on the advisory fees of portfolios of other clients of MFS, including institutional separate accounts and other clients, (iv) information as to whether and to what extent applicable expense waivers, reimbursements or fee “breakpoints” are observed for the Fund, (v) information regarding MFS’ financial results and financial condition, including MFS’ and certain of its affiliates’ estimated profitability from services performed for the Fund and the MFS Funds as a whole, and compared to MFS’ institutional business, (vi) MFS’ views regarding the outlook for the mutual fund industry and the strategic business plans of MFS, (vii) descriptions of various functions performed by MFS for the Funds, such as compliance monitoring and portfolio trading practices, and (viii) information regarding the overall organization of MFS, including information about MFS’ senior management and other personnel providing investment advisory,
55
Board Review of Investment Advisory Agreement – continued
administrative and other services to the Fund and the other MFS Funds. The comparative performance, fee and expense information prepared and provided by Broadridge was not independently verified and the independent Trustees did not independently verify any information provided to them by MFS.
The Trustees’ conclusion as to the continuation of the investment advisory agreement was based on a comprehensive consideration of all information provided to the Trustees and not the result of any single factor. Some of the factors that figured particularly in the Trustees’ deliberations are described below, although individual Trustees may have evaluated the information presented differently from one another, giving different weights to various factors. It is also important to recognize that the fee arrangements for the Fund and other MFS Funds are the result of years of review and discussion between the independent Trustees and MFS, that certain aspects of such arrangements may receive greater scrutiny in some years than in others, and that the Trustees’ conclusions may be based, in part, on their consideration of these same arrangements during the course of the year and in prior years.
Based on information provided by Broadridge and MFS, the Trustees reviewed the Fund’s total return investment performance as well as the performance of peer groups of funds over various time periods. The Trustees placed particular emphasis on the total return performance of the Fund’s Class A shares in comparison to the performance of funds in its Lipper performance universe over the three-year period ended December 31, 2016, which the Trustees believed was a long enough period to reflect differing market conditions. The total return performance of the Fund’s Class A shares was in the 2nd quintile relative to the other funds in the universe for this three-year period (the 1st quintile being the best performers and the 5th quintile being the worst performers). The total return performance of the Fund’s Class A shares was in the 2nd quintile for each of the one- and five-year periods ended December 31, 2016 relative to the Lipper performance universe. Because of the passage of time, these performance results may differ from the performance results for more recent periods, including those shown elsewhere in this report.
In the course of their deliberations, the Trustees took into account information provided by MFS in connection with the contract review meetings, as well as during investment review meetings conducted with portfolio management personnel during the course of the year regarding the Fund’s performance. After reviewing these and related factors, the Trustees concluded, within the context of their overall conclusions regarding the investment advisory agreement, that they were satisfied with MFS’ responses and efforts relating to investment performance.
In assessing the reasonableness of the Fund’s advisory fee, the Trustees considered, among other information, the Fund’s advisory fee and the total expense ratio of the Fund’s Class A shares as a percentage of average daily net assets and the advisory fee and total expense ratios of peer groups of funds based on information provided by Broadridge. The Trustees considered that, according to the data provided by Broadridge (which takes into account any fee reductions or expense limitations that were in effect during the Fund’s last fiscal year), the Fund’s effective advisory fee rate and total expense ratio were each lower than the Broadridge expense group median.
56
Board Review of Investment Advisory Agreement – continued
The Trustees also considered the advisory fees charged by MFS to any institutional separate accounts advised by MFS (“separate accounts”) and unaffiliated investment companies for which MFS serves as subadviser (“subadvised funds”) that have comparable investment strategies to the Fund, if any. In comparing these fees, the Trustees considered information provided by MFS as to the generally broader scope of services provided by MFS to the Fund, as well as the more extensive regulatory burdens imposed on MFS in managing the Fund, in comparison to separate accounts and subadvised funds. The Trustees also considered the higher demands placed on MFS’ investment personnel and trading infrastructure as a result of the daily cash in-flows and out-flows of the Fund in comparison to separate accounts.
The Trustees also considered whether the Fund may benefit from any economies of scale in the management of the Fund in the event of growth in assets of the Fund and/or growth in assets of the MFS Funds as a whole. They noted that the Fund’s advisory fee rate schedule is subject to contractual breakpoints that reduce the Fund’s advisory fee rate on average daily net assets over $500 million and $2.5 billion. The Trustees also noted that MFS has agreed in writing to waive a portion of the management fees of certain MFS Funds, including the Fund, if the total combined assets of certain funds within the MFS Funds’ complex increase above agreed upon thresholds (the “group fee waiver”), enabling the Fund’s shareholders to share in the benefits from any economies of scale at the complex level. The group fee waiver is reviewed and renewed annually between the Board and MFS. The Trustees concluded that the breakpoints and the group fee waiver were sufficient to allow the Fund to benefit from economies of scale as its assets and overall complex assets grow.
The Trustees also considered information prepared by MFS relating to MFS’ costs and profits with respect to the Fund, the MFS Funds considered as a group, and other investment companies and accounts advised by MFS, as well as MFS’ methodologies used to determine and allocate its costs to the MFS Funds, the Fund and other accounts and products for purposes of estimating profitability.
After reviewing these and other factors described herein, the Trustees concluded, within the context of their overall conclusions regarding the investment advisory agreement, that the advisory fees charged to the Fund represent reasonable compensation in light of the services being provided by MFS to the Fund.
In addition, the Trustees considered MFS’ resources and related efforts to continue to retain, attract and motivate capable personnel to serve the Fund. The Trustees also considered current and developing conditions in the financial services industry, including the presence of large and well-capitalized companies which are spending, and appear to be prepared to continue to spend, substantial sums to engage personnel and to provide services to competing investment companies. In this regard, the Trustees also considered the financial resources of MFS and its ultimate parent, Sun Life Financial Inc. The Trustees also considered the advantages and possible disadvantages to the Fund of having an adviser that also serves other investment companies as well as other accounts.
The Trustees also considered the nature, quality, cost, and extent of administrative, transfer agency, and distribution services provided to the Fund by MFS and its affiliates under agreements and plans other than the investment advisory agreement, including
57
Board Review of Investment Advisory Agreement – continued
any 12b-1 fees the Fund pays to MFS Fund Distributors, Inc., an affiliate of MFS. The Trustees also considered the nature, extent and quality of certain other services MFS performs or arranges for on the Fund’s behalf, which may include securities lending programs, directed expense payment programs, class action recovery programs, and MFS’ interaction with third-party service providers, principally custodians and sub-custodians. The Trustees concluded that the various non-advisory services provided by MFS and its affiliates on behalf of the Fund were satisfactory.
The Trustees also considered benefits to MFS from the use of the Fund’s portfolio brokerage commissions, if applicable, to pay for investment research and various other factors. Additionally, the Trustees considered so-called “fall-out benefits” to MFS such as reputational value derived from serving as investment manager to the Fund.
Based on their evaluation of factors that they deemed to be material, including those factors described above, the Board of Trustees, including the independent Trustees, concluded that the Fund’s investment advisory agreement with MFS should be continued for an additional one-year period, commencing August 1, 2017.
58
PROXY VOTING POLICIES AND INFORMATION
MFS votes proxies on behalf of the fund pursuant to proxy voting policies and procedures that are available without charge, upon request, by calling 1-800-225-2606, by visiting mfs.com (once you have selected “Individual Investor” as your role, click on “Individual Investor Home” in the top navigation and then select “Learn More About Proxy Voting” under the “I want to…” header on the left hand column of the page), or by visiting the SEC’s Web site at http://www.sec.gov.
Information regarding how the fund voted proxies relating to portfolio securities during the most recent twelve-month period ended June 30 is available by August 31 of each year without charge by visiting mfs.com (once you have selected “Individual Investor” as your role, click on “Individual Investor Home” in the top navigation and then select “Learn More About Proxy Voting” under the “I want to…” header on the left hand column of the page), or by visiting the SEC’s Web site at http://www.sec.gov.
QUARTERLY PORTFOLIO DISCLOSURE
The fund will file a complete schedule of portfolio holdings with the Securities and Exchange Commission (the Commission) for the first and third quarters of each fiscal year on Form N-Q. A shareholder can obtain the quarterly portfolio holdings report at mfs.com. The fund’s Form N-Q is also available on the EDGAR database on the Commission’s Internet Web site at http://www.sec.gov, and may be reviewed and copied at the:
Public Reference Room
Securities and Exchange Commission
100 F Street, NE, Room 1580
Washington, D.C. 20549
Information on the operation of the Public Reference Room may be obtained by calling the Commission at 1-800-SEC-0330. Copies of the fund’s Form N-Q also may be obtained, upon payment of a duplicating fee, by electronic request at the following e-mail address: publicinfo@sec.gov or by writing the Public Reference Section at the above address.
FURTHER INFORMATION
From time to time, MFS may post important information about the fund or the MFS funds on the MFS web site (mfs.com). This information is available on mfs.com by following these steps once you have selected “Individual Investor” as your role: (1) Click on the “Individual Investor Home” in the top navigation and then select the “Announcements” option within the “Market Outlooks” drop down, or (2) Click on “Products & Services” and “Mutual Funds” and then choose the fund’s name in the “Select a fund” menu.
59
INFORMATION ABOUT FUND CONTRACTS AND LEGAL CLAIMS
The fund has entered into contractual arrangements with an investment adviser, administrator, distributor, shareholder servicing agent, 529 program manager (if applicable), and custodian who each provide services to the fund. Unless expressly stated otherwise, shareholders are not parties to, or intended beneficiaries of these contractual arrangements, and these contractual arrangements are not intended to create any shareholder right to enforce them against the service providers or to seek any remedy under them against the service providers, either directly or on behalf of the fund.
Under the Trust’s By-Laws and Declaration of Trust, any claims asserted against or on behalf of the MFS Funds, including claims against Trustees and Officers, must be brought in state and federal courts located within the Commonwealth of Massachusetts.
FEDERAL TAX INFORMATION (unaudited)
The fund will notify shareholders of amounts for use in preparing 2017 income tax forms in January 2018. The following information is provided pursuant to provisions of the Internal Revenue Code.
The fund designates the maximum amount allowable as qualified dividend income eligible to be taxed at the same rate as long-term capital gain.
The fund designates $66,768,000 as capital gain dividends paid during the fiscal year.
For corporate shareholders, 99.99% of the ordinary income dividends paid during the fiscal year qualify for the corporate dividends received deduction.
60
rev. 3/16
| | | | |
| | | |
FACTS | | WHAT DOES MFS DO WITH YOUR PERSONAL INFORMATION? | |  |
| | |
| Why? | | Financial companies choose how they share your personal information. Federal law gives consumers the right to limit some but not all sharing. Federal law also requires us to tell you how we collect, share, and protect your personal information. Please read this notice carefully to understand what we do. |
| | |
| What? | | The types of personal information we collect and share depend on the product or service you have with us. This information can include: • Social Security number and account balances • Account transactions and transaction history • Checking account information and wire transfer instructions When you are no longer our customer, we continue to share your information as described in this notice. |
| | |
| How? | | All financial companies need to share customers’ personal information to run their everyday business. In the section below, we list the reasons financial companies can share their customers’ personal information; the reasons MFS chooses to share; and whether you can limit this sharing. |
| | | | |
Reasons we can share your
personal information | | Does MFS
share? | | Can you limit
this sharing? |
For our everyday business purposes – such as to process your transactions, maintain your account(s), respond to court orders and legal investigations, or report to credit bureaus | | Yes | | No |
For our marketing purposes – to offer our products and services to you | | No | | We don’t share |
For joint marketing with other financial companies | | No | | We don’t share |
For our affiliates’ everyday business purposes – information about your transactions and experiences | | No | | We don’t share |
For our affiliates’ everyday business purposes – information about your creditworthiness | | No | | We don’t share |
| For nonaffiliates to market to you | | No | | We don’t share |
| | |
| Questions? | | Call 800-225-2606 or go to mfs.com. |
61
| | |
| Who we are |
| Who is providing this notice? | | MFS Funds, MFS Investment Management, MFS Institutional Advisors, Inc., and MFS Heritage Trust Company. |
| | |
| What we do |
| How does MFS protect my personal information? | | To protect your personal information from unauthorized access and use, we use security measures that comply with federal law. These measures include procedural, electronic, and physical safeguards for the protection of the personal information we collect about you. |
| How does MFS collect my personal information? | | We collect your personal information, for example, when you • open an account or provide account information • direct us to buy securities or direct us to sell your securities • make a wire transfer We also collect your personal information from others, such as credit bureaus, affiliates, or other companies. |
| Why can’t I limit all sharing? | | Federal law gives you the right to limit only • sharing for affiliates’ everyday business purposes – information about your creditworthiness • affiliates from using your information to market to you • sharing for nonaffiliates to market to you State laws and individual companies may give you additional rights to limit sharing. |
| | |
| Definitions |
| Affiliates | | Companies related by common ownership or control. They can be financial and nonfinancial companies. • MFS does not share personal information with affiliates, except for everyday business purposes as described on page one of this notice. |
| Nonaffiliates | | Companies not related by common ownership or control. They can be financial and nonfinancial companies. • MFS does not share with nonaffiliates so they can market to you. |
| Joint marketing | | A formal agreement between nonaffiliated financial companies that together market financial products or services to you. • MFS doesn’t jointly market. |
| | |
| Other important information |
| If you own an MFS product or receive an MFS service in the name of a third party such as a bank or broker-dealer, their privacy policy may apply to you instead of ours. |
62
Save paper with eDelivery.

| MFS® will send you prospectuses, |
reports, and proxies directly via e-mail so you will get information faster with less mailbox clutter.
To sign up:
1. Go to mfs.com.
2. Log in via MFS® Access.
3. Select eDelivery.
If you own your MFS fund shares through a financial institution or a retirement plan, MFS® TALK, MFS® Access, or eDelivery may not be available to you.
CONTACT
WEB SITE
mfs.com
MFS TALK
1-800-637-8255
24 hours a day
ACCOUNT SERVICE AND LITERATURE
Shareholders
1-800-225-2606
Financial advisors
1-800-343-2829
Retirement plan services
1-800-637-1255
MAILING ADDRESS
MFS Service Center, Inc.
P.O. Box 55824
Boston, MA 02205-5824
OVERNIGHT MAIL
MFS Service Center, Inc.
c/o Boston Financial Data Services
30 Dan Road
Canton, MA 02021-2809
ANNUAL REPORT
August 31, 2017

MFS® LOW VOLATILITY GLOBAL EQUITY FUND

LVO-ANN
MFS® LOW VOLATILITY GLOBAL EQUITY FUND
CONTENTS
The report is prepared for the general information of shareholders.
It is authorized for distribution to prospective investors only when preceded or accompanied by a current prospectus.
NOT FDIC INSURED • MAY LOSE VALUE • NO BANK GUARANTEE

LETTER FROM THE EXECUTIVE CHAIRMAN
Dear Shareholders:
Despite policy uncertainty accompanying a new presidential administration in the United States and unease over ongoing Brexit negotiations, most markets have proved
resilient. U.S. share prices have reached new highs in recent months although the U.S. Federal Reserve has continued to gradually hike interest rates. However, rates in most developed markets remain very low, with major non-U.S. central banks just beginning to contemplate curbing accommodative monetary policies.
Globally, we’ve experienced a year-long synchronized upturn in economic growth. Despite better growth, there are few immediate signs of worrisome inflation amid muted wage gains around the world. Europe has benefited from diminishing event risks as populist challengers fell short of upsetting establishment
candidates in both the Dutch and French elections. Emerging market economies have been boosted in part by a weaker U.S. dollar and are recovering despite lingering concerns over the potential for restrictive U.S. trade policies that could hamper global trade growth. Looking ahead, markets will have to contend with issues involving geopolitical hot spots on the Korean peninsula and in the Middle East.
At MFS®, we believe time is an asset. A patient, long-term approach to investing can have a powerful impact on decision making and outcomes. Time arbitrage, as we call it, comes down to having the conviction and discipline to allow enough time for good investment ideas to play out. In our view, such an approach, along with the professional guidance of a financial advisor, will help you reach your investment objectives.
Respectfully,

Robert J. Manning
Executive Chairman
MFS Investment Management
October 17, 2017
The opinions expressed in this letter are subject to change and may not be relied upon for investment advice. No forecasts can be guaranteed.
1
PORTFOLIO COMPOSITION
Portfolio structure
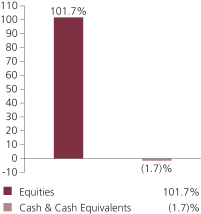
| | | | |
| Top ten holdings | | | | |
| Taiwan Semiconductor Manufacturing Co. Ltd., ADR | | | 3.5% | |
| Johnson & Johnson | | | 2.9% | |
| Roche Holding AG | | | 2.4% | |
| Fisher & Paykel Healthcare Corp. Ltd. | | | 2.4% | |
| Integra LifeSciences Holdings Corp. | | | 2.2% | |
| Terumo Corp. | | | 2.0% | |
| McDonald’s Corp. | | | 2.0% | |
| Ross Stores, Inc. | | | 1.9% | |
| Validus Holdings Ltd. | | | 1.9% | |
| Lockheed Martin Corp. | | | 1.9% | |
| | | | |
| Equity sectors | | | | |
| Financial Services | | | 18.0% | |
| Utilities & Communications | | | 17.6% | |
| Health Care | | | 15.9% | |
| Consumer Staples | | | 13.5% | |
| Technology | | | 11.7% | |
| Retailing | | | 8.6% | |
| Leisure | | | 3.6% | |
| Autos & Housing | | | 2.9% | |
| Basic Materials | | | 2.7% | |
| Industrial Goods & Services | | | 2.7% | |
| Energy | | | 2.6% | |
| Special Products & Services | | | 1.1% | |
| Transportation | | | 0.8% | |
|
| Issuer country weightings (x) | |
| United States | | | 47.3% | |
| Japan | | | 11.0% | |
| Canada | | | 7.9% | |
| Switzerland | | | 7.2% | |
| Hong Kong | | | 4.4% | |
| Taiwan | | | 3.5% | |
| United Kingdom | | | 3.4% | |
| Germany | | | 2.6% | |
| New Zealand | | | 2.4% | |
| Other Countries | | | 10.3% | |
2
Portfolio Composition – continued
| | | | |
|
| Currency exposure weightings (y) | |
| United States Dollar | | | 56.7% | |
| Japanese Yen | | | 11.0% | |
| Swiss Franc | | | 7.2% | |
| Euro | | | 4.2% | |
| Taiwan Dollar | | | 3.5% | |
| Hong Kong Dollar | | | 3.4% | |
| British Pound Sterling | | | 3.4% | |
| New Zealand Dollar | | | 2.4% | |
| Israeli Shekel | | | 1.6% | |
| Other Currencies | | | 6.6% | |
| (x) | Represents the portfolio’s exposure to issuer countries as a percentage of a portfolio’s net assets. For purposes of this presentation, United States includes Cash & Cash Equivalents. |
| (y) | Represents the portfolio’s exposure to a particular currency as a percentage of a portfolio’s net assets. For purposes of this presentation, United States Dollar includes Cash & Cash Equivalents. |
Cash & Cash Equivalents includes any cash, investments in money market funds, short-term securities, and other assets less liabilities. Please see the Statement of Assets and Liabilities for additional information related to the fund’s cash position and other assets and liabilities.
From time to time Cash & Cash Equivalents may be negative due to timing of cash receipts.
Percentages are based on net assets as of August 31, 2017.
The portfolio is actively managed and current holdings may be different.
3
MANAGEMENT REVIEW
Summary of Results
For the twelve months ended August 31, 2017, Class A shares of the MFS Low Volatility Global Equity Fund (“fund”) provided a total return of 9.28%, at net asset value. This compares with a return of 17.11% for the fund’s benchmark, the MSCI All Country World Index (net div).
Market Environment
For the first time in many years, the global economy is experiencing a period of synchronized economic growth. The rebound in emerging markets (“EM”) economies has been more pronounced (despite the deceleration in Chinese growth at the end of the period), helped by larger economies such as Brazil and Russia emerging from recessions. At the same time, developed markets (“DM”) economies continued to grow at or above potential. Market confidence increased in the US after the presidential elections in November in anticipation of lower taxes, a lighter regulatory burden and increased infrastructure spending, boosting US equities and corporate bond performance. Though hopes have largely faded for pro-growth US policies, market confidence persists. Globally, markets benefited from a reflation trade during the first half of the period as commodity prices strengthened, activity and growth prospects improved, and inflation moved higher, though within moderate bounds. While this bump in global inflation faded in the second half of the period as commodity prices, particularly oil, leveled off or declined, global growth remained relatively resilient. As a result, there have been more tightening signals and actions by DM central banks. The US Federal Reserve increased interest rates by 25 basis points during the second half of the period, bringing the total number of quarter-percent hikes in the federal funds rate to four since December 2015. The European Central Bank appears set to announce tapering of quantitative easing in the fall of 2017. The Bank of England may also begin reducing monetary accommodation. Markets have been comforted, along with central banks, by the decline in fears of a populist surge in Europe after establishment candidates won the Dutch and French elections. European growth has reflected the calmer political economic backdrop.
In recent months, the US dollar reversed the sharp rise seen early in the period, easing what had been a substantial headwind to earnings for multinationals. US consumer spending held up well during the second half of the period amid a modest increase in real wages and relatively low gasoline prices. Demand for autos reached near-record territory in the first half of the period before tapering off at the end of the period, while the housing market continued its recovery amid relatively low mortgage rates and tight inventories. Global trade, which was sluggish early in the period, showed signs of improvement in the period’s second half, a positive indicator of global economic activity and prospects. Early in the period, the US election resulted in a sell-off in EM assets due to fears that President Trump would follow through on various campaign threats and promises that were judged to be detrimental to EM. While President Trump withdrew the US from the Trans-Pacific Partnership and began the renegotiation of the North American Free Trade Agreement, significant additional policy action has so far been lacking on economic issues involving EM. As a result,
4
Management Review – continued
emerging markets resumed their upward trajectory, powered by strong inflows throughout the first half of 2017.
Detractors from Performance
Stock selection and, to a lesser extent, the fund’s overweight position in the consumer staples sector detracted from performance relative to the MSCI All Country World Index. The fund’s overweight positions in global food company General Mills and instant noodle and food products company Toyo Suisan Kaisha (Japan) hindered relative results. Shares of General Mills declined after the company lowered its full year 2018 earnings guidance.
Weak security selection and, to a lesser extent, the fund’s underweight position in the financial services sector also detracted from relative performance. Here, holdings of insurance provider Validus (b) held back relative results.
Security selection and, to a lesser extent, the fund’s overweight position in the retailing sector further detracted from relative performance. The fund’s overweight positions in apparel and footwear producer ABC-Mart (Japan), apparel retailer Ross Stores and convenience store chain Lawson (Japan) weakened relative results. Although ABC-Mart’s reported fiscal year 2017 results were in line with expectations, the stock came under pressure as investors appeared to have been disappointed by management’s conservative earnings guidance for the year ahead.
An underweight position and security selection in the technology sector hurt relative results. Within this sector, not holding shares of strong-performing computer and personal electronics maker Apple held back relative performance.
Other top relative detractors for the period included the fund’s overweight positions in motor vehicle manufacturer Kia Motors (South Korea), telecommunications company KDDI (Japan) and pharmaceutical company Express Scripts.
During the reporting period, the fund’s currency exposure, resulting primarily from differences between the fund’s and the benchmark’s exposures to holdings of securities denominated in foreign currencies, also detracted from relative results. All of MFS’ investment decisions are driven by the fundamentals of each individual opportunity and as such, it is common for our portfolios to have different currency exposure than the benchmark.
Contributors to Performance
Security selection in the leisure sector contributed to relative performance. The fund’s overweight positions in fast food restaurant McDonald’s and broadband provider Charter Communications bolstered relative results. Shares of McDonald’s rose after the company reported strong earnings results attributed to better-than-expected same-store sales, both in the domestic and international markets. Restaurant-level margins also increased as food, paper and labor costs were all lower than projected.
Other top relative contributors for the period included the fund’s overweight positions in integrated circuits manufacturer Taiwan Semiconductor (Taiwan), digital media solutions provider Adobe Systems, biochemical product producer PTT Global Chemical (Thailand), insurance company Swiss Life Holding (Switzerland), investment banking services provider DBS Group (h) (Singapore), aerospace company Lockheed Martin and
5
Management Review – continued
financial services company Credicorp (Peru). Shares of Taiwan Semiconductor Manufacturing rose as the company’s revenues exceeded company guidance and consensus analyst estimates. Management also reported favorable forward-looking guidance for the second half of 2017, which further benefited the stock. Not owning shares of poor-performing diversified industrial conglomerate General Electric was another area of relative strength over the reporting period.
Respectfully,
Portfolio Manager(s)
Jim Fallon, Matt Krummell, Jonathan Sage, and Jed Stocks
| (b) | Security is not a benchmark constituent. |
| (h) | Security was not held in the portfolio at period end. |
The views expressed in this report are those of the portfolio manager(s) only through the end of the period of the report as stated on the cover and do not necessarily reflect the views of MFS or any other person in the MFS organization. These views are subject to change at any time based on market or other conditions, and MFS disclaims any responsibility to update such views. These views may not be relied upon as investment advice or an indication of trading intent on behalf of any MFS portfolio. References to specific securities are not recommendations of such securities, and may not be representative of any MFS portfolio’s current or future investments.
6
PERFORMANCE SUMMARY THROUGH 8/31/17
The following chart illustrates a representative class of the fund’s historical performance in comparison to its benchmark(s). Performance results include the deduction of the maximum applicable sales charge and reflect the percentage change in net asset value, including reinvestment of dividends and capital gains distributions. The performance of other share classes will be greater than or less than that of the class depicted below. Benchmarks are unmanaged and may not be invested in directly. Benchmark returns do not reflect sales charges, commissions or expenses. (See Notes to Performance Summary.)
Performance data shown represents past performance and is no guarantee of future results. Investment return and principal value fluctuate so your shares, when sold, may be worth more or less than the original cost; current performance may be lower or higher than quoted. The performance shown does not reflect the deduction of taxes, if any, that a shareholder would pay on fund distributions or the redemption of fund shares.
Growth of a Hypothetical $10,000 Investment (t)
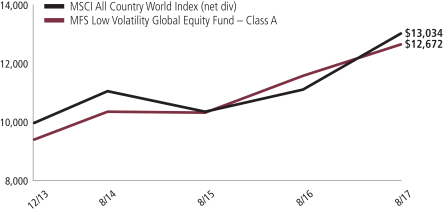
7
Performance Summary – continued
Total Returns through 8/31/17
Average annual without sales charge
| | | | | | | | | | |
| | | Share Class | | Class Inception Date | | 1-yr | | Life (t) | | |
| | | A | | 12/05/13 | | 9.28% | | 8.24% | | |
| | | B | | 12/05/13 | | 8.48% | | 7.38% | | |
| | | C | | 12/05/13 | | 8.49% | | 7.38% | | |
| | | I | | 12/05/13 | | 9.59% | | 8.47% | | |
| | | R1 | | 12/05/13 | | 8.47% | | 7.38% | | |
| | | R2 | | 12/05/13 | | 8.94% | | 7.91% | | |
| | | R3 | | 12/05/13 | | 9.24% | | 8.19% | | |
| | | R4 | | 12/05/13 | | 9.58% | | 8.46% | | |
| | | R6 | | 12/05/13 | | 9.63% | | 8.49% | | |
| Comparative benchmark(s) | | | | | | |
| | | MSCI All Country World Index (net div) (f) | | 17.11% | | 7.34% | | |
| Average annual with sales charge | | | | | | |
| | | A
With Initial Sales Charge (5.75%) | | 3.00% | | 6.54% | | |
| | | B
With CDSC (Declining over six years from 4% to 0%) (v) | | 4.48% | | 6.71% | | |
| | | C
With CDSC (1% for 12 months) (v) | | 7.49% | | 7.38% | | |
CDSC – Contingent Deferred Sales Charge.
Class I, R1, R2, R3, R4, and R6 shares do not have a sales charge.
Effective August 26, 2016, Class R5 shares were renamed Class R6 shares.
| (f) | Source: FactSet Research Systems Inc. |
| (t) | For the period from the class inception date through the stated period end. (See Notes to Performance Summary.) |
| (v) | Assuming redemption at the end of the applicable period. |
Benchmark Definition(s)
MSCI All Country World Index (net div) – a market capitalization-weighted index that is designed to measure equity market performance in the global developed and emerging markets.
It is not possible to invest directly in an index.
Notes to Performance Summary
Average annual total return represents the average annual change in value for each share class for the periods presented. Life returns are presented where the share class has less than 10 years of performance history and represent the average annual total return from the class inception date to the stated period end date.
8
Performance Summary – continued
Performance results reflect any applicable expense subsidies and waivers in effect during the periods shown. Without such subsidies and waivers the fund’s performance results would be less favorable. Please see the prospectus and financial statements for complete details.
Performance results do not include adjustments made for financial reporting purposes in accordance with U.S. generally accepted accounting principles and may differ from amounts reported in the financial highlights.
From time to time the fund may receive proceeds from litigation settlements, without which performance would be lower.
9
EXPENSE TABLE
Fund expenses borne by the shareholders during the period, March 1, 2017 through August 31, 2017
As a shareholder of the fund, you incur two types of costs: (1) transaction costs, including sales charges (loads) on certain purchase or redemption payments, and (2) ongoing costs, including management fees; distribution and service (12b-1) fees; and other fund expenses. This example is intended to help you understand your ongoing costs (in dollars) of investing in the fund and to compare these costs with the ongoing costs of investing in other mutual funds.
The example is based on an investment of $1,000 invested at the beginning of the period and held for the entire period March 1, 2017 through August 31, 2017.
Actual Expenses
The first line for each share class in the following table provides information about actual account values and actual expenses. You may use the information in this line, together with the amount you invested, to estimate the expenses that you paid over the period. Simply divide your account value by $1,000 (for example, an $8,600 account value divided by $1,000 = 8.6), then multiply the result by the number in the first line under the heading entitled “Expenses Paid During Period” to estimate the expenses you paid on your account during this period.
Hypothetical Example for Comparison Purposes
The second line for each share class in the following table provides information about hypothetical account values and hypothetical expenses based on the fund’s actual expense ratio and an assumed rate of return of 5% per year before expenses, which is not the fund’s actual return. The hypothetical account values and expenses may not be used to estimate the actual ending account balance or expenses you paid for the period. You may use this information to compare the ongoing costs of investing in the fund and other funds. To do so, compare this 5% hypothetical example with the 5% hypothetical examples that appear in the shareholder reports of the other funds.
Please note that the expenses shown in the table are meant to highlight your ongoing costs only and do not reflect any transactional costs, such as sales charges (loads). Therefore, the second line for each share class in the table is useful in comparing ongoing costs only, and will not help you determine the relative total costs of owning different funds. In addition, if these transactional costs were included, your costs would have been higher.
10
Expense Table – continued
| | | | | | | | | | | | | | | | | | |
Share
Class | | | | Annualized
Expense
Ratio | | | Beginning
Account Value
3/01/17 | | | Ending Account Value
8/31/17 | | | Expenses Paid During
Period (p) 3/01/17-8/31/17 | |
| A | | Actual | | | 1.15% | | | | $1,000.00 | | | | $1,074.03 | | | | $6.01 | |
| | Hypothetical (h) | | | 1.15% | | | | $1,000.00 | | | | $1,019.41 | | | | $5.85 | |
| B | | Actual | | | 1.93% | | | | $1,000.00 | | | | $1,070.74 | | | | $10.07 | |
| | Hypothetical (h) | | | 1.93% | | | | $1,000.00 | | | | $1,015.48 | | | | $9.80 | |
| C | | Actual | | | 1.94% | | | | $1,000.00 | | | | $1,070.08 | | | | $10.12 | |
| | Hypothetical (h) | | | 1.94% | | | | $1,000.00 | | | | $1,015.43 | | | | $9.86 | |
| I | | Actual | | | 0.88% | | | | $1,000.00 | | | | $1,075.89 | | | | $4.60 | |
| | Hypothetical (h) | | | 0.88% | | | | $1,000.00 | | | | $1,020.77 | | | | $4.48 | |
| R1 | | Actual | | | 1.93% | | | | $1,000.00 | | | | $1,069.62 | | | | $10.07 | |
| | Hypothetical (h) | | | 1.93% | | | | $1,000.00 | | | | $1,015.48 | | | | $9.80 | |
| R2 | | Actual | | | 1.44% | | | | $1,000.00 | | | | $1,072.39 | | | | $7.52 | |
| | Hypothetical (h) | | | 1.44% | | | | $1,000.00 | | | | $1,017.95 | | | | $7.32 | |
| R3 | | Actual | | | 1.15% | | | | $1,000.00 | | | | $1,073.95 | | | | $6.01 | |
| | Hypothetical (h) | | | 1.15% | | | | $1,000.00 | | | | $1,019.41 | | | | $5.85 | |
| R4 | | Actual | | | 0.93% | | | | $1,000.00 | | | | $1,075.86 | | | | $4.87 | |
| | Hypothetical (h) | | | 0.93% | | | | $1,000.00 | | | | $1,020.52 | | | | $4.74 | |
| R6 | | Actual | | | 0.90% | | | | $1,000.00 | | | | $1,076.05 | | | | $4.71 | |
| | Hypothetical (h) | | �� | 0.90% | | | | $1,000.00 | | | | $1,020.67 | | | | $4.58 | |
| (h) | 5% class return per year before expenses. |
| (p) | “Expenses Paid During Period” are equal to each class’s annualized expense ratio, as shown above, multiplied by the average account value over the period, multiplied by 184/365 (to reflect the one-half year period). Expenses paid do not include any applicable sales charges (loads). If these transaction costs had been included, your costs would have been higher. |
Notes to Expense Table
Each class with a Rule 12b-1 service fee is subject to a rebate of a portion of such fee. Such rebates are included in the expense ratios above and are outside of the expense limitation arrangement. For Class A shares, this rebate reduced the expense ratio above by 0.04%. See Note 3 in the Notes to Financial Statements for additional information.
Changes to the fund’s fee arrangements occurred during the six month period. Had these fee changes been in effect throughout the entire six month period, the annualized expense ratios, the actual expenses paid during the period, and the hypothetical expenses paid during the period would have been approximately 0.92%, $4.81, and $4.69 for Class A, 1.71%, $8.93, and $8.69 for Class B, 1.71%, $8.92, and $8.69 for Class C, 0.71%, $3.71, and $3.62 for Class I, 1.71%, $8.92, and $8.69 for Class R1, 1.21%, $6.32, and $6.16 for Class R2, 0.96%, $5.02, and $4.89 for Class R3, 0.71%, $3.71, and $3.62 for Class R4, and 0.68%, $3.56, and $3.47 for Class R6, respectively. For further information about the fund’s fee arrangements and changes to those fee arrangements, please see Note 3 in the Notes to Financial Statements.
11
PORTFOLIO OF INVESTMENTS
8/31/17
The Portfolio of Investments is a complete list of all securities owned by your fund. It is categorized by broad-based asset classes.
| | | | | | | | |
| Common Stocks - 101.7% | | | | | | | | |
| Issuer | | Shares/Par | | | Value ($) | |
| Aerospace - 1.9% | | | | | | | | |
| Lockheed Martin Corp. | | | 10,949 | | | $ | 3,343,715 | |
| | |
| Alcoholic Beverages - 0.4% | | | | | | | | |
| Remy Cointreau S.A. | | | 6,353 | | | $ | 725,512 | |
| | |
| Apparel Manufacturers - 0.5% | | | | | | | | |
| Gildan Activewear, Inc. | | | 29,471 | | | $ | 922,442 | |
| | |
| Automotive - 2.3% | | | | | | | | |
| Kia Motors Corp. | | | 70,580 | | | $ | 2,218,926 | |
| USS Co. Ltd. | | | 95,000 | | | | 1,867,422 | |
| | | | | | | | |
| | | | | | | $ | 4,086,348 | |
| Business Services - 1.1% | | | | | | | | |
| Forrester Research, Inc. | | | 47,607 | | | $ | 1,939,985 | |
| | |
| Cable TV - 1.7% | | | | | | | | |
| Charter Communications, Inc., “A” (a) | | | 5,469 | | | $ | 2,179,615 | |
| Comcast Corp., “A” | | | 18,603 | | | | 755,468 | |
| | | | | | | | |
| | | | | | | $ | 2,935,083 | |
| Chemicals - 0.6% | | | | | | | | |
| Monsanto Co. | | | 9,246 | | | $ | 1,083,631 | |
| | |
| Computer Software - 1.6% | | | | | | | | |
| Adobe Systems, Inc. (a) | | | 18,746 | | | $ | 2,908,629 | |
| | |
| Computer Software - Systems - 1.6% | | | | | | | | |
| NICE Systems Ltd., ADR | | | 36,684 | | | $ | 2,869,423 | |
| | |
| Construction - 0.6% | | | | | | | | |
| Owens Corning | | | 14,589 | | | $ | 1,081,483 | |
| | |
| Consumer Products - 3.4% | | | | | | | | |
| Colgate-Palmolive Co. | | | 11,872 | | | $ | 850,510 | |
| Kimberly-Clark Corp. | | | 16,440 | | | | 2,026,888 | |
| L’Oréal | | | 3,484 | | | | 735,564 | |
| Procter & Gamble Co. | | | 25,944 | | | | 2,393,853 | |
| | | | | | | | |
| | | | | | | $ | 6,006,815 | |
12
Portfolio of Investments – continued
| | | | | | | | |
| Issuer | | Shares/Par | | | Value ($) | |
| Common Stocks - continued | | | | | | | | |
| Electronics - 5.0% | | | | | | | | |
| Kyocera Corp. | | | 44,900 | | | $ | 2,695,593 | |
| Taiwan Semiconductor Manufacturing Co. Ltd., ADR | | | 168,724 | | | | 6,237,726 | |
| | | | | | | | |
| | | | | | | $ | 8,933,319 | |
| Energy - Independent - 0.5% | | | | | | | | |
| Occidental Petroleum Corp. | | | 16,255 | | | $ | 970,424 | |
| | |
| Energy - Integrated - 2.0% | | | | | | | | |
| Exxon Mobil Corp. | | | 29,175 | | | $ | 2,226,928 | |
| Royal Dutch Shell PLC, “B” | | | 48,831 | | | | 1,364,213 | |
| | | | | | | | |
| | | | | | | $ | 3,591,141 | |
| Food & Beverages - 8.1% | | | | | | | | |
| General Mills, Inc. | | | 54,314 | | | $ | 2,892,764 | |
| Marine Harvest | | | 84,871 | | | | 1,685,835 | |
| Mondelez International, Inc. | | | 25,932 | | | | 1,054,395 | |
| Nestle S.A. | | | 38,426 | | | | 3,259,769 | |
| PepsiCo, Inc. | | | 9,510 | | | | 1,100,592 | |
| Pinnacle Foods, Inc. | | | 17,317 | | | | 1,027,071 | |
| Sligro Food Group N.V. | | | 29,141 | | | | 1,284,258 | |
| Toyo Suisan Kaisha Ltd. | | | 57,100 | | | | 2,111,352 | |
| | | | | | | | |
| | | | | | | $ | 14,416,036 | |
| Food & Drug Stores - 3.7% | | | | | | | | |
| CVS Health Corp. | | | 16,820 | | | $ | 1,300,859 | |
| Dairy Farm International Holdings Ltd. | | | 214,900 | | | | 1,740,690 | |
| Lawson, Inc. | | | 36,200 | | | | 2,433,420 | |
| METRO, Inc., “A” | | | 34,357 | | | | 1,134,090 | |
| | | | | | | | |
| | | | | | | $ | 6,609,059 | |
| Insurance - 7.3% | | | | | | | | |
| AXIS Capital Holdings Ltd. | | | 10,389 | | | $ | 625,833 | |
| Beazley PLC | | | 218,463 | | | | 1,443,548 | |
| Everest Re Group Ltd. | | | 3,326 | | | | 839,748 | |
| Intact Financial Corp. | | | 25,296 | | | | 2,085,261 | |
| Swiss Life Holding AG | | | 4,094 | | | | 1,465,208 | |
| Travelers Cos., Inc. | | | 7,577 | | | | 918,181 | |
| Validus Holdings Ltd. | | | 66,826 | | | | 3,351,324 | |
| XL Group Ltd. | | | 22,464 | | | | 920,125 | |
| Zurich Insurance Group AG | | | 4,336 | | | | 1,297,251 | |
| | | | | | | | |
| | | | | | | $ | 12,946,479 | |
13
Portfolio of Investments – continued
| | | | | | | | |
| Issuer | | Shares/Par | | | Value ($) | |
| Common Stocks - continued | | | | | | | | |
| Internet - 2.2% | | | | | | | | |
| Alphabet, Inc., “A” (a) | | | 1,351 | | | $ | 1,290,529 | |
| Facebook, Inc., “A” (a) | | | 14,942 | | | | 2,569,576 | |
| | | | | | | | |
| | | | | | | $ | 3,860,105 | |
| Machinery & Tools - 0.8% | | | | | | | | |
| Schindler Holding AG | | | 3,581 | | | $ | 767,024 | |
| Schindler Holding AG | | | 2,995 | | | | 629,326 | |
| | | | | | | | |
| | | | | | | $ | 1,396,350 | |
| Major Banks - 2.4% | | | | | | | | |
| Bank of Nova Scotia | | | 17,057 | | | $ | 1,059,922 | |
| HSBC Holdings PLC, ADR | | | 33,547 | | | | 1,623,675 | |
| Royal Bank of Canada | | | 20,994 | | | | 1,554,815 | |
| | | | | | | | |
| | | | | | | $ | 4,238,412 | |
| Medical & Health Technology & Services - 0.7% | | | | | | | | |
| Express Scripts Holding Co. (a) | | | 19,495 | | | $ | 1,224,676 | |
| | |
| Medical Equipment - 7.2% | | | | | | | | |
| Abbott Laboratories | | | 19,534 | | | $ | 995,062 | |
| Fisher & Paykel Healthcare Corp. Ltd. | | | 506,905 | | | | 4,283,782 | |
| Integra LifeSciences Holdings Corp. (a) | | | 78,084 | | | | 3,981,503 | |
| Terumo Corp. | | | 93,600 | | | | 3,618,502 | |
| | | | | | | | |
| | | | | | | $ | 12,878,849 | |
| Natural Gas - Distribution - 0.6% | | | | | | | | |
| Osaka Gas Co. Ltd. | | | 250,000 | | | $ | 978,078 | |
| | |
| Natural Gas - Pipeline - 1.2% | | | | | | | | |
| Enbridge, Inc. | | | 53,129 | | | $ | 2,124,629 | |
| | |
| Network & Telecom - 1.3% | | | | | | | | |
| VTech Holdings Ltd. | | | 168,500 | | | $ | 2,368,463 | |
| | |
| Other Banks & Diversified Financials - 3.4% | | | | | | | | |
| Banco de Oro Unibank, Inc. | | | 301,520 | | | $ | 748,939 | |
| Credicorp Ltd. | | | 9,896 | | | | 2,007,305 | |
| Discover Financial Services | | | 19,932 | | | | 1,174,991 | |
| Public Bank Berhad | | | 189,400 | | | | 914,672 | |
| Sydbank A.S. | | | 30,862 | | | | 1,203,881 | |
| | | | | | | | |
| | | | | | | $ | 6,049,788 | |
| Pharmaceuticals - 8.0% | | | | | | | | |
| Johnson & Johnson | | | 39,246 | | | $ | 5,194,993 | |
| Merck & Co., Inc. | | | 42,080 | | | | 2,687,229 | |
14
Portfolio of Investments – continued
| | | | | | | | |
| Issuer | | Shares/Par | | | Value ($) | |
| Common Stocks - continued | | | | | | | | |
| Pharmaceuticals - continued | | | | | | | | |
| Novartis AG | | | 13,338 | | | $ | 1,125,235 | |
| Pfizer, Inc. | | | 29,882 | | | | 1,013,597 | |
| Roche Holding AG | | | 17,020 | | | | 4,321,779 | |
| | | | | | | | |
| | | | | | | $ | 14,342,833 | |
| Railroad & Shipping - 0.8% | | | | | | | | |
| Canadian National Railway Co. | | | 18,374 | | | $ | 1,488,110 | |
| | |
| Real Estate - 4.9% | | | | | | | | |
| AvalonBay Communities, Inc., REIT | | | 14,606 | | | $ | 2,741,985 | |
| Grand City Properties S.A. | | | 139,126 | | | | 3,030,894 | |
| Public Storage, Inc., REIT | | | 6,074 | | | | 1,247,235 | |
| Starwood Property Trust, Inc., REIT | | | 35,620 | | | | 791,120 | |
| Store Capital Corp., REIT | | | 38,360 | | | | 973,577 | |
| | | | | | | | |
| | | | | | | $ | 8,784,811 | |
| Restaurants - 2.0% | | | | | | | | |
| McDonald’s Corp. | | | 21,862 | | | $ | 3,497,264 | |
| | |
| Specialty Chemicals - 2.1% | | | | | | | | |
| PTT Global Chemical PLC | | | 924,600 | | | $ | 2,130,158 | |
| Symrise AG | | | 23,154 | | | | 1,692,411 | |
| | | | | | | | |
| | | | | | | $ | 3,822,569 | |
| Specialty Stores - 4.4% | | | | | | | | |
| ABC-MART, Inc. | | | 59,900 | | | $ | 3,078,501 | |
| Home Depot, Inc. | | | 8,681 | | | | 1,301,022 | |
| Ross Stores, Inc. | | | 58,292 | | | | 3,407,167 | |
| | | | | | | | |
| | | | | | | $ | 7,786,690 | |
| Telecommunications - Wireless - 3.6% | | | | | | | | |
| KDDI Corp. | | | 105,600 | | | $ | 2,850,004 | |
| SBA Communications Corp., REIT (a) | | | 13,510 | | | | 2,074,461 | |
| Vodafone Group PLC | | | 541,467 | | | | 1,550,179 | |
| | | | | | | | |
| | | | | | | $ | 6,474,644 | |
| Telephone Services - 4.4% | | | | | | | | |
| BCE, Inc. | | | 16,440 | | | $ | 781,886 | |
| HKT Trust and HKT Ltd. | | | 908,000 | | | | 1,171,875 | |
| TDC A.S. | | | 194,625 | | | | 1,159,523 | |
| TELUS Corp. | | | 79,767 | | | | 2,885,970 | |
| Verizon Communications, Inc. | | | 38,833 | | | | 1,862,819 | |
| | | | | | | | |
| | | | | | | $ | 7,862,073 | |
15
Portfolio of Investments – continued
| | | | | | | | |
| Issuer | | Shares/Par | | | Value ($) | |
| Common Stocks - continued | | | | | | | | |
| Tobacco - 1.6% | | | | | | | | |
| Altria Group, Inc. | | | 35,883 | | | $ | 2,274,982 | |
| British American Tobacco | | | 63,700 | | | | 659,002 | |
| | | | | | | | |
| | | | | | | $ | 2,933,984 | |
| Utilities - Electric Power - 7.8% | | | | | | | | |
| Alliant Energy Corp. | | | 46,400 | | | $ | 1,983,136 | |
| American Electric Power Co., Inc. | | | 24,682 | | | | 1,817,336 | |
| CLP Holdings Ltd. | | | 237,000 | | | | 2,503,025 | |
| Duke Energy Corp. | | | 9,378 | | | | 818,699 | |
| PG&E Corp. | | | 37,881 | | | | 2,666,065 | |
| WEC Energy Group, Inc. | | | 28,076 | | | | 1,831,117 | |
| Xcel Energy, Inc. | | | 47,000 | | | | 2,326,500 | |
| | | | | | | | |
| | | | | | | $ | 13,945,878 | |
| Total Common Stocks (Identified Cost, $165,265,260) | | | | | | $ | 181,427,730 | |
| | |
| Investment Companies (h) - 1.1% | | | | | | | | |
| Money Market Funds - 1.1% | | | | | | | | |
MFS Institutional Money Market Portfolio, 1.11% (v)
(Identified Cost, $1,955,606) | | | 1,955,613 | | | $ | 1,955,613 | |
| | |
| Other Assets, Less Liabilities - (2.8)% | | | | | | | (5,034,015 | ) |
| Net Assets - 100.0% | | | | | | $ | 178,349,328 | |
| (a) | Non-income producing security. |
| (h) | An affiliated issuer may be considered one in which the fund owns 5% or more of the outstanding voting securities, or a company which is under common control. At period end, the aggregate values of the fund’s investments in affiliated issuers and in unaffiliated issuers were $1,955,613 and $181,427,730, respectively. |
| (v) | Affiliated issuer that is available only to investment companies managed by MFS. The rate quoted for the MFS Institutional Money Market Portfolio is the annualized seven-day yield of the fund at period end. |
The following abbreviations are used in this report and are defined:
| ADR | | American Depositary Receipt |
| PLC | | Public Limited Company |
| REIT | | Real Estate Investment Trust |
See Notes to Financial Statements
16
Financial Statements
STATEMENT OF ASSETS AND LIABILITIES
At 8/31/17
This statement represents your fund’s balance sheet, which details the assets and liabilities comprising the total value of the fund.
| | | | |
| Assets | | | | |
Investments in unaffiliated issuers, at value (identified cost, $165,265,260) | | | $181,427,730 | |
Investments in affiliated issuers, at value (identified cost, $1,955,606) | | | 1,955,613 | |
Foreign currency, at value (identified cost, $10,315) | | | 10,326 | |
Receivables for | | | | |
Fund shares sold | | | 568,305 | |
Interest and dividends | | | 484,967 | |
Receivable from investment adviser | | | 15,483 | |
Receivable from distributor | | | 360 | |
Other assets | | | 143 | |
Total assets | | | $184,462,927 | |
| Liabilities | | | | |
Payables for | | | | |
Investments purchased | | | $1,570,955 | |
Fund shares reacquired | | | 4,384,456 | |
Payable to affiliates | | | | |
Shareholder servicing costs | | | 8,475 | |
Payable for independent Trustees’ compensation | | | 13 | |
Deferred country tax expense payable | | | 42,608 | |
Accrued expenses and other liabilities | | | 107,092 | |
Total liabilities | | | $6,113,599 | |
Net assets | | | $178,349,328 | |
| Net assets consist of | | | | |
Paid-in capital | | | $163,441,774 | |
Unrealized appreciation (depreciation) (net of $42,608 deferred country tax) | | | 16,122,830 | |
Accumulated net realized gain (loss) | | | (2,151,853 | ) |
Undistributed net investment income | | | 936,577 | |
Net assets | | | $178,349,328 | |
Shares of beneficial interest outstanding | | | 13,920,943 | |
17
Statement of Assets and Liabilities – continued
| | | | | | | | | | | | |
| | | Net assets | | | Shares
outstanding | | | Net asset value
per share (a) | |
Class A | | | $9,214,916 | | | | 719,068 | | | | $12.82 | |
Class B | | | 349,695 | | | | 27,477 | | | | 12.73 | |
Class C | | | 1,923,593 | | | | 151,334 | | | | 12.71 | |
Class I | | | 97,951,592 | | | | 7,642,042 | | | | 12.82 | |
Class R1 | | | 67,832 | | | | 5,307 | | | | 12.78 | |
Class R2 | | | 60,937 | | | | 4,756 | | | | 12.81 | |
Class R3 | | | 150,621 | | | | 11,745 | | | | 12.82 | |
Class R4 | | | 61,542 | | | | 4,801 | | | | 12.82 | |
Class R6 | | | 68,568,600 | | | | 5,354,413 | | | | 12.81 | |
| (a) | Maximum offering price per share was equal to the net asset value per share for all share classes, except for Class A, for which the maximum offering price per share was $13.60 [100 / 94.25 x $12.82]. On sales of $50,000 or more, the maximum offering price of Class A shares is reduced. A contingent deferred sales charge may be imposed on redemptions of Class A, Class B, and Class C shares. Redemption price per share was equal to the net asset value per share for Classes I, R1, R2, R3, R4, and R6. |
See Notes to Financial Statements
18
Financial Statements
STATEMENT OF OPERATIONS
Year ended 8/31/17
This statement describes how much your fund earned in investment income and accrued in expenses. It also describes any gains and/or losses generated by fund operations.
| | | | |
| Net investment income (loss) | | | | |
Income | | | | |
Dividends | | | $3,088,960 | |
Dividends from affiliated issuers | | | 13,298 | |
Income on securities loaned | | | 804 | |
Interest | | | 41 | |
Foreign taxes withheld | | | (169,593 | ) |
Total investment income | | | $2,933,510 | |
Expenses | | | | |
Management fee | | | 683,050 | |
Distribution and service fees | | | 43,389 | |
Shareholder servicing costs | | | 27,938 | |
Administrative services fee | | | 26,725 | |
Independent Trustees’ compensation | | | 2,283 | |
Custodian fee | | | 42,498 | |
Shareholder communications | | | 20,453 | |
Audit and tax fees | | | 53,844 | |
Legal fees | | | 1,478 | |
Registration fees | | | 139,729 | |
Miscellaneous | | | 17,648 | |
Total expenses | | | $1,059,035 | |
Reduction of expenses by investment adviser and distributor | | | (33,526 | ) |
Net expenses | | | $1,025,509 | |
Net investment income (loss) | | | $1,908,001 | |
| Realized and unrealized gain (loss) | | | | |
Realized gain (loss) (identified cost basis) | | | | |
Unaffiliated issuers (net of $794 country tax) | | | $(332,723 | ) |
Affiliated issuers | | | 2,704 | |
Foreign currency | | | (12,483 | ) |
Net realized gain (loss) | | | $(342,502 | ) |
Change in unrealized appreciation (depreciation) | | | | |
Unaffiliated issuers (net of $41,008 increase in deferred country tax) | | | 10,190,016 | |
Affiliated issuers | | | 7 | |
Translation of assets and liabilities in foreign currencies | | | 2,990 | |
Net unrealized gain (loss) | | | $10,193,013 | |
Net realized and unrealized gain (loss) | | | $9,850,511 | |
Change in net assets from operations | | | $11,758,512 | |
See Notes to Financial Statements
19
Financial Statements
STATEMENTS OF CHANGES IN NET ASSETS
These statements describe the increases and/or decreases in net assets resulting from operations, any distributions, and any shareholder transactions.
| | | | | | | | |
| | | Year ended | |
| | | 8/31/17 | | | 8/31/16 | |
| Change in net assets | | | | | | |
| From operations | | | | | | | | |
Net investment income (loss) | | | $1,908,001 | | | | $885,961 | |
Net realized gain (loss) | | | (342,502 | ) | | | (893,725 | ) |
Net unrealized gain (loss) | | | 10,193,013 | | | | 6,082,464 | |
Change in net assets from operations | | | $11,758,512 | | | | $6,074,700 | |
| Distributions declared to shareholders | | | | | | | | |
From net investment income | | | $(1,436,284 | ) | | | $(882,213 | ) |
Change in net assets from fund share transactions | | | $101,951,299 | | | | $25,075,711 | |
Total change in net assets | | | $112,273,527 | | | | $30,268,198 | |
| Net assets | | | | | | | | |
At beginning of period | | | 66,075,801 | | | | 35,807,603 | |
At end of period (including undistributed net investment income of $936,577 and $173,978, respectively) | | | $178,349,328 | | | | $66,075,801 | |
See Notes to Financial Statements
20
Financial Statements
FINANCIAL HIGHLIGHTS
The financial highlights table is intended to help you understand the fund’s financial performance for the past 5 years (or life of a particular share class, if shorter). Certain information reflects financial results for a single fund share. The total returns in the table represent the rate that an investor would have earned (or lost) on an investment in the fund share class (assuming reinvestment of all distributions) held for the entire period.
| | | | | | | | | | | | | | | | |
| Class A | | Year ended | |
| | | 8/31/17 | | | 8/31/16 | | | 8/31/15 | | | 8/31/14 (c) | |
Net asset value, beginning of period | | | $11.87 | | | | $10.75 | | | | $10.92 | | | | $10.00 | |
| Income (loss) from investment operations | | | | | | | | | | | | | | | | |
Net investment income (loss) (d) | | | $0.19 | | | | $0.18 | | | | $0.19 | | | | $0.15 | |
Net realized and unrealized gain (loss) | | | 0.91 | | | | 1.11 | | | | (0.22 | ) | | | 0.86 | |
Total from investment operations | | | $1.10 | | | | $1.29 | | | | $(0.03 | ) | | | $1.01 | |
| Less distributions declared to shareholders | | | | | | | | | | | | | | | | |
From net investment income | | | $(0.15 | ) | | | $(0.17 | ) | | | $(0.12 | ) | | | $(0.09 | ) |
From net realized gain | | | — | | | | — | | | | (0.02 | ) | | | — | |
Total distributions declared to shareholders | | | $(0.15 | ) | | | $(0.17 | ) | | | $(0.14 | ) | | | $(0.09 | ) |
Net asset value, end of period (x) | | | $12.82 | | | | $11.87 | | | | $10.75 | | | | $10.92 | |
Total return (%) (r)(s)(t)(x) | | | 9.36 | | | | 12.12 | | | | (0.36 | ) | | | 10.13 | (n) |
Ratios (%) (to average net assets)
and Supplemental data: | | | | | | | | | | | | | | | | |
Expenses before expense reductions (f) | | | 1.23 | | | | 1.51 | | | | 1.88 | | | | 5.81 | (a) |
Expenses after expense reductions (f) | | | 1.17 | | | | 1.19 | | | | 1.23 | | | | 1.22 | (a) |
Net investment income (loss) | | | 1.55 | | | | 1.56 | | | | 1.65 | | | | 1.86 | (a) |
Portfolio turnover | | | 24 | | | | 28 | | | | 61 | | | | 28 | (n) |
Net assets at end of period (000 omitted) | | | $9,215 | | | | $7,473 | | | | $3,981 | | | | $800 | |
See Notes to Financial Statements
21
Financial Highlights – continued
| | | | | | | | | | | | | | | | |
| Class B | | Year ended | |
| | | 8/31/17 | | | 8/31/16 | | | 8/31/15 | | | 8/31/14 (c) | |
Net asset value, beginning of period | | | $11.79 | | | | $10.70 | | | | $10.91 | | | | $10.00 | |
| Income (loss) from investment operations | | | | | | | | | | | | | | | | |
Net investment income (loss) (d) | | | $0.09 | | | | $0.07 | | | | $0.08 | | | | $0.06 | |
Net realized and unrealized gain (loss) | | | 0.91 | | | | 1.12 | | | | (0.20 | ) | | | 0.89 | |
Total from investment operations | | | $1.00 | | | | $1.19 | | | | $(0.12 | ) | | | $0.95 | |
| Less distributions declared to shareholders | | | | | | | | | | | | | | | | |
From net investment income | | | $(0.06 | ) | | | $(0.10 | ) | | | $(0.07 | ) | | | $(0.04 | ) |
From net realized gain | | | — | | | | — | | | | (0.02 | ) | | | — | |
Total distributions declared to shareholders | | | $(0.06 | ) | | | $(0.10 | ) | | | $(0.09 | ) | | | $(0.04 | ) |
Net asset value, end of period (x) | | | $12.73 | | | | $11.79 | | | | $10.70 | | | | $10.91 | |
Total return (%) (r)(s)(t)(x) | | | 8.48 | | | | 11.16 | | | | (1.16 | ) | | | 9.50 | (n) |
Ratios (%) (to average net assets)
and Supplemental data: | | | | | | | | | | | | | | | | |
Expenses before expense reductions (f) | | | 1.98 | | | | 2.33 | | | | 2.68 | | | | 6.87 | (a) |
Expenses after expense reductions (f) | | | 1.96 | | | | 1.98 | | | | 2.01 | | | | 2.07 | (a) |
Net investment income (loss) | | | 0.73 | | | | 0.65 | | | | 0.74 | | | | 0.80 | (a) |
Portfolio turnover | | | 24 | | | | 28 | | | | 61 | | | | 28 | (n) |
Net assets at end of period (000 omitted) | | | $350 | | | | $341 | | | | $446 | | | | $116 | |
| |
| Class C | | Year ended | |
| | | 8/31/17 | | | 8/31/16 | | | 8/31/15 | | | 8/31/14 (c) | |
Net asset value, beginning of period | | | $11.78 | | | | $10.69 | | | | $10.91 | | | | $10.00 | |
| Income (loss) from investment operations | | | | | | | | | | | | | | | | |
Net investment income (loss) (d) | | | $0.09 | | | | $0.08 | | | | $0.10 | | | | $0.06 | |
Net realized and unrealized gain (loss) | | | 0.91 | | | | 1.11 | | | | (0.23 | ) | | | 0.89 | |
Total from investment operations | | | $1.00 | | | | $1.19 | | | | $(0.13 | ) | | | $0.95 | |
| Less distributions declared to shareholders | | | | | | | | | | | | | | | | |
From net investment income | | | $(0.07 | ) | | | $(0.10 | ) | | | $(0.07 | ) | | | $(0.04 | ) |
From net realized gain | | | — | | | | — | | | | (0.02 | ) | | | — | |
Total distributions declared to shareholders | | | $(0.07 | ) | | | $(0.10 | ) | | | $(0.09 | ) | | | $(0.04 | ) |
Net asset value, end of period (x) | | | $12.71 | | | | $11.78 | | | | $10.69 | | | | $10.91 | |
Total return (%) (r)(s)(t)(x) | | | 8.49 | | | | 11.22 | | | | (1.23 | ) | | | 9.50 | (n) |
Ratios (%) (to average net assets)
and Supplemental data: | | | | | | | | | | | | | | | | |
Expenses before expense reductions (f) | | | 1.98 | | | | 2.23 | | | | 2.66 | | | | 6.85 | (a) |
Expenses after expense reductions (f) | | | 1.96 | | | | 1.99 | | | | 2.00 | | | | 2.07 | (a) |
Net investment income (loss) | | | 0.76 | | | | 0.74 | | | | 0.89 | | | | 0.82 | (a) |
Portfolio turnover | | | 24 | | | | 28 | | | | 61 | | | | 28 | (n) |
Net assets at end of period (000 omitted) | | | $1,924 | | | | $1,554 | | | | $453 | | | | $130 | |
See Notes to Financial Statements
22
Financial Highlights – continued
| | | | | | | | | | | | | | | | |
| Class I | | Year ended | |
| | | 8/31/17 | | | 8/31/16 | | | 8/31/15 | | | 8/31/14 (c) | |
Net asset value, beginning of period | | | $11.87 | | | | $10.76 | | | | $10.93 | | | | $10.00 | |
| Income (loss) from investment operations | | | | | | | | | | | | | | | | |
Net investment income (loss) (d) | | | $0.23 | | | | $0.21 | | | | $0.24 | | | | $0.14 | |
Net realized and unrealized gain (loss) | | | 0.90 | | | | 1.10 | | | | (0.25 | ) | | | 0.89 | |
Total from investment operations | | | $1.13 | | | | $1.31 | | | | $(0.01 | ) | | | $1.03 | |
| Less distributions declared to shareholders | | | | | | | | | | | | | | | | |
From net investment income | | | $(0.18 | ) | | | $(0.20 | ) | | | $(0.14 | ) | | | $(0.10 | ) |
From net realized gain | | | — | | | | — | | | | (0.02 | ) | | | — | |
Total distributions declared to shareholders | | | $(0.18 | ) | | | $(0.20 | ) | | | $(0.16 | ) | | | $(0.10 | ) |
Net asset value, end of period (x) | | | $12.82 | | | | $11.87 | | | | $10.76 | | | | $10.93 | |
Total return (%) (r)(s)(t)(x) | | | 9.59 | | | | 12.34 | | | | (0.18 | ) | | | 10.29 | (n) |
Ratios (%) (to average net assets)
and Supplemental data: | | | | | | | | | | | | | | | | |
Expenses before expense reductions (f) | | | 0.94 | | | | 1.17 | | | | 1.63 | | | | 5.85 | (a) |
Expenses after expense reductions (f) | | | 0.90 | | | | 0.98 | | | | 1.00 | | | | 1.07 | (a) |
Net investment income (loss) | | | 1.87 | | | | 1.86 | | | | 2.10 | | | | 1.81 | (a) |
Portfolio turnover | | | 24 | | | | 28 | | | | 61 | | | | 28 | (n) |
Net assets at end of period (000 omitted) | | | $97,952 | | | | $10,669 | | | | $2,685 | | | | $138 | |
| |
| Class R1 | | Year ended | |
| | | 8/31/17 | | | 8/31/16 | | | 8/31/15 | | | 8/31/14 (c) | |
Net asset value, beginning of period | | | $11.84 | | | | $10.70 | | | | $10.91 | | | | $10.00 | |
| Income (loss) from investment operations | | | | | | | | | | | | | | | | |
Net investment income (loss) (d) | | | $0.09 | | | | $0.08 | | | | $0.07 | | | | $0.06 | |
Net realized and unrealized gain (loss) | | | 0.91 | | | | 1.12 | | | | (0.19 | ) | | | 0.89 | |
Total from investment operations | | | $1.00 | | | | $1.20 | | | | $(0.12 | ) | | | $0.95 | |
| Less distributions declared to shareholders | | | | | | | | | | | | | | | | |
From net investment income | | | $(0.06 | ) | | | $(0.06 | ) | | | $(0.07 | ) | | | $(0.04 | ) |
From net realized gain | | | — | | | | — | | | | (0.02 | ) | | | — | |
Total distributions declared to shareholders | | | $(0.06 | ) | | | $(0.06 | ) | | | $(0.09 | ) | | | $(0.04 | ) |
Net asset value, end of period (x) | | | $12.78 | | | | $11.84 | | | | $10.70 | | | | $10.91 | |
Total return (%) (r)(s)(t)(x) | | | 8.47 | | | | 11.24 | | | | (1.22 | ) | | | 9.50 | (n) |
Ratios (%) (to average net assets)
and Supplemental data: | | | | | | | | | | | | | | | | |
Expenses before expense reductions (f) | | | 1.98 | | | | 2.31 | | | | 2.69 | | | | 6.89 | (a) |
Expenses after expense reductions (f) | | | 1.96 | | | | 1.99 | | | | 2.01 | | | | 2.07 | (a) |
Net investment income (loss) | | | 0.75 | | | | 0.69 | | | | 0.66 | | | | 0.79 | (a) |
Portfolio turnover | | | 24 | | | | 28 | | | | 61 | | | | 28 | (n) |
Net assets at end of period (000 omitted) | | | $68 | | | | $56 | | | | $108 | | | | $109 | |
See Notes to Financial Statements
23
Financial Highlights – continued
| | | | | | | | | | | | | | | | |
| Class R2 | | Year ended | |
| | | 8/31/17 | | | 8/31/16 | | | 8/31/15 | | | 8/31/14 (c) | |
Net asset value, beginning of period | | | $11.87 | | | | $10.74 | | | | $10.92 | | | | $10.00 | |
| Income (loss) from investment operations | | | | | | | | | | | | | | | | |
Net investment income (loss) (d) | | | $0.15 | | | | $0.13 | | | | $0.13 | | | | $0.10 | |
Net realized and unrealized gain (loss) | | | 0.90 | | | | 1.13 | | | | (0.20 | ) | | | 0.89 | |
Total from investment operations | | | $1.05 | | | | $1.26 | | | | $(0.07 | ) | | | $0.99 | |
| Less distributions declared to shareholders | | | | | | | | | | | | | | | | |
From net investment income | | | $(0.11 | ) | | | $(0.13 | ) | | | $(0.09 | ) | | | $(0.07 | ) |
From net realized gain | | | — | | | | — | | | | (0.02 | ) | | | — | |
Total distributions declared to shareholders | | | $(0.11 | ) | | | $(0.13 | ) | | | $(0.11 | ) | | | $(0.07 | ) |
Net asset value, end of period (x) | | | $12.81 | | | | $11.87 | | | | $10.74 | | | | $10.92 | |
Total return (%) (r)(s)(t)(x) | | | 8.94 | | | | 11.83 | | | | (0.71 | ) | | | 9.89 | (n) |
Ratios (%) (to average net assets)
and Supplemental data: | | | | | | | | | | | | | | | | |
Expenses before expense reductions (f) | | | 1.49 | | | | 1.79 | | | | 2.19 | | | | 6.39 | (a) |
Expenses after expense reductions (f) | | | 1.47 | | | | 1.49 | | | | 1.51 | | | | 1.57 | (a) |
Net investment income (loss) | | | 1.24 | | | | 1.20 | | | | 1.16 | | | | 1.29 | (a) |
Portfolio turnover | | | 24 | | | | 28 | | | | 61 | | | | 28 | (n) |
Net assets at end of period (000 omitted) | | | $61 | | | | $72 | | | | $112 | | | | $110 | |
| |
| Class R3 | | Year ended | |
| | | 8/31/17 | | | 8/31/16 | | | 8/31/15 | | | 8/31/14 (c) | |
Net asset value, beginning of period | | | $11.88 | | | | $10.76 | | | | $10.92 | | | | $10.00 | |
| Income (loss) from investment operations | | | | | | | | | | | | | | | | |
Net investment income (loss) (d) | | | $0.19 | | | | $0.16 | | | | $0.16 | | | | $0.12 | |
Net realized and unrealized gain (loss) | | | 0.90 | | | | 1.12 | | | | (0.19 | ) | | | 0.88 | |
Total from investment operations | | | $1.09 | | | | $1.28 | | | | $(0.03 | ) | | | $1.00 | |
| Less distributions declared to shareholders | | | | | | | | | | | | | | | | |
From net investment income | | | $(0.15 | ) | | | $(0.16 | ) | | | $(0.11 | ) | | | $(0.08 | ) |
From net realized gain | �� | | — | | | | — | | | | (0.02 | ) | | | — | |
Total distributions declared to shareholders | | | $(0.15 | ) | | | $(0.16 | ) | | | $(0.13 | ) | | | $(0.08 | ) |
Net asset value, end of period (x) | | | $12.82 | | | | $11.88 | | | | $10.76 | | | | $10.92 | |
Total return (%) (r)(s)(t)(x) | | | 9.24 | | | | 12.05 | | | | (0.34 | ) | | | 10.04 | (n) |
Ratios (%) (to average net assets)
and Supplemental data: | | | | | | | | | | | | | | | | |
Expenses before expense reductions (f) | | | 1.21 | | | | 1.56 | | | | 1.94 | | | | 6.14 | (a) |
Expenses after expense reductions (f) | | | 1.18 | | | | 1.24 | | | | 1.26 | | | | 1.32 | (a) |
Net investment income (loss) | | | 1.55 | | | | 1.44 | | | | 1.41 | | | | 1.54 | (a) |
Portfolio turnover | | | 24 | | | | 28 | | | | 61 | | | | 28 | (n) |
Net assets at end of period (000 omitted) | | | $151 | | | | $56 | | | | $110 | | | | $110 | |
See Notes to Financial Statements
24
Financial Highlights – continued
| | | | | | | | | | | | | | | | |
| Class R4 | | Year ended | |
| | | 8/31/17 | | | 8/31/16 | | | 8/31/15 | | | 8/31/14 (c) | |
Net asset value, beginning of period | | | $11.87 | | | | $10.76 | | | | $10.93 | | | | $10.00 | |
| Income (loss) from investment operations | | | | | | | | | | | | | | | | |
Net investment income (loss) (d) | | | $0.21 | | | | $0.19 | | | | $0.19 | | | | $0.14 | |
Net realized and unrealized gain (loss) | | | 0.92 | | | | 1.12 | | | | (0.20 | ) | | | 0.89 | |
Total from investment operations | | | $1.13 | | | | $1.31 | | | | $(0.01 | ) | | | $1.03 | |
| Less distributions declared to shareholders | | | | | | | | | | | | | |
From net investment income | | | $(0.18 | ) | | | $(0.20 | ) | | | $(0.14 | ) | | | $(0.10 | ) |
From net realized gain | | | — | | | | — | | | | (0.02 | ) | | | — | |
Total distributions declared to shareholders | | | $(0.18 | ) | | | $(0.20 | ) | | | $(0.16 | ) | | | $(0.10 | ) |
Net asset value, end of period (x) | | | $12.82 | | | | $11.87 | | | | $10.76 | | | | $10.93 | |
Total return (%) (r)(s)(t)(x) | | | 9.58 | | | | 12.32 | | | | (0.18 | ) | | | 10.29 | (n) |
Ratios (%) (to average net assets)
and Supplemental data: | | | | | | | | | | | | | | | | |
Expenses before expense reductions (f) | | | 0.98 | | | | 1.31 | | | | 1.69 | | | | 5.89 | (a) |
Expenses after expense reductions (f) | | | 0.96 | | | | 0.99 | | | | 1.02 | | | | 1.07 | (a) |
Net investment income (loss) | | | 1.74 | | | | 1.69 | | | | 1.66 | | | | 1.79 | (a) |
Portfolio turnover | | | 24 | | | | 28 | | | | 61 | | | | 28 | (n) |
Net assets at end of period (000 omitted) | | | $62 | | | | $56 | | | | $110 | | | | $110 | |
| |
| Class R6 | | Year ended | |
| | | 8/31/17 | | | 8/31/16 | | | 8/31/15 | | | 8/31/14 (c) | |
Net asset value, beginning of period | | | $11.86 | | | | $10.76 | | | | $10.92 | | | | $10.00 | |
| Income (loss) from investment operations | | | | | | | | | | | | | | | | |
Net investment income (loss) (d) | | | $0.21 | | | | $0.20 | | | | $0.20 | | | | $0.14 | |
Net realized and unrealized gain (loss) | | | 0.92 | | | | 1.11 | | | | (0.20 | ) | | | 0.88 | |
Total from investment operations | | | $1.13 | | | | $1.31 | | | | $0.00 | | | | $1.02 | |
| Less distributions declared to shareholders | | | | | | | | | | | | | |
From net investment income | | | $(0.18 | ) | | | $(0.21 | ) | | | $(0.14 | ) | | | $(0.10 | ) |
From net realized gain | | | — | | | | — | | | | (0.02 | ) | | | — | |
Total distributions declared to shareholders | | | $(0.18 | ) | | | $(0.21 | ) | | | $(0.16 | ) | | | $(0.10 | ) |
Net asset value, end of period (x) | | | $12.81 | | | | $11.86 | | | | $10.76 | | | | $10.92 | |
Total return (%) (r)(s)(t)(x) | | | 9.63 | | | | 12.37 | | | | (0.09 | ) | | | 10.21 | (n) |
Ratios (%) (to average net assets)
and Supplemental data: | | | | | | | | | | | | | | | | |
Expenses before expense reductions (f) | | | 0.94 | | | | 1.21 | | | | 1.63 | | | | 5.88 | (a) |
Expenses after expense reductions (f) | | | 0.92 | | | | 0.93 | | | | 0.97 | | | | 1.06 | (a) |
Net investment income (loss) | | | 1.77 | | | | 1.76 | | | | 1.790 | | | | 1.80 | (a) |
Portfolio turnover | | | 24 | | | | 28 | | | | 61 | | | | 28 | (n) |
Net assets at end of period (000 omitted) | | | $68,569 | | | | $45,799 | | | | $27,802 | | | | $5,966 | |
See Notes to Financial Statements
25
Financial Highlights – continued
| (c) | For the period from the commencement of the fund’s investment operations, December 5, 2013, through the stated period end. |
| (d) | Per share data is based on average shares outstanding. |
| (f) | Ratios do not reflect reductions from fees paid indirectly, if applicable. |
| (r) | Certain expenses have been reduced without which performance would have been lower. |
| (s) | From time to time the fund may receive proceeds from litigation settlements, without which performance would be lower. |
| (t) | Total returns do not include any applicable sales charges. |
| (x) | The net asset values and total returns have been calculated on net assets which include adjustments made in accordance with U.S. generally accepted accounting principles required at period end for financial reporting purposes. |
See Notes to Financial Statements
26
NOTES TO FINANCIAL STATEMENTS
(1) Business and Organization
MFS Low Volatility Global Equity Fund (the fund) is a diversified series of MFS Series Trust I (the trust). The trust is organized as a Massachusetts business trust and is registered under the Investment Company Act of 1940, as amended, as an open-end management investment company.
The fund is an investment company and accordingly follows the investment company accounting and reporting guidance of the Financial Accounting Standards Board (FASB) Accounting Standards Codification Topic 946 Financial Services – Investment Companies.
(2) Significant Accounting Policies
General – The preparation of financial statements in conformity with U.S. generally accepted accounting principles requires management to make estimates and assumptions that affect the reported amounts of assets and liabilities, and disclosure of contingent assets and liabilities at the date of the financial statements and the reported amounts of increases and decreases in net assets from operations during the reporting period. Actual results could differ from those estimates. In the preparation of these financial statements, management has evaluated subsequent events occurring after the date of the fund’s Statement of Assets and Liabilities through the date that the financial statements were issued. The fund invests in foreign securities, including securities of emerging market issuers. Investments in foreign securities are vulnerable to the effects of changes in the relative values of the local currency and the U.S. dollar and to the effects of changes in each country’s legal, political, and economic environment. The markets of emerging markets countries are generally more volatile than the markets of developed countries with more mature economies. All of the risks of investing in foreign securities previously described are heightened when investing in emerging markets countries.
In October 2016, the Securities and Exchange Commission (SEC) released its Final Rule on Investment Company Reporting Modernization (the “Rule”). The Rule, which introduced two new regulatory reporting forms for investment companies – Form N-PORT and Form N-CEN – also contained amendments to Regulation S-X which impact financial statement presentation, particularly the presentation of derivative investments, for all reporting periods ending after August 1, 2017. The fund has adopted the Rule’s Regulation S-X amendments and believes that the fund’s financial statements are in compliance with those amendments.
Balance Sheet Offsetting – The fund’s accounting policy with respect to balance sheet offsetting is that, absent an event of default by the counterparty or a termination of the agreement, the International Swaps and Derivatives Association (ISDA) Master Agreement does not result in an offset of reported amounts of financial assets and financial liabilities in the Statement of Assets and Liabilities across transactions between the fund and the applicable counterparty. The fund’s right to setoff may be restricted or prohibited by the bankruptcy or insolvency laws of the particular jurisdiction to which a specific master netting agreement counterparty is subject. Balance sheet
27
Notes to Financial Statements – continued
offsetting disclosures, to the extent applicable to the fund, have been included in the fund’s Significant Accounting Policies note under the captions for each of the fund’s in-scope financial instruments and transactions.
Investment Valuations – Equity securities, including restricted equity securities, are generally valued at the last sale or official closing price on their primary market or exchange as provided by a third-party pricing service. Equity securities, for which there were no sales reported that day, are generally valued at the last quoted daily bid quotation on their primary market or exchange as provided by a third-party pricing service. Short-term instruments with a maturity at issuance of 60 days or less may be valued at amortized cost, which approximates market value. Open-end investment companies are generally valued at net asset value per share. Securities and other assets generally valued on the basis of information from a third-party pricing service may also be valued at a broker/dealer bid quotation. Values obtained from third-party pricing services can utilize both transaction data and market information such as yield, quality, coupon rate, maturity, type of issue, trading characteristics, and other market data. The values of foreign securities and other assets and liabilities expressed in foreign currencies are converted to U.S. dollars using the mean of bid and asked prices for rates provided by a third-party pricing service.
The Board of Trustees has delegated primary responsibility for determining or causing to be determined the value of the fund’s investments (including any fair valuation) to the adviser pursuant to valuation policies and procedures approved by the Board. If the adviser determines that reliable market quotations are not readily available, investments are valued at fair value as determined in good faith by the adviser in accordance with such procedures under the oversight of the Board of Trustees. Under the fund’s valuation policies and procedures, market quotations are not considered to be readily available for most types of debt instruments and floating rate loans and many types of derivatives. These investments are generally valued at fair value based on information from third-party pricing services. In addition, investments may be valued at fair value if the adviser determines that an investment’s value has been materially affected by events occurring after the close of the exchange or market on which the investment is principally traded (such as foreign exchange or market) and prior to the determination of the fund’s net asset value, or after the halting of trading of a specific security where trading does not resume prior to the close of the exchange or market on which the security is principally traded. Events that occur on a frequent basis after foreign markets close (such as developments in foreign markets and significant movements in the U.S. markets) and prior to the determination of the fund’s net asset value may be deemed to have a material effect on the value of securities traded in foreign markets. Accordingly, the fund’s foreign equity securities may often be valued at fair value. The adviser generally relies on third-party pricing services or other information (such as the correlation with price movements of similar securities in the same or other markets; the type, cost and investment characteristics of the security; the business and financial condition of the issuer; and trading and other market data) to assist in determining whether to fair value and at what value to fair value an investment. The value of an investment for purposes of calculating the fund’s net asset value can differ depending on the source and method used to determine value. When fair valuation is used, the value of an investment used to determine the fund’s net asset value may differ from
28
Notes to Financial Statements – continued
quoted or published prices for the same investment. There can be no assurance that the fund could obtain the fair value assigned to an investment if it were to sell the investment at the same time at which the fund determines its net asset value per share.
Various inputs are used in determining the value of the fund’s assets or liabilities. These inputs are categorized into three broad levels. In certain cases, the inputs used to measure fair value may fall into different levels of the fair value hierarchy. In such cases, an investment’s level within the fair value hierarchy is based on the lowest level of input that is significant to the fair value measurement. The fund’s assessment of the significance of a particular input to the fair value measurement in its entirety requires judgment, and considers factors specific to the investment. Level 1 includes unadjusted quoted prices in active markets for identical assets or liabilities. Level 2 includes other significant observable market-based inputs (including quoted prices for similar securities, interest rates, prepayment speed, and credit risk). Level 3 includes unobservable inputs, which may include the adviser’s own assumptions in determining the fair value of investments. The following is a summary of the levels used as of August 31, 2017 in valuing the fund’s assets or liabilities:
| | | | | | | | | | | | | | | | |
| Financial Instruments | | Level 1 | | | Level 2 | | | Level 3 | | | Total | |
| Equity Securities: | | | | | | | | | | | | | | | | |
United States | | | $87,538,662 | | | | $— | | | | $— | | | | $87,538,662 | |
Japan | | | 19,632,871 | | | | — | | | | — | | | | 19,632,871 | |
Canada | | | 11,951,866 | | | | 2,085,261 | | | | — | | | | 14,037,127 | |
Switzerland | | | 12,865,591 | | | | — | | | | — | | | | 12,865,591 | |
Hong Kong | | | 7,784,053 | | | | — | | | | — | | | | 7,784,053 | |
Taiwan | | | 6,237,726 | | | | — | | | | — | | | | 6,237,726 | |
United Kingdom | | | 5,981,615 | | | | — | | | | — | | | | 5,981,615 | |
Germany | | | 4,723,305 | | | | — | | | | — | | | | 4,723,305 | |
New Zealand | | | 4,283,782 | | | | — | | | | — | | | | 4,283,782 | |
Other Countries | | | 15,298,167 | | | | 3,044,830 | | | | — | | | | 18,342,997 | |
| Mutual Funds | | | 1,955,613 | | | | — | | | | — | | | | 1,955,613 | |
| Total | | | $178,253,252 | | | | $5,130,091 | | | | $— | | | | $183,383,343 | |
For further information regarding security characteristics, see the Portfolio of Investments.
Foreign Currency Translation – Purchases and sales of foreign investments, income, and expenses are converted into U.S. dollars based upon currency exchange rates prevailing on the respective dates of such transactions or on the reporting date for foreign denominated receivables and payables. Gains and losses attributable to foreign currency exchange rates on sales of securities are recorded for financial statement purposes as net realized gains and losses on investments. Gains and losses attributable to foreign exchange rate movements on receivables, payables, income and expenses are recorded for financial statement purposes as foreign currency transaction gains and losses. That portion of both realized and unrealized gains and losses on investments that results from fluctuations in foreign currency exchange rates is not separately disclosed.
Security Loans – Under its Securities Lending Agency Agreement with the fund, State Street Bank and Trust Company (“State Street”), as lending agent, loans the securities
29
Notes to Financial Statements – continued
of the fund to certain qualified institutions (the “Borrowers”) approved by the fund. Security loans can be terminated at the discretion of either the lending agent or the fund and the related securities must be returned within the earlier of the standard trade settlement period for such securities or within three business days. The loans are collateralized by cash and/or U.S. Treasury and federal agency obligations in an amount typically at least equal to the market value of the securities loaned. On loans collateralized by cash, the cash collateral is invested in a money market fund. The market value of the loaned securities is determined at the close of business of the fund and any additional required collateral is delivered to the fund on the next business day. State Street provides the fund with indemnification against Borrower default. In the event of Borrower default, State Street will, for the benefit of the fund, either purchase securities identical to those loaned or, when such purchase is commercially impracticable, pay the fund the market value of the loaned securities. In return, State Street assumes the fund’s rights to the related collateral. If the collateral value is less than the cost to purchase identical securities, State Street is responsible for the shortfall, but only to the extent that such shortfall is not due to a decline in collateral value resulting from collateral reinvestment for which the fund bears the risk of loss. A portion of the income generated upon investment of the collateral is remitted to the Borrowers, and the remainder is allocated between the fund and the lending agent. On loans collateralized by U.S. Treasury and/or federal agency obligations, a fee is received from the Borrower, and is allocated between the fund and the lending agent. Income from securities lending is separately reported in the Statement of Operations. The dividend and interest income earned on the securities loaned is accounted for in the same manner as other dividend and interest income. At August 31, 2017, there were no securities on loan or collateral outstanding.
Indemnifications – Under the fund’s organizational documents, its officers and Trustees may be indemnified against certain liabilities and expenses arising out of the performance of their duties to the fund. Additionally, in the normal course of business, the fund enters into agreements with service providers that may contain indemnification clauses. The fund’s maximum exposure under these agreements is unknown as this would involve future claims that may be made against the fund that have not yet occurred.
Investment Transactions and Income – Investment transactions are recorded on the trade date. Dividends received in cash are recorded on the ex-dividend date. Certain dividends from foreign securities will be recorded when the fund is informed of the dividend if such information is obtained subsequent to the ex-dividend date. Dividend payments received in additional securities are recorded on the ex-dividend date in an amount equal to the value of the security on such date.
The fund may receive proceeds from litigation settlements. Any proceeds received from litigation involving portfolio holdings are reflected in the Statement of Operations in realized gain/loss if the security has been disposed of by the fund or in unrealized gain/loss if the security is still held by the fund. Any other proceeds from litigation not related to portfolio holdings are reflected as other income in the Statement of Operations.
Tax Matters and Distributions – The fund intends to qualify as a regulated investment company, as defined under Subchapter M of the Internal Revenue Code,
30
Notes to Financial Statements – continued
and to distribute all of its taxable income, including realized capital gains. As a result, no provision for federal income tax is required. The fund’s federal tax returns, when filed, will remain subject to examination by the Internal Revenue Service for a three year period. Management has analyzed the fund’s tax positions taken on federal and state tax returns for all open tax years and does not believe that there are any uncertain tax positions that require recognition of a tax liability. Foreign taxes, if any, have been accrued by the fund in the accompanying financial statements in accordance with the applicable foreign tax law. Foreign income taxes may be withheld by certain countries in which the fund invests. Additionally, capital gains realized by the fund on securities issued in or by certain foreign countries may be subject to capital gains tax imposed by those countries.
Distributions to shareholders are recorded on the ex-dividend date. Income and capital gain distributions are determined in accordance with income tax regulations, which may differ from U.S. generally accepted accounting principles. Certain capital accounts in the financial statements are periodically adjusted for permanent differences in order to reflect their tax character. These adjustments have no impact on net assets or net asset value per share. Temporary differences which arise from recognizing certain items of income, expense, gain or loss in different periods for financial statement and tax purposes will reverse at some time in the future. Distributions in excess of net investment income or net realized gains are temporary overdistributions for financial statement purposes resulting from differences in the recognition or classification of income or distributions for financial statement and tax purposes.
Book/tax differences primarily relate to passive foreign investment companies and wash sale loss deferrals.
The tax character of distributions declared to shareholders for the last two fiscal years is as follows:
| | | | | | | | |
| | | Year ended
8/31/17 | | | Year ended
8/31/16 | |
| Ordinary income (including any short-term capital gains) | | | $1,436,284 | | | | $882,213 | |
The federal tax cost and the tax basis components of distributable earnings were as follows:
| | | | |
| As of 8/31/17 | | | |
| Cost of investments | | | $168,181,065 | |
| Gross appreciation | | | 17,010,644 | |
| Gross depreciation | | | (1,808,366 | ) |
| Net unrealized appreciation (depreciation) | | | $15,202,278 | |
| Undistributed ordinary income | | | 952,058 | |
| Capital loss carryforwards | | | (1,191,654 | ) |
| Other temporary differences | | | (55,128 | ) |
31
Notes to Financial Statements – continued
As of August 31, 2017, the fund had capital loss carryforwards available to offset future realized gains. These net capital losses may be carried forward indefinitely and their character is retained as short-term and/or long-term losses. Such losses are characterized as follows:
| | | | |
| Short-Term | | | $(970,650 | ) |
| Long-Term | | | (221,004 | ) |
| Total | | | $(1,191,654 | ) |
Multiple Classes of Shares of Beneficial Interest – The fund offers multiple classes of shares, which differ in their respective distribution and service fees. The fund’s income, realized and unrealized gain (loss) are allocated to shareholders based on the daily net assets of each class. Dividends are declared separately for each class. Differences in per share dividend rates are generally due to differences in separate class expenses. Class B shares will convert to Class A shares approximately eight years after purchase. The fund’s distributions declared to shareholders as reported in the Statements of Changes in Net Assets are presented by class as follows:
| | | | | | | | |
| | | From net investment
income | |
| | | Year
ended
8/31/17 | | | Year
ended
8/31/16 | |
| Class A | | | $102,130 | | | | $82,410 | |
| Class B | | | 1,407 | | | | 3,365 | |
| Class C | | | 10,810 | | | | 6,103 | |
| Class I | | | 588,856 | | | | 84,191 | |
| Class R1 | | | 288 | | | | 279 | |
| Class R2 | | | 665 | | | | 699 | |
| Class R3 | | | 901 | | | | 763 | |
| Class R4 | | | 834 | | | | 928 | |
| Class R6 | | | 730,393 | | | | 703,475 | |
| Total | | | $1,436,284 | | | | $882,213 | |
(3) Transactions with Affiliates
Investment Adviser – The fund has an investment advisory agreement with MFS to provide overall investment management and related administrative services and facilities to the fund. The management fee is computed daily and paid monthly at the following annual rates:
| | | | | | | | |
| | | Effective
Commencement
of Period | | | Effective
8/01/17 | |
| First $1 billion of average daily net assets | | | 0.65% | | | | 0.55% | |
| Next $1.5 billion of average daily net assets | | | 0.60% | | | | 0.525% | |
| Average daily net assets in excess of $2.5 billion | | | 0.55% | | | | 0.50% | |
MFS has agreed in writing to reduce its management fee by a specified amount if certain MFS mutual fund assets exceed thresholds agreed to by MFS and the fund’s Board of Trustees. For the year ended August 31, 2017, this management fee reduction amounted to $8,237, which is included in the reduction of total expenses in
32
Notes to Financial Statements – continued
the Statement of Operations. The management fee incurred for the year ended August 31, 2017 was equivalent to an annual effective rate of 0.63% of the fund’s average daily net assets.
The investment adviser had agreed in writing to pay a portion of the fund’s total annual operating expenses, excluding interest, taxes, extraordinary expenses, brokerage and transaction costs, and investment-related expenses, such that total fund operating expenses did not exceed the following rates annually of each class’s average daily net assets:
| | | | | | | | | | | | | | | | | | | | | | | | | | | | | | | | |
| Classes | |
| A | | B | | | C | | | I | | | R1 | | | R2 | | | R3 | | | R4 | | | R6 | |
| 1.24% | | | 1.99% | | | | 1.99% | | | | 0.99% | | | | 1.99% | | | | 1.49% | | | | 1.24% | | | | 0.99% | | | | 0.95% | |
This written agreement terminated on July 31, 2017. For the period September 1, 2016 through July 31, 2017, this reduction amounted to $93, which is included in the reduction of total expenses in the Statement of Operations. Effective August 1, 2017, the investment adviser has agreed in writing to pay a portion of the fund’s total annual operating expenses, excluding interest, taxes, extraordinary expenses, brokerage and transaction costs, and investment-related expenses, such that total fund operating expenses do not exceed the following rates annually of each class’s average daily net assets:
| | | | | | | | | | | | | | | | | | | | | | | | | | | | | | | | |
| Classes | |
| A | | B | | | C | | | I | | | R1 | | | R2 | | | R3 | | | R4 | | | R6 | |
| 0.99% | | | 1.74% | | | | 1.74% | | | | 0.74% | | | | 1.74% | | | | 1.24% | | | | 0.99% | | | | 0.74% | | | | 0.68% | |
This written agreement will continue until modified by the fund’s Board of Trustees, but such agreement will continue at least until December 31, 2018. For the period August 1, 2017 through August 31, 2017, this reduction amounted to $21,697, which is included in the reduction of total expenses in the Statement of Operations.
Distributor – MFS Fund Distributors, Inc. (MFD), a wholly-owned subsidiary of MFS, as distributor, received $9,516 for the year ended August 31, 2017, as its portion of the initial sales charge on sales of Class A shares of the fund.
The Board of Trustees has adopted a distribution plan for certain share classes pursuant to Rule 12b-1 of the Investment Company Act of 1940.
The fund’s distribution plan provides that the fund will pay MFD for services provided by MFD and financial intermediaries in connection with the distribution and servicing of certain share classes. One component of the plan is a distribution fee paid to MFD and another component of the plan is a service fee paid to MFD. MFD may subsequently pay all, or a portion, of the distribution and/or service fees to financial intermediaries.
33
Notes to Financial Statements – continued
Distribution Plan Fee Table:
| | | | | | | | | | | | | | | | | | | | |
| | | Distribution
Fee Rate (d) | | | Service
Fee Rate (d) | | | Total
Distribution
Plan (d) | | | Annual
Effective
Rate (e) | | | Distribution
and Service
Fee | |
| Class A | | | — | | | | 0.25% | | | | 0.25% | | | | 0.21% | | | | $20,311 | |
| Class B | | | 0.75% | | | | 0.25% | | | | 1.00% | | | | 1.00% | | | | 3,058 | |
| Class C | | | 0.75% | | | | 0.25% | | | | 1.00% | | | | 1.00% | | | | 18,903 | |
| Class R1 | | | 0.75% | | | | 0.25% | | | | 1.00% | | | | 1.00% | | | | 584 | |
| Class R2 | | | 0.25% | | | | 0.25% | | | | 0.50% | | | | 0.50% | | | | 342 | |
| Class R3 | | | — | | | | 0.25% | | | | 0.25% | | | | 0.25% | | | | 191 | |
| Total Distribution and Service Fees | | | | | | | | | | | | $43,389 | |
| (d) | In accordance with the distribution plan for certain classes, the fund pays distribution and/or service fees equal to these annual percentage rates of each class’s average daily net assets. The distribution and service fee rates disclosed by class represent the current rates in effect at the end of the reporting period. Any rate changes, if applicable, are detailed below. |
| (e) | The annual effective rates represent actual fees incurred under the distribution plan for the year ended August 31, 2017 based on each class’s average daily net assets. MFD has voluntarily agreed to rebate a portion of each class’s 0.25% service fee attributable to accounts for which MFD retains the 0.25% service fee except for accounts attributable to MFS or its affiliates’ seed money. For the year ended August 31, 2017, this rebate amounted to $3,495 and $4 for Class A and Class B, respectively, and is included in the reduction of total expenses in the Statement of Operations. |
Certain Class A shares are subject to a contingent deferred sales charge (CDSC) in the event of a shareholder redemption within 18 months of purchase. Class C shares are subject to a CDSC in the event of a shareholder redemption within 12 months of purchase. Class B shares are subject to a CDSC in the event of a shareholder redemption within six years of purchase. All contingent deferred sales charges are paid to MFD and during the year ended August 31, 2017, were as follows:
| | | | |
| | | Amount | |
| Class A | | | $4 | |
| Class B | | | 1,798 | |
| Class C | | | 1,109 | |
Shareholder Servicing Agent – MFS Service Center, Inc. (MFSC), a wholly-owned subsidiary of MFS, receives a fee from the fund for its services as shareholder servicing agent calculated as a percentage of the average daily net assets of the fund as determined periodically under the supervision of the fund’s Board of Trustees. For the year ended August 31, 2017, the fee was $6,416, which equated to 0.0060% annually of the fund’s average daily net assets. MFSC also receives payment from the fund for out-of-pocket expenses, sub-accounting and other shareholder servicing costs which may be paid to affiliated and unaffiliated service providers. Class R6 shares do not incur sub-accounting fees. For the year ended August 31, 2017, these out-of-pocket expenses, sub-accounting and other shareholder servicing costs amounted to $21,522.
Administrator – MFS provides certain financial, legal, shareholder communications, compliance, and other administrative services to the fund. Under an administrative services agreement, the fund reimburses MFS the costs incurred to provide these
34
Notes to Financial Statements – continued
services. The fund is charged an annual fixed amount of $17,500 plus a fee based on average daily net assets. The administrative services fee incurred for the year ended August 31, 2017 was equivalent to an annual effective rate of 0.0249% of the fund’s average daily net assets.
Trustees’ and Officers’ Compensation – The fund pays compensation to independent Trustees in the form of a retainer, attendance fees, and additional compensation to Board and Committee chairpersons. The fund does not pay compensation directly to Trustees or officers of the fund who are also officers of the investment adviser, all of whom receive remuneration for their services to the fund from MFS. Certain officers and Trustees of the fund are officers or directors of MFS, MFD, and MFSC.
Other – This fund and certain other funds managed by MFS (the funds) have entered into a service agreement (the ISO Agreement) which provides for payment of fees solely by the funds to Tarantino LLC in return for the provision of services of an Independent Senior Officer (ISO) for the funds. Frank L. Tarantino serves as the ISO and is an officer of the funds and the sole member of Tarantino LLC. The funds can terminate the ISO Agreement with Tarantino LLC at any time under the terms of the ISO Agreement. For the year ended August 31, 2017, the fee paid by the fund under this agreement was $180 and is included in “Miscellaneous” expense in the Statement of Operations. MFS has agreed to bear all expenses associated with office space, other administrative support, and supplies provided to the ISO.
The fund invests in the MFS Institutional Money Market Portfolio which is managed by MFS and seeks current income consistent with preservation of capital and liquidity. This money market fund does not pay a management fee to MFS.
On September 9, 2015, MFS redeemed 10,205, 5,442, 5,439, 10,229, 5,436, 5,504, 5,545, 5,584, and 52,729 shares of Class A, Class B, Class C, Class I, Class R1, Class R2, Class R3, Class R4, and Class R6 (formerly Class R5), respectively, for an aggregate amount of $1,123,336. On March 16, 2017, MFS purchased 2,133 shares of Class I for an aggregate amount of $25,873. On March 21, 2017, MFS purchased 412 shares of Class I for an aggregate amount of $4,989. On August 15, 2017, MFS redeemed 4,746 shares of Class C for an aggregate amount of $59,987.
At August 31, 2017, MFS held approximately 89%, 100%, and 100% of the outstanding shares of Class R1, Class R2, and Class R4, respectively.
(4) Portfolio Securities
For the year ended August 31, 2017, purchases and sales of investments other than short-term obligations, aggregated $132,037,629 and $24,930,321, respectively.
35
Notes to Financial Statements – continued
(5) Shares of Beneficial Interest
The fund’s Declaration of Trust permits the Trustees to issue an unlimited number of full and fractional shares of beneficial interest. Transactions in fund shares were as follows:
| | | | | | | | | | | | | | | | |
| | | Year ended
8/31/17 | | | Year ended
8/31/16 | |
| | | Shares | | | Amount | | | Shares | | | Amount | |
| Shares sold | | | | | | | | | | | | | | | | |
Class A | | | 235,619 | | | | $2,835,638 | | | | 352,011 | | | | $3,943,532 | |
Class B | | | 6,560 | | | | 79,744 | | | | 12,746 | | | | 140,632 | |
Class C | | | 76,350 | | | | 907,914 | | | | 102,284 | | | | 1,183,608 | |
Class I | | | 7,672,302 | | | | 93,687,604 | | | | 755,196 | | | | 8,502,164 | |
Class R1 | | | 586 | | | | 7,429 | | | | — | | | | — | |
Class R2 | | | 181 | | | | 2,100 | | | | 1,057 | | | | 12,124 | |
Class R3 | | | 6,957 | | | | 86,940 | | | | — | | | | — | |
Class R6 | | | 2,104,117 | | | | 26,035,765 | | | | 1,420,824 | | | | 15,709,877 | |
| | | 10,102,672 | | | | $123,643,134 | | | | 2,644,118 | | | | $29,491,937 | |
| | | | |
| Shares issued to shareholders in reinvestment of distributions | | | | | | | | | | | | | | | | |
Class A | | | 8,445 | | | | $102,071 | | | | 7,402 | | | | $82,410 | |
Class B | | | 116 | | | | 1,407 | | | | 310 | | | | 3,365 | |
Class C | | | 893 | | | | 10,751 | | | | 545 | | | | 6,065 | |
Class I | | | 41,894 | | | | 518,156 | | | | 7,364 | | | | 82,896 | |
Class R1 | | | 24 | | | | 288 | | | | 25 | | | | 279 | |
Class R2 | | | 55 | | | | 665 | | | | 63 | | | | 699 | |
Class R3 | | | 74 | | | | 901 | | | | 69 | | | | 763 | |
Class R4 | | | 69 | | | | 834 | | | | 84 | | | | 928 | |
Class R6 | | | 58,559 | | | | 706,049 | | | | 61,837 | | | | 682,663 | |
| | | 110,129 | | | | $1,341,122 | | | | 77,699 | | | | $860,068 | |
| | | | |
| Shares reacquired | | | | | | | | | | | | | | | | |
Class A | | | (154,676 | ) | | | $(1,860,946 | ) | | | (100,064 | ) | | | $(1,122,184 | ) |
Class B | | | (8,107 | ) | | | (95,574 | ) | | | (25,828 | ) | | | (281,688 | ) |
Class C | | | (57,812 | ) | | | (703,973 | ) | | | (13,294 | ) | | | (142,347 | ) |
Class I | | | (971,256 | ) | | | (11,953,174 | ) | | | (112,934 | ) | | | (1,224,321 | ) |
Class R1 | | | (1 | ) | | | (10 | ) | | | (5,436 | ) | | | (57,295 | ) |
Class R2 | | | (1,538 | ) | | | (18,712 | ) | | | (5,504 | ) | | | (58,232 | ) |
Class R3 | | | (3 | ) | | | (36 | ) | | | (5,545 | ) | | | (58,721 | ) |
Class R4 | | | — | | | | — | | | | (5,584 | ) | | | (59,190 | ) |
Class R6 | | | (670,323 | ) | | | (8,400,532 | ) | | | (204,768 | ) | | | (2,272,316 | ) |
| | | (1,863,716 | ) | | | $(23,032,957 | ) | | | (478,957 | ) | | | $(5,276,294 | ) |
36
Notes to Financial Statements – continued
| | | | | | | | | | | | | | | | |
| | | Year ended
8/31/17 | | | Year ended
8/31/16 | |
| | | Shares | | | Amount | | | Shares | | | Amount | |
| Net change | | | | | | | | | | | | | | | | |
Class A | | | 89,388 | | | | $1,076,763 | | | | 259,349 | | | | $2,903,758 | |
Class B | | | (1,431 | ) | | | (14,423 | ) | | | (12,772 | ) | | | (137,691 | ) |
Class C | | | 19,431 | | | | 214,692 | | | | 89,535 | | | | 1,047,326 | |
Class I | | | 6,742,940 | | | | 82,252,586 | | | | 649,626 | | | | 7,360,739 | |
Class R1 | | | 609 | | | | 7,707 | | | | (5,411 | ) | | | (57,016 | ) |
Class R2 | | | (1,302 | ) | | | (15,947 | ) | | | (4,384 | ) | | | (45,409 | ) |
Class R3 | | | 7,028 | | | | 87,805 | | | | (5,476 | ) | | | (57,958 | ) |
Class R4 | | | 69 | | | | 834 | | | | (5,500 | ) | | | (58,262 | ) |
Class R6 | | | 1,492,353 | | | | 18,341,282 | | | | 1,277,893 | | | | 14,120,224 | |
| | | 8,349,085 | | | | $101,951,299 | | | | 2,242,860 | | | | $25,075,711 | |
(6) Line of Credit
The fund and certain other funds managed by MFS participate in a $1.25 billion unsecured committed line of credit, subject to a $1 billion sublimit, provided by a syndication of banks under a credit agreement. Borrowings may be made for temporary financing needs. Interest is charged to each fund, based on its borrowings, generally at a rate equal to the higher of the Overnight Federal Reserve funds rate or daily one month LIBOR plus an agreed upon spread. A commitment fee, based on the average daily, unused portion of the committed line of credit, is allocated among the participating funds at the end of each calendar quarter. In addition, the fund and other funds managed by MFS have established unsecured uncommitted borrowing arrangements with certain banks for temporary financing needs. Interest is charged to each fund, based on its borrowings, at a rate equal to the Overnight Federal Reserve funds rate plus an agreed upon spread. For the year ended August 31, 2017, the fund’s commitment fee and interest expense were $622 and $0, respectively, and are included in “Miscellaneous” expense in the Statement of Operations.
(7) Investments in Affiliated Issuers
An affiliated issuer may be considered one in which the fund owns 5% or more of the outstanding voting securities, or a company which is under common control. For the purposes of this report, the fund assumes the following to be an affiliated issuer:
| | | | | | | | | | | | | | | | | | | | |
| Affiliated Issuer | | | | | Beginning
Shares/Par
Amount | | | Acquisitions
Shares/Par
Amount | | | Dispositions
Shares/Par
Amount | | | Ending
Shares/Par
Amount | |
MFS Institutional Money
Market Portfolio | | | | | | | 1,086,952 | | | | 99,208,841 | | | | (98,340,180 | ) | | | 1,955,613 | |
| | | | | |
| Affiliated Issuer | | Realized
Gain (Loss) | | | Change in
Unrealized
Appreciation/
(Depreciation) | | | Capital Gain
Distributions | | | Dividend
Income | | | Ending
Value | |
MFS Institutional Money
Market Portfolio | | | $2,704 | | | | $7 | | | | $— | | | | $13,298 | | | | $1,955,613 | |
37
REPORT OF INDEPENDENT REGISTERED PUBLIC ACCOUNTING FIRM
To the Board of Trustees of MFS Series Trust I and the Shareholders of MFS Low Volatility Global Equity Fund:
We have audited the accompanying statement of assets and liabilities, including the portfolio of investments, of MFS Low Volatility Global Equity Fund (one of the series of MFS Series Trust I) (the “Fund”) as of August 31, 2017, and the related statement of operations for the year then ended, the statements of changes in net assets for each of the two years in the period then ended, and the financial highlights for each of the periods presented. These financial statements and financial highlights are the responsibility of the Fund’s management. Our responsibility is to express an opinion on these financial statements and financial highlights based on our audits.
We conducted our audits in accordance with the standards of the Public Company Accounting Oversight Board (United States). Those standards require that we plan and perform the audit to obtain reasonable assurance about whether the financial statements and financial highlights are free of material misstatement. The Fund is not required to have, nor were we engaged to perform, an audit of its internal control over financial reporting. Our audits included consideration of internal control over financial reporting as a basis for designing audit procedures that are appropriate in the circumstances, but not for the purpose of expressing an opinion on the effectiveness of the Fund’s internal control over financial reporting. Accordingly, we express no such opinion. An audit also includes examining, on a test basis, evidence supporting the amounts and disclosures in the financial statements, assessing the accounting principles used and significant estimates made by management, as well as evaluating the overall financial statement presentation. Our procedures included confirmation of securities owned as of August 31, 2017, by correspondence with the custodian and brokers; when replies were not received from brokers, we performed other auditing procedures. We believe that our audits provide a reasonable basis for our opinion.
In our opinion, such financial statements and financial highlights referred to above present fairly, in all material respects, the financial position of MFS Low Volatility Global Equity Fund as of August 31, 2017, the results of its operations for the year then ended, the changes in its net assets for each of the two years in the period then ended, and the financial highlights for each of the periods presented, in conformity with accounting principles generally accepted in the United States of America.
DELOITTE & TOUCHE LLP
Boston, Massachusetts
October 17, 2017
38
RESULTS OF SHAREHOLDER MEETING
(unaudited)
At a special meeting of shareholders of MFS Series Trust I, which was held on March 23, 2017, the following action was taken:
Item 1: To elect the following individuals as Trustees:
| | | | | | | | |
| | | Number of Dollars | |
Nominee | | For | | | Withheld Authority | |
| Steven E. Buller | | | 40,448,016,134.453 | | | | 372,137,248.376 | |
| John A. Caroselli | | | 40,455,058,441.389 | | | | 365,094,941.560 | |
| Maureen R. Goldfarb | | | 40,458,621,672.449 | | | | 361,531,746.940 | |
| David H. Gunning | | | 40,369,558,961.219 | | | | 450,594,312.051 | |
| Michael Hegarty | | | 40,379,783,468.714 | | | | 440,369,950.676 | |
| John P. Kavanaugh | | | 40,453,732,784.104 | | | | 366,420,708.405 | |
| Robert J. Manning | | | 40,424,010,964.586 | | | | 396,142,308.684 | |
| Clarence Otis, Jr. | | | 40,441,919,324.712 | | | | 378,234,043.007 | |
| Maryanne L. Roepke | | | 40,471,040,575.143 | | | | 349,112,917.026 | |
| Robin A. Stelmach | | | 40,459,908,730.475 | | | | 360,244,615.574 | |
| Laurie J. Thomsen | | | 40,426,270,790.416 | | | | 393,882,628.973 | |
39
TRUSTEES AND OFFICERS — IDENTIFICATION AND BACKGROUND
The Trustees and Officers of the Trust, as of October 1, 2017, are listed below, together with their principal occupations during the past five years. (Their titles may have varied during that period.) The address of each Trustee and Officer is 111 Huntington Avenue, Boston, Massachusetts 02199-7618.
| | | | | | | | | | |
Name, Age | | Position(s)
Held with Fund | | Trustee/Officer Since (h) | | Number of
MFS Funds
overseen
by the
Trustee | | Principal
Occupations During the Past Five Years | | Other Directorships
During the Past
Five Years (j) |
| INTERESTED TRUSTEES |
Robert J. Manning (k)
(age 53) | | Trustee | | February 2004 | | 136 | | Massachusetts Financial Services Company, Executive Chairman (since January 2017); Director; Chairman of the Board; Chief Executive Officer (until 2015); Co-Chief Executive Officer (2015-2016) | | N/A |
Robin A. Stelmach (k) (age 56) | | Trustee | | January 2014 | | 136 | | Massachusetts Financial Services Company, Vice Chair (since January 2017); Chief Operating Officer and Executive Vice President (until January 2017) | | N/A |
| INDEPENDENT TRUSTEES |
David H. Gunning
(age 75) | | Trustee and Chair of Trustees | | January 2004 | | 136 | | Private investor | | Lincoln Electric Holdings, Inc., Director; Development Alternatives, Inc., Director/Non-Executive Chairman (until 2013) |
40
Trustees and Officers – continued
| | | | | | | | | | |
Name, Age | | Position(s)
Held with Fund | | Trustee/Officer Since (h) | | Number of
MFS Funds
overseen
by the
Trustee | | Principal
Occupations During the Past Five Years | | Other Directorships
During the Past
Five Years (j) |
Steven E. Buller
(age 66) | | Trustee | | February 2014 | | 136 | | Financial Accounting Standards Advisory Council, Chairman (2014-2015); Public Company Accounting Oversight Board, Standing Advisory Group, Member (until 2014); BlackRock, Inc. (investment management), Managing Director (until 2014), BlackRock Finco UK (investment management), Director (until 2014) | | N/A |
John A. Caroselli
(age 63) | | Trustee | | March 2017 | | 136 | | JC Global Advisors, LLC (management consulting), President (since 2015); First Capital Corporation (commercial finance), Executive Vice President (until 2015) | | N/A |
Maureen R. Goldfarb
(age 62) | | Trustee | | January 2009 | | 136 | | Private investor | | N/A |
Michael Hegarty
(age 72) | | Trustee | | December 2004 | | 136 | | Private investor | | Rouse Properties Inc., Director (until 2016); Capmark Financial Group Inc., Director (until 2015) |
John P. Kavanaugh
(age 62) | | Trustee and Vice Chair of Trustees | | January 2009 | | 136 | | Private investor | | N/A |
Clarence Otis, Jr.
(age 61) | | Trustee | | March 2017 | | 136 | | Darden Restaurants, Inc., Chief Executive Officer (until 2014) | | VF Corporation, Director; Verizon Communications, Inc., Director; The Travelers Companies, Director; Federal Reserve Bank of Atlanta, Director (until 2015) |
41
Trustees and Officers – continued
| | | | | | | | | | |
Name, Age | | Position(s)
Held with Fund | | Trustee/Officer Since (h) | | Number of
MFS Funds
overseen
by the
Trustee | | Principal
Occupations During the Past Five Years | | Other Directorships
During the Past
Five Years (j) |
Maryanne L. Roepke
(age 61) | | Trustee | | May 2014 | | 136 | | American Century Investments (investment management), Senior Vice President and Chief Compliance Officer (until 2014) | | N/A |
Laurie J. Thomsen
(age 60) | | Trustee | | March 2005 | | 136 | | Private investor | | The Travelers Companies, Director; Dycom Industries, Inc., Director (since 2015) |
| | | | | | | | |
Name, Age | | Position(s) Held with Fund | | Trustee/Officer
Since (h) | | Number of
MFS Funds
for which
the Person
is an Officer | | Principal
Occupations During the Past Five Years |
| OFFICERS | | | | | | | | |
Christopher R. Bohane (k)
(age 43) | | Assistant Secretary and Assistant Clerk | | July 2005 | | 136 | | Massachusetts Financial Services Company, Vice President and Assistant General Counsel |
Kino Clark (k)
(age 49) | | Assistant Treasurer | | January 2012 | | 136 | | Massachusetts Financial Services Company, Vice President |
John W. Clark, Jr. (k)
(age 50) | | Assistant Treasurer | | April 2017 | | 136 | | Massachusetts Financial Services Company, Vice President (since March 2017); Deutsche Bank (financial services), Department Head – Treasurer’s Office (until February 2017) |
Thomas H. Connors (k)
(age 58) | | Assistant Secretary and Assistant Clerk | | September 2012 | | 136 | | Massachusetts Financial Services Company, Vice President and Senior Counsel; Deutsche Investment Management Americas Inc. (financial service provider), Director and Senior Counsel (until 2012) |
42
Trustees and Officers – continued
| | | | | | | | |
Name, Age | | Position(s) Held with Fund | | Trustee/Officer
Since (h) | | Number of
MFS Funds
for which
the Person
is an Officer | | Principal
Occupations During the Past Five Years |
Ethan D. Corey (k)
(age 53) | | Assistant Secretary and Assistant Clerk | | July 2005 | | 136 | | Massachusetts Financial Services Company, Senior Vice President and Associate General Counsel |
David L. DiLorenzo (k)
(age 49) | | President | | July 2005 | | 136 | | Massachusetts Financial Services Company, Senior Vice President |
Heidi W. Hardin (k)
(age 50) | | Secretary and Clerk | | April 2017 | | 136 | | Massachusetts Financial Services Company, Executive Vice President and General Counsel (since March 2017); Harris Associates (investment management), General Counsel (from September 2015 to January 2017); Janus Capital Management LLC (investment management), Senior Vice President and General Counsel (until September 2015) |
Brian E. Langenfeld (k) (age 44) | | Assistant Secretary and Assistant Clerk | | June 2006 | | 136 | | Massachusetts Financial Services Company, Vice President and Senior Counsel |
Susan A. Pereira (k)
(age 46) | | Assistant Secretary and Assistant Clerk | | July 2005 | | 136 | | Massachusetts Financial Services Company, Vice President and Senior Counsel |
Kasey L. Phillips (k)
(age 46) | | Assistant Treasurer | | September 2012 | | 136 | | Massachusetts Financial Services Company, Vice President; Wells Fargo Funds Management, LLC, Senior Vice President, Fund Treasurer (until 2012) |
Matthew A. Stowe (k)
(age 42) | | Assistant Secretary and Assistant Clerk | | October 2014 | | 136 | | Massachusetts Financial Services Company, Vice President and Assistant General Counsel |
Frank L. Tarantino
(age 73) | | Independent Senior Officer | | June 2004 | | 136 | | Tarantino LLC (provider of compliance services), Principal |
Richard S. Weitzel (k)
(age 47) | | Assistant Secretary and Assistant Clerk | | October 2007 | | 136 | | Massachusetts Financial Services Company, Senior Vice President and Associate General Counsel |
43
Trustees and Officers – continued
| | | | | | | | |
Name, Age | | Position(s) Held with Fund | | Trustee/Officer
Since (h) | | Number of
MFS Funds
for which
the Person
is an Officer | | Principal
Occupations During the Past Five Years |
Martin J. Wolin (k)
(age 50) | | Chief Compliance Officer | | July 2015 | | 136 | | Massachusetts Financial Services Company, Senior Vice President and Chief Compliance Officer (since July 2015); Mercer (financial service provider), Chief Risk and Compliance Officer, North America and Latin America (until June 2015) |
James O. Yost (k)
(age 57) | | Treasurer | | September 1990 | | 136 | | Massachusetts Financial Services Company, Senior Vice President |
| (h) | Date first appointed to serve as Trustee/officer of an MFS Fund. Each Trustee has served continuously since appointment unless indicated otherwise. For the period from December 15, 2004 until February 22, 2005, Mr. Manning served as Advisory Trustee. Prior to January 2012, Messrs. DiLorenzo and Yost served as Assistant Treasurers of the Funds. From January 2012 through December 2016, Messrs. DiLorenzo and Yost served as Treasurer and Deputy Treasurer of the Funds, respectively. |
| (j) | Directorships or trusteeships of companies required to report to the Securities and Exchange Commission (i.e., “public companies”). |
| (k) | “Interested person” of the Trust within the meaning of the Investment Company Act of 1940 (referred to as the 1940 Act), which is the principal federal law governing investment companies like the fund, as a result of a position with MFS. The address of MFS is 111 Huntington Avenue, Boston, Massachusetts 02199-7618. |
Each Trustee has been elected by shareholders and each Trustee and officer holds office until his or her successor is chosen and qualified or until his or her earlier death, resignation, retirement or removal. The Trust does not hold annual meetings for the purpose of electing Trustees, and Trustees are not elected for fixed terms. Under the terms of the Board’s retirement policy, an Independent Trustee shall retire at the end of the calendar year in which he or she reaches the earlier of 75 years of age or 15 years of service on the Board (or, in the case of any Independent Trustee who joined the Board prior to 2015, 20 years of service on the Board).
Messrs. Buller, Kavanaugh and Otis and Ms. Roepke are members of the Trust’s Audit Committee.
Each of the Interested Trustees and certain Officers hold comparable officer positions with certain affiliates of MFS.
44
Trustees and Officers – continued
The Statement of Additional Information for a Fund includes further information about the Trustees and is available without charge upon request by calling 1-800-225-2606.
| | |
| Investment Adviser | | Custodian |
Massachusetts Financial Services Company
111 Huntington Avenue
Boston, MA 02199-7618 | | State Street Bank and Trust Company 1 Lincoln Street
Boston, MA 02111-2900 |
| Distributor | | Independent Registered Public Accounting Firm |
MFS Fund Distributors, Inc.
111 Huntington Avenue
Boston, MA 02199-7618 | | Deloitte & Touche LLP
200 Berkeley Street
Boston, MA 02116 |
| Portfolio Manager(s) | | |
Jim Fallon | | |
Matt Krummell | | |
| Jonathan Sage | | |
| Jed Stocks | | |
45
BOARD REVIEW OF INVESTMENT ADVISORY AGREEMENT
The Investment Company Act of 1940 requires that both the full Board of Trustees and a majority of the non-interested (“independent”) Trustees, voting separately, annually approve the continuation of the Fund’s investment advisory agreement with MFS. The Trustees consider matters bearing on the Fund and its advisory arrangements at their meetings throughout the year, including a review of performance data at each regular meeting. In addition, the independent Trustees met several times over the course of three months beginning in May and ending in July, 2017 (“contract review meetings”) for the specific purpose of considering whether to approve the continuation of the investment advisory agreement for the Fund and the other investment companies that the Board oversees (the “MFS Funds”). The independent Trustees were assisted in their evaluation of the Fund’s investment advisory agreement by independent legal counsel, from whom they received separate legal advice and with whom they met separately from MFS during various contract review meetings. The independent Trustees were also assisted in this process by the MFS Funds’ Independent Senior Officer, a senior officer appointed by and reporting to the independent Trustees.
In connection with their deliberations regarding the continuation of the investment advisory agreement, the Trustees, including the independent Trustees, considered such information and factors as they believed, in light of the legal advice furnished to them and their own business judgment, to be relevant. The investment advisory agreement for the Fund was considered separately, although the Trustees also took into account the common interests of all MFS Funds in their review. As described below, the Trustees considered the nature, quality, and extent of the various investment advisory, administrative, and shareholder services performed by MFS under the existing investment advisory agreement and other arrangements with the Fund.
In connection with their contract review meetings, the Trustees received and relied upon materials that included, among other items: (i) information provided by Broadridge Financial Solutions, Inc. (“Broadridge”), an independent third party, on the investment performance of the Fund for various time periods ended December 31, 2016 and the investment performance of a group of funds with substantially similar investment classifications/objectives (the “Lipper performance universe”), (ii) information provided by Broadridge on the Fund’s advisory fees and other expenses and the advisory fees and other expenses of comparable funds identified by Lipper Inc. (the “Broadridge expense group”), (iii) information provided by MFS on the advisory fees of portfolios of other clients of MFS, including institutional separate accounts and other clients, (iv) information as to whether and to what extent applicable expense waivers, reimbursements or fee “breakpoints” are observed for the Fund, (v) information regarding MFS’ financial results and financial condition, including MFS’ and certain of its affiliates’ estimated profitability from services performed for the Fund and the MFS Funds as a whole, and compared to MFS’ institutional business, (vi) MFS’ views regarding the outlook for the mutual fund industry and the strategic business plans of MFS, (vii) descriptions of various functions performed by MFS for the Funds, such as compliance monitoring and portfolio trading practices, and (viii) information regarding the overall organization of MFS, including information about MFS’ senior management and other personnel providing investment advisory,
46
Board Review of Investment Advisory Agreement – continued
administrative and other services to the Fund and the other MFS Funds. The comparative performance, fee and expense information prepared and provided by Broadridge was not independently verified and the independent Trustees did not independently verify any information provided to them by MFS.
The Trustees’ conclusion as to the continuation of the investment advisory agreement was based on a comprehensive consideration of all information provided to the Trustees and not the result of any single factor. Some of the factors that figured particularly in the Trustees’ deliberations are described below, although individual Trustees may have evaluated the information presented differently from one another, giving different weights to various factors. It is also important to recognize that the fee arrangements for the Fund and other MFS Funds are the result of years of review and discussion between the independent Trustees and MFS, that certain aspects of such arrangements may receive greater scrutiny in some years than in others, and that the Trustees’ conclusions may be based, in part, on their consideration of these same arrangements during the course of the year and in prior years.
Based on information provided by Broadridge and MFS, the Trustees reviewed the Fund’s total return investment performance as well as the performance of peer groups of funds for various time periods. The Trustees placed particular emphasis on the total return performance of the Fund’s Class A shares in comparison to the performance of funds in its Lipper performance universe over the three-year period ended December 31, 2016, which the Trustees believed was a long enough period to reflect differing market conditions. The total return performance of the Fund’s Class A shares was in the 1st quintile relative to the other funds in the universe for this three-year period (the 1st quintile being the best performers and the 5th quintile being the worst performers). The total return performance of the Fund’s Class A shares was in the 4th quintile for the one-year period ended December 31, 2016 relative to the Lipper performance universe. The Fund commenced operations on December 5, 2013; therefore no performance data for the five-year period was available. Because of the passage of time, these performance results may differ from the performance results for more recent periods, including those shown elsewhere in this report.
In the course of their deliberations, the Trustees took into account information provided by MFS in connection with the contract review meetings, as well as during investment review meetings conducted with portfolio management personnel during the course of the year regarding the Fund’s performance. After reviewing these and related factors, the Trustees concluded, within the context of their overall conclusions regarding the investment advisory agreement, that they were satisfied with MFS’ responses and efforts relating to investment performance.
In assessing the reasonableness of the Fund’s advisory fee, the Trustees considered, among other information, the Fund’s advisory fee and the total expense ratio of the Fund’s Class A shares as a percentage of average daily net assets and the advisory fee and total expense ratios of peer groups of funds based on information provided by Broadridge. The Trustees considered that MFS currently observes an expense limitation for the Fund, which may not be changed without the Trustees’ approval. The Trustees also considered that, according to the data provided by Broadridge (which takes into account any fee reductions or expense limitations that were in effect during the Fund’s
47
Board Review of Investment Advisory Agreement – continued
last fiscal year), the Fund’s effective advisory fee rate and total expense ratio were each lower than the Broadridge expense group median. The Trustees also noted that MFS has agreed to further reduce such expense limitation for the Fund effective August 1, 2017, which may not be changed without the Trustees’ approval.
The Trustees also considered the advisory fees charged by MFS to any institutional separate accounts advised by MFS (“separate accounts”) and unaffiliated investment companies for which MFS serves as subadviser (“subadvised funds”) that have comparable investment strategies to the Fund, if any. In comparing these fees, the Trustees considered information provided by MFS as to the generally broader scope of services provided by MFS to the Fund, as well as the more extensive regulatory burdens imposed on MFS in managing the Fund, in comparison to separate accounts and subadvised funds. The Trustees also considered the higher demands placed on MFS’ investment personnel and trading infrastructure as a result of the daily cash in-flows and out-flows of the Fund in comparison to separate accounts.
The Trustees also considered whether the Fund may benefit from any economies of scale in the management of the Fund in the event of growth in assets of the Fund and/or growth in assets of the MFS Funds as a whole. They noted that the Fund’s advisory fee rate schedule is subject to contractual breakpoints that reduce the Fund’s advisory fee rate on average daily net assets over $1 billion and $2.5 billion. They also noted that MFS has agreed to amend its contractual advisory fee rate schedule to further reduce the Fund’s advisory fee rate on assets over these breakpoints effective August 1, 2017. The Trustees also noted that MFS has agreed in writing to waive a portion of the management fees of certain MFS Funds, including the Fund, if the total combined assets of certain funds within the MFS Funds’ complex increase above agreed upon thresholds (the “group fee waiver”), enabling the Fund’s shareholders to share in the benefits from any economies of scale at the complex level. The group fee waiver is reviewed and renewed annually between the Board and MFS. The Trustees concluded that the breakpoints and the group fee waiver were sufficient to allow the Fund to benefit from economies of scale as its assets and overall complex assets grow.
The Trustees also considered information prepared by MFS relating to MFS’ costs and profits with respect to the Fund, the MFS Funds considered as a group, and other investment companies and accounts advised by MFS, as well as MFS’ methodologies used to determine and allocate its costs to the MFS Funds, the Fund and other accounts and products for purposes of estimating profitability.
In addition, the Trustees considered MFS’ resources and related efforts to continue to retain, attract and motivate capable personnel to serve the Fund. The Trustees also considered current and developing conditions in the financial services industry, including the presence of large and well-capitalized companies which are spending, and appear to be prepared to continue to spend, substantial sums to engage personnel and to provide services to competing investment companies. In this regard, the Trustees also considered the financial resources of MFS and its ultimate parent, Sun Life Financial Inc. The Trustees also considered the advantages and possible disadvantages to the Fund of having an adviser that also serves other investment companies as well as other accounts.
48
Board Review of Investment Advisory Agreement – continued
The Trustees also considered the nature, quality, cost, and extent of administrative, transfer agency, and distribution services provided to the Fund by MFS and its affiliates under agreements and plans other than the investment advisory agreement, including any 12b-1 fees the Fund pays to MFS Fund Distributors, Inc., an affiliate of MFS. The Trustees also considered the nature, extent and quality of certain other services MFS performs or arranges for on the Fund’s behalf, which may include securities lending programs, directed expense payment programs, class action recovery programs, and MFS’ interaction with third-party service providers, principally custodians and sub-custodians. The Trustees concluded that the various non-advisory services provided by MFS and its affiliates on behalf of the Fund were satisfactory.
The Trustees also considered benefits to MFS from the use of the Fund’s portfolio brokerage commissions, if applicable, to pay for investment research and various other factors. Additionally, the Trustees considered so-called “fall-out benefits” to MFS such as reputational value derived from serving as investment manager to the Fund.
Based on their evaluation of factors that they deemed to be material, including those factors described above, the Board of Trustees, including the independent Trustees, concluded that the Fund’s investment advisory agreement with MFS should be continued for an additional one-year period, commencing August 1, 2017.
49
PROXY VOTING POLICIES AND INFORMATION
MFS votes proxies on behalf of the fund pursuant to proxy voting policies and procedures that are available without charge, upon request, by calling 1-800-225-2606, by visiting mfs.com (once you have selected “Individual Investor” as your role, click on “Individual Investor Home” in the top navigation and then select “Learn More About Proxy Voting” under the “I want to…” header on the left hand column of the page), or by visiting the SEC’s Web site at http://www.sec.gov.
Information regarding how the fund voted proxies relating to portfolio securities during the most recent twelve-month period ended June 30 is available by August 31 of each year without charge by visiting mfs.com (once you have selected “Individual Investor” as your role, click on “Individual Investor Home” in the top navigation and then select “Learn More About Proxy Voting” under the “I want to…” header on the left hand column of the page), or by visiting the SEC’s Web site at http://www.sec.gov.
QUARTERLY PORTFOLIO DISCLOSURE
The fund will file a complete schedule of portfolio holdings with the Securities and Exchange Commission (the Commission) for the first and third quarters of each fiscal year on Form N-Q. A shareholder can obtain the quarterly portfolio holdings report at mfs.com. The fund’s Form N-Q is also available on the EDGAR database on the Commission’s Internet Web site at http://www.sec.gov, and may be reviewed and copied at the:
Public Reference Room
Securities and Exchange Commission
100 F Street, NE, Room 1580
Washington, D.C. 20549
Information on the operation of the Public Reference Room may be obtained by calling the Commission at 1-800-SEC-0330. Copies of the fund’s Form N-Q also may be obtained, upon payment of a duplicating fee, by electronic request at the following e-mail address: publicinfo@sec.gov or by writing the Public Reference Section at the above address.
FURTHER INFORMATION
From time to time, MFS may post important information about the fund or the MFS funds on the MFS web site (mfs.com). This information is available on mfs.com by following these steps once you have selected “Individual Investor” as your role: (1) Click on the “Individual Investor Home” in the top navigation and then select the “Announcements” option within the “Market Outlooks” drop down, or (2) Click on “Products & Services” and “Mutual Funds” and then choose the fund’s name in the “Select a fund” menu.
50
INFORMATION ABOUT FUND CONTRACTS AND LEGAL CLAIMS
The fund has entered into contractual arrangements with an investment adviser, administrator, distributor, shareholder servicing agent, 529 program manager (if applicable), and custodian who each provide services to the fund. Unless expressly stated otherwise, shareholders are not parties to, or intended beneficiaries of these contractual arrangements, and these contractual arrangements are not intended to create any shareholder right to enforce them against the service providers or to seek any remedy under them against the service providers, either directly or on behalf of the fund.
Under the Trust’s By-Laws and Declaration of Trust, any claims asserted against or on behalf of the MFS Funds, including claims against Trustees and Officers, must be brought in state and federal courts located within the Commonwealth of Massachusetts.
FEDERAL TAX INFORMATION (unaudited)
The fund will notify shareholders of amounts for use in preparing 2017 income tax forms in January 2018. The following information is provided pursuant to provisions of the Internal Revenue Code.
The fund designates the maximum amount allowable as qualified dividend income eligible to be taxed at the same rate as long-term capital gain.
For corporate shareholders, 44.90% of the ordinary income dividends paid during the fiscal year qualify for the corporate dividends received deduction.
Income derived from foreign sources was $1,933,501. The fund intends to pass through foreign tax credits of $154,755 for the fiscal year.
51
rev. 3/16
| | | | |
| | | |
FACTS | | WHAT DOES MFS DO WITH YOUR PERSONAL INFORMATION? | |  |
| | |
| Why? | | Financial companies choose how they share your personal information. Federal law gives consumers the right to limit some but not all sharing. Federal law also requires us to tell you how we collect, share, and protect your personal information. Please read this notice carefully to understand what we do. |
| | |
| What? | | The types of personal information we collect and share depend on the product or service you have with us. This information can include: • Social Security number and account balances • Account transactions and transaction history • Checking account information and wire transfer instructions When you are no longer our customer, we continue to share your information as described in this notice. |
| | |
| How? | | All financial companies need to share customers’ personal information to run their everyday business. In the section below, we list the reasons financial companies can share their customers’ personal information; the reasons MFS chooses to share; and whether you can limit this sharing. |
| | | | |
Reasons we can share your
personal information | | Does MFS
share? | | Can you limit
this sharing? |
For our everyday business purposes – such as to process your transactions, maintain your account(s), respond to court orders and legal investigations, or report to credit bureaus | | Yes | | No |
For our marketing purposes – to offer our products and services to you | | No | | We don’t share |
For joint marketing with other financial companies | | No | | We don’t share |
For our affiliates’ everyday business purposes – information about your transactions and experiences | | No | | We don’t share |
For our affiliates’ everyday business purposes – information about your creditworthiness | | No | | We don’t share |
| For nonaffiliates to market to you | | No | | We don’t share |
| | |
| Questions? | | Call 800-225-2606 or go to mfs.com. |
52
| | |
| Who we are |
| Who is providing this notice? | | MFS Funds, MFS Investment Management, MFS Institutional Advisors, Inc., and MFS Heritage Trust Company. |
| | |
| What we do |
| How does MFS protect my personal information? | | To protect your personal information from unauthorized access and use, we use security measures that comply with federal law. These measures include procedural, electronic, and physical safeguards for the protection of the personal information we collect about you. |
| How does MFS collect my personal information? | | We collect your personal information, for example, when you • open an account or provide account information • direct us to buy securities or direct us to sell your securities • make a wire transfer We also collect your personal information from others, such as credit bureaus, affiliates, or other companies. |
| Why can’t I limit all sharing? | | Federal law gives you the right to limit only • sharing for affiliates’ everyday business purposes – information about your creditworthiness • affiliates from using your information to market to you • sharing for nonaffiliates to market to you State laws and individual companies may give you additional rights to limit sharing. |
| | |
| Definitions |
| Affiliates | | Companies related by common ownership or control. They can be financial and nonfinancial companies. • MFS does not share personal information with affiliates, except for everyday business purposes as described on page one of this notice. |
| Nonaffiliates | | Companies not related by common ownership or control. They can be financial and nonfinancial companies. • MFS does not share with nonaffiliates so they can market to you. |
| Joint marketing | | A formal agreement between nonaffiliated financial companies that together market financial products or services to you. • MFS doesn’t jointly market. |
| | |
| Other important information |
| If you own an MFS product or receive an MFS service in the name of a third party such as a bank or broker-dealer, their privacy policy may apply to you instead of ours. |
53
Save paper with eDelivery.

| MFS® will send you prospectuses, |
reports, and proxies directly via e-mail so you will get information faster with less mailbox clutter.
To sign up:
1. Go to mfs.com.
2. Log in via MFS® Access.
3. Select eDelivery.
If you own your MFS fund shares through a financial institution or a retirement plan, MFS® TALK, MFS® Access, or eDelivery may not be available to you.
CONTACT
WEB SITE
mfs.com
MFS TALK
1-800-637-8255
24 hours a day
ACCOUNT SERVICE AND LITERATURE
Shareholders
1-800-225-2606
Financial advisors
1-800-343-2829
Retirement plan services
1-800-637-1255
MAILING ADDRESS
MFS Service Center, Inc.
P.O. Box 55824
Boston, MA 02205-5824
OVERNIGHT MAIL
MFS Service Center, Inc.
c/o Boston Financial Data Services
30 Dan Road
Canton, MA 02021-2809
ANNUAL REPORT
August 31, 2017

MFS® LOW VOLATILITY EQUITY FUND

LVU-ANN
MFS® LOW VOLATILITY EQUITY FUND
CONTENTS
The report is prepared for the general information of shareholders.
It is authorized for distribution to prospective investors only when preceded or accompanied by a current prospectus.
NOT FDIC INSURED • MAY LOSE VALUE • NO BANK GUARANTEE

LETTER FROM THE EXECUTIVE CHAIRMAN
Dear Shareholders:
Despite policy uncertainty accompanying a new presidential administration in the United States and unease over ongoing Brexit negotiations, most markets have proved
resilient. U.S. share prices have reached new highs in recent months although the U.S. Federal Reserve has continued to gradually hike interest rates. However, rates in most developed markets remain very low, with major non-U.S. central banks just beginning to contemplate curbing accommodative monetary policies.
Globally, we’ve experienced a year-long synchronized upturn in economic growth. Despite better growth, there are few immediate signs of worrisome inflation amid muted wage gains around the world. Europe has benefited from diminishing event risks as populist challengers fell short of upsetting establishment
candidates in both the Dutch and French elections. Emerging market economies have been boosted in part by a weaker U.S. dollar and are recovering despite lingering concerns over the potential for restrictive U.S. trade policies that could hamper global trade growth. Looking ahead, markets will have to contend with issues involving geopolitical hot spots on the Korean peninsula and in the Middle East.
At MFS®, we believe time is an asset. A patient, long-term approach to investing can have a powerful impact on decision making and outcomes. Time arbitrage, as we call it, comes down to having the conviction and discipline to allow enough time for good investment ideas to play out. In our view, such an approach, along with the professional guidance of a financial advisor, will help you reach your investment objectives.
Respectfully,

Robert J. Manning
Executive Chairman
MFS Investment Management
October 17, 2017
The opinions expressed in this letter are subject to change and may not be relied upon for investment advice. No forecasts can be guaranteed.
1
PORTFOLIO COMPOSITION
Portfolio structure

| | | | |
| Top ten holdings | | | | |
| Facebook, Inc., “A” | | | 2.7% | |
| Amdocs Ltd. | | | 2.7% | |
| PepsiCo, Inc. | | | 2.6% | |
| Waste Connections, Inc. | | | 2.5% | |
| McDonald’s Corp. | | | 2.4% | |
| Johnson & Johnson | | | 2.3% | |
| Starwood Property Trust, Inc., REIT | | | 2.2% | |
| Alphabet, Inc., “A” | | | 2.1% | |
| Eli Lilly & Co. | | | 1.9% | |
| Costco Wholesale Corp. | | | 1.9% | |
| | | | |
| Equity sectors | | | | |
| Financial Services | | | 21.1% | |
| Health Care | | | 17.9% | |
| Consumer Staples | | | 11.9% | |
| Technology | | | 10.7% | |
| Utilities & Communications | | | 9.5% | |
| Industrial Goods & Services | | | 8.1% | |
| Leisure | | | 6.3% | |
| Retailing | | | 4.4% | |
| Special Products & Services | | | 4.2% | |
| Energy | | | 3.0% | |
| Basic Materials | | | 1.5% | |
| Autos & Housing | | | 0.6% | |
Cash & Cash Equivalents includes any cash, investments in money market funds, short-term securities, and other assets less liabilities. Please see the Statement of Assets and Liabilities for additional information related to the fund’s cash position and other assets and liabilities.
Percentages are based on net assets as of August 31, 2017.
The portfolio is actively managed and current holdings may be different.
2
MANAGEMENT REVIEW
Summary of Results
For the twelve months ended August 31, 2017, Class A shares of the MFS Low Volatility Equity Fund (“fund”) provided a total return of 11.18%, at net asset value. This compares with a return of 16.23% for the fund’s benchmark, the Standard & Poor’s 500 Stock Index (S&P 500 Index).
Market Environment
For the first time in many years, the global economy is experiencing a period of synchronized economic growth. The rebound in emerging markets (“EM”) economies has been more pronounced (despite the deceleration in Chinese growth at the end of the period), helped by larger economies such as Brazil and Russia emerging from recessions. At the same time, developed markets (“DM”) economies continued to grow at or above potential. Market confidence increased in the US after the presidential elections in November in anticipation of lower taxes, a lighter regulatory burden and increased infrastructure spending, boosting US equities and corporate bond performance. Though hopes have largely faded for pro-growth US policies, market confidence persists. Globally, markets benefited from a reflation trade during the first half of the period as commodity prices strengthened, activity and growth prospects improved, and inflation moved higher, though within moderate bounds. While this bump in global inflation faded in the second half of the period as commodity prices, particularly oil, leveled off or declined, global growth remained relatively resilient. As a result, there have been more tightening signals and actions by DM central banks. The US Federal Reserve increased interest rates by 25 basis points during the second half of the period, bringing the total number of quarter-percent hikes in the federal funds rate to four since December 2015. The European Central Bank appears set to announce tapering of quantitative easing in the fall of 2017. The Bank of England may also begin reducing monetary accommodation. Markets have been comforted, along with central banks, by the decline in fears of a populist surge in Europe after establishment candidates won the Dutch and French elections. European growth has reflected the calmer political economic backdrop.
In recent months, the US dollar reversed the sharp rise seen early in the period, easing what had been a substantial headwind to earnings for multinationals. US consumer spending held up well during the second half of the period amid a modest increase in real wages and relatively low gasoline prices. Demand for autos reached near-record territory in the first half of the period before tapering off at the end of the period, while the housing market continued its recovery amid relatively low mortgage rates and tight inventories. Global trade, which was sluggish early in the period, showed signs of improvement in the period’s second half, a positive indicator of global economic activity and prospects. Early in the period, the US election resulted in a sell-off in EM assets due to fears that President Trump would follow through on various campaign threats and promises that were judged to be detrimental to EM. While President Trump withdrew the US from the Trans-Pacific Partnership and began the renegotiation of the North American Free Trade Agreement, significant additional
3
Management Review – continued
policy action has so far been lacking on economic issues involving EM. As a result, emerging markets resumed their upward trajectory, powered by strong inflows throughout the first half of 2017.
Detractors from Performance
The fund’s underweight position and security selection in the technology sector detracted from performance relative to the S&P 500 Index. Within this sector, an underweight position in computer and personal electronics maker Apple, and not holding shares of both software giant Microsoft and computer graphics processors maker NVIDIA, hurt relative results. Shares of Apple advanced during the reporting period on the back of better-than-expected earnings results and anticipation of the release of new iPhone models this fall.
Weak stock selection within both the leisure and financial services sectors further hindered relative returns. Within the leisure sector, holding shares of poor-performing casual dining restaurant company Brinker International (b)(h) dampened relative performance as weak traffic trends and a tough competitive environment limited growth. Within the financial services sector, not holding shares of banking giant Bank of America diminished relative results. Shares of Bank of America advanced during the reporting period, benefiting from President Donald Trump’s election victory and interest rate increases by the US Federal Reserve.
The fund’s overweight position and, to a lesser extent, stock selection in the consumer staples sector also weakened relative results. Within this sector, overweight positions in global food company General Mills and tobacco company Altria Group weighed on relative performance. Shares of General Mills declined as strong expense management was not enough to offset weakness in sales volumes.
Elsewhere, overweight positions in automotive replacement parts distributor AutoZone (h) and oilfield services company Schlumberger, along with not holding shares of aerospace company Boeing, weakened relative results.
Contributors to Performance
Strong security selection in both the utilities & communications and industrial goods & services sectors benefited relative returns during the reporting period. Within the utilities & communications sector, avoiding shares of poor-performing telecommunications company AT&T helped relative results. Shares of AT&T trended lower as the acquisition of Time Warner and competitive pricing pressures appeared to have weighed on investor sentiment. Within the industrial goods & services sector, not owning shares of diversified industrial conglomerate General Electric, and holding shares of waste services company Waste Connections (b) (Canada), lifted relative performance. Shares of Waste Connections advanced on strong growth that was aided by a series of strategic acquisitions. Overweighting shares of non-hazardous waste solutions firm Republic Services also helped relative results.
Stocks in other sectors that supported relative results included overweight positions in financial services firm M&T Bank Corporation, fast-food giant McDonald’s, alcoholic
4
Management Review – continued
beverages company Constellation Brands, insurance services firm Everest Reinsurance and social networking service provider Facebook. Not holding shares of wireless communications software company QUALCOMM also benefited relative performance.
Respectfully,
Portfolio Manager(s)
Jim Fallon, Matt Krummell, Jonathan Sage, and Jed Stocks
| (b) | Security is not a benchmark constituent. |
| (h) | Security was not held in the portfolio at period end. |
The views expressed in this report are those of the portfolio manager(s) only through the end of the period of the report as stated on the cover and do not necessarily reflect the views of MFS or any other person in the MFS organization. These views are subject to change at any time based on market or other conditions, and MFS disclaims any responsibility to update such views. These views may not be relied upon as investment advice or an indication of trading intent on behalf of any MFS portfolio. References to specific securities are not recommendations of such securities, and may not be representative of any MFS portfolio’s current or future investments.
5
PERFORMANCE SUMMARY THROUGH 8/31/17
The following chart illustrates a representative class of the fund’s historical performance in comparison to its benchmark(s). Performance results include the deduction of the maximum applicable sales charge and reflect the percentage change in net asset value, including reinvestment of dividends and capital gains distributions. The performance of other share classes will be greater than or less than that of the class depicted below. Benchmarks are unmanaged and may not be invested in directly. Benchmark returns do not reflect sales charges, commissions or expenses. (See Notes to Performance Summary.)
Performance data shown represents past performance and is no guarantee of future results. Investment return and principal value fluctuate so your shares, when sold, may be worth more or less than the original cost; current performance may be lower or higher than quoted. The performance shown does not reflect the deduction of taxes, if any, that a shareholder would pay on fund distributions or the redemption of fund shares.
Growth of a Hypothetical $10,000 Investment (t)
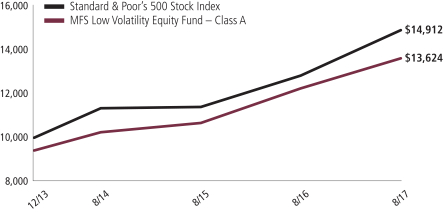
6
Performance Summary – continued
Total Returns through 8/31/17
Average annual without sales charge
| | | | | | | | | | |
| | | Share Class | | Class Inception Date | | 1-yr | | Life (t) | | |
| | | A | | 12/05/13 | | 11.18% | | 10.35% | | |
| | | B | | 12/05/13 | | 10.36% | | 9.51% | | |
| | | C | | 12/05/13 | | 10.36% | | 9.52% | | |
| | | I | | 12/05/13 | | 11.44% | | 10.60% | | |
| | | R1 | | 12/05/13 | | 10.33% | | 9.52% | | |
| | | R2 | | 12/05/13 | | 10.93% | | 10.08% | | |
| | | R3 | | 12/05/13 | | 11.22% | | 10.34% | | |
| | | R4 | | 12/05/13 | | 11.42% | | 10.60% | | |
| | | R6 | | 12/05/13 | | 11.61% | | 10.69% | | |
| Comparative benchmark(s) | | | | | | |
| | | Standard & Poor’s 500 Stock Index (f) | | 16.23% | | 11.27% | | |
| Average annual with sales charge | | | | | | |
| | | A
With Initial Sales Charge (5.75%) | | 4.79% | | 8.62% | | |
| | | B
With CDSC (Declining over six years from 4% to 0%) (v) | | 6.36% | | 8.88% | | |
| | | C
With CDSC (1% for 12 months) (v) | | 9.36% | | 9.52% | | |
CDSC – Contingent Deferred Sales Charge.
Class I, R1, R2, R3, R4, and R6 shares do not have a sales charge.
Effective August 26, 2016, Class R5 shares were renamed Class R6 shares.
| (f) | Source: FactSet Research Systems Inc. |
| (t) | For the period from the class inception date through the stated period end. (See Notes to Performance Summary.) |
| (v) | Assuming redemption at the end of the applicable period. |
Benchmark Definition(s)
Standard & Poor’s 500 Stock Index – a market capitalization-weighted index of 500 widely held equity securities, designed to measure broad U.S. equity performance.
It is not possible to invest directly in an index.
Notes to Performance Summary
Average annual total return represents the average annual change in value for each share class for the periods presented. Life returns are presented where the share class has less than 10 years of performance history and represent the average annual total return from the class inception date to the stated period end date.
7
Performance Summary – continued
Performance results reflect any applicable expense subsidies and waivers in effect during the periods shown. Without such subsidies and waivers the fund’s performance results would be less favorable. Please see the prospectus and financial statements for complete details.
Performance results do not include adjustments made for financial reporting purposes in accordance with U.S. generally accepted accounting principles and may differ from amounts reported in the financial highlights.
From time to time the fund may receive proceeds from litigation settlements, without which performance would be lower.
8
EXPENSE TABLE
Fund expenses borne by the shareholders during the period, March 1, 2017 through August 31, 2017
As a shareholder of the fund, you incur two types of costs: (1) transaction costs, including sales charges (loads) on certain purchase or redemption payments, and (2) ongoing costs, including management fees; distribution and service (12b-1) fees; and other fund expenses. This example is intended to help you understand your ongoing costs (in dollars) of investing in the fund and to compare these costs with the ongoing costs of investing in other mutual funds.
The example is based on an investment of $1,000 invested at the beginning of the period and held for the entire period March 1, 2017 through August 31, 2017.
Actual Expenses
The first line for each share class in the following table provides information about actual account values and actual expenses. You may use the information in this line, together with the amount you invested, to estimate the expenses that you paid over the period. Simply divide your account value by $1,000 (for example, an $8,600 account value divided by $1,000 = 8.6), then multiply the result by the number in the first line under the heading entitled “Expenses Paid During Period” to estimate the expenses you paid on your account during this period.
Hypothetical Example for Comparison Purposes
The second line for each share class in the following table provides information about hypothetical account values and hypothetical expenses based on the fund’s actual expense ratio and an assumed rate of return of 5% per year before expenses, which is not the fund’s actual return. The hypothetical account values and expenses may not be used to estimate the actual ending account balance or expenses you paid for the period. You may use this information to compare the ongoing costs of investing in the fund and other funds. To do so, compare this 5% hypothetical example with the 5% hypothetical examples that appear in the shareholder reports of the other funds.
Please note that the expenses shown in the table are meant to highlight your ongoing costs only and do not reflect any transactional costs, such as sales charges (loads). Therefore, the second line for each share class in the table is useful in comparing ongoing costs only, and will not help you determine the relative total costs of owning different funds. In addition, if these transactional costs were included, your costs would have been higher.
9
Expense Table – continued
| | | | | | | | | | | | |
Share Class | | | | Annualized
Expense
Ratio | | Beginning
Account Value
3/01/17 | | Ending
Account Value
8/31/17 | | Expenses
Paid During
Period (p)
3/01/17-8/31/17 | |
| A | | Actual | | 1.14% | | $1,000.00 | | $1,045.41 | | | $5.88 | |
| | Hypothetical (h) | | 1.14% | | $1,000.00 | | $1,019.46 | | | $5.80 | |
| B | | Actual | | 1.90% | | $1,000.00 | | $1,041.70 | | | $9.78 | |
| | Hypothetical (h) | | 1.90% | | $1,000.00 | | $1,015.63 | | | $9.65 | |
| C | | Actual | | 1.90% | | $1,000.00 | | $1,041.30 | | | $9.78 | |
| | Hypothetical (h) | | 1.90% | | $1,000.00 | | $1,015.63 | | | $9.65 | |
| I | | Actual | | 0.90% | | $1,000.00 | | $1,046.57 | | | $4.64 | |
| | Hypothetical (h) | | 0.90% | | $1,000.00 | | $1,020.67 | | | $4.58 | |
| R1 | | Actual | | 1.89% | | $1,000.00 | | $1,041.57 | | | $9.73 | |
| | Hypothetical (h) | | 1.89% | | $1,000.00 | | $1,015.68 | | | $9.60 | |
| R2 | | Actual | | 1.39% | | $1,000.00 | | $1,043.90 | | | $7.16 | |
| | Hypothetical (h) | | 1.39% | | $1,000.00 | | $1,018.20 | | | $7.07 | |
| R3 | | Actual | | 1.15% | | $1,000.00 | | $1,045.18 | | | $5.93 | |
| | Hypothetical (h) | | 1.15% | | $1,000.00 | | $1,019.41 | | | $5.85 | |
| R4 | | Actual | | 0.90% | | $1,000.00 | | $1,046.46 | | | $4.64 | |
| | Hypothetical (h) | | 0.90% | | $1,000.00 | | $1,020.67 | | | $4.58 | |
| R6 | | Actual | | 0.75% | | $1,000.00 | | $1,047.71 | | | $3.87 | |
| | Hypothetical (h) | | 0.75% | | $1,000.00 | | $1,021.42 | | | $3.82 | |
| (h) | 5% class return per year before expenses. |
| (p) | “Expenses Paid During Period” are equal to each class’s annualized expense ratio, as shown above, multiplied by the average account value over the period, multiplied by 184/365 (to reflect the one-half year period). Expenses paid do not include any applicable sales charges (loads). If these transaction costs had been included, your costs would have been higher. |
Notes to Expense Table
Each class with a Rule 12b-1 service fee is subject to a rebate of a portion of such fee. Such rebates are included in the expense ratios above and are outside of the expense limitation arrangement. For Class A shares, this rebate reduced the expense ratio above by 0.01%. See Note 3 in the Notes to Financial Statements for additional information.
Changes to the fund’s fee arrangements occurred during the six month period. Had these fee changes been in effect throughout the entire six month period, the annualized expense ratios, the actual expenses paid during the period, and the hypothetical expenses paid during the period would have been approximately 0.88%, $4.54, and $4.48 for Class A, 1.64%, $8.44, and $8.34 for Class B, 1.64%, $8.44, and $8.34 for Class C, 0.64%, $3.30, and $3.26 for Class I, 1.64%, $8.44, and $8.34 for Class R1, 1.14%, $5.87, and $5.80 for Class R2, 0.89%, $4.59, and $4.53 for Class R3, 0.64%, $3.30, and $3.26 for Class R4, and 0.55%, $2.84, and $2.80 for Class R6, respectively. For further information about the fund’s fee arrangements and changes to those fee arrangements, please see Note 3 in the Notes to Financial Statements.
10
PORTFOLIO OF INVESTMENTS
8/31/17
The Portfolio of Investments is a complete list of all securities owned by your fund. It is categorized by broad-based asset classes.
| | | | | | | | |
| Common Stocks - 99.2% | | | | | | | | |
| Issuer | | Shares/Par | | | Value ($) | |
| Aerospace - 4.5% | | | | | | | | |
| General Dynamics Corp. | | | 2,439 | | | $ | 491,093 | |
| Honeywell International, Inc. | | | 5,638 | | | | 779,566 | |
| Lockheed Martin Corp. | | | 2,592 | | | | 791,571 | |
| Northrop Grumman Corp. | | | 3,944 | | | | 1,073,596 | |
| United Technologies Corp. | | | 4,579 | | | | 548,198 | |
| | | | | | | | |
| | | | | | | $ | 3,684,024 | |
| Alcoholic Beverages - 1.3% | | | | | | | | |
| Constellation Brands, Inc., “A” | | | 5,467 | | | $ | 1,093,947 | |
| | |
| Brokerage & Asset Managers - 1.2% | | | | | | | | |
| CME Group, Inc. | | | 8,072 | | | $ | 1,015,458 | |
| | |
| Business Services - 2.7% | | | | | | | | |
| Amdocs Ltd. | | | 34,056 | | | $ | 2,206,488 | |
| | |
| Cable TV - 0.8% | | | | | | | | |
| Comcast Corp., “A” | | | 15,972 | | | $ | 648,623 | |
| | |
| Computer Software - 2.0% | | | | | | | | |
| Blackbaud, Inc. | | | 3,926 | | | $ | 331,394 | |
| Intuit, Inc. | | | 6,700 | | | | 947,715 | |
| Oracle Corp. | | | 6,982 | | | | 351,404 | |
| | | | | | | | |
| | | | | | | $ | 1,630,513 | |
| Computer Software - Systems - 0.9% | | | | | | | | |
| Apple, Inc. | | | 4,663 | | | $ | 764,732 | |
| | |
| Construction - 0.6% | | | | | | | | |
| Toll Brothers, Inc. | | | 11,887 | | | $ | 463,118 | |
| | |
| Consumer Products - 1.9% | | | | | | | | |
| Colgate-Palmolive Co. | | | 5,665 | | | $ | 405,840 | |
| Procter & Gamble Co. | | | 13,073 | | | | 1,206,246 | |
| | | | | | | | |
| | | | | | | $ | 1,612,086 | |
| Consumer Services - 1.5% | | | | | | | | |
| Bright Horizons Family Solutions, Inc. (a) | | | 15,963 | | | $ | 1,275,923 | |
11
Portfolio of Investments – continued
| | | | | | | | |
| Issuer | | Shares/Par | | | Value ($) | |
| Common Stocks - continued | | | | | | | | |
| Electronics - 1.2% | | | | | | | | |
| Texas Instruments, Inc. | | | 11,843 | | | $ | 980,837 | |
| | |
| Energy - Independent - 0.6% | | | | | | | | |
| Occidental Petroleum Corp. | | | 8,623 | | | $ | 514,793 | |
| | |
| Energy - Integrated - 0.7% | | | | | | | | |
| Exxon Mobil Corp. | | | 7,876 | | | $ | 601,175 | |
| | |
| Entertainment - 0.7% | | | | | | | | |
| Madison Square Garden Co., “A” (a) | | | 2,755 | | | $ | 585,465 | |
| | |
| Food & Beverages - 5.6% | | | | | | | | |
| Coca-Cola Co. | | | 7,986 | | | $ | 363,762 | |
| Dr Pepper Snapple Group, Inc. | | | 4,022 | | | | 366,203 | |
| General Mills, Inc. | | | 18,108 | | | | 964,432 | |
| Mondelez International, Inc. | | | 8,467 | | | | 344,268 | |
| PepsiCo, Inc. | | | 18,249 | | | | 2,111,957 | |
| Pinnacle Foods, Inc. | | | 8,170 | | | | 484,563 | |
| | | | | | | | |
| | | | | | | $ | 4,635,185 | |
| Gaming & Lodging - 1.2% | | | | | | | | |
| Carnival Corp. | | | 14,907 | | | $ | 1,035,738 | |
| | |
| General Merchandise - 3.8% | | | | | | | | |
| Costco Wholesale Corp. | | | 10,031 | | | $ | 1,572,259 | |
| Wal-Mart Stores, Inc. | | | 19,778 | | | | 1,544,068 | |
| | | | | | | | |
| | | | | | | $ | 3,116,327 | |
| Health Maintenance Organizations - 1.9% | | | | | | | | |
| Aetna, Inc. | | | 3,367 | | | $ | 530,976 | |
| UnitedHealth Group, Inc. | | | 5,121 | | | | 1,018,567 | |
| | | | | | | | |
| | | | | | | $ | 1,549,543 | |
| Insurance - 8.2% | | | | | | | | |
| Aon PLC | | | 2,719 | | | $ | 378,397 | |
| Chubb Ltd. | | | 4,611 | | | | 652,088 | |
| Everest Re Group Ltd. | | | 5,896 | | | | 1,488,622 | |
| Hartford Financial Services Group, Inc. | | | 17,743 | | | | 959,364 | |
| Loews Corp. | | | 23,269 | | | | 1,083,870 | |
| Markel Corp. (a) | | | 1,097 | | | | 1,154,033 | |
| MetLife, Inc. | | | 10,779 | | | | 504,781 | |
| Travelers Cos., Inc. | | | 4,575 | | | | 554,398 | |
| | | | | | | | |
| | | | | | | $ | 6,775,553 | |
12
Portfolio of Investments – continued
| | | | | | | | |
| Issuer | | Shares/Par | | | Value ($) | |
| Common Stocks - continued | | | | | | | | |
| Internet - 4.8% | | | | | | | | |
| Alphabet, Inc., “A” (a) | | | 1,844 | | | $ | 1,761,462 | |
| Facebook, Inc., “A” (a) | | | 12,938 | | | | 2,224,948 | |
| | | | | | | | |
| | | | | | | $ | 3,986,410 | |
| Major Banks - 0.6% | | | | | | | | |
| PNC Financial Services Group, Inc. | | | 3,850 | | | $ | 482,828 | |
| | |
| Medical & Health Technology & Services - 1.7% | | | | | | | | |
| Healthcare Services Group, Inc. | | | 12,830 | | | $ | 656,896 | |
| Henry Schein, Inc. (a) | | | 4,507 | | | | 782,776 | |
| | | | | | | | |
| | | | | | | $ | 1,439,672 | |
| Medical Equipment - 7.4% | | | | | | | | |
| Abbott Laboratories | | | 21,913 | | | $ | 1,116,248 | |
| Becton, Dickinson and Co. | | | 2,022 | | | | 403,268 | |
| Cooper Cos., Inc. | | | 3,056 | | | | 766,536 | |
| Danaher Corp. | | | 9,511 | | | | 793,408 | |
| Medtronic PLC | | | 14,701 | | | | 1,185,195 | |
| Steris PLC | | | 11,863 | | | | 1,033,979 | |
| Stryker Corp. | | | 2,662 | | | | 376,327 | |
| Zimmer Biomet Holdings, Inc. | | | 3,649 | | | | 416,971 | |
| | | | | | | | |
| | | | | | | $ | 6,091,932 | |
| Network & Telecom - 1.8% | | | | | | | | |
| Cisco Systems, Inc. | | | 34,186 | | | $ | 1,101,131 | |
| Motorola Solutions, Inc. | | | 4,488 | | | | 395,483 | |
| | | | | | | | |
| | | | | | | $ | 1,496,614 | |
| Oil Services - 1.6% | | | | | | | | |
| Schlumberger Ltd. | | | 20,810 | | | $ | 1,321,643 | |
| | |
| Other Banks & Diversified Financials - 3.9% | | | | | | | | |
| Citigroup, Inc. | | | 13,379 | | | $ | 910,173 | |
| M&T Bank Corp. | | | 4,412 | | | | 652,358 | |
| Mastercard, Inc., “A” | | | 5,347 | | | | 712,755 | |
| U.S. Bancorp | | | 9,596 | | | | 491,795 | |
| Visa, Inc., “A” | | | 4,176 | | | | 432,300 | |
| | | | | | | | |
| | | | | | | $ | 3,199,381 | |
| Pharmaceuticals - 6.9% | | | | | | | | |
| Eli Lilly & Co. | | | 19,792 | | | $ | 1,608,892 | |
| Johnson & Johnson | | | 14,617 | | | | 1,934,852 | |
| Merck & Co., Inc. | | | 21,982 | | | | 1,403,770 | |
| Pfizer, Inc. | | | 12,228 | | | | 414,774 | |
13
Portfolio of Investments – continued
| | | | | | | | |
| Issuer | | Shares/Par | | | Value ($) | |
| Common Stocks - continued | | | | | | | | |
| Pharmaceuticals - continued | | | | | | | | |
| Zoetis, Inc. | | | 5,570 | | | $ | 349,239 | |
| | | | | | | | |
| | | | | | | $ | 5,711,527 | |
| Pollution Control - 3.7% | | | | | | | | |
| Republic Services, Inc. | | | 15,412 | | | $ | 1,005,479 | |
| Waste Connections, Inc. | | | 30,555 | | | | 2,037,713 | |
| | | | | | | | |
| | | | | | | $ | 3,043,192 | |
| Real Estate - 7.3% | | | | | | | | |
| AvalonBay Communities, Inc., REIT | | | 6,278 | | | $ | 1,178,569 | |
| Equity Lifestyle Properties, Inc., REIT | | | 7,268 | | | | 647,942 | |
| Mid-America Apartment Communities, Inc., REIT | | | 6,313 | | | | 672,082 | |
| Public Storage, Inc., REIT | | | 4,567 | | | | 937,788 | |
| Starwood Property Trust, Inc., REIT | | | 81,511 | | | | 1,810,359 | |
| Store Capital Corp., REIT | | | 13,913 | | | | 353,112 | |
| Sun Communities, Inc., REIT | | | 4,561 | | | | 411,904 | |
| | | | | | | | |
| | | | | | | $ | 6,011,756 | |
| Restaurants - 3.6% | | | | | | | | |
| Aramark | | | 8,283 | | | $ | 337,035 | |
| McDonald’s Corp. | | | 12,627 | | | | 2,019,941 | |
| Starbucks Corp. | | | 10,848 | | | | 595,122 | |
| | | | | | | | |
| | | | | | | $ | 2,952,098 | |
| Specialty Chemicals - 1.5% | | | | | | | | |
| Ecolab, Inc. | | | 6,823 | | | $ | 909,506 | |
| Praxair, Inc. | | | 2,620 | | | | 344,635 | |
| | | | | | | | |
| | | | | | | $ | 1,254,141 | |
| Specialty Stores - 0.6% | | | | | | | | |
| Home Depot, Inc. | | | 3,489 | | | $ | 522,896 | |
| | |
| Telecommunications - Wireless - 0.5% | | | | | | | | |
| SBA Communications Corp., REIT (a) | | | 2,652 | | | $ | 407,215 | |
| | |
| Telephone Services - 0.8% | | | | | | | | |
| Verizon Communications, Inc. | | | 14,122 | | | $ | 677,432 | |
| | |
| Tobacco - 3.0% | | | | | | | | |
| Altria Group, Inc. | | | 24,723 | | | $ | 1,567,438 | |
| Philip Morris International, Inc. | | | 7,736 | | | | 904,571 | |
| | | | | | | | |
| | | | | | | $ | 2,472,009 | |
14
Portfolio of Investments – continued
| | | | | | | | |
| Issuer | | Shares/Par | | | Value ($) | |
| Common Stocks - continued | | | | | | | | |
| Utilities - Electric Power - 8.2% | | | | | | | | |
| Alliant Energy Corp. | | | 20,007 | | | $ | 855,099 | |
| American Electric Power Co., Inc. | | | 6,777 | | | | 498,991 | |
| Consolidated Edison, Inc. | | | 3,750 | | | | 316,013 | |
| Dominion Energy, Inc. | | | 6,141 | | | | 483,727 | |
| DTE Energy Co. | | | 8,473 | | | | 951,687 | |
| Duke Energy Corp. | | | 11,704 | | | | 1,021,759 | |
| Exelon Corp. | | | 10,779 | | | | 408,201 | |
| NextEra Energy, Inc. | | | 6,712 | | | | 1,010,223 | |
| Pinnacle West Capital Corp. | | | 4,022 | | | | 361,859 | |
| WEC Energy Group, Inc. | | | 6,093 | | | | 397,385 | |
| Xcel Energy, Inc. | | | 10,090 | | | | 499,455 | |
| | | | | | | | |
| | | | | | | $ | 6,804,399 | |
| Total Common Stocks (Identified Cost, $70,837,335) | | | | | | $ | 82,064,673 | |
| | |
| Investment Companies (h) - 0.8% | | | | | | | | |
| Money Market Funds - 0.8% | | | | | | | | |
MFS Institutional Money Market Portfolio, 1.11% (v)
(Identified Cost, $631,939) | | | 631,939 | | | $ | 631,939 | |
| | |
| Other Assets, Less Liabilities - 0.0% | | | | | | | 3,454 | |
| Net Assets - 100.0% | | | | | | $ | 82,700,066 | |
| (a) | Non-income producing security. |
| (h) | An affiliated issuer may be considered one in which the fund owns 5% or more of the outstanding voting securities, or a company which is under common control. At period end, the aggregate values of the fund’s investments in affiliated issuers and in unaffiliated issuers were $631,939 and $82,064,673, respectively. |
| (v) | Affiliated issuer that is available only to investment companies managed by MFS. The rate quoted for the MFS Institutional Money Market Portfolio is the annualized seven-day yield of the fund at period end. |
The following abbreviations are used in this report and are defined:
| PLC | | Public Limited Company |
| REIT | | Real Estate Investment Trust |
See Notes to Financial Statements
15
Financial Statements
STATEMENT OF ASSETS AND LIABILITIES
At 8/31/17
This statement represents your fund’s balance sheet, which details the assets and liabilities comprising the total value of the fund.
| | | | |
| Assets | | | | |
Investments in unaffiliated issuers, at value (identified cost, $70,837,335) | | | $82,064,673 | |
Investments in affiliated issuers, at value (identified cost, $631,939) | | | 631,939 | |
Receivables for | | | | |
Fund shares sold | | | 225,577 | |
Dividends | | | 154,698 | |
Receivable from investment adviser | | | 21,671 | |
Other assets | | | 137 | |
Total assets | | | $83,098,695 | |
| Liabilities | | | | |
Payables for | | | | |
Investments purchased | | | $81,334 | |
Fund shares reacquired | | | 230,135 | |
Payable to affiliates | | | | |
Shareholder servicing costs | | | 16,086 | |
Distribution and service fees | | | 718 | |
Payable for independent Trustees’ compensation | | | 11 | |
Accrued expenses and other liabilities | | | 70,345 | |
Total liabilities | | | $398,629 | |
Net assets | | | $82,700,066 | |
| Net assets consist of | | | | |
Paid-in capital | | | $71,522,580 | |
Unrealized appreciation (depreciation) | | | 11,227,338 | |
Accumulated distributions in excess of net realized gain | | | (229,609 | ) |
Undistributed net investment income | | | 179,757 | |
Net assets | | | $82,700,066 | |
Shares of beneficial interest outstanding | | | 6,009,665 | |
16
Statement of Assets and Liabilities – continued
| | | | | | | | | | | | |
| | | Net assets | | | Shares
outstanding | | | Net asset value
per share (a) | |
Class A | | | $39,568,430 | | | | 2,874,414 | | | | $13.77 | |
Class B | | | 2,081,382 | | | | 151,520 | | | | 13.74 | |
Class C | | | 12,421,952 | | | | 906,790 | | | | 13.70 | |
Class I | | | 21,813,836 | | | | 1,583,018 | | | | 13.78 | |
Class R1 | | | 107,866 | | | | 7,834 | | | | 13.77 | |
Class R2 | | | 74,213 | | | | 5,368 | | | | 13.83 | |
Class R3 | | | 58,873 | | | | 4,263 | | | | 13.81 | |
Class R4 | | | 58,813 | | | | 4,265 | | | | 13.79 | |
Class R6 | | | 6,514,701 | | | | 472,193 | | | | 13.80 | |
| (a) | Maximum offering price per share was equal to the net asset value per share for all share classes, except for Class A, for which the maximum offering price per share was $14.61 [100 / 94.25 x $13.77]. On sales of $50,000 or more, the maximum offering price of Class A shares is reduced. A contingent deferred sales charge may be imposed on redemptions of Class A, Class B, and Class C shares. Redemption price per share was equal to the net asset value per share for Classes I, R1, R2, R3, R4, and R6. |
See Notes to Financial Statements
17
Financial Statements
STATEMENT OF OPERATIONS
Year ended 8/31/17
This statement describes how much your fund earned in investment income and accrued in expenses. It also describes any gains and/or losses generated by fund operations.
| | | | |
| Net investment income (loss) | | | | |
Income | | | | |
Dividends | | | $1,635,575 | |
Dividends from affiliated issuers | | | 6,210 | |
Interest | | | 26 | |
Foreign taxes withheld | | | (1,558 | ) |
Total investment income | | | $1,640,253 | |
Expenses | | | | |
Management fee | | | 411,048 | |
Distribution and service fees | | | 217,543 | |
Shareholder servicing costs | | | 82,657 | |
Administrative services fee | | | 20,657 | |
Independent Trustees’ compensation | | | 2,207 | |
Custodian fee | | | 10,667 | |
Shareholder communications | | | 26,440 | |
Audit and tax fees | | | 49,052 | |
Legal fees | | | 1,291 | |
Registration fees | | | 127,717 | |
Miscellaneous | | | 16,472 | |
Total expenses | | | $965,751 | |
Reduction of expenses by investment adviser and distributor | | | (112,776 | ) |
Net expenses | | | $852,975 | |
Net investment income (loss) | | | $787,278 | |
| Realized and unrealized gain (loss) | | | | |
Realized gain (loss) (identified cost basis) | | | | |
Unaffiliated issuers | | | $344,007 | |
Affiliated issuers | | | (9 | ) |
Net realized gain (loss) | | | $343,998 | |
Change in unrealized appreciation (depreciation) on unaffiliated issuers | | | 6,210,716 | |
Net realized and unrealized gain (loss) | | | $6,554,714 | |
Change in net assets from operations | | | $7,341,992 | |
See Notes to Financial Statements
18
Financial Statements
STATEMENTS OF CHANGES IN NET ASSETS
These statements describe the increases and/or decreases in net assets resulting from operations, any distributions, and any shareholder transactions.
| | | | | | | | |
| | | Year ended | |
| | | 8/31/17 | | | 8/31/16 | |
| Change in net assets | | | | | | |
| From operations | | | | | | | | |
Net investment income (loss) | | | $787,278 | | | | $424,103 | |
Net realized gain (loss) | | | 343,998 | | | | (287,502 | ) |
Net unrealized gain (loss) | | | 6,210,716 | | | | 5,042,099 | |
Change in net assets from operations | | | $7,341,992 | | | | $5,178,700 | |
| Distributions declared to shareholders | | | | | | | | |
From net investment income | | | $(761,769 | ) | | | $(300,213 | ) |
From net realized gain on investments | | | (134,785 | ) | | | (135,911 | ) |
Total distributions declared to shareholders | | | $(896,554 | ) | | | $(436,124 | ) |
Change in net assets from fund share transactions | | | $16,852,555 | | | | $38,103,303 | |
Total change in net assets | | | $23,297,993 | | | | $42,845,879 | |
| Net assets | | | | | | | | |
At beginning of period | | | 59,402,073 | | | | 16,556,194 | |
At end of period (including undistributed net investment income of $179,757 and $154,248, respectively) | | | $82,700,066 | | | | $59,402,073 | |
See Notes to Financial Statements
19
Financial Statements
FINANCIAL HIGHLIGHTS
The financial highlights table is intended to help you understand the fund’s financial performance for the past 5 years (or life of a particular share class, if shorter). Certain information reflects financial results for a single fund share. The total returns in the table represent the rate that an investor would have earned (or lost) on an investment in the fund share class (assuming reinvestment of all distributions) held for the entire period.
| | | | | | | | | | | | | | | | |
| Class A | | Year ended | |
| | | 8/31/17 | | | 8/31/16 | | | 8/31/15 | | | 8/31/14 (c) | |
Net asset value, beginning of period | | | $12.56 | | | | $11.12 | | | | $10.82 | | | | $10.00 | |
| Income (loss) from investment operations | | | | | | | | | | | | | | | | |
Net investment income (loss) (d) | | | $0.16 | | | | $0.15 | | | | $0.14 | | | | $0.11 | |
Net realized and unrealized gain (loss) | | | 1.23 | | | | 1.49 | | | | 0.30 | (g) | | | 0.77 | |
Total from investment operations | | | $1.39 | | | | $1.64 | | | | $0.44 | | | | $0.88 | |
| Less distributions declared to shareholders | | | | | | | | | | | | | | | | |
From net investment income | | | $(0.15 | ) | | | $(0.11 | ) | | | $(0.13 | ) | | | $(0.06 | ) |
From net realized gain | | | (0.03 | ) | | | (0.09 | ) | | | (0.01 | ) | | | — | |
Total distributions declared to shareholders | | | $(0.18 | ) | | | $(0.20 | ) | | | $(0.14 | ) | | | $(0.06 | ) |
Net asset value, end of period (x) | | | $13.77 | | | | $12.56 | | | | $11.12 | | | | $10.82 | |
Total return (%) (r)(s)(t)(x) | | | 11.18 | | | | 14.87 | | | | 4.01 | | | | 8.82 | (n) |
Ratios (%) (to average net assets)
and Supplemental data: | | | | | | | | | | | | | | | | |
Expenses before expense reductions (f) | | | 1.33 | | | | 1.65 | | | | 2.72 | | | | 4.45 | (a) |
Expenses after expense reductions (f) | | | 1.16 | | | | 1.19 | | | | 1.18 | | | | 1.15 | (a) |
Net investment income (loss) | | | 1.19 | | | | 1.25 | | | | 1.22 | | | | 1.40 | (a) |
Portfolio turnover | | | 36 | | | | 38 | | | | 33 | | | | 30 | (n) |
Net assets at end of period (000 omitted) | | | $39,568 | | | | $29,508 | | | | $11,267 | | | | $1,154 | |
See Notes to Financial Statements
20
Financial Highlights – continued
| | | | | | | | | | | | | | | | |
| Class B | | Year ended | |
| | | 8/31/17 | | | 8/31/16 | | | 8/31/15 | | | 8/31/14 (c) | |
Net asset value, beginning of period | | | $12.53 | | | | $11.10 | | | | $10.81 | | | | $10.00 | |
| Income (loss) from investment operations | | | | | | | | | | | | | | | | |
Net investment income (loss) (d) | | | $0.06 | | | | $0.06 | | | | $0.05 | | | | $0.04 | |
Net realized and unrealized gain (loss) | | | 1.23 | | | | 1.48 | | | | 0.30 | (g) | | | 0.78 | |
Total from investment operations | | | $1.29 | | | | $1.54 | | | | $0.35 | | | | $0.82 | |
| Less distributions declared to shareholders | | | | | | | | | | | | | | | | |
From net investment income | | | $(0.05 | ) | | | $(0.02 | ) | | | $(0.05 | ) | | | $(0.01 | ) |
From net realized gain | | | (0.03 | ) | | | (0.09 | ) | | | (0.01 | ) | | | — | |
Total distributions declared to shareholders | | | $(0.08 | ) | | | $(0.11 | ) | | | $(0.06 | ) | | | $(0.01 | ) |
Net asset value, end of period (x) | | | $13.74 | | | | $12.53 | | | | $11.10 | | | | $10.81 | |
Total return (%) (r)(s)(t)(x) | | | 10.36 | | | | 13.96 | | | | 3.20 | | | | 8.23 | (n) |
Ratios (%) (to average net assets)
and Supplemental data: | | | | | | | | | | | | | | | | |
Expenses before expense reductions (f) | | | 2.08 | | | | 2.42 | | | | 3.79 | | | | 5.75 | (a) |
Expenses after expense reductions (f) | | | 1.92 | | | | 1.95 | | | | 1.95 | | | | 1.93 | (a) |
Net investment income (loss) | | | 0.43 | | | | 0.49 | | | | 0.43 | | | | 0.46 | (a) |
Portfolio turnover | | | 36 | | | | 38 | | | | 33 | | | | 30 | (n) |
Net assets at end of period (000 omitted) | | | $2,081 | | | | $1,885 | | | | $717 | | | | $170 | |
| |
| Class C | | Year ended | |
| | | 8/31/17 | | | 8/31/16 | | | 8/31/15 | | | 8/31/14 (c) | |
Net asset value, beginning of period | | | $12.50 | | | | $11.09 | | | | $10.80 | | | | $10.00 | |
| Income (loss) from investment operations | | | | | | | | | | | | | | | | |
Net investment income (loss) (d) | | | $0.06 | | | | $0.06 | | | | $0.05 | | | | $0.04 | |
Net realized and unrealized gain (loss) | | | 1.23 | | | | 1.48 | | | | 0.30 | (g) | | | 0.79 | |
Total from investment operations | | | $1.29 | | | | $1.54 | | | | $0.35 | | | | $0.83 | |
| Less distributions declared to shareholders | | | | | | | | | | | | | | | | |
From net investment income | | | $(0.06 | ) | | | $(0.04 | ) | | | $(0.05 | ) | | | $(0.03 | ) |
From net realized gain | | | (0.03 | ) | | | (0.09 | ) | | | (0.01 | ) | | | — | |
Total distributions declared to shareholders | | | $(0.09 | ) | | | $(0.13 | ) | | | $(0.06 | ) | | | $(0.03 | ) |
Net asset value, end of period (x) | | | $13.70 | | | | $12.50 | | | | $11.09 | | | | $10.80 | |
Total return (%) (r)(s)(t)(x) | | | 10.36 | | | | 13.91 | | | | 3.23 | | | | 8.27 | (n) |
Ratios (%) (to average net assets)
and Supplemental data: | | | | | | | | | | | | | | | | |
Expenses before expense reductions (f) | | | 2.08 | | | | 2.31 | | | | 3.73 | | | | 5.39 | (a) |
Expenses after expense reductions (f) | | | 1.92 | | | | 1.95 | | | | 1.95 | | | | 1.93 | (a) |
Net investment income (loss) | | | 0.43 | | | | 0.48 | | | | 0.43 | | | | 0.48 | (a) |
Portfolio turnover | | | 36 | | | | 38 | | | | 33 | | | | 30 | (n) |
Net assets at end of period (000 omitted) | | | $12,422 | | | | $9,977 | | | | $1,564 | | | | $421 | |
See Notes to Financial Statements
21
Financial Highlights – continued
| | | | | | | | | | | | | | | | |
| Class I | | Year ended | |
| | | 8/31/17 | | | 8/31/16 | | | 8/31/15 | | | 8/31/14 (c) | |
Net asset value, beginning of period | | | $12.57 | | | | $11.14 | | | | $10.84 | | | | $10.00 | |
| Income (loss) from investment operations | | | | | | | | | | | | | | | | |
Net investment income (loss) (d) | | | $0.19 | | | | $0.18 | | | | $0.16 | | | | $0.11 | |
Net realized and unrealized gain (loss) | | | 1.23 | | | | 1.48 | | | | 0.30 | (g) | | | 0.80 | |
Total from investment operations | | | $1.42 | | | | $1.66 | | | | $0.46 | | | | $0.91 | |
| Less distributions declared to shareholders | | | | | | | | | | | | | | | | |
From net investment income | | | $(0.18 | ) | | | $(0.14 | ) | | | $(0.15 | ) | | | $(0.07 | ) |
From net realized gain | | | (0.03 | ) | | | (0.09 | ) | | | (0.01 | ) | | | — | |
Total distributions declared to shareholders | | | $(0.21 | ) | | | $(0.23 | ) | | | $(0.16 | ) | | | $(0.07 | ) |
Net asset value, end of period (x) | | | $13.78 | | | | $12.57 | | | | $11.14 | | | | $10.84 | |
Total return (%) (r)(s)(t)(x) | | | 11.44 | | | | 15.05 | | | | 4.20 | | | | 9.09 | (n) |
Ratios (%) (to average net assets)
and Supplemental data: | | | | | | | | | | | | | | | | |
Expenses before expense reductions (f) | | | 1.07 | | | | 1.20 | | | | 2.53 | | | | 4.72 | (a) |
Expenses after expense reductions (f) | | | 0.92 | | | | 0.95 | | | | 0.95 | | | | 0.93 | (a) |
Net investment income (loss) | | | 1.47 | | | | 1.51 | | | | 1.36 | | | | 1.43 | (a) |
Portfolio turnover | | | 36 | | | | 38 | | | | 33 | | | | 30 | (n) |
Net assets at end of period (000 omitted) | | | $21,814 | | | | $16,123 | | | | $964 | | | | $177 | |
| |
| Class R1 | | Year ended | |
| | | 8/31/17 | | | 8/31/16 | | | 8/31/15 | | | 8/31/14 (c) | |
Net asset value, beginning of period | | | $12.57 | | | | $11.12 | | | | $10.82 | | | | $10.00 | |
| Income (loss) from investment operations | | | | | | | | | | | | | | | | |
Net investment income (loss) (d) | | | $0.05 | | | | $0.06 | | | | $0.04 | | | | $0.03 | |
Net realized and unrealized gain (loss) | | | 1.24 | | | | 1.49 | | | | 0.31 | (g) | | | 0.80 | |
Total from investment operations | | | $1.29 | | | | $1.55 | | | | $0.35 | | | | $0.83 | |
| Less distributions declared to shareholders | | | | | | | | | | | | | | | | |
From net investment income | | | $(0.06 | ) | | | $(0.01 | ) | | | $(0.04 | ) | | | $(0.01 | ) |
From net realized gain | | | (0.03 | ) | | | (0.09 | ) | | | (0.01 | ) | | | — | |
Total distributions declared to shareholders | | | $(0.09 | ) | | | $(0.10 | ) | | | $(0.05 | ) | | | $(0.01 | ) |
Net asset value, end of period (x) | | | $13.77 | | | | $12.57 | | | | $11.12 | | | | $10.82 | |
Total return (%) (r)(s)(t)(x) | | | 10.33 | | | | 13.96 | | | | 3.18 | | | | 8.30 | (n) |
Ratios (%) (to average net assets)
and Supplemental data: | | | | | | | | | | | | | | | | |
Expenses before expense reductions (f) | | | 2.07 | | | | 2.56 | | | | 4.18 | | | | 5.92 | (a) |
Expenses after expense reductions (f) | | | 1.91 | | | | 1.95 | | | | 1.95 | | | | 1.93 | (a) |
Net investment income (loss) | | | 0.41 | | | | 0.48 | | | | 0.39 | | | | 0.40 | (a) |
Portfolio turnover | | | 36 | | | | 38 | | | | 33 | | | | 30 | (n) |
Net assets at end of period (000 omitted) | | | $108 | | | | $57 | | | | $112 | | | | $108 | |
See Notes to Financial Statements
22
Financial Highlights – continued
| | | | | | | | | | | | | | | | |
| Class R2 | | Year ended | |
| | | 8/31/17 | | | 8/31/16 | | | 8/31/15 | | | 8/31/14 (c) | |
Net asset value, beginning of period | | | $12.61 | | | | $11.13 | | | | $10.83 | | | | $10.00 | |
| Income (loss) from investment operations | | | | | | | | | | | | | | | | |
Net investment income (loss) (d) | | | $0.12 | | | | $0.12 | | | | $0.10 | | | | $0.07 | |
Net realized and unrealized gain (loss) | | | 1.25 | | | | 1.49 | | | | 0.30 | (g) | | | 0.80 | |
Total from investment operations | | | $1.37 | | | | $1.61 | | | | $0.40 | | | | $0.87 | |
| Less distributions declared to shareholders | | | | | | | | | | | | | | | | |
From net investment income | | | $(0.12 | ) | | | $(0.04 | ) | | | $(0.09 | ) | | | $(0.04 | ) |
From net realized gain | | | (0.03 | ) | | | (0.09 | ) | | | (0.01 | ) | | | — | |
Total distributions declared to shareholders | | | $(0.15 | ) | | | $(0.13 | ) | | | $(0.10 | ) | | | $(0.04 | ) |
Net asset value, end of period (x) | | | $13.83 | | | | $12.61 | | | | $11.13 | | | | $10.83 | |
Total return (%) (r)(s)(t)(x) | | | 10.93 | | | | 14.57 | | | | 3.69 | | | | 8.69 | (n) |
Ratios (%) (to average net assets)
and Supplemental data: | | | | | | | | | | | | | | | | |
Expenses before expense reductions (f) | | | 1.58 | | | | 2.07 | | | | 3.68 | | | | 5.42 | (a) |
Expenses after expense reductions (f) | | | 1.42 | | | | 1.45 | | | | 1.45 | | | | 1.43 | (a) |
Net investment income (loss) | | | 0.91 | | | | 0.98 | | | | 0.89 | | | | 0.90 | (a) |
Portfolio turnover | | | 36 | | | | 38 | | | | 33 | | | | 30 | (n) |
Net assets at end of period (000 omitted) | | | $74 | | | | $53 | | | | $113 | | | | $109 | |
| |
| Class R3 | | Year ended | |
| | | 8/31/17 | | | 8/31/16 | | | 8/31/15 | | | 8/31/14 (c) | |
Net asset value, beginning of period | | | $12.59 | | | | $11.14 | | | | $10.83 | | | | $10.00 | |
| Income (loss) from investment operations | | | | | | | | | | | | | | | | |
Net investment income (loss) (d) | | | $0.15 | | | | $0.15 | | | | $0.13 | | | | $0.09 | |
Net realized and unrealized gain (loss) | | | 1.25 | | | | 1.48 | | | | 0.31 | (g) | | | 0.79 | |
Total from investment operations | | | $1.40 | | | | $1.63 | | | | $0.44 | | | | $0.88 | |
| Less distributions declared to shareholders | | | | | | | | | | | | | | | | |
From net investment income | | | $(0.15 | ) | | | $(0.09 | ) | | | $(0.12 | ) | | | $(0.05 | ) |
From net realized gain | | | (0.03 | ) | | | (0.09 | ) | | | (0.01 | ) | | | — | |
Total distributions declared to shareholders | | | $(0.18 | ) | | | $(0.18 | ) | | | $(0.13 | ) | | | $(0.05 | ) |
Net asset value, end of period (x) | | | $13.81 | | | | $12.59 | | | | $11.14 | | | | $10.83 | |
Total return (%) (r)(s)(t)(x) | | | 11.22 | | | | 14.72 | | | | 4.04 | | | | 8.84 | (n) |
Ratios (%) (to average net assets)
and Supplemental data: | | | | | | | | | | | | | | | | |
Expenses before expense reductions (f) | | | 1.33 | | | | 1.82 | | | | 3.43 | | | | 5.17 | (a) |
Expenses after expense reductions (f) | | | 1.17 | | | | 1.20 | | | | 1.20 | | | | 1.18 | (a) |
Net investment income (loss) | | | 1.18 | | | | 1.23 | | | | 1.14 | | | | 1.15 | (a) |
Portfolio turnover | | | 36 | | | | 38 | | | | 33 | | | | 30 | (n) |
Net assets at end of period (000 omitted) | | | $59 | | | | $53 | | | | $113 | | | | $109 | |
See Notes to Financial Statements
23
Financial Highlights – continued
| | | | | | | | | | | | | | | | |
| Class R4 | | Year ended | |
| | | 8/31/17 | | | 8/31/16 | | | 8/31/15 | | | 8/31/14 (c) | |
Net asset value, beginning of period | | | $12.58 | | | | $11.14 | | | | $10.84 | | | | $10.00 | |
| Income (loss) from investment operations | | | | | | | | | | | | | | | | |
Net investment income (loss) (d) | | | $0.19 | | | | $0.17 | | | | $0.16 | | | | $0.11 | |
Net realized and unrealized gain (loss) | | | 1.23 | | | | 1.49 | | | | 0.30 | (g) | | | 0.80 | |
Total from investment operations | | | $1.42 | | | | $1.66 | | | | $0.46 | | | | $0.91 | |
| Less distributions declared to shareholders | | | | | | | | | | | | | | | | |
From net investment income | | | $(0.18 | ) | | | $(0.13 | ) | | | $(0.15 | ) | | | $(0.07 | ) |
From net realized gain | | | (0.03 | ) | | | (0.09 | ) | | | (0.01 | ) | | | — | |
Total distributions declared to shareholders | | | $(0.21 | ) | | | $(0.22 | ) | | | $(0.16 | ) | | | $(0.07 | ) |
Net asset value, end of period (x) | | | $13.79 | | | | $12.58 | | | | $11.14 | | | | $10.84 | |
Total return (%) (r)(s)(t)(x) | | | 11.42 | | | | 15.08 | | | | 4.20 | | | | 9.09 | (n) |
Ratios (%) (to average net assets)
and Supplemental data: | | | | | | | | | | | | | | | | |
Expenses before expense reductions (f) | | | 1.08 | | | | 1.57 | | | | 3.18 | | | | 4.92 | (a) |
Expenses after expense reductions (f) | | | 0.92 | | | | 0.95 | | | | 0.95 | | | | 0.93 | (a) |
Net investment income (loss) | | | 1.42 | | | | 1.48 | | | | 1.39 | | | | 1.40 | (a) |
Portfolio turnover | | | 36 | | | | 38 | | | | 33 | | | | 30 | (n) |
Net assets at end of period (000 omitted) | | | $59 | | | | $53 | | | | $114 | | | | $109 | |
| |
| Class R6 | | Year ended | |
| | | 8/31/17 | | | 8/31/16 | | | 8/31/15 | | | 8/31/14 (c) | |
Net asset value, beginning of period | | | $12.58 | | | | $11.14 | | | | $10.84 | | | | $10.00 | |
| Income (loss) from investment operations | | | | | | | | | | | | | | | | |
Net investment income (loss) (d) | | | $0.18 | | | | $0.18 | | | | $0.16 | | | | $0.11 | |
Net realized and unrealized gain (loss) | | | 1.27 | | | | 1.50 | | | | 0.30 | (g) | | | 0.80 | |
Total from investment operations | | | $1.45 | | | | $1.68 | | | | $0.46 | | | | $0.91 | |
| Less distributions declared to shareholders | | | | | | | | | | | | | | | | |
From net investment income | | | $(0.20 | ) | | | $(0.15 | ) | | | $(0.15 | ) | | | $(0.07 | ) |
From net realized gain | | | (0.03 | ) | | | (0.09 | ) | | | (0.01 | ) | | | — | |
Total distributions declared to shareholders | | | $(0.23 | ) | | | $(0.24 | ) | | | $(0.16 | ) | | | $(0.07 | ) |
Net asset value, end of period (x) | | | $13.80 | | | | $12.58 | | | | $11.14 | | | | $10.84 | |
Total return (%) (r)(s)(t)(x) | | | 11.61 | | | | 15.21 | | | | 4.22 | | | | 9.11 | (n) |
Ratios (%) (to average net assets)
and Supplemental data: | | | | | | | | | | | | | | | | |
Expenses before expense reductions (f) | | | 0.97 | | | | 1.36 | | | | 3.14 | | | | 4.90 | (a) |
Expenses after expense reductions (f) | | | 0.78 | | | | 0.88 | | | | 0.91 | | | | 0.91 | (a) |
Net investment income (loss) | | | 1.38 | | | | 1.53 | | | | 1.43 | | | | 1.42 | (a) |
Portfolio turnover | | | 36 | | | | 38 | | | | 33 | | | | 30 | (n) |
Net assets at end of period (000 omitted) | | | $6,515 | | | | $1,693 | | | | $1,593 | | | | $1,527 | |
See Notes to Financial Statements
24
Financial Highlights – continued
| (c) | For the period from the commencement of the fund’s investment operations, December 5, 2013, through the stated period end. |
| (d) | Per share data is based on average shares outstanding. |
| (f) | Ratios do not reflect reductions from fees paid indirectly, if applicable. |
| (g) | The per share amount varies from the net realized and unrealized gain/loss for the period because of the timing of sales of fund shares and the per share amount of realized and unrealized gains and losses at such time. |
| (r) | Certain expenses have been reduced without which performance would have been lower. |
| (s) | From time to time the fund may receive proceeds from litigation settlements, without which performance would be lower. |
| (t) | Total returns do not include any applicable sales charges. |
| (x) | The net asset values and total returns have been calculated on net assets which include adjustments made in accordance with U.S. generally accepted accounting principles required at period end for financial reporting purposes. |
See Notes to Financial Statements
25
NOTES TO FINANCIAL STATEMENTS
(1) Business and Organization
MFS Low Volatility Equity Fund (the fund) is a diversified series of MFS Series Trust I (the trust). The trust is organized as a Massachusetts business trust and is registered under the Investment Company Act of 1940, as amended, as an open-end management investment company.
The fund is an investment company and accordingly follows the investment company accounting and reporting guidance of the Financial Accounting Standards Board (FASB) Accounting Standards Codification Topic 946 Financial Services – Investment Companies.
(2) Significant Accounting Policies
General – The preparation of financial statements in conformity with U.S. generally accepted accounting principles requires management to make estimates and assumptions that affect the reported amounts of assets and liabilities, and disclosure of contingent assets and liabilities at the date of the financial statements and the reported amounts of increases and decreases in net assets from operations during the reporting period. Actual results could differ from those estimates. In the preparation of these financial statements, management has evaluated subsequent events occurring after the date of the fund’s Statement of Assets and Liabilities through the date that the financial statements were issued.
In October 2016, the Securities and Exchange Commission (SEC) released its Final Rule on Investment Company Reporting Modernization (the “Rule”). The Rule, which introduced two new regulatory reporting forms for investment companies – Form N-PORT and Form N-CEN – also contained amendments to Regulation S-X which impact financial statement presentation, particularly the presentation of derivative investments, for all reporting periods ending after August 1, 2017. The fund has adopted the Rule’s Regulation S-X amendments and believes that the fund’s financial statements are in compliance with those amendments.
Balance Sheet Offsetting – The fund’s accounting policy with respect to balance sheet offsetting is that, absent an event of default by the counterparty or a termination of the agreement, the International Swaps and Derivatives Association (ISDA) Master Agreement does not result in an offset of reported amounts of financial assets and financial liabilities in the Statement of Assets and Liabilities across transactions between the fund and the applicable counterparty. The fund’s right to setoff may be restricted or prohibited by the bankruptcy or insolvency laws of the particular jurisdiction to which a specific master netting agreement counterparty is subject. Balance sheet offsetting disclosures, to the extent applicable to the fund, have been included in the fund’s Significant Accounting Policies note under the captions for each of the fund’s in-scope financial instruments and transactions.
Investment Valuations – Equity securities, including restricted equity securities, are generally valued at the last sale or official closing price on their primary market or exchange as provided by a third-party pricing service. Equity securities, for which there were no sales reported that day, are generally valued at the last quoted daily bid quotation on their primary market or exchange as provided by a third-party pricing
26
Notes to Financial Statements – continued
service. Short-term instruments with a maturity at issuance of 60 days or less may be valued at amortized cost, which approximates market value. Open-end investment companies are generally valued at net asset value per share. Securities and other assets generally valued on the basis of information from a third-party pricing service may also be valued at a broker/dealer bid quotation. Values obtained from third-party pricing services can utilize both transaction data and market information such as yield, quality, coupon rate, maturity, type of issue, trading characteristics, and other market data.
The Board of Trustees has delegated primary responsibility for determining or causing to be determined the value of the fund’s investments (including any fair valuation) to the adviser pursuant to valuation policies and procedures approved by the Board. If the adviser determines that reliable market quotations are not readily available, investments are valued at fair value as determined in good faith by the adviser in accordance with such procedures under the oversight of the Board of Trustees. Under the fund’s valuation policies and procedures, market quotations are not considered to be readily available for most types of debt instruments and floating rate loans and many types of derivatives. These investments are generally valued at fair value based on information from third-party pricing services. In addition, investments may be valued at fair value if the adviser determines that an investment’s value has been materially affected by events occurring after the close of the exchange or market on which the investment is principally traded (such as foreign exchange or market) and prior to the determination of the fund’s net asset value, or after the halting of trading of a specific security where trading does not resume prior to the close of the exchange or market on which the security is principally traded. Events that occur on a frequent basis after foreign markets close (such as developments in foreign markets and significant movements in the U.S. markets) and prior to the determination of the fund’s net asset value may be deemed to have a material effect on the value of securities traded in foreign markets.
Accordingly, the fund’s foreign equity securities may often be valued at fair value. The adviser generally relies on third-party pricing services or other information (such as the correlation with price movements of similar securities in the same or other markets; the type, cost and investment characteristics of the security; the business and financial condition of the issuer; and trading and other market data) to assist in determining whether to fair value and at what value to fair value an investment. The value of an investment for purposes of calculating the fund’s net asset value can differ depending on the source and method used to determine value. When fair valuation is used, the value of an investment used to determine the fund’s net asset value may differ from quoted or published prices for the same investment. There can be no assurance that the fund could obtain the fair value assigned to an investment if it were to sell the investment at the same time at which the fund determines its net asset value per share.
Various inputs are used in determining the value of the fund’s assets or liabilities. These inputs are categorized into three broad levels. In certain cases, the inputs used to measure fair value may fall into different levels of the fair value hierarchy. In such cases, an investment’s level within the fair value hierarchy is based on the lowest level of input that is significant to the fair value measurement. The fund’s assessment of the significance of a particular input to the fair value measurement in its entirety requires judgment, and considers factors specific to the investment. Level 1 includes unadjusted quoted prices in active markets for identical assets or liabilities. Level 2 includes other
27
Notes to Financial Statements – continued
significant observable market-based inputs (including quoted prices for similar securities, interest rates, prepayment speed, and credit risk). Level 3 includes unobservable inputs, which may include the adviser’s own assumptions in determining the fair value of investments. The following is a summary of the levels used as of August 31, 2017 in valuing the fund’s assets or liabilities:
| | | | | | | | | | | | | | | | |
| Financial Instruments | | Level 1 | | | Level 2 | | | Level 3 | | | Total | |
| Equity Securities | | | $82,064,673 | | | | $— | | | | $— | | | | $82,064,673 | |
| Mutual Funds | | | 631,939 | | | | — | | | | — | | | | 631,939 | |
| Total | | | $82,696,612 | | | | $— | | | | $— | | | | $82,696,612 | |
For further information regarding security characteristics, see the Portfolio of Investments.
Indemnifications – Under the fund’s organizational documents, its officers and Trustees may be indemnified against certain liabilities and expenses arising out of the performance of their duties to the fund. Additionally, in the normal course of business, the fund enters into agreements with service providers that may contain indemnification clauses. The fund’s maximum exposure under these agreements is unknown as this would involve future claims that may be made against the fund that have not yet occurred.
Investment Transactions and Income – Investment transactions are recorded on the trade date. Dividends received in cash are recorded on the ex-dividend date. Certain dividends from foreign securities will be recorded when the fund is informed of the dividend if such information is obtained subsequent to the ex-dividend date. Dividend payments received in additional securities are recorded on the ex-dividend date in an amount equal to the value of the security on such date.
The fund may receive proceeds from litigation settlements. Any proceeds received from litigation involving portfolio holdings are reflected in the Statement of Operations in realized gain/loss if the security has been disposed of by the fund or in unrealized gain/loss if the security is still held by the fund. Any other proceeds from litigation not related to portfolio holdings are reflected as other income in the Statement of Operations.
Tax Matters and Distributions – The fund intends to qualify as a regulated investment company, as defined under Subchapter M of the Internal Revenue Code, and to distribute all of its taxable income, including realized capital gains. As a result, no provision for federal income tax is required. The fund’s federal tax returns, when filed, will remain subject to examination by the Internal Revenue Service for a three year period. Management has analyzed the fund’s tax positions taken on federal and state tax returns for all open tax years and does not believe that there are any uncertain tax positions that require recognition of a tax liability. Foreign taxes, if any, have been accrued by the fund in the accompanying financial statements in accordance with the applicable foreign tax law. Foreign income taxes may be withheld by certain countries in which the fund invests. Additionally, capital gains realized by the fund on securities issued in or by certain foreign countries may be subject to capital gains tax imposed by those countries.
Distributions to shareholders are recorded on the ex-dividend date. Income and capital gain distributions are determined in accordance with income tax regulations, which
28
Notes to Financial Statements – continued
may differ from U.S. generally accepted accounting principles. Certain capital accounts in the financial statements are periodically adjusted for permanent differences in order to reflect their tax character. These adjustments have no impact on net assets or net asset value per share. Temporary differences which arise from recognizing certain items of income, expense, gain or loss in different periods for financial statement and tax purposes will reverse at some time in the future. Distributions in excess of net investment income or net realized gains are temporary overdistributions for financial statement purposes resulting from differences in the recognition or classification of income or distributions for financial statement and tax purposes.
Book/tax differences primarily relate to wash sale loss deferrals and treating a portion of the proceeds from redemptions as a distribution for tax purposes.
The tax character of distributions declared to shareholders for the last two fiscal years is as follows:
| | | | | | | | |
| | | Year ended
8/31/17 | | | Year ended
8/31/16 | |
| Ordinary income (including any short-term capital gains) | | | $867,018 | | | | $349,626 | |
| Long-term capital gains | | | 29,536 | | | | 86,498 | |
| Total distributions | | | $896,554 | | | | $436,124 | |
The federal tax cost and the tax basis components of distributable earnings were as follows:
| | | | |
| As of 8/31/17 | | | |
| Cost of investments | | | $71,700,135 | |
| Gross appreciation | | | 11,574,213 | |
| Gross depreciation | | | (577,736 | ) |
| Net unrealized appreciation (depreciation) | | | $10,996,477 | |
| Undistributed ordinary income | | | 179,757 | |
| Undistributed long-term capital gain | | | 91,202 | |
| Post-October capital loss deferral | | | $(89,950 | ) |
Multiple Classes of Shares of Beneficial Interest – The fund offers multiple classes of shares, which differ in their respective distribution and service fees. The fund’s income, realized and unrealized gain (loss), and common expenses are allocated to shareholders based on the daily net assets of each class. Dividends are declared separately for each class. Differences in per share dividend rates are generally due to differences in separate class expenses. Class B shares will convert to Class A shares
29
Notes to Financial Statements – continued
approximately eight years after purchase. The fund’s distributions declared to shareholders as reported in the Statements of Changes in Net Assets are presented by class as follows:
| | | | | | | | | | | | | | | | |
| | | From net investment
income | | | From net realized gain on
investments | |
| | | Year
ended
8/31/17 | | | Year
ended
8/31/16 | | | Year
ended
8/31/17 | | | Year
ended
8/31/16 | |
| Class A | | | $401,351 | | | | $179,228 | | | | $72,819 | | | | $101,634 | |
| Class B | | | 8,063 | | | | 1,944 | | | | 4,185 | | | | 6,272 | |
| Class C | | | 50,551 | | | | 13,239 | | | | 22,638 | | | | 14,761 | |
| Class I | | | 275,528 | | | | 90,806 | | | | 31,512 | | | | 6,456 | |
| Class R1 | | | 375 | | | | 32 | | | | 129 | | | | 390 | |
| Class R2 | | | 501 | | | | 198 | | | | 119 | | | | 390 | |
| Class R3 | | | 638 | | | | 400 | | | | 120 | | | | 390 | |
| Class R4 | | | 776 | | | | 605 | | | | 120 | | | | 391 | |
| Class R6 | | | 23,986 | | | | 13,761 | | | | 3,143 | | | | 5,227 | |
| Total | | | $761,769 | | | | $300,213 | | | | $134,785 | | | | $135,911 | |
(3) Transactions with Affiliates
Investment Adviser – The fund has an investment advisory agreement with MFS to provide overall investment management and related administrative services and facilities to the fund. The management fee is computed daily and paid monthly at the following annual rates:
| | | | | | | | |
| | | Effective
Commencement
of Period | | | Effective
8/01/17 | |
| First $1 billion of average daily net assets | | | 0.60% | | | | 0.50% | |
| Next $1.5 billion of average daily net assets | | | 0.55% | | | | 0.475% | |
| Average daily net assets in excess of $2.5 billion | | | 0.50% | | | | 0.45% | |
MFS has agreed in writing to reduce its management fee by a specified amount if certain MFS mutual fund assets exceed thresholds agreed to by MFS and the fund’s Board of Trustees. For the year ended August 31, 2017, this management fee reduction amounted to $5,301, which is included in the reduction of total expenses in the Statement of Operations. The management fee incurred for the year ended August 31, 2017 was equivalent to an annual effective rate of 0.58% of the fund’s average daily net assets.
The investment adviser had agreed in writing to pay a portion of the fund’s total annual operating expenses, excluding interest, taxes, extraordinary expenses, brokerage and transaction costs, and investment-related expenses, such that total fund operating expenses did not exceed the following rates annually of each class’s average daily net assets:
| | | | | | | | | | | | | | | | | | | | | | | | | | | | | | | | |
| Classes | |
| A | | B | | | C | | | I | | | R1 | | | R2 | | | R3 | | | R4 | | | R6 | |
| 1.20% | | | 1.95% | | | | 1.95% | | | | 0.95% | | | | 1.95% | | | | 1.45% | | | | 1.20% | | | | 0.95% | | | | 0.91% | |
30
Notes to Financial Statements – continued
This written agreement terminated on July 31, 2017. For the period September 1, 2016 through July 31, 2017, this reduction amounted to $80,815, which is included in the reduction of total expenses in the Statement of Operations. Effective August 1, 2017, the investment adviser has agreed in writing to pay a portion of the fund’s total annual operating expenses, excluding interest, taxes, extraordinary expenses, brokerage and transaction costs, and investment-related expenses, such that total fund operating expenses do not exceed the following rates annually of each class’s average daily net assets:
| | | | | | | | | | | | | | | | | | | | | | | | | | | | | | | | |
| Classes | |
| A | | B | | | C | | | I | | | R1 | | | R2 | | | R3 | | | R4 | | | R6 | |
| 0.89% | | | 1.64% | | | | 1.64% | | | | 0.64% | | | | 1.64% | | | | 1.14% | | | | 0.89% | | | | 0.64% | | | | 0.57% | |
This written agreement will continue until modified by the fund’s Board of Trustees, but such agreement will continue at least until December 31, 2018. For the period August 1, 2017 through August 31, 2017, this reduction amounted to $23,138, which is included in the reduction of total expenses in the Statement of Operations.
Distributor – MFS Fund Distributors, Inc. (MFD), a wholly-owned subsidiary of MFS, as distributor, received $41,273 for the year ended August 31, 2017, as its portion of the initial sales charge on sales of Class A shares of the fund.
The Board of Trustees has adopted a distribution plan for certain share classes pursuant to Rule 12b-1 of the Investment Company Act of 1940.
The fund’s distribution plan provides that the fund will pay MFD for services provided by MFD and financial intermediaries in connection with the distribution and servicing of certain share classes. One component of the plan is a distribution fee paid to MFD and another component of the plan is a service fee paid to MFD. MFD may subsequently pay all, or a portion, of the distribution and/or service fees to financial intermediaries.
Distribution Plan Fee Table:
| | | | | | | | | | | | | | | | | | | | |
| | | Distribution
Fee Rate (d) | | | Service
Fee Rate (d) | | | Total
Distribution
Plan (d) | | | Annual
Effective
Rate (e) | | | Distribution
and Service
Fee | |
| Class A | | | — | | | | 0.25% | | | | 0.25% | | | | 0.24% | | | | $86,240 | |
| Class B | | | 0.75% | | | | 0.25% | | | | 1.00% | | | | 1.00% | | | | 19,567 | |
| Class C | | | 0.75% | | | | 0.25% | | | | 1.00% | | | | 1.00% | | | | 110,586 | |
| Class R1 | | | 0.75% | | | | 0.25% | | | | 1.00% | | | | 1.00% | | | | 726 | |
| Class R2 | | | 0.25% | | | | 0.25% | | | | 0.50% | | | | 0.50% | | | | 286 | |
| Class R3 | | | — | | | | 0.25% | | | | 0.25% | | | | 0.25% | | | | 138 | |
| Total Distribution and Service Fees | | | | | | | | | | | | $217,543 | |
| (d) | In accordance with the distribution plan for certain classes, the fund pays distribution and/or service fees equal to these annual percentage rates of each class’s average daily net assets. The distribution and service fee rates disclosed by class represent the current rates in effect at the end of the reporting period. Any rate changes, if applicable, are detailed below. |
| (e) | The annual effective rates represent actual fees incurred under the distribution plan for the year ended August 31, 2017 based on each class’s average daily net assets. MFD has voluntarily agreed to rebate a portion of each class’s 0.25% service fee attributable to accounts for which MFD retains the 0.25% service fee except for accounts attributable to MFS or its affiliates’ seed money. For the year ended August 31, 2017, this rebate amounted to $3,503 and $19 for Class A and Class B, respectively, and is included in the reduction of total expenses in the Statement of Operations. |
31
Notes to Financial Statements – continued
Certain Class A shares are subject to a contingent deferred sales charge (CDSC) in the event of a shareholder redemption within 18 months of purchase. Class C shares are subject to a CDSC in the event of a shareholder redemption within 12 months of purchase. Class B shares are subject to a CDSC in the event of a shareholder redemption within six years of purchase. All contingent deferred sales charges are paid to MFD and during the year ended August 31, 2017, were as follows:
| | | | |
| | | Amount | |
| Class A | | | $90 | |
| Class B | | | 8,881 | |
| Class C | | | 4,512 | |
Shareholder Servicing Agent – MFS Service Center, Inc. (MFSC), a wholly-owned subsidiary of MFS, receives a fee from the fund for its services as shareholder servicing agent calculated as a percentage of the average daily net assets of the fund as determined periodically under the supervision of the fund’s Board of Trustees. For the year ended August 31, 2017, the fee was $10,369, which equated to 0.0149% annually of the fund’s average daily net assets. MFSC also receives payment from the fund for out-of-pocket expenses, sub-accounting and other shareholder servicing costs which may be paid to affiliated and unaffiliated service providers. Class R6 shares do not incur sub-accounting fees. For the year ended August 31, 2017, these out-of-pocket expenses, sub-accounting and other shareholder servicing costs amounted to $72,288.
Administrator – MFS provides certain financial, legal, shareholder communications, compliance, and other administrative services to the fund. Under an administrative services agreement, the fund reimburses MFS the costs incurred to provide these services. The fund is charged an annual fixed amount of $17,500 plus a fee based on average daily net assets. The administrative services fee incurred for the year ended August 31, 2017 was equivalent to an annual effective rate of 0.0296% of the fund’s average daily net assets.
Trustees’ and Officers’ Compensation – The fund pays compensation to independent Trustees in the form of a retainer, attendance fees, and additional compensation to Board and Committee chairpersons. The fund does not pay compensation directly to Trustees or officers of the fund who are also officers of the investment adviser, all of whom receive remuneration for their services to the fund from MFS. Certain officers and Trustees of the fund are officers or directors of MFS, MFD, and MFSC.
Other – This fund and certain other funds managed by MFS (the funds) have entered into a service agreement (the ISO Agreement) which provides for payment of fees solely by the funds to Tarantino LLC in return for the provision of services of an Independent Senior Officer (ISO) for the funds. Frank L. Tarantino serves as the ISO and is an officer of the funds and the sole member of Tarantino LLC. The funds can terminate the ISO Agreement with Tarantino LLC at any time under the terms of the ISO Agreement. For the year ended August 31, 2017, the fee paid by the fund under this agreement was $126 and is included in “Miscellaneous” expense in the Statement of Operations. MFS has agreed to bear all expenses associated with office space, other administrative support, and supplies provided to the ISO.
32
Notes to Financial Statements – continued
The fund invests in the MFS Institutional Money Market Portfolio which is managed by MFS and seeks current income consistent with preservation of capital and liquidity. This money market fund does not pay a management fee to MFS.
On September 9, 2015, MFS redeemed 10,176, 5,557, 10,076, 5,716, 5,552, 5,633, 5,676, 5,715, and 129,501 shares of Class A, Class B, Class C, Class I, Class R1, Class R2, Class R3, Class R4, and Class R6 (formerly Class R5), respectively, for an aggregate amount of $2,018,148. On June 29, 2016, MFS redeemed 4,546, 4,559, 363, 371, and 379 shares, respectively, of Class B, Class I, Class R2, Class R3, and Class R4, for an aggregate amount of $125,049. On March 16, 2017, MFS purchased 2,545 shares of Class I for an aggregate amount of $33,844. On March 21, 2017, MFS sold 412 shares of Class I for an aggregate amount of $5,438.
At August 31, 2017, MFS held approximately 58%, 79%, 100%, and 100% of the outstanding shares of Class R1, Class R2, Class R3, and Class R4, respectively.
(4) Portfolio Securities
For the year ended August 31, 2017, purchases and sales of investments and short-term obligations, aggregated $42,142,146 and $24,667,271, respectively.
(5) Shares of Beneficial Interest
The fund’s Declaration of Trust permits the Trustees to issue an unlimited number of full and fractional shares of beneficial interest. Transactions in fund shares were as follows:
| | | | | | | | | | | | | | | | |
| | | Year ended
8/31/17 | | | Year ended
8/31/16 | |
| | | Shares | | | Amount | | | Shares | | | Amount | |
| Shares sold | | | | | | | | | | | | | | | | |
Class A | | | 1,456,499 | | | | $18,899,873 | | | | 2,092,547 | | | | $24,894,676 | |
Class B | | | 41,150 | | | | 534,770 | | | | 113,015 | | | | 1,323,803 | |
Class C | | | 356,503 | | | | 4,664,725 | | | | 747,875 | | | | 8,945,844 | |
Class I | | | 1,624,156 | | | | 21,194,572 | | | | 1,514,125 | | | | 17,745,563 | |
Class R1 | | | 3,284 | | | | 44,177 | | | | — | | | | — | |
Class R2 | | | 1,141 | | | | 15,604 | | | | — | | | | — | |
Class R3 | | | 19 | | | | 260 | | | | — | | | | — | |
Class R6 | | | 434,316 | | | | 5,859,230 | | | | 148,602 | | | | 1,724,717 | |
| | | 3,917,068 | | | | $51,213,211 | | | | 4,616,164 | | | | $54,634,603 | |
33
Notes to Financial Statements – continued
| | | | | | | | | | | | | | | | |
| | | Year ended
8/31/17 | | | Year ended
8/31/16 | |
| | | Shares | | | Amount | | | Shares | | | Amount | |
| Shares issued to shareholders in reinvestment of distributions | | | | | | | | | | | | | | | | |
Class A | | | 36,525 | | | | $473,635 | | | | 24,005 | | | | $280,852 | |
Class B | | | 951 | | | | 12,248 | | | | 712 | | | | 8,216 | |
Class C | | | 5,654 | | | | 72,738 | | | | 2,377 | | | | 27,828 | |
Class I | | | 23,535 | | | | 307,040 | | | | 8,111 | | | | 97,262 | |
Class R1 | | | 38 | | | | 504 | | | | 37 | | | | 422 | |
Class R2 | | | 48 | | | | 620 | | | | 50 | | | | 588 | |
Class R3 | | | 59 | | | | 757 | | | | 68 | | | | 790 | |
Class R4 | | | 69 | | | | 895 | | | | 86 | | | | 996 | |
Class R6 | | | 262 | | | | 3,416 | | | | 304 | | | | 3,550 | |
| | | 67,141 | | | | $871,853 | | | | 35,750 | | | | $420,504 | |
| | | | |
| Shares reacquired | | | | | | | | | | | | | | | | |
Class A | | | (968,834 | ) | | | $(12,572,950 | ) | | | (779,292 | ) | | | $(9,522,556 | ) |
Class B | | | (41,062 | ) | | | (535,569 | ) | | | (27,799 | ) | | | (327,879 | ) |
Class C | | | (253,515 | ) | | | (3,323,190 | ) | | | (93,160 | ) | | | (1,097,562 | ) |
Class I | | | (1,347,574 | ) | | | (17,546,911 | ) | | | (325,884 | ) | | | (3,977,164 | ) |
Class R1 | | | (22 | ) | | | (303 | ) | | | (5,552 | ) | | | (60,905 | ) |
Class R2 | | | (1 | ) | | | (10 | ) | | | (5,996 | ) | | | (66,317 | ) |
Class R3 | | | (1 | ) | | | (4 | ) | | | (6,047 | ) | | | (66,925 | ) |
Class R4 | | | — | | | | — | | | | (6,094 | ) | | | (67,506 | ) |
Class R6 | | | (96,998 | ) | | | (1,253,572 | ) | | | (157,202 | ) | | | (1,764,990 | ) |
| | | (2,708,007 | ) | | | $(35,232,509 | ) | | | (1,407,026 | ) | | | $(16,951,804 | ) |
| | | | |
| Net change | | | | | | | | | | | | | | | | |
Class A | | | 524,190 | | | | $6,800,558 | | | | 1,337,260 | | | | $15,652,972 | |
Class B | | | 1,039 | | | | 11,449 | | | | 85,928 | | | | 1,004,140 | |
Class C | | | 108,642 | | | | 1,414,273 | | | | 657,092 | | | | 7,876,110 | |
Class I | | | 300,117 | | | | 3,954,701 | | | | 1,196,352 | | | | 13,865,661 | |
Class R1 | | | 3,300 | | | | 44,378 | | | | (5,515 | ) | | | (60,483 | ) |
Class R2 | | | 1,188 | | | | 16,214 | | | | (5,946 | ) | | | (65,729 | ) |
Class R3 | | | 77 | | | | 1,013 | | | | (5,979 | ) | | | (66,135 | ) |
Class R4 | | | 69 | | | | 895 | | | | (6,008 | ) | | | (66,510 | ) |
Class R6 | | | 337,580 | | | | 4,609,074 | | | | (8,296 | ) | | | (36,723 | ) |
| | | 1,276,202 | | | | $16,852,555 | | | | 3,244,888 | | | | $38,103,303 | |
(6) Line of Credit
The fund and certain other funds managed by MFS participate in a $1.25 billion unsecured committed line of credit, subject to a $1 billion sublimit, provided by a syndication of banks under a credit agreement. Borrowings may be made for temporary financing needs. Interest is charged to each fund, based on its borrowings, generally at a rate equal to the higher of the Overnight Federal Reserve funds rate or daily one month LIBOR plus an agreed upon spread. A commitment fee, based on the average daily, unused portion of the committed line of credit, is allocated among the
34
Notes to Financial Statements – continued
participating funds at the end of each calendar quarter. In addition, the fund and other funds managed by MFS have established unsecured uncommitted borrowing arrangements with certain banks for temporary financing needs. Interest is charged to each fund, based on its borrowings, at a rate equal to the Overnight Federal Reserve funds rate plus an agreed upon spread. For the year ended August 31, 2017, the fund’s commitment fee and interest expense were $458 and $0, respectively, and are included in “Miscellaneous” expense in the Statement of Operations.
(7) Investments in Affiliated Issuers
An affiliated issuer may be considered one in which the fund owns 5% or more of the outstanding voting securities, or a company which is under common control. For the purposes of this report, the fund assumes the following to be an affiliated issuer:
| | | | | | | | | | | | | | | | | | | | |
| Affiliated Issuer | | | | | Beginning
Shares/Par
Amount | | | Acquisitions
Shares/Par
Amount | | | Dispositions
Shares/Par
Amount | | | Ending
Shares/Par
Amount | |
MFS Institutional Money
Market Portfolio | | | | | | | 379,373 | | | | 23,485,457 | | | | (23,232,891 | ) | | | 631,939 | |
| | | | | |
| Affiliated Issuer | | Realized
Gain (Loss) | | | Change in
Unrealized
Appreciation/
(Depreciation) | | | Capital Gain
Distributions | | | Dividend
Income | | | Ending
Value | |
MFS Institutional Money
Market Portfolio | | | $(9 | ) | | | $— | | | | $— | | | | $6,210 | | | | $631,939 | |
35
REPORT OF INDEPENDENT REGISTERED PUBLIC ACCOUNTING FIRM
To the Board of Trustees of MFS Series Trust I and Shareholders of MFS Low Volatility Equity Fund:
We have audited the accompanying statement of assets and liabilities, including the portfolio of investments, of MFS Low Volatility Equity Fund (the Fund) (one of the series constituting the MFS Series Trust I) as of August 31, 2017, and the related statement of operations for the year then ended, the statements of changes in net assets for each of the two years in the period then ended and the financial highlights for each of the periods indicated therein. These financial statements and financial highlights are the responsibility of the Fund’s management. Our responsibility is to express an opinion on these financial statements and financial highlights based on our audits.
We conducted our audits in accordance with the standards of the Public Company Accounting Oversight Board (United States). Those standards require that we plan and perform the audit to obtain reasonable assurance about whether the financial statements and financial highlights are free of material misstatement. We were not engaged to perform an audit of the Fund’s internal control over financial reporting. Our audits included consideration of internal control over financial reporting as a basis for designing audit procedures that are appropriate in the circumstances, but not for the purpose of expressing an opinion on the effectiveness of the Fund’s internal control over financial reporting. Accordingly, we express no such opinion. An audit also includes examining, on a test basis, evidence supporting the amounts and disclosures in the financial statements and financial highlights, assessing the accounting principles used and significant estimates made by management, and evaluating the overall financial statement presentation. Our procedures included confirmation of securities owned as of August 31, 2017, by correspondence with the custodian and others or by other appropriate auditing procedures where replies from others were not received. We believe that our audits provide a reasonable basis for our opinion.
In our opinion, the financial statements and financial highlights referred to above present fairly, in all material respects, the financial position of MFS Low Volatility Equity Fund (one of the series constituting the MFS Series Trust I) at August 31, 2017, the results of its operations for the year then ended, the changes in its net assets for each of the two years in the period then ended and the financial highlights for each of the periods indicated therein, in conformity with U.S. generally accepted accounting principles.

Boston, Massachusetts
October 17, 2017
36
RESULTS OF SHAREHOLDER MEETING
(unaudited)
At a special meeting of shareholders of MFS Series Trust I, which was held on March 23, 2017, the following action was taken:
Item 1: To elect the following individuals as Trustees:
| | | | | | | | |
| | | Number of Dollars | |
Nominee | | For | | | Withheld Authority | |
| Steven E. Buller | | | 40,448,016,134.453 | | | | 372,137,248.376 | |
| John A. Caroselli | | | 40,455,058,441.389 | | | | 365,094,941.560 | |
| Maureen R. Goldfarb | | | 40,458,621,672.449 | | | | 361,531,746.940 | |
| David H. Gunning | | | 40,369,558,961.219 | | | | 450,594,312.051 | |
| Michael Hegarty | | | 40,379,783,468.714 | | | | 440,369,950.676 | |
| John P. Kavanaugh | | | 40,453,732,784.104 | | | | 366,420,708.405 | |
| Robert J. Manning | | | 40,424,010,964.586 | | | | 396,142,308.684 | |
| Clarence Otis, Jr. | | | 40,441,919,324.712 | | | | 378,234,043.007 | |
| Maryanne L. Roepke | | | 40,471,040,575.143 | | | | 349,112,917.026 | |
| Robin A. Stelmach | | | 40,459,908,730.475 | | | | 360,244,615.574 | |
| Laurie J. Thomsen | | | 40,426,270,790.416 | | | | 393,882,628.973 | |
37
TRUSTEES AND OFFICERS — IDENTIFICATION AND BACKGROUND
The Trustees and Officers of the Trust, as of October 1, 2017, are listed below, together with their principal occupations during the past five years. (Their titles may have varied during that period.) The address of each Trustee and Officer is 111 Huntington Avenue, Boston, Massachusetts 02199-7618.
| | | | | | | | | | |
Name, Age | | Position(s)
Held with Fund | | Trustee/Officer Since (h) | | Number of
MFS Funds
overseen
by the
Trustee | | Principal
Occupations During the Past Five Years | | Other Directorships
During the Past
Five Years (j) |
| INTERESTED TRUSTEES |
Robert J. Manning (k)
(age 53) | | Trustee | | February 2004 | | 136 | | Massachusetts Financial Services Company, Executive Chairman (since January 2017); Director; Chairman of the Board; Chief Executive Officer (until 2015); Co-Chief Executive Officer (2015-2016) | | N/A |
Robin A. Stelmach (k) (age 56) | | Trustee | | January 2014 | | 136 | | Massachusetts Financial Services Company, Vice Chair (since January 2017); Chief Operating Officer and Executive Vice President (until January 2017) | | N/A |
| INDEPENDENT TRUSTEES |
David H. Gunning
(age 75) | | Trustee and Chair of Trustees | | January 2004 | | 136 | | Private investor | | Lincoln Electric Holdings, Inc., Director; Development Alternatives, Inc., Director/Non-Executive Chairman (until 2013) |
38
Trustees and Officers – continued
| | | | | | | | | | |
Name, Age | | Position(s)
Held with Fund | | Trustee/Officer Since (h) | | Number of
MFS Funds
overseen
by the
Trustee | | Principal
Occupations During the Past Five Years | | Other Directorships
During the Past
Five Years (j) |
Steven E. Buller
(age 66) | | Trustee | | February 2014 | | 136 | | Financial Accounting Standards Advisory Council, Chairman (2014-2015); Public Company Accounting Oversight Board, Standing Advisory Group, Member (until 2014); BlackRock, Inc. (investment management), Managing Director (until 2014), BlackRock Finco UK (investment management), Director (until 2014) | | N/A |
John A. Caroselli
(age 63) | | Trustee | | March 2017 | | 136 | | JC Global Advisors, LLC (management consulting), President (since 2015); First Capital Corporation (commercial finance), Executive Vice President (until 2015) | | N/A |
Maureen R. Goldfarb
(age 62) | | Trustee | | January 2009 | | 136 | | Private investor | | N/A |
Michael Hegarty
(age 72) | | Trustee | | December 2004 | | 136 | | Private investor | | Rouse Properties Inc., Director (until 2016); Capmark Financial Group Inc., Director (until 2015) |
John P. Kavanaugh
(age 62) | | Trustee and Vice Chair of Trustees | | January 2009 | | 136 | | Private investor | | N/A |
Clarence Otis, Jr.
(age 61) | | Trustee | | March 2017 | | 136 | | Darden Restaurants, Inc., Chief Executive Officer (until 2014) | | VF Corporation, Director; Verizon Communications, Inc., Director; The Travelers Companies, Director; Federal Reserve Bank of Atlanta, Director (until 2015) |
39
Trustees and Officers – continued
| | | | | | | | | | |
Name, Age | | Position(s)
Held with Fund | | Trustee/Officer Since (h) | | Number of
MFS Funds
overseen
by the
Trustee | | Principal
Occupations During the Past Five Years | | Other Directorships
During the Past
Five Years (j) |
Maryanne L. Roepke
(age 61) | | Trustee | | May 2014 | | 136 | | American Century Investments (investment management), Senior Vice President and Chief Compliance Officer (until 2014) | | N/A |
Laurie J. Thomsen
(age 60) | | Trustee | | March 2005 | | 136 | | Private investor | | The Travelers Companies, Director; Dycom Industries, Inc., Director (since 2015) |
| | | | | | | | |
Name, Age | | Position(s) Held with Fund | | Trustee/Officer
Since (h) | | Number of
MFS Funds
for which
the Person
is an Officer | | Principal
Occupations During the Past Five Years |
| OFFICERS | | | | | | | | |
Christopher R. Bohane (k)
(age 43) | | Assistant Secretary and Assistant Clerk | | July 2005 | | 136 | | Massachusetts Financial Services Company, Vice President and Assistant General Counsel |
Kino Clark (k)
(age 49) | | Assistant Treasurer | | January 2012 | | 136 | | Massachusetts Financial Services Company, Vice President |
John W. Clark, Jr. (k)
(age 50) | | Assistant Treasurer | | April 2017 | | 136 | | Massachusetts Financial Services Company, Vice President (since March 2017); Deutsche Bank (financial services), Department Head – Treasurer’s Office (until February 2017) |
Thomas H. Connors (k)
(age 58) | | Assistant Secretary and Assistant Clerk | | September 2012 | | 136 | | Massachusetts Financial Services Company, Vice President and Senior Counsel; Deutsche Investment Management Americas Inc. (financial service provider), Director and Senior Counsel (until 2012) |
40
Trustees and Officers – continued
| | | | | | | | |
Name, Age | | Position(s) Held with Fund | | Trustee/Officer
Since (h) | | Number of
MFS Funds
for which
the Person
is an Officer | | Principal
Occupations During the Past Five Years |
Ethan D. Corey (k)
(age 53) | | Assistant Secretary and Assistant Clerk | | July 2005 | | 136 | | Massachusetts Financial Services Company, Senior Vice President and Associate General Counsel |
David L. DiLorenzo (k)
(age 49) | | President | | July 2005 | | 136 | | Massachusetts Financial Services Company, Senior Vice President |
Heidi W. Hardin (k)
(age 50) | | Secretary and Clerk | | April 2017 | | 136 | | Massachusetts Financial Services Company, Executive Vice President and General Counsel (since March 2017); Harris Associates (investment management), General Counsel (from September 2015 to January 2017); Janus Capital Management LLC (investment management), Senior Vice President and General Counsel (until September 2015) |
Brian E. Langenfeld (k) (age 44) | | Assistant Secretary and Assistant Clerk | | June 2006 | | 136 | | Massachusetts Financial Services Company, Vice President and Senior Counsel |
Susan A. Pereira (k)
(age 46) | | Assistant Secretary and Assistant Clerk | | July 2005 | | 136 | | Massachusetts Financial Services Company, Vice President and Senior Counsel |
Kasey L. Phillips (k)
(age 46) | | Assistant Treasurer | | September 2012 | | 136 | | Massachusetts Financial Services Company, Vice President; Wells Fargo Funds Management, LLC, Senior Vice President, Fund Treasurer (until 2012) |
Matthew A. Stowe (k)
(age 42) | | Assistant Secretary and Assistant Clerk | | October 2014 | | 136 | | Massachusetts Financial Services Company, Vice President and Assistant General Counsel |
Frank L. Tarantino
(age 73) | | Independent Senior Officer | | June 2004 | | 136 | | Tarantino LLC (provider of compliance services), Principal |
Richard S. Weitzel (k)
(age 47) | | Assistant Secretary and Assistant Clerk | | October 2007 | | 136 | | Massachusetts Financial Services Company, Senior Vice President and Associate General Counsel |
41
Trustees and Officers – continued
| | | | | | | | |
Name, Age | | Position(s) Held with Fund | | Trustee/Officer
Since (h) | | Number of
MFS Funds
for which
the Person
is an Officer | | Principal
Occupations During the Past Five Years |
Martin J. Wolin (k)
(age 50) | | Chief Compliance Officer | | July 2015 | | 136 | | Massachusetts Financial Services Company, Senior Vice President and Chief Compliance Officer (since July 2015); Mercer (financial service provider), Chief Risk and Compliance Officer, North America and Latin America (until June 2015) |
James O. Yost (k)
(age 57) | | Treasurer | | September 1990 | | 136 | | Massachusetts Financial Services Company, Senior Vice President |
| (h) | Date first appointed to serve as Trustee/officer of an MFS Fund. Each Trustee has served continuously since appointment unless indicated otherwise. For the period from December 15, 2004 until February 22, 2005, Mr. Manning served as Advisory Trustee. Prior to January 2012, Messrs. DiLorenzo and Yost served as Assistant Treasurers of the Funds. From January 2012 through December 2016, Messrs. DiLorenzo and Yost served as Treasurer and Deputy Treasurer of the Funds, respectively. |
| (j) | Directorships or trusteeships of companies required to report to the Securities and Exchange Commission (i.e., “public companies”). |
| (k) | “Interested person” of the Trust within the meaning of the Investment Company Act of 1940 (referred to as the 1940 Act), which is the principal federal law governing investment companies like the fund, as a result of a position with MFS. The address of MFS is 111 Huntington Avenue, Boston, Massachusetts 02199-7618. |
Each Trustee has been elected by shareholders and each Trustee and officer holds office until his or her successor is chosen and qualified or until his or her earlier death, resignation, retirement or removal. The Trust does not hold annual meetings for the purpose of electing Trustees, and Trustees are not elected for fixed terms. Under the terms of the Board’s retirement policy, an Independent Trustee shall retire at the end of the calendar year in which he or she reaches the earlier of 75 years of age or 15 years of service on the Board (or, in the case of any Independent Trustee who joined the Board prior to 2015, 20 years of service on the Board).
Messrs. Buller, Kavanaugh and Otis and Ms. Roepke are members of the Trust’s Audit Committee.
Each of the Interested Trustees and certain Officers hold comparable officer positions with certain affiliates of MFS.
42
Trustees and Officers – continued
The Statement of Additional Information for a Fund includes further information about the Trustees and is available without charge upon request by calling 1-800-225-2606.
| | |
| Investment Adviser | | Custodian |
Massachusetts Financial Services Company
111 Huntington Avenue
Boston, MA 02199-7618 | | State Street Bank and Trust Company 1 Lincoln Street
Boston, MA 02111-2900 |
| Distributor | | Independent Registered Public Accounting Firm |
MFS Fund Distributors, Inc.
111 Huntington Avenue
Boston, MA 02199-7618 | | Ernst & Young LLP 200 Claredon Street
Boston, MA 02116 |
| Portfolio Manager(s) | | |
| Jim Fallon | | |
| Matt Krummell | | |
| Jonathan Sage | | |
| Jed Stocks | | |
43
BOARD REVIEW OF INVESTMENT ADVISORY AGREEMENT
The Investment Company Act of 1940 requires that both the full Board of Trustees and a majority of the non-interested (“independent”) Trustees, voting separately, annually approve the continuation of the Fund’s investment advisory agreement with MFS. The Trustees consider matters bearing on the Fund and its advisory arrangements at their meetings throughout the year, including a review of performance data at each regular meeting. In addition, the independent Trustees met several times over the course of three months beginning in May and ending in July, 2017 (“contract review meetings”) for the specific purpose of considering whether to approve the continuation of the investment advisory agreement for the Fund and the other investment companies that the Board oversees (the “MFS Funds”). The independent Trustees were assisted in their evaluation of the Fund’s investment advisory agreement by independent legal counsel, from whom they received separate legal advice and with whom they met separately from MFS during various contract review meetings. The independent Trustees were also assisted in this process by the MFS Funds’ Independent Senior Officer, a senior officer appointed by and reporting to the independent Trustees.
In connection with their deliberations regarding the continuation of the investment advisory agreement, the Trustees, including the independent Trustees, considered such information and factors as they believed, in light of the legal advice furnished to them and their own business judgment, to be relevant. The investment advisory agreement for the Fund was considered separately, although the Trustees also took into account the common interests of all MFS Funds in their review. As described below, the Trustees considered the nature, quality, and extent of the various investment advisory, administrative, and shareholder services to be performed by MFS under the existing investment advisory agreement and other arrangements with the Fund.
In connection with their contract review meetings, the Trustees received and relied upon materials that included, among other items: (i) information provided by Broadridge Financial Solutions, Inc. (“Broadridge”), an independent third party, on the investment performance of the Fund for various time periods ended December 31, 2016 and the investment performance of a group of funds with substantially similar investment classifications/objectives (the “Lipper performance universe”), (ii) information provided by Broadridge on the Fund’s advisory fees and other expenses and the advisory fees and other expenses of comparable funds identified by Broadridge (the “Broadridge expense group”), (iii) information provided by MFS on the advisory fees of portfolios of other clients of MFS, including institutional separate accounts and other clients, (iv) information as to whether and to what extent applicable expense waivers, reimbursements or fee “breakpoints” are observed for the Fund, (v) information regarding MFS’ financial results and financial condition, including MFS’ and certain of its affiliates’ estimated profitability from services performed for the Fund and the MFS Funds as a whole, and compared to MFS’ institutional business, (vi) MFS’ views regarding the outlook for the mutual fund industry and the strategic business plans of MFS, (vii) descriptions of various functions performed by MFS for the Funds, such as compliance monitoring and portfolio trading practices, and (viii) information regarding the overall organization of MFS, including information about MFS’ senior management and other personnel providing investment advisory,
44
Board Review of Investment Advisory Agreement – continued
administrative and other services to the Fund and the other MFS Funds. The comparative performance, fee and expense information prepared and provided by Broadridge was not independently verified and the independent Trustees did not independently verify any information provided to them by MFS.
The Trustees’ conclusion as to the continuation of the investment advisory agreement was based on a comprehensive consideration of all information provided to the Trustees and not the result of any single factor. Some of the factors that figured particularly in the Trustees’ deliberations are described below, although individual Trustees may have evaluated the information presented differently from one another, giving different weights to various factors. It is also important to recognize that the fee arrangements for the Fund and other MFS Funds are the result of years of review and discussion between the independent Trustees and MFS, that certain aspects of such arrangements may receive greater scrutiny in some years than in others, and that the Trustees’ conclusions may be based, in part, on their consideration of these same arrangements during the course of the year and in prior years.
Based on information provided by Broadridge and MFS, the Trustees reviewed the Fund’s total return investment performance as well as the performance of peer groups of funds for various time periods. The Trustees placed particular emphasis on the total return performance of the Fund’s Class A shares in comparison to the performance of funds in its Lipper performance universe over the three-year period ended December 31, 2016, which the Trustees believed was a long enough period to reflect differing market conditions. The total return performance of the Fund’s Class A shares was in the 1st quintile relative to the other funds in the universe for this three-year period (the 1st quintile being the best performers and the 5th quintile being the worst performers). The total return performance of the Fund’s Class A shares was in the 3rd quintile for the one-year period ended December 31, 2016 relative to the Lipper performance universe. The Fund commenced operations on December 5, 2013; therefore no performance data for the five-year period was available. Because of the passage of time, these performance results may differ from the performance results for more recent periods, including those shown elsewhere in this report.
In the course of their deliberations, the Trustees took into account information provided by MFS in connection with the contract review meetings, as well as during investment review meetings conducted with portfolio management personnel during the course of the year regarding the Fund’s performance. After reviewing these and related factors, the Trustees concluded, within the context of their overall conclusions regarding the investment advisory agreement, that they were satisfied with MFS’ responses and efforts relating to investment performance.
In assessing the reasonableness of the Fund’s advisory fee, the Trustees considered, among other information, the Fund’s advisory fee and the total expense ratio of the Fund’s Class A shares as a percentage of average daily net assets and the advisory fee and total expense ratios of peer groups of funds based on information provided by Broadridge. The Trustees considered that MFS currently observes an expense limitation for the Fund, which may not be changed without the Trustees’ approval. The Trustees also considered that, according to the data provided by Broadridge (which takes into account any fee reductions or expense limitations that were in effect during the Fund’s
45
Board Review of Investment Advisory Agreement – continued
last fiscal year), the Fund’s effective advisory fee rate and total expense ratio were each approximately at the Broadridge expense group median. The Trustees also noted that MFS has agreed to further reduce such expense limitation for the Fund effective August 1, 2017, which may not be changed without the Trustees’ approval.
The Trustees also considered the advisory fees charged by MFS to any institutional separate accounts advised by MFS (“separate accounts”) and unaffiliated investment companies for which MFS serves as subadviser (“subadvised funds”) that have comparable investment strategies to the Fund, if any. In comparing these fees, the Trustees considered information provided by MFS as to the generally broader scope of services provided by MFS to the Fund, as well as the more extensive regulatory burdens imposed on MFS in managing the Fund, in comparison to separate accounts and subadvised funds. The Trustees also considered the higher demands placed on MFS’ investment personnel and trading infrastructure as a result of the daily cash in-flows and out-flows of the Fund in comparison to separate accounts.
The Trustees also considered whether the Fund may benefit from any economies of scale in the management of the Fund in the event of growth in assets of the Fund and/or growth in assets of the MFS Funds as a whole. They noted that the Fund’s advisory fee rate schedule is subject to contractual breakpoints that reduce the Fund’s advisory fee rate on average daily net assets over $1 billion and $2.5 billion. They also noted that MFS has agreed to amend its contractual advisory fee rate schedule to further reduce the Fund’s advisory fee rate on assets over these breakpoints effective August 1, 2017. The Trustees also noted that MFS has agreed in writing to waive a portion of the management fees of certain MFS Funds, including the Fund, if the total combined assets of certain funds within the MFS Funds’ complex increase above agreed upon thresholds (the “group fee waiver”), enabling the Fund’s shareholders to share in the benefits from any economies of scale at the complex level. The group fee waiver is reviewed and renewed annually between the Board and MFS. The Trustees concluded that the breakpoints and the group fee waiver were sufficient to allow the Fund to benefit from economies of scale as its assets and overall complex assets grow.
The Trustees also considered information prepared by MFS relating to MFS’ costs and profits with respect to the Fund, the MFS Funds considered as a group, and other investment companies and accounts advised by MFS, as well as MFS’ methodologies used to determine and allocate its costs to the MFS Funds, the Fund and other accounts and products for purposes of estimating profitability.
In addition, the Trustees considered MFS’ resources and related efforts to continue to retain, attract and motivate capable personnel to serve the Fund. The Trustees also considered current and developing conditions in the financial services industry, including the presence of large and well-capitalized companies which are spending, and appear to be prepared to continue to spend, substantial sums to engage personnel and to provide services to competing investment companies. In this regard, the Trustees also considered the financial resources of MFS and its ultimate parent, Sun Life Financial Inc. The Trustees also considered the advantages and possible disadvantages to the Fund of having an adviser that also serves other investment companies as well as other accounts.
46
Board Review of Investment Advisory Agreement – continued
The Trustees also considered the nature, quality, cost, and extent of administrative, transfer agency, and distribution services provided to the Fund by MFS and its affiliates under agreements and plans other than the investment advisory agreement, including any 12b-1 fees the Fund pays to MFS Fund Distributors, Inc., an affiliate of MFS. The Trustees also considered the nature, extent and quality of certain other services MFS performs or arranges for on the Fund’s behalf, which may include securities lending programs, directed expense payment programs, class action recovery programs, and MFS’ interaction with third-party service providers, principally custodians and sub-custodians. The Trustees concluded that the various non-advisory services provided by MFS and its affiliates on behalf of the Fund were satisfactory.
The Trustees also considered benefits to MFS from the use of the Fund’s portfolio brokerage commissions, if applicable, to pay for investment research and various other factors. Additionally, the Trustees considered so-called “fall-out benefits” to MFS such as reputational value derived from serving as investment manager to the Fund.
Based on their evaluation of factors that they deemed to be material, including those factors described above, the Board of Trustees, including the independent Trustees, concluded that the Fund’s investment advisory agreement with MFS should be continued for an additional one-year period, commencing August 1, 2017.
47
PROXY VOTING POLICIES AND INFORMATION
MFS votes proxies on behalf of the fund pursuant to proxy voting policies and procedures that are available without charge, upon request, by calling 1-800-225-2606, by visiting mfs.com (once you have selected “Individual Investor” as your role, click on “Individual Investor Home” in the top navigation and then select “Learn More About Proxy Voting” under the “I want to…” header on the left hand column of the page), or by visiting the SEC’s Web site at http://www.sec.gov.
Information regarding how the fund voted proxies relating to portfolio securities during the most recent twelve-month period ended June 30 is available by August 31 of each year without charge by visiting mfs.com (once you have selected “Individual Investor” as your role, click on “Individual Investor Home” in the top navigation and then select “Learn More About Proxy Voting” under the “I want to…” header on the left hand column of the page), or by visiting the SEC’s Web site at http://www.sec.gov.
QUARTERLY PORTFOLIO DISCLOSURE
The fund will file a complete schedule of portfolio holdings with the Securities and Exchange Commission (the Commission) for the first and third quarters of each fiscal year on Form N-Q. A shareholder can obtain the quarterly portfolio holdings report at mfs.com. The fund’s Form N-Q is also available on the EDGAR database on the Commission’s Internet Web site at http://www.sec.gov, and may be reviewed and copied at the:
Public Reference Room
Securities and Exchange Commission
100 F Street, NE, Room 1580
Washington, D.C. 20549
Information on the operation of the Public Reference Room may be obtained by calling the Commission at 1-800-SEC-0330. Copies of the fund’s Form N-Q also may be obtained, upon payment of a duplicating fee, by electronic request at the following e-mail address: publicinfo@sec.gov or by writing the Public Reference Section at the above address.
FURTHER INFORMATION
From time to time, MFS may post important information about the fund or the MFS funds on the MFS web site (mfs.com). This information is available on mfs.com by following these steps once you have selected “Individual Investor” as your role: (1) Click on the “Individual Investor Home” in the top navigation and then select the “Announcements” option within the “Market Outlooks” drop down, or (2) Click on “Products & Services” and “Mutual Funds” and then choose the fund’s name in the “Select a fund” menu.
48
INFORMATION ABOUT FUND CONTRACTS AND LEGAL CLAIMS
The fund has entered into contractual arrangements with an investment adviser, administrator, distributor, shareholder servicing agent, 529 program manager (if applicable), and custodian who each provide services to the fund. Unless expressly stated otherwise, shareholders are not parties to, or intended beneficiaries of these contractual arrangements, and these contractual arrangements are not intended to create any shareholder right to enforce them against the service providers or to seek any remedy under them against the service providers, either directly or on behalf of the fund.
Under the Trust’s By-Laws and Declaration of Trust, any claims asserted against or on behalf of the MFS Funds, including claims against Trustees and Officers, must be brought in state and federal courts located within the Commonwealth of Massachusetts.
FEDERAL TAX INFORMATION (unaudited)
The fund will notify shareholders of amounts for use in preparing 2017 income tax forms in January 2018. The following information is provided pursuant to provisions of the Internal Revenue Code.
The fund designates the maximum amount allowable as qualified dividend income eligible to be taxed at the same rate as long-term capital gain.
The fund designates $138,000 as capital gain dividends paid during the fiscal year.
For corporate shareholders, 100% of the ordinary income dividends paid during the fiscal year qualify for the corporate dividends received deduction.
49
rev. 3/16
| | | | |
| | | |
FACTS | | WHAT DOES MFS DO WITH YOUR PERSONAL INFORMATION? | |  |
| | |
| Why? | | Financial companies choose how they share your personal information. Federal law gives consumers the right to limit some but not all sharing. Federal law also requires us to tell you how we collect, share, and protect your personal information. Please read this notice carefully to understand what we do. |
| | |
| What? | | The types of personal information we collect and share depend on the product or service you have with us. This information can include: • Social Security number and account balances • Account transactions and transaction history • Checking account information and wire transfer instructions When you are no longer our customer, we continue to share your information as described in this notice. |
| | |
| How? | | All financial companies need to share customers’ personal information to run their everyday business. In the section below, we list the reasons financial companies can share their customers’ personal information; the reasons MFS chooses to share; and whether you can limit this sharing. |
| | | | |
Reasons we can share your
personal information | | Does MFS
share? | | Can you limit
this sharing? |
For our everyday business purposes – such as to process your transactions, maintain your account(s), respond to court orders and legal investigations, or report to credit bureaus | | Yes | | No |
For our marketing purposes – to offer our products and services to you | | No | | We don’t share |
For joint marketing with other financial companies | | No | | We don’t share |
For our affiliates’ everyday business purposes – information about your transactions and experiences | | No | | We don’t share |
For our affiliates’ everyday business purposes – information about your creditworthiness | | No | | We don’t share |
| For nonaffiliates to market to you | | No | | We don’t share |
| | |
| Questions? | | Call 800-225-2606 or go to mfs.com. |
50
| | |
| Who we are |
| Who is providing this notice? | | MFS Funds, MFS Investment Management, MFS Institutional Advisors, Inc., and MFS Heritage Trust Company. |
| | |
| What we do |
| How does MFS protect my personal information? | | To protect your personal information from unauthorized access and use, we use security measures that comply with federal law. These measures include procedural, electronic, and physical safeguards for the protection of the personal information we collect about you. |
| How does MFS collect my personal information? | | We collect your personal information, for example, when you • open an account or provide account information • direct us to buy securities or direct us to sell your securities • make a wire transfer We also collect your personal information from others, such as credit bureaus, affiliates, or other companies. |
| Why can’t I limit all sharing? | | Federal law gives you the right to limit only • sharing for affiliates’ everyday business purposes – information about your creditworthiness • affiliates from using your information to market to you • sharing for nonaffiliates to market to you State laws and individual companies may give you additional rights to limit sharing. |
| | |
| Definitions |
| Affiliates | | Companies related by common ownership or control. They can be financial and nonfinancial companies. • MFS does not share personal information with affiliates, except for everyday business purposes as described on page one of this notice. |
| Nonaffiliates | | Companies not related by common ownership or control. They can be financial and nonfinancial companies. • MFS does not share with nonaffiliates so they can market to you. |
| Joint marketing | | A formal agreement between nonaffiliated financial companies that together market financial products or services to you. • MFS doesn’t jointly market. |
| | |
| Other important information |
| If you own an MFS product or receive an MFS service in the name of a third party such as a bank or broker-dealer, their privacy policy may apply to you instead of ours. |
51
Save paper with eDelivery.

| MFS® will send you prospectuses, |
reports, and proxies directly via e-mail so you will get information faster with less mailbox clutter.
To sign up:
1. Go to mfs.com.
2. Log in via MFS® Access.
3. Select eDelivery.
If you own your MFS fund shares through a financial institution or a retirement plan, MFS® TALK, MFS® Access, or eDelivery may not be available to you.
CONTACT
WEB SITE
mfs.com
MFS TALK
1-800-637-8255
24 hours a day
ACCOUNT SERVICE AND LITERATURE
Shareholders
1-800-225-2606
Financial advisors
1-800-343-2829
Retirement plan services
1-800-637-1255
MAILING ADDRESS
MFS Service Center, Inc.
P.O. Box 55824
Boston, MA 02205-5824
OVERNIGHT MAIL
MFS Service Center, Inc.
c/o Boston Financial Data Services
30 Dan Road
Canton, MA 02021-2809
ANNUAL REPORT
August 31, 2017

MFS® NEW DISCOVERY FUND

NDF-ANN
MFS® NEW DISCOVERY FUND
CONTENTS
The report is prepared for the general information of shareholders.
It is authorized for distribution to prospective investors only when preceded or accompanied by a current prospectus.
NOT FDIC INSURED • MAY LOSE VALUE • NO BANK GUARANTEE

LETTER FROM THE EXECUTIVE CHAIRMAN
Dear Shareholders:
Despite policy uncertainty accompanying a new presidential administration in the United States and unease over ongoing Brexit negotiations, most markets have proved
resilient. U.S. share prices have reached new highs in recent months although the U.S. Federal Reserve has continued to gradually hike interest rates. However, rates in most developed markets remain very low, with major non-U.S. central banks just beginning to contemplate curbing accommodative monetary policies.
Globally, we’ve experienced a year-long synchronized upturn in economic growth. Despite better growth, there are few immediate signs of worrisome inflation amid muted wage gains around the world. Europe has benefited from diminishing event risks as populist challengers fell short of upsetting establishment
candidates in both the Dutch and French elections. Emerging market economies have been boosted in part by a weaker U.S. dollar and are recovering despite lingering concerns over the potential for restrictive U.S. trade policies that could hamper global trade growth. Looking ahead, markets will have to contend with issues involving geopolitical hot spots on the Korean peninsula and in the Middle East.
At MFS®, we believe time is an asset. A patient, long-term approach to investing can have a powerful impact on decision making and outcomes. Time arbitrage, as we call it, comes down to having the conviction and discipline to allow enough time for good investment ideas to play out. In our view, such an approach, along with the professional guidance of a financial advisor, will help you reach your investment objectives.
Respectfully,

Robert J. Manning
Executive Chairman
MFS Investment Management
October 17, 2017
The opinions expressed in this letter are subject to change and may not be relied upon for investment advice. No forecasts can be guaranteed.
1
PORTFOLIO COMPOSITION
Portfolio structure
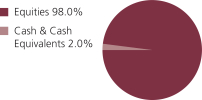
| | | | |
| Top ten holdings | | | | |
| Bright Horizons Family Solutions, Inc. | | | 2.4% | |
| Berry Plastics Group, Inc. | | | 1.9% | |
| Steris PLC | | | 1.8% | |
| SS&C Technologies Holdings, Inc. | | | 1.8% | |
| NICE Systems Ltd., ADR | | | 1.6% | |
| GrubHub, Inc. | | | 1.5% | |
| Zendesk, Inc. | | | 1.5% | |
| LogMeIn, Inc. | | | 1.4% | |
| Live Nation, Inc. | | | 1.4% | |
| U.S. Foods Holding Corp. | | | 1.4% | |
| | | | |
| Equity sectors | | | | |
| Technology | | | 21.9% | |
| Health Care | | | 19.4% | |
| Special Products & Services | | | 10.8% | |
| Basic Materials | | | 8.9% | |
| Autos & Housing | | | 7.7% | |
| Industrial Goods & Services | | | 7.2% | |
| Financial Services | | | 7.2% | |
| Leisure | | | 6.9% | |
| Consumer Staples | | | 4.4% | |
| Retailing | | | 1.8% | |
| Energy | | | 0.9% | |
| Transportation | | | 0.9% | |
Cash & Cash Equivalents includes any cash, investments in money market funds, short-term securities, and other assets less liabilities. Please see the Statement of Assets and Liabilities for additional information related to the fund’s cash position and other assets and liabilities.
Percentages are based on net assets as of August 31, 2017.
The portfolio is actively managed and current holdings may be different.
2
MANAGEMENT REVIEW
Summary of Results
For the twelve months ended August 31, 2017, Class A shares of the MFS New Discovery Fund (“fund”) provided a total return of 15.83%, at net asset value. This compares with a return of 16.39% for the fund’s benchmark, the Russell 2000® Growth Index.
Market Environment
For the first time in many years, the global economy is experiencing a period of synchronized economic growth. The rebound in emerging markets (“EM”) economies has been more pronounced (despite the deceleration in Chinese growth at the end of the period), helped by larger economies such as Brazil and Russia emerging from recessions. At the same time, developed markets (“DM”) economies continued to grow at or above potential. Market confidence increased in the US after the presidential elections in November in anticipation of lower taxes, a lighter regulatory burden and increased infrastructure spending, boosting US equities and corporate bond performance. Though hopes have largely faded for pro-growth US policies, market confidence persists. Globally, markets benefited from a reflation trade during the first half of the period as commodity prices strengthened, activity and growth prospects improved, and inflation moved higher, though within moderate bounds. While this bump in global inflation faded in the second half of the period as commodity prices, particularly oil, leveled off or declined, global growth remained relatively resilient. As a result, there have been more tightening signals and actions by DM central banks. The US Federal Reserve increased interest rates by 25 basis points during the second half of the period, bringing the total number of quarter-percent hikes in the federal funds rate to four since December 2015. The European Central Bank appears set to announce tapering of quantitative easing in the fall of 2017. The Bank of England may also begin reducing monetary accommodation. Markets have been comforted, along with central banks, by the decline in fears of a populist surge in Europe after establishment candidates won the Dutch and French elections. European growth has reflected the calmer political economic backdrop.
In recent months, the US dollar reversed the sharp rise seen early in the period, easing what had been a substantial headwind to earnings for multinationals. US consumer spending held up well during the second half of the period amid a modest increase in real wages and relatively low gasoline prices. Demand for autos reached near-record territory in the first half of the period before tapering off at the end of the period, while the housing market continued its recovery amid relatively low mortgage rates and tight inventories. Global trade, which was sluggish early in the period, showed signs of improvement in the period’s second half, a positive indicator of global economic activity and prospects. Early in the period, the US election resulted in a sell-off in EM assets due to fears that President Trump would follow through on various campaign threats and promises that were judged to be detrimental to EM. While President Trump withdrew the US from the Trans-Pacific Partnership and began the renegotiation of the North American Free Trade Agreement, significant additional
3
Management Review – continued
policy action has so far been lacking on economic issues involving EM. As a result, emerging markets resumed their upward trajectory, powered by strong inflows throughout the first half of 2017.
Detractors from Performance
Stock selection in the health care sector detracted from performance relative to the Russell 2000® Growth Index. Within this sector, not owning shares of biotechnology firm Kite Pharma, and an overweight position in emergency rooms operator Adeptus Health (h), weakened relative results. Shares of Kite Pharma grew after the company announced positive results in its late-stage trials for the company’s cancer treatment. Additionally, Gilead Sciences announced the acquisition of Kite Pharma which further boosted the company’s share price.
An overweight position in the energy sector also held back relative returns, led by an overweight position in industrial minerals producer US Silica Holdings. The company’s share price weakened, in the second half of the reporting period, as fears of sand oversupply and pricing weakness, combined with lower oil prices, weighed on relative results.
Stocks in other sectors that detracted from relative performance included holdings of automotive products reseller Fenix Parts (b)(h), real estate investment trust Tanger Factory Outlet Centers (b)(h), travel and tourism industry’s technology solutions provider Sabre (b)(h) and retailer Urban Outfitters (b). Shares of Fenix Parts weakened amid concerns of poor financial controls after the company failed to report its quarterly financial statements on time. Additionally, an overweight position in restaurant operator Zoe’s Kitchen, and not owning shares of performance chemicals provider Chemours, also weighed on relative returns.
The fund’s cash and/or cash equivalents position during the period was another detractor from relative performance. Under normal market conditions, the fund strives to be fully invested and generally holds cash to buy new holdings and to provide liquidity. In a period when equity markets rose, as measured by the fund’s benchmark, holding cash hurt performance versus the benchmark, which has no cash position.
Contributors to Performance
Strong stock selection in both the industrial goods & services and leisure sectors contributed to relative performance. Within the industrial goods & services sector, the fund’s position in defense company Leidos Holdings (b) boosted relative returns. Shares of Leidos Holdings appreciated throughout the period after the company secured a number of significant government contracts that included delivery of a joint mission planning system and integrated build environments for the U.S. Air Force. Within the leisure sector, the fund’s holdings of entertainment company Live Nation (b) helped relative results. Shares of Live Nation rose as the company reported strong bookings and ticket sales for arena, stadium and amphitheater shows. It also sold most of its planned advertising for the year which further benefited the stock.
A combination of strong stock selection and, to a lesser extent, an underweight position in the retailing sector, also supported relative performance. However, there were no individual stocks within this sector that were among the fund’s largest relative contributors during the period.
4
Management Review – continued
Stocks in other sectors that aided relative performance included overweight positions in telehealth platform provider Teladoc, disposable medical products maker Merit Medical Systems, regenerative biomaterials products manufacturer MiMedx Group, cloud-based solutions provider RingCentral and remote access and support solutions provider LogMeIn. Shares of Teladoc rose as the company posted strong results driven by strong growth in total membership and higher visit revenue. Management also maintained guidance for the fiscal 2017 year which further strengthened the stock. Additionally, holdings of integrated circuits and electronic devices manufacturer Cadence Design Systems (b) and agricultural solutions provider FMC (b), and the timing of the fund’s ownership in shares of online and mobile food-ordering company GrubHub also boosted relative results.
Respectfully,
Portfolio Manager(s)
Paul Gordon and Michael Grossman
| (b) | Security is not a benchmark constituent. |
| (h) | Security was not held in the portfolio at period end. |
Note to Shareholders: Effective October 1, 2017, Paul Gordon was no longer a Portfolio Manager of the Fund.
The views expressed in this report are those of the portfolio manager(s) only through the end of the period of the report as stated on the cover and do not necessarily reflect the views of MFS or any other person in the MFS organization. These views are subject to change at any time based on market or other conditions, and MFS disclaims any responsibility to update such views. These views may not be relied upon as investment advice or an indication of trading intent on behalf of any MFS portfolio. References to specific securities are not recommendations of such securities, and may not be representative of any MFS portfolio’s current or future investments.
5
PERFORMANCE SUMMARY THROUGH 8/31/17
The following chart illustrates a representative class of the fund’s historical performance in comparison to its benchmark(s). Performance results include the deduction of the maximum applicable sales charge and reflect the percentage change in net asset value, including reinvestment of dividends and capital gains distributions. The performance of other share classes will be greater than or less than that of the class depicted below. Benchmarks are unmanaged and may not be invested in directly. Benchmark returns do not reflect sales charges, commissions or expenses. (See Notes to Performance Summary.)
Performance data shown represents past performance and is no guarantee of future results. Investment return and principal value fluctuate so your shares, when sold, may be worth more or less than the original cost; current performance may be lower or higher than quoted. The performance shown does not reflect the deduction of taxes, if any, that a shareholder would pay on fund distributions or the redemption of fund shares.
Growth of a Hypothetical $10,000 Investment
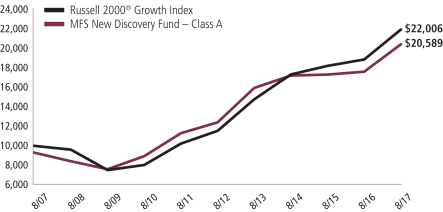
6
Performance Summary – continued
Total Returns through 8/31/17
Average annual without sales charge
| | | | | | | | | | | | | | |
| | | Share Class | | Class Inception Date | | 1-yr | | 5-yr | | 10-yr | | Life (t) | | |
| | | A | | 1/02/97 | | 15.83% | | 10.40% | | 8.13% | | N/A | | |
| | | B | | 11/03/97 | | 14.97% | | 9.57% | | 7.33% | | N/A | | |
| | | C | | 11/03/97 | | 14.94% | | 9.58% | | 7.33% | | N/A | | |
| | | I | | 1/02/97 | | 16.12% | | 10.67% | | 8.41% | | N/A | | |
| | | R1 | | 4/01/05 | | 14.91% | | 9.58% | | 7.33% | | N/A | | |
| | | R2 | | 10/31/03 | | 15.50% | | 10.13% | | 7.86% | | N/A | | |
| | | R3 | | 4/01/05 | | 15.81% | | 10.40% | | 8.14% | | N/A | | |
| | | R4 | | 4/01/05 | | 16.10% | | 10.68% | | 8.40% | | N/A | | |
| | | R6 | | 6/01/12 | | 16.26% | | 10.81% | | N/A | | 12.06% | | |
| | | 529A | | 7/31/02 | | 15.75% | | 10.36% | | 8.05% | | N/A | | |
| | | 529B | | 7/31/02 | | 14.87% | | 9.53% | | 7.26% | | N/A | | |
| | | 529C | | 7/31/02 | | 14.88% | | 9.51% | | 7.24% | | N/A | | |
| Comparative benchmark(s) | | | | | | | | | | |
| | | Russell 2000® Growth Index (f) | | 16.39% | | 13.75% | | 8.21% | | N/A | | |
| Average annual with sales charge | | | | | | | | | | |
| | | A
With Initial Sales Charge (5.75%) | | 9.17% | | 9.10% | | 7.49% | | N/A | | |
| | | B
With CDSC (Declining over six years from 4% to 0%) (v) | | 10.97% | | 9.29% | | 7.33% | | N/A | | |
| | | C
With CDSC (1% for 12 months) (v) | | 13.94% | | 9.58% | | 7.33% | | N/A | | |
| | | 529A
With initial Sales Charge (5.75%) | | 9.10% | | 9.06% | | 7.41% | | N/A | | |
| | | 529B
With CDSC (Declining over six years from 4% to 0%) (v) | | 10.87% | | 9.25% | | 7.26% | | N/A | | |
| | | 529C
With CDSC (1% for 12 months) (v) | | 13.88% | | 9.51% | | 7.24% | | N/A | | |
CDSC – Contingent Deferred Sales Charge.
Class I, R1, R2, R3, R4, and R6 shares do not have a sales charge.
| (f) | Source: FactSet Research Systems Inc. |
| (t) | For the period from the class inception date through the stated period end (for those share classes with less than 10 years of performance history). No comparative benchmark performance information is provided for “life” periods. (See Notes to Performance Summary.) |
| (v) | Assuming redemption at the end of the applicable period. |
7
Performance Summary – continued
Benchmark Definition(s)
Russell 2000® Growth Index – constructed to provide a comprehensive barometer for growth securities in the small-cap segment of the U.S. equity universe. Companies in this index generally have higher price-to-book ratios and higher forecasted growth values. The Russell 2000® Growth Index is a trademark/service mark of the Frank Russell Company. Russell® is a trademark of the Frank Russell Company.
It is not possible to invest directly in an index.
Notes to Performance Summary
Class 529 shares are only available in conjunction with qualified tuition programs, such as the MFS 529 Savings Plan. There also is an additional fee, which is detailed in the program description, on qualified tuition programs. If this fee was reflected, the performance for Class 529 shares would have been lower. This annual fee is waived for Oregon residents and for those accounts with assets of $25,000 or more.
Average annual total return represents the average annual change in value for each share class for the periods presented. Life returns are presented where the share class has less than 10 years of performance history and represent the average annual total return from the class inception date to the stated period end date. As the fund’s share classes may have different inception dates, the life returns may represent different time periods and may not be comparable. As a result, no comparative benchmark performance information is provided for life periods.
Performance results reflect any applicable expense subsidies and waivers in effect during the periods shown. Without such subsidies and waivers the fund’s performance results would be less favorable. Please see the prospectus and financial statements for complete details.
Performance results do not include adjustments made for financial reporting purposes in accordance with U.S. generally accepted accounting principles and may differ from amounts reported in the financial highlights.
From time to time the fund may receive proceeds from litigation settlements, without which performance would be lower.
8
EXPENSE TABLE
Fund expenses borne by the shareholders during the period, March 1, 2017 through August 31, 2017
As a shareholder of the fund, you incur two types of costs: (1) transaction costs, including sales charges (loads) on certain purchase or redemption payments, and (2) ongoing costs, including management fees; distribution and service (12b-1) fees; and other fund expenses. This example is intended to help you understand your ongoing costs (in dollars) of investing in the fund and to compare these costs with the ongoing costs of investing in other mutual funds.
The example is based on an investment of $1,000 invested at the beginning of the period and held for the entire period March 1, 2017 through August 31, 2017.
Actual Expenses
The first line for each share class in the following table provides information about actual account values and actual expenses. You may use the information in this line, together with the amount you invested, to estimate the expenses that you paid over the period. Simply divide your account value by $1,000 (for example, an $8,600 account value divided by $1,000 = 8.6), then multiply the result by the number in the first line under the heading entitled “Expenses Paid During Period” to estimate the expenses you paid on your account during this period.
Hypothetical Example for Comparison Purposes
The second line for each share class in the following table provides information about hypothetical account values and hypothetical expenses based on the fund’s actual expense ratio and an assumed rate of return of 5% per year before expenses, which is not the fund’s actual return. The hypothetical account values and expenses may not be used to estimate the actual ending account balance or expenses you paid for the period. You may use this information to compare the ongoing costs of investing in the fund and other funds. To do so, compare this 5% hypothetical example with the 5% hypothetical examples that appear in the shareholder reports of the other funds.
Please note that the expenses shown in the table are meant to highlight your ongoing costs only and do not reflect any transactional costs, such as sales charges (loads). Therefore, the second line for each share class in the table is useful in comparing ongoing costs only, and will not help you determine the relative total costs of owning different funds. In addition, if these transactional costs were included, your costs would have been higher.
9
Expense Table – continued
| | | | | | | | | | | | | | | | | | |
Share
Class | | | | Annualized
Expense
Ratio | | | Beginning
Account Value
3/01/17 | | | Ending
Account Value
8/31/17 | | | Expenses
Paid During
Period (p)
3/01/17-8/31/17 | |
| A | | Actual | | | 1.33% | | | | $1,000.00 | | | | $1,086.02 | | | | $6.99 | |
| | Hypothetical (h) | | | 1.33% | | | | $1,000.00 | | | | $1,018.50 | | | | $6.77 | |
| B | | Actual | | | 2.08% | | | | $1,000.00 | | | | $1,081.66 | | | | $10.91 | |
| | Hypothetical (h) | | | 2.08% | | | | $1,000.00 | | | | $1,014.72 | | | | $10.56 | |
| C | | Actual | | | 2.09% | | | | $1,000.00 | | | | $1,081.51 | | | | $10.97 | |
| | Hypothetical (h) | | | 2.09% | | | | $1,000.00 | | | | $1,014.67 | | | | $10.61 | |
| I | | Actual | | | 1.09% | | | | $1,000.00 | | | | $1,087.56 | | | | $5.74 | |
| | Hypothetical (h) | | | 1.09% | | | | $1,000.00 | | | | $1,019.71 | | | | $5.55 | |
| R1 | | Actual | | | 2.09% | | | | $1,000.00 | | | | $1,081.73 | | | | $10.97 | |
| | Hypothetical (h) | | | 2.09% | | | | $1,000.00 | | | | $1,014.67 | | | | $10.61 | |
| R2 | | Actual | | | 1.59% | | | | $1,000.00 | | | | $1,084.77 | | | | $8.36 | |
| | Hypothetical (h) | | | 1.59% | | | | $1,000.00 | | | | $1,017.19 | | | | $8.08 | |
| R3 | | Actual | | | 1.34% | | | | $1,000.00 | | | | $1,086.12 | | | | $7.05 | |
| | Hypothetical (h) | | | 1.34% | | | | $1,000.00 | | | | $1,018.45 | | | | $6.82 | |
| R4 | | Actual | | | 1.09% | | | | $1,000.00 | | | | $1,087.06 | | | | $5.73 | |
| | Hypothetical (h) | | | 1.09% | | | | $1,000.00 | | | | $1,019.71 | | | | $5.55 | |
| R6 | | Actual | | | 0.98% | | | | $1,000.00 | | | | $1,088.11 | | | | $5.16 | |
| | Hypothetical (h) | | | 0.98% | | | | $1,000.00 | | | | $1,020.27 | | | | $4.99 | |
| 529A | | Actual | | | 1.37% | | | | $1,000.00 | | | | $1,085.83 | | | | $7.20 | |
| | Hypothetical (h) | | | 1.37% | | | | $1,000.00 | | | | $1,018.30 | | | | $6.97 | |
| 529B | | Actual | | | 2.13% | | | | $1,000.00 | | | | $1,081.89 | | | | $11.18 | |
| | Hypothetical (h) | | | 2.13% | | | | $1,000.00 | | | | $1,014.47 | | | | $10.82 | |
| 529C | | Actual | | | 2.14% | | | | $1,000.00 | | | | $1,081.40 | | | | $11.23 | |
| | Hypothetical (h) | | | 2.14% | | | | $1,000.00 | | | | $1,014.42 | | | | $10.87 | |
| (h) | 5% class return per year before expenses. |
| (p) | “Expenses Paid During Period” are equal to each class’s annualized expense ratio, as shown above, multiplied by the average account value over the period, multiplied by 184/365 (to reflect the one-half year period). Expenses paid do not include any applicable sales charges (loads). If these transaction costs had been included, your costs would have been higher. |
Notes to Expense Table
Each class with a Rule 12b-1 service fee is subject to a rebate of a portion of such fee. Such rebates are included in the expense ratios above. For Class A, Class 529A, and Class 529B shares, this rebate reduced the expense ratios above by 0.01%, 0.02%, and 0.01%, respectively. See Note 3 in the Notes to Financial Statements for additional information.
10
PORTFOLIO OF INVESTMENTS
8/31/17
The Portfolio of Investments is a complete list of all securities owned by your fund. It is categorized by broad-based asset classes.
| | | | | | | | |
| Common Stocks - 98.0% | | | | | | | | |
| Issuer | | Shares/Par | | | Value ($) | |
| Aerospace - 1.6% | | | | | | | | |
| HEICO Corp. | | | 98,617 | | | $ | 8,458,380 | |
| Leidos Holdings, Inc. | | | 167,827 | | | | 9,787,671 | |
| | | | | | | | |
| | | | | | | $ | 18,246,051 | |
| Automotive - 1.3% | | | | | | | | |
| Kar Auction Services, Inc. | | | 337,961 | | | $ | 15,238,661 | |
| | |
| Biotechnology - 4.1% | | | | | | | | |
| ACADIA Pharmaceuticals, Inc. (a) | | | 110,073 | | | $ | 3,919,700 | |
| Alder Biopharmaceuticals, Inc. (a) | | | 185,099 | | | | 1,813,970 | |
| Amicus Therapeutics, Inc. (a) | | | 523,816 | | | | 7,301,995 | |
| Bio-Techne Corp. | | | 53,167 | | | | 6,581,011 | |
| Exact Sciences Corp. (a) | | | 117,643 | | | | 4,928,065 | |
| MiMedx Group, Inc. (a)(l) | | | 489,329 | | | | 7,961,383 | |
| Neurocrine Biosciences, Inc. (a) | | | 65,764 | | | | 3,722,242 | |
| Spark Therapeutics, Inc. (a) | | | 70,353 | | | | 5,792,162 | |
| Tesaro, Inc. (a) | | | 28,868 | | | | 3,728,014 | |
| VTV Therapeutics, Inc. (a) | | | 275,016 | | | | 1,493,337 | |
| | | | | | | | |
| | | | | | | $ | 47,241,879 | |
| Brokerage & Asset Managers - 1.5% | | | | | | | | |
| Hamilton Lane, Inc.,“A” | | | 352,834 | | | $ | 8,270,429 | |
| NASDAQ, Inc. | | | 112,836 | | | | 8,505,578 | |
| | | | | | | | |
| | | | | | | $ | 16,776,007 | |
| Business Services - 7.2% | | | | | | | | |
| CoStar Group, Inc. (a) | | | 19,892 | | | $ | 5,701,445 | |
| Global Payments, Inc. | | | 139,912 | | | | 13,360,197 | |
| RingCentral, Inc. (a) | | | 339,706 | | | | 14,386,549 | |
| Travelport Worldwide Ltd. | | | 380,469 | | | | 5,760,301 | |
| Tyler Technologies, Inc. (a) | | | 33,442 | | | | 5,778,777 | |
| WNS (Holdings) Ltd., ADR (a) | | | 282,195 | | | | 9,876,825 | |
| Yext, Inc. (a)(l) | | | 826,704 | | | | 10,755,419 | |
| Zendesk, Inc. (a) | | | 623,607 | | | | 17,086,832 | |
| | | | | | | | |
| | | | | | | $ | 82,706,345 | |
| Chemicals - 1.9% | | | | | | | | |
| FMC Corp. | | | 73,794 | | | $ | 6,362,519 | |
| Ingevity Corp. (a) | | | 243,235 | | | | 15,316,508 | |
| | | | | | | | |
| | | | | | | $ | 21,679,027 | |
11
Portfolio of Investments – continued
| | | | | | | | |
| Issuer | | Shares/Par | | | Value ($) | |
| Common Stocks - continued | | | | | | | | |
| Computer Software - 4.9% | | | | | | | | |
| 2U, Inc. (a) | | | 181,996 | | | $ | 9,118,000 | |
| Cadence Design Systems, Inc. (a) | | | 292,783 | | | | 11,503,444 | |
| MuleSoft, Inc., “A” (a)(l) | | | 303,362 | | | | 6,613,292 | |
| Okta, Inc. (a) | | | 115,671 | | | | 3,121,960 | |
| Paylocity Holding Corp. (a) | | | 185,314 | | | | 9,106,330 | |
| Twilio, Inc., “A” (a)(l) | | | 315,574 | | | | 9,240,007 | |
| Ultimate Software Group, Inc. (a) | | | 37,035 | | | | 7,440,331 | |
| | | | | | | | |
| | | | | | | $ | 56,143,364 | |
| Computer Software - Systems - 9.9% | | | | | | | | |
| Electronics For Imaging, Inc. (a) | | | 103,650 | | | $ | 3,685,794 | |
| Five9, Inc. (a) | | | 487,520 | | | | 10,481,680 | |
| HubSpot, Inc. (a) | | | 84,254 | | | | 6,180,031 | |
| Kinaxis, Inc. (a) | | | 87,732 | | | | 5,148,349 | |
| New Relic, Inc. (a) | | | 252,835 | | | | 12,110,796 | |
| NICE Systems Ltd., ADR | | | 231,268 | | | | 18,089,783 | |
| Proofpoint, Inc. (a) | | | 84,521 | | | | 7,755,647 | |
| Q2 Holdings, Inc. (a) | | | 275,678 | | | | 11,192,527 | |
| Rapid7, Inc. (a) | | | 501,401 | | | | 8,453,621 | |
| RealPage, Inc (a) | | | 245,446 | | | | 10,578,723 | |
| SS&C Technologies Holdings, Inc. | | | 523,917 | | | | 20,280,827 | |
| | | | | | | | |
| | | | | | | $ | 113,957,778 | |
| Construction - 6.4% | | | | | | | | |
| Foundation Building Materials, Inc. (a) | | | 661,147 | | | $ | 8,634,580 | |
| GMS, Inc. (a) | | | 495,828 | | | | 15,955,745 | |
| Lennox International, Inc. | | | 30,926 | | | | 5,125,366 | |
| Pool Corp. | | | 42,047 | | | | 4,191,666 | |
| Siteone Landscape Supply, Inc. (a) | | | 260,035 | | | | 13,064,158 | |
| Summit Materials, Inc., “A” (a) | | | 448,071 | | | | 13,236,017 | |
| Techtronic Industries Co. Ltd. | | | 1,013,500 | | | | 5,245,088 | |
| Trex Co., Inc. (a) | | | 113,532 | | | | 8,628,432 | |
| | | | | | | | |
| | | | | | | $ | 74,081,052 | |
| Consumer Products - 0.7% | | | | | | | | |
| E.L.F. Beauty, Inc. (a)(l) | | | 384,170 | | | $ | 7,948,477 | |
| | |
| Consumer Services - 2.6% | | | | | | | | |
| Bright Horizons Family Solutions, Inc. (a) | | | 346,818 | | | $ | 27,721,162 | |
| Carriage Services, Inc. | | | 80,067 | | | | 1,960,841 | |
| | | | | | | | |
| | | | | | | $ | 29,682,003 | |
| Containers - 1.9% | | | | | | | | |
| Berry Global Group, Inc. (a) | | | 389,778 | | | $ | 21,921,115 | |
12
Portfolio of Investments – continued
| | | | | | | | |
| Issuer | | Shares/Par | | | Value ($) | |
| Common Stocks - continued | | | | | | | | |
| Electrical Equipment - 1.4% | | | | | | | | |
| Littlefuse, Inc. | | | 38,122 | | | $ | 7,096,792 | |
| WESCO International, Inc. (a) | | | 172,476 | | | | 8,701,414 | |
| | | | | | | | |
| | | | | | | $ | 15,798,206 | |
| Electronics - 4.2% | | | | | | | | |
| Inphi Corp. (a) | | | 269,287 | | | $ | 10,310,999 | |
| MACOM Technology Solutions Holdings, Inc. (a) | | | 160,718 | | | | 7,319,098 | |
| Mercury Systems, Inc. (a) | | | 164,039 | | | | 7,914,882 | |
| Monolithic Power Systems, Inc. | | | 110,553 | | | | 11,201,230 | |
| Silicon Laboratories, Inc. (a) | | | 150,465 | | | | 11,420,293 | |
| | | | | | | | |
| | | | | | | $ | 48,166,502 | |
| Entertainment - 1.4% | | | | | | | | |
| Live Nation, Inc. (a) | | | 401,775 | | | $ | 16,054,929 | |
| | |
| Food & Beverages - 3.7% | | | | | | | | |
| Blue Buffalo Pet Products, Inc. (a) | | | 471,452 | | | $ | 12,144,603 | |
| Cal-Maine Foods, Inc. (a) | | | 221,941 | | | | 8,089,749 | |
| Flex Pharma, Inc. (a)(l) | | | 222,918 | | | | 876,068 | |
| Greencore Group PLC | | | 2,562,754 | | | | 6,793,493 | |
| Snyders-Lance, Inc. | | | 408,657 | | | | 14,515,497 | |
| | | | | | | | |
| | | | | | | $ | 42,419,410 | |
| Gaming & Lodging - 0.5% | | | | | | | | |
| Vail Resorts, Inc. | | | 26,204 | | | $ | 5,973,202 | |
| | |
| General Merchandise - 0.8% | | | | | | | | |
| Five Below, Inc. (a) | | | 113,769 | | | $ | 5,411,991 | |
| Ollie’s Bargain Outlet Holdings, Inc. (a) | | | 104,130 | | | | 4,357,841 | |
| | | | | | | | |
| | | | | | | $ | 9,769,832 | |
| Internet - 2.9% | | | | | | | | |
| GrubHub, Inc. (a) | | | 305,203 | | | $ | 17,424,039 | |
| LogMeIn, Inc. | | | 140,531 | | | | 16,076,747 | |
| | | | | | | | |
| | | | | | | $ | 33,500,786 | |
| Machinery & Tools - 3.3% | | | | | | | | |
| Gardner Denver Holdings, Inc. (a) | | | 373,405 | | | $ | 8,771,284 | |
| Ritchie Bros. Auctioneers, Inc. | | | 373,259 | | | | 11,100,723 | |
| SPX FLOW, Inc. (a) | | | 228,803 | | | | 7,658,036 | |
| WABCO Holdings, Inc. (a) | | | 75,699 | | | | 10,871,890 | |
| | | | | | | | |
| | | | | | | $ | 38,401,933 | |
13
Portfolio of Investments – continued
| | | | | | | | |
| Issuer | | Shares/Par | | | Value ($) | |
| Common Stocks - continued | | | | | | | | |
| Medical & Health Technology & Services - 4.9% | | | | | | | | |
| Capital Senior Living Corp. (a) | | | 486,402 | | | $ | 6,045,977 | |
| Evolent Health, Inc.,“A” (a) | | | 345,741 | | | | 5,773,875 | |
| Healthcare Services Group, Inc. | | | 216,516 | | | | 11,085,619 | |
| ICON PLC (a) | | | 77,186 | | | | 8,752,121 | |
| INC Research Holdings, Inc., “A” (a) | | | 215,723 | | | | 12,662,940 | |
| Teladoc, Inc. (a) | | | 347,270 | | | | 11,650,908 | |
| | | | | | | | |
| | | | | | | $ | 55,971,440 | |
| Medical Equipment - 9.0% | | | | | | | | |
| DexCom, Inc. (a) | | | 133,225 | | | $ | 9,939,917 | |
| Insulet Corp. (a) | | | 66,530 | | | | 3,862,732 | |
| iRhythm Technologies, Inc. (a) | | | 147,048 | | | | 7,020,071 | |
| Masimo Corp. (a) | | | 55,304 | | | | 4,666,552 | |
| Merit Medical Systems, Inc. (a) | | | 306,758 | | | | 12,669,105 | |
| Nevro Corp. (a) | | | 106,735 | | | | 9,198,422 | |
| NxStage Medical, Inc. (a) | | | 228,576 | | | | 6,400,128 | |
| Obalon Therapeutics, Inc. (a)(l) | | | 287,124 | | | | 2,581,245 | |
| PerkinElmer, Inc. | | | 214,981 | | | | 14,401,577 | |
| Steris PLC | | | 243,835 | | | | 21,252,659 | |
| Tactile Systems Technology, Inc. (a) | | | 105,450 | | | | 3,467,196 | |
| West Pharmaceutical Services, Inc. | | | 98,051 | | | | 8,534,359 | |
| | | | | | | | |
| | | | | | | $ | 103,993,963 | |
| Oil Services - 0.9% | | | | | | | | |
| Patterson-UTI Energy, Inc. | | | 273,042 | | | $ | 4,360,480 | |
| U.S. Silica Holdings, Inc. | | | 215,399 | | | | 5,861,007 | |
| | | | | | | | |
| | | | | | | $ | 10,221,487 | |
| Other Banks & Diversified Financials - 3.6% | | | | | | | | |
| Bank of the Ozarks, Inc. | | | 244,041 | | | $ | 10,484,001 | |
| Pinnacle Financial Partners, Inc. | | | 141,105 | | | | 8,776,731 | |
| Preferred Bank | | | 118,586 | | | | 6,379,927 | |
| Texas Capital Bancshares, Inc. (a) | | | 104,807 | | | | 7,781,920 | |
| Wintrust Financial Corp. | | | 117,151 | | | | 8,529,764 | |
| | | | | | | | |
| | | | | | | $ | 41,952,343 | |
| Pharmaceuticals - 1.4% | | | | | | | | |
| Aratana Therapeutics, Inc. (a)(l) | | | 608,472 | | | $ | 3,474,375 | |
| Collegium Pharmaceutical, Inc. (a)(l) | | | 414,347 | | | | 4,160,044 | |
| PetIQ, Inc. (a) | | | 258,647 | | | | 6,481,694 | |
| TherapeuticsMD, Inc. (a)(l) | | | 405,152 | | | | 2,430,912 | |
| | | | | | | | |
| | | | | | | $ | 16,547,025 | |
14
Portfolio of Investments – continued
| | | | | | | | |
| Issuer | | Shares/Par | | | Value ($) | |
| Common Stocks - continued | | | | | | | | |
| Pollution Control - 0.9% | | | | | | | | |
| Clean Harbors, Inc. (a) | | | 194,689 | | | $ | 10,530,728 | |
| | |
| Railroad & Shipping - 0.3% | | | | | | | | |
| StealthGas, Inc. (a) | | | 976,797 | | | $ | 3,145,286 | |
| | |
| Real Estate - 2.1% | | | | | | | | |
| Big Yellow Group PLC, REIT | | | 458,482 | | | $ | 4,793,301 | |
| Life Storage, Inc., REIT | | | 116,817 | | | | 8,596,563 | |
| STAG Industrial, Inc., REIT | | | 369,179 | | | | 10,333,320 | |
| | | | | | | | |
| | | | | | | $ | 23,723,184 | |
| Restaurants - 5.0% | | | | | | | | |
| Dave & Buster’s, Inc. (a) | | | 109,829 | | | $ | 6,420,603 | |
| Domino’s Pizza Group PLC | | | 1,852,995 | | | | 6,479,079 | |
| Performance Food Group Co. (a) | | | 527,654 | | | | 14,668,781 | |
| U.S. Foods Holding Corp. (a) | | | 583,031 | | | | 16,004,201 | |
| Wingstop, Inc. (l) | | | 193,411 | | | | 6,268,451 | |
| Zoe’s Kitchen, Inc. (a)(l) | | | 575,333 | | | | 7,404,536 | |
| | | | | | | | |
| | | | | | | $ | 57,245,651 | |
| Special Products & Services - 1.0% | | | | | | | | |
| Boyd Group Income Fund, IEU | | | 155,140 | | | $ | 11,609,876 | |
| | |
| Specialty Chemicals - 5.1% | | | | | | | | |
| Axalta Coating Systems Ltd. (a) | | | 467,954 | | | $ | 13,814,002 | |
| Ferro Corp. (a) | | | 462,530 | | | | 8,912,953 | |
| Ferroglobe PLC | | | 458,482 | | | | 6,184,922 | |
| Nexeo Solutions, Inc. (a) | | | 940,101 | | | | 6,740,524 | |
| RPM International, Inc. | | | 242,928 | | | | 11,896,184 | |
| Univar, Inc. (a) | | | 416,801 | | | | 11,757,957 | |
| | | | | | | | |
| | | | | | | $ | 59,306,542 | |
| Specialty Stores - 1.0% | | | | | | | | |
| Michaels Co., Inc. (a) | | | 332,691 | | | $ | 7,468,913 | |
| Urban Outfitters, Inc. (a) | | | 179,001 | | | | 3,658,780 | |
| | | | | | | | |
| | | | | | | $ | 11,127,693 | |
| Trucking - 0.6% | | | | | | | | |
| Swift Transportation Co. (a) | | | 245,477 | | | $ | 6,885,630 | |
| Total Common Stocks (Identified Cost, $ 903,318,626) | | | | | | $ | 1,127,967,407 | |
15
Portfolio of Investments – continued
| | | | | | | | |
| Investment Companies (h) - 2.0% | | | | | | | | |
| Issuer | | Shares/Par | | | Value ($) | |
| Money Market Funds - 2.0% | | | | | | | | |
MFS Institutional Money Market Portfolio, 1.11% (v)
(Identified Cost, $23,452,182) | | | 23,454,525 | | | $ | 23,454,525 | |
| | |
| Collateral for Securities Loaned - 1.6% | | | | | | | | |
| State Street Navigator Securities Lending Government Money Market Portfolio, 1.01% (j) (Identified Cost, $17,943,175) | | | 17,943,175 | | | $ | 17,943,175 | |
| | |
| Other Assets, Less Liabilities - (1.6)% | | | | | | | (18,860,809 | ) |
| Net Assets - 100.0% | | | | | | $ | 1,150,504,298 | |
| (a) | Non-income producing security. |
| (h) | An affiliated issuer may be considered one in which the fund owns 5% or more of the outstanding voting securities, or a company which is under common control. At period end, the aggregate values of the fund’s investments in affiliated issuers and in unaffiliated issuers were $23,454,525 and $1,145,910,582, respectively. |
| (j) | The rate quoted is the annualized seven-day yield of the fund at period end. |
| (l) | A portion of this security is on loan. |
| (v) | Affiliated issuer that is available only to investment companies managed by MFS. The rate quoted for the MFS Institutional Money Market Portfolio is the annualized seven-day yield of the fund at period end. |
The following abbreviations are used in this report and are defined:
| ADR | | American Depositary Receipt |
| IEU | | International Equity Unit |
| PLC | | Public Limited Company |
| REIT | | Real Estate Investment Trust |
See Notes to Financial Statements
16
Financial Statements
STATEMENT OF ASSETS AND LIABILITIES
At 8/31/17
This statement represents your fund’s balance sheet, which details the assets and liabilities comprising the total value of the fund.
| | | | |
| Assets | | | | |
Investments in unaffiliated issuers, at value, including $27,523,659 of securities on loan (identified cost, $921,261,801) | | | $1,145,910,582 | |
Investments in affiliated issuers, at value (identified cost, $23,452,182) | | | 23,454,525 | |
Receivables for | | | | |
Investments sold | | | 10,266,292 | |
Fund shares sold | | | 1,894,261 | |
Interest and dividends | | | 501,420 | |
Other assets | | | 1,167 | |
Total assets | | | $1,182,028,247 | |
| Liabilities | | | | |
Payables for | | | | |
Investments purchased | | | $10,897,020 | |
Fund shares reacquired | | | 2,164,333 | |
Collateral for securities loaned, at value (c) | | | 17,943,175 | |
Payable to affiliates | | | | |
Investment adviser | | | 55,821 | |
Shareholder servicing costs | | | 286,931 | |
Distribution and service fees | | | 10,093 | |
Program manager fee | | | 21 | |
Payable for independent Trustees’ compensation | | | 2,085 | |
Accrued expenses and other liabilities | | | 164,470 | |
Total liabilities | | | $31,523,949 | |
Net assets | | | $1,150,504,298 | |
| Net assets consist of | | | | |
Paid-in capital | | | $861,325,063 | |
Unrealized appreciation (depreciation) | | | 224,649,814 | |
Accumulated net realized gain (loss) | | | 64,531,495 | |
Accumulated net investment loss | | | (2,074 | ) |
Net assets | | | $1,150,504,298 | |
Shares of beneficial interest outstanding | | | 41,273,014 | |
17
Statement of Assets and Liabilities – continued
| | | | | | | | | | | | |
| | | Net assets | | | Shares
outstanding | | | Net asset value
per share (a) | |
Class A | | | $394,877,601 | | | | 14,480,409 | | | | $27.27 | |
Class B | | | 20,143,090 | | | | 889,204 | | | | 22.65 | |
Class C | | | 76,723,650 | | | | 3,380,583 | | | | 22.70 | |
Class I | | | 106,459,006 | | | | 3,570,895 | | | | 29.81 | |
Class R1 | | | 4,376,808 | | | | 194,487 | | | | 22.50 | |
Class R2 | | | 29,129,793 | | | | 1,126,725 | | | | 25.85 | |
Class R3 | | | 42,346,210 | | | | 1,554,598 | | | | 27.24 | |
Class R4 | | | 83,185,511 | | | | 2,921,329 | | | | 28.48 | |
Class R6 | | | 385,439,854 | | | | 12,844,009 | | | | 30.01 | |
Class 529A | | | 5,902,031 | | | | 223,175 | | | | 26.45 | |
Class 529B | | | 325,251 | | | | 14,830 | | | | 21.93 | |
Class 529C | | | 1,595,493 | | | | 72,770 | | | | 21.93 | |
| (a) | Maximum offering price per share was equal to the net asset value per share for all share classes, except for Classes A and 529A, for which the maximum offering prices per share were $28.93 [100 / 94.25 x $27.27] and $28.06 [100 / 94.25 x $26.45], respectively. On sales of $50,000 or more, the maximum offering prices of Class A and Class 529A shares are reduced. A contingent deferred sales charge may be imposed on redemptions of Class A, Class B, Class C, Class 529B, and Class 529C shares. Redemption price per share was equal to the net asset value per share for Classes I, R1, R2, R3, R4, R6, and 529A. |
| (c) | Non-cash collateral is not included. |
See Notes to Financial Statements
18
Financial Statements
STATEMENT OF OPERATIONS
Year ended 8/31/17
This statement describes how much your fund earned in investment income and accrued in expenses. It also describes any gains and/or losses generated by fund operations.
| | | | |
| Net investment income (loss) | | | | |
Income | | | | |
Dividends | | | $6,146,212 | |
Income on securities loaned | | | 809,465 | |
Dividends from affiliated issuers | | | 170,013 | |
Other | | | 7,797 | |
Foreign taxes withheld | | | (86,590 | ) |
Total investment income | | | $7,046,897 | |
Expenses | | | | |
Management fee | | | $9,949,618 | |
Distribution and service fees | | | 2,332,472 | |
Shareholder servicing costs | | | 1,301,954 | |
Program manager fees | | | 7,153 | |
Administrative services fee | | | 185,662 | |
Independent Trustees’ compensation | | | 25,760 | |
Custodian fee | | | 73,396 | |
Reimbursement of custodian expenses | | | (75,313 | ) |
Shareholder communications | | | 155,838 | |
Audit and tax fees | | | 58,210 | |
Legal fees | | | 12,260 | |
Miscellaneous | | | 188,114 | |
Total expenses | | | $14,215,124 | |
Reduction of expenses by investment adviser and distributor | | | (141,481 | ) |
Net expenses | | | $14,073,643 | |
Net investment income (loss) | | | $(7,026,746 | ) |
| Realized and unrealized gain (loss) | | | | |
Realized gain (loss) (identified cost basis) | | | | |
Unaffiliated issuers | | | $113,177,604 | |
Affiliated issuers | | | (12,383,990 | ) |
Foreign currency | | | (6,702 | ) |
Net realized gain (loss) | | | $100,786,912 | |
Change in unrealized appreciation (depreciation) | | | | |
Unaffiliated issuers | | | $67,195,823 | |
Affiliated issuers | | | 4,238,724 | |
Translation of assets and liabilities in foreign currencies | | | (1,049 | ) |
Net unrealized gain (loss) | | | $71,433,498 | |
Net realized and unrealized gain (loss) | | | $172,220,410 | |
Change in net assets from operations | | | $165,193,664 | |
See Notes to Financial Statements
19
Financial Statements
STATEMENTS OF CHANGES IN NET ASSETS
These statements describe the increases and/or decreases in net assets resulting from operations, any distributions, and any shareholder transactions.
| | | | | | | | |
| | | Year ended | |
| | | 8/31/17 | | | 8/31/16 | |
| Change in net assets | | | | | | |
| From operations | | | | | | | | |
Net investment income (loss) | | | $(7,026,746 | ) | | | $(5,354,613 | ) |
Net realized gain (loss) | | | 100,786,912 | | | | 18,100,820 | |
Net unrealized gain (loss) | | | 71,433,498 | | | | (5,221,249 | ) |
Change in net assets from operations | | | $165,193,664 | | | | $7,524,958 | |
| Distributions declared to shareholders | | | | | | | | |
From net realized gain | | | $(25,588,520 | ) | | | $— | |
Change in net assets from fund share transactions | | | $(118,490,984 | ) | | | $(251,345,128 | ) |
Total change in net assets | | | $21,114,160 | | | | $(243,820,170 | ) |
| Net assets | | | | | | | | |
At beginning of period | | | 1,129,390,138 | | | | 1,373,210,308 | |
At end of period (including accumulated net investment
loss of $2,074 and $1,146,174, respectively) | | | $1,150,504,298 | | | | $1,129,390,138 | |
See Notes to Financial Statements
20
Financial Statements
FINANCIAL HIGHLIGHTS
The financial highlights table is intended to help you understand the fund’s financial performance for the past 5 years. Certain information reflects financial results for a single fund share. The total returns in the table represent the rate that an investor would have earned (or lost) on an investment in the fund share class (assuming reinvestment of all distributions) held for the entire period.
| | | | | | | | | | | | | | | | | | | | |
| Class A | | Year ended | |
| | | 8/31/17 | | | 8/31/16 | | | 8/31/15 | | | 8/31/14 | | | 8/31/13 | |
Net asset value, beginning of period | | | $24.11 | | | | $23.69 | | | | $25.49 | | | | $25.86 | | | | $20.17 | |
| Income (loss) from investment operations | | | | | | | | | | | | | | | | | |
Net investment income (loss) (d) | | | $(0.18 | )(c) | | | $(0.11 | ) | | | $(0.20 | ) | | | $(0.22 | ) | | | $(0.14 | ) |
Net realized and unrealized gain (loss) | | | 3.92 | | | | 0.53 | | | | 0.22 | | | | 2.30 | | | | 5.83 | |
Total from investment operations | | | $3.74 | | | | $0.42 | | | | $0.02 | | | | $2.08 | | | | $5.69 | |
| Less distributions declared to shareholders | | | | | | | | | | | | | | | | | |
From net realized gain | | | $(0.58 | ) | | | $— | | | | $(1.82 | ) | | | $(2.45 | ) | | | $— | |
Net asset value, end of period (x) | | | $27.27 | | | | $24.11 | | | | $23.69 | | | | $25.49 | | | | $25.86 | |
Total return (%) (r)(s)(t)(x) | | | 15.83 | (c) | | | 1.77 | | | | 0.47 | | | | 8.01 | | | | 28.21 | |
Ratios (%) (to average net assets)
and Supplemental data: | | | | | | | | | | | | | | | | | |
Expenses before expense reductions (f) | | | 1.35 | (c) | | | 1.36 | | | | 1.36 | | | | 1.33 | | | | 1.35 | |
Expenses after expense reductions (f) | | | 1.33 | (c) | | | 1.34 | | | | 1.31 | | | | 1.27 | | | | 1.31 | |
Net investment income (loss) | | | (0.70 | )(c) | | | (0.50 | ) | | | (0.81 | ) | | | (0.83 | ) | | | (0.59 | ) |
Portfolio turnover | | | 53 | | | | 49 | | | | 56 | | | | 98 | | | | 96 | |
Net assets at end of period (000 omitted) | | | $394,878 | | | | $400,997 | | | | $457,437 | | | | $620,802 | | | | $866,006 | |
See Notes to Financial Statements
21
Financial Highlights – continued
| | | | | | | | | | | | | | | | | | | | |
| Class B | | Year ended | |
| | | 8/31/17 | | | 8/31/16 | | | 8/31/15 | | | 8/31/14 | | | 8/31/13 | |
Net asset value, beginning of period | | | $20.27 | | | | $20.07 | | | | $22.04 | | | | $22.83 | | | | $17.94 | |
| Income (loss) from investment operations | | | | | | | | | | | | | | | | | |
Net investment income (loss) (d) | | | $(0.30 | )(c) | | | $(0.24 | ) | | | $(0.32 | ) | | | $(0.36 | ) | | | $(0.27 | ) |
Net realized and unrealized gain (loss) | | | 3.26 | | | | 0.44 | | | | 0.17 | | | | 2.02 | | | | 5.16 | |
Total from investment operations | | | $2.96 | | | | $0.20 | | | | $(0.15 | ) | | | $1.66 | | | | $4.89 | |
| Less distributions declared to shareholders | | | | | | | | | | | | | | | | | |
From net realized gain | | | $(0.58 | ) | | | $— | | | | $(1.82 | ) | | | $(2.45 | ) | | | $— | |
Net asset value, end of period (x) | | | $22.65 | | | | $20.27 | | | | $20.07 | | | | $22.04 | | | | $22.83 | |
Total return (%) (r)(s)(t)(x) | | | 14.97 | (c) | | | 1.00 | | | | (0.27 | ) | | | 7.18 | | | | 27.26 | |
Ratios (%) (to average net assets)
and Supplemental data: | | | | | | | | | | | | | | | | | |
Expenses before expense reductions (f) | | | 2.10 | (c) | | | 2.11 | | | | 2.11 | | | | 2.08 | | | | 2.10 | |
Expenses after expense reductions (f) | | | 2.08 | (c) | | | 2.09 | | | | 2.06 | | | | 2.02 | | | | 2.06 | |
Net investment income (loss) | | | (1.45 | )(c) | | | (1.26 | ) | | | (1.57 | ) | | | (1.58 | ) | | | (1.34 | ) |
Portfolio turnover | | | 53 | | | | 49 | | | | 56 | | | | 98 | | | | 96 | |
Net assets at end of period (000 omitted) | | | $20,143 | | | | $22,906 | | | | $27,455 | | | | $34,971 | | | | $37,952 | |
| |
| Class C | | Year ended | |
| | | 8/31/17 | | | 8/31/16 | | | 8/31/15 | | | 8/31/14 | | | 8/31/13 | |
Net asset value, beginning of period | | | $20.31 | | | | $20.11 | | | | $22.08 | | | | $22.86 | | | | $17.96 | |
| Income (loss) from investment operations | | | | | | | | | | | | | | | | | |
Net investment income (loss) (d) | | | $(0.31 | )(c) | | | $(0.24 | ) | | | $(0.32 | ) | | | $(0.36 | ) | | | $(0.27 | ) |
Net realized and unrealized gain (loss) | | | 3.28 | | | | 0.44 | | | | 0.17 | | | | 2.03 | | | | 5.17 | |
Total from investment operations | | | $2.97 | | | | $0.20 | | | | $(0.15 | ) | | | $1.67 | | | | $4.90 | |
| Less distributions declared to shareholders | | | | | | | | | | | | | | | | | |
From net realized gain | | | $(0.58 | ) | | | $— | | | | $(1.82 | ) | | | $(2.45 | ) | | | $— | |
Net asset value, end of period (x) | | | $22.70 | | | | $20.31 | | | | $20.11 | | | | $22.08 | | | | $22.86 | |
Total return (%) (r)(s)(t)(x) | | | 14.99 | (c) | | | 0.99 | | | | (0.28 | ) | | | 7.22 | | | | 27.28 | |
Ratios (%) (to average net assets)
and Supplemental data: | | | | | | | | | | | | | | | | | |
Expenses before expense reductions (f) | | | 2.10 | (c) | | | 2.11 | | | | 2.11 | | | | 2.08 | | | | 2.10 | |
Expenses after expense reductions (f) | | | 2.09 | (c) | | | 2.09 | | | | 2.06 | | | | 2.02 | | | | 2.06 | |
Net investment income (loss) | | | (1.45 | )(c) | | | (1.27 | ) | | | (1.57 | ) | | | (1.59 | ) | | | (1.35 | ) |
Portfolio turnover | | | 53 | | | | 49 | | | | 56 | | | | 98 | | | | 96 | |
Net assets at end of period (000 omitted) | | | $76,724 | | | | $85,370 | | | | $105,686 | | | | $141,293 | | | | $136,913 | |
See Notes to Financial Statements
22
Financial Highlights – continued
| | | | | | | | | | | | | | | | | | | | |
| Class I | | Year ended | |
| | | 8/31/17 | | | 8/31/16 | | | 8/31/15 | | | 8/31/14 | | | 8/31/13 | |
Net asset value, beginning of period | | | $26.24 | | | | $25.72 | | | | $27.44 | | | | $27.61 | | | | $21.48 | |
| Income (loss) from investment operations | | | | | | | | | | | | | | | | | |
Net investment income (loss) (d) | | | $(0.12 | )(c) | | | $(0.07 | ) | | | $(0.14 | ) | | | $(0.17 | ) | | | $(0.09 | ) |
Net realized and unrealized gain (loss) | | | 4.27 | | | | 0.59 | | | | 0.24 | | | | 2.45 | | | | 6.22 | |
Total from investment operations | | | $4.15 | | | | $0.52 | | | | $0.10 | | | | $2.28 | | | | $6.13 | |
| Less distributions declared to shareholders | | | | | | | | | | | | | | | | | |
From net realized gain | | | $(0.58 | ) | | | $— | | | | $(1.82 | ) | | | $(2.45 | ) | | | $— | |
Net asset value, end of period (x) | | | $29.81 | | | | $26.24 | | | | $25.72 | | | | $27.44 | | | | $27.61 | |
Total return (%) (r)(s)(t)(x) | | | 16.12 | (c) | | | 2.02 | | | | 0.74 | | | | 8.25 | | | | 28.54 | |
Ratios (%) (to average net assets)
and Supplemental data: | | | | | | | | | | | | | | | | | |
Expenses before expense reductions (f) | | | 1.10 | (c) | | | 1.12 | | | | 1.11 | | | | 1.08 | | | | 1.10 | |
Expenses after expense reductions (f) | | | 1.09 | (c) | | | 1.09 | | | | 1.06 | | | | 1.02 | | | | 1.06 | |
Net investment income (loss) | | | (0.45 | )(c) | | | (0.30 | ) | | | (0.55 | ) | | | (0.59 | ) | | | (0.36 | ) |
Portfolio turnover | | | 53 | | | | 49 | | | | 56 | | | | 98 | | | | 96 | |
Net assets at end of period (000 omitted) | | | $106,459 | | | | $101,635 | | | | $166,513 | | | | $483,893 | | | | $368,806 | |
| |
| Class R1 | | Year ended | |
| | | 8/31/17 | | | 8/31/16 | | | 8/31/15 | | | 8/31/14 | | | 8/31/13 | |
Net asset value, beginning of period | | | $20.15 | | | | $19.94 | | | | $21.91 | | | | $22.71 | | | | $17.84 | |
| Income (loss) from investment operations | | | | | | | | | | | | | | | | | |
Net investment income (loss) (d) | | | $(0.30 | )(c) | | | $(0.23 | ) | | | $(0.32 | ) | | | $(0.36 | ) | | | $(0.27 | ) |
Net realized and unrealized gain (loss) | | | 3.23 | | | | 0.44 | | | | 0.17 | | | | 2.01 | | | | 5.14 | |
Total from investment operations | | | $2.93 | | | | $0.21 | | | | $(0.15 | ) | | | $1.65 | | | | $4.87 | |
| Less distributions declared to shareholders | | | | | | | | | | | | | | | | | |
From net realized gain | | | $(0.58 | ) | | | $— | | | | $(1.82 | ) | | | $(2.45 | ) | | | $— | |
Net asset value, end of period (x) | | | $22.50 | | | | $20.15 | | | | $19.94 | | | | $21.91 | | | | $22.71 | |
Total return (%) (r)(s)(t)(x) | | | 14.91 | (c) | | | 1.05 | | | | (0.28 | ) | | | 7.17 | | | | 27.30 | |
Ratios (%) (to average net assets)
and Supplemental data: | | | | | | | | | | | | | | | | | |
Expenses before expense reductions (f) | | | 2.10 | (c) | | | 2.11 | | | | 2.11 | | | | 2.08 | | | | 2.10 | |
Expenses after expense reductions (f) | | | 2.09 | (c) | | | 2.09 | | | | 2.06 | | | | 2.02 | | | | 2.06 | |
Net investment income (loss) | | | (1.45 | )(c) | | | (1.26 | ) | | | (1.57 | ) | | | (1.59 | ) | | | (1.34 | ) |
Portfolio turnover | | | 53 | | | | 49 | | | | 56 | | | | 98 | | | | 96 | |
Net assets at end of period (000 omitted) | | | $4,377 | | | | $5,647 | | | | $6,573 | | | | $8,490 | | | | $8,972 | |
See Notes to Financial Statements
23
Financial Highlights – continued
| | | | | | | | | | | | | | | | | | | | |
| Class R2 | | Year ended | |
| | | 8/31/17 | | | 8/31/16 | | | 8/31/15 | | | 8/31/14 | | | 8/31/13 | |
Net asset value, beginning of period | | | $22.95 | | | | $22.60 | | | | $24.46 | | | | $24.97 | | | | $19.52 | |
| Income (loss) from investment operations | | | | | | | | | | | | | | | | | |
Net investment income (loss) (d) | | | $(0.23 | )(c) | | | $(0.17 | ) | | | $(0.25 | ) | | | $(0.27 | ) | | | $(0.19 | ) |
Net realized and unrealized gain (loss) | | | 3.71 | | | | 0.52 | | | | 0.21 | | | | 2.21 | | | | 5.64 | |
Total from investment operations | | | $3.48 | | | | $0.35 | | | | $(0.04 | ) | | | $1.94 | | | | $5.45 | |
| Less distributions declared to shareholders | | | | | | | | | | | | | | | | | |
From net realized gain | | | $(0.58 | ) | | | $— | | | | $(1.82 | ) | | | $(2.45 | ) | | | $— | |
Net asset value, end of period (x) | | | $25.85 | | | | $22.95 | | | | $22.60 | | | | $24.46 | | | | $24.97 | |
Total return (%) (r)(s)(t)(x) | | | 15.50 | (c) | | | 1.55 | | | | 0.23 | | | | 7.72 | | | | 27.92 | |
Ratios (%) (to average net assets)
and Supplemental data: | | | | | | | | | | | | | | | | | |
Expenses before expense reductions (f) | | | 1.60 | (c) | | | 1.62 | | | | 1.61 | | | | 1.58 | | | | 1.60 | |
Expenses after expense reductions (f) | | | 1.59 | (c) | | | 1.59 | | | | 1.56 | | | | 1.52 | | | | 1.56 | |
Net investment income (loss) | | | (0.95 | )(c) | | | (0.82 | ) | | | (1.07 | ) | | | (1.09 | ) | | | (0.85 | ) |
Portfolio turnover | | | 53 | | | | 49 | | | | 56 | | | | 98 | | | | 96 | |
Net assets at end of period (000 omitted) | | | $29,130 | | | | $35,890 | | | | $57,077 | | | | $66,923 | | | | $60,501 | |
| |
| Class R3 | | Year ended | |
| | | 8/31/17 | | | 8/31/16 | | | 8/31/15 | | | 8/31/14 | | | 8/31/13 | |
Net asset value, beginning of period | | | $24.09 | | | | $23.67 | | | | $25.47 | | | | $25.84 | | | | $20.15 | |
| Income (loss) from investment operations | | | | | | | | | | | | | | | | | |
Net investment income (loss) (d) | | | $(0.17 | )(c) | | | $(0.12 | ) | | | $(0.20 | ) | | | $(0.22 | ) | | | $(0.14 | ) |
Net realized and unrealized gain (loss) | | | 3.90 | | | | 0.54 | | | | 0.22 | | | | 2.30 | | | | 5.83 | |
Total from investment operations | | | $3.73 | | | | $0.42 | | | | $0.02 | | | | $2.08 | | | | $5.69 | |
| Less distributions declared to shareholders | | | | | | | | | | | | | | | | | |
From net realized gain | | | $(0.58 | ) | | | $— | | | | $(1.82 | ) | | | $(2.45 | ) | | | $— | |
Net asset value, end of period (x) | | | $27.24 | | | | $24.09 | | | | $23.67 | | | | $25.47 | | | | $25.84 | |
Total return (%) (r)(s)(t)(x) | | | 15.81 | (c) | | | 1.77 | | | | 0.47 | | | | 8.02 | | | | 28.24 | |
Ratios (%) (to average net assets)
and Supplemental data: | | | | | | | | | | | | | | | | | |
Expenses before expense reductions (f) | | | 1.35 | (c) | | | 1.37 | | | | 1.36 | | | | 1.33 | | | | 1.35 | |
Expenses after expense reductions (f) | | | 1.34 | (c) | | | 1.34 | | | | 1.31 | | | | 1.27 | | | | 1.31 | |
Net investment income (loss) | | | (0.70 | )(c) | | | (0.55 | ) | | | (0.82 | ) | | | (0.84 | ) | | | (0.60 | ) |
Portfolio turnover | | | 53 | | | | 49 | | | | 56 | | | | 98 | | | | 96 | |
Net assets at end of period (000 omitted) | | | $42,346 | | | | $57,593 | | | | $89,659 | | | | $150,359 | | | | $110,562 | |
See Notes to Financial Statements
24
Financial Highlights – continued
| | | | | | | | | | | | | | | | | | | | |
| Class R4 | | Year ended | |
| | | 8/31/17 | | | 8/31/16 | | | 8/31/15 | | | 8/31/14 | | | 8/31/13 | |
Net asset value, beginning of period | | | $25.09 | | | | $24.60 | | | | $26.33 | | | | $26.57 | | | | $20.67 | |
| Income (loss) from investment operations | | | | | | | | | | | | | | | | | |
Net investment income (loss) (d) | | | $(0.12 | )(c) | | | $(0.07 | ) | | | $(0.14 | ) | | | $(0.16 | ) | | | $(0.08 | ) |
Net realized and unrealized gain (loss) | | | 4.09 | | | | 0.56 | | | | 0.23 | | | | 2.37 | | | | 5.98 | |
Total from investment operations | | | $3.97 | | | | $0.49 | | | | $0.09 | | | | $2.21 | | | | $5.90 | |
| Less distributions declared to shareholders | | | | | | | | | | | | | | | | | |
From net realized gain | | | $(0.58 | ) | | | $— | | | | $(1.82 | ) | | | $(2.45 | ) | | | $— | |
Net asset value, end of period (x) | | | $28.48 | | | | $25.09 | | | | $24.60 | | | | $26.33 | | | | $26.57 | |
Total return (%) (r)(s)(t)(x) | | | 16.14 | (c) | | | 1.99 | | | | 0.73 | | | | 8.31 | | | | 28.54 | |
Ratios (%) (to average net assets)
and Supplemental data: | | | | | | | | | | | | | | | | | |
Expenses before expense reductions (f) | | | 1.10 | (c) | | | 1.12 | | | | 1.11 | | | | 1.08 | | | | 1.10 | |
Expenses after expense reductions (f) | | | 1.09 | (c) | | | 1.09 | | | | 1.06 | | | | 1.02 | | | | 1.06 | |
Net investment income (loss) | | | (0.45 | )(c) | | | (0.32 | ) | | | (0.57 | ) | | | (0.59 | ) | | | (0.35 | ) |
Portfolio turnover | | | 53 | | | | 49 | | | | 56 | | | | 98 | | | | 96 | |
Net assets at end of period (000 omitted) | | | $83,186 | | | | $91,974 | | | | $142,857 | | | | $229,964 | | | | $197,884 | |
| |
| Class R6 | | Year ended | |
| | | 8/31/17 | | | 8/31/16 | | | 8/31/15 | | | 8/31/14 | | | 8/31/13 | |
Net asset value, beginning of period | | | $26.38 | | | | $25.83 | | | | $27.52 | | | | $27.64 | | | | $21.48 | |
| Income (loss) from investment operations | | | | | | | | | | | | | | | | | |
Net investment income (loss) (d) | | | $(0.09 | )(c) | | | $(0.03 | ) | | | $(0.12 | ) | | | $(0.13 | ) | | | $(0.06 | ) |
Net realized and unrealized gain (loss) | | | 4.30 | | | | 0.58 | | | | 0.25 | | | | 2.46 | | | | 6.22 | |
Total from investment operations | | | $4.21 | | | | $0.55 | | | | $0.13 | | | | $2.33 | | | | $6.16 | |
| Less distributions declared to shareholders | | | | | | | | | | | | | | | | | |
From net realized gain | | | $(0.58 | ) | | | $— | | | | $(1.82 | ) | | | $(2.45 | ) | | | $— | |
Net asset value, end of period (x) | | | $30.01 | | | | $26.38 | | | | $25.83 | | | | $27.52 | | | | $27.64 | |
Total return (%) (r)(s)(t)(x) | | | 16.26 | (c) | | | 2.13 | | | | 0.85 | | | | 8.43 | | | | 28.68 | |
Ratios (%) (to average net assets)
and Supplemental data: | | | | | | | | | | | | | | | | | |
Expenses before expense reductions (f) | | | 0.98 | (c) | | | 0.99 | | | | 0.98 | | | | 0.97 | | | | 0.99 | |
Expenses after expense reductions (f) | | | 0.97 | (c) | | | 0.97 | | | | 0.93 | | | | 0.91 | | | | 0.96 | |
Net investment income (loss) | | | (0.34 | )(c) | | | (0.11 | ) | | | (0.44 | ) | | | (0.48 | ) | | | (0.24 | ) |
Portfolio turnover | | | 53 | | | | 49 | | | | 56 | | | | 98 | | | | 96 | |
Net assets at end of period (000 omitted) | | | $385,440 | | | | $320,645 | | | | $313,080 | | | | $319,139 | | | | $244,655 | |
See Notes to Financial Statements
25
Financial Highlights – continued
| | | | | | | | | | | | | | | | | | | | |
| Class 529A | | Year ended | |
| | | 8/31/17 | | | 8/31/16 | | | 8/31/15 | | | 8/31/14 | | | 8/31/13 | |
Net asset value, beginning of period | | | $23.41 | | | | $23.01 | | | | $24.82 | | | | $25.25 | | | | $19.70 | |
| Income (loss) from investment operations | | | | | | | | | | | | | | | | | |
Net investment income (loss) (d) | | | $(0.18 | )(c) | | | $(0.11 | ) | | | $(0.20 | ) | | | $(0.22 | ) | | | $(0.14 | ) |
Net realized and unrealized gain (loss) | | | 3.80 | | | | 0.51 | | | | 0.21 | | | | 2.24 | | | | 5.69 | |
Total from investment operations | | | $3.62 | | | | $0.40 | | | | $0.01 | | | | $2.02 | | | | $5.55 | |
| Less distributions declared to shareholders | | | | | | | | | | | | | | | | | |
From net realized gain | | | $(0.58 | ) | | | $— | | | | $(1.82 | ) | | | $(2.45 | ) | | | $— | |
Net asset value, end of period (x) | | | $26.45 | | | | $23.41 | | | | $23.01 | | | | $24.82 | | | | $25.25 | |
Total return (%) (r)(s)(t)(x) | | | 15.80 | (c) | | | 1.74 | | | | 0.44 | | | | 7.97 | | | | 28.17 | |
Ratios (%) (to average net assets)
and Supplemental data: | | | | | | | | | | | | | | | | | |
Expenses before expense reductions (f) | | | 1.45 | (c) | | | 1.46 | | | | 1.46 | | | | 1.43 | | | | 1.45 | |
Expenses after expense reductions (f) | | | 1.37 | (c) | | | 1.37 | | | | 1.34 | | | | 1.30 | | | | 1.34 | |
Net investment income (loss) | | | (0.73 | )(c) | | | (0.50 | ) | | | (0.85 | ) | | | (0.86 | ) | | | (0.62 | ) |
Portfolio turnover | | | 53 | | | | 49 | | | | 56 | | | | 98 | | | | 96 | |
Net assets at end of period (000 omitted) | | | $5,902 | | | | $5,075 | | | | $5,149 | | | | $5,150 | | | | $4,519 | |
| |
| Class 529B | | Year ended | |
| | | 8/31/17 | | | 8/31/16 | | | 8/31/15 | | | 8/31/14 | | | 8/31/13 | |
Net asset value, beginning of period | | | $19.66 | | | | $19.47 | | | | $21.44 | | | | $22.27 | | | | $17.51 | |
| Income (loss) from investment operations | | | | | | | | | | | | | | | | | |
Net investment income (loss) (d) | | | $(0.30 | )(c) | | | $(0.23 | ) | | | $(0.32 | ) | | | $(0.36 | ) | | | $(0.28 | ) |
Net realized and unrealized gain (loss) | | | 3.15 | | | | 0.42 | | | | 0.17 | | | | 1.98 | | | | 5.04 | |
Total from investment operations | | | $2.85 | | | | $0.19 | | | | $(0.15 | ) | | | $1.62 | | | | $4.76 | |
| Less distributions declared to shareholders | | | | | | | | | | | | | | | | | |
From net realized gain | | | $(0.58 | ) | | | $— | | | | $(1.82 | ) | | | $(2.45 | ) | | | $— | |
Net asset value, end of period (x) | | | $21.93 | | | | $19.66 | | | | $19.47 | | | | $21.44 | | | | $22.27 | |
Total return (%) (r)(s)(t)(x) | | | 14.87 | (c) | | | 0.98 | | | | (0.28 | ) | | | 7.18 | | | | 27.18 | |
Ratios (%) (to average net assets)
and Supplemental data: | | | | | | | | | | | | | | | | | |
Expenses before expense reductions (f) | | | 2.20 | (c) | | | 2.21 | | | | 2.21 | | | | 2.18 | | | | 2.20 | |
Expenses after expense reductions (f) | | | 2.13 | (c) | | | 2.12 | | | | 2.09 | | | | 2.06 | | | | 2.10 | |
Net investment income (loss) | | | (1.49 | )(c) | | | (1.28 | ) | | | (1.60 | ) | | | (1.62 | ) | | | (1.39 | ) |
Portfolio turnover | | | 53 | | | | 49 | | | | 56 | | | | 98 | | | | 96 | |
Net assets at end of period (000 omitted) | | | $325 | | | | $306 | | | | $341 | | | | $348 | | | | $300 | |
See Notes to Financial Statements
26
Financial Highlights – continued
| | | | | | | | | | | | | | | | | | | | |
| Class 529C | | Year ended | |
| | | 8/31/17 | | | 8/31/16 | | | 8/31/15 | | | 8/31/14 | | | 8/31/13 | |
Net asset value, beginning of period | | | $19.65 | | | | $19.46 | | | | $21.44 | | | | $22.28 | | | | $17.52 | |
| Income (loss) from investment operations | | | | | | | | | | | | | | | | | |
Net investment income (loss) (d) | | | $(0.31 | )(c) | | | $(0.23 | ) | | | $(0.33 | ) | | | $(0.36 | ) | | | $(0.28 | ) |
Net realized and unrealized gain (loss) | | | 3.17 | | | | 0.42 | | | | 0.17 | | | | 1.97 | | | | 5.04 | |
Total from investment operations | | | $2.86 | | | | $0.19 | | | | $(0.16 | ) | | | $1.61 | | | | $4.76 | |
| Less distributions declared to shareholders | | | | | | | | | | | | | | | | | |
From net realized gain | | | $(0.58 | ) | | | $— | | | | $(1.82 | ) | | | $(2.45 | ) | | | $— | |
Net asset value, end of period (x) | | | $21.93 | | | | $19.65 | | | | $19.46 | | | | $21.44 | | | | $22.28 | |
Total return (%) (r)(s)(t)(x) | | | 14.93 | (c) | | | 0.98 | | | | (0.34 | ) | | | 7.13 | | | | 27.17 | |
Ratios (%) (to average net assets)
and Supplemental data: | | | | | | | | | | | | | | | | | |
Expenses before expense reductions (f) | | | 2.20 | (c) | | | 2.21 | | | | 2.21 | | | | 2.18 | | | | 2.20 | |
Expenses after expense reductions (f) | | | 2.13 | (c) | | | 2.14 | | | | 2.11 | | | | 2.07 | | | | 2.11 | |
Net investment income (loss) | | | (1.50 | )(c) | | | (1.28 | ) | | | (1.62 | ) | | | (1.63 | ) | | | (1.39 | ) |
Portfolio turnover | | | 53 | | | | 49 | | | | 56 | | | | 98 | | | | 96 | |
Net assets at end of period (000 omitted) | | | $1,595 | | | | $1,351 | | | | $1,383 | | | | $1,223 | | | | $1,454 | |
| (c) | Amount reflects a one-time reimbursement of expenses by the custodian (or former custodian) without which net investment income and performance would be lower and expenses would be higher. See Note 2 in the Notes to Financial Statements for additional information. |
| (d) | Per share data is based on average shares outstanding. |
| (f) | Ratios do not reflect reductions from fees paid indirectly, if applicable. |
| (r) | Certain expenses have been reduced without which performance would have been lower. |
| (s) | From time to time the fund may receive proceeds from litigation settlements, without which performance would be lower. |
| (t) | Total returns do not include any applicable sales charges. |
| (x) | The net asset values and total returns have been calculated on net assets which include adjustments made in accordance with U.S. generally accepted accounting principles required at period end for financial reporting purposes. |
See Notes to Financial Statements
27
NOTES TO FINANCIAL STATEMENTS
(1) Business and Organization
MFS New Discovery Fund (the fund) is a diversified series of MFS Series Trust I (the trust). The trust is organized as a Massachusetts business trust and is registered under the Investment Company Act of 1940, as amended, as an open-end management investment company.
The fund is an investment company and accordingly follows the investment company accounting and reporting guidance of the Financial Accounting Standards Board (FASB) Accounting Standards Codification Topic 946 Financial Services – Investment Companies.
(2) Significant Accounting Policies
General – The preparation of financial statements in conformity with U.S. generally accepted accounting principles requires management to make estimates and assumptions that affect the reported amounts of assets and liabilities, and disclosure of contingent assets and liabilities at the date of the financial statements and the reported amounts of increases and decreases in net assets from operations during the reporting period. Actual results could differ from those estimates. In the preparation of these financial statements, management has evaluated subsequent events occurring after the date of the fund’s Statement of Assets and Liabilities through the date that the financial statements were issued. The fund will generally focus on securities of small size companies which may be more volatile than those of larger companies.
In October 2016, the Securities and Exchange Commission (SEC) released its Final Rule on Investment Company Reporting Modernization (the “Rule”). The Rule, which introduced two new regulatory reporting forms for investment companies – Form N-PORT and Form N-CEN – also contained amendments to Regulation S-X which impact financial statement presentation, particularly the presentation of derivative investments, for all reporting periods ending after August 1, 2017. The fund has adopted the Rule’s Regulation S-X amendments and believes that the fund’s financial statements are in compliance with those amendments.
Balance Sheet Offsetting – The fund’s accounting policy with respect to balance sheet offsetting is that, absent an event of default by the counterparty or a termination of the agreement, the International Swaps and Derivatives Association (ISDA) Master Agreement does not result in an offset of reported amounts of financial assets and financial liabilities in the Statement of Assets and Liabilities across transactions between the fund and the applicable counterparty. The fund’s right to setoff may be restricted or prohibited by the bankruptcy or insolvency laws of the particular jurisdiction to which a specific master netting agreement counterparty is subject. Balance sheet offsetting disclosures, to the extent applicable to the fund, have been included in the fund’s Significant Accounting Policies note under the captions for each of the fund’s in-scope financial instruments and transactions.
Investment Valuations – Equity securities, including restricted equity securities, are generally valued at the last sale or official closing price on their primary market or exchange as provided by a third-party pricing service. Equity securities, for which there were no sales reported that day, are generally valued at the last quoted daily bid
28
Notes to Financial Statements – continued
quotation on their primary market or exchange as provided by a third-party pricing service. Short-term instruments with a maturity at issuance of 60 days or less may be valued at amortized cost, which approximates market value. Open-end investment companies are generally valued at net asset value per share. Securities and other assets generally valued on the basis of information from a third-party pricing service may also be valued at a broker/dealer bid quotation. Values obtained from third-party pricing services can utilize both transaction data and market information such as yield, quality, coupon rate, maturity, type of issue, trading characteristics, and other market data. The values of foreign securities and other assets and liabilities expressed in foreign currencies are converted to U.S. dollars using the mean of bid and asked prices for rates provided by a third-party pricing service.
The Board of Trustees has delegated primary responsibility for determining or causing to be determined the value of the fund’s investments (including any fair valuation) to the adviser pursuant to valuation policies and procedures approved by the Board. If the adviser determines that reliable market quotations are not readily available, investments are valued at fair value as determined in good faith by the adviser in accordance with such procedures under the oversight of the Board of Trustees. Under the fund’s valuation policies and procedures, market quotations are not considered to be readily available for most types of debt instruments and floating rate loans and many types of derivatives. These investments are generally valued at fair value based on information from third-party pricing services. In addition, investments may be valued at fair value if the adviser determines that an investment’s value has been materially affected by events occurring after the close of the exchange or market on which the investment is principally traded (such as foreign exchange or market) and prior to the determination of the fund’s net asset value, or after the halting of trading of a specific security where trading does not resume prior to the close of the exchange or market on which the security is principally traded. Events that occur on a frequent basis after foreign markets close (such as developments in foreign markets and significant movements in the U.S. markets) and prior to the determination of the fund’s net asset value may be deemed to have a material effect on the value of securities traded in foreign markets. Accordingly, the fund’s foreign equity securities may often be valued at fair value. The adviser generally relies on third-party pricing services or other information (such as the correlation with price movements of similar securities in the same or other markets; the type, cost and investment characteristics of the security; the business and financial condition of the issuer; and trading and other market data) to assist in determining whether to fair value and at what value to fair value an investment. The value of an investment for purposes of calculating the fund’s net asset value can differ depending on the source and method used to determine value. When fair valuation is used, the value of an investment used to determine the fund’s net asset value may differ from quoted or published prices for the same investment. There can be no assurance that the fund could obtain the fair value assigned to an investment if it were to sell the investment at the same time at which the fund determines its net asset value per share.
Various inputs are used in determining the value of the fund’s assets or liabilities. These inputs are categorized into three broad levels. In certain cases, the inputs used to measure fair value may fall into different levels of the fair value hierarchy. In such cases, an investment’s level within the fair value hierarchy is based on the lowest level of
29
Notes to Financial Statements – continued
input that is significant to the fair value measurement. The fund’s assessment of the significance of a particular input to the fair value measurement in its entirety requires judgment, and considers factors specific to the investment. Level 1 includes unadjusted quoted prices in active markets for identical assets or liabilities. Level 2 includes other significant observable market-based inputs (including quoted prices for similar securities, interest rates, prepayment speed, and credit risk). Level 3 includes unobservable inputs, which may include the adviser’s own assumptions in determining the fair value of investments. The following is a summary of the levels used as of August 31, 2017 in valuing the fund’s assets or liabilities:
| | | | | | | | | | | | | | | | |
| Financial Instruments | | Level 1 | | | Level 2 | | | Level 3 | | | Total | |
| Equity Securities | | | $1,127,967,407 | | | | $— | | | | $— | | | | $1,127,967,407 | |
| Mutual Funds | | | 41,397,700 | | | | — | | | | — | | | | 41,397,700 | |
| Total | | | $1,169,365,107 | | | | $— | | | | $— | | | | $1,169,365,107 | |
For further information regarding security characteristics, see the Portfolio of Investments.
Foreign Currency Translation – Purchases and sales of foreign investments, income, and expenses are converted into U.S. dollars based upon currency exchange rates prevailing on the respective dates of such transactions or on the reporting date for foreign denominated receivables and payables. Gains and losses attributable to foreign currency exchange rates on sales of securities are recorded for financial statement purposes as net realized gains and losses on investments. Gains and losses attributable to foreign exchange rate movements on receivables, payables, income and expenses are recorded for financial statement purposes as foreign currency transaction gains and losses. That portion of both realized and unrealized gains and losses on investments that results from fluctuations in foreign currency exchange rates is not separately disclosed.
Security Loans – Under its Securities Lending Agency Agreement with the fund, State Street Bank and Trust Company (“State Street”), as lending agent, loans the securities of the fund to certain qualified institutions (the “Borrowers”) approved by the fund. Security loans can be terminated at the discretion of either the lending agent or the fund and the related securities must be returned within the earlier of the standard trade settlement period for such securities or within three business days. The loans are collateralized by cash and/or U.S. Treasury and federal agency obligations in an amount typically at least equal to the market value of the securities loaned. On loans collateralized by cash, the cash collateral is invested in a money market fund. The market value of the loaned securities is determined at the close of business of the fund and any additional required collateral is delivered to the fund on the next business day. State Street provides the fund with indemnification against Borrower default. In the event of Borrower default, State Street will, for the benefit of the fund, either purchase securities identical to those loaned or, when such purchase is commercially impracticable, pay the fund the market value of the loaned securities. In return, State Street assumes the fund’s rights to the related collateral. If the collateral value is less than the cost to purchase identical securities, State Street is responsible for the shortfall, but only to the extent that such shortfall is not due to a decline in collateral value resulting from collateral reinvestment for which the fund bears the risk of loss.
30
Notes to Financial Statements – continued
At period end, the fund had investment securities on loan, all of which were classified as equity securities in the fund’s Portfolio of Investments, with a fair value of $27,523,659. The fair value of the fund’s investment securities on loan and a related liability of $17,943,175 for cash collateral received on securities loaned are both presented gross in the Statement of Assets and Liabilities. Additionally, these loans were collateralized by U.S. Treasury Obligations of $10,151,607. The collateral on securities loaned exceeded the value of securities on loan at period end. The liability for cash collateral for securities loaned is carried at fair value, which is categorized as level 2 within the fair value hierarchy. A portion of the income generated upon investment of the collateral is remitted to the Borrowers, and the remainder is allocated between the fund and the lending agent. On loans collateralized by U.S. Treasury and/or federal agency obligations, a fee is received from the Borrower, and is allocated between the fund and the lending agent. Income from securities lending is separately reported in the Statement of Operations. The dividend and interest income earned on the securities loaned is accounted for in the same manner as other dividend and interest income.
Indemnifications – Under the fund’s organizational documents, its officers and Trustees may be indemnified against certain liabilities and expenses arising out of the performance of their duties to the fund. Additionally, in the normal course of business, the fund enters into agreements with service providers that may contain indemnification clauses. The fund’s maximum exposure under these agreements is unknown as this would involve future claims that may be made against the fund that have not yet occurred.
Investment Transactions and Income – Investment transactions are recorded on the trade date. Dividends received in cash are recorded on the ex-dividend date. Certain dividends from foreign securities will be recorded when the fund is informed of the dividend if such information is obtained subsequent to the ex-dividend date. Dividend payments received in additional securities are recorded on the ex-dividend date in an amount equal to the value of the security on such date.
The fund may receive proceeds from litigation settlements. Any proceeds received from litigation involving portfolio holdings are reflected in the Statement of Operations in realized gain/loss if the security has been disposed of by the fund or in unrealized gain/loss if the security is still held by the fund. Any other proceeds from litigation not related to portfolio holdings are reflected as other income in the Statement of Operations.
Reimbursement of Expenses by Custodian – In December 2015, the fund’s custodian (or former custodian), State Street Bank and Trust Company, announced that it intended to reimburse its asset servicing clients for expense amounts that it billed in error during the period 1998 through 2015. The amount of this one-time reimbursement attributable to the fund is reflected as “Reimbursement of custodian expenses” in the Statement of Operations.
Tax Matters and Distributions – The fund intends to qualify as a regulated investment company, as defined under Subchapter M of the Internal Revenue Code, and to distribute all of its taxable income, including realized capital gains. As a result, no provision for federal income tax is required. The fund’s federal tax returns, when
31
Notes to Financial Statements – continued
filed, will remain subject to examination by the Internal Revenue Service for a three year period. Management has analyzed the fund’s tax positions taken on federal and state tax returns for all open tax years and does not believe that there are any uncertain tax positions that require recognition of a tax liability. Foreign taxes, if any, have been accrued by the fund in the accompanying financial statements in accordance with the applicable foreign tax law. Foreign income taxes may be withheld by certain countries in which the fund invests. Additionally, capital gains realized by the fund on securities issued in or by certain foreign countries may be subject to capital gains tax imposed by those countries.
Distributions to shareholders are recorded on the ex-dividend date. Income and capital gain distributions are determined in accordance with income tax regulations, which may differ from U.S. generally accepted accounting principles. Certain capital accounts in the financial statements are periodically adjusted for permanent differences in order to reflect their tax character. These adjustments have no impact on net assets or net asset value per share. Temporary differences which arise from recognizing certain items of income, expense, gain or loss in different periods for financial statement and tax purposes will reverse at some time in the future. Distributions in excess of net investment income or net realized gains are temporary overdistributions for financial statement purposes resulting from differences in the recognition or classification of income or distributions for financial statement and tax purposes.
Book/tax differences primarily relate to wash sale loss deferrals and treating a portion of the proceeds from redemptions as a distribution for tax purposes.
The tax character of distributions declared to shareholders for the last two fiscal years is as follows:
| | | | | | | | |
| | | Year ended
8/31/17 | | | Year ended
8/31/16 | |
| Long-term capital gains | | | $25,588,520 | | | | $— | |
The federal tax cost and the tax basis components of distributable earnings were as follows:
| | | | |
| As of 8/31/17 | | | |
| Cost of investments | | | $946,057,006 | |
| Gross appreciation | | | 287,477,425 | |
| Gross depreciation | | | (64,169,324 | ) |
| Net unrealized appreciation (depreciation) | | | $223,308,101 | |
| Undistributed ordinary income | | | 24,502,943 | |
| Undistributed long-term capital gain | | | 41,371,575 | |
| Other temporary differences | | | (3,384 | ) |
Multiple Classes of Shares of Beneficial Interest – The fund offers multiple classes of shares, which differ in their respective distribution, service, and program manager fees. The fund’s income, realized and unrealized gain (loss), and common expenses are allocated to shareholders based on the daily net assets of each class. Dividends are declared separately for each class. Differences in per share dividend rates are generally due to differences in separate class expenses. Class B and Class 529B shares will
32
Notes to Financial Statements – continued
convert to Class A and Class 529A shares, respectively, approximately eight years after purchase. The fund’s distributions declared to shareholders as reported in the Statements of Changes in Net Assets are presented by class as follows:
| | | | | | | | |
| | | From net realized gain on
investments | |
| | | Year
ended
8/31/17 | | | Year
ended
8/31/16 | |
| Class A | | | $9,172,597 | | | | $— | |
| Class B | | | 584,795 | | | | — | |
| Class C | | | 2,281,782 | | | | — | |
| Class I | | | 2,526,174 | | | | — | |
| Class R1 | | | 140,626 | | | | — | |
| Class R2 | | | 824,816 | | | | — | |
| Class R3 | | | 1,269,935 | | | | — | |
| Class R4 | | | 1,800,361 | | | | — | |
| Class R6 | | | 6,811,530 | | | | — | |
| Class 529A | | | 128,020 | | | | — | |
| Class 529B | | | 8,528 | | | | — | |
| Class 529C | | | 39,356 | | | | — | |
| Total | | | $25,588,520 | | | | $— | |
(3) Transactions with Affiliates
Investment Adviser – The fund has an investment advisory agreement with MFS to provide overall investment management and related administrative services and facilities to the fund. For the period from September 1, 2016 through December 28, 2016, the management fee was computed daily and paid monthly at an annual rate of 0.90% of the fund’s average daily net assets. The investment adviser had agreed in writing to reduce its management fee to 0.80% of average daily net assets in excess of $1 billion up to $2.5 billion, 0.75% of average daily net assets in excess of $2.5 billion up to $5 billion, and 0.70% of average daily net assets in excess of $5 billion. This written agreement terminated on December 28, 2016. For the period from September 1, 2016 through December 28, 2016, this management fee reduction amounted to $30,628, which is included in the reduction of total expenses in the Statement of Operations. Effective December 29, 2016, the management fee is computed daily and paid monthly at an annual rate of 0.90% of average daily net assets up to $1 billion, 0.80% of average daily net assets in excess of $1 billion up to $2.5 billion, 0.75% of average daily net assets in excess of $2.5 billion up to $5 billion, and 0.70% of average daily net assets in excess of $5 billion. MFS has also agreed in writing to reduce its management fee by a specified amount if certain MFS mutual fund assets exceed thresholds agreed to by MFS and the fund’s Board of Trustees. For the year ended August 31, 2017, this management fee reduction amounted to $84,454, which is included in the reduction of total expenses in the Statement of Operations. The management fee incurred for the year ended August 31, 2017 was equivalent to an annual effective rate of 0.88% of the fund’s average daily net assets.
33
Notes to Financial Statements – continued
Distributor – MFS Fund Distributors, Inc. (MFD), a wholly-owned subsidiary of MFS, as distributor, received $123,023 and $3,239 for the year ended August 31, 2017, as its portion of the initial sales charge on sales of Class A and Class 529A shares of the fund, respectively.
The Board of Trustees has adopted a distribution plan for certain share classes pursuant to Rule 12b-1 of the Investment Company Act of 1940.
The fund’s distribution plan provides that the fund will pay MFD for services provided by MFD and financial intermediaries in connection with the distribution and servicing of certain share classes. One component of the plan is a distribution fee paid to MFD and another component of the plan is a service fee paid to MFD. MFD may subsequently pay all, or a portion, of the distribution and/or service fees to financial intermediaries.
Distribution Plan Fee Table:
| | | | | | | | | | | | | | | | | | | | |
| | | Distribution
Fee Rate (d) | | | Service
Fee Rate (d) | | | Total
Distribution
Plan (d) | | | Annual
Effective
Rate (e) | | | Distribution
and Service
Fee | |
| Class A | | | — | | | | 0.25% | | | | 0.25% | | | | 0.24% | | | | $965,068 | |
| Class B | | | 0.75% | | | | 0.25% | | | | 1.00% | | | | 1.00% | | | | 204,558 | |
| Class C | | | 0.75% | | | | 0.25% | | | | 1.00% | | | | 1.00% | | | | 798,207 | |
| Class R1 | | | 0.75% | | | | 0.25% | | | | 1.00% | | | | 1.00% | | | | 48,805 | |
| Class R2 | | | 0.25% | | | | 0.25% | | | | 0.50% | | | | 0.50% | | | | 161,592 | |
| Class R3 | | | — | | | | 0.25% | | | | 0.25% | | | | 0.25% | | | | 123,290 | |
| Class 529A | | | — | | | | 0.25% | | | | 0.25% | | | | 0.23% | | | | 13,525 | |
| Class 529B | | | 0.75% | | | | 0.25% | | | | 1.00% | | | | 0.99% | | | | 3,011 | |
| Class 529C | | | 0.75% | | | | 0.25% | | | | 1.00% | | | | 1.00% | | | | 14,416 | |
| Total Distribution and Service Fees | | | | | | | | $2,332,472 | |
| (d) | In accordance with the distribution plan for certain classes, the fund pays distribution and/or service fees equal to these annual percentage rates of each class’s average daily net assets. The distribution and service fee rates disclosed by class represent the current rates in effect at the end of the reporting period. Any rate changes, if applicable, are detailed below. |
| (e) | The annual effective rates represent actual fees incurred under the distribution plan for the year ended August 31, 2017 based on each class’s average daily net assets. MFD has voluntarily agreed to rebate a portion of each class’s 0.25% service fee attributable to accounts for which MFD retains the 0.25% service fee except for accounts attributable to MFS or its affiliates’ seed money. For the year ended August 31, 2017, this rebate amounted to $20,566, $712, $244, $68, $1,164, $31, and $37 for Class A, Class B, Class C, Class R2, Class 529A, Class 529B, and Class 529C, respectively, and is included in the reduction of total expenses in the Statement of Operations. |
34
Notes to Financial Statements – continued
Certain Class A shares are subject to a contingent deferred sales charge (CDSC) in the event of a shareholder redemption within 18 months of purchase. Class C and Class 529C shares are subject to a CDSC in the event of a shareholder redemption within 12 months of purchase. Class B and Class 529B shares are subject to a CDSC in the event of a shareholder redemption within six years of purchase. All contingent deferred sales charges are paid to MFD and during the year ended August 31, 2017, were as follows:
| | | | |
| | | Amount | |
| Class A | | | $6,997 | |
| Class B | | | 55,734 | |
| Class C | | | 3,957 | |
| Class 529B | | | — | |
| Class 529C | | | 56 | |
The fund has entered into and may from time to time enter into contracts with program managers and other parties which administer the tuition programs through which an investment in the fund’s 529 share classes is made. The fund has entered into an agreement with MFD pursuant to which MFD receives an annual fee of up to 0.10% of the average daily net assets attributable to each 529 share class. MFD has agreed to waive a portion of this fee in an amount equal to 0.05% of the average daily net assets for each 529 share class. This waiver agreement will expire on December 31, 2018, unless MFD elects to extend the waiver. For the year ended August 31, 2017, this waiver amounted to $3,577 and is included in the reduction of total expenses in the Statement of Operations. The program manager fee incurred for the year ended August 31, 2017 was equivalent to an annual effective rate of 0.05% of the average daily net assets attributable to each 529 share class. The services provided by MFD, or a third party with which MFD contracts, include recordkeeping and tax reporting and account services, as well as services designed to maintain the program’s compliance with the Internal Revenue Code and other regulatory requirements. Program manager fees and waivers for the year ended August 31, 2017, were as follows:
| | | | | | | | |
| | | Fee | | | Waiver | |
| Class 529A | | | $5,410 | | | | $2,705 | |
| Class 529B | | | 301 | | | | 151 | |
| Class 529C | | | 1,442 | | | | 721 | |
| Total Program Manager Fees and Waivers | | | $7,153 | | | | $3,577 | |
Shareholder Servicing Agent – MFS Service Center, Inc. (MFSC), a wholly-owned subsidiary of MFS, receives a fee from the fund for its services as shareholder servicing agent calculated as a percentage of the average daily net assets of the fund as determined periodically under the supervision of the fund’s Board of Trustees. For the year ended August 31, 2017, the fee was $211,071, which equated to 0.0189% annually of the fund’s average daily net assets. MFSC also receives payment from the fund for out-of-pocket expenses, sub-accounting and other shareholder servicing costs which may be paid to affiliated and unaffiliated service providers. Class R6 shares do not incur sub-accounting fees. For the year ended August 31, 2017, these out-of-pocket expenses, sub-accounting and other shareholder servicing costs amounted to $1,090,883.
35
Notes to Financial Statements – continued
Administrator – MFS provides certain financial, legal, shareholder communications, compliance, and other administrative services to the fund. Under an administrative services agreement, the fund reimburses MFS the costs incurred to provide these services. The fund is charged an annual fixed amount of $17,500 plus a fee based on average daily net assets. The administrative services fee incurred for the year ended August 31, 2017 was equivalent to an annual effective rate of 0.0166% of the fund’s average daily net assets.
Trustees’ and Officers’ Compensation – The fund pays compensation to independent Trustees in the form of a retainer, attendance fees, and additional compensation to Board and Committee chairpersons. The fund does not pay compensation directly to Trustees or officers of the fund who are also officers of the investment adviser, all of whom receive remuneration for their services to the fund from MFS. Certain officers and Trustees of the fund are officers or directors of MFS, MFD, and MFSC.
Prior to December 31, 2001, the fund had an unfunded defined benefit plan (“DB plan”) for independent Trustees. As of December 31, 2001, the Board took action to terminate the DB plan with respect to then-current and any future independent Trustees, such that the DB plan covers only certain of those former independent Trustees who retired on or before December 31, 2001. The DB plan resulted in a
pension expense of $602 and is included in “Independent Trustees’ compensation” in the Statement of Operations for the year ended August 31, 2017. The liability for deferred retirement benefits payable to certain independent Trustees under the DB plan amounted to $2,074 at August 31, 2017, and is included in “Payable for independent Trustees’ compensation” in the Statement of Assets and Liabilities.
Other – This fund and certain other funds managed by MFS (the funds) have entered into a service agreement (the ISO Agreement) which provides for payment of fees solely by the funds to Tarantino LLC in return for the provision of services of an Independent Senior Officer (ISO) for the funds. Frank L. Tarantino serves as the ISO and is an officer of the funds and the sole member of Tarantino LLC. The funds can terminate the ISO Agreement with Tarantino LLC at any time under the terms of the ISO Agreement. For the year ended August 31, 2017, the fee paid by the fund under this agreement was $2,099 and is included in “Miscellaneous” expense in the Statement of Operations. MFS has agreed to bear all expenses associated with office space, other administrative support, and supplies provided to the ISO.
The fund invests in the MFS Institutional Money Market Portfolio which is managed by MFS and seeks current income consistent with preservation of capital and liquidity. This money market fund does not pay a management fee to MFS.
On March 16, 2016, MFS purchased 613 shares of Class I for an aggregate amount of $13,712.
The fund is permitted to engage in purchase and sale transactions with funds and accounts for which MFS serves as investment adviser or sub-adviser (“cross-trades”) pursuant to a policy adopted by the Board of Trustees. This policy has been designed to ensure that cross-trades conducted by the fund comply with Rule 17a-7 under the Investment Company Act of 1940. Under this policy, cross-trades are effected at current market prices with no remuneration paid in connection with the transaction.
36
Notes to Financial Statements – continued
During the year ended August 31, 2017, the fund engaged in purchase and sale transactions pursuant to this policy, which amounted to $915,839 and $2,686,033, respectively. The sales transactions resulted in net realized gains (losses) of $(3,306,172).
(4) Portfolio Securities
For the year ended August 31, 2017, purchases and sales of investments, other than short-term obligations, aggregated $582,377,405 and $741,373,011, respectively.
(5) Shares of Beneficial Interest
The fund’s Declaration of Trust permits the Trustees to issue an unlimited number of full and fractional shares of beneficial interest. Transactions in fund shares were as follows:
| | | | | | | | | | | | | | | | |
| | | Year ended
8/31/17 | | | Year ended
8/31/16 | |
| | | Shares | | | Amount | | | Shares | | | Amount | |
| Shares sold | | | | | | | | | | | | | | | | |
Class A | | | 2,341,848 | | | | $59,001,136 | | | | 2,581,507 | | | | $57,106,656 | |
Class B | | | 102,320 | | | | 2,162,726 | | | | 125,615 | | | | 2,323,055 | |
Class C | | | 356,395 | | | | 7,440,681 | | | | 359,925 | | | | 6,744,890 | |
Class I | | | 3,690,354 | | | | 100,156,404 | | | | 982,521 | | | | 24,084,261 | |
Class R1 | | | 34,848 | | | | 720,340 | | | | 48,011 | | | | 889,588 | |
Class R2 | | | 206,742 | | | | 4,917,124 | | | | 353,539 | | | | 7,402,869 | |
Class R3 | | | 479,936 | | | | 12,115,693 | | | | 774,467 | | | | 16,847,480 | |
Class R4 | | | 812,147 | | | | 21,286,173 | | | | 959,951 | | | | 21,770,461 | |
Class R6 | | | 2,895,945 | | | | 83,215,903 | | | | 2,833,166 | | | | 68,078,944 | |
Class 529A | | | 35,478 | | | | 853,424 | | | | 32,930 | | | | 704,960 | |
Class 529B | | | 1,504 | | | | 30,113 | | | | 1,023 | | | | 18,604 | |
Class 529C | | | 8,513 | | | | 172,895 | | | | 13,002 | | | | 227,071 | |
| | | 10,966,030 | | | | $292,072,612 | | | | 9,065,657 | | | | $206,198,839 | |
|
Shares issued to shareholders in
reinvestment of distributions | |
Class A | | | 349,553 | | | | $8,459,180 | | | | — | | | | $— | |
Class B | | | 26,112 | | | | 527,716 | | | | — | | | | — | |
Class C | | | 93,965 | | | | 1,902,799 | | | | — | | | | — | |
Class I | | | 77,460 | | | | 2,044,932 | | | | — | | | | — | |
Class R1 | | | 7,003 | | | | 140,626 | | | | — | | | | — | |
Class R2 | | | 32,149 | | | | 738,792 | | | | — | | | | — | |
Class R3 | | | 52,542 | | | | 1,269,935 | | | | — | | | | — | |
Class R4 | | | 71,379 | | | | 1,800,181 | | | | — | | | | — | |
Class R6 | | | 240,953 | | | | 6,399,723 | | | | — | | | | — | |
Class 529A | | | 5,455 | | | | 128,020 | | | | — | | | | — | |
Class 529B | | | 436 | | | | 8,528 | | | | — | | | | — | |
Class 529C | | | 2,011 | | | | 39,356 | | | | — | | | | — | |
| | | 959,018 | | | | $23,459,788 | | | | — | | | | $— | |
37
Notes to Financial Statements – continued
| | | | | | | | | | | | | | | | |
| | | Year ended
8/31/17 | | | Year ended
8/31/16 | |
| | | Shares | | | Amount | | | Shares | | | Amount | |
| Shares reacquired | | | | | | | | | | | | | |
Class A | | | (4,841,795 | ) | | | $(120,972,086 | ) | | | (5,259,274 | ) | | | $(116,373,210 | ) |
Class B | | | (369,005 | ) | | | (7,673,676 | ) | | | (363,736 | ) | | | (6,790,055 | ) |
Class C | | | (1,272,779 | ) | | | (26,705,841 | ) | | | (1,412,784 | ) | | | (26,258,340 | ) |
Class I | | | (4,069,947 | ) | | | (114,653,455 | ) | | | (3,583,416 | ) | | | (86,864,306 | ) |
Class R1 | | | (127,668 | ) | | | (2,645,579 | ) | | | (97,262 | ) | | | (1,799,822 | ) |
Class R2 | | | (676,252 | ) | | | (16,145,795 | ) | | | (1,314,576 | ) | | | (27,633,057 | ) |
Class R3 | | | (1,368,848 | ) | | | (34,380,875 | ) | | | (2,171,692 | ) | | | (48,293,221 | ) |
Class R4 | | | (1,627,560 | ) | | | (42,350,702 | ) | | | (3,102,929 | ) | | | (71,687,353 | ) |
Class R6 | | | (2,446,162 | ) | | | (67,477,778 | ) | | | (2,801,968 | ) | | | (70,638,112 | ) |
Class 529A | | | (34,529 | ) | | | (833,352 | ) | | | (39,969 | ) | | | (879,960 | ) |
Class 529B | | | (2,691 | ) | | | (53,331 | ) | | | (2,953 | ) | | | (53,513 | ) |
Class 529C | | | (6,491 | ) | | | (130,914 | ) | | | (15,307 | ) | | | (273,018 | ) |
| | | (16,843,727 | ) | | | $(434,023,384 | ) | | | (20,165,866 | ) | | | $(457,543,967 | ) |
| | |
| Net change | | | | | | | | | |
Class A | | | (2,150,394 | ) | | | $(53,511,770 | ) | | | (2,677,767 | ) | | | $(59,266,554 | ) |
Class B | | | (240,573 | ) | | | (4,983,234 | ) | | | (238,121 | ) | | | (4,467,000 | ) |
Class C | | | (822,419 | ) | | | (17,362,361 | ) | | | (1,052,859 | ) | | | (19,513,450 | ) |
Class I | | | (302,133 | ) | | | (12,452,119 | ) | | | (2,600,895 | ) | | | (62,780,045 | ) |
Class R1 | | | (85,817 | ) | | | (1,784,613 | ) | | | (49,251 | ) | | | (910,234 | ) |
Class R2 | | | (437,361 | ) | | | (10,489,879 | ) | | | (961,037 | ) | | | (20,230,188 | ) |
Class R3 | | | (836,370 | ) | | | (20,995,247 | ) | | | (1,397,225 | ) | | | (31,445,741 | ) |
Class R4 | | | (744,034 | ) | | | (19,264,348 | ) | | | (2,142,978 | ) | | | (49,916,892 | ) |
Class R6 | | | 690,736 | | | | 22,137,848 | | | | 31,198 | | | | (2,559,168 | ) |
Class 529A | | | 6,404 | | | | 148,092 | | | | (7,039 | ) | | | (175,000 | ) |
Class 529B | | | (751 | ) | | | (14,690 | ) | | | (1,930 | ) | | | (34,909 | ) |
Class 529C | | | 4,033 | | | | 81,337 | | | | (2,305 | ) | | | (45,947 | ) |
| | | (4,918,679 | ) | | | $(118,490,984 | ) | | | (11,100,209 | ) | | | $(251,345,128 | ) |
The fund is one of several mutual funds in which certain MFS funds may invest. The MFS funds do not invest in the underlying funds for the purpose of exercising management or control. At the end of the period, the MFS Growth Allocation Fund, the MFS Moderate Allocation Fund, the MFS Aggressive Growth Allocation Fund, and the MFS Conservative Allocation Fund were the owners of record of approximately 9%, 8%, 4%, and 3%, respectively, of the value of outstanding voting shares of the fund. In addition, the MFS Lifetime Income Fund, the MFS Lifetime 2020 Fund, the MFS Lifetime 2025 Fund, the MFS Lifetime 2030 Fund, the MFS Lifetime 2035 Fund, the MFS Lifetime 2040 Fund, the MFS Lifetime 2045 Fund, the MFS Lifetime 2050 Fund, the MFS Lifetime 2055 Fund, and the MFS Lifetime 2060 Fund were each the owners of record of less than 1% of the value of outstanding voting shares of the fund.
(6) Line of Credit
The fund and certain other funds managed by MFS participate in a $1.25 billion unsecured committed line of credit, subject to a $1 billion sublimit, provided by a
38
Notes to Financial Statements – continued
syndication of banks under a credit agreement. Borrowings may be made for temporary financing needs. Interest is charged to each fund, based on its borrowings, generally at a rate equal to the higher of the Overnight Federal Reserve funds rate or daily one month LIBOR plus an agreed upon spread. A commitment fee, based on the average daily, unused portion of the committed line of credit, is allocated among the participating funds at the end of each calendar quarter. In addition, the fund and other funds managed by MFS have established unsecured uncommitted borrowing arrangements with certain banks for temporary financing needs. Interest is charged to each fund, based on its borrowings, at a rate equal to the Overnight Federal Reserve funds rate plus an agreed upon spread. For the year ended August 31, 2017, the fund’s commitment fee and interest expense were $7,676 and $0, respectively, and are included in “Miscellaneous” expense in the Statement of Operations.
(7) Investments in Affiliated Issuers
An affiliated issuer may be considered one in which the fund owns 5% or more of the outstanding voting securities, or a company which is under common control. For the purposes of this report, the fund assumes the following to be affiliated issuers:
| | | | | | | | | | | | | | | | | | | | |
| Affiliated Issuers | | | | | Beginning
Shares/Par
Amount | | | Acquisitions
Shares/Par
Amount | | | Dispositions
Shares/Par
Amount | | | Ending
Shares/Par
Amount | |
| MFS Institutional Money Market Portfolio | | | | | | | 15,910,051 | | | | 320,369,001 | | | | (312,824,527 | ) | | | 23,454,525 | |
| Fenix Parts, Inc. | | | | | | | 1,338,451 | | | | — | | | | (1,338,451 | ) | | | — | |
| SecureWorks Corp. | | | | | | | 610,636 | | | | — | | | | (610,636 | ) | | | — | |
| | | | | |
| Affiliated Issuers | | Realized Gain (Loss) | | | Change in
Unrealized
Appreciation
(Depreciation) | | | Capital Gain
Distributions | | | Dividend
Income | | | Ending Value | |
| MFS Institutional Money Market Portfolio | | | $(2,082 | ) | | | $2,343 | | | | $— | | | | $170,013 | | | | $23,454,525 | |
| Fenix Parts, Inc. | | | (10,143,806 | ) | | | 4,360,355 | | | | — | | | | — | | | | — | |
| SecureWorks Corp. | | | (2,238,102 | ) | | | (123,974 | ) | | | — | | | | — | | | | — | |
| | | | | | | | | | | | | | | | | | | | |
| Total | | | $(12,383,990 | ) | | | $4,238,724 | | | | $— | | | | $170,013 | | | | $23,454,525 | |
| | | | | | | | | | | | | | | | | | | | |
39
REPORT OF INDEPENDENT REGISTERED PUBLIC ACCOUNTING FIRM
To the Board of Trustees of MFS Series Trust I and Shareholders of MFS New Discovery Fund:
We have audited the accompanying statement of assets and liabilities, including the portfolio of investments, of MFS New Discovery Fund (the Fund) (one of the series constituting the MFS Series Trust I) as of August 31, 2017, and the related statement of operations for the year then ended, the statements of changes in net assets for each of the two years in the period then ended and the financial highlights for each of the five years in the period then ended. These financial statements and financial highlights are the responsibility of the Fund’s management. Our responsibility is to express an opinion on these financial statements and financial highlights based on our audits.
We conducted our audits in accordance with the standards of the Public Company Accounting Oversight Board (United States). Those standards require that we plan and perform the audit to obtain reasonable assurance about whether the financial statements and financial highlights are free of material misstatement. We were not engaged to perform an audit of the Fund’s internal control over financial reporting. Our audits included consideration of internal control over financial reporting as a basis for designing audit procedures that are appropriate in the circumstances, but not for the purpose of expressing an opinion on the effectiveness of the Fund’s internal control over financial reporting. Accordingly, we express no such opinion. An audit also includes examining, on a test basis, evidence supporting the amounts and disclosures in the financial statements and financial highlights, assessing the accounting principles used and significant estimates made by management, and evaluating the overall financial statement presentation. Our procedures included confirmation of securities owned as of August 31, 2017, by correspondence with the custodian and others or by other appropriate auditing procedures where replies from others were not received. We believe that our audits provide a reasonable basis for our opinion.
In our opinion, the financial statements and financial highlights referred to above present fairly, in all material respects, the financial position of MFS New Discovery Fund (one of the series constituting the MFS Series Trust I) at August 31, 2017, the results of its operations for the year then ended, the changes in its net assets for each of the two years in the period then ended and the financial highlights for each of the five years in the period then ended, in conformity with U.S. generally accepted accounting principles.

Boston, Massachusetts
October 17, 2017
40
RESULTS OF SHAREHOLDER MEETING
(unaudited)
At a special meeting of shareholders of MFS Series Trust I, which was held on March 23, 2017, the following action was taken:
Item 1: To elect the following individuals as Trustees:
| | | | | | | | |
| | | Number of Dollars | |
Nominee | | For | | | Withheld Authority | |
| Steven E. Buller | | | 40,448,016,134.453 | | | | 372,137,248.376 | |
| John A. Caroselli | | | 40,455,058,441.389 | | | | 365,094,941.560 | |
| Maureen R. Goldfarb | | | 40,458,621,672.449 | | | | 361,531,746.940 | |
| David H. Gunning | | | 40,369,558,961.219 | | | | 450,594,312.051 | |
| Michael Hegarty | | | 40,379,783,468.714 | | | | 440,369,950.676 | |
| John P. Kavanaugh | | | 40,453,732,784.104 | | | | 366,420,708.405 | |
| Robert J. Manning | | | 40,424,010,964.586 | | | | 396,142,308.684 | |
| Clarence Otis, Jr. | | | 40,441,919,324.712 | | | | 378,234,043.007 | |
| Maryanne L. Roepke | | | 40,471,040,575.143 | | | | 349,112,917.026 | |
| Robin A. Stelmach | | | 40,459,908,730.475 | | | | 360,244,615.574 | |
| Laurie J. Thomsen | | | 40,426,270,790.416 | | | | 393,882,628.973 | |
41
TRUSTEES AND OFFICERS — IDENTIFICATION AND BACKGROUND
The Trustees and Officers of the Trust, as of October 1, 2017, are listed below, together with their principal occupations during the past five years. (Their titles may have varied during that period.) The address of each Trustee and Officer is 111 Huntington Avenue, Boston, Massachusetts 02199-7618.
| | | | | | | | | | |
Name, Age | | Position(s)
Held with Fund | | Trustee/Officer Since (h) | | Number of
MFS Funds
overseen
by the
Trustee | | Principal
Occupations During the Past Five Years | | Other Directorships
During the Past
Five Years (j) |
| INTERESTED TRUSTEES |
Robert J. Manning (k)
(age 53) | | Trustee | | February 2004 | | 136 | | Massachusetts Financial Services Company, Executive Chairman (since January 2017); Director; Chairman of the Board; Chief Executive Officer (until 2015); Co-Chief Executive Officer (2015-2016) | | N/A |
Robin A. Stelmach (k) (age 56) | | Trustee | | January 2014 | | 136 | | Massachusetts Financial Services Company, Vice Chair (since January 2017); Chief Operating Officer and Executive Vice President (until January 2017) | | N/A |
| INDEPENDENT TRUSTEES |
David H. Gunning
(age 75) | | Trustee and Chair of Trustees | | January 2004 | | 136 | | Private investor | | Lincoln Electric Holdings, Inc., Director; Development Alternatives, Inc., Director/Non-Executive Chairman (until 2013) |
42
Trustees and Officers – continued
| | | | | | | | | | |
Name, Age | | Position(s)
Held with Fund | | Trustee/Officer Since (h) | | Number of
MFS Funds
overseen
by the
Trustee | | Principal
Occupations During the Past Five Years | | Other Directorships
During the Past
Five Years (j) |
Steven E. Buller
(age 66) | | Trustee | | February 2014 | | 136 | | Financial Accounting Standards Advisory Council, Chairman (2014-2015); Public Company Accounting Oversight Board, Standing Advisory Group, Member (until 2014); BlackRock, Inc. (investment management), Managing Director (until 2014), BlackRock Finco UK (investment management), Director (until 2014) | | N/A |
John A. Caroselli
(age 63) | | Trustee | | March 2017 | | 136 | | JC Global Advisors, LLC (management consulting), President (since 2015); First Capital Corporation (commercial finance), Executive Vice President (until 2015) | | N/A |
Maureen R. Goldfarb
(age 62) | | Trustee | | January 2009 | | 136 | | Private investor | | N/A |
Michael Hegarty
(age 72) | | Trustee | | December 2004 | | 136 | | Private investor | | Rouse Properties Inc., Director (until 2016); Capmark Financial Group Inc., Director (until 2015) |
John P. Kavanaugh
(age 62) | | Trustee and Vice Chair of Trustees | | January 2009 | | 136 | | Private investor | | N/A |
Clarence Otis, Jr.
(age 61) | | Trustee | | March 2017 | | 136 | | Darden Restaurants, Inc., Chief Executive Officer (until 2014) | | VF Corporation, Director; Verizon Communications, Inc., Director; The Travelers Companies, Director; Federal Reserve Bank of Atlanta, Director (until 2015) |
43
Trustees and Officers – continued
| | | | | | | | | | |
Name, Age | | Position(s)
Held with Fund | | Trustee/Officer Since (h) | | Number of
MFS Funds
overseen
by the
Trustee | | Principal
Occupations During the Past Five Years | | Other Directorships
During the Past
Five Years (j) |
Maryanne L. Roepke
(age 61) | | Trustee | | May 2014 | | 136 | | American Century Investments (investment management), Senior Vice President and Chief Compliance Officer (until 2014) | | N/A |
Laurie J. Thomsen
(age 60) | | Trustee | | March 2005 | | 136 | | Private investor | | The Travelers Companies, Director; Dycom Industries, Inc., Director (since 2015) |
| | | | | | | | |
Name, Age | | Position(s) Held with Fund | | Trustee/Officer
Since (h) | | Number of
MFS Funds
for which
the Person
is an Officer | | Principal
Occupations During the Past Five Years |
| OFFICERS | | | | | | | | |
Christopher R. Bohane (k)
(age 43) | | Assistant Secretary and Assistant Clerk | | July 2005 | | 136 | | Massachusetts Financial Services Company, Vice President and Assistant General Counsel |
Kino Clark (k)
(age 49) | | Assistant Treasurer | | January 2012 | | 136 | | Massachusetts Financial Services Company, Vice President |
John W. Clark, Jr. (k)
(age 50) | | Assistant Treasurer | | April 2017 | | 136 | | Massachusetts Financial Services Company, Vice President (since March 2017); Deutsche Bank (financial services), Department Head – Treasurer’s Office (until February 2017) |
Thomas H. Connors (k)
(age 58) | | Assistant Secretary and Assistant Clerk | | September 2012 | | 136 | | Massachusetts Financial Services Company, Vice President and Senior Counsel; Deutsche Investment Management Americas Inc. (financial service provider), Director and Senior Counsel (until 2012) |
44
Trustees and Officers – continued
| | | | | | | | |
Name, Age | | Position(s) Held with Fund | | Trustee/Officer
Since (h) | | Number of
MFS Funds
for which
the Person
is an Officer | | Principal
Occupations During the Past Five Years |
Ethan D. Corey (k)
(age 53) | | Assistant Secretary and Assistant Clerk | | July 2005 | | 136 | | Massachusetts Financial Services Company, Senior Vice President and Associate General Counsel |
David L. DiLorenzo (k)
(age 49) | | President | | July 2005 | | 136 | | Massachusetts Financial Services Company, Senior Vice President |
Heidi W. Hardin (k)
(age 50) | | Secretary and Clerk | | April 2017 | | 136 | | Massachusetts Financial Services Company, Executive Vice President and General Counsel (since March 2017); Harris Associates (investment management), General Counsel (from September 2015 to January 2017); Janus Capital Management LLC (investment management), Senior Vice President and General Counsel (until September 2015) |
Brian E. Langenfeld (k) (age 44) | | Assistant Secretary and Assistant Clerk | | June 2006 | | 136 | | Massachusetts Financial Services Company, Vice President and Senior Counsel |
Susan A. Pereira (k)
(age 46) | | Assistant Secretary and Assistant Clerk | | July 2005 | | 136 | | Massachusetts Financial Services Company, Vice President and Senior Counsel |
Kasey L. Phillips (k)
(age 46) | | Assistant Treasurer | | September 2012 | | 136 | | Massachusetts Financial Services Company, Vice President; Wells Fargo Funds Management, LLC, Senior Vice President, Fund Treasurer (until 2012) |
Matthew A. Stowe (k)
(age 42) | | Assistant Secretary and Assistant Clerk | | October 2014 | | 136 | | Massachusetts Financial Services Company, Vice President and Assistant General Counsel |
Frank L. Tarantino
(age 73) | | Independent Senior Officer | | June 2004 | | 136 | | Tarantino LLC (provider of compliance services), Principal |
Richard S. Weitzel (k)
(age 47) | | Assistant Secretary and Assistant Clerk | | October 2007 | | 136 | | Massachusetts Financial Services Company, Senior Vice President and Associate General Counsel |
45
Trustees and Officers – continued
| | | | | | | | |
Name, Age | | Position(s) Held with Fund | | Trustee/Officer
Since (h) | | Number of
MFS Funds
for which
the Person
is an Officer | | Principal
Occupations During the Past Five Years |
Martin J. Wolin (k)
(age 50) | | Chief Compliance Officer | | July 2015 | | 136 | | Massachusetts Financial Services Company, Senior Vice President and Chief Compliance Officer (since July 2015); Mercer (financial service provider), Chief Risk and Compliance Officer, North America and Latin America (until June 2015) |
James O. Yost (k)
(age 57) | | Treasurer | | September 1990 | | 136 | | Massachusetts Financial Services Company, Senior Vice President |
| (h) | Date first appointed to serve as Trustee/officer of an MFS Fund. Each Trustee has served continuously since appointment unless indicated otherwise. For the period from December 15, 2004 until February 22, 2005, Mr. Manning served as Advisory Trustee. Prior to January 2012, Messrs. DiLorenzo and Yost served as Assistant Treasurers of the Funds. From January 2012 through December 2016, Messrs. DiLorenzo and Yost served as Treasurer and Deputy Treasurer of the Funds, respectively. |
| (j) | Directorships or trusteeships of companies required to report to the Securities and Exchange Commission (i.e., “public companies”). |
| (k) | “Interested person” of the Trust within the meaning of the Investment Company Act of 1940 (referred to as the 1940 Act), which is the principal federal law governing investment companies like the fund, as a result of a position with MFS. The address of MFS is 111 Huntington Avenue, Boston, Massachusetts 02199-7618. |
Each Trustee has been elected by shareholders and each Trustee and officer holds office until his or her successor is chosen and qualified or until his or her earlier death, resignation, retirement or removal. The Trust does not hold annual meetings for the purpose of electing Trustees, and Trustees are not elected for fixed terms. Under the terms of the Board’s retirement policy, an Independent Trustee shall retire at the end of the calendar year in which he or she reaches the earlier of 75 years of age or 15 years of service on the Board (or, in the case of any Independent Trustee who joined the Board prior to 2015, 20 years of service on the Board).
Messrs. Buller, Kavanaugh and Otis and Ms. Roepke are members of the Trust’s Audit Committee.
Each of the Interested Trustees and certain Officers hold comparable officer positions with certain affiliates of MFS.
46
Trustees and Officers – continued
The Statement of Additional Information for a Fund includes further information about the Trustees and is available without charge upon request by calling 1-800-225-2606.
| | |
| Investment Adviser | | Custodian |
Massachusetts Financial Services Company
111 Huntington Avenue
Boston, MA 02199-7618 | | State Street Bank and Trust Company 1 Lincoln Street
Boston, MA 02111-2900 |
| Distributor | | Independent Registered Public Accounting Firm |
MFS Fund Distributors, Inc.
111 Huntington Avenue
Boston, MA 02199-7618 | | Ernst & Young LLP 200 Claredon Street
Boston, MA 02116 |
| Portfolio Manager(s) | | |
Paul Gordon | | |
Michael Grossman | | |
47
BOARD REVIEW OF INVESTMENT ADVISORY AGREEMENT
The Investment Company Act of 1940 requires that both the full Board of Trustees and a majority of the non-interested (“independent”) Trustees, voting separately, annually approve the continuation of the Fund’s investment advisory agreement with MFS. The Trustees consider matters bearing on the Fund and its advisory arrangements at their meetings throughout the year, including a review of performance data at each regular meeting. In addition, the independent Trustees met several times over the course of three months beginning in May and ending in July, 2017 (“contract review meetings”) for the specific purpose of considering whether to approve the continuation of the investment advisory agreement for the Fund and the other investment companies that the Board oversees (the “MFS Funds”). The independent Trustees were assisted in their evaluation of the Fund’s investment advisory agreement by independent legal counsel, from whom they received separate legal advice and with whom they met separately from MFS during various contract review meetings. The independent Trustees were also assisted in this process by the MFS Funds’ Independent Senior Officer, a senior officer appointed by and reporting to the independent Trustees.
In connection with their deliberations regarding the continuation of the investment advisory agreement, the Trustees, including the independent Trustees, considered such information and factors as they believed, in light of the legal advice furnished to them and their own business judgment, to be relevant. The investment advisory agreement for the Fund was considered separately, although the Trustees also took into account the common interests of all MFS Funds in their review. As described below, the Trustees considered the nature, quality, and extent of the various investment advisory, administrative, and shareholder services performed by MFS under the existing investment advisory agreement and other arrangements with the Fund.
In connection with their contract review meetings, the Trustees received and relied upon materials that included, among other items: (i) information provided by Broadridge Financial Solutions, Inc. (“Broadridge”), an independent third party, on the investment performance of the Fund for various time periods ended December 31, 2016 and the investment performance of a group of funds with substantially similar investment classifications/objectives (the “Lipper performance universe”), (ii) information provided by Broadridge on the Fund’s advisory fees and other expenses and the advisory fees and other expenses of comparable funds identified by Broadridge (the “Broadridge expense group”), (iii) information provided by MFS on the advisory fees of portfolios of other clients of MFS, including institutional separate accounts and other clients, (iv) information as to whether and to what extent applicable expense waivers, reimbursements or fee “breakpoints” are observed for the Fund, (v) information regarding MFS’ financial results and financial condition, including MFS’ and certain of its affiliates’ estimated profitability from services performed for the Fund and the MFS Funds as a whole, and compared to MFS’ institutional business, (vi) MFS’ views regarding the outlook for the mutual fund industry and the strategic business plans of MFS, (vii) descriptions of various functions performed by MFS for the Funds, such as compliance monitoring and portfolio trading practices, and (viii) information regarding the overall organization of MFS, including information about MFS’ senior management and other personnel providing investment advisory,
48
Board Review of Investment Advisory Agreement – continued
administrative and other services to the Fund and the other MFS Funds. The comparative performance, fee and expense information prepared and provided by Broadridge was not independently verified and the independent Trustees did not independently verify any information provided to them by MFS.
The Trustees’ conclusion as to the continuation of the investment advisory agreement was based on a comprehensive consideration of all information provided to the Trustees and not the result of any single factor. Some of the factors that figured particularly in the Trustees’ deliberations are described below, although individual Trustees may have evaluated the information presented differently from one another, giving different weights to various factors. It is also important to recognize that the fee arrangements for the Fund and other MFS Funds are the result of years of review and discussion between the independent Trustees and MFS, that certain aspects of such arrangements may receive greater scrutiny in some years than in others, and that the Trustees’ conclusions may be based, in part, on their consideration of these same arrangements during the course of the year and in prior years.
Based on information provided by Broadridge and MFS, the Trustees reviewed the Fund’s total return investment performance as well as the performance of peer groups of funds over various time periods. The Trustees placed particular emphasis on the total return performance of the Fund’s Class A shares in comparison to the performance of funds in its Lipper performance universe over the three-year period ended December 31, 2016, which the Trustees believed was a long enough period to reflect differing market conditions. The total return performance of the Fund’s Class A shares was in the 5th quintile relative to the other funds in the universe for this three-year period (the 1st quintile being the best performers and the 5th quintile being the worst performers). The total return performance of the Fund’s Class A shares was in the 3rd quintile for the one-year period and the 4th quintile for the five-year period ended December 31, 2016 relative to the Lipper performance universe. Because of the passage of time, these performance results may differ from the performance results for more recent periods, including those shown elsewhere in this report.
The Trustees expressed continued concern to MFS about the substandard investment performance of the Fund. In the course of their deliberations, the Trustees took into account information provided by MFS in connection with the contract review meetings, as well as during investment review meetings conducted with portfolio management personnel during the course of the year, as to MFS’ efforts to improve the Fund’s performance. In addition, the Trustees requested that they receive a separate update on the Fund’s performance at each of their regular meetings. After reviewing these and related factors, the Trustees concluded, within the context of their overall conclusions regarding the investment advisory agreement, that MFS’ responses and efforts and plans to improve investment performance were sufficient to support approval of the continuance of the investment advisory agreement for an additional one-year period, but that they would continue to closely monitor the performance of the Fund.
In assessing the reasonableness of the Fund’s advisory fee, the Trustees considered, among other information, the Fund’s advisory fee and the total expense ratio of the Fund’s Class A shares as a percentage of average daily net assets and the advisory fee and total expense ratios of peer groups of funds based on information provided by
49
Board Review of Investment Advisory Agreement – continued
Broadridge. The Trustees considered that, according to the data provided by Broadridge (which takes into account any fee reductions or expense limitations that were in effect during the Fund’s last fiscal year), the Fund’s effective advisory fee rate was higher than the Broadridge expense group median and the Fund’s total expense ratio was approximately at the Broadridge expense group median.
The Trustees also considered the advisory fees charged by MFS to any institutional separate accounts advised by MFS (“separate accounts”) and unaffiliated investment companies for which MFS serves as subadviser (“subadvised funds”) that have comparable investment strategies to the Fund, if any. In comparing these fees, the Trustees considered information provided by MFS as to the generally broader scope of services provided by MFS to the Fund, as well as the more extensive regulatory burdens imposed on MFS in managing the Fund, in comparison to separate accounts and subadvised funds. The Trustees also considered the higher demands placed on MFS’ investment personnel and trading infrastructure as a result of the daily cash in-flows and out-flows of the Fund in comparison to separate accounts.
The Trustees also considered whether the Fund may benefit from any economies of scale in the management of the Fund in the event of growth in assets of the Fund and/or growth in assets of the MFS Funds as a whole. They noted that the Fund’s advisory fee rate schedule is subject to contractual breakpoints that reduce the Fund’s advisory fee rate on average daily net assets over $1 billion, $2.5 billion and $5 billion. The Trustees also noted that MFS has agreed in writing to waive a portion of the management fees of certain MFS Funds, including the Fund, if the total combined assets of certain funds within the MFS Funds’ complex increase above agreed upon thresholds (the “group fee waiver”), enabling the Fund’s shareholders to share in the benefits from any economies of scale at the complex level. The group fee waiver is reviewed and renewed annually between the Board and MFS. The Trustees concluded that the breakpoints and the group fee waiver were sufficient to allow the Fund to benefit from economies of scale as its assets and overall complex assets grow.
The Trustees also considered information prepared by MFS relating to MFS’ costs and profits with respect to the Fund, the MFS Funds considered as a group, and other investment companies and accounts advised by MFS, as well as MFS’ methodologies used to determine and allocate its costs to the MFS Funds, the Fund and other accounts and products for purposes of estimating profitability.
After reviewing these and other factors described herein, the Trustees concluded, within the context of their overall conclusions regarding the investment advisory agreement, that the advisory fees charged to the Fund represent reasonable compensation in light of the services being provided by MFS to the Fund.
In addition, the Trustees considered MFS’ resources and related efforts to continue to retain, attract and motivate capable personnel to serve the Fund. The Trustees also considered current and developing conditions in the financial services industry, including the presence of large and well-capitalized companies which are spending, and appear to be prepared to continue to spend, substantial sums to engage personnel and to provide services to competing investment companies. In this regard, the Trustees also considered the financial resources of MFS and its ultimate parent, Sun Life
50
Board Review of Investment Advisory Agreement – continued
Financial Inc. The Trustees also considered the advantages and possible disadvantages to the Fund of having an adviser that also serves other investment companies as well as other accounts.
The Trustees also considered the nature, quality, cost, and extent of administrative, transfer agency, and distribution services provided to the Fund by MFS and its affiliates under agreements and plans other than the investment advisory agreement, including any 12b-1 fees the Fund pays to MFS Fund Distributors, Inc., an affiliate of MFS. The Trustees also considered the nature, extent and quality of certain other services MFS performs or arranges for on the Fund’s behalf, which may include securities lending programs, directed expense payment programs, class action recovery programs, and MFS’ interaction with third-party service providers, principally custodians and sub-custodians. The Trustees concluded that the various non-advisory services provided by MFS and its affiliates on behalf of the Fund were satisfactory.
The Trustees also considered benefits to MFS from the use of the Fund’s portfolio brokerage commissions, if applicable, to pay for investment research and various other factors. Additionally, the Trustees considered so-called “fall-out benefits” to MFS such as reputational value derived from serving as investment manager to the Fund.
Based on their evaluation of factors that they deemed to be material, including those factors described above, the Board of Trustees, including the independent Trustees, concluded that the Fund’s investment advisory agreement with MFS should be continued for an additional one-year period, commencing August 1, 2017.
51
PROXY VOTING POLICIES AND INFORMATION
MFS votes proxies on behalf of the fund pursuant to proxy voting policies and procedures that are available without charge, upon request, by calling 1-800-225-2606, by visiting mfs.com (once you have selected “Individual Investor” as your role, click on “Individual Investor Home” in the top navigation and then select “Learn More About Proxy Voting” under the “I want to…” header on the left hand column of the page), or by visiting the SEC’s Web site at http://www.sec.gov.
Information regarding how the fund voted proxies relating to portfolio securities during the most recent twelve-month period ended June 30 is available by August 31 of each year without charge by visiting mfs.com (once you have selected “Individual Investor” as your role, click on “Individual Investor Home” in the top navigation and then select “Learn More About Proxy Voting” under the “I want to…” header on the left hand column of the page), or by visiting the SEC’s Web site at http://www.sec.gov.
QUARTERLY PORTFOLIO DISCLOSURE
The fund will file a complete schedule of portfolio holdings with the Securities and Exchange Commission (the Commission) for the first and third quarters of each fiscal year on Form N-Q. A shareholder can obtain the quarterly portfolio holdings report at mfs.com. The fund’s Form N-Q is also available on the EDGAR database on the Commission’s Internet Web site at http://www.sec.gov, and may be reviewed and copied at the:
Public Reference Room
Securities and Exchange Commission
100 F Street, NE, Room 1580
Washington, D.C. 20549
Information on the operation of the Public Reference Room may be obtained by calling the Commission at 1-800-SEC-0330. Copies of the fund’s Form N-Q also may be obtained, upon payment of a duplicating fee, by electronic request at the following e-mail address: publicinfo@sec.gov or by writing the Public Reference Section at the above address.
FURTHER INFORMATION
From time to time, MFS may post important information about the fund or the MFS funds on the MFS web site (mfs.com). This information is available on mfs.com by following these steps once you have selected “Individual Investor” as your role: (1) Click on the “Individual Investor Home” in the top navigation and then select the “Announcements” option within the “Market Outlooks” drop down, or (2) Click on “Products & Services” and “Mutual Funds” and then choose the fund’s name in the “Select a fund” menu.
52
INFORMATION ABOUT FUND CONTRACTS AND LEGAL CLAIMS
The fund has entered into contractual arrangements with an investment adviser, administrator, distributor, shareholder servicing agent, 529 program manager (if applicable), and custodian who each provide services to the fund. Unless expressly stated otherwise, shareholders are not parties to, or intended beneficiaries of these contractual arrangements, and these contractual arrangements are not intended to create any shareholder right to enforce them against the service providers or to seek any remedy under them against the service providers, either directly or on behalf of the fund.
Under the Trust’s By-Laws and Declaration of Trust, any claims asserted against or on behalf of the MFS Funds, including claims against Trustees and Officers, must be brought in state and federal courts located within the Commonwealth of Massachusetts.
FEDERAL TAX INFORMATION (unaudited)
The fund will notify shareholders of amounts for use in preparing 2017 income tax forms in January 2018. The following information is provided pursuant to provisions of the Internal Revenue Code.
The fund designates $37,802,000 as capital gain dividends paid during the fiscal year.
53
rev. 3/16
| | | | |
| | | |
FACTS | | WHAT DOES MFS DO WITH YOUR PERSONAL INFORMATION? | |  |
| | |
| Why? | | Financial companies choose how they share your personal information. Federal law gives consumers the right to limit some but not all sharing. Federal law also requires us to tell you how we collect, share, and protect your personal information. Please read this notice carefully to understand what we do. |
| | |
| What? | | The types of personal information we collect and share depend on the product or service you have with us. This information can include: • Social Security number and account balances • Account transactions and transaction history • Checking account information and wire transfer instructions When you are no longer our customer, we continue to share your information as described in this notice. |
| | |
| How? | | All financial companies need to share customers’ personal information to run their everyday business. In the section below, we list the reasons financial companies can share their customers’ personal information; the reasons MFS chooses to share; and whether you can limit this sharing. |
| | | | |
Reasons we can share your
personal information | | Does MFS
share? | | Can you limit
this sharing? |
For our everyday business purposes – such as to process your transactions, maintain your account(s), respond to court orders and legal investigations, or report to credit bureaus | | Yes | | No |
For our marketing purposes – to offer our products and services to you | | No | | We don’t share |
For joint marketing with other financial companies | | No | | We don’t share |
For our affiliates’ everyday business purposes – information about your transactions and experiences | | No | | We don’t share |
For our affiliates’ everyday business purposes – information about your creditworthiness | | No | | We don’t share |
| For nonaffiliates to market to you | | No | | We don’t share |
| | |
| Questions? | | Call 800-225-2606 or go to mfs.com. |
54
| | |
| Who we are |
| Who is providing this notice? | | MFS Funds, MFS Investment Management, MFS Institutional Advisors, Inc., and MFS Heritage Trust Company. |
| | |
| What we do |
| How does MFS protect my personal information? | | To protect your personal information from unauthorized access and use, we use security measures that comply with federal law. These measures include procedural, electronic, and physical safeguards for the protection of the personal information we collect about you. |
| How does MFS collect my personal information? | | We collect your personal information, for example, when you • open an account or provide account information • direct us to buy securities or direct us to sell your securities • make a wire transfer We also collect your personal information from others, such as credit bureaus, affiliates, or other companies. |
| Why can’t I limit all sharing? | | Federal law gives you the right to limit only • sharing for affiliates’ everyday business purposes – information about your creditworthiness • affiliates from using your information to market to you • sharing for nonaffiliates to market to you State laws and individual companies may give you additional rights to limit sharing. |
| | |
| Definitions |
| Affiliates | | Companies related by common ownership or control. They can be financial and nonfinancial companies. • MFS does not share personal information with affiliates, except for everyday business purposes as described on page one of this notice. |
| Nonaffiliates | | Companies not related by common ownership or control. They can be financial and nonfinancial companies. • MFS does not share with nonaffiliates so they can market to you. |
| Joint marketing | | A formal agreement between nonaffiliated financial companies that together market financial products or services to you. • MFS doesn’t jointly market. |
| | |
| Other important information |
| If you own an MFS product or receive an MFS service in the name of a third party such as a bank or broker-dealer, their privacy policy may apply to you instead of ours. |
55
Save paper with eDelivery.

| MFS® will send you prospectuses, |
reports, and proxies directly via e-mail so you will get information faster with less mailbox clutter.
To sign up:
1. Go to mfs.com.
2. Log in via MFS® Access.
3. Select eDelivery.
If you own your MFS fund shares through a financial institution or a retirement plan, MFS® TALK, MFS® Access, or eDelivery may not be available to you.
CONTACT
WEB SITE
mfs.com
MFS TALK
1-800-637-8255
24 hours a day
ACCOUNT SERVICE AND LITERATURE
Shareholders
1-800-225-2606
Financial advisors
1-800-343-2829
Retirement plan services
1-800-637-1255
MAILING ADDRESS
MFS Service Center, Inc.
P.O. Box 55824
Boston, MA 02205-5824
OVERNIGHT MAIL
MFS Service Center, Inc.
c/o Boston Financial Data Services
30 Dan Road
Canton, MA 02021-2809
ANNUAL REPORT
August 31, 2017

MFS® RESEARCH INTERNATIONAL FUND

RIF-ANN
MFS® RESEARCH INTERNATIONAL FUND
CONTENTS
The report is prepared for the general information of shareholders.
It is authorized for distribution to prospective investors only when preceded or accompanied by a current prospectus.
NOT FDIC INSURED • MAY LOSE VALUE • NO BANK GUARANTEE

LETTER FROM THE EXECUTIVE CHAIRMAN
Dear Shareholders:
Despite policy uncertainty accompanying a new presidential administration in the United States and unease over ongoing Brexit negotiations, most markets have proved
resilient. U.S. share prices have reached new highs in recent months although the U.S. Federal Reserve has continued to gradually hike interest rates. However, rates in most developed markets remain very low, with major non-U.S. central banks just beginning to contemplate curbing accommodative monetary policies.
Globally, we’ve experienced a year-long synchronized upturn in economic growth. Despite better growth, there are few immediate signs of worrisome inflation amid muted wage gains around the world. Europe has benefited from diminishing event risks as populist challengers fell short of upsetting establishment
candidates in both the Dutch and French elections. Emerging market economies have been boosted in part by a weaker U.S. dollar and are recovering despite lingering concerns over the potential for restrictive U.S. trade policies that could hamper global trade growth. Looking ahead, markets will have to contend with issues involving geopolitical hot spots on the Korean peninsula and in the Middle East.
At MFS®, we believe time is an asset. A patient, long-term approach to investing can have a powerful impact on decision making and outcomes. Time arbitrage, as we call it, comes down to having the conviction and discipline to allow enough time for good investment ideas to play out. In our view, such an approach, along with the professional guidance of a financial advisor, will help you reach your investment objectives.
Respectfully,

Robert J. Manning
Executive Chairman
MFS Investment Management
October 17, 2017
The opinions expressed in this letter are subject to change and may not be relied upon for investment advice. No forecasts can be guaranteed.
1
PORTFOLIO COMPOSITION
Portfolio structure

| | | | |
| Top ten holdings | | | | |
| Nestle S.A. | | | 3.4% | |
| Roche Holding AG | | | 2.9% | |
| Bayer AG | | | 2.7% | |
| AIA Group Ltd. | | | 2.1% | |
| Schneider Electric S.A. | | | 2.0% | |
| UBS AG | | | 1.8% | |
| Danone S.A. | | | 1.7% | |
| Reckitt Benckiser Group PLC | | | 1.7% | |
| Akzo Nobel N.V. | | | 1.7% | |
| BNP Paribas | | | 1.6% | |
|
| Global equity sectors | |
| Financial Services | | | 24.7% | |
| Capital Goods | | | 23.5% | |
| Health Care | | | 10.0% | |
| Consumer Staples | | | 10.0% | |
| Technology | | | 9.3% | |
| Consumer Cyclicals | | | 8.3% | |
| Energy | | | 8.2% | |
| Telecommunications/Cable Television | | | 4.5% | |
| | | | |
| Issuer country weightings (x) | |
| Japan | | | 18.3% | |
| Switzerland | | | 14.1% | |
| United Kingdom | | | 10.3% | |
| Germany | | | 8.6% | |
| France | | | 8.4% | |
| United States | | | 7.5% | |
| Australia | | | 3.9% | |
| Hong Kong | | | 3.8% | |
| Italy | | | 3.5% | |
| Other Countries | | | 21.6% | |
|
| Currency exposure weightings (y) | |
| Euro | | | 29.0% | |
| Japanese Yen | | | 18.3% | |
| Swiss Franc | | | 14.1% | |
| British Pound Sterling | | | 10.7% | |
| United States Dollar | | | 8.2% | |
| Hong Kong Dollar | | | 4.4% | |
| Australian Dollar | | | 3.9% | |
| Chinese Renminbi | | | 1.7% | |
| Canadian Dollar | | | 1.6% | |
| Other Currencies | | | 8.1% | |
| (x) | Represents the portfolio’s exposure to issuer countries as a percentage of a portfolio’s net assets. For purposes of this presentation, United States includes Cash & Cash Equivalents. |
| (y) | Represents the portfolio’s exposure to a particular currency as a percentage of a portfolio’s net assets. For purposes of this presentation, United States Dollar includes Cash & Cash Equivalents. |
2
Portfolio Composition – continued
Cash & Cash Equivalents includes any cash, investments in money market funds, short-term securities, and other assets less liabilities. Please see the Statement of Assets and Liabilities for additional information related to the fund’s cash position and other assets and liabilities.
Percentages are based on net assets as of August 31, 2017.
The portfolio is actively managed and current holdings may be different.
3
MANAGEMENT REVIEW
Summary of Results
For the twelve months ended August 31, 2017, Class A shares of the MFS Research International Fund (“fund”) provided a total return of 16.66%, at net asset value. This compares with a return of 17.64% for the fund’s benchmark, the MSCI EAFE Index (net div).
Market Environment
For the first time in many years, the global economy is experiencing a period of synchronized economic growth. The rebound in emerging markets (“EM”) economies has been more pronounced (despite the deceleration in Chinese growth at the end of the period), helped by larger economies such as Brazil and Russia emerging from recessions. At the same time, developed markets (“DM”) economies continued to grow at or above potential. Market confidence increased in the US after the presidential elections in November in anticipation of lower taxes, a lighter regulatory burden and increased infrastructure spending, boosting US equities and corporate bond performance. Though hopes have largely faded for pro-growth US policies, market confidence persists. Globally, markets benefited from a reflation trade during the first half of the period as commodity prices strengthened, activity and growth prospects improved, and inflation moved higher, though within moderate bounds. While this bump in global inflation faded in the second half of the period as commodity prices, particularly oil, leveled off or declined, global growth remained relatively resilient. As a result, there have been more tightening signals and actions by DM central banks. The US Federal Reserve increased interest rates by 25 basis points during the second half of the period, bringing the total number of quarter-percent hikes in the federal funds rate to four since December 2015. The European Central Bank appears set to announce tapering of quantitative easing in the fall of 2017. The Bank of England may also begin reducing monetary accommodation. Markets have been comforted, along with central banks, by the decline in fears of a populist surge in Europe after establishment candidates won the Dutch and French elections. European growth has reflected the calmer political economic backdrop.
In recent months, the US dollar reversed the sharp rise seen early in the period, easing what had been a substantial headwind to earnings for multinationals. US consumer spending held up well during the second half of the period amid a modest increase in real wages and relatively low gasoline prices. Demand for autos reached near-record territory in the first half of the period before tapering off at the end of the period, while the housing market continued its recovery amid relatively low mortgage rates and tight inventories. Global trade, which was sluggish early in the period, showed signs of improvement in the period’s second half, a positive indicator of global economic activity and prospects. Early in the period, the US election resulted in a sell-off in EM assets due to fears that President Trump would follow through on various campaign threats and promises that were judged to be detrimental to EM. While President Trump withdrew the US from the Trans-Pacific Partnership and began the renegotiation of the North American Free Trade Agreement, significant additional
4
Management Review – continued
policy action has so far been lacking on economic issues involving EM. As a result, emerging markets resumed their upward trajectory, powered by strong inflows throughout the first half of 2017.
Detractors from Performance
Stock selection within the capital goods sector was a primary detractor from performance relative to the MSCI EAFE Index. The fund’s overweight positions in supply chain support services and information management solutions provider Brambles (Australia), parcel delivery services company Yamato Holdings (Japan) and mechanical engineering firm GEA Group (Germany) held back relative results. Shares of Brambles fell after the company issued a profit warning as sales and earnings growth came in below market consensus. Management cited US retail de-stocking as a key driver for the weak performance.
Stock selection in both the consumer staples and energy sectors further detracted from relative performance. Within the consumer staples sector, an overweight position in tobacco company Japan Tobacco (Japan) and health, hygiene and home products manufacturer Reckitt Benckiser (United Kingdom) hindered relative performance. There were no individual securities within the energy sector that were among the fund’s top relative detractors during the period.
Elsewhere, the fund’s overweight positions in telecommunications company KDDI (Japan) and advertising and marketing firm WPP (United Kingdom) dampened relative returns. Shares of WPP depreciated after the company reported account losses and lower-than-expected net organic sales growth due to a deceleration in the North American region. Additionally, not holding shares of financial services firm HSBC (United Kingdom), and the fund’s holdings of internet search engine and online computer games provider NAVER (b) (South Korea), further hindered relative returns.
The fund’s cash and/or cash equivalents position during the period was also a detractor from relative performance. Under normal market conditions, the fund strives to be fully invested and generally holds cash to buy new holdings and to provide liquidity. In a period when equity markets rose, as measured by the fund’s benchmark, holding cash hurt performance versus the benchmark, which has no cash position.
Contributors to Performance
Stock selection in both the health care and technology sectors contributed to relative results. Within the health care sector, not holding a position in weak-performing pharmaceutical company Teva Pharmaceutical Industries Ltd (Israel) benefited relative results. Within the technology sector, the fund’s position in online and mobile commerce company Alibaba Group Holding (b) aided relative performance. Shares of Alibaba Group advanced after the company reported greater-than-expected sales guidance and strong revenue results, driven by outperformance in the company’s core commerce and cloud computing services.
Other areas of relative strength included the fund’s overweight positions in financial services group DnB NOR (Norway), mining company Rio Tinto (United Kingdom), banking and financial services firm Intesa Sanpaolo (Italy), global banking group BNP Paribas (France), luxury goods company LVMH (France), paint and specialty chemicals manufacturer Akzo Nobel (Netherlands) and banking firm KBC Group (Belgium).
5
Management Review – continued
Avoiding shares of auto manufacturer Toyota Motor (Japan), which underperformed the benchmark, also helped. Shares of DnB NOR rose during the period after the company’s results came in ahead of market consensus, driven by lower-than-expected costs, a stronger capital position and improved dividend payout prospects.
Respectfully,
|
| Portfolio Manager(s) |
| Jose Luis Garcia, Victoria Higley, and Thomas Melendez |
| (b) | Security is not a benchmark constituent. |
The views expressed in this report are those of the portfolio manager(s) only through the end of the period of the report as stated on the cover and do not necessarily reflect the views of MFS or any other person in the MFS organization. These views are subject to change at any time based on market or other conditions, and MFS disclaims any responsibility to update such views. These views may not be relied upon as investment advice or an indication of trading intent on behalf of any MFS portfolio. References to specific securities are not recommendations of such securities, and may not be representative of any MFS portfolio’s current or future investments.
6
PERFORMANCE SUMMARY THROUGH 8/31/17
The following chart illustrates a representative class of the fund’s historical performance in comparison to its benchmark(s). Performance results include the deduction of the maximum applicable sales charge and reflect the percentage change in net asset value, including reinvestment of dividends and capital gains distributions. The performance of other share classes will be greater than or less than that of the class depicted below. Benchmarks are unmanaged and may not be invested in directly. Benchmark returns do not reflect sales charges, commissions or expenses. (See Notes to Performance Summary.)
Performance data shown represents past performance and is no guarantee of future results. Investment return and principal value fluctuate so your shares, when sold, may be worth more or less than the original cost; current performance may be lower or higher than quoted. The performance shown does not reflect the deduction of taxes, if any, that a shareholder would pay on fund distributions or the redemption of fund shares.
Growth of a Hypothetical $10,000 Investment
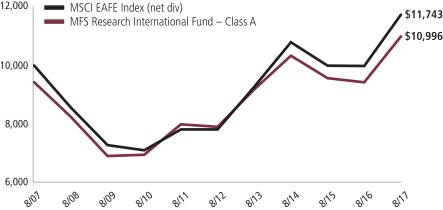
7
Performance Summary – continued
Total Returns through 8/31/17
Average annual without sales charge
| | | | | | | | | | | | |
| | | Share Class | | Class Inception Date | | 1-yr | | 5-yr | | 10-yr | | |
| | | A | | 1/02/97 | | 16.66% | | 6.81% | | 1.55% | | |
| | | B | | 1/02/98 | | 15.77% | | 6.01% | | 0.81% | | |
| | | C | | 1/02/98 | | 15.74% | | 6.01% | | 0.81% | | |
| | | I | | 1/02/97 | | 16.95% | | 7.08% | | 1.82% | | |
| | | R1 | | 4/01/05 | | 15.79% | | 6.01% | | 0.81% | | |
| | | R2 | | 10/31/03 | | 16.37% | | 6.55% | | 1.31% | | |
| | | R3 | | 4/01/05 | | 16.67% | | 6.82% | | 1.56% | | |
| | | R4 | | 4/01/05 | | 16.92% | | 7.08% | | 1.82% | | |
| | | R6 | | 5/01/06 | | 17.07% | | 7.19% | | 1.82% | | |
| | | 529A | | 7/31/02 | | 16.60% | | 6.79% | | 1.48% | | |
| | | 529B | | 7/31/02 | | 15.68% | | 5.96% | | 0.73% | | |
| | | 529C | | 7/31/02 | | 15.78% | | 5.97% | | 0.73% | | |
| Comparative benchmark(s) | | | | | | | | |
| | | MSCI EAFE Index (net div) (f) | | 17.64% | | 8.48% | | 1.62% | | |
| Average annual with sales charge | | | | | | | | |
| | | A
With Initial Sales Charge (5.75%) | | 9.95% | | 5.55% | | 0.95% | | |
| | | B
With CDSC (Declining over six years from 4% to 0%) (v) | | 11.77% | | 5.69% | | 0.81% | | |
| | | C
With CDSC (1% for 12 months) (v) | | 14.74% | | 6.01% | | 0.81% | | |
| | | 529A
With initial Sales Charge (5.75%) | | 9.89% | | 5.53% | | 0.89% | | |
| | | 529B
With CDSC (Declining over six years from 4% to 0%) (v) | | 11.68% | | 5.64% | | 0.73% | | |
| | | 529C
With CDSC (1% for 12 months) (v) | | 14.78% | | 5.97% | | 0.73% | | |
CDSC – Contingent Deferred Sales Charge.
Class I, R1, R2, R3, R4, and R6 shares do not have a sales charge.
On May 30, 2012, Class W shares were redesignated Class R5 shares. Total returns for Class R5 shares prior to May 30, 2012 reflect the performance history of Class W shares which had different fees and expenses than Class R5 shares. Effective August 26, 2016, Class R5 shares were renamed Class R6 shares.
| (f) | Source: FactSet Research Systems Inc. |
| (v) | Assuming redemption at the end of the applicable period. |
8
Performance Summary – continued
Benchmark Definition(s)
MSCI EAFE (Europe, Australasia, Far East) Index (net div) – a market capitalization-weighted index that is designed to measure equity market performance in the developed markets, excluding the U.S. and Canada.
It is not possible to invest directly in an index.
Notes to Performance Summary
Class 529 shares are only available in conjunction with qualified tuition programs, such as the MFS 529 Savings Plan. There also is an additional fee, which is detailed in the program description, on qualified tuition programs. If this fee was reflected, the performance for Class 529 shares would have been lower. This annual fee is waived for Oregon residents and for those accounts with assets of $25,000 or more.
Average annual total return represents the average annual change in value for each share class for the periods presented.
Performance results reflect any applicable expense subsidies and waivers in effect during the periods shown. Without such subsidies and waivers the fund’s performance results would be less favorable. Please see the prospectus and financial statements for complete details.
Performance results do not include adjustments made for financial reporting purposes in accordance with U.S. generally accepted accounting principles and may differ from amounts reported in the financial highlights.
From time to time the fund may receive proceeds from litigation settlements, without which performance would be lower.
9
EXPENSE TABLE
Fund expenses borne by the shareholders during the period, March 1, 2017 through August 31, 2017
As a shareholder of the fund, you incur two types of costs: (1) transaction costs, including sales charges (loads) on certain purchase or redemption payments, and (2) ongoing costs, including management fees; distribution and service (12b-1) fees; and other fund expenses. This example is intended to help you understand your ongoing costs (in dollars) of investing in the fund and to compare these costs with the ongoing costs of investing in other mutual funds.
The example is based on an investment of $1,000 invested at the beginning of the period and held for the entire period March 1, 2017 through August 31, 2017.
Actual Expenses
The first line for each share class in the following table provides information about actual account values and actual expenses. You may use the information in this line, together with the amount you invested, to estimate the expenses that you paid over the period. Simply divide your account value by $1,000 (for example, an $8,600 account value divided by $1,000 = 8.6), then multiply the result by the number in the first line under the heading entitled “Expenses Paid During Period” to estimate the expenses you paid on your account during this period.
Hypothetical Example for Comparison Purposes
The second line for each share class in the following table provides information about hypothetical account values and hypothetical expenses based on the fund’s actual expense ratio and an assumed rate of return of 5% per year before expenses, which is not the fund’s actual return. The hypothetical account values and expenses may not be used to estimate the actual ending account balance or expenses you paid for the period. You may use this information to compare the ongoing costs of investing in the fund and other funds. To do so, compare this 5% hypothetical example with the 5% hypothetical examples that appear in the shareholder reports of the other funds.
Please note that the expenses shown in the table are meant to highlight your ongoing costs only and do not reflect any transactional costs, such as sales charges (loads). Therefore, the second line for each share class in the table is useful in comparing ongoing costs only, and will not help you determine the relative total costs of owning different funds. In addition, if these transactional costs were included, your costs would have been higher.
10
Expense Table – continued
| | | | | | | | | | | | | | | | | | |
Share
Class | | | | Annualized Expense Ratio | | | Beginning Account Value
3/01/17 | | | Ending Account Value 8/31/17 | | | Expenses Paid During Period (p) 3/01/17-8/31/17 | |
| A | | Actual | | | 1.09% | | | | $1,000.00 | | | | $1,145.02 | | | | $5.89 | |
| | Hypothetical (h) | | | 1.09% | | | | $1,000.00 | | | | $1,019.71 | | | | $5.55 | |
| B | | Actual | | | 1.84% | | | | $1,000.00 | | | | $1,140.99 | | | | $9.93 | |
| | Hypothetical (h) | | | 1.84% | | | | $1,000.00 | | | | $1,015.93 | | | | $9.35 | |
| C | | Actual | | | 1.84% | | | | $1,000.00 | | | | $1,140.66 | | | | $9.93 | |
| | Hypothetical (h) | | | 1.84% | | | | $1,000.00 | | | | $1,015.93 | | | | $9.35 | |
| I | | Actual | | | 0.85% | | | | $1,000.00 | | | | $1,146.43 | | | | $4.60 | |
| | Hypothetical (h) | | | 0.85% | | | | $1,000.00 | | | | $1,020.92 | | | | $4.33 | |
| R1 | | Actual | | | 1.84% | | | | $1,000.00 | | | | $1,140.53 | | | | $9.93 | |
| | Hypothetical (h) | | | 1.84% | | | | $1,000.00 | | | | $1,015.93 | | | | $9.35 | |
| R2 | | Actual | | | 1.34% | | | | $1,000.00 | | | | $1,144.07 | | | | $7.24 | |
| | Hypothetical (h) | | | 1.34% | | | | $1,000.00 | | | | $1,018.45 | | | | $6.82 | |
| R3 | | Actual | | | 1.09% | | | | $1,000.00 | | | | $1,145.22 | | | | $5.89 | |
| | Hypothetical (h) | | | 1.09% | | | | $1,000.00 | | | | $1,019.71 | | | | $5.55 | |
| R4 | | Actual | | | 0.85% | | | | $1,000.00 | | | | $1,146.73 | | | | $4.60 | |
| | Hypothetical (h) | | | 0.85% | | | | $1,000.00 | | | | $1,020.92 | | | | $4.33 | |
| R6 | | Actual | | | 0.76% | | | | $1,000.00 | | | | $1,147.02 | | | | $4.11 | |
| | Hypothetical (h) | | | 0.76% | | | | $1,000.00 | | | | $1,021.37 | | | | $3.87 | |
| 529A | | Actual | | | 1.12% | | | | $1,000.00 | | | | $1,145.06 | | | | $6.06 | |
| | Hypothetical (h) | | | 1.12% | | | | $1,000.00 | | | | $1,019.56 | | | | $5.70 | |
| 529B | | Actual | | | 1.89% | | | | $1,000.00 | | | | $1,139.85 | | | | $10.19 | |
| | Hypothetical (h) | | | 1.89% | | | | $1,000.00 | | | | $1,015.68 | | | | $9.60 | |
| 529C | | Actual | | | 1.88% | | | | $1,000.00 | | | | $1,140.98 | | | | $10.15 | |
| | Hypothetical (h) | | | 1.88% | | | | $1,000.00 | | | | $1,015.73 | | | | $9.55 | |
| (h) | 5% class return per year before expenses. |
| (p) | “Expenses Paid During Period” are equal to each class’s annualized expense ratio, as shown above, multiplied by the average account value over the period, multiplied by 184/365 (to reflect the one-half year period). Expenses paid do not include any applicable sales charges (loads). If these transaction costs had been included, your costs would have been higher. |
Notes to Expense Table
Each class with a Rule 12b-1 service fee is subject to a rebate of a portion of such fee. Such rebates are included in the expense ratios above. For Class 529A and Class 529C shares, this rebate reduced the expense ratios above by 0.02% and 0.01%, respectively. See Note 3 in the Notes to Financial Statements for additional information.
11
PORTFOLIO OF INVESTMENTS
8/31/17
The Portfolio of Investments is a complete list of all securities owned by your fund. It is categorized by broad-based asset classes.
| | | | | | | | |
| Common Stocks - 98.5% | | | | | | | | |
| Issuer | | Shares/Par | | | Value ($) | |
| Airlines - 0.7% | | | | | | | | |
| Aena S.A. | | | 123,521 | | | $ | 24,122,840 | |
| Malaysia Airports Holdings Berhad | | | 11,248,700 | | | | 23,706,428 | |
| | | | | | | | |
| | | | | | | $ | 47,829,268 | |
| Alcoholic Beverages - 0.5% | | | | | | | | |
| AmBev S.A., ADR | | | 5,837,664 | | | $ | 36,543,777 | |
| | |
| Apparel Manufacturers - 1.3% | | | | | | | | |
| LVMH Moet Hennessy Louis Vuitton SE | | | 359,069 | | | $ | 94,146,729 | |
| | |
| Automotive - 3.3% | | | | | | | | |
| GKN PLC | | | 19,229,531 | | | $ | 79,296,779 | |
| Koito Manufacturing Co. Ltd. | | | 1,217,700 | | | | 75,874,335 | |
| USS Co. Ltd. | | | 4,392,800 | | | | 86,349,577 | |
| | | | | | | | |
| | | | | | | $ | 241,520,691 | |
| Broadcasting - 0.9% | | | | | | | | |
| WPP PLC | | | 3,712,498 | | | $ | 68,168,997 | |
| | |
| Business Services - 3.2% | | | | | | | | |
| Amadeus IT Holding S.A. | | | 1,108,161 | | | $ | 68,691,318 | |
| Cerved Information Solutions S.p.A. | | | 1,822,697 | | | | 20,537,449 | |
| Cognizant Technology Solutions Corp., “A” | | | 1,530,089 | | | | 108,284,399 | |
| Nomura Research, Inc. | | | 981,400 | | | | 38,207,959 | |
| | | | | | | | |
| | | | | | | $ | 235,721,125 | |
| Chemicals - 0.6% | | | | | | | | |
| Orica Ltd. | | | 2,486,539 | | | $ | 40,185,778 | |
| | |
| Computer Software - 0.7% | | | | | | | | |
| Check Point Software Technologies Ltd. (a) | | | 457,375 | | | $ | 51,166,541 | |
| | |
| Computer Software - Systems - 0.6% | | | | | | | | |
| EPAM Systems, Inc. (a) | | | 535,506 | | | $ | 43,552,703 | |
| | |
| Construction - 2.0% | | | | | | | | |
| Techtronic Industries Co. Ltd. | | | 12,825,500 | | | $ | 66,374,820 | |
| Toto Ltd. | | | 2,043,300 | | | | 77,784,241 | |
| | | | | | | | |
| | | | | | | $ | 144,159,061 | |
12
Portfolio of Investments – continued
| | | | | | | | |
| Issuer | | Shares/Par | | | Value ($) | |
| Common Stocks - continued | | | | | | | | |
| Consumer Products - 3.0% | | | | | | | | |
| L’Oréal | | | 457,419 | | | $ | 96,573,240 | |
| Reckitt Benckiser Group PLC | | | 1,336,578 | | | | 126,721,148 | |
| | | | | | | | |
| | | | | | | $ | 223,294,388 | |
| Consumer Services - 0.3% | | | | | | | | |
| Ctrip.com International Ltd., ADR (a) | | | 440,564 | | | $ | 22,667,018 | |
| | |
| Containers - 1.1% | | | | | | | | |
| Brambles Ltd. | | | 11,142,376 | | | $ | 82,464,536 | |
| | |
| Electrical Equipment - 2.6% | | | | | | | | |
| Legrand S.A. | | | 595,241 | | | $ | 41,722,666 | |
| Schneider Electric S.A. | | | 1,827,771 | | | | 147,371,758 | |
| | | | | | | | |
| | | | | | | $ | 189,094,424 | |
| Electronics - 2.7% | | | | | | | | |
| Broadcom Corp. | | | 176,484 | | | $ | 44,486,322 | |
| Mellanox Technologies Ltd. (a) | | | 873,653 | | | | 41,018,009 | |
| Samsung Electronics Co. Ltd. | | | 18,447 | | | | 37,888,659 | |
| Taiwan Semiconductor Manufacturing Co. Ltd. | | | 10,754,326 | | | | 77,150,057 | |
| | | | | | | | |
| | | | | | | $ | 200,543,047 | |
| Energy - Independent - 1.3% | | | | | | | | |
| Cairn Energy PLC (a) | | | 9,703,593 | | | $ | 21,519,344 | |
| Caltex Australia Ltd. | | | 1,528,318 | | | | 40,566,718 | |
| Oil Search Ltd. | | | 6,932,174 | | | | 36,977,003 | |
| | | | | | | | |
| | | | | | | $ | 99,063,065 | |
| Energy - Integrated - 2.9% | | | | | | | | |
| BP PLC | | | 16,493,314 | | | $ | 94,939,434 | |
| Eni S.p.A. | | | 3,945,157 | | | | 61,853,100 | |
| Galp Energia SGPS S.A., “B” | | | 3,322,811 | | | | 55,022,989 | |
| | | | | | | | |
| | | | | | | $ | 211,815,523 | |
| Food & Beverages - 5.1% | | | | | | | | |
| Danone S.A. | | | 1,610,548 | | | $ | 126,827,937 | |
| Nestle S.A. | | | 2,972,169 | | | | 252,136,137 | |
| | | | | | | | |
| | | | | | | $ | 378,964,074 | |
| Food & Drug Stores - 1.3% | | | | | | | | |
| Clicks Group Ltd. | | | 1,697,772 | | | $ | 19,419,888 | |
| Sundrug Co. Ltd. | | | 1,760,000 | | | | 72,923,091 | |
| | | | | | | | |
| | | | | | | $ | 92,342,979 | |
13
Portfolio of Investments – continued
| | | | | | | | |
| Issuer | | Shares/Par | | | Value ($) | |
| Common Stocks - continued | | | | | | | | |
| Gaming & Lodging - 0.5% | | | | | | | | |
| Paddy Power Betfair PLC | | | 377,015 | | | $ | 33,224,375 | |
| | |
| General Merchandise - 0.5% | | | | | | | | |
| Dollarama, Inc. | | | 405,636 | | | $ | 39,977,275 | |
| | |
| Insurance - 6.6% | | | | | | | | |
| AIA Group Ltd. | | | 20,063,200 | | | $ | 153,952,677 | |
| AMP Ltd. | | | 13,114,450 | | | | 53,169,183 | |
| Aon PLC | | | 529,443 | | | | 73,677,288 | |
| Hiscox Ltd. | | | 3,937,846 | | | | 65,076,159 | |
| Swiss Re Ltd. | | | 580,125 | | | | 52,540,650 | |
| Zurich Insurance Group AG | | | 304,647 | | | | 91,144,715 | |
| | | | | | | | |
| | | | | | | $ | 489,560,672 | |
| Internet - 1.6% | | | | | | | | |
| Alibaba Group Holding Ltd., ADR (a) | | | 384,305 | | | $ | 66,000,541 | |
| NAVER Corp. | | | 65,560 | | | | 43,896,595 | |
| Scout24 AG | | | 195,612 | | | | 7,876,707 | |
| | | | | | | | |
| | | | | | | $ | 117,773,843 | |
| Machinery & Tools - 5.1% | | | | | | | | |
| Daikin Industries Ltd. | | | 948,200 | | | $ | 94,832,938 | |
| GEA Group AG | | | 1,656,726 | | | | 72,973,272 | |
| Kubota Corp. | | | 5,956,400 | | | | 103,160,828 | |
| Ritchie Bros. Auctioneers, Inc. | | | 1,072,247 | | | | 31,873,320 | |
| Schindler Holding AG | | | 355,416 | | | | 76,127,479 | |
| | | | | | | | |
| | | | | | | $ | 378,967,837 | |
| Major Banks - 6.2% | | | | | | | | |
| Barclays PLC | | | 27,342,629 | | | $ | 67,566,791 | |
| BNP Paribas | | | 1,542,389 | | | | 117,347,582 | |
| Erste Group Bank AG | | | 1,377,305 | | | | 58,198,087 | |
| Sumitomo Mitsui Financial Group, Inc. | | | 2,035,000 | | | | 76,154,000 | |
| UBS AG | | | 8,275,565 | | | | 136,351,141 | |
| | | | | | | | |
| | | | | | | $ | 455,617,601 | |
| Medical Equipment - 0.7% | | | | | | | | |
| Terumo Corp. | | | 1,399,200 | | | $ | 54,091,963 | |
| | |
| Metals & Mining - 1.3% | | | | | | | | |
| Rio Tinto Ltd. | | | 1,987,871 | | | $ | 96,304,431 | |
| | |
| Natural Gas - Distribution - 0.6% | | | | | | | | |
| China Resources Gas Group Ltd. | | | 11,442,000 | | | $ | 40,353,857 | |
14
Portfolio of Investments – continued
| | | | | | | | |
| Issuer | | Shares/Par | | | Value ($) | |
| Common Stocks - continued | | | | | | | | |
| Natural Gas - Pipeline - 1.1% | | | | | | | | |
| APA Group | | | 5,047,804 | | | $ | 35,552,974 | |
| Enbridge, Inc. | | | 1,220,431 | | | | 48,787,920 | |
| | | | | | | | |
| | | | | | | $ | 84,340,894 | |
| Network & Telecom - 0.5% | | | | | | | | |
| LM Ericsson Telephone Co., “B” | | | 5,986,924 | | | $ | 35,089,331 | |
| | |
| Oil Services - 0.4% | | | | | | | | |
| Schlumberger Ltd. | | | 513,703 | | | $ | 32,625,278 | |
| | |
| Other Banks & Diversified Financials - 8.8% | | | | | | | | |
| Aeon Credit Service Co. Ltd. | | | 4,055,100 | | | $ | 85,982,063 | |
| Allied Irish Banks PLC | | | 10,034,021 | | | | 59,796,706 | |
| DnB NOR A.S.A. | | | 3,807,955 | | | | 74,363,096 | |
| HDFC Bank Ltd. | | | 2,085,107 | | | | 57,987,184 | |
| Intesa Sanpaolo S.p.A. | | | 26,492,734 | | | | 89,442,600 | |
| Julius Baer Group Ltd. | | | 1,282,180 | | | | 71,666,769 | |
| Jyske Bank A.S. | | | 689,334 | | | | 41,476,890 | |
| KBC Groep N.V. | | | 900,382 | | | | 73,990,521 | |
| Mastercard, Inc., “A” | | | 717,506 | | | | 95,643,550 | |
| | | | | | | | |
| | | | | | | $ | 650,349,379 | |
| Pharmaceuticals - 9.3% | | | | | | | | |
| Bayer AG | | | 1,567,281 | | | $ | 200,570,354 | |
| Novartis AG | | | 763,262 | | | | 64,391,153 | |
| Novo Nordisk A.S., “B” | | | 1,535,584 | | | | 73,247,702 | |
| Roche Holding AG | | | 857,133 | | | | 217,646,265 | |
| Santen Pharmaceutical Co. Ltd. | | | 6,718,500 | | | | 104,259,435 | |
| Shionogi & Co. Ltd. | | | 448,000 | | | | 23,615,409 | |
| | | | | | | | |
| | | | | | | $ | 683,730,318 | |
| Printing & Publishing - 1.4% | | | | | | | | |
| RELX N.V. | | | 4,839,196 | | | $ | 101,592,134 | |
| | |
| Real Estate - 3.1% | | | | | | | | |
| Grand City Properties S.A. | | | 3,293,371 | | | $ | 71,746,902 | |
| LEG Immobilien AG | | | 1,062,906 | | | | 107,427,126 | |
| Mitsui Fudosan Co. Ltd. | | | 2,371,800 | | | | 51,304,320 | |
| | | | | | | | |
| | | | | | | $ | 230,478,348 | |
| Specialty Chemicals - 6.7% | | | | | | | | |
| Akzo Nobel N.V. | | | 1,360,947 | | | $ | 124,426,774 | |
| Croda International PLC | | | 1,621,617 | | | | 80,563,436 | |
| Linde AG | | | 611,728 | | | | 117,281,766 | |
15
Portfolio of Investments – continued
| | | | | | | | |
| Issuer | | Shares/Par | | | Value ($) | |
| Common Stocks - continued | | | | | | | | |
| Specialty Chemicals - continued | | | | | | | | |
| Nippon Paint Holdings Co. Ltd. | | | 1,154,900 | | | $ | 39,394,870 | |
| Sika AG | | | 10,681 | | | | 75,739,924 | |
| Symrise AG | | | 826,365 | | | | 60,402,052 | |
| | | | | | | | |
| | | | | | | $ | 497,808,822 | |
| Specialty Stores - 1.5% | | | | | | | | |
| Esprit Holdings Ltd. (a) | | | 15,455,500 | | | $ | 8,946,544 | |
| JD.com, Inc., ADR (a) | | | 873,059 | | | | 36,589,902 | |
| Just Eat PLC (a) | | | 4,197,579 | | | | 36,149,762 | |
| Ryohin Keikaku Co. Ltd. | | | 110,700 | | | | 30,712,239 | |
| | | | | | | | |
| | | | | | | $ | 112,398,447 | |
| Telecommunications - Wireless - 4.1% | | | | | | | | |
| Advanced Info Service PLC | | | 8,332,500 | | | $ | 47,051,461 | |
| Cellnex Telecom S.A.U. | | | 2,622,778 | | | | 58,589,732 | |
| KDDI Corp. | | | 3,749,400 | | | | 101,191,338 | |
| SoftBank Corp. | | | 944,000 | | | | 76,612,253 | |
| Vodafone Group PLC | | | 7,187,867 | | | | 20,578,323 | |
| | | | | | | | |
| | | | | | | $ | 304,023,107 | |
| Telephone Services - 0.4% | | | | | | | | |
| Com Hem Holding AB | | | 1,971,087 | | | $ | 29,371,261 | |
| | |
| Tobacco - 1.3% | | | | | | | | |
| Japan Tobacco, Inc. | | | 2,813,300 | | | $ | 96,322,929 | |
| | |
| Trucking - 0.9% | | | | | | | | |
| Yamato Holdings Co. Ltd. | | | 2,970,400 | | | $ | 63,333,948 | |
| | |
| Utilities - Electric Power - 1.8% | | | | | | | | |
| CLP Holdings Ltd. | | | 4,865,500 | | | $ | 51,385,947 | |
| Enel S.p.A. | | | 13,984,606 | | | | 84,654,997 | |
| | | | | | | | |
| | | | | | | $ | 136,040,944 | |
| Total Common Stocks (Identified Cost, $6,426,596,670) | | | | | | $ | 7,266,620,718 | |
| | |
| Investment Companies (h) - 1.3% | | | | | | | | |
| Money Market Funds - 1.3% | | | | | | | | |
MFS Institutional Money Market Portfolio, 1.11% (v)
(Identified Cost, $97,839,502) | | | 97,839,200 | | | $ | 97,839,200 | |
| | |
| Other Assets, Less Liabilities - 0.2% | | | | | | | 16,708,647 | |
| Net Assets - 100.0% | | | | | | $ | 7,381,168,565 | |
16
Portfolio of Investments – continued
| (a) | Non-income producing security. |
| (h) | An affiliated issuer may be considered one in which the fund owns 5% or more of the outstanding voting securities, or a company which is under common control. At period end, the aggregate values of the fund’s investments in affiliated issuers and in unaffiliated issuers were $97,839,200 and $7,266,620,718, respectively. |
| (v) | Affiliated issuer that is available only to investment companies managed by MFS. The rate quoted for the MFS Institutional Money Market Portfolio is the annualized seven-day yield of the fund at period end. |
The following abbreviations are used in this report and are defined:
| ADR | | American Depositary Receipt |
| PLC | | Public Limited Company |
See Notes to Financial Statements
17
Financial Statements
STATEMENT OF ASSETS AND LIABILITIES
At 8/31/17
This statement represents your fund’s balance sheet, which details the assets and liabilities comprising the total value of the fund.
| | | | |
| Assets | | | | |
Investments in unaffiliated issuers, at value (identified cost, $6,426,596,670) | | | $7,266,620,718 | |
Investments in affiliated issuers, at value (identified cost, $97,839,502) | | | 97,839,200 | |
Cash | | | 320,096 | |
Foreign currency, at value (identified cost, $1,187,910) | | | 1,185,531 | |
Receivables for | | | | |
Investments sold | | | 62,893,466 | |
Fund shares sold | | | 14,451,986 | |
Interest and dividends | | | 29,890,856 | |
Other assets | | | 6,251 | |
Total assets | | | $7,473,208,104 | |
| Liabilities | | | | |
Payables for | | | | |
Investments purchased | | | $82,513,413 | |
Fund shares reacquired | | | 6,798,467 | |
Payable to affiliates | | | | |
Investment adviser | | | 284,978 | |
Shareholder servicing costs | | | 703,526 | |
Distribution and service fees | | | 16,569 | |
Program manager fee | | | 40 | |
Payable for independent Trustees’ compensation | | | 644 | |
Deferred country tax expense payable | | | 725,177 | |
Accrued expenses and other liabilities | | | 996,725 | |
Total liabilities | | | $92,039,539 | |
Net assets | | | $7,381,168,565 | |
| Net assets consist of | | | | |
Paid-in capital | | | $6,843,431,250 | |
Unrealized appreciation (depreciation) (net of $725,177 deferred country tax) | | | 839,968,033 | |
Accumulated net realized gain (loss) | | | (409,272,603 | ) |
Undistributed net investment income | | | 107,041,885 | |
Net assets | | | $7,381,168,565 | |
Shares of beneficial interest outstanding | | | 405,965,613 | |
18
Statement of Assets and Liabilities – continued
| | | | | | | | | | | | |
| | | Net assets | | | Shares
outstanding | | | Net asset value
per share (a) | |
| Class A | | | $693,537,910 | | | | 38,181,745 | | | | $18.16 | |
| Class B | | | 6,228,407 | | | | 356,332 | | | | 17.48 | |
| Class C | | | 48,570,384 | | | | 2,852,077 | | | | 17.03 | |
| Class I | | | 1,099,133,776 | | | | 58,495,416 | | | | 18.79 | |
| Class R1 | | | 2,089,101 | | | | 124,344 | | | | 16.80 | |
| Class R2 | | | 132,988,185 | | | | 7,579,335 | | | | 17.55 | |
| Class R3 | | | 91,653,482 | | | | 5,098,289 | | | | 17.98 | |
| Class R4 | | | 63,884,478 | | | | 3,508,653 | | | | 18.21 | |
| Class R6 | | | 5,228,376,667 | | | | 288,926,275 | | | | 18.10 | |
| Class 529A | | | 10,464,475 | | | | 586,570 | | | | 17.84 | |
| Class 529B | | | 386,101 | | | | 22,990 | | | | 16.79 | |
| Class 529C | | | 3,855,599 | | | | 233,587 | | | | 16.51 | |
| (a) | Maximum offering price per share was equal to the net asset value per share for all share classes, except for Classes A and 529A, for which the maximum offering prices per share were $19.27 [100 / 94.25 x $18.16] and $18.93 [100 / 94.25 x $17.84], respectively. On sales of $50,000 or more, the maximum offering prices of Class A and Class 529A shares are reduced. A contingent deferred sales charge may be imposed on redemptions of Class A, Class B, Class C, Class 529B, and Class 529C shares. Redemption price per share was equal to the net asset value per share for Classes I, R1, R2, R3, R4, R6, and 529A. |
See Notes to Financial Statements
19
Financial Statements
STATEMENT OF OPERATIONS
Year ended 8/31/17
This statement describes how much your fund earned in investment income and accrued in expenses. It also describes any gains and/or losses generated by fund operations.
| | | | |
| Net investment income (loss) | | | | |
Income | | | | |
Dividends | | | $183,683,643 | |
Income on securities loaned | | | 668,816 | |
Dividends from affiliated issuers | | | 385,762 | |
Other | | | 15,945 | |
Interest | | | 8,258 | |
Foreign taxes withheld | | | (16,018,631 | ) |
Total investment income | | | $168,743,793 | |
Expenses | | | | |
Management fee | | | $48,656,249 | |
Distribution and service fees | | | 3,646,555 | |
Shareholder servicing costs | | | 3,575,321 | |
Program manager fees | | | 13,380 | |
Administrative services fee | | | 640,808 | |
Independent Trustees’ compensation | | | 98,191 | |
Custodian fee | | | 948,531 | |
Reimbursement of custodian expenses | | | (222,629 | ) |
Shareholder communications | | | 826,044 | |
Audit and tax fees | | | 89,809 | |
Legal fees | | | 71,016 | |
Miscellaneous | | | 329,827 | |
Total expenses | | | $58,673,102 | |
Reduction of expenses by investment adviser and distributor | | | (977,161 | ) |
Net expenses | | | $57,695,941 | |
Net investment income (loss) | | | $111,047,852 | |
| Realized and unrealized gain (loss) | | | | |
Realized gain (loss) (identified cost basis) | | | | |
Unaffiliated issuers (net of $8,127 country tax) | | | $149,964,726 | |
Affiliated issuers | | | (3,870 | ) |
Foreign currency | | | (2,824,133 | ) |
Net realized gain (loss) | | | $147,136,723 | |
Change in unrealized appreciation (depreciation) | | | | |
Unaffiliated issuers (net of $725,177 increase in deferred country tax) | | | $805,420,965 | |
Affiliated issuers | | | (302 | ) |
Translation of assets and liabilities in foreign currencies | | | 825,381 | |
Net unrealized gain (loss) | | | $806,246,044 | |
Net realized and unrealized gain (loss) | | | $953,382,767 | |
Change in net assets from operations | | | $1,064,430,619 | |
See Notes to Financial Statements
20
Financial Statements
STATEMENTS OF CHANGES IN NET ASSETS
These statements describe the increases and/or decreases in net assets resulting from operations, any distributions, and any shareholder transactions.
| | | | | | | | |
| | | Year ended | |
| | | 8/31/17 | | | 8/31/16 | |
| Change in net assets | | | | | | |
| From operations | | | | | | | | |
Net investment income (loss) | | | $111,047,852 | | | | $123,556,405 | |
Net realized gain (loss) | | | 147,136,723 | | | | (194,900,147 | ) |
Net unrealized gain (loss) | | | 806,246,044 | | | | (41,757,937 | ) |
Change in net assets from operations | | | $1,064,430,619 | | | | $(113,101,679 | ) |
| Distributions declared to shareholders | | | | | | | | |
From net investment income | | | $(123,095,420 | ) | | | $(126,270,222 | ) |
Change in net assets from fund share transactions | | | $1,950,464 | | | | $(697,216,021 | ) |
Total change in net assets | | | $943,285,663 | | | | $(936,587,922 | ) |
| Net assets | | | | | | | | |
At beginning of period | | | 6,437,882,902 | | | | 7,374,470,824 | |
At end of period (including undistributed net investment income of $107,041,885 and $121,964,273, respectively) | | | $7,381,168,565 | | | | $6,437,882,902 | |
See Notes to Financial Statements
21
Financial Statements
FINANCIAL HIGHLIGHTS
The financial highlights table is intended to help you understand the fund’s financial performance for the past 5 years. Certain information reflects financial results for a single fund share. The total returns in the table represent the rate that an investor would have earned (or lost) on an investment in the fund share class (assuming reinvestment of all distributions) held for the entire period.
| | | | | | | | | | | | | | | | | | | | |
| Class A | | Year ended | |
| | | 8/31/17 | | | 8/31/16 | | | 8/31/15 | | | 8/31/14 | | | 8/31/13 | |
Net asset value, beginning of period | | | $15.83 | | | | $16.34 | | | | $18.06 | | | | $16.25 | | | | $14.25 | |
| Income (loss) from investment operations | | | | | | | | | | | | | | | | | |
Net investment income (loss) (d) | | | $0.20 | (c) | | | $0.25 | | | | $0.26 | | | | $0.40 | | | | $0.26 | |
Net realized and unrealized gain (loss) | | | 2.39 | | | | (0.50 | ) | | | (1.60 | ) | | | 1.64 | | | | 2.01 | |
Total from investment operations | | | $2.59 | | | | $(0.25 | ) | | | $(1.34 | ) | | | $2.04 | | | | $2.27 | |
| Less distributions declared to shareholders | |
From net investment income | | | $(0.26 | ) | | | $(0.26 | ) | | | $(0.38 | ) | | | $(0.23 | ) | | | $(0.27 | ) |
Net asset value, end of period (x) | | | $18.16 | | | | $15.83 | | | | $16.34 | | | | $18.06 | | | | $16.25 | |
Total return (%) (r)(s)(t)(x) | | | 16.66 | (c) | | | (1.50 | ) | | | (7.44 | ) | | | 12.60 | | | | 16.08 | |
Ratios (%) (to average net assets)
and Supplemental data: | | | | | | | | | | | | | | | | | |
Expenses before expense reductions (f) | | | 1.12 | (c) | | | 1.14 | | | | 1.13 | | | | 1.13 | | | | 1.18 | |
Expenses after expense reductions (f) | | | 1.10 | (c) | | | 1.11 | | | | 1.09 | | | | 1.11 | | | | 1.18 | |
Net investment income (loss) | | | 1.25 | (c) | | | 1.62 | | | | 1.53 | | | | 2.24 | | | | 1.65 | |
Portfolio turnover | | | 33 | | | | 40 | | | | 28 | | | | 27 | | | | 32 | |
Net assets at end of period (000 omitted) | | | $693,538 | | | | $971,630 | | | | $1,178,013 | | | | $1,184,927 | | | | $1,108,795 | |
See Notes to Financial Statements
22
Financial Highlights – continued
| | | | | | | | | | | | | | | | | | | | |
| Class B | | Year ended | |
| | | 8/31/17 | | | 8/31/16 | | | 8/31/15 | | | 8/31/14 | | | 8/31/13 | |
Net asset value, beginning of period | | | $15.21 | | | | $15.65 | | | | $17.26 | | | | $15.52 | | | | $13.59 | |
| Income (loss) from investment operations | | | | | | | | | | | | | | | | | |
Net investment income (loss) (d) | | | $0.10 | (c) | | | $0.12 | | | | $0.12 | | | | $0.25 | | | | $0.12 | |
Net realized and unrealized gain (loss) | | | 2.28 | | | | (0.47 | ) | | | (1.52 | ) | | | 1.57 | | | | 1.94 | |
Total from investment operations | | | $2.38 | | | | $(0.35 | ) | | | $(1.40 | ) | | | $1.82 | | | | $2.06 | |
| Less distributions declared to shareholders | |
From net investment income | | | $(0.11 | ) | | | $(0.09 | ) | | | $(0.21 | ) | | | $(0.08 | ) | | | $(0.13 | ) |
Net asset value, end of period (x) | | | $17.48 | | | | $15.21 | | | | $15.65 | | | | $17.26 | | | | $15.52 | |
Total return (%) (r)(s)(t)(x) | | | 15.77 | (c) | | | (2.20 | ) | | | (8.15 | ) | | | 11.77 | | | | 15.27 | |
Ratios (%) (to average net assets)
and Supplemental data: | | | | | | | | | | | | | | | | | |
Expenses before expense reductions (f) | | | 1.87 | (c) | | | 1.89 | | | | 1.88 | | | | 1.88 | | | | 1.93 | |
Expenses after expense reductions (f) | | | 1.85 | (c) | | | 1.86 | | | | 1.84 | | | | 1.86 | | | | 1.93 | |
Net investment income (loss) | | | 0.61 | (c) | | | 0.82 | | | | 0.70 | | | | 1.46 | | | | 0.83 | |
Portfolio turnover | | | 33 | | | | 40 | | | | 28 | | | | 27 | | | | 32 | |
Net assets at end of period (000 omitted) | | | $6,228 | | | | $7,967 | | | | $11,228 | | | | $16,932 | | | | $19,751 | |
| |
| Class C | | Year ended | |
| | | 8/31/17 | | | 8/31/16 | | | 8/31/15 | | | 8/31/14 | | | 8/31/13 | |
Net asset value, beginning of period | | | $14.85 | | | | $15.31 | | | | $16.93 | | | | $15.26 | | | | $13.39 | |
| Income (loss) from investment operations | | | | | | | | | | | | | | | | | |
Net investment income (loss) (d) | | | $0.10 | (c) | | | $0.12 | | | | $0.12 | | | | $0.25 | | | | $0.13 | |
Net realized and unrealized gain (loss) | | | 2.21 | | | | (0.45 | ) | | | (1.50 | ) | | | 1.54 | | | | 1.90 | |
Total from investment operations | | | $2.31 | | | | $(0.33 | ) | | | $(1.38 | ) | | | $1.79 | | | | $2.03 | |
| Less distributions declared to shareholders | |
From net investment income | | | $(0.13 | ) | | | $(0.13 | ) | | | $(0.24 | ) | | | $(0.12 | ) | | | $(0.16 | ) |
Net asset value, end of period (x) | | | $17.03 | | | | $14.85 | | | | $15.31 | | | | $16.93 | | | | $15.26 | |
Total return (%) (r)(s)(t)(x) | | | 15.74 | (c) | | | (2.16 | ) | | | (8.17 | ) | | | 11.74 | | | | 15.22 | |
Ratios (%) (to average net assets)
and Supplemental data: | | | | | | | | | | | | | | | | | |
Expenses before expense reductions (f) | | | 1.87 | (c) | | | 1.89 | | | | 1.88 | | | | 1.88 | | | | 1.93 | |
Expenses after expense reductions (f) | | | 1.85 | (c) | | | 1.86 | | | | 1.84 | | | | 1.86 | | | | 1.93 | |
Net investment income (loss) | | | 0.64 | (c) | | | 0.85 | | | | 0.76 | | | | 1.50 | | | | 0.87 | |
Portfolio turnover | | | 33 | | | | 40 | | | | 28 | | | | 27 | | | | 32 | |
Net assets at end of period (000 omitted) | | | $48,570 | | | | $62,124 | | | | $77,442 | | | | $91,487 | | | | $86,793 | |
See Notes to Financial Statements
23
Financial Highlights – continued
| | | | | | | | | | | | | | | | | | | | |
| Class I | | Year ended | |
| | | 8/31/17 | | | 8/31/16 | | | 8/31/15 | | | 8/31/14 | | | 8/31/13 | |
Net asset value, beginning of period | | | $16.38 | | | | $16.90 | | | | $18.66 | | | | $16.78 | | | | $14.71 | |
| Income (loss) from investment operations | | | | | |
Net investment income (loss) (d) | | | $0.30 | (c) | | | $0.30 | | | | $0.32 | | | | $0.46 | | | | $0.31 | |
Net realized and unrealized gain (loss) | | | 2.42 | | | | (0.51 | ) | | | (1.66 | ) | | | 1.69 | | | | 2.06 | |
Total from investment operations | | | $2.72 | | | | $(0.21 | ) | | | $(1.34 | ) | | | $2.15 | | | | $2.37 | |
| Less distributions declared to shareholders | |
From net investment income | | | $(0.31 | ) | | | $(0.31 | ) | | | $(0.42 | ) | | | $(0.27 | ) | | | $(0.30 | ) |
Net asset value, end of period (x) | | | $18.79 | | | | $16.38 | | | | $16.90 | | | | $18.66 | | | | $16.78 | |
Total return (%) (r)(s)(t)(x) | | | 16.95 | (c) | | | (1.24 | ) | | | (7.19 | ) | | | 12.89 | | | | 16.32 | |
Ratios (%) (to average net assets)
and Supplemental data: | | | | | | | | | | | | | | | | | |
Expenses before expense reductions (f) | | | 0.87 | (c) | | | 0.89 | | | | 0.88 | | | | 0.88 | | | | 0.93 | |
Expenses after expense reductions (f) | | | 0.86 | (c) | | | 0.86 | | | | 0.84 | | | | 0.86 | | | | 0.93 | |
Net investment income (loss) | | | 1.79 | (c) | | | 1.86 | | | | 1.80 | | | | 2.51 | | | | 1.89 | |
Portfolio turnover | | | 33 | | | | 40 | | | | 28 | | | | 27 | | | | 32 | |
Net assets at end of period (000 omitted) | | | $1,099,134 | | | | $2,187,011 | | | | $2,410,936 | | | | $2,194,432 | | | | $1,834,498 | |
| |
| Class R1 | | Year ended | |
| | | 8/31/17 | | | 8/31/16 | | | 8/31/15 | | | 8/31/14 | | | 8/31/13 | |
Net asset value, beginning of period | | | $14.63 | | | | $15.08 | | | | $16.69 | | | | $15.02 | | | | $13.17 | |
| Income (loss) from investment operations | | | | | | | | | | | | | | | | | |
Net investment income (loss) (d) | | | $0.09 | (c) | | | $0.11 | | | | $0.11 | | | | $0.24 | | | | $0.12 | |
Net realized and unrealized gain (loss) | | | 2.20 | | | | (0.44 | ) | | | (1.47 | ) | | | 1.52 | | | | 1.87 | |
Total from investment operations | | | $2.29 | | | | $(0.33 | ) | | | $(1.36 | ) | | | $1.76 | | | | $1.99 | |
| Less distributions declared to shareholders | |
From net investment income | | | $(0.12 | ) | | | $(0.12 | ) | | | $(0.25 | ) | | | $(0.09 | ) | | | $(0.14 | ) |
Net asset value, end of period (x) | | | $16.80 | | | | $14.63 | | | | $15.08 | | | | $16.69 | | | | $15.02 | |
Total return (%) (r)(s)(t)(x) | | | 15.79 | (c) | | | (2.19 | ) | | | (8.18 | ) | | | 11.73 | | | | 15.24 | |
Ratios (%) (to average net assets)
and Supplemental data: | | | | | | | | | | | | | | | | | |
Expenses before expense reductions (f) | | | 1.87 | (c) | | | 1.89 | | | | 1.88 | | | | 1.88 | | | | 1.93 | |
Expenses after expense reductions (f) | | | 1.85 | (c) | | | 1.86 | | | | 1.84 | | | | 1.86 | | | | 1.93 | |
Net investment income (loss) | | | 0.61 | (c) | | | 0.78 | | | | 0.72 | | | | 1.47 | | | | 0.85 | |
Portfolio turnover | | | 33 | | | | 40 | | | | 28 | | | | 27 | | | | 32 | |
Net assets at end of period (000 omitted) | | | $2,089 | | | | $2,418 | | | | $3,509 | | | | $4,243 | | | | $4,034 | |
See Notes to Financial Statements
24
Financial Highlights – continued
| | | | | | | | | | | | | | | | | | | | |
| Class R2 | | Year ended | |
| | | 8/31/17 | | | 8/31/16 | | | 8/31/15 | | | 8/31/14 | | | 8/31/13 | |
Net asset value, beginning of period | | | $15.31 | | | | $15.80 | | | | $17.48 | | | | $15.75 | | | | $13.83 | |
| Income (loss) from investment operations | | | | | | | | | | | | | | | | | |
Net investment income (loss) (d) | | | $0.17 | (c) | | | $0.21 | | | | $0.22 | | | | $0.36 | | | | $0.21 | |
Net realized and unrealized gain (loss) | | | 2.30 | | | | (0.48 | ) | | | (1.56 | ) | | | 1.57 | | | | 1.95 | |
Total from investment operations | | | $2.47 | | | | $(0.27 | ) | | | $(1.34 | ) | | | $1.93 | | | | $2.16 | |
| Less distributions declared to shareholders | |
From net investment income | | | $(0.23 | ) | | | $(0.22 | ) | | | $(0.34 | ) | | | $(0.20 | ) | | | $(0.24 | ) |
Net asset value, end of period (x) | | | $17.55 | | | | $15.31 | | | | $15.80 | | | | $17.48 | | | | $15.75 | |
Total return (%) (r)(s)(t)(x) | | | 16.37 | (c) | | | (1.69 | ) | | | (7.69 | ) | | | 12.32 | | | | 15.79 | |
Ratios (%) (to average net assets)
and Supplemental data: | | | | | | | | | | | | | | | | | |
Expenses before expense reductions (f) | | | 1.37 | (c) | | | 1.39 | | | | 1.38 | | | | 1.38 | | | | 1.43 | |
Expenses after expense reductions (f) | | | 1.35 | (c) | | | 1.36 | | | | 1.34 | | | | 1.36 | | | | 1.43 | |
Net investment income (loss) | | | 1.10 | (c) | | | 1.38 | | | | 1.29 | | | | 2.06 | | | | 1.41 | |
Portfolio turnover | | | 33 | | | | 40 | | | | 28 | | | | 27 | | | | 32 | |
Net assets at end of period (000 omitted) | | | $132,988 | | | | $152,133 | | | | $169,812 | | | | $182,466 | | | | $136,444 | |
| |
| Class R3 | | Year ended | |
| | | 8/31/17 | | | 8/31/16 | | | 8/31/15 | | | 8/31/14 | | | 8/31/13 | |
Net asset value, beginning of period | | | $15.67 | | | | $16.16 | | | | $17.86 | | | | $16.08 | | | | $14.10 | |
| Income (loss) from investment operations | | | | | | | | | | | | | | | | | |
Net investment income (loss) (d) | | | $0.22 | (c) | | | $0.24 | | | | $0.25 | | | | $0.40 | | | | $0.25 | |
Net realized and unrealized gain (loss) | | | 2.35 | | | | (0.48 | ) | | | (1.58 | ) | | | 1.61 | | | | 2.00 | |
Total from investment operations | | | $2.57 | | | | $(0.24 | ) | | | $(1.33 | ) | | | $2.01 | | | | $2.25 | |
| Less distributions declared to shareholders | |
From net investment income | | | $(0.26 | ) | | | $(0.25 | ) | | | $(0.37 | ) | | | $(0.23 | ) | | | $(0.27 | ) |
Net asset value, end of period (x) | | | $17.98 | | | | $15.67 | | | | $16.16 | | | | $17.86 | | | | $16.08 | |
Total return (%) (r)(s)(t)(x) | | | 16.67 | (c) | | | (1.47 | ) | | | (7.44 | ) | | | 12.56 | | | | 16.13 | |
Ratios (%) (to average net assets)
and Supplemental data: | | | | | | | | | | | | | | | | | |
Expenses before expense reductions (f) | | | 1.12 | (c) | | | 1.14 | | | | 1.13 | | | | 1.13 | | | | 1.18 | |
Expenses after expense reductions (f) | | | 1.10 | (c) | | | 1.11 | | | | 1.09 | | | | 1.11 | | | | 1.18 | |
Net investment income (loss) | | | 1.37 | (c) | | | 1.59 | | | | 1.46 | | | | 2.28 | | | | 1.63 | |
Portfolio turnover | | | 33 | | | | 40 | | | | 28 | | | | 27 | | | | 32 | |
Net assets at end of period (000 omitted) | | | $91,653 | | | | $126,980 | | | | $165,656 | | | | $229,232 | | | | $195,358 | |
See Notes to Financial Statements
25
Financial Highlights – continued
| | | | | | | | | | | | | | | | | | | | |
| Class R4 | | Year ended | |
| | | 8/31/17 | | | 8/31/16 | | | 8/31/15 | | | 8/31/14 | | | 8/31/13 | |
Net asset value, beginning of period | | | $15.86 | | | | $16.36 | | | | $18.09 | | | | $16.27 | | | | $14.26 | |
| Income (loss) from investment operations | | | | | | | | | | | | | | | | | |
Net investment income (loss) (d) | | | $0.28 | (c) | | | $0.30 | | | | $0.29 | | | | $0.45 | | | | $0.25 | |
Net realized and unrealized gain (loss) | | | 2.35 | | | | (0.50 | ) | | | (1.60 | ) | | | 1.63 | | | | 2.06 | |
Total from investment operations | | | $2.63 | | | | $(0.20 | ) | | | $(1.31 | ) | | | $2.08 | | | | $2.31 | |
| Less distributions declared to shareholders | |
From net investment income | | | $(0.28 | ) | | | $(0.30 | ) | | | $(0.42 | ) | | | $(0.26 | ) | | | $(0.30 | ) |
Net asset value, end of period (x) | | | $18.21 | | | | $15.86 | | | | $16.36 | | | | $18.09 | | | | $16.27 | |
Total return (%) (r)(s)(t)(x) | | | 16.92 | (c) | | | (1.20 | ) | | | (7.26 | ) | | | 12.87 | | | | 16.42 | |
Ratios (%) (to average net assets)
and Supplemental data: | | | | | | | | | | | | | | | | | |
Expenses before expense reductions (f) | | | 0.87 | (c) | | | 0.89 | | | | 0.88 | | | | 0.88 | | | | 0.93 | |
Expenses after expense reductions (f) | | | 0.86 | (c) | | | 0.86 | | | | 0.85 | | | | 0.86 | | | | 0.93 | |
Net investment income (loss) | | | 1.73 | (c) | | | 1.93 | | | | 1.70 | | | | 2.54 | | | | 1.60 | |
Portfolio turnover | | | 33 | | | | 40 | | | | 28 | | | | 27 | | | | 32 | |
Net assets at end of period (000 omitted) | | | $63,884 | | | | $148,243 | | | | $343,475 | | | | $546,069 | | | | $470,915 | |
| |
| Class R6 | | Year ended | |
| | | 8/31/17 | | | 8/31/16 | | | 8/31/15 | | | 8/31/14 | | | 8/31/13 | |
Net asset value, beginning of period | | | $15.79 | | | | $16.30 | | | | $18.02 | | | | $16.21 | | | | $14.20 | |
| Income (loss) from investment operations | | | | | | | | | | | | | | | | | |
Net investment income (loss) (d) | | | $0.28 | (c) | | | $0.31 | | | | $0.32 | | | | $0.46 | | | | $0.33 | |
Net realized and unrealized gain (loss) | | | 2.36 | | | | (0.50 | ) | | | (1.60 | ) | | | 1.64 | | | | 1.99 | |
Total from investment operations | | | $2.64 | | | | $(0.19 | ) | | | $(1.28 | ) | | | $2.10 | | | | $2.32 | |
| Less distributions declared to shareholders | |
From net investment income | | | $(0.33 | ) | | | $(0.32 | ) | | | $(0.44 | ) | | | $(0.29 | ) | | | $(0.31 | ) |
Net asset value, end of period (x) | | | $18.10 | | | | $15.79 | | | | $16.30 | | | | $18.02 | | | | $16.21 | |
Total return (%) (r)(s)(t)(x) | | | 17.07 | (c) | | | (1.13 | ) | | | (7.13 | ) | | | 13.01 | | | | 16.50 | |
Ratios (%) (to average net assets)
and Supplemental data: | | | | | | | | | | | | | | | | | |
Expenses before expense reductions (f) | | | 0.77 | (c) | | | 0.79 | | | | 0.79 | | | | 0.79 | | | | 0.81 | |
Expenses after expense reductions (f) | | | 0.76 | (c) | | | 0.76 | | | | 0.75 | | | | 0.77 | | | | 0.81 | |
Net investment income (loss) | | | 1.72 | (c) | | | 2.02 | | | | 1.88 | | | | 2.62 | | | | 2.09 | |
Portfolio turnover | | | 33 | | | | 40 | | | | 28 | | | | 27 | | | | 32 | |
Net assets at end of period (000 omitted) | | | $5,228,377 | | | | $2,766,544 | | | | $3,010,863 | | | | $2,955,339 | | | | $2,331,325 | |
See Notes to Financial Statements
26
Financial Highlights – continued
| | | | | | | | | | | | | | | | | | | | |
| Class 529A | | Year ended | |
| | | 8/31/17 | | | 8/31/16 | | | 8/31/15 | | | 8/31/14 | | | 8/31/13 | |
Net asset value, beginning of period | | | $15.61 | | | | $16.12 | | | | $17.81 | | | | $16.03 | | | | $14.06 | |
| Income (loss) from investment operations | | | | | | | | | | | | | | | | | |
Net investment income (loss) (d) | | | $0.23 | (c) | | | $0.19 | | | | $0.26 | | | | $0.39 | | | | $0.25 | |
Net realized and unrealized gain (loss) | | | 2.31 | | | | (0.44 | ) | | | (1.58 | ) | | | 1.62 | | | | 1.98 | |
Total from investment operations | | | $2.54 | | | | $(0.25 | ) | | | $(1.32 | ) | | | $2.01 | | | | $2.23 | |
| Less distributions declared to shareholders | |
From net investment income | | | $(0.31 | ) | | | $(0.26 | ) | | | $(0.37 | ) | | | $(0.23 | ) | | | $(0.26 | ) |
Net asset value, end of period (x) | | | $17.84 | | | | $15.61 | | | | $16.12 | | | | $17.81 | | | | $16.03 | |
Total return (%) (r)(s)(t)(x) | | | 16.60 | (c) | | | (1.52 | ) | | | (7.43 | ) | | | 12.57 | | | | 16.05 | |
Ratios (%) (to average net assets)
and Supplemental data: | | | | | | | | | | | | | | | | | |
Expenses before expense reductions (f) | | | 1.22 | (c) | | | 1.23 | | | | 1.23 | | | | 1.23 | | | | 1.28 | |
Expenses after expense reductions (f) | | | 1.13 | (c) | | | 1.13 | | | | 1.12 | | | | 1.14 | | | | 1.21 | |
Net investment income (loss) | | | 1.39 | (c) | | | 1.22 | | | | 1.51 | | | | 2.22 | | | | 1.62 | |
Portfolio turnover | | | 33 | | | | 40 | | | | 28 | | | | 27 | | | | 32 | |
Net assets at end of period (000 omitted) | | | $10,464 | | | | $9,101 | | | | $2,419 | | | | $2,428 | | | | $2,105 | |
| |
| Class 529B | | Year ended | |
| | | 8/31/17 | | | 8/31/16 | | | 8/31/15 | | | 8/31/14 | | | 8/31/13 | |
Net asset value, beginning of period | | | $14.78 | | | | $15.19 | | | | $16.80 | | | | $15.14 | | | | $13.25 | |
| Income (loss) from investment operations | | | | | | | | | | | | | | | | | |
Net investment income (loss) (d) | | | $0.09 | (c) | | | $0.05 | | | | $0.10 | | | | $0.25 | | | | $0.12 | |
Net realized and unrealized gain (loss) | | | 2.18 | | | | (0.39 | ) | | | (1.47 | ) | | | 1.52 | | | | 1.88 | |
Total from investment operations | | | $2.27 | | | | $(0.34 | ) | | | $(1.37 | ) | | | $1.77 | | | | $2.00 | |
| Less distributions declared to shareholders | |
From net investment income | | | $(0.26 | ) | | | $(0.07 | ) | | | $(0.24 | ) | | | $(0.11 | ) | | | $(0.11 | ) |
Net asset value, end of period (x) | | | $16.79 | | | | $14.78 | | | | $15.19 | | | | $16.80 | | | | $15.14 | |
Total return (%) (r)(s)(t)(x) | | | 15.68 | (c) | | | (2.25 | ) | | | (8.17 | ) | | | 11.71 | | | | 15.15 | |
Ratios (%) (to average net assets)
and Supplemental data: | | | | | | | | | | | | | | | | | |
Expenses before expense reductions (f) | | | 1.97 | (c) | | | 1.98 | | | | 1.98 | | | | 1.98 | | | | 2.03 | |
Expenses after expense reductions (f) | | | 1.90 | (c) | | | 1.90 | | | | 1.89 | | | | 1.91 | | | | 1.98 | |
Net investment income (loss) | | | 0.58 | (c) | | | 0.37 | | | | 0.63 | | | | 1.49 | | | | 0.82 | |
Portfolio turnover | | | 33 | | | | 40 | | | | 28 | | | | 27 | | | | 32 | |
Net assets at end of period (000 omitted) | | | $386 | | | | $434 | | | | $138 | | | | $192 | | | | $188 | |
See Notes to Financial Statements
27
Financial Highlights – continued
| | | | | | | | | | | | | | | | | | | | |
| Class 529C | | Year ended | |
| | | 8/31/17 | | | 8/31/16 | | | 8/31/15 | | | 8/31/14 | | | 8/31/13 | |
Net asset value, beginning of period | | | $14.53 | | | | $15.01 | | | | $16.61 | | | | $14.98 | | | | $13.17 | |
| Income (loss) from investment operations | | | | | | | | | | | | | | | | | |
Net investment income (loss) (d) | | | $0.10 | (c) | | | $0.07 | | | | $0.11 | | | | $0.23 | | | | $0.12 | |
Net realized and unrealized gain (loss) | | | 2.15 | | | | (0.41 | ) | | | (1.46 | ) | | | 1.52 | | | | 1.86 | |
Total from investment operations | | | $2.25 | | | | $(0.34 | ) | | | $(1.35 | ) | | | $1.75 | | | | $1.98 | |
| Less distributions declared to shareholders | |
From net investment income | | | $(0.27 | ) | | | $(0.14 | ) | | | $(0.25 | ) | | | $(0.12 | ) | | | $(0.17 | ) |
Net asset value, end of period (x) | | | $16.51 | | | | $14.53 | | | | $15.01 | | | | $16.61 | | | | $14.98 | |
Total return (%) (r)(s)(t)(x) | | | 15.78 | (c) | | | (2.28 | ) | | | (8.17 | ) | | | 11.68 | | | | 15.17 | |
Ratios (%) (to average net assets)
and Supplemental data: | | | | | | | | | | | | | | | | | |
Expenses before expense reductions (f) | | | 1.97 | (c) | | | 1.99 | | | | 1.98 | | | | 1.98 | | | | 2.03 | |
Expenses after expense reductions (f) | | | 1.89 | (c) | | | 1.90 | | | | 1.89 | | | | 1.91 | | | | 1.98 | |
Net investment income (loss) | | | 0.63 | (c) | | | 0.47 | | | | 0.72 | | | | 1.43 | | | | 0.81 | |
Portfolio turnover | | | 33 | | | | 40 | | | | 28 | | | | 27 | | | | 32 | |
Net assets at end of period (000 omitted) | | | $3,856 | | | | $3,298 | | | | $980 | | | | $1,098 | | | | $950 | |
| (c) | Amount reflects a one-time reimbursement of expenses by the custodian (or former custodian) without which net investment income and performance would be lower and expenses would be higher. See Note 2 in the Notes to Financial Statements for additional information. |
| (d) | Per share data is based on average shares outstanding. |
| (f) | Ratios do not reflect reductions from fees paid indirectly, if applicable. |
| (r) | Certain expenses have been reduced without which performance would have been lower. |
| (s) | From time to time the fund may receive proceeds from litigation settlements, without which performance would be lower. |
| (t) | Total returns do not include any applicable sales charges. |
| (x) | The net asset values and total returns have been calculated on net assets which include adjustments made in accordance with U.S. generally accepted accounting principles required at period end for financial reporting purposes. |
See Notes to Financial Statements
28
NOTES TO FINANCIAL STATEMENTS
(1) Business and Organization
MFS Research International Fund (the fund) is a diversified series of MFS Series Trust I (the trust). The trust is organized as a Massachusetts business trust and is registered under the Investment Company Act of 1940, as amended, as an open-end management investment company.
The fund is an investment company and accordingly follows the investment company accounting and reporting guidance of the Financial Accounting Standards Board (FASB) Accounting Standards Codification Topic 946 Financial Services – Investment Companies.
(2) Significant Accounting Policies
General – The preparation of financial statements in conformity with U.S. generally accepted accounting principles requires management to make estimates and assumptions that affect the reported amounts of assets and liabilities, and disclosure of contingent assets and liabilities at the date of the financial statements and the reported amounts of increases and decreases in net assets from operations during the reporting period. Actual results could differ from those estimates. In the preparation of these financial statements, management has evaluated subsequent events occurring after the date of the fund’s Statement of Assets and Liabilities through the date that the financial statements were issued. The fund invests in foreign securities. Investments in foreign securities are vulnerable to the effects of changes in the relative values of the local currency and the U.S. dollar and to the effects of changes in each country’s legal, political, and economic environment.
In October 2016, the Securities and Exchange Commission (SEC) released its Final Rule on Investment Company Reporting Modernization (the “Rule”). The Rule, which introduced two new regulatory reporting forms for investment companies – Form N-PORT and Form N-CEN – also contained amendments to Regulation S-X which impact financial statement presentation, particularly the presentation of derivative investments, for all reporting periods ending after August 1, 2017. The fund has adopted the Rule’s Regulation S-X amendments and believes that the fund’s financial statements are in compliance with those amendments.
Balance Sheet Offsetting – The fund’s accounting policy with respect to balance sheet offsetting is that, absent an event of default by the counterparty or a termination of the agreement, the International Swaps and Derivatives Association (ISDA) Master Agreement does not result in an offset of reported amounts of financial assets and financial liabilities in the Statement of Assets and Liabilities across transactions between the fund and the applicable counterparty. The fund’s right to setoff may be restricted or prohibited by the bankruptcy or insolvency laws of the particular jurisdiction to which a specific master netting agreement counterparty is subject. Balance sheet offsetting disclosures, to the extent applicable to the fund, have been included in the fund’s Significant Accounting Policies note under the captions for each of the fund’s in-scope financial instruments and transactions.
Investment Valuations – Equity securities, including restricted equity securities, are generally valued at the last sale or official closing price on their primary market or
29
Notes to Financial Statements – continued
exchange as provided by a third-party pricing service. Equity securities, for which there were no sales reported that day, are generally valued at the last quoted daily bid quotation on their primary market or exchange as provided by a third-party pricing service. Short-term instruments with a maturity at issuance of 60 days or less may be valued at amortized cost, which approximates market value. Open-end investment companies are generally valued at net asset value per share. Securities and other assets generally valued on the basis of information from a third-party pricing service may also be valued at a broker/dealer bid quotation. Values obtained from third-party pricing services can utilize both transaction data and market information such as yield, quality, coupon rate, maturity, type of issue, trading characteristics, and other market data. The values of foreign securities and other assets and liabilities expressed in foreign currencies are converted to U.S. dollars using the mean of bid and asked prices for rates provided by a third-party pricing service.
The Board of Trustees has delegated primary responsibility for determining or causing to be determined the value of the fund’s investments (including any fair valuation) to the adviser pursuant to valuation policies and procedures approved by the Board. If the adviser determines that reliable market quotations are not readily available, investments are valued at fair value as determined in good faith by the adviser in accordance with such procedures under the oversight of the Board of Trustees. Under the fund’s valuation policies and procedures, market quotations are not considered to be readily available for most types of debt instruments and floating rate loans and many types of derivatives. These investments are generally valued at fair value based on information from third-party pricing services. In addition, investments may be valued at fair value if the adviser determines that an investment’s value has been materially affected by events occurring after the close of the exchange or market on which the investment is principally traded (such as foreign exchange or market) and prior to the determination of the fund’s net asset value, or after the halting of trading of a specific security where trading does not resume prior to the close of the exchange or market on which the security is principally traded. Events that occur on a frequent basis after foreign markets close (such as developments in foreign markets and significant movements in the U.S. markets) and prior to the determination of the fund’s net asset value may be deemed to have a material effect on the value of securities traded in foreign markets. Accordingly, the fund’s foreign equity securities may often be valued at fair value. The adviser generally relies on third-party pricing services or other information (such as the correlation with price movements of similar securities in the same or other markets; the type, cost and investment characteristics of the security; the business and financial condition of the issuer; and trading and other market data) to assist in determining whether to fair value and at what value to fair value an investment. The value of an investment for purposes of calculating the fund’s net asset value can differ depending on the source and method used to determine value. When fair valuation is used, the value of an investment used to determine the fund’s net asset value may differ from quoted or published prices for the same investment. There can be no assurance that the fund could obtain the fair value assigned to an investment if it were to sell the investment at the same time at which the fund determines its net asset value per share.
Various inputs are used in determining the value of the fund’s assets or liabilities. These inputs are categorized into three broad levels. In certain cases, the inputs used to
30
Notes to Financial Statements – continued
measure fair value may fall into different levels of the fair value hierarchy. In such cases, an investment’s level within the fair value hierarchy is based on the lowest level of input that is significant to the fair value measurement. The fund’s assessment of the significance of a particular input to the fair value measurement in its entirety requires judgment, and considers factors specific to the investment. Level 1 includes unadjusted quoted prices in active markets for identical assets or liabilities. Level 2 includes other significant observable market-based inputs (including quoted prices for similar securities, interest rates, prepayment speed, and credit risk). Level 3 includes unobservable inputs, which may include the adviser’s own assumptions in determining the fair value of investments. The following is a summary of the levels used as of August 31, 2017 in valuing the fund’s assets or liabilities:
| | | | | | | | | | | | | | | | |
| Financial Instruments | | Level 1 | | | Level 2 | | | Level 3 | | | Total | |
| Equity Securities: | | | | | | | | | | | | | | | | |
Japan | | | $1,352,107,736 | | | | $— | | | | $— | | | | $1,352,107,736 | |
Switzerland | | | 1,037,744,232 | | | | — | | | | — | | | | 1,037,744,232 | |
United Kingdom | | | 756,884,605 | | | | — | | | | — | | | | 756,884,605 | |
Germany | | | 638,278,179 | | | | — | | | | — | | | | 638,278,179 | |
France | | | 623,989,912 | | | | — | | | | — | | | | 623,989,912 | |
United States | | �� | 439,287,547 | | | | — | | | | — | | | | 439,287,547 | |
Australia | | | 288,916,191 | | | | — | | | | — | | | | 288,916,191 | |
Hong Kong | | | 280,659,988 | | | | — | | | | — | | | | 280,659,988 | |
Italy | | | 256,488,147 | | | | — | | | | — | | | | 256,488,147 | |
Other Countries | | | 1,545,212,720 | | | | 47,051,461 | | | | — | | | | 1,592,264,181 | |
| Mutual Funds | | | 97,839,200 | | | | — | | | | — | | | | 97,839,200 | |
| Total | | | $7,317,408,457 | | | | $47,051,461 | | | | $— | | | | $7,364,459,918 | |
For further information regarding security characteristics, see the Portfolio of Investments.
Foreign Currency Translation – Purchases and sales of foreign investments, income, and expenses are converted into U.S. dollars based upon currency exchange rates prevailing on the respective dates of such transactions or on the reporting date for foreign denominated receivables and payables. Gains and losses attributable to foreign currency exchange rates on sales of securities are recorded for financial statement purposes as net realized gains and losses on investments. Gains and losses attributable to foreign exchange rate movements on receivables, payables, income and expenses are recorded for financial statement purposes as foreign currency transaction gains and losses. That portion of both realized and unrealized gains and losses on investments that results from fluctuations in foreign currency exchange rates is not separately disclosed.
Security Loans – Under its Securities Lending Agency Agreement with the fund, State Street Bank and Trust Company (“State Street”), as lending agent, loans the securities of the fund to certain qualified institutions (the “Borrowers”) approved by the fund. Security loans can be terminated at the discretion of either the lending agent or the fund and the related securities must be returned within the earlier of the standard trade settlement period for such securities or within three business days. The loans are collateralized by cash and/or U.S. Treasury and federal agency obligations in an amount
31
Notes to Financial Statements – continued
typically at least equal to the market value of the securities loaned. On loans collateralized by cash, the cash collateral is invested in a money market fund. The market value of the loaned securities is determined at the close of business of the fund and any additional required collateral is delivered to the fund on the next business day. State Street provides the fund with indemnification against Borrower default. In the event of Borrower default, State Street will, for the benefit of the fund, either purchase securities identical to those loaned or, when such purchase is commercially impracticable, pay the fund the market value of the loaned securities. In return, State Street assumes the fund’s rights to the related collateral. If the collateral value is less than the cost to purchase identical securities, State Street is responsible for the shortfall, but only to the extent that such shortfall is not due to a decline in collateral value resulting from collateral reinvestment for which the fund bears the risk of loss. A portion of the income generated upon investment of the collateral is remitted to the Borrowers, and the remainder is allocated between the fund and the lending agent. On loans collateralized by U.S. Treasury and/or federal agency obligations, a fee is received from the Borrower, and is allocated between the fund and the lending agent. Income from securities lending is separately reported in the Statement of Operations. The dividend and interest income earned on the securities loaned is accounted for in the same manner as other dividend and interest income. At August 31, 2017, there were no securities on loan or collateral outstanding.
Indemnifications – Under the fund’s organizational documents, its officers and Trustees may be indemnified against certain liabilities and expenses arising out of the performance of their duties to the fund. Additionally, in the normal course of business, the fund enters into agreements with service providers that may contain indemnification clauses. The fund’s maximum exposure under these agreements is unknown as this would involve future claims that may be made against the fund that have not yet occurred.
Investment Transactions and Income – Investment transactions are recorded on the trade date. Interest income is recorded on the accrual basis. Dividends received in cash are recorded on the ex-dividend date. Certain dividends from foreign securities will be recorded when the fund is informed of the dividend if such information is obtained subsequent to the ex-dividend date. Dividend and interest payments received in additional securities are recorded on the ex-dividend or ex-interest date in an amount equal to the value of the security on such date.
The fund may receive proceeds from litigation settlements. Any proceeds received from litigation involving portfolio holdings are reflected in the Statement of Operations in realized gain/loss if the security has been disposed of by the fund or in unrealized gain/loss if the security is still held by the fund. Any other proceeds from litigation not related to portfolio holdings are reflected as other income in the Statement of Operations.
Reimbursement of Expenses by Custodian – In December 2015, the fund’s custodian (or former custodian), State Street Bank and Trust Company, announced that it intended to reimburse its asset servicing clients for expense amounts that it billed in error during the period 1998 through 2015. The amount of this one-time reimbursement attributable to the fund is reflected as “Reimbursement of custodian expenses” in the Statement of Operations.
32
Notes to Financial Statements – continued
Tax Matters and Distributions – The fund intends to qualify as a regulated investment company, as defined under Subchapter M of the Internal Revenue Code, and to distribute all of its taxable income, including realized capital gains. As a result, no provision for federal income tax is required. The fund’s federal tax returns, when filed, will remain subject to examination by the Internal Revenue Service for a three year period. Management has analyzed the fund’s tax positions taken on federal and state tax returns for all open tax years and does not believe that there are any uncertain tax positions that require recognition of a tax liability. Foreign taxes, if any, have been accrued by the fund in the accompanying financial statements in accordance with the applicable foreign tax law. Foreign income taxes may be withheld by certain countries in which the fund invests. Additionally, capital gains realized by the fund on securities issued in or by certain foreign countries may be subject to capital gains tax imposed by those countries.
Distributions to shareholders are recorded on the ex-dividend date. Income and capital gain distributions are determined in accordance with income tax regulations, which may differ from U.S. generally accepted accounting principles. Certain capital accounts in the financial statements are periodically adjusted for permanent differences in order to reflect their tax character. These adjustments have no impact on net assets or net asset value per share. Temporary differences which arise from recognizing certain items of income, expense, gain or loss in different periods for financial statement and tax purposes will reverse at some time in the future. Distributions in excess of net investment income or net realized gains are temporary overdistributions for financial statement purposes resulting from differences in the recognition or classification of income or distributions for financial statement and tax purposes.
Book/tax differences primarily relate to wash sale loss deferrals.
The tax character of distributions declared to shareholders for the last two fiscal years is as follows:
| | | | | | | | |
| | | Year ended
8/31/17 | | | Year ended
8/31/16 | |
| Ordinary income (including any short-term capital gains) | | | $123,095,420 | | | | $126,270,222 | |
The federal tax cost and the tax basis components of distributable earnings were as follows:
| | | | |
| As of 8/31/17 | | | |
| Cost of investments | | | $6,549,962,756 | |
| Gross appreciation | | | 1,120,757,591 | |
| Gross depreciation | | | (306,260,429 | ) |
| Net unrealized appreciation (depreciation) | | | $814,497,162 | |
| Undistributed ordinary income | | | 107,377,778 | |
| Capital loss carryforwards | | | (384,347,670 | ) |
| Other temporary differences | | | 210,045 | |
Under the Regulated Investment Company Modernization Act of 2010 (the “Act”), net capital losses recognized for fund fiscal years beginning after August 31, 2011 may be
33
Notes to Financial Statements – continued
carried forward indefinitely, and their character is retained as short-term and/or long-term losses (“post-enactment losses”). Previously, net capital losses were carried forward for eight years and treated as short-term losses (“pre-enactment losses”). As a transition rule, the Act requires that all post-enactment net capital losses be used before pre-enactment net capital losses.
As of August 31, 2017, the fund had capital loss carryforwards available to offset future realized gains as follows:
| | | | |
Pre-enactment losses which
expire as follows: | | | |
| 8/31/18 | | | $(268,624,124 | ) |
| |
Post-enactment losses which
are characterized as follows: | | | |
| Long-Term | | | $(115,723,546 | ) |
Multiple Classes of Shares of Beneficial Interest – The fund offers multiple classes of shares, which differ in their respective distribution, service, and program manager fees. The fund’s income, realized and unrealized gain (loss), and common expenses are allocated to shareholders based on the daily net assets of each class. Dividends are declared separately for each class. Differences in per share dividend rates are generally due to differences in separate class expenses. Class B and Class 529B shares will convert to Class A and Class 529A shares, respectively, approximately eight years after purchase. The fund’s distributions declared to shareholders as reported in the Statements of Changes in Net Assets are presented by class as follows:
| | | | | | | | |
| | | From net investment
income | |
| | | Year
ended
8/31/17 | | | Year
ended
8/31/16 | |
| Class A | | | $14,801,129 | | | | $18,519,876 | |
| Class B | | | 52,252 | | | | 64,227 | |
| Class C | | | 520,875 | | | | 617,527 | |
| Class I | | | 42,606,302 | | | | 44,201,313 | |
| Class R1 | | | 17,739 | | | | 24,774 | |
| Class R2 | | | 2,122,150 | | | | 2,349,821 | |
| Class R3 | | | 1,806,343 | | | | 2,419,727 | |
| Class R4 | | | 2,074,905 | | | | 6,237,275 | |
| Class R6 | | | 58,847,369 | | | | 51,787,408 | |
| Class 529A | | | 178,025 | | | | 38,977 | |
| Class 529B | | | 7,154 | | | | 507 | |
| Class 529C | | | 61,177 | | | | 8,790 | |
| Total | | | $123,095,420 | | | | $126,270,222 | |
34
Notes to Financial Statements – continued
(3) Transactions with Affiliates
Investment Adviser – The fund has an investment advisory agreement with MFS to provide overall investment management and related administrative services and facilities to the fund. For the period from September 1, 2016 through December 28, 2016, the management fee was computed daily and paid monthly at the following annual rates:
| | | | |
| First $1 billion of average daily net assets | | | 0.90 | % |
| Next $1 billion of average daily net assets | | | 0.80 | % |
| Average daily net assets in excess of $2 billion | | | 0.70 | % |
The investment adviser had agreed in writing to reduce its management fee to 0.60% of average daily net assets in excess of $5 billion up to $10 billion and 0.55% of average daily net assets in excess of $10 billion. This written agreement terminated on December 28, 2016. For the period from September 1, 2016 through December 28, 2016, this management fee reduction amounted to $451,215, which is included in the reduction of total expenses in the Statement of Operations.
Effective December 29, 2016, the management fee is computed daily and paid monthly at the following annual rates:
| | | | |
| First $1 billion of average daily net assets | | | 0.90 | % |
| Average daily net assets in excess of $1 billion up to $2 billion | | | 0.80 | % |
| Average daily net assets in excess of $2 billion up to $5 billion | | | 0.70 | % |
| Average daily net assets in excess of $5 billion up to $10 billion | | | 0.60 | % |
| Average daily net assets in excess of $10 billion | | | 0.55 | % |
MFS has also agreed in writing to reduce its management fee by a specified amount if certain MFS mutual fund assets exceed thresholds agreed to by MFS and the fund’s Board of Trustees. For the year ended August 31, 2017, this management fee reduction amounted to $508,201, which is included in the reduction of total expenses in the Statement of Operations. The management fee incurred for the year ended August 31, 2017 was equivalent to an annual effective rate of 0.71% of the fund’s average daily net assets.
Distributor – MFS Fund Distributors, Inc. (MFD), a wholly-owned subsidiary of MFS, as distributor, received $61,521 and $4,611 for the year ended August 31, 2017, as its portion of the initial sales charge on sales of Class A and Class 529A shares of the fund, respectively.
The Board of Trustees has adopted a distribution plan for certain share classes pursuant to Rule 12b-1 of the Investment Company Act of 1940.
The fund’s distribution plan provides that the fund will pay MFD for services provided by MFD and financial intermediaries in connection with the distribution and servicing of certain share classes. One component of the plan is a distribution fee paid to MFD and another component of the plan is a service fee paid to MFD. MFD may subsequently pay all, or a portion, of the distribution and/or service fees to financial intermediaries.
35
Notes to Financial Statements – continued
Distribution Plan Fee Table:
| | | | | | | | | | | | | | | | | | | | |
| | | Distribution
Fee Rate (d) | | | Service
Fee Rate (d) | | | Total
Distribution
Plan (d) | | | Annual
Effective
Rate (e) | | | Distribution
and Service
Fee | |
| Class A | | | — | | | | 0.25% | | | | 0.25% | | | | 0.25% | | | | $1,984,647 | |
| Class B | | | 0.75% | | | | 0.25% | | | | 1.00% | | | | 1.00% | | | | 68,782 | |
| Class C | | | 0.75% | | | | 0.25% | | | | 1.00% | | | | 1.00% | | | | 544,662 | |
| Class R1 | | | 0.75% | | | | 0.25% | | | | 1.00% | | | | 1.00% | | | | 21,540 | |
| Class R2 | | | 0.25% | | | | 0.25% | | | | 0.50% | | | | 0.50% | | | | 698,350 | |
| Class R3 | | | — | | | | 0.25% | | | | 0.25% | | | | 0.25% | | | | 266,015 | |
| Class 529A | | | — | | | | 0.25% | | | | 0.25% | | | | 0.23% | | | | 23,747 | |
| Class 529B | | | 0.75% | | | | 0.25% | | | | 1.00% | | | | 1.00% | | | | 3,981 | |
| Class 529C | | | 0.75% | | | | 0.25% | | | | 1.00% | | | | 0.99% | | | | 34,831 | |
| Total Distribution and Service Fees | | | | | | | | | | | | $3,646,555 | |
| (d) | In accordance with the distribution plan for certain classes, the fund pays distribution and/or service fees equal to these annual percentage rates of each class’s average daily net assets. The distribution and service fee rates disclosed by class represent the current rates in effect at the end of the reporting period. Any rate changes, if applicable, are detailed below. |
| (e) | The annual effective rates represent actual fees incurred under the distribution plan for the year ended August 31, 2017 based on each class’s average daily net assets. MFD has voluntarily agreed to rebate a portion of each class’s 0.25% service fee attributable to accounts for which MFD retains the 0.25% service fee except for accounts attributable to MFS or its affiliates’ seed money. For the year ended August 31, 2017, this rebate amounted to $8,229, $101, $195, $15, $44, $2,135, $2, and $334 for Class A, Class B, Class C, Class R2, Class R3, Class 529A, Class 592B, and Class 529C, respectively, and is included in the reduction of total expenses in the Statement of Operations. |
Certain Class A shares are subject to a contingent deferred sales charge (CDSC) in the event of a shareholder redemption within 18 months of purchase. Class C and Class 529C shares are subject to a CDSC in the event of a shareholder redemption within 12 months of purchase. Class B and Class 529B shares are subject to a CDSC in the event of a shareholder redemption within six years of purchase. All contingent deferred sales charges are paid to MFD and during the year ended August 31, 2017, were as follows:
| | | | |
| | | Amount | |
| Class A | | | $2,825 | |
| Class B | | | 9,227 | |
| Class C | | | 2,077 | |
| Class 529B | | | 134 | |
| Class 529C | | | 104 | |
The fund has entered into and may from time to time enter into contracts with program managers and other parties which administer the tuition programs through which an investment in the fund’s 529 share classes is made. The fund has entered into an agreement with MFD pursuant to which MFD receives an annual fee of up to 0.10% of the average daily net assets attributable to each 529 share class. MFD has agreed to waive a portion of this fee in an amount equal to 0.05% of the average daily net assets for each 529 share class. This waiver agreement will expire on December 31, 2018, unless MFD elects to extend the waiver. For the year ended
36
Notes to Financial Statements – continued
August 31, 2017, this waiver amounted to $6,690 and is included in the reduction of total expenses in the Statement of Operations. The program manager fee incurred for the year ended August 31, 2017 was equivalent to an annual effective rate of 0.05% of the average daily net assets attributable to each 529 share class. The services provided by MFD, or a third party with which MFD contracts, include recordkeeping and tax reporting and account services, as well as services designed to maintain the program’s compliance with the Internal Revenue Code and other regulatory requirements. Program manager fees and waivers for the year ended August 31, 2017, were as follows:
| | | | | | | | |
| | | Fee | | | Waiver | |
| Class 529A | | | $9,499 | | | | $4,749 | |
| Class 529B | | | 398 | | | | 199 | |
| Class 529C | | | 3,483 | | | | 1,742 | |
| Total Program Manager Fees and Waivers | | | $13,380 | | | | $6,690 | |
Shareholder Servicing Agent – MFS Service Center, Inc. (MFSC), a wholly-owned subsidiary of MFS, receives a fee from the fund for its services as shareholder servicing agent calculated as a percentage of the average daily net assets of the fund as determined periodically under the supervision of the fund’s Board of Trustees. For the year ended August 31, 2017, the fee was $243,258, which equated to 0.0036% annually of the fund’s average daily net assets. MFSC also receives payment from the fund for out-of-pocket expenses, sub-accounting and other shareholder servicing costs which may be paid to affiliated and unaffiliated service providers. Class R6 shares do not incur sub-accounting fees. For the year ended August 31, 2017, these out-of-pocket expenses, sub-accounting and other shareholder servicing costs amounted to $3,332,063.
Administrator – MFS provides certain financial, legal, shareholder communications, compliance, and other administrative services to the fund. Under an administrative services agreement, the fund reimburses MFS the costs incurred to provide these services. The fund is charged an annual fixed amount of $17,500 plus a fee based on average daily net assets. The administrative services fee incurred for the year ended August 31, 2017 was equivalent to an annual effective rate of 0.0096% of the fund’s average daily net assets.
Trustees’ and Officers’ Compensation – The fund pays compensation to independent Trustees in the form of a retainer, attendance fees, and additional compensation to Board and Committee chairpersons. The fund does not pay compensation directly to Trustees or officers of the fund who are also officers of the investment adviser, all of whom receive remuneration for their services to the fund from MFS. Certain officers and Trustees of the fund are officers or directors of MFS, MFD, and MFSC.
Prior to December 31, 2001, the fund had an unfunded defined benefit plan (“DB plan”) for independent Trustees. As of December 31, 2001, the Board took action to terminate the DB plan with respect to then-current and any future independent Trustees, such that the DB plan covers only certain of those former independent Trustees who retired on or before December 31, 2001. The DB plan resulted in a pension expense of $247 and is included in “Independent Trustees’ compensation” in
37
Notes to Financial Statements – continued
the Statement of Operations for the year ended August 31, 2017. The liability for deferred retirement benefits payable to certain independent Trustees under the DB plan amounted to $631 at August 31, 2017, and is included in “Payable for independent Trustees’ compensation” in the Statement of Assets and Liabilities.
Other – This fund and certain other funds managed by MFS (the funds) have entered into a service agreement (the ISO Agreement) which provides for payment of fees solely by the funds to Tarantino LLC in return for the provision of services of an Independent Senior Officer (ISO) for the funds. Frank L. Tarantino serves as the ISO and is an officer of the funds and the sole member of Tarantino LLC. The funds can terminate the ISO Agreement with Tarantino LLC at any time under the terms of the ISO Agreement. For the year ended August 31, 2017, the fee paid by the fund under this agreement was $12,341 and is included in “Miscellaneous” expense in the Statement of Operations. MFS has agreed to bear all expenses associated with office space, other administrative support, and supplies provided to the ISO.
The fund invests in the MFS Institutional Money Market Portfolio which is managed by MFS and seeks current income consistent with preservation of capital and liquidity. This money market fund does not pay a management fee to MFS.
On March 16, 2016, MFS purchased 1,975 shares of Class I for an aggregate amount of $30,679. On March 16, 2017, MFS redeemed 1,606 shares of Class I for an aggregate amount of $27,153.
The fund is permitted to engage in purchase and sale transactions with funds and accounts for which MFS serves as investment adviser or sub-adviser (“cross-trades”) pursuant to a policy adopted by the Board of Trustees. This policy has been designed to ensure that cross-trades conducted by the fund comply with Rule 17a-7 under the Investment Company Act of 1940. Under this policy, cross-trades are effected at current market prices with no remuneration paid in connection with the transaction. During the year ended August 31, 2017, the fund engaged in purchase and sale transactions pursuant to this policy, which amounted to $17,296,930 and $12,221,177, respectively. The sales transactions resulted in net realized gains (losses) of $2,271,552.
(4) Portfolio Securities
For the year ended August 31, 2017, purchases and sales of investments, other than short-term obligations, aggregated $2,200,986,303 and $2,259,314,641, respectively.
38
Notes to Financial Statements – continued
(5) Shares of Beneficial Interest
The fund’s Declaration of Trust permits the Trustees to issue an unlimited number of full and fractional shares of beneficial interest. Transactions in fund shares were as follows:
| | | | | | | | | | | | | | | | |
| | | Year ended
8/31/17 | | | Year ended
8/31/16 | |
| | | Shares | | | Amount | | | Shares | | | Amount | |
| Shares sold | | | | | | | | | | | | | | | | |
Class A | | | 8,582,981 | | | | $138,223,182 | | | | 21,545,595 | | | | $328,659,059 | |
Class B | | | 34,564 | | | | 554,571 | | | | 48,030 | | | | 723,144 | |
Class C | | | 253,541 | | | | 3,952,051 | | | | 430,840 | | | | 6,267,357 | |
Class I | | | 42,721,875 | | | | 720,116,950 | | | | 35,918,662 | | | | 572,047,523 | |
Class R1 | | | 16,068 | | | | 246,173 | | | | 23,930 | | | | 338,866 | |
Class R2 | | | 1,287,477 | | | | 20,166,349 | | | | 1,950,959 | | | | 29,032,110 | |
Class R3 | | | 1,343,734 | | | | 21,647,695 | | | | 1,552,694 | | | | 23,658,689 | |
Class R4 | | | 1,102,171 | | | | 17,981,607 | | | | 4,587,268 | | | | 70,247,582 | |
Class R6 | | | 132,775,681 | | | | 2,295,191,131 | | | | 27,737,532 | | | | 423,125,363 | |
Class 529A | | | 82,941 | | | | 1,344,959 | | | | 494,224 | | | | 7,503,100 | |
Class 529B | | | 1,775 | | | | 27,433 | | | | 25,855 | | | | 372,212 | |
Class 529C | | | 34,844 | | | | 515,747 | | | | 181,957 | | | | 2,575,360 | |
| | | 188,237,652 | | | | $3,219,967,848 | | | | 94,497,546 | | | | $1,464,550,365 | |
| | | | |
Shares issued to shareholders in
reinvestment of distributions | | | | | | | | | | | | | | | | |
Class A | | | 753,070 | | | | $11,612,342 | | | | 967,727 | | | | $15,135,244 | |
Class B | | | 2,923 | | | | 43,611 | | | | 3,595 | | | | 54,285 | |
Class C | | | 22,145 | | | | 321,994 | | | | 24,676 | | | | 363,730 | |
Class I | | | 2,119,423 | | | | 33,762,412 | | | | 2,154,640 | | | | 34,797,443 | |
Class R1 | | | 1,232 | | | | 17,670 | | | | 1,698 | | | | 24,674 | |
Class R2 | | | 135,578 | | | | 2,022,831 | | | | 148,079 | | | | 2,243,401 | |
Class R3 | | | 118,371 | | | | 1,806,343 | | | | 156,313 | | | | 2,419,727 | |
Class R4 | | | 134,339 | | | | 2,072,857 | | | | 394,308 | | | | 6,166,970 | |
Class R6 | | | 3,829,739 | | | | 58,709,900 | | | | 3,318,907 | | | | 51,642,198 | |
Class 529A | | | 11,741 | | | | 177,872 | | | | 2,497 | | | | 38,505 | |
Class 529B | | | 499 | | | | 7,154 | | | | 35 | | | | 507 | |
Class 529C | | | 4,342 | | | | 61,177 | | | | 609 | | | | 8,790 | |
| | | 7,133,402 | | | | $110,616,163 | | | | 7,173,084 | | | | $112,895,474 | |
39
Notes to Financial Statements – continued
| | | | | | | | | | | | | | | | |
| | | Year ended
8/31/17 | | | Year ended
8/31/16 | |
| | | Shares | | | Amount | | | Shares | | | Amount | |
| Shares reacquired | | | | | | | | | | | | | | | | |
Class A | | | (32,516,368 | ) | | | $(523,334,043 | ) | | | (33,256,347 | ) | | | $(505,503,605 | ) |
Class B | | | (205,001 | ) | | | (3,230,732 | ) | | | (245,306 | ) | | | (3,634,091 | ) |
Class C | | | (1,608,153 | ) | | | (25,050,058 | ) | | | (1,328,603 | ) | | | (19,307,729 | ) |
Class I | | | (119,850,510 | ) | | | (2,144,302,000 | ) | | | (47,251,025 | ) | | | (747,130,180 | ) |
Class R1 | | | (58,236 | ) | | | (871,875 | ) | | | (92,952 | ) | | | (1,312,230 | ) |
Class R2 | | | (3,781,953 | ) | | | (59,658,034 | ) | | | (2,907,635 | ) | | | (43,313,201 | ) |
Class R3 | | | (4,467,029 | ) | | | (72,551,216 | ) | | | (3,856,903 | ) | | | (58,609,686 | ) |
Class R4 | | | (7,076,802 | ) | | | (118,677,345 | ) | | | (16,622,063 | ) | | | (263,940,004 | ) |
Class R6 | | | (22,885,746 | ) | | | (378,877,194 | ) | | | (40,593,179 | ) | | | (630,552,683 | ) |
Class 529A | | | (91,229 | ) | | | (1,471,469 | ) | | | (63,717 | ) | | | (975,004 | ) |
Class 529B | | | (8,674 | ) | | | (132,298 | ) | | | (5,596 | ) | | | (82,184 | ) |
Class 529C | | | (32,507 | ) | | | (477,283 | ) | | | (20,939 | ) | | | (301,263 | ) |
| | | (192,582,208 | ) | | | $(3,328,633,547 | ) | | | (146,244,265 | ) | | | $(2,274,661,860 | ) |
| | | | |
| Net change | | | | | | | | | | | | | | | | |
Class A | | | (23,180,317 | ) | | | $(373,498,519 | ) | | | (10,743,025 | ) | | | $(161,709,302 | ) |
Class B | | | (167,514 | ) | | | (2,632,550 | ) | | | (193,681 | ) | | | (2,856,662 | ) |
Class C | | | (1,332,467 | ) | | | (20,776,013 | ) | | | (873,087 | ) | | | (12,676,642 | ) |
Class I | | | (75,009,212 | ) | | | (1,390,422,638 | ) | | | (9,177,723 | ) | | | (140,285,214 | ) |
Class R1 | | | (40,936 | ) | | | (608,032 | ) | | | (67,324 | ) | | | (948,690 | ) |
Class R2 | | | (2,358,898 | ) | | | (37,468,854 | ) | | | (808,597 | ) | | | (12,037,690 | ) |
Class R3 | | | (3,004,924 | ) | | | (49,097,178 | ) | | | (2,147,896 | ) | | | (32,531,270 | ) |
Class R4 | | | (5,840,292 | ) | | | (98,622,881 | ) | | | (11,640,487 | ) | | | (187,525,452 | ) |
Class R6 | | | 113,719,674 | | | | 1,975,023,837 | | | | (9,536,740 | ) | | | (155,785,122 | ) |
Class 529A | | | 3,453 | | | | 51,362 | | | | 433,004 | | | | 6,556,601 | |
Class 529B | | | (6,400 | ) | | | (97,711 | ) | | | 20,294 | | | | 290,535 | |
Class 529C | | | 6,679 | | | | 99,641 | | | | 161,627 | | | | 2,282,887 | |
| | | 2,788,846 | | | | $1,950,464 | | | | (44,573,635 | ) | | | $(697,216,021 | ) |
The fund is one of several mutual funds in which certain MFS funds may invest. The MFS funds do not invest in the underlying funds for the purpose of exercising management or control. At the end of the period, the MFS International Diversification Fund, the MFS Moderate Allocation Fund, the MFS Growth Allocation Fund, the MFS Aggressive Growth Allocation Fund, and the MFS Conservative Allocation Fund were the owners of record of approximately 35%, 5%, 5%, 2%, and 2%, respectively, of the value of outstanding voting shares of the fund. In addition, the MFS Lifetime 2020 Fund, the MFS Lifetime 2025 Fund, the MFS Lifetime 2030 Fund, the MFS Lifetime 2035 Fund, the MFS Lifetime 2040 Fund, the MFS Lifetime 2045 Fund, the MFS Lifetime 2050 Fund, the MFS Lifetime 2055 Fund, the MFS Lifetime 2060 Fund, and the MFS Lifetime Income Fund were each the owners of record of less than 1% of the value of outstanding voting shares of the fund.
40
Notes to Financial Statements – continued
(6) Line of Credit
The fund and certain other funds managed by MFS participate in a $1.25 billion unsecured committed line of credit, subject to a $1 billion sublimit, provided by a syndication of banks under a credit agreement. Borrowings may be made for temporary financing needs. Interest is charged to each fund, based on its borrowings, generally at a rate equal to the higher of the Overnight Federal Reserve funds rate or daily one month LIBOR plus an agreed upon spread. A commitment fee, based on the average daily, unused portion of the committed line of credit, is allocated among the participating funds at the end of each calendar quarter. In addition, the fund and other funds managed by MFS have established unsecured uncommitted borrowing arrangements with certain banks for temporary financing needs. Interest is charged to each fund, based on its borrowings, at a rate equal to the Overnight Federal Reserve funds rate plus an agreed upon spread. For the year ended August 31, 2017, the fund’s commitment fee and interest expense were $46,492 and $0, respectively, and are included in “Miscellaneous” expense in the Statement of Operations.
(7) Investments in Affiliated Issuers
An affiliated issuer may be considered one in which the fund owns 5% or more of the outstanding voting securities, or a company which is under common control. For the purposes of this report, the fund assumes the following to be an affiliated issuer:
| | | | | | | | | | | | | | | | | | | | |
| Affiliated Issuer | | | | | Beginning
Shares/Par
Amount | | | Acquisitions
Shares/Par
Amount | | | Dispositions
Shares/Par
Amount | | | Ending
Shares/Par
Amount | |
MFS Institutional Money
Market Portfolio | | | | 41,698,907 | | | | 1,044,745,594 | | | | (988,605,301 | ) | | | 97,839,200 | |
| | | | | |
| Affiliated Issuer | | Realized
Gain (Loss) | | | Change in
Unrealized
Appreciation
(Depreciation) | | | Capital Gain
Distributions | | | Dividend
Income | | | Ending Value | |
MFS Institutional Money
Market Portfolio | | | $(3,870 | ) | | | $(302 | ) | | | $— | | | | $385,762 | | | | $97,839,200 | |
41
REPORT OF INDEPENDENT REGISTERED PUBLIC ACCOUNTING FIRM
To the Board of Trustees of MFS Series Trust I and Shareholders of MFS Research International Fund:
We have audited the accompanying statement of assets and liabilities, including the portfolio of investments, of MFS Research International Fund (the Fund) (one of the series constituting the MFS Series Trust I) as of August 31, 2017, and the related statement of operations for the year then ended, the statements of changes in net assets for each of the two years in the period then ended and the financial highlights for each of the five years in the period then ended. These financial statements and financial highlights are the responsibility of the Fund’s management. Our responsibility is to express an opinion on these financial statements and financial highlights based on our audits.
We conducted our audits in accordance with the standards of the Public Company Accounting Oversight Board (United States). Those standards require that we plan and perform the audit to obtain reasonable assurance about whether the financial statements and financial highlights are free of material misstatement. We were not engaged to perform an audit of the Fund’s internal control over financial reporting. Our audits included consideration of internal control over financial reporting as a basis for designing audit procedures that are appropriate in the circumstances, but not for the purpose of expressing an opinion on the effectiveness of the Fund’s internal control over financial reporting. Accordingly, we express no such opinion. An audit also includes examining, on a test basis, evidence supporting the amounts and disclosures in the financial statements and financial highlights, assessing the accounting principles used and significant estimates made by management, and evaluating the overall financial statement presentation. Our procedures included confirmation of securities owned as of August 31, 2017, by correspondence with the custodian and others or by other appropriate auditing procedures where replies from others were not received. We believe that our audits provide a reasonable basis for our opinion.
In our opinion, the financial statements and financial highlights referred to above present fairly, in all material respects, the financial position of MFS Research International Fund (one of the series constituting the MFS Series Trust I) at August 31, 2017, the results of its operations for the year then ended, the changes in its net assets for each of the two years in the period then ended and the financial highlights for each of the five years in the period then ended, in conformity with U.S. generally accepted accounting principles.

Boston, Massachusetts
October 17, 2017
42
RESULTS OF SHAREHOLDER MEETING
(unaudited)
At a special meeting of shareholders of MFS Series Trust I, which was held on March 23, 2017, the following action was taken:
Item 1: To elect the following individuals as Trustees:
| | | | | | | | |
| | | Number of Dollars | |
Nominee | | For | | | Withheld Authority | |
| Steven E. Buller | | | 40,448,016,134.453 | | | | 372,137,248.376 | |
| John A. Caroselli | | | 40,455,058,441.389 | | | | 365,094,941.560 | |
| Maureen R. Goldfarb | | | 40,458,621,672.449 | | | | 361,531,746.940 | |
| David H. Gunning | | | 40,369,558,961.219 | | | | 450,594,312.051 | |
| Michael Hegarty | | | 40,379,783,468.714 | | | | 440,369,950.676 | |
| John P. Kavanaugh | | | 40,453,732,784.104 | | | | 366,420,708.405 | |
| Robert J. Manning | | | 40,424,010,964.586 | | | | 396,142,308.684 | |
| Clarence Otis, Jr. | | | 40,441,919,324.712 | | | | 378,234,043.007 | |
| Maryanne L. Roepke | | | 40,471,040,575.143 | | | | 349,112,917.026 | |
| Robin A. Stelmach | | | 40,459,908,730.475 | | | | 360,244,615.574 | |
| Laurie J. Thomsen | | | 40,426,270,790.416 | | | | 393,882,628.973 | |
43
TRUSTEES AND OFFICERS — IDENTIFICATION AND BACKGROUND
The Trustees and Officers of the Trust, as of October 1, 2017, are listed below, together with their principal occupations during the past five years. (Their titles may have varied during that period.) The address of each Trustee and Officer is 111 Huntington Avenue, Boston, Massachusetts 02199-7618.
| | | | | | | | | | |
Name, Age | | Position(s)
Held with Fund | | Trustee/Officer Since (h) | | Number of
MFS Funds
overseen
by the
Trustee | | Principal
Occupations During the Past Five Years | | Other Directorships
During the Past
Five Years (j) |
| INTERESTED TRUSTEES |
Robert J. Manning (k)
(age 53) | | Trustee | | February 2004 | | 136 | | Massachusetts Financial Services Company, Executive Chairman (since January 2017); Director; Chairman of the Board; Chief Executive Officer (until 2015); Co-Chief Executive Officer (2015-2016) | | N/A |
Robin A. Stelmach (k) (age 56) | | Trustee | | January 2014 | | 136 | | Massachusetts Financial Services Company, Vice Chair (since January 2017); Chief Operating Officer and Executive Vice President (until January 2017) | | N/A |
| INDEPENDENT TRUSTEES |
David H. Gunning
(age 75) | | Trustee and Chair of Trustees | | January 2004 | | 136 | | Private investor | | Lincoln Electric Holdings, Inc., Director; Development Alternatives, Inc., Director/Non-Executive Chairman (until 2013) |
44
Trustees and Officers – continued
| | | | | | | | | | |
Name, Age | | Position(s)
Held with Fund | | Trustee/Officer Since (h) | | Number of
MFS Funds
overseen
by the
Trustee | | Principal
Occupations During the Past Five Years | | Other Directorships
During the Past
Five Years (j) |
Steven E. Buller
(age 66) | | Trustee | | February 2014 | | 136 | | Financial Accounting Standards Advisory Council, Chairman (2014-2015); Public Company Accounting Oversight Board, Standing Advisory Group, Member (until 2014); BlackRock, Inc. (investment management), Managing Director (until 2014), BlackRock Finco UK (investment management), Director (until 2014) | | N/A |
John A. Caroselli
(age 63) | | Trustee | | March 2017 | | 136 | | JC Global Advisors, LLC (management consulting), President (since 2015); First Capital Corporation (commercial finance), Executive Vice President (until 2015) | | N/A |
Maureen R. Goldfarb
(age 62) | | Trustee | | January 2009 | | 136 | | Private investor | | N/A |
Michael Hegarty
(age 72) | | Trustee | | December 2004 | | 136 | | Private investor | | Rouse Properties Inc., Director (until 2016); Capmark Financial Group Inc., Director (until 2015) |
John P. Kavanaugh
(age 62) | | Trustee and Vice Chair of Trustees | | January 2009 | | 136 | | Private investor | | N/A |
Clarence Otis, Jr.
(age 61) | | Trustee | | March 2017 | | 136 | | Darden Restaurants, Inc., Chief Executive Officer (until 2014) | | VF Corporation, Director; Verizon Communications, Inc., Director; The Travelers Companies, Director; Federal Reserve Bank of Atlanta, Director (until 2015) |
45
Trustees and Officers – continued
| | | | | | | | | | |
Name, Age | | Position(s)
Held with Fund | | Trustee/Officer Since (h) | | Number of
MFS Funds
overseen
by the
Trustee | | Principal
Occupations During the Past Five Years | | Other Directorships
During the Past
Five Years (j) |
Maryanne L. Roepke
(age 61) | | Trustee | | May 2014 | | 136 | | American Century Investments (investment management), Senior Vice President and Chief Compliance Officer (until 2014) | | N/A |
Laurie J. Thomsen
(age 60) | | Trustee | | March 2005 | | 136 | | Private investor | | The Travelers Companies, Director; Dycom Industries, Inc., Director (since 2015) |
| | | | | | | | |
Name, Age | | Position(s) Held with Fund | | Trustee/Officer
Since (h) | | Number of
MFS Funds
for which
the Person
is an Officer | | Principal
Occupations During the Past Five Years |
| OFFICERS | | | | | | | | |
Christopher R. Bohane (k)
(age 43) | | Assistant Secretary and Assistant Clerk | | July 2005 | | 136 | | Massachusetts Financial Services Company, Vice President and Assistant General Counsel |
Kino Clark (k)
(age 49) | | Assistant Treasurer | | January 2012 | | 136 | | Massachusetts Financial Services Company, Vice President |
John W. Clark, Jr. (k)
(age 50) | | Assistant Treasurer | | April 2017 | | 136 | | Massachusetts Financial Services Company, Vice President (since March 2017); Deutsche Bank (financial services), Department Head – Treasurer’s Office (until February 2017) |
Thomas H. Connors (k)
(age 58) | | Assistant Secretary and Assistant Clerk | | September 2012 | | 136 | | Massachusetts Financial Services Company, Vice President and Senior Counsel; Deutsche Investment Management Americas Inc. (financial service provider), Director and Senior Counsel (until 2012) |
46
Trustees and Officers – continued
| | | | | | | | |
Name, Age | | Position(s) Held with Fund | | Trustee/Officer
Since (h) | | Number of
MFS Funds
for which
the Person
is an Officer | | Principal
Occupations During the Past Five Years |
Ethan D. Corey (k)
(age 53) | | Assistant Secretary and Assistant Clerk | | July 2005 | | 136 | | Massachusetts Financial Services Company, Senior Vice President and Associate General Counsel |
David L. DiLorenzo (k)
(age 49) | | President | | July 2005 | | 136 | | Massachusetts Financial Services Company, Senior Vice President |
Heidi W. Hardin (k)
(age 50) | | Secretary and Clerk | | April 2017 | | 136 | | Massachusetts Financial Services Company, Executive Vice President and General Counsel (since March 2017); Harris Associates (investment management), General Counsel (from September 2015 to January 2017); Janus Capital Management LLC (investment management), Senior Vice President and General Counsel (until September 2015) |
Brian E. Langenfeld (k) (age 44) | | Assistant Secretary and Assistant Clerk | | June 2006 | | 136 | | Massachusetts Financial Services Company, Vice President and Senior Counsel |
Susan A. Pereira (k)
(age 46) | | Assistant Secretary and Assistant Clerk | | July 2005 | | 136 | | Massachusetts Financial Services Company, Vice President and Senior Counsel |
Kasey L. Phillips (k)
(age 46) | | Assistant Treasurer | | September 2012 | | 136 | | Massachusetts Financial Services Company, Vice President; Wells Fargo Funds Management, LLC, Senior Vice President, Fund Treasurer (until 2012) |
Matthew A. Stowe (k)
(age 42) | | Assistant Secretary and Assistant Clerk | | October 2014 | | 136 | | Massachusetts Financial Services Company, Vice President and Assistant General Counsel |
Frank L. Tarantino
(age 73) | | Independent Senior Officer | | June 2004 | | 136 | | Tarantino LLC (provider of compliance services), Principal |
Richard S. Weitzel (k)
(age 47) | | Assistant Secretary and Assistant Clerk | | October 2007 | | 136 | | Massachusetts Financial Services Company, Senior Vice President and Associate General Counsel |
47
Trustees and Officers – continued
| | | | | | | | |
Name, Age | | Position(s) Held with Fund | | Trustee/Officer
Since (h) | | Number of
MFS Funds
for which
the Person
is an Officer | | Principal
Occupations During the Past Five Years |
Martin J. Wolin (k)
(age 50) | | Chief Compliance Officer | | July 2015 | | 136 | | Massachusetts Financial Services Company, Senior Vice President and Chief Compliance Officer (since July 2015); Mercer (financial service provider), Chief Risk and Compliance Officer, North America and Latin America (until June 2015) |
James O. Yost (k)
(age 57) | | Treasurer | | September 1990 | | 136 | | Massachusetts Financial Services Company, Senior Vice President |
| (h) | Date first appointed to serve as Trustee/officer of an MFS Fund. Each Trustee has served continuously since appointment unless indicated otherwise. For the period from December 15, 2004 until February 22, 2005, Mr. Manning served as Advisory Trustee. Prior to January 2012, Messrs. DiLorenzo and Yost served as Assistant Treasurers of the Funds. From January 2012 through December 2016, Messrs. DiLorenzo and Yost served as Treasurer and Deputy Treasurer of the Funds, respectively. |
| (j) | Directorships or trusteeships of companies required to report to the Securities and Exchange Commission (i.e., “public companies”). |
| (k) | “Interested person” of the Trust within the meaning of the Investment Company Act of 1940 (referred to as the 1940 Act), which is the principal federal law governing investment companies like the fund, as a result of a position with MFS. The address of MFS is 111 Huntington Avenue, Boston, Massachusetts 02199-7618. |
Each Trustee has been elected by shareholders and each Trustee and officer holds office until his or her successor is chosen and qualified or until his or her earlier death, resignation, retirement or removal. The Trust does not hold annual meetings for the purpose of electing Trustees, and Trustees are not elected for fixed terms. Under the terms of the Board’s retirement policy, an Independent Trustee shall retire at the end of the calendar year in which he or she reaches the earlier of 75 years of age or 15 years of service on the Board (or, in the case of any Independent Trustee who joined the Board prior to 2015, 20 years of service on the Board).
Messrs. Buller, Kavanaugh and Otis and Ms. Roepke are members of the Trust’s Audit Committee.
Each of the Interested Trustees and certain Officers hold comparable officer positions with certain affiliates of MFS.
48
Trustees and Officers – continued
The Statement of Additional Information for a Fund includes further information about the Trustees and is available without charge upon request by calling 1-800-225-2606.
| | |
| Investment Adviser | | Custodian |
Massachusetts Financial Services Company
111 Huntington Avenue
Boston, MA 02199-7618 | | State Street Bank and Trust Company 1 Lincoln Street
Boston, MA 02111-2900 |
| Distributor | | Independent Registered Public Accounting Firm |
MFS Fund Distributors, Inc.
111 Huntington Avenue
Boston, MA 02199-7618 | | Ernst & Young LLP 200 Claredon Street
Boston, MA 02116 |
| Portfolio Manager(s) | | |
| Jose Luis Garcia | | |
| Victoria Higley | | |
| Thomas Melendez | | |
49
BOARD REVIEW OF INVESTMENT ADVISORY AGREEMENT
The Investment Company Act of 1940 requires that both the full Board of Trustees and a majority of the non-interested (“independent”) Trustees, voting separately, annually approve the continuation of the Fund’s investment advisory agreement with MFS. The Trustees consider matters bearing on the Fund and its advisory arrangements at their meetings throughout the year, including a review of performance data at each regular meeting. In addition, the independent Trustees met several times over the course of three months beginning in May and ending in July, 2017 (“contract review meetings”) for the specific purpose of considering whether to approve the continuation of the investment advisory agreement for the Fund and the other investment companies that the Board oversees (the “MFS Funds”). The independent Trustees were assisted in their evaluation of the Fund’s investment advisory agreement by independent legal counsel, from whom they received separate legal advice and with whom they met separately from MFS during various contract review meetings. The independent Trustees were also assisted in this process by the MFS Funds’ Independent Senior Officer, a senior officer appointed by and reporting to the independent Trustees.
In connection with their deliberations regarding the continuation of the investment advisory agreement, the Trustees, including the independent Trustees, considered such information and factors as they believed, in light of the legal advice furnished to them and their own business judgment, to be relevant. The investment advisory agreement for the Fund was considered separately, although the Trustees also took into account the common interests of all MFS Funds in their review. As described below, the Trustees considered the nature, quality, and extent of the various investment advisory, administrative, and shareholder services performed by MFS under the existing investment advisory agreement and other arrangements with the Fund.
In connection with their contract review meetings, the Trustees received and relied upon materials that included, among other items: (i) information provided by Broadridge Financial Solutions, Inc. (“Broadridge”), an independent third party, on the investment performance of the Fund for various time periods ended December 31, 2016 and the investment performance of a group of funds with substantially similar investment classifications/objectives (the “Lipper performance universe”), (ii) information provided by Broadridge on the Fund’s advisory fees and other expenses and the advisory fees and other expenses of comparable funds identified by Broadridge (the “Broadridge expense group”), (iii) information provided by MFS on the advisory fees of portfolios of other clients of MFS, including institutional separate accounts and other clients, (iv) information as to whether and to what extent applicable expense waivers, reimbursements or fee “breakpoints” are observed for the Fund, (v) information regarding MFS’ financial results and financial condition, including MFS’ and certain of its affiliates’ estimated profitability from services performed for the Fund and the MFS Funds as a whole, and compared to MFS’ institutional business, (vi) MFS’ views regarding the outlook for the mutual fund industry and the strategic business plans of MFS, (vii) descriptions of various functions performed by MFS for the Funds, such as compliance monitoring and portfolio trading practices, and (viii) information regarding the overall organization of MFS, including information about MFS’ senior management and other personnel providing investment advisory,
50
Board Review of Investment Advisory Agreement – continued
administrative and other services to the Fund and the other MFS Funds. The comparative performance, fee and expense information prepared and provided by Broadridge was not independently verified and the independent Trustees did not independently verify any information provided to them by MFS.
The Trustees’ conclusion as to the continuation of the investment advisory agreement was based on a comprehensive consideration of all information provided to the Trustees and not the result of any single factor. Some of the factors that figured particularly in the Trustees’ deliberations are described below, although individual Trustees may have evaluated the information presented differently from one another, giving different weights to various factors. It is also important to recognize that the fee arrangements for the Fund and other MFS Funds are the result of years of review and discussion between the independent Trustees and MFS, that certain aspects of such arrangements may receive greater scrutiny in some years than in others, and that the Trustees’ conclusions may be based, in part, on their consideration of these same arrangements during the course of the year and in prior years.
Based on information provided by Broadridge and MFS, the Trustees reviewed the Fund’s total return investment performance as well as the performance of peer groups of funds over various time periods. The Trustees placed particular emphasis on the total return performance of the Fund’s Class A shares in comparison to the performance of funds in its Lipper performance universe over the three-year period ended December 31, 2016, which the Trustees believed was a long enough period to reflect differing market conditions. The total return performance of the Fund’s Class A shares was in the 4th quintile relative to the other funds in the universe for this three-year period (the 1st quintile being the best performers and the 5th quintile being the worst performers). The total return performance of the Fund’s Class A shares was in the 4th quintile for each of the one- and five-year periods ended December 31, 2016 relative to the Lipper performance universe. Because of the passage of time, these performance results may differ from the performance results for more recent periods, including those shown elsewhere in this report.
The Trustees expressed concern to MFS about the substandard investment performance of the Fund. In the course of their deliberations, the Trustees took into account information provided by MFS in connection with the contract review meetings, as well as during investment review meetings conducted with portfolio management personnel during the course of the year, as to MFS’ efforts to improve the Fund’s performance. In addition, the Trustees requested that they receive a separate update on the Fund’s performance at each of their regular meetings. After reviewing these and related factors, the Trustees concluded, within the context of their overall conclusions regarding the investment advisory agreement, that MFS’ responses and efforts and plans to improve investment performance were sufficient to support approval of the continuance of the investment advisory agreement for an additional one-year period, but that they would continue to closely monitor the performance of the Fund.
In assessing the reasonableness of the Fund’s advisory fee, the Trustees considered, among other information, the Fund’s advisory fee and the total expense ratio of the Fund’s Class A shares as a percentage of average daily net assets and the advisory fee and total expense ratios of peer groups of funds based on information provided by
51
Board Review of Investment Advisory Agreement – continued
Broadridge. The Trustees considered that, according to the data provided by Broadridge (which takes into account any fee reductions or expense limitations that were in effect during the Fund’s last fiscal year), the Fund’s effective advisory fee rate and total expense ratio were each lower than the Broadridge expense group median.
The Trustees also considered the advisory fees charged by MFS to any institutional separate accounts advised by MFS (“separate accounts”) and unaffiliated investment companies for which MFS serves as subadviser (“subadvised funds”) that have comparable investment strategies to the Fund, if any. In comparing these fees, the Trustees considered information provided by MFS as to the generally broader scope of services provided by MFS to the Fund, as well as the more extensive regulatory burdens imposed on MFS in managing the Fund, in comparison to separate accounts and subadvised funds. The Trustees also considered the higher demands placed on MFS’ investment personnel and trading infrastructure as a result of the daily cash in-flows and out-flows of the Fund in comparison to separate accounts.
The Trustees also considered whether the Fund may benefit from any economies of scale in the management of the Fund in the event of growth in assets of the Fund and/or growth in assets of the MFS Funds as a whole. They noted that the Fund’s advisory fee rate schedule is subject to contractual breakpoints that reduce the Fund’s advisory fee rate on average daily net assets over $1 billion, $2 billion, $5 billion and $10 billion. The Trustees also noted that MFS has agreed in writing to waive a portion of the management fees of certain MFS Funds, including the Fund, if the total combined assets of certain funds within the MFS Funds’ complex increase above agreed upon thresholds (the “group fee waiver”), enabling the Fund’s shareholders to share in the benefits from any economies of scale at the complex level. The group fee waiver is reviewed and renewed annually between the Board and MFS. The Trustees concluded that the breakpoints and the group fee waiver were sufficient to allow the Fund to benefit from economies of scale as its assets and overall complex assets grow.
The Trustees also considered information prepared by MFS relating to MFS’ costs and profits with respect to the Fund, the MFS Funds considered as a group, and other investment companies and accounts advised by MFS, as well as MFS’ methodologies used to determine and allocate its costs to the MFS Funds, the Fund and other accounts and products for purposes of estimating profitability.
After reviewing these and other factors described herein, the Trustees concluded, within the context of their overall conclusions regarding the investment advisory agreement, that the advisory fees charged to the Fund represent reasonable compensation in light of the services being provided by MFS to the Fund.
In addition, the Trustees considered MFS’ resources and related efforts to continue to retain, attract and motivate capable personnel to serve the Fund. The Trustees also considered current and developing conditions in the financial services industry, including the presence of large and well-capitalized companies which are spending, and appear to be prepared to continue to spend, substantial sums to engage personnel and to provide services to competing investment companies. In this regard, the Trustees also considered the financial resources of MFS and its ultimate parent, Sun Life Financial Inc. The Trustees also considered the advantages and possible disadvantages to the Fund of having an adviser that also serves other investment companies as well as other accounts.
52
Board Review of Investment Advisory Agreement – continued
The Trustees also considered the nature, quality, cost, and extent of administrative, transfer agency, and distribution services provided to the Fund by MFS and its affiliates under agreements and plans other than the investment advisory agreement, including any 12b-1 fees the Fund pays to MFS Fund Distributors, Inc., an affiliate of MFS. The Trustees also considered the nature, extent and quality of certain other services MFS performs or arranges for on the Fund’s behalf, which may include securities lending programs, directed expense payment programs, class action recovery programs, and MFS’ interaction with third-party service providers, principally custodians and sub-custodians. The Trustees concluded that the various non-advisory services provided by MFS and its affiliates on behalf of the Fund were satisfactory.
The Trustees also considered benefits to MFS from the use of the Fund’s portfolio brokerage commissions, if applicable, to pay for investment research and various other factors. Additionally, the Trustees considered so-called “fall-out benefits” to MFS such as reputational value derived from serving as investment manager to the Fund.
Based on their evaluation of factors that they deemed to be material, including those factors described above, the Board of Trustees, including the independent Trustees, concluded that the Fund’s investment advisory agreement with MFS should be continued for an additional one-year period, commencing August 1, 2017.
53
PROXY VOTING POLICIES AND INFORMATION
MFS votes proxies on behalf of the fund pursuant to proxy voting policies and procedures that are available without charge, upon request, by calling 1-800-225-2606, by visiting mfs.com (once you have selected “Individual Investor” as your role, click on “Individual Investor Home” in the top navigation and then select “Learn More About Proxy Voting” under the “I want to…” header on the left hand column of the page), or by visiting the SEC’s Web site at http://www.sec.gov.
Information regarding how the fund voted proxies relating to portfolio securities during the most recent twelve-month period ended June 30 is available by August 31 of each year without charge by visiting mfs.com (once you have selected “Individual Investor” as your role, click on “Individual Investor Home” in the top navigation and then select “Learn More About Proxy Voting” under the “I want to…” header on the left hand column of the page), or by visiting the SEC’s Web site at http://www.sec.gov.
QUARTERLY PORTFOLIO DISCLOSURE
The fund will file a complete schedule of portfolio holdings with the Securities and Exchange Commission (the Commission) for the first and third quarters of each fiscal year on Form N-Q. A shareholder can obtain the quarterly portfolio holdings report at mfs.com. The fund’s Form N-Q is also available on the EDGAR database on the Commission’s Internet Web site at http://www.sec.gov, and may be reviewed and copied at the:
Public Reference Room
Securities and Exchange Commission
100 F Street, NE, Room 1580
Washington, D.C. 20549
Information on the operation of the Public Reference Room may be obtained by calling the Commission at 1-800-SEC-0330. Copies of the fund’s Form N-Q also may be obtained, upon payment of a duplicating fee, by electronic request at the following e-mail address: publicinfo@sec.gov or by writing the Public Reference Section at the above address.
FURTHER INFORMATION
From time to time, MFS may post important information about the fund or the MFS funds on the MFS web site (mfs.com). This information is available on mfs.com by following these steps once you have selected “Individual Investor” as your role: (1) Click on the “Individual Investor Home” in the top navigation and then select the “Announcements” option within the “Market Outlooks” drop down, or (2) Click on “Products & Services” and “Mutual Funds” and then choose the fund’s name in the “Select a fund” menu.
54
INFORMATION ABOUT FUND CONTRACTS AND LEGAL CLAIMS
The fund has entered into contractual arrangements with an investment adviser, administrator, distributor, shareholder servicing agent, 529 program manager (if applicable), and custodian who each provide services to the fund. Unless expressly stated otherwise, shareholders are not parties to, or intended beneficiaries of these contractual arrangements, and these contractual arrangements are not intended to create any shareholder right to enforce them against the service providers or to seek any remedy under them against the service providers, either directly or on behalf of the fund.
Under the Trust’s By-Laws and Declaration of Trust, any claims asserted against or on behalf of the MFS Funds, including claims against Trustees and Officers, must be brought in state and federal courts located within the Commonwealth of Massachusetts.
FEDERAL TAX INFORMATION (unaudited)
The fund will notify shareholders of amounts for use in preparing 2017 income tax forms in January 2018. The following information is provided pursuant to provisions of the Internal Revenue Code.
The fund designates the maximum amount allowable as qualified dividend income eligible to be taxed at the same rate as long-term capital gain.
Income derived from foreign sources was $166,340,964. The fund intends to pass through foreign tax credits of $14,613,028 for the fiscal year.
55
rev. 3/16
| | | | |
| | | |
FACTS | | WHAT DOES MFS DO WITH YOUR PERSONAL INFORMATION? | |  |
| | |
| Why? | | Financial companies choose how they share your personal information. Federal law gives consumers the right to limit some but not all sharing. Federal law also requires us to tell you how we collect, share, and protect your personal information. Please read this notice carefully to understand what we do. |
| | |
| What? | | The types of personal information we collect and share depend on the product or service you have with us. This information can include: • Social Security number and account balances • Account transactions and transaction history • Checking account information and wire transfer instructions When you are no longer our customer, we continue to share your information as described in this notice. |
| | |
| How? | | All financial companies need to share customers’ personal information to run their everyday business. In the section below, we list the reasons financial companies can share their customers’ personal information; the reasons MFS chooses to share; and whether you can limit this sharing. |
| | | | |
Reasons we can share your
personal information | | Does MFS
share? | | Can you limit
this sharing? |
For our everyday business purposes – such as to process your transactions, maintain your account(s), respond to court orders and legal investigations, or report to credit bureaus | | Yes | | No |
For our marketing purposes – to offer our products and services to you | | No | | We don’t share |
For joint marketing with other financial companies | | No | | We don’t share |
For our affiliates’ everyday business purposes – information about your transactions and experiences | | No | | We don’t share |
For our affiliates’ everyday business purposes – information about your creditworthiness | | No | | We don’t share |
| For nonaffiliates to market to you | | No | | We don’t share |
| | |
| Questions? | | Call 800-225-2606 or go to mfs.com. |
56
| | |
| Who we are |
| Who is providing this notice? | | MFS Funds, MFS Investment Management, MFS Institutional Advisors, Inc., and MFS Heritage Trust Company. |
| | |
| What we do |
| How does MFS protect my personal information? | | To protect your personal information from unauthorized access and use, we use security measures that comply with federal law. These measures include procedural, electronic, and physical safeguards for the protection of the personal information we collect about you. |
| How does MFS collect my personal information? | | We collect your personal information, for example, when you • open an account or provide account information • direct us to buy securities or direct us to sell your securities • make a wire transfer We also collect your personal information from others, such as credit bureaus, affiliates, or other companies. |
| Why can’t I limit all sharing? | | Federal law gives you the right to limit only • sharing for affiliates’ everyday business purposes – information about your creditworthiness • affiliates from using your information to market to you • sharing for nonaffiliates to market to you State laws and individual companies may give you additional rights to limit sharing. |
| | |
| Definitions |
| Affiliates | | Companies related by common ownership or control. They can be financial and nonfinancial companies. • MFS does not share personal information with affiliates, except for everyday business purposes as described on page one of this notice. |
| Nonaffiliates | | Companies not related by common ownership or control. They can be financial and nonfinancial companies. • MFS does not share with nonaffiliates so they can market to you. |
| Joint marketing | | A formal agreement between nonaffiliated financial companies that together market financial products or services to you. • MFS doesn’t jointly market. |
| | |
| Other important information |
| If you own an MFS product or receive an MFS service in the name of a third party such as a bank or broker-dealer, their privacy policy may apply to you instead of ours. |
57
Save paper with eDelivery.

| MFS® will send you prospectuses, |
reports, and proxies directly via e-mail so you will get information faster with less mailbox clutter.
To sign up:
1. Go to mfs.com.
2. Log in via MFS® Access.
3. Select eDelivery.
If you own your MFS fund shares through a financial institution or a retirement plan, MFS® TALK, MFS® Access, or eDelivery may not be available to you.
CONTACT
WEB SITE
mfs.com
MFS TALK
1-800-637-8255
24 hours a day
ACCOUNT SERVICE AND LITERATURE
Shareholders
1-800-225-2606
Financial advisors
1-800-343-2829
Retirement plan services
1-800-637-1255
MAILING ADDRESS
MFS Service Center, Inc.
P.O. Box 55824
Boston, MA 02205-5824
OVERNIGHT MAIL
MFS Service Center, Inc.
c/o Boston Financial Data Services
30 Dan Road
Canton, MA 02021-2809
ANNUAL REPORT
August 31, 2017

MFS® TECHNOLOGY FUND

SCT-ANN
MFS® TECHNOLOGY FUND
CONTENTS
The report is prepared for the general information of shareholders.
It is authorized for distribution to prospective investors only when preceded or accompanied by a current prospectus.
NOT FDIC INSURED • MAY LOSE VALUE • NO BANK GUARANTEE

LETTER FROM THE EXECUTIVE CHAIRMAN
Dear Shareholders:
Despite policy uncertainty accompanying a new presidential administration in the United States and unease over ongoing Brexit negotiations, most markets have proved
resilient. U.S. share prices have reached new highs in recent months although the U.S. Federal Reserve has continued to gradually hike interest rates. However, rates in most developed markets remain very low, with major non-U.S. central banks just beginning to contemplate curbing accommodative monetary policies.
Globally, we’ve experienced a year-long synchronized upturn in economic growth. Despite better growth, there are few immediate signs of worrisome inflation amid muted wage gains around the world. Europe has benefited from diminishing event risks as populist challengers fell short of upsetting establishment
candidates in both the Dutch and French elections. Emerging market economies have been boosted in part by a weaker U.S. dollar and are recovering despite lingering concerns over the potential for restrictive U.S. trade policies that could hamper global trade growth. Looking ahead, markets will have to contend with issues involving geopolitical hot spots on the Korean peninsula and in the Middle East.
At MFS®, we believe time is an asset. A patient, long-term approach to investing can have a powerful impact on decision making and outcomes. Time arbitrage, as we call it, comes down to having the conviction and discipline to allow enough time for good investment ideas to play out. In our view, such an approach, along with the professional guidance of a financial advisor, will help you reach your investment objectives.
Respectfully,

Robert J. Manning
Executive Chairman
MFS Investment Management
October 17, 2017
The opinions expressed in this letter are subject to change and may not be relied upon for investment advice. No forecasts can be guaranteed.
1
PORTFOLIO COMPOSITION
Portfolio structure
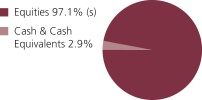
| | | | |
| Top ten holdings | | | | |
| Alphabet, Inc., “A” | | | 10.0% | |
| Facebook, Inc., “A” | | | 9.6% | |
| Amazon.com, Inc. | | | 5.8% | |
| Microsoft Corp. | | | 4.2% | |
| DXC Technology Co. | | | 3.9% | |
| Salesforce.com, Inc. | | | 3.9% | |
| Adobe Systems, Inc. | | | 3.6% | |
| Visa, Inc., “A” | | | 3.6% | |
| Apple, Inc. | | | 2.9% | |
| Mastercard, Inc., “A” | | | 2.6% | |
| | | | |
| Top five industries | | | | |
| Internet | | | 24.2% | |
| Business Services | | | 14.7% | |
| Computer Software | | | 13.0% | |
| Computer Software-Systems | | | 10.2% | |
| Electronics (s) | | | 6.5% | |
| (s) | Includes securities sold short. |
Cash & Cash Equivalents includes any cash, investments in money market funds, short-term securities, and other assets less liabilities. Please see the Statement of Assets and Liabilities for additional information related to the fund’s cash position and other assets and liabilities.
Percentages are based on net assets as of August 31, 2017.
The portfolio is actively managed and current holdings may be different.
2
MANAGEMENT REVIEW
Summary of Results
For the twelve months ended August 31, 2017, Class A shares of the MFS Technology Fund (“fund”) provided a total return of 28.58%, at net asset value. This compares with a return of 16.23% for the fund’s benchmark, the Standard & Poor’s 500 Stock Index and a return of 29.27% for the fund’s other benchmark, the Standard & Poor’s North American Technology Sector Index.
Market Environment
For the first time in many years, the global economy is experiencing a period of synchronized economic growth. The rebound in emerging markets (“EM”) economies has been more pronounced (despite the deceleration in Chinese growth at the end of the period), helped by larger economies such as Brazil and Russia emerging from recessions. At the same time, developed markets (“DM”) economies continued to grow at or above potential. Market confidence increased in the US after the presidential elections in November in anticipation of lower taxes, a lighter regulatory burden and increased infrastructure spending, boosting US equities and corporate bond performance. Though hopes have largely faded for pro-growth US policies, market confidence persists. Globally, markets benefited from a reflation trade during the first half of the period as commodity prices strengthened, activity and growth prospects improved, and inflation moved higher, though within moderate bounds. While this bump in global inflation faded in the second half of the period as commodity prices, particularly oil, leveled off or declined, global growth remained relatively resilient. As a result, there have been more tightening signals and actions by DM central banks. The US Federal Reserve increased interest rates by 25 basis points during the second half of the period, bringing the total number of quarter-percent hikes in the federal funds rate to four since December 2015. The European Central Bank appears set to announce tapering of quantitative easing in the fall of 2017. The Bank of England may also begin reducing monetary accommodation. Markets have been comforted, along with central banks, by the decline in fears of a populist surge in Europe after establishment candidates won the Dutch and French elections. European growth has reflected the calmer political economic backdrop.
In recent months, the US dollar reversed the sharp rise seen early in the period, easing what had been a substantial headwind to earnings for multinationals. US consumer spending held up well during the second half of the period amid a modest increase in real wages and relatively low gasoline prices. Demand for autos reached near-record territory in the first half of the period before tapering off at the end of the period, while the housing market continued its recovery amid relatively low mortgage rates and tight inventories. Global trade, which was sluggish early in the period, showed signs of improvement in the period’s second half, a positive indicator of global economic activity and prospects. Early in the period, the US election resulted in a sell-off in EM assets due to fears that President Trump would follow through on various campaign threats and promises that were judged to be detrimental to EM. While President Trump withdrew the US from the Trans-Pacific Partnership and began the renegotiation of the North American Free Trade Agreement, significant additional
3
Management Review – continued
policy action has so far been lacking on economic issues involving EM. As a result, emerging markets resumed their upward trajectory, powered by strong inflows throughout the first half of 2017.
Detractors from Performance
Weak stock selection and, to a lesser extent, an underweight position in the computer systems industry weakened the fund’s performance relative to the Standard & Poor’s North American Technology Sector Index. The fund’s underweight positions in computer and personal electronics maker Apple and computer hard drive maker Western Digital, and holdings of IT solutions provider Presidio (b), held back relative results. Shares of Apple advanced during the reporting period on the back of better-than-expected earnings results and anticipation of the release of new iPhone models this fall.
Elsewhere, not holding shares of technology company NVIDIA, and overweight positions in internet search giant Alphabet and business services company Fleetcor Technologies Inc (h), detracted from relative performance. Shares of FleetCor declined after management reported results which were lower than market consensus estimates, and following reports that the company had engaged in unfair pricing practices. Additionally, the fund’s holdings of stock exchange Nasdaq (b) and business services company Equifax (b), and not holding shares of semiconductor manufacturer Micron Technology, hindered relative returns.
The fund’s cash and/or cash equivalents position during the period was another detractor from relative performance. Under normal market conditions, the fund strives to be fully invested and generally holds cash to buy new holdings and to provide liquidity. In a period when markets rose, as measured by the fund’s benchmark, holding cash hurt performance versus the benchmark, which has no cash position.
Contributors to Performance
An underweight position in the network & telecom industry bolstered relative performance. Within this industry, the fund’s underweight positions in wireless communications software company QUALCOMM (h) and network technology firm Cisco Systems (h) contributed to relative results. Shares of QUALCOMM fell following licensing disputes with Apple.
Strong stock selection in the internet industry also benefited relative results, led by the fund’s holdings of online and mobile commerce company Alibaba Group Holding (b) (China). Shares of Alibaba Group Holding appreciated after the company reported strong earnings results, driven by outperformance in its core commerce and cloud computing services. Management also announced greater-than-expected sales guidance, which further supported the stock.
Other top relative contributors for the period included the fund’s short positions in shares of computer semiconductor company Intel and diversified technology products and services company International Business Machines (IBM) (h). Shares of Intel depreciated after the company announced it was to acquire Israeli technology company Mobileye. In addition, declining platform volumes and desktop volumes also pressured the stock. The fund’s overweight positions in laser solutions provider Coherent (h), digital marketing and digital media solutions provider Adobe Systems Inc.
4
Management Review – continued
semiconductor manufacturer Microchip Technology, IT services and solutions company DXC Technology and video game maker Electronic Arts, further contributed to relative returns.
Respectfully,
|
| Portfolio Manager(s) |
| Matthew Sabel |
| (b) | Security is not a benchmark constituent. |
| (h) | Security was not held in the portfolio at period end. |
The views expressed in this report are those of the portfolio manager(s) only through the end of the period of the report as stated on the cover and do not necessarily reflect the views of MFS or any other person in the MFS organization. These views are subject to change at any time based on market or other conditions, and MFS disclaims any responsibility to update such views. These views may not be relied upon as investment advice or an indication of trading intent on behalf of any MFS portfolio. References to specific securities are not recommendations of such securities, and may not be representative of any MFS portfolio’s current or future investments.
5
PERFORMANCE SUMMARY THROUGH 8/31/17
The following chart illustrates a representative class of the fund’s historical performance in comparison to its benchmark(s). Performance results include the deduction of the maximum applicable sales charge and reflect the percentage change in net asset value, including reinvestment of dividends and capital gains distributions. The performance of other share classes will be greater than or less than that of the class depicted below. Benchmarks are unmanaged and may not be invested in directly. Benchmark returns do not reflect sales charges, commissions or expenses. (See Notes to Performance Summary.)
Performance data shown represents past performance and is no guarantee of future results. Investment return and principal value fluctuate so your shares, when sold, may be worth more or less than the original cost; current performance may be lower or higher than quoted. The performance shown does not reflect the deduction of taxes, if any, that a shareholder would pay on fund distributions or the redemption of fund shares.
Growth of a Hypothetical $10,000 Investment
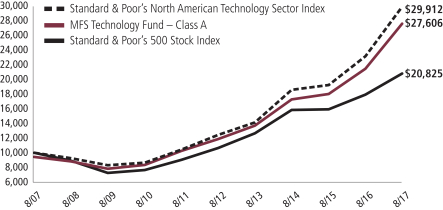
6
Performance Summary – continued
Total Returns through 8/31/17
Average annual without sales charge
| | | | | | | | | | | | | | |
| | | Share Class | | Class Inception Date | | 1-yr | | 5-yr | | 10-yr | | Life (t) | | |
| | | A | | 1/02/97 | | 28.58% | | 18.39% | | 11.35% | | N/A | | |
| | | B | | 4/14/00 | | 27.60% | | 17.49% | | 10.52% | | N/A | | |
| | | C | | 4/14/00 | | 27.62% | | 17.49% | | 10.52% | | N/A | | |
| | | I | | 1/02/97 | | 28.91% | | 18.67% | | 11.64% | | N/A | | |
| | | R1 | | 4/01/05 | | 27.63% | | 17.50% | | 10.52% | | N/A | | |
| | | R2 | | 10/31/03 | | 28.27% | | 18.08% | | 11.07% | | N/A | | |
| | | R3 | | 4/01/05 | | 28.59% | | 18.38% | | 11.35% | | N/A | | |
| | | R4 | | 4/01/05 | | 28.92% | | 18.67% | | 11.63% | | N/A | | |
| | | R6 | | 1/02/13 | | 29.03% | | N/A | | N/A | | 20.08% | | |
| Comparative benchmark(s) | | | | | | | | | | |
| | | Standard & Poor’s 500 Stock Index (f) | | 16.23% | | 14.34% | | 7.61% | | N/A | | |
| | | Standard & Poor’s North American Technology Sector
Index (f) | | 29.27% | | 19.17% | | 11.58% | | N/A | | |
| Average annual with sales charge | | | | | | | | | | |
| | | A
With Initial Sales Charge (5.75%) | | 21.19% | | 17.00% | | 10.69% | | N/A | | |
| | | B
With CDSC (Declining over six years from 4% to 0%) (v) | | 23.60% | | 17.28% | | 10.52% | | N/A | | |
| | | C
With CDSC (1% for 12 months) (v) | | 26.62% | | 17.49% | | 10.52% | | N/A | | |
CDSC – Contingent Deferred Sales Charge.
Class I, R1, R2, R3, R4, and R6 shares do not have a sales charge.
Effective August 26, 2016, Class R5 shares were renamed Class R6 shares.
| (f) | Source: FactSet Research Systems Inc. |
| (t) | For the period from the class inception date through the stated period end (for those share classes with less than 10 years of performance history). No comparative benchmark performance information is provided for “life” periods. (See Notes to Performance Summary.) |
| (v) | Assuming redemption at the end of the applicable period. |
Benchmark Definition(s)
Standard & Poor’s 500 Stock Index – a market capitalization-weighted index of 500 widely held equity securities, designed to measure broad U.S. equity performance.
Standard & Poor’s North American Technology Sector Index – a modified market capitalization-weighted index that measures the performance of selected technology stocks.
It is not possible to invest directly in an index.
7
Performance Summary – continued
Notes to Performance Summary
Average annual total return represents the average annual change in value for each share class for the periods presented. Life returns are presented where the share class has less than 10 years of performance history and represent the average annual total return from the class inception date to the stated period end date. As the fund’s share classes may have different inception dates, the life returns may represent different time periods and may not be comparable. As a result, no comparative benchmark performance information is provided for life periods.
Performance results reflect any applicable expense subsidies and waivers in effect during the periods shown. Without such subsidies and waivers the fund’s performance results would be less favorable. Please see the prospectus and financial statements for complete details.
Performance results do not include adjustments made for financial reporting purposes in accordance with U.S. generally accepted accounting principles and may differ from amounts reported in the financial highlights.
From time to time the fund may receive proceeds from litigation settlements, without which performance would be lower.
8
EXPENSE TABLE
Fund expenses borne by the shareholders during the period, March 1, 2017 through August 31, 2017
As a shareholder of the fund, you incur two types of costs: (1) transaction costs, including sales charges (loads) on certain purchase or redemption payments, and (2) ongoing costs, including management fees; distribution and service (12b-1) fees; and other fund expenses. This example is intended to help you understand your ongoing costs (in dollars) of investing in the fund and to compare these costs with the ongoing costs of investing in other mutual funds.
The example is based on an investment of $1,000 invested at the beginning of the period and held for the entire period March 1, 2017 through August 31, 2017.
Actual Expenses
The first line for each share class in the following table provides information about actual account values and actual expenses. You may use the information in this line, together with the amount you invested, to estimate the expenses that you paid over the period. Simply divide your account value by $1,000 (for example, an $8,600 account value divided by $1,000 = 8.6), then multiply the result by the number in the first line under the heading entitled “Expenses Paid During Period” to estimate the expenses you paid on your account during this period.
Hypothetical Example for Comparison Purposes
The second line for each share class in the following table provides information about hypothetical account values and hypothetical expenses based on the fund’s actual expense ratio and an assumed rate of return of 5% per year before expenses, which is not the fund’s actual return. The hypothetical account values and expenses may not be used to estimate the actual ending account balance or expenses you paid for the period. You may use this information to compare the ongoing costs of investing in the fund and other funds. To do so, compare this 5% hypothetical example with the 5% hypothetical examples that appear in the shareholder reports of the other funds.
Please note that the expenses shown in the table are meant to highlight your ongoing costs only and do not reflect any transactional costs, such as sales charges (loads). Therefore, the second line for each share class in the table is useful in comparing ongoing costs only, and will not help you determine the relative total costs of owning different funds. In addition, if these transactional costs were included, your costs would have been higher.
9
Expense Table – continued
| | | | | | | | | | | | | | | | | | |
Share
Class | | | | Annualized Expense Ratio | | | Beginning Account Value
3/01/17 | | | Ending Account Value 8/31/17 | | | Expenses Paid During Period (p) 3/01/17-8/31/17 | |
| A | | Actual | | | 1.22% | | | | $1,000.00 | | | | $1,180.34 | | | | $6.70 | |
| | Hypothetical (h) | | | 1.22% | | | | $1,000.00 | | | | $1,019.06 | | | | $6.21 | |
| B | | Actual | | | 1.97% | | | | $1,000.00 | | | | $1,175.37 | | | | $10.80 | |
| | Hypothetical (h) | | | 1.97% | | | | $1,000.00 | | | | $1,015.27 | | | | $10.01 | |
| C | | Actual | | | 1.97% | | | | $1,000.00 | | | | $1,175.76 | | | | $10.80 | |
| | Hypothetical (h) | | | 1.97% | | | | $1,000.00 | | | | $1,015.27 | | | | $10.01 | |
| I | | Actual | | | 0.97% | | | | $1,000.00 | | | | $1,181.79 | | | | $5.33 | |
| | Hypothetical (h) | | | 0.97% | | | | $1,000.00 | | | | $1,020.32 | | | | $4.94 | |
| R1 | | Actual | | | 1.97% | | | | $1,000.00 | | | | $1,175.72 | | | | $10.80 | |
| | Hypothetical (h) | | | 1.97% | | | | $1,000.00 | | | | $1,015.27 | | | | $10.01 | |
| R2 | | Actual | | | 1.47% | | | | $1,000.00 | | | | $1,178.68 | | | | $8.07 | |
| | Hypothetical (h) | | | 1.47% | | | | $1,000.00 | | | | $1,017.80 | | | | $7.48 | |
| R3 | | Actual | | | 1.22% | | | | $1,000.00 | | | | $1,180.40 | | | | $6.70 | |
| | Hypothetical (h) | | | 1.22% | | | | $1,000.00 | | | | $1,019.06 | | | | $6.21 | |
| R4 | | Actual | | | 0.97% | | | | $1,000.00 | | | | $1,181.64 | | | | $5.33 | |
| | Hypothetical (h) | | | 0.97% | | | | $1,000.00 | | | | $1,020.32 | | | | $4.94 | |
| R6 | | Actual | | | 0.88% | | | | $1,000.00 | | | | $1,182.19 | | | | $4.84 | |
| | Hypothetical (h) | | | 0.88% | | | | $1,000.00 | | | | $1,020.77 | | | | $4.48 | |
| (h) | 5% class return per year before expenses. |
| (p) | “Expenses Paid During Period” are equal to each class’s annualized expense ratio, as shown above, multiplied by the average account value over the period, multiplied by 184/365 (to reflect the one-half year period). Expenses paid do not include any applicable sales charges (loads). If these transaction costs had been included, your costs would have been higher. |
Notes to Expense Table
Expense ratios include 0.02% of investment related expenses from short sales (See Note 2 of the Notes to Financial Statements).
10
PORTFOLIO OF INVESTMENTS
8/31/17
The Portfolio of Investments is a complete list of all securities owned by your fund. It is categorized by broad-based asset classes.
| | | | | | | | |
| Common Stocks - 97.3% | | | | | | | | |
| Issuer | | Shares/Par | | | Value ($) | |
| Aerospace - 2.1% | | | | | | | | |
| Harris Corp. | | | 58,473 | | | $ | 7,186,332 | |
| Leidos Holdings, Inc. | | | 98,033 | | | | 5,717,285 | |
| Northrop Grumman Corp. | | | 19,159 | | | | 5,215,271 | |
| | | | | | | | |
| | | | | | | $ | 18,118,888 | |
| Broadcasting - 2.1% | | | | | | | | |
| Netflix, Inc. (a) | | | 104,474 | | | $ | 18,252,653 | |
| | |
| Brokerage & Asset Managers - 1.7% | | | | | | | | |
| Intercontinental Exchange, Inc. | | | 74,566 | | | $ | 4,822,183 | |
| NASDAQ, Inc. | | | 131,960 | | | | 9,947,145 | |
| | | | | | | | |
| | | | | | | $ | 14,769,328 | |
| Business Services - 14.7% | | | | | | | | |
| Cognizant Technology Solutions Corp., “A” | | | 275,558 | | | $ | 19,501,240 | |
| DXC Technology Co. | | | 400,030 | | | | 34,002,550 | |
| Equifax, Inc. | | | 30,628 | | | | 4,363,571 | |
| Fidelity National Information Services, Inc. | | | 167,344 | | | | 15,549,604 | |
| First Data Corp. (a) | | | 274,672 | | | | 5,056,712 | |
| Fiserv, Inc. (a) | | | 83,474 | | | | 10,326,569 | |
| Global Payments, Inc. | | | 146,127 | | | | 13,953,667 | |
| Grand Canyon Education, Inc. (a) | | | 63,378 | | | | 5,200,165 | |
| PayPal Holdings, Inc. (a) | | | 103,428 | | | | 6,379,439 | |
| Ringcentral, Inc. (a) | | | 102,726 | | | | 4,350,446 | |
| Total System Services, Inc. | | | 53,510 | | | | 3,698,611 | |
| Verisk Analytics, Inc., “A” (a) | | | 48,365 | | | | 3,919,983 | |
| | | | | | | | |
| | | | | | | $ | 126,302,557 | |
| Cable TV - 2.3% | | | | | | | | |
| Altice USA, Inc. (a) | | | 279,930 | | | $ | 8,540,664 | |
| Comcast Corp., “A” | | | 282,797 | | | | 11,484,386 | |
| | | | | | | | |
| | | | | | | $ | 20,025,050 | |
| Computer Software - 13.0% | | | | | | | | |
| Adobe Systems, Inc. (a) | | | 201,420 | | | $ | 31,252,327 | |
| Cadence Design Systems, Inc. (a) | | | 149,194 | | | | 5,861,832 | |
| Microsoft Corp. | | | 479,128 | | | | 35,824,401 | |
| PTC, Inc. (a) | | | 107,810 | | | | 6,037,360 | |
| Salesforce.com, Inc. (a) | | | 349,597 | | | | 33,383,018 | |
| | | | | | | | |
| | | | | | | $ | 112,358,938 | |
11
Portfolio of Investments – continued
| | | | | | | | |
| Issuer | | Shares/Par | | | Value ($) | |
| Common Stocks - continued | | | | | | | | |
| Computer Software - Systems - 10.2% | | | | | | | | |
| Apple, Inc. | | | 150,741 | | | $ | 24,721,524 | |
| Constellation Software, Inc. | | | 20,226 | | | | 11,246,547 | |
| EPAM Systems, Inc. (a) | | | 57,424 | | | | 4,670,294 | |
| New Relic, Inc. (a) | | | 84,778 | | | | 4,060,866 | |
| Presidio, Inc. (a) | | | 795,053 | | | | 11,059,187 | |
| Rapid7, Inc. (a) | | | 219,079 | | | | 3,693,672 | |
| ServiceNow, Inc. (a) | | | 57,995 | | | | 6,738,439 | |
| SS&C Technologies Holdings, Inc. | | | 189,906 | | | | 7,351,261 | |
| Verint Systems, Inc. (a) | | | 125,456 | | | | 4,980,603 | |
| Western Digital Corp. | | | 103,366 | | | | 9,124,117 | |
| | | | | | | | |
| | | | | | | $ | 87,646,510 | |
| Consumer Services - 1.6% | | | | | | | | |
| Priceline Group, Inc. (a) | | | 7,539 | | | $ | 13,962,831 | |
| | |
| Electrical Equipment - 1.3% | | | | | | | | |
| Amphenol Corp., “A” | | | 136,508 | | | $ | 11,048,957 | |
| | |
| Electronics - 6.7% | | | | | | | | |
| Applied Materials, Inc. | | | 189,892 | | | $ | 8,567,927 | |
| Broadcom Corp. | | | 83,257 | | | | 20,986,592 | |
| MACOM Technology Solutions Holdings, Inc. (a) | | | 66,566 | | | | 3,031,416 | |
| Mercury Systems, Inc. (a) | | | 91,308 | | | | 4,405,611 | |
| Microchip Technology, Inc. | | | 179,754 | | | | 15,602,647 | |
| NXP Semiconductors N.V. (a) | | | 7,425 | | | | 838,728 | |
| Silicon Laboratories, Inc. (a) | | | 56,659 | | | | 4,300,418 | |
| | | | | | | | |
| | | | | | | $ | 57,733,339 | |
| Internet - 24.2% | | | | | | | | |
| Alibaba Group Holding Ltd., ADR (a) | | | 109,739 | | | $ | 18,846,576 | |
| Alphabet, Inc., “A” (a)(s) | | | 90,087 | | | | 86,054,706 | |
| Facebook, Inc., “A” (a)(s) | | | 480,401 | | | | 82,614,560 | |
| Godaddy, Inc. (a) | | | 156,732 | | | | 7,024,729 | |
| GrubHub, Inc. (a) | | | 72,191 | | | | 4,121,384 | |
| LogMeIn, Inc. | | | 58,688 | | | | 6,713,907 | |
| Wix.com Ltd. (a) | | | 43,772 | | | | 2,849,557 | |
| | | | | | | | |
| | | | | | | $ | 208,225,419 | |
| Leisure & Toys - 4.2% | | | | | | | | |
| Activision Blizzard, Inc. | | | 221,531 | | | $ | 14,523,571 | |
| Electronic Arts, Inc. (a) | | | 132,928 | | | | 16,150,752 | |
| Take-Two Interactive Software, Inc. (a) | | | 56,986 | | | | 5,572,661 | |
| | | | | | | | |
| | | | | | | $ | 36,246,984 | |
12
Portfolio of Investments – continued
| | | | | | | | |
| Issuer | | Shares/Par | | | Value ($) | |
| Common Stocks - continued | | | | | | | | |
| Other Banks & Diversified Financials - 6.2% | | | | | | | | |
| Mastercard, Inc., “A” | | | 166,098 | | | $ | 22,140,863 | |
| Visa, Inc., “A” | | | 300,379 | | | | 31,095,234 | |
| | | | | | | | |
| | | | | | | $ | 53,236,097 | |
| Printing & Publishing - 0.6% | | | | | | | | |
| IHS Markit Ltd. (a) | | | 106,177 | | | $ | 4,973,331 | |
| | |
| Specialty Stores - 5.7% | | | | | | | | |
| Amazon.com, Inc. (a)(s) | | | 50,498 | | | $ | 49,518,339 | |
| | |
| Telecommunications - Wireless - 0.7% | | | | | | | | |
| American Tower Corp., REIT | | | 39,940 | | | $ | 5,913,117 | |
| Total Common Stocks (Identified Cost, $522,492,032) | | | | | | $ | 838,332,338 | |
| | |
| Investment Companies (h) - 2.9% | | | | | | | | |
| Money Market Funds - 2.9% | | | | | | | | |
MFS Institutional Money Market Portfolio, 1.11% (v)
(Identified Cost, $24,816,746) | | | 24,817,058 | | | $ | 24,817,059 | |
| | |
| Securities Sold Short - (0.2)% | | | | | | | | |
| Electronics - (0.2)% | | | | | | | | |
| Intel Corp. (Proceeds Received, $1,758,675) | | | (48,991 | ) | | $ | (1,718,114 | ) |
| | |
| Other Assets, Less Liabilities - 0.0% | | | | | | | (348,467 | ) |
| Net Assets - 100.0% | | | | | | $ | 861,082,816 | |
| (a) | Non-income producing security. |
| (h) | An affiliated issuer may be considered one in which the fund owns 5% or more of the outstanding voting securities, or a company which is under common control. At period end, the aggregate values of the fund’s investments in affiliated issuers and in unaffiliated issuers were $24,817,059 and $838,332,338, respectively. |
| (s) | Security or a portion of the security was pledged to cover collateral requirements for securities sold short and/or certain derivative transactions. |
| (v) | Affiliated issuer that is available only to investment companies managed by MFS. The rate quoted for the MFS Institutional Money Market Portfolio is the annualized seven-day yield of the fund at period end. |
At August 31, 2017, the fund had cash collateral of $290,032 and other liquid securities with an aggregate value of $3,975,799 to cover collateral or margin obligations for securities sold short and certain derivative contracts. Cash collateral is comprised of deposits with brokers in the Statement of Assets and Liabilities.
The following abbreviations are used in this report and are defined:
| ADR | | American Depositary Receipt |
| REIT | | Real Estate Investment Trust |
See Notes to Financial Statements
13
Financial Statements
STATEMENT OF ASSETS AND LIABILITIES
At 8/31/17
This statement represents your fund’s balance sheet, which details the assets and liabilities comprising the total value of the fund.
| | | | |
| Assets | | | | |
Investments in unaffiliated issuers, at value (identified cost, $522,492,032) | | | $838,332,338 | |
Investments in affiliated issuers, at value (identified cost, $24,816,746) | | | 24,817,059 | |
Deposits with brokers for securities sold short | | | 290,032 | |
Receivables for | | | | |
Fund shares sold | | | 2,103,095 | |
Dividends | | | 370,972 | |
Other assets | | | 804 | |
Total assets | | | $865,914,300 | |
| Liabilities | | | | |
Payables for | | | | |
Dividends on securities sold short | | | $13,350 | |
Securities sold short, at value (proceeds received, $1,758,675) | | | 1,718,114 | |
Fund shares reacquired | | | 2,707,840 | |
Payable to affiliates | | | | |
Investment adviser | | | 35,422 | |
Shareholder servicing costs | | | 209,766 | |
Distribution and service fees | | | 12,415 | |
Payable for independent Trustees’ compensation | | | 639 | |
Accrued expenses and other liabilities | | | 133,938 | |
Total liabilities | | | $4,831,484 | |
Net assets | | | $861,082,816 | |
| Net assets consist of | | | | |
Paid-in capital | | | $517,399,443 | |
Unrealized appreciation (depreciation) | | | 315,881,180 | |
Accumulated net realized gain (loss) | | | 27,802,820 | |
Accumulated net investment loss | | | (627 | ) |
Net assets | | | $861,082,816 | |
Shares of beneficial interest outstanding | | | 24,253,336 | |
14
Statement of Assets and Liabilities – continued
| | | | | | | | | | | | |
| | | Net assets | | | Shares
outstanding | | | Net asset value
per share (a) | |
Class A | | | $359,697,861 | | | | 10,083,818 | | | | $35.67 | |
Class B | | | 34,396,022 | | | | 1,098,717 | | | | 31.31 | |
Class C | | | 101,656,449 | | | | 3,253,653 | | | | 31.24 | |
Class I | | | 174,274,771 | | | | 4,598,221 | | | | 37.90 | |
Class R1 | | | 4,256,001 | | | | 136,479 | | | | 31.18 | |
Class R2 | | | 23,625,420 | | | | 691,419 | | | | 34.17 | |
Class R3 | | | 53,198,953 | | | | 1,491,965 | | | | 35.66 | |
Class R4 | | | 14,442,919 | | | | 390,843 | | | | 36.95 | |
Class R6 | | | 95,534,420 | | | | 2,508,221 | | | | 38.09 | |
| (a) | Maximum offering price per share was equal to the net asset value per share for all share classes, except for Class A, for which the maximum offering price per share was $37.85 [100 / 94.25 x $35.67]. On sales of $50,000 or more, the maximum offering price of Class A shares is reduced. A contingent deferred sales charge may be imposed on redemptions of Class A, Class B, and Class C shares. Redemption price per share was equal to the net asset value per share for Classes I, R1, R2, R3, R4, and R6. |
See Notes to Financial Statements
15
Financial Statements
STATEMENT OF OPERATIONS
Year ended 8/31/17
This statement describes how much your fund earned in investment income and accrued in expenses. It also describes any gains and/or losses generated by fund operations.
| | | | |
| Net investment income (loss) | | | | |
Income | | | | |
Dividends | | | $4,137,529 | |
Dividends from affiliated issuers | | | 150,920 | |
Interest | | | 54,307 | |
Income on securities loaned | | | 23,238 | |
Other | | | 1,463 | |
Foreign taxes withheld | | | (11,946 | ) |
Total investment income | | | $4,355,511 | |
Expenses | | | | |
Management fee | | | $5,448,744 | |
Distribution and service fees | | | 2,223,915 | |
Shareholder servicing costs | | | 886,643 | |
Administrative services fee | | | 124,731 | |
Independent Trustees’ compensation | | | 14,353 | |
Custodian fee | | | 45,145 | |
Reimbursement of custodian expenses | | | (25,973 | ) |
Shareholder communications | | | 109,724 | |
Audit and tax fees | | | 59,467 | |
Legal fees | | | 9,346 | |
Dividend and interest expense on securities sold short | | | 281,032 | |
Miscellaneous | | | 205,609 | |
Total expenses | | | $9,382,736 | |
Reduction of expenses by investment adviser and distributor | | | (69,345 | ) |
Net expenses | | | $9,313,391 | |
Net investment income (loss) | | | $(4,957,880 | ) |
| Realized and unrealized gain (loss) | | | | |
Realized gain (loss) (identified cost basis) | | | | |
Unaffiliated issuers | | | $45,737,985 | |
Affiliated issuers | | | (1,414 | ) |
Written options | | | 291,947 | |
Foreign currency | | | (12,516 | ) |
Net realized gain (loss) | | | $46,016,002 | |
Change in unrealized appreciation (depreciation) | | | | |
Unaffiliated issuers | | | $147,188,044 | |
Affiliated issuers | | | 313 | |
Written options | | | (59,505 | ) |
Securities sold short | | | 40,561 | |
Net unrealized gain (loss) | | | $147,169,413 | |
Net realized and unrealized gain (loss) | | | $193,185,415 | |
Change in net assets from operations | | | $188,227,535 | |
See Notes to Financial Statements
16
Financial Statements
STATEMENTS OF CHANGES IN NET ASSETS
These statements describe the increases and/or decreases in net assets resulting from operations, any distributions, and any shareholder transactions.
| | | | | | | | |
| | | Year ended | |
| | | 8/31/17 | | | 8/31/16 | |
| Change in net assets | | | | | | |
| From operations | | | | | | | | |
Net investment income (loss) | | | $(4,957,880 | ) | | | $(2,648,809 | ) |
Net realized gain (loss) | | | 46,016,002 | | | | 8,521,898 | |
Net unrealized gain (loss) | | | 147,169,413 | | | | 74,439,807 | |
Change in net assets from operations | | | $188,227,535 | | | | $80,312,896 | |
| Distributions declared to shareholders | | | | | | | | |
From net realized gain | | | $(12,086,828 | ) | | | $(17,116,057 | ) |
Change in net assets from fund share transactions | | | $86,447,267 | | | | $181,028,652 | |
Total change in net assets | | | $262,587,974 | | | | $244,225,491 | |
| Net assets | | | | | | | | |
At beginning of period | | | 598,494,842 | | | | 354,269,351 | |
At end of period (including accumulated net investment loss of $627 and $1,877,291, respectively) | | | $861,082,816 | | | | $598,494,842 | |
See Notes to Financial Statements
17
Financial Statements
FINANCIAL HIGHLIGHTS
The financial highlights table is intended to help you understand the fund’s financial performance for the past 5 years (or life of a particular share class, if shorter). Certain information reflects financial results for a single fund share. The total returns in the table represent the rate that an investor would have earned (or lost) on an investment in the fund share class (assuming reinvestment of all distributions) held for the entire period.
| | | | | | | | | | | | | | | | | | | | |
| Class A | | Year ended | |
| | | 8/31/17 | | | 8/31/16 | | | 8/31/15 | | | 8/31/14 | | | 8/31/13 | |
Net asset value, beginning of period | | | $28.27 | | | | $24.62 | | | | $24.47 | | | | $19.41 | | | | $16.80 | |
| Income (loss) from investment operations | | | | | | | | | | | | | | | | | |
Net investment income (loss) (d) | | | $(0.19 | )(c) | | | $(0.12 | ) | | | $(0.15 | ) | | | $(0.13 | ) | | | $(0.12 | ) |
Net realized and unrealized gain (loss) | | | 8.13 | | | | 4.76 | | | | 1.15 | | | | 5.19 | | | | 2.73 | |
Total from investment operations | | | $7.94 | | | | $4.64 | | | | $1.00 | | | | $5.06 | | | | $2.61 | |
| Less distributions declared to shareholders | | | | | | | | | | | | | | | | | |
From net realized gain | | | $(0.54 | ) | | | $(0.99 | ) | | | $(0.85 | ) | | | $— | | | | $— | |
Net asset value, end of period (x) | | | $35.67 | | | | $28.27 | | | | $24.62 | | | | $24.47 | | | | $19.41 | |
Total return (%) (r)(s)(t)(x) | | | 28.58 | (c) | | | 19.20 | | | | 4.18 | | | | 26.07 | | | | 15.54 | |
Ratios (%) (to average net assets)
and Supplemental data: | | | | | | | | | | | | | | | | | |
Expenses before expense reductions (f) | | | 1.24 | (c) | | | 1.27 | | | | 1.30 | | | | 1.33 | | | | 1.55 | |
Expenses after expense reductions (f) | | | 1.23 | (c) | | | 1.26 | | | | 1.29 | | | | 1.32 | | | | 1.54 | |
Net investment income (loss) | | | (0.63 | )(c) | | | (0.48 | ) | | | (0.60 | ) | | | (0.58 | ) | | | (0.70 | ) |
Portfolio turnover | | | 43 | | | | 30 | | | | 43 | | | | 38 | | | | 54 | |
Net assets at end of period (000 omitted) | | | $359,698 | | | | $320,898 | | | | $199,313 | | | | $171,020 | | | | $141,147 | |
| Supplemental Ratios (%): | | | | | | | | | | | | | | | | | |
Ratio of expenses to average net assets after
expense reductions excluding short sale
expenses and interest expense and fees (f) | | | 1.19 | (c) | | | 1.24 | | | | 1.27 | | | | 1.28 | | | | 1.36 | |
See Notes to Financial Statements
18
Financial Highlights – continued
| | | | | | | | | | | | | | | | | | | | |
| Class B | | Year ended | |
| | | 8/31/17 | | | 8/31/16 | | | 8/31/15 | | | 8/31/14 | | | 8/31/13 | |
Net asset value, beginning of period | | | $25.06 | | | | $22.09 | | | | $22.20 | | | | $17.75 | | | | $15.48 | |
| Income (loss) from investment operations | | | | | | | | | | | | | | | | | |
Net investment income (loss) (d) | | | $(0.38 | )(c) | | | $(0.28 | ) | | | $(0.30 | ) | | | $(0.27 | ) | | | $(0.23 | ) |
Net realized and unrealized gain (loss) | | | 7.17 | | | | 4.24 | | | | 1.04 | | | | 4.72 | | | | 2.50 | |
Total from investment operations | | | $6.79 | | | | $3.96 | | | | $0.74 | | | | $4.45 | | | | $2.27 | |
| Less distributions declared to shareholders | | | | | | | | | | | | | | | | | |
From net realized gain | | | $(0.54 | ) | | | $(0.99 | ) | | | $(0.85 | ) | | | $— | | | | $— | |
Net asset value, end of period (x) | | | $31.31 | | | | $25.06 | | | | $22.09 | | | | $22.20 | | | | $17.75 | |
Total return (%) (r)(s)(t)(x) | | | 27.64 | (c) | | | 18.29 | | | | 3.41 | | | | 25.07 | | | | 14.66 | |
Ratios (%) (to average net assets)
and Supplemental data: | | | | | | | | | | | | | | | | | |
Expenses before expense reductions (f) | | | 1.99 | (c) | | | 2.02 | | | | 2.05 | | | | 2.08 | | | | 2.30 | |
Expenses after expense reductions (f) | | | 1.98 | (c) | | | 2.01 | | | | 2.04 | | | | 2.07 | | | | 2.29 | |
Net investment income (loss) | | | (1.38 | )(c) | | | (1.22 | ) | | | (1.35 | ) | | | (1.34 | ) | | | (1.44 | ) |
Portfolio turnover | | | 43 | | | | 30 | | | | 43 | | | | 38 | | | | 54 | |
Net assets at end of period (000 omitted) | | | $34,396 | | | | $25,990 | | | | $18,791 | | | | $16,190 | | | | $13,009 | |
| Supplemental Ratios (%): | | | | | | | | | | | | | | | | | |
Ratio of expenses to average net assets after
expense reductions excluding short sale
expenses and interest expense and fees (f) | | | 1.94 | (c) | | | 1.99 | | | | 2.02 | | | | 2.03 | | | | 2.12 | |
See Notes to Financial Statements
19
Financial Highlights – continued
| | | | | | | | | | | | | | | | | | | | |
| Class C | | Year ended | |
| | | 8/31/17 | | | 8/31/16 | | | 8/31/15 | | | 8/31/14 | | | 8/31/13 | |
Net asset value, beginning of period | | | $25.01 | | | | $22.05 | | | | $22.16 | | | | $17.71 | | | | $15.45 | |
| Income (loss) from investment operations | | | | | | | | | | | | | | | | | |
Net investment income (loss) (d) | | | $(0.38 | )(c) | | | $(0.28 | ) | | | $(0.30 | ) | | | $(0.28 | ) | | | $(0.24 | ) |
Net realized and unrealized gain (loss) | | | 7.15 | | | | 4.23 | | | | 1.04 | | | | 4.73 | | | | 2.50 | |
Total from investment operations | | | $6.77 | | | | $3.95 | | | | $0.74 | | | | $4.45 | | | | $2.26 | |
| Less distributions declared to shareholders | | | | | | | | | | | | | | | | | |
From net realized gain | | | $(0.54 | ) | | | $(0.99 | ) | | | $(0.85 | ) | | | $— | | | | $— | |
Net asset value, end of period (x) | | | $31.24 | | | | $25.01 | | | | $22.05 | | | | $22.16 | | | | $17.71 | |
Total return (%) (r)(s)(t)(x) | | | 27.62 | (c) | | | 18.28 | | | | 3.42 | | | | 25.13 | | | | 14.63 | |
Ratios (%) (to average net assets)
and Supplemental data: | | | | | | | | | | | | | | | | | |
Expenses before expense reductions (f) | | | 1.99 | (c) | | | 2.02 | | | | 2.05 | | | | 2.07 | | | | 2.30 | |
Expenses after expense reductions (f) | | | 1.98 | (c) | | | 2.01 | | | | 2.04 | | | | 2.07 | | | | 2.30 | |
Net investment income (loss) | | | (1.38 | )(c) | | | (1.23 | ) | | | (1.35 | ) | | | (1.34 | ) | | | (1.45 | ) |
Portfolio turnover | | | 43 | | | | 30 | | | | 43 | | | | 38 | | | | 54 | |
Net assets at end of period (000 omitted) | | | $101,656 | | | | $73,071 | | | | $43,037 | | | | $35,998 | | | | $25,026 | |
| Supplemental Ratios (%): | | | | | | | | | | | | | | | | | |
Ratio of expenses to average net assets after
expense reductions excluding short sale
expenses and interest expense and fees (f) | | | 1.94 | (c) | | | 2.00 | | | | 2.02 | | | | 2.03 | | | | 2.12 | |
See Notes to Financial Statements
20
Financial Highlights – continued
| | | | | | | | | | | | | | | | | | | | |
| Class I | | Year ended | |
| | | 8/31/17 | | | 8/31/16 | | | 8/31/15 | | | 8/31/14 | | | 8/31/13 | |
Net asset value, beginning of period | | | $29.93 | | | | $25.96 | | | | $25.69 | | | | $20.33 | | | | $17.56 | |
| Income (loss) from investment operations | | | | | | | | | | | | | | | | | |
Net investment income (loss) (d) | | | $(0.13 | )(c) | | | $(0.07 | ) | | | $(0.09 | ) | | | $(0.08 | ) | | | $(0.08 | ) |
Net realized and unrealized gain (loss) | | | 8.64 | | | | 5.03 | | | | 1.21 | | | | 5.44 | | | | 2.85 | |
Total from investment operations | | | $8.51 | | | | $4.96 | | | | $1.12 | | | | $5.36 | | | | $2.77 | |
| Less distributions declared to shareholders | | | | | | | | | | | | | | | | | |
From net realized gain | | | $(0.54 | ) | | | $(0.99 | ) | | | $(0.85 | ) | | | $— | | | | $— | |
Net asset value, end of period (x) | | | $37.90 | | | | $29.93 | | | | $25.96 | | | | $25.69 | | | | $20.33 | |
Total return (%) (r)(s)(t)(x) | | | 28.91 | (c) | | | 19.45 | | | | 4.45 | | | | 26.36 | | | | 15.77 | |
Ratios (%) (to average net assets)
and Supplemental data: | | | | | | | | | | | | | | | | | |
Expenses before expense reductions (f) | | | 0.99 | (c) | | | 1.02 | | | | 1.05 | | | | 1.08 | | | | 1.30 | |
Expenses after expense reductions (f) | | | 0.98 | (c) | | | 1.01 | | | | 1.04 | | | | 1.07 | | | | 1.30 | |
Net investment income (loss) | | | (0.39 | )(c) | | | (0.24 | ) | | | (0.35 | ) | | | (0.35 | ) | | | (0.45 | ) |
Portfolio turnover | | | 43 | | | | 30 | | | | 43 | | | | 38 | | | | 54 | |
Net assets at end of period (000 omitted) | | | $174,275 | | | | $96,700 | | | | $56,619 | | | | $40,359 | | | | $30,615 | |
| Supplemental Ratios (%): | | | | | | | | | | | | | | | | | |
Ratio of expenses to average net assets after
expense reductions excluding short sale
expenses and interest expense and fees (f) | | | 0.95 | (c) | | | 1.00 | | | | 1.02 | | | | 1.04 | | | | 1.12 | |
See Notes to Financial Statements
21
Financial Highlights – continued
| | | | | | | | | | | | | | | | | | | | |
| Class R1 | | Year ended | |
| | | 8/31/17 | | | 8/31/16 | | | 8/31/15 | | | 8/31/14 | | | 8/31/13 | |
Net asset value, beginning of period | | | $24.96 | | | | $22.01 | | | | $22.12 | | | | $17.68 | | | | $15.42 | |
| Income (loss) from investment operations | | | | | | | | | | | | | | | | | |
Net investment income (loss) (d) | | | $(0.38 | )(c) | | | $(0.28 | ) | | | $(0.30 | ) | | | $(0.27 | ) | | | $(0.23 | ) |
Net realized and unrealized gain (loss) | | | 7.14 | | | | 4.22 | | | | 1.04 | | | | 4.71 | | | | 2.49 | |
Total from investment operations | | | $6.76 | | | | $3.94 | | | | $0.74 | | | | $4.44 | | | | $2.26 | |
| Less distributions declared to shareholders | | | | | | | | | | | | | | | | | |
From net realized gain | | | $(0.54 | ) | | | $(0.99 | ) | | | $(0.85 | ) | | | $— | | | | $— | |
Net asset value, end of period (x) | | | $31.18 | | | | $24.96 | | | | $22.01 | | | | $22.12 | | | | $17.68 | |
Total return (%) (r)(s)(t)(x) | | | 27.63 | (c) | | | 18.27 | | | | 3.43 | | | | 25.11 | | | | 14.66 | |
Ratios (%) (to average net assets)
and Supplemental data: | | | | | | | | | | | | | | | | | |
Expenses before expense reductions (f) | | | 1.99 | (c) | | | 2.02 | | | | 2.05 | | | | 2.08 | | | | 2.30 | |
Expenses after expense reductions (f) | | | 1.98 | (c) | | | 2.01 | | | | 2.04 | | | | 2.07 | | | | 2.30 | |
Net investment income (loss) | | | (1.38 | )(c) | | | (1.22 | ) | | | (1.36 | ) | | | (1.34 | ) | | | (1.45 | ) |
Portfolio turnover | | | 43 | | | | 30 | | | | 43 | | | | 38 | | | | 54 | |
Net assets at end of period (000 omitted) | | | $4,256 | | | | $3,073 | | | | $2,516 | | | | $2,033 | | | | $1,542 | |
| Supplemental Ratios (%): | | | | | | | | | | | | | | | | | |
Ratio of expenses to average net assets after
expense reductions excluding short sale
expenses and interest expense and fees (f) | | | 1.95 | (c) | | | 1.99 | | | | 2.02 | | | | 2.04 | | | | 2.12 | |
See Notes to Financial Statements
22
Financial Highlights – continued
| | | | | | | | | | | | | | | | | | | | |
| Class R2 | | Year ended | |
| | | 8/31/17 | | | 8/31/16 | | | 8/31/15 | | | 8/31/14 | | | 8/31/13 | |
Net asset value, beginning of period | | | $27.17 | | | | $23.76 | | | | $23.70 | | | | $18.85 | | | | $16.36 | |
| Income (loss) from investment operations | | | | | | | | | | | | | | | | | |
Net investment income (loss) (d) | | | $(0.26 | )(c) | | | $(0.18 | ) | | | $(0.20 | ) | | | $(0.18 | ) | | | $(0.16 | ) |
Net realized and unrealized gain (loss) | | | 7.80 | | | | 4.58 | | | | 1.11 | | | | 5.03 | | | | 2.65 | |
Total from investment operations | | | $7.54 | | | | $4.40 | | | | $0.91 | | | | $4.85 | | | | $2.49 | |
| Less distributions declared to shareholders | | | | | | | | | | | | | | | | | |
From net realized gain | | | $(0.54 | ) | | | $(0.99 | ) | | | $(0.85 | ) | | | $— | | | | $— | |
Net asset value, end of period (x) | | | $34.17 | | | | $27.17 | | | | $23.76 | | | | $23.70 | | | | $18.85 | |
Total return (%) (r)(s)(t)(x) | | | 28.27 | (c) | | | 18.88 | | | | 3.93 | | | | 25.73 | | | | 15.22 | |
Ratios (%) (to average net assets)
and Supplemental data: | | | | | | | | | | | | | | | | | |
Expenses before expense reductions (f) | | | 1.49 | (c) | | | 1.52 | | | | 1.55 | | | | 1.58 | | | | 1.79 | |
Expenses after expense reductions (f) | | | 1.49 | (c) | | | 1.51 | | | | 1.54 | | | | 1.58 | | | | 1.79 | |
Net investment income (loss) | | | (0.89 | )(c) | | | (0.72 | ) | | | (0.84 | ) | | | (0.83 | ) | | | (0.94 | ) |
Portfolio turnover | | | 43 | | | | 30 | | | | 43 | | | | 38 | | | | 54 | |
Net assets at end of period (000 omitted) | | | $23,625 | | | | $17,031 | | | | $14,946 | | | | $17,123 | | | | $15,890 | |
| Supplemental Ratios (%): | | | | | | | | | | | | | | | | | |
Ratio of expenses to average net assets after
expense reductions excluding short sale
expenses and interest expense and fees (f) | | | 1.45 | (c) | | | 1.49 | | | | 1.52 | | | | 1.54 | | | | 1.62 | |
See Notes to Financial Statements
23
Financial Highlights – continued
| | | | | | | | | | | | | | | | | | | | |
| Class R3 | | Year ended | |
| | | 8/31/17 | | | 8/31/16 | | | 8/31/15 | | | 8/31/14 | | | 8/31/13 | |
Net asset value, beginning of period | | | $28.26 | | | | $24.61 | | | | $24.46 | | | | $19.41 | | | | $16.80 | |
| Income (loss) from investment operations | | | | | | | | | | | | | | | | | |
Net investment income (loss) (d) | | | $(0.20 | )(c) | | | $(0.13 | ) | | | $(0.15 | ) | | | $(0.13 | ) | | | $(0.12 | ) |
Net realized and unrealized gain (loss) | | | 8.14 | | | | 4.77 | | | | 1.15 | | | | 5.18 | | | | 2.73 | |
Total from investment operations | | | $7.94 | | | | $4.64 | | | | $1.00 | | | | $5.05 | | | | $2.61 | |
| Less distributions declared to shareholders | | | | | | | | | | | | | | | | | |
From net realized gain | | | $(0.54 | ) | | | $(0.99 | ) | | | $(0.85 | ) | | | $— | | | | $— | |
Net asset value, end of period (x) | | | $35.66 | | | | $28.26 | | | | $24.61 | | | | $24.46 | | | | $19.41 | |
Total return (%) (r)(s)(t)(x) | | | 28.59 | (c) | | | 19.21 | | | | 4.18 | | | | 26.02 | | | | 15.54 | |
Ratios (%) (to average net assets)
and Supplemental data: | | | | | | | | | | | | | | | | | |
Expenses before expense reductions (f) | | | 1.24 | (c) | | | 1.27 | | | | 1.30 | | | | 1.33 | | | | 1.55 | |
Expenses after expense reductions (f) | | | 1.23 | (c) | | | 1.26 | | | | 1.29 | | | | 1.32 | | | | 1.55 | |
Net investment income (loss) | | | (0.65 | )(c) | | | (0.49 | ) | | | (0.60 | ) | | | (0.59 | ) | | | (0.70 | ) |
Portfolio turnover | | | 43 | | | | 30 | | | | 43 | | | | 38 | | | | 54 | |
Net assets at end of period (000 omitted) | | | $53,199 | | | | $20,180 | | | | $9,732 | | | | $10,626 | | | | $8,863 | |
| Supplemental Ratios (%): | | | | | | | | | | | | | | | | | |
Ratio of expenses to average net assets after
expense reductions excluding short sale
expenses and interest expense and fees (f) | | | 1.20 | (c) | | | 1.25 | | | | 1.27 | | | | 1.29 | | | | 1.37 | |
See Notes to Financial Statements
24
Financial Highlights – continued
| | | | | | | | | | | | | | | | | | | | |
| Class R4 | | Year ended | |
| | | 8/31/17 | | | 8/31/16 | | | 8/31/15 | | | 8/31/14 | | | 8/31/13 | |
Net asset value, beginning of period | | | $29.19 | | | | $25.34 | | | | $25.10 | | | | $19.86 | | | | $17.15 | |
| Income (loss) from investment operations | | | | | | | | | | | | | | | | | |
Net investment income (loss) (d) | | | $(0.13 | )(c) | | | $(0.06 | ) | | | $(0.09 | ) | | | $(0.08 | ) | | | $(0.08 | ) |
Net realized and unrealized gain (loss) | | | 8.43 | | | | 4.90 | | | | 1.18 | | | | 5.32 | | | | 2.79 | |
Total from investment operations | | | $8.30 | | | | $4.84 | | | | $1.09 | | | | $5.24 | | | | $2.71 | |
| Less distributions declared to shareholders | | | | | | | | | | | | | | | | | |
From net realized gain | | | $(0.54 | ) | | | $(0.99 | ) | | | $(0.85 | ) | | | $— | | | | $— | |
Net asset value, end of period (x) | | | $36.95 | | | | $29.19 | | | | $25.34 | | | | $25.10 | | | | $19.86 | |
Total return (%) (r)(s)(t)(x) | | | 28.92 | (c) | | | 19.45 | | | | 4.44 | | | | 26.38 | | | | 15.80 | |
Ratios (%) (to average net assets)
and Supplemental data: | | | | | | | | | | | | | | | | | |
Expenses before expense reductions (f) | | | 0.99 | (c) | | | 1.02 | | | | 1.05 | | | | 1.07 | | | | 1.29 | |
Expenses after expense reductions (f) | | | 0.99 | (c) | | | 1.01 | | | | 1.04 | | | | 1.07 | | | | 1.29 | |
Net investment income (loss) | | | (0.39 | )(c) | | | (0.24 | ) | | | (0.37 | ) | | | (0.34 | ) | | | (0.45 | ) |
Portfolio turnover | | | 43 | | | | 30 | | | | 43 | | | | 38 | | | | 54 | |
Net assets at end of period (000 omitted) | | | $14,443 | | | | $8,141 | | | | $2,234 | | | | $1,403 | | | | $1,269 | |
| Supplemental Ratios (%): | | | | | | | | | | | | | | | | | |
Ratio of expenses to average net assets after
expense reductions excluding short sale
expenses and interest expense and fees (f) | | | 0.95 | (c) | | | 1.00 | | | | 1.02 | | | | 1.04 | | | | 1.12 | |
See Notes to Financial Statements
25
Financial Highlights – continued
| | | | | | | | | | | | | | | | | | | | |
| Class R6 | | Year ended | |
| | | 8/31/17 | | | 8/31/16 | | | 8/31/15 | | | 8/31/14 | | | 8/31/13 (i) | |
Net asset value, beginning of period | | | $30.05 | | | | $26.03 | | | | $25.73 | | | | $20.34 | | | | $17.68 | |
| Income (loss) from investment operations | | | | | | | | | | | | | | | | | |
Net investment income (loss) (d) | | | $(0.10 | )(c) | | | $(0.04 | ) | | | $(0.07 | ) | | | $(0.07 | ) | | | $(0.04 | ) |
Net realized and unrealized gain (loss) | | | 8.68 | | | | 5.05 | | | | 1.22 | | | | 5.46 | | | | 2.70 | |
Total from investment operations | | | $8.58 | | | | $5.01 | | | | $1.15 | | | | $5.39 | | | | $2.66 | |
| Less distributions declared to shareholders | | | | | | | | | | | | | | | | | |
From net realized gain | | | $(0.54 | ) | | | $(0.99 | ) | | | $(0.85 | ) | | | $— | | | | $— | |
Net asset value, end of period (x) | | | $38.09 | | | | $30.05 | | | | $26.03 | | | | $25.73 | | | | $20.34 | |
Total return (%) (r)(s)(t)(x) | | | 29.03 | (c) | | | 19.59 | | | | 4.57 | | | | 26.50 | | | | 15.05 | (n) |
Ratios (%) (to average net assets)
and Supplemental data: | | | | | | | | | | | | | | | | | |
Expenses before expense reductions (f) | | | 0.90 | (c) | | | 0.92 | | | | 0.95 | | | | 0.97 | | | | 1.13 | (a) |
Expenses after expense reductions (f) | | | 0.89 | (c) | | | 0.91 | | | | 0.94 | | | | 0.96 | | | | 1.13 | (a) |
Net investment income (loss) | | | (0.30 | )(c) | | | (0.13 | ) | | | (0.27 | ) | | | (0.28 | ) | | | (0.35 | )(a) |
Portfolio turnover | | | 43 | | | | 30 | | | | 43 | | | | 38 | | | | 54 | |
Net assets at end of period (000 omitted) | | | $95,534 | | | | $33,411 | | | | $7,079 | | | | $2,429 | | | | $116 | |
| Supplemental Ratios (%): | | | | | | | | | | | | | | | | | |
Ratio of expenses to average net assets after
expense reductions excluding short sale
expenses and interest expense and fees (f) | | | 0.85 | (c) | | | 0.90 | | | | 0.92 | | | | 0.95 | | | | 1.01 | (a) |
| (c) | Amount reflects a one-time reimbursement of expenses by the custodian (or former custodian) without which net investment income and performance would be lower and expenses would be higher. See Note 2 in the Notes to Financial Statements for additional information. |
| (d) | Per share data is based on average shares outstanding. |
| (f) | Ratios do not reflect reductions from fees paid indirectly, if applicable. |
| (i) | For the period from the class inception, January 2, 2013, through the stated period end. |
| (r) | Certain expenses have been reduced without which performance would have been lower. |
| (s) | From time to time the fund may receive proceeds from litigation settlements, without which performance would be lower. |
| (t) | Total returns do not include any applicable sales charges. |
| (x) | The net asset values and total returns have been calculated on net assets which include adjustments made in accordance with U.S. generally accepted accounting principles required at period end for financial reporting purposes. |
See Notes to Financial Statements
26
NOTES TO FINANCIAL STATEMENTS
(1) Business and Organization
MFS Technology Fund (the fund) is a non-diversified series of MFS Series Trust I (the trust). The trust is organized as a Massachusetts business trust and is registered under the Investment Company Act of 1940, as amended, as an open-end management investment company.
The fund is an investment company and accordingly follows the investment company accounting and reporting guidance of the Financial Accounting Standards Board (FASB) Accounting Standards Codification Topic 946 Financial Services – Investment Companies.
(2) Significant Accounting Policies
General – The preparation of financial statements in conformity with U.S. generally accepted accounting principles requires management to make estimates and assumptions that affect the reported amounts of assets and liabilities, and disclosure of contingent assets and liabilities at the date of the financial statements and the reported amounts of increases and decreases in net assets from operations during the reporting period. Actual results could differ from those estimates. In the preparation of these financial statements, management has evaluated subsequent events occurring after the date of the fund’s Statement of Assets and Liabilities through the date that the financial statements were issued. The fund invests primarily in securities of issuers in the technology industry. Issuers in a single industry can react similarly to market, economic, political and regulatory conditions and developments.
In October 2016, the Securities and Exchange Commission (SEC) released its Final Rule on Investment Company Reporting Modernization (the “Rule”). The Rule, which introduced two new regulatory reporting forms for investment companies – Form N-PORT and Form N-CEN – also contained amendments to Regulation S-X which impact financial statement presentation, particularly the presentation of derivative investments, for all reporting periods ending after August 1, 2017. The fund has adopted the Rule’s Regulation S-X amendments and believes that the fund’s financial statements are in compliance with those amendments.
Balance Sheet Offsetting – The fund’s accounting policy with respect to balance sheet offsetting is that, absent an event of default by the counterparty or a termination of the agreement, the International Swaps and Derivatives Association (ISDA) Master Agreement does not result in an offset of reported amounts of financial assets and financial liabilities in the Statement of Assets and Liabilities across transactions between the fund and the applicable counterparty. The fund’s right to setoff may be restricted or prohibited by the bankruptcy or insolvency laws of the particular jurisdiction to which a specific master netting agreement counterparty is subject. Balance sheet offsetting disclosures, to the extent applicable to the fund, have been included in the fund’s Significant Accounting Policies note under the captions for each of the fund’s in-scope financial instruments and transactions.
Investment Valuations – Equity securities, including restricted equity securities and equity securities held short, are generally valued at the last sale or official closing price on their primary market or exchange as provided by a third-party pricing service. Equity
27
Notes to Financial Statements – continued
securities, for which there were no sales reported that day, are generally valued at the last quoted daily bid quotation on their primary market or exchange as provided by a third-party pricing service. Equity securities held short, for which there were no sales reported for that day, are generally valued at the last quoted daily ask quotation on their primary market or exchange as provided by a third-party pricing service. Short-term instruments with a maturity at issuance of 60 days or less may be valued at amortized cost, which approximates market value. Exchange-traded options are generally valued at the last sale or official closing price on their primary exchange as provided by a third-party pricing service. Exchange-traded options for which there were no sales reported that day are generally valued at the last daily bid quotation on their primary exchange as provided by a third-party pricing service. Options not traded on an exchange are generally valued at a broker/dealer bid quotation. Foreign currency options are generally valued at valuations provided by a third-party pricing service. Open-end investment companies are generally valued at net asset value per share. Securities and other assets generally valued on the basis of information from a third-party pricing service may also be valued at a broker/dealer bid quotation. Values obtained from third-party pricing services can utilize both transaction data and market information such as yield, quality, coupon rate, maturity, type of issue, trading characteristics, and other market data. The values of foreign securities and other assets and liabilities expressed in foreign currencies are converted to U.S. dollars using the mean of bid and asked prices for rates provided by a third-party pricing service.
The Board of Trustees has delegated primary responsibility for determining or causing to be determined the value of the fund’s investments (including any fair valuation) to the adviser pursuant to valuation policies and procedures approved by the Board. If the adviser determines that reliable market quotations are not readily available, investments are valued at fair value as determined in good faith by the adviser in accordance with such procedures under the oversight of the Board of Trustees. Under the fund’s valuation policies and procedures, market quotations are not considered to be readily available for most types of debt instruments and floating rate loans and many types of derivatives. These investments are generally valued at fair value based on information from third-party pricing services. In addition, investments may be valued at fair value if the adviser determines that an investment’s value has been materially affected by events occurring after the close of the exchange or market on which the investment is principally traded (such as foreign exchange or market) and prior to the determination of the fund’s net asset value, or after the halting of trading of a specific security where trading does not resume prior to the close of the exchange or market on which the security is principally traded. Events that occur on a frequent basis after foreign markets close (such as developments in foreign markets and significant movements in the U.S. markets) and prior to the determination of the fund’s net asset value may be deemed to have a material effect on the value of securities traded in foreign markets. Accordingly, the fund’s foreign equity securities may often be valued at fair value. The adviser generally relies on third-party pricing services or other information (such as the correlation with price movements of similar securities in the same or other markets; the type, cost and investment characteristics of the security; the business and financial condition of the issuer; and trading and other market data) to assist in determining whether to fair value and at what value to fair value an investment. The value of an
28
Notes to Financial Statements – continued
investment for purposes of calculating the fund’s net asset value can differ depending on the source and method used to determine value. When fair valuation is used, the value of an investment used to determine the fund’s net asset value may differ from quoted or published prices for the same investment. There can be no assurance that the fund could obtain the fair value assigned to an investment if it were to sell the investment at the same time at which the fund determines its net asset value per share.
Various inputs are used in determining the value of the fund’s assets or liabilities. These inputs are categorized into three broad levels. In certain cases, the inputs used to measure fair value may fall into different levels of the fair value hierarchy. In such cases, an investment’s level within the fair value hierarchy is based on the lowest level of input that is significant to the fair value measurement. The fund’s assessment of the significance of a particular input to the fair value measurement in its entirety requires judgment, and considers factors specific to the investment. Level 1 includes unadjusted quoted prices in active markets for identical assets or liabilities. Level 2 includes other significant observable market-based inputs (including quoted prices for similar securities, interest rates, prepayment speed, and credit risk). Level 3 includes unobservable inputs, which may include the adviser’s own assumptions in determining the fair value of investments. The following is a summary of the levels used as of August 31, 2017 in valuing the fund’s assets or liabilities:
| | | | | | | | | | | | | | | | |
| Investments at Value | | Level 1 | | | Level 2 | | | Level 3 | | | Total | |
| Equity Securities | | | $838,332,338 | | | | $— | | | | $— | | | | $838,332,338 | |
| Mutual Funds | | | 24,817,059 | | | | — | | | | — | | | | 24,817,059 | |
| Total Investments | | | $863,149,397 | | | | $— | | | | $— | | | | $863,149,397 | |
| Securities Sold Short | | | $(1,718,114 | ) | | | $— | | | | $— | | | | $(1,718,114 | ) |
For further information regarding security characteristics, see the Portfolio of Investments.
Foreign Currency Translation – Purchases and sales of foreign investments, income, and expenses are converted into U.S. dollars based upon currency exchange rates prevailing on the respective dates of such transactions or on the reporting date for foreign denominated receivables and payables. Gains and losses attributable to foreign currency exchange rates on sales of securities are recorded for financial statement purposes as net realized gains and losses on investments. Gains and losses attributable to foreign exchange rate movements on receivables, payables, income and expenses are recorded for financial statement purposes as foreign currency transaction gains and losses. That portion of both realized and unrealized gains and losses on investments that results from fluctuations in foreign currency exchange rates is not separately disclosed.
Derivatives – The fund uses derivatives for different purposes, primarily to increase or decrease exposure to a particular market or segment of the market, or security, to increase or decrease interest rate or currency exposure, or as alternatives to direct investments. Derivatives are used for hedging or non-hedging purposes. While hedging can reduce or eliminate losses, it can also reduce or eliminate gains. When the fund uses derivatives as an investment to increase market exposure, or for hedging purposes, gains and losses from derivative instruments may be substantially greater than the derivative’s original cost.
29
Notes to Financial Statements – continued
The derivative instruments used by the fund were written options and purchased options. Depending on the type of derivative, the fund may exit a derivative position by entering into an offsetting transaction with a counterparty or exchange, negotiating an agreement with the derivative counterparty, or novating the position to a third party. At August 31, 2017, the fund did not have any outstanding derivative instruments.
The following table presents, by major type of derivative contract, the realized gain (loss) on derivatives held by the fund for the year ended August 31, 2017 as reported in the Statement of Operations:
| | | | | | | | |
| Risk | | Investments
(Purchased
Options) | | | Written
Options | |
| Equity | | | $(458,098 | ) | | | $291,947 | |
The following table presents, by major type of derivative contract, the change in unrealized appreciation (depreciation) on derivatives held by the fund for the year ended August 31, 2017 as reported in the Statement of Operations:
| | | | | | | | |
| Risk | | Investments
(Purchased)
Options) | | | Written
Options | |
| Equity | | | $67,607 | | | | $(59,505 | ) |
Derivative counterparty credit risk is managed through formal evaluation of the creditworthiness of all potential counterparties. On certain, but not all, uncleared derivatives, the fund attempts to reduce its exposure to counterparty credit risk whenever possible by entering into an ISDA Master Agreement on a bilateral basis. The ISDA Master Agreement gives each party to the agreement the right to terminate all transactions traded under such agreement if there is a certain deterioration in the credit quality of the other party. Upon an event of default or a termination of the ISDA Master Agreement, the non-defaulting party has the right to close out all transactions traded under such agreement and to net amounts owed under each agreement to one net amount payable by one party to the other. This right to close out and net payments across all transactions traded under the ISDA Master Agreement could result in a reduction of the fund’s credit risk to such counterparty equal to any amounts payable by the fund under the applicable transactions, if any.
Collateral and margin requirements differ by type of derivative. For cleared derivatives (e.g., futures contracts, cleared swaps, and exchange-traded options), margin requirements are set by the clearing broker and the clearing house and collateral, in the form of cash or securities, is posted by the fund directly with the clearing broker. Collateral terms are counterparty agreement specific for uncleared derivatives (e.g., forward foreign currency exchange contracts, uncleared swap agreements, and uncleared options) and collateral, in the form of cash and securities, is held in segregated accounts with the fund’s custodian in connection with these agreements. For derivatives traded under an ISDA Master Agreement, which contains a collateral support annex, the collateral requirements are netted across all transactions traded under such counterparty-specific agreement and one amount is posted from one party to the other to collateralize such obligations. Cash that has been segregated or delivered to cover the fund’s collateral or margin obligations under derivative contracts,
30
Notes to Financial Statements – continued
if any, will be reported separately in the Statement of Assets and Liabilities as restricted cash for uncleared derivatives or deposits with brokers for cleared derivatives, respectively. Securities pledged as collateral or margin for the same purpose, if any, are noted in the Portfolio of Investments. The fund may be required to make payments of interest on uncovered collateral or margin obligations with the broker. Any such payments are included in “Miscellaneous” expense “ in the Statement of Operations.
Written Options – In exchange for a premium, the fund wrote call options on securities for which it anticipated the price would decline and also wrote put options on securities for which it anticipated the price would increase. At the time the option was written, the fund believed the premium received exceeded the potential loss that could result from adverse price changes in the options’ underlying securities. In a written option, the fund as the option writer grants the buyer the right to purchase from, or sell to, the fund a specified number of shares or units of a particular security, currency or index at a specified price within a specified period of time.
The premium received is initially recorded as a liability in the Statement of Assets and Liabilities. The option is subsequently marked-to-market daily with the difference between the premium received and the market value of the written option being recorded as unrealized appreciation or depreciation. When a written option expires, the fund realizes a gain equal to the amount of the premium received. The difference between the premium received and the amount paid on effecting a closing transaction is considered a realized gain or loss. When a written call option is exercised, the premium received is offset against the proceeds to determine the realized gain or loss. When a written put option is exercised, the premium reduces the cost basis of the security purchased by the fund.
At the initiation of the written option contract, for exchange traded options, the fund is required to deposit securities or cash as collateral with the custodian for the benefit of the broker or directly with the clearing broker, based on the type of option. For uncleared options, the fund may post collateral subject to the terms of an ISDA Master Agreement as generally described above if the market value of the options contract moves against it. The fund, as writer of an option, may have no control over whether the underlying securities may be sold (call) or purchased (put) and, as a result, bears the market risk of an unfavorable change in the price of the securities underlying the written option. Losses from writing options can exceed the premium received and can exceed the potential loss from an ordinary buy and sell transaction. Although the fund’s market risk may be significant, the maximum counterparty credit risk to the fund is equal to the market value of any collateral posted to the broker. For uncleared options, this risk is mitigated in cases where there is an ISDA Master Agreement between the fund and the counterparty providing for netting as described above.
Purchased Options – The fund purchased call and put options for a premium. Purchased call and put options entitle the holder to buy and sell a specified number of shares or units of a particular security, currency or index at a specified price at a specified date or within a specified period of time. Purchasing call options may hedge against an anticipated increase in the dollar cost of securities or currency to be acquired or increase the fund’s exposure to an underlying instrument. Purchasing put options
31
Notes to Financial Statements – continued
may hedge against an anticipated decline in the value of portfolio securities or currency or decrease the fund’s exposure to an underlying instrument.
The premium paid is initially recorded as an investment in the Statement of Assets and Liabilities. That investment is subsequently marked-to-market daily with the difference between the premium paid and the market value of the purchased option being recorded as unrealized appreciation or depreciation. Premiums paid for purchased call and put options which have expired are treated as realized losses on investments in the Statement of Operations. Upon the exercise or closing of a purchased call option, the premium paid is added to the cost of the security or financial instrument purchased. Upon the exercise or closing of a purchased put option, the premium paid is offset against the proceeds on the sale of the underlying security or financial instrument in order to determine the realized gain or loss on investments.
Whether or not the option is exercised, the fund’s maximum risk of loss from purchasing an option is the amount of premium paid. All option contracts involve credit risk if the counterparty to the option contract fails to perform. For uncleared options, this risk is mitigated in cases where there is an ISDA Master Agreement between the fund and the counterparty providing for netting as described above and, where applicable, by the posting of collateral by the counterparty to the fund to cover the fund’s exposure to the counterparty under such ISDA Master Agreement.
Short Sales – The fund entered into short sales whereby it sells a security it does not own in anticipation of a decline in the value of that security. The fund will realize a gain if the security price decreases and a loss if the security price increases between the date of the short sale and the date on which the fund replaces the borrowed security. Losses from short sales can exceed the proceeds of the security sold; and they can also exceed the potential loss from an ordinary buy and sell transaction. The amount of any premium, dividends, or interest the fund may be required to pay in connection with a short sale will be recognized as a fund expense. During the year ended August 31, 2017, this expense amounted to $281,032. The fund segregates cash or marketable securities in an amount that, when combined with the amount of proceeds from the short sale deposited with the broker, at least equals the current market value of the security sold short.
Security Loans – Under its Securities Lending Agency Agreement with the fund, State Street Bank and Trust Company (“State Street”), as lending agent, loans the securities of the fund to certain qualified institutions (the ”Borrowers“) approved by the fund. Security loans can be terminated at the discretion of either the lending agent or the fund and the related securities must be returned within the earlier of the standard trade settlement period for such securities or within three business days. The loans are collateralized by cash and/or U.S. Treasury and federal agency obligations in an amount typically at least equal to the market value of the securities loaned. On loans collateralized by cash, the cash collateral is invested in a money market fund. The market value of the loaned securities is determined at the close of business of the fund and any additional required collateral is delivered to the fund on the next business day. State Street provides the fund with indemnification against Borrower default. In the event of Borrower default, State Street will, for the benefit of the fund, either purchase securities identical to those loaned or, when such purchase is commercially
32
Notes to Financial Statements – continued
impracticable, pay the fund the market value of the loaned securities. In return, State Street assumes the fund’s rights to the related collateral. If the collateral value is less than the cost to purchase identical securities, State Street is responsible for the shortfall, but only to the extent that such shortfall is not due to a decline in collateral value resulting from collateral reinvestment for which the fund bears the risk of loss. A portion of the income generated upon investment of the collateral is remitted to the Borrowers, and the remainder is allocated between the fund and the lending agent. On loans collateralized by U.S. Treasury and/or federal agency obligations, a fee is received from the Borrower, and is allocated between the fund and the lending agent. Income from securities lending is separately reported in the Statement of Operations. The dividend and interest income earned on the securities loaned is accounted for in the same manner as other dividend and interest income. At August 31, 2017, there were no securities on loan or collateral outstanding.
Indemnifications – Under the fund’s organizational documents, its officers and Trustees may be indemnified against certain liabilities and expenses arising out of the performance of their duties to the fund. Additionally, in the normal course of business, the fund enters into agreements with service providers that may contain indemnification clauses. The fund’s maximum exposure under these agreements is unknown as this would involve future claims that may be made against the fund that have not yet occurred.
Investment Transactions and Income – Investment transactions are recorded on the trade date. Interest income is recorded on the accrual basis. Dividends received in cash are recorded on the ex-dividend date. Certain dividends from foreign securities will be recorded when the fund is informed of the dividend if such information is obtained subsequent to the ex-dividend date. Dividend and interest payments received in additional securities are recorded on the ex-dividend or ex-interest date in an amount equal to the value of the security on such date.
The fund may receive proceeds from litigation settlements. Any proceeds received from litigation involving portfolio holdings are reflected in the Statement of Operations in realized gain/loss if the security has been disposed of by the fund or in unrealized
gain/loss if the security is still held by the fund. Any other proceeds from litigation not related to portfolio holdings are reflected as other income in the Statement of Operations.
Reimbursement of Expenses by Custodian – In December 2015, the fund’s custodian (or former custodian), State Street Bank and Trust Company, announced that it intended to reimburse its asset servicing clients for expense amounts that it billed in error during the period 1998 through 2015. The amount of this one-time reimbursement attributable to the fund is reflected as ”Reimbursement of custodian expenses“ in the Statement of Operations.
Tax Matters and Distributions – The fund intends to qualify as a regulated investment company, as defined under Subchapter M of the Internal Revenue Code, and to distribute all of its taxable income, including realized capital gains. As a result, no provision for federal income tax is required. The fund’s federal tax returns, when filed, will remain subject to examination by the Internal Revenue Service for a three year period. Management has analyzed the fund’s tax positions taken on federal and
33
Notes to Financial Statements – continued
state tax returns for all open tax years and does not believe that there are any uncertain tax positions that require recognition of a tax liability. Foreign taxes, if any, have been accrued by the fund in the accompanying financial statements in accordance with the applicable foreign tax law. Foreign income taxes may be withheld by certain countries in which the fund invests. Additionally, capital gains realized by the fund on securities issued in or by certain foreign countries may be subject to capital gains tax imposed by those countries.
Distributions to shareholders are recorded on the ex-dividend date. Income and capital gain distributions are determined in accordance with income tax regulations, which may differ from U.S. generally accepted accounting principles. Certain capital accounts in the financial statements are periodically adjusted for permanent differences in order to reflect their tax character. These adjustments have no impact on net assets or net asset value per share. Temporary differences which arise from recognizing certain items of income, expense, gain or loss in different periods for financial statement and tax purposes will reverse at some time in the future. Distributions in excess of net investment income or net realized gains are temporary overdistributions for financial statement purposes resulting from differences in the recognition or classification of income or distributions for financial statement and tax purposes.
Book/tax differences primarily relate to wash sale loss deferrals, straddle loss deferrals, and treating a portion of the proceeds from redemptions as a distribution for tax purposes.
The tax character of distributions declared to shareholders for the last two fiscal years is as follows:
| | | | | | | | |
| | | Year ended
8/31/17 | | | Year ended
8/31/16 | |
| Long-term capital gains | | | $12,086,828 | | | | $17,116,057 | |
The federal tax cost and the tax basis components of distributable earnings were as follows:
| | | | |
| As of 8/31/17 | | | |
| Cost of investments | | | $551,768,458 | |
| Gross appreciation | | | 310,924,823 | |
| Gross depreciation | | | (1,261,998) | |
| Net unrealized appreciation (depreciation) | | | $309,662,825 | |
| Undistributed ordinary income | | | 10,345,364 | |
| Undistributed long-term capital gain | | | 23,675,811 | |
| Other temporary differences | | | (627) | |
Multiple Classes of Shares of Beneficial Interest – The fund offers multiple classes of shares, which differ in their respective distribution and service fees. The fund’s income, realized and unrealized gain (loss), and common expenses are allocated to shareholders based on the daily net assets of each class. Dividends are declared separately for each class. Differences in per share dividend rates are generally due to differences in separate class expenses. Class B shares will convert to Class A shares
34
Notes to Financial Statements – continued
approximately eight years after purchase. The fund’s distributions declared to shareholders as reported in the Statements of Changes in Net Assets are presented by class as follows:
| | | | | | | | |
| | | From net realized gain on
investments | |
| | | Year
ended
8/31/17 | | | Year
ended
8/31/16 | |
| Class A | | | $6,042,407 | | | | $9,437,848 | |
| Class B | | | 564,793 | | | | 911,554 | |
| Class C | | | 1,649,827 | | | | 2,147,972 | |
| Class I | | | 1,747,655 | | | | 2,507,391 | |
| Class R1 | | | 62,501 | | | | 127,045 | |
| Class R2 | | | 357,143 | | | | 631,886 | |
| Class R3 | | | 493,168 | | | | 425,776 | |
| Class R4 | | | 176,204 | | | | 74,453 | |
| Class R6 | | | 993,130 | | | | 852,132 | |
| Total | | | $12,086,828 | | | | $17,116,057 | |
(3) Transactions with Affiliates
Investment Adviser – The fund has an investment advisory agreement with MFS to provide overall investment management and related administrative services and facilities to the fund. The management fee is computed daily and paid monthly at the following annual rates:
| | | | |
| First $1 billion of average daily net assets | | | 0.75 | % |
| Average daily net assets in excess of $1 billion | | | 0.70 | % |
MFS has agreed in writing to reduce its management fee by a specified amount if certain MFS mutual fund assets exceed thresholds agreed to by MFS and the fund’s Board of Trustees. For the year ended August 31, 2017, this management fee reduction amounted to $55,260, which is included in the reduction of total expenses in the Statement of Operations. The management fee incurred for the year ended August 31, 2017 was equivalent to an annual effective rate of 0.74% of the fund’s average daily net assets.
Distributor – MFS Fund Distributors, Inc. (MFD), a wholly-owned subsidiary of MFS, as distributor, received $218,099 for the year ended August 31, 2017, as its portion of the initial sales charge on sales of Class A shares of the fund.
The Board of Trustees has adopted a distribution plan for certain share classes pursuant to Rule 12b-1 of the Investment Company Act of 1940.
The fund’s distribution plan provides that the fund will pay MFD for services provided by MFD and financial intermediaries in connection with the distribution and servicing of certain share classes. One component of the plan is a distribution fee paid to MFD and another component of the plan is a service fee paid to MFD. MFD may subsequently pay all, or a portion, of the distribution and/or service fees to financial intermediaries.
35
Notes to Financial Statements – continued
Distribution Plan Fee Table:
| | | | | | | | | | | | | | | | | | | | |
| | | Distribution
Fee Rate (d) | | | Service
Fee Rate (d) | | | Total
Distribution
Plan (d) | | | Annual
Effective
Rate (e) | | | Distribution
and Service
Fee | |
| Class A | | | — | | | | 0.25% | | | | 0.25% | | | | 0.25% | | | | $852,850 | |
| Class B | | | 0.75% | | | | 0.25% | | | | 1.00% | | | | 1.00% | | | | 294,955 | |
| Class C | | | 0.75% | | | | 0.25% | | | | 1.00% | | | | 1.00% | | | | 857,024 | |
| Class R1 | | | 0.75% | | | | 0.25% | | | | 1.00% | | | | 1.00% | | | | 34,196 | |
| Class R2 | | | 0.25% | | | | 0.25% | | | | 0.50% | | | | 0.50% | | | | 99,018 | |
| Class R3 | | | — | | | | 0.25% | | | | 0.25% | | | | 0.25% | | | | 85,872 | |
| Total Distribution and Service Fees | | | | | | | | | | | | $2,223,915 | |
| (d) | In accordance with the distribution plan for certain classes, the fund pays distribution and/or service fees equal to these annual percentage rates of each class’s average daily net assets. The distribution and service fee rates disclosed by class represent the current rates in effect at the end of the reporting period. Any rate changes, if applicable, are detailed below. |
| (e) | The annual effective rates represent actual fees incurred under the distribution plan for the year ended August 31, 2017 based on each class’s average daily net assets. MFD has voluntarily agreed to rebate a portion of each class’s 0.25% service fee attributable to accounts for which MFD retains the 0.25% service fee except for accounts attributable to MFS or its affiliates’ seed money. For the year ended August 31, 2017, this rebate amounted to $12,995, $356, $733, and $1 for Class A, Class B, Class C, and Class R2, respectively, and is included in the reduction of total expenses in the Statement of Operations. |
Certain Class A shares are subject to a contingent deferred sales charge (CDSC) in the event of a shareholder redemption within 18 months of purchase. Class C shares are subject to a CDSC in the event of a shareholder redemption within 12 months of purchase. Class B shares are subject to a CDSC in the event of a shareholder redemption within six years of purchase. All contingent deferred sales charges are paid to MFD and during the year ended August 31, 2017, were as follows:
| | | | |
| | | Amount | |
| Class A | | | $2,444 | |
| Class B | | | 33,953 | |
| Class C | | | 28,520 | |
Shareholder Servicing Agent – MFS Service Center, Inc. (MFSC), a wholly-owned subsidiary of MFS, receives a fee from the fund for its services as shareholder servicing agent calculated as a percentage of the average daily net assets of the fund as determined periodically under the supervision of the fund’s Board of Trustees. For the year ended August 31, 2017, the fee was $161,777, which equated to 0.0222% annually of the fund’s average daily net assets. MFSC also receives payment from the fund for out-of-pocket expenses, sub-accounting and other shareholder servicing costs which may be paid to affiliated and unaffiliated service providers. Class R6 shares do not incur sub-accounting fees. For the year ended August 31, 2017, these out-of-pocket expenses, sub-accounting and other shareholder servicing costs amounted to $724,866.
Administrator – MFS provides certain financial, legal, shareholder communications, compliance, and other administrative services to the fund. Under an administrative services agreement, the fund reimburses MFS the costs incurred to provide these
36
Notes to Financial Statements – continued
services. The fund is charged an annual fixed amount of $17,500 plus a fee based on average daily net assets. The administrative services fee incurred for the year ended August 31, 2017 was equivalent to an annual effective rate of 0.0172% of the fund’s average daily net assets.
Trustees’ and Officers’ Compensation – The fund pays compensation to independent Trustees in the form of a retainer, attendance fees, and additional compensation to Board and Committee chairpersons. The fund does not pay compensation directly to Trustees or officers of the fund who are also officers of the investment adviser, all of whom receive remuneration for their services to the fund from MFS. Certain officers and Trustees of the fund are officers or directors of MFS, MFD, and MFSC.
Prior to December 31, 2001, the fund had an unfunded defined benefit plan (“DB plan”) for independent Trustees. As of December 31, 2001, the Board took action to terminate the DB plan with respect to then-current and any future independent Trustees, such that the DB plan covers only certain of those former independent Trustees who retired on or before December 31, 2001. The DB plan resulted in a pension expense of $246 and is included in ”Independent Trustees’ compensation“ in the Statement of Operations for the year ended August 31, 2017. The liability for deferred retirement benefits payable to certain independent Trustees under the DB plan amounted to $627 at August 31, 2017, and is included in ”Payable for independent Trustees’ compensation“ in the Statement of Assets and Liabilities.
Other – This fund and certain other funds managed by MFS (the funds) have entered into a service agreement (the ISO Agreement) which provides for payment of fees solely by the funds to Tarantino LLC in return for the provision of services of an Independent Senior Officer (ISO) for the funds. Frank L. Tarantino serves as the ISO and is an officer of the funds and the sole member of Tarantino LLC. The funds can terminate the ISO Agreement with Tarantino LLC at any time under the terms of the ISO Agreement. For the year ended August 31, 2017, the fee paid by the fund under this agreement was $1,317 and is included in ”Miscellaneous“ expense in the Statement of Operations. MFS has agreed to bear all expenses associated with office space, other administrative support, and supplies provided to the ISO.
The fund invests in the MFS Institutional Money Market Portfolio which is managed by MFS and seeks current income consistent with preservation of capital and liquidity. This money market fund does not pay a management fee to MFS.
On September 9, 2015, MFS redeemed 5,844 shares of Class R6 for an aggregate amount of $151,886. On March 16, 2016, MFS redeemed 6,339 shares of Class I for an aggregate amount of $167,466.
The fund is permitted to engage in purchase and sale transactions with funds and accounts for which MFS serves as investment adviser or sub-adviser (”cross-trades“) pursuant to a policy adopted by the Board of Trustees. This policy has been designed to ensure that cross-trades conducted by the fund comply with Rule 17a-7 under the Investment Company Act of 1940. Under this policy, cross-trades are effected at current market prices with no remuneration paid in connection with the transaction. During the year ended August 31, 2017, the fund engaged in purchase and sale
37
Notes to Financial Statements – continued
transactions pursuant to this policy, which amounted to $50,482 and $856,271, respectively. The sales transactions resulted in net realized gains (losses) of $55,203.
(4) Portfolio Securities
For the year ended August 31, 2017, purchases and sales of investments, other than purchased option transactions, short sales, and short-term obligations, aggregated $366,862,851 and $302,931,689, respectively.
(5) Shares of Beneficial Interest
The fund’s Declaration of Trust permits the Trustees to issue an unlimited number of full and fractional shares of beneficial interest. Transactions in fund shares were as follows:
| | | | | | | | | | | | | | | | |
| | | Year ended
8/31/17 | | | Year ended
8/31/16 | |
| | | Shares | | | Amount | | | Shares | | | Amount | |
| Shares sold | | | | | | | | | | | | | | | | |
Class A | | | 3,903,397 | | | | $118,724,794 | | | | 5,650,212 | | | | $146,107,339 | |
Class B | | | 300,442 | | | | 8,204,144 | | | | 340,869 | | | | 7,842,383 | |
Class C | | | 1,045,012 | | | | 28,144,392 | | | | 1,326,858 | | | | 30,532,344 | |
Class I | | | 3,330,760 | | | | 106,868,431 | | | | 3,469,595 | | | | 95,301,998 | |
Class R1 | | | 53,395 | | | | 1,439,175 | | | | 59,793 | | | | 1,366,106 | |
Class R2 | | | 317,338 | | | | 9,295,803 | | | | 316,198 | | | | 7,917,738 | |
Class R3 | | | 1,128,979 | | | | 34,581,757 | | | | 433,184 | | | | 11,179,724 | |
Class R4 | | | 186,687 | | | | 5,801,786 | | | | 269,057 | | | | 7,406,114 | |
Class R6 | | | 1,876,424 | | | | 59,960,695 | | | | 1,008,817 | | | | 26,942,479 | |
| | | 12,142,434 | | | | $373,020,977 | | | | 12,874,583 | | | | $334,596,225 | |
| | | | |
| Shares issued to shareholders in reinvestment of distributions | | | | | | | | | | | | | | | | |
Class A | | | 206,974 | | | | $5,813,904 | | | | 351,762 | | | | $9,145,810 | |
Class B | | | 22,405 | | | | 555,187 | | | | 38,326 | | | | 888,406 | |
Class C | | | 59,252 | | | | 1,465,308 | | | | 80,131 | | | | 1,853,426 | |
Class I | | | 42,956 | | | | 1,279,665 | | | | 65,685 | | | | 1,805,022 | |
Class R1 | | | 2,532 | | | | 62,501 | | | | 5,502 | | | | 127,045 | |
Class R2 | | | 11,665 | | | | 314,359 | | | | 24,051 | | | | 602,249 | |
Class R3 | | | 17,563 | | | | 493,168 | | | | 16,376 | | | | 425,776 | |
Class R4 | | | 4,712 | | | | 136,848 | | | | 2,777 | | | | 74,453 | |
Class R6 | | | 23,250 | | | | 695,648 | | | | 10,949 | | | | 301,867 | |
| | | 391,309 | | | | $10,816,588 | | | | 595,559 | | | | $15,224,054 | |
38
Notes to Financial Statements – continued
| | | | | | | | | | | | | | | | |
| | | Year ended
8/31/17 | | | Year ended
8/31/16 | |
| | | Shares | | | Amount | | | Shares | | | Amount | |
| Shares reacquired | | | | | | | | | | | | | | | | |
Class A | | | (5,378,740 | ) | | | $(165,793,400 | ) | | | (2,744,468 | ) | | | $(70,029,661 | ) |
Class B | | | (261,310 | ) | | | (7,226,145 | ) | | | (192,697 | ) | | | (4,444,263 | ) |
Class C | | | (772,303 | ) | | | (21,102,926 | ) | | | (437,124 | ) | | | (10,007,638 | ) |
Class I | | | (2,006,437 | ) | | | (64,179,030 | ) | | | (2,485,635 | ) | | | (64,260,422 | ) |
Class R1 | | | (42,550 | ) | | | (1,112,429 | ) | | | (56,516 | ) | | | (1,271,891 | ) |
Class R2 | | | (264,457 | ) | | | (7,811,141 | ) | | | (342,465 | ) | | | (8,463,244 | ) |
Class R3 | | | (368,711 | ) | | | (11,215,693 | ) | | | (130,805 | ) | | | (3,377,690 | ) |
Class R4 | | | (79,423 | ) | | | (2,549,379 | ) | | | (81,123 | ) | | | (2,055,904 | ) |
Class R6 | | | (503,418 | ) | | | (16,400,155 | ) | | | (179,822 | ) | | | (4,880,914 | ) |
| | | (9,677,349 | ) | | | $(297,390,298 | ) | | | (6,650,655 | ) | | | $(168,791,627 | ) |
| | | | |
| Net change | | | | | | | | | | | | | | | | |
Class A | | | (1,268,369 | ) | | | $(41,254,702 | ) | | | 3,257,506 | | | | $85,223,488 | |
Class B | | | 61,537 | | | | 1,533,186 | | | | 186,498 | | | | 4,286,526 | |
Class C | | | 331,961 | | | | 8,506,774 | | | | 969,865 | | | | 22,378,132 | |
Class I | | | 1,367,279 | | | | 43,969,066 | | | | 1,049,645 | | | | 32,846,598 | |
Class R1 | | | 13,377 | | | | 389,247 | | | | 8,779 | | | | 221,260 | |
Class R2 | | | 64,546 | | | | 1,799,021 | | | | (2,216 | ) | | | 56,743 | |
Class R3 | | | 777,831 | | | | 23,859,232 | | | | 318,755 | | | | 8,227,810 | |
Class R4 | | | 111,976 | | | | 3,389,255 | | | | 190,711 | | | | 5,424,663 | |
Class R6 | | | 1,396,256 | | | | 44,256,188 | | | | 839,944 | | | | 22,363,432 | |
| | | 2,856,394 | | | | $86,447,267 | | | | 6,819,487 | | | | $181,028,652 | |
(6) Line of Credit
The fund and certain other funds managed by MFS participate in a $1.25 billion unsecured committed line of credit, subject to a $1 billion sublimit, provided by a syndication of banks under a credit agreement. Borrowings may be made for temporary financing needs. Interest is charged to each fund, based on its borrowings, generally at a rate equal to the higher of the Overnight Federal Reserve funds rate or daily one month LIBOR plus an agreed upon spread. A commitment fee, based on the average daily, unused portion of the committed line of credit, is allocated among the participating funds at the end of each calendar quarter. In addition, the fund and other funds managed by MFS have established unsecured uncommitted borrowing arrangements with certain banks for temporary financing needs. Interest is charged to each fund, based on its borrowings, at a rate equal to the Overnight Federal Reserve funds rate plus an agreed upon spread. For the year ended August 31, 2017, the fund’s commitment fee and interest expense were $4,716 and $0, respectively, and are included in ”Miscellaneous“ expense in the Statement of Operations.
39
Notes to Financial Statements – continued
(7) Investments in Affiliated Issuers
An affiliated issuer may be considered one in which the fund owns 5% or more of the outstanding voting securities, or a company which is under common control. For the purposes of this report, the fund assumes the following to be an affiliated issuer:
| | | | | | | | | | | | | | | | | | | | |
| Affiliated Issuer | | | | | Beginning
Shares/Par
Amount | | | Acquisitions
Shares/Par
Amount | | | Dispositions
Shares/Par
Amount | | | Ending
Shares/Par
Amount | |
MFS Institutional Money
Market Portfolio | | | | | | | 16,566,726 | | | | 214,206,728 | | | | (205,956,396 | ) | | | 24,817,058 | |
| | | | | |
| Affiliated Issuer | | Realized
Gain (Loss) | | | Change in
Unrealized
Appreciation
(Depreciation) | | | Capital Gain
Distributions | | | Dividend
Income | | | Ending
Value | |
MFS Institutional Money
Market Portfolio | | | $(1,414 | ) | | | $313 | | | | $— | | | | $150,920 | | | | $24,817,059 | |
40
REPORT OF INDEPENDENT REGISTERED PUBLIC ACCOUNTING FIRM
To the Board of Trustees of MFS Series Trust I and Shareholders of MFS Technology Fund:
We have audited the accompanying statement of assets and liabilities, including the portfolio of investments, of MFS Technology Fund (the Fund) (one of the series constituting the MFS Series Trust I) as of August 31, 2017, and the related statement of operations for the year then ended, the statements of changes in net assets for each of the two years in the period then ended and the financial highlights for each of the periods indicated therein. These financial statements and financial highlights are the responsibility of the Fund’s management. Our responsibility is to express an opinion on these financial statements and financial highlights based on our audits.
We conducted our audits in accordance with the standards of the Public Company Accounting Oversight Board (United States). Those standards require that we plan and perform the audit to obtain reasonable assurance about whether the financial statements and financial highlights are free of material misstatement. We were not engaged to perform an audit of the Fund’s internal control over financial reporting. Our audits included consideration of internal control over financial reporting as a basis for designing audit procedures that are appropriate in the circumstances, but not for the purpose of expressing an opinion on the effectiveness of the Fund’s internal control over financial reporting. Accordingly, we express no such opinion. An audit also includes examining, on a test basis, evidence supporting the amounts and disclosures in the financial statements and financial highlights, assessing the accounting principles used and significant estimates made by management, and evaluating the overall financial statement presentation. Our procedures included confirmation of securities owned as of August 31, 2017, by correspondence with the custodian and others. We believe that our audits provide a reasonable basis for our opinion.
In our opinion, the financial statements and financial highlights referred to above present fairly, in all material respects, the financial position of MFS Technology Fund (one of the series constituting the MFS Series Trust I) at August 31, 2017, the results of its operations for the year then ended, the changes in its net assets for each of the two years in the period then ended and the financial highlights for each of the periods indicated therein, in conformity with U.S. generally accepted accounting principles.

Boston, Massachusetts
October 17, 2017
41
RESULTS OF SHAREHOLDER MEETING
(unaudited)
At the special meeting of shareholders of MFS Series Trust I, which was held on March 23, 2017, the following action was taken:
Item 1: To elect the following individuals as Trustees:
| | | | | | | | |
| | | Number of Dollars | |
Nominee | | For | | | Withheld Authority | |
| Steven E. Buller | | | 40,448,016,134.453 | | | | 372,137,248.376 | |
| John A. Caroselli | | | 40,455,058,441.389 | | | | 365,094,941.560 | |
| Maureen R. Goldfarb | | | 40,458,621,672.449 | | | | 361,531,746.940 | |
| David H. Gunning | | | 40,369,558,961.219 | | | | 450,594,312.051 | |
| Michael Hegarty | | | 40,379,783,468.714 | | | | 440,369,950.676 | |
| John P. Kavanaugh | | | 40,453,732,784.104 | | | | 366,420,708.405 | |
| Robert J. Manning | | | 40,424,010,964.586 | | | | 396,142,308.684 | |
| Clarence Otis, Jr. | | | 40,441,919,324.712 | | | | 378,234,043.007 | |
| Maryanne L. Roepke | | | 40,471,040,575.143 | | | | 349,112,917.026 | |
| Robin A. Stelmach | | | 40,459,908,730.475 | | | | 360,244,615.574 | |
| Laurie J. Thomsen | | | 40,426,270,790.416 | | | | 393,882,628.973 | |
42
TRUSTEES AND OFFICERS — IDENTIFICATION AND BACKGROUND
The Trustees and Officers of the Trust, as of October 1, 2017, are listed below, together with their principal occupations during the past five years. (Their titles may have varied during that period.) The address of each Trustee and Officer is 111 Huntington Avenue, Boston, Massachusetts 02199-7618.
| | | | | | | | | | |
Name, Age | | Position(s)
Held with Fund | | Trustee/Officer Since (h) | | Number of
MFS Funds
overseen
by the
Trustee | | Principal
Occupations During the Past Five Years | | Other Directorships
During the Past
Five Years (j) |
| INTERESTED TRUSTEES |
Robert J. Manning (k)
(age 53) | | Trustee | | February 2004 | | 136 | | Massachusetts Financial Services Company, Executive Chairman (since January 2017); Director; Chairman of the Board; Chief Executive Officer (until 2015); Co-Chief Executive Officer (2015-2016) | | N/A |
Robin A. Stelmach (k) (age 56) | | Trustee | | January 2014 | | 136 | | Massachusetts Financial Services Company, Vice Chair (since January 2017); Chief Operating Officer and Executive Vice President (until January 2017) | | N/A |
| INDEPENDENT TRUSTEES |
David H. Gunning
(age 75) | | Trustee and Chair of Trustees | | January 2004 | | 136 | | Private investor | | Lincoln Electric Holdings, Inc., Director; Development Alternatives, Inc., Director/Non-Executive Chairman (until 2013) |
43
Trustees and Officers – continued
| | | | | | | | | | |
Name, Age | | Position(s)
Held with Fund | | Trustee/Officer Since (h) | | Number of
MFS Funds
overseen
by the
Trustee | | Principal
Occupations During the Past Five Years | | Other Directorships
During the Past
Five Years (j) |
Steven E. Buller
(age 66) | | Trustee | | February 2014 | | 136 | | Financial Accounting Standards Advisory Council, Chairman (2014-2015); Public Company Accounting Oversight Board, Standing Advisory Group, Member (until 2014); BlackRock, Inc. (investment management), Managing Director (until 2014), BlackRock Finco UK (investment management), Director (until 2014) | | N/A |
John A. Caroselli
(age 63) | | Trustee | | March 2017 | | 136 | | JC Global Advisors, LLC (management consulting), President (since 2015); First Capital Corporation (commercial finance), Executive Vice President (until 2015) | | N/A |
Maureen R. Goldfarb
(age 62) | | Trustee | | January 2009 | | 136 | | Private investor | | N/A |
Michael Hegarty
(age 72) | | Trustee | | December 2004 | | 136 | | Private investor | | Rouse Properties Inc., Director (until 2016); Capmark Financial Group Inc., Director (until 2015) |
John P. Kavanaugh
(age 62) | | Trustee and Vice Chair of Trustees | | January 2009 | | 136 | | Private investor | | N/A |
Clarence Otis, Jr.
(age 61) | | Trustee | | March 2017 | | 136 | | Darden Restaurants, Inc., Chief Executive Officer (until 2014) | | VF Corporation, Director; Verizon Communications, Inc., Director; The Travelers Companies, Director; Federal Reserve Bank of Atlanta, Director (until 2015) |
44
Trustees and Officers – continued
| | | | | | | | | | |
Name, Age | | Position(s)
Held with Fund | | Trustee/Officer Since (h) | | Number of
MFS Funds
overseen
by the
Trustee | | Principal
Occupations During the Past Five Years | | Other Directorships
During the Past
Five Years (j) |
Maryanne L. Roepke
(age 61) | | Trustee | | May 2014 | | 136 | | American Century Investments (investment management), Senior Vice President and Chief Compliance Officer (until 2014) | | N/A |
Laurie J. Thomsen
(age 60) | | Trustee | | March 2005 | | 136 | | Private investor | | The Travelers Companies, Director; Dycom Industries, Inc., Director (since 2015) |
| | | | | | | | |
Name, Age | | Position(s) Held with Fund | | Trustee/Officer
Since (h) | | Number of
MFS Funds
for which
the Person
is an Officer | | Principal
Occupations During the Past Five Years |
| OFFICERS | | | | | | | | |
Christopher R. Bohane (k)
(age 43) | | Assistant Secretary and Assistant Clerk | | July 2005 | | 136 | | Massachusetts Financial Services Company, Vice President and Assistant General Counsel |
Kino Clark (k)
(age 49) | | Assistant Treasurer | | January 2012 | | 136 | | Massachusetts Financial Services Company, Vice President |
John W. Clark, Jr. (k)
(age 50) | | Assistant Treasurer | | April 2017 | | 136 | | Massachusetts Financial Services Company, Vice President (since March 2017); Deutsche Bank (financial services), Department Head – Treasurer’s Office (until February 2017) |
Thomas H. Connors (k)
(age 58) | | Assistant Secretary and Assistant Clerk | | September 2012 | | 136 | | Massachusetts Financial Services Company, Vice President and Senior Counsel; Deutsche Investment Management Americas Inc. (financial service provider), Director and Senior Counsel (until 2012) |
45
Trustees and Officers – continued
| | | | | | | | |
Name, Age | | Position(s) Held with Fund | | Trustee/Officer
Since (h) | | Number of
MFS Funds
for which
the Person
is an Officer | | Principal
Occupations During the Past Five Years |
Ethan D. Corey (k)
(age 53) | | Assistant Secretary and Assistant Clerk | | July 2005 | | 136 | | Massachusetts Financial Services Company, Senior Vice President and Associate General Counsel |
David L. DiLorenzo (k)
(age 49) | | President | | July 2005 | | 136 | | Massachusetts Financial Services Company, Senior Vice President |
Heidi W. Hardin (k)
(age 50) | | Secretary and Clerk | | April 2017 | | 136 | | Massachusetts Financial Services Company, Executive Vice President and General Counsel (since March 2017); Harris Associates (investment management), General Counsel (from September 2015 to January 2017); Janus Capital Management LLC (investment management), Senior Vice President and General Counsel (until September 2015) |
Brian E. Langenfeld (k) (age 44) | | Assistant Secretary and Assistant Clerk | | June 2006 | | 136 | | Massachusetts Financial Services Company, Vice President and Senior Counsel |
Susan A. Pereira (k)
(age 46) | | Assistant Secretary and Assistant Clerk | | July 2005 | | 136 | | Massachusetts Financial Services Company, Vice President and Senior Counsel |
Kasey L. Phillips (k)
(age 46) | | Assistant Treasurer | | September 2012 | | 136 | | Massachusetts Financial Services Company, Vice President; Wells Fargo Funds Management, LLC, Senior Vice President, Fund Treasurer (until 2012) |
Matthew A. Stowe (k)
(age 42) | | Assistant Secretary and Assistant Clerk | | October 2014 | | 136 | | Massachusetts Financial Services Company, Vice President and Assistant General Counsel |
Frank L. Tarantino
(age 73) | | Independent Senior Officer | | June 2004 | | 136 | | Tarantino LLC (provider of compliance services), Principal |
Richard S. Weitzel (k)
(age 47) | | Assistant Secretary and Assistant Clerk | | October 2007 | | 136 | | Massachusetts Financial Services Company, Senior Vice President and Associate General Counsel |
46
Trustees and Officers – continued
| | | | | | | | |
Name, Age | | Position(s) Held with Fund | | Trustee/Officer
Since (h) | | Number of
MFS Funds
for which
the Person
is an Officer | | Principal
Occupations During the Past Five Years |
Martin J. Wolin (k)
(age 50) | | Chief Compliance Officer | | July 2015 | | 136 | | Massachusetts Financial Services Company, Senior Vice President and Chief Compliance Officer (since July 2015); Mercer (financial service provider), Chief Risk and Compliance Officer, North America and Latin America (until June 2015) |
James O. Yost (k)
(age 57) | | Treasurer | | September 1990 | | 136 | | Massachusetts Financial Services Company, Senior Vice President |
| (h) | Date first appointed to serve as Trustee/officer of an MFS Fund. Each Trustee has served continuously since appointment unless indicated otherwise. For the period from December 15, 2004 until February 22, 2005, Mr. Manning served as Advisory Trustee. Prior to January 2012, Messrs. DiLorenzo and Yost served as Assistant Treasurers of the Funds. From January 2012 through December 2016, Messrs. DiLorenzo and Yost served as Treasurer and Deputy Treasurer of the Funds, respectively. |
| (j) | Directorships or trusteeships of companies required to report to the Securities and Exchange Commission (i.e., “public companies”). |
| (k) | “Interested person” of the Trust within the meaning of the Investment Company Act of 1940 (referred to as the 1940 Act), which is the principal federal law governing investment companies like the fund, as a result of a position with MFS. The address of MFS is 111 Huntington Avenue, Boston, Massachusetts 02199-7618. |
Each Trustee has been elected by shareholders and each Trustee and officer holds office until his or her successor is chosen and qualified or until his or her earlier death, resignation, retirement or removal. The Trust does not hold annual meetings for the purpose of electing Trustees, and Trustees are not elected for fixed terms. Under the terms of the Board’s retirement policy, an Independent Trustee shall retire at the end of the calendar year in which he or she reaches the earlier of 75 years of age or 15 years of service on the Board (or, in the case of any Independent Trustee who joined the Board prior to 2015, 20 years of service on the Board).
Messrs. Buller, Kavanaugh and Otis and Ms. Roepke are members of the Trust’s Audit Committee.
Each of the Interested Trustees and certain Officers hold comparable officer positions with certain affiliates of MFS.
47
Trustees and Officers – continued
The Statement of Additional Information for a Fund includes further information about the Trustees and is available without charge upon request by calling 1-800-225-2606.
| | |
| Investment Adviser | | Custodian |
Massachusetts Financial Services Company
111 Huntington Avenue
Boston, MA 02199-7618 | | State Street Bank and Trust Company 1 Lincoln Street
Boston, MA 02111-2900 |
| Distributor | | Independent Registered Public Accounting Firm |
MFS Fund Distributors, Inc.
111 Huntington Avenue
Boston, MA 02199-7618 | | Ernst & Young LLP 200 Claredon Street
Boston, MA 02116 |
| Portfolio Manager(s) | | |
| Matthew Sabel | | |
48
BOARD REVIEW OF INVESTMENT ADVISORY AGREEMENT
The Investment Company Act of 1940 requires that both the full Board of Trustees and a majority of the non-interested (“independent”) Trustees, voting separately, annually approve the continuation of the Fund’s investment advisory agreement with MFS. The Trustees consider matters bearing on the Fund and its advisory arrangements at their meetings throughout the year, including a review of performance data at each regular meeting. In addition, the independent Trustees met several times over the course of three months beginning in May and ending in July, 2017 (“contract review meetings”) for the specific purpose of considering whether to approve the continuation of the investment advisory agreement for the Fund and the other investment companies that the Board oversees (the “MFS Funds”). The independent Trustees were assisted in their evaluation of the Fund’s investment advisory agreement by independent legal counsel, from whom they received separate legal advice and with whom they met separately from MFS during various contract review meetings. The independent Trustees were also assisted in this process by the MFS Funds’ Independent Senior Officer, a senior officer appointed by and reporting to the independent Trustees.
In connection with their deliberations regarding the continuation of the investment advisory agreement, the Trustees, including the independent Trustees, considered such information and factors as they believed, in light of the legal advice furnished to them and their own business judgment, to be relevant. The investment advisory agreement for the Fund was considered separately, although the Trustees also took into account the common interests of all MFS Funds in their review. As described below, the Trustees considered the nature, quality, and extent of the various investment advisory, administrative, and shareholder services performed by MFS under the existing investment advisory agreement and other arrangements with the Fund.
In connection with their contract review meetings, the Trustees received and relied upon materials that included, among other items: (i) information provided by Broadridge Financial Solutions, Inc. (“Broadridge”), an independent third party, on the investment performance of the Fund for various time periods ended December 31, 2016 and the investment performance of a group of funds with substantially similar investment classifications/objectives (the “Lipper performance universe”), (ii) information provided by Broadridge on the Fund’s advisory fees and other expenses and the advisory fees and other expenses of comparable funds identified by Broadridge (the “Broadridge expense group”), (iii) information provided by MFS on the advisory fees of portfolios of other clients of MFS, including institutional separate accounts and other clients, (iv) information as to whether and to what extent applicable expense waivers, reimbursements or fee “breakpoints” are observed for the Fund, (v) information regarding MFS’ financial results and financial condition, including MFS’ and certain of its affiliates’ estimated profitability from services performed for the Fund and the MFS Funds as a whole, and compared to MFS’ institutional business, (vi) MFS’ views regarding the outlook for the mutual fund industry and the strategic business plans of MFS, (vii) descriptions of various functions performed by MFS for the Funds, such as compliance monitoring and portfolio trading practices, and (viii) information regarding the overall organization of MFS, including information about MFS’ senior management and other personnel providing investment advisory,
49
Board Review of Investment Advisory Agreement – continued
administrative and other services to the Fund and the other MFS Funds. The comparative performance, fee and expense information prepared and provided by Broadridge was not independently verified and the independent Trustees did not independently verify any information provided to them by MFS.
The Trustees’ conclusion as to the continuation of the investment advisory agreement was based on a comprehensive consideration of all information provided to the Trustees and not the result of any single factor. Some of the factors that figured particularly in the Trustees’ deliberations are described below, although individual Trustees may have evaluated the information presented differently from one another, giving different weights to various factors. It is also important to recognize that the fee arrangements for the Fund and other MFS Funds are the result of years of review and discussion between the independent Trustees and MFS, that certain aspects of such arrangements may receive greater scrutiny in some years than in others, and that the Trustees’ conclusions may be based, in part, on their consideration of these same arrangements during the course of the year and in prior years.
Based on information provided by Broadridge and MFS, the Trustees reviewed the Fund’s total return investment performance as well as the performance of peer groups of funds over various time periods. The Trustees placed particular emphasis on the total return performance of the Fund’s Class A shares in comparison to the performance of funds in its Lipper performance universe over the three-year period ended December 31, 2016, which the Trustees believed was a long enough period to reflect differing market conditions. The total return performance of the Fund’s Class A shares was in the 3rd quintile relative to the other funds in the universe for this three-year period (the 1st quintile being the best performers and the 5th quintile being the worst performers). The total return performance of the Fund’s Class A shares was in the 3rd quintile for each of the one- and five-year periods ended December 31, 2016 relative to the Lipper performance universe. Because of the passage of time, these performance results may differ from the performance results for more recent periods, including those shown elsewhere in this report.
In the course of their deliberations, the Trustees took into account information provided by MFS in connection with the contract review meetings, as well as during investment review meetings conducted with portfolio management personnel during the course of the year regarding the Fund’s performance. After reviewing these and related factors, the Trustees concluded, within the context of their overall conclusions regarding the investment advisory agreement, that they were satisfied with MFS’ responses and efforts relating to investment performance.
In assessing the reasonableness of the Fund’s advisory fee, the Trustees considered, among other information, the Fund’s advisory fee and the total expense ratio of the Fund’s Class A shares as a percentage of average daily net assets and the advisory fee and total expense ratios of peer groups of funds based on information provided by Broadridge. The Trustees considered that, according to the data provided by Broadridge (which takes into account any fee reductions or expense limitations that were in effect during the Fund’s last fiscal year), the Fund’s effective advisory fee rate and total expense ratio were each lower than the Broadridge expense group median.
50
Board Review of Investment Advisory Agreement – continued
The Trustees also considered the advisory fees charged by MFS to any institutional separate accounts advised by MFS (“separate accounts”) and unaffiliated investment companies for which MFS serves as subadviser (“subadvised funds”) that have comparable investment strategies to the Fund, if any. In comparing these fees, the Trustees considered information provided by MFS as to the generally broader scope of services provided by MFS to the Fund, as well as the more extensive regulatory burdens imposed on MFS in managing the Fund, in comparison to separate accounts and subadvised funds. The Trustees also considered the higher demands placed on MFS’ investment personnel and trading infrastructure as a result of the daily cash in-flows and out-flows of the Fund in comparison to separate accounts.
The Trustees also considered whether the Fund may benefit from any economies of scale in the management of the Fund in the event of growth in assets of the Fund and/or growth in assets of the MFS Funds as a whole. They noted that the Fund’s advisory fee rate schedule is subject to a contractual breakpoint that reduces the Fund’s advisory fee rate on average daily net assets over $1 billion. The Trustees also noted that MFS has agreed in writing to waive a portion of the management fees of certain MFS Funds, including the Fund, if the total combined assets of certain funds within the MFS Funds’ complex increase above agreed upon thresholds (the “group fee waiver”), enabling the Fund’s shareholders to share in the benefits from any economies of scale at the complex level. The group fee waiver is reviewed and renewed annually between the Board and MFS. The Trustees concluded that the breakpoint and the group fee waiver were sufficient to allow the Fund to benefit from economies of scale as its assets and overall complex assets grow.
The Trustees also considered information prepared by MFS relating to MFS’ costs and profits with respect to the Fund, the MFS Funds considered as a group, and other investment companies and accounts advised by MFS, as well as MFS’ methodologies used to determine and allocate its costs to the MFS Funds, the Fund and other accounts and products for purposes of estimating profitability.
After reviewing these and other factors described herein, the Trustees concluded, within the context of their overall conclusions regarding the investment advisory agreement, that the advisory fees charged to the Fund represent reasonable compensation in light of the services being provided by MFS to the Fund.
In addition, the Trustees considered MFS’ resources and related efforts to continue to retain, attract and motivate capable personnel to serve the Fund. The Trustees also considered current and developing conditions in the financial services industry, including the presence of large and well-capitalized companies which are spending, and appear to be prepared to continue to spend, substantial sums to engage personnel and to provide services to competing investment companies. In this regard, the Trustees also considered the financial resources of MFS and its ultimate parent, Sun Life Financial Inc. The Trustees also considered the advantages and possible disadvantages to the Fund of having an adviser that also serves other investment companies as well as other accounts.
The Trustees also considered the nature, quality, cost, and extent of administrative, transfer agency, and distribution services provided to the Fund by MFS and its affiliates under agreements and plans other than the investment advisory agreement, including
51
Board Review of Investment Advisory Agreement – continued
any 12b-1 fees the Fund pays to MFS Fund Distributors, Inc., an affiliate of MFS. The Trustees also considered the nature, extent and quality of certain other services MFS performs or arranges for on the Fund’s behalf, which may include securities lending programs, directed expense payment programs, class action recovery programs, and MFS’ interaction with third-party service providers, principally custodians and sub-custodians. The Trustees concluded that the various non-advisory services provided by MFS and its affiliates on behalf of the Fund were satisfactory.
The Trustees also considered benefits to MFS from the use of the Fund’s portfolio brokerage commissions, if applicable, to pay for investment research and various other factors. Additionally, the Trustees considered so-called “fall-out benefits” to MFS such as reputational value derived from serving as investment manager to the Fund.
Based on their evaluation of factors that they deemed to be material, including those factors described above, the Board of Trustees, including the independent Trustees, concluded that the Fund’s investment advisory agreement with MFS should be continued for an additional one-year period, commencing August 1, 2017.
52
PROXY VOTING POLICIES AND INFORMATION
MFS votes proxies on behalf of the fund pursuant to proxy voting policies and procedures that are available without charge, upon request, by calling 1-800-225-2606, by visiting mfs.com (once you have selected “Individual Investor” as your role, click on “Individual Investor Home” in the top navigation and then select “Learn More About Proxy Voting” under the “I want to…” header on the left hand column of the page), or by visiting the SEC’s Web site at http://www.sec.gov.
Information regarding how the fund voted proxies relating to portfolio securities during the most recent twelve-month period ended June 30 is available by August 31 of each year without charge by visiting mfs.com (once you have selected “Individual Investor” as your role, click on “Individual Investor Home” in the top navigation and then select “Learn More About Proxy Voting” under the “I want to…” header on the left hand column of the page), or by visiting the SEC’s Web site at http://www.sec.gov.
QUARTERLY PORTFOLIO DISCLOSURE
The fund will file a complete schedule of portfolio holdings with the Securities and Exchange Commission (the Commission) for the first and third quarters of each fiscal year on Form N-Q. A shareholder can obtain the quarterly portfolio holdings report at mfs.com. The fund’s Form N-Q is also available on the EDGAR database on the Commission’s Internet Web site at http://www.sec.gov, and may be reviewed and copied at the:
Public Reference Room
Securities and Exchange Commission
100 F Street, NE, Room 1580
Washington, D.C. 20549
Information on the operation of the Public Reference Room may be obtained by calling the Commission at 1-800-SEC-0330. Copies of the fund’s Form N-Q also may be obtained, upon payment of a duplicating fee, by electronic request at the following e-mail address: publicinfo@sec.gov or by writing the Public Reference Section at the above address.
FURTHER INFORMATION
From time to time, MFS may post important information about the fund or the MFS funds on the MFS web site (mfs.com). This information is available on mfs.com by following these steps once you have selected “Individual Investor” as your role: (1) Click on the “Individual Investor Home” in the top navigation and then select the “Announcements” option within the “Market Outlooks” drop down, or (2) Click on “Products & Services” and “Mutual Funds” and then choose the fund’s name in the “Select a fund” menu.
53
INFORMATION ABOUT FUND CONTRACTS AND LEGAL CLAIMS
The fund has entered into contractual arrangements with an investment adviser, administrator, distributor, shareholder servicing agent, 529 program manager (if applicable), and custodian who each provide services to the fund. Unless expressly stated otherwise, shareholders are not parties to, or intended beneficiaries of these contractual arrangements, and these contractual arrangements are not intended to create any shareholder right to enforce them against the service providers or to seek any remedy under them against the service providers, either directly or on behalf of the fund.
Under the Trust’s By-Laws and Declaration of Trust, any claims asserted against or on behalf of the MFS Funds, including claims against Trustees and Officers, must be brought in state and federal courts located within the Commonwealth of Massachusetts.
FEDERAL TAX INFORMATION (unaudited)
The fund will notify shareholders of amounts for use in preparing 2017 income tax forms in January 2018. The following information is provided pursuant to provisions of the Internal Revenue Code.
The fund designates $17,456,000 as capital gain dividends paid during the fiscal year.
54
rev. 3/16
| | | | |
| | | |
FACTS | | WHAT DOES MFS DO WITH YOUR PERSONAL INFORMATION? | |  |
| | |
| Why? | | Financial companies choose how they share your personal information. Federal law gives consumers the right to limit some but not all sharing. Federal law also requires us to tell you how we collect, share, and protect your personal information. Please read this notice carefully to understand what we do. |
| | |
| What? | | The types of personal information we collect and share depend on the product or service you have with us. This information can include: • Social Security number and account balances • Account transactions and transaction history • Checking account information and wire transfer instructions When you are no longer our customer, we continue to share your information as described in this notice. |
| | |
| How? | | All financial companies need to share customers’ personal information to run their everyday business. In the section below, we list the reasons financial companies can share their customers’ personal information; the reasons MFS chooses to share; and whether you can limit this sharing. |
| | | | |
Reasons we can share your
personal information | | Does MFS
share? | | Can you limit
this sharing? |
For our everyday business purposes – such as to process your transactions, maintain your account(s), respond to court orders and legal investigations, or report to credit bureaus | | Yes | | No |
For our marketing purposes – to offer our products and services to you | | No | | We don’t share |
For joint marketing with other financial companies | | No | | We don’t share |
For our affiliates’ everyday business purposes – information about your transactions and experiences | | No | | We don’t share |
For our affiliates’ everyday business purposes – information about your creditworthiness | | No | | We don’t share |
| For nonaffiliates to market to you | | No | | We don’t share |
| | |
| Questions? | | Call 800-225-2606 or go to mfs.com. |
55
| | |
| Who we are |
| Who is providing this notice? | | MFS Funds, MFS Investment Management, MFS Institutional Advisors, Inc., and MFS Heritage Trust Company. |
| | |
| What we do |
| How does MFS protect my personal information? | | To protect your personal information from unauthorized access and use, we use security measures that comply with federal law. These measures include procedural, electronic, and physical safeguards for the protection of the personal information we collect about you. |
| How does MFS collect my personal information? | | We collect your personal information, for example, when you • open an account or provide account information • direct us to buy securities or direct us to sell your securities • make a wire transfer We also collect your personal information from others, such as credit bureaus, affiliates, or other companies. |
| Why can’t I limit all sharing? | | Federal law gives you the right to limit only • sharing for affiliates’ everyday business purposes – information about your creditworthiness • affiliates from using your information to market to you • sharing for nonaffiliates to market to you State laws and individual companies may give you additional rights to limit sharing. |
| | |
| Definitions |
| Affiliates | | Companies related by common ownership or control. They can be financial and nonfinancial companies. • MFS does not share personal information with affiliates, except for everyday business purposes as described on page one of this notice. |
| Nonaffiliates | | Companies not related by common ownership or control. They can be financial and nonfinancial companies. • MFS does not share with nonaffiliates so they can market to you. |
| Joint marketing | | A formal agreement between nonaffiliated financial companies that together market financial products or services to you. • MFS doesn’t jointly market. |
| | |
| Other important information |
| If you own an MFS product or receive an MFS service in the name of a third party such as a bank or broker-dealer, their privacy policy may apply to you instead of ours. |
56
Save paper with eDelivery.

| MFS® will send you prospectuses, |
reports, and proxies directly via e-mail so you will get information faster with less mailbox clutter.
To sign up:
1. Go to mfs.com.
2. Log in via MFS® Access.
3. Select eDelivery.
If you own your MFS fund shares through a financial institution or a retirement plan, MFS® TALK, MFS® Access, or eDelivery may not be available to you.
CONTACT
WEB SITE
mfs.com
MFS TALK
1-800-637-8255
24 hours a day
ACCOUNT SERVICE AND LITERATURE
Shareholders
1-800-225-2606
Financial advisors
1-800-343-2829
Retirement plan services
1-800-637-1255
MAILING ADDRESS
MFS Service Center, Inc.
P.O. Box 55824
Boston, MA 02205-5824
OVERNIGHT MAIL
MFS Service Center, Inc.
c/o Boston Financial Data Services
30 Dan Road
Canton, MA 02021-2809
ANNUAL REPORT
August 31, 2017

MFS® U.S. GOVERNMENT CASH RESERVE FUND

LMM-ANN
MFS® U.S. GOVERNMENT CASH RESERVE FUND
CONTENTS
The report is prepared for the general information of shareholders.
It is authorized for distribution to prospective investors only when preceded or accompanied by a current prospectus.
NOT FDIC INSURED • MAY LOSE VALUE • NO BANK GUARANTEE

LETTER FROM THE EXECUTIVE CHAIRMAN
Dear Shareholders:
Despite policy uncertainty accompanying a new presidential administration in the United States and unease over ongoing Brexit negotiations, most markets have proved
resilient. U.S. share prices have reached new highs in recent months although the U.S. Federal Reserve has continued to gradually hike interest rates. However, rates in most developed markets remain very low, with major non-U.S. central banks just beginning to contemplate curbing accommodative monetary policies.
Globally, we’ve experienced a year-long synchronized upturn in economic growth. Despite better growth, there are few immediate signs of worrisome inflation amid muted wage gains around the world. Europe has benefited from diminishing event risks as populist challengers fell short of upsetting establishment
candidates in both the Dutch and French elections. Emerging market economies have been boosted in part by a weaker U.S. dollar and are recovering despite lingering concerns over the potential for restrictive U.S. trade policies that could hamper global trade growth. Looking ahead, markets will have to contend with issues involving geopolitical hot spots on the Korean peninsula and in the Middle East.
At MFS®, we believe time is an asset. A patient, long-term approach to investing can have a powerful impact on decision making and outcomes. Time arbitrage, as we call it, comes down to having the conviction and discipline to allow enough time for good investment ideas to play out. In our view, such an approach, along with the professional guidance of a financial advisor, will help you reach your investment objectives.
Respectfully,

Robert J. Manning
Executive Chairman
MFS Investment Management
October 17, 2017
The opinions expressed in this letter are subject to change and may not be relied upon for investment advice. No forecasts can be guaranteed.
1
PORTFOLIO COMPOSITION
Portfolio structure (u)
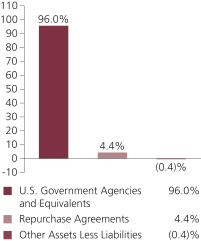
| | | | |
Composition including fixed
income credit quality (a)(u) | |
| A-1+ | | | 15.7% | |
| A-1 | | | 80.3% | |
| A-2 | | | 4.4% | |
| Not Rated | | | 0.0% | |
| Other Assets Less Liabilities | | | (0.4)% | |
| | | | |
| Maturity breakdown (u) | | | | |
| 0 - 7 days | | | 24.6% | |
| 8 - 29 days | | | 30.9% | |
| 30 - 59 days | | | 39.4% | |
| 60 - 89 days | | | 1.8% | |
| 90 - 365 days | | | 3.7% | |
| Other Assets Less Liabilities | | | (0.4)% | |
| (a) | Ratings are assigned to portfolio securities utilizing ratings from Moody’s, Fitch, and Standard & Poor’s rating agencies and applying the following hierarchy: If all three agencies provide a rating, the middle rating (after dropping the highest and lowest ratings) is assigned; if two of the three agencies rate a security, the lower of the two is assigned. Ratings are shown in the S&P scale. All ratings are subject to change. The fund is not rated by these agencies. |
| (u) | For purposes of this presentation, accrued interest, where applicable, is included. |
From time to time Other Assets Less Liabilities may be negative due to timing of cash receipts.
Percentages are based on net assets as of August 31, 2017.
The portfolio is actively managed and current holdings may be different.
2
PERFORMANCE SUMMARY THROUGH 8/31/17
Total returns as well as the current 7-day yield have been provided for the applicable time periods. Performance results reflect the percentage change in net asset value, including the reinvestment of any dividends and capital gains distributions. (See Notes to Performance Summary.)
Performance data shown represents past performance and is no guarantee of future results. Although the fund seeks to preserve the value of your investment at $1.00 per share, you could lose money on your investment in the fund. An investment in the fund is not a bank deposit and is not insured or guaranteed by the Federal Deposit Insurance Corporation or any other governmental agency. The performance shown does not reflect the deduction of taxes, if any, that a shareholder would pay on fund distributions or the redemption of fund shares.
| | | | | | | | | | | | |
| | | Share Class | | Inception | | 1-Year Total
Return (without
sales charge) | | Current 7-day yield | | | |
| | | A | | 9/07/93 | | 0.08% | | | 0.30% | | | |
| | | B | | 12/29/86 | | 0.08% | | | 0.30% | | | |
| | | C | | 4/01/96 | | 0.08% | | | 0.30% | | | |
| | | R1 | | 4/01/05 | | 0.08% | | | 0.30% | | | |
| | | R2 | | 4/01/05 | | 0.08% | | | 0.30% | | | |
| | | R3 | | 4/01/05 | | 0.08% | | | 0.30% | | | |
| | | R4 | | 4/01/05 | | 0.08% | | | 0.30% | | | |
| | | 529A | | 7/31/02 | | 0.06% | | | 0.25% | | | |
| | | 529B | | 7/31/02 | | 0.06% | | | 0.25% | | | |
| | | 529C | | 7/31/02 | | 0.06% | | | 0.25% | | | |
| | | |
| | | | | 1-Year
Total Return | | | |
| | | B
With CDSC (Declining over six years from 4% to 0%) (v) | | | (3.92)% | | | |
| | | C
With CDSC (1% for 12 months) (v) | | | (0.92)% | | | |
| | | 529B
With CDSC (Declining over six years from 4% to 0%) (v) | | | (3.94)% | | | |
| | | 529C
With CDSC (1% for 12 months) (v) | | | (0.94)% | | | |
3
Performance Summary – continued
CDSC – Contingent Deferred Sales Charge.
Class R1, R2, R3, R4, and 529A shares do not have a sales charge. Certain Class A shares acquired through an exchange may be subject to a CDSC upon redemption depending on when the shares exchanged were originally purchased.
| (v) | Assuming redemption at the end of the applicable period. |
Yields quoted are based on the latest seven days ended as of August 31, 2017, with dividends annualized. The yield quotations more closely reflect the current earnings of the fund than the total return quotations. Shares of the fund can be purchased at net asset value without a sales charge.
Notes to Performance Summary
Class 529 shares are only available in conjunction with qualified tuition programs, such as the MFS 529 Savings Plan. There also is an additional fee, which is detailed in the program description, on qualified tuition programs. If this fee was reflected, the performance for Class 529 shares would have been lower. This annual fee is waived for Oregon residents and for those accounts with assets of $25,000 or more.
Performance results reflect any applicable expense subsidies, waivers and adjustments in effect during the periods shown. Subsidies and fee waivers may be imposed to enhance a fund’s yield or to avoid a negative yield during periods when the fund’s operating expenses have a significant impact on the fund’s yield due to lower interest rates. Without such subsidies and waivers the fund’s performance results would be less favorable. Please see the prospectus and financial statements for complete details. All results are historical and assume the reinvestment of any dividends and capital gain distributions.
4
EXPENSE TABLE
Fund expenses borne by the shareholders during the period, March 1, 2017 through August 31, 2017
As a shareholder of the fund, you incur two types of costs: (1) transaction costs, including sales charges (loads) on certain purchase or redemption payments, and (2) ongoing costs, including management fees; distribution and service (12b-1) fees; and other fund expenses. This example is intended to help you understand your ongoing costs (in dollars) of investing in the fund and to compare these costs with the ongoing costs of investing in other mutual funds.
The example is based on an investment of $1,000 invested at the beginning of the period and held for the entire period March 1, 2017 through August 31, 2017.
Actual Expenses
The first line for each share class in the following table provides information about actual account values and actual expenses. You may use the information in this line, together with the amount you invested, to estimate the expenses that you paid over the period. Simply divide your account value by $1,000 (for example, an $8,600 account value divided by $1,000 = 8.6), then multiply the result by the number in the first line under the heading entitled “Expenses Paid During Period” to estimate the expenses you paid on your account during this period.
Hypothetical Example for Comparison Purposes
The second line for each share class in the following table provides information about hypothetical account values and hypothetical expenses based on the fund’s actual expense ratio and an assumed rate of return of 5% per year before expenses, which is not the fund’s actual return. The hypothetical account values and expenses may not be used to estimate the actual ending account balance or expenses you paid for the period. You may use this information to compare the ongoing costs of investing in the fund and other funds. To do so, compare this 5% hypothetical example with the 5% hypothetical examples that appear in the shareholder reports of the other funds.
Please note that the expenses shown in the table are meant to highlight your ongoing costs only and do not reflect any transactional costs, such as sales charges (loads). Therefore, the second line for each share class in the table is useful in comparing ongoing costs only, and will not help you determine the relative total costs of owning different funds. In addition, if these transactional costs were included, your costs would have been higher.
5
Expense Table – continued
| | | | | | | | | | | | |
Share
Class | | | | Annualized
Expense
Ratio | | Beginning
Account Value
3/01/17 | | Ending Account Value
8/31/17 | | Expenses Paid During
Period (p)
3/01/17-8/31/17 | |
| A | | Actual | | 0.66% | | $1,000.00 | | $1,000.73 | | | $3.33 | |
| | Hypothetical (h) | | 0.66% | | $1,000.00 | | $1,021.88 | | | $3.36 | |
| B | | Actual | | 0.66% | | $1,000.00 | | $1,000.73 | | | $3.33 | |
| | Hypothetical (h) | | 0.66% | | $1,000.00 | | $1,021.88 | | | $3.36 | |
| C | | Actual | | 0.66% | | $1,000.00 | | $1,000.73 | | | $3.33 | |
| | Hypothetical (h) | | 0.66% | | $1,000.00 | | $1,021.88 | | | $3.36 | |
| R1 | | Actual | | 0.66% | | $1,000.00 | | $1,000.72 | | | $3.33 | |
| | Hypothetical (h) | | 0.66% | | $1,000.00 | | $1,021.88 | | | $3.36 | |
| R2 | | Actual | | 0.66% | | $1,000.00 | | $1,000.73 | | | $3.33 | |
| | Hypothetical (h) | | 0.66% | | $1,000.00 | | $1,021.88 | | | $3.36 | |
| R3 | | Actual | | 0.66% | | $1,000.00 | | $1,000.73 | | | $3.33 | |
| | Hypothetical (h) | | 0.66% | | $1,000.00 | | $1,021.88 | | | $3.36 | |
| R4 | | Actual | | 0.66% | | $1,000.00 | | $1,000.73 | | | $3.33 | |
| | Hypothetical (h) | | 0.66% | | $1,000.00 | | $1,021.88 | | | $3.36 | |
| 529A | | Actual | | 0.70% | | $1,000.00 | | $1,000.54 | | | $3.53 | |
| | Hypothetical (h) | | 0.70% | | $1,000.00 | | $1,021.68 | | | $3.57 | |
| 529B | | Actual | | 0.70% | | $1,000.00 | | $1,000.54 | | | $3.53 | |
| | Hypothetical (h) | | 0.70% | | $1,000.00 | | $1,021.68 | | | $3.57 | |
| 529C | | Actual | | 0.70% | | $1,000.00 | | $1,000.54 | | | $3.53 | |
| | Hypothetical (h) | | 0.70% | | $1,000.00 | | $1,021.68 | | | $3.57 | |
| (h) | 5% class return per year before expenses. |
| (p) | “Expenses Paid During Period” are equal to each class’s annualized expense ratio, as shown above, multiplied by the average account value over the period, multiplied by 184/365 (to reflect the one-half year period). Expenses paid do not include any applicable sales charges (loads). If these transaction costs had been included, your costs would have been higher. |
Notes to Expense Table
As further discussed in Note 3 in the Notes to Financial Statements, the expense ratios reported above include additional expense reductions to avoid a negative yield.
6
PORTFOLIO OF INVESTMENTS
8/31/17
The Portfolio of Investments is a complete list of all securities owned by your fund. It is categorized by broad-based asset classes.
| | | | | | | | |
| U.S. Government Agencies and Equivalents (y) - 96.0% | |
| Issuer | | Shares/Par | | | Value ($) | |
| Fannie Mae, 0.975%, due 9/1/2017 | | $ | 1,385,000 | | | $ | 1,385,000 | |
| Fannie Mae, 0.944%, due 9/5/2017 | | | 5,000,000 | | | | 4,999,483 | |
| Fannie Mae, 0.974%, due 9/5/2017 | | | 6,562,000 | | | | 6,561,300 | |
| Fannie Mae, 1.02%, due 9/6/2017 | | | 4,750,000 | | | | 4,749,337 | |
| Fannie Mae, 0.944%, due 10/2/2017 | | | 11,554,000 | | | | 11,544,747 | |
| Fannie Mae, 0.954%, due 10/2/2017 | | | 9,273,000 | | | | 9,265,494 | |
| Fannie Mae, 0.944%, due 10/3/2017 | | | 4,000,000 | | | | 3,996,693 | |
| Fannie Mae, 1.057%, due 10/18/2017 | | | 9,300,000 | | | | 9,287,373 | |
| Fannie Mae, 1.011%, due 10/25/2017 | | | 4,400,000 | | | | 4,393,426 | |
| Federal Farm Credit Bank, 1.005%, due 9/1/2017 | | | 1,000,000 | | | | 1,000,000 | |
| Federal Farm Credit Bank, 1.005%, due 9/13/2017 | | | 2,500,000 | | | | 2,499,175 | |
| Federal Farm Credit Bank, 1.005%, due 9/19/2017 | | | 8,000,000 | | | | 7,996,040 | |
| Federal Farm Credit Bank, 1.015%, due 9/21/2017 | | | 3,200,000 | | | | 3,198,222 | |
| Federal Farm Credit Bank, 1.005%, due 10/2/2017 | | | 4,000,000 | | | | 3,996,590 | |
| Federal Farm Credit Bank, 1.015%, due 10/3/2017 | | | 10,000,000 | | | | 9,991,111 | |
| Federal Farm Credit Bank, 1.005%, due 10/12/2017 | | | 4,500,000 | | | | 4,494,926 | |
| Federal Farm Credit Bank, 1.015%, due 10/16/2017 | | | 7,100,000 | | | | 7,091,125 | |
| Federal Farm Credit Bank, 1.078%, due 10/20/2017 | | | 11,425,000 | | | | 11,408,516 | |
| Federal Farm Credit Bank, 1.016%, due 11/16/2017 | | | 5,000,000 | | | | 4,989,444 | |
| Federal Home Loan Bank, 0.963%, due 9/5/2017 | | | 15,177,000 | | | | 15,175,398 | |
| Federal Home Loan Bank, 0.964%, due 9/8/2017 | | | 1,612,000 | | | | 1,611,702 | |
| Federal Home Loan Bank, 1.004%, due 9/11/2017 | | | 4,000,000 | | | | 3,998,900 | |
| Federal Home Loan Bank, 1.014%, due 9/13/2017 | | | 6,891,000 | | | | 6,888,703 | |
| Federal Home Loan Bank, 1.025%, due 9/25/2017 | | | 11,300,000 | | | | 11,292,391 | |
| Federal Home Loan Bank, 1.01%, due 9/26/2017 | | | 7,754,000 | | | | 7,748,642 | |
| Federal Home Loan Bank, 1.02%, due 9/27/2017 | | | 6,900,000 | | | | 6,894,992 | |
| Federal Home Loan Bank, 1.036%, due 10/6/2017 | | | 2,660,000 | | | | 2,657,362 | |
| Freddie Mac, 1.016%, due 9/8/2017 | | | 11,550,000 | | | | 11,547,754 | |
| Freddie Mac, 1.03%, due 9/11/2017 | | | 5,655,000 | | | | 5,653,406 | |
| Freddie Mac, 1.005%, due 9/14/2017 | | | 3,000,000 | | | | 2,998,928 | |
| Freddie Mac, 0.984%, due 9/21/2017 | | | 13,374,000 | | | | 13,366,793 | |
| Freddie Mac, 1.004%, due 9/21/2017 | | | 100,000 | | | | 99,945 | |
| Freddie Mac, 1.004%, due 9/25/2017 | | | 1,850,000 | | | | 1,848,779 | |
| Freddie Mac, 1.016%, due 10/5/2017 | | | 9,000,000 | | | | 8,991,500 | |
| Freddie Mac, 1.047%, due 10/17/2017 | | | 6,950,000 | | | | 6,940,853 | |
| Freddie Mac, 1.005%, due 10/20/2017 | | | 5,000,000 | | | | 4,993,263 | |
| U.S. Treasury Bill, 0.949%, due 9/7/2017 | | | 8,900,000 | | | | 8,898,613 | |
| U.S. Treasury Bill, 0.994%, due 9/7/2017 | | | 900,000 | | | | 899,853 | |
| U.S. Treasury Bill, 0.933%, due 9/14/2017 | | | 7,396,000 | | | | 7,393,543 | |
| U.S. Treasury Bill, 0.974%, due 9/14/2017 | | | 5,100,000 | | | | 5,098,232 | |
7
Portfolio of Investments – continued
| | | | | | | | |
| Issuer | | Shares/Par | | | Value ($) | |
| U.S. Government Agencies and Equivalents (y) - continued | |
| U.S. Treasury Bill, 1.032%, due 10/19/2017 | | $ | 11,590,000 | | | $ | 11,574,315 | |
| U.S. Treasury Bill, 1.142%, due 2/15/2018 | | | 10,450,000 | | | | 10,395,706 | |
Total U.S. Government Agencies and Equivalents,
at Amortized Cost and Value | | | | | | $ | 269,817,575 | |
| | |
| Repurchase Agreements - 4.4% | | | | | | | | |
| Goldman Sachs Repurchase Agreement, 1.05%, dated 8/31/17, due 9/01/17, total to be received $12,262,358 (secured by U.S. Treasury and Federal Agency obligations valued at $12,507,243 in a jointly traded account), at Cost and Value | | $ | 12,262,000 | | | $ | 12,262,000 | |
| |
| Other Assets, Less Liabilities - (0.4)% | | | | (1,046,251 | ) |
| Net Assets - 100.0% | | | $ | 281,033,324 | |
| (y) | The rate shown represents an annualized yield at time of purchase. |
See Notes to Financial Statements
8
Financial Statements
STATEMENT OF ASSETS AND LIABILITIES
At 8/31/17
This statement represents your fund’s balance sheet, which details the assets and liabilities comprising the total value of the fund.
| | | | |
| Assets | | | | |
Investments in unaffiliated issuers, at amortized cost and value | | | $282,079,575 | |
Cash | | | 86 | |
Receivables for | | | | |
Fund shares sold | | | 100,062 | |
Interest | | | 358 | |
Other assets | | | 433 | |
Total assets | | | $282,180,514 | |
| Liabilities | | | | |
Payables for | | | | |
Distributions | | | $1,206 | |
Fund shares reacquired | | | 964,104 | |
Payable to affiliates | | | | |
Investment adviser | | | 6,351 | |
Shareholder servicing costs | | | 96,344 | |
Program manager fee | | | 56 | |
Payable for independent Trustees’ compensation | | | 6,527 | |
Accrued expenses and other liabilities | | | 72,602 | |
Total liabilities | | | $1,147,190 | |
Net assets | | | $281,033,324 | |
| Net assets consist of | | | | |
Paid-in capital | | | $281,041,048 | |
Accumulated net realized gain (loss) | | | (5 | ) |
Accumulated distributions in excess of net investment income | | | (7,719 | ) |
Net assets | | | $281,033,324 | |
Shares of beneficial interest outstanding | | | 281,263,331 | |
9
Statement of Assets and Liabilities – continued
| | | | | | | | | | | | |
| | | Net assets | | | Shares outstanding | | | Net asset value per share | |
Class A | | | $105,859,463 | | | | 105,944,053 | | | | $1.00 | |
Class B | | | 17,338,003 | | | | 17,354,865 | | | | 1.00 | |
Class C | | | 38,457,621 | | | | 38,488,826 | | | | 1.00 | |
Class R1 | | | 12,235,989 | | | | 12,246,184 | | | | 1.00 | |
Class R2 | | | 48,184,040 | | | | 48,223,323 | | | | 1.00 | |
Class R3 | | | 35,195,911 | | | | 35,225,807 | | | | 1.00 | |
Class R4 | | | 3,249,778 | | | | 3,252,344 | | | | 1.00 | |
Class 529A | | | 13,208,250 | | | | 13,218,088 | | | | 1.00 | |
Class 529B | | | 347,512 | | | | 347,852 | | | | 1.00 | |
Class 529C | | | 6,956,757 | | | | 6,961,989 | | | | 1.00 | |
A contingent deferred sales charge may be imposed on redemptions of Class A, Class B, Class C, Class 529B, and Class 529C shares. Redemption price per share was equal to the net asset value per share for Classes R1, R2, R3, R4, and 529A.
See Notes to Financial Statements
10
Financial Statements
STATEMENT OF OPERATIONS
Year ended 8/31/17
This statement describes how much your fund earned in investment income and accrued in expenses. It also describes any gains and/or losses generated by fund operations.
| | | | |
| Net investment income (loss) | | | | |
Income | | | | |
Interest | | | $1,777,515 | |
Other | | | 4,909 | |
Total investment income | | | $1,782,424 | |
Expenses | | | | |
Management fee | | | $1,229,252 | |
Distribution and service fees | | | 1,527,876 | |
Shareholder servicing costs | | | 516,452 | |
Program manager fees | | | 20,762 | |
Administrative services fee | | | 58,024 | |
Independent Trustees’ compensation | | | 10,946 | |
Custodian fee | | | 20,835 | |
Reimbursement of custodian expenses | | | (25,151 | ) |
Shareholder communications | | | 36,730 | |
Audit and tax fees | | | 36,380 | |
Legal fees | | | 3,975 | |
Miscellaneous | | | 152,969 | |
Total expenses | | | $3,589,050 | |
Reduction of expenses by investment adviser and distributor | | | (2,034,056 | ) |
Net expenses | | | $1,554,994 | |
Net investment income (loss) | | | $227,430 | |
Realized gain (loss) (identified cost basis) on unaffiliated issuers | | | $(4 | ) |
Change in net assets from operations | | | $227,426 | |
See Notes to Financial Statements
11
Financial Statements
STATEMENTS OF CHANGES IN NET ASSETS
These statements describe the increases and/or decreases in net assets resulting from operations, any distributions, and any shareholder transactions.
| | | | | | | | |
| | | Year ended | |
| | | 8/31/17 | | | 8/31/16 | |
| Change in net assets | | | | | | |
| From operations | | | | | | | | |
Net investment income (loss) | | | $227,430 | | | | $0 | |
Net realized gain (loss) | | | (4 | ) | | | 0 | |
Change in net assets from operations | | | $227,426 | | | | $0 | |
| Distributions declared to shareholders | | | | | | | | |
From net investment income | | | $(227,426 | ) | | | $0 | |
Change in net assets from fund share transactions | | | $(33,308,224 | ) | | | $(2,111,675 | ) |
Total change in net assets | | | $(33,308,224 | ) | | | $(2,111,675 | ) |
| Net assets | | | | | | | | |
At beginning of period | | | 314,341,548 | | | | 316,453,223 | |
At end of period (including accumulated distributions in excess of net investment income of $7,719 and accumulated net investment loss of $9,044, respectively) | | | $281,033,324 | | | | $314,341,548 | |
See Notes to Financial Statements
12
Financial Statements
FINANCIAL HIGHLIGHTS
The financial highlights table is intended to help you understand the fund’s financial performance for the past 5 years. Certain information reflects financial results for a single fund share. The total returns in the table represent the rate that an investor would have earned (or lost) on an investment in the fund share class (assuming reinvestment of all distributions) held for the entire period.
| | | | | | | | | | | | | | | | | | | | |
| Class A | | Year ended | |
| | | 8/31/17 | | | 8/31/16 | | | 8/31/15 | | | 8/31/14 | | | 8/31/13 | |
Net asset value, beginning of period | | | $1.00 | | | | $1.00 | | | | $1.00 | | | | $1.00 | | | | $1.00 | |
| Income (loss) from investment operations | | | | | | | | | | | | | | | | | |
Net investment income (loss) (d) | | | $0.00 | (c)(w) | | | $0.00 | | | | $0.00 | | | | $0.00 | | | | $0.00 | |
Net realized and unrealized gain (loss) | | | (0.00 | )(w) | | | — | | | | 0.00 | (w) | | | 0.00 | (w) | | | — | |
Total from investment operations | | | $0.00 | (w) | | | $0.00 | | | | $0.00 | (w) | | | $0.00 | (w) | | | $0.00 | |
| Less distributions declared to shareholders | | | | | | | | | | | | | | | | | |
From net investment income | | | $(0.00 | )(w) | | | $— | | | | $— | | | | $— | | | | $— | |
Net asset value, end of period | | | $1.00 | | | | $1.00 | | | | $1.00 | | | | $1.00 | | | | $1.00 | |
Total return (%) (r)(t) | | | 0.08 | (c) | | | 0.00 | | | | 0.00 | (w) | | | 0.00 | (w) | | | 0.00 | |
Ratios (%) (to average net assets)
and Supplemental data: | | | | | | | | | | | | | | | | | |
Expenses before expense reductions (f) | | | 0.91 | (c) | | | 0.91 | | | | 0.92 | | | | 0.90 | | | | 0.93 | |
Expenses after expense reductions (f) | | | 0.50 | (c) | | | 0.23 | | | | 0.07 | | | | 0.09 | | | | 0.15 | |
Net investment income (loss) | | | 0.08 | (c) | | | 0.00 | | | | 0.00 | | | | 0.00 | | | | 0.00 | |
Net assets at end of period (000 omitted) | | | $105,859 | | | | $120,740 | | | | $122,085 | | | | $124,550 | | | | $145,062 | |
| |
| Class B | | Year ended | |
| | | 8/31/17 | | | 8/31/16 | | | 8/31/15 | | | 8/31/14 | | | 8/31/13 | |
Net asset value, beginning of period | | | $1.00 | | | | $1.00 | | | | $1.00 | | | | $1.00 | | | | $1.00 | |
| Income (loss) from investment operations | |
Net investment income (loss) (d) | | | $0.00 | (c)(w) | | | $0.00 | | | | $0.00 | | | | $0.00 | | | | $0.00 | |
Net realized and unrealized gain (loss) | | | (0.00 | )(w) | | | — | | | | 0.00 | (w) | | | 0.00 | (w) | | | — | |
Total from investment operations | | | $0.00 | (w) | | | $0.00 | | | | $0.00 | (w) | | | $0.00 | (w) | | | $0.00 | |
| Less distributions declared to shareholders | |
From net investment income | | | $(0.00 | )(w) | | | $— | | | | $— | | | | $— | | | | $— | |
Net asset value, end of period | | | $1.00 | | | | $1.00 | | | | $1.00 | | | | $1.00 | | | | $1.00 | |
Total return (%) (r)(t) | | | 0.08 | (c) | | | 0.00 | | | | 0.00 | (w) | | | 0.00 | (w) | | | 0.00 | |
Ratios (%) (to average net assets)
and Supplemental data: | | | | | |
Expenses before expense reductions (f) | | | 1.66 | (c) | | | 1.66 | | | | 1.67 | | | | 1.65 | | | | 1.68 | |
Expenses after expense reductions (f) | | | 0.51 | (c) | | | 0.23 | | | | 0.07 | | | | 0.10 | | | | 0.15 | |
Net investment income (loss) | | | 0.07 | (c) | | | 0.00 | | | | 0.00 | | | | 0.00 | | | | 0.00 | |
Net assets at end of period (000 omitted) | | | $17,338 | | | | $18,096 | | | | $18,831 | | | | $22,982 | | | | $30,833 | |
See Notes to Financial Statements
13
Financial Highlights – continued
| | | | | | | | | | | | | | | | | | | | |
| Class C | | Year ended | |
| | | 8/31/17 | | | 8/31/16 | | | 8/31/15 | | | 8/31/14 | | | 8/31/13 | |
Net asset value, beginning of period | | | $1.00 | | | | $1.00 | | | | $1.00 | | | | $1.00 | | | | $1.00 | |
| Income (loss) from investment operations | |
Net investment income (loss) (d) | | | $0.00 | (c)(w) | | | $0.00 | | | | $0.00 | | | | $0.00 | | | | $0.00 | |
Net realized and unrealized gain (loss) | | | (0.00 | )(w) | | | — | | | | 0.00 | (w) | | | 0.00 | (w) | | | — | |
Total from investment operations | | | $0.00 | (w) | | | $0.00 | | | | $0.00 | (w) | | | $0.00 | (w) | | | $0.00 | |
| Less distributions declared to shareholders | |
From net investment income | | | $(0.00 | )(w) | | | $— | | | | $— | | | | $— | | | | $— | |
Net asset value, end of period | | | $1.00 | | | | $1.00 | | | | $1.00 | | | | $1.00 | | | | $1.00 | |
Total return (%) (r)(t) | | | 0.08 | (c) | | | 0.00 | | | | 0.00 | (w) | | | 0.00 | (w) | | | 0.00 | |
Ratios (%) (to average net assets)
and Supplemental data: | |
Expenses before expense reductions (f) | | | 1.66 | (c) | | | 1.66 | | | | 1.67 | | | | 1.65 | | | | 1.68 | |
Expenses after expense reductions (f) | | | 0.50 | (c) | | | 0.24 | | | | 0.07 | | | | 0.10 | | | | 0.15 | |
Net investment income (loss) | | | 0.07 | (c) | | | 0.00 | | | | 0.00 | | | | 0.00 | | | | 0.00 | |
Net assets at end of period (000 omitted) | | | $38,458 | | | | $48,749 | | | | $42,522 | | | | $45,662 | | | | $58,363 | |
| |
| Class R1 | | Year ended | |
| | | 8/31/17 | | | 8/31/16 | | | 8/31/15 | | | 8/31/14 | | | 8/31/13 | |
Net asset value, beginning of period | | | $1.00 | | | | $1.00 | | | | $1.00 | | | | $1.00 | | | | $1.00 | |
| Income (loss) from investment operations | |
Net investment income (loss) (d) | | | $0.00 | (c)(w) | | | $0.00 | | | | $0.00 | | | | $0.00 | | | | $0.00 | |
Net realized and unrealized gain (loss) | | | (0.00 | )(w) | | | — | | | | 0.00 | (w) | | | 0.00 | (w) | | | — | |
Total from investment operations | | | $0.00 | (w) | | | $0.00 | | | | $0.00 | (w) | | | $0.00 | (w) | | | $0.00 | |
| Less distributions declared to shareholders | |
From net investment income | | | $(0.00 | )(w) | | | $— | | | | $— | | | | $— | | | | $— | |
Net asset value, end of period | | | $1.00 | | | | $1.00 | | | | $1.00 | | | | $1.00 | | | | $1.00 | |
Total return (%) (r)(t) | | | 0.08 | (c) | | | 0.00 | | | | 0.00 | (w) | | | 0.00 | (w) | | | 0.00 | |
Ratios (%) (to average net assets)
and Supplemental data: | |
Expenses before expense reductions (f) | | | 1.66 | (c) | | | 1.66 | | | | 1.67 | | | | 1.65 | | | | 1.68 | |
Expenses after expense reductions (f) | | | 0.50 | (c) | | | 0.23 | | | | 0.07 | | | | 0.09 | | | | 0.15 | |
Net investment income (loss) | | | 0.07 | (c) | | | 0.00 | | | | 0.00 | | | | 0.00 | | | | 0.00 | |
Net assets at end of period (000 omitted) | | | $12,236 | | | | $14,569 | | | | $14,363 | | | | $16,819 | | | | $21,080 | |
See Notes to Financial Statements
14
Financial Highlights – continued
| | | | | | | | | | | | | | | | | | | | |
| Class R2 | | Year ended | |
| | | 8/31/17 | | | 8/31/16 | | | 8/31/15 | | | 8/31/14 | | | 8/31/13 | |
Net asset value, beginning of period | | | $1.00 | | | | $1.00 | | | | $1.00 | | | | $1.00 | | | | $1.00 | |
| Income (loss) from investment operations | |
Net investment income (loss) (d) | | | $0.00 | (c)(w) | | | $0.00 | | | | $0.00 | | | | $0.00 | | | | $0.00 | |
Net realized and unrealized gain (loss) | | | (0.00 | )(w) | | | — | | | | 0.00 | (w) | | | 0.00 | (w) | | | — | |
Total from investment operations | | | $0.00 | (w) | | | $0.00 | | | | $0.00 | (w) | | | $0.00 | (w) | | | $0.00 | |
| Less distributions declared to shareholders | |
From net investment income | | | $(0.00 | )(w) | | | $— | | | | $— | | | | $— | | | | $— | |
Net asset value, end of period | | | $1.00 | | | | $1.00 | | | | $1.00 | | | | $1.00 | | | | $1.00 | |
Total return (%) (r)(t) | | | 0.08 | (c) | | | 0.00 | | | | 0.00 | (w) | | | 0.00 | (w) | | | 0.00 | |
Ratios (%) (to average net assets)
and Supplemental data: | |
Expenses before expense reductions (f) | | | 1.16 | (c) | | | 1.16 | | | | 1.17 | | | | 1.15 | | | | 1.18 | |
Expenses after expense reductions (f) | | | 0.51 | (c) | | | 0.23 | | | | 0.07 | | | | 0.09 | | | | 0.15 | |
Net investment income (loss) | | | 0.08 | (c) | | | 0.00 | | | | 0.00 | | | | 0.00 | | | | 0.00 | |
Net assets at end of period (000 omitted) | | | $48,184 | | | | $51,537 | | | | $53,058 | | | | $57,634 | | | | $74,406 | |
| |
| Class R3 | | Year ended | |
| | | 8/31/17 | | | 8/31/16 | | | 8/31/15 | | | 8/31/14 | | | 8/31/13 | |
Net asset value, beginning of period | | | $1.00 | | | | $1.00 | | | | $1.00 | | | | $1.00 | | | | $1.00 | |
| Income (loss) from investment operations | |
Net investment income (loss) (d) | | | $0.00 | (c)(w) | | | $0.00 | | | | $0.00 | | | | $0.00 | | | | $0.00 | |
Net realized and unrealized gain (loss) | | | (0.00 | )(w) | | | — | | | | 0.00 | (w) | | | 0.00 | (w) | | | — | |
Total from investment operations | | | $0.00 | (w) | | | $0.00 | | | | $0.00 | (w) | | | $0.00 | (w) | | | $0.00 | |
| Less distributions declared to shareholders | |
From net investment income | | | $(0.00 | )(w) | | | $— | | | | $— | | | | $— | | | | $— | |
Net asset value, end of period | | | $1.00 | | | | $1.00 | | | | $1.00 | | | | $1.00 | | | | $1.00 | |
Total return (%) (r)(t) | | | 0.08 | (c) | | | 0.00 | | | | 0.00 | (w) | | | 0.00 | (w) | | | 0.00 | |
Ratios (%) (to average net assets)
and Supplemental data: | |
Expenses before expense reductions (f) | | | 0.91 | (c) | | | 0.91 | | | | 0.92 | | | | 0.90 | | | | 0.93 | |
Expenses after expense reductions (f) | | | 0.51 | (c) | | | 0.23 | | | | 0.07 | | | | 0.09 | | | | 0.15 | |
Net investment income (loss) | | | 0.08 | (c) | | | 0.00 | | | | 0.00 | | | | 0.00 | | | | 0.00 | |
Net assets at end of period (000 omitted) | | | $35,196 | | | | $37,650 | | | | $44,872 | | | | $53,916 | | | | $64,925 | |
See Notes to Financial Statements
15
Financial Highlights – continued
| | | | | | | | | | | | | | | | | | | | |
| Class R4 | | Year ended | |
| | | 8/31/17 | | | 8/31/16 | | | 8/31/15 | | | 8/31/14 | | | 8/31/13 | |
Net asset value, beginning of period | | | $1.00 | | | | $1.00 | | | | $1.00 | | | | $1.00 | | | | $1.00 | |
| Income (loss) from investment operations | |
Net investment income (loss) (d) | | | $0.00 | (c)(w) | | | $0.00 | | | | $0.00 | | | | $0.00 | | | | $0.00 | |
Net realized and unrealized gain (loss) | | | (0.00 | )(w) | | | — | | | | 0.00 | (w) | | | 0.00 | (w) | | | — | |
Total from investment operations | | | $0.00 | (w) | | | $0.00 | | | | $0.00 | (w) | | | $0.00 | (w) | | | $0.00 | |
| Less distributions declared to shareholders | |
From net investment income | | | $(0.00 | )(w) | | | $— | | | | $— | | | | $— | | | | $— | |
Net asset value, end of period | | | $1.00 | | | | $1.00 | | | | $1.00 | | | | $1.00 | | | | $1.00 | |
Total return (%) (r)(t) | | | 0.08 | (c) | | | 0.00 | | | | 0.00 | (w) | | | 0.00 | (w) | | | 0.00 | |
Ratios (%) (to average net assets)
and Supplemental data: | |
Expenses before expense reductions (f) | | | 0.67 | (c) | | | 0.66 | | | | 0.67 | | | | 0.65 | | | | 0.68 | |
Expenses after expense reductions (f) | | | 0.52 | (c) | | | 0.23 | | | | 0.07 | | | | 0.09 | | | | 0.15 | |
Net investment income (loss) | | | 0.08 | (c) | | | 0.00 | | | | 0.00 | | | | 0.00 | | | | 0.00 | |
Net assets at end of period (000 omitted) | | | $3,250 | | | | $3,077 | | | | $3,034 | | | | $2,907 | | | | $820 | |
| |
| Class 529A | | Year ended | |
| | | 8/31/17 | | | 8/31/16 | | | 8/31/15 | | | 8/31/14 | | | 8/31/13 | |
Net asset value, beginning of period | | | $1.00 | | | | $1.00 | | | | $1.00 | | | | $1.00 | | | | $1.00 | |
| Income (loss) from investment operations | |
Net investment income (loss) (d) | | | $0.00 | (c)(w) | | | $0.00 | | | | $0.00 | | | | $0.00 | | | | $0.00 | |
Net realized and unrealized gain (loss) | | | (0.00 | )(w) | | | — | | | | 0.00 | (w) | | | 0.00 | (w) | | | — | |
Total from investment operations | | | $0.00 | (w) | | | $0.00 | | | | $0.00 | (w) | | | $0.00 | (w) | | | $0.00 | |
| Less distributions declared to shareholders | |
From net investment income | | | $(0.00 | )(w) | | | $— | | | | $— | | | | $— | | | | $— | |
Net asset value, end of period | | | $1.00 | | | | $1.00 | | | | $1.00 | | | | $1.00 | | | | $1.00 | |
Total return (%) (r)(t) | | | 0.06 | (c) | | | 0.00 | | | | 0.00 | (w) | | | 0.00 | (w) | | | 0.00 | |
Ratios (%) (to average net assets)
and Supplemental data: | |
Expenses before expense reductions (f) | | | 1.01 | (c) | | | 1.00 | | | | 1.02 | | | | 1.00 | | | | 1.03 | |
Expenses after expense reductions (f) | | | 0.53 | (c) | | | 0.23 | | | | 0.07 | | | | 0.09 | | | | 0.15 | |
Net investment income (loss) | | | 0.06 | (c) | | | 0.00 | | | | 0.00 | | | | 0.00 | | | | 0.00 | |
Net assets at end of period (000 omitted) | | | $13,208 | | | | $12,841 | | | | $11,383 | | | | $10,927 | | | | $10,897 | |
See Notes to Financial Statements
16
Financial Highlights – continued
| | | | | | | | | | | | | | | | | | | | |
| Class 529B | | Year ended | |
| | | 8/31/17 | | | 8/31/16 | | | 8/31/15 | | | 8/31/14 | | | 8/31/13 | |
Net asset value, beginning of period | | | $1.00 | | | | $1.00 | | | | $1.00 | | | | $1.00 | | | | $1.00 | |
| Income (loss) from investment operations | |
Net investment income (loss) (d) | | | $0.00 | (c)(w) | | | $0.00 | | | | $0.00 | | | | $0.00 | | | | $0.00 | |
Net realized and unrealized gain (loss) | | | (0.00 | )(w) | | | — | | | | 0.00 | (w) | | | 0.00 | (w) | | | — | |
Total from investment operations | | | $0.00 | (w) | | | $0.00 | | | | $0.00 | (w) | | | $0.00 | (w) | | | $0.00 | |
| Less distributions declared to shareholders | |
From net investment income | | | $(0.00 | )(w) | | | $— | | | | $— | | | | $— | | | | $— | |
Net asset value, end of period | | | $1.00 | | | | $1.00 | | | | $1.00 | | | | $1.00 | | | | $1.00 | |
Total return (%) (r)(t) | | | 0.06 | (c) | | | 0.00 | | | | 0.00 | (w) | | | 0.00 | (w) | | | 0.00 | |
Ratios (%) (to average net assets)
and Supplemental data: | |
Expenses before expense reductions (f) | | | 1.76 | (c) | | | 1.76 | | | | 1.77 | | | | 1.75 | | | | 1.78 | |
Expenses after expense reductions (f) | | | 0.53 | (c) | | | 0.22 | | | | 0.07 | | | | 0.10 | | | | 0.15 | |
Net investment income (loss) | | | 0.06 | (c) | | | 0.00 | | | | 0.00 | | | | 0.00 | | | | 0.00 | |
Net assets at end of period (000 omitted) | | | $348 | | | | $355 | | | | $440 | | | | $531 | | | | $676 | |
| |
| Class 529C | | Year ended | |
| | | 8/31/17 | | | 8/31/16 | | | 8/31/15 | | | 8/31/14 | | | 8/31/13 | |
Net asset value, beginning of period | | | $1.00 | | | | $1.00 | | | | $1.00 | | | | $1.00 | | | | $1.00 | |
| Income (loss) from investment operations | |
Net investment income (loss) (d) | | | $0.00 | (c)(w) | | | $0.00 | | | | $0.00 | | | | $0.00 | | | | $0.00 | |
Net realized and unrealized gain (loss) | | | (0.00 | )(w) | | | — | | | | 0.00 | (w) | | | 0.00 | (w) | | | — | |
Total from investment operations | | | $0.00 | (w) | | | $0.00 | | | | $0.00 | (w) | | | $0.00 | (w) | | | $0.00 | |
| Less distributions declared to shareholders | |
From net investment income | | | $(0.00 | )(w) | | | $— | | | | $— | | | | $— | | | | $— | |
Net asset value, end of period | | | $1.00 | | | | $1.00 | | | | $1.00 | | | | $1.00 | | | | $1.00 | |
Total return (%) (r)(t) | | | 0.06 | (c) | | | 0.00 | | | | 0.00 | (w) | | | 0.00 | (w) | | | 0.00 | |
Ratios (%) (to average net assets)
and Supplemental data: | |
Expenses before expense reductions (f) | | | 1.76 | (c) | | | 1.76 | | | | 1.77 | | | | 1.75 | | | | 1.78 | |
Expenses after expense reductions (f) | | | 0.54 | (c) | | | 0.24 | | | | 0.07 | | | | 0.09 | | | | 0.15 | |
Net investment income (loss) | | | 0.06 | (c) | | | 0.00 | | | | 0.00 | | | | 0.00 | | | | 0.00 | |
Net assets at end of period (000 omitted) | | | $6,957 | | | | $6,728 | | | | $5,866 | | | | $6,240 | | | | $6,072 | |
See Notes to Financial Statements
17
Financial Highlights – continued
| (c) | Amount reflects a one-time reimbursement of expenses by the custodian (or former custodian) without which net investment income and performance would be lower and expenses would be higher. See Note 2 in the Notes to Financial Statements for additional information. |
| (d) | Per share data is based on average shares outstanding. |
| (f) | Ratios do not reflect reductions from fees paid indirectly, if applicable. |
| (r) | Certain expenses have been reduced without which performance would have been lower. |
| (t) | Total returns do not include any applicable sales charges. |
| (w) | Per share amount was less than $0.01 and total return or ratio was less than 0.01%, as applicable. |
See Notes to Financial Statements
18
NOTES TO FINANCIAL STATEMENTS
(1) Business and Organization
MFS U.S. Government Cash Reserve Fund (the fund) is a diversified series of MFS Series Trust I (the trust). The trust is organized as a Massachusetts business trust and is registered under the Investment Company Act of 1940, as amended, as an open-end management investment company.
The fund is an investment company and accordingly follows the investment company accounting and reporting guidance of the Financial Accounting Standards Board (FASB) Accounting Standards Codification Topic 946 Financial Services – Investment Companies.
(2) Significant Accounting Policies
General – The preparation of financial statements in conformity with U.S. generally accepted accounting principles requires management to make estimates and assumptions that affect the reported amounts of assets and liabilities, and disclosure of contingent assets and liabilities at the date of the financial statements and the reported amounts of increases and decreases in net assets from operations during the reporting period. Actual results could differ from those estimates. In the preparation of these financial statements, management has evaluated subsequent events occurring after the date of the fund’s Statement of Assets and Liabilities through the date that the financial statements were issued.
In October 2016, the Securities and Exchange Commission (SEC) released its Final Rule on Investment Company Reporting Modernization (the “Rule”). The Rule, which introduced two new regulatory reporting forms for investment companies – Form N-PORT and Form N-CEN – also contained amendments to Regulation S-X which impact financial statement presentation, particularly the presentation of derivative investments, for all reporting periods ended after August 1, 2017. The fund has adopted the Rule’s Regulation S-X amendments and believes that the fund’s financial statements are in compliance with those amendments.
Balance Sheet Offsetting – The fund’s accounting policy with respect to balance sheet offsetting is that, absent an event of default by the counterparty or a termination of the agreement, the International Swaps and Derivatives Association (ISDA) Master Agreement does not result in an offset of reported amounts of financial assets and financial liabilities in the Statement of Assets and Liabilities across transactions between the fund and the applicable counterparty. The fund’s right to setoff may be restricted or prohibited by the bankruptcy or insolvency laws of the particular jurisdiction to which a specific master netting agreement counterparty is subject. Balance sheet offsetting disclosures, to the extent applicable to the fund, have been included in the fund’s Significant Accounting Policies note under the captions for each of the fund’s in-scope financial instruments and transactions.
Investment Valuations – Pursuant to procedures approved by the Board of Trustees, investments held by the fund are generally valued at amortized cost, which approximates market value. Amortized cost involves valuing an instrument at its cost as adjusted for amortization of premium or accretion of discount rather than its current market value. The amortized cost value of an instrument can be different from the market value of an instrument.
19
Notes to Financial Statements – continued
Various inputs are used in determining the value of the fund’s assets or liabilities. These inputs are categorized into three broad levels. In certain cases, the inputs used to measure fair value may fall into different levels of the fair value hierarchy. In such cases, an investment’s level within the fair value hierarchy is based on the lowest level of input that is significant to the fair value measurement. The fund’s assessment of the significance of a particular input to the fair value measurement in its entirety requires judgment, and considers factors specific to the investment. Level 1 includes unadjusted quoted prices in active markets for identical assets or liabilities. Level 2 includes other significant observable market-based inputs (including quoted prices for similar securities, interest rates, prepayment speed, and credit risk). Level 3 includes unobservable inputs, which may include the adviser’s own assumptions in determining the fair value of investments. The following is a summary of the levels used as of August 31, 2017 in valuing the fund’s assets or liabilities:
| | | | | | | | | | | | | | | | |
| Financial Instruments | | Level 1 | | | Level 2 | | | Level 3 | | | Total | |
| Short-Term Securities | | | $— | | | | $282,079,575 | | | | $— | | | | $282,079,575 | |
For further information regarding security characteristics, see the Portfolio of Investments.
Repurchase Agreements – The fund enters into repurchase agreements under the terms of Master Repurchase Agreements with approved counterparties. Each repurchase agreement is recorded at cost. The fund requires that the securities collateral in a repurchase transaction be transferred to a custodian. The fund monitors, on a daily basis, the value of the collateral to ensure that its value, including accrued interest, is greater than amounts owed to the fund under each such repurchase agreement. Upon an event of default under a Master Repurchase Agreement, the non-defaulting party may close out all transactions traded under such agreement and net amounts owed under each transaction to one net amount payable by one party to the other. Absent an event of default, the Master Repurchase Agreement does not result in an offset of reported amounts of assets and liabilities in the Statement of Assets and Liabilities across transactions between the fund and the applicable counterparty. The fund and other funds managed by MFS may utilize a joint trading account for the purpose of entering into one or more repurchase agreements. At period end, the fund had investments in repurchase agreements with a gross value of $12,262,000 included in investments in the Statement of Assets and Liabilities. The value of the related collateral exceeded the value of the repurchase agreements at period end.
Indemnifications – Under the fund’s organizational documents, its officers and Trustees may be indemnified against certain liabilities and expenses arising out of the performance of their duties to the fund. Additionally, in the normal course of business, the fund enters into agreements with service providers that may contain indemnification clauses. The fund’s maximum exposure under these agreements is unknown as this would involve future claims that may be made against the fund that have not yet occurred.
20
Notes to Financial Statements – continued
Investment Transactions and Income – Investment transactions are recorded on the trade date. Interest income is recorded on the accrual basis. All premium and discount is amortized or accreted for financial statement purposes in accordance with U.S. generally accepted accounting principles.
Reimbursement of Expenses by Custodian – In December 2015, the fund’s custodian (or former custodian), State Street Bank and Trust Company, announced that it intended to reimburse its asset servicing clients for expense amounts that it billed in error during the period 1998 through 2015. The amount of this one-time reimbursement attributable to the fund is reflected as “Reimbursement of custodian expenses” in the Statement of Operations.
Tax Matters and Distributions – The fund intends to qualify as a regulated investment company, as defined under Subchapter M of the Internal Revenue Code, and to distribute all of its taxable income, including realized capital gains. As a result, no provision for federal income tax is required. The fund’s federal tax returns, when filed, will remain subject to examination by the Internal Revenue Service for a three year period. Management has analyzed the fund’s tax positions taken on federal and state tax returns for all open tax years and does not believe that there are any uncertain tax positions that require recognition of a tax liability.
Distributions to shareholders are recorded on the ex-dividend date. Income and capital gain distributions are determined in accordance with income tax regulations, which may differ from U.S. generally accepted accounting principles. Certain capital accounts in the financial statements are periodically adjusted for permanent differences in order to reflect their tax character. These adjustments have no impact on net assets or net asset value per share. Temporary differences which arise from recognizing certain items of income, expense, gain or loss in different periods for financial statement and tax purposes will reverse at some time in the future. Distributions in excess of net investment income or net realized gains are temporary overdistributions for financial statement purposes resulting from differences in the recognition or classification of income or distributions for financial statement and tax purposes.
During the year ended August 31, 2017, there were no significant adjustments due to differences between book and tax accounting.
The tax character of distributions declared to shareholders for the last two fiscal years is as follows:
| | | | | | | | |
| | | Year ended | | | Year ended | |
| | | 8/31/17 | | | 8/31/16 | |
| Ordinary income (including any short-term capital gains) | | | $227,426 | | | | $— | |
The federal tax cost and the tax basis components of distributable earnings were as follows:
| | | | |
| As of 8/31/17 | | | |
| Cost of investments | | | $282,079,575 | |
| Post-October capital loss deferral | | | (5 | ) |
| Other temporary differences | | | (7,719 | ) |
21
Notes to Financial Statements – continued
Multiple Classes of Shares of Beneficial Interest – The fund offers multiple classes of shares, which differ in their respective distribution, service, and program manager fees. The fund’s income and common expenses are allocated to shareholders based on the value of settled shares outstanding of each class. The fund’s realized and unrealized gain (loss) are allocated to shareholders based on the daily net assets of each class. Dividends are declared separately for each class. Differences in per share dividend rates are generally due to differences in separate class expenses. Class B and Class 529B shares will convert to Class A and Class 529A shares, respectively, approximately eight years after purchase. The fund’s distributions declared to shareholders as reported in the Statements of Changes in Net Assets are presented by class as follows:
| | | | | | | | |
| | | From net investment
income | |
| | | Year
ended
8/31/17 | | | Year
ended
8/31/16 | |
| Class A | | | $89,813 | | | | $— | |
| Class B | | | 14,501 | | | | — | |
| Class C | | | 31,490 | | | | — | |
| Class R1 | | | 8,882 | | | | — | |
| Class R2 | | | 39,425 | | | | — | |
| Class R3 | | | 27,743 | | | | — | |
| Class R4 | | | 2,601 | | | | — | |
| Class 529A | | | 8,383 | | | | — | |
| Class 529B | | | 214 | | | | — | |
| Class 529C | | | 4,374 | | | | — | |
| Total | | | $227,426 | | | | $— | |
(3) Transactions with Affiliates
Investment Adviser – The fund has an investment advisory agreement with MFS to provide overall investment management and related administrative services and facilities to the fund. The management fee is computed daily and paid monthly at an annual rate of 0.40% of the fund’s average daily net assets.
During the year ended August 31, 2017, MFS voluntarily waived receipt of $466,223 of the fund’s management fee in order to avoid a negative yield. For the year ended August 31, 2017, this amount is included in the reduction of total expenses in the Statement of Operations. MFS has also agreed in writing to reduce its management fee by a specified amount if certain MFS mutual fund assets exceed thresholds agreed to by MFS and the fund’s Board of Trustees. For the year ended August 31, 2017, this management fee reduction amounted to $23,174, which is included in the reduction of total expenses in the Statement of Operations. The management fee incurred for the year ended August 31, 2017 was equivalent to an annual effective rate of 0.24% of the fund’s average daily net assets.
Distributor – The Board of Trustees has adopted a distribution plan for certain share classes pursuant to Rule 12b-1 of the Investment Company Act of 1940.
The fund’s distribution plan provides that the fund will pay MFD for services provided by MFD and financial intermediaries in connection with the distribution and servicing of
22
Notes to Financial Statements – continued
certain share classes. One component of the plan is a distribution fee paid to MFD and another component of the plan is a service fee paid to MFD. MFD may subsequently pay all, or a portion, of the distribution and/or service fees to financial intermediaries.
Distribution Plan Fee Table:
| | | | | | | | | | | | | | | | | | | | |
| | | Distribution
Fee Rate (d) | | | Service
Fee Rate (d) | | | Total
Distribution
Plan (d) | | | Annual
Effective
Rate (e) | | | Distribution
and Service
Fee | |
| Class A | | | — | | | | 0.25% | | | | 0.25% | | | | 0.00% | | | | $298,527 | |
| Class B | | | 0.75% | | | | 0.25% | | | | 1.00% | | | | 0.00% | | | | 208,026 | |
| Class C | | | 0.75% | | | | 0.25% | | | | 1.00% | | | | 0.00% | | | | 449,828 | |
| Class R1 | | | 0.75% | | | | 0.25% | | | | 1.00% | | | | 0.00% | | | | 121,231 | |
| Class R2 | | | 0.25% | | | | 0.25% | | | | 0.50% | | | | 0.00% | | | | 253,804 | |
| Class R3 | | | — | | | | 0.25% | | | | 0.25% | | | | 0.00% | | | | 88,212 | |
| Class 529A | | | — | | | | 0.25% | | | | 0.25% | | | | 0.00% | | | | 33,119 | |
| Class 529B | | | 0.75% | | | | 0.25% | | | | 1.00% | | | | 0.00% | | | | 3,747 | |
| Class 529C | | | 0.75% | | | | 0.25% | | | | 1.00% | | | | 0.00% | | | | 71,382 | |
| Total Distribution and Service Fees | | | | $1,527,876 | |
| (d) | In accordance with the distribution plan for certain classes, the fund pays distribution and/or service fees equal to these annual percentage rates of each class’s average daily net assets. The distribution and service fee rates disclosed by class represent the current rates in effect at the end of the reporting period. Any rate changes, if applicable, are detailed below. |
| (e) | The annual effective rates represent actual fees incurred under the distribution plan for the year ended August 31, 2017 based on each class’s average daily net assets. MFD has agreed in writing to waive the Class A and Class 529A service fee. This written agreement will continue until modified by the fund’s Board of Trustees, but such agreement will continue until at least December 31, 2017. These reductions, for the year ended August 31, 2017, for Class A and Class 529A amounted to $298,527 and $33,119, respectively, and are included in the reduction of total expenses in the Statement of Operations. For the period from September 1, 2016 through April 9, 2017, MFD also voluntarily waived receipt of the fund’s distribution and service fees to ensure the fund avoids a negative yield. These reductions, for the year ended August 31, 2017, for Class B, Class C, Class R1, Class R2, Class R3, Class 529B, and Class 529C amounted to $133,297, $290,679, $76,718, $156,232, $54,366, $2,296, and $42,278, respectively, and are included in the reduction of total expenses in the Statement of Operations. Effective April 10, 2017, MFD discontinued this voluntary waiver to avoid a negative yield and instead agreed in writing to waive the Class B, Class C, Class R1, Class R2, Class R3, Class 529B, and Class 529C distribution and service fees. This written agreement will continue until modified by the fund’s Board of Trustees, but such agreement will continue until at least December 31, 2017. These reductions, for the period April 10, 2017 through August 31, 2017, for Class B, Class C, Class R1, Class R2, Class R3, Class 529B, and Class 529C amounted to $74,729, $159,149, $44,513, $97,572, $33,846, $1,451, and $29,104, respectively, and are included in the reduction of total expenses in the Statement of Operations. |
Certain Class A shares acquired through an exchange may be subject to a contingent deferred sales charge (CDSC) upon redemption depending on when the shares exchanged were originally purchased. Class C and Class 529C shares are subject to a CDSC in the event of a shareholder redemption within 12 months of purchase. Class B and Class 529B shares are subject to a CDSC in the event of a shareholder redemption
23
Notes to Financial Statements – continued
within six years of purchase. All contingent deferred sales charges are paid to MFD and during the year ended August 31, 2017, were as follows:
| | | | |
| | | Amount | |
| Class A | | | $138 | |
| Class B | | | 54,013 | |
| Class C | | | 15,517 | |
| Class 529B | | | 189 | |
| Class 529C | | | 570 | |
The fund has entered into and may from time to time enter into contracts with program managers and other parties which administer the tuition programs through which an investment in the fund’s 529 share classes is made. The fund has entered into an agreement with MFD pursuant to which MFD receives an annual fee of up to 0.10% of the average daily net assets attributable to each 529 share class. MFD has agreed to waive a portion of this fee in an amount equal to 0.05% of the average daily net assets for each 529 share class. This waiver agreement will expire on December 31, 2018, unless MFD elects to extend the waiver. For the year ended August 31, 2017, this waiver amounted to $10,381, and is included in the reduction of total expenses in the Statement of Operations. In addition, MFS voluntarily waived receipt of $6,402 of the fund’s program manager fees in order to avoid a negative yield for Class 529A, Class 529B, and Class 529C shares. This amount, for the year ended August 31, 2017, is included in the reduction of total expenses in the Statement of Operations. This voluntary waiver had the effect of reducing the program manager fee by 0.03% of average daily net assets attributable to Class 529A, Class 529B, and Class 529C shares on an annualized basis. The program manager fee incurred for the year ended August 31, 2017 was equivalent to an annual effective rate of 0.02% of the average daily net assets attributable to each 529 share class. The services provided by MFD, or a third party with which MFD contracts, include recordkeeping and tax reporting and account services, as well as services designed to maintain the program’s compliance with the Internal Revenue Code and other regulatory requirements. Program manager fees and waivers for the year ended August 31, 2017, were as follows:
| | | | | | | | |
| | | Fee | | | Waiver | |
| Class 529A | | | $13,248 | | | | $10,712 | |
| Class 529B | | | 375 | | | | 307 | |
| Class 529C | | | 7,139 | | | | 5,764 | |
| Total Program Manager Fees and Waivers | | | $20,762 | | | | $16,783 | |
Shareholder Servicing Agent – MFS Service Center, Inc. (MFSC), a wholly-owned subsidiary of MFS, receives a fee from the fund for its services as shareholder servicing agent calculated as a percentage of the average daily net assets of the fund as determined periodically under the supervision of the fund’s Board of Trustees. For the year ended August 31, 2017, the fee was $171,153, which equated to 0.0557% annually of the fund’s average daily net assets. MFSC also receives payment from the fund for out-of-pocket expenses, sub-accounting and other shareholder servicing costs which may be paid to affiliated and unaffiliated service providers. For the year ended August 31, 2017, these out-of-pocket expenses, sub-accounting and other shareholder servicing costs amounted to $345,299.
24
Notes to Financial Statements – continued
Administrator – MFS provides certain financial, legal, shareholder communications, compliance, and other administrative services to the fund. Under an administrative services agreement, the fund reimburses MFS the costs incurred to provide these services. The fund is charged an annual fixed amount of $17,500 plus a fee based on average daily net assets. The administrative services fee incurred for the year ended August 31, 2017 was equivalent to an annual effective rate of 0.0189% of the fund’s average daily net assets.
Trustees’ and Officers’ Compensation – The fund pays compensation to independent Trustees in the form of a retainer, attendance fees, and additional compensation to Board and Committee chairpersons. The fund does not pay compensation directly to Trustees or officers of the fund who are also officers of the investment adviser, all of whom receive remuneration for their services to the fund from MFS. Certain officers and Trustees of the fund are officers or directors of MFS, MFD, and MFSC.
Prior to December 31, 2001, the fund had an unfunded defined benefit plan (“DB plan”) for independent Trustees. As of December 31, 2001, the Board took action to terminate the DB plan with respect to then-current and any future independent Trustees, such that the DB plan covers only certain of those former independent Trustees who retired on or before December 31, 2001. The DB plan resulted in a pension expense of $1,335 and is included in “Independent Trustees’ compensation” in the Statement of Operations for the year ended August 31, 2017. The liability for deferred retirement benefits payable to certain independent Trustees under the DB plan amounted to $6,513 at August 31, 2017, and is included in “Payable for independent Trustees’ compensation” in the Statement of Assets and Liabilities.
Other – This fund and certain other funds managed by MFS (the funds) have entered into a service agreement (the ISO Agreement) which provides for payment of fees solely by the funds to Tarantino LLC in return for the provision of services of an Independent Senior Officer (ISO) for the funds. Frank L. Tarantino serves as the ISO and is an officer of the funds and the sole member of Tarantino LLC. The funds can terminate the ISO Agreement with Tarantino LLC at any time under the terms of the ISO Agreement. For the year ended August 31, 2017, the fee paid by the fund under this agreement was $577 and is included in “Miscellaneous” expense in the Statement of Operations. MFS has agreed to bear all expenses associated with office space, other administrative support, and supplies provided to the ISO.
On September 9, 2015, MFS redeemed 48, 125, 134, 40 and 18 shares each, of Class B, Class R3, Class R4, Class 529A and Class 529C respectively for the aggregate amount of $365. At August 31, 2017, MFS held approximately 80% of the outstanding shares of Class R4.
25
Notes to Financial Statements – continued
(4) Shares of Beneficial Interest
The fund’s Declaration of Trust permits the Trustees to issue an unlimited number of full and fractional shares of beneficial interest. Transactions in fund shares were as follows:
| | | | | | | | | | | | | | | | |
| | | Year ended
8/31/17 | | | Year ended
8/31/16 | |
| | | Shares | | | Amount | | | Shares | | | Amount | |
| Shares sold | | | | | | | | | | | | | | | | |
Class A | | | 52,201,068 | | | | $52,201,070 | | | | 61,984,342 | | | | $61,984,346 | |
Class B | | | 13,010,177 | | | | 13,010,176 | | | | 15,009,346 | | | | 15,009,346 | |
Class C | | | 26,105,909 | | | | 26,105,907 | | | | 45,857,815 | | | | 45,857,814 | |
Class R1 | | | 3,907,819 | | | | 3,907,819 | | | | 5,028,966 | | | | 5,028,966 | |
Class R2 | | | 13,316,853 | | | | 13,316,880 | | | | 16,235,866 | | | | 16,235,866 | |
Class R3 | | | 14,110,795 | | | | 14,110,795 | | | | 15,034,388 | | | | 15,034,388 | |
Class R4 | | | 519,206 | | | | 519,208 | | | | 253,380 | | | | 253,379 | |
Class 529A | | | 6,937,795 | | | | 6,937,795 | | | | 7,049,714 | | | | 7,049,715 | |
Class 529B | | | 184,277 | | | | 184,277 | | | | 269,487 | | | | 269,487 | |
Class 529C | | | 4,065,880 | | | | 4,065,880 | | | | 4,478,950 | | | | 4,478,949 | |
| | | 134,359,779 | | | | $134,359,807 | | | | 171,202,254 | | | | $171,202,256 | |
|
Shares issued to shareholders in
reinvestment of distributions | |
Class A | | | 86,846 | | | | $86,846 | | | | — | | | | $— | |
Class B | | | 13,834 | | | | 13,834 | | | | — | | | | — | |
Class C | | | 30,644 | | | | 30,644 | | | | — | | | | — | |
Class R1 | | | 8,848 | | | | 8,848 | | | | — | | | | — | |
Class R2 | | | 39,453 | | | | 39,425 | | | | — | | | | — | |
Class R3 | | | 27,726 | | | | 27,726 | | | | — | | | | — | |
Class R4 | | | 2,602 | | | | 2,601 | | | | — | | | | — | |
Class 529A | | | 8,300 | | | | 8,300 | | | | — | | | | — | |
Class 529B | | | 212 | | | | 212 | | | | — | | | | — | |
Class 529C | | | 4,316 | | | | 4,316 | | | | — | | | | — | |
| | | 222,781 | | | | $222,752 | | | | — | | | | $— | |
| | | | |
| Shares reacquired | | | | | | | | | | | | | | | | |
Class A | | | (67,169,924 | ) | | | $(67,169,924 | ) | | | (63,330,188 | ) | | | $(63,330,188 | ) |
Class B | | | (13,780,498 | ) | | | (13,780,501 | ) | | | (15,744,830 | ) | | | (15,744,833 | ) |
Class C | | | (36,431,544 | ) | | | (36,431,544 | ) | | | (39,626,535 | ) | | | (39,626,535 | ) |
Class R1 | | | (6,250,419 | ) | | | (6,250,419 | ) | | | (4,822,357 | ) | | | (4,822,357 | ) |
Class R2 | | | (16,707,622 | ) | | | (16,707,622 | ) | | | (17,757,982 | ) | | | (17,757,982 | ) |
Class R3 | | | (16,590,937 | ) | | | (16,590,937 | ) | | | (22,261,502 | ) | | | (22,261,502 | ) |
Class R4 | | | (349,153 | ) | | | (349,153 | ) | | | (209,426 | ) | | | (209,426 | ) |
Class 529A | | | (6,577,379 | ) | | | (6,577,379 | ) | | | (5,591,127 | ) | | | (5,591,127 | ) |
Class 529B | | | (192,320 | ) | | | (192,320 | ) | | | (353,733 | ) | | | (353,733 | ) |
Class 529C | | | (3,840,984 | ) | | | (3,840,984 | ) | | | (3,616,248 | ) | | | (3,616,248 | ) |
| | | (167,890,780 | ) | | | $(167,890,783 | ) | | | (173,313,928 | ) | | | $(173,313,931 | ) |
26
Notes to Financial Statements – continued
| | | | | | | | | | | | | | | | |
| | | Year ended
8/31/17 | | | Year ended
8/31/16 | |
| | | Shares | | | Amount | | | Shares | | | Amount | |
| Net change | | | | | | | | | | | | | | | | |
Class A | | | (14,882,010 | ) | | | $(14,882,008 | ) | | | (1,345,846 | ) | | | $(1,345,842 | ) |
Class B | | | (756,487 | ) | | | (756,491 | ) | | | (735,484 | ) | | | (735,487 | ) |
Class C | | | (10,294,991 | ) | | | (10,294,993 | ) | | | 6,231,280 | | | | 6,231,279 | |
Class R1 | | | (2,333,752 | ) | | | (2,333,752 | ) | | | 206,609 | | | | 206,609 | |
Class R2 | | | (3,351,316 | ) | | | (3,351,317 | ) | | | (1,522,116 | ) | | | (1,522,116 | ) |
Class R3 | | | (2,452,416 | ) | | | (2,452,416 | ) | | | (7,227,114 | ) | | | (7,227,114 | ) |
Class R4 | | | 172,655 | | | | 172,656 | | | | 43,954 | | | | 43,953 | |
Class 529A | | | 368,716 | | | | 368,716 | | | | 1,458,587 | | | | 1,458,588 | |
Class 529B | | | (7,831 | ) | | | (7,831 | ) | | | (84,246 | ) | | | (84,246 | ) |
Class 529C | | | 229,212 | | | | 229,212 | | | | 862,702 | | | | 862,701 | |
| | | (33,308,220 | ) | | | $(33,308,224 | ) | | | (2,111,674 | ) | | | $(2,111,675 | ) |
(5) Line of Credit
The fund and certain other funds managed by MFS participate in a $1.25 billion unsecured committed line of credit, subject to a $1 billion sublimit, provided by a syndication of banks under a credit agreement. Borrowings may be made for temporary financing needs. Interest is charged to each fund, based on its borrowings, generally at a rate equal to the higher of the Overnight Federal Reserve funds rate or daily one month LIBOR plus an agreed upon spread. A commitment fee, based on the average daily, unused portion of the committed line of credit, is allocated among the participating funds at the end of each calendar quarter. In addition, the fund and other funds managed by MFS have established unsecured uncommitted borrowing arrangements with certain banks for temporary financing needs. Interest is charged to each fund, based on its borrowings, at a rate equal to the Overnight Federal Reserve funds rate plus an agreed upon spread. For the year ended August 31, 2017, the fund’s commitment fee and interest expense were $2,248 and $0, respectively, and are included in “Miscellaneous” expense in the Statement of Operations.
27
REPORT OF INDEPENDENT REGISTERED PUBLIC ACCOUNTING FIRM
To the Board of Trustees of MFS Series Trust I and the Shareholders of MFS U.S. Government Cash Reserve Fund:
We have audited the accompanying statement of assets and liabilities, including the portfolio of investments, of MFS U.S. Government Cash Reserve Fund (one of the series of MFS Series Trust I) (the “Fund”) as of August 31, 2017, and the related statement of operations for the year then ended, the statements of changes in net assets for each of the two years in the period then ended, and the financial highlights for each of the five years in the period then ended. These financial statements and financial highlights are the responsibility of the Fund’s management. Our responsibility is to express an opinion on these financial statements and financial highlights based on our audits.
We conducted our audits in accordance with the standards of the Public Company Accounting Oversight Board (United States). Those standards require that we plan and perform the audit to obtain reasonable assurance about whether the financial statements and financial highlights are free of material misstatement. The Fund is not required to have, nor were we engaged to perform, an audit of its internal control over financial reporting. Our audits included consideration of internal control over financial reporting as a basis for designing audit procedures that are appropriate in the circumstances, but not for the purpose of expressing an opinion on the effectiveness of the Fund’s internal control over financial reporting. Accordingly, we express no such opinion. An audit also includes examining, on a test basis, evidence supporting the amounts and disclosures in the financial statements, assessing the accounting principles used and significant estimates made by management, as well as evaluating the overall financial statement presentation. Our procedures included confirmation of securities owned as of August 31, 2017, by correspondence with the custodian. We believe that our audits provide a reasonable basis for our opinion.
In our opinion, such financial statements and financial highlights referred to above present fairly, in all material respects, the financial position of MFS U.S. Government Cash Reserve Fund as of August 31, 2017, the results of its operations for the year then ended, the changes in its net assets for each of the two years in the period then ended, and the financial highlights for each of the five years in the period then ended, in conformity with accounting principles generally accepted in the United States of America.
DELOITTE & TOUCHE LLP
Boston, Massachusetts
October 17, 2017
28
RESULTS OF SHAREHOLDER MEETING
(unaudited)
At a special meeting of shareholders of MFS Series Trust I, which was held on March 23, 2017, the following action was taken:
Item 1: To elect the following individuals as Trustees:
| | | | | | | | |
| | | Number of Dollars | |
Nominee | | For | | | Withheld Authority | |
| Steven E. Buller | | | 40,448,016,134.453 | | | | 372,137,248.376 | |
| John A. Caroselli | | | 40,455,058,441.389 | | | | 365,094,941.560 | |
| Maureen R. Goldfarb | | | 40,458,621,672.449 | | | | 361,531,746.940 | |
| David H. Gunning | | | 40,369,558,961.219 | | | | 450,594,312.051 | |
| Michael Hegarty | | | 40,379,783,468.714 | | | | 440,369,950.676 | |
| John P. Kavanaugh | | | 40,453,732,784.104 | | | | 366,420,708.405 | |
| Robert J. Manning | | | 40,424,010,964.586 | | | | 396,142,308.684 | |
| Clarence Otis, Jr. | | | 40,441,919,324.712 | | | | 378,234,043.007 | |
| Maryanne L. Roepke | | | 40,471,040,575.143 | | | | 349,112,917.026 | |
| Robin A. Stelmach | | | 40,459,908,730.475 | | | | 360,244,615.574 | |
| Laurie J. Thomsen | | | 40,426,270,790.416 | | | | 393,882,628.973 | |
29
TRUSTEES AND OFFICERS — IDENTIFICATION AND BACKGROUND
The Trustees and Officers of the Trust, as of October 1, 2017, are listed below, together with their principal occupations during the past five years. (Their titles may have varied during that period.) The address of each Trustee and Officer is 111 Huntington Avenue, Boston, Massachusetts 02199-7618.
| | | | | | | | | | |
Name, Age | | Position(s)
Held with Fund | | Trustee/Officer Since (h) | | Number of
MFS Funds
overseen
by the
Trustee | | Principal
Occupations During the Past Five Years | | Other Directorships
During the Past
Five Years (j) |
| INTERESTED TRUSTEES |
Robert J. Manning (k)
(age 53) | | Trustee | | February 2004 | | 136 | | Massachusetts Financial Services Company, Executive Chairman (since January 2017); Director; Chairman of the Board; Chief Executive Officer (until 2015); Co-Chief Executive Officer (2015-2016) | | N/A |
Robin A. Stelmach (k) (age 56) | | Trustee | | January 2014 | | 136 | | Massachusetts Financial Services Company, Vice Chair (since January 2017); Chief Operating Officer and Executive Vice President (until January 2017) | | N/A |
| INDEPENDENT TRUSTEES |
David H. Gunning
(age 75) | | Trustee and Chair of Trustees | | January 2004 | | 136 | | Private investor | | Lincoln Electric Holdings, Inc., Director; Development Alternatives, Inc., Director/Non-Executive Chairman (until 2013) |
30
Trustees and Officers – continued
| | | | | | | | | | |
Name, Age | | Position(s)
Held with Fund | | Trustee/Officer Since (h) | | Number of
MFS Funds
overseen
by the
Trustee | | Principal
Occupations During the Past Five Years | | Other Directorships
During the Past
Five Years (j) |
Steven E. Buller
(age 66) | | Trustee | | February 2014 | | 136 | | Financial Accounting Standards Advisory Council, Chairman (2014-2015); Public Company Accounting Oversight Board, Standing Advisory Group, Member (until 2014); BlackRock, Inc. (investment management), Managing Director (until 2014), BlackRock Finco UK (investment management), Director (until 2014) | | N/A |
John A. Caroselli
(age 63) | | Trustee | | March 2017 | | 136 | | JC Global Advisors, LLC (management consulting), President (since 2015); First Capital Corporation (commercial finance), Executive Vice President (until 2015) | | N/A |
Maureen R. Goldfarb
(age 62) | | Trustee | | January 2009 | | 136 | | Private investor | | N/A |
Michael Hegarty
(age 72) | | Trustee | | December 2004 | | 136 | | Private investor | | Rouse Properties Inc., Director (until 2016); Capmark Financial Group Inc., Director (until 2015) |
John P. Kavanaugh
(age 62) | | Trustee and Vice Chair of Trustees | | January 2009 | | 136 | | Private investor | | N/A |
Clarence Otis, Jr.
(age 61) | | Trustee | | March 2017 | | 136 | | Darden Restaurants, Inc., Chief Executive Officer (until 2014) | | VF Corporation, Director; Verizon Communications, Inc., Director; The Travelers Companies, Director; Federal Reserve Bank of Atlanta, Director (until 2015) |
31
Trustees and Officers – continued
| | | | | | | | | | |
Name, Age | | Position(s)
Held with Fund | | Trustee/Officer Since (h) | | Number of
MFS Funds
overseen
by the
Trustee | | Principal
Occupations During the Past Five Years | | Other Directorships
During the Past
Five Years (j) |
Maryanne L. Roepke
(age 61) | | Trustee | | May 2014 | | 136 | | American Century Investments (investment management), Senior Vice President and Chief Compliance Officer (until 2014) | | N/A |
Laurie J. Thomsen
(age 60) | | Trustee | | March 2005 | | 136 | | Private investor | | The Travelers Companies, Director; Dycom Industries, Inc., Director (since 2015) |
| | | | | | | | |
Name, Age | | Position(s) Held with Fund | | Trustee/Officer
Since (h) | | Number of
MFS Funds
for which
the Person
is an Officer | | Principal
Occupations During the Past Five Years |
| OFFICERS | | | | | | | | |
Christopher R. Bohane (k)
(age 43) | | Assistant Secretary and Assistant Clerk | | July 2005 | | 136 | | Massachusetts Financial Services Company, Vice President and Assistant General Counsel |
Kino Clark (k)
(age 49) | | Assistant Treasurer | | January 2012 | | 136 | | Massachusetts Financial Services Company, Vice President |
John W. Clark, Jr. (k)
(age 50) | | Assistant Treasurer | | April 2017 | | 136 | | Massachusetts Financial Services Company, Vice President (since March 2017); Deutsche Bank (financial services), Department Head – Treasurer’s Office (until February 2017) |
Thomas H. Connors (k)
(age 58) | | Assistant Secretary and Assistant Clerk | | September 2012 | | 136 | | Massachusetts Financial Services Company, Vice President and Senior Counsel; Deutsche Investment Management Americas Inc. (financial service provider), Director and Senior Counsel (until 2012) |
32
Trustees and Officers – continued
| | | | | | | | |
Name, Age | | Position(s) Held with Fund | | Trustee/Officer
Since (h) | | Number of
MFS Funds
for which
the Person
is an Officer | | Principal
Occupations During the Past Five Years |
Ethan D. Corey (k)
(age 53) | | Assistant Secretary and Assistant Clerk | | July 2005 | | 136 | | Massachusetts Financial Services Company, Senior Vice President and Associate General Counsel |
David L. DiLorenzo (k)
(age 49) | | President | | July 2005 | | 136 | | Massachusetts Financial Services Company, Senior Vice President |
Heidi W. Hardin (k)
(age 50) | | Secretary and Clerk | | April 2017 | | 136 | | Massachusetts Financial Services Company, Executive Vice President and General Counsel (since March 2017); Harris Associates (investment management), General Counsel (from September 2015 to January 2017); Janus Capital Management LLC (investment management), Senior Vice President and General Counsel (until September 2015) |
Brian E. Langenfeld (k) (age 44) | | Assistant Secretary and Assistant Clerk | | June 2006 | | 136 | | Massachusetts Financial Services Company, Vice President and Senior Counsel |
Susan A. Pereira (k)
(age 46) | | Assistant Secretary and Assistant Clerk | | July 2005 | | 136 | | Massachusetts Financial Services Company, Vice President and Senior Counsel |
Kasey L. Phillips (k)
(age 46) | | Assistant Treasurer | | September 2012 | | 136 | | Massachusetts Financial Services Company, Vice President; Wells Fargo Funds Management, LLC, Senior Vice President, Fund Treasurer (until 2012) |
Matthew A. Stowe (k)
(age 42) | | Assistant Secretary and Assistant Clerk | | October 2014 | | 136 | | Massachusetts Financial Services Company, Vice President and Assistant General Counsel |
Frank L. Tarantino
(age 73) | | Independent Senior Officer | | June 2004 | | 136 | | Tarantino LLC (provider of compliance services), Principal |
Richard S. Weitzel (k)
(age 47) | | Assistant Secretary and Assistant Clerk | | October 2007 | | 136 | | Massachusetts Financial Services Company, Senior Vice President and Associate General Counsel |
33
Trustees and Officers – continued
| | | | | | | | |
Name, Age | | Position(s) Held with Fund | | Trustee/Officer
Since (h) | | Number of
MFS Funds
for which
the Person
is an Officer | | Principal
Occupations During the Past Five Years |
Martin J. Wolin (k)
(age 50) | | Chief Compliance Officer | | July 2015 | | 136 | | Massachusetts Financial Services Company, Senior Vice President and Chief Compliance Officer (since July 2015); Mercer (financial service provider), Chief Risk and Compliance Officer, North America and Latin America (until June 2015) |
James O. Yost (k)
(age 57) | | Treasurer | | September 1990 | | 136 | | Massachusetts Financial Services Company, Senior Vice President |
| (h) | Date first appointed to serve as Trustee/officer of an MFS Fund. Each Trustee has served continuously since appointment unless indicated otherwise. For the period from December 15, 2004 until February 22, 2005, Mr. Manning served as Advisory Trustee. Prior to January 2012, Messrs. DiLorenzo and Yost served as Assistant Treasurers of the Funds. From January 2012 through December 2016, Messrs. DiLorenzo and Yost served as Treasurer and Deputy Treasurer of the Funds, respectively. |
| (j) | Directorships or trusteeships of companies required to report to the Securities and Exchange Commission (i.e., “public companies”). |
| (k) | “Interested person” of the Trust within the meaning of the Investment Company Act of 1940 (referred to as the 1940 Act), which is the principal federal law governing investment companies like the fund, as a result of a position with MFS. The address of MFS is 111 Huntington Avenue, Boston, Massachusetts 02199-7618. |
Each Trustee has been elected by shareholders and each Trustee and officer holds office until his or her successor is chosen and qualified or until his or her earlier death, resignation, retirement or removal. The Trust does not hold annual meetings for the purpose of electing Trustees, and Trustees are not elected for fixed terms. Under the terms of the Board’s retirement policy, an Independent Trustee shall retire at the end of the calendar year in which he or she reaches the earlier of 75 years of age or 15 years of service on the Board (or, in the case of any Independent Trustee who joined the Board prior to 2015, 20 years of service on the Board).
Messrs. Buller, Kavanaugh and Otis and Ms. Roepke are members of the Trust’s Audit Committee.
Each of the Interested Trustees and certain Officers hold comparable officer positions with certain affiliates of MFS.
34
Trustees and Officers – continued
The Statement of Additional Information for a Fund includes further information about the Trustees and is available without charge upon request by calling 1-800-225-2606.
| | |
| Investment Adviser | | Custodian |
Massachusetts Financial Services Company
111 Huntington Avenue
Boston, MA 02199-7618 | | State Street Bank and Trust Company 1 Lincoln Street Boston, MA 02111-2900 |
| Distributor | | Independent Registered Public Accounting Firm |
MFS Fund Distributors, Inc.
111 Huntington Avenue
Boston, MA 02199-7618 | | Deloitte & Touche LLP 200 Berkeley Street Boston, MA 02116 |
| Portfolio Manager(s) | | |
| Edward O’Dette | | |
35
BOARD REVIEW OF INVESTMENT ADVISORY AGREEMENT
The Investment Company Act of 1940 requires that both the full Board of Trustees and a majority of the non-interested (“independent”) Trustees, voting separately, annually approve the continuation of the Fund’s investment advisory agreement with MFS. The Trustees consider matters bearing on the Fund and its advisory arrangements at their meetings throughout the year, including a review of performance data at each regular meeting. In addition, the independent Trustees met several times over the course of three months beginning in May and ending in July, 2017 (“contract review meetings”) for the specific purpose of considering whether to approve the continuation of the investment advisory agreement for the Fund and the other investment companies that the Board oversees (the “MFS Funds”). The independent Trustees were assisted in their evaluation of the Fund’s investment advisory agreement by independent legal counsel, from whom they received separate legal advice and with whom they met separately from MFS during various contract review meetings. The independent Trustees were also assisted in this process by the MFS Funds’ Independent Senior Officer, a senior officer appointed by and reporting to the independent Trustees.
In connection with their deliberations regarding the continuation of the investment advisory agreement, the Trustees, including the independent Trustees, considered such information and factors as they believed, in light of the legal advice furnished to them and their own business judgment, to be relevant. The investment advisory agreement for the Fund was considered separately, although the Trustees also took into account the common interests of all MFS Funds in their review. As described below, the Trustees considered the nature, quality, and extent of the various investment advisory, administrative, and shareholder services performed by MFS under the existing investment advisory agreement and other arrangements with the Fund.
In connection with their contract review meetings, the Trustees received and relied upon materials that included, among other items: (i) information provided by Broadridge Financial Solutions, Inc. (“Broadridge”), an independent third party, on the investment performance of the Fund for various time periods ended December 31, 2016 and the investment performance of a group of funds with substantially similar investment classifications/objectives (the “Lipper performance universe”), (ii) information provided by Broadridge on the Fund’s advisory fees and other expenses and the advisory fees and other expenses of comparable funds identified by Broadridge (the “Broadridge expense group”), (iii) information provided by MFS on the advisory fees of portfolios of other clients of MFS, including institutional separate accounts and other clients, (iv) information as to whether and to what extent applicable expense waivers, reimbursements or fee “breakpoints” are observed for the Fund, (v) information regarding MFS’ financial results and financial condition, including MFS’ and certain of its affiliates’ estimated profitability from services performed for the Fund and the MFS Funds as a whole, and compared to MFS’ institutional business, (vi) MFS’ views regarding the outlook for the mutual fund industry and the strategic business plans of MFS, (vii) descriptions of various functions performed by MFS for the Funds, such as compliance monitoring and portfolio trading practices, and (viii) information regarding the overall organization of MFS, including information about MFS’ senior management and other personnel providing investment advisory,
36
Board Review of Investment Advisory Agreement – continued
administrative and other services to the Fund and the other MFS Funds. The comparative performance, fee and expense information prepared and provided by Broadridge. was not independently verified and the independent Trustees did not independently verify any information provided to them by MFS.
The Trustees’ conclusion as to the continuation of the investment advisory agreement was based on a comprehensive consideration of all information provided to the Trustees and not the result of any single factor. Some of the factors that figured particularly in the Trustees’ deliberations are described below, although individual Trustees may have evaluated the information presented differently from one another, giving different weights to various factors. It is also important to recognize that the fee arrangements for the Fund and other MFS Funds are the result of years of review and discussion between the independent Trustees and MFS, that certain aspects of such arrangements may receive greater scrutiny in some years than in others, and that the Trustees’ conclusions may be based, in part, on their consideration of these same arrangements during the course of the year and in prior years.
Based on information provided by Broadridge and MFS, the Trustees reviewed the Fund’s total return investment performance as well as the performance of peer groups of funds over various time periods. The Trustees placed particular emphasis on the total return performance of the Fund’s Class A shares in comparison to the performance of funds in its Lipper performance universe over the three-year period ended December 31, 2016, which the Trustees believed was a long enough period to reflect differing market conditions. The total return performance of the Fund’s Class A shares was in the 4th quintile relative to the other funds in the universe for this three-year period (the 1st quintile being the best performers and the 5th quintile being the worst performers). The total return performance of the Fund’s Class A shares was in the 2nd quintile for the one-year period and the 4th quintile for the five-year period ended December 31, 2016 relative to the Lipper performance universe. Because of the passage of time, these performance results may differ from the performance results for more recent periods, including those shown elsewhere in this report.
In the course of their deliberations, the Trustees took into account information provided by MFS in connection with the contract review meetings, as well as during investment review meetings conducted with portfolio management personnel during the course of the year regarding the Fund’s performance. In addition, the Trustees noted the market conditions affecting all money market funds, in particular the low interest rate environment, and MFS’ voluntary waiver of all or a portion of its fees to ensure that the Fund avoids a negative yield. After reviewing these and related factors, the Trustees concluded, within the context of their overall conclusions regarding the investment advisory agreement, that they were satisfied with MFS’ responses and efforts relating to investment performance.
In assessing the reasonableness of the Fund’s advisory fee, the Trustees considered, among other information, the Fund’s advisory fee and the total expense ratio of the Fund’s Class A shares as a percentage of average daily net assets and the advisory fee and total expense ratios of peer groups of funds based on information provided by Broadridge. The Trustees considered that MFS Fund Distributors, Inc. (“MFD”), an affiliate of MFS, currently observes a Class A 12b-1 fee waiver, which may not be
37
Board Review of Investment Advisory Agreement – continued
changed without the Trustees’ approval. The Trustees also considered that, according to the data provided by Broadridge (which takes into account any fee reductions or expense limitations that were in effect during the Fund’s last fiscal year), the Fund’s effective advisory fee rate and total expense ratio were each approximately at the Broadridge expense group median.
The Trustees also considered the advisory fees charged by MFS to any institutional separate accounts advised by MFS (“separate accounts”) and unaffiliated investment companies for which MFS serves as subadviser (“subadvised funds”) that have comparable investment strategies to the Fund, if any. In comparing these fees, the Trustees considered information provided by MFS as to the generally broader scope of services provided by MFS to the Fund, as well as the more extensive regulatory burdens imposed on MFS in managing the Fund, in comparison to separate accounts and subadvised funds. The Trustees also considered the higher demands placed on MFS’ investment personnel and trading infrastructure as a result of the daily cash in-flows and out-flows of the Fund in comparison to separate accounts.
The Trustees also considered whether the Fund may benefit from any economies of scale in the management of the Fund in the event of growth in assets of the Fund and/or growth in assets of the MFS Funds as a whole. They noted that the Fund’s advisory fee rate schedule is not subject to any breakpoints. Taking into account that the Fund’s effective advisory fee rate was approximately at the Broadridge expense group median described above, the Trustees determined not to recommend any advisory fee breakpoints for the Fund at this time. The Trustees also noted that MFS has agreed in writing to waive a portion of the management fees of certain MFS Funds, including the Fund, if the total combined assets of certain funds within the MFS Funds’ complex increase above agreed upon thresholds (the “group fee waiver”), enabling the Fund’s shareholders to share in the benefits from any economies of scale at the complex level. The group fee waiver is reviewed and renewed annually between the Board and MFS. The Trustees concluded that the group fee waiver was sufficient to allow the Fund to benefit from economies of scale as its assets and overall complex assets grow.
The Trustees also considered information prepared by MFS relating to MFS’ costs and profits with respect to the Fund, the MFS Funds considered as a group, and other investment companies and accounts advised by MFS, as well as MFS’ methodologies used to determine and allocate its costs to the MFS Funds, the Fund and other accounts and products for purposes of estimating profitability.
After reviewing these and other factors described herein, the Trustees concluded, within the context of their overall conclusions regarding the investment advisory agreement, that the advisory fees charged to the Fund represent reasonable compensation in light of the services being provided by MFS to the Fund.
In addition, the Trustees considered MFS’ resources and related efforts to continue to retain, attract and motivate capable personnel to serve the Fund. The Trustees also considered current and developing conditions in the financial services industry, including the presence of large and well-capitalized companies which are spending, and appear to be prepared to continue to spend, substantial sums to engage personnel and to provide services to competing investment companies. In this regard, the
38
Board Review of Investment Advisory Agreement – continued
Trustees also considered the financial resources of MFS and its ultimate parent, Sun Life Financial Inc. The Trustees also considered the advantages and possible disadvantages to the Fund of having an adviser that also serves other investment companies as well as other accounts.
The Trustees also considered the nature, quality, cost, and extent of administrative, transfer agency, and distribution services provided to the Fund by MFS and its affiliates under agreements and plans other than the investment advisory agreement, including any 12b-1 fees the Fund pays to MFD. The Trustees also considered the nature, extent and quality of certain other services MFS performs or arranges for on the Fund’s behalf, which may include securities lending programs, directed expense payment programs, class action recovery programs, and MFS’ interaction with third-party service providers, principally custodians and sub-custodians. The Trustees concluded that the various non-advisory services provided by MFS and its affiliates on behalf of the Fund were satisfactory.
The Trustees also considered benefits to MFS from the use of the Fund’s portfolio brokerage commissions, if applicable, to pay for investment research and various other factors. Additionally, the Trustees considered so-called “fall-out benefits” to MFS such as reputational value derived from serving as investment manager to the Fund.
Based on their evaluation of factors that they deemed to be material, including those factors described above, the Board of Trustees, including the independent Trustees, concluded that the Fund’s investment advisory agreement with MFS should be continued for an additional one-year period, commencing August 1, 2017.
39
PROXY VOTING POLICIES AND INFORMATION
MFS votes proxies on behalf of the fund pursuant to proxy voting policies and procedures that are available without charge, upon request, by calling 1-800-225-2606, by visiting mfs.com (once you have selected “Individual Investor” as your role, click on “Individual Investor Home” in the top navigation and then select “Learn More About Proxy Voting” under the “I want to…” header on the left hand column of the page), or by visiting the SEC’s Web site at http://www.sec.gov
Information regarding how the fund voted proxies relating to portfolio securities during the most recent twelve-month period ended June 30 is available by August 31 of each year without charge by visiting mfs.com (once you have selected “Individual Investor” as your role, click on “Individual Investor Home” in the top navigation and then select “Learn More About Proxy Voting” under the “I want to…” header on the left hand column of the page), or by visiting the SEC’s Web site at http://www.sec.gov.
QUARTERLY PORTFOLIO DISCLOSURE
The fund will file a complete schedule of portfolio holdings with the Securities and Exchange Commission (the Commission) for the first and third quarters of each fiscal year on Form N-Q. A shareholder can obtain the quarterly portfolio holdings report at mfs.com. The fund’s Form N-Q is also available on the EDGAR database on the Commission’s Internet Web site at http://www.sec.gov, and may be reviewed and copied at the:
Public Reference Room
Securities and Exchange Commission
100 F Street, NE, Room 1580
Washington, D.C. 20549
Information on the operation of the Public Reference Room may be obtained by calling the Commission at 1-800-SEC-0330. Copies of the fund’s Form N-Q also may be obtained, upon payment of a duplicating fee, by electronic request at the following e-mail address: publicinfo@sec.gov or by writing the Public Reference Section at the above address.
FURTHER INFORMATION
From time to time, MFS may post important information about the fund or the MFS funds on the MFS web site (mfs.com). This information is available on mfs.com by following these steps once you have selected “Individual Investor” as your role: (1) Click on the “Individual Investor Home” in the top navigation and then select the “Announcements” option within the “Market Outlooks” drop down, or (2) Click on “Products & Services” and “Mutual Funds” and then choose the fund’s name in the “Select a fund” menu.
40
INFORMATION ABOUT FUND CONTRACTS AND LEGAL CLAIMS
The fund has entered into contractual arrangements with an investment adviser, administrator, distributor, shareholder servicing agent, 529 program manager (if applicable), and custodian who each provide services to the fund. Unless expressly stated otherwise, shareholders are not parties to, or intended beneficiaries of these contractual arrangements, and these contractual arrangements are not intended to create any shareholder right to enforce them against the service providers or to seek any remedy under them against the service providers, either directly or on behalf of the fund.
Under the Trust’s By-Laws and Declaration of Trust, any claims asserted against or on behalf of the MFS Funds, including claims against Trustees and Officers, must be brought in state and federal courts located within the Commonwealth of Massachusetts.
FEDERAL TAX INFORMATION (unaudited)
The fund will notify shareholders of amounts for use in preparing 2017 income tax forms in January 2018.
41
rev. 3/16
| | | | |
| | | |
FACTS | | WHAT DOES MFS DO WITH YOUR PERSONAL INFORMATION? | |  |
| | |
| Why? | | Financial companies choose how they share your personal information. Federal law gives consumers the right to limit some but not all sharing. Federal law also requires us to tell you how we collect, share, and protect your personal information. Please read this notice carefully to understand what we do. |
| | |
| What? | | The types of personal information we collect and share depend on the product or service you have with us. This information can include: • Social Security number and account balances • Account transactions and transaction history • Checking account information and wire transfer instructions When you are no longer our customer, we continue to share your information as described in this notice. |
| | |
| How? | | All financial companies need to share customers’ personal information to run their everyday business. In the section below, we list the reasons financial companies can share their customers’ personal information; the reasons MFS chooses to share; and whether you can limit this sharing. |
| | | | |
Reasons we can share your
personal information | | Does MFS
share? | | Can you limit
this sharing? |
For our everyday business purposes – such as to process your transactions, maintain your account(s), respond to court orders and legal investigations, or report to credit bureaus | | Yes | | No |
For our marketing purposes – to offer our products and services to you | | No | | We don’t share |
For joint marketing with other financial companies | | No | | We don’t share |
For our affiliates’ everyday business purposes – information about your transactions and experiences | | No | | We don’t share |
For our affiliates’ everyday business purposes – information about your creditworthiness | | No | | We don’t share |
| For nonaffiliates to market to you | | No | | We don’t share |
| | |
| Questions? | | Call 800-225-2606 or go to mfs.com. |
42
| | |
| Who we are |
| Who is providing this notice? | | MFS Funds, MFS Investment Management, MFS Institutional Advisors, Inc., and MFS Heritage Trust Company. |
| | |
| What we do |
| How does MFS protect my personal information? | | To protect your personal information from unauthorized access and use, we use security measures that comply with federal law. These measures include procedural, electronic, and physical safeguards for the protection of the personal information we collect about you. |
| How does MFS collect my personal information? | | We collect your personal information, for example, when you • open an account or provide account information • direct us to buy securities or direct us to sell your securities • make a wire transfer We also collect your personal information from others, such as credit bureaus, affiliates, or other companies. |
| Why can’t I limit all sharing? | | Federal law gives you the right to limit only • sharing for affiliates’ everyday business purposes – information about your creditworthiness • affiliates from using your information to market to you • sharing for nonaffiliates to market to you State laws and individual companies may give you additional rights to limit sharing. |
| | |
| Definitions |
| Affiliates | | Companies related by common ownership or control. They can be financial and nonfinancial companies. • MFS does not share personal information with affiliates, except for everyday business purposes as described on page one of this notice. |
| Nonaffiliates | | Companies not related by common ownership or control. They can be financial and nonfinancial companies. • MFS does not share with nonaffiliates so they can market to you. |
| Joint marketing | | A formal agreement between nonaffiliated financial companies that together market financial products or services to you. • MFS doesn’t jointly market. |
| | |
| Other important information |
| If you own an MFS product or receive an MFS service in the name of a third party such as a bank or broker-dealer, their privacy policy may apply to you instead of ours. |
43
Save paper with eDelivery.

| MFS® will send you prospectuses, |
reports, and proxies directly via e-mail so you will get information faster with less mailbox clutter.
To sign up:
1. Go to mfs.com.
2. Log in via MFS® Access.
3. Select eDelivery.
If you own your MFS fund shares through a financial institution or a retirement plan, MFS® TALK, MFS® Access, or eDelivery may not be available to you.
CONTACT
WEB SITE
mfs.com
MFS TALK
1-800-637-8255
24 hours a day
ACCOUNT SERVICE AND LITERATURE
Shareholders
1-800-225-2606
Financial advisors
1-800-343-2829
Retirement plan services
1-800-637-1255
MAILING ADDRESS
MFS Service Center, Inc.
P.O. Box 55824
Boston, MA 02205-5824
OVERNIGHT MAIL
MFS Service Center, Inc.
c/o Boston Financial Data Services
30 Dan Road
Canton, MA 02021-2809
ANNUAL REPORT
August 31, 2017

MFS® VALUE FUND

EIF-ANN
MFS® VALUE FUND
CONTENTS
The report is prepared for the general information of shareholders.
It is authorized for distribution to prospective investors only when preceded or accompanied by a current prospectus.
NOT FDIC INSURED • MAY LOSE VALUE • NO BANK GUARANTEE

LETTER FROM THE EXECUTIVE CHAIRMAN
Dear Shareholders:
Despite policy uncertainty accompanying a new presidential administration in the United States and unease over ongoing Brexit negotiations, most markets have proved
resilient. U.S. share prices have reached new highs in recent months although the U.S. Federal Reserve has continued to gradually hike interest rates. However, rates in most developed markets remain very low, with major non-U.S. central banks just beginning to contemplate curbing accommodative monetary policies.
Globally, we’ve experienced a year-long synchronized upturn in economic growth. Despite better growth, there are few immediate signs of worrisome inflation amid muted wage gains around the world. Europe has benefited from diminishing event risks as populist challengers fell short of upsetting establishment
candidates in both the Dutch and French elections. Emerging market economies have been boosted in part by a weaker U.S. dollar and are recovering despite lingering concerns over the potential for restrictive U.S. trade policies that could hamper global trade growth. Looking ahead, markets will have to contend with issues involving geopolitical hot spots on the Korean peninsula and in the Middle East.
At MFS®, we believe time is an asset. A patient, long-term approach to investing can have a powerful impact on decision making and outcomes. Time arbitrage, as we call it, comes down to having the conviction and discipline to allow enough time for good investment ideas to play out. In our view, such an approach, along with the professional guidance of a financial advisor, will help you reach your investment objectives.
Respectfully,

Robert J. Manning
Executive Chairman
MFS Investment Management
October 17, 2017
The opinions expressed in this letter are subject to change and may not be relied upon for investment advice. No forecasts can be guaranteed.
1
PORTFOLIO COMPOSITION
Portfolio structure

| | | | |
| Top ten holdings | | | | |
| JPMorgan Chase & Co. | | | 4.6% | |
| Philip Morris International, Inc. | | | 3.7% | |
| Johnson & Johnson | | | 3.6% | |
| Wells Fargo & Co. | | | 3.0% | |
| Accenture PLC, “A” | | | 2.8% | |
| Medtronic PLC | | | 2.4% | |
| Goldman Sachs Group, Inc. | | | 2.4% | |
| Citigroup, Inc. | | | 2.3% | |
| U.S. Bancorp | | | 2.2% | |
| Pfizer, Inc. | | | 2.2% | |
| | | | |
| Equity sectors | | | | |
| Financial Services | | | 29.7% | |
| Health Care | | | 15.7% | |
| Consumer Staples | | | 10.8% | |
| Industrial Goods & Services | | | 9.7% | |
| Special Products & Services | | | 5.8% | |
| Basic Materials | | | 5.1% | |
| Leisure | | | 5.0% | |
| Energy | | | 5.0% | |
| Utilities & Communications | | | 2.7% | |
| Autos & Housing | | | 2.7% | |
| Transportation | | | 2.4% | |
| Retailing | | | 2.2% | |
| Technology | | | 1.8% | |
Cash & Cash Equivalents includes any cash, investments in money market funds, short-term securities, and other assets less liabilities. Please see the Statement of Assets and Liabilities for additional information related to the fund’s cash position and other assets and liabilities.
Percentages are based on net assets as of August 31, 2017.
The portfolio is actively managed and current holdings may be different.
2
MANAGEMENT REVIEW
Summary of results
For the twelve months ended August 31, 2017, Class A shares of the MFS Value Fund (“fund”) provided a total return of 12.24%, at net asset value. This compares with a return of 11.58% for the fund’s benchmark, the Russell 1000® Value Index.
Market Environment
For the first time in many years, the global economy is experiencing a period of synchronized economic growth. The rebound in emerging markets (“EM”) economies has been more pronounced (despite the deceleration in Chinese growth at the end of the period), helped by larger economies such as Brazil and Russia emerging from recessions. At the same time, developed markets (“DM”) economies continued to grow at or above potential. Market confidence increased in the US after the presidential elections in November in anticipation of lower taxes, a lighter regulatory burden and increased infrastructure spending, boosting US equities and corporate bond performance. Though hopes have largely faded for pro-growth US policies, market confidence persists. Globally, markets benefited from a reflation trade during the first half of the period as commodity prices strengthened, activity and growth prospects improved, and inflation moved higher, though within moderate bounds. While this bump in global inflation faded in the second half of the period as commodity prices, particularly oil, leveled off or declined, global growth remained relatively resilient. As a result, there have been more tightening signals and actions by DM central banks. The US Federal Reserve increased interest rates by 25 basis points during the second half of the period, bringing the total number of quarter-percent hikes in the federal funds rate to four since December 2015. The European Central Bank appears set to announce tapering of quantitative easing in the fall of 2017. The Bank of England may also begin reducing monetary accommodation. Markets have been comforted, along with central banks, by the decline in fears of a populist surge in Europe after establishment candidates won the Dutch and French elections. European growth has reflected the calmer political economic backdrop.
In recent months, the US dollar reversed the sharp rise seen early in the period, easing what had been a substantial headwind to earnings for multinationals. US consumer spending held up well during the second half of the period amid a modest increase in real wages and relatively low gasoline prices. Demand for autos reached near-record territory in the first half of the period before tapering off at the end of the period, while the housing market continued its recovery amid relatively low mortgage rates and tight inventories. Global trade, which was sluggish early in the period, showed signs of improvement in the period’s second half, a positive indicator of global economic activity and prospects. Early in the period, the US election resulted in a sell-off in EM assets due to fears that President Trump would follow through on various campaign threats and promises that were judged to be detrimental to EM. While President Trump withdrew the US from the Trans-Pacific Partnership and began the renegotiation of the North American Free Trade Agreement, significant additional policy action has so far been lacking on economic issues involving EM. As a result, emerging markets resumed their upward trajectory, powered by strong inflows throughout the first half of 2017.
3
Management Review – continued
Contributors to Performance
An underweight position in the energy sector contributed to performance relative to the Russell 1000® Value Index. Within this sector, an underweight position in oil and gas company Exxon Mobil bolstered relative returns. The energy sector was the worst performing sector over the last year. As commodity prices languished, shares of most energy companies, including Exxon Mobil, significantly underperformed the market.
Security selection in the financial services sector further benefited relative results. The fund’s overweight positions in global financial services firm JPMorgan Chase and investment services company Goldman Sachs Group, and holding shares of consulting firm AON (b), aided relative results. Shares of many US banks significantly outperformed the market following the US Presidential Election as it appeared that investors anticipated a more favorable environment with reduced regulation and higher interest rates going forward.
Security selection in both the industrial goods & services and autos & housing sectors also contributed to relative results. Within the industrial goods & services sector, not holding diversified industrial conglomerate General Electric, and the fund’s position in security solutions firm Northrop Grumman (b), supported relative performance. Shares of General Electric depreciated following what appeared to have been investor concerns regarding the company’s weaker-than-expected cash flow generation during the period. The unexpected resignation of its CEO in June further pressured its share price. Within the autos & housing sector, the fund’s position in vehicle components manufacturer Delphi Automotive (b) benefited relative performance.
Stocks in other sectors that aided relative results included not holding telecommunication services provider AT&T or next-generation mobile technologies provider QUALCOMM, and an overweight position in tobacco company Philip Morris International.
Detractors from Performance
Security selection in the retailing sector was a primary detractor from relative performance, led by the fund’s overweight position in drugstore CVS Health Corp.
Elsewhere, not holding financial services firm Bank of America, multinational conglomerate holding company Berkshire Hathaway and rail-based transportation company CSX hindered relative results. Shares of Bank of America reacted positively during the period to strong results in fee income revenue, a lower-than-anticipated loan loss provision, solid expense management, better-than-expected credit trends and increased future earnings guidance. The fund’s overweight positions in global food company General Mills, diversified technology and multi-industrial company Johnson Controls, global supplier of paints, coatings, specialty materials, and fiberglass PPG Industries, medical device maker Medtronic and beauty product manufacturer Coty weighed on relative returns. Shares of General Mills came under pressure after the
4
Management Review – continued
company lowered both its 2017 and 2018 earnings guidance during the period. Additionally, the fund’s holding of marketing and corporate communications services firm Omnicom Group (b) further held back relative performance.
Respectfully,
| | |
| Portfolio Manager(s) |
| Nevin Chitkara and Steve Gorham |
| (b) | Security is not a benchmark constituent. |
The views expressed in this report are those of the portfolio manager(s) only through the end of the period of the report as stated on the cover and do not necessarily reflect the views of MFS or any other person in the MFS organization. These views are subject to change at any time based on market or other conditions, and MFS disclaims any responsibility to update such views. These views may not be relied upon as investment advice or an indication of trading intent on behalf of any MFS portfolio. References to specific securities are not recommendations of such securities, and may not be representative of any MFS portfolio’s current or future investments.
5
PERFORMANCE SUMMARY THROUGH 8/31/17
The following chart illustrates a representative class of the fund’s historical performance in comparison to its benchmark(s). Performance results include the deduction of the maximum applicable sales charge and reflect the percentage change in net asset value, including reinvestment of dividends and capital gains distributions. The performance of other share classes will be greater than or less than that of the class depicted below. Benchmarks are unmanaged and may not be invested in directly. Benchmark returns do not reflect sales charges, commissions or expenses. (See Notes to Performance Summary.)
Performance data shown represents past performance and is no guarantee of future results. Investment return and principal value fluctuate so your shares, when sold, may be worth more or less than the original cost; current performance may be lower or higher than quoted. The performance shown does not reflect the deduction of taxes, if any, that a shareholder would pay on fund distributions or the redemption of fund shares.
Growth of a Hypothetical $10,000 Investment
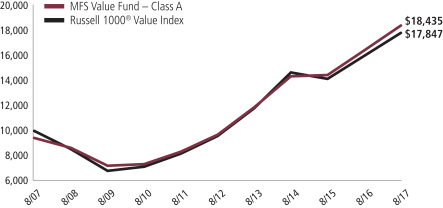
6
Performance Summary – continued
Total Returns through 8/31/17
Average annual without sales charge
| | | | | | | | | | | | |
| | | Share Class | | Class Inception Date | | 1-yr | | 5-yr | | 10-yr | | |
| | | A | | 1/02/96 | | 12.24% | | 13.73% | | 6.94% | | |
| | | B | | 11/04/97 | | 11.40% | | 12.88% | | 6.15% | | |
| | | C | | 11/05/97 | | 11.43% | | 12.88% | | 6.15% | | |
| | | I | | 1/02/97 | | 12.54% | | 14.01% | | 7.22% | | |
| | | R1 | | 4/01/05 | | 11.40% | | 12.88% | | 6.15% | | |
| | | R2 | | 10/31/03 | | 11.95% | | 13.45% | | 6.68% | | |
| | | R3 | | 4/01/05 | | 12.23% | | 13.73% | | 6.94% | | |
| | | R4 | | 4/01/05 | | 12.52% | | 14.01% | | 7.21% | | |
| | | R6 | | 5/01/06 | | 12.66% | | 14.13% | | 7.24% | | |
| | | 529A | | 7/31/02 | | 12.21% | | 13.73% | | 6.88% | | |
| | | 529B | | 7/31/02 | | 11.78% | | 13.01% | | 6.16% | | |
| | | 529C | | 7/31/02 | | 11.35% | | 12.83% | | 6.07% | | |
| Comparative benchmark(s) | | | | | | | | |
| | | Russell 1000® Value Index (f) | | 11.58% | | 13.25% | | 5.96% | | |
| | | Average annual with sales charge | | | | | | |
| | | A
With Initial Sales Charge (5.75%) | | 5.79% | | 12.39% | | 6.31% | | |
| | | B
With CDSC (Declining over six years from 4% to 0%) (v) | | 7.40% | | 12.63% | | 6.15% | | |
| | | C
With CDSC (1% for 12 months) (v) | | 10.43% | | 12.88% | | 6.15% | | |
| | | 529A
With initial Sales Charge (5.75%) | | 5.76% | | 12.39% | | 6.25% | | |
| | | 529B
With CDSC (Declining over six years from 4% to 0%) (v) | | 7.78% | | 12.76% | | 6.16% | | |
| | | 529C
With CDSC (1% for 12 months) (v) | | 10.35% | | 12.83% | | 6.07% | | |
CDSC – Contingent Deferred Sales Charge.
Class I, R1, R2, R3, R4, and R6 shares do not have a sales charge.
On May 30, 2012, Class W shares were redesignated Class R5 shares. Total returns for Class R5 shares prior to May 30, 2012 reflect the performance history of Class W shares which had different fees and expenses than Class R5 shares. Effective August 26, 2016, Class R5 shares were renamed Class R6 shares.
| (f) | Source: FactSet Research Systems Inc. |
| (v) | Assuming redemption at the end of the applicable period. |
7
Performance Summary – continued
Benchmark Definition(s)
Russell 1000® Value Index – constructed to provide a comprehensive barometer for the value securities in the large-cap segment of the U.S. equity universe. Companies in this index generally have lower price-to-book ratios and lower forecasted growth values. The Russell 1000® Value Index is a trademark/service mark of the Frank Russell Company. Russell® is a trademark of the Frank Russell Company.
It is not possible to invest directly in an index.
Notes to Performance Summary
Class 529 shares are only available in conjunction with qualified tuition programs, such as the MFS 529 Savings Plan. There also is an additional fee, which is detailed in the program description, on qualified tuition programs. If this fee was reflected, the performance for Class 529 shares would have been lower. This annual fee is waived for Oregon residents and for those accounts with assets of $25,000 or more.
Average annual total return represents the average annual change in value for each share class for the periods presented.
Performance results reflect any applicable expense subsidies and waivers in effect during the periods shown. Without such subsidies and waivers the fund’s performance results would be less favorable. Please see the prospectus and financial statements for complete details.
Performance results do not include adjustments made for financial reporting purposes in accordance with U.S. generally accepted accounting principles and may differ from amounts reported in the financial highlights.
From time to time the fund may receive proceeds from litigation settlements, without which performance would be lower.
8
EXPENSE TABLE
Fund expenses borne by the shareholders during the period, March 1, 2017 through August 31, 2017
As a shareholder of the fund, you incur two types of costs: (1) transaction costs, including sales charges (loads) on certain purchase or redemption payments, and (2) ongoing costs, including management fees; distribution and service (12b-1) fees; and other fund expenses. This example is intended to help you understand your ongoing costs (in dollars) of investing in the fund and to compare these costs with the ongoing costs of investing in other mutual funds.
The example is based on an investment of $1,000 invested at the beginning of the period and held for the entire period March 1, 2017 through August 31, 2017.
Actual Expenses
The first line for each share class in the following table provides information about actual account values and actual expenses. You may use the information in this line, together with the amount you invested, to estimate the expenses that you paid over the period. Simply divide your account value by $1,000 (for example, an $8,600 account value divided by $1,000 = 8.6), then multiply the result by the number in the first line under the heading entitled “Expenses Paid During Period” to estimate the expenses you paid on your account during this period.
Hypothetical Example for Comparison Purposes
The second line for each share class in the following table provides information about hypothetical account values and hypothetical expenses based on the fund’s actual expense ratio and an assumed rate of return of 5% per year before expenses, which is not the fund’s actual return. The hypothetical account values and expenses may not be used to estimate the actual ending account balance or expenses you paid for the period. You may use this information to compare the ongoing costs of investing in the fund and other funds. To do so, compare this 5% hypothetical example with the 5% hypothetical examples that appear in the shareholder reports of the other funds.
Please note that the expenses shown in the table are meant to highlight your ongoing costs only and do not reflect any transactional costs, such as sales charges (loads). Therefore, the second line for each share class in the table is useful in comparing ongoing costs only, and will not help you determine the relative total costs of owning different funds. In addition, if these transactional costs were included, your costs would have been higher.
9
Expense Table – continued
| | | | | | | | | | | | |
Share
Class | | | | Annualized
Expense
Ratio | | Beginning
Account Value
3/01/17 | | Ending Account Value
8/31/17 | | Expenses Paid During
Period (p) 3/01/17-8/31/17 | |
| A | | Actual | | 0.84% | | $1,000.00 | | $1,034.80 | | | $4.31 | |
| | Hypothetical (h) | | 0.84% | | $1,000.00 | | $1,020.97 | | | $4.28 | |
| B | | Actual | | 1.59% | | $1,000.00 | | $1,030.70 | | | $8.14 | |
| | Hypothetical (h) | | 1.59% | | $1,000.00 | | $1,017.19 | | | $8.08 | |
| C | | Actual | | 1.59% | | $1,000.00 | | $1,030.87 | | | $8.14 | |
| | Hypothetical (h) | | 1.59% | | $1,000.00 | | $1,017.19 | | | $8.08 | |
| I | | Actual | | 0.59% | | $1,000.00 | | $1,036.06 | | | $3.03 | |
| | Hypothetical (h) | | 0.59% | | $1,000.00 | | $1,022.23 | | | $3.01 | |
| R1 | | Actual | | 1.59% | | $1,000.00 | | $1,030.98 | | | $8.14 | |
| | Hypothetical (h) | | 1.59% | | $1,000.00 | | $1,017.19 | | | $8.08 | |
| R2 | | Actual | | 1.09% | | $1,000.00 | | $1,033.38 | | | $5.59 | |
| | Hypothetical (h) | | 1.09% | | $1,000.00 | | $1,019.71 | | | $5.55 | |
| R3 | | Actual | | 0.84% | | $1,000.00 | | $1,034.64 | | | $4.31 | |
| | Hypothetical (h) | | 0.84% | | $1,000.00 | | $1,020.97 | | | $4.28 | |
| R4 | | Actual | | 0.59% | | $1,000.00 | | $1,035.96 | | | $3.03 | |
| | Hypothetical (h) | | 0.59% | | $1,000.00 | | $1,022.23 | | | $3.01 | |
| R6 | | Actual | | 0.49% | | $1,000.00 | | $1,036.73 | | | $2.52 | |
| | Hypothetical (h) | | 0.49% | | $1,000.00 | | $1,022.74 | | | $2.50 | |
| 529A | | Actual | | 0.86% | | $1,000.00 | | $1,034.47 | | | $4.41 | |
| | Hypothetical (h) | | 0.86% | | $1,000.00 | | $1,020.87 | | | $4.38 | |
| 529B | | Actual | | 1.63% | | $1,000.00 | | $1,030.44 | | | $8.34 | |
| | Hypothetical (h) | | 1.63% | | $1,000.00 | | $1,016.99 | | | $8.29 | |
| 529C | | Actual | | 1.63% | | $1,000.00 | | $1,030.79 | | | $8.34 | |
| | Hypothetical (h) | | 1.63% | | $1,000.00 | | $1,016.99 | | | $8.29 | |
| (h) | 5% class return per year before expenses. |
| (p) | “Expenses Paid During Period” are equal to each class’s annualized expense ratio, as shown above, multiplied by the average account value over the period, multiplied by 184/365 (to reflect the one-half year period). Expenses paid do not include any applicable sales charges (loads). If these transaction costs had been included, your costs would have been higher. |
Notes to Expense Table
Each class with a Rule 12b-1 service fee is subject to a rebate of a portion of such fee. Such rebates are included in the expense ratios above. For Class 529A, Class 529B, and Class 529C shares, this rebate reduced the expense ratios above by 0.04%, 0.01%, and 0.01%, respectively. See Note 3 in the Notes to Financial Statements for additional information.
10
PORTFOLIO OF INVESTMENTS
8/31/17
The Portfolio of Investments is a complete list of all securities owned by your fund. It is categorized by broad-based asset classes.
| | | | | | | | |
| Common Stocks - 98.6% | | | | | | | | |
| Issuer | | Shares/Par | | | Value ($) | |
| Aerospace - 5.2% | | | | | | | | |
| Honeywell International, Inc. | | | 5,973,718 | | | $ | 825,985,988 | |
| Lockheed Martin Corp. | | | 1,209,915 | | | | 369,495,942 | |
| Northrop Grumman Corp. | | | 2,213,286 | | | | 602,478,582 | |
| United Technologies Corp. | | | 4,292,942 | | | | 513,951,016 | |
| | | | | | | | |
| | | | | | | $ | 2,311,911,528 | |
| Alcoholic Beverages - 1.2% | | | | | | | | |
| Diageo PLC | | | 15,705,494 | | | $ | 526,403,699 | |
| | |
| Apparel Manufacturers - 0.5% | | | | | | | | |
| Hanesbrands, Inc. | | | 8,361,357 | | | $ | 202,846,521 | |
| | |
| Automotive - 1.3% | | | | | | | | |
| Delphi Automotive PLC | | | 5,301,755 | | | $ | 511,089,182 | |
| Harley-Davidson, Inc. | | | 1,487,573 | | | | 69,930,807 | |
| | | | | | | | |
| | | | | | | $ | 581,019,989 | |
| Broadcasting - 1.8% | | | | | | | | |
| Interpublic Group of Companies, Inc. | | | 10,957,831 | | | $ | 220,690,717 | |
| Omnicom Group, Inc. | | | 7,507,398 | | | | 543,385,467 | |
| Walt Disney Co. | | | 322,786 | | | | 32,665,943 | |
| | | | | | | | |
| | | | | | | $ | 796,742,127 | |
| Brokerage & Asset Managers - 2.8% | | | | | | | | |
| BlackRock, Inc. | | | 1,030,885 | | | $ | 431,951,124 | |
| Franklin Resources, Inc. | | | 4,033,042 | | | | 174,348,406 | |
| NASDAQ, Inc. | | | 5,887,919 | | | | 443,831,334 | |
| T. Rowe Price Group, Inc. | | | 2,142,622 | | | | 180,751,592 | |
| | | | | | | | |
| | | | | | | $ | 1,230,882,456 | |
| Business Services - 5.8% | | | | | | | | |
| Accenture PLC, “A” | | | 9,398,839 | | | $ | 1,228,992,188 | |
| Amdocs Ltd. | | | 1,719,480 | | | | 111,405,109 | |
| Cognizant Technology Solutions Corp., “A” | | | 2,726,945 | | | | 192,985,898 | |
| DXC Technology Co. | | | 1,615,309 | | | | 137,301,265 | |
| Equifax, Inc. | | | 1,453,998 | | | | 207,151,095 | |
| Fidelity National Information Services, Inc. | | | 5,036,468 | | | | 467,988,606 | |
| Fiserv, Inc. (a) | | | 1,720,176 | | | | 212,802,973 | |
| | | | | | | | |
| | | | | | | $ | 2,558,627,134 | |
11
Portfolio of Investments – continued
| | | | | | | | |
| Issuer | | Shares/Par | | | Value ($) | |
| Common Stocks - continued | | | | | | | | |
| Cable TV - 1.4% | | | | | | | | |
| Comcast Corp., “A” | | | 15,310,380 | | | $ | 621,754,532 | |
| | |
| Chemicals - 4.6% | | | | | | | | |
| 3M Co. | | | 4,361,983 | | | $ | 891,240,367 | |
| E.I. du Pont de Nemours & Co. | | | 2,115,824 | | | | 177,581,108 | |
| Monsanto Co. | | | 1,460,603 | | | | 171,182,672 | |
| PPG Industries, Inc. | | | 7,796,745 | | | | 813,356,438 | |
| | | | | | | | |
| | | | | | | $ | 2,053,360,585 | |
| Computer Software - Systems - 0.6% | | | | | | | | |
| International Business Machines Corp. | | | 1,703,241 | | | $ | 243,614,560 | |
| | |
| Construction - 1.4% | | | | | | | | |
| Sherwin-Williams Co. | | | 1,010,251 | | | $ | 342,747,857 | |
| Stanley Black & Decker, Inc. | | | 1,798,705 | | | | 259,013,520 | |
| | | | | | | | |
| | | | | | | $ | 601,761,377 | |
| Consumer Products - 1.0% | | | | | | | | |
| Coty, Inc., “A” | | | 9,507,255 | | | $ | 157,630,288 | |
| Newell Brands, Inc. | | | 1,511,799 | | | | 72,989,656 | |
| Procter & Gamble Co. | | | 2,502,247 | | | | 230,882,330 | |
| | | | | | | | |
| | | | | | | $ | 461,502,274 | |
| Containers - 0.5% | | | | | | | | |
| Crown Holdings, Inc. (a) | | | 3,665,917 | | | $ | 216,399,080 | |
| | |
| Electrical Equipment - 2.1% | | | | | | | | |
| HD Supply Holdings, Inc. (a) | | | 1,698,354 | | | $ | 56,555,188 | |
| Johnson Controls International PLC | | | 22,492,440 | | | | 890,475,700 | |
| | | | | | | | |
| | | | | | | $ | 947,030,888 | |
| Electronics - 1.2% | | | | | | | | |
| Texas Instruments, Inc. | | | 6,538,546 | | | $ | 541,522,380 | |
| | |
| Energy - Independent - 1.6% | | | | | | | | |
| EOG Resources, Inc. | | | 4,729,334 | | | $ | 401,946,096 | |
| Occidental Petroleum Corp. | | | 4,983,797 | | | | 297,532,681 | |
| | | | | | | | |
| | | | | | | $ | 699,478,777 | |
| Energy - Integrated - 1.7% | | | | | | | | |
| Chevron Corp. | | | 3,402,758 | | | $ | 366,204,816 | |
| Exxon Mobil Corp. | | | 4,869,440 | | | | 371,684,355 | |
| | | | | | | | |
| | | | | | | $ | 737,889,171 | |
12
Portfolio of Investments – continued
| | | | | | | | |
| Issuer | | Shares/Par | | | Value ($) | |
| Common Stocks - continued | | | | | | | | |
| Entertainment - 0.9% | | | | | | | | |
| Time Warner, Inc. | | | 3,744,486 | | | $ | 378,567,535 | |
| | |
| Food & Beverages - 4.5% | | | | | | | | |
| Archer Daniels Midland Co. | | | 3,721,582 | | | $ | 153,775,768 | |
| Danone S.A. | | | 2,726,092 | | | | 214,675,145 | |
| General Mills, Inc. | | | 8,418,713 | | | | 448,380,654 | |
| J.M. Smucker Co. | | | 1,516,717 | | | | 158,891,273 | |
| Nestle S.A. | | | 8,957,096 | | | | 759,851,671 | |
| PepsiCo, Inc. | | | 2,266,905 | | | | 262,348,916 | |
| | | | | | | | |
| | | | | | | $ | 1,997,923,427 | |
| Food & Drug Stores - 1.5% | | | | | | | | |
| CVS Health Corp. | | | 8,754,661 | | | $ | 677,085,482 | |
| | |
| Health Maintenance Organizations - 0.8% | | | | | | | | |
| Cigna Corp. | | | 1,545,635 | | | $ | 281,398,308 | |
| UnitedHealth Group, Inc. | | | 373,414 | | | | 74,272,045 | |
| | | | | | | | |
| | | | | | | $ | 355,670,353 | |
| Insurance - 7.6% | | | | | | | | |
| Aon PLC | | | 6,002,683 | | | $ | 835,333,366 | |
| Chubb Ltd. | | | 6,194,045 | | | | 875,961,844 | |
| MetLife, Inc. | | | 11,386,946 | | | | 533,250,681 | |
| Prudential Financial, Inc. | | | 2,546,430 | | | | 259,939,575 | |
| Travelers Cos., Inc. | | | 6,889,600 | | | | 834,881,728 | |
| | | | | | | | |
| | | | | | | $ | 3,339,367,194 | |
| Machinery & Tools - 2.3% | | | | | | | | |
| Eaton Corp. PLC | | | 5,820,764 | | | $ | 417,698,025 | |
| Illinois Tool Works, Inc. | | | 2,682,440 | | | | 368,862,324 | |
| Ingersoll-Rand Co. Ltd., “A” | | | 2,950,683 | | | | 251,958,821 | |
| | | | | | | | |
| | | | | | | $ | 1,038,519,170 | |
| Major Banks - 13.4% | | | | | | | | |
| Bank of New York Mellon Corp. | | | 9,688,566 | | | $ | 506,518,230 | |
| Goldman Sachs Group, Inc. | | | 4,703,435 | | | | 1,052,346,547 | |
| JPMorgan Chase & Co. | | | 22,335,181 | | | | 2,030,044,601 | |
| PNC Financial Services Group, Inc. | | | 4,903,339 | | | | 614,927,744 | |
| State Street Corp. | | | 4,339,727 | | | | 401,381,350 | |
| Wells Fargo & Co. | | | 26,103,096 | | | | 1,333,085,113 | |
| | | | | | | | |
| | | | | | | $ | 5,938,303,585 | |
13
Portfolio of Investments – continued
| | | | | | | | |
| Issuer | | Shares/Par | | | Value ($) | |
| Common Stocks - continued | | | | | | | | |
| Medical & Health Technology & Services - 1.1% | | | | | | | | |
| Express Scripts Holding Co. (a) | | | 3,250,050 | | | $ | 204,168,141 | |
| McKesson Corp. | | | 1,934,337 | | | | 288,815,857 | |
| | | | | | | | |
| | | | | | | $ | 492,983,998 | |
| Medical Equipment - 6.6% | | | | | | | | |
| Abbott Laboratories | | | 14,669,078 | | | $ | 747,242,833 | |
| Danaher Corp. | | | 6,263,115 | | | | 522,469,053 | |
| Medtronic PLC | | | 13,163,777 | | | | 1,061,263,702 | |
| Thermo Fisher Scientific, Inc. | | | 3,150,640 | | | | 589,610,770 | |
| | | | | | | | |
| | | | | | | $ | 2,920,586,358 | |
| Oil Services - 1.7% | | | | | | | | |
| Schlumberger Ltd. | | | 11,873,596 | | | $ | 754,092,082 | |
| | |
| Other Banks & Diversified Financials - 5.5% | | | | | | | | |
| American Express Co. | | | 5,165,567 | | | $ | 444,755,319 | |
| Citigroup, Inc. | | | 15,016,984 | | | | 1,021,605,421 | |
| U.S. Bancorp | | | 18,849,759 | | | | 966,050,149 | |
| | | | | | | | |
| | | | | | | $ | 2,432,410,889 | |
| Pharmaceuticals - 7.2% | | | | | | | | |
| Johnson & Johnson | | | 12,173,806 | | | $ | 1,611,446,700 | |
| Merck & Co., Inc. | | | 6,623,654 | | | | 422,986,545 | |
| Novartis AG | | | 1,287,269 | | | | 108,598,010 | |
| Pfizer, Inc. | | | 28,220,491 | | | | 957,239,055 | |
| Roche Holding AG | | | 369,342 | | | | 93,784,636 | |
| | | | | | | | |
| | | | | | | $ | 3,194,054,946 | |
| Printing & Publishing - 1.0% | | | | | | | | |
| Moody’s Corp. | | | 2,498,348 | | | $ | 334,853,583 | |
| S&P Global, Inc. | | | 618,113 | | | | 95,393,379 | |
| | | | | | | | |
| | | | | | | $ | 430,246,962 | |
| Railroad & Shipping - 1.3% | | | | | | | | |
| Canadian National Railway Co. | | | 3,226,388 | | | $ | 261,305,164 | |
| Union Pacific Corp. | | | 2,962,140 | | | | 311,913,342 | |
| | | | | | | | |
| | | | | | | $ | 573,218,506 | |
| Real Estate - 0.4% | | | | | | | | |
| Public Storage, Inc., REIT | | | 833,967 | | | $ | 171,246,784 | |
| | |
| Specialty Stores - 0.2% | | | | | | | | |
| Advance Auto Parts, Inc. | | | 808,391 | | | $ | 79,141,479 | |
14
Portfolio of Investments – continued
| | | | | | | | |
| Issuer | | Shares/Par | | | Value ($) | |
| Common Stocks - continued | | | | | | | | |
| Telephone Services - 0.8% | | | | | | | | |
| Verizon Communications, Inc. | | | 7,270,804 | | | $ | 348,780,468 | |
| | |
| Tobacco - 4.1% | | | | | | | | |
| Altria Group, Inc. | | | 2,971,679 | | | $ | 188,404,449 | |
| Philip Morris International, Inc. | | | 13,862,841 | | | | 1,620,981,998 | |
| | | | | | | | |
| | | | | | | $ | 1,809,386,447 | |
| Trucking - 1.1% | | | | | | | | |
| United Parcel Service, Inc., “B” | | | 4,249,785 | | | $ | 486,005,412 | |
| | |
| Utilities - Electric Power - 1.9% | | | | | | | | |
| Duke Energy Corp. | | | 7,318,955 | | | $ | 638,944,771 | |
| Xcel Energy, Inc. | | | 4,004,336 | | | | 198,214,632 | |
| | | | | | | | |
| | | | | | | $ | 837,159,403 | |
Total Common Stocks
(Identified Cost, $28,126,961,105) | | | | | | $ | 43,587,497,558 | |
| | |
| Investment Companies (h) - 2.0% | | | | | | | | |
| Money Market Funds - 2.0% | | | | | | | | |
MFS Institutional Money Market Portfolio, 1.11% (v)
(Identified Cost, $908,248,308) | | | 908,270,888 | | | $ | 908,270,888 | |
| | |
| Other Assets, Less Liabilities - (0.6)% | | | | | | | (281,072,216 | ) |
| Net Assets - 100.0% | | | | | | $ | 44,214,696,230 | |
| (a) | Non-income producing security. |
| (h) | An affiliated issuer may be considered one in which the fund owns 5% or more of the outstanding voting securities, or a company which is under common control. At period end, the aggregate values of the fund’s investments in affiliated issuers and in unaffiliated issuers were $908,270,888 and $43,587,497,558, respectively. |
| (v) | Underlying affiliated fund that is available only to investment companies managed by MFS. The rate quoted for the MFS Institutional Money Market Portfolio is the annualized seven-day yield of the fund at period end. |
The following abbreviations are used in this report and are defined:
| PLC | | Public Limited Company |
| REIT | | Real Estate Investment Trust |
See Notes to Financial Statements
15
Financial Statements
STATEMENT OF ASSETS AND LIABILITIES
At 8/31/17
This statement represents your fund’s balance sheet, which details the assets and liabilities comprising the total value of the fund.
| | | | |
| Assets | | | | |
Investments in unaffiliated issuers, at value (identified cost, $28,126,961,105) | | | $43,587,497,558 | |
Investments in affiliated issuers, at value (identified cost, $908,248,308) | | | 908,270,888 | |
Cash | | | 3,884 | |
Foreign currency, at value (identified cost, $45) | | | 50 | |
Receivables for | | | | |
Investments sold | | | 96,792,274 | |
Fund shares sold | | | 96,359,653 | |
Dividends | | | 117,715,059 | |
Other assets | | | 36,433 | |
Total assets | | | $44,806,675,799 | |
| Liabilities | | | | |
Payables for | | | | |
Investments purchased | | | $509,190,087 | |
Fund shares reacquired | | | 71,358,110 | |
Payable to affiliates | | | | |
Investment adviser | | | 1,108,151 | |
Shareholder servicing costs | | | 8,792,347 | |
Distribution and service fees | | | 206,443 | |
Program manager fee | | | 80 | |
Payable for independent Trustees’ compensation | | | 1,872 | |
Accrued expenses and other liabilities | | | 1,322,479 | |
Total liabilities | | | $591,979,569 | |
Net assets | | | $44,214,696,230 | |
| Net assets consist of | | | | |
Paid-in capital | | | $27,836,693,401 | |
Unrealized appreciation (depreciation) | | | 15,460,782,029 | |
Accumulated net realized gain (loss) | | | 783,521,349 | |
Undistributed net investment income | | | 133,699,451 | |
Net assets | | | $44,214,696,230 | |
Shares of beneficial interest outstanding | | | 1,131,708,823 | |
16
Statement of Assets and Liabilities – continued
| | | | | | | | | | | | |
| | | Net assets | | | Shares
outstanding | | | Net asset value
per share (a) | |
Class A | | | $6,344,964,872 | | | | 162,699,440 | | | | $39.00 | |
Class B | | | 137,360,957 | | | | 3,543,563 | | | | 38.76 | |
Class C | | | 1,389,685,125 | | | | 36,081,147 | | | | 38.52 | |
Class I | | | 19,624,016,269 | | | | 500,397,357 | | | | 39.22 | |
Class R1 | | | 26,662,958 | | | | 697,134 | | | | 38.25 | |
Class R2 | | | 614,043,995 | | | | 15,907,634 | | | | 38.60 | |
Class R3 | | | 2,030,023,444 | | | | 52,247,366 | | | | 38.85 | |
Class R4 | | | 3,060,883,150 | | | | 78,474,599 | | | | 39.00 | |
Class R6 | | | 10,957,733,671 | | | | 280,899,972 | | | | 39.01 | |
Class 529A | | | 22,490,218 | | | | 581,254 | | | | 38.69 | |
Class 529B | | | 908,012 | | | | 23,749 | | | | 38.23 | |
Class 529C | | | 5,923,559 | | | | 155,608 | | | | 38.07 | |
| (a) | Maximum offering price per share was equal to the net asset value per share for all share classes, except for Classes A and 529A, for which the maximum offering prices per share were $41.38 [100 / 94.25 x $39.00] and $41.05 [100 / 94.25 x $38.69], respectively. On sales of $50,000 or more, the maximum offering prices of Class A and Class 529A shares are reduced. A contingent deferred sales charge may be imposed on redemptions of Class A, Class B, Class C, Class 529B, and Class 529C shares. Redemption price per share was equal to the net asset value per share for Classes I, R1, R2, R3, R4, R6, and 529A. |
See Notes to Financial Statements
17
Financial Statements
STATEMENT OF OPERATIONS
Year ended 8/31/17
This statement describes how much your fund earned in investment income and accrued in expenses. It also describes any gains and/or losses generated by fund operations.
| | | | |
| Net investment income (loss) | | | | |
Income | | | | |
Dividends | | | $946,677,798 | |
Non-cash dividends | | | 127,776,059 | |
Dividends from affiliated issuers | | | 3,203,286 | |
Income on securities loaned | | | 1,466,268 | |
Other | | | 12,755 | |
Foreign taxes withheld | | | (5,302,304 | ) |
Total investment income | | | $1,073,833,862 | |
Expenses | | | | |
Management fee | | | $202,696,656 | |
Distribution and service fees | | | 43,842,268 | |
Shareholder servicing costs | | | 38,226,658 | |
Program manager fees | | | 27,513 | |
Administrative services fee | | | 640,808 | |
Independent Trustees’ compensation | | | 244,707 | |
Custodian fee | | | 590,558 | |
Reimbursement of custodian expenses | | | (93,469 | ) |
Shareholder communications | | | 2,908,927 | |
Audit and tax fees | | | 71,239 | |
Legal fees | | | 463,472 | |
Miscellaneous | | | 1,914,159 | |
Total expenses | | | $291,533,496 | |
Reduction of expenses by investment adviser and distributor | | | (8,881,552 | ) |
Net expenses | | | $282,651,944 | |
Net investment income (loss) | | | $791,181,918 | |
| Realized and unrealized gain (loss) | | | | |
Realized gain (loss) (identified cost basis) | | | | |
Unaffiliated issuers | | | $1,357,513,093 | |
Affiliated issuers | | | (41,834 | ) |
Foreign currency | | | (138,118 | ) |
Net realized gain (loss) | | | $1,357,333,141 | |
Change in unrealized appreciation (depreciation) | | | | |
Unaffiliated issuers | | | $2,726,768,930 | |
Affiliated issuers | | | 22,580 | |
Translation of assets and liabilities in foreign currencies | | | 364,273 | |
Net unrealized gain (loss) | | | $2,727,155,783 | |
Net realized and unrealized gain (loss) | | | $4,084,488,924 | |
Change in net assets from operations | | | $4,875,670,842 | |
See Notes to Financial Statements
18
Financial Statements
STATEMENTS OF CHANGES IN NET ASSETS
These statements describe the increases and/or decreases in net assets resulting from operations, any distributions, and any shareholder transactions.
| | | | | | | | |
| | | Year ended | |
| | | 8/31/17 | | | 8/31/16 | |
| Change in net assets | | | | | | |
| From operations | | | | | | | | |
Net investment income (loss) | | | $791,181,918 | | | | $619,545,994 | |
Net realized gain (loss) | | | 1,357,333,141 | | | | 862,550,534 | |
Net unrealized gain (loss) | | | 2,727,155,783 | | | | 3,214,917,617 | |
Change in net assets from operations | | | $4,875,670,842 | | | | $4,697,014,145 | |
| Distributions declared to shareholders | | | | | | | | |
From net investment income | | | $(767,688,873 | ) | | | $(631,287,372 | ) |
From net realized gain on investments | | | (686,739,618 | ) | | | (1,243,632,740 | ) |
Total distributions declared to shareholders | | | $(1,454,428,491 | ) | | | $(1,874,920,112 | ) |
Change in net assets from fund share transactions | | | $955,436,745 | | | | $3,382,783,869 | |
Total change in net assets | | | $4,376,679,096 | | | | $6,204,877,902 | |
| Net assets | | | | | | | | |
At beginning of period | | | 39,838,017,134 | | | | 33,633,139,232 | |
At end of period (including undistributed net investment income of $133,699,451 and $110,344,524, respectively) | | | $44,214,696,230 | | | | $39,838,017,134 | |
See Notes to Financial Statements
19
Financial Statements
FINANCIAL HIGHLIGHTS
The financial highlights table is intended to help you understand the fund’s financial performance for the past 5 years. Certain information reflects financial results for a single fund share. The total returns in the table represent the rate that an investor would have earned (or lost) on an investment in the fund share class (assuming reinvestment of all distributions) held for the entire period.
| | | | | | | | | | | | | | | | | | | | |
| Class A | | Year ended | |
| | | 8/31/17 | | | 8/31/16 | | | 8/31/15 | | | 8/31/14 | | | 8/31/13 | |
Net asset value, beginning of period | | | $35.93 | | | | $33.38 | | | | $34.70 | | | | $29.81 | | | | $24.90 | |
| Income (loss) from investment operations | |
Net investment income (loss) (d) | | | $0.66 | (c) | | | $0.54 | | | | $0.63 | | | | $0.69 | | | | $0.50 | |
Net realized and unrealized gain (loss) | | | 3.65 | | | | 3.81 | | | | (0.36 | ) | | | 5.41 | | | | 5.08 | |
Total from investment operations | | | $4.31 | | | | $4.35 | | | | $0.27 | | | | $6.10 | | | | $5.58 | |
| Less distributions declared to shareholders | |
From net investment income | | | $(0.62 | ) | | | $(0.56 | ) | | | $(0.67 | ) | | | $(0.63 | ) | | | $(0.48 | ) |
From net realized gain | | | (0.62 | ) | | | (1.24 | ) | | | (0.92 | ) | | | (0.58 | ) | | | (0.19 | ) |
Total distributions declared to
shareholders | | | $(1.24 | ) | | | $(1.80 | ) | | | $(1.59 | ) | | | $(1.21 | ) | | | $(0.67 | ) |
Net asset value, end of period (x) | | | $39.00 | | | | $35.93 | | | | $33.38 | | | | $34.70 | | | | $29.81 | |
Total return (%) (r)(s)(t)(x) | | | 12.24 | (c) | | | 13.55 | | | | 0.68 | | | | 20.78 | | | | 22.75 | |
Ratios (%) (to average net assets)
and Supplemental data: | | | | | | | | | |
Expenses before expense reductions (f) | | | 0.86 | (c) | | | 0.90 | | | | 0.90 | | | | 0.90 | | | | 0.93 | |
Expenses after expense reductions (f) | | | 0.84 | (c) | | | 0.86 | | | | 0.86 | | | | 0.88 | | | | 0.92 | |
Net investment income (loss) | | | 1.77 | (c) | | | 1.60 | | | | 1.80 | | | | 2.10 | | | | 1.80 | |
Portfolio turnover | | | 14 | | | | 12 | | | | 12 | | | | 13 | | | | 12 | |
Net assets at end of period (000 omitted) | | | $6,344,965 | | | | $9,033,842 | | | | $8,478,761 | | | | $9,448,535 | | | | $8,058,858 | |
See Notes to Financial Statements
20
Financial Highlights – continued
| | | | | | | | | | | | | | | | | | | | |
| Class B | | Year ended | |
| | | 8/31/17 | | | 8/31/16 | | | 8/31/15 | | | 8/31/14 | | | 8/31/13 | |
Net asset value, beginning of period | | | $35.72 | | | | $33.19 | | | | $34.50 | | | | $29.64 | | | | $24.76 | |
| Income (loss) from investment operations | |
Net investment income (loss) (d) | | | $0.37 | (c) | | | $0.28 | | | | $0.37 | | | | $0.44 | | | | $0.29 | |
Net realized and unrealized gain (loss) | | | 3.64 | | | | 3.79 | | | | (0.35 | ) | | | 5.38 | | | | 5.05 | |
Total from investment operations | | | $4.01 | | | | $4.07 | | | | $0.02 | | | | $5.82 | | | | $5.34 | |
| Less distributions declared to shareholders | | | | | | | | | | | | | |
From net investment income | | | $(0.35 | ) | | | $(0.30 | ) | | | $(0.41 | ) | | | $(0.38 | ) | | | $(0.27 | ) |
From net realized gain | | | (0.62 | ) | | | (1.24 | ) | | | (0.92 | ) | | | (0.58 | ) | | | (0.19 | ) |
Total distributions declared to
shareholders | | | $(0.97 | ) | | | $(1.54 | ) | | | $(1.33 | ) | | | $(0.96 | ) | | | $(0.46 | ) |
Net asset value, end of period (x) | | | $38.76 | | | | $35.72 | | | | $33.19 | | | | $34.50 | | | | $29.64 | |
Total return (%) (r)(s)(t)(x) | | | 11.40 | (c) | | | 12.68 | | | | (0.06 | ) | | | 19.89 | | | | 21.82 | |
Ratios (%) (to average net assets)
and Supplemental data: | | | | | |
Expenses before expense reductions (f) | | | 1.61 | (c) | | | 1.65 | | | | 1.65 | | | | 1.65 | | | | 1.68 | |
Expenses after expense reductions (f) | | | 1.59 | (c) | | | 1.61 | | | | 1.61 | | | | 1.63 | | | | 1.67 | |
Net investment income (loss) | | | 0.99 | (c) | | | 0.85 | | | | 1.05 | | | | 1.35 | | | | 1.05 | |
Portfolio turnover | | | 14 | | | | 12 | | | | 12 | | | | 13 | | | | 12 | |
Net assets at end of period (000 omitted) | | | $137,361 | | | | $154,742 | | | | $154,205 | | | | $179,284 | | | | $169,208 | |
| |
| Class C | | Year ended | |
| | | 8/31/17 | | | 8/31/16 | | | 8/31/15 | | | 8/31/14 | | | 8/31/13 | |
Net asset value, beginning of period | | | $35.50 | | | | $33.00 | | | | $34.33 | | | | $29.50 | | | | $24.65 | |
| Income (loss) from investment operations | |
Net investment income (loss) (d) | | | $0.37 | (c) | | | $0.28 | | | | $0.37 | | | | $0.44 | | | | $0.29 | |
Net realized and unrealized gain (loss) | | | 3.62 | | | | 3.77 | | | | (0.36 | ) | | | 5.36 | | | | 5.03 | |
Total from investment operations | | | $3.99 | | | | $4.05 | | | | $0.01 | | | | $5.80 | | | | $5.32 | |
| Less distributions declared to shareholders | | | | | | | | | | | | | |
From net investment income | | | $(0.35 | ) | | | $(0.31 | ) | | | $(0.42 | ) | | | $(0.39 | ) | | | $(0.28 | ) |
From net realized gain | | | (0.62 | ) | | | (1.24 | ) | | | (0.92 | ) | | | (0.58 | ) | | | (0.19 | ) |
Total distributions declared to
shareholders | | | $(0.97 | ) | | | $(1.55 | ) | | | $(1.34 | ) | | | $(0.97 | ) | | | $(0.47 | ) |
Net asset value, end of period (x) | | | $38.52 | | | | $35.50 | | | | $33.00 | | | | $34.33 | | | | $29.50 | |
Total return (%) (r)(s)(t)(x) | | | 11.43 | (c) | | | 12.69 | | | | (0.09 | ) | | | 19.92 | | | | 21.83 | |
Ratios (%) (to average net assets)
and Supplemental data: | | | | | |
Expenses before expense reductions (f) | | | 1.61 | (c) | | | 1.65 | | | | 1.65 | | | | 1.65 | | | | 1.68 | |
Expenses after expense reductions (f) | | | 1.59 | (c) | | | 1.61 | | | | 1.61 | | | | 1.63 | | | | 1.67 | |
Net investment income (loss) | | | 0.99 | (c) | | | 0.85 | | | | 1.06 | | | | 1.35 | | | | 1.05 | |
Portfolio turnover | | | 14 | | | | 12 | | | | 12 | | | | 13 | | | | 12 | |
Net assets at end of period (000 omitted) | | | $1,389,685 | | | | $1,538,605 | | | | $1,335,968 | | | | $1,359,860 | | | | $1,090,690 | |
See Notes to Financial Statements
21
Financial Highlights – continued
| | | | | | | | | | | | | | | | | | | | |
| Class I | | Year ended | |
| | | 8/31/17 | | | 8/31/16 | | | 8/31/15 | | | 8/31/14 | | | 8/31/13 | |
Net asset value, beginning of period | | | $36.13 | | | | $33.56 | | | | $34.88 | | | | $29.96 | | | | $25.02 | |
| Income (loss) from investment operations | | | | | | | | | | | | | |
Net investment income (loss) (d) | | | $0.74 | (c) | | | $0.63 | | | | $0.72 | | | | $0.78 | | | | $0.57 | |
Net realized and unrealized gain (loss) | | | 3.70 | | | | 3.82 | | | | (0.36 | ) | | | 5.43 | | | | 5.10 | |
Total from investment operations | | | $4.44 | | | | $4.45 | | | | $0.36 | | | | $6.21 | | | | $5.67 | |
| Less distributions declared to shareholders | | | | | | | | | | | | | |
From net investment income | | | $(0.73 | ) | | | $(0.64 | ) | | | $(0.76 | ) | | | $(0.71 | ) | | | $(0.54 | ) |
From net realized gain | | | (0.62 | ) | | | (1.24 | ) | | | (0.92 | ) | | | (0.58 | ) | | | (0.19 | ) |
Total distributions declared to
shareholders | | | $(1.35 | ) | | | $(1.88 | ) | | | $(1.68 | ) | | | $(1.29 | ) | | | $(0.73 | ) |
Net asset value, end of period (x) | | | $39.22 | | | | $36.13 | | | | $33.56 | | | | $34.88 | | | | $29.96 | |
Total return (%) (r)(s)(t)(x) | | | 12.54 | (c) | | | 13.83 | | | | 0.93 | | | | 21.07 | | | | 23.06 | |
Ratios (%) (to average net assets)
and Supplemental data: | | | | | | | | | | | | | | | | | |
Expenses before expense reductions (f) | | | 0.61 | (c) | | | 0.65 | | | | 0.65 | | | | 0.65 | | | | 0.68 | |
Expenses after expense reductions (f) | | | 0.59 | (c) | | | 0.61 | | | | 0.61 | | | | 0.63 | | | | 0.67 | |
Net investment income (loss) | | | 1.98 | (c) | | | 1.84 | | | | 2.06 | | | | 2.35 | | | | 2.05 | |
Portfolio turnover | | | 14 | | | | 12 | | | | 12 | | | | 13 | | | | 12 | |
Net assets at end of period (000 omitted) | | | $19,624,016 | | | | $17,134,836 | | | | $13,888,395 | | | | $13,905,910 | | | | $10,568,573 | |
| |
| Class R1 | | Year ended | |
| | | 8/31/17 | | | 8/31/16 | | | 8/31/15 | | | 8/31/14 | | | 8/31/13 | |
Net asset value, beginning of period | | | $35.27 | | | | $32.79 | | | | $34.11 | | | | $29.32 | | | | $24.50 | |
| Income (loss) from investment operations | | | | | | | | | | | | | | | | | |
Net investment income (loss) (d) | | | $0.36 | (c) | | | $0.28 | | | | $0.36 | | | | $0.43 | | | | $0.29 | |
Net realized and unrealized gain (loss) | | | 3.60 | | | | 3.74 | | | | (0.34 | ) | | | 5.33 | | | | 5.00 | |
Total from investment operations | | | $3.96 | | | | $4.02 | | | | $0.02 | | | | $5.76 | | | | $5.29 | |
| Less distributions declared to shareholders | | | | | | | | | | | | | |
From net investment income | | | $(0.36 | ) | | | $(0.30 | ) | | | $(0.42 | ) | | | $(0.39 | ) | | | $(0.28 | ) |
From net realized gain | | | (0.62 | ) | | | (1.24 | ) | | | (0.92 | ) | | | (0.58 | ) | | | (0.19 | ) |
Total distributions declared to
shareholders | | | $(0.98 | ) | | | $(1.54 | ) | | | $(1.34 | ) | | | $(0.97 | ) | | | $(0.47 | ) |
Net asset value, end of period (x) | | | $38.25 | | | | $35.27 | | | | $32.79 | | | | $34.11 | | | | $29.32 | |
Total return (%) (r)(s)(t)(x) | | | 11.40 | (c) | | | 12.69 | | | | (0.07 | ) | | | 19.88 | | | | 21.83 | |
Ratios (%) (to average net assets)
and Supplemental data: | | | | | | | | | | | | | | | | | |
Expenses before expense reductions (f) | | | 1.61 | (c) | | | 1.65 | | | | 1.65 | | | | 1.65 | | | | 1.68 | |
Expenses after expense reductions (f) | | | 1.59 | (c) | | | 1.61 | | | | 1.61 | | | | 1.63 | | | | 1.67 | |
Net investment income (loss) | | | 0.99 | (c) | | | 0.85 | | | | 1.06 | | | | 1.33 | | | | 1.06 | |
Portfolio turnover | | | 14 | | | | 12 | | | | 12 | | | | 13 | | | | 12 | |
Net assets at end of period (000 omitted) | | | $26,663 | | | | $27,096 | | | | $27,860 | | | | $33,390 | | | | $33,485 | |
See Notes to Financial Statements
22
Financial Highlights – continued
| | | | | | | | | | | | | | | | | | | | |
| Class R2 | | Year ended | |
| | | 8/31/17 | | | 8/31/16 | | | 8/31/15 | | | 8/31/14 | | | 8/31/13 | |
Net asset value, beginning of period | | | $35.59 | | | | $33.08 | | | | $34.40 | | | | $29.56 | | | | $24.69 | |
| Income (loss) from investment operations | | | | | | | | | | | | | |
Net investment income (loss) (d) | | | $0.55 | (c) | | | $0.45 | | | | $0.54 | | | | $0.60 | | | | $0.43 | |
Net realized and unrealized gain (loss) | | | 3.62 | | | | 3.78 | | | | (0.35 | ) | | | 5.36 | | | | 5.04 | |
Total from investment operations | | | $4.17 | | | | $4.23 | | | | $0.19 | | | | $5.96 | | | | $5.47 | |
| Less distributions declared to shareholders | | | | | | | | | | | | | |
From net investment income | | | $(0.54 | ) | | | $(0.48 | ) | | | $(0.59 | ) | | | $(0.54 | ) | | | $(0.41 | ) |
From net realized gain | | | (0.62 | ) | | | (1.24 | ) | | | (0.92 | ) | | | (0.58 | ) | | | (0.19 | ) |
Total distributions declared to
shareholders | | | $(1.16 | ) | | | $(1.72 | ) | | | $(1.51 | ) | | | $(1.12 | ) | | | $(0.60 | ) |
Net asset value, end of period (x) | | | $38.60 | | | | $35.59 | | | | $33.08 | | | | $34.40 | | | | $29.56 | |
Total return (%) (r)(s)(t)(x) | | | 11.95 | (c) | | | 13.27 | | | | 0.43 | | | | 20.48 | | | | 22.47 | |
Ratios (%) (to average net assets)
and Supplemental data: | | | | | | | | | | | | | | | | | |
Expenses before expense reductions (f) | | | 1.11 | (c) | | | 1.15 | | | | 1.15 | | | | 1.15 | | | | 1.18 | |
Expenses after expense reductions (f) | | | 1.09 | (c) | | | 1.11 | | | | 1.11 | | | | 1.13 | | | | 1.17 | |
Net investment income (loss) | | | 1.49 | (c) | | | 1.35 | | | | 1.54 | | | | 1.84 | | | | 1.55 | |
Portfolio turnover | | | 14 | | | | 12 | | | | 12 | | | | 13 | | | | 12 | |
Net assets at end of period (000 omitted) | | | $614,044 | | | | $567,665 | | | | $521,592 | | | | $607,340 | | | | $572,590 | |
| |
| Class R3 | | Year ended | |
| | | 8/31/17 | | | 8/31/16 | | | 8/31/15 | | | 8/31/14 | | | 8/31/13 | |
Net asset value, beginning of period | | | $35.81 | | | | $33.28 | | | | $34.60 | | | | $29.73 | | | | $24.83 | |
| Income (loss) from investment operations | | | | | | | | | | | | | | | | | |
Net investment income (loss) (d) | | | $0.65 | (c) | | | $0.54 | | | | $0.63 | | | | $0.69 | | | | $0.50 | |
Net realized and unrealized gain (loss) | | | 3.64 | | | | 3.79 | | | | (0.35 | ) | | | 5.39 | | | | 5.07 | |
Total from investment operations | | | $4.29 | | | | $4.33 | | | | $0.28 | | | | $6.08 | | | | $5.57 | |
| Less distributions declared to shareholders | | | | | | | | | | | | | |
From net investment income | | | $(0.63 | ) | | | $(0.56 | ) | | | $(0.68 | ) | | | $(0.63 | ) | | | $(0.48 | ) |
From net realized gain | | | (0.62 | ) | | | (1.24 | ) | | | (0.92 | ) | | | (0.58 | ) | | | (0.19 | ) |
Total distributions declared to
shareholders | | | $(1.25 | ) | | | $(1.80 | ) | | | $(1.60 | ) | | | $(1.21 | ) | | | $(0.67 | ) |
Net asset value, end of period (x) | | | $38.85 | | | | $35.81 | | | | $33.28 | | | | $34.60 | | | | $29.73 | |
Total return (%) (r)(s)(t)(x) | | | 12.23 | (c) | | | 13.54 | | | | 0.69 | | | | 20.77 | | | | 22.77 | |
Ratios (%) (to average net assets)
and Supplemental data: | | | | | | | | | | | | | | | | | |
Expenses before expense reductions (f) | | | 0.86 | (c) | | | 0.90 | | | | 0.90 | | | | 0.90 | | | | 0.93 | |
Expenses after expense reductions (f) | | | 0.84 | (c) | | | 0.86 | | | | 0.86 | | | | 0.87 | | | | 0.91 | |
Net investment income (loss) | | | 1.74 | (c) | | | 1.60 | | | | 1.80 | | | | 2.11 | | | | 1.80 | |
Portfolio turnover | | | 14 | | | | 12 | | | | 12 | | | | 13 | | | | 12 | |
Net assets at end of period (000 omitted) | | | $2,030,023 | | | | $1,903,910 | | | | $1,571,281 | | | | $1,559,863 | | | | $1,299,126 | |
See Notes to Financial Statements
23
Financial Highlights – continued
| | | | | | | | | | | | | | | | | | | | |
| Class R4 | | Year ended | |
| | | 8/31/17 | | | 8/31/16 | | | 8/31/15 | | | 8/31/14 | | | 8/31/13 | |
Net asset value, beginning of period | | | $35.94 | | | | $33.40 | | | | $34.72 | | | | $29.82 | | | | $24.90 | |
| Income (loss) from investment operations | | | | | | | | | | | | | |
Net investment income (loss) (d) | | | $0.74 | (c) | | | $0.62 | | | | $0.72 | | | | $0.77 | | | | $0.57 | |
Net realized and unrealized gain (loss) | | | 3.67 | | | | 3.80 | | | | (0.36 | ) | | | 5.42 | | | | 5.08 | |
Total from investment operations | | | $4.41 | | | | $4.42 | | | | $0.36 | | | | $6.19 | | | | $5.65 | |
| Less distributions declared to shareholders | | | | | | | | | | | | | |
From net investment income | | | $(0.73 | ) | | | $(0.64 | ) | | | $(0.76 | ) | | | $(0.71 | ) | | | $(0.54 | ) |
From net realized gain | | | (0.62 | ) | | | (1.24 | ) | | | (0.92 | ) | | | (0.58 | ) | | | (0.19 | ) |
Total distributions declared to
shareholders | | | $(1.35 | ) | | | $(1.88 | ) | | | $(1.68 | ) | | | $(1.29 | ) | | | $(0.73 | ) |
Net asset value, end of period (x) | | | $39.00 | | | | $35.94 | | | | $33.40 | | | | $34.72 | | | | $29.82 | |
Total return (%) (r)(s)(t)(x) | | | 12.52 | (c) | | | 13.80 | | | | 0.93 | | | | 21.11 | | | | 23.09 | |
Ratios (%) (to average net assets)
and Supplemental data: | | | | | | | | | | | | | | | | | |
Expenses before expense reductions (f) | | | 0.61 | (c) | | | 0.65 | | | | 0.65 | | | | 0.65 | | | | 0.68 | |
Expenses after expense reductions (f) | | | 0.59 | (c) | | | 0.61 | | | | 0.61 | | | | 0.63 | | | | 0.67 | |
Net investment income (loss) | | | 1.99 | (c) | | | 1.85 | | | | 2.05 | | | | 2.34 | | | | 2.07 | |
Portfolio turnover | | | 14 | | | | 12 | | | | 12 | | | | 13 | | | | 12 | |
Net assets at end of period (000 omitted) | | | $3,060,883 | | | | $3,233,421 | | | | $2,787,041 | | | | $3,283,133 | | | | $2,892,340 | |
| |
| Class R6 | | Year ended | |
| | | 8/31/17 | | | 8/31/16 | | | 8/31/15 | | | 8/31/14 | | | 8/31/13 | |
Net asset value, beginning of period | | | $35.94 | | | | $33.40 | | | | $34.72 | | | | $29.82 | | | | $24.90 | |
| Income (loss) from investment operations | | | | | | | | | | | | | |
Net investment income (loss) (d) | | | $0.76 | (c) | | | $0.66 | | | | $0.76 | | | | $0.82 | | | | $0.60 | |
Net realized and unrealized gain (loss) | | | 3.69 | | | | 3.80 | | | | (0.36 | ) | | | 5.40 | | | | 5.07 | |
Total from investment operations | | | $4.45 | | | | $4.46 | | | | $0.40 | | | | $6.22 | | | | $5.67 | |
| Less distributions declared to shareholders | | | | | | | | | | | | | |
From net investment income | | | $(0.76 | ) | | | $(0.68 | ) | | | $(0.80 | ) | | | $(0.74 | ) | | | $(0.56 | ) |
From net realized gain | | | (0.62 | ) | | | (1.24 | ) | | | (0.92 | ) | | | (0.58 | ) | | | (0.19 | ) |
Total distributions declared to
shareholders | | | $(1.38 | ) | | | $(1.92 | ) | | | $(1.72 | ) | | | $(1.32 | ) | | | $(0.75 | ) |
Net asset value, end of period (x) | | | $39.01 | | | | $35.94 | | | | $33.40 | | | | $34.72 | | | | $29.82 | |
Total return (%) (r)(s)(t)(x) | | | 12.66 | (c) | | | 13.93 | | | | 1.04 | | | | 21.23 | | | | 23.18 | |
Ratios (%) (to average net assets)
and Supplemental data: | | | | | | | | | | | | | | | | | |
Expenses before expense reductions (f) | | | 0.51 | (c) | | | 0.54 | | | | 0.54 | | | | 0.55 | | | | 0.57 | |
Expenses after expense reductions (f) | | | 0.49 | (c) | | | 0.50 | | | | 0.50 | | | | 0.53 | | | | 0.56 | |
Net investment income (loss) | | | 2.04 | (c) | | | 1.95 | | | | 2.17 | | | | 2.48 | | | | 2.12 | |
Portfolio turnover | | | 14 | | | | 12 | | | | 12 | | | | 13 | | | | 12 | |
Net assets at end of period (000 omitted) | | | $10,957,734 | | | | $6,218,954 | | | | $4,846,172 | | | | $3,996 | | | | $2,632 | |
See Notes to Financial Statements
24
Financial Highlights – continued
| | | | | | | | | | | | | | | | | | | | |
| Class 529A | | Year ended | |
| | | 8/31/17 | | | 8/31/16 | | | 8/31/15 | | | 8/31/14 | | | 8/31/13 | |
Net asset value, beginning of period | | | $35.67 | | | | $33.15 | | | | $34.48 | | | | $29.62 | | | | $24.74 | |
| Income (loss) from investment operations | | | | | | | | | |
Net investment income (loss) (d) | | | $0.63 | (c) | | | $0.53 | | | | $0.63 | | | | $0.69 | | | | $0.49 | |
Net realized and unrealized gain (loss) | | | 3.64 | | | | 3.79 | | | | (0.36 | ) | | | 5.38 | | | | 5.05 | |
Total from investment operations | | | $4.27 | | | | $4.32 | | | | $0.27 | | | | $6.07 | | | | $5.54 | |
| Less distributions declared to shareholders | | | | | | | | | | | | | |
From net investment income | | | $(0.63 | ) | | | $(0.56 | ) | | | $(0.68 | ) | | | $(0.63 | ) | | | $(0.47 | ) |
From net realized gain | | | (0.62 | ) | | | (1.24 | ) | | | (0.92 | ) | | | (0.58 | ) | | | (0.19 | ) |
Total distributions declared to
shareholders | | | $(1.25 | ) | | | $(1.80 | ) | | | $(1.60 | ) | | | $(1.21 | ) | | | $(0.66 | ) |
Net asset value, end of period (x) | | | $38.69 | | | | $35.67 | | | | $33.15 | | | | $34.48 | | | | $29.62 | |
Total return (%) (r)(s)(t)(x) | | | 12.21 | (c) | | | 13.55 | | | | 0.67 | | | | 20.84 | | | | 22.73 | |
Ratios (%) (to average net assets)
and Supplemental data: | | | | | | | | | | | | | | | | | |
Expenses before expense reductions (f) | | | 0.96 | (c) | | | 1.00 | | | | 1.00 | | | | 1.00 | | | | 1.03 | |
Expenses after expense reductions (f) | | | 0.85 | (c) | | | 0.86 | | | | 0.86 | | | | 0.87 | | | | 0.93 | |
Net investment income (loss) | | | 1.71 | (c) | | | 1.59 | | | | 1.82 | | | | 2.11 | | | | 1.79 | |
Portfolio turnover | | | 14 | | | | 12 | | | | 12 | | | | 13 | | | | 12 | |
Net assets at end of period (000 omitted) | | | $22,490 | | | | $18,625 | | | | $16,543 | | | | $14,547 | | | | $10,899 | |
| |
| Class 529B | | Year ended | |
| | | 8/31/17 | | | 8/31/16 | | | 8/31/15 | | | 8/31/14 | | | 8/31/13 | |
Net asset value, beginning of period | | | $35.27 | | | | $32.78 | | | | $34.08 | | | | $29.29 | | | | $24.48 | |
| Income (loss) from investment operations | | | | | | | | | | | | | | | | | |
Net investment income (loss) (d) | | | $0.47 | (c) | | | $0.29 | | | | $0.47 | | | | $0.42 | | | | $0.27 | |
Net realized and unrealized gain (loss) | | | 3.61 | | | | 3.73 | | | | (0.34 | ) | | | 5.32 | | | | 4.99 | |
Total from investment operations | | | $4.08 | | | | $4.02 | | | | $0.13 | | | | $5.74 | | | | $5.26 | |
| Less distributions declared to shareholders | | | | | | | | | | | | | |
From net investment income | | | $(0.50 | ) | | | $(0.29 | ) | | | $(0.51 | ) | | | $(0.37 | ) | | | $(0.26 | ) |
From net realized gain | | | (0.62 | ) | | | (1.24 | ) | | | (0.92 | ) | | | (0.58 | ) | | | (0.19 | ) |
Total distributions declared to
shareholders | | | $(1.12 | ) | | | $(1.53 | ) | | | $(1.43 | ) | | | $(0.95 | ) | | | $(0.45 | ) |
Net asset value, end of period (x) | | | $38.23 | | | | $35.27 | | | | $32.78 | | | | $34.08 | | | | $29.29 | |
Total return (%) (r)(s)(t)(x) | | | 11.78 | (c) | | | 12.70 | | | | 0.27 | | | | 19.85 | | | | 21.74 | |
Ratios (%) (to average net assets)
and Supplemental data: | | | | | | | | | | | | | | | | | |
Expenses before expense reductions (f) | | | 1.34 | (c) | | | 1.68 | | | | 1.37 | | | | 1.75 | | | | 1.78 | |
Expenses after expense reductions (f) | | | 1.26 | (c) | | | 1.58 | | | | 1.27 | | | | 1.67 | | | | 1.71 | |
Net investment income (loss) | | | 1.28 | (c) | | | 0.87 | | | | 1.38 | | | | 1.30 | | | | 1.00 | |
Portfolio turnover | | | 14 | | | | 12 | | | | 12 | | | | 13 | | | | 12 | |
Net assets at end of period (000 omitted) | | | $908 | | | | $941 | | | | $888 | | | | $1,026 | | | | $1,013 | |
See Notes to Financial Statements
25
Financial Highlights – continued
| | | | | | | | | | | | | | | | | | | | |
| Class 529C | | Year ended | |
| | | 8/31/17 | | | 8/31/16 | | | 8/31/15 | | | 8/31/14 | | | 8/31/13 | |
Net asset value, beginning of period | | | $35.11 | | | | $32.66 | | | | $34.00 | | | | $29.23 | | | | $24.43 | |
| Income (loss) from investment operations | | | | | |
Net investment income (loss) (d) | | | $0.34 | (c) | | | $0.26 | | | | $0.35 | | | | $0.41 | | | | $0.27 | |
Net realized and unrealized gain (loss) | | | 3.59 | | | | 3.73 | | | | (0.36 | ) | | | 5.32 | | | | 4.99 | |
Total from investment operations | | | $3.93 | | | | $3.99 | | | | $(0.01 | ) | | | $5.73 | | | | $5.26 | |
| Less distributions declared to shareholders | | | | | | | | | | | | | |
From net investment income | | | $(0.35 | ) | | | $(0.30 | ) | | | $(0.41 | ) | | | $(0.38 | ) | | | $(0.27 | ) |
From net realized gain | | | (0.62 | ) | | | (1.24 | ) | | | (0.92 | ) | | | (0.58 | ) | | | (0.19 | ) |
Total distributions declared to
shareholders | | | $(0.97 | ) | | | $(1.54 | ) | | | $(1.33 | ) | | | $(0.96 | ) | | | $(0.46 | ) |
Net asset value, end of period (x) | | | $38.07 | | | | $35.11 | | | | $32.66 | | | | $34.00 | | | | $29.23 | |
Total return (%) (r)(s)(t)(x) | | | 11.38 | (c) | | | 12.64 | | | | (0.14 | ) | | | 19.85 | | | | 21.80 | |
Ratios (%) (to average net assets)
and Supplemental data: | | | | | | | | | | | | | | | | | |
Expenses before expense reductions (f) | | | 1.71 | (c) | | | 1.75 | | | | 1.75 | | | | 1.75 | | | | 1.78 | |
Expenses after expense reductions (f) | | | 1.63 | (c) | | | 1.65 | | | | 1.66 | | | | 1.67 | | | | 1.72 | |
Net investment income (loss) | | | 0.93 | (c) | | | 0.80 | | | | 1.03 | | | | 1.28 | | | | 1.00 | |
Portfolio turnover | | | 14 | | | | 12 | | | | 12 | | | | 13 | | | | 12 | |
Net assets at end of period (000 omitted) | | | $5,924 | | | | $5,381 | | | | $4,434 | | | | $3,981 | | | | $3,387 | |
| (c) | Amount reflects a one-time reimbursement of expenses by the custodian (or former custodian) without which net investment income and performance would be lower and expenses would be higher. See Note 2 in the Notes to Financial Statements for additional information. |
| (d) | Per share data is based on average shares outstanding. |
| (f) | Ratios do not reflect reductions from fees paid indirectly, if applicable. |
| (r) | Certain expenses have been reduced without which performance would have been lower. |
| (s) | From time to time the fund may receive proceeds from litigation settlements, without which performance would be lower. |
| (t) | Total returns do not include any applicable sales charges. |
| (x) | The net asset values and total returns have been calculated on net assets which include adjustments made in accordance with U.S. generally accepted accounting principles required at period end for financial reporting purposes. |
See Notes to Financial Statements
26
NOTES TO FINANCIAL STATEMENTS
(1) Business and Organization
MFS Value Fund (the fund) is a diversified series of MFS Series Trust I (the trust). The trust is organized as a Massachusetts business trust and is registered under the Investment Company Act of 1940, as amended, as an open-end management investment company.
The fund is an investment company and accordingly follows the investment company accounting and reporting guidance of the Financial Accounting Standards Board (FASB) Accounting Standards Codification Topic 946 Financial Services – Investment Companies.
(2) Significant Accounting Policies
General – The preparation of financial statements in conformity with U.S. generally accepted accounting principles requires management to make estimates and assumptions that affect the reported amounts of assets and liabilities, and disclosure of contingent assets and liabilities at the date of the financial statements and the reported amounts of increases and decreases in net assets from operations during the reporting period. Actual results could differ from those estimates. In the preparation of these financial statements, management has evaluated subsequent events occurring after the date of the fund’s Statement of Assets and Liabilities through the date that the financial statements were issued.
In October 2016, the Securities and Exchange Commission (SEC) released its Final Rule on Investment Company Reporting Modernization (the “Rule”). The Rule, which introduced two new regulatory reporting forms for investment companies – Form N-PORT and Form N-CEN – also contained amendments to Regulation S-X which impact financial statement presentation, particularly the presentation of derivative investments, for all reporting periods ending after August 1, 2017. The fund has adopted the Rule’s Regulation S-X amendments and believes that the fund’s financial statements are in compliance with those amendments.
Balance Sheet Offsetting – The fund’s accounting policy with respect to balance sheet offsetting is that, absent an event of default by the counterparty or a termination of the agreement, the International Swaps and Derivatives Association (ISDA) Master Agreement does not result in an offset of reported amounts of financial assets and financial liabilities in the Statement of Assets and Liabilities across transactions between the fund and the applicable counterparty. The fund’s right to setoff may be restricted or prohibited by the bankruptcy or insolvency laws of the particular jurisdiction to which a specific master netting agreement counterparty is subject. Balance sheet offsetting disclosures, to the extent applicable to the fund, have been included in the fund’s Significant Accounting Policies note under the captions for each of the fund’s in-scope financial instruments and transactions.
Investment Valuations – Equity securities, including restricted equity securities, are generally valued at the last sale or official closing price on their primary market or exchange as provided by a third-party pricing service. Equity securities, for which there were no sales reported that day, are generally valued at the last quoted daily bid quotation on their primary market or exchange as provided by a third-party pricing service. Short-term instruments with a maturity at issuance of 60 days or less may be
27
Notes to Financial Statements – continued
valued at amortized cost, which approximates market value. Open-end investment companies are generally valued at net asset value per share. Securities and other assets generally valued on the basis of information from a third-party pricing service may also be valued at a broker/dealer bid quotation. Values obtained from third-party pricing services can utilize both transaction data and market information such as yield, quality, coupon rate, maturity, type of issue, trading characteristics, and other market data. The values of foreign securities and other assets and liabilities expressed in foreign currencies are converted to U.S. dollars using the mean of bid and asked prices for rates provided by a third-party pricing service.
The Board of Trustees has delegated primary responsibility for determining or causing to be determined the value of the fund’s investments (including any fair valuation) to the adviser pursuant to valuation policies and procedures approved by the Board. If the adviser determines that reliable market quotations are not readily available, investments are valued at fair value as determined in good faith by the adviser in accordance with such procedures under the oversight of the Board of Trustees. Under the fund’s valuation policies and procedures, market quotations are not considered to be readily available for most types of debt instruments and floating rate loans and many types of derivatives. These investments are generally valued at fair value based on information from third-party pricing services. In addition, investments may be valued at fair value if the adviser determines that an investment’s value has been materially affected by events occurring after the close of the exchange or market on which the investment is principally traded (such as foreign exchange or market) and prior to the determination of the fund’s net asset value, or after the halting of trading of a specific security where trading does not resume prior to the close of the exchange or market on which the security is principally traded. Events that occur on a frequent basis after foreign markets close (such as developments in foreign markets and significant movements in the U.S. markets) and prior to the determination of the fund’s net asset value may be deemed to have a material effect on the value of securities traded in foreign markets. Accordingly, the fund’s foreign equity securities may often be valued at fair value. The adviser generally relies on third-party pricing services or other information (such as the correlation with price movements of similar securities in the same or other markets; the type, cost and investment characteristics of the security; the business and financial condition of the issuer; and trading and other market data) to assist in determining whether to fair value and at what value to fair value an investment. The value of an investment for purposes of calculating the fund’s net asset value can differ depending on the source and method used to determine value. When fair valuation is used, the value of an investment used to determine the fund’s net asset value may differ from quoted or published prices for the same investment. There can be no assurance that the fund could obtain the fair value assigned to an investment if it were to sell the investment at the same time at which the fund determines its net asset value per share.
Various inputs are used in determining the value of the fund’s assets or liabilities. These inputs are categorized into three broad levels. In certain cases, the inputs used to measure fair value may fall into different levels of the fair value hierarchy. In such cases, an investment’s level within the fair value hierarchy is based on the lowest level of input that is significant to the fair value measurement. The fund’s assessment of the significance of a particular input to the fair value measurement in its entirety requires
28
Notes to Financial Statements – continued
judgment, and considers factors specific to the investment. Level 1 includes unadjusted quoted prices in active markets for identical assets or liabilities. Level 2 includes other significant observable market-based inputs (including quoted prices for similar securities, interest rates, prepayment speed, and credit risk). Level 3 includes unobservable inputs, which may include the adviser’s own assumptions in determining the fair value of investments. The following is a summary of the levels used as of August 31, 2017 in valuing the fund’s assets or liabilities:
| | | | | | | | | | | | | | | | |
| Financial Instruments | | Level 1 | | | Level 2 | | | Level 3 | | | Total | |
| Equity Securities | | | $43,587,497,558 | | | | $— | | | | $— | | | | $43,587,497,558 | |
| Mutual Funds | | | 908,270,888 | | | | — | | | | — | | | | 908,270,888 | |
| Total | | | $44,495,768,446 | | | | $— | | | | $— | | | | $44,495,768,446 | |
For further information regarding security characteristics, see the Portfolio of Investments.
Foreign Currency Translation – Purchases and sales of foreign investments, income, and expenses are converted into U.S. dollars based upon currency exchange rates prevailing on the respective dates of such transactions or on the reporting date for foreign denominated receivables and payables. Gains and losses attributable to foreign currency exchange rates on sales of securities are recorded for financial statement purposes as net realized gains and losses on investments. Gains and losses attributable to foreign exchange rate movements on receivables, payables, income and expenses are recorded for financial statement purposes as foreign currency transaction gains and losses. That portion of both realized and unrealized gains and losses on investments that results from fluctuations in foreign currency exchange rates is not separately disclosed.
Security Loans – Under its Securities Lending Agency Agreement with the fund, State Street Bank and Trust Company (“State Street”), as lending agent, loans the securities of the fund to certain qualified institutions (the “Borrowers”) approved by the fund. Security loans can be terminated at the discretion of either the lending agent or the fund and the related securities must be returned within the earlier of the standard trade settlement period for such securities or within three business days. The loans are collateralized by cash and/or U.S. Treasury and federal agency obligations in an amount typically at least equal to the market value of the securities loaned. On loans collateralized by cash, the cash collateral is invested in a money market fund. The market value of the loaned securities is determined at the close of business of the fund and any additional required collateral is delivered to the fund on the next business day. State Street provides the fund with indemnification against Borrower default. In the event of Borrower default, State Street will, for the benefit of the fund, either purchase securities identical to those loaned or, when such purchase is commercially impracticable, pay the fund the market value of the loaned securities. In return, State Street assumes the fund’s rights to the related collateral. If the collateral value is less than the cost to purchase identical securities, State Street is responsible for the shortfall, but only to the extent that such shortfall is not due to a decline in collateral value resulting from collateral reinvestment for which the fund bears the risk of loss. A portion of the income generated upon investment of the collateral is remitted to the Borrowers, and the remainder is allocated between the fund and the lending agent. On
29
Notes to Financial Statements – continued
loans collateralized by U.S. Treasury and/or federal agency obligations, a fee is received from the Borrower, and is allocated between the fund and the lending agent. Income from securities lending is separately reported in the Statement of Operations. The dividend and interest income earned on the securities loaned is accounted for in the same manner as other dividend and interest income. At August 31, 2017, there were no securities on loan or collateral outstanding.
Indemnifications – Under the fund’s organizational documents, its officers and Trustees may be indemnified against certain liabilities and expenses arising out of the performance of their duties to the fund. Additionally, in the normal course of business, the fund enters into agreements with service providers that may contain indemnification clauses. The fund’s maximum exposure under these agreements is unknown as this would involve future claims that may be made against the fund that have not yet occurred.
Investment Transactions and Income – Investment transactions are recorded on the trade date. Interest income is recorded on the accrual basis. Dividends received in cash are recorded on the ex-dividend date. Certain dividends from foreign securities will be recorded when the fund is informed of the dividend if such information is obtained subsequent to the ex-dividend date. Dividend and interest payments received in additional securities are recorded on the ex-dividend or ex-interest date in an amount equal to the value of the security on such date.
The fund may receive proceeds from litigation settlements. Any proceeds received from litigation involving portfolio holdings are reflected in the Statement of Operations in realized gain/loss if the security has been disposed of by the fund or in unrealized gain/loss if the security is still held by the fund. Any other proceeds from litigation not related to portfolio holdings are reflected as other income in the Statement of Operations.
Reimbursement of Expenses by Custodian – In December 2015, the fund’s custodian (or former custodian), State Street Bank and Trust Company, announced that it intended to reimburse its asset servicing clients for expense amounts that it billed in error during the period 1998 through 2015. The amount of this one-time reimbursement attributable to the fund is reflected as “Reimbursement of custodian expenses” in the Statement of Operations.
Tax Matters and Distributions – The fund intends to qualify as a regulated investment company, as defined under Subchapter M of the Internal Revenue Code, and to distribute all of its taxable income, including realized capital gains. As a result, no provision for federal income tax is required. The fund’s federal tax returns, when filed, will remain subject to examination by the Internal Revenue Service for a three year period. Management has analyzed the fund’s tax positions taken on federal and state tax returns for all open tax years and does not believe that there are any uncertain tax positions that require recognition of a tax liability. Foreign taxes, if any, have been accrued by the fund in the accompanying financial statements in accordance with the applicable foreign tax law. Foreign income taxes may be withheld by certain countries in which the fund invests. Additionally, capital gains realized by the fund on securities issued in or by certain foreign countries may be subject to capital gains tax imposed by those countries.
30
Notes to Financial Statements – continued
Distributions to shareholders are recorded on the ex-dividend date. Income and capital gain distributions are determined in accordance with income tax regulations, which may differ from U.S. generally accepted accounting principles. Certain capital accounts in the financial statements are periodically adjusted for permanent differences in order to reflect their tax character. These adjustments have no impact on net assets or net asset value per share. Temporary differences which arise from recognizing certain items of income, expense, gain or loss in different periods for financial statement and tax purposes will reverse at some time in the future. Distributions in excess of net investment income or net realized gains are temporary overdistributions for financial statement purposes resulting from differences in the recognition or classification of income or distributions for financial statement and tax purposes.
Book/tax differences primarily relate to wash sale loss deferrals, treating a portion of the proceeds from redemptions as a distribution for tax purposes, and redemptions in-kind.
The tax character of distributions declared to shareholders for the last two fiscal years is as follows:
| | | | | | | | |
| | | Year ended
8/31/17 | | | Year ended
8/31/16 | |
| Ordinary income (including any short-term capital gains) | | | $767,688,873 | | | | $675,250,066 | |
| Long-term capital gains | | | 686,739,618 | | | | 1,199,670,046 | |
| Total distributions | | | $1,454,428,491 | | | | $1,874,920,112 | |
The federal tax cost and the tax basis components of distributable earnings were as follows:
| | | | |
| As of 8/31/17 | | | |
| Cost of investments | | | $29,182,228,961 | |
| Gross appreciation | | | 15,709,464,601 | |
| Gross depreciation | | | (395,925,116 | ) |
| Net unrealized appreciation (depreciation) | | | $15,313,539,485 | |
| Undistributed ordinary income | | | 238,199,458 | |
| Undistributed long-term capital gain | | | 826,042,751 | |
| Other temporary differences | | | 221,135 | |
Multiple Classes of Shares of Beneficial Interest – The fund offers multiple classes of shares, which differ in their respective distribution and service fees. The fund’s income, realized and unrealized gain (loss), and common expenses are allocated to shareholders based on the daily net assets of each class. Dividends are declared separately for each class. Differences in per share dividend rates are generally due to differences in separate class expenses. Class B shares will convert to Class A shares
31
Notes to Financial Statements – continued
approximately eight years after purchase. The fund’s distributions declared to shareholders as reported in the Statements of Changes in Net Assets are presented by class as follows:
| | | | | | | | | | | | | | | | |
| | | From net investment
income | | | From net realized gain on
investments | |
| | | Year
ended
8/31/17 | | | Year
ended
8/31/16 | | | Year
ended
8/31/17 | | | Year
ended
8/31/16 | |
| Class A | | | $131,982,827 | | | | $143,652,211 | | | | $145,815,548 | | | | $317,518,220 | |
| Class B | | | 1,409,681 | | | | 1,365,556 | | | | 2,559,725 | | | | 5,620,466 | |
| Class C | | | 14,571,557 | | | | 13,003,027 | | | | 26,261,814 | | | | 50,501,471 | |
| Class I | | | 375,506,835 | | | | 279,002,684 | | | | 303,900,025 | | | | 516,393,410 | |
| Class R1 | | | 260,861 | | | | 242,154 | | | | 444,176 | | | | 980,245 | |
| Class R2 | | | 8,856,685 | | | | 7,506,322 | | | | 10,120,565 | | | | 19,304,965 | |
| Class R3 | | | 33,433,839 | | | | 27,575,912 | | | | 32,531,493 | | | | 60,955,804 | |
| Class R4 | | | 62,561,506 | | | | 55,632,088 | | | | 55,201,840 | | | | 102,703,354 | |
| Class R6 | | | 138,688,255 | | | | 102,970,243 | | | | 109,454,646 | | | | 168,819,722 | |
| Class 529A | | | 348,807 | | | | 285,400 | | | | 337,407 | | | | 629,492 | |
| Class 529B | | | 12,287 | | | | 8,069 | | | | 15,161 | | | | 32,356 | |
| Class 529C | | | 55,733 | | | | 43,706 | | | | 97,218 | | | | 173,235 | |
| Total | | | $767,688,873 | | | | $631,287,372 | | | | $686,739,618 | | | | $1,243,632,740 | |
(3) Transactions with Affiliates
Investment Adviser – The fund has an investment advisory agreement with MFS to provide overall investment management and related administrative services and facilities to the fund. For the period September 1, 2016 to December 28, 2016, the management fee was computed daily and paid monthly at the following annual rates:
| | | | |
| First $7.5 billion of average daily net assets | | | 0.60 | % |
| Next $2.5 billion of average daily net assets | | | 0.53 | % |
| Average daily net assets in excess of $10 billion | | | 0.50 | % |
The investment adviser had agreed in writing to reduce its management fee to 0.45% of average daily net assets in excess of $20 billion up to $25 billion, 0.42% of average daily net assets in excess of $25 billion up to $30 billion, 0.40% of average daily net assets in excess of $30 billion up to $35 billion, 0.38% of average daily net assets in excess of $35 billion up to $40 billion, and 0.36% of average daily nets assets in excess of $40 billion. This written agreement terminated on December 28, 2016. For the period September 1, 2016 to December 28, 2016, this management fee reduction amounted to $5,603,205, which is included in the reduction of total expenses in the Statement of Operations.
32
Notes to Financial Statements – continued
For the period December 29, 2016 through July 31, 2017, the management fee was computed daily and paid monthly at the following annual rates:
| | | | |
| First $7.5 billion of average daily net assets | | | 0.60% | |
| Next $2.5 billion of average daily net assets | | | 0.53% | |
| Next $10 billion of average daily net assets | | | 0.50% | |
| Next $5 billion of average daily net assets | | | 0.45% | |
| Next $5 billion of average daily net assets | | | 0.42% | |
| Next $5 billion of average daily net assets | | | 0.40% | |
| Next $5 billion of average daily net assets | | | 0.38% | |
| Average daily net assets in excess of $40 billion | | | 0.36% | |
Effective August 1, 2017, the management fee is computed daily and paid monthly at the following annual rates:
| | | | |
| First $7.5 billion of average daily net assets | | | 0.60% | |
| Next $2.5 billion of average daily net assets | | | 0.53% | |
| Next $10 billion of average daily net assets | | | 0.50% | |
| Next $5 billion of average daily net assets | | | 0.45% | |
| Next $5 billion of average daily net assets | | | 0.42% | |
| Next $5 billion of average daily net assets | | | 0.40% | |
| Next $5 billion of average daily net assets | | | 0.38% | |
| Next $5 billion of average daily net assets | | | 0.36% | |
| Average daily net assets in excess of $45 billion | | | 0.35% | |
MFS has also agreed in writing to reduce its management fee by a specified amount if certain MFS mutual fund assets exceed thresholds agreed to by MFS and the fund’s Board of Trustees. For the year ended August 31, 2017, this management fee reduction amounted to $3,167,032, which is included in the reduction of total expenses in the Statement of Operations. The management fee incurred for the year ended August 31, 2017 was equivalent to an annual effective rate of 0.46% of the fund’s average daily net assets.
Distributor – MFS Fund Distributors, Inc. (MFD), a wholly-owned subsidiary of MFS, as distributor, received $1,905,694 and $14,658 for the year ended August 31, 2017, as its portion of the initial sales charge on sales of Class A and Class 529A shares of the fund, respectively.
The Board of Trustees has adopted a distribution plan for certain share classes pursuant to Rule 12b-1 of the Investment Company Act of 1940.
The fund’s distribution plan provides that the fund will pay MFD for services provided by MFD and financial intermediaries in connection with the distribution and servicing of certain share classes. One component of the plan is a distribution fee paid to MFD and another component of the plan is a service fee paid to MFD. MFD may subsequently pay all, or a portion, of the distribution and/or service fees to financial intermediaries.
33
Notes to Financial Statements – continued
Distribution Plan Fee Table:
| | | | | | | | | | | | | | | | | | | | |
| | | Distribution
Fee Rate (d) | | | Service
Fee Rate (d) | | | Total
Distribution
Plan (d) | | | Annual
Effective
Rate (e) | | | Distribution
and Service
Fee | |
| Class A | | | — | | | | 0.25% | | | | 0.25% | | | | 0.25% | | | | $19,078,310 | |
| Class B | | | 0.75% | | | | 0.25% | | | | 1.00% | | | | 1.00% | | | | 1,468,100 | |
| Class C | | | 0.75% | | | | 0.25% | | | | 1.00% | | | | 1.00% | | | | 14,946,170 | |
| Class R1 | | | 0.75% | | | | 0.25% | | | | 1.00% | | | | 1.00% | | | | 272,746 | |
| Class R2 | | | 0.25% | | | | 0.25% | | | | 0.50% | | | | 0.50% | | | | 3,038,950 | |
| Class R3 | | | — | | | | 0.25% | | | | 0.25% | | | | 0.25% | | | | 4,922,108 | |
| Class 529A | | | — | | | | 0.25% | | | | 0.25% | | | | 0.21% | | | | 51,973 | |
| Class 529B | | | 0.75% | | | | 0.25% | | | | 1.00% | | | | 0.62% | | | | 5,716 | |
| Class 529C | | | 0.75% | | | | 0.25% | | | | 1.00% | | | | 0.99% | | | | 58,195 | |
| Total Distribution and Service Fees | | | | | | | | | | | | $43,842,268 | |
| (d) | In accordance with the distribution plan for certain classes, the fund pays distribution and/or service fees equal to these annual percentage rates of each class’s average daily net assets. The distribution and service fee rates disclosed by class represent the current rates in effect at the end of the reporting period. Any rate changes, if applicable, are detailed below. |
| (e) | The annual effective rates represent actual fees incurred under the distribution plan for the year ended August 31, 2017 based on each class’s average daily net assets. MFD has voluntarily agreed to rebate a portion of each class’s 0.25% service fee attributable to accounts for which MFD retains the 0.25% service fee except for accounts attributable to MFS or its affiliates’ seed money. For the year ended August 31, 2017, this rebate amounted to $84,260, $1,059, $2,761, $80, $1,453, $7,474, $74, and $397 for Class A, Class B, Class C, Class R2, Class R3, Class 529A, Class 529B, and Class 529C, respectively, and is included in the reduction of total expenses in the Statement of Operations. For the period September 1, 2016 through February 28, 2017, the 0.75% distribution fee was not imposed for Class 529B shares. |
Certain Class A shares are subject to a contingent deferred sales charge (CDSC) in the event of a shareholder redemption within 18 months of purchase. Class C and Class 529C shares are subject to a CDSC in the event of a shareholder redemption within 12 months of purchase. Class B and Class 529B shares are subject to a CDSC in the event of a shareholder redemption within six years of purchase. All contingent deferred sales charges are paid to MFD and during the year ended August 31, 2017, were as follows:
| | | | |
| | | Amount | |
| Class A | | | $72,624 | |
| Class B | | | 211,592 | |
| Class C | | | 161,541 | |
| Class 529B | | | — | |
| Class 529C | | | 83 | |
The fund has entered into and may from time to time enter into contracts with program managers and other parties which administer the tuition programs through which an investment in the fund’s 529 share classes is made. The fund has entered into an agreement with MFD pursuant to which MFD receives an annual fee of up to 0.10% of the average daily net assets attributable to each 529 share class. MFD has agreed to waive a portion of this fee in an amount equal to 0.05% of the average daily net assets
34
Notes to Financial Statements – continued
for each 529 share class. This waiver agreement will expire on December 31, 2018, unless MFD elects to extend the waiver. For the year ended August 31, 2017, this waiver amounted to $13,757 and is included in the reduction of total expenses in the Statement of Operations. The program manager fee incurred for the year ended August 31, 2017 was equivalent to an annual effective rate of 0.05% of the average daily net assets attributable to each 529 share class. The services provided by MFD, or a third party with which MFD contracts, include recordkeeping and tax reporting and account services, as well as services designed to maintain the program’s compliance with the Internal Revenue Code and other regulatory requirements. Program manager fees and waivers for the year ended August 31, 2017, were as follows:
| | | | | | | | |
| | | Fee | | | Waiver | |
| Class 529A | | | $20,789 | | | | $10,395 | |
| Class 529B | | | 904 | | | | 452 | |
| Class 529C | | | 5,820 | | | | 2,910 | |
| Total Program Manager Fees and Waivers | | | $27,513 | | | | $13,757 | |
Shareholder Servicing Agent – MFS Service Center, Inc. (MFSC), a wholly-owned subsidiary of MFS, receives a fee from the fund for its services as shareholder servicing agent calculated as a percentage of the average daily net assets of the fund as determined periodically under the supervision of the fund’s Board of Trustees. For the year ended August 31, 2017, the fee was $1,793,541, which equated to 0.0043% annually of the fund’s average daily net assets. MFSC also receives payment from the fund for out-of-pocket expenses, sub-accounting and other shareholder servicing costs which may be paid to affiliated and unaffiliated service providers. Class R6 shares do not incur sub-accounting fees. For the year ended August 31, 2017, these out-of-pocket expenses, sub-accounting and other shareholder servicing costs amounted to $36,433,117.
Administrator – MFS provides certain financial, legal, shareholder communications, compliance, and other administrative services to the fund. Under an administrative services agreement, the fund reimburses MFS the costs incurred to provide these services. The fund is charged an annual fixed amount of $17,500 plus a fee based on average daily net assets. The administrative services fee incurred for the year ended August 31, 2017 was equivalent to an annual effective rate of 0.0015% of the fund’s average daily net assets.
Trustees’ and Officers’ Compensation – The fund pays compensation to independent Trustees in the form of a retainer, attendance fees, and additional compensation to Board and Committee chairpersons. The fund does not pay compensation directly to Trustees or officers of the fund who are also officers of the investment adviser, all of whom receive remuneration for their services to the fund from MFS. Certain officers and Trustees of the fund are officers or directors of MFS, MFD, and MFSC.
Prior to December 31, 2001, the fund had an unfunded defined benefit plan (“DB plan”) for independent Trustees. As of December 31, 2001, the Board took action to terminate the DB plan with respect to then-current and any future independent Trustees, such that the DB plan covers only certain of those former independent Trustees who retired on or before December 31, 2001. The DB plan resulted in a
35
Notes to Financial Statements – continued
pension expense of $560 and is included in “Independent Trustees’ compensation” in the Statement of Operations for the year ended August 31, 2017. The liability for deferred retirement benefits payable to certain independent Trustees under the DB plan amounted to $1,861 at August 31, 2017, and is included in “Payable for independent Trustees’ compensation” in the Statement of Assets and Liabilities.
Other – This fund and certain other funds managed by MFS (the funds) have entered into a service agreement (the ISO Agreement) which provides for payment of fees solely by the funds to Tarantino LLC in return for the provision of services of an Independent Senior Officer (ISO) for the funds. Frank L. Tarantino serves as the ISO and is an officer of the funds and the sole member of Tarantino LLC. The funds can terminate the ISO Agreement with Tarantino LLC at any time under the terms of the ISO Agreement. For the year ended August 31, 2017, the fee paid by the fund under this agreement was $76,905 and is included in “Miscellaneous” expense in the Statement of Operations. MFS has agreed to bear all expenses associated with office space, other administrative support, and supplies provided to the ISO.
The fund invests in the MFS Institutional Money Market Portfolio which is managed by MFS and seeks current income consistent with preservation of capital and liquidity. This money market fund does not pay a management fee to MFS.
On September 9, 2015, MFS redeemed 26 shares of Class R6 for an aggregate amount of $856. On March 16, 2016, MFS redeemed 40,429 shares of Class I for an aggregate amount of $1,341,422. On March 16, 2017, MFS purchased 48,783 shares of Class I for an aggregate amount of $1,882,554.
The fund is permitted to engage in purchase and sale transactions with funds and accounts for which MFS serves as investment adviser or sub-adviser (“cross-trades”) pursuant to a policy adopted by the Board of Trustees. This policy has been designed to ensure that cross-trades conducted by the fund comply with Rule 17a-7 under the Investment Company Act of 1940. Under this policy, cross-trades are effected at current market prices with no remuneration paid in connection with the transaction. During the year ended August 31, 2017, the fund engaged in purchase and sale transactions pursuant to this policy, which amounted to $38,581,671 and $25,403,259, respectively. The sales transactions resulted in net realized gains (losses) of $2,221,304.
(4) Portfolio Securities
For the year ended August 31, 2017, purchases and sales of investments, other than short-term obligations, aggregated $6,244,375,024 and $5,787,662,720, respectively.
36
Notes to Financial Statements – continued
(5) Shares of Beneficial Interest
The fund’s Declaration of Trust permits the Trustees to issue an unlimited number of full and fractional shares of beneficial interest. Transactions in fund shares were as follows:
| | | | | | | | | | | | | | | | |
| | | Year ended
8/31/17 | | | Year ended
8/31/16 | |
| | | Shares | | | Amount | | | Shares | | | Amount | |
| Shares sold | | | | | | | | | | | | | | | | |
Class A | | | 43,230,719 | | | | $1,600,357,205 | | | | 56,768,963 | | | | $1,904,117,260 | |
Class B | | | 409,602 | | | | 15,035,351 | | | | 519,166 | | | | 17,360,213 | |
Class C | | | 5,986,930 | | | | 219,687,272 | | | | 8,152,513 | | | | 270,588,495 | |
Class I | | | 243,305,782 | | | | 9,165,915,403 | | | | 145,431,576 | | | | 4,938,317,915 | |
Class R1 | | | 262,817 | | | | 9,532,638 | | | | 163,031 | | | | 5,375,906 | |
Class R2 | | | 4,092,565 | | | | 148,873,968 | | | | 3,849,909 | | | | 128,332,720 | |
Class R3 | | | 14,808,851 | | | | 547,458,754 | | | | 18,949,088 | | | | 639,478,504 | |
Class R4 | | | 17,657,031 | | | | 656,925,761 | | | | 27,256,586 | | | | 905,372,336 | |
Class R6 | | | 147,390,698 | | | | 5,624,934,683 | | | | 57,025,963 | | | | 1,914,833,944 | |
Class 529A | | | 108,068 | | | | 3,966,237 | | | | 94,052 | | | | 3,127,505 | |
Class 529B | | | 4,785 | | | | 171,069 | | | | 4,894 | | | | 156,788 | |
Class 529C | | | 29,769 | | | | 1,075,087 | | | | 43,845 | | | | 1,439,715 | |
| | | 477,287,617 | | | | $17,993,933,428 | | | | 318,259,586 | | | | $10,728,501,301 | |
| | | | |
| Shares issued to shareholders in reinvestment of distributions | | | | | | | | | | | | | | | | |
Class A | | | 6,766,520 | | | | $248,454,218 | | | | 12,787,124 | | | | $421,657,414 | |
Class B | | | 99,277 | | | | 3,632,741 | | | | 193,930 | | | | 6,372,721 | |
Class C | | | 799,377 | | | | 29,063,578 | | | | 1,327,523 | | | | 43,374,651 | |
Class I | | | 13,652,416 | | | | 506,718,218 | | | | 17,177,750 | | | | 569,272,041 | |
Class R1 | | | 19,510 | | | | 705,037 | | | | 37,672 | | | | 1,222,399 | |
Class R2 | | | 487,452 | | | | 17,778,534 | | | | 779,535 | | | | 25,481,542 | |
Class R3 | | | 1,796,755 | | | | 65,965,080 | | | | 2,693,294 | | | | 88,531,682 | |
Class R4 | | | 3,045,418 | | | | 112,104,718 | | | | 4,591,727 | | | | 151,372,851 | |
Class R6 | | | 6,150,032 | | | | 226,909,284 | | | | 7,489,730 | | | | 246,831,433 | |
Class 529A | | | 18,752 | | | | 686,051 | | | | 27,903 | | | | 913,451 | |
Class 529B | | | 761 | | | | 27,448 | | | | 1,246 | | | | 40,425 | |
Class 529C | | | 4,251 | | | | 152,951 | | | | 6,711 | | | | 216,941 | |
| | | 32,840,521 | | | | $1,212,197,858 | | | | 47,114,145 | | | | $1,555,287,551 | |
37
Notes to Financial Statements – continued
| | | | | | | | | | | | | | | | |
| | | Year ended
8/31/17 | | | Year ended
8/31/16 | |
| | | Shares | | | Amount | | | Shares | | | Amount | |
| Shares reacquired | | | | | | | | | | | | | | | | |
Class A | | | (138,738,962 | ) | | | $(5,168,833,039 | ) | | | (72,124,211 | ) | | | $(2,423,599,803 | ) |
Class B | | | (1,297,053 | ) | | | (47,974,161 | ) | | | (1,027,622 | ) | | | (34,444,392 | ) |
Class C | | | (14,041,805 | ) | | | (519,939,313 | ) | | | (6,623,806 | ) | | | (220,702,727 | ) |
Class I | | | (230,780,835 | ) | | | (8,789,683,191 | ) | | | (102,196,743 | ) | | | (3,464,029,826 | ) |
Class R1 | | | (353,521 | ) | | | (12,867,968 | ) | | | (282,106 | ) | | | (9,326,974 | ) |
Class R2 | | | (4,624,581 | ) | | | (170,766,207 | ) | | | (4,445,949 | ) | | | (148,071,701 | ) |
Class R3 | | | (17,523,982 | ) | | | (647,496,527 | ) | | | (15,692,059 | ) | | | (518,179,133 | ) |
Class R4 | | | (32,186,529 | ) | | | (1,198,570,080 | ) | | | (25,344,379 | ) | | | (855,036,285 | ) |
Class R6 | | | (45,654,925 | ) | | | (1,690,587,513 | ) | | | (36,595,792 | ) | | | (1,223,113,334 | ) |
Class 529A | | | (67,724 | ) | | | (2,512,154 | ) | | | (98,814 | ) | | | (3,186,555 | ) |
Class 529B | | | (8,463 | ) | | | (303,930 | ) | | | (6,559 | ) | | | (219,387 | ) |
Class 529C | | | (31,658 | ) | | | (1,160,458 | ) | | | (33,065 | ) | | | (1,094,866 | ) |
| | | (485,310,038 | ) | | | $(18,250,694,541 | ) | | | (264,471,105 | ) | | | $(8,901,004,983 | ) |
| | | | |
| Net change | | | | | | | | | | | | | | | | |
Class A | | | (88,741,723 | ) | | | $(3,320,021,616 | ) | | | (2,568,124 | ) | | | $(97,825,129 | ) |
Class B | | | (788,174 | ) | | | (29,306,069 | ) | | | (314,526 | ) | | | (10,711,458 | ) |
Class C | | | (7,255,498 | ) | | | (271,188,463 | ) | | | 2,856,230 | | | | 93,260,419 | |
Class I | | | 26,177,363 | | | | 882,950,430 | | | | 60,412,583 | | | | 2,043,560,130 | |
Class R1 | | | (71,194 | ) | | | (2,630,293 | ) | | | (81,403 | ) | | | (2,728,669 | ) |
Class R2 | | | (44,564 | ) | | | (4,113,705 | ) | | | 183,495 | | | | 5,742,561 | |
Class R3 | | | (918,376 | ) | | | (34,072,693 | ) | | | 5,950,323 | | | | 209,831,053 | |
Class R4 | | | (11,484,080 | ) | | | (429,539,601 | ) | | | 6,503,934 | | | | 201,708,902 | |
Class R6 | | | 107,885,805 | | | | 4,161,256,454 | | | | 27,919,901 | | | | 938,552,043 | |
Class 529A | | | 59,096 | | | | 2,140,134 | | | | 23,141 | | | | 854,401 | |
Class 529B | | | (2,917 | ) | | | (105,413 | ) | | | (419 | ) | | | (22,174 | ) |
Class 529C | | | 2,362 | | | | 67,580 | | | | 17,491 | | | | 561,790 | |
| | | 24,818,100 | | | | $955,436,745 | | | | 100,902,626 | | | | $3,382,783,869 | |
The fund is one of several mutual funds in which certain MFS funds may invest. The MFS funds do not invest in the underlying funds for the purpose of exercising management or control. At the end of the period, the MFS Growth Allocation Fund and the MFS Moderate Allocation Fund were each the owners of record of approximately 1% of the value of outstanding voting shares of the fund. In addition, the MFS Aggressive Growth Allocation Fund, the MFS Conservative Allocation Fund, the MFS Lifetime Income Fund, the MFS Lifetime 2020 Fund, the MFS Lifetime 2025 Fund, the MFS Lifetime 2030 Fund, the MFS Lifetime 2035 Fund, the MFS Lifetime 2040 Fund, the MFS Lifetime 2045 Fund, the MFS Lifetime 2050 Fund, the MFS Lifetime 2055 Fund, the MFS Lifetime 2060 Fund, and the MFS Managed Wealth Fund were each the owners of record of less than 1% of the value of outstanding voting shares of the fund.
38
Notes to Financial Statements – continued
(6) Line of Credit
The fund and certain other funds managed by MFS participate in a $1.25 billion unsecured committed line of credit, subject to a $1 billion sublimit, provided by a syndication of banks under a credit agreement. Borrowings may be made for temporary financing needs. Interest is charged to each fund, based on its borrowings, generally at a rate equal to the higher of the Overnight Federal Reserve funds rate or daily one month LIBOR plus an agreed upon spread. A commitment fee, based on the average daily, unused portion of the committed line of credit, is allocated among the participating funds at the end of each calendar quarter. In addition, the fund and other funds managed by MFS have established unsecured uncommitted borrowing arrangements with certain banks for temporary financing needs. Interest is charged to each fund, based on its borrowings, at a rate equal to the Overnight Federal Reserve funds rate plus an agreed upon spread. For the year ended August 31, 2017, the fund’s commitment fee and interest expense were $291,617 and $0, respectively, and are included in “Miscellaneous” expense in the Statement of Operations.
(7) Investments in Affiliated Issuers
An affiliated issuer may be considered one in which the fund owns 5% or more of the outstanding voting securities, or a company which is under common control. For the purposes of this report, the fund assumes the following to be an affiliated issuer:
| | | | | | | | | | | | | | | | | | | | |
| Affiliated Issuer | | | | | Beginning
Shares/Par
Amount | | | Acquisitions
Shares/Par
Amount | | | Dispositions
Shares/Par
Amount | | | Ending
Shares/Par
Amount | |
| MFS Institutional Money Market Portfolio | | | | | | | 640,928,994 | | | | 5,156,644,013 | | | | (4,889,302,119 | ) | | | 908,270,888 | |
| | | | | |
| Affiliated Issuer | | Realized
Gain (Loss) | | | Change in
Unrealized
Appreciation
(Depreciation) | | | Capital Gain
Distributions | | | Dividend
Income | | | Ending
Value | |
| MFS Institutional Money Market Portfolio | | | $(41,834 | ) | | | $22,580 | | | | $— | | | | $3,203,286 | | | | $908,270,888 | |
(8) Redemptions In-Kind
On September 23, 2016, the fund recorded redemption proceeds for a redemption in-kind of portfolio securities and cash that were valued at $279,982,234. The redeeming shareholder generally receives a pro rata share of the securities held by the fund. The distribution of such securities generated a realized gain of $132,187,116 for the fund.
39
REPORT OF INDEPENDENT REGISTERED PUBLIC ACCOUNTING FIRM
To the Board of Trustees of MFS Series Trust I and Shareholders of MFS Value Fund:
We have audited the accompanying statement of assets and liabilities, including the portfolio of investments, of MFS Value Fund (the Fund) (one of the series constituting the MFS Series Trust I) as of August 31, 2017, and the related statement of operations for the year then ended, the statements of changes in net assets for each of the two years in the period then ended and the financial highlights for each of the five years in the period then ended. These financial statements and financial highlights are the responsibility of the Fund’s management. Our responsibility is to express an opinion on these financial statements and financial highlights based on our audits.
We conducted our audits in accordance with the standards of the Public Company Accounting Oversight Board (United States). Those standards require that we plan and perform the audit to obtain reasonable assurance about whether the financial statements and financial highlights are free of material misstatement. We were not engaged to perform an audit of the Fund’s internal control over financial reporting. Our audits included consideration of internal control over financial reporting as a basis for designing audit procedures that are appropriate in the circumstances, but not for the purpose of expressing an opinion on the effectiveness of the Fund’s internal control over financial reporting. Accordingly, we express no such opinion. An audit also includes examining, on a test basis, evidence supporting the amounts and disclosures in the financial statements and financial highlights, assessing the accounting principles used and significant estimates made by management, and evaluating the overall financial statement presentation. Our procedures included confirmation of securities owned as of August 31, 2017, by correspondence with the custodian and others or by other appropriate auditing procedures where replies from others were not received. We believe that our audits provide a reasonable basis for our opinion.
In our opinion, the financial statements and financial highlights referred to above present fairly, in all material respects, the financial position of MFS Value Fund (one of the series constituting the MFS Series Trust I) at August 31, 2017, the results of its operations for the year then ended, the changes in its net assets for each of the two years in the period then ended and the financial highlights for each of the five years in the period then ended, in conformity with U.S. generally accepted accounting principles.

Boston, Massachusetts
October 17, 2017
40
RESULTS OF SHAREHOLDER MEETING
(unaudited)
At a special meeting of shareholders of MFS Series Trust I, which was held on March 23, 2017, the following action was taken:
Item 1: To elect the following individuals as Trustees:
| | | | | | | | |
| | | Number of Dollars | |
Nominee | | For | | | Withheld Authority | |
| Steven E. Buller | | | 40,448,016,134.453 | | | | 372,137,248.376 | |
| John A. Caroselli | | | 40,455,058,441.389 | | | | 365,094,941.560 | |
| Maureen R. Goldfarb | | | 40,458,621,672.449 | | | | 361,531,746.940 | |
| David H. Gunning | | | 40,369,558,961.219 | | | | 450,594,312.051 | |
| Michael Hegarty | | | 40,379,783,468.714 | | | | 440,369,950.676 | |
| John P. Kavanaugh | | | 40,453,732,784.104 | | | | 366,420,708.405 | |
| Robert J. Manning | | | 40,424,010,964.586 | | | | 396,142,308.684 | |
| Clarence Otis, Jr. | | | 40,441,919,324.712 | | | | 378,234,043.007 | |
| Maryanne L. Roepke | | | 40,471,040,575.143 | | | | 349,112,917.026 | |
| Robin A. Stelmach | | | 40,459,908,730.475 | | | | 360,244,615.574 | |
| Laurie J. Thomsen | | | 40,426,270,790.416 | | | | 393,882,628.973 | |
41
TRUSTEES AND OFFICERS — IDENTIFICATION AND BACKGROUND
The Trustees and Officers of the Trust, as of October 1, 2017, are listed below, together with their principal occupations during the past five years. (Their titles may have varied during that period.) The address of each Trustee and Officer is 111 Huntington Avenue, Boston, Massachusetts 02199-7618.
| | | | | | | | | | |
Name, Age | | Position(s)
Held with Fund | | Trustee/Officer Since (h) | | Number of
MFS Funds
overseen
by the
Trustee | | Principal
Occupations During the Past Five Years | | Other Directorships
During the Past
Five Years (j) |
| INTERESTED TRUSTEES |
Robert J. Manning (k)
(age 53) | | Trustee | | February 2004 | | 136 | | Massachusetts Financial Services Company, Executive Chairman (since January 2017); Director; Chairman of the Board; Chief Executive Officer (until 2015); Co-Chief Executive Officer (2015-2016) | | N/A |
Robin A. Stelmach (k) (age 56) | | Trustee | | January 2014 | | 136 | | Massachusetts Financial Services Company, Vice Chair (since January 2017); Chief Operating Officer and Executive Vice President (until January 2017) | | N/A |
| INDEPENDENT TRUSTEES |
David H. Gunning
(age 75) | | Trustee and Chair of Trustees | | January 2004 | | 136 | | Private investor | | Lincoln Electric Holdings, Inc., Director; Development Alternatives, Inc., Director/Non-Executive Chairman (until 2013) |
42
Trustees and Officers – continued
| | | | | | | | | | |
Name, Age | | Position(s)
Held with Fund | | Trustee/Officer Since (h) | | Number of
MFS Funds
overseen
by the
Trustee | | Principal
Occupations During the Past Five Years | | Other Directorships
During the Past
Five Years (j) |
Steven E. Buller
(age 66) | | Trustee | | February 2014 | | 136 | | Financial Accounting Standards Advisory Council, Chairman (2014-2015); Public Company Accounting Oversight Board, Standing Advisory Group, Member (until 2014); BlackRock, Inc. (investment management), Managing Director (until 2014), BlackRock Finco UK (investment management), Director (until 2014) | | N/A |
John A. Caroselli
(age 63) | | Trustee | | March 2017 | | 136 | | JC Global Advisors, LLC (management consulting), President (since 2015); First Capital Corporation (commercial finance), Executive Vice President (until 2015) | | N/A |
Maureen R. Goldfarb
(age 62) | | Trustee | | January 2009 | | 136 | | Private investor | | N/A |
Michael Hegarty
(age 72) | | Trustee | | December 2004 | | 136 | | Private investor | | Rouse Properties Inc., Director (until 2016); Capmark Financial Group Inc., Director (until 2015) |
John P. Kavanaugh
(age 62) | | Trustee and Vice Chair of Trustees | | January 2009 | | 136 | | Private investor | | N/A |
Clarence Otis, Jr.
(age 61) | | Trustee | | March 2017 | | 136 | | Darden Restaurants, Inc., Chief Executive Officer (until 2014) | | VF Corporation, Director; Verizon Communications, Inc., Director; The Travelers Companies, Director; Federal Reserve Bank of Atlanta, Director (until 2015) |
43
Trustees and Officers – continued
| | | | | | | | | | |
Name, Age | | Position(s)
Held with Fund | | Trustee/Officer Since (h) | | Number of
MFS Funds
overseen
by the
Trustee | | Principal
Occupations During the Past Five Years | | Other Directorships
During the Past
Five Years (j) |
Maryanne L. Roepke
(age 61) | | Trustee | | May 2014 | | 136 | | American Century Investments (investment management), Senior Vice President and Chief Compliance Officer (until 2014) | | N/A |
Laurie J. Thomsen
(age 60) | | Trustee | | March 2005 | | 136 | | Private investor | | The Travelers Companies, Director; Dycom Industries, Inc., Director (since 2015) |
| | | | | | | | |
Name, Age | | Position(s) Held with Fund | | Trustee/Officer
Since (h) | | Number of
MFS Funds
for which
the Person
is an Officer | | Principal
Occupations During the Past Five Years |
| OFFICERS | | | | | | | | |
Christopher R. Bohane (k)
(age 43) | | Assistant Secretary and Assistant Clerk | | July 2005 | | 136 | | Massachusetts Financial Services Company, Vice President and Assistant General Counsel |
Kino Clark (k)
(age 49) | | Assistant Treasurer | | January 2012 | | 136 | | Massachusetts Financial Services Company, Vice President |
John W. Clark, Jr. (k)
(age 50) | | Assistant Treasurer | | April 2017 | | 136 | | Massachusetts Financial Services Company, Vice President (since March 2017); Deutsche Bank (financial services), Department Head – Treasurer’s Office (until February 2017) |
Thomas H. Connors (k)
(age 58) | | Assistant Secretary and Assistant Clerk | | September 2012 | | 136 | | Massachusetts Financial Services Company, Vice President and Senior Counsel; Deutsche Investment Management Americas Inc. (financial service provider), Director and Senior Counsel (until 2012) |
44
Trustees and Officers – continued
| | | | | | | | |
Name, Age | | Position(s) Held with Fund | | Trustee/Officer
Since (h) | | Number of
MFS Funds
for which
the Person
is an Officer | | Principal
Occupations During the Past Five Years |
Ethan D. Corey (k)
(age 53) | | Assistant Secretary and Assistant Clerk | | July 2005 | | 136 | | Massachusetts Financial Services Company, Senior Vice President and Associate General Counsel |
David L. DiLorenzo (k)
(age 49) | | President | | July 2005 | | 136 | | Massachusetts Financial Services Company, Senior Vice President |
Heidi W. Hardin (k)
(age 50) | | Secretary and Clerk | | April 2017 | | 136 | | Massachusetts Financial Services Company, Executive Vice President and General Counsel (since March 2017); Harris Associates (investment management), General Counsel (from September 2015 to January 2017); Janus Capital Management LLC (investment management), Senior Vice President and General Counsel (until September 2015) |
Brian E. Langenfeld (k) (age 44) | | Assistant Secretary and Assistant Clerk | | June 2006 | | 136 | | Massachusetts Financial Services Company, Vice President and Senior Counsel |
Susan A. Pereira (k)
(age 46) | | Assistant Secretary and Assistant Clerk | | July 2005 | | 136 | | Massachusetts Financial Services Company, Vice President and Senior Counsel |
Kasey L. Phillips (k)
(age 46) | | Assistant Treasurer | | September 2012 | | 136 | | Massachusetts Financial Services Company, Vice President; Wells Fargo Funds Management, LLC, Senior Vice President, Fund Treasurer (until 2012) |
Matthew A. Stowe (k)
(age 42) | | Assistant Secretary and Assistant Clerk | | October 2014 | | 136 | | Massachusetts Financial Services Company, Vice President and Assistant General Counsel |
Frank L. Tarantino
(age 73) | | Independent Senior Officer | | June 2004 | | 136 | | Tarantino LLC (provider of compliance services), Principal |
Richard S. Weitzel (k)
(age 47) | | Assistant Secretary and Assistant Clerk | | October 2007 | | 136 | | Massachusetts Financial Services Company, Senior Vice President and Associate General Counsel |
45
Trustees and Officers – continued
| | | | | | | | |
Name, Age | | Position(s) Held with Fund | | Trustee/Officer
Since (h) | | Number of
MFS Funds
for which
the Person
is an Officer | | Principal
Occupations During the Past Five Years |
Martin J. Wolin (k)
(age 50) | | Chief Compliance Officer | | July 2015 | | 136 | | Massachusetts Financial Services Company, Senior Vice President and Chief Compliance Officer (since July 2015); Mercer (financial service provider), Chief Risk and Compliance Officer, North America and Latin America (until June 2015) |
James O. Yost (k)
(age 57) | | Treasurer | | September 1990 | | 136 | | Massachusetts Financial Services Company, Senior Vice President |
| (h) | Date first appointed to serve as Trustee/officer of an MFS Fund. Each Trustee has served continuously since appointment unless indicated otherwise. For the period from December 15, 2004 until February 22, 2005, Mr. Manning served as Advisory Trustee. Prior to January 2012, Messrs. DiLorenzo and Yost served as Assistant Treasurers of the Funds. From January 2012 through December 2016, Messrs. DiLorenzo and Yost served as Treasurer and Deputy Treasurer of the Funds, respectively. |
| (j) | Directorships or trusteeships of companies required to report to the Securities and Exchange Commission (i.e., “public companies”). |
| (k) | “Interested person” of the Trust within the meaning of the Investment Company Act of 1940 (referred to as the 1940 Act), which is the principal federal law governing investment companies like the fund, as a result of a position with MFS. The address of MFS is 111 Huntington Avenue, Boston, Massachusetts 02199-7618. |
Each Trustee has been elected by shareholders and each Trustee and officer holds office until his or her successor is chosen and qualified or until his or her earlier death, resignation, retirement or removal. The Trust does not hold annual meetings for the purpose of electing Trustees, and Trustees are not elected for fixed terms. Under the terms of the Board’s retirement policy, an Independent Trustee shall retire at the end of the calendar year in which he or she reaches the earlier of 75 years of age or 15 years of service on the Board (or, in the case of any Independent Trustee who joined the Board prior to 2015, 20 years of service on the Board).
Messrs. Buller, Kavanaugh and Otis and Ms. Roepke are members of the Trust’s Audit Committee.
Each of the Interested Trustees and certain Officers hold comparable officer positions with certain affiliates of MFS.
46
Trustees and Officers – continued
The Statement of Additional Information for a Fund includes further information about the Trustees and is available without charge upon request by calling 1-800-225-2606.
| | |
| Investment Adviser | | Custodian |
Massachusetts Financial Services Company
111 Huntington Avenue
Boston, MA 02199-7618 | | State Street Bank and Trust Company 1 Lincoln Street
Boston, MA 02111-2900 |
| Distributor | | Independent Registered Public Accounting Firm |
MFS Fund Distributors, Inc.
111 Huntington Avenue
Boston, MA 02199-7618 | | Ernst & Young LLP 200 Claredon Street
Boston, MA 02116 |
| Portfolio Manager(s) | | |
Nevin Chitkara | | |
Steven Gorham | | |
47
BOARD REVIEW OF INVESTMENT ADVISORY AGREEMENT
The Investment Company Act of 1940 requires that both the full Board of Trustees and a majority of the non-interested (“independent”) Trustees, voting separately, annually approve the continuation of the Fund’s investment advisory agreement with MFS. The Trustees consider matters bearing on the Fund and its advisory arrangements at their meetings throughout the year, including a review of performance data at each regular meeting. In addition, the independent Trustees met several times over the course of three months beginning in May and ending in July, 2017 (“contract review meetings”) for the specific purpose of considering whether to approve the continuation of the investment advisory agreement for the Fund and the other investment companies that the Board oversees (the “MFS Funds”). The independent Trustees were assisted in their evaluation of the Fund’s investment advisory agreement by independent legal counsel, from whom they received separate legal advice and with whom they met separately from MFS during various contract review meetings. The independent Trustees were also assisted in this process by the MFS Funds’ Independent Senior Officer, a senior officer appointed by and reporting to the independent Trustees.
In connection with their deliberations regarding the continuation of the investment advisory agreement, the Trustees, including the independent Trustees, considered such information and factors as they believed, in light of the legal advice furnished to them and their own business judgment, to be relevant. The investment advisory agreement for the Fund was considered separately, although the Trustees also took into account the common interests of all MFS Funds in their review. As described below, the Trustees considered the nature, quality, and extent of the various investment advisory, administrative, and shareholder services performed by MFS under the existing investment advisory agreement and other arrangements with the Fund.
In connection with their contract review meetings, the Trustees received and relied upon materials that included, among other items: (i) information provided by Broadridge Financial Solutions, Inc. (“Broadridge”), an independent third party, on the investment performance of the Fund for various time periods ended December 31, 2016 and the investment performance of a group of funds with substantially similar investment classifications/objectives (the “Lipper performance universe”), (ii) information provided by Broadridge on the Fund’s advisory fees and other expenses and the advisory fees and other expenses of comparable funds identified by Broadridge (the “Broadridge expense group”), (iii) information provided by MFS on the advisory fees of portfolios of other clients of MFS, including institutional separate accounts and other clients, (iv) information as to whether and to what extent applicable expense waivers, reimbursements or fee “breakpoints” are observed for the Fund, (v) information regarding MFS’ financial results and financial condition, including MFS’ and certain of its affiliates’ estimated profitability from services performed for the Fund and the MFS Funds as a whole, and compared to MFS’ institutional business, (vi) MFS’ views regarding the outlook for the mutual fund industry and the strategic business plans of MFS, (vii) descriptions of various functions performed by MFS for the Funds, such as compliance monitoring and portfolio trading practices, and (viii) information regarding the overall organization of MFS, including information about MFS’ senior management and other personnel providing investment advisory,
48
Board Review of Investment Advisory Agreement – continued
administrative and other services to the Fund and the other MFS Funds. The comparative performance, fee and expense information prepared and provided by Broadridge was not independently verified and the independent Trustees did not independently verify any information provided to them by MFS.
The Trustees’ conclusion as to the continuation of the investment advisory agreement was based on a comprehensive consideration of all information provided to the Trustees and not the result of any single factor. Some of the factors that figured particularly in the Trustees’ deliberations are described below, although individual Trustees may have evaluated the information presented differently from one another, giving different weights to various factors. It is also important to recognize that the fee arrangements for the Fund and other MFS Funds are the result of years of review and discussion between the independent Trustees and MFS, that certain aspects of such arrangements may receive greater scrutiny in some years than in others, and that the Trustees’ conclusions may be based, in part, on their consideration of these same arrangements during the course of the year and in prior years.
Based on information provided by Broadridge and MFS, the Trustees reviewed the Fund’s total return investment performance as well as the performance of peer groups of funds over various time periods. The Trustees placed particular emphasis on the total return performance of the Fund’s Class A shares in comparison to the performance of funds in its Lipper performance universe over the three-year period ended December 31, 2016, which the Trustees believed was a long enough period to reflect differing market conditions. The total return performance of the Fund’s Class A shares was in the 2nd quintile relative to the other funds in the universe for this three-year period (the 1st quintile being the best performers and the 5th quintile being the worst performers). The total return performance of the Fund’s Class A shares was in the 3rd quintile for the one-year period and the 2nd quintile for the five-year period ended December 31, 2016 relative to the Lipper performance universe. Because of the passage of time, these performance results may differ from the performance results for more recent periods, including those shown elsewhere in this report.
In the course of their deliberations, the Trustees took into account information provided by MFS in connection with the contract review meetings, as well as during investment review meetings conducted with portfolio management personnel during the course of the year regarding the Fund’s performance. After reviewing these and related factors, the Trustees concluded, within the context of their overall conclusions regarding the investment advisory agreement, that they were satisfied with MFS’ responses and efforts relating to investment performance.
In assessing the reasonableness of the Fund’s advisory fee, the Trustees considered, among other information, the Fund’s advisory fee and the total expense ratio of the Fund’s Class A shares as a percentage of average daily net assets and the advisory fee and total expense ratios of peer groups of funds based on information provided by Broadridge. The Trustees considered that, according to the data provided by Broadridge (which takes into account any fee reductions or expense limitations that were in effect during the Fund’s last fiscal year), the Fund’s effective advisory fee rate was approximately at the Broadridge expense group median and the Fund’s total expense ratio was lower than the Broadridge expense group median.
49
Board Review of Investment Advisory Agreement – continued
The Trustees also considered the advisory fees charged by MFS to any institutional separate accounts advised by MFS (“separate accounts”) and unaffiliated investment companies for which MFS serves as subadviser (“subadvised funds”) that have comparable investment strategies to the Fund, if any. In comparing these fees, the Trustees considered information provided by MFS as to the generally broader scope of services provided by MFS to the Fund, as well as the more extensive regulatory burdens imposed on MFS in managing the Fund, in comparison to separate accounts and subadvised funds. The Trustees also considered the higher demands placed on MFS’ investment personnel and trading infrastructure as a result of the daily cash in-flows and out-flows of the Fund in comparison to separate accounts.
The Trustees also considered whether the Fund may benefit from any economies of scale in the management of the Fund in the event of growth in assets of the Fund and/or growth in assets of the MFS Funds as a whole. They noted that the Fund’s advisory fee rate schedule is subject to contractual breakpoints that reduce the Fund’s advisory fee rate on average daily net assets over $7.5 billion, $10 billion, $20 billion, $25 billion, $30 billion, $35 billion and $40 billion. They also noted that MFS has agreed to implement an additional contractual breakpoint that reduces its advisory fee rate on the Fund’s average daily net assets over $45 billion effective August 1, 2017. The Trustees also noted that MFS has agreed in writing to waive a portion of the management fees of certain MFS Funds, including the Fund, if the total combined assets of certain funds within the MFS Funds’ complex increase above agreed upon thresholds (the “group fee waiver”), enabling the Fund’s shareholders to share in the benefits from any economies of scale at the complex level. The group fee waiver is reviewed and renewed annually between the Board and MFS. The Trustees concluded that the breakpoints and the group fee waiver were sufficient to allow the Fund to benefit from economies of scale as its assets and overall complex assets grow.
The Trustees also considered information prepared by MFS relating to MFS’ costs and profits with respect to the Fund, the MFS Funds considered as a group, and other investment companies and accounts advised by MFS, as well as MFS’ methodologies used to determine and allocate its costs to the MFS Funds, the Fund and other accounts and products for purposes of estimating profitability.
After reviewing these and other factors described herein, the Trustees concluded, within the context of their overall conclusions regarding the investment advisory agreement, that the advisory fees charged to the Fund represent reasonable compensation in light of the services being provided by MFS to the Fund.
In addition, the Trustees considered MFS’ resources and related efforts to continue to retain, attract and motivate capable personnel to serve the Fund. The Trustees also considered current and developing conditions in the financial services industry, including the presence of large and well-capitalized companies which are spending, and appear to be prepared to continue to spend, substantial sums to engage personnel and to provide services to competing investment companies. In this regard, the Trustees also considered the financial resources of MFS and its ultimate parent, Sun Life Financial Inc. The Trustees also considered the advantages and possible disadvantages to the Fund of having an adviser that also serves other investment companies as well as other accounts.
50
Board Review of Investment Advisory Agreement – continued
The Trustees also considered the nature, quality, cost, and extent of administrative, transfer agency, and distribution services provided to the Fund by MFS and its affiliates under agreements and plans other than the investment advisory agreement, including any 12b-1 fees the Fund pays to MFS Fund Distributors, Inc., an affiliate of MFS. The Trustees also considered the nature, extent and quality of certain other services MFS performs or arranges for on the Fund’s behalf, which may include securities lending programs, directed expense payment programs, class action recovery programs, and MFS’ interaction with third-party service providers, principally custodians and sub-custodians. The Trustees concluded that the various non-advisory services provided by MFS and its affiliates on behalf of the Fund were satisfactory.
The Trustees also considered benefits to MFS from the use of the Fund’s portfolio brokerage commissions, if applicable, to pay for investment research and various other factors. Additionally, the Trustees considered so-called “fall-out benefits” to MFS such as reputational value derived from serving as investment manager to the Fund.
Based on their evaluation of factors that they deemed to be material, including those factors described above, the Board of Trustees, including the independent Trustees, concluded that the Fund’s investment advisory agreement with MFS should be continued for an additional one-year period, commencing August 1, 2017.
51
PROXY VOTING POLICIES AND INFORMATION
MFS votes proxies on behalf of the fund pursuant to proxy voting policies and procedures that are available without charge, upon request, by calling 1-800-225-2606, by visiting mfs.com (once you have selected “Individual Investor” as your role, click on “Individual Investor Home” in the top navigation and then select “Learn More About Proxy Voting” under the “I want to…” header on the left hand column of the page), or by visiting the SEC’s Web site at http://www.sec.gov.
Information regarding how the fund voted proxies relating to portfolio securities during the most recent twelve-month period ended June 30 is available by August 31 of each year without charge by visiting mfs.com (once you have selected “Individual Investor” as your role, click on “Individual Investor Home” in the top navigation and then select “Learn More About Proxy Voting” under the “I want to…” header on the left hand column of the page), or by visiting the SEC’s Web site at http://www.sec.gov.
QUARTERLY PORTFOLIO DISCLOSURE
The fund will file a complete schedule of portfolio holdings with the Securities and Exchange Commission (the Commission) for the first and third quarters of each fiscal year on Form N-Q. A shareholder can obtain the quarterly portfolio holdings report at mfs.com. The fund’s Form N-Q is also available on the EDGAR database on the Commission’s Internet Web site at http://www.sec.gov, and may be reviewed and copied at the:
Public Reference Room
Securities and Exchange Commission
100 F Street, NE, Room 1580
Washington, D.C. 20549
Information on the operation of the Public Reference Room may be obtained by calling the Commission at 1-800-SEC-0330. Copies of the fund’s Form N-Q also may be obtained, upon payment of a duplicating fee, by electronic request at the following e-mail address: publicinfo@sec.gov or by writing the Public Reference Section at the above address.
FURTHER INFORMATION
From time to time, MFS may post important information about the fund or the MFS funds on the MFS web site (mfs.com). This information is available on mfs.com by following these steps once you have selected “Individual Investor” as your role: (1) Click on the “Individual Investor Home” in the top navigation and then select the “Announcements” option within the “Market Outlooks” drop down, or (2) Click on “Products & Services” and “Mutual Funds” and then choose the fund’s name in the “Select a fund” menu.
52
INFORMATION ABOUT FUND CONTRACTS AND LEGAL CLAIMS
The fund has entered into contractual arrangements with an investment adviser, administrator, distributor, shareholder servicing agent, 529 program manager (if applicable), and custodian who each provide services to the fund. Unless expressly stated otherwise, shareholders are not parties to, or intended beneficiaries of these contractual arrangements, and these contractual arrangements are not intended to create any shareholder right to enforce them against the service providers or to seek any remedy under them against the service providers, either directly or on behalf of the fund.
Under the Trust’s By-Laws and Declaration of Trust, any claims asserted against or on behalf of the MFS Funds, including claims against Trustees and Officers, must be brought in state and federal courts located within the Commonwealth of Massachusetts.
FEDERAL TAX INFORMATION (unaudited)
The fund will notify shareholders of amounts for use in preparing 2017 income tax forms in January 2018. The following information is provided pursuant to provisions of the Internal Revenue Code.
The fund designates the maximum amount allowable as qualified dividend income eligible to be taxed at the same rate as long-term capital gain.
The fund designates $909,411,000 as capital gain dividends paid during the fiscal year.
For corporate shareholders, 93.60% of the ordinary income dividends paid during the fiscal year qualify for the corporate dividends received deduction.
53
rev. 3/16
| | | | |
| | | |
FACTS | | WHAT DOES MFS DO WITH YOUR PERSONAL INFORMATION? | |  |
| | |
| Why? | | Financial companies choose how they share your personal information. Federal law gives consumers the right to limit some but not all sharing. Federal law also requires us to tell you how we collect, share, and protect your personal information. Please read this notice carefully to understand what we do. |
| | |
| What? | | The types of personal information we collect and share depend on the product or service you have with us. This information can include: • Social Security number and account balances • Account transactions and transaction history • Checking account information and wire transfer instructions When you are no longer our customer, we continue to share your information as described in this notice. |
| | |
| How? | | All financial companies need to share customers’ personal information to run their everyday business. In the section below, we list the reasons financial companies can share their customers’ personal information; the reasons MFS chooses to share; and whether you can limit this sharing. |
| | | | |
Reasons we can share your
personal information | | Does MFS
share? | | Can you limit
this sharing? |
For our everyday business purposes – such as to process your transactions, maintain your account(s), respond to court orders and legal investigations, or report to credit bureaus | | Yes | | No |
For our marketing purposes – to offer our products and services to you | | No | | We don’t share |
For joint marketing with other financial companies | | No | | We don’t share |
For our affiliates’ everyday business purposes – information about your transactions and experiences | | No | | We don’t share |
For our affiliates’ everyday business purposes – information about your creditworthiness | | No | | We don’t share |
| For nonaffiliates to market to you | | No | | We don’t share |
| | |
| Questions? | | Call 800-225-2606 or go to mfs.com. |
54
| | |
| Who we are |
| Who is providing this notice? | | MFS Funds, MFS Investment Management, MFS Institutional Advisors, Inc., and MFS Heritage Trust Company. |
| | |
| What we do |
| How does MFS protect my personal information? | | To protect your personal information from unauthorized access and use, we use security measures that comply with federal law. These measures include procedural, electronic, and physical safeguards for the protection of the personal information we collect about you. |
| How does MFS collect my personal information? | | We collect your personal information, for example, when you • open an account or provide account information • direct us to buy securities or direct us to sell your securities • make a wire transfer We also collect your personal information from others, such as credit bureaus, affiliates, or other companies. |
| Why can’t I limit all sharing? | | Federal law gives you the right to limit only • sharing for affiliates’ everyday business purposes – information about your creditworthiness • affiliates from using your information to market to you • sharing for nonaffiliates to market to you State laws and individual companies may give you additional rights to limit sharing. |
| | |
| Definitions |
| Affiliates | | Companies related by common ownership or control. They can be financial and nonfinancial companies. • MFS does not share personal information with affiliates, except for everyday business purposes as described on page one of this notice. |
| Nonaffiliates | | Companies not related by common ownership or control. They can be financial and nonfinancial companies. • MFS does not share with nonaffiliates so they can market to you. |
| Joint marketing | | A formal agreement between nonaffiliated financial companies that together market financial products or services to you. • MFS doesn’t jointly market. |
| | |
| Other important information |
| If you own an MFS product or receive an MFS service in the name of a third party such as a bank or broker-dealer, their privacy policy may apply to you instead of ours. |
55
Save paper with eDelivery.

| MFS® will send you prospectuses, |
reports, and proxies directly via e-mail so you will get information faster with less mailbox clutter.
To sign up:
1. Go to mfs.com.
2. Log in via MFS® Access.
3. Select eDelivery.
If you own your MFS fund shares through a financial institution or a retirement plan, MFS® TALK, MFS® Access, or eDelivery may not be available to you.
CONTACT
WEB SITE
mfs.com
MFS TALK
1-800-637-8255
24 hours a day
ACCOUNT SERVICE AND LITERATURE
Shareholders
1-800-225-2606
Financial advisors
1-800-343-2829
Retirement plan services
1-800-637-1255
MAILING ADDRESS
MFS Service Center, Inc.
P.O. Box 55824
Boston, MA 02205-5824
OVERNIGHT MAIL
MFS Service Center, Inc.
c/o Boston Financial Data Services
30 Dan Road
Canton, MA 02021-2809
The Registrant has adopted a Code of Ethics (the “Code”) pursuant to Section 406 of the Sarbanes-Oxley Act and as defined in Form N-CSR that applies to the Registrant’s principal executive officer and principal financial and accounting officer. Effective January 1, 2017, the Code was amended to (i) clarify that the term “for profit” company as used in Section II.B of the Code excludes the investment adviser and its subsidiaries and pooled investment vehicles sponsored by the investment adviser or its subsidiaries, (ii) align the Code’s provisions regarding receipt of gifts and entertainment in Section II.B of the Code with the gifts and entertainment policy of the Funds’ investment adviser, and (iii) make other administrative changes. During the period covered by the report, the Registrant has not granted a waiver, including an implicit waiver, from any provision of the Code.
A copy of the Code effective as of January 1, 2017 is filed as an exhibit to this Form N-CSR.
| ITEM 3. | AUDIT COMMITTEE FINANCIAL EXPERT. |
Messrs. Steven E. Buller, John P. Kavanaugh and Clarence Otis, Jr. and Ms. Maryanne L. Roepke, members of the Audit Committee, have been determined by the Board of Trustees in their reasonable business judgment to meet the definition of “audit committee financial expert” as such term is defined in Form N-CSR. In addition, Messrs. Buller, Kavanaugh, and Otis and Ms. Roepke are “independent” members of the Audit Committee (as such term has been defined by the Securities and Exchange Commission in regulations implementing Section 407 of the Sarbanes-Oxley Act of 2002). The Securities and Exchange Commission has stated that the designation of a person as an audit committee financial expert pursuant to this Item 3 on the Form N-CSR does not impose on such a person any duties, obligations or liability that are greater than the duties, obligations or liability imposed on such person as a member of the Audit Committee and the Board of Trustees in the absence of such designation or identification.
| ITEM 4. | PRINCIPAL ACCOUNTANT FEES AND SERVICES. |
Items 4(a) through 4(d) and 4(g):
The Board of Trustees has appointed Deloitte & Touche LLP (“Deloitte”) to serve as independent accountant to certain series of the Registrant and Ernst & Young LLP (“E&Y”) to serve in the same capacity to certain other series of the Registrant (each a “Fund” and collectively the “Funds”). The tables below set forth the audit fees billed to each Fund as well as fees for non-audit services provided to each Fund and/or to each Fund’s investment adviser, Massachusetts Financial Services Company (“MFS”), and to various entities either controlling, controlled by, or under common control with MFS that provide ongoing services to the Fund (“MFS Related Entities”).
For the fiscal years ended August 31, 2017 and 2016, audit fees billed to each Fund by Deloitte and E&Y were as follows:
| | | | | | | | |
| | | Audit Fees | |
| | 2017 | | | 2016 | |
Fees Billed by Deloitte | | | | | | | | |
MFS Global Leaders Fund+ | | | N/A | | | | 0 | |
MFS Low Volatility Global Equity Fund | | | 45,406 | | | | 44,531 | |
MFS U.S. Government Cash Reserve Fund | | | 32,013 | | | | 31,401 | |
| | | | | | | | |
Total | | | 77,419 | | | | 75,932 | |
| | | | | | | | |
| | | Audit Fees | |
| | 2017 | | | 2016 | |
Fees Billed by E&Y | | | | | | | | |
MFS Core Equity Fund | | | 45,803 | | | | 44,492 | |
MFS Low Volatility Equity Fund | | | 39,657 | | | | 38,525 | |
MFS New Discovery Fund | | | 45,814 | | | | 44,503 | |
MFS Research International Fund | | | 48,829 | | | | 47,430 | |
MFS Technology Fund | | | 45,803 | | | | 44,492 | |
MFS Value Fund | | | 45,932 | | | | 44,618 | |
| | | | | | | | |
Total | | | 271,838 | | | | 264,060 | |
For the fiscal years ended August 31, 2017 and 2016, fees billed by Deloitte and E&Y for audit-related, tax and other services provided to each Fund and for audit-related, tax and other services provided to MFS and MFS Related Entities were as follows:
| | | | | | | | | | | | | | | | | | | | | | | | |
| | | Audit-Related Fees1 | | | Tax Fees2 | | | All Other Fees3 | |
| | 2017 | | | 2016 | | | 2017 | | | 2016 | | | 2017 | | | 2016 | |
Fees Billed by Deloitte | | | | | | | | | | | | | | | | | | | | | | | | |
To MFS Global Leaders Fund+ | | | N/A | | | | 0 | | | | N/A | | | | 8,507 | | | | N/A | | | | 0 | |
To MFS Low Volatility Global Equity Fund | | | 0 | | | | 0 | | | | 6,674 | | | | 6,575 | | | | 0 | | | | 0 | |
To MFS U.S. Government Cash Reserve Fund | | | 0 | | | | 0 | | | | 3,230 | | | | 3,182 | | | | 0 | | | | 0 | |
Total fees billed by Deloitte To above Funds | | | 0 | | | | 0 | | | | 9,904 | | | | 18,264 | | | | 0 | | | | 0 | |
| | | |
| | | Audit-Related Fees1 | | | Tax Fees2 | | | All Other Fees3 | |
| | 2017 | | | 2016 | | | 2017 | | | 2016 | | | 2017 | | | 2016 | |
Fees Billed by Deloitte | | | | | | | | | | | | | | | | | | | | | | | | |
To MFS and MFS Related Entities of MFS Global Leaders Fund*+ | | | 0 | | | | 0 | | | | 0 | | | | 0 | | | | N/A | | | | 5,000 | |
To MFS and MFS Related Entities of MFS Low Volatility Global Equity Fund* | | | 0 | | | | 0 | | | | 0 | | | | 0 | | | | 5,390 | | | | 5,000 | |
To MFS and MFS Related Entities of MFS U.S. Government Cash Reserve Fund* | | | 0 | | | | 0 | | | | 0 | | | | 0 | | | | 5,390 | | | | 5,000 | |
| | | | | | | | |
| | | Aggregate Fees for Non-audit
Services | |
| | 2017 | | | 2016 | |
Fees Billed by Deloitte | | | | | | | | |
To MFS Global Leaders Fund, MFS and MFS Related Entities#+ | | | N/A | | | | 78,785 | |
To MFS Low Volatility Global Equity Fund, MFS and MFS Related Entities# | | | 851,534 | | | | 76,853 | |
To MFS U.S. Government Cash Reserve Fund, MFS and MFS Related Entities# | | | 848,090 | | | | 73,460 | |
| | | | | | | | | | | | | | | | | | | | | | | | |
| | | Audit-Related Fees1 | | | Tax Fees2 | | | All Other Fees4 | |
| | 2017 | | | 2016 | | | 2017 | | | 2016 | | | 2017 | | | 2016 | |
Fees Billed by E&Y | | | | | | | | | | | | | | | | | | | | | | | | |
To MFS Core Equity Fund | | | 0 | | | | 0 | | | | 9,878 | | | | 8,634 | | | | 1,553 | | | | 1,517 | |
To MFS Low Volatility Equity Fund | | | 0 | | | | 0 | | | | 8,364 | | | | 8,246 | | | | 1,018 | | | | 1,008 | |
To MFS New Discovery Fund | | | 0 | | | | 0 | | | | 8,778 | | | | 8,634 | | | | 1,462 | | | | 1,560 | |
To MFS Research International Fund | | | 0 | | | | 0 | | | | 9,223 | | | | 9,073 | | | | 3,638 | | | | 3,849 | |
To MFS Technology Fund | | | 0 | | | | 0 | | | | 10,278 | | | | 8,634 | | | | 1,212 | | | | 1,155 | |
To MFS Value Fund | | | 0 | | | | 0 | | | | 9,378 | | | | 8,634 | | | | 15,907 | | | | 14,899 | |
Total fees billed by E&Y To above Funds | | | 0 | | | | 0 | | | | 55,899 | | | | 51,855 | | | | 24,790 | | | | 23,988 | |
| | | |
| | | Audit-Related Fees1 | | | Tax Fees2 | | | All Other Fees4 | |
| | 2017 | | | 20165 | | | 2017 | | | 2016 | | | 2017 | | | 2016 | |
Fees Billed by E&Y | | | | | | | | | | | | | | | | | | | | | | | | |
To MFS and MFS Related Entities of MFS Core Equity Fund* | | | 1,603,983 | | | | 1,612,499 | | | | 0 | | | | 0 | | | | 99,450 | | | | 99,446 | |
To MFS and MFS Related Entities of Low Volatility Equity Fund* | | | 1,603,983 | | | | 1,612,499 | | | | 0 | | | | 0 | | | | 99,450 | | | | 99,446 | |
To MFS and MFS Related Entities of MFS New Discovery Fund* | | | 1,603,983 | | | | 1,612,499 | | | | 0 | | | | 0 | | | | 99,450 | | | | 99,446 | |
To MFS and MFS Related Entities of MFS Research International Fund* | | | 1,603,983 | | | | 1,612,499 | | | | 0 | | | | 0 | | | | 99,450 | | | | 99,446 | |
To MFS and MFS Related Entities of MFS Technology Fund* | | | 1,603,983 | | | | 1,612,499 | | | | 0 | | | | 0 | | | | 99,450 | | | | 99,446 | |
To MFS and MFS Related Entities of MFS Value Fund* | | | 1,603,983 | | | | 1,612,499 | | | | 0 | | | | 0 | | | | 99,450 | | | | 99,446 | |
| | | | | | | | |
| | | Aggregate Fees for Non-audit
Services | |
| | 2017 | | | 2016 | |
Fees Billed by E&Y | | | | | | | | |
To MFS Core Equity Fund, MFS and MFS Related Entities# | | | 1,886,864 | | | | 1,872,696 | |
To Low Volatility Equity Fund, MFS and MFS Related Entities# | | | 1,884,815 | | | | 1,871,799 | |
To MFS New Discovery Fund, MFS and MFS Related Entities# | | | 1,885,673 | | | | 1,872,739 | |
To MFS Research International Fund, MFS and MFS Related Entities# | | | 1,888,294 | | | | 1,875,467 | |
To MFS Technology Fund, MFS and MFS Related Entities# | | | 1,886,923 | | | | 1,872,334 | |
To MFS Value Fund, MFS and MFS Related Entities# | | | 1,900,718 | | | | 1,886,078 | |
| + | MFS Global Leaders Fund liquidated effective November 17, 2016. |
| * | This amount reflects the fees billed to MFS and MFS Related Entities for non-audit services relating directly to the operations and financial reporting of the Funds (portions of which services also related to the operations and financial reporting of other funds within the MFS Funds complex). |
| # | This amount reflects the aggregate fees billed by Deloitte or E&Y for non-audit services rendered to the Funds and for non-audit services rendered to MFS and the MFS Related Entities. |
| 1 | The fees included under “Audit-Related Fees” are fees related to assurance and related services that are reasonably related to the performance of the audit or review of financial statements, but not reported under “Audit Fees,” including accounting consultations, agreed-upon procedure reports, attestation reports, comfort letters and internal control reviews. |
| 2 | The fees included under “Tax Fees” are fees associated with tax compliance, tax advice and tax planning, including services relating to the filing or amendment of federal, state or local income tax returns, regulated investment company qualification reviews and tax distribution and analysis. |
| 3 | The fees included under “All Other Fees” are fees for products and services provided by Deloitte other than those reported under “Audit Fees,” “Audit-Related Fees” and “Tax Fees”. |
| 4 | The fees included under “All Other Fees” are fees for products and services provided by E&Y other than those reported under “Audit Fees,” “Audit-Related Fees” and “Tax Fees,” including fees for services related to review of internal controls and Rule 38a-1 compliance program. |
Item 4(e)(1):
Set forth below are the policies and procedures established by the Audit Committee of the Board of Trustees relating to the pre-approval of audit and non-audit related services:
To the extent required by applicable law, pre-approval by the Audit Committee of the Board is needed for all audit and permissible non-audit services rendered to the Funds and all permissible non-audit services rendered to MFS or MFS Related Entities if the services relate directly to the operations and financial reporting of the Registrant. Pre-approval is currently on an engagement-by-engagement basis. In the event pre-approval of such services is necessary between regular meetings of the Audit Committee and it is not practical to wait to seek pre-approval at the next regular meeting of the Audit Committee, pre-approval of such services may be referred to the Chair of the Audit Committee for approval; provided that the Chair may not pre-approve any individual engagement for such services exceeding $50,000 or multiple engagements for such services in the aggregate exceeding $100,000 in each period between regular meetings of the Audit Committee. Any engagement pre-approved by the Chair between regular meetings of the Audit Committee shall be presented for ratification by the entire Audit Committee at its next regularly scheduled meeting.
Item 4(e)(2):
None, or 0%, of the services relating to the Audit-Related Fees, Tax Fees and All Other Fees paid by the Fund and MFS and MFS Related Entities relating directly to the operations and financial reporting of the Registrant disclosed above were approved by the audit committee pursuant to paragraphs (c)(7)(i)(C) of Rule 2-01 of Regulation S-X (which permits audit committee approval after the start of the engagement with respect to services other than audit, review or attest services, if certain conditions are satisfied).
Item 4(f): Not applicable.
Item 4(h): The Registrant’s Audit Committee has considered whether the provision by a Registrant’s independent registered public accounting firm of non-audit services to MFS and MFS Related Entities that were not pre-approved by the Committee (because such services did not relate directly to the operations and financial reporting of the Registrant) was compatible with maintaining the independence of the independent registered public accounting firm as the Registrant’s principal auditors.
| ITEM 5. | AUDIT COMMITTEE OF LISTED REGISTRANTS. |
Not applicable to the Registrant.
A schedule of investments of the Registrant is included as part of the report to shareholders of such series under Item 1 of this Form N-CSR.
| ITEM 7. | DISCLOSURE OF PROXY VOTING POLICIES AND PROCEDURES FOR CLOSED-END MANAGEMENT INVESTMENT COMPANIES. |
Not applicable to the Registrant.
| ITEM 8. | PORTFOLIO MANAGERS OF CLOSED-END MANAGEMENT INVESTMENT COMPANIES. |
Not applicable to the Registrant.
| ITEM 9. | PURCHASES OF EQUITY SECURITIES BY CLOSED-END MANAGEMENT INVESTMENT COMPANY AND AFFILIATED PURCHASERS. |
Not applicable to the Registrant.
| ITEM 10. | SUBMISSION OF MATTERS TO A VOTE OF SECURITY HOLDERS. |
There were no material changes to the procedures by which shareholders may send recommendations to the Board for nominees to the Registrant’s Board since the Registrant last provided disclosure as to such procedures in response to the requirements of Item 407 (c)(2)(iv) of Regulation S-K or this Item.
| ITEM 11. | CONTROLS AND PROCEDURES. |
| (a) | Based upon their evaluation of the effectiveness of the registrant’s disclosure controls and procedures (as defined in Rule 30a-3(c) under the Investment Company Act of 1940 (the “Act”)) as conducted within 90 days of the filing date of this report on Form N-CSR, the registrant’s principal financial officer and principal executive officer have concluded that those disclosure controls and procedures provide reasonable assurance that the material information required to be disclosed by the registrant on this report is recorded, processed, summarized and reported within the time periods specified in the Securities and Exchange Commission’s rules and forms. |
| (b) | There were no changes in the registrant’s internal controls over financial reporting (as defined in Rule 30a-3(d) under the Act) that occurred during the second fiscal quarter of the period covered by the report that have materially affected, or are reasonably likely to materially affect, the registrant’s internal control over financial reporting. |
| ITEM 12. | DISCLOSURE OF SECURITIES LENDING ACTIVITIES FOR CLOSED-END MANAGEMENT INVESTMENT COMPANIES. |
Not applicable to the Registrant.
| (a) | File the exhibits listed below as part of this form. Letter or number the exhibits in the sequence indicated. |
| | (1) | Any code of ethics, or amendment thereto, that is the subject of the disclosure required by Item 2, to the extent that the registrant intends to satisfy the Item 2 requirements through filing of an exhibit: Code of Ethics attached hereto. |
| | (2) | A separate certification for each principal executive officer and principal financial officer of the registrant as required by Rule 30a-2 under the Act (17 CFR 270.30a-2): Attached hereto. |
| (b) | If the report is filed under Section 13(a) or 15(d) of the Exchange Act, provide the certifications required by Rule 30a-2(b) under the Act (17 CFR 270.30a-2(b)), Rule 13a-14(b) or Rule 15d-14(b) under the Exchange Act (17 CFR 240.13a-14(b) or 240.15d-14(b)) and Section 1350 of Chapter 63 of Title 18 of the United States Code (18 U.S.C. 1350) as an exhibit. A certification furnished pursuant to this paragraph will not be deemed “filed” for the purposes of Section 18 of the Exchange Act (15 U.S.C. 78r), or otherwise subject to the liability of that section. Such certification will not be deemed to be incorporated by reference into any filing under the Securities Act of 1933 or the Exchange Act, except to the extent that the registrant specifically incorporates it by reference: Attached hereto. |
Notice
A copy of the Amended and Restated Declaration of Trust, as amended, of the Registrant is on file with the Secretary of State of The Commonwealth of Massachusetts and notice is hereby given that this instrument is executed on behalf of the Registrant by an officer of the Registrant as an officer and not individually and the obligations of or arising out of this instrument are not binding upon any of the Trustees or shareholders individually, but are binding only upon the assets and property of the respective constituent series of the Registrant.
SIGNATURES
Pursuant to the requirements of the Securities Exchange Act of 1934 and the Investment Company Act of 1940, the registrant has duly caused this report to be signed on its behalf by the undersigned, thereunto duly authorized.
(Registrant) MFS SERIES TRUST I
| | |
| By (Signature and Title)* | | DAVID L. DILORENZO |
| | David L. DiLorenzo, President |
Date: October 17, 2017
Pursuant to the requirements of the Securities Exchange Act of 1934 and the Investment Company Act of 1940, this report has been signed below by the following persons on behalf of the registrant and in the capacities and on the dates indicated.
| | |
| By (Signature and Title)* | | DAVID L. DILORENZO |
| | David L. DiLorenzo, President (Principal Executive Officer) |
Date: October 17, 2017
| | |
| By (Signature and Title)* | | JAMES O. YOST |
| | James O. Yost, Treasurer (Principal Financial Officer and Accounting Officer) |
Date: October 17, 2017
| * | Print name and title of each signing officer under his or her signature. |