UNITED STATES
SECURITIES AND EXCHANGE COMMISSION
Washington, D.C. 20549
FORMN-CSR
CERTIFIED SHAREHOLDER REPORT OF
REGISTERED MANAGEMENT INVESTMENT COMPANIES
Investment Company Act file number811-4777
MFS SERIES TRUST I
(Exact name of registrant as specified in charter)
111 Huntington Avenue, Boston, Massachusetts 02199
(Address of principal executive offices) (Zip code)
Christopher R. Bohane
Massachusetts Financial Services Company
111 Huntington Avenue
Boston, Massachusetts 02199
(Name and address of agents for service)
Registrant’s telephone number, including area code: (617)954-5000
Date of fiscal year end: August 31
Date of reporting period: August 31, 2019
| ITEM 1. | REPORTS TO STOCKHOLDERS. |
Annual Report
August 31, 2019

MFS® Core Equity Fund

Beginning on January 1, 2021, as permitted by regulations adopted by the U.S. Securities and Exchange Commission, paper copies of the fund’s annual and semiannual shareholder reports will no longer be sent by mail, unless you specifically request paper copies of the reports. Instead, the complete reports will be made available on the fund’s Web site (funds.mfs.com), and you will be notified by mail each time a report is posted and provided with a Web site link to access the report.
If you are already signed up to receive shareholder reports by email, you will not be affected by this change and you need not take any action. You may sign up to receive shareholder reports and other communications from the fund by email by contacting your financial intermediary (such as a broker-dealer or bank) or, if you hold your shares directly with the fund, by calling 1-800-225-2606 or by logging on to MFS Access at mfs.com.
Beginning on January 1, 2019, you may elect to receive all future reports in paper free of charge. Contact your financial intermediary to request that you continue to receive paper copies of your shareholder reports. If you invest directly with the fund, you can call 1-800-225-2606 or send an email request to orderliterature@mfs.com to let the fund know that you wish to continue receiving paper copies of your shareholder reports. Your election to receive reports in paper will apply to all funds held in your account if you invest through your financial intermediary or all funds held with the MFS fund complex if you invest directly.
RGI-ANN
MFS® Core Equity Fund
CONTENTS
The report is prepared for the general information of shareholders.
It is authorized for distribution to prospective investors only when preceded or accompanied by a current prospectus.
NOT FDIC INSURED• MAY LOSE VALUE• NO BANK GUARANTEE

LETTER FROM THE EXECUTIVE CHAIRMAN
Dear Shareholders:
Slowing global growth, low inflation, and increasing trade friction between the United States and China have been hallmarks of the past 12 months. After experiencing an
uptick in market volatility in late 2018, markets steadied during the first half of 2019, thanks in large measure to the adoption of a dovish policy stance on the part of global central banks, focused on supporting economic growth. The U.S. and China have raised tariffs on each other, heightening tensions and uncertainty. Despite repeated declarations by British Prime Minister Boris Johnson that the United Kingdom will leave the European Union on October 31, 2019, with or without a deal, apprehension over the possibility of a no-deal Brexit has eased somewhat, with Parliament having taken steps to block such an outcome.
Markets expect that the longest economic expansion in U.S. history will continue for the time being, albeit at a slower pace. In an effort to prolong the expansion, the U.S. Federal Reserve lowered interest rates for the first time in more than a decade in July and again in September. Similarly, the European Central Bank loosened policy in September. While markets have grown more risk averse, the accommodative monetary environment has helped push global interest rates toward record-low levels and has been somewhat supportive of risk assets despite the unsettled economic and geopolitical backdrop.
Since launching the first U.S. open-end mutual fund in 1924, MFS® has been committed to a single purpose: to create value by allocating capital responsibly for clients. Through our powerful global investment platform, we combine collective expertise, thoughtful risk management, and long-term discipline to uncover what we believe are the best investment opportunities in the market.
Respectfully,

Robert J. Manning
Executive Chairman
MFS Investment Management
October 17, 2019
The opinions expressed in this letter are subject to change and may not be relied upon for investment advice. No forecasts can be guaranteed.
1
PORTFOLIO COMPOSITION
Portfolio structure

| | | | |
| Top ten holdings | |
| Apple, Inc. | | | 4.1% | |
| Microsoft Corp. | | | 3.1% | |
| Amazon.com, Inc. | | | 3.1% | |
| Alphabet, Inc., “A” | | | 2.9% | |
| American Tower Corp., REIT | | | 2.3% | |
| Mastercard, Inc., “A” | | | 2.1% | |
| Aon PLC | | | 2.0% | |
| Facebook, Inc., “A” | | | 1.9% | |
| Chevron Corp. | | | 1.7% | |
| Salesforce.com, Inc. | | | 1.5% | |
| | | | |
| Global equity sectors (k) | |
| Technology | | | 25.2% | |
| Financial Services | | | 17.1% | |
| Health Care (s) | | | 13.6% | |
| Consumer Cyclicals | | | 12.8% | |
| Capital Goods (s) | | | 12.8% | |
| Energy | | | 7.5% | |
| Consumer Staples | | | 5.3% | |
| Telecommunications/Cable Television (s) | | | 3.8% | |
| (k) | The sectors set forth above and the associated portfolio composition are based on MFS’ own custom sector classification methodology. |
| (s) | Includes securities sold short. |
Cash & Cash Equivalents includes any cash, investments in money market funds, short-term securities, and other assets less liabilities. Please see the Statement of Assets and Liabilities for additional information related to the fund’s cash position and other assets and liabilities.
Percentages are based on net assets as of August 31, 2019.
The portfolio is actively managed and current holdings may be different.
2
MANAGEMENT REVIEW
Summary of Results
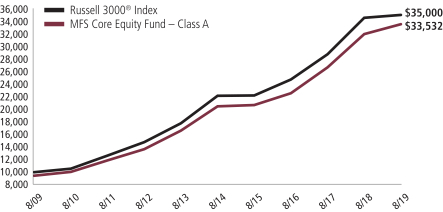
For the twelve months ended August 31, 2019, Class A shares of the MFS Core Equity Fund (fund) provided a total return of 4.94%, at net asset value. This compares with a return of 1.31% for the fund’s benchmark, the Russell 3000® Index.
Market Environment
Changes in market sentiment, driven largely by uncertainty over the outcome of trade negotiations between the United States and China, contributed to periodic bouts of volatility during the reporting period. The global economy decelerated, led by weakness in China and Europe.
The deteriorating global growth backdrop, along with declining inflationary pressures, prompted the US Federal Reserve to cut interest rates for the first time in over a decade at the end of July, which, combined with a more dovish posture beginning in early 2019, resulted in a sharp decline in long-term interest rates during the period’s second half, inverting portions of the US Treasury yield curve. Consequently, markets anticipate additional rate cuts in the coming quarters.
Globally, central banks have tilted more dovish as well, with China lowering reserve requirements, the Bank of Canada and Bank of England holding rates steady and the European Central Bank extending alow-interest-rate refinancing facility for eurozone banks to encourage the continued flow of credit. The ECB also indicated that it would likely lower rates further and possibly resume asset purchases this fall.
Emerging markets experienced considerable volatility earlier in the period (through the end of 2018) as tighter global financial conditions exposed structural weakness in some countries. Those conditions improved in 2019 as the Fed became more dovish, but diminished hopes for a trade deal between the US and China weighed on sentiment. Idiosyncratic factors negatively impacted some emerging economies, such as Argentina and Turkey.
From a geopolitical perspective, uncertainty over Brexit remains high. British Prime Minister Boris Johnson has shown a willingness to leave the European Union on October 31, 2019, without a withdrawal agreement, although Parliament has taken steps to prevent the United Kingdom from leaving the EU without a deal. The combination of Brexit uncertainty and the deteriorating outlook for global trade has damaged business confidence and hampered investment.
Contributors to Performance
Security selection in both thefinancial services andtelecommunications/cable television sectors contributed to performance relative to the Russell 3000® Index. Within thefinancial services sector, overweight positions in risk management and consulting services provider Aon, debit and credit transaction processing company Mastercard and real estate investment trusts Medical Properties Trust and W.P. Carey, as well as holding shares of global alternative asset manager Blackstone Group (b), aided relative performance. The share price of Aon rose as the company reported solid revenue growth, notably in both its reinsurance and commercial risk solutions divisions, and expense savings from its cost reduction program. Within thetelecommunications/cable television sector, the fund’s overweight positions in communications tower
3
Management Review – continued
management firm American Tower and telecommunications company Altice USA lifted relative returns. The share price of American Tower advanced on the back of strong organic growth, both domestically and internationally, as major wireless carriers ramped up investments in 5G technology.
Elsewhere, the fund’s underweight position in personal electronics maker Apple, and overweight positions in coffee and tea company Starbucks and animal health products manufacturer Zoetis, supported relative results. The share price of Starbucks appreciated over the reporting period as robust growth in global same-store sales and an improved corporate tax rate appeared to have lifted investor sentiment.
Detractors from Performance
From a sector perspective, there were no standout detractors that weakened the fund’s relative performance during the reporting period.
From an individual stock perspective, overweight positions in computer graphics processor maker NVIDIA (h), animal health services firm Elanco Animal Health, information technology company DXC Technology, electronic brokerage firm TD Ameritrade, independent petroleum products company Marathon Petroleum, information technology education company Pluralsight, energy exploration and production company EOG Resources and biotechnology company Biogen (h) weighed on relative returns. The share price of NVIDIA fell, notably early in the reporting period, as a decline in cryptocurrency prices translated into decreased demand for the company’s computer chips (used to mine cryptocurrencies) and led to a backlog of chip inventory. Not holding positions in global payments technology company Visa and pharmaceutical company Merck & Company also hurt relative results as both stocks delivered strong performance during the reporting period. The share price of Visa rose as strong processing and transaction fees, as well as cross-border transaction volumes, helped the company deliver better-than-expected earnings.
Respectfully,
Portfolio Manager(s)
Joseph MacDougall
| (b) | Security is not a benchmark constituent. |
| (h) | Security was not held in the portfolio at period end. |
The views expressed in this report are those of the portfolio manager(s) only through the end of the period of the report as stated on the cover and do not necessarily reflect the views of MFS or any other person in the MFS organization. These views are subject to change at any time based on market or other conditions, and MFS disclaims any responsibility to update such views. These views may not be relied upon as investment advice or an indication of trading intent on behalf of any MFS portfolio. References to specific securities are not recommendations of such securities, and may not be representative of any MFS portfolio’s current or future investments.
4
PERFORMANCE SUMMARYTHROUGH 8/31/19
The following chart illustrates a representative class of the fund’s historical performance in comparison to its benchmark(s). Performance results include the deduction of the maximum applicable sales charge and reflect the percentage change in net asset value, including reinvestment of dividends and capital gains distributions. The performance of other share classes will be greater than or less than that of the class depicted below. Benchmarks are unmanaged and may not be invested in directly. Benchmark returns do not reflect sales charges, commissions or expenses. (See Notes to Performance Summary.)
Performance data shown represents past performance and is no guarantee of future results. Investment return and principal value fluctuate so your shares, when sold, may be worth more or less than the original cost; current performance may be lower or higher than quoted. The performance shown does not reflect the deduction of taxes, if any, that a shareholder would pay on fund distributions or the redemption of fund shares.
Growth of a Hypothetical $10,000 Investment
5
Performance Summary – continued
Total Returns through 8/31/19
Average annual without sales charge
| | | | | | | | | | | | | | |
| | | Share Class | | Class Inception Date | | 1-yr | | 5-yr | | 10-yr | | Life (t) | | |
| | | A | | 1/02/96 | | 4.94% | | 10.36% | | 13.53% | | N/A | | |
| | | B | | 1/02/97 | | 4.16% | | 9.53% | | 12.68% | | N/A | | |
| | | C | | 1/02/97 | | 4.14% | | 9.53% | | 12.67% | | N/A | | |
| | | I | | 1/02/97 | | 5.17% | | 10.63% | | 13.81% | | N/A | | |
| | | R1 | | 4/01/05 | | 4.14% | | 9.53% | | 12.68% | | N/A | | |
| | | R2 | | 10/31/03 | | 4.66% | | 10.09% | | 13.24% | | N/A | | |
| | | R3 | | 4/01/05 | | 4.91% | | 10.35% | | 13.52% | | N/A | | |
| | | R4 | | 4/01/05 | | 5.18% | | 10.63% | | 13.79% | | N/A | | |
| | | R6 | | 1/02/13 | | 5.28% | | 10.73% | | N/A | | 14.27% | | |
| | | | | |
| Comparative benchmark(s) | | | | | | | | | | |
| | | Russell 3000® Index (f) | | 1.31% | | 9.60% | | 13.35% | | N/A | | |
| | | | | |
| Average annual with sales charge | | | | | | | | | | |
| | | A
With Initial Sales Charge (5.75%) | | (1.09)% | | 9.06% | | 12.86% | | N/A | | |
| | | B
With CDSC (Declining over six years from 4% to 0%) (v) | | 0.42% | | 9.25% | | 12.68% | | N/A | | |
| | | C
With CDSC (1% for 12 months) (v) | | 3.21% | | 9.53% | | 12.67% | | N/A | | |
CDSC – Contingent Deferred Sales Charge.
Class I, R1, R2, R3, R4, and R6 shares do not have a sales charge.
| (f) | Source: FactSet Research Systems Inc. |
| (t) | For the period from the class inception date through the stated period end (for those share classes with less than 10 years of performance history). No comparative benchmark performance information is provided for “life” periods. (See Notes to Performance Summary.) |
| (v) | Assuming redemption at the end of the applicable period. |
Benchmark Definition(s)
Russell 3000® Index – constructed to provide a comprehensive barometer for the 3,000 largest U.S. companies based on total market capitalization, which represents approximately 98% of the investable U.S. equity market. The Russell 3000® Index is a trademark/service mark of the Frank Russell Company. Russell® is a trademark of the Frank Russell Company.
It is not possible to invest directly in an index.
Notes to Performance Summary
Average annual total return represents the average annual change in value for each share class for the periods presented. Life returns are presented where the share class has less than 10 years of performance history and represent the average annual total return from the class inception date to the stated period end date. As the fund’s share
6
Performance Summary – continued
classes may have different inception dates, the life returns may represent different time periods and may not be comparable. As a result, no comparative benchmark performance information is provided for life periods.
Performance results reflect any applicable expense subsidies and waivers in effect during the periods shown. Without such subsidies and waivers the fund’s performance results would be less favorable. Please see the prospectus and financial statements for complete details.
Performance results do not include adjustments made for financial reporting purposes in accordance with U.S. generally accepted accounting principles and may differ from amounts reported in the financial highlights.
From time to time the fund may receive proceeds from litigation settlements, without which performance would be lower.
7
EXPENSE TABLE
Fund expenses borne by the shareholders during the period, March 1, 2019 through August 31, 2019
As a shareholder of the fund, you incur two types of costs: (1) transaction costs, including sales charges (loads) on certain purchase or redemption payments, and (2) ongoing costs, including management fees; distribution and service(12b-1) fees; and other fund expenses. This example is intended to help you understand your ongoing costs (in dollars) of investing in the fund and to compare these costs with the ongoing costs of investing in other mutual funds.
The example is based on an investment of $1,000 invested at the beginning of the period and held for the entire period March 1, 2019 through August 31, 2019.
Actual Expenses
The first line for each share class in the following table provides information about actual account values and actual expenses. You may use the information in this line, together with the amount you invested, to estimate the expenses that you paid over the period. Simply divide your account value by $1,000 (for example, an $8,600 account value divided by $1,000 = 8.6), then multiply the result by the number in the first line under the heading entitled “Expenses Paid During Period” to estimate the expenses you paid on your account during this period.
Hypothetical Example for Comparison Purposes
The second line for each share class in the following table provides information about hypothetical account values and hypothetical expenses based on the fund’s actual expense ratio and an assumed rate of return of 5% per year before expenses, which is not the fund’s actual return. The hypothetical account values and expenses may not be used to estimate the actual ending account balance or expenses you paid for the period. You may use this information to compare the ongoing costs of investing in the fund and other funds. To do so, compare this 5% hypothetical example with the 5% hypothetical examples that appear in the shareholder reports of the other funds.
Please note that the expenses shown in the table are meant to highlight your ongoing costs only and do not reflect any transactional costs, such as sales charges (loads). Therefore, the second line for each share class in the table is useful in comparing ongoing costs only, and will not help you determine the relative total costs of owning different funds. In addition, if these transactional costs were included, your costs would have been higher.
8
Expense Table – continued
| | | | | | | | | | | | | | | | | | |
Share
Class | | | | Annualized
Expense Ratio | | | Beginning
Account Value
3/01/19 | | | Ending
Account Value
8/31/19 | | | Expenses Paid During
Period (p)
3/01/19-8/31/19 | |
| A | | Actual | | | 0.99% | | | | $1,000.00 | | | | $1,071.66 | | | | $5.17 | |
| | Hypothetical (h) | | | 0.99% | | | | $1,000.00 | | | | $1,020.21 | | | | $5.04 | |
| B | | Actual | | | 1.74% | | | | $1,000.00 | | | | $1,067.70 | | | | $9.07 | |
| | Hypothetical (h) | | | 1.74% | | | | $1,000.00 | | | | $1,016.43 | | | | $8.84 | |
| C | | Actual | | | 1.75% | | | | $1,000.00 | | | | $1,067.43 | | | | $9.12 | |
| | Hypothetical (h) | | | 1.75% | | | | $1,000.00 | | | | $1,016.38 | | | | $8.89 | |
| I | | Actual | | | 0.75% | | | | $1,000.00 | | | | $1,072.83 | | | | $3.92 | |
| | Hypothetical (h) | | | 0.75% | | | | $1,000.00 | | | | $1,021.42 | | | | $3.82 | |
| R1 | | Actual | | | 1.75% | | | | $1,000.00 | | | | $1,067.49 | | | | $9.12 | |
| | Hypothetical (h) | | | 1.75% | | | | $1,000.00 | | | | $1,016.38 | | | | $8.89 | |
| R2 | | Actual | | | 1.23% | | | | $1,000.00 | | | | $1,070.44 | | | | $6.42 | |
| | Hypothetical (h) | | | 1.23% | | | | $1,000.00 | | | | $1,019.00 | | | | $6.26 | |
| R3 | | Actual | | | 1.00% | | | | $1,000.00 | | | | $1,071.88 | | | | $5.22 | |
| | Hypothetical (h) | | | 1.00% | | | | $1,000.00 | | | | $1,020.16 | | | | $5.09 | |
| R4 | | Actual | | | 0.75% | | | | $1,000.00 | | | | $1,073.04 | | | | $3.92 | |
| | Hypothetical (h) | | | 0.75% | | | | $1,000.00 | | | | $1,021.42 | | | | $3.82 | |
| R6 | | Actual | | | 0.66% | | | | $1,000.00 | | | | $1,073.32 | | | | $3.45 | |
| | Hypothetical (h) | | | 0.66% | | | | $1,000.00 | | | | $1,021.88 | | | | $3.36 | |
| (h) | 5% class return per year before expenses. |
| (p) | “Expenses Paid During Period” are equal to each class’s annualized expense ratio, as shown above, multiplied by the average account value over the period, multiplied by 184/365 (to reflect theone-half year period). Expenses paid do not include any applicable sales charges (loads). If these transaction costs had been included, your costs would have been higher. |
Notes to Expense Table
Expense ratios include 0.03% of investment related expenses from short sales (See Note 2 of the Notes to Financial Statements). Each class with a Rule12b-1 service fee is subject to a rebate of a portion of such fee. Such rebates are included in the expense ratios above. For Class A and Class R2 shares, this rebate reduced the expense ratios above by 0.01%. See Note 3 in the Notes to Financial Statements for additional information.
9
PORTFOLIO OF INVESTMENTS
8/31/19
The Portfolio of Investments is a complete list of all securities owned by your fund. It is categorized by broad-based asset classes.
| | | | | | | | |
| Common Stocks - 98.5% | | | | | | | | |
| | |
| Issuer | | Shares/Par | | | Value ($) | |
| Aerospace - 3.6% | | | | | | | | |
| Boeing Co. | | | 61,420 | | | $ | 22,362,408 | |
| CACI International, Inc., “A” (a) | | | 35,545 | | | | 7,901,298 | |
| Curtiss-Wright Corp. | | | 39,565 | | | | 4,852,251 | |
| FLIR Systems, Inc. | | | 40,684 | | | | 2,004,501 | |
| Honeywell International, Inc. | | | 137,399 | | | | 22,618,623 | |
| Huntington Ingalls Industries, Inc. | | | 20,253 | | | | 4,232,877 | |
| Northrop Grumman Corp. | | | 60,409 | | | | 22,222,659 | |
| United Technologies Corp. | | | 119,682 | | | | 15,587,384 | |
| | | | | | | | |
| | | | | | | $ | 101,782,001 | |
| Alcoholic Beverages - 0.4% | | | | | | | | |
| Constellation Brands, Inc., “A” | | | 50,877 | | | $ | 10,396,715 | |
| | |
| Apparel Manufacturers - 0.4% | | | | | | | | |
| NIKE, Inc., “B” | | | 71,772 | | | $ | 6,064,734 | |
| Skechers USA, Inc., “A” (a) | | | 202,452 | | | | 6,409,630 | |
| | | | | | | | |
| | | | | | | $ | 12,474,364 | |
| Automotive - 0.7% | | | | | | | | |
| Copart, Inc. (a) | | | 85,423 | | | $ | 6,440,040 | |
| IAA, Inc. (a) | | | 69,606 | | | | 3,400,253 | |
| Lear Corp. | | | 47,412 | | | | 5,322,471 | |
| Stoneridge, Inc. (a) | | | 133,719 | | | | 4,106,511 | |
| | | | | | | | |
| | | | | | | $ | 19,269,275 | |
| Biotechnology - 0.3% | | | | | | | | |
| Adaptive Biotechnologies Corp. (a) | | | 28,762 | | | $ | 1,462,548 | |
| Illumina, Inc. (a) | | | 22,140 | | | | 6,228,867 | |
| | | | | | | | |
| | | | | | | $ | 7,691,415 | |
| Broadcasting - 0.5% | | | | | | | | |
| Netflix, Inc. (a) | | | 44,187 | | | $ | 12,979,931 | |
| | |
| Brokerage & Asset Managers - 2.1% | | | | | | | | |
| Blackstone Group, Inc. | | | 127,931 | | | $ | 6,365,846 | |
| Charles Schwab Corp. | | | 366,313 | | | | 14,018,798 | |
| CME Group, Inc. | | | 72,216 | | | | 15,691,815 | |
| TD Ameritrade Holding Corp. | | | 539,970 | | | | 23,980,068 | |
| | | | | | | | |
| | | | | | | $ | 60,056,527 | |
10
Portfolio of Investments – continued
| | | | | | | | |
| | |
| Issuer | | Shares/Par | | | Value ($) | |
| Common Stocks - continued | | | | | | | | |
| Business Services - 4.1% | | | | | | | | |
| Amdocs Ltd. | | | 111,464 | | | $ | 7,216,179 | |
| Cognizant Technology Solutions Corp., “A” | | | 210,358 | | | | 12,913,878 | |
| DXC Technology Co. | | | 157,199 | | | | 5,222,151 | |
| Equinix, Inc., REIT | | | 18,971 | | | | 10,553,188 | |
| Fidelity National Information Services, Inc. | | | 110,548 | | | | 15,058,848 | |
| Fiserv, Inc. (a) | | | 103,112 | | | | 11,026,797 | |
| FleetCor Technologies, Inc. (a) | | | 65,817 | | | | 19,639,793 | |
| Global Payments, Inc. | | | 60,136 | | | | 9,981,373 | |
| Total System Services, Inc. | | | 64,927 | | | | 8,714,502 | |
| Verisk Analytics, Inc., “A” | | | 94,494 | | | | 15,264,561 | |
| | | | | | | | |
| | | | | | | $ | 115,591,270 | |
| Cable TV - 1.1% | | | | | | | | |
| Altice USA, Inc., “A” (a) | | | 676,597 | | | $ | 19,540,121 | |
| Comcast Corp., “A” | | | 285,688 | | | | 12,644,551 | |
| | | | | | | | |
| | | | | | | $ | 32,184,672 | |
| Chemicals - 0.4% | | | | | | | | |
| FMC Corp. | | | 93,795 | | | $ | 8,097,322 | |
| Ingevity Corp. (a) | | | 47,867 | | | | 3,646,030 | |
| | | | | | | | |
| | | | | | | $ | 11,743,352 | |
| Computer Software - 6.6% | | | | | | | | |
| Adobe Systems, Inc. (a) | | | 121,791 | | | $ | 34,650,758 | |
| Cadence Design Systems, Inc. (a) | | | 163,813 | | | | 11,217,914 | |
| DocuSign, Inc. (a) | | | 192,360 | | | | 8,981,289 | |
| Microsoft Corp. | | | 629,684 | | | | 86,808,236 | |
| Salesforce.com, Inc. (a) | | | 275,074 | | | | 42,930,799 | |
| | | | | | | | |
| | | | | | | $ | 184,588,996 | |
| Computer Software - Systems - 5.1% | | | | | | | | |
| Apple, Inc. (s) | | | 549,195 | | | $ | 114,638,964 | |
| Pluralsight, Inc., “A” (a) | | | 405,022 | | | | 6,520,854 | |
| Rapid7, Inc. (a) | | | 151,589 | | | | 8,138,814 | |
| ServiceNow, Inc. (a) | | | 45,299 | | | | 11,861,090 | |
| Square, Inc., “A” (a) | | | 31,045 | | | | 1,919,823 | |
| | | | | | | | |
| | | | | | | $ | 143,079,545 | |
| Construction - 1.6% | | | | | | | | |
| Masco Corp. | | | 409,797 | | | $ | 16,691,032 | |
| Toll Brothers, Inc. | | | 416,430 | | | | 15,070,601 | |
| Vulcan Materials Co. | | | 84,871 | | | | 11,988,029 | |
| | | | | | | | |
| | | | | | | $ | 43,749,662 | |
11
Portfolio of Investments – continued
| | | | | | | | |
| | |
| Issuer | | Shares/Par | | | Value ($) | |
| Common Stocks - continued | | | | | | | | |
| Consumer Products - 1.6% | | | | | | | | |
| Colgate-Palmolive Co. | | | 194,800 | | | $ | 14,444,420 | |
| Energizer Holdings, Inc. | | | 40,763 | | | | 1,569,376 | |
| Kimberly-Clark Corp. | | | 90,975 | | | | 12,837,482 | |
| Procter & Gamble Co. | | | 129,679 | | | | 15,591,306 | |
| | | | | | | | |
| | | | | | | $ | 44,442,584 | |
| Consumer Services - 1.1% | | | | | | | | |
| Booking Holdings, Inc. (a) | | | 7,320 | | | $ | 14,394,121 | |
| Bright Horizons Family Solutions, Inc. (a) | | | 49,957 | | | | 8,245,403 | |
| Grand Canyon Education, Inc. (a) | | | 74,924 | | | | 9,410,455 | |
| | | | | | | | |
| | | | | | | $ | 32,049,979 | |
| Containers - 0.1% | | | | | | | | |
| Sealed Air Corp. | | | 108,331 | | | $ | 4,313,740 | |
| | |
| Electrical Equipment - 1.9% | | | | | | | | |
| AMETEK, Inc. | | | 238,340 | | | $ | 20,480,556 | |
| Fortive Corp. | | | 135,540 | | | | 9,609,786 | |
| HD Supply Holdings, Inc. (a) | | | 216,169 | | | | 8,411,136 | |
| Sensata Technologies Holding PLC (a) | | | 190,818 | | | | 8,697,484 | |
| TE Connectivity Ltd. | | | 58,085 | | | | 5,298,514 | |
| | | | | | | | |
| | | | | | | $ | 52,497,476 | |
| Electronics - 3.1% | | | | | | | | |
| Analog Devices, Inc. | | | 185,973 | | | $ | 20,425,415 | |
| Applied Materials, Inc. | | | 66,068 | | | | 3,172,585 | |
| Marvell Technology Group Ltd. | | | 426,131 | | | | 10,214,360 | |
| Mellanox Technologies Ltd. (a) | | | 33,149 | | | | 3,548,600 | |
| Monolithic Power Systems, Inc. | | | 23,737 | | | | 3,573,843 | |
| nLIGHT, Inc. (a) | | | 111,068 | | | | 1,434,999 | |
| NXP Semiconductors N.V. | | | 122,345 | | | | 12,496,318 | |
| Silicon Laboratories, Inc. (a) | | | 36,338 | | | | 3,960,842 | |
| Texas Instruments, Inc. | | | 222,924 | | | | 27,586,845 | |
| | | | | | | | |
| | | | | | | $ | 86,413,807 | |
| Energy - Independent - 1.5% | | | | | | | | |
| Diamondback Energy, Inc. | | | 68,786 | | | $ | 6,746,531 | |
| EOG Resources, Inc. | | | 172,192 | | | | 12,774,924 | |
| Hess Corp. | | | 75,794 | | | | 4,771,232 | |
| Marathon Petroleum Corp. | | | 244,422 | | | | 12,028,007 | |
| Pioneer Natural Resources Co. | | | 50,200 | | | | 6,195,684 | |
| | | | | | | | |
| | | | | | | $ | 42,516,378 | |
| Energy - Integrated - 1.7% | | | | | | | | |
| Chevron Corp. | | | 406,260 | | | $ | 47,824,927 | |
12
Portfolio of Investments – continued
| | | | | | | | |
| | |
| Issuer | | Shares/Par | | | Value ($) | |
| Common Stocks - continued | | | | | | | | |
| Engineering - Construction - 0.2% | | | | | | | | |
| KBR, Inc. | | | 244,081 | | | $ | 6,228,947 | |
| | |
| Entertainment - 0.1% | | | | | | | | |
| World Wrestling Entertainment, Inc., “A” | | | 47,327 | | | $ | 3,380,568 | |
| | |
| Food & Beverages - 2.9% | | | | | | | | |
| Archer Daniels Midland Co. | | | 187,284 | | | $ | 7,126,156 | |
| Coca-Cola Co. | | | 219,818 | | | | 12,098,783 | |
| Hostess Brands, Inc. (a) | | | 365,487 | | | | 5,124,128 | |
| J.M. Smucker Co. | | | 46,751 | | | | 4,916,335 | |
| Mondelez International, Inc. | | | 371,877 | | | | 20,535,048 | |
| Nomad Foods Ltd. (a) | | | 138,210 | | | | 2,784,931 | |
| PepsiCo, Inc. | | | 211,908 | | | | 28,974,181 | |
| | | | | | | | |
| | | | | | | $ | 81,559,562 | |
| Food & Drug Stores - 0.1% | | | | | | | | |
| Grocery Outlet Holding Corp. (a) | | | 93,166 | | | $ | 3,768,565 | |
| | |
| Gaming & Lodging - 0.9% | | | | | | | | |
| Marriott International, Inc., “A” | | | 141,314 | | | $ | 17,814,043 | |
| Wyndham Hotels Group LLC | | | 151,490 | | | | 7,783,556 | |
| | | | | | | | |
| | | | | | | $ | 25,597,599 | |
| General Merchandise - 1.5% | | | | | | | | |
| Dollar General Corp. | | | 158,865 | | | $ | 24,797,238 | |
| Dollar Tree, Inc. (a) | | | 158,066 | | | | 16,048,441 | |
| | | | | | | | |
| | | | | | | $ | 40,845,679 | |
| Health Maintenance Organizations - 1.5% | | | | | | | | |
| Cigna Corp. | | | 143,285 | | | $ | 22,061,592 | |
| Humana, Inc. | | | 69,111 | | | | 19,572,926 | |
| | | | | | | | |
| | | | | | | $ | 41,634,518 | |
| Insurance - 4.3% | | | | | | | | |
| Aon PLC | | | 291,298 | | | $ | 56,759,415 | |
| Assurant, Inc. | | | 97,825 | | | | 12,032,475 | |
| Chubb Ltd. | | | 133,879 | | | | 20,922,610 | |
| Everest Re Group Ltd. | | | 21,104 | | | | 4,978,012 | |
| Hartford Financial Services Group, Inc. | | | 195,997 | | | | 11,422,705 | |
| MetLife, Inc. | | | 180,603 | | | | 8,000,713 | |
| Reinsurance Group of America, Inc. | | | 37,533 | | | | 5,778,956 | |
| | | | | | | | |
| | | | | | | $ | 119,894,886 | |
13
Portfolio of Investments – continued
| | | | | | | | |
| | |
| Issuer | | Shares/Par | | | Value ($) | |
| Common Stocks - continued | | | | | | | | |
| Internet - 5.1% | | | | | | | | |
| Alphabet, Inc., “A” (a)(s) | | | 69,220 | | | $ | 82,408,486 | |
| CarGurus, Inc. (a) | | | 275,405 | | | | 8,983,711 | |
| Facebook, Inc., “A” (a) | | | 282,804 | | | | 52,508,219 | |
| | | | | | | | |
| | | | | | | $ | 143,900,416 | |
| Leisure & Toys - 0.8% | | | | | | | | |
| Brunswick Corp. | | | 109,169 | | | $ | 5,087,275 | |
| Electronic Arts, Inc. (a) | | | 171,833 | | | | 16,097,316 | |
| | | | | | | | |
| | | | | | | $ | 21,184,591 | |
| Machinery & Tools - 1.3% | | | | | | | | |
| Flowserve Corp. | | | 177,559 | | | $ | 7,578,218 | |
| IDEX Corp. | | | 37,720 | | | | 6,212,861 | |
| ITT, Inc. | | | 92,954 | | | | 5,290,942 | |
| Roper Technologies, Inc. | | | 47,394 | | | | 17,382,223 | |
| | | | | | | | |
| | | | | | | $ | 36,464,244 | |
| Major Banks - 2.3% | | | | | | | | |
| Goldman Sachs Group, Inc. | | | 159,211 | | | $ | 32,464,715 | |
| PNC Financial Services Group, Inc. | | | 130,213 | | | | 16,788,362 | |
| State Street Corp. | | | 122,663 | | | | 6,293,839 | |
| Wells Fargo & Co. | | | 182,869 | | | | 8,516,209 | |
| | | | | | | | |
| | | | | | | $ | 64,063,125 | |
| Medical & Health Technology & Services - 1.5% | | | | | | | | |
| Guardant Health, Inc. (a) | | | 12,509 | | | $ | 1,094,913 | |
| HCA Healthcare, Inc. | | | 95,684 | | | | 11,501,217 | |
| HealthEquity, Inc. (a) | | | 67,951 | | | | 4,033,571 | |
| ICON PLC (a) | | | 54,104 | | | | 8,342,296 | |
| IDEXX Laboratories, Inc. (a) | | | 13,691 | | | | 3,966,830 | |
| McKesson Corp. | | | 61,876 | | | | 8,555,594 | |
| Premier, Inc., “A” (a) | | | 105,899 | | | | 3,733,999 | |
| | | | | | | | |
| | | | | | | $ | 41,228,420 | |
| Medical Equipment - 4.4% | | | | | | | | |
| Becton, Dickinson and Co. | | | 72,858 | | | $ | 18,500,103 | |
| Boston Scientific Corp. (a) | | | 477,377 | | | | 20,398,319 | |
| Danaher Corp. | | | 72,937 | | | | 10,363,618 | |
| Masimo Corp. (a) | | | 57,107 | | | | 8,751,648 | |
| Medtronic PLC | | | 340,264 | | | | 36,711,083 | |
| PerkinElmer, Inc. | | | 151,335 | | | | 12,515,405 | |
| STERIS PLC | | | 52,078 | | | | 8,040,843 | |
| West Pharmaceutical Services, Inc. | | | 58,265 | | | | 8,475,227 | |
| | | | | | | | |
| | | | | | | $ | 123,756,246 | |
14
Portfolio of Investments – continued
| | | | | | | | |
| | |
| Issuer | | Shares/Par | | | Value ($) | |
| Common Stocks - continued | | | | | | | | |
| Natural Gas - Pipeline - 0.5% | | | | | | | | |
| Enterprise Products Partners LP | | | 258,374 | | | $ | 7,366,243 | |
| Equitrans Midstream Corp. | | | 398,461 | | | | 5,375,239 | |
| | | | | | | | |
| | | | | | | $ | 12,741,482 | |
| Network & Telecom - 1.2% | | | | | | | | |
| Cisco Systems, Inc. | | | 585,747 | | | $ | 27,418,817 | |
| Interxion Holding N.V. (a) | | | 81,680 | | | | 6,611,179 | |
| | | | | | | | |
| | | | | | | $ | 34,029,996 | |
| Oil Services - 0.4% | | | | | | | | |
| Cactus, Inc., “A” (a) | | | 84,088 | | | $ | 2,141,721 | |
| Core Laboratories N.V. | | | 111,840 | | | | 4,427,746 | |
| Patterson-UTI Energy, Inc. | | | 624,219 | | | | 5,399,494 | |
| | | | | | | | |
| | | | | | | $ | 11,968,961 | |
| Other Banks & Diversified Financials - 6.1% | | | | | | | | |
| Bank OZK | | | 284,246 | | | $ | 7,333,547 | |
| BB&T Corp. | | | 633,559 | | | | 30,189,086 | |
| Citigroup, Inc. | | | 537,660 | | | | 34,598,421 | |
| Mastercard, Inc., “A” | | | 211,604 | | | | 59,539,018 | |
| Prosperity Bancshares, Inc. | | | 45,335 | | | | 2,943,148 | |
| SVB Financial Group (a) | | | 16,346 | | | | 3,181,259 | |
| U.S. Bancorp | | | 453,818 | | | | 23,911,670 | |
| Wintrust Financial Corp. | | | 172,489 | | | | 10,837,484 | |
| | | | | | | | |
| | | | | | | $ | 172,533,633 | |
| Pharmaceuticals - 6.2% | | | | | | | | |
| Elanco Animal Health, Inc. (a) | | | 879,952 | | | $ | 22,896,351 | |
| Eli Lilly & Co. | | | 280,581 | | | | 31,697,235 | |
| Johnson & Johnson | | | 312,324 | | | | 40,089,909 | |
| Pfizer, Inc. | | | 1,142,232 | | | | 40,606,348 | |
| Zoetis, Inc. | | | 311,842 | | | | 39,423,066 | |
| | | | | | | | |
| | | | | | | $ | 174,712,909 | |
| Pollution Control - 0.3% | | | | | | | | |
| Waste Connections, Inc. | | | 91,142 | | | $ | 8,375,950 | |
| | |
| Railroad & Shipping - 1.3% | | | | | | | | |
| Canadian Pacific Railway Ltd. | | | 80,236 | | | $ | 19,316,817 | |
| Kansas City Southern Co. | | | 132,271 | | | | 16,639,692 | |
| | | | | | | | |
| | | | | | | $ | 35,956,509 | |
| Real Estate - 2.2% | | | | | | | | |
| Industrial Logistics Properties Trust, REIT | | | 502,374 | | | $ | 10,745,780 | |
| Lexington Realty Trust, REIT | | | 262,146 | | | | 2,723,697 | |
15
Portfolio of Investments – continued
| | | | | | | | |
| | |
| Issuer | | Shares/Par | | | Value ($) | |
| Common Stocks - continued | | | | | | | | |
| Real Estate - continued | | | | | | | | |
| Medical Properties Trust, Inc., REIT | | | 811,056 | | | $ | 15,077,531 | |
| STORE Capital Corp., REIT | | | 350,683 | | | | 13,241,790 | |
| Sun Communities, Inc., REIT | | | 29,138 | | | | 4,306,597 | |
| W.P. Carey, Inc., REIT | | | 183,859 | | | | 16,510,538 | |
| | | | | | | | |
| | | | | | | $ | 62,605,933 | |
| Restaurants - 1.4% | | | | | | | | |
| Starbucks Corp. | | | 302,681 | | | $ | 29,226,877 | |
| U.S. Foods Holding Corp. (a) | | | 260,342 | | | | 10,530,834 | |
| | | | | | | | |
| | | | | | | $ | 39,757,711 | |
| Specialty Chemicals - 1.0% | | | | | | | | |
| Corteva, Inc. | | | 342,504 | | | $ | 10,042,217 | |
| DuPont de Nemours, Inc. | | | 211,313 | | | | 14,354,492 | |
| Univar, Inc. (a) | | | 227,741 | | | | 4,406,789 | |
| | | | | | | | |
| | | | | | | $ | 28,803,498 | |
| Specialty Stores - 6.0% | | | | | | | | |
| Amazon.com, Inc. (a)(s) | | | 48,774 | | | $ | 86,636,769 | |
| Chewy, Inc., “A” (a) | | | 87,568 | | | | 2,889,744 | |
| Costco Wholesale Corp. | | | 67,691 | | | | 19,952,599 | |
| Floor & Decor Holdings, Inc. (a) | | | 281,096 | | | | 13,835,545 | |
| Ross Stores, Inc. | | | 202,240 | | | | 21,439,462 | |
| Target Corp. | | | 212,396 | | | | 22,734,868 | |
| | | | | | | | |
| | | | | | | $ | 167,488,987 | |
| Telecommunications - Wireless - 2.3% | | | | | | | | |
| American Tower Corp., REIT | | | 279,208 | | | $ | 64,270,890 | |
| | |
| Telephone Services - 0.6% | | | | | | | | |
| Verizon Communications, Inc. | | | 278,807 | | | $ | 16,215,415 | |
| | |
| Tobacco - 0.5% | | | | | | | | |
| Philip Morris International, Inc. | | | 194,882 | | | $ | 14,049,043 | |
| | |
| Trucking - 0.4% | | | | | | | | |
| Forward Air Corp. | | | 96,076 | | | $ | 5,985,535 | |
| Schneider National, Inc. | | | 263,190 | | | | 5,116,413 | |
| | | | | | | | |
| | | | | | | $ | 11,101,948 | |
| Utilities - Electric Power - 3.3% | | | | | | | | |
| American Electric Power Co., Inc. | | | 144,824 | | | $ | 13,200,708 | |
| Avangrid, Inc. | | | 44,644 | | | | 2,256,308 | |
| CenterPoint Energy, Inc. | | | 252,624 | | | | 6,995,158 | |
16
Portfolio of Investments – continued
| | | | | | | | |
| | |
| Issuer | | Shares/Par | | | Value ($) | |
| Common Stocks - continued | | | | | | | | |
| Utilities - Electric Power - continued | | | | | | | | |
| CMS Energy Corp. | | | 176,300 | | | $ | 11,115,715 | |
| Evergy, Inc. | | | 168,643 | | | | 10,961,795 | |
| Exelon Corp. | | | 249,629 | | | | 11,797,466 | |
| NextEra Energy, Inc. | | | 84,491 | | | | 18,510,288 | |
| Southern Co. | | | 89,087 | | | | 5,190,209 | |
| Xcel Energy, Inc. | | | 190,621 | | | | 12,241,681 | |
| | | | | | | | |
| | | | | | | $ | 92,269,328 | |
| Total Common Stocks (Identified Cost, $2,173,375,659) | | | | | | $ | 2,766,036,175 | |
| | |
| Convertible Preferred Stocks - 0.1% | | | | | | | | |
| Natural Gas - Distribution - 0.1% | | | | | | | | |
| South Jersey Industries, Inc. | | | 37,587 | | | $ | 1,960,162 | |
| | |
| Utilities - Electric Power - 0.0% | | | | | | | | |
| American Electric Power Co., Inc. | | | 13,400 | | | $ | 755,492 | |
Total Convertible Preferred Stocks
(Identified Cost, $2,549,350) | | | | | | $ | 2,715,654 | |
| | |
| Investment Companies (h) - 1.3% | | | | | | | | |
| Money Market Funds - 1.3% | | | | | | | | |
MFS Institutional Money Market Portfolio, 2.17% (v)
(Identified Cost, $36,340,640) | | | 36,343,213 | | | $ | 36,346,848 | |
| | |
| Securities Sold Short - (0.5)% | | | | | | | | |
| Medical & Health Technology & Services - (0.2)% | | | | | | | | |
| Healthcare Services Group, Inc. | | | (242,368 | ) | | $ | (5,465,399 | ) |
| | |
| Telecommunications - Wireless - (0.2)% | | | | | | | | |
| Crown Castle International Corp., REIT | | | (44,300 | ) | | $ | (6,431,031 | ) |
| | |
| Trucking - (0.1)% | | | | | | | | |
| XPO Logistics, Inc. | | | (25,219 | ) | | $ | (1,787,018 | ) |
Total Securities Sold Short
(Proceeds Received, $13,924,288) | | | | | | $ | (13,683,448 | ) |
| | |
| Other Assets, Less Liabilities - 0.6% | | | | | | | 16,178,515 | |
| Net Assets - 100.0% | | | | | | $ | 2,807,593,744 | |
| (a) | Non-income producing security. |
| (h) | An affiliated issuer, which may be considered one in which the fund owns 5% or more of the outstanding voting securities, or a company which is under common control. At period end, the aggregate values of the fund’s investments in affiliated issuers and in unaffiliated issuers were $36,346,848 and $2,768,751,829, respectively. |
17
Portfolio of Investments – continued
| (s) | Security or a portion of the security was pledged to cover collateral requirements for securities sold short. |
| (v) | Affiliated issuer that is available only to investment companies managed by MFS. The rate quoted for the MFS Institutional Money Market Portfolio is the annualizedseven-day yield of the fund at period end. |
The following abbreviations are used in this report and are defined:
| REIT | | Real Estate Investment Trust |
At August 31, 2019, the fund had cash collateral of $1,694,212 and other liquid securities with an aggregate value of $20,982,492 to cover any collateral or margin obligations for securities sold short. Restricted cash and/or deposits with brokers in the Statement of Assets and Liabilities are comprised of cash collateral.
See Notes to Financial Statements
18
Financial Statements
STATEMENT OF ASSETS AND LIABILITIES
At 8/31/19
This statement represents your fund’s balance sheet, which details the assets and liabilities comprising the total value of the fund.
| | | | |
| Assets | | | | |
Investments in unaffiliated issuers, at value (identified cost, $2,175,925,009) | | | $2,768,751,829 | |
Investments in affiliated issuers, at value (identified cost, $36,340,640) | | | 36,346,848 | |
Cash | | | 29,691 | |
Deposits with brokers for | | | | |
Securities sold short | | | 1,694,212 | |
Receivables for | | | | |
Investments sold | | | 4,905,682 | |
Fund shares sold | | | 13,480,282 | |
Dividends | | | 4,271,990 | |
Other assets | | | 1,991 | |
Total assets | | | $2,829,482,525 | |
| |
| Liabilities | | | | |
Payables for | | | | |
Dividends on securities sold short | | | $48,171 | |
Securities sold short, at value (proceeds received, $13,924,288) | | | 13,683,448 | |
Investments purchased | | | 5,152,348 | |
Fund shares reacquired | | | 1,944,518 | |
Payable to affiliates | | | | |
Investment adviser | | | 126,676 | |
Administrative services fee | | | 3,135 | |
Shareholder servicing costs | | | 655,669 | |
Distribution and service fees | | | 30,249 | |
Payable for independent Trustees’ compensation | | | 9,075 | |
Accrued expenses and other liabilities | | | 235,492 | |
Total liabilities | | | $21,888,781 | |
Net assets | | | $2,807,593,744 | |
| |
| Net assets consist of | | | | |
Paid-in capital | | | $2,158,521,290 | |
Total distributable earnings (loss) | | | 649,072,454 | |
Net assets | | | $2,807,593,744 | |
Shares of beneficial interest outstanding | | | 84,705,776 | |
19
Statement of Assets and Liabilities – continued
| | | | | | | | | | | | |
| | | |
| | | Net assets | | | Shares
outstanding | | | Net asset value
per share (a) | |
| Class A | | | $1,373,524,274 | | | | 42,330,822 | | | | $32.45 | |
| Class B | | | 22,759,171 | | | | 806,265 | | | | 28.23 | |
| Class C | | | 72,092,796 | | | | 2,587,780 | | | | 27.86 | |
| Class I | | | 467,859,583 | | | | 13,572,510 | | | | 34.47 | |
| Class R1 | | | 3,185,757 | | | | 114,436 | | | | 27.84 | |
| Class R2 | | | 13,415,554 | | | | 424,452 | | | | 31.61 | |
| Class R3 | | | 42,198,588 | | | | 1,304,160 | | | | 32.36 | |
| Class R4 | | | 29,218,416 | | | | 891,877 | | | | 32.76 | |
| Class R6 | | | 783,339,605 | | | | 22,673,474 | | | | 34.55 | |
| (a) | Maximum offering price per share was equal to the net asset value per share for all share classes, except for Class A, for which the maximum offering price per share was $34.43 [100 / 94.25 x $32.45]. On sales of $50,000 or more, the maximum offering price of Class A shares is reduced. A contingent deferred sales charge may be imposed on redemptions of Class A, Class B, and Class C shares. Redemption price per share was equal to the net asset value per share for Classes I, R1, R2, R3, R4, and R6. |
See Notes to Financial Statements
20
Financial Statements
STATEMENT OF OPERATIONS
Year ended 8/31/19
This statement describes how much your fund earned in investment income and accrued in expenses. It also describes any gains and/or losses generated by fund operations.
| | | | |
| Net investment income (loss) | | | | |
Income | | | | |
Dividends | | | $37,233,606 | |
Dividends from affiliated issuers | | | 877,389 | |
Other | | | 359,485 | |
Income on securities loaned | | | 251,875 | |
Foreign taxes withheld | | | (78,372 | ) |
Total investment income | | | $38,643,983 | |
Expenses | | | | |
Management fee | | | $13,492,938 | |
Distribution and service fees | | | 4,111,600 | |
Shareholder servicing costs | | | 2,073,255 | |
Administrative services fee | | | 327,034 | |
Independent Trustees’ compensation | | | 36,609 | |
Custodian fee | | | 118,460 | |
Shareholder communications | | | 142,027 | |
Audit and tax fees | | | 61,062 | |
Legal fees | | | 49,594 | |
Dividend and interest expense on securities sold short | | | 581,911 | |
Interest expense and fees | | | 13,057 | |
Miscellaneous | | | 303,196 | |
Total expenses | | | $21,310,743 | |
Reduction of expenses by investment adviser and distributor | | | (308,054 | ) |
Net expenses | | | $21,002,689 | |
Net investment income (loss) | | | $17,641,294 | |
| |
| Realized and unrealized gain (loss) | | | | |
Realized gain (loss) (identified cost basis) | | | | |
Unaffiliated issuers | | | $45,661,773 | |
Affiliated issuers | | | (16,734 | ) |
Foreign currency | | | (3,717 | ) |
Net realized gain (loss) | | | $45,641,322 | |
Change in unrealized appreciation or depreciation | | | | |
Unaffiliated issuers | | | $72,947,809 | |
Affiliated issuers | | | 2,438 | |
Securities sold short | | | 1,614,177 | |
Translation of assets and liabilities in foreign currencies | | | 45 | |
Net unrealized gain (loss) | | | $74,564,469 | |
Net realized and unrealized gain (loss) | | | $120,205,791 | |
Change in net assets from operations | | | $137,847,085 | |
See Notes to Financial Statements
21
Financial Statements
STATEMENTS OF CHANGES IN NET ASSETS
These statements describe the increases and/or decreases in net assets resulting from operations, any distributions, and any shareholder transactions.
| | | | | | | | |
| | | Year ended | |
| | | 8/31/19 | | | 8/31/18 | |
| Change in net assets | | | | | | |
| | |
| From operations | | | | | | | | |
Net investment income (loss) | | | $17,641,294 | | | | $12,999,055 | |
Net realized gain (loss) | | | 45,641,322 | | | | 202,361,180 | |
Net unrealized gain (loss) | | | 74,564,469 | | | | 132,966,174 | |
Change in net assets from operations | | | $137,847,085 | | | | $348,326,409 | |
Total distributions to shareholders (a) | | | $(199,800,134 | ) | | | $(118,520,157 | ) |
Change in net assets from fund share transactions | | | $695,524,955 | | | | $249,008,217 | |
Total change in net assets | | | $633,571,906 | | | | $478,814,469 | |
| | |
| Net assets | | | | | | | | |
At beginning of period | | | 2,174,021,838 | | | | 1,695,207,369 | |
At end of period (b) | | | $2,807,593,744 | | | | $2,174,021,838 | |
| (a) | Distributions from net investment income and from net realized gain are no longer required to be separately disclosed. For the year ended August 31, 2018, distributions from net investment income and from net realized gain were $10,130,006 and $108,390,151, respectively. |
| (b) | Parenthetical disclosure of undistributed net investment income is no longer required. For the year ended August 31, 2018, end of period net assets included undistributed net investment income of $12,453,901. |
See Notes to Financial Statements
22
Financial Statements
FINANCIAL HIGHLIGHTS
The financial highlights table is intended to help you understand the fund’s financial performance for the past 5 years. Certain information reflects financial results for a single fund share. The total returns in the table represent the rate that an investor would have earned (or lost) on an investment in the fund share class (assuming reinvestment of all distributions) held for the entire period.
| | | | | | | | | | | | | | | | | | | | |
| Class A | | Year ended | |
| | | | | |
| | | 8/31/19 | | | 8/31/18 | | | 8/31/17 | | | 8/31/16 | | | 8/31/15 | |
Net asset value, beginning of period | | | $34.18 | | | | $30.46 | | | | $26.72 | | | | $27.19 | | | | $29.19 | |
| | | |
| Income (loss) from investment operations | | | | | | | | | | | | | |
Net investment income (loss) (d) | | | $0.20 | | | | $0.20 | | | | $0.18 | (c) | | | $0.18 | | | | $0.15 | |
Net realized and unrealized gain (loss) | | | 1.05 | | | | 5.63 | | | | 4.53 | | | | 2.08 | | | | 0.13 | |
Total from investment operations | | | $1.25 | | | | $5.83 | | | | $4.71 | | | | $2.26 | | | | $0.28 | |
| | | |
| Less distributions declared to shareholders | | | | | | | | | | | | | |
From net investment income | | | $(0.16 | ) | | | $(0.17 | ) | | | $(0.16 | ) | | | $(0.14 | ) | | | $(0.13 | ) |
From net realized gain | | | (2.82 | ) | | | (1.94 | ) | | | (0.81 | ) | | | (2.59 | ) | | | (2.15 | ) |
Total distributions declared to shareholders | | | $(2.98 | ) | | | $(2.11 | ) | | | $(0.97 | ) | | | $(2.73 | ) | | | $(2.28 | ) |
Net asset value, end of period (x) | | | $32.45 | | | | $34.18 | | | | $30.46 | | | | $26.72 | | | | $27.19 | |
Total return (%) (r)(s)(t)(x) | | | 4.94 | | | | 19.89 | | | | 18.11 | (c) | | | 9.09 | | | | 0.98 | |
| | | |
Ratios (%) (to average net assets)
and Supplemental data: | | | | | | | | | | | | | |
Expenses before expense reductions (f) | | | 1.00 | | | | 1.00 | | | | 1.03 | (c) | | | 1.07 | | | | 1.05 | |
Expenses after expense reductions (f) | | | 0.98 | | | | 0.99 | | | | 1.01 | (c) | | | 1.05 | | | | 1.04 | |
Net investment income (loss) | | | 0.65 | | | | 0.62 | | | | 0.63 | (c) | | | 0.70 | | | | 0.52 | |
Portfolio turnover | | | 39 | | | | 42 | | | | 46 | | | | 68 | | | | 53 | |
Net assets at end of period (000 omitted) | | | $1,373,524 | | | | $1,184,976 | | | | $992,736 | | | | $959,812 | | | | $963,167 | |
| | | | | |
| Supplemental Ratios (%): | | | | | | | | | | | | | | | | | | | | |
Ratio of expenses to average net assets after
expense reductions excluding short sale
expenses and interest expense and fees (f) | | | 0.96 | | | | 0.97 | | | | 1.00 | (c) | | | 1.04 | | | | 1.03 | |
See Notes to Financial Statements
23
Financial Highlights – continued
| | | | | | | | | | | | | | | | | | | | |
| Class B | | Year ended | |
| | | | | |
| | | 8/31/19 | | | 8/31/18 | | | 8/31/17 | | | 8/31/16 | | | 8/31/15 | |
Net asset value, beginning of period | | | $30.19 | | | | $27.17 | | | | $23.96 | | | | $24.70 | | | | $26.78 | |
| | | | |
| Income (loss) from investment operations | | | | | | | | | | | | | | | | | |
Net investment income (loss) (d) | | | $(0.03 | ) | | | $(0.04 | ) | | | $(0.03 | )(c) | | | $(0.02 | ) | | | $(0.06 | ) |
Net realized and unrealized gain (loss) | | | 0.89 | | | | 5.00 | | | | 4.05 | | | | 1.87 | | | | 0.13 | |
Total from investment operations | | | $0.86 | | | | $4.96 | | | | $4.02 | | | | $1.85 | | | | $0.07 | |
| | | | |
| Less distributions declared to shareholders | | | | | | | | | | | | | | | | | |
From net investment income | | | $— | | | | $— | | | | $— | | | | $— | | | | $— | |
From net realized gain | | | (2.82 | ) | | | (1.94 | ) | | | (0.81 | ) | | | (2.59 | ) | | | (2.15 | ) |
Total distributions declared to shareholders | | | $(2.82 | ) | | | $(1.94 | ) | | | $(0.81 | ) | | | $(2.59 | ) | | | $(2.15 | ) |
Net asset value, end of period (x) | | | $28.23 | | | | $30.19 | | | | $27.17 | | | | $23.96 | | | | $24.70 | |
Total return (%) (r)(s)(t)(x) | | | 4.16 | | | | 19.01 | | | | 17.21 | (c) | | | 8.24 | | | | 0.25 | |
| | | | |
Ratios (%) (to average net assets)
and Supplemental data: | | | | | | | | | | | | | | | | | |
Expenses before expense reductions (f) | | | 1.75 | | | | 1.75 | | | | 1.78 | (c) | | | 1.82 | | | | 1.80 | |
Expenses after expense reductions (f) | | | 1.73 | | | | 1.74 | | | | 1.77 | (c) | | | 1.81 | | | | 1.80 | |
Net investment income (loss) | | | (0.11 | ) | | | (0.14 | ) | | | (0.12 | )(c) | | | (0.07 | ) | | | (0.23 | ) |
Portfolio turnover | | | 39 | | | | 42 | | | | 46 | | | | 68 | | | | 53 | |
Net assets at end of period (000 omitted) | | | $22,759 | | | | $26,993 | | | | $27,139 | | | | $30,324 | | | | $34,126 | |
| | | | |
| Supplemental Ratios (%): | | | | | | | | | | | | | | | | | |
Ratio of expenses to average net assets after
expense reductions excluding short sale
expenses and interest expense and fees (f) | | | 1.71 | | | | 1.72 | | | | 1.75 | (c) | | | 1.79 | | | | 1.79 | |
See Notes to Financial Statements
24
Financial Highlights – continued
| | | | | | | | | | | | | | | | | | | | |
| Class C | | Year ended | |
| | | | | |
| | | 8/31/19 | | | 8/31/18 | | | 8/31/17 | | | 8/31/16 | | | 8/31/15 | |
Net asset value, beginning of period | | | $29.84 | | | | $26.88 | | | | $23.71 | | | | $24.47 | | | | $26.55 | |
| | | | |
| Income (loss) from investment operations | | | | | | | | | | | | | | | | | |
Net investment income (loss) (d) | | | $(0.03 | ) | | | $(0.05 | ) | | | $(0.03 | )(c) | | | $(0.01 | ) | | | $(0.06 | ) |
Net realized and unrealized gain (loss) | | | 0.87 | | | | 4.95 | | | | 4.01 | | | | 1.84 | | | | 0.13 | |
Total from investment operations | | | $0.84 | | | | $4.90 | | | | $3.98 | | | | $1.83 | | | | $0.07 | |
| | | | |
| Less distributions declared to shareholders | | | | | | | | | | | | | | | | | |
From net investment income | | | $— | | | | $— | | | | $— | | | | $— | | | | $— | |
From net realized gain | | | (2.82 | ) | | | (1.94 | ) | | | (0.81 | ) | | | (2.59 | ) | | | (2.15 | ) |
Total distributions declared to shareholders | | | $(2.82 | ) | | | $(1.94 | ) | | | $(0.81 | ) | | | $(2.59 | ) | | | $(2.15 | ) |
Net asset value, end of period (x) | | | $27.86 | | | | $29.84 | | | | $26.88 | | | | $23.71 | | | | $24.47 | |
Total return (%) (r)(s)(t)(x) | | | 4.14 | | | | 18.98 | | | | 17.22 | (c) | | | 8.24 | | | | 0.26 | |
| | | | |
Ratios (%) (to average net assets)
and Supplemental data: | | | | | | | | | | | | | | | | | |
Expenses before expense reductions (f) | | | 1.75 | | | | 1.75 | | | | 1.78 | (c) | | | 1.82 | | | | 1.80 | |
Expenses after expense reductions (f) | | | 1.74 | | | | 1.74 | | | | 1.77 | (c) | | | 1.81 | | | | 1.80 | |
Net investment income (loss) | | | (0.10 | ) | | | (0.17 | ) | | | (0.12 | )(c) | | | (0.05 | ) | | | (0.23 | ) |
Portfolio turnover | | | 39 | | | | 42 | | | | 46 | | | | 68 | | | | 53 | |
Net assets at end of period (000 omitted) | | | $72,093 | | | | $56,413 | | | | $89,946 | | | | $89,160 | | | | $88,020 | |
| | | | |
| Supplemental Ratios (%): | | | | | | | | | | | | | | | | | |
Ratio of expenses to average net assets after
expense reductions excluding short sale
expenses and interest expense and fees (f) | | | 1.71 | | | | 1.72 | | | | 1.75 | (c) | | | 1.79 | | | | 1.79 | |
See Notes to Financial Statements
25
Financial Highlights – continued
| | | | | | | | | | | | | | | | | | | | |
| Class I | | Year ended | |
| | | | | |
| | | 8/31/19 | | | 8/31/18 | | | 8/31/17 | | | 8/31/16 | | | 8/31/15 | |
Net asset value, beginning of period | | | $36.12 | | | | $32.07 | | | | $28.10 | | | | $28.44 | | | | $30.43 | |
| | | | |
| Income (loss) from investment operations | | | | | | | | | | | | | | | | | |
Net investment income (loss) (d) | | | $0.30 | | | | $0.30 | | | | $0.26 | (c) | | | $0.29 | | | | $0.23 | |
Net realized and unrealized gain (loss) | | | 1.11 | | | | 5.93 | | | | 4.76 | | | | 2.15 | | | | 0.13 | |
Total from investment operations | | | $1.41 | | | | $6.23 | | | | $5.02 | | | | $2.44 | | | | $0.36 | |
| | | | |
| Less distributions declared to shareholders | | | | | | | | | | | | | | | | | |
From net investment income | | | $(0.24 | ) | | | $(0.24 | ) | | | $(0.24 | ) | | | $(0.19 | ) | | | $(0.20 | ) |
From net realized gain | | | (2.82 | ) | | | (1.94 | ) | | | (0.81 | ) | | | (2.59 | ) | | | (2.15 | ) |
Total distributions declared to shareholders | | | $(3.06 | ) | | | $(2.18 | ) | | | $(1.05 | ) | | | $(2.78 | ) | | | $(2.35 | ) |
Net asset value, end of period (x) | | | $34.47 | | | | $36.12 | | | | $32.07 | | | | $28.10 | | | | $28.44 | |
Total return (%) (r)(s)(t)(x) | | | 5.17 | | | | 20.21 | | | | 18.38 | (c) | | | 9.36 | | | | 1.23 | |
| | | | |
Ratios (%) (to average net assets)
and Supplemental data: | | | | | | | | | | | | | | | | | |
Expenses before expense reductions (f) | | | 0.75 | | | | 0.75 | | | | 0.78 | (c) | | | 0.81 | | | | 0.80 | |
Expenses after expense reductions (f) | | | 0.74 | | | | 0.74 | | | | 0.77 | (c) | | | 0.80 | | | | 0.80 | |
Net investment income (loss) | | | 0.90 | | | | 0.88 | | | | 0.88 | (c) | | | 1.07 | | | | 0.77 | |
Portfolio turnover | | | 39 | | | | 42 | | | | 46 | | | | 68 | | | | 53 | |
Net assets at end of period (000 omitted) | | | $467,860 | | | | $246,779 | | | | $122,055 | | | | $61,739 | | | | $49,768 | |
| | | | |
| Supplemental Ratios (%): | | | | | | | | | | | | | | | | | |
Ratio of expenses to average net assets after
expense reductions excluding short sale
expenses and interest expense and fees (f) | | | 0.72 | | | | 0.73 | | | | 0.75 | (c) | | | 0.79 | | | | 0.79 | |
See Notes to Financial Statements
26
Financial Highlights – continued
| | | | | | | | | | | | | | | | | | | | |
| Class R1 | | Year ended | |
| | | | | |
| | | 8/31/19 | | | 8/31/18 | | | 8/31/17 | | | 8/31/16 | | | 8/31/15 | |
Net asset value, beginning of period | | | $29.82 | | | | $26.86 | | | | $23.70 | | | | $24.45 | | | | $26.54 | |
| | | | |
| Income (loss) from investment operations | | | | | | | | | | | | | | | | | |
Net investment income (loss) (d) | | | $(0.03 | ) | | | $(0.04 | ) | | | $(0.03 | )(c) | | | $(0.02 | ) | | | $(0.06 | ) |
Net realized and unrealized gain (loss) | | | 0.87 | | | | 4.94 | | | | 4.00 | | | | 1.86 | | | | 0.12 | |
Total from investment operations | | | $0.84 | | | | $4.90 | | | | $3.97 | | | | $1.84 | | | | $0.06 | |
| | | | |
| Less distributions declared to shareholders | | | | | | | | | | | | | | | | | |
From net investment income | | | $— | | | | $— | | | | $— | | | | $— | | | | $— | |
From net realized gain | | | (2.82 | ) | | | (1.94 | ) | | | (0.81 | ) | | | (2.59 | ) | | | (2.15 | ) |
Total distributions declared to shareholders | | | $(2.82 | ) | | | $(1.94 | ) | | | $(0.81 | ) | | | $(2.59 | ) | | | $(2.15 | ) |
Net asset value, end of period (x) | | | $27.84 | | | | $29.82 | | | | $26.86 | | | | $23.70 | | | | $24.45 | |
Total return (%) (r)(s)(t)(x) | | | 4.14 | | | | 19.00 | | | | 17.19 | (c) | | | 8.29 | | | | 0.22 | |
| | | | |
Ratios (%) (to average net assets)
and Supplemental data: | | | | | | | | | | | | | | | | | |
Expenses before expense reductions (f) | | | 1.75 | | | | 1.75 | | | | 1.78 | (c) | | | 1.82 | | | | 1.80 | |
Expenses after expense reductions (f) | | | 1.74 | | | | 1.74 | | | | 1.77 | (c) | | | 1.81 | | | | 1.80 | |
Net investment income (loss) | | | (0.11 | ) | | | (0.14 | ) | | | (0.13 | )(c) | | | (0.09 | ) | | | (0.23 | ) |
Portfolio turnover | | | 39 | | | | 42 | | | | 46 | | | | 68 | | | | 53 | |
Net assets at end of period (000 omitted) | | | $3,186 | | | | $3,448 | | | | $3,103 | | | | $2,935 | | | | $3,625 | |
| | | | |
| Supplemental Ratios (%): | | | | | | | | | | | | | | | | | |
Ratio of expenses to average net assets after
expense reductions excluding short sale
expenses and interest expense and fees (f) | | | 1.71 | | | | 1.73 | | | | 1.75 | (c) | | | 1.80 | | | | 1.79 | |
See Notes to Financial Statements
27
Financial Highlights – continued
| | | | | | | | | | | | | | | | | | | | |
| Class R2 | | Year ended | |
| | | | | |
| | | 8/31/19 | | | 8/31/18 | | | 8/31/17 | | | 8/31/16 | | | 8/31/15 | |
Net asset value, beginning of period | | | $33.33 | | | | $29.75 | | | | $26.12 | | | | $26.62 | | | | $28.59 | |
| | | | |
| Income (loss) from investment operations | | | | | | | | | | | | | | | | | |
Net investment income (loss) (d) | | | $0.12 | | | | $0.11 | | | | $0.10 | (c) | | | $0.11 | | | | $0.07 | |
Net realized and unrealized gain (loss) | | | 1.02 | | | | 5.50 | | | | 4.43 | | | | 2.04 | | | | 0.14 | |
Total from investment operations | | | $1.14 | | | | $5.61 | | | | $4.53 | | | | $2.15 | | | | $0.21 | |
| | | | |
| Less distributions declared to shareholders | | | | | | | | | | | | | | | | | |
From net investment income | | | $(0.04 | ) | | | $(0.09 | ) | | | $(0.09 | ) | | | $(0.06 | ) | | | $(0.03 | ) |
From net realized gain | | | (2.82 | ) | | | (1.94 | ) | | | (0.81 | ) | | | (2.59 | ) | | | (2.15 | ) |
Total distributions declared to shareholders | | | $(2.86 | ) | | | $(2.03 | ) | | | $(0.90 | ) | | | $(2.65 | ) | | | $(2.18 | ) |
Net asset value, end of period (x) | | | $31.61 | | | | $33.33 | | | | $29.75 | | | | $26.12 | | | | $26.62 | |
Total return (%) (r)(s)(t)(x) | | | 4.66 | | | | 19.61 | | | | 17.80 | (c) | | | 8.82 | | | | 0.75 | |
| | | | |
Ratios (%) (to average net assets)
and Supplemental data: | | | | | | | | | | | | | | | | | |
Expenses before expense reductions (f) | | | 1.25 | | | | 1.25 | | | | 1.28 | (c) | | | 1.32 | | | | 1.30 | |
Expenses after expense reductions (f) | | | 1.23 | | | | 1.24 | | | | 1.27 | (c) | | | 1.31 | | | | 1.30 | |
Net investment income (loss) | | | 0.39 | | | | 0.35 | | | | 0.38 | (c) | | | 0.46 | | | | 0.27 | |
Portfolio turnover | | | 39 | | | | 42 | | | | 46 | | | | 68 | | | | 53 | |
Net assets at end of period (000 omitted) | | | $13,416 | | | | $15,202 | | | | $16,508 | | | | $15,932 | | | | $16,332 | |
| | | | |
| Supplemental Ratios (%): | | | | | | | | | | | | | | | | | |
Ratio of expenses to average net assets after
expense reductions excluding short sale
expenses and interest expense and fees (f) | | | 1.20 | | | | 1.22 | | | | 1.25 | (c) | | | 1.29 | | | | 1.29 | |
See Notes to Financial Statements
28
Financial Highlights – continued
| | | | | | | | | | | | | | | | | | | | |
| Class R3 | | Year ended | |
| | | | | |
| | | 8/31/19 | | | 8/31/18 | | | 8/31/17 | | | 8/31/16 | | | 8/31/15 | |
Net asset value, beginning of period | | | $34.11 | | | | $30.33 | | | | $26.61 | | | | $27.10 | | | | $29.10 | |
| | | | |
| Income (loss) from investment operations | | | | | | | | | | | | | | | | | |
Net investment income (loss) (d) | | | $0.20 | | | | $0.20 | | | | $0.17 | (c) | | | $0.18 | | | | $0.15 | |
Net realized and unrealized gain (loss) | | | 1.04 | | | | 5.61 | | | | 4.52 | | | | 2.06 | | | | 0.13 | |
Total from investment operations | | | $1.24 | | | | $5.81 | | | | $4.69 | | | | $2.24 | | | | $0.28 | |
| | | | |
| Less distributions declared to shareholders | | | | | | | | | | | | | | | | | |
From net investment income | | | $(0.17 | ) | | | $(0.09 | ) | | | $(0.16 | ) | | | $(0.14 | ) | | | $(0.13 | ) |
From net realized gain | | | (2.82 | ) | | | (1.94 | ) | | | (0.81 | ) | | | (2.59 | ) | | | (2.15 | ) |
Total distributions declared to shareholders | | | $(2.99 | ) | | | $(2.03 | ) | | | $(0.97 | ) | | | $(2.73 | ) | | | $(2.28 | ) |
Net asset value, end of period (x) | | | $32.36 | | | | $34.11 | | | | $30.33 | | | | $26.61 | | | | $27.10 | |
Total return (%) (r)(s)(t)(x) | | | 4.91 | | | | 19.91 | | | | 18.10 | (c) | | | 9.06 | | | | 0.99 | |
| | | | |
Ratios (%) (to average net assets)
and Supplemental data: | | | | | | | | | | | | | | | | | |
Expenses before expense reductions (f) | | | 1.00 | | | | 1.00 | | | | 1.02 | (c) | | | 1.07 | | | | 1.05 | |
Expenses after expense reductions (f) | | | 0.99 | | | | 0.99 | | | | 1.02 | (c) | | | 1.06 | | | | 1.05 | |
Net investment income (loss) | | | 0.64 | | | | 0.61 | | | | 0.62 | (c) | | | 0.71 | | | | 0.52 | |
Portfolio turnover | | | 39 | | | | 42 | | | | 46 | | | | 68 | | | | 53 | |
Net assets at end of period (000 omitted) | | | $42,199 | | | | $34,916 | | | | $28,075 | | | | $77,217 | | | | $65,775 | |
| | | | |
| Supplemental Ratios (%): | | | | | | | | | | | | | | | | | |
Ratio of expenses to average net assets after
expense reductions excluding short sale
expenses and interest expense and fees (f) | | | 0.96 | | | | 0.98 | | | | 1.00 | (c) | | | 1.04 | | | | 1.04 | |
See Notes to Financial Statements
29
Financial Highlights – continued
| | | | | | | | | | | | | | | | | | | | |
| Class R4 | | Year ended | |
| | | | | |
| | | 8/31/19 | | | 8/31/18 | | | 8/31/17 | | | 8/31/16 | | | 8/31/15 | |
Net asset value, beginning of period | | | $34.48 | | | | $30.71 | | | | $26.93 | | | | $27.39 | | | | $29.40 | |
| | | | |
| Income (loss) from investment operations | | | | | | | | | | | | | | | | | |
Net investment income (loss) (d) | | | $0.28 | | | | $0.28 | | | | $0.25 | (c) | | | $0.23 | | | | $0.22 | |
Net realized and unrealized gain (loss) | | | 1.05 | | | | 5.67 | | | | 4.57 | | | | 2.11 | | | | 0.12 | |
Total from investment operations | | | $1.33 | | | | $5.95 | | | | $4.82 | | | | $2.34 | | | | $0.34 | |
| | | | |
| Less distributions declared to shareholders | | | | | | | | | | | | | | | | | |
From net investment income | | | $(0.23 | ) | | | $(0.24 | ) | | | $(0.23 | ) | | | $(0.21 | ) | | | $(0.20 | ) |
From net realized gain | | | (2.82 | ) | | | (1.94 | ) | | | (0.81 | ) | | | (2.59 | ) | | | (2.15 | ) |
Total distributions declared to shareholders | | | $(3.05 | ) | | | $(2.18 | ) | | | $(1.04 | ) | | | $(2.80 | ) | | | $(2.35 | ) |
Net asset value, end of period (x) | | | $32.76 | | | | $34.48 | | | | $30.71 | | | | $26.93 | | | | $27.39 | |
Total return (%) (r)(s)(t)(x) | | | 5.18 | | | | 20.18 | | | | 18.40 | (c) | | | 9.36 | | | | 1.22 | |
| | | | |
Ratios (%) (to average net assets)
and Supplemental data: | | | | | | | | | | | | | | | | | |
Expenses before expense reductions (f) | | | 0.75 | | | | 0.75 | | | | 0.78 | (c) | | | 0.82 | | | | 0.80 | |
Expenses after expense reductions (f) | | | 0.74 | | | | 0.74 | | | | 0.77 | (c) | | | 0.81 | | | | 0.80 | |
Net investment income (loss) | | | 0.89 | | | | 0.86 | | | | 0.87 | (c) | | | 0.90 | | | | 0.76 | |
Portfolio turnover | | | 39 | | | | 42 | | | | 46 | | | | 68 | | | | 53 | |
Net assets at end of period (000 omitted) | | | $29,218 | | | | $27,707 | | | | $22,494 | | | | $15,799 | | | | $21,159 | |
| | | | |
| Supplemental Ratios (%): | | | | | | | | | | | | | | | | | |
Ratio of expenses to average net assets after
expense reductions excluding short sale
expenses and interest expense and fees (f) | | | 0.71 | | | | 0.73 | | | | 0.76 | (c) | | | 0.79 | | | | 0.79 | |
See Notes to Financial Statements
30
Financial Highlights – continued
| | | | | | | | | | | | | | | | | | | | |
| Class R6 | | Year ended | |
| | | | | |
| | | 8/31/19 | | | 8/31/18 | | | 8/31/17 | | | 8/31/16 | | | 8/31/15 | |
Net asset value, beginning of period | | | $36.18 | | | | $32.12 | | | | $28.13 | | | | $28.49 | | | | $30.47 | |
| | | | |
| Income (loss) from investment operations | | | | | | | | | | | | | | | | | |
Net investment income (loss) (d) | | | $0.32 | | | | $0.32 | | | | $0.29 | (c) | | | $0.58 | | | | $0.24 | |
Net realized and unrealized gain (loss) | | | 1.13 | | | | 5.95 | | | | 4.77 | | | | 1.89 | | | | 0.15 | |
Total from investment operations | | | $1.45 | | | | $6.27 | | | | $5.06 | | | | $2.47 | | | | $0.39 | |
| | | | |
| Less distributions declared to shareholders | | | | | | | | | | | | | | | | | |
From net investment income | | | $(0.26 | ) | | | $(0.27 | ) | | | $(0.27 | ) | | | $(0.24 | ) | | | $(0.22 | ) |
From net realized gain | | | (2.82 | ) | | | (1.94 | ) | | | (0.81 | ) | | | (2.59 | ) | | | (2.15 | ) |
Total distributions declared to shareholders | | | $(3.08 | ) | | | $(2.21 | ) | | | $(1.07 | ) | | | $(2.83 | ) | | | $(2.37 | ) |
Net asset value, end of period (x) | | | $34.55 | | | | $36.18 | | | | $32.12 | | | | $28.13 | | | | $28.49 | |
Total return (%) (r)(s)(t)(x) | | | 5.28 | | | | 20.29 | | | | 18.49 | (c) | | | 9.46 | | | | 1.34 | |
| | | | |
Ratios (%) (to average net assets)
and Supplemental data: | | | | | | | | | | | | | | | | | |
Expenses before expense reductions (f) | | | 0.67 | | | | 0.67 | | | | 0.69 | (c) | | | 0.70 | | | | 0.71 | |
Expenses after expense reductions (f) | | | 0.66 | | | | 0.66 | | | | 0.68 | (c) | | | 0.69 | | | | 0.70 | |
Net investment income (loss) | | | 0.98 | | | | 0.95 | | | | 0.97 | (c) | | | 2.10 | | | | 0.82 | |
Portfolio turnover | | | 39 | | | | 42 | | | | 46 | | | | 68 | | | | 53 | |
Net assets at end of period (000 omitted) | | | $783,340 | | | | $577,588 | | | | $393,153 | | | | $300,078 | | | | $6,198 | |
| | | | |
| Supplemental Ratios (%): | | | | | | | | | | | | | | | | | |
Ratio of expenses to average net assets after
expense reductions excluding short sale
expenses and interest expense and fees (f) | | | 0.63 | | | | 0.65 | | | | 0.66 | (c) | | | 0.68 | | | | 0.69 | |
| (c) | Amount reflects aone-time reimbursement of expenses by the custodian (or former custodian) without which net investment income and performance would be lower and expenses would be higher. |
| (d) | Per share data is based on average shares outstanding. |
| (f) | Ratios do not reflect reductions from fees paid indirectly, if applicable. |
| (r) | Certain expenses have been reduced without which performance would have been lower. |
| (s) | From time to time the fund may receive proceeds from litigation settlements, without which performance would be lower. Excluding the effect of the proceeds received from anon-recurring litigation settlement against Household International, Inc., the total return for the year ended August 31, 2017 would have been lower by approximately 0.85%. |
| (t) | Total returns do not include any applicable sales charges. |
| (x) | The net asset values and total returns have been calculated on net assets which include adjustments made in accordance with U.S. generally accepted accounting principles required at period end for financial reporting purposes. |
See Notes to Financial Statements
31
NOTES TO FINANCIAL STATEMENTS
(1) Business and Organization
MFS Core Equity Fund (the fund) is a diversified series of MFS Series Trust I (the trust). The trust is organized as a Massachusetts business trust and is registered under the Investment Company Act of 1940, as amended, as anopen-end management investment company.
The fund is an investment company and accordingly follows the investment company accounting and reporting guidance of the Financial Accounting Standards Board (FASB) Accounting Standards Codification Topic 946 Financial Services – Investment Companies.
(2) Significant Accounting Policies
General– The preparation of financial statements in conformity with U.S. generally accepted accounting principles requires management to make estimates and assumptions that affect the reported amounts of assets and liabilities, and disclosure of contingent assets and liabilities at the date of the financial statements and the reported amounts of increases and decreases in net assets from operations during the reporting period. Actual results could differ from those estimates. In the preparation of these financial statements, management has evaluated subsequent events occurring after the date of the fund’s Statement of Assets and Liabilities through the date that the financial statements were issued.
Balance Sheet Offsetting– The fund’s accounting policy with respect to balance sheet offsetting is that, absent an event of default by the counterparty or a termination of the agreement, the International Swaps and Derivatives Association (ISDA) Master Agreement, or similar agreement, does not result in an offset of reported amounts of financial assets and financial liabilities in the Statement of Assets and Liabilities across transactions between the fund and the applicable counterparty. The fund’s right to setoff may be restricted or prohibited by the bankruptcy or insolvency laws of the particular jurisdiction to which a specific master netting agreement counterparty is subject. Balance sheet offsetting disclosures, to the extent applicable to the fund, have been included in the fund’s Significant Accounting Policies note under the captions for each of the fund’sin-scope financial instruments and transactions.
Investment Valuations– Equity securities, including restricted equity securities and equity securities sold short, are generally valued at the last sale or official closing price on their primary market or exchange as provided by a third-party pricing service. Equity securities, for which there were no sales reported that day, are generally valued at the last quoted daily bid quotation on their primary market or exchange as provided by a third-party pricing service. Equity securities sold short, for which there were no sales reported for that day, are generally valued at the last quoted daily ask quotation on their primary market or exchange as provided by a third-party pricing service.Short-term instruments with a maturity at issuance of 60 days or less may be valued at amortized cost, which approximates market value.Open-end investment companies are generally valued at net asset value per share. Securities and other assets generally valued on the basis of information from a third-party pricing service may also be valued at a broker/dealer bid quotation. In determining values, third-party pricing services can
32
Notes to Financial Statements – continued
utilize both transaction data and market information such as yield, quality, coupon rate, maturity, type of issue, trading characteristics, and other market data. The values of foreign securities and other assets and liabilities expressed in foreign currencies are converted to U.S. dollars using the mean of bid and asked prices for rates provided by a third-party pricing service.
The Board of Trustees has delegated primary responsibility for determining or causing to be determined the value of the fund’s investments (including any fair valuation) to the adviser pursuant to valuation policies and procedures approved by the Board. If the adviser determines that reliable market quotations are not readily available, investments are valued at fair value as determined in good faith by the adviser in accordance with such procedures under the oversight of the Board of Trustees. Under the fund’s valuation policies and procedures, market quotations are not considered to be readily available for most types of debt instruments and floating rate loans and many types of derivatives. These investments are generally valued at fair value based on information from third-party pricing services. In addition, investments may be valued at fair value if the adviser determines that an investment’s value has been materially affected by events occurring after the close of the exchange or market on which the investment is principally traded (such as foreign exchange or market) and prior to the determination of the fund’s net asset value, or after the halt of trading of a specific security where trading does not resume prior to the close of the exchange or market on which the security is principally traded. Events that occur after foreign markets close (such as developments in foreign markets and significant movements in the U.S. markets) and prior to the determination of the fund’s net asset value may be deemed to have a material effect on the value of securities traded in foreign markets. Accordingly, the fund’s foreign equity securities may often be valued at fair value. The adviser generally relies on third-party pricing services or other information (such as the correlation with price movements of similar securities in the same or other markets; the type, cost and investment characteristics of the security; the business and financial condition of the issuer; and trading and other market data) to assist in determining whether to fair value and at what value to fair value an investment. The value of an investment for purposes of calculating the fund’s net asset value can differ depending on the source and method used to determine value. When fair valuation is used, the value of an investment used to determine the fund’s net asset value may differ from quoted or published prices for the same investment. There can be no assurance that the fund could obtain the fair value assigned to an investment if it were to sell the investment at the same time at which the fund determines its net asset value per share.
Various inputs are used in determining the value of the fund’s assets or liabilities. These inputs are categorized into three broad levels. In certain cases, the inputs used to measure fair value may fall into different levels of the fair value hierarchy. In such cases, an investment’s level within the fair value hierarchy is based on the lowest level of input that is significant to the fair value measurement. The fund’s assessment of the significance of a particular input to the fair value measurement in its entirety requires judgment, and considers factors specific to the investment. Level 1 includes unadjusted quoted prices in active markets for identical assets or liabilities. Level 2 includes other significant observable market-based inputs (including quoted prices for similar securities, interest rates, prepayment speed, and credit risk). Level 3 includes
33
Notes to Financial Statements – continued
unobservable inputs, which may include the adviser’s own assumptions in determining the fair value of investments. The following is a summary of the levels used as of August 31, 2019 in valuing the fund’s assets or liabilities:
| | | | | | | | | | | | | | | | |
| | | | |
| Financial Instruments | | Level 1 | | | Level 2 | | | Level 3 | | | Total | |
| Equity Securities | | | $2,768,751,829 | | | | $— | | | | $— | | | | $2,768,751,829 | |
| Mutual Funds | | | 36,346,848 | | | | — | | | | — | | | | 36,346,848 | |
| Total | | | $2,805,098,677 | | | | $— | | | | $— | | | | $2,805,098,677 | |
| Short Sales | | | $(13,683,448 | ) | | | $— | | | | $— | | | | $(13,683,448 | ) |
For further information regarding security characteristics, see the Portfolio of Investments.
The following is a reconciliation of level 3 assets for which significant unobservable inputs were used to determine fair value. The table presents the activity of level 3 securities held at the beginning and the end of the period.
| | | | |
| |
| | | Equity Securities | |
| Balance as of 8/31/18 | | | $73,250 | |
Disposition of worthless securities | | | (73,250 | ) |
| Balance as of 8/31/19 | | | $— | |
Foreign Currency Translation– Purchases and sales of foreign investments, income, and expenses are converted into U.S. dollars based upon currency exchange rates prevailing on the respective dates of such transactions or on the reporting date for foreign denominated receivables and payables. Gains and losses attributable to foreign currency exchange rates on sales of securities are recorded for financial statement purposes as net realized gains and losses on investments. Gains and losses attributable to foreign exchange rate movements on receivables, payables, income and expenses are recorded for financial statement purposes as foreign currency transaction gains and losses. That portion of both realized and unrealized gains and losses on investments that results from fluctuations in foreign currency exchange rates is not separately disclosed.
Short Sales– The fund entered into short sales whereby it sells a security it does not own in anticipation of a decline in the value of that security. The fund will realize a gain if the security price decreases and a loss if the security price increases between the date of the short sale and the date on which the fund replaces the borrowed security. Losses from short sales can exceed the proceeds of the security sold; and they can also exceed the potential loss from an ordinary buy and sell transaction. The amount of any premium, dividends, or interest the fund may be required to pay in connection with a short sale will be recognized as a fund expense. During the year ended August 31, 2019, this expense amounted to $581,911. The fund segregates cash or marketable securities in an amount that, when combined with the amount of proceeds from the short sale deposited with the broker, at least equals the current market value of the security sold short.
Security Loans– Under its Securities Lending Agency Agreement with the fund, State Street Bank and Trust Company, as lending agent, loans the securities of the fund to certain qualified institutions (the “Borrowers”) approved by the fund. Security loans
34
Notes to Financial Statements – continued
can be terminated at the discretion of either the lending agent or the fund and the related securities must be returned within the earlier of the standard trade settlement period for such securities or within three business days. The loans are collateralized by cash and/or U.S. Treasury and federal agency obligations in an amount typically at least equal to the market value of the securities loaned. On loans collateralized by cash, the cash collateral is invested in a money market fund. The market value of the loaned securities is determined at the close of business of the fund and any additional required collateral is delivered to the fund on the next business day. The lending agent provides the fund with indemnification against Borrower default. In the event of Borrower default, the lending agent will, for the benefit of the fund, either purchase securities identical to those loaned or, when such purchase is commercially impracticable, pay the fund the market value of the loaned securities. In return, the lending agent assumes the fund’s rights to the related collateral. If the collateral value is less than the cost to purchase identical securities, the lending agent is responsible for the shortfall, but only to the extent that such shortfall is not due to a decline in collateral value resulting from collateral reinvestment for which the fund bears the risk of loss. A portion of the income generated upon investment of the collateral is remitted to the Borrowers, and the remainder is allocated between the fund and the lending agent. On loans collateralized by U.S. Treasury and/or federal agency obligations, a fee is received from the Borrower, and is allocated between the fund and the lending agent. Income from securities lending is separately reported in the Statement of Operations. The dividend and interest income earned on the securities loaned is accounted for in the same manner as other dividend and interest income. At August 31, 2019, there were no securities on loan or collateral outstanding.
Indemnifications– Under the fund’s organizational documents, its officers and Trustees may be indemnified against certain liabilities and expenses arising out of the performance of their duties to the fund. Additionally, in the normal course of business, the fund enters into agreements with service providers that may contain indemnification clauses. The fund’s maximum exposure under these agreements is unknown as this would involve future claims that may be made against the fund that have not yet occurred.
Investment Transactions and Income– Investment transactions are recorded on the trade date. Dividends received in cash are recorded on theex-dividend date. Certain dividends from foreign securities will be recorded when the fund is informed of the dividend if such information is obtained subsequent to theex-dividend date. Dividend payments received in additional securities are recorded on theex-dividend date in an amount equal to the value of the security on such date.
The fund may receive proceeds from litigation settlements. Any proceeds received from litigation involving portfolio holdings are reflected in the Statement of Operations in realized gain/loss if the security has been disposed of by the fund or in unrealized gain/loss if the security is still held by the fund. Any other proceeds from litigation not related to portfolio holdings are reflected as other income in the Statement of Operations.
Tax Matters and Distributions– The fund intends to qualify as a regulated investment company, as defined under Subchapter M of the Internal Revenue Code, and to distribute all of its taxable income, including realized capital gains. As a result,
35
Notes to Financial Statements – continued
no provision for federal income tax is required. The fund’s federal tax returns, when filed, will remain subject to examination by the Internal Revenue Service for a three year period. Management has analyzed the fund’s tax positions taken on federal and state tax returns for all open tax years and does not believe that there are any uncertain tax positions that require recognition of a tax liability. Foreign taxes, if any, have been accrued by the fund in the accompanying financial statements in accordance with the applicable foreign tax law. Foreign income taxes may be withheld by certain countries in which the fund invests. Additionally, capital gains realized by the fund on securities issued in or by certain foreign countries may be subject to capital gains tax imposed by those countries.
Distributions to shareholders are recorded on theex-dividend date. Income and capital gain distributions are determined in accordance with income tax regulations, which may differ from U.S. generally accepted accounting principles. Certain capital accounts in the financial statements are periodically adjusted for permanent differences in order to reflect their tax character. These adjustments have no impact on net assets or net asset value per share. Temporary differences which arise from recognizing certain items of income, expense, gain or loss in different periods for financial statement and tax purposes will reverse at some time in the future. Distributions in excess of net investment income or net realized gains are temporary overdistributions for financial statement purposes resulting from differences in the recognition or classification of income or distributions for financial statement and tax purposes.
Book/tax differences primarily relate to wash sale loss deferrals and treating a portion of the proceeds from redemptions as a distribution for tax purposes.
The tax character of distributions declared to shareholders for the last two fiscal years is as follows:
| | | | | | | | |
| | |
| | | Year ended
8/31/19 | | | Year ended
8/31/18 | |
Ordinary income (including any
short-term capital gains) | | | $27,039,464 | | | | $63,295,048 | |
| Long-term capital gains | | | 172,760,670 | | | | 55,225,109 | |
| Total distributions | | | $199,800,134 | | | | $118,520,157 | |
The federal tax cost and the tax basis components of distributable earnings were as follows:
| | | | |
| |
| As of 8/31/19 | | | |
| |
| Cost of investments | | | $2,206,809,320 | |
| Gross appreciation | | | 659,608,650 | |
| |
| Gross depreciation | | | (75,002,741 | ) |
| Net unrealized appreciation (depreciation) | | | $584,605,909 | |
| |
| Undistributed ordinary income | | | 21,523,258 | |
| Undistributed long-term capital gain | | | 42,076,042 | |
| Other temporary differences | | | 867,245 | |
Multiple Classes of Shares of Beneficial Interest– The fund offers multiple classes of shares, which differ in their respective distribution and service fees. The fund’s income, realized and unrealized gain (loss), and common expenses are allocated to
36
Notes to Financial Statements – continued
shareholders based on the daily net assets of each class. Dividends are declared separately for each class. Differences in per share dividend rates are generally due to differences in separate class expenses. Class B shares will convert to Class A shares approximately eight years after purchase. Class C shares will convert to Class A shares approximately ten years after purchase. The fund’s distributions declared to shareholders as reported in the Statements of Changes in Net Assets are presented by class as follows:
| | | | | | | | | | | | | | | | |
| | | From net investment
income | | | From net realized
gain | |
| | | | |
| | | Year
ended
8/31/19 | | | Year
ended
8/31/18 | | | Year
ended
8/31/19 | | | Year
ended
8/31/18 | |
| Class A | | | $5,730,310 | | | | $5,294,029 | | | | $100,135,888 | | | | $61,975,380 | |
| Class B | | | — | | | | — | | | | 2,489,868 | | | | 1,817,848 | |
| Class C | | | — | | | | — | | | | 5,804,466 | | | | 6,378,072 | |
| Class I | | | 2,052,976 | | | | 1,130,413 | | | | 23,830,597 | | | | 8,961,582 | |
| Class R1 | | | — | | | | — | | | | 326,330 | | | | 223,893 | |
| Class R2 | | | 16,997 | | | | 49,766 | | | | 1,200,797 | | | | 1,036,306 | |
| Class R3 | | | 194,379 | | | | 88,607 | | | | 3,241,648 | | | | 1,845,694 | |
| Class R4 | | | 189,751 | | | | 177,188 | | | | 2,279,557 | | | | 1,420,076 | |
| Class R6 | | | 4,415,385 | | | | 3,390,003 | | | | 47,891,185 | | | | 24,731,300 | |
| Total | | | $12,599,798 | | | | $10,130,006 | | | | $187,200,336 | | | | $108,390,151 | |
(3) Transactions with Affiliates
Investment Adviser– The fund has an investment advisory agreement with MFS to provide overall investment management and related administrative services and facilities to the fund. For the period September 1, 2018 through July 31, 2019, the management fee was computed daily and paid monthly at the following annual rates based on the fund’s average daily net assets:
| | | | |
| Up to $500 million | | | 0.65 | % |
| In excess of $500 million and up to $2.5 billion | | | 0.55 | % |
| In excess of $2.5 billion | | | 0.50 | % |
Effective August 1, 2019, the management fee is computed daily and paid monthly at the following annual rates based on the fund’s average daily net assets:
| | | | |
| Up to $500 million | | | 0.65 | % |
| In excess of $500 million and up to $2.5 billion | | | 0.55 | % |
| In excess of $2.5 billion and up to $5 billion | | | 0.50 | % |
| In excess of $5 billion and up to $10 billion | | | 0.47 | % |
| In excess of $10 billion | | | 0.45 | % |
MFS has agreed in writing to reduce its management fee by a specified amount if certain MFS mutual fund assets exceed thresholds agreed to by MFS and the fund’s Board of Trustees. For the year ended August 31, 2019, this management fee reduction amounted to $229,039, which is included in the reduction of total expenses in the Statement of Operations. The management fee incurred for the year ended August 31, 2019 was equivalent to an annual effective rate of 0.56% of the fund’s average daily net assets.
37
Notes to Financial Statements – continued
Distributor– MFS Fund Distributors, Inc. (MFD), a wholly-owned subsidiary of MFS, as distributor, received $425,742 for the year ended August 31, 2019, as its portion of the initial sales charge on sales of Class A shares of the fund.
The Board of Trustees has adopted a distribution plan for certain share classes pursuant to Rule12b-1 of the Investment Company Act of 1940.
The fund’s distribution plan provides that the fund will pay MFD for services provided by MFD and financial intermediaries in connection with the distribution and servicing of certain share classes. One component of the plan is a distribution fee paid to MFD and another component of the plan is a service fee paid to MFD. MFD may subsequently pay all, or a portion, of the distribution and/or service fees to financial intermediaries.
Distribution Plan Fee Table:
| | | | | | | | | | | | | | | | | | | | |
| | | | | |
| | | Distribution
Fee Rate (d) | | | Service
Fee Rate (d) | | | Total
Distribution
Plan (d) | | | Annual
Effective
Rate (e) | | | Distribution
and Service
Fee | |
| Class A | | | — | | | | 0.25% | | | | 0.25% | | | | 0.24% | | | | $3,047,512 | |
| Class B | | | 0.75% | | | | 0.25% | | | | 1.00% | | | | 0.99% | | | | 244,750 | |
| Class C | | | 0.75% | | | | 0.25% | | | | 1.00% | | | | 1.00% | | | | 626,463 | |
| Class R1 | | | 0.75% | | | | 0.25% | | | | 1.00% | | | | 1.00% | | | | 31,861 | |
| Class R2 | | | 0.25% | | | | 0.25% | | | | 0.50% | | | | 0.49% | | | | 66,991 | |
| Class R3 | | | — | | | | 0.25% | | | | 0.25% | | | | 0.25% | | | | 94,023 | |
| Total Distribution and Service Fees | | | | | | | | | | | | $4,111,600 | |
| (d) | In accordance with the distribution plan for certain classes, the fund pays distribution and/or service fees equal to these annual percentage rates of each class’s average daily net assets. The distribution and service fee rates disclosed by class represent the current rates in effect at the end of the reporting period. Any rate changes, if applicable, are detailed below. |
| (e) | The annual effective rates represent actual fees incurred under the distribution plan for the year ended August 31, 2019 based on each class’s average daily net assets. MFD has voluntarily agreed to rebate a portion of each class’s 0.25% service fee attributable to accounts for which MFD retains the 0.25% service fee except for accounts attributable to MFS or its affiliates’ seed money. For the year ended August 31, 2019, this rebate amounted to $75,921, $1,311, $526, and $1,257 for Class A, Class B, Class C, and Class R2, respectively, and is included in the reduction of total expenses in the Statement of Operations. |
Certain Class A shares are subject to a contingent deferred sales charge (CDSC) in the event of a shareholder redemption within 18 months of purchase. Class B shares are subject to a CDSC in the event of a shareholder redemption within six years of purchase. Class C shares are subject to a CDSC in the event of a shareholder redemption within 12 months of purchase. All contingent deferred sales charges are paid to MFD and during the year ended August 31, 2019, were as follows:
| | | | |
| |
| | | Amount | |
| Class A | | | $13,367 | |
| Class B | | | 15,671 | |
| Class C | | | 7,206 | |
Shareholder Servicing Agent– MFS Service Center, Inc. (MFSC), a wholly-owned subsidiary of MFS, receives a fee from the fund for its services as shareholder servicing agent calculated as a percentage of the average daily net assets of the fund as
38
Notes to Financial Statements – continued
determined periodically under the supervision of the fund’s Board of Trustees. For the year ended August 31, 2019, the fee was $368,855, which equated to 0.0156% annually of the fund’s average daily net assets. MFSC also receives payment from the fund forout-of-pocket expenses,sub-accounting and other shareholder servicing costs which may be paid to affiliated and unaffiliated service providers. Class R6 shares do not incursub-accounting fees. For the year ended August 31, 2019, theseout-of-pocket expenses,sub-accounting and other shareholder servicing costs amounted to $1,704,400.
Administrator– MFS provides certain financial, legal, shareholder communications, compliance, and other administrative services to the fund. Under an administrative services agreement, the fund reimburses MFS the costs incurred to provide these services. The fund is charged an annual fixed amount of $17,500 plus a fee based on average daily net assets. The administrative services fee incurred for the year ended August 31, 2019 was equivalent to an annual effective rate of 0.0138% of the fund’s average daily net assets.
Trustees’ and Officers’ Compensation– The fund pays compensation to independent Trustees in the form of a retainer, attendance fees, and additional compensation to Board and Committee chairpersons. The fund does not pay compensation directly to Trustees or officers of the fund who are also officers of the investment adviser, all of whom receive remuneration from MFS for their services to the fund. Certain officers and Trustees of the fund are officers or directors of MFS, MFD, and MFSC.
Prior to December 31, 2001, the fund had an unfunded defined benefit plan (“DB plan”) for independent Trustees. As of December 31, 2001, the Board took action to terminate the DB plan with respect to then-current and any future independent Trustees, such that the DB plan covers only certain of those former independent Trustees who retired on or before December 31, 2001. Effective January 1, 2002, accrued benefits under the DB plan for then-current independent Trustees who continued were credited to an unfunded retirement deferral plan (the “Retirement Deferral plan”), which was established for and exists solely with respect to these credited amounts, and is not available for other deferrals by these or other independent Trustees. Although the Retirement Deferral plan is unfunded, amounts deferred under the plan are periodically adjusted for investment experience as if they had been invested in shares of the fund. The DB plan resulted in a pension expense of $1,620 and the Retirement Deferral plan, which terminated on December 31, 2018, resulted in a net decrease in expense of $5,905. Both amounts are included in “Independent Trustees’ compensation” in the Statement of Operations for the year ended August 31, 2019. The liability for deferred retirement benefits payable to those former independent Trustees under the DB Plan amounted to $9,064 at August 31, 2019, and is included in “Payable for independent Trustees’ compensation” in the Statement of Assets and Liabilities.
Other– This fund and certain other funds managed by MFS (the funds) had entered into a service agreement (the ISO Agreement) which provided for payment of fees solely by the funds to Tarantino LLC in return for the provision of services of an Independent Senior Officer (ISO) for the funds. Frank L. Tarantino served as the ISO and
39
Notes to Financial Statements – continued
was an officer of the funds and the sole member of Tarantino LLC. Effective June 30, 2019, Mr. Tarantino retired from his position as ISO for the funds, and the ISO Agreement was terminated. For the year ended August 31, 2019, the fee paid by the fund under this agreement was $4,151 and is included in “Miscellaneous” expense in the Statement of Operations. MFS had agreed to bear all expenses associated with office space, other administrative support, and supplies provided to the ISO.
The fund invests in the MFS Institutional Money Market Portfolio which is managed by MFS and seeks current income consistent with preservation of capital and liquidity. This money market fund does not pay a management fee to MFS.
The fund is permitted to engage in purchase and sale transactions with funds and accounts for which MFS serves as investment adviser orsub-adviser (“cross-trades”) pursuant to a policy adopted by the Board of Trustees. This policy has been designed to ensure that cross-trades conducted by the fund comply with Rule17a-7 under the Investment Company Act of 1940. During the year ended August 31, 2019, the fund engaged in purchase and sale transactions pursuant to this policy, which amounted to $1,782,580 and $1,382,796, respectively. The sales transactions resulted in net realized gains (losses) of $33,394.
The adviser has voluntarily undertaken to reimburse the fund from its own resources on a quarterly basis for the cost of investment research embedded in the cost of the fund’s securities trades. This agreement may be rescinded at any time. For the year ended August 31, 2019, this reimbursement amounted to $151,656, which is included in “Other” income in the Statement of Operations.
(4) Portfolio Securities
For the year ended August 31, 2019, purchases and sales of investments, other than short sales and short-term obligations, aggregated $1,429,970,849 and $920,216,686, respectively.
(5) Shares of Beneficial Interest
The fund’s Declaration of Trust permits the Trustees to issue an unlimited number of full and fractional shares of beneficial interest. Transactions in fund shares were as follows:
| | | | | | | | | | | | | | | | |
| | | Year ended
8/31/19 | | | Year ended
8/31/18 | |
| | | | |
| | | Shares | | | Amount | | | Shares | | | Amount | |
| Shares sold | | | | | | | | | | | | | | | | |
Class A | | | 9,634,178 | | | | $300,587,873 | | | | 5,491,477 | | | | $174,636,099 | |
Class B | | | 108,329 | | | | 2,957,560 | | | | 105,996 | | | | 3,002,223 | |
Class C | | | 1,116,113 | | | | 29,419,493 | | | | 543,749 | | | | 15,277,509 | |
Class I | | | 10,576,543 | | | | 346,152,292 | | | | 4,501,467 | | | | 152,069,519 | |
Class R1 | | | 19,278 | | | | 514,159 | | | | 16,033 | | | | 450,900 | |
Class R2 | | | 140,877 | | | | 4,281,134 | | | | 78,215 | | | | 2,431,816 | |
Class R3 | | | 558,827 | | | | 17,349,962 | | | | 382,260 | | | | 12,171,048 | |
Class R4 | | | 235,627 | | | | 7,596,808 | | | | 125,527 | | | | 4,042,161 | |
Class R6 | | | 8,080,095 | | | | 268,741,520 | | | | 4,974,501 | | | | 168,636,329 | |
| | | 30,469,867 | | | | $977,600,801 | | | | 16,219,225 | | | | $532,717,604 | |
40
Notes to Financial Statements – continued
| | | | | | | | | | | | | | | | |
| | | Year ended
8/31/19 | | | Year ended
8/31/18 | |
| | | | |
| | | Shares | | | Amount | | | Shares | | | Amount | |
Shares issued to shareholders in
reinvestment of distributions | | | | | | | | | | | | | | | | |
Class A | | | 3,617,902 | | | | $102,241,924 | | | | 2,102,570 | | | | $64,696,076 | |
Class B | | | 98,656 | | | | 2,438,781 | | | | 65,187 | | | | 1,780,902 | |
Class C | | | 228,301 | | | | 5,570,537 | | | | 229,209 | | | | 6,190,943 | |
Class I | | | 818,315 | | | | 24,524,913 | | | | 297,420 | | | | 9,651,266 | |
Class R1 | | | 13,385 | | | | 326,330 | | | | 8,295 | | | | 223,888 | |
Class R2 | | | 42,497 | | | | 1,172,074 | | | | 34,320 | | | | 1,031,307 | |
Class R3 | | | 121,888 | | | | 3,436,027 | | | | 63,007 | | | | 1,934,301 | |
Class R4 | | | 86,084 | | | | 2,452,539 | | | | 51,558 | | | | 1,597,264 | |
Class R6 | | | 1,640,473 | | | | 49,246,989 | | | | 790,253 | | | | 25,675,328 | |
| | | 6,667,501 | | | | $191,410,114 | | | | 3,641,819 | | | | $112,781,275 | |
| | | | |
| Shares reacquired | | | | | | | | | | | | | | | | |
Class A | | | (5,585,845 | ) | | | $(172,873,286 | ) | | | (5,525,286 | ) | | | $(176,652,711 | ) |
Class B | | | (294,676 | ) | | | (7,961,871 | ) | | | (276,080 | ) | | | (7,828,387 | ) |
Class C | | | (647,045 | ) | | | (17,059,886 | ) | | | (2,229,182 | ) | | | (61,364,135 | ) |
Class I | | | (4,654,776 | ) | | | (148,719,791 | ) | | | (1,772,545 | ) | | | (59,813,814 | ) |
Class R1 | | | (33,857 | ) | | | (870,193 | ) | | | (24,215 | ) | | | (679,704 | ) |
Class R2 | | | (215,066 | ) | | | (6,465,638 | ) | | | (211,365 | ) | | | (6,644,813 | ) |
Class R3 | | | (400,269 | ) | | | (12,423,690 | ) | | | (347,308 | ) | | | (11,021,902 | ) |
Class R4 | | | (233,321 | ) | | | (7,058,208 | ) | | | (106,173 | ) | | | (3,416,345 | ) |
Class R6 | | | (3,009,716 | ) | | | (100,053,397 | ) | | | (2,043,451 | ) | | | (69,068,851 | ) |
| | | (15,074,571 | ) | | | $(473,485,960 | ) | | | (12,535,605 | ) | | | $(396,490,662 | ) |
| | | | |
| Net change | | | | | | | | | | | | | | | | |
Class A | | | 7,666,235 | | | | $229,956,511 | | | | 2,068,761 | | | | $62,679,464 | |
Class B | | | (87,691 | ) | | | (2,565,530 | ) | | | (104,897 | ) | | | (3,045,262 | ) |
Class C | | | 697,369 | | | | 17,930,144 | | | | (1,456,224 | ) | | | (39,895,683 | ) |
Class I | | | 6,740,082 | | | | 221,957,414 | | | | 3,026,342 | | | | 101,906,971 | |
Class R1 | | | (1,194 | ) | | | (29,704 | ) | | | 113 | | | | (4,916 | ) |
Class R2 | | | (31,692 | ) | | | (1,012,430 | ) | | | (98,830 | ) | | | (3,181,690 | ) |
Class R3 | | | 280,446 | | | | 8,362,299 | | | | 97,959 | | | | 3,083,447 | |
Class R4 | | | 88,390 | | | | 2,991,139 | | | | 70,912 | | | | 2,223,080 | |
Class R6 | | | 6,710,852 | | | | 217,935,112 | | | | 3,721,303 | | | | 125,242,806 | |
| | | 22,062,797 | | | | $695,524,955 | | | | 7,325,439 | | | | $249,008,217 | |
Class T shares were not publicly available for sale during the period. Please see the fund’s prospectus for details.
Effective June 1, 2019, purchases of the fund’s Class B shares are closed to new and existing investors subject to certain exceptions. Please see the fund’s prospectus for details.
(6) Line of Credit
The fund and certain other funds managed by MFS participate in a $1.25 billion unsecured committed line of credit, subject to a $1 billion sublimit, provided by a
41
Notes to Financial Statements – continued
syndicate of banks under a credit agreement. Borrowings may be made for temporary financing needs. Interest is charged to each fund, based on its borrowings, generally at a rate equal to the highest of one month LIBOR, the Federal Funds Effective Rate and the Overnight Bank Funding Rate, plus an agreed upon spread. A commitment fee, based on the average daily, unused portion of the committed line of credit, is allocated among the participating funds. In addition, the fund and other funds managed by MFS have established unsecured uncommitted borrowing arrangements with certain banks for temporary financing needs. Interest is charged to each fund, based on its borrowings, at rates equal to customary reference rates plus an agreed upon spread. For the year ended August 31, 2019, the fund’s commitment fee and interest expense were $12,607 and $0, respectively, and are included in “Interest expense and fees” in the Statement of Operations.
(7) Investments in Affiliated Issuers
An affiliated issuer may be considered one in which the fund owns 5% or more of the outstanding voting securities, or a company which is under common control. For the purposes of this report, the following were affiliated issuers:
| | | | | | | | | | | | | | | | | | | | | | | | |
| | | | | | |
| Affiliated Issuers | | Beginning
Value | | | Purchases | | | Sales
Proceeds | | | Realized
Gain
(Loss) | | | Change in
Unrealized
Appreciation or
Depreciation | | | Ending
Value | |
| MFS Institutional Money Market Portfolio | | | $30,298,308 | | | | $640,567,305 | | | | $634,504,469 | | | | $(16,734 | ) | | | $2,438 | | | | $36,346,848 | |
| | | | | | |
| Affiliated Issuers | | | | | | | | | | | | | | Dividend
Income | | | Capital Gain
Distributions | |
| MFS Institutional Money Market Portfolio | | | | | | | | | | | | | | | | $877,389 | | | | $— | |
42
REPORT OF INDEPENDENT REGISTERED PUBLIC ACCOUNTING FIRM
To the Shareholders of MFS Core Equity Fund and the Board of Trustees of MFS Series Trust I
Opinion on the Financial Statements
We have audited the accompanying statement of assets and liabilities of MFS Core Equity Fund (the “Fund”) (one of the funds constituting MFS Series Trust I (the “Trust”)), including the portfolio of investments, as of August 31, 2019,and the related statement of operations for the year then ended, the statements of changes in net assets for each of the two years in the period then ended, the financial highlights for each of the five years in the period then ended and the related notes (collectively referred to as the “financial statements”). In our opinion, the financial statements present fairly, in all material respects, the financial position of the Fund (one of the funds constituting MFS Series Trust I) at August 31, 2019, the results of its operations for the year then ended, the changes in its net assets for each of the two years in the period then ended and its financial highlights for each of the five years in the period then ended, in conformity with U.S. generally accepted accounting principles.
Basis for Opinion
These financial statements are the responsibility of the Trust’s management. Our responsibility is to express an opinion on the Fund’s financial statements based on our audits. We are a public accounting firm registered with the Public Company Accounting Oversight Board (United States) (“PCAOB”) and are required to be independent with respect to the Trust in accordance with the U.S. federal securities laws and the applicable rules and regulations of the Securities and Exchange Commission and the PCAOB.
We conducted our audits in accordance with the standards of the PCAOB. Those standards require that we plan and perform the audit to obtain reasonable assurance about whether the financial statements are free of material misstatement, whether due to error or fraud. The Trust is not required to have, nor were we engaged to perform, an audit of the Trust’s internal control over financial reporting. As part of our audits we are required to obtain an understanding of internal control over financial reporting but not for the purpose of expressing an opinion on the effectiveness of the Trust’s internal control over financial reporting. Accordingly, we express no such opinion.
Our audits included performing procedures to assess the risks of material misstatement of the financial statements, whether due to error or fraud, and performing procedures that respond to those risks. Such procedures included examining, on a test basis, evidence regarding the amounts and disclosures in the financial statements. Our procedures included confirmation of securities owned as of August 31, 2019,by correspondence with the custodian andothers or by other appropriate auditing procedures where replies from others were not received. Our audits also included
43
Report of Independent Registered Public Accounting Firm – continued
evaluating the accounting principles used and significant estimates made by management, as well as evaluating the overall presentation of the financial statements. We believe that our audits provide a reasonable basis for our opinion.

We have served as the auditor of one or more MFS investment companies since 1993.
Boston, Massachusetts
October 17, 2019
44
TRUSTEES AND OFFICERS — IDENTIFICATION AND BACKGROUND
The Trustees and Officers of the Trust, as of October 1, 2019, are listed below, together with their principal occupations during the past five years. (Their titles may have varied during that period.) The address of each Trustee and Officer is 111 Huntington Avenue, Boston, Massachusetts 02199-7618.
| | | | | | | | | | |
Name, Age | | Position(s)
Held
with Fund | | Trustee/Officer
Since (h) | | Number of
MFS Funds
overseen
by the
Trustee | | Principal
Occupations During the Past Five Years | | Other
Directorships
During the Past
Five Years (j) |
| INTERESTED TRUSTEES |
Robert J. Manning (k)
(age 55) | | Trustee | | February 2004 | | 135 | | Massachusetts Financial Services Company, Executive Chairman (since January 2017); Director; Chairman of the Board; Chief Executive Officer (until 2015);Co-Chief Executive Officer (2015-2016) | | N/A |
| | | | | |
Robin A. Stelmach (k) (age 58) | | Trustee | | January 2014 | | 135 | | Massachusetts Financial Services Company, Vice Chair (since January 2017); Chief Operating Officer and Executive Vice President (until January 2017) | | N/A |
| INDEPENDENT TRUSTEES |
John P. Kavanaugh (age 64) | | Trustee and Chair of Trustees | | January 2009 | | 135 | | Private investor | | N/A |
| | | | | |
Steven E. Buller (age 68) | | Trustee | | February 2014 | | 135 | | Financial Accounting Standards Advisory Council, Chairman (2014-2015); Public Company Accounting Oversight Board, Standing Advisory Group, Member (until 2014); BlackRock, Inc. (investment management), Managing Director (until 2014), BlackRock Finco UK (investment management), Director (until 2014) | | N/A |
45
Trustees and Officers – continued
| | | | | | | | | | |
Name, Age | | Position(s)
Held
with Fund | | Trustee/Officer
Since (h) | | Number of
MFS Funds
overseen
by the
Trustee | | Principal
Occupations During the Past Five Years | | Other
Directorships
During the Past
Five Years (j) |
John A. Caroselli (age 65) | | Trustee | | March 2017 | | 135 | | JC Global Advisors, LLC (management consulting), President (since 2015); First Capital Corporation (commercial finance), Executive Vice President (until 2015) | | N/A |
| | | | | |
Maureen R. Goldfarb (age 64) | | Trustee | | January 2009 | | 135 | | Private investor | | N/A |
| | | | | |
Michael Hegarty
(age 74) | | Trustee | | December 2004 | | 135 | | Private investor | | Rouse Properties Inc., Director (until 2016); Capmark Financial Group Inc., Director (until 2015) |
| | | | | |
Peter D. Jones
(age 64) | | Trustee | | January 2019 | | 135 | | Franklin Templeton Distributors, Inc. (investment management), President (until 2015); Franklin Templeton Institutional, LLC (investment management), Chairman (until 2015) | | N/A |
| | | | | |
James W. Kilman, Jr. (age 58) | | Trustee | | January 2019 | | 135 | | Burford Capital Limited (finance and investment management), Chief Financial Officer (since 2019); KielStrand Capital LLC (family office and merchant bank), Chief Executive Officer (since 2016); Morgan Stanley & Co. (financial services), Vice Chairman of Investment Banking,Co-Head of Diversified Financials Coverage – Financial Institutions Investment Banking Group (until 2016) | | Alpha-En Corporation, Director (since 2016) |
46
Trustees and Officers – continued
| | | | | | | | | | |
Name, Age | | Position(s)
Held
with Fund | | Trustee/Officer
Since (h) | | Number of
MFS Funds
overseen
by the
Trustee | | Principal
Occupations During the Past Five Years | | Other
Directorships
During the Past
Five Years (j) |
Clarence Otis, Jr. (age 63) | | Trustee | | March 2017 | | 135 | | Darden Restaurants, Inc., Chief Executive Officer (until 2014) | | VF Corporation, Director; Verizon Communications, Inc., Director; The Travelers Companies, Director; Federal Reserve Bank of Atlanta, Director (until 2015) |
| | | | | |
Maryanne L. Roepke (age 63) | | Trustee | | May 2014 | | 135 | | American Century Investments (investment management), Senior Vice President and Chief Compliance Officer (until 2014) | | N/A |
| | | | | |
Laurie J. Thomsen
(age 62) | | Trustee | | March 2005 | | 135 | | Private investor | | The Travelers Companies, Director; Dycom Industries, Inc., Director (since 2015) |
| | | | | | | | |
Name, Age | | Position(s) Held
with Fund | | Trustee/Officer
Since (h) | | Number of
MFS Funds
for which
the Person
is an Officer | | Principal
Occupations During
the Past Five Years |
| OFFICERS | | | | | | | | |
Christopher R. Bohane (k) (age 45) | | Assistant Secretary and Assistant Clerk | | July 2005 | | 135 | | Massachusetts Financial Services Company, Vice President and Assistant General Counsel |
| | | | |
Kino Clark (k) (age 51) | | Assistant Treasurer | | January 2012 | | 135 | | Massachusetts Financial Services Company, Vice President |
47
Trustees and Officers – continued
| | | | | | | | |
Name, Age | | Position(s) Held
with Fund | | Trustee/Officer
Since (h) | | Number of
MFS Funds
for which
the Person
is an Officer | | Principal
Occupations During
the Past Five Years |
John W. Clark, Jr. (k) (age 52) | | Assistant Treasurer | | April 2017 | | 135 | | Massachusetts Financial Services Company, Vice President (since March 2017); Deutsche Bank (financial services), Department Head – Treasurer’s Office (until February 2017) |
| | | | |
Thomas H. Connors (k) (age 60) | | Assistant Secretary and Assistant Clerk | | September 2012 | | 135 | | Massachusetts Financial Services Company, Vice President and Senior Counsel |
| | | | |
David L. DiLorenzo (k)
(age 51) | | President | | July 2005 | | 135 | | Massachusetts Financial Services Company, Senior Vice President |
| | | | |
Heidi W. Hardin (k)
(age 52) | | Secretary and Clerk | | April 2017 | | 135 | | Massachusetts Financial Services Company, Executive Vice President and General Counsel (since March 2017); Harris Associates (investment management), General Counsel (from September 2015 to January 2017); Janus Capital Management LLC (investment management), Senior Vice President and General Counsel (until September 2015) |
| | | | |
Brian E. Langenfeld (k)
(age 46) | | Assistant
Secretary and Assistant Clerk | | June 2006 | | 135 | | Massachusetts Financial Services Company, Vice President and Senior Counsel |
| | | | |
Amanda S. Mooradian (k)
(age 40) | | Assistant
Secretary and Assistant Clerk | | September 2018 | | 135 | | Massachusetts Financial Services Company, Assistant Vice President and Counsel |
48
Trustees and Officers – continued
| | | | | | | | |
Name, Age | | Position(s) Held
with Fund | | Trustee/Officer
Since (h) | | Number of
MFS Funds
for which
the Person
is an Officer | | Principal
Occupations During
the Past Five Years |
Susan A. Pereira (k)
(age 48) | | Assistant
Secretary and Assistant Clerk | | July 2005 | | 135 | | Massachusetts Financial Services Company, Vice President and Assistant General Counsel |
| | | | |
Kasey L. Phillips (k)
(age 48) | | Assistant Treasurer | | September 2012 | | 135 | | Massachusetts Financial Services Company, Vice President |
| | | | |
Matthew A. Stowe (k)
(age 44) | | Assistant Secretary and Assistant Clerk | | October 2014 | | 135 | | Massachusetts Financial Services Company, Vice President and Assistant General Counsel |
| | | | |
Martin J. Wolin (k)
(age 52) | | Chief Compliance Officer | | July 2015 | | 135 | | Massachusetts Financial Services Company, Senior Vice President and Chief Compliance Officer (since July 2015); Mercer (financial service provider), Chief Risk and Compliance Officer, North America and Latin America (until June 2015) |
| | | | |
James O. Yost (k)
(age 59) | | Treasurer | | September 1990 | | 135 | | Massachusetts Financial Services Company, Senior Vice President |
| (h) | Date first appointed to serve as Trustee/officer of an MFS Fund. Each Trustee has served continuously since appointment unless indicated otherwise. For the period from December 15, 2004 until February 22, 2005, Mr. Manning served as Advisory Trustee. From January 2012 through December 2016, Messrs. DiLorenzo and Yost served as Treasurer and Deputy Treasurer of the Funds, respectively. |
| (j) | Directorships or trusteeships of companies required to report to the Securities and Exchange Commission (i.e., “public companies”). |
| (k) | “Interested person” of the Trust within the meaning of the Investment Company Act of 1940 (referred to as the 1940 Act), which is the principal federal law governing investment companies like the fund, as a result of a position with MFS. The address of MFS is 111 Huntington Avenue, Boston, Massachusetts 02199-7618. |
Each Trustee (other than Messrs. Jones and Kilman) has been elected by shareholders and each Trustee and Officer holds office until his or her successor is chosen and qualified or until his or her earlier death, resignation, retirement or removal. Messrs. Jones and Kilman became Trustees of the Funds on January 1, 2019. The Trust does
49
Trustees and Officers – continued
not hold annual meetings for the purpose of electing Trustees, and Trustees are not elected for fixed terms. Under the terms of the Board’s retirement policy, an Independent Trustee shall retire at the end of the calendar year in which he or she reaches the earlier of 75 years of age or 15 years of service on the Board (or, in the case of any Independent Trustee who joined the Board prior to 2015, 20 years of service on the Board).
Messrs. Buller, Hegarty, Kilman and Otis and Ms. Roepke are members of the Trust’s Audit Committee.
Each of the Interested Trustees and certain Officers hold comparable officer positions with certain affiliates of MFS.
The Statement of Additional Information for a Fund includes further information about the Trustees and is available without charge upon request by calling1-800-225-2606.
| | |
| Investment Adviser | | Custodian |
Massachusetts Financial Services Company
111 Huntington Avenue Boston, MA 02199-7618 | | State Street Bank and Trust Company 1 Lincoln Street Boston, MA 02111-2900 |
| Distributor | | Independent Registered Public Accounting Firm |
MFS Fund Distributors, Inc.
111 Huntington Avenue Boston, MA 02199-7618 | | Ernst & Young LLP 200 Clarendon Street Boston, MA 02116 |
| Portfolio Manager(s) | | |
| Joseph MacDougall | | |
50
BOARD REVIEW OF INVESTMENT ADVISORY AGREEMENT
The Investment Company Act of 1940 requires that both the full Board of Trustees and a majority of thenon-interested (“independent”) Trustees, voting separately, annually approve the continuation of the Fund’s investment advisory agreement with MFS. The Trustees consider matters bearing on the Fund and its advisory arrangements at their meetings throughout the year, including a review of performance data at each regular meeting. In addition, the independent Trustees met several times over the course of three months beginning in May and ending in July, 2019 (“contract review meetings”) for the specific purpose of considering whether to approve the continuation of the investment advisory agreement for the Fund and the other investment companies that the Board oversees (the “MFS Funds”). The independent Trustees were assisted in their evaluation of the Fund’s investment advisory agreement by independent legal counsel, from whom they received separate legal advice and with whom they met separately from MFS during various contract review meetings. The independent Trustees were also assisted in this process by the MFS Funds’ Independent Senior Officer, a senior officer appointed by and reporting to the independent Trustees.
In connection with their deliberations regarding the continuation of the investment advisory agreement, the Trustees, including the independent Trustees, considered such information and factors as they believed, in light of the legal advice furnished to them and their own business judgment, to be relevant. The investment advisory agreement for the Fund was considered separately, although the Trustees also took into account the common interests of all MFS Funds in their review. As described below, the Trustees considered the nature, quality, and extent of the various investment advisory, administrative, and shareholder services performed by MFS under the existing investment advisory agreement and other arrangements with the Fund.
In connection with their contract review meetings, the Trustees received and relied upon materials that included, among other items: (i) information provided by Broadridge Financial Solutions, Inc. (“Broadridge”), an independent third party, on the investment performance of the Fund for various time periods ended December 31, 2018 and the investment performance of a group of funds with substantially similar investment classifications/objectives (the “Broadridge performance universe”), (ii) information provided by Broadridge on the Fund’s advisory fees and other expenses and the advisory fees and other expenses of comparable funds identified by Broadridge as well as all other funds in the same investment classification/category (the “Broadridge expense group and universe”), (iii) information provided by MFS on the advisory fees of portfolios of other clients of MFS, including institutional separate accounts and other clients, (iv) information as to whether and to what extent applicable expense waivers, reimbursements or fee “breakpoints” are observed for the Fund, (v) information regarding MFS’ financial results and financial condition, including MFS’ and certain of its affiliates’ estimated profitability from services performed for the Fund and the MFS Funds as a whole, and compared to MFS’ institutional business, (vi) MFS’ views regarding the outlook for the mutual fund industry and the strategic business plans of MFS, (vii) descriptions of various functions performed by MFS for the Funds, such as compliance monitoring and portfolio trading practices, and (viii) information regarding the overall organization of MFS, including information
51
Board Review of Investment Advisory Agreement – continued
about MFS’ senior management and other personnel providing investment advisory, administrative and other services to the Fund and the other MFS Funds. The comparative performance, fee and expense information prepared and provided by Broadridge was not independently verified and the independent Trustees did not independently verify any information provided to them by MFS.
The Trustees’ conclusion as to the continuation of the investment advisory agreement was based on a comprehensive consideration of all information provided to the Trustees and not the result of any single factor. Some of the factors that figured particularly in the Trustees’ deliberations are described below, although individual Trustees may have evaluated the information presented differently from one another, giving different weights to various factors. It is also important to recognize that the fee arrangements for the Fund and other MFS Funds are the result of years of review and discussion between the independent Trustees and MFS, that certain aspects of such arrangements may receive greater scrutiny in some years than in others, and that the Trustees’ conclusions may be based, in part, on their consideration of these same arrangements during the course of the year and in prior years.
Based on information provided by Broadridge and MFS, the Trustees reviewed the Fund’s total return investment performance as well as the Broadridge performance universe over various time periods. The Trustees placed particular emphasis on the total return performance of the Fund’s Class A shares in comparison to the performance of funds in its Broadridge performance universe over the five-year period ended December 31, 2018, which the Trustees believed was a long enough period to reflect differing market conditions. The total return performance of the Fund’s Class A shares was in the 1st quintile relative to the other funds in the universe for this five-year period (the 1st quintile being the best performers and the 5th quintile being the worst performers). The total return performance of the Fund’s Class A shares was in the 1st quintile for each of theone- and three-year periods ended December 31, 2018 relative to the Broadridge performance universe. Because of the passage of time, these performance results may differ from the performance results for more recent periods, including those shown elsewhere in this report.
In the course of their deliberations, the Trustees took into account information provided by MFS in connection with the contract review meetings, as well as during investment review meetings conducted with portfolio management personnel during the course of the year regarding the Fund’s performance. After reviewing these and related factors, the Trustees concluded, within the context of their overall conclusions regarding the investment advisory agreement, that they were satisfied with MFS’ responses and efforts relating to investment performance.
In assessing the reasonableness of the Fund’s advisory fee, the Trustees considered, among other information, the Fund’s advisory fee and the total expense ratio of the Fund’s Class A shares as a percentage of average daily net assets and the advisory fee and total expense ratios of the Broadridge expense group based on information provided by Broadridge. The Trustees considered that, according to the data provided by Broadridge (which takes into account any fee reductions or expense limitations that were in effect during the Fund’s last fiscal year), the Fund’s effective advisory fee rate and total expense ratio were each lower than the Broadridge expense group median.
52
Board Review of Investment Advisory Agreement – continued
The Trustees also considered the advisory fees charged by MFS to any institutional separate accounts advised by MFS (“separate accounts”) and unaffiliated investment companies for which MFS serves as subadviser (“subadvised funds”) that have comparable investment strategies to the Fund, if any. In comparing these fees, the Trustees considered information provided by MFS as to the generally broader scope of services provided by MFS to the Fund, as well as the more extensive regulatory burdens imposed on MFS in managing the Fund, in comparison to separate accounts and subadvised funds. The Trustees also considered the higher demands placed on MFS’ investment personnel and trading infrastructure as a result of the daily cashin-flows andout-flows of the Fund in comparison to separate accounts.
The Trustees also considered whether the Fund may benefit from any economies of scale in the management of the Fund in the event of growth in assets of the Fund and/or growth in assets of the MFS Funds as a whole. They noted that the Fund’s advisory fee rate schedule is subject to contractual breakpoints that reduce the Fund’s advisory fee rate on average daily net assets over $500 million and $2.5 billion. They also noted that MFS has agreed to implement additional contractual breakpoints that reduce its advisory fee rate on the Fund’s average daily net assets over $5 billion and $10 billion effective August 1, 2019. The Trustees also noted that MFS has agreed in writing to waive a portion of the management fees of certain MFS Funds, including the Fund, if the total combined assets of certain funds within the MFS Funds’ complex increase above agreed upon thresholds (the “group fee waiver”), enabling the Fund’s shareholders to share in the benefits from any economies of scale at the complex level. The group fee waiver is reviewed and renewed annually between the Board and MFS. The Trustees concluded that the breakpoints and the group fee waiver were sufficient to allow the Fund to benefit from economies of scale as its assets and overall complex assets grow.
The Trustees also considered information prepared by MFS relating to MFS’ costs and profits with respect to the Fund, the MFS Funds considered as a group, and other investment companies and accounts advised by MFS, as well as MFS’ methodologies used to determine and allocate its costs to the MFS Funds, the Fund and other accounts and products for purposes of estimating profitability.
After reviewing these and other factors described herein, the Trustees concluded, within the context of their overall conclusions regarding the investment advisory agreement, that the advisory fees charged to the Fund represent reasonable compensation in light of the services being provided by MFS to the Fund.
In addition, the Trustees considered MFS’ resources and related efforts to continue to retain, attract and motivate capable personnel to serve the Fund. The Trustees also considered current and developing conditions in the financial services industry, including the presence of large and well-capitalized companies which are spending, and appear to be prepared to continue to spend, substantial sums to engage personnel and to provide services to competing investment companies. In this regard, the Trustees also considered the financial resources of MFS and its ultimate parent, Sun Life Financial Inc. The Trustees also considered the advantages and possible disadvantages to the Fund of having an adviser that also serves other investment companies as well as other accounts.
53
Board Review of Investment Advisory Agreement – continued
The Trustees also considered the nature, quality, cost, and extent of administrative, transfer agency, and distribution services provided to the Fund by MFS and its affiliates under agreements and plans other than the investment advisory agreement, including any12b-1 fees the Fund pays to MFS Fund Distributors, Inc., an affiliate of MFS. The Trustees also considered the nature, extent and quality of certain other services MFS performs or arranges for on the Fund’s behalf, which may include securities lending programs, directed expense payment programs, class action recovery programs, and MFS’ interaction with third-party service providers, principally custodians andsub-custodians. The Trustees concluded that the variousnon-advisory services provided by MFS and its affiliates on behalf of the Fund were satisfactory.
The Trustees consideredso-called“fall-out benefits” to MFS such as reputational value derived from serving as investment manager to the MFS Funds. The Trustees also considered that, effective January 3, 2018, MFS had discontinued its historic practice of obtaining investment research from portfolio brokerage commissions paid by certain MFS Funds and would thereafter directly pay for or voluntarily reimburse a Fund, if applicable, for the costs of external research acquired through the use of the Fund’s portfolio brokerage commissions.
Based on their evaluation of factors that they deemed to be material, including those factors described above, the Board of Trustees, including the independent Trustees, concluded that the Fund’s investment advisory agreement with MFS should be continued for an additionalone-year period, commencing August 1, 2019.
54
PROXY VOTING POLICIES AND INFORMATION
MFS votes proxies on behalf of the fund pursuant to proxy voting policies and procedures that are available without charge, upon request, by calling1-800-225-2606, by visitingmfs.com/proxyvoting,or by visiting the SEC’s Web site athttp://www.sec.gov.
Information regarding how the fund voted proxies relating to portfolio securities during the most recent twelve-month period ended June 30 is available by August 31 of each year without charge by visitingmfs.com/proxyvoting,or by visiting the SEC’s Web site athttp://www.sec.gov.
QUARTERLY PORTFOLIO DISCLOSURE
The fund files a complete schedule of portfolio holdings with the SEC for the first and third quarters of each fiscal year on Form N-Q or as an exhibit to its reports onForm N-PORT (for first and third fiscal quarters ending March 31, 2019 or after). The fund’s Form N-Q or Form N-PORT reports are available on the SEC’s website athttp://www.sec.gov.A shareholder can obtain the portfolio holdings report for the first and third quarters of the fund’s fiscal year atmfs.com/openendfunds by choosing the fund’s name and then selecting the “Resources” tab and clicking on “Prospectus and Reports”.
FURTHER INFORMATION
From time to time, MFS may post important information about the fund or the MFS funds on the MFS web site (mfs.com). This information is available athttps://www.mfs.com/en-us/what-we-do/announcements.htmlor atmfs.com/openendfundsby choosing the fund’s name.
INFORMATION ABOUT FUND CONTRACTS AND LEGAL CLAIMS
The fund has entered into contractual arrangements with an investment adviser, administrator, distributor, shareholder servicing agent, 529 program manager (if applicable), and custodian who each provide services to the fund. Unless expressly stated otherwise, shareholders are not parties to, or intended beneficiaries of these contractual arrangements, and these contractual arrangements are not intended to create any shareholder right to enforce them against the service providers or to seek any remedy under them against the service providers, either directly or on behalf of the fund.
Under the Trust’s By-Laws and Declaration of Trust, any claims asserted against or on behalf of the MFS Funds, including claims against Trustees and Officers, must be brought in state and federal courts located within the Commonwealth of Massachusetts.
FEDERAL TAX INFORMATION (unaudited)
The fund will notify shareholders of amounts for use in preparing 2019 income tax forms in January 2020. The following information is provided pursuant to provisions of the Internal Revenue Code.
The fund designates the maximum amount allowable as qualified dividend income eligible to be taxed at the same rate as long-term capital gain.
The fund designates $194,816,000 as capital gain dividends paid during the fiscal year.
For corporate shareholders, 85.10% of the ordinary income dividends paid during the fiscal year qualify for the corporate dividends received deduction.
The fund designates the maximum amount allowable as Section 199A dividends as defined in Proposed Treasury Regulation §1.199A-3(d).
55
rev. 3/16
| | | | |
| | | |
FACTS | | WHAT DOES MFS DO WITH YOUR PERSONAL INFORMATION? | |  |
| | |
| Why? | | Financial companies choose how they share your personal information. Federal law gives consumers the right to limit some but not all sharing. Federal law also requires us to tell you how we collect, share, and protect your personal information. Please read this notice carefully to understand what we do. |
| | |
| What? | | The types of personal information we collect and share depend on the product or service you have with us. This information can include: • Social Security number and account balances • Account transactions and transaction history • Checking account information and wire transfer instructions When you areno longer our customer, we continue to share your information as described in this notice. |
| | |
| How? | | All financial companies need to share customers’ personal information to run their everyday business. In the section below, we list the reasons financial companies can share their customers’ personal information; the reasons MFS chooses to share; and whether you can limit this sharing. |
| | | | |
Reasons we can share your
personal information | | Does MFS
share? | | Can you limit
this sharing? |
For our everyday business purposes – such as to process your transactions, maintain your account(s), respond to court orders and legal investigations, or report to credit bureaus | | Yes | | No |
For our marketing purposes – to offer our products and services to you | | No | | We don’t share |
For joint marketing with other financial companies | | No | | We don’t share |
For our affiliates’ everyday business purposes – information about your transactions and experiences | | No | | We don’t share |
For our affiliates’ everyday business purposes – information about your creditworthiness | | No | | We don’t share |
| For nonaffiliates to market to you | | No | | We don’t share |
| | |
| | |
| Questions? | | Call800-225-2606 or go tomfs.com. |
56
| | |
| Who we are |
| Who is providing this notice? | | MFS Funds, MFS Investment Management, MFS Institutional Advisors, Inc., and MFS Heritage Trust Company. |
| | |
| What we do |
| How does MFS protect my personal information? | | To protect your personal information from unauthorized access and use, we use security measures that comply with federal law. These measures include procedural, electronic, and physical safeguards for the protection of the personal information we collect about you. |
| How does MFS collect my personal information? | | We collect your personal information, for example, when you • open an account or provide account information • direct us to buy securities or direct us to sell your securities • make a wire transfer We also collect your personal information from others, such as credit bureaus, affiliates, or other companies. |
| Why can’t I limit all sharing? | | Federal law gives you the right to limit only • sharing for affiliates’ everyday business purposes – information about your creditworthiness • affiliates from using your information to market to you • sharing for nonaffiliates to market to you State laws and individual companies may give you additional rights to limit sharing. |
| | |
| Definitions |
| Affiliates | | Companies related by common ownership or control. They can be financial and nonfinancial companies. • MFS does not share personal information with affiliates, except for everyday business purposes as described on page one of this notice. |
| Nonaffiliates | | Companies not related by common ownership or control. They can be financial and nonfinancial companies. • MFS does not share with nonaffiliates so they can market to you. |
| Joint marketing | | A formal agreement between nonaffiliated financial companies that together market financial products or services to you. • MFS doesn’t jointly market. |
| | |
| Other important information |
| If you own an MFS product or receive an MFS service in the name of a third party such as a bank or broker-dealer, their privacy policy may apply to you instead of ours. |
57
Save paper with eDelivery.

| MFS® will send you prospectuses, |
reports, and proxies directly viae-mail so you will get information faster with less mailbox clutter.
To sign up:
1. Go to mfs.com.
2. Log in via MFS® Access.
3. Select eDelivery.
If you own your MFS fund shares through a financial institution or a retirement plan, MFS® TALK, MFS® Access, or eDelivery may not be available to you.
CONTACT
WEB SITE
mfs.com
MFS TALK
1-800-637-8255
24 hours a day
ACCOUNT SERVICE AND LITERATURE
Shareholders
1-800-225-2606
Financial advisors
1-800-343-2829
Retirement plan services
1-800-637-1255
MAILING ADDRESS
MFS Service Center, Inc.
P.O. Box 219341
Kansas City, MO 64121-9341
OVERNIGHT MAIL
MFS Service Center, Inc.
Suite 219341
430 W 7th Street
Kansas City, MO 64105-1407
Annual Report
August 31, 2019

MFS® Low Volatility Global Equity Fund

Beginning on January 1, 2021, as permitted by regulations adopted by the U.S. Securities and Exchange Commission, paper copies of the fund’s annual and semiannual shareholder reports will no longer be sent by mail, unless you specifically request paper copies of the reports. Instead, the complete reports will be made available on the fund’s Web site (funds.mfs.com), and you will be notified by mail each time a report is posted and provided with a Web site link to access the report.
If you are already signed up to receive shareholder reports by email, you will not be affected by this change and you need not take any action. You may sign up to receive shareholder reports and other communications from the fund by email by contacting your financial intermediary (such as a broker-dealer or bank) or, if you hold your shares directly with the fund, by calling 1-800-225-2606 or by logging on to MFS Access at mfs.com.
Beginning on January 1, 2019, you may elect to receive all future reports in paper free of charge. Contact your financial intermediary to request that you continue to receive paper copies of your shareholder reports. If you invest directly with the fund, you can call 1-800-225-2606 or send an email request to orderliterature@mfs.com to let the fund know that you wish to continue receiving paper copies of your shareholder reports. Your election to receive reports in paper will apply to all funds held in your account if you invest through your financial intermediary or all funds held with the MFS fund complex if you invest directly.
LVO-ANN
MFS® Low Volatility Global Equity Fund
CONTENTS
The report is prepared for the general information of shareholders.
It is authorized for distribution to prospective investors only when preceded or accompanied by a current prospectus.
NOT FDIC INSURED• MAY LOSE VALUE• NO BANK GUARANTEE

LETTER FROM THE EXECUTIVE CHAIRMAN
Dear Shareholders:
Slowing global growth, low inflation, and increasing trade friction between the United States and China have been hallmarks of the past 12 months. After experiencing an
uptick in market volatility in late 2018, markets steadied during the first half of 2019, thanks in large measure to the adoption of a dovish policy stance on the part of global central banks, focused on supporting economic growth. The U.S. and China have raised tariffs on each other, heightening tensions and uncertainty. Despite repeated declarations by British Prime Minister Boris Johnson that the United Kingdom will leave the European Union on October 31, 2019, with or without a deal, apprehension over the possibility of a no-deal Brexit has eased somewhat, with Parliament having taken steps to block such an outcome.
Markets expect that the longest economic expansion in U.S. history will continue for the time being, albeit at a slower pace. In an effort to prolong the expansion, the U.S. Federal Reserve lowered interest rates for the first time in more than a decade in July and again in September. Similarly, the European Central Bank loosened policy in September. While markets have grown more risk averse, the accommodative monetary environment has helped push global interest rates toward record-low levels and has been somewhat supportive of risk assets despite the unsettled economic and geopolitical backdrop.
Since launching the first U.S. open-end mutual fund in 1924, MFS® has been committed to a single purpose: to create value by allocating capital responsibly for clients. Through our powerful global investment platform, we combine collective expertise, thoughtful risk management, and long-term discipline to uncover what we believe are the best investment opportunities in the market.
Respectfully,

Robert J. Manning
Executive Chairman
MFS Investment Management
October 17, 2019
The opinions expressed in this letter are subject to change and may not be relied upon for investment advice. No forecasts can be guaranteed.
1
PORTFOLIO COMPOSITION
Portfolio structure

| | | | |
| Top ten holdings | | | | |
| Roche Holding AG | | | 3.0% | |
| Johnson & Johnson | | | 2.4% | |
| STORE Capital Corp., REIT | | | 2.4% | |
| NICE Systems Ltd., ADR | | | 2.4% | |
| Starbucks Corp. | | | 2.4% | |
| Taiwan Semiconductor Manufacturing Co. Ltd., ADR | | | 2.2% | |
| PepsiCo, Inc. | | | 2.1% | |
| ABC-MART, Inc. | | | 2.1% | |
| Lockheed Martin Corp. | | | 2.0% | |
| Adobe Systems, Inc. | | | 2.0% | |
| |
| Equity sectors (k) | | | | |
| Financial Services | | | 18.7% | |
| Health Care | | | 13.4% | |
| Consumer Staples | | | 12.0% | |
| Technology | | | 11.6% | |
| Retailing | | | 9.9% | |
| Utilities | | | 8.2% | |
| Communications | | | 7.1% | |
| Leisure | | | 7.1% | |
| Industrial Goods & Services | | | 2.9% | |
| Special Products & Services | | | 2.6% | |
| Basic Materials | | | 2.3% | |
| Energy | | | 2.1% | |
| Transportation | | | 1.3% | |
| | | | |
| Issuer country weightings (x) | |
| United States | | | 44.1% | |
| Japan | | | 12.5% | |
| Canada | | | 8.2% | |
| Switzerland | | | 6.2% | |
| United Kingdom | | | 3.7% | |
| Hong Kong | | | 3.7% | |
| Germany | | | 2.6% | |
| Israel | | | 2.4% | |
| Taiwan | | | 2.2% | |
| Other Countries | | | 14.4% | |
|
| Currency exposure weightings (y) | |
| United States Dollar | | | 52.7% | |
| Japanese Yen | | | 12.5% | |
| Swiss Franc | | | 6.2% | |
| Euro | | | 5.1% | |
| British Pound Sterling | | | 3.7% | |
| Hong Kong Dollar | | | 2.8% | |
| Israeli Shekel | | | 2.4% | |
| Taiwan Dollar | | | 2.2% | |
| Australian Dollar | | | 2.2% | |
| Other Currencies | | | 10.2% | |
2
Portfolio Composition – continued
| (k) | The sectors set forth above and the associated portfolio composition are based on MFS’ own custom sector classification methodology. |
| (x) | Represents the portfolio’s exposure to issuer countries as a percentage of a portfolio’s net assets. For purposes of this presentation, United States includes Cash & Cash Equivalents. |
| (y) | Represents the portfolio’s exposure to a particular currency as a percentage of a portfolio’s net assets. For purposes of this presentation, United States Dollar includes Cash & Cash Equivalents. |
Cash & Cash Equivalents includes any cash, investments in money market funds, short-term securities, and other assets less liabilities. Please see the Statement of Assets and Liabilities for additional information related to the fund’s cash position and other assets and liabilities.
Percentages are based on net assets as of August 31, 2019.
The portfolio is actively managed and current holdings may be different.
3
MANAGEMENT REVIEW
Summary of Results
For the twelve months ended August 31, 2019, Class A shares of the MFS Low Volatility Global Equity Fund (fund) provided a total return of 6.38%, at net asset value. This compares with a return of –0.28% for the fund’s benchmark, the MSCI All Country World Index (net div).
Market Environment
Changes in market sentiment, driven largely by uncertainty over the outcome of trade negotiations between the United States and China, contributed to periodic bouts of volatility during the reporting period. The global economy decelerated, led by weakness in China and Europe.
The deteriorating global growth backdrop, along with declining inflationary pressures, prompted the US Federal Reserve to cut interest rates for the first time in over a decade at the end of July, which, combined with a more dovish posture beginning in early 2019, resulted in a sharp decline in long-term interest rates during the period’s second half, inverting portions of the US Treasury yield curve. Consequently, markets anticipate additional rate cuts in the coming quarters.
Globally, central banks have tilted more dovish as well, with China lowering reserve requirements, the Bank of Canada and Bank of England holding rates steady and the European Central Bank extending alow-interest-rate refinancing facility for eurozone banks to encourage the continued flow of credit. The ECB also indicated that it would likely lower rates further and possibly resume asset purchases this fall.
Emerging markets experienced considerable volatility earlier in the period (through the end of 2018) as tighter global financial conditions exposed structural weakness in some countries. Those conditions improved in 2019 as the Fed became more dovish, but diminished hopes for a trade deal between the US and China weighed on sentiment. Idiosyncratic factors negatively impacted some emerging economies, such as Argentina and Turkey.
From a geopolitical perspective, uncertainty over Brexit remains high. British Prime Minister Boris Johnson has shown a willingness to leave the European Union on October 31, 2019, without a withdrawal agreement, although Parliament has taken steps to prevent the United Kingdom from leaving the EU without a deal. The combination of Brexit uncertainty and the deteriorating outlook for global trade has damaged business confidence and hampered investment.
Contributors to Performance
Stock selection in theconsumer discretionary sector contributed to performance relative to the MSCI All Country World Index. Here, the fund’s overweight positions in coffee and tea company Starbucks, fast-food company giant McDonald’s and apparel and footwear producerABC-MART (Japan) aided relative results. The share price of Starbucks rose as the company reported earnings per share results that beat consensus estimates, driven by better-than-expected margins and a slightly lower tax rate. Management also increased its forward-looking earnings guidance, which further supported the stock.
4
Management Review – continued
The combination of stock selection and an overweight position in thereal estatesector also benefited relative results. Within this sector, the fund’s holding of real estate investment trust STORE Capital (b) and an overweight position in real estate management services firm Sun Communities were among the fund’s top relative contributors. STORE Capital reported earnings which were ahead of estimates, driven by lower selling, general & administrative and interest expenses. The company also posted a record acquisition year, which bolstered its revenue outlook for the upcoming year.
Other top relative contributors during the period included the fund’s overweight positions in data recording products provider NICE Systems (Israel), gold-focused royalty and stream company Franco-Nevada (Canada), electricity and natural gas distribution company WEC Energy Group, global food company Nestle (Switzerland) and aerospace company Boeing (h) (United States).
Detractors from Performance
Security selection within theconsumer staplessector detracted from relative performance. The fund’s overweight holdings of drug store operator Walgreens Boots Alliance (h), diversified retailer Seven & I Holdings (Japan) and convenience and supermarket store operator Dairy Farm International Holdings (Hong Kong) held back relative results. The share price of Walgreens Boots Alliance declined throughout the year, after the company reported earnings below market expectations and a lower-than-anticipated full-year earnings per share outlook. Weak sales and margins in the company’s US retail business pressured earnings and offset its cost savings generated throughout the year.
Other top relative detractors for the period included not owning strong-performing software giant Microsoft and the fund’s holdings of advisory services provider Forrester Research (b) and real estate development company Grand City Properties (b) (Germany). Shares of Microsoft rose as the company reported solid results, driven primarily by strong growth in its Commercial segment. Additionally, Microsoft and Oracle announced interoperability across Azure and Oracle Cloud systems, allowing customers to run workloads across the two platforms, which further supported the stock. Additionally, overweighting shares of investment management company Genting (Malaysia), marine and casualty insurance services provider Samsung Fire & Marine Insurance (South Korea) and pharmaceutical giant Pfizer held back relative performance. Underweighting shares of social networking service provider Facebook (h)also detracted from relative results. Shares of Facebook appreciated after the company reported a solid year with revenue growth that did not decelerate significantly, coupled with lower-than-expected expense growth. Additionally, the company unveiled the new blockchain-based Libra cryptocurrency that will launch in the first half of 2020. What differentiates Libra from other digital currencies is that Libra is backed by a reserve of real assets that provide value preservation.
Respectfully,
Portfolio Manager(s)
Jim Fallon, Matt Krummell, Jonathan Sage, and Jed Stocks
| (b) | Security is not a benchmark constituent. |
| (h) | Security was not held in the portfolio at period end. |
5
Management Review – continued
The views expressed in this report are those of the portfolio manager(s) only through the end of the period of the report as stated on the cover and do not necessarily reflect the views of MFS or any other person in the MFS organization. These views are subject to change at any time based on market or other conditions, and MFS disclaims any responsibility to update such views. These views may not be relied upon as investment advice or an indication of trading intent on behalf of any MFS portfolio. References to specific securities are not recommendations of such securities, and may not be representative of any MFS portfolio’s current or future investments.
6
PERFORMANCE SUMMARYTHROUGH 8/31/19
The following chart illustrates a representative class of the fund’s historical performance in comparison to its benchmark(s). Performance results include the deduction of the maximum applicable sales charge and reflect the percentage change in net asset value, including reinvestment of dividends and capital gains distributions. The performance of other share classes will be greater than or less than that of the class depicted below. Benchmarks are unmanaged and may not be invested in directly. Benchmark returns do not reflect sales charges, commissions or expenses. (See Notes to Performance Summary.)
Performance data shown represents past performance and is no guarantee of future results. Investment return and principal value fluctuate so your shares, when sold, may be worth more or less than the original cost; current performance may be lower or higher than quoted. The performance shown does not reflect the deduction of taxes, if any, that a shareholder would pay on fund distributions or the redemption of fund shares.
Growth of a Hypothetical $10,000 Investment (t)
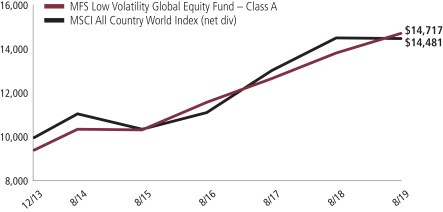
7
Performance Summary – continued
Total Returns through 8/31/19
Average annual without sales charge
| | | | | | | | | | | | |
| | | Share Class | | Class Inception Date | | 1-yr | | 5-yr | | Life (t) | | |
| | | A | | 12/05/13 | | 6.38% | | 7.23% | | 8.07% | | |
| | | B | | 12/05/13 | | 5.60% | | 6.40% | | 7.22% | | |
| | | C | | 12/05/13 | | 5.57% | | 6.40% | | 7.22% | | |
| | | I | | 12/05/13 | | 6.61% | | 7.47% | | 8.30% | | |
| | | R1 | | 12/05/13 | | 5.61% | | 6.41% | | 7.23% | | |
| | | R2 | | 12/05/13 | | 6.09% | | 6.94% | | 7.76% | | |
| | | R3 | | 12/05/13 | | 6.42% | | 7.21% | | 8.04% | | |
| | | R4 | | 12/05/13 | | 6.61% | | 7.45% | | 8.29% | | |
| | | R6 | | 12/05/13 | | 6.68% | | 7.51% | | 8.34% | | |
| | | | |
| Comparative benchmark(s) | | | | | | | | |
| | | MSCI All Country World Index (net div) (f) | | (0.28)% | | 5.51% | | 6.66% | | |
| | | | |
| Average annual with sales charge | | | | | | | | |
| | | A
With Initial Sales Charge (5.75%) | | 0.26% | | 5.97% | | 6.96% | | |
| | | B
With CDSC (Declining over six years from 4% to 0%) (v) | | 1.60% | | 6.09% | | 7.09% | | |
| | | C
With CDSC (1% for 12 months) (v) | | 4.57% | | 6.40% | | 7.22% | | |
CDSC – Contingent Deferred Sales Charge.
Class I, R1, R2, R3, R4, and R6 shares do not have a sales charge.
| (f) | Source: FactSet Research Systems Inc. |
| (t) | For the period from the class inception date through the stated period end. (See Notes to Performance Summary.) |
| (v) | Assuming redemption at the end of the applicable period. |
Benchmark Definition(s)
MSCI All Country World Index (net div) – a market capitalization-weighted index that is designed to measure equity market performance in the global developed and emerging markets.
It is not possible to invest directly in an index.
Notes to Performance Summary
Average annual total return represents the average annual change in value for each share class for the periods presented. Life returns are presented where the share class has less than 10 years of performance history and represent the average annual total return from the class inception date to the stated period end date.
8
Performance Summary – continued
Performance results reflect any applicable expense subsidies and waivers in effect during the periods shown. Without such subsidies and waivers the fund’s performance results would be less favorable. Please see the prospectus and financial statements for complete details.
Performance results do not include adjustments made for financial reporting purposes in accordance with U.S. generally accepted accounting principles and may differ from amounts reported in the financial highlights.
From time to time the fund may receive proceeds from litigation settlements, without which performance would be lower.
9
EXPENSE TABLE
Fund expenses borne by the shareholders during the period, March 1, 2019 through August 31, 2019
As a shareholder of the fund, you incur two types of costs: (1) transaction costs, including sales charges (loads) on certain purchase or redemption payments, and (2) ongoing costs, including management fees; distribution and service(12b-1) fees; and other fund expenses. This example is intended to help you understand your ongoing costs (in dollars) of investing in the fund and to compare these costs with the ongoing costs of investing in other mutual funds.
The example is based on an investment of $1,000 invested at the beginning of the period and held for the entire period March 1, 2019 through August 31, 2019.
Actual Expenses
The first line for each share class in the following table provides information about actual account values and actual expenses. You may use the information in this line, together with the amount you invested, to estimate the expenses that you paid over the period. Simply divide your account value by $1,000 (for example, an $8,600 account value divided by $1,000 = 8.6), then multiply the result by the number in the first line under the heading entitled “Expenses Paid During Period” to estimate the expenses you paid on your account during this period.
Hypothetical Example for Comparison Purposes
The second line for each share class in the following table provides information about hypothetical account values and hypothetical expenses based on the fund’s actual expense ratio and an assumed rate of return of 5% per year before expenses, which is not the fund’s actual return. The hypothetical account values and expenses may not be used to estimate the actual ending account balance or expenses you paid for the period. You may use this information to compare the ongoing costs of investing in the fund and other funds. To do so, compare this 5% hypothetical example with the 5% hypothetical examples that appear in the shareholder reports of the other funds.
Please note that the expenses shown in the table are meant to highlight your ongoing costs only and do not reflect any transactional costs, such as sales charges (loads). Therefore, the second line for each share class in the table is useful in comparing ongoing costs only, and will not help you determine the relative total costs of owning different funds. In addition, if these transactional costs were included, your costs would have been higher.
10
Expense Table – continued
| | | | | | | | | | | | | | | | | | |
Share
Class | | | | Annualized
Expense Ratio | | | Beginning
Account Value
3/01/19 | | | Ending Account Value
8/31/19 | | | Expenses Paid During
Period (p) 3/01/19-8/31/19 | |
| A | | Actual | | | 0.99% | | | | $1,000.00 | | | | $1,047.03 | | | | $5.11 | |
| | Hypothetical (h) | | | 0.99% | | | | $1,000.00 | | | | $1,020.21 | | | | $5.04 | |
| B | | Actual | | | 1.74% | | | | $1,000.00 | | | | $1,042.96 | | | | $8.96 | |
| | Hypothetical (h) | | | 1.74% | | | | $1,000.00 | | | | $1,016.43 | | | | $8.84 | |
| C | | Actual | | | 1.74% | | | | $1,000.00 | | | | $1,042.35 | | | | $8.96 | |
| | Hypothetical (h) | | | 1.74% | | | | $1,000.00 | | | | $1,016.43 | | | | $8.84 | |
| I | | Actual | | | 0.74% | | | | $1,000.00 | | | | $1,048.09 | | | | $3.82 | |
| | Hypothetical (h) | | | 0.74% | | | | $1,000.00 | | | | $1,021.48 | | | | $3.77 | |
| R1 | | Actual | | | 1.74% | | | | $1,000.00 | | | | $1,043.04 | | | | $8.96 | |
| | Hypothetical (h) | | | 1.74% | | | | $1,000.00 | | | | $1,016.43 | | | | $8.84 | |
| R2 | | Actual | | | 1.24% | | | | $1,000.00 | | | | $1,045.73 | | | | $6.39 | |
| | Hypothetical (h) | | | 1.24% | | | | $1,000.00 | | | | $1,018.95 | | | | $6.31 | |
| R3 | | Actual | | | 0.99% | | | | $1,000.00 | | | | $1,046.83 | | | | $5.11 | |
| | Hypothetical (h) | | | 0.99% | | | | $1,000.00 | | | | $1,020.21 | | | | $5.04 | |
| R4 | | Actual | | | 0.74% | | | | $1,000.00 | | | | $1,048.09 | | | | $3.82 | |
| | Hypothetical (h) | | | 0.74% | | | | $1,000.00 | | | | $1,021.48 | | | | $3.77 | |
| R6 | | Actual | | | 0.67% | | | | $1,000.00 | | | | $1,048.40 | | | | $3.46 | |
| | Hypothetical (h) | | | 0.67% | | | | $1,000.00 | | | | $1,021.83 | | | | $3.41 | |
| (h) | 5% class return per year before expenses. |
| (p) | “Expenses Paid During Period” are equal to each class’s annualized expense ratio, as shown above, multiplied by the average account value over the period, multiplied by 184/365 (to reflect theone-half year period). Expenses paid do not include any applicable sales charges (loads). If these transaction costs had been included, your costs would have been higher. |
Notes to Expense Table
Each class with a Rule12b-1 service fee is subject to a rebate of a portion of such fee. Such rebates are included in the expense ratios above and are outside of the expense limitation arrangement. For Class A shares this rebate reduced the expense ratio above by 0.01%. See Note 3 in the Notes to Financial Statements for additional information.
11
PORTFOLIO OF INVESTMENTS
8/31/19
The Portfolio of Investments is a complete list of all securities owned by your fund. It is categorized by broad-based asset classes.
| | | | | | | | |
| Common Stocks - 99.2% | | | | | | | | |
| | |
| Issuer | | Shares/Par | | | Value ($) | |
| Aerospace - 2.0% | | | | | | | | |
| Lockheed Martin Corp. | | | 11,688 | | | $ | 4,489,478 | |
| | |
| Airlines - 0.5% | | | | | | | | |
| Malaysia Airports Holdings Berhad | | | 542,800 | | | $ | 1,062,238 | |
| | |
| Apparel Manufacturers - 0.5% | | | | | | | | |
| Gildan Activewear, Inc. | | | 31,441 | | | $ | 1,153,256 | |
| | |
| Automotive - 0.9% | | | | | | | | |
| USS Co. Ltd. | | | 101,300 | | | $ | 1,914,721 | |
| | |
| Broadcasting - 0.6% | | | | | | | | |
| Publicis Groupe S.A. | | | 28,986 | | | $ | 1,389,605 | |
| | |
| Business Services - 3.1% | | | | | | | | |
| Auto Trader Group PLC | | | 170,409 | | | $ | 1,102,292 | |
| Forrester Research, Inc. | | | 50,793 | | | | 1,771,152 | |
| Infosys Technologies Ltd., ADR | | | 341,631 | | | | 3,925,340 | |
| | | | | | | | |
| | | | | | | $ | 6,798,784 | |
| Cable TV - 0.4% | | | | | | | | |
| Comcast Corp., “A” | | | 19,846 | | | $ | 878,384 | |
| | |
| Computer Software - 2.0% | | | | | | | | |
| Adobe Systems, Inc. (a) | | | 15,769 | | | $ | 4,486,438 | |
| | |
| Computer Software - Systems - 2.9% | | | | | | | | |
| Hitachi Ltd. | | | 30,400 | | | $ | 1,038,467 | |
| NICE Systems Ltd., ADR (a) | | | 34,383 | | | | 5,269,195 | |
| | | | | | | | |
| | | | | | | $ | 6,307,662 | |
| Construction - 1.8% | | | | | | | | |
| AvalonBay Communities, Inc., REIT | | | 14,528 | | | $ | 3,088,071 | |
| Rinnai Corp. | | | 15,700 | | | | 985,730 | |
| | | | | | | | |
| | | | | | | $ | 4,073,801 | |
| Consumer Products - 2.8% | | | | | | | | |
| Kimberly-Clark Corp. | | | 15,851 | | | $ | 2,236,735 | |
| L’Oréal | | | 3,713 | | | | 1,014,480 | |
12
Portfolio of Investments – continued
| | | | | | | | |
| | |
| Issuer | | Shares/Par | | | Value ($) | |
| Common Stocks - continued | | | | | | | | |
| Consumer Products - continued | | | | | | | | |
| Procter & Gamble Co. | | | 23,636 | | | $ | 2,841,756 | |
| | | | | | | | |
| | | | | | | $ | 6,092,971 | |
| Electronics - 3.5% | | | | | | | | |
| Kyocera Corp. | | | 50,100 | | | $ | 2,978,129 | |
| Taiwan Semiconductor Manufacturing Co. Ltd., ADR | | | 111,327 | | | | 4,745,870 | |
| | | | | | | | |
| | | | | | | $ | 7,723,999 | |
| Energy - Integrated - 1.3% | | | | | | | | |
| Eni S.p.A. | | | 55,307 | | | $ | 831,540 | |
| Royal Dutch Shell PLC, “B” | | | 71,092 | | | | 1,959,332 | |
| | | | | | | | |
| | | | | | | $ | 2,790,872 | |
| Food & Beverages - 7.8% | | | | | | | | |
| General Mills, Inc. | | | 55,529 | | | $ | 2,987,460 | |
| Mondelez International, Inc. | | | 35,916 | | | | 1,983,281 | |
| Mowi A.S.A. | | | 91,691 | | | | 2,193,613 | |
| Nestle S.A. | | | 36,385 | | | | 4,080,561 | |
| PepsiCo, Inc. | | | 33,399 | | | | 4,566,645 | |
| Toyo Suisan Kaisha Ltd. | | | 33,200 | | | | 1,351,626 | |
| | | | | | | | |
| | | | | | | $ | 17,163,186 | |
| Food & Drug Stores - 4.3% | | | | | | | | |
| Dairy Farm International Holdings Ltd. | | | 252,200 | | | $ | 1,805,752 | |
| Lawson, Inc. | | | 38,700 | | | | 1,919,791 | |
| Seven & I Holdings Co. Ltd. | | | 61,000 | | | | 2,157,264 | |
| Tesco PLC | | | 277,539 | | | | 740,259 | |
| Wesfarmers Ltd. | | | 108,146 | | | | 2,847,690 | |
| | | | | | | | |
| | | | | | | $ | 9,470,756 | |
| Gaming & Lodging - 2.2% | | | | | | | | |
| Crown Resorts Ltd. | | | 230,783 | | | $ | 1,866,604 | |
| Genting Berhad | | | 2,066,200 | | | | 2,947,854 | |
| | | | | | | | |
| | | | | | | $ | 4,814,458 | |
| Health Maintenance Organizations - 0.8% | | | | | | | | |
| Cigna Corp. | | | 10,896 | | | $ | 1,677,657 | |
| | |
| Insurance - 5.2% | | | | | | | | |
| Beazley PLC | | | 226,406 | | | $ | 1,568,920 | |
| Everest Re Group Ltd. | | | 13,127 | | | | 3,096,397 | |
| MetLife, Inc. | | | 44,869 | | | | 1,987,696 | |
| Reinsurance Group of America, Inc. | | | 11,267 | | | | 1,734,780 | |
| Samsung Fire & Marine Insurance Co. Ltd. | | | 6,847 | | | | 1,294,500 | |
13
Portfolio of Investments – continued
| | | | | | | | |
| | |
| Issuer | | Shares/Par | | | Value ($) | |
| Common Stocks - continued | | | | | | | | |
| Insurance - continued | | | | | | | | |
| Zurich Insurance Group AG | | | 4,625 | | | $ | 1,645,794 | |
| | | | | | | | |
| | | | | | | $ | 11,328,087 | |
| Internet - 0.8% | | | | | | | | |
| Alphabet, Inc., “A” (a) | | | 1,441 | | | $ | 1,715,554 | |
| | |
| Machinery & Tools - 0.9% | | | | | | | | |
| AGCO Corp. | | | 13,562 | | | $ | 937,405 | |
| Doosan Bobcat, Inc. | | | 34,106 | | | | 1,009,453 | |
| | | | | | | | |
| | | | | | | $ | 1,946,858 | |
| Major Banks - 1.8% | | | | | | | | |
| Bank of Nova Scotia | | | 18,201 | | | $ | 968,475 | |
| PNC Financial Services Group, Inc. | | | 8,432 | | | | 1,087,138 | |
| Royal Bank of Canada | | | 24,911 | | | | 1,862,346 | |
| | | | | | | | |
| | | | | | | $ | 3,917,959 | |
| Medical & Health Technology & Services - 0.4% | | | | | | | | |
| McKesson Corp. | | | 6,006 | | | $ | 830,450 | |
| | |
| Medical Equipment - 2.7% | | | | | | | | |
| EssilorLuxottica | | | 14,538 | | | $ | 2,145,044 | |
| Terumo Corp. | | | 132,100 | | | | 3,838,591 | |
| | | | | | | | |
| | | | | | | $ | 5,983,635 | |
| Natural Gas - Distribution - 0.5% | | | | | | | | |
| Tokyo Gas Co. Ltd. | | | 42,500 | | | $ | 1,074,352 | |
| | |
| Natural Gas - Pipeline - 0.9% | | | | | | | | |
| Enbridge, Inc. | | | 56,681 | | | $ | 1,896,546 | |
| | |
| Other Banks & Diversified Financials - 3.5% | | | | | | | | |
| Bangkok Bank Public Co. Ltd. | | | 128,500 | | | $ | 720,836 | |
| Credicorp Ltd. | | | 9,139 | | | | 1,892,870 | |
| DBS Group Holdings Ltd. | | | 47,300 | | | | 836,079 | |
| Komercni Banka A.S. | | | 36,237 | | | | 1,286,352 | |
| U.S. Bancorp | | | 43,138 | | | | 2,272,941 | |
| Zions Bancorp NA | | | 17,065 | | | | 701,201 | |
| | | | | | | | |
| | | | | | | $ | 7,710,279 | |
| Pharmaceuticals - 10.5% | | | | | | | | |
| Eli Lilly & Co. | | | 20,788 | | | $ | 2,348,420 | |
| Johnson & Johnson | | | 41,868 | | | | 5,374,177 | |
| Merck & Co., Inc. | | | 39,520 | | | | 3,417,294 | |
14
Portfolio of Investments – continued
| | | | | | | | |
| | |
| Issuer | | Shares/Par | | | Value ($) | |
| Common Stocks - continued | | | | | | | | |
| Pharmaceuticals - continued | | | | | | | | |
| Novartis AG | | | 14,229 | | | $ | 1,279,640 | |
| Novo Nordisk A.S., “B” | | | 41,779 | | | | 2,169,450 | |
| Pfizer, Inc. | | | 49,784 | | | | 1,769,821 | |
| Roche Holding AG | | | 24,442 | | | | 6,682,501 | |
| | | | | | | | |
| | | | | | | $ | 23,041,303 | |
| Pollution Control - 1.8% | | | | | | | | |
| Waste Connections, Inc. | | | 42,181 | | | $ | 3,876,434 | |
| | |
| Precious Metals & Minerals - 1.3% | | | | | | | | |
| Franco-Nevada Corp. | | | 29,035 | | | $ | 2,836,332 | |
| | |
| Railroad & Shipping - 0.8% | | | | | | | | |
| Canadian National Railway Co. | | | 19,605 | | | $ | 1,806,405 | |
| | |
| Real Estate - 6.8% | | | | | | | | |
| Grand City Properties S.A. | | | 148,425 | | | $ | 3,406,080 | |
| Life Storage, Inc., REIT | | | 15,564 | | | | 1,649,162 | |
| Public Storage, Inc., REIT | | | 6,483 | | | | 1,716,309 | |
| STORE Capital Corp., REIT | | | 140,775 | | | | 5,315,664 | |
| Sun Communities, Inc., REIT | | | 19,481 | | | | 2,879,292 | |
| | | | | | | | |
| | | | | | | $ | 14,966,507 | |
| Restaurants - 4.5% | | | | | | | | |
| McDonald’s Corp. | | | 15,084 | | | $ | 3,287,860 | |
| Starbucks Corp. | | | 53,716 | | | | 5,186,817 | |
| U.S. Foods Holding Corp. (a) | | | 37,401 | | | | 1,512,870 | |
| | | | | | | | |
| | | | | | | $ | 9,987,547 | |
| Specialty Chemicals - 1.0% | | | | | | | | |
| Symrise AG | | | 24,696 | | | $ | 2,304,910 | |
| | |
| Specialty Stores - 2.1% | | | | | | | | |
| ABC-MART, Inc. | | | 71,100 | | | $ | 4,544,350 | |
| | |
| Telecommunications - Wireless - 3.1% | | | | | | | | |
| Advanced Info Service Public Co. Ltd. | | | 190,700 | | | $ | 1,447,131 | |
| KDDI Corp. | | | 127,400 | | | | 3,399,812 | |
| Vodafone Group PLC | | | 1,070,832 | | | | 2,022,758 | |
| | | | | | | | |
| | | | | | | $ | 6,869,701 | |
| Telephone Services - 4.1% | | | | | | | | |
| HKT Trust and HKT Ltd. | | | 1,928,000 | | | $ | 3,014,805 | |
| TELUS Corp. | | | 96,046 | | | | 3,482,628 | |
15
Portfolio of Investments – continued
| | | | | | | | |
| | |
| Issuer | | Shares/Par | | | Value ($) | |
| Common Stocks - continued | | | | | | | | |
| Telephone Services - continued | | | | | | | | |
| Verizon Communications, Inc. | | | 41,429 | | | $ | 2,409,511 | |
| | | | | | | | |
| | | | | | | $ | 8,906,944 | |
| Tobacco - 1.4% | | | | | | | | |
| British American Tobacco PLC | | | 23,458 | | | $ | 822,058 | |
| Japan Tobacco, Inc. | | | 103,300 | | | | 2,188,325 | |
| | | | | | | | |
| | | | | | | $ | 3,010,383 | |
| Utilities - Electric Power - 7.7% | | | | | | | | |
| American Electric Power Co., Inc. | | | 26,334 | | | $ | 2,400,344 | |
| Avangrid, Inc. | | | 29,694 | | | | 1,500,735 | |
| CEZ A.S. | | | 32,467 | | | | 715,170 | |
| CLP Holdings Ltd. | | | 313,500 | | | | 3,228,805 | |
| Duke Energy Corp. | | | 10,001 | | | | 927,493 | |
| Evergy, Inc. | | | 36,660 | | | | 2,382,900 | |
| WEC Energy Group, Inc. | | | 29,953 | | | | 2,868,599 | |
| Xcel Energy, Inc. | | | 44,227 | | | | 2,840,258 | |
| | | | | | | | |
| | | | | | | $ | 16,864,304 | |
| Total Common Stocks (Identified Cost, $182,669,256) | | | | | | $ | 217,707,106 | |
| | |
| Investment Companies (h) - 0.3% | | | | | | | | |
| Money Market Funds - 0.3% | | | | | | | | |
MFS Institutional Money Market Portfolio, 2.17% (v)
(Identified Cost, $588,564) | | | 588,550 | | | $ | 588,609 | |
| | |
| Other Assets, Less Liabilities - 0.5% | | | | | | | 1,094,486 | |
| Net Assets - 100.0% | | | | | | $ | 219,390,201 | |
| (a) | Non-income producing security. |
| (h) | An affiliated issuer, which may be considered one in which the fund owns 5% or more of the outstanding voting securities, or a company which is under common control. At period end, the aggregate values of the fund’s investments in affiliated issuers and in unaffiliated issuers were $588,609 and $217,707,106, respectively. |
| (v) | Affiliated issuer that is available only to investment companies managed by MFS. The rate quoted for the MFS Institutional Money Market Portfolio is the annualizedseven-day yield of the fund at period end. |
The following abbreviations are used in this report and are defined:
| ADR | | American Depositary Receipt |
| REIT | | Real Estate Investment Trust |
See Notes to Financial Statements
16
Financial Statements
STATEMENT OF ASSETS AND LIABILITIES
At 8/31/19
This statement represents your fund’s balance sheet, which details the assets and liabilities comprising the total value of the fund.
| | | | |
| Assets | | | | |
Investments in unaffiliated issuers, at value (identified cost, $182,669,256) | | | $217,707,106 | |
Investments in affiliated issuers, at value (identified cost, $588,564) | | | 588,609 | |
Receivables for | | | | |
Fund shares sold | | | 885,221 | |
Dividends | | | 881,575 | |
Receivable from investment adviser | | | 25,021 | |
Other assets | | | 256 | |
Total assets | | | $220,087,788 | |
| |
| Liabilities | | | | |
Payables for | | | | |
Fund shares reacquired | | | $486,156 | |
Payable to affiliates | | | | |
Administrative services fee | | | 328 | |
Shareholder servicing costs | | | 57,303 | |
Distribution and service fees | | | 518 | |
Payable for independent Trustees’ compensation | | | 14 | |
Deferred country tax expense payable | | | 36,731 | |
Accrued expenses and other liabilities | | | 116,537 | |
Total liabilities | | | $697,587 | |
Net assets | | | $219,390,201 | |
| |
| Net assets consist of | | | | |
Paid-in capital | | | $184,917,147 | |
Total distributable earnings (loss) | | | 34,473,054 | |
Net assets | | | $219,390,201 | |
Shares of beneficial interest outstanding | | | 15,764,397 | |
17
Statement of Assets and Liabilities – continued
| | | | | | | | | | | | |
| | | |
| | | Net assets | | | Shares
outstanding | | | Net asset value
per share (a) | |
| Class A | | | $19,981,357 | | | | 1,435,630 | | | | $13.92 | |
| Class B | | | 410,015 | | | | 29,673 | | | | 13.82 | |
| Class C | | | 2,876,284 | | | | 208,412 | | | | 13.80 | |
| Class I | | | 118,906,636 | | | | 8,540,200 | | | | 13.92 | |
| Class R1 | | | 96,387 | | | | 6,947 | | | | 13.88 | |
| Class R2 | | | 75,360 | | | | 5,413 | | | | 13.92 | |
| Class R3 | | | 71,048 | | | | 5,098 | | | | 13.94 | |
| Class R4 | | | 71,769 | | | | 5,154 | | | | 13.92 | |
| Class R6 | | | 76,901,345 | | | | 5,527,870 | | | | 13.91 | |
| (a) | Maximum offering price per share was equal to the net asset value per share for all share classes, except for Class A, for which the maximum offering price per share was $14.77 [100 / 94.25 x $13.92]. On sales of $50,000 or more, the maximum offering price of Class A shares is reduced. A contingent deferred sales charge may be imposed on redemptions of Class A, Class B, and Class C shares. Redemption price per share was equal to the net asset value per share for Classes I, R1, R2, R3, R4, and R6. |
See Notes to Financial Statements
18
Financial Statements
STATEMENT OF OPERATIONS
Year ended 8/31/19
This statement describes how much your fund earned in investment income and accrued in expenses. It also describes any gains and/or losses generated by fund operations.
| | | | |
| Net investment income (loss) | | | | |
Income | | | | |
Dividends | | | $6,669,768 | |
Dividends from affiliated issuers | | | 45,831 | |
Other | | | 19,547 | |
Income on securities loaned | | | 13,688 | |
Interest | | | 7 | |
Foreign taxes withheld | | | (375,152 | ) |
Total investment income | | | $6,373,689 | |
Expenses | | | | |
Management fee | | | $1,245,776 | |
Distribution and service fees | | | 61,983 | |
Shareholder servicing costs | | | 120,538 | |
Administrative services fee | | | 41,165 | |
Independent Trustees’ compensation | | | 8,290 | |
Custodian fee | | | 72,792 | |
Shareholder communications | | | 32,274 | |
Audit and tax fees | | | 56,131 | |
Legal fees | | | 2,048 | |
Registration fees | | | 128,070 | |
Miscellaneous | | | 33,894 | |
Total expenses | | | $1,802,961 | |
Reduction of expenses by investment adviser and distributor | | | (114,188 | ) |
Net expenses | | | $1,688,773 | |
Net investment income (loss) | | | $4,684,916 | |
| |
| Realized and unrealized gain (loss) | | | | |
Realized gain (loss) (identified cost basis) | | | | |
Unaffiliated issuers (net of $7,498 country tax) | | | $1,971,059 | |
Affiliated issuers | | | (89 | ) |
Foreign currency | | | 5,742 | |
Net realized gain (loss) | | | $1,976,712 | |
Change in unrealized appreciation or depreciation | | | | |
Unaffiliated issuers (net of $28,227 increase in deferred country tax) | | | $10,761,321 | |
Affiliated issuers | | | (72 | ) |
Translation of assets and liabilities in foreign currencies | | | 1,165 | |
Net unrealized gain (loss) | | | $10,762,414 | |
Net realized and unrealized gain (loss) | | | $12,739,126 | |
Change in net assets from operations | | | $17,424,042 | |
See Notes to Financial Statements
19
Financial Statements
STATEMENTS OF CHANGES IN NET ASSETS
These statements describe the increases and/or decreases in net assets resulting from operations, any distributions, and any shareholder transactions.
| | | | | | | | |
| | | Year ended | |
| | | 8/31/19 | | | 8/31/18 | |
| Change in net assets | | | | | | |
| | |
| From operations | | | | | | | | |
Net investment income (loss) | | | $4,684,916 | | | | $3,736,632 | |
Net realized gain (loss) | | | 1,976,712 | | | | 4,752,570 | |
Net unrealized gain (loss) | | | 10,762,414 | | | | 8,115,677 | |
Change in net assets from operations | | | $17,424,042 | | | | $16,604,879 | |
Total distributions to shareholders (a) | | | $(10,518,952 | ) | | | $(3,747,865 | ) |
Change in net assets from fund share transactions | | | $17,311,467 | | | | $3,967,302 | |
Total change in net assets | | | $24,216,557 | | | | $16,824,316 | |
| | |
| Net assets | | | | | | | | |
At beginning of period | | | 195,173,644 | | | | 178,349,328 | |
At end of period (b) | | | $219,390,201 | | | | $195,173,644 | |
| (a) | Distributions from net investment income and from net realized gain are no longer required to be separately disclosed. For the year ended August 31, 2018, distributions from net investment income were $3,747,865. |
| (b) | Parenthetical disclosure of undistributed net investment income is no longer required. For the year ended August 31, 2018, end of period net assets included undistributed net investment income of $985,825. |
See Notes to Financial Statements
20
Financial Statements
FINANCIAL HIGHLIGHTS
The financial highlights table is intended to help you understand the fund’s financial performance for the past 5 years. Certain information reflects financial results for a single fund share. The total returns in the table represent the rate that an investor would have earned (or lost) on an investment in the fund share class (assuming reinvestment of all distributions) held for the entire period.
| | | | | | | | | | | | | | | | | | | | |
| Class A | | Year ended | |
| | | | | |
| | | 8/31/19 | | | 8/31/18 | | | 8/31/17 | | | 8/31/16 | | | 8/31/15 | |
Net asset value, beginning of period | | | $13.73 | | | | $12.82 | | | | $11.87 | | | | $10.75 | | | | $10.92 | |
| | | | |
| Income (loss) from investment operations | | | | | | | | | | | | | | | | | |
Net investment income (loss) (d) | | | $0.25 | | | | $0.23 | | | | $0.19 | | | | $0.18 | | | | $0.19 | |
Net realized and unrealized gain (loss) | | | 0.56 | | | | 0.92 | | | | 0.91 | | | | 1.11 | | | | (0.22 | ) |
Total from investment operations | | | $0.81 | | | | $1.15 | | | | $1.10 | | | | $1.29 | | | | $(0.03 | ) |
| | | | |
| Less distributions declared to shareholders | | | | | | | | | | | | | | | | | |
From net investment income | | | $(0.23 | ) | | | $(0.24 | ) | | | $(0.15 | ) | | | $(0.17 | ) | | | $(0.12 | ) |
From net realized gain | | | (0.39 | ) | | | — | | | | — | | | | — | | | | (0.02 | ) |
Total distributions declared to shareholders | | | $(0.62 | ) | | | $(0.24 | ) | | | $(0.15 | ) | | | $(0.17 | ) | | | $(0.14 | ) |
Net asset value, end of period (x) | | | $13.92 | | | | $13.73 | | | | $12.82 | | | | $11.87 | | | | $10.75 | |
Total return (%) (r)(s)(t)(x) | | | 6.38 | | | | 9.09 | | | | 9.36 | | | | 12.12 | | | | (0.36 | ) |
| | | | |
Ratios (%) (to average net assets)
and Supplemental data: | | | | | | | | | | | | | | | | | |
Expenses before expense reductions (f) | | | 1.05 | | | | 1.06 | | | | 1.23 | | | | 1.51 | | | | 1.88 | |
Expenses after expense reductions (f) | | | 0.98 | | | | 0.97 | | | | 1.17 | | | | 1.19 | | | | 1.23 | |
Net investment income (loss) | | | 1.86 | | | | 1.75 | | | | 1.55 | | | | 1.56 | | | | 1.65 | |
Portfolio turnover | | | 65 | | | | 41 | | | | 24 | | | | 28 | | | | 61 | |
Net assets at end of period (000 omitted) | | | $19,981 | | | | $9,102 | | | | $9,215 | | | | $7,473 | | | | $3,981 | |
See Notes to Financial Statements
21
Financial Highlights – continued
| | | | | | | | | | | | | | | | | | | | |
| Class B | | Year ended | |
| | | | | |
| | | 8/31/19 | | | 8/31/18 | | | 8/31/17 | | | 8/31/16 | | | 8/31/15 | |
Net asset value, beginning of period | | | $13.63 | | | | $12.73 | | | | $11.79 | | | | $10.70 | | | | $10.91 | |
| | | |
| Income (loss) from investment operations | | | | | | | | | | | | | |
Net investment income (loss) (d) | | | $0.14 | | | | $0.13 | | | | $0.09 | | | | $0.07 | | | | $0.08 | |
Net realized and unrealized gain (loss) | | | 0.57 | | | | 0.91 | | | | 0.91 | | | | 1.12 | | | | (0.20 | ) |
Total from investment operations | | | $0.71 | | | | $1.04 | | | | $1.00 | | | | $1.19 | | | | $(0.12 | ) |
| | | |
| Less distributions declared to shareholders | | | | | | | | | | | | | |
From net investment income | | | $(0.13 | ) | | | $(0.14 | ) | | | $(0.06 | ) | | | $(0.10 | ) | | | $(0.07 | ) |
From net realized gain | | | (0.39 | ) | | | — | | | | — | | | | — | | | | (0.02 | ) |
Total distributions declared to shareholders | | | $(0.52 | ) | | | $(0.14 | ) | | | $(0.06 | ) | | | $(0.10 | ) | | | $(0.09 | ) |
Net asset value, end of period (x) | | | $13.82 | | | | $13.63 | | | | $12.73 | | | | $11.79 | | | | $10.70 | |
Total return (%) (r)(s)(t)(x) | | | 5.60 | | | | 8.25 | | | | 8.48 | | | | 11.16 | | | | (1.16 | ) |
| | | | |
Ratios (%) (to average net assets)
and Supplemental data: | | | | | | | | | | | | | | | | | |
Expenses before expense reductions (f) | | | 1.79 | | | | 1.81 | | | | 1.98 | | | | 2.33 | | | | 2.68 | |
Expenses after expense reductions (f) | | | 1.74 | | | | 1.74 | | | | 1.96 | | | | 1.98 | | | | 2.01 | |
Net investment income (loss) | | | 1.03 | | | | 1.02 | | | | 0.73 | | | | 0.65 | | | | 0.74 | |
Portfolio turnover | | | 65 | | | | 41 | | | | 24 | | | | 28 | | | | 61 | |
Net assets at end of period (000 omitted) | | | $410 | | | | $380 | | | | $350 | | | | $341 | | | | $446 | |
| |
| Class C | | Year ended | |
| | | | | |
| | | 8/31/19 | | | 8/31/18 | | | 8/31/17 | | | 8/31/16 | | | 8/31/15 | |
Net asset value, beginning of period | | | $13.62 | | | | $12.71 | | | | $11.78 | | | | $10.69 | | | | $10.91 | |
| | | |
| Income (loss) from investment operations | | | | | | | | | | | | | |
Net investment income (loss) (d) | | | $0.14 | | | | $0.13 | | | | $0.09 | | | | $0.08 | | | | $0.10 | |
Net realized and unrealized gain (loss) | | | 0.57 | | | | 0.92 | | | | 0.91 | | | | 1.11 | | | | (0.23 | ) |
Total from investment operations | | | $0.71 | | | | $1.05 | | | | $1.00 | | | | $1.19 | | | | $(0.13 | ) |
| | | |
| Less distributions declared to shareholders | | | | | | | | | | | | | |
From net investment income | | | $(0.14 | ) | | | $(0.14 | ) | | | $(0.07 | ) | | | $(0.10 | ) | | | $(0.07 | ) |
From net realized gain | | | (0.39 | ) | | | — | | | | — | | | | — | | | | (0.02 | ) |
Total distributions declared to shareholders | | | $(0.53 | ) | | | $(0.14 | ) | | | $(0.07 | ) | | | $(0.10 | ) | | | $(0.09 | ) |
Net asset value, end of period (x) | | | $13.80 | | | | $13.62 | | | | $12.71 | | | | $11.78 | | | | $10.69 | |
Total return (%) (r)(s)(t)(x) | | | 5.57 | | | | 8.28 | | | | 8.49 | | | | 11.22 | | | | (1.23 | ) |
| | | | |
Ratios (%) (to average net assets)
and Supplemental data: | | | | | | | | | | | | | | | | | |
Expenses before expense reductions (f) | | | 1.80 | | | | 1.81 | | | | 1.98 | | | | 2.23 | | | | 2.66 | |
Expenses after expense reductions (f) | | | 1.74 | | | | 1.74 | | | | 1.96 | | | | 1.99 | | | | 2.00 | |
Net investment income (loss) | | | 1.02 | | | | 1.01 | | | | 0.76 | | | | 0.74 | | | | 0.89 | |
Portfolio turnover | | | 65 | | | | 41 | | | | 24 | | | | 28 | | | | 61 | |
Net assets at end of period (000 omitted) | | | $2,876 | | | | $1,773 | | | | $1,924 | | | | $1,554 | | | | $453 | |
See Notes to Financial Statements
22
Financial Highlights – continued
| | | | | | | | | | | | | | | | | | | | |
| Class I | | Year ended | |
| | | | | |
| | | 8/31/19 | | | 8/31/18 | | | 8/31/17 | | | 8/31/16 | | | 8/31/15 | |
Net asset value, beginning of period | | | $13.73 | | | | $12.82 | | | | $11.87 | | | | $10.76 | | | | $10.93 | |
| | | |
| Income (loss) from investment operations | | | | | | | | | | | | | |
Net investment income (loss) (d) | | | $0.28 | | | | $0.27 | | | | $0.23 | | | | $0.21 | | | | $0.24 | |
Net realized and unrealized gain (loss) | | | 0.56 | | | | 0.91 | | | | 0.90 | | | | 1.10 | | | | (0.25 | ) |
Total from investment operations | | | $0.84 | | | | $1.18 | | | | $1.13 | | | | $1.31 | | | | $(0.01 | ) |
| | | |
| Less distributions declared to shareholders | | | | | | | | | | | | | |
From net investment income | | | $(0.26 | ) | | | $(0.27 | ) | | | $(0.18 | ) | | | $(0.20 | ) | | | $(0.14 | ) |
From net realized gain | | | (0.39 | ) | | | — | | | | — | | | | — | | | | (0.02 | ) |
Total distributions declared to shareholders | | | $(0.65 | ) | | | $(0.27 | ) | | | $(0.18 | ) | | | $(0.20 | ) | | | $(0.16 | ) |
Net asset value, end of period (x) | | | $13.92 | | | | $13.73 | | | | $12.82 | | | | $11.87 | | | | $10.76 | |
Total return (%) (r)(s)(t)(x) | | | 6.61 | | | | 9.34 | | | | 9.59 | | | | 12.34 | | | | (0.18 | ) |
| | | | |
Ratios (%) (to average net assets)
and Supplemental data: | | | | | | | | | | | | | | | | | |
Expenses before expense reductions (f) | | | 0.79 | | | | 0.81 | | | | 0.94 | | | | 1.17 | | | | 1.63 | |
Expenses after expense reductions (f) | | | 0.74 | | | | 0.74 | | | | 0.90 | | | | 0.98 | | | | 1.00 | |
Net investment income (loss) | | | 2.09 | | | | 2.03 | | | | 1.87 | | | | 1.86 | | | | 2.10 | |
Portfolio turnover | | | 65 | | | | 41 | | | | 24 | | | | 28 | | | | 61 | |
Net assets at end of period (000 omitted) | | | $118,907 | | | | $114,259 | | | | $97,952 | | | | $10,669 | | | | $2,685 | |
| |
| Class R1 | | Year ended | |
| | | | | |
| | | 8/31/19 | | | 8/31/18 | | | 8/31/17 | | | 8/31/16 | | | 8/31/15 | |
Net asset value, beginning of period | | | $13.69 | | | | $12.78 | | | | $11.84 | | | | $10.70 | | | | $10.91 | |
| | | |
| Income (loss) from investment operations | | | | | | | | | | | | | |
Net investment income (loss) (d) | | | $0.14 | | | | $0.14 | | | | $0.09 | | | | $0.08 | | | | $0.07 | |
Net realized and unrealized gain (loss) | | | 0.58 | | | | 0.91 | | | | 0.91 | | | | 1.12 | | | | (0.19 | ) |
Total from investment operations | | | $0.72 | | | | $1.05 | | | | $1.00 | | | | $1.20 | | | | $(0.12 | ) |
| | | |
| Less distributions declared to shareholders | | | | | | | | | | | | | |
From net investment income | | | $(0.14 | ) | | | $(0.14 | ) | | | $(0.06 | ) | | | $(0.06 | ) | | | $(0.07 | ) |
From net realized gain | | | (0.39 | ) | | | — | | | | — | | | | — | | | | (0.02 | ) |
Total distributions declared to shareholders | | | $(0.53 | ) | | | $(0.14 | ) | | | $(0.06 | ) | | | $(0.06 | ) | | | $(0.09 | ) |
Net asset value, end of period (x) | | | $13.88 | | | | $13.69 | | | | $12.78 | | | | $11.84 | | | | $10.70 | |
Total return (%) (r)(s)(t)(x) | | | 5.61 | | | | 8.29 | | | | 8.47 | | | | 11.24 | | | | (1.22 | ) |
| | | | |
Ratios (%) (to average net assets)
and Supplemental data: | | | | | | | | | | | | | | | | | |
Expenses before expense reductions (f) | | | 1.79 | | | | 1.81 | | | | 1.98 | | | | 2.31 | | | | 2.69 | |
Expenses after expense reductions (f) | | | 1.74 | | | | 1.74 | | | | 1.96 | | | | 1.99 | | | | 2.01 | |
Net investment income (loss) | | | 1.03 | | | | 1.03 | | | | 0.75 | | | | 0.69 | | | | 0.66 | |
Portfolio turnover | | | 65 | | | | 41 | | | | 24 | | | | 28 | | | | 61 | |
Net assets at end of period (000 omitted) | | | $96 | | | | $74 | | | | $68 | | | | $56 | | | | $108 | |
See Notes to Financial Statements
23
Financial Highlights – continued
| | | | | | | | | | | | | | | | | | | | |
| Class R2 | | Year ended | |
| | | | | |
| | | 8/31/19 | | | 8/31/18 | | | 8/31/17 | | | 8/31/16 | | | 8/31/15 | |
Net asset value, beginning of period | | | $13.73 | | | | $12.81 | | | | $11.87 | | | | $10.74 | | | | $10.92 | |
| | | |
| Income (loss) from investment operations | | | | | | | | | | | | | |
Net investment income (loss) (d) | | | $0.21 | | | | $0.20 | | | | $0.15 | | | | $0.13 | | | | $0.13 | |
Net realized and unrealized gain (loss) | | | 0.57 | | | | 0.92 | | | | 0.90 | | | | 1.13 | | | | (0.20 | ) |
Total from investment operations | | | $0.78 | | | | $1.12 | | | | $1.05 | | | | $1.26 | | | | $(0.07 | ) |
| | | |
| Less distributions declared to shareholders | | | | | | | | | | | | | |
From net investment income | | | $(0.20 | ) | | | $(0.20 | ) | | | $(0.11 | ) | | | $(0.13 | ) | | | $(0.09 | ) |
From net realized gain | | | (0.39 | ) | | | — | | | | — | | | | — | | | | (0.02 | ) |
Total distributions declared to shareholders | | | $(0.59 | ) | | | $(0.20 | ) | | | $(0.11 | ) | | | $(0.13 | ) | | | $(0.11 | ) |
Net asset value, end of period (x) | | | $13.92 | | | | $13.73 | | | | $12.81 | | | | $11.87 | | | | $10.74 | |
Total return (%) (r)(s)(t)(x) | | | 6.09 | | | | 8.87 | | | | 8.94 | | | | 11.83 | | | | (0.71 | ) |
| | | | |
Ratios (%) (to average net assets)
and Supplemental data: | | | | | | | | | | | | | | | | | |
Expenses before expense reductions (f) | | | 1.29 | | | | 1.31 | | | | 1.49 | | | | 1.79 | | | | 2.19 | |
Expenses after expense reductions (f) | | | 1.24 | | | | 1.24 | | | | 1.47 | | | | 1.49 | | | | 1.51 | |
Net investment income (loss) | | | 1.53 | | | | 1.52 | | | | 1.24 | | | | 1.20 | | | | 1.16 | |
Portfolio turnover | | | 65 | | | | 41 | | | | 24 | | | | 28 | | | | 61 | |
Net assets at end of period (000 omitted) | | | $75 | | | | $66 | | | | $61 | | | | $72 | | | | $112 | |
| |
| Class R3 | | Year ended | |
| | | | | |
| | | 8/31/19 | | | 8/31/18 | | | 8/31/17 | | | 8/31/16 | | | 8/31/15 | |
Net asset value, beginning of period | | | $13.74 | | | | $12.82 | | | | $11.88 | | | | $10.76 | | | | $10.92 | |
| | | |
| Income (loss) from investment operations | | | | | | | | | | | | | |
Net investment income (loss) (d) | | | $0.24 | | | | $0.22 | | | | $0.19 | | | | $0.16 | | | | $0.16 | |
Net realized and unrealized gain (loss) | | | 0.58 | | | | 0.93 | | | | 0.90 | | | | 1.12 | | | | (0.19 | ) |
Total from investment operations | | | $0.82 | | | | $1.15 | | | | $1.09 | | | | $1.28 | | | | $(0.03 | ) |
| | | |
| Less distributions declared to shareholders | | | | | | | | | | | | | |
From net investment income | | | $(0.23 | ) | | | $(0.23 | ) | | | $(0.15 | ) | | | $(0.16 | ) | | | $(0.11 | ) |
From net realized gain | | | (0.39 | ) | | | — | | | | — | | | | — | | | | (0.02 | ) |
Total distributions declared to shareholders | | | $(0.62 | ) | | | $(0.23 | ) | | | $(0.15 | ) | | | $(0.16 | ) | | | $(0.13 | ) |
Net asset value, end of period (x) | | | $13.94 | | | | $13.74 | | | | $12.82 | | | | $11.88 | | | | $10.76 | |
Total return (%) (r)(s)(t)(x) | | | 6.42 | | | | 9.11 | | | | 9.24 | | | | 12.05 | | | | (0.34 | ) |
| | | | |
Ratios (%) (to average net assets)
and Supplemental data: | | | | | | | | | | | | | | | | | |
Expenses before expense reductions (f) | | | 1.04 | | | | 1.05 | | | | 1.21 | | | | 1.56 | | | | 1.94 | |
Expenses after expense reductions (f) | | | 0.99 | | | | 0.99 | | | | 1.18 | | | | 1.24 | | | | 1.26 | |
Net investment income (loss) | | | 1.78 | | | | 1.69 | | | | 1.55 | | | | 1.44 | | | | 1.41 | |
Portfolio turnover | | | 65 | | | | 41 | | | | 24 | | | | 28 | | | | 61 | |
Net assets at end of period (000 omitted) | | | $71 | | | | $67 | | | | $151 | | | | $56 | | | | $110 | |
See Notes to Financial Statements
24
Financial Highlights – continued
| | | | | | | | | | | | | | | | | | | | |
| Class R4 | | Year ended | |
| | | | | |
| | | 8/31/19 | | | 8/31/18 | | | 8/31/17 | | | 8/31/16 | | | 8/31/15 | |
Net asset value, beginning of period | | | $13.73 | | | | $12.82 | | | | $11.87 | | | | $10.76 | | | | $10.93 | |
| | | |
| Income (loss) from investment operations | | | | | | | | | | | | | |
Net investment income (loss) (d) | | | $0.27 | | | | $0.27 | | | | $0.21 | | | | $0.19 | | | | $0.19 | |
Net realized and unrealized gain (loss) | | | 0.57 | | | | 0.91 | | | | 0.92 | | | | 1.12 | | | | (0.20 | ) |
Total from investment operations | | | $0.84 | | | | $1.18 | | | | $1.13 | | | | $1.31 | | | | $(0.01 | ) |
| | | |
| Less distributions declared to shareholders | | | | | | | | | | | | | |
From net investment income | | | $(0.26 | ) | | | $(0.27 | ) | | | $(0.18 | ) | | | $(0.20 | ) | | | $(0.14 | ) |
From net realized gain | | | (0.39 | ) | | | — | | | | — | | | | — | | | | (0.02 | ) |
Total distributions declared to shareholders | | | $(0.65 | ) | | | $(0.27 | ) | | | $(0.18 | ) | | | $(0.20 | ) | | | $(0.16 | ) |
Net asset value, end of period (x) | | | $13.92 | | | | $13.73 | | | | $12.82 | | | | $11.87 | | | | $10.76 | |
Total return (%) (r)(s)(t)(x) | | | 6.61 | | | | 9.34 | | | | 9.58 | | | | 12.32 | | | | (0.18 | ) |
| | | | |
Ratios (%) (to average net assets)
and Supplemental data: | | | | | | | | | | | | | | | | | |
Expenses before expense reductions (f) | | | 0.79 | | | | 0.81 | | | | 0.98 | | | | 1.31 | | | | 1.69 | |
Expenses after expense reductions (f) | | | 0.74 | | | | 0.74 | | | | 0.96 | | | | 0.99 | | | | 1.02 | |
Net investment income (loss) | | | 2.03 | | | | 2.02 | | | | 1.74 | | | | 1.69 | | | | 1.66 | |
Portfolio turnover | | | 65 | | | | 41 | | | | 24 | | | | 28 | | | | 61 | |
Net assets at end of period (000 omitted) | | | $72 | | | | $67 | | | | $62 | | | | $56 | | | | $110 | |
| |
| Class R6 | | Year ended | |
| | | | | |
| | | 8/31/19 | | | 8/31/18 | | | 8/31/17 | | | 8/31/16 | | | 8/31/15 | |
Net asset value, beginning of period | | | $13.72 | | | | $12.81 | | | | $11.86 | | | | $10.76 | | | | $10.92 | |
| | | |
| Income (loss) from investment operations | | | | | | | | | | | | | |
Net investment income (loss) (d) | | | $0.28 | | | | $0.27 | | | | $0.21 | | | | $0.20 | | | | $0.20 | |
Net realized and unrealized gain (loss) | | | 0.57 | | | | 0.92 | | | | 0.92 | | | | 1.11 | | | | (0.20 | ) |
Total from investment operations | | | $0.85 | | | | $1.19 | | | | $1.13 | | | | $1.31 | | | | $0.00 | |
| | | |
| Less distributions declared to shareholders | | | | | | | | | | | | | |
From net investment income | | | $(0.27 | ) | | | $(0.28 | ) | | | $(0.18 | ) | | | $(0.21 | ) | | | $(0.14 | ) |
From net realized gain | | | (0.39 | ) | | | — | | | | — | | | | — | | | | (0.02 | ) |
Total distributions declared to shareholders | | | $(0.66 | ) | | | $(0.28 | ) | | | $(0.18 | ) | | | $(0.21 | ) | | | $(0.16 | ) |
Net asset value, end of period (x) | | | $13.91 | | | | $13.72 | | | | $12.81 | | | | $11.86 | | | | $10.76 | |
Total return (%) (r)(s)(t)(x) | | | 6.68 | | | | 9.42 | | | | 9.63 | | | | 12.37 | | | | (0.09 | ) |
| | | | |
Ratios (%) (to average net assets)
and Supplemental data: | | | | | | | | | | | | | | | | | |
Expenses before expense reductions (f) | | | 0.72 | | | | 0.74 | | | | 0.94 | | | | 1.21 | | | | 1.63 | |
Expenses after expense reductions (f) | | | 0.67 | | | | 0.67 | | | | 0.92 | | | | 0.93 | | | | 0.97 | |
Net investment income (loss) | | | 2.11 | | | | 2.08 | | | | 1.77 | | | | 1.76 | | | | 1.79 | |
Portfolio turnover | | | 65 | | | | 41 | | | | 24 | | | | 28 | | | | 61 | |
Net assets at end of period (000 omitted) | | | $76,901 | | | | $69,385 | | | | $68,569 | | | | $45,799 | | | | $27,802 | |
See Notes to Financial Statements
25
Financial Highlights – continued
| (d) | Per share data is based on average shares outstanding. |
| (f) | Ratios do not reflect reductions from fees paid indirectly, if applicable. |
| (r) | Certain expenses have been reduced without which performance would have been lower. |
| (s) | From time to time the fund may receive proceeds from litigation settlements, without which performance would be lower. |
| (t) | Total returns do not include any applicable sales charges. |
| (x) | The net asset values and total returns have been calculated on net assets which include adjustments made in accordance with U.S. generally accepted accounting principles required at period end for financial reporting purposes. |
See Notes to Financial Statements
26
NOTES TO FINANCIAL STATEMENTS
(1) Business and Organization
MFS Low Volatility Global Equity Fund (the fund) is a diversified series of MFS Series Trust I (the trust). The trust is organized as a Massachusetts business trust and is registered under the Investment Company Act of 1940, as amended, as anopen-end management investment company.
The fund is an investment company and accordingly follows the investment company accounting and reporting guidance of the Financial Accounting Standards Board (FASB) Accounting Standards Codification Topic 946 Financial Services – Investment Companies.
(2) Significant Accounting Policies
General– The preparation of financial statements in conformity with U.S. generally accepted accounting principles requires management to make estimates and assumptions that affect the reported amounts of assets and liabilities, and disclosure of contingent assets and liabilities at the date of the financial statements and the reported amounts of increases and decreases in net assets from operations during the reporting period. Actual results could differ from those estimates. In the preparation of these financial statements, management has evaluated subsequent events occurring after the date of the fund’s Statement of Assets and Liabilities through the date that the financial statements were issued. The fund invests in foreign securities. Investments in foreign securities are vulnerable to the effects of changes in the relative values of the local currency and the U.S. dollar and to the effects of changes in each country’s market, economic, industrial, political, regulatory, geopolitical, and other conditions.
Balance Sheet Offsetting– The fund’s accounting policy with respect to balance sheet offsetting is that, absent an event of default by the counterparty or a termination of the agreement, the International Swaps and Derivatives Association (ISDA) Master Agreement, or similar agreement, does not result in an offset of reported amounts of financial assets and financial liabilities in the Statement of Assets and Liabilities across transactions between the fund and the applicable counterparty. The fund’s right to setoff may be restricted or prohibited by the bankruptcy or insolvency laws of the particular jurisdiction to which a specific master netting agreement counterparty is subject. Balance sheet offsetting disclosures, to the extent applicable to the fund, have been included in the fund’s Significant Accounting Policies note under the captions for each of the fund’sin-scope financial instruments and transactions.
Investment Valuations– Equity securities, including restricted equity securities, are generally valued at the last sale or official closing price on their primary market or exchange as provided by a third-party pricing service. Equity securities, for which there were no sales reported that day, are generally valued at the last quoted daily bid quotation on their primary market or exchange as provided by a third-party pricing service. Short-term instruments with a maturity at issuance of 60 days or less may be valued at amortized cost, which approximates market value.Open-end investment companies are generally valued at net asset value per share. Securities and other assets generally valued on the basis of information from a third-party pricing service may also be valued at a broker/dealer bid quotation. In determining values, third-party pricing
27
Notes to Financial Statements – continued
services can utilize both transaction data and market information such as yield, quality, coupon rate, maturity, type of issue, trading characteristics, and other market data. The values of foreign securities and other assets and liabilities expressed in foreign currencies are converted to U.S. dollars using the mean of bid and asked prices for rates provided by a third-party pricing service.
The Board of Trustees has delegated primary responsibility for determining or causing to be determined the value of the fund’s investments (including any fair valuation) to the adviser pursuant to valuation policies and procedures approved by the Board. If the adviser determines that reliable market quotations are not readily available, investments are valued at fair value as determined in good faith by the adviser in accordance with such procedures under the oversight of the Board of Trustees. Under the fund’s valuation policies and procedures, market quotations are not considered to be readily available for most types of debt instruments and floating rate loans and many types of derivatives. These investments are generally valued at fair value based on information from third-party pricing services. In addition, investments may be valued at fair value if the adviser determines that an investment’s value has been materially affected by events occurring after the close of the exchange or market on which the investment is principally traded (such as foreign exchange or market) and prior to the determination of the fund’s net asset value, or after the halt of trading of a specific security where trading does not resume prior to the close of the exchange or market on which the security is principally traded. Events that occur after foreign markets close (such as developments in foreign markets and significant movements in the U.S. markets) and prior to the determination of the fund’s net asset value may be deemed to have a material effect on the value of securities traded in foreign markets. Accordingly, the fund’s foreign equity securities may often be valued at fair value. The adviser generally relies on third-party pricing services or other information (such as the correlation with price movements of similar securities in the same or other markets; the type, cost and investment characteristics of the security; the business and financial condition of the issuer; and trading and other market data) to assist in determining whether to fair value and at what value to fair value an investment. The value of an investment for purposes of calculating the fund’s net asset value can differ depending on the source and method used to determine value. When fair valuation is used, the value of an investment used to determine the fund’s net asset value may differ from quoted or published prices for the same investment. There can be no assurance that the fund could obtain the fair value assigned to an investment if it were to sell the investment at the same time at which the fund determines its net asset value per share.
Various inputs are used in determining the value of the fund’s assets or liabilities. These inputs are categorized into three broad levels. In certain cases, the inputs used to measure fair value may fall into different levels of the fair value hierarchy. In such cases, an investment’s level within the fair value hierarchy is based on the lowest level of input that is significant to the fair value measurement. The fund’s assessment of the significance of a particular input to the fair value measurement in its entirety requires judgment, and considers factors specific to the investment. Level 1 includes unadjusted quoted prices in active markets for identical assets or liabilities. Level 2 includes other significant observable market-based inputs (including quoted prices for similar securities, interest rates, prepayment speed, and credit risk). Level 3 includes
28
Notes to Financial Statements – continued
unobservable inputs, which may include the adviser’s own assumptions in determining the fair value of investments. The following is a summary of the levels used as of August 31, 2019 in valuing the fund’s assets or liabilities:
| | | | | | | | | | | | | | | | |
| | | | |
| Financial Instruments | | Level 1 | | | Level 2 | | | Level 3 | | | Total | |
| Equity Securities: | | | | | | | | | | | | | | | | |
United States | | | $95,158,145 | | | | $— | | | | $— | | | | $95,158,145 | |
Japan | | | 27,391,157 | | | | — | | | | — | | | | 27,391,157 | |
Canada | | | 17,882,422 | | | | — | | | | — | | | | 17,882,422 | |
Switzerland | | | 13,688,496 | | | | — | | | | — | | | | 13,688,496 | |
United Kingdom | | | 8,215,619 | | | | — | | | | — | | | | 8,215,619 | |
Hong Kong | | | 8,049,363 | | | | — | | | | — | | | | 8,049,363 | |
Germany | | | 5,710,990 | | | | — | | | | — | | | | 5,710,990 | |
Israel | | | 5,269,194 | | | | — | | | | — | | | | 5,269,194 | |
Taiwan | | | 4,745,870 | | | | — | | | | — | | | | 4,745,870 | |
Other Countries | | | 30,148,719 | | | | 1,447,131 | | | | — | | | | 31,595,850 | |
| Mutual Funds | | | 588,609 | | | | — | | | | — | | | | 588,609 | |
| Total | | | $216,848,584 | | | | $1,447,131 | | | | $— | | | | $218,295,715 | |
For further information regarding security characteristics, see the Portfolio of Investments.
Foreign Currency Translation– Purchases and sales of foreign investments, income, and expenses are converted into U.S. dollars based upon currency exchange rates prevailing on the respective dates of such transactions or on the reporting date for foreign denominated receivables and payables. Gains and losses attributable to foreign currency exchange rates on sales of securities are recorded for financial statement purposes as net realized gains and losses on investments. Gains and losses attributable to foreign exchange rate movements on receivables, payables, income and expenses are recorded for financial statement purposes as foreign currency transaction gains and losses. That portion of both realized and unrealized gains and losses on investments that results from fluctuations in foreign currency exchange rates is not separately disclosed.
Security Loans– Under its Securities Lending Agency Agreement with the fund, State Street Bank and Trust Company, as lending agent, loans the securities of the fund to certain qualified institutions (the “Borrowers”) approved by the fund. Security loans can be terminated at the discretion of either the lending agent or the fund and the related securities must be returned within the earlier of the standard trade settlement period for such securities or within three business days. The loans are collateralized by cash and/or U.S. Treasury and federal agency obligations in an amount typically at least equal to the market value of the securities loaned. On loans collateralized by cash, the cash collateral is invested in a money market fund. The market value of the loaned securities is determined at the close of business of the fund and any additional required collateral is delivered to the fund on the next business day. The lending agent provides the fund with indemnification against Borrower default. In the event of Borrower default, the lending agent will, for the benefit of the fund, either purchase securities identical to those loaned or, when such purchase is commercially impracticable, pay the fund the market value of the loaned securities. In return, the lending agent assumes
29
Notes to Financial Statements – continued
the fund’s rights to the related collateral. If the collateral value is less than the cost to purchase identical securities, the lending agent is responsible for the shortfall, but only to the extent that such shortfall is not due to a decline in collateral value resulting from collateral reinvestment for which the fund bears the risk of loss. A portion of the income generated upon investment of the collateral is remitted to the Borrowers, and the remainder is allocated between the fund and the lending agent. On loans collateralized by U.S. Treasury and/or federal agency obligations, a fee is received from the Borrower, and is allocated between the fund and the lending agent. Income from securities lending is separately reported in the Statement of Operations. The dividend and interest income earned on the securities loaned is accounted for in the same manner as other dividend and interest income. At August 31, 2019, there were no securities on loan or collateral outstanding.
Indemnifications– Under the fund’s organizational documents, its officers and Trustees may be indemnified against certain liabilities and expenses arising out of the performance of their duties to the fund. Additionally, in the normal course of business, the fund enters into agreements with service providers that may contain indemnification clauses. The fund’s maximum exposure under these agreements is unknown as this would involve future claims that may be made against the fund that have not yet occurred.
Investment Transactions and Income– Investment transactions are recorded on the trade date. Dividends received in cash are recorded on theex-dividend date. Certain dividends from foreign securities will be recorded when the fund is informed of the dividend if such information is obtained subsequent to theex-dividend date. Dividend payments received in additional securities are recorded on theex-dividend date in an amount equal to the value of the security on such date.
The fund may receive proceeds from litigation settlements. Any proceeds received from litigation involving portfolio holdings are reflected in the Statement of Operations in realized gain/loss if the security has been disposed of by the fund or in unrealized gain/loss if the security is still held by the fund. Any other proceeds from litigation not related to portfolio holdings are reflected as other income in the Statement of Operations.
Tax Matters and Distributions– The fund intends to qualify as a regulated investment company, as defined under Subchapter M of the Internal Revenue Code, and to distribute all of its taxable income, including realized capital gains. As a result, no provision for federal income tax is required. The fund’s federal tax returns, when filed, will remain subject to examination by the Internal Revenue Service for a three year period. Management has analyzed the fund’s tax positions taken on federal and state tax returns for all open tax years and does not believe that there are any uncertain tax positions that require recognition of a tax liability. Foreign taxes, if any, have been accrued by the fund in the accompanying financial statements in accordance with the applicable foreign tax law. Foreign income taxes may be withheld by certain countries in which the fund invests. Additionally, capital gains realized by the fund on securities issued in or by certain foreign countries may be subject to capital gains tax imposed by those countries.
30
Notes to Financial Statements – continued
Distributions to shareholders are recorded on theex-dividend date. Income and capital gain distributions are determined in accordance with income tax regulations, which may differ from U.S. generally accepted accounting principles. Certain capital accounts in the financial statements are periodically adjusted for permanent differences in order to reflect their tax character. These adjustments have no impact on net assets or net asset value per share. Temporary differences which arise from recognizing certain items of income, expense, gain or loss in different periods for financial statement and tax purposes will reverse at some time in the future. Distributions in excess of net investment income or net realized gains are temporary overdistributions for financial statement purposes resulting from differences in the recognition or classification of income or distributions for financial statement and tax purposes.
Book/tax differences primarily relate to passive foreign investment companies and wash sale loss deferrals.
The tax character of distributions declared to shareholders for the last two fiscal years is as follows:
| | | | | | | | |
| | |
| | | Year ended | | | Year ended | |
| | |
| | | 8/31/19 | | | 8/31/18 | |
| Ordinary income (including any short-term capital gains) | | | $4,465,803 | | | | $3,747,865 | |
| Long-term capital gains | | | 6,053,149 | | | | — | |
| Total distributions | | | $10,518,952 | | | | $3,747,865 | |
The federal tax cost and the tax basis components of distributable earnings were as follows:
| | | | |
| |
| As of 8/31/19 | | | |
| |
| Cost of investments | | | $185,946,171 | |
| Gross appreciation | | | 36,883,978 | |
| |
| Gross depreciation | | | (4,534,434 | ) |
| Net unrealized appreciation (depreciation) | | | $32,349,544 | |
| |
| Undistributed ordinary income | | | 1,949,792 | |
| Undistributed long-term capital gain | | | 244,641 | |
| Other temporary differences | | | (70,923 | ) |
Multiple Classes of Shares of Beneficial Interest– The fund offers multiple classes of shares, which differ in their respective distribution and service fees. The fund’s income, realized and unrealized gain (loss), and common expenses are allocated to shareholders based on the daily net assets of each class. Dividends are declared separately for each class. Differences in per share dividend rates are generally due to differences in separate class expenses. Class B shares will convert to Class A shares approximately eight years after purchase. Class C shares will convert to Class A shares
31
Notes to Financial Statements – continued
approximately ten years after purchase. The fund’s distributions declared to shareholders as reported in the Statements of Changes in Net Assets are presented by class as follows:
| | | | | | | | | | | | | | | | |
| | | From net investment
income | | | From net realized
gain | |
| | | | |
| | | Year
ended
8/31/19 | | | Year
ended
8/31/18 | | | Year
ended
8/31/19 | | | Year
ended
8/31/18 | |
| Class A | | | $233,200 | | | | $171,679 | | | | $316,381 | | | | $— | |
| Class B | | | 3,792 | | | | 4,005 | | | | 10,247 | | | | — | |
| Class C | | | 21,935 | | | | 19,587 | | | | 55,646 | | | | — | |
| Class I | | | 2,688,977 | | | | 2,142,583 | | | | 3,717,214 | | | | — | |
| Class R1 | | | 832 | | | | 760 | | | | 2,099 | | | | — | |
| Class R2 | | | 982 | | | | 979 | | | | 1,872 | | | | — | |
| Class R3 | | | 1,148 | | | | 1,496 | | | | 1,885 | | | | — | |
| Class R4 | | | 1,324 | | | | 1,310 | | | | 1,902 | | | | — | |
| Class R6 | | | 1,446,520 | | | | 1,405,466 | | | | 2,012,996 | | | | — | |
| Total | | | $4,398,710 | | | | $3,747,865 | | | | $6,120,242 | | | | $— | |
(3) Transactions with Affiliates
Investment Adviser– The fund has an investment advisory agreement with MFS to provide overall investment management and related administrative services and facilities to the fund. The management fee is computed daily and paid monthly at the following annual rates based on the fund’s average daily net assets:
| | | | |
| Up to $1 billion | | | 0.55 | % |
| In excess of $1 billion and up to $2.5 billion | | | 0.525 | % |
| In excess of $2.5 billion | | | 0.50 | % |
MFS has agreed in writing to reduce its management fee by a specified amount if certain MFS mutual fund assets exceed thresholds agreed to by MFS and the fund’s Board of Trustees. For the year ended August 31, 2019, this management fee reduction amounted to $21,943, which is included in the reduction of total expenses in the Statement of Operations. The management fee incurred for the year ended August 31, 2019 was equivalent to an annual effective rate of 0.54% of the fund’s average daily net assets.
The investment adviser has agreed in writing to pay a portion of the fund’s total annual operating expenses, excluding interest, taxes, extraordinary expenses, brokerage and transaction costs, and investment-related expenses, such that total fund operating expenses do not exceed the following rates annually of each class’s average daily net assets:
| | | | | | | | | | | | | | | | | | | | | | | | | | | | | | | | |
| Classes | |
| | | | | | | | |
| A | | B | | | C | | | I | | | R1 | | | R2 | | | R3 | | | R4 | | | R6 | |
| 0.99% | | | 1.74% | | | | 1.74% | | | | 0.74% | | | | 1.74% | | | | 1.24% | | | | 0.99% | | | | 0.74% | | | | 0.68% | |
This written agreement will continue until modified by the fund’s Board of Trustees, but such agreement will continue at least until December 31, 2020. For the year ended August 31, 2019, this reduction amounted to $91,138, which is included in the reduction of total expenses in the Statement of Operations.
32
Notes to Financial Statements – continued
Distributor– MFS Fund Distributors, Inc. (MFD), a wholly-owned subsidiary of MFS, as distributor, received $8,593 for the year ended August 31, 2019, as its portion of the initial sales charge on sales of Class A shares of the fund.
The Board of Trustees has adopted a distribution plan for certain share classes pursuant to Rule12b-1 of the Investment Company Act of 1940.
The fund’s distribution plan provides that the fund will pay MFD for services provided by MFD and financial intermediaries in connection with the distribution and servicing of certain share classes. One component of the plan is a distribution fee paid to MFD and another component of the plan is a service fee paid to MFD. MFD may subsequently pay all, or a portion, of the distribution and/or service fees to financial intermediaries.
Distribution Plan Fee Table:
| | | | | | | | | | | | | | | | | | | | |
| | | | | |
| | | Distribution
Fee Rate (d) | | | Service
Fee Rate (d) | | | Total
Distribution
Plan (d) | | | Annual
Effective
Rate (e) | | | Distribution
and Service
Fee | |
| Class A | | | — | | | | 0.25% | | | | 0.25% | | | | 0.24% | | | | $34,962 | |
| Class B | | | 0.75% | | | | 0.25% | | | | 1.00% | | | | 1.00% | | | | 3,857 | |
| Class C | | | 0.75% | | | | 0.25% | | | | 1.00% | | | | 1.00% | | | | 21,863 | |
| Class R1 | | | 0.75% | | | | 0.25% | | | | 1.00% | | | | 1.00% | | | | 796 | |
| Class R2 | | | 0.25% | | | | 0.25% | | | | 0.50% | | | | 0.50% | | | | 336 | |
| Class R3 | | | — | | | | 0.25% | | | | 0.25% | | | | 0.25% | | | | 169 | |
| Total Distribution and Service Fees | | | | | | | | | | | | $61,983 | |
| (d) | In accordance with the distribution plan for certain classes, the fund pays distribution and/or service fees equal to these annual percentage rates of each class’s average daily net assets. The distribution and service fee rates disclosed by class represent the current rates in effect at the end of the reporting period. Any rate changes, if applicable, are detailed below. |
| (e) | The annual effective rates represent actual fees incurred under the distribution plan for the year ended August 31, 2019 based on each class’s average daily net assets. MFD has voluntarily agreed to rebate a portion of each class’s 0.25% service fee attributable to accounts for which MFD retains the 0.25% service fee except for accounts attributable to MFS or its affiliates’ seed money. For the year ended August 31, 2019, this rebate amounted to $1,107 for Class A and is included in the reduction of total expenses in the Statement of Operations. |
Certain Class A shares are subject to a contingent deferred sales charge (CDSC) in the event of a shareholder redemption within 18 months of purchase. Class B shares are subject to a CDSC in the event of a shareholder redemption within six years of purchase. Class C shares are subject to a CDSC in the event of a shareholder redemption within 12 months of purchase. All contingent deferred sales charges are paid to MFD and during the year ended August 31, 2019, were as follows:
| | | | |
| |
| | | Amount | |
| Class A | | | $131 | |
| Class B | | | 735 | |
| Class C | | | 411 | |
Shareholder Servicing Agent– MFS Service Center, Inc. (MFSC), a wholly-owned subsidiary of MFS, receives a fee from the fund for its services as shareholder servicing agent calculated as a percentage of the average daily net assets of the fund as determined periodically under the supervision of the fund’s Board of Trustees. For the
33
Notes to Financial Statements – continued
year ended August 31, 2019, the fee was $5,148, which equated to 0.0023% annually of the fund’s average daily net assets. MFSC also receives payment from the fund forout-of-pocket expenses,sub-accounting and other shareholder servicing costs which may be paid to affiliated and unaffiliated service providers. Class R6 shares do not incursub-accounting fees. For the year ended August 31, 2019, theseout-of-pocket expenses,sub-accounting and other shareholder servicing costs amounted to $115,390.
Administrator– MFS provides certain financial, legal, shareholder communications, compliance, and other administrative services to the fund. Under an administrative services agreement, the fund reimburses MFS the costs incurred to provide these services. The fund is charged an annual fixed amount of $17,500 plus a fee based on average daily net assets. The administrative services fee incurred for the year ended August 31, 2019 was equivalent to an annual effective rate of 0.0182% of the fund’s average daily net assets.
Trustees’ and Officers’ Compensation– The fund pays compensation to independent Trustees in the form of a retainer, attendance fees, and additional compensation to Board and Committee chairpersons. The fund does not pay compensation directly to Trustees or officers of the fund who are also officers of the investment adviser, all of whom receive remuneration from MFS for their services to the fund. Certain officers and Trustees of the fund are officers or directors of MFS, MFD, and MFSC.
Other– This fund and certain other funds managed by MFS (the funds) had entered into a service agreement (the ISO Agreement) which provided for payment of fees solely by the funds to Tarantino LLC in return for the provision of services of an Independent Senior Officer (ISO) for the funds. Frank L. Tarantino served as the ISO and was an officer of the funds and the sole member of Tarantino LLC. Effective June 30, 2019, Mr. Tarantino retired from his position as ISO for the funds, and the ISO
Agreement was terminated. For the year ended August 31, 2019, the fee paid by the fund under this agreement was $399 and is included in “Miscellaneous” expense in the Statement of Operations. MFS had agreed to bear all expenses associated with office space, other administrative support, and supplies provided to the ISO.
The fund invests in the MFS Institutional Money Market Portfolio which is managed by MFS and seeks current income consistent with preservation of capital and liquidity. This money market fund does not pay a management fee to MFS.
On September 20, 2017, MFS redeemed 2,847 shares of Class I for an aggregate amount of $36,499. On March 19, 2018, MFS redeemed 7,343 shares of Class I for an aggregate amount of $96,564.
At August 31, 2019, MFS held approximately 72%, 93%, 100%, and 100% of the outstanding shares of Class R1, Class R2, Class R3, and Class R4, respectively.
The fund is permitted to engage in purchase and sale transactions with funds and accounts for which MFS serves as investment adviser orsub-adviser (“cross-trades”) pursuant to a policy adopted by the Board of Trustees. This policy has been designed to ensure that cross-trades conducted by the fund comply with Rule17a-7 under the
34
Notes to Financial Statements – continued
Investment Company Act of 1940. During the year ended August 31, 2019, the fund engaged in purchase transactions pursuant to this policy, which amounted to $611,422.
The adviser has voluntarily undertaken to reimburse the fund from its own resources on a quarterly basis for the cost of investment research embedded in the cost of the fund’s securities trades. This agreement may be rescinded at any time. For the year ended August 31, 2019, this reimbursement amounted to $19,503, which is included in “Other” income in the Statement of Operations.
(4) Portfolio Securities
For the year ended August 31, 2019, purchases and sales of investments, other thanshort-term obligations, aggregated $156,784,339 and $145,091,807, respectively.
(5) Shares of Beneficial Interest
The fund’s Declaration of Trust permits the Trustees to issue an unlimited number of full and fractional shares of beneficial interest. Transactions in fund shares were as follows:
| | | | | | | | | | | | | | | | |
| | | Year ended
8/31/19 | | | Year ended
8/31/18 | |
| | | | |
| | | Shares | | | Amount | | | Shares | | | Amount | |
| Shares sold | | | | | | | | | | | | | | | | |
Class A | | | 1,041,729 | | | | $13,809,908 | | | | 166,465 | | | | $2,195,559 | |
Class B | | | 3,234 | | | | 41,580 | | | | 2,431 | | | | 32,218 | |
Class C | | | 131,925 | | | | 1,728,080 | | | | 44,846 | | | | 588,231 | |
Class I | | | 8,478,173 | | | | 112,927,999 | | | | 3,081,326 | | | | 40,706,123 | |
Class R1 | | | 1,336 | | | | 18,304 | | | | 59 | | | | 768 | |
Class R2 | | | 358 | | | | 4,947 | | | | — | | | | — | |
Class R6 | | | 1,744,896 | | | | 23,529,647 | | | | 1,110,058 | | | | 14,524,680 | |
| | | 11,401,651 | | | | $152,060,465 | | | | 4,405,185 | | | | $58,047,579 | |
| | | | |
Shares issued to shareholders in
reinvestment of distributions | | | | | | | | | | | | | | | | |
Class A | | | 42,848 | | | | $548,615 | | | | 13,140 | | | | $171,513 | |
Class B | | | 1,114 | | | | 14,039 | | | | 307 | | | | 4,005 | |
Class C | | | 6,003 | | | | 75,592 | | | | 1,495 | | | | 19,416 | |
Class I | | | 476,060 | | | | 6,073,699 | | | | 157,587 | | | | 2,054,501 | |
Class R1 | | | 231 | | | | 2,931 | | | | 58 | | | | 760 | |
Class R2 | | | 224 | | | | 2,854 | | | | 75 | | | | 979 | |
Class R3 | | | 238 | | | | 3,033 | | | | 115 | | | | 1,496 | |
Class R4 | | | 252 | | | | 3,226 | | | | 101 | | | | 1,310 | |
Class R6 | | | 261,566 | | | | 3,338,647 | | | | 104,523 | | | | 1,360,917 | |
| | | 788,536 | | | | $10,062,636 | | | | 277,401 | | | | $3,614,897 | |
35
Notes to Financial Statements – continued
| | | | | | | | | | | | | | | | |
| | | Year ended
8/31/19 | | | Year ended
8/31/18 | |
| | | | |
| | | Shares | | | Amount | | | Shares | | | Amount | |
| Shares reacquired | | | | | | | | | | | | | | | | |
Class A | | | (311,945 | ) | | | $(4,142,094 | ) | | | (235,675 | ) | | | $(3,097,154 | ) |
Class B | | | (2,521 | ) | | | (32,865 | ) | | | (2,369 | ) | | | (30,922 | ) |
Class C | | | (59,697 | ) | | | (780,451 | ) | | | (67,494 | ) | | | (885,022 | ) |
Class I | | | (8,734,942 | ) | | | (119,271,353 | ) | | | (2,560,046 | ) | | | (33,731,533 | ) |
Class R1 | | | (43 | ) | | | (600 | ) | | | (1 | ) | | | (18 | ) |
Class R3 | | | — | | | | — | | | | (7,000 | ) | | | (90,368 | ) |
Class R6 | | | (1,535,830 | ) | | | (20,584,271 | ) | | | (1,511,756 | ) | | | (19,860,157 | ) |
| | | (10,644,978 | ) | | | $(144,811,634 | ) | | | (4,384,341 | ) | | | $(57,695,174 | ) |
| | | | |
| Net change | | | | | | | | | | | | | | | | |
Class A | | | 772,632 | | | | $10,216,429 | | | | (56,070 | ) | | | $(730,082 | ) |
Class B | | | 1,827 | | | | 22,754 | | | | 369 | | | | 5,301 | |
Class C | | | 78,231 | | | | 1,023,221 | | | | (21,153 | ) | | | (277,375 | ) |
Class I | | | 219,291 | | | �� | (269,655 | ) | | | 678,867 | | | | 9,029,091 | |
Class R1 | | | 1,524 | | | | 20,635 | | | | 116 | | | | 1,510 | |
Class R2 | | | 582 | | | | 7,801 | | | | 75 | | | | 979 | |
Class R3 | | | 238 | | | | 3,033 | | | | (6,885 | ) | | | (88,872 | ) |
Class R4 | | | 252 | | | | 3,226 | | | | 101 | | | | 1,310 | |
Class R6 | | | 470,632 | | | | 6,284,023 | | | | (297,175 | ) | | | (3,974,560 | ) |
| | | 1,545,209 | | | | $17,311,467 | | | | 298,245 | | | | $3,967,302 | |
Class T shares were not publicly available for sale during the period. Please see the fund’s prospectus for details.
Effective June 1, 2019, purchases of the fund’s Class B shares are closed to new and existing investors subject to certain exceptions. Please see the fund’s prospectus for details.
(6) Line of Credit
The fund and certain other funds managed by MFS participate in a $1.25 billion unsecured committed line of credit, subject to a $1 billion sublimit, provided by a syndicate of banks under a credit agreement. Borrowings may be made for temporary financing needs. Interest is charged to each fund, based on its borrowings, generally at a rate equal to the highest of one month LIBOR, the Federal Funds Effective Rate and the Overnight Bank Funding Rate, plus an agreed upon spread. A commitment fee, based on the average daily, unused portion of the committed line of credit, is allocated among the participating funds. In addition, the fund and other funds managed by MFS have established unsecured uncommitted borrowing arrangements with certain banks for temporary financing needs. Interest is charged to each fund, based on its borrowings, at rates equal to customary reference rates plus an agreed upon spread. For the year ended August 31, 2019, the fund’s commitment fee and interest expense were $1,285 and $0, respectively, and are included in “Miscellaneous” expense in the Statement of Operations.
36
Notes to Financial Statements – continued
(7) Investments in Affiliated Issuers
An affiliated issuer may be considered one in which the fund owns 5% or more of the outstanding voting securities, or a company which is under common control. For the purposes of this report, the following were affiliated issuers:
| | | | | | | | | | | | | | | | | | | | | | | | |
| | | | | | |
| Affiliated Issuers | | Beginning
Value | | | Purchases | | | Sales
Proceeds | | | Realized
Gain
(Loss) | | | Change in
Unrealized
Appreciation or
Depreciation | | | Ending
Value | |
MFS Institutional Money
Market Portfolio | | | $1,215,317 | | | | $89,068,892 | | | | $89,695,439 | | | | $(89 | ) | | | $(72 | ) | | | $588,609 | |
| | | | | | |
| Affiliated Issuers | | | | | | | | | | | | | | Dividend
Income | | | Capital Gain
Distributions | |
| MFS Institutional Money Market Portfolio | | | | | | | | | | | | | | | | $45,831 | | | | $— | |
37
REPORT OF INDEPENDENT REGISTERED PUBLIC ACCOUNTING FIRM
To the Board of Trustees of MFS Series Trust I and the Shareholders of MFS Low Volatility Global Equity Fund:
Opinion on the Financial Statements and Financial Highlights
We have audited the accompanying statement of assets and liabilities of MFS Low Volatility Global Equity Fund (the “Fund”), including the portfolio of investments, as of August 31, 2019, the related statement of operations for the year then ended, the statements of changes in net assets for each of the two years in the period then ended, the financial highlights for each of the five years in the period then ended, and the related notes. In our opinion, the financial statements and financial highlights present fairly, in all material respects, the financial position of the Fund as of August 31, 2019, and the results of its operations for the year then ended, the changes in its net assets for each of the two years in the period then ended, and the financial highlights for each of the five years in the period then ended, in conformity with accounting principles generally accepted in the United States of America.
Basis for Opinion
These financial statements and financial highlights are the responsibility of the Fund’s management. Our responsibility is to express an opinion on the Fund’s financial statements and financial highlights based on our audits. We are a public accounting firm registered with the Public Company Accounting Oversight Board (United States) (PCAOB) and are required to be independent with respect to the Fund in accordance with the U.S. federal securities laws and the applicable rules and regulations of the Securities and Exchange Commission and the PCAOB.
We conducted our audits in accordance with the standards of the PCAOB. Those standards require that we plan and perform the audit to obtain reasonable assurance about whether the financial statements and financial highlights are free of material misstatement, whether due to error or fraud. The Fund is not required to have, nor were we engaged to perform, an audit of its internal control over financial reporting. As part of our audits we are required to obtain an understanding of internal control over financial reporting but not for the purpose of expressing an opinion on the effectiveness of the Fund’s internal control over financial reporting. Accordingly, we express no such opinion.
Our audits included performing procedures to assess the risks of material misstatement of the financial statements and financial highlights, whether due to error or fraud, and performing procedures that respond to those risks. Such procedures included examining, on a test basis, evidence regarding the amounts and disclosures in the financial statements and financial highlights. Our audits also included evaluating the accounting principles used and significant estimates made by management, as well as evaluating the overall presentation of the financial statements and financial highlights.
38
Report of Independent Registered Public Accounting Firm – continued
Our procedures included confirmation of securities owned as of August 31, 2019, by correspondence with the custodian. We believe that our audits provide a reasonable basis for our opinion.
DELOITTE & TOUCHE LLP
Boston, Massachusetts
October 17, 2019
We have served as the auditor of one or more of the MFS investment companies since 1924.
39
TRUSTEES AND OFFICERS — IDENTIFICATION AND BACKGROUND
The Trustees and Officers of the Trust, as of October 1, 2019, are listed below, together with their principal occupations during the past five years. (Their titles may have varied during that period.) The address of each Trustee and Officer is 111 Huntington Avenue, Boston, Massachusetts 02199-7618.
| | | | | | | | | | |
Name, Age | | Position(s)
Held
with Fund | | Trustee/Officer
Since (h) | | Number of
MFS Funds
overseen
by the
Trustee | | Principal
Occupations During the Past Five Years | | Other
Directorships
During the Past
Five Years (j) |
| INTERESTED TRUSTEES |
Robert J. Manning (k)
(age 55) | | Trustee | | February 2004 | | 135 | | Massachusetts Financial Services Company, Executive Chairman (since January 2017); Director; Chairman of the Board; Chief Executive Officer (until 2015);Co-Chief Executive Officer (2015-2016) | | N/A |
| | | | | |
Robin A. Stelmach (k) (age 58) | | Trustee | | January 2014 | | 135 | | Massachusetts Financial Services Company, Vice Chair (since January 2017); Chief Operating Officer and Executive Vice President (until January 2017) | | N/A |
| INDEPENDENT TRUSTEES |
John P. Kavanaugh (age 64) | | Trustee and Chair of Trustees | | January 2009 | | 135 | | Private investor | | N/A |
| | | | | |
Steven E. Buller (age 68) | | Trustee | | February 2014 | | 135 | | Financial Accounting Standards Advisory Council, Chairman (2014-2015); Public Company Accounting Oversight Board, Standing Advisory Group, Member (until 2014); BlackRock, Inc. (investment management), Managing Director (until 2014), BlackRock Finco UK (investment management), Director (until 2014) | | N/A |
40
Trustees and Officers – continued
| | | | | | | | | | |
Name, Age | | Position(s)
Held
with Fund | | Trustee/Officer
Since (h) | | Number of
MFS Funds
overseen
by the
Trustee | | Principal
Occupations During the Past Five Years | | Other
Directorships
During the Past
Five Years (j) |
John A. Caroselli (age 65) | | Trustee | | March 2017 | | 135 | | JC Global Advisors, LLC (management consulting), President (since 2015); First Capital Corporation (commercial finance), Executive Vice President (until 2015) | | N/A |
| | | | | |
Maureen R. Goldfarb (age 64) | | Trustee | | January 2009 | | 135 | | Private investor | | N/A |
| | | | | |
Michael Hegarty
(age 74) | | Trustee | | December 2004 | | 135 | | Private investor | | Rouse Properties Inc., Director (until 2016); Capmark Financial Group Inc., Director (until 2015) |
| | | | | |
Peter D. Jones
(age 64) | | Trustee | | January 2019 | | 135 | | Franklin Templeton Distributors, Inc. (investment management), President (until 2015); Franklin Templeton Institutional, LLC (investment management), Chairman (until 2015) | | N/A |
| | | | | |
James W. Kilman, Jr.
(age 58) | | Trustee | | January 2019 | | 135 | | Burford Capital Limited (finance and investment management), Chief Financial Officer (since 2019); KielStrand Capital LLC (family office and merchant bank), Chief Executive Officer (since 2016); Morgan Stanley & Co. (financial services), Vice Chairman of Investment Banking,Co-Head of Diversified Financials Coverage – Financial Institutions Investment Banking Group (until 2016) | | Alpha-En Corporation, Director (since 2016) |
41
Trustees and Officers – continued
| | | | | | | | | | |
Name, Age | | Position(s)
Held
with Fund | | Trustee/Officer
Since (h) | | Number of
MFS Funds
overseen
by the
Trustee | | Principal
Occupations During the Past Five Years | | Other
Directorships
During the Past
Five Years (j) |
Clarence Otis, Jr. (age 63) | | Trustee | | March 2017 | | 135 | | Darden Restaurants, Inc., Chief Executive Officer (until 2014) | | VF Corporation, Director; Verizon Communications, Inc., Director; The Travelers Companies, Director; Federal Reserve Bank of Atlanta, Director (until 2015) |
| | | | | |
Maryanne L. Roepke (age 63) | | Trustee | | May 2014 | | 135 | | American Century Investments (investment management), Senior Vice President and Chief Compliance Officer (until 2014) | | N/A |
| | | | | |
Laurie J. Thomsen
(age 62) | | Trustee | | March 2005 | | 135 | | Private investor | | The Travelers Companies, Director; Dycom Industries, Inc., Director (since 2015) |
| | | | | | | | |
Name, Age | | Position(s) Held
with Fund | | Trustee/Officer
Since (h) | | Number of
MFS Funds
for which
the Person
is an Officer | | Principal
Occupations During
the Past Five Years |
| OFFICERS | | | | | | | | |
Christopher R. Bohane (k)
(age 45) | | Assistant Secretary and Assistant Clerk | | July 2005 | | 135 | | Massachusetts Financial Services Company, Vice President and Assistant General Counsel |
| | | | |
Kino Clark (k) (age 51) | | Assistant Treasurer | | January 2012 | | 135 | | Massachusetts Financial Services Company, Vice President |
42
Trustees and Officers – continued
| | | | | | | | |
Name, Age | | Position(s) Held
with Fund | | Trustee/Officer
Since (h) | | Number of
MFS Funds
for which
the Person
is an Officer | | Principal
Occupations During
the Past Five Years |
John W. Clark, Jr. (k) (age 52) | | Assistant Treasurer | | April 2017 | | 135 | | Massachusetts Financial Services Company, Vice President (since March 2017); Deutsche Bank (financial services), Department Head – Treasurer’s Office (until February 2017) |
| | | | |
Thomas H. Connors (k) (age 60) | | Assistant Secretary and Assistant Clerk | | September 2012 | | 135 | | Massachusetts Financial Services Company, Vice President and Senior Counsel |
| | | | |
David L. DiLorenzo (k)
(age 51) | | President | | July 2005 | | 135 | | Massachusetts Financial Services Company, Senior Vice President |
| | | | |
Heidi W. Hardin (k)
(age 52) | | Secretary and Clerk | | April 2017 | | 135 | | Massachusetts Financial Services Company, Executive Vice President and General Counsel (since March 2017); Harris Associates (investment management), General Counsel (from September 2015 to January 2017); Janus Capital Management LLC (investment management), Senior Vice President and General Counsel (until September 2015) |
| | | | |
Brian E. Langenfeld (k)
(age 46) | | Assistant
Secretary and Assistant Clerk | | June 2006 | | 135 | | Massachusetts Financial Services Company, Vice President and Senior Counsel |
| | | | |
Amanda S. Mooradian (k)
(age 40) | | Assistant
Secretary and Assistant Clerk | | September 2018 | | 135 | | Massachusetts Financial Services Company, Assistant Vice President and Counsel |
43
Trustees and Officers – continued
| | | | | | | | |
Name, Age | | Position(s) Held
with Fund | | Trustee/Officer
Since (h) | | Number of
MFS Funds
for which
the Person
is an Officer | | Principal
Occupations During
the Past Five Years |
Susan A. Pereira (k)
(age 48) | | Assistant
Secretary and Assistant Clerk | | July 2005 | | 135 | | Massachusetts Financial Services Company, Vice President and Assistant General Counsel |
| | | | |
Kasey L. Phillips (k)
(age 48) | | Assistant Treasurer | | September 2012 | | 135 | | Massachusetts Financial Services Company, Vice President |
| | | | |
Matthew A. Stowe (k)
(age 44) | | Assistant Secretary and Assistant Clerk | | October 2014 | | 135 | | Massachusetts Financial Services Company, Vice President and Assistant General Counsel |
| | | | |
Martin J. Wolin (k)
(age 52) | | Chief Compliance Officer | | July 2015 | | 135 | | Massachusetts Financial Services Company, Senior Vice President and Chief Compliance Officer (since July 2015); Mercer (financial service provider), Chief Risk and Compliance Officer, North America and Latin America (until June 2015) |
| | | | |
James O. Yost (k)
(age 59) | | Treasurer | | September 1990 | | 135 | | Massachusetts Financial Services Company, Senior Vice President |
| (h) | Date first appointed to serve as Trustee/officer of an MFS Fund. Each Trustee has served continuously since appointment unless indicated otherwise. For the period from December 15, 2004 until February 22, 2005, Mr. Manning served as Advisory Trustee. From January 2012 through December 2016, Messrs. DiLorenzo and Yost served as Treasurer and Deputy Treasurer of the Funds, respectively. |
| (j) | Directorships or trusteeships of companies required to report to the Securities and Exchange Commission (i.e., “public companies”). |
| (k) | “Interested person” of the Trust within the meaning of the Investment Company Act of 1940 (referred to as the 1940 Act), which is the principal federal law governing investment companies like the fund, as a result of a position with MFS. The address of MFS is 111 Huntington Avenue, Boston, Massachusetts 02199-7618. |
Each Trustee (other than Messrs. Jones and Kilman) has been elected by shareholders and each Trustee and Officer holds office until his or her successor is chosen and qualified or until his or her earlier death, resignation, retirement or removal. Messrs. Jones and Kilman became Trustees of the Funds on January 1, 2019. The Trust does
44
Trustees and Officers – continued
not hold annual meetings for the purpose of electing Trustees, and Trustees are not elected for fixed terms. Under the terms of the Board’s retirement policy, an Independent Trustee shall retire at the end of the calendar year in which he or she reaches the earlier of 75 years of age or 15 years of service on the Board (or, in the case of any Independent Trustee who joined the Board prior to 2015, 20 years of service on the Board).
Messrs. Buller, Hegarty, Kilman and Otis and Ms. Roepke are members of the Trust’s Audit Committee.
Each of the Interested Trustees and certain Officers hold comparable officer positions with certain affiliates of MFS.
The Statement of Additional Information for a Fund includes further information about the Trustees and is available without charge upon request by calling1-800-225-2606.
| | |
| Investment Adviser | | Custodian |
Massachusetts Financial Services Company
111 Huntington Avenue Boston, MA 02199-7618 | | State Street Bank and Trust Company 1 Lincoln Street Boston, MA 02111-2900 |
| Distributor | | Independent Registered Public Accounting Firm |
MFS Fund Distributors, Inc.
111 Huntington Avenue Boston, MA 02199-7618 | | Deloitte & Touche LLP 200 Berkeley Street Boston, MA 02116 |
| Portfolio Manager(s) | | |
Jim Fallon Matt Krummell Jonathan Sage Jed Stocks | | |
45
BOARD REVIEW OF INVESTMENT ADVISORY AGREEMENT
The Investment Company Act of 1940 requires that both the full Board of Trustees and a majority of thenon-interested (“independent”) Trustees, voting separately, annually approve the continuation of the Fund’s investment advisory agreement with MFS. The Trustees consider matters bearing on the Fund and its advisory arrangements at their meetings throughout the year, including a review of performance data at each regular meeting. In addition, the independent Trustees met several times over the course of three months beginning in May and ending in July, 2019 (“contract review meetings”) for the specific purpose of considering whether to approve the continuation of the investment advisory agreement for the Fund and the other investment companies that the Board oversees (the “MFS Funds”). The independent Trustees were assisted in their evaluation of the Fund’s investment advisory agreement by independent legal counsel, from whom they received separate legal advice and with whom they met separately from MFS during various contract review meetings. The independent Trustees were also assisted in this process by the MFS Funds’ Independent Senior Officer, a senior officer appointed by and reporting to the independent Trustees.
In connection with their deliberations regarding the continuation of the investment advisory agreement, the Trustees, including the independent Trustees, considered such information and factors as they believed, in light of the legal advice furnished to them and their own business judgment, to be relevant. The investment advisory agreement for the Fund was considered separately, although the Trustees also took into account the common interests of all MFS Funds in their review. As described below, the Trustees considered the nature, quality, and extent of the various investment advisory, administrative, and shareholder services performed by MFS under the existing investment advisory agreement and other arrangements with the Fund.
In connection with their contract review meetings, the Trustees received and relied upon materials that included, among other items: (i) information provided by Broadridge Financial Solutions, Inc. (“Broadridge”), an independent third party, on the investment performance of the Fund for various time periods ended December 31, 2018 and the investment performance of a group of funds with substantially similar investment classifications/objectives (the “Broadridge performance universe”), (ii) information provided by Broadridge on the Fund’s advisory fees and other expenses and the advisory fees and other expenses of comparable funds identified by Broadridge as well as all other funds in the same investment classification/category (the “Broadridge expense group and universe”), (iii) information provided by MFS on the advisory fees of portfolios of other clients of MFS, including institutional separate accounts and other clients, (iv) information as to whether and to what extent applicable expense waivers, reimbursements or fee “breakpoints” are observed for the Fund, (v) information regarding MFS’ financial results and financial condition, including MFS’ and certain of its affiliates’ estimated profitability from services performed for the Fund and the MFS Funds as a whole, and compared to MFS’ institutional business, (vi) MFS’ views regarding the outlook for the mutual fund industry and the strategic business plans of MFS, (vii) descriptions of various functions performed by MFS for the Funds, such as compliance monitoring and portfolio trading practices, and (viii) information regarding the overall organization of MFS, including
46
Board Review of Investment Advisory Agreement – continued
information about MFS’ senior management and other personnel providing investment advisory, administrative and other services to the Fund and the other MFS Funds. The comparative performance, fee and expense information prepared and provided by Broadridge was not independently verified and the independent Trustees did not independently verify any information provided to them by MFS.
The Trustees’ conclusion as to the continuation of the investment advisory agreement was based on a comprehensive consideration of all information provided to the Trustees and not the result of any single factor. Some of the factors that figured particularly in the Trustees’ deliberations are described below, although individual Trustees may have evaluated the information presented differently from one another, giving different weights to various factors. It is also important to recognize that the fee arrangements for the Fund and other MFS Funds are the result of years of review and discussion between the independent Trustees and MFS, that certain aspects of such arrangements may receive greater scrutiny in some years than in others, and that the Trustees’ conclusions may be based, in part, on their consideration of these same arrangements during the course of the year and in prior years.
Based on information provided by Broadridge and MFS, the Trustees reviewed the Fund’s total return investment performance as well as the Broadridge performance universe over various time periods. The Trustees placed particular emphasis on the total return performance of the Fund’s Class A shares in comparison to the performance of funds in its Broadridge performance universe over the five-year period ended December 31, 2018, which the Trustees believed was a long enough period to reflect differing market conditions. The total return performance of the Fund’s Class A shares was in the 1st quintile relative to the other funds in the universe for this five-year period (the 1st quintile being the best performers and the 5th quintile being the worst performers). The total return performance of the Fund’s Class A shares was in the 1st quintile for theone-year period and the 2nd quintile for the three-year period ended December 31, 2018 relative to the Broadridge performance universe. Because of the passage of time, these performance results may differ from the performance results for more recent periods, including those shown elsewhere in this report.
In addition to considering the performance information provided in connection with the contract review meetings, the Trustees noted that, in light of the Fund’s substandard relative performance of the Fund at the time of their contract review meetings in 2018, they had met at each of their regular meetings since then with MFS’ senior investment management personnel to discuss the Fund’s performance and MFS’ efforts to improve the Fund’s performance. The Trustees further noted that the Fund’s three-year performance as compared to its Broadridge performance universe improved for the period ended December 31, 2018, as compared to the prior year. Taking this information into account, the Trustees concluded, within the context of their overall conclusions regarding the investment advisory agreement, that they were satisfied with MFS’ responses and efforts relating to investment performance.
In assessing the reasonableness of the Fund’s advisory fee, the Trustees considered, among other information, the Fund’s advisory fee and the total expense ratio of the Fund’s Class A shares as a percentage of average daily net assets and the advisory fee and total expense ratios of the Broadridge expense group based on information
47
Board Review of Investment Advisory Agreement – continued
provided by Broadridge. The Trustees considered that MFS currently observes an expense limitation for the Fund, which may not be changed without the Trustees’ approval. The Trustees also considered that, according to the data provided by Broadridge (which takes into account any fee reductions or expense limitations that were in effect during the Fund’s last fiscal year), the Fund’s effective advisory fee rate and total expense ratio were each lower than the Broadridge expense group median.
The Trustees also considered the advisory fees charged by MFS to any institutional separate accounts advised by MFS (“separate accounts”) and unaffiliated investment companies for which MFS serves as subadviser (“subadvised funds”) that have comparable investment strategies to the Fund, if any. In comparing these fees, the Trustees considered information provided by MFS as to the generally broader scope of services provided by MFS to the Fund, as well as the more extensive regulatory burdens imposed on MFS in managing the Fund, in comparison to separate accounts and subadvised funds. The Trustees also considered the higher demands placed on MFS’ investment personnel and trading infrastructure as a result of the daily cashin-flows andout-flows of the Fund in comparison to separate accounts.
The Trustees also considered whether the Fund may benefit from any economies of scale in the management of the Fund in the event of growth in assets of the Fund and/or growth in assets of the MFS Funds as a whole. They noted that the Fund’s advisory fee rate schedule is subject to contractual breakpoints that reduce the Fund’s advisory fee rate on average daily net assets over $1 billion and $2.5 billion. The Trustees also noted that MFS has agreed in writing to waive a portion of the management fees of certain MFS Funds, including the Fund, if the total combined assets of certain funds within the MFS Funds’ complex increase above agreed upon thresholds (the “group fee waiver”), enabling the Fund’s shareholders to share in the benefits from any economies of scale at the complex level. The group fee waiver is reviewed and renewed annually between the Board and MFS. The Trustees concluded that the breakpoints and the group fee waiver were sufficient to allow the Fund to benefit from economies of scale as its assets and overall complex assets grow.
The Trustees also considered information prepared by MFS relating to MFS’ costs and profits with respect to the Fund, the MFS Funds considered as a group, and other investment companies and accounts advised by MFS, as well as MFS’ methodologies used to determine and allocate its costs to the MFS Funds, the Fund and other accounts and products for purposes of estimating profitability.
After reviewing these and other factors described herein, the Trustees concluded, within the context of their overall conclusions regarding the investment advisory agreement, that the advisory fees charged to the Fund represent reasonable compensation in light of the services being provided by MFS to the Fund.
In addition, the Trustees considered MFS’ resources and related efforts to continue to retain, attract and motivate capable personnel to serve the Fund. The Trustees also considered current and developing conditions in the financial services industry, including the presence of large and well-capitalized companies which are spending, and appear to be prepared to continue to spend, substantial sums to engage personnel and to provide services to competing investment companies. In this regard, the Trustees also considered the financial resources of MFS and its ultimate parent, Sun Life
48
Board Review of Investment Advisory Agreement – continued
Financial Inc. The Trustees also considered the advantages and possible disadvantages to the Fund of having an adviser that also serves other investment companies as well as other accounts.
The Trustees also considered the nature, quality, cost, and extent of administrative, transfer agency, and distribution services provided to the Fund by MFS and its affiliates under agreements and plans other than the investment advisory agreement, including any12b-1 fees the Fund pays to MFS Fund Distributors, Inc., an affiliate of MFS. The Trustees also considered the nature, extent and quality of certain other services MFS performs or arranges for on the Fund’s behalf, which may include securities lending programs, directed expense payment programs, class action recovery programs, and MFS’ interaction with third-party service providers, principally custodians andsub-custodians. The Trustees concluded that the variousnon-advisory services provided by MFS and its affiliates on behalf of the Fund were satisfactory.
The Trustees consideredso-called“fall-out benefits” to MFS such as reputational value derived from serving as investment manager to the MFS Funds. The Trustees also considered that, effective January 3, 2018, MFS had discontinued its historic practice of obtaining investment research from portfolio brokerage commissions paid by certain MFS Funds and would thereafter directly pay for or voluntarily reimburse a Fund, if applicable, for the costs of external research acquired through the use of the Fund’s portfolio brokerage commissions.
Based on their evaluation of factors that they deemed to be material, including those factors described above, the Board of Trustees, including the independent Trustees, concluded that the Fund’s investment advisory agreement with MFS should be continued for an additionalone-year period, commencing August 1, 2019.
49
PROXY VOTING POLICIES AND INFORMATION
MFS votes proxies on behalf of the fund pursuant to proxy voting policies and procedures that are available without charge, upon request, by calling1-800-225-2606, by visitingmfs.com/proxyvoting,or by visiting the SEC’s Web site athttp://www.sec.gov.
Information regarding how the fund voted proxies relating to portfolio securities during the most recent twelve-month period ended June 30 is available by August 31 of each year without charge by visitingmfs.com/proxyvoting,or by visiting the SEC’s Web site athttp://www.sec.gov.
QUARTERLY PORTFOLIO DISCLOSURE
The fund files a complete schedule of portfolio holdings with the SEC for the first and third quarters of each fiscal year on Form N-Q or as an exhibit to its reports onForm N-PORT (for first and third fiscal quarters ending March 31, 2019 or after). The fund’s Form N-Q or Form N-PORT reports are available on the SEC’s website athttp://www.sec.gov.A shareholder can obtain the portfolio holdings report for the first and third quarters of the fund’s fiscal year atmfs.com/openendfunds by choosing the fund’s name and then selecting the “Resources” tab and clicking on “Prospectus and Reports”.
FURTHER INFORMATION
From time to time, MFS may post important information about the fund or the MFS funds on the MFS web site (mfs.com). This information is available athttps://www.mfs.com/en-us/what-we-do/announcements.htmlor atmfs.com/openendfundsby choosing the fund’s name.
INFORMATION ABOUT FUND CONTRACTS AND LEGAL CLAIMS
The fund has entered into contractual arrangements with an investment adviser, administrator, distributor, shareholder servicing agent, 529 program manager (if applicable), and custodian who each provide services to the fund. Unless expressly stated otherwise, shareholders are not parties to, or intended beneficiaries of these contractual arrangements, and these contractual arrangements are not intended to create any shareholder right to enforce them against the service providers or to seek any remedy under them against the service providers, either directly or on behalf of the fund.
Under the Trust’s By-Laws and Declaration of Trust, any claims asserted against or on behalf of the MFS Funds, including claims against Trustees and Officers, must be brought in state and federal courts located within the Commonwealth of Massachusetts.
FEDERAL TAX INFORMATION (unaudited)
The fund will notify shareholders of amounts for use in preparing 2019 income tax forms in January 2020. The following information is provided pursuant to provisions of the Internal Revenue Code.
The fund designates the maximum amount allowable as qualified dividend income eligible to be taxed at the same rate as long-term capital gain.
The fund designates $6,693,000 as capital gain dividends paid during the fiscal year.
For corporate shareholders, 38.49% of the ordinary income dividends paid during the fiscal year qualify for the corporate dividends received deduction.
Income derived from foreign sources was $3,961,471. The fund intends to pass through foreign tax credits of $354,580 for the fiscal year.
The fund designates the maximum amount allowable as Section 199A dividends as defined in Proposed Treasury Regulation §1.199A-3(d).
50
rev. 3/16
| | | | |
| | | |
FACTS | | WHAT DOES MFS DO WITH YOUR PERSONAL INFORMATION? | |  |
| | |
| Why? | | Financial companies choose how they share your personal information. Federal law gives consumers the right to limit some but not all sharing. Federal law also requires us to tell you how we collect, share, and protect your personal information. Please read this notice carefully to understand what we do. |
| | |
| What? | | The types of personal information we collect and share depend on the product or service you have with us. This information can include: • Social Security number and account balances • Account transactions and transaction history • Checking account information and wire transfer instructions When you areno longer our customer, we continue to share your information as described in this notice. |
| | |
| How? | | All financial companies need to share customers’ personal information to run their everyday business. In the section below, we list the reasons financial companies can share their customers’ personal information; the reasons MFS chooses to share; and whether you can limit this sharing. |
| | | | |
Reasons we can share your
personal information | | Does MFS
share? | | Can you limit
this sharing? |
For our everyday business purposes – such as to process your transactions, maintain your account(s), respond to court orders and legal investigations, or report to credit bureaus | | Yes | | No |
For our marketing purposes – to offer our products and services to you | | No | | We don’t share |
For joint marketing with other financial companies | | No | | We don’t share |
For our affiliates’ everyday business purposes – information about your transactions and experiences | | No | | We don’t share |
For our affiliates’ everyday business purposes – information about your creditworthiness | | No | | We don’t share |
| For nonaffiliates to market to you | | No | | We don’t share |
| | |
| | |
| Questions? | | Call800-225-2606 or go tomfs.com. |
51
| | |
| Who we are |
| Who is providing this notice? | | MFS Funds, MFS Investment Management, MFS Institutional Advisors, Inc., and MFS Heritage Trust Company. |
| | |
| What we do |
| How does MFS protect my personal information? | | To protect your personal information from unauthorized access and use, we use security measures that comply with federal law. These measures include procedural, electronic, and physical safeguards for the protection of the personal information we collect about you. |
| How does MFS collect my personal information? | | We collect your personal information, for example, when you • open an account or provide account information • direct us to buy securities or direct us to sell your securities • make a wire transfer We also collect your personal information from others, such as credit bureaus, affiliates, or other companies. |
| Why can’t I limit all sharing? | | Federal law gives you the right to limit only • sharing for affiliates’ everyday business purposes – information about your creditworthiness • affiliates from using your information to market to you • sharing for nonaffiliates to market to you State laws and individual companies may give you additional rights to limit sharing. |
| | |
| Definitions |
| Affiliates | | Companies related by common ownership or control. They can be financial and nonfinancial companies. • MFS does not share personal information with affiliates, except for everyday business purposes as described on page one of this notice. |
| Nonaffiliates | | Companies not related by common ownership or control. They can be financial and nonfinancial companies. • MFS does not share with nonaffiliates so they can market to you. |
| Joint marketing | | A formal agreement between nonaffiliated financial companies that together market financial products or services to you. • MFS doesn’t jointly market. |
| | |
| Other important information |
| If you own an MFS product or receive an MFS service in the name of a third party such as a bank or broker-dealer, their privacy policy may apply to you instead of ours. |
52
Save paper with eDelivery.

| MFS® will send you prospectuses, |
reports, and proxies directly viae-mail so you will get information faster with less mailbox clutter.
To sign up:
1. Go to mfs.com.
2. Log in via MFS® Access.
3. Select eDelivery.
If you own your MFS fund shares through a financial institution or a retirement plan, MFS® TALK, MFS® Access, or eDelivery may not be available to you.
CONTACT
WEB SITE
mfs.com
MFS TALK
1-800-637-8255
24 hours a day
ACCOUNT SERVICE AND LITERATURE
Shareholders
1-800-225-2606
Financial advisors
1-800-343-2829
Retirement plan services
1-800-637-1255
MAILING ADDRESS
MFS Service Center, Inc.
P.O. Box 219341
Kansas City, MO 64121-9341
OVERNIGHT MAIL
MFS Service Center, Inc.
Suite 219341
430 W 7th Street
Kansas City, MO 64105-1407
Annual Report
August 31, 2019

MFS® Low Volatility Equity Fund

Beginning on January 1, 2021, as permitted by regulations adopted by the U.S. Securities and Exchange Commission, paper copies of the fund’s annual and semiannual shareholder reports will no longer be sent by mail, unless you specifically request paper copies of the reports. Instead, the complete reports will be made available on the fund’s Web site (funds.mfs.com), and you will be notified by mail each time a report is posted and provided with a Web site link to access the report.
If you are already signed up to receive shareholder reports by email, you will not be affected by this change and you need not take any action. You may sign up to receive shareholder reports and other communications from the fund by email by contacting your financial intermediary (such as a broker-dealer or bank) or, if you hold your shares directly with the fund, by calling 1-800-225-2606 or by logging on to MFS Access at mfs.com.
Beginning on January 1, 2019, you may elect to receive all future reports in paper free of charge. Contact your financial intermediary to request that you continue to receive paper copies of your shareholder reports. If you invest directly with the fund, you can call 1-800-225-2606 or send an email request to orderliterature@mfs.com to let the fund know that you wish to continue receiving paper copies of your shareholder reports. Your election to receive reports in paper will apply to all funds held in your account if you invest through your financial intermediary or all funds held with the MFS fund complex if you invest directly.
LVU-ANN
MFS® Low Volatility Equity Fund
CONTENTS
The report is prepared for the general information of shareholders.
It is authorized for distribution to prospective investors only when preceded or accompanied by a current prospectus.
NOT FDIC INSURED• MAY LOSE VALUE• NO BANK GUARANTEE

LETTER FROM THE EXECUTIVE CHAIRMAN
Dear Shareholders:
Slowing global growth, low inflation, and increasing trade friction between the United States and China have been hallmarks of the past 12 months. After experiencing an
uptick in market volatility in late 2018, markets steadied during the first half of 2019, thanks in large measure to the adoption of a dovish policy stance on the part of global central banks, focused on supporting economic growth. The U.S. and China have raised tariffs on each other, heightening tensions and uncertainty. Despite repeated declarations by British Prime Minister Boris Johnson that the United Kingdom will leave the European Union on October 31, 2019, with or without a deal, apprehension over the possibility of a no-deal Brexit has eased somewhat, with Parliament having taken steps to block such an outcome.
Markets expect that the longest economic expansion in U.S. history will continue for the time being, albeit at a slower pace. In an effort to prolong the expansion, the U.S. Federal Reserve lowered interest rates for the first time in more than a decade in July and again in September. Similarly, the European Central Bank loosened policy in September. While markets have grown more risk averse, the accommodative monetary environment has helped push global interest rates toward record-low levels and has been somewhat supportive of risk assets despite the unsettled economic and geopolitical backdrop.
Since launching the first U.S. open-end mutual fund in 1924, MFS® has been committed to a single purpose: to create value by allocating capital responsibly for clients. Through our powerful global investment platform, we combine collective expertise, thoughtful risk management, and long-term discipline to uncover what we believe are the best investment opportunities in the market.
Respectfully,

Robert J. Manning
Executive Chairman
MFS Investment Management
October 17, 2019
The opinions expressed in this letter are subject to change and may not be relied upon for investment advice. No forecasts can be guaranteed.
1
PORTFOLIO COMPOSITION
Portfolio structure

| | | | |
| Top ten holdings | |
| Waste Connections, Inc. | | | 3.0% | |
| PepsiCo, Inc. | | | 2.8% | |
| Cisco Systems, Inc. | | | 2.7% | |
| Eli Lilly & Co. | | | 2.6% | |
| Amdocs Ltd. | | | 2.4% | |
| Starbucks Corp. | | | 2.3% | |
| Alphabet, Inc., “A” | | | 2.1% | |
| Johnson & Johnson | | | 2.1% | |
| Procter & Gamble Co. | | | 2.1% | |
| STORE Capital Corp., REIT | | | 1.9% | |
| | | | |
| Equity sectors (k) | | | | |
| Financial Services | | | 23.3% | |
| Technology | | | 16.3% | |
| Health Care | | | 14.2% | |
| Consumer Staples | | | 12.0% | |
| Utilities | | | 8.1% | |
| Industrial Goods & Services | | | 7.8% | |
| Leisure | | | 3.9% | |
| Retailing | | | 2.7% | |
| Special Products & Services | | | 2.5% | |
| Energy | | | 1.6% | |
| Basic Materials | | | 1.3% | |
| Communications | | | 0.8% | |
| Autos & Housing | | | 0.4% | |
| (k) | The sectors set forth above and the associated portfolio composition are based on MFS’ own custom sector classification methodology. |
Cash & Cash Equivalents includes any cash, investments in money market funds, short-term securities, and other assets less liabilities. Please see the Statement of Assets and Liabilities for additional information related to the fund’s cash position and other assets and liabilities.
Percentages are based on net assets as of August 31, 2019.
The portfolio is actively managed and current holdings may be different.
2
MANAGEMENT REVIEW
Summary of Results
For the twelve months ended August 31, 2019, Class A shares of the MFS Low Volatility Equity Fund (fund) provided a total return of 13.23%, at net asset value. This compares with a return of 2.92% for the fund’s benchmark, the Standard & Poor’s 500 Stock Index (S&P 500 Index).
Market Environment
Changes in market sentiment, driven largely by uncertainty over the outcome of trade negotiations between the United States and China, contributed to periodic bouts of volatility during the reporting period. The global economy decelerated, led by weakness in China and Europe.
The deteriorating global growth backdrop, along with declining inflationary pressures, prompted the US Federal Reserve to cut interest rates for the first time in over a decade at the end of July, which, combined with a more dovish posture beginning in early 2019, resulted in a sharp decline in long-term interest rates during the period’s second half, inverting portions of the US Treasury yield curve. Consequently, markets anticipate additional rate cuts in the coming quarters.
Globally, central banks have tilted more dovish as well, with China lowering reserve requirements, the Bank of Canada and Bank of England holding rates steady and the European Central Bank extending alow-interest-rate refinancing facility for eurozone banks to encourage the continued flow of credit. The ECB also indicated that it would likely lower rates further and possibly resume asset purchases this fall.
Emerging markets experienced considerable volatility earlier in the period (through the end of 2018) as tighter global financial conditions exposed structural weakness in some countries. Those conditions improved in 2019 as the Fed became more dovish, but diminished hopes for a trade deal between the US and China weighed on sentiment. Idiosyncratic factors negatively impacted some emerging economies, such as Argentina and Turkey.
From a geopolitical perspective, uncertainty over Brexit remains high. British Prime Minister Boris Johnson has shown a willingness to leave the European Union on October 31, 2019, without a withdrawal agreement, although Parliament has taken steps to prevent the United Kingdom from leaving the EU without a deal. The combination of Brexit uncertainty and the deteriorating outlook for global trade has damaged business confidence and hampered investment.
Contributors to Performance
Stock selection in both thefinancialsandindustrialssectors contributed to performance relative to the S&P 500 Index. However, there were no individual stocks within either sector that were among the fund’s top relative contributors during the reporting period.
Stock selection in theconsumer discretionarysector also bolstered relative performance. Within this sector, an overweight position in coffee and tea company Starbucks supported relative results. The stock price of Starbucks appreciated as management reported solid financial results during the period, driven by a lower tax rate and strong revenues from global same-store sales.In addition, the fund’s position
3
Management Review – continued
in child care and early education provider Bright Horizons Family Solutions (b) and not owning shares of internet retailer Amazon.com aided relative results. The share price of Bright Horizons Family Solutions advanced as revenue continued to grow year over year across all segments. Operating margins also expanded, driven by the company’s Full Service andBack-Up Care segments.
An overweight position and stock selection in both theutilitiesand real estatesectors further benefited relative returns. Within theutilitiessector, an overweight position in power and natural gas distributor Xcel Energy helped relative returns. Within thereal estate sector, holding shares of real estate investment trusts Sun Communities (b) and STORE Capital (b) buoyed relative performance.
Stocks in other sectors that strengthened relative returns included the fund’s overweight positions in food, snack and beverage company PepsiCo and wholesale retailer Costco Wholesale. Additionally, holding shares of medical and surgical equipment manufacturer STERIS (b) and not owning shares of computer and personal electronics maker Apple further boosted relative performance.
Detractors from Performance
Stock selection and an underweight position in thecommunication servicessector detracted from relative results. Within this sector, the timing of the fund’s ownership in shares of social networking service provider Facebook (h) and not holding shares of diversified entertainment company Walt Disney hindered relative performance.
Elsewhere, an underweight position in strong-performing software giant Microsoft held back relative returns. The stock price of Microsoft advanced as the company posted solid earnings results, driven by strong revenue growth in both its Commercial and Azure cloud segments. In addition, the fund’soverweight positions in health care provider Humana, cruise ship operator Carnival Corporation (h), tobacco giant Altria Group, pharmaceutical giant Pfizer and global health service organization Cigna negatively impacted relative performance. The stock price of Humana depreciated during the period as the company reported a fall in net income due to investments in the business aimed to improve benefits to its existing members.Not holding shares of globalnon-alcoholic beverage giant Coca-Cola and the timing of the fund’s ownership in home improvement retailer Home Depot (h) further weakened relative results.
Respectfully,
Portfolio Manager(s)
Jim Fallon, Matt Krummell, Jonathan Sage, and Jed Stocks
| (b) | Security is not a benchmark constituent. |
| (h) | Security was not held in the portfolio at period end. |
The views expressed in this report are those of the portfolio manager(s) only through the end of the period of the report as stated on the cover and do not necessarily reflect the views of MFS or any other person in the MFS organization. These views are subject to change at any time based on market or other conditions, and MFS disclaims any responsibility to update such views. These views may not be relied upon as investment advice or an indication of trading intent on behalf of any MFS portfolio. References to specific securities are not recommendations of such securities, and may not be representative of any MFS portfolio’s current or future investments.
4
PERFORMANCE SUMMARYTHROUGH 8/31/19
The following chart illustrates a representative class of the fund’s historical performance in comparison to its benchmark(s). Performance results include the deduction of the maximum applicable sales charge and reflect the percentage change in net asset value, including reinvestment of dividends and capital gains distributions. The performance of other share classes will be greater than or less than that of the class depicted below. Benchmarks are unmanaged and may not be invested in directly. Benchmark returns do not reflect sales charges, commissions or expenses. (See Notes to Performance Summary.)
Performance data shown represents past performance and is no guarantee of future results. Investment return and principal value fluctuate so your shares, when sold, may be worth more or less than the original cost; current performance may be lower or higher than quoted. The performance shown does not reflect the deduction of taxes, if any, that a shareholder would pay on fund distributions or the redemption of fund shares.
Growth of a Hypothetical $10,000 Investment (t)

5
Performance Summary – continued
Total Returns through 8/31/19
Average annual without sales charge
| | | | | | | | | | | | | | |
| | | Share Class | | Class Inception Date | | | | 1-yr | | 5-yr | | Life (t) | | |
| | | A | | 12/05/13 | | | | 13.23% | | 11.02% | | 11.16% | | |
| | | B | | 12/05/13 | | | | 12.41% | | 10.18% | | 10.33% | | |
| | | C | | 12/05/13 | | | | 12.40% | | 10.19% | | 10.34% | | |
| | | I | | 12/05/13 | | | | 13.55% | | 11.28% | | 11.43% | | |
| | | R1 | | 12/05/13 | | | | 12.37% | | 10.18% | | 10.33% | | |
| | | R2 | | 12/05/13 | | | | 12.94% | | 10.75% | | 10.90% | | |
| | | R3 | | 12/05/13 | | | | 13.24% | | 11.02% | | 11.16% | | |
| | | R4 | | 12/05/13 | | | | 13.53% | | 11.28% | | 11.43% | | |
| | | R6 | | 12/05/13 | | | | 13.63% | | 11.38% | | 11.53% | | |
| | | | | |
| Comparative benchmark(s) | | | | | | | | | | |
| | | Standard & Poor’s 500 Stock Index (f) | | | | 2.92% | | 10.11% | | 11.17% | | |
| | | | | |
| Average annual with sales charge | | | | | | | | | | |
| | | A
With Initial Sales Charge (5.75%) | | | | 6.71% | | 9.71% | | 10.02% | | |
| | | B
With CDSC (Declining over six years from 4% to 0%) (v) | | | | 8.41% | | 9.91% | | 10.22% | | |
| | | C
With CDSC (1% for 12 months) (v) | | | | 11.40% | | 10.19% | | 10.34% | | |
CDSC – Contingent Deferred Sales Charge.
Class I, R1, R2, R3, R4, and R6 shares do not have a sales charge.
| (f) | Source: FactSet Research Systems Inc. |
| (t) | For the period from the class inception date through the stated period end. (See Notes to Performance Summary.) |
| (v) | Assuming redemption at the end of the applicable period. |
Benchmark Definition(s)
Standard & Poor’s 500 Stock Index – a market capitalization-weighted index of 500 widely held equity securities, designed to measure broad U.S. equity performance.
It is not possible to invest directly in an index.
Notes to Performance Summary
Average annual total return represents the average annual change in value for each share class for the periods presented. Life returns are presented where the share class has less than 10 years of performance history and represent the average annual total return from the class inception date to the stated period end date.
Performance results reflect any applicable expense subsidies and waivers in effect during the periods shown. Without such subsidies and waivers the fund’s performance results would be less favorable. Please see the prospectus and financial statements for complete details.
6
Performance Summary – continued
Performance results do not include adjustments made for financial reporting purposes in accordance with U.S. generally accepted accounting principles and may differ from amounts reported in the financial highlights.
From time to time the fund may receive proceeds from litigation settlements, without which performance would be lower.
7
EXPENSE TABLE
Fund expenses borne by the shareholders during the period, March 1, 2019 through August 31, 2019
As a shareholder of the fund, you incur two types of costs: (1) transaction costs, including sales charges (loads) on certain purchase or redemption payments, and (2) ongoing costs, including management fees; distribution and service(12b-1) fees; and other fund expenses. This example is intended to help you understand your ongoing costs (in dollars) of investing in the fund and to compare these costs with the ongoing costs of investing in other mutual funds.
The example is based on an investment of $1,000 invested at the beginning of the period and held for the entire period March 1, 2019 through August 31, 2019.
Actual Expenses
The first line for each share class in the following table provides information about actual account values and actual expenses. You may use the information in this line, together with the amount you invested, to estimate the expenses that you paid over the period. Simply divide your account value by $1,000 (for example, an $8,600 account value divided by $1,000 = 8.6), then multiply the result by the number in the first line under the heading entitled “Expenses Paid During Period” to estimate the expenses you paid on your account during this period.
Hypothetical Example for Comparison Purposes
The second line for each share class in the following table provides information about hypothetical account values and hypothetical expenses based on the fund’s actual expense ratio and an assumed rate of return of 5% per year before expenses, which is not the fund’s actual return. The hypothetical account values and expenses may not be used to estimate the actual ending account balance or expenses you paid for the period. You may use this information to compare the ongoing costs of investing in the fund and other funds. To do so, compare this 5% hypothetical example with the 5% hypothetical examples that appear in the shareholder reports of the other funds.
Please note that the expenses shown in the table are meant to highlight your ongoing costs only and do not reflect any transactional costs, such as sales charges (loads). Therefore, the second line for each share class in the table is useful in comparing ongoing costs only, and will not help you determine the relative total costs of owning different funds. In addition, if these transactional costs were included, your costs would have been higher.
8
Expense Table – continued
| | | | | | | | | | | | | | | | | | |
Share
Class | | | | Annualized
Expense Ratio | | | Beginning
Account Value
3/01/19 | | | Ending Account Value
8/31/19 | | | Expenses Paid During Period (p) 3/01/19-8/31/19 | |
| A | | Actual | | | 0.89% | | | | $1,000.00 | | | | $1,104.26 | | | | $4.72 | |
| | Hypothetical (h) | | | 0.89% | | | | $1,000.00 | | | | $1,020.72 | | | | $4.53 | |
| B | | Actual | | | 1.64% | | | | $1,000.00 | | | | $1,099.92 | | | | $8.68 | |
| | Hypothetical (h) | | | 1.64% | | | | $1,000.00 | | | | $1,016.94 | | | | $8.34 | |
| C | | Actual | | | 1.64% | | | | $1,000.00 | | | | $1,100.41 | | | | $8.68 | |
| | Hypothetical (h) | | | 1.64% | | | | $1,000.00 | | | | $1,016.94 | | | | $8.34 | |
| I | | Actual | | | 0.64% | | | | $1,000.00 | | | | $1,106.02 | | | | $3.40 | |
| | Hypothetical (h) | | | 0.64% | | | | $1,000.00 | | | | $1,021.98 | | | | $3.26 | |
| R1 | | Actual | | | 1.64% | | | | $1,000.00 | | | | $1,100.47 | | | | $8.68 | |
| | Hypothetical (h) | | | 1.64% | | | | $1,000.00 | | | | $1,016.94 | | | | $8.34 | |
| R2 | | Actual | | | 1.14% | | | | $1,000.00 | | | | $1,103.16 | | | | $6.04 | |
| | Hypothetical (h) | | | 1.14% | | | | $1,000.00 | | | | $1,019.46 | | | | $5.80 | |
| R3 | | Actual | | | 0.89% | | | | $1,000.00 | | | | $1,104.53 | | | | $4.72 | |
| | Hypothetical (h) | | | 0.89% | | | | $1,000.00 | | | | $1,020.72 | | | | $4.53 | |
| R4 | | Actual | | | 0.64% | | | | $1,000.00 | | | | $1,105.84 | | | | $3.40 | |
| | Hypothetical (h) | | | 0.64% | | | | $1,000.00 | | | | $1,021.98 | | | | $3.26 | |
| R6 | | Actual | | | 0.57% | | | | $1,000.00 | | | | $1,106.22 | | | | $3.03 | |
| | Hypothetical (h) | | | 0.57% | | | | $1,000.00 | | | | $1,022.33 | | | | $2.91 | |
| (h) | 5% class return per year before expenses. |
| (p) | “Expenses Paid During Period” are equal to each class’s annualized expense ratio, as shown above, multiplied by the average account value over the period, multiplied by 184/365 (to reflect theone-half year period). Expenses paid do not include any applicable sales charges (loads). If these transaction costs had been included, your costs would have been higher. |
9
PORTFOLIO OF INVESTMENTS
8/31/19
The Portfolio of Investments is a complete list of all securities owned by your fund. It is categorized by broad-based asset classes.
| | | | | | | | |
| Common Stocks - 94.9% | | | | | | | | |
| | |
| Issuer | | Shares/Par | | | Value ($) | |
| Aerospace - 4.8% | | | | | | | | |
| CACI International, Inc., “A” (a) | | | 12,841 | | | $ | 2,854,426 | |
| Honeywell International, Inc. | | | 31,992 | | | | 5,266,523 | |
| Lockheed Martin Corp. | | | 10,772 | | | | 4,137,633 | |
| Northrop Grumman Corp. | | | 11,611 | | | | 4,271,339 | |
| United Technologies Corp. | | | 16,167 | | | | 2,105,590 | |
| | | | | | | | |
| | | | | | | $ | 18,635,511 | |
| Alcoholic Beverages - 1.3% | | | | | | | | |
| Constellation Brands, Inc., “A” | | | 24,528 | | | $ | 5,012,297 | |
| | |
| Brokerage & Asset Managers - 1.4% | | | | | | | | |
| CME Group, Inc. | | | 24,752 | | | $ | 5,378,362 | |
| | |
| Business Services - 5.0% | | | | | | | | |
| Amdocs Ltd. | | | 140,933 | | | $ | 9,124,002 | |
| CoStar Group, Inc. (a) | | | 4,227 | | | | 2,599,056 | |
| FleetCor Technologies, Inc. (a) | | | 6,838 | | | | 2,040,459 | |
| Global Payments, Inc. | | | 10,333 | | | | 1,715,071 | |
| Total System Services, Inc. | | | 15,052 | | | | 2,020,280 | |
| Verisk Analytics, Inc., “A” | | | 12,180 | | | | 1,967,557 | |
| | | | | | | | |
| | | | | | | $ | 19,466,425 | |
| Cable TV - 0.7% | | | | | | | | |
| Comcast Corp., “A” | | | 56,369 | | | $ | 2,494,892 | |
| | |
| Chemicals - 0.4% | | | | | | | | |
| Eastman Chemical Co. | | | 23,871 | | | $ | 1,560,447 | |
| | |
| Computer Software - 3.0% | | | | | | | | |
| Adobe Systems, Inc. (a) | | | 13,614 | | | $ | 3,873,319 | |
| Microsoft Corp. | | | 41,741 | | | | 5,754,414 | |
| Oracle Corp. | | | 37,158 | | | | 1,934,446 | |
| | | | | | | | |
| | | | | | | $ | 11,562,179 | |
| Construction - 1.9% | | | | | | | | |
| AvalonBay Communities, Inc., REIT | | | 22,161 | | | $ | 4,710,542 | |
| Mid-America Apartment Communities, Inc., REIT | | | 22,287 | | | | 2,823,317 | |
| | | | | | | | |
| | | | | | | $ | 7,533,859 | |
10
Portfolio of Investments – continued
| | | | | | | | |
| | |
| Issuer | | Shares/Par | | | Value ($) | |
| Common Stocks - continued | | | | | | | | |
| Consumer Products - 2.1% | | | | | | | | |
| Procter & Gamble Co. | | | 66,142 | | | $ | 7,952,253 | |
| | |
| Consumer Services - 2.3% | | | | | | | | |
| Booking Holdings, Inc. (a) | | | 1,444 | | | $ | 2,839,496 | |
| Bright Horizons Family Solutions, Inc. (a) | | | 36,502 | | | | 6,024,655 | |
| | | | | | | | |
| | | | | | | $ | 8,864,151 | |
| Electrical Equipment - 0.9% | | | | | | | | |
| Johnson Controls International PLC | | | 41,647 | | | $ | 1,777,910 | |
| TE Connectivity Ltd. | | | 20,095 | | | | 1,833,066 | |
| | | | | | | | |
| | | | | | | $ | 3,610,976 | |
| Electronics - 1.3% | | | | | | | | |
| Texas Instruments, Inc. | | | 41,797 | | | $ | 5,172,379 | |
| | |
| Energy - Independent - 0.5% | | | | | | | | |
| Phillips 66 | | | 20,895 | | | $ | 2,060,874 | |
| | |
| Energy - Integrated - 1.1% | | | | | | | | |
| Exxon Mobil Corp. | | | 59,181 | | | $ | 4,052,715 | |
| | |
| Food & Beverages - 5.5% | | | | | | | | |
| General Mills, Inc. | | | 89,465 | | | $ | 4,813,217 | |
| Ingredion, Inc. | | | 20,150 | | | | 1,556,991 | |
| J.M. Smucker Co. | | | 14,631 | | | | 1,538,596 | |
| Mondelez International, Inc. | | | 51,060 | | | | 2,819,533 | |
| PepsiCo, Inc. | | | 78,093 | | | | 10,677,656 | |
| | | | | | | | |
| | | | | | | $ | 21,405,993 | |
| Health Maintenance Organizations - 1.8% | | | | | | | | |
| Cigna Corp. | | | 22,194 | | | $ | 3,417,210 | |
| Humana, Inc. | | | 13,095 | | | | 3,708,635 | |
| | | | | | | | |
| | | | | | | $ | 7,125,845 | |
| Insurance - 9.0% | | | | | | | | |
| Allstate Corp. | | | 20,361 | | | $ | 2,084,763 | |
| Aon PLC | | | 23,624 | | | | 4,603,136 | |
| Chubb Ltd. | | | 28,917 | | | | 4,519,149 | |
| Everest Re Group Ltd. | | | 26,485 | | | | 6,247,282 | |
| Hartford Financial Services Group, Inc. | | | 62,613 | | | | 3,649,086 | |
| Loews Corp. | | | 82,117 | | | | 3,947,364 | |
| MetLife, Inc. | | | 111,049 | | | | 4,919,471 | |
| Progressive Corp. | | | 30,324 | | | | 2,298,559 | |
| Prudential Financial, Inc. | | | 14,900 | | | | 1,193,341 | |
11
Portfolio of Investments – continued
| | | | | | | | |
| | |
| Issuer | | Shares/Par | | | Value ($) | |
| Common Stocks - continued | | | | | | | | |
| Insurance - continued | | | | | | | | |
| Travelers Cos., Inc. | | | 10,021 | | | $ | 1,472,686 | |
| | | | | | | | |
| | | | | | | $ | 34,934,837 | |
| Internet - 2.6% | | | | | | | | |
| Alphabet, Inc., “A” (a) | | | 6,800 | | | $ | 8,095,604 | |
| Alphabet, Inc., “C” (a) | | | 1,583 | | | | 1,880,762 | |
| | | | | | | | |
| | | | | | | $ | 9,976,366 | |
| Machinery & Tools - 2.8% | | | | | | | | |
| AGCO Corp. | | | 56,572 | | | $ | 3,910,257 | |
| Eaton Corp. PLC | | | 46,797 | | | | 3,777,454 | |
| Illinois Tool Works, Inc. | | | 10,150 | | | | 1,521,079 | |
| Roper Technologies, Inc. | | | 4,052 | | | | 1,486,111 | |
| | | | | | | | |
| | | | | | | $ | 10,694,901 | |
| Major Banks - 0.9% | | | | | | | | |
| PNC Financial Services Group, Inc. | | | 13,584 | | | $ | 1,751,385 | |
| Wells Fargo & Co. | | | 38,590 | | | | 1,797,136 | |
| | | | | | | | |
| | | | | | | $ | 3,548,521 | |
| Medical & Health Technology & Services - 0.5% | | | | | | | | |
| Quest Diagnostics, Inc. | | | 17,766 | | | $ | 1,818,705 | |
| | |
| Medical Equipment - 6.1% | | | | | | | | |
| Danaher Corp. | | | 45,438 | | | $ | 6,456,285 | |
| Medtronic PLC | | | 59,059 | | | | 6,371,876 | |
| STERIS PLC | | | 46,263 | | | | 7,143,007 | |
| Stryker Corp. | | | 11,350 | | | | 2,504,491 | |
| Varian Medical Systems, Inc. (a) | | | 10,664 | | | | 1,129,638 | |
| | | | | | | | |
| | | | | | | $ | 23,605,297 | |
| Network & Telecom - 2.4% | | | | | | | | |
| Cisco Systems, Inc. | | | 152,983 | | | $ | 7,161,135 | |
| Motorola Solutions, Inc. | | | 11,453 | | | | 2,071,962 | |
| | | | | | | | |
| | | | | | | $ | 9,233,097 | |
| Other Banks & Diversified Financials - 2.3% | | | | | | | | |
| Mastercard, Inc., “A” | | | 15,725 | | | $ | 4,424,543 | |
| U.S. Bancorp | | | 33,860 | | | | 1,784,084 | |
| Visa, Inc., “A” | | | 15,867 | | | | 2,869,071 | |
| | | | | | | | |
| | | | | | | $ | 9,077,698 | |
| Pharmaceuticals - 7.5% | | | | | | | | |
| Eli Lilly & Co. | | | 87,709 | | | $ | 9,908,486 | |
| Johnson & Johnson | | | 62,650 | | | | 8,041,754 | |
12
Portfolio of Investments – continued
| | | | | | | | |
| | |
| Issuer | | Shares/Par | | | Value ($) | |
| Common Stocks - continued | | | | | | | | |
| Pharmaceuticals - continued | | | | | | | | |
| Merck & Co., Inc. | | | 28,526 | | | $ | 2,466,643 | |
| Pfizer, Inc. | | | 177,567 | | | | 6,312,507 | |
| Zoetis, Inc. | | | 19,663 | | | | 2,485,796 | |
| | | | | | | | |
| | | | | | | $ | 29,215,186 | |
| Pollution Control - 3.0% | | | | | | | | |
| Waste Connections, Inc. | | | 125,160 | | | $ | 11,502,204 | |
| | |
| Real Estate - 6.0% | | | | | | | | |
| EPR Properties, REIT | | | 21,780 | | | $ | 1,704,285 | |
| Extra Space Storage, Inc., REIT | | | 16,634 | | | | 2,028,017 | |
| Public Storage, Inc., REIT | | | 23,691 | | | | 6,271,955 | |
| STAG Industrial, Inc., REIT | | | 49,682 | | | | 1,444,753 | |
| STORE Capital Corp., REIT | | | 190,763 | | | | 7,203,211 | |
| Sun Communities, Inc., REIT | | | 30,118 | | | | 4,451,441 | |
| | | | | | | | |
| | | | | | | $ | 23,103,662 | |
| Restaurants - 3.7% | | | | | | | | |
| McDonald’s Corp. | | | 16,642 | | | $ | 3,627,457 | |
| Starbucks Corp. | | | 90,402 | | | | 8,729,217 | |
| U.S. Foods Holding Corp. (a) | | | 49,094 | | | | 1,985,852 | |
| | | | | | | | |
| | | | | | | $ | 14,342,526 | |
| Specialty Chemicals - 1.6% | | | | | | | | |
| Ecolab, Inc. | | | 30,853 | | | $ | 6,365,282 | |
| | |
| Specialty Stores - 2.7% | | | | | | | | |
| Costco Wholesale Corp. | | | 35,408 | | | $ | 10,436,862 | |
| | |
| Telephone Services - 0.8% | | | | | | | | |
| Verizon Communications, Inc. | | | 55,364 | | | $ | 3,219,970 | |
| | |
| Tobacco - 1.0% | | | | | | | | |
| Altria Group, Inc. | | | 87,242 | | | $ | 3,815,965 | |
| | |
| Utilities - Electric Power - 8.0% | | | | | | | | |
| American Electric Power Co., Inc. | | | 25,608 | | | $ | 2,334,169 | |
| DTE Energy Co. | | | 32,621 | | | | 4,229,639 | |
| Duke Energy Corp. | | | 48,224 | | | | 4,472,294 | |
| Evergy, Inc. | | | 40,032 | | | | 2,602,080 | |
| Exelon Corp. | | | 39,112 | | | | 1,848,433 | |
| NextEra Energy, Inc. | | | 31,809 | | | | 6,968,716 | |
| WEC Energy Group, Inc. | | | 26,433 | | | | 2,531,488 | |
13
Portfolio of Investments – continued
| | | | | | | | |
| | |
| Issuer | | Shares/Par | | | Value ($) | |
| Common Stocks - continued | | | | | | | | |
| Utilities - Electric Power - continued | | | | | | | | |
| Xcel Energy, Inc. | | | 96,241 | | | $ | 6,180,597 | |
| | | | | | | | |
| | | | | | | $ | 31,167,416 | |
| Total Common Stocks (Identified Cost, $328,651,603) | | | | | | $ | 367,947,653 | |
| | |
| Investment Companies (h) - 0.7% | | | | | | | | |
| Money Market Funds - 0.7% | | | | | | | | |
MFS Institutional Money Market Portfolio, 2.17% (v)
(Identified Cost, $2,644,909) | | | 2,644,909 | | | $ | 2,645,173 | |
| | |
| Other Assets, Less Liabilities - 4.4% | | | | | | | 17,081,111 | |
| Net Assets - 100.0% | | | | | | $ | 387,673,937 | |
| (a) | Non-income producing security. |
| (h) | An affiliated issuer, which may be considered one in which the fund owns 5% or more of the outstanding voting securities, or a company which is under common control. At period end, the aggregate values of the fund’s investments in affiliated issuers and in unaffiliated issuers were $2,645,173 and $367,947,653, respectively. |
| (v) | Affiliated issuer that is available only to investment companies managed by MFS. The rate quoted for the MFS Institutional Money Market Portfolio is the annualizedseven-day yield of the fund at period end. |
The following abbreviations are used in this report and are defined:
| REIT | | Real Estate Investment Trust |
See Notes to Financial Statements
14
Financial Statements
STATEMENT OF ASSETS AND LIABILITIES
At 8/31/19
This statement represents your fund’s balance sheet, which details the assets and liabilities comprising the total value of the fund.
| | | | |
| Assets | | | | |
Investments in unaffiliated issuers, at value (identified cost, $328,651,603) | | | $367,947,653 | |
Investments in affiliated issuers, at value (identified cost, $2,644,909) | | | 2,645,173 | |
Cash | | | 87,100 | |
Receivables for | | | | |
Fund shares sold | | | 19,229,782 | |
Dividends | | | 667,673 | |
Receivable from investment adviser | | | 15,385 | |
Other assets | | | 158 | |
Total assets | | | $390,592,924 | |
| |
| Liabilities | | | | |
Payables for | | | | |
Investments purchased | | | $2,503,657 | |
Fund shares reacquired | | | 269,159 | |
Payable to affiliates | | | | |
Administrative services fee | | | 493 | |
Shareholder servicing costs | | | 58,677 | |
Distribution and service fees | | | 3,675 | |
Payable for independent Trustees’ compensation | | | 11 | |
Accrued expenses and other liabilities | | | 83,315 | |
Total liabilities | | | $2,918,987 | |
Net assets | | | $387,673,937 | |
| |
| Net assets consist of | | | | |
Paid-in capital | | | $347,989,161 | |
Total distributable earnings (loss) | | | 39,684,776 | |
Net assets | | | $387,673,937 | |
Shares of beneficial interest outstanding | | | 23,789,545 | |
15
Statement of Assets and Liabilities – continued
| | | | | | | | | | | | |
| | | |
| | | Net assets | | | Shares
outstanding | | | Net asset value
per share (a) | |
| Class A | | | $85,022,116 | | | | 5,221,004 | | | | $16.28 | |
| Class B | | | 2,557,509 | | | | 157,396 | | | | 16.25 | |
| Class C | | | 21,859,263 | | | | 1,349,625 | | | | 16.20 | |
| Class I | | | 246,245,460 | | | | 15,101,989 | | | | 16.31 | |
| Class R1 | | | 163,852 | | | | 10,059 | | | | 16.29 | |
| Class R2 | | | 367,891 | | | | 22,494 | | | | 16.36 | |
| Class R3 | | | 100,070 | | | | 6,124 | | | | 16.34 | |
| Class R4 | | | 75,091 | | | | 4,601 | | | | 16.32 | |
| Class R6 | | | 31,282,685 | | | | 1,916,253 | | | | 16.32 | |
| (a) | Maximum offering price per share was equal to the net asset value per share for all share classes, except for Class A, for which the maximum offering price per share was $17.27 [100 / 94.25 x $16.28]. On sales of $50,000 or more, the maximum offering price of Class A shares is reduced. A contingent deferred sales charge may be imposed on redemptions of Class A, Class B, and Class C shares. Redemption price per share was equal to the net asset value per share for Classes I, R1, R2, R3, R4, and R6. |
See Notes to Financial Statements
16
Financial Statements
STATEMENT OF OPERATIONS
Year ended 8/31/19
This statement describes how much your fund earned in investment income and accrued in expenses. It also describes any gains and/or losses generated by fund operations.
| | | | |
| Net investment income (loss) | | | | |
Income | | | | |
Dividends | | | $3,487,040 | |
Dividends from affiliated issuers | | | 43,202 | |
Other | | | 4,800 | |
Foreign taxes withheld | | | (6,492 | ) |
Total investment income | | | $3,528,550 | |
Expenses | | | | |
Management fee | | | $838,087 | |
Distribution and service fees | | | 337,609 | |
Shareholder servicing costs | | | 145,256 | |
Administrative services fee | | | 33,287 | |
Independent Trustees’ compensation | | | 4,336 | |
Custodian fee | | | 11,526 | |
Shareholder communications | | | 19,430 | |
Audit and tax fees | | | 51,194 | |
Legal fees | | | 1,366 | |
Registration fees | | | 179,370 | |
Miscellaneous | | | 29,504 | |
Total expenses | | | $1,650,965 | |
Reduction of expenses by investment adviser and distributor | | | (251,294 | ) |
Net expenses | | | $1,399,671 | |
Net investment income (loss) | | | $2,128,879 | |
| |
| Realized and unrealized gain (loss) | | | | |
Realized gain (loss) (identified cost basis) | | | | |
Unaffiliated issuers | | | $566,432 | |
Affiliated issuers | | | 1,235 | |
Foreign currency | | | (96 | ) |
Net realized gain (loss) | | | $567,571 | |
Change in unrealized appreciation or depreciation | | | | |
Unaffiliated issuers | | | $22,926,200 | |
Affiliated issuers | | | 194 | |
Net unrealized gain (loss) | | | $22,926,394 | |
Net realized and unrealized gain (loss) | | | $23,493,965 | |
Change in net assets from operations | | | $25,622,844 | |
See Notes to Financial Statements
17
Financial Statements
STATEMENTS OF CHANGES IN NET ASSETS
These statements describe the increases and/or decreases in net assets resulting from operations, any distributions, and any shareholder transactions.
| | | | | | | | |
| | | Year ended | |
| | | 8/31/19 | | | 8/31/18 | |
| Change in net assets | | | | | | |
| | |
| From operations | | | | | | | | |
Net investment income (loss) | | | $2,128,879 | | | | $1,091,038 | |
Net realized gain (loss) | | | 567,571 | | | | 4,031,706 | |
Net unrealized gain (loss) | | | 22,926,394 | | | | 5,142,582 | |
Change in net assets from operations | | | $25,622,844 | | | | $10,265,326 | |
Total distributions to shareholders (a) | | | $(4,818,533 | ) | | | $(2,244,387 | ) |
Change in net assets from fund share transactions | | | $269,731,498 | | | | $6,417,123 | |
Total change in net assets | | | $290,535,809 | | | | $14,438,062 | |
| | |
| Net assets | | | | | | | | |
At beginning of period | | | 97,138,128 | | | | 82,700,066 | |
At end of period (b) | | | $387,673,937 | | | | $97,138,128 | |
| (a) | Distributions from net investment income and from net realized gain are no longer required to be separately disclosed. For the year ended August 31, 2018, distributions from net investment income and from net realized gain were $1,093,232 and $1,151,155, respectively. |
| (b) | Parenthetical disclosure of undistributed net investment income is no longer required. For the year ended August 31, 2018, end of period net assets included undistributed net investment income of $177,561. |
See Notes to Financial Statements
18
Financial Statements
FINANCIAL HIGHLIGHTS
The financial highlights table is intended to help you understand the fund’s financial performance for the past 5 years. Certain information reflects financial results for a single fund share. The total returns in the table represent the rate that an investor would have earned (or lost) on an investment in the fund share class (assuming reinvestment of all distributions) held for the entire period.
| | | | | | | | | | | | | | | | | | | | |
| Class A | | Year ended | |
| | | | | |
| | | 8/31/19 | | | 8/31/18 | | | 8/31/17 | | | 8/31/16 | | | 8/31/15 | |
Net asset value, beginning of period | | | $15.05 | | | | $13.77 | | | | $12.56 | | | | $11.12 | | | | $10.82 | |
| | | |
| Income (loss) from investment operations | | | | | | | | | | | | | |
Net investment income (loss) (d) | | | $0.18 | | | | $0.18 | | | | $0.16 | | | | $0.15 | | | | $0.14 | |
Net realized and unrealized gain (loss) | | | 1.68 | | | | 1.47 | | | | 1.23 | | | | 1.49 | | | | 0.30 | (g) |
Total from investment operations | | | $1.86 | | | | $1.65 | | | | $1.39 | | | | $1.64 | | | | $0.44 | |
| | | |
| Less distributions declared to shareholders | | | | | | | | | | | | | |
From net investment income | | | $(0.17 | ) | | | $(0.18 | ) | | | $(0.15 | ) | | | $(0.11 | ) | | | $(0.13 | ) |
From net realized gain | | | (0.46 | ) | | | (0.19 | ) | | | (0.03 | ) | | | (0.09 | ) | | | (0.01 | ) |
Total distributions declared to shareholders | | | $(0.63 | ) | | | $(0.37 | ) | | | $(0.18 | ) | | | $(0.20 | ) | | | $(0.14 | ) |
Net asset value, end of period (x) | | | $16.28 | | | | $15.05 | | | | $13.77 | | | | $12.56 | | | | $11.12 | |
Total return (%) (r)(s)(t)(x) | | | 13.23 | | | | 12.14 | | | | 11.18 | | | | 14.87 | | | | 4.01 | |
| | | |
Ratios (%) (to average net assets)
and Supplemental data: | | | | | | | | | | | | | |
Expenses before expense reductions (f) | | | 1.05 | | | | 1.16 | | | | 1.33 | | | | 1.65 | | | | 2.72 | |
Expenses after expense reductions (f) | | | 0.89 | | | | 0.88 | | | | 1.16 | | | | 1.19 | | | | 1.18 | |
Net investment income (loss) | | | 1.22 | | | | 1.25 | | | | 1.19 | | | | 1.25 | | | | 1.22 | |
Portfolio turnover | | | 28 | | | | 30 | | | | 36 | | | | 38 | | | | 33 | |
Net assets at end of period (000 omitted) | | | $85,022 | | | | $41,177 | | | | $39,568 | | | | $29,508 | | | | $11,267 | |
See Notes to Financial Statements
19
Financial Highlights – continued
| | | | | | | | | | | | | | | | | | | | |
| Class B | | Year ended | |
| | | | | |
| | | 8/31/19 | | | 8/31/18 | | | 8/31/17 | | | 8/31/16 | | | 8/31/15 | |
Net asset value, beginning of period | | | $15.02 | | | | $13.74 | | | | $12.53 | | | | $11.10 | | | | $10.81 | |
| | | | |
| Income (loss) from investment operations | | | | | | | | | | | | | | | | | |
Net investment income (loss) (d) | | | $0.07 | | | | $0.07 | | | | $0.06 | | | | $0.06 | | | | $0.05 | |
Net realized and unrealized gain (loss) | | | 1.68 | | | | 1.47 | | | | 1.23 | | | | 1.48 | | | | 0.30 | (g) |
Total from investment operations | | | $1.75 | | | | $1.54 | | | | $1.29 | | | | $1.54 | | | | $0.35 | |
| | | | |
| Less distributions declared to shareholders | | | | | | | | | | | | | | | | | |
From net investment income | | | $(0.06 | ) | | | $(0.07 | ) | | | $(0.05 | ) | | | $(0.02 | ) | | | $(0.05 | ) |
From net realized gain | | | (0.46 | ) | | | (0.19 | ) | | | (0.03 | ) | | | (0.09 | ) | | | (0.01 | ) |
Total distributions declared to shareholders | | | $(0.52 | ) | | | $(0.26 | ) | | | $(0.08 | ) | | | $(0.11 | ) | | | $(0.06 | ) |
Net asset value, end of period (x) | | | $16.25 | | | | $15.02 | | | | $13.74 | | | | $12.53 | | | | $11.10 | |
Total return (%) (r)(s)(t)(x) | | | 12.41 | | | | 11.32 | | | | 10.36 | | | | 13.96 | | | | 3.20 | |
| | | | |
Ratios (%) (to average net assets)
and Supplemental data: | | | | | | | | | | | | | | | | | |
Expenses before expense reductions (f) | | | 1.81 | | | | 1.91 | | | | 2.08 | | | | 2.42 | | | | 3.79 | |
Expenses after expense reductions (f) | | | 1.64 | | | | 1.64 | | | | 1.92 | | | | 1.95 | | | | 1.95 | |
Net investment income (loss) | | | 0.48 | | | | 0.50 | | | | 0.43 | | | | 0.49 | | | | 0.43 | |
Portfolio turnover | | | 28 | | | | 30 | | | | 36 | | | | 38 | | | | 33 | |
Net assets at end of period (000 omitted) | | | $2,558 | | | | $2,211 | | | | $2,081 | | | | $1,885 | | | | $717 | |
| |
| Class C | | Year ended | |
| | | | | |
| | | 8/31/19 | | | 8/31/18 | | | 8/31/17 | | | 8/31/16 | | | 8/31/15 | |
Net asset value, beginning of period | | | $14.98 | | | | $13.70 | | | | $12.50 | | | | $11.09 | | | | $10.80 | |
| | | | |
| Income (loss) from investment operations | | | | | | | | | | | | | | | | | |
Net investment income (loss) (d) | | | $0.07 | | | | $0.07 | | | | $0.06 | | | | $0.06 | | | | $0.05 | |
Net realized and unrealized gain (loss) | | | 1.67 | | | | 1.48 | | | | 1.23 | | | | 1.48 | | | | 0.30 | (g) |
Total from investment operations | | | $1.74 | | | | $1.55 | | | | $1.29 | | | | $1.54 | | | | $0.35 | |
| | | | |
| Less distributions declared to shareholders | | | | | | | | | | | | | | | | | |
From net investment income | | | $(0.06 | ) | | | $(0.08 | ) | | | $(0.06 | ) | | | $(0.04 | ) | | | $(0.05 | ) |
From net realized gain | | | (0.46 | ) | | | (0.19 | ) | | | (0.03 | ) | | | (0.09 | ) | | | (0.01 | ) |
Total distributions declared to shareholders | | | $(0.52 | ) | | | $(0.27 | ) | | | $(0.09 | ) | | | $(0.13 | ) | | | $(0.06 | ) |
Net asset value, end of period (x) | | | $16.20 | | | | $14.98 | | | | $13.70 | | | | $12.50 | | | | $11.09 | |
Total return (%) (r)(s)(t)(x) | | | 12.40 | | | | 11.36 | | | | 10.36 | | | | 13.91 | | | | 3.23 | |
| | | | |
Ratios (%) (to average net assets)
and Supplemental data: | | | | | | | | | | | | | | | | | |
Expenses before expense reductions (f) | | | 1.81 | | | | 1.91 | | | | 2.08 | | | | 2.31 | | | | 3.73 | |
Expenses after expense reductions (f) | | | 1.64 | | | | 1.64 | | | | 1.92 | | | | 1.95 | | | | 1.95 | |
Net investment income (loss) | | | 0.47 | | | | 0.50 | | | | 0.43 | | | | 0.48 | | | | 0.43 | |
Portfolio turnover | | | 28 | | | | 30 | | | | 36 | | | | 38 | | | | 33 | |
Net assets at end of period (000 omitted) | | | $21,859 | | | | $13,942 | | | | $12,422 | | | | $9,977 | | | | $1,564 | |
See Notes to Financial Statements
20
Financial Highlights – continued
| | | | | | | | | | | | | | | | | | | | |
| Class I | | Year ended | |
| | | | | |
| | | 8/31/19 | | | 8/31/18 | | | 8/31/17 | | | 8/31/16 | | | 8/31/15 | |
Net asset value, beginning of period | | | $15.07 | | | | $13.78 | | | | $12.57 | | | | $11.14 | | | | $10.84 | |
| | | | |
| Income (loss) from investment operations | | | | | | | | | | | | | | | | | |
Net investment income (loss) (d) | | | $0.23 | | | | $0.21 | | | | $0.19 | | | | $0.18 | | | | $0.16 | |
Net realized and unrealized gain (loss) | | | 1.68 | | | | 1.49 | | | | 1.23 | | | | 1.48 | | | | 0.30 | (g) |
Total from investment operations | | | $1.91 | | | | $1.70 | | | | $1.42 | | | | $1.66 | | | | $0.46 | |
| | | | |
| Less distributions declared to shareholders | | | | | | | | | | | | | | | | | |
From net investment income | | | $(0.21 | ) | | | $(0.22 | ) | | | $(0.18 | ) | | | $(0.14 | ) | | | $(0.15 | ) |
From net realized gain | | | (0.46 | ) | | | (0.19 | ) | | | (0.03 | ) | | | (0.09 | ) | | | (0.01 | ) |
Total distributions declared to shareholders | | | $(0.67 | ) | | | $(0.41 | ) | | | $(0.21 | ) | | | $(0.23 | ) | | | $(0.16 | ) |
Net asset value, end of period (x) | | | $16.31 | | | | $15.07 | | | | $13.78 | | | | $12.57 | | | | $11.14 | |
Total return (%) (r)(s)(t)(x) | | | 13.55 | | | | 12.49 | | | | 11.44 | | | | 15.05 | | | | 4.20 | |
| | | | |
Ratios (%) (to average net assets)
and Supplemental data: | | | | | | | | | | | | | | | | | |
Expenses before expense reductions (f) | | | 0.78 | | | | 0.91 | | | | 1.07 | | | | 1.20 | | | | 2.53 | |
Expenses after expense reductions (f) | | | 0.64 | | | | 0.64 | | | | 0.92 | | | | 0.95 | | | | 0.95 | |
Net investment income (loss) | | | 1.46 | | | | 1.50 | | | | 1.47 | | | | 1.51 | | | | 1.36 | |
Portfolio turnover | | | 28 | | | | 30 | | | | 36 | | | | 38 | | | | 33 | |
Net assets at end of period (000 omitted) | | | $246,245 | | | | $30,751 | | | | $21,814 | | | | $16,123 | | | | $964 | |
| |
| Class R1 | | Year ended | |
| | | | | |
| | | 8/31/19 | | | 8/31/18 | | | 8/31/17 | | | 8/31/16 | | | 8/31/15 | |
Net asset value, beginning of period | | | $15.06 | | | | $13.77 | | | | $12.57 | | | | $11.12 | | | | $10.82 | |
| | | | |
| Income (loss) from investment operations | | | | | | | | | | | | | | | | | |
Net investment income (loss) (d) | | | $0.07 | | | | $0.07 | | | | $0.05 | | | | $0.06 | | | | $0.04 | |
Net realized and unrealized gain (loss) | | | 1.68 | | | | 1.48 | | | | 1.24 | | | | 1.49 | | | | 0.31 | (g) |
Total from investment operations | | | $1.75 | | | | $1.55 | | | | $1.29 | | | | $1.55 | | | | $0.35 | |
| | | | |
| Less distributions declared to shareholders | | | | | | | | | | | | | | | | | |
From net investment income | | | $(0.06 | ) | | | $(0.07 | ) | | | $(0.06 | ) | | | $(0.01 | ) | | | $(0.04 | ) |
From net realized gain | | | (0.46 | ) | | | (0.19 | ) | | | (0.03 | ) | | | (0.09 | ) | | | (0.01 | ) |
Total distributions declared to shareholders | | | $(0.52 | ) | | | $(0.26 | ) | | | $(0.09 | ) | | | $(0.10 | ) | | | $(0.05 | ) |
Net asset value, end of period (x) | | | $16.29 | | | | $15.06 | | | | $13.77 | | | | $12.57 | | | | $11.12 | |
Total return (%) (r)(s)(t)(x) | | | 12.37 | | | | 11.36 | | | | 10.33 | | | | 13.96 | | | | 3.18 | |
| | | | |
Ratios (%) (to average net assets)
and Supplemental data: | | | | | | | | | | | | | | | | | |
Expenses before expense reductions (f) | | | 1.81 | | | | 1.91 | | | | 2.07 | | | | 2.56 | | | | 4.18 | |
Expenses after expense reductions (f) | | | 1.64 | | | | 1.64 | | | | 1.91 | | | | 1.95 | | | | 1.95 | |
Net investment income (loss) | | | 0.48 | | | | 0.49 | | | | 0.41 | | | | 0.48 | | | | 0.39 | |
Portfolio turnover | | | 28 | | | | 30 | | | | 36 | | | | 38 | | | | 33 | |
Net assets at end of period (000 omitted) | | | $164 | | | | $136 | | | | $108 | | | | $57 | | | | $112 | |
See Notes to Financial Statements
21
Financial Highlights – continued
| | | | | | | | | | | | | | | | | | | | |
| Class R2 | | Year ended | |
| | | | | |
| | | 8/31/19 | | | 8/31/18 | | | 8/31/17 | | | 8/31/16 | | | 8/31/15 | |
Net asset value, beginning of period | | | $15.12 | | | | $13.83 | | | | $12.61 | | | | $11.13 | | | | $10.83 | |
| | | | |
| Income (loss) from investment operations | | | | | | | | | | | | | | | | | |
Net investment income (loss) (d) | | | $0.15 | | | | $0.14 | | | | $0.12 | | | | $0.12 | | | | $0.10 | |
Net realized and unrealized gain (loss) | | | 1.68 | | | | 1.49 | | | | 1.25 | | | | 1.49 | | | | 0.30 | (g) |
Total from investment operations | | | $1.83 | | | | $1.63 | | | | $1.37 | | | | $1.61 | | | | $0.40 | |
| | | | |
| Less distributions declared to shareholders | | | | | | | | | | | | | | | | | |
From net investment income | | | $(0.13 | ) | | | $(0.15 | ) | | | $(0.12 | ) | | | $(0.04 | ) | | | $(0.09 | ) |
From net realized gain | | | (0.46 | ) | | | (0.19 | ) | | | (0.03 | ) | | | (0.09 | ) | | | (0.01 | ) |
Total distributions declared to shareholders | | | $(0.59 | ) | | | $(0.34 | ) | | | $(0.15 | ) | | | $(0.13 | ) | | | $(0.10 | ) |
Net asset value, end of period (x) | | | $16.36 | | | | $15.12 | | | | $13.83 | | | | $12.61 | | | | $11.13 | |
Total return (%) (r)(s)(t)(x) | | | 12.94 | | | | 11.93 | | | | 10.93 | | | | 14.57 | | | | 3.69 | |
| | | | |
Ratios (%) (to average net assets)
and Supplemental data: | | | | | | | | | | | | | | | | | |
Expenses before expense reductions (f) | | | 1.30 | | | | 1.42 | | | | 1.58 | | | | 2.07 | | | | 3.68 | |
Expenses after expense reductions (f) | | | 1.14 | | | | 1.14 | | | | 1.42 | | | | 1.45 | | | | 1.45 | |
Net investment income (loss) | | | 0.98 | | | | 1.01 | | | | 0.91 | | | | 0.98 | | | | 0.89 | |
Portfolio turnover | | | 28 | | | | 30 | | | | 36 | | | | 38 | | | | 33 | |
Net assets at end of period (000 omitted) | | | $368 | | | | $156 | | | | $74 | | | | $53 | | | | $113 | |
| |
| Class R3 | | Year ended | |
| | | | | |
| | | 8/31/19 | | | 8/31/18 | | | 8/31/17 | | | 8/31/16 | | | 8/31/15 | |
Net asset value, beginning of period | | | $15.10 | | | | $13.81 | | | | $12.59 | | | | $11.14 | | | | $10.83 | |
| | | | |
| Income (loss) from investment operations | | | | | | | | | | | | | | | | | |
Net investment income (loss) (d) | | | $0.19 | | | | $0.18 | | | | $0.15 | | | | $0.15 | | | | $0.13 | |
Net realized and unrealized gain (loss) | | | 1.68 | | | | 1.48 | | | | 1.25 | | | | 1.48 | | | | 0.31 | (g) |
Total from investment operations | | | $1.87 | | | | $1.66 | | | | $1.40 | | | | $1.63 | | | | $0.44 | |
| | | | |
| Less distributions declared to shareholders | | | | | | | | | | | | | | | | | |
From net investment income | | | $(0.17 | ) | | | $(0.18 | ) | | | $(0.15 | ) | | | $(0.09 | ) | | | $(0.12 | ) |
From net realized gain | | | (0.46 | ) | | | (0.19 | ) | | | (0.03 | ) | | | (0.09 | ) | | | (0.01 | ) |
Total distributions declared to shareholders | | | $(0.63 | ) | | | $(0.37 | ) | | | $(0.18 | ) | | | $(0.18 | ) | | | $(0.13 | ) |
Net asset value, end of period (x) | | | $16.34 | | | | $15.10 | | | | $13.81 | | | | $12.59 | | | | $11.14 | |
Total return (%) (r)(s)(t)(x) | | | 13.24 | | | | 12.18 | | | | 11.22 | | | | 14.72 | | | | 4.04 | |
| | | | |
Ratios (%) (to average net assets)
and Supplemental data: | | | | | | | | | | | | | | | | | |
Expenses before expense reductions (f) | | | 1.05 | | | | 1.16 | | | | 1.33 | | | | 1.82 | | | | 3.43 | |
Expenses after expense reductions (f) | | | 0.89 | | | | 0.89 | | | | 1.17 | | | | 1.20 | | | | 1.20 | |
Net investment income (loss) | | | 1.22 | | | | 1.25 | | | | 1.18 | | | | 1.23 | | | | 1.14 | |
Portfolio turnover | | | 28 | | | | 30 | | | | 36 | | | | 38 | | | | 33 | |
Net assets at end of period (000 omitted) | | | $100 | | | | $67 | | | | $59 | | | | $53 | | | | $113 | |
See Notes to Financial Statements
22
Financial Highlights – continued
| | | | | | | | | | | | | | | | | | | | |
| Class R4 | | Year ended | |
| | | | | |
| | | 8/31/19 | | | 8/31/18 | | | 8/31/17 | | | 8/31/16 | | | 8/31/15 | |
Net asset value, beginning of period | | | $15.08 | | | | $13.79 | | | | $12.58 | | | | $11.14 | | | | $10.84 | |
| | | | |
| Income (loss) from investment operations | | | | | | | | | | | | | | | | | |
Net investment income (loss) (d) | | | $0.22 | | | | $0.21 | | | | $0.19 | | | | $0.17 | | | | $0.16 | |
Net realized and unrealized gain (loss) | | | 1.69 | | | | 1.49 | | | | 1.23 | | | | 1.49 | | | | 0.30 | (g) |
Total from investment operations | | | $1.91 | | | | $1.70 | | | | $1.42 | | | | $1.66 | | | | $0.46 | |
| | | | |
| Less distributions declared to shareholders | | | | | | | | | | | | | | | | | |
From net investment income | | | $(0.21 | ) | | | $(0.22 | ) | | | $(0.18 | ) | | | $(0.13 | ) | | | $(0.15 | ) |
From net realized gain | | | (0.46 | ) | | | (0.19 | ) | | | (0.03 | ) | | | (0.09 | ) | | | (0.01 | ) |
Total distributions declared to shareholders | | | $(0.67 | ) | | | $(0.41 | ) | | | $(0.21 | ) | | | $(0.22 | ) | | | $(0.16 | ) |
Net asset value, end of period (x) | | | $16.32 | | | | $15.08 | | | | $13.79 | | | | $12.58 | | | | $11.14 | |
Total return (%) (r)(s)(t)(x) | | | 13.53 | | | | 12.48 | | | | 11.42 | | | | 15.08 | | | | 4.20 | |
| | | | |
Ratios (%) (to average net assets)
and Supplemental data: | | | | | | | | | | | | | | | | | |
Expenses before expense reductions (f) | | | 0.81 | | | | 0.91 | | | | 1.08 | | | | 1.57 | | | | 3.18 | |
Expenses after expense reductions (f) | | | 0.64 | | | | 0.64 | | | | 0.92 | | | | 0.95 | | | | 0.95 | |
Net investment income (loss) | | | 1.48 | | | | 1.50 | | | | 1.42 | | | | 1.48 | | | | 1.39 | |
Portfolio turnover | | | 28 | | | | 30 | | | | 36 | | | | 38 | | | | 33 | |
Net assets at end of period (000 omitted) | | | $75 | | | | $66 | | | | $59 | | | | $53 | | | | $114 | |
| |
| Class R6 | | Year ended | |
| | | | | |
| | | 8/31/19 | | | 8/31/18 | | | 8/31/17 | | | 8/31/16 | | | 8/31/15 | |
Net asset value, beginning of period | | | $15.09 | | | | $13.80 | | | | $12.58 | | | | $11.14 | | | | $10.84 | |
| | | | |
| Income (loss) from investment operations | | | | | | | | | | | | | | | | | |
Net investment income (loss) (d) | | | $0.23 | | | | $0.23 | | | | $0.18 | | | | $0.18 | | | | $0.16 | |
Net realized and unrealized gain (loss) | | | 1.68 | | | | 1.48 | | | | 1.27 | | | | 1.50 | | | | 0.30 | (g) |
Total from investment operations | | | $1.91 | | | | $1.71 | | | | $1.45 | | | | $1.68 | | | | $0.46 | |
| | | | |
| Less distributions declared to shareholders | | | | | | | | | | | | | | | | | |
From net investment income | | | $(0.22 | ) | | | $(0.23 | ) | | | $(0.20 | ) | | | $(0.15 | ) | | | $(0.15 | ) |
From net realized gain | | | (0.46 | ) | | | (0.19 | ) | | | (0.03 | ) | | | (0.09 | ) | | | (0.01 | ) |
Total distributions declared to shareholders | | | $(0.68 | ) | | | $(0.42 | ) | | | $(0.23 | ) | | | $(0.24 | ) | | | $(0.16 | ) |
Net asset value, end of period (x) | | | $16.32 | | | | $15.09 | | | | $13.80 | | | | $12.58 | | | | $11.14 | |
Total return (%) (r)(s)(t)(x) | | | 13.56 | | | | 12.57 | | | | 11.61 | | | | 15.21 | | | | 4.22 | |
| | | | |
Ratios (%) (to average net assets)
and Supplemental data: | | | | | | | | | | | | | | | | | |
Expenses before expense reductions (f) | | | 0.71 | | | | 0.82 | | | | 0.97 | | | | 1.36 | | | | 3.14 | |
Expenses after expense reductions (f) | | | 0.56 | | | | 0.54 | | | | 0.78 | | | | 0.88 | | | | 0.91 | |
Net investment income (loss) | | | 1.53 | | | | 1.60 | | | | 1.38 | | | | 1.53 | | | | 1.43 | |
Portfolio turnover | | | 28 | | | | 30 | | | | 36 | | | | 38 | | | | 33 | |
Net assets at end of period (000 omitted) | | | $31,283 | | | | $8,632 | | | | $6,515 | | | | $1,693 | | | | $1,593 | |
See Notes to Financial Statements
23
Financial Highlights – continued
| (d) | Per share data is based on average shares outstanding. |
| (f) | Ratios do not reflect reductions from fees paid indirectly, if applicable. |
| (g) | The per share amount varies from the net realized and unrealized gain/loss for the period because of the timing of sales of fund shares and the per share amount of realized and unrealized gains and losses at such time. |
| (r) | Certain expenses have been reduced without which performance would have been lower. |
| (s) | From time to time the fund may receive proceeds from litigation settlements, without which performance would be lower. |
| (t) | Total returns do not include any applicable sales charges. |
| (x) | The net asset values and total returns have been calculated on net assets which include adjustments made in accordance with U.S. generally accepted accounting principles required at period end for financial reporting purposes. |
See Notes to Financial Statements
24
NOTES TO FINANCIAL STATEMENTS
(1) Business and Organization
MFS Low Volatility Equity Fund (the fund) is a diversified series of MFS Series Trust I (the trust). The trust is organized as a Massachusetts business trust and is registered under the Investment Company Act of 1940, as amended, as anopen-end management investment company.
The fund is an investment company and accordingly follows the investment company accounting and reporting guidance of the Financial Accounting Standards Board (FASB) Accounting Standards Codification Topic 946 Financial Services – Investment Companies.
(2) Significant Accounting Policies
General– The preparation of financial statements in conformity with U.S. generally accepted accounting principles requires management to make estimates and assumptions that affect the reported amounts of assets and liabilities, and disclosure of contingent assets and liabilities at the date of the financial statements and the reported amounts of increases and decreases in net assets from operations during the reporting period. Actual results could differ from those estimates. In the preparation of these financial statements, management has evaluated subsequent events occurring after the date of the fund’s Statement of Assets and Liabilities through the date that the financial statements were issued.
Balance Sheet Offsetting– The fund’s accounting policy with respect to balance sheet offsetting is that, absent an event of default by the counterparty or a termination of the agreement, the International Swaps and Derivatives Association (ISDA) Master Agreement, or similar agreement, does not result in an offset of reported amounts of financial assets and financial liabilities in the Statement of Assets and Liabilities across transactions between the fund and the applicable counterparty. The fund’s right to setoff may be restricted or prohibited by the bankruptcy or insolvency laws of the particular jurisdiction to which a specific master netting agreement counterparty is subject. Balance sheet offsetting disclosures, to the extent applicable to the fund, have been included in the fund’s Significant Accounting Policies note under the captions for each of the fund’sin-scope financial instruments and transactions.
Investment Valuations– Equity securities, including restricted equity securities, are generally valued at the last sale or official closing price on their primary market or exchange as provided by a third-party pricing service. Equity securities, for which there were no sales reported that day, are generally valued at the last quoted daily bid quotation on their primary market or exchange as provided by a third-party pricing service. Short-term instruments with a maturity at issuance of 60 days or less may be valued at amortized cost, which approximates market value.Open-end investment companies are generally valued at net asset value per share. Securities and other assets generally valued on the basis of information from a third-party pricing service may also be valued at a broker/dealer bid quotation. In determining values, third-party pricing services can utilize both transaction data and market information such as yield, quality, coupon rate, maturity, type of issue, trading characteristics, and other market data.
25
Notes to Financial Statements – continued
The Board of Trustees has delegated primary responsibility for determining or causing to be determined the value of the fund’s investments (including any fair valuation) to the adviser pursuant to valuation policies and procedures approved by the Board. If the adviser determines that reliable market quotations are not readily available, investments are valued at fair value as determined in good faith by the adviser in accordance with such procedures under the oversight of the Board of Trustees. Under the fund’s valuation policies and procedures, market quotations are not considered to be readily available for most types of debt instruments and floating rate loans and many types of derivatives. These investments are generally valued at fair value based on information from third-party pricing services. In addition, investments may be valued at fair value if the adviser determines that an investment’s value has been materially affected by events occurring after the close of the exchange or market on which the investment is principally traded (such as foreign exchange or market) and prior to the determination of the fund’s net asset value, or after the halt of trading of a specific security where trading does not resume prior to the close of the exchange or market on which the security is principally traded. Events that occur after foreign markets close (such as developments in foreign markets and significant movements in the U.S. markets) and prior to the determination of the fund’s net asset value may be deemed to have a material effect on the value of securities traded in foreign markets. Accordingly, the fund’s foreign equity securities may often be valued at fair value. The adviser generally relies on third-party pricing services or other information (such as the correlation with price movements of similar securities in the same or other markets; the type, cost and investment characteristics of the security; the business and financial condition of the issuer; and trading and other market data) to assist in determining whether to fair value and at what value to fair value an investment. The value of an investment for purposes of calculating the fund’s net asset value can differ depending on the source and method used to determine value. When fair valuation is used, the value of an investment used to determine the fund’s net asset value may differ from quoted or published prices for the same investment. There can be no assurance that the fund could obtain the fair value assigned to an investment if it were to sell the investment at the same time at which the fund determines its net asset value per share.
Various inputs are used in determining the value of the fund’s assets or liabilities. These inputs are categorized into three broad levels. In certain cases, the inputs used to measure fair value may fall into different levels of the fair value hierarchy. In such cases, an investment’s level within the fair value hierarchy is based on the lowest level of input that is significant to the fair value measurement. The fund’s assessment of the significance of a particular input to the fair value measurement in its entirety requires judgment, and considers factors specific to the investment. Level 1 includes unadjusted quoted prices in active markets for identical assets or liabilities. Level 2 includes other significant observable market-based inputs (including quoted prices for similar securities, interest rates, prepayment speed, and credit risk). Level 3 includes
26
Notes to Financial Statements – continued
unobservable inputs, which may include the adviser’s own assumptions in determining the fair value of investments. The following is a summary of the levels used as of August 31, 2019 in valuing the fund’s assets or liabilities:
| | | | | | | | | | | | | | | | |
| | | | |
| Financial Instruments | | Level 1 | | | Level 2 | | | Level 3 | | | Total | |
| Equity Securities | | | $367,947,653 | | | | $— | | | | $— | | | | $367,947,653 | |
| Mutual Funds | | | 2,645,173 | | | | — | | | | — | | | | 2,645,173 | |
| Total | | | $370,592,826 | | | | $— | | | | $— | | | | $370,592,826 | |
For further information regarding security characteristics, see the Portfolio of Investments.
Indemnifications– Under the fund’s organizational documents, its officers and Trustees may be indemnified against certain liabilities and expenses arising out of the performance of their duties to the fund. Additionally, in the normal course of business, the fund enters into agreements with service providers that may contain indemnification clauses. The fund’s maximum exposure under these agreements is unknown as this would involve future claims that may be made against the fund that have not yet occurred.
Investment Transactions and Income– Investment transactions are recorded on the trade date. Dividends received in cash are recorded on theex-dividend date. Certain dividends from foreign securities will be recorded when the fund is informed of the dividend if such information is obtained subsequent to theex-dividend date. Dividend payments received in additional securities are recorded on theex-dividend date in an amount equal to the value of the security on such date.
The fund may receive proceeds from litigation settlements. Any proceeds received from litigation involving portfolio holdings are reflected in the Statement of Operations in realized gain/loss if the security has been disposed of by the fund or in unrealized gain/loss if the security is still held by the fund. Any other proceeds from litigation not related to portfolio holdings are reflected as other income in the Statement of Operations.
Tax Matters and Distributions– The fund intends to qualify as a regulated investment company, as defined under Subchapter M of the Internal Revenue Code, and to distribute all of its taxable income, including realized capital gains. As a result, no provision for federal income tax is required. The fund’s federal tax returns, when filed, will remain subject to examination by the Internal Revenue Service for a three year period. Management has analyzed the fund’s tax positions taken on federal and state tax returns for all open tax years and does not believe that there are any uncertain tax positions that require recognition of a tax liability. Foreign taxes, if any, have been accrued by the fund in the accompanying financial statements in accordance with the applicable foreign tax law. Foreign income taxes may be withheld by certain countries in which the fund invests. Additionally, capital gains realized by the fund on securities issued in or by certain foreign countries may be subject to capital gains tax imposed by those countries.
Distributions to shareholders are recorded on theex-dividend date. Income and capital gain distributions are determined in accordance with income tax regulations, which may differ from U.S. generally accepted accounting principles. Certain capital accounts
27
Notes to Financial Statements – continued
in the financial statements are periodically adjusted for permanent differences in order to reflect their tax character. These adjustments have no impact on net assets or net asset value per share. Temporary differences which arise from recognizing certain items of income, expense, gain or loss in different periods for financial statement and tax purposes will reverse at some time in the future. Distributions in excess of net investment income or net realized gains are temporary overdistributions for financial statement purposes resulting from differences in the recognition or classification of income or distributions for financial statement and tax purposes.
Book/tax differences primarily relate to wash sale loss deferrals.
The tax character of distributions declared to shareholders for the last two fiscal years is as follows:
| | | | | | | | |
| | |
| | | Year ended | | | Year ended | |
| | |
| | | 8/31/19 | | | 8/31/18 | |
| Ordinary income (including any short-term capital gains) | | | $2,003,416 | | | | $1,498,316 | |
| Long-term capital gains | | | 2,815,117 | | | | 746,071 | |
| | |
| Total distributions | | | $4,818,533 | | | | $2,244,387 | |
The federal tax cost and the tax basis components of distributable earnings were as follows:
| | | | |
| |
| As of 8/31/19 | | | |
| |
| Cost of investments | | | $332,258,550 | |
| Gross appreciation | | | 42,744,577 | |
| |
| Gross depreciation | | | (4,410,301 | ) |
| Net unrealized appreciation (depreciation) | | | $38,334,276 | |
| |
| Undistributed ordinary income | | | 672,340 | |
| Undistributed long-term capital gain | | | 678,160 | |
Multiple Classes of Shares of Beneficial Interest– The fund offers multiple classes of shares, which differ in their respective distribution and service fees. The fund’s income, realized and unrealized gain (loss), and common expenses are allocated to shareholders based on the daily net assets of each class. Dividends are declared separately for each class. Differences in per share dividend rates are generally due to differences in separate class expenses. Class B shares will convert to Class A shares approximately eight years after purchase. Class C shares will convert to Class A shares
28
Notes to Financial Statements – continued
approximately ten years after purchase. The fund’s distributions declared to shareholders as reported in the Statements of Changes in Net Assets are presented by class as follows:
| | | | | | | | | | | | | | | | |
| | | From net investment
income | | | From net realized
gain | |
| | | | |
| | | Year
ended
8/31/19 | | | Year
ended
8/31/18 | | | Year
ended
8/31/19 | | | Year
ended
8/31/18 | |
| Class A | | | $583,411 | | | | $504,110 | | | | $1,358,525 | | | | $520,876 | |
| Class B | | | 9,394 | | | | 11,146 | | | | 69,284 | | | | 28,574 | |
| Class C | | | 67,502 | | | | 69,236 | | | | 451,966 | | | | 170,155 | |
| Class I | | | 785,192 | | | | 381,889 | | | | 1,003,335 | | | | 330,158 | |
| Class R1 | | | 582 | | | | 597 | | | | 4,207 | | | | 1,471 | |
| Class R2 | | | 1,479 | | | | 1,117 | | | | 4,849 | | | | 1,003 | |
| Class R3 | | | 823 | | | | 781 | | | | 2,048 | | | | 799 | |
| Class R4 | | | 923 | | | | 932 | | | | 2,021 | | | | 798 | |
| Class R6 | | | 184,084 | | | | 123,424 | | | | 288,908 | | | | 97,321 | |
| Total | | | $1,633,390 | | | | $1,093,232 | | | | $3,185,143 | | | | $1,151,155 | |
(3) Transactions with Affiliates
Investment Adviser– The fund has an investment advisory agreement with MFS to provide overall investment management and related administrative services and facilities to the fund. The management fee is computed daily and paid monthly at the following annual rates based on the fund’s average daily net assets:
| | | | |
| Up to $1 billion | | | 0.50 | % |
| In excess of $1 billion and up to $2.5 billion | | | 0.475 | % |
| In excess of $2.5 billion | | | 0.45 | % |
MFS has agreed in writing to reduce its management fee by a specified amount if certain MFS mutual fund assets exceed thresholds agreed to by MFS and the fund’s Board of Trustees. For the year ended August 31, 2019, this management fee reduction amounted to $16,101, which is included in the reduction of total expenses in the Statement of Operations. The management fee incurred for the year ended August 31, 2019 was equivalent to an annual effective rate of 0.49% of the fund’s average daily net assets.
The investment adviser has agreed in writing to pay a portion of the fund’s total annual operating expenses, excluding interest, taxes, extraordinary expenses, brokerage and transaction costs, and investment-related expenses, such that total fund operating expenses do not exceed the following rates annually of each class’s average daily net assets:
| | | | | | | | | | | | | | | | | | | | | | | | | | | | | | | | |
| Classes | |
| | | | | | | | |
| A | | B | | | C | | | I | | | R1 | | | R2 | | | R3 | | | R4 | | | R6 | |
| 0.89% | | | 1.64% | | | | 1.64% | | | | 0.64% | | | | 1.64% | | | | 1.14% | | | | 0.89% | | | | 0.64% | | | | 0.57% | |
This written agreement will continue until modified by the fund’s Board of Trustees, but such agreement will continue at least until December 31, 2020. For the year ended August 31, 2019, this reduction amounted to $234,269, which is included in the reduction of total expenses in the Statement of Operations.
29
Notes to Financial Statements – continued
Distributor– MFS Fund Distributors, Inc. (MFD), a wholly-owned subsidiary of MFS, as distributor, received $83,609 for the year ended August 31, 2019, as its portion of the initial sales charge on sales of Class A shares of the fund.
The Board of Trustees has adopted a distribution plan for certain share classes pursuant to Rule12b-1 of the Investment Company Act of 1940.
The fund’s distribution plan provides that the fund will pay MFD for services provided by MFD and financial intermediaries in connection with the distribution and servicing of certain share classes. One component of the plan is a distribution fee paid to MFD and another component of the plan is a service fee paid to MFD. MFD may subsequently pay all, or a portion, of the distribution and/or service fees to financial intermediaries.
Distribution Plan Fee Table:
| | | | | | | | | | | | | | | | | | | | |
| | | | | |
| | | Distribution
Fee Rate (d) | | | Service
Fee Rate (d) | | | Total
Distribution
Plan (d) | | | Annual
Effective
Rate (e) | | | Distribution
and Service
Fee | |
| Class A | | | — | | | | 0.25% | | | | 0.25% | | | | 0.25% | | | | $141,408 | |
| Class B | | | 0.75% | | | | 0.25% | | | | 1.00% | | | | 1.00% | | | | 23,511 | |
| Class C | | | 0.75% | | | | 0.25% | | | | 1.00% | | | | 1.00% | | | | 170,096 | |
| Class R1 | | | 0.75% | | | | 0.25% | | | | 1.00% | | | | 1.00% | | | | 1,458 | |
| Class R2 | | | 0.25% | | | | 0.25% | | | | 0.50% | | | | 0.50% | | | | 942 | |
| Class R3 | | | — | | | | 0.25% | | | | 0.25% | | | | 0.25% | | | | 194 | |
| Total Distribution and Service Fees | | | | | | | | | | | | $337,609 | |
| (d) | In accordance with the distribution plan for certain classes, the fund pays distribution and/or service fees equal to these annual percentage rates of each class’s average daily net assets. The distribution and service fee rates disclosed by class represent the current rates in effect at the end of the reporting period. Any rate changes, if applicable, are detailed below. |
| (e) | The annual effective rates represent actual fees incurred under the distribution plan for the year ended August 31, 2019 based on each class’s average daily net assets. MFD has voluntarily agreed to rebate a portion of each class’s 0.25% service fee attributable to accounts for which MFD retains the 0.25% service fee except for accounts attributable to MFS or its affiliates’ seed money. For the year ended August 31, 2019, this rebate amounted to $893, $14, and $17 for Class A, Class B, and Class C, respectively, and is included in the reduction of total expenses in the Statement of Operations. |
Certain Class A shares are subject to a contingent deferred sales charge (CDSC) in the event of a shareholder redemption within 18 months of purchase. Class B shares are subject to a CDSC in the event of a shareholder redemption within six years of purchase. Class C shares are subject to a CDSC in the event of a shareholder redemption within 12 months of purchase. All contingent deferred sales charges are paid to MFD and during the year ended August 31, 2019, were as follows:
| | | | |
| |
| | | Amount | |
| Class A | | | $677 | |
| Class B | | | 1,786 | |
| Class C | | | 2,591 | |
Shareholder Servicing Agent– MFS Service Center, Inc. (MFSC), a wholly-owned subsidiary of MFS, receives a fee from the fund for its services as shareholder servicing agent calculated as a percentage of the average daily net assets of the fund as determined periodically under the supervision of the fund’s Board of Trustees. For the
30
Notes to Financial Statements – continued
year ended August 31, 2019, the fee was $16,776, which equated to 0.0100% annually of the fund’s average daily net assets. MFSC also receives payment from the fund forout-of-pocket expenses,sub-accounting and other shareholder servicing costs which may be paid to affiliated and unaffiliated service providers. Class R6 shares do not incursub-accounting fees. For the year ended August 31, 2019, theseout-of-pocket expenses,sub-accounting and other shareholder servicing costs amounted to $128,480.
Administrator– MFS provides certain financial, legal, shareholder communications, compliance, and other administrative services to the fund. Under an administrative services agreement, the fund reimburses MFS the costs incurred to provide these services. The fund is charged an annual fixed amount of $17,500 plus a fee based on average daily net assets. The administrative services fee incurred for the year ended August 31, 2019 was equivalent to an annual effective rate of 0.0198% of the fund’s average daily net assets.
Trustees’ and Officers’ Compensation– The fund pays compensation to independent Trustees in the form of a retainer, attendance fees, and additional compensation to Board and Committee chairpersons. The fund does not pay compensation directly to Trustees or officers of the fund who are also officers of the investment adviser, all of whom receive remuneration from MFS for their services to the fund. Certain officers and Trustees of the fund are officers or directors of MFS, MFD, and MFSC.
Other– This fund and certain other funds managed by MFS (the funds) had entered into a service agreement (the ISO Agreement) which provided for payment of fees solely by the funds to Tarantino LLC in return for the provision of services of an Independent Senior Officer (ISO) for the funds. Frank L. Tarantino served as the ISO and was an officer of the funds and the sole member of Tarantino LLC. Effective June 30, 2019, Mr. Tarantino retired from his position as ISO for the funds, and the ISO Agreement was terminated. For the year ended August 31, 2019, the fee paid by the fund under this agreement was $257 and is included in “Miscellaneous” expense in the Statement of Operations. MFS had agreed to bear all expenses associated with office space, other administrative support, and supplies provided to the ISO.
The fund invests in the MFS Institutional Money Market Portfolio which is managed by MFS and seeks current income consistent with preservation of capital and liquidity. This money market fund does not pay a management fee to MFS.
On December 14, 2018, MFS redeemed 4,446 shares of Class R6 for an aggregate amount of $64,462.
At August 31, 2019, MFS held approximately 74% and 100% of the outstanding shares of Class R3 and Class R4, respectively.
The fund is permitted to engage in purchase and sale transactions with funds and accounts for which MFS serves as investment adviser orsub-adviser (“cross-trades”) pursuant to a policy adopted by the Board of Trustees. This policy has been designed to ensure that cross-trades conducted by the fund comply with Rule17a-7 under the Investment Company Act of 1940. During the year ended August 31, 2019, the fund engaged in purchase transactions pursuant to this policy, which amounted to $41,828.
31
Notes to Financial Statements – continued
The adviser has voluntarily undertaken to reimburse the fund from its own resources on a quarterly basis for the cost of investment research embedded in the cost of the fund’s securities trades. This agreement may be rescinded at any time. For the year ended August 31, 2019, this reimbursement amounted to $4,773, which is included in “Other” income in the Statement of Operations.
(4) Portfolio Securities
For the year ended August 31, 2019, purchases and sales of investments, other than short-term obligations, aggregated $296,213,801 and $48,052,204, respectively.
(5) Shares of Beneficial Interest
The fund’s Declaration of Trust permits the Trustees to issue an unlimited number of full and fractional shares of beneficial interest. Transactions in fund shares were as follows:
| | | | | | | | | | | | | | | | |
| | | Year ended
8/31/19 | | | Year ended
8/31/18 | |
| | | | |
| | | Shares | | | Amount | | | Shares | | | Amount | |
| Shares sold | | | | | | | | | | | | | | | | |
Class A | | | 3,235,271 | | | | $48,902,099 | | | | 669,556 | | | | $9,561,155 | |
Class B | | | 23,122 | | | | 339,299 | | | | 29,684 | | | | 427,651 | |
Class C | | | 647,279 | | | | 9,609,566 | | | | 254,161 | | | | 3,630,483 | |
Class I | | | 15,531,431 | | | | 243,089,354 | | | | 941,779 | | | | 13,506,029 | |
Class R1 | | | 1,739 | | | | 27,454 | | | | 1,117 | | | | 16,060 | |
Class R2 | | | 11,703 | | | | 189,116 | | | | 5,348 | | | | 75,258 | |
Class R3 | | | 1,477 | | | | 22,634 | | | | 65 | | | | 920 | |
Class R6 | | | 1,485,520 | | | | 22,946,373 | | | | 244,878 | | | | 3,490,016 | |
| | | 20,937,542 | | | | $325,125,895 | | | | 2,146,588 | | | | $30,707,572 | |
| | | | |
Shares issued to shareholders in
reinvestment of distributions | | | | | | | | | | | | | | | | |
Class A | | | 141,448 | | | | $1,933,913 | | | | 72,060 | | | | $1,023,057 | |
Class B | | | 5,642 | | | | 75,618 | | | | 2,787 | | | | 39,720 | |
Class C | | | 38,814 | | | | 519,165 | | | | 16,826 | | | | 239,073 | |
Class I | | | 127,726 | | | | 1,787,923 | | | | 50,159 | | | | 711,948 | |
Class R1 | | | 356 | | | | 4,789 | | | | 145 | | | | 2,068 | |
Class R2 | | | 464 | | | | 6,328 | | | | 149 | | | | 2,120 | |
Class R3 | | | 210 | | | | 2,871 | | | | 111 | | | | 1,580 | |
Class R4 | | | 214 | | | | 2,944 | | | | 122 | | | | 1,730 | |
Class R6 | | | 28,277 | | | | 392,678 | | | | 12,749 | | | | 181,160 | |
| | | 343,151 | | | | $4,726,229 | | | | 155,108 | | | | $2,202,456 | |
32
Notes to Financial Statements – continued
| | | | | | | | | | | | | | | | |
| | | Year ended
8/31/19 | | | Year ended
8/31/18 | |
| | | | |
| | | Shares | | | Amount | | | Shares | | | Amount | |
| Shares reacquired | | | | | | | | | | | | | | | | |
Class A | | | (890,885 | ) | | | $(13,424,228 | ) | | | (880,860 | ) | | | $(12,579,954 | ) |
Class B | | | (18,557 | ) | | | (280,249 | ) | | | (36,802 | ) | | | (524,433 | ) |
Class C | | | (267,226 | ) | | | (4,024,024 | ) | | | (247,019 | ) | | | (3,512,395 | ) |
Class I | | | (2,597,814 | ) | | | (39,783,835 | ) | | | (534,310 | ) | | | (7,611,482 | ) |
Class R1 | | | (1,095 | ) | | | (17,588 | ) | | | (37 | ) | | | (528 | ) |
Class R2 | | | (15 | ) | | | (235 | ) | | | (523 | ) | | | (7,503 | ) |
Class R3 | | | (1 | ) | | | (10 | ) | | | (1 | ) | | | (9 | ) |
Class R6 | | | (169,611 | ) | | | (2,590,457 | ) | | | (157,753 | ) | | | (2,256,601 | ) |
| | | (3,945,204 | ) | | | $(60,120,626 | ) | | | (1,857,305 | ) | | | $(26,492,905 | ) |
| | | | |
| Net change | | | | | | | | | | | | | | | | |
Class A | | | 2,485,834 | | | | $37,411,784 | | | | (139,244 | ) | | | $(1,995,742 | ) |
Class B | | | 10,207 | | | | 134,668 | | | | (4,331 | ) | | | (57,062 | ) |
Class C | | | 418,867 | | | | 6,104,707 | | | | 23,968 | | | | 357,161 | |
Class I | | | 13,061,343 | | | | 205,093,442 | | | | 457,628 | | | | 6,606,495 | |
Class R1 | | | 1,000 | | | | 14,655 | | | | 1,225 | | | | 17,600 | |
Class R2 | | | 12,152 | | | | 195,209 | | | | 4,974 | | | | 69,875 | |
Class R3 | | | 1,686 | | | | 25,495 | | | | 175 | | | | 2,491 | |
Class R4 | | | 214 | | | | 2,944 | | | | 122 | | | | 1,730 | |
Class R6 | | | 1,344,186 | | | | 20,748,594 | | | | 99,874 | | | | 1,414,575 | |
| | | 17,335,489 | | | | $269,731,498 | | | | 444,391 | | | | $6,417,123 | |
Class T shares were not publicly available for sale during the period. Please see the fund’s prospectus for details.
Effective June 1, 2019, purchases of the fund’s Class B shares are closed to new and existing investors subject to certain exceptions. Please see the fund’s prospectus for details.
(6) Line of Credit
The fund and certain other funds managed by MFS participate in a $1.25 billion unsecured committed line of credit, subject to a $1 billion sublimit, provided by a syndicate of banks under a credit agreement. Borrowings may be made for temporary financing needs. Interest is charged to each fund, based on its borrowings, generally at a rate equal to the highest of one month LIBOR, the Federal Funds Effective Rate and the Overnight Bank Funding Rate, plus an agreed upon spread. A commitment fee, based on the average daily, unused portion of the committed line of credit, is allocated among the participating funds. In addition, the fund and other funds managed by MFS have established unsecured uncommitted borrowing arrangements with certain banks for temporary financing needs. Interest is charged to each fund, based on its borrowings, at rates equal to customary reference rates plus an agreed upon spread. For the year ended August 31, 2019, the fund’s commitment fee and interest expense were $659 and $0, respectively, and are included in “Miscellaneous” expense in the Statement of Operations.
33
Notes to Financial Statements – continued
(7) Investments in Affiliated Issuers
An affiliated issuer may be considered one in which the fund owns 5% or more of the outstanding voting securities, or a company which is under common control. For the purposes of this report, the following were affiliated issuers:
| | | | | | | | | | | | | | | | | | | | | | | | |
| | | | | | |
| Affiliated Issuers | | Beginning
Value | | | Purchases | | | Sales
Proceeds | | | Realized
Gain
(Loss) | | | Change in
Unrealized
Appreciation or
Depreciation | | | Ending
Value | |
| MFS Institutional Money Market Portfolio | | | $778,538 | | | | $179,951,086 | | | | $178,085,880 | | | | $1,235 | | | | $194 | | | | $2,645,173 | |
| | | | | | |
| Affiliated Issuers | | | | | | | | | | | | | | Dividend
Income | | | Capital Gain
Distributions | |
| MFS Institutional Money Market Portfolio | | | | | | | | | | | | | | | | $43,202 | | | | $— | |
34
REPORT OF INDEPENDENT REGISTERED PUBLIC ACCOUNTING FIRM
To the Shareholders of MFS Low Volatility Equity Fund and the Board of Trustees of MFS Series Trust I
Opinion on the Financial Statements
We have audited the accompanying statement of assets and liabilities of MFS Low Volatility Equity Fund (the “Fund”) (one of the funds constituting MFS Series Trust I (the “Trust”)), including the portfolio of investments, as of August 31, 2019,and the related statement of operations for the year then ended, the statements of changes in net assets for each of the two years in the period then ended, the financial highlights for each of the five years in the period then ended and the related notes (collectively referred to as the “financial statements”). In our opinion, the financial statements present fairly, in all material respects, the financial position of the Fund (one of the funds constituting MFS Series Trust I) at August 31, 2019, the results of its operations for the year then ended, the changes in its net assets for each of the two years in the period then ended and its financial highlights for each of the five years in the period then ended, in conformity with U.S. generally accepted accounting principles.
Basis for Opinion
These financial statements are the responsibility of the Trust’s management. Our responsibility is to express an opinion on the Fund’s financial statements based on our audits. We are a public accounting firm registered with the Public Company Accounting Oversight Board (United States) (“PCAOB”) and are required to be independent with respect to the Trust in accordance with the U.S. federal securities laws and the applicable rules and regulations of the Securities and Exchange Commission and the PCAOB.
We conducted our audits in accordance with the standards of the PCAOB. Those standards require that we plan and perform the audit to obtain reasonable assurance about whether the financial statements are free of material misstatement, whether due to error or fraud. The Trust is not required to have, nor were we engaged to perform, an audit of the Trust’s internal control over financial reporting. As part of our audits we are required to obtain an understanding of internal control over financial reporting but not for the purpose of expressing an opinion on the effectiveness of the Trust’s internal control over financial reporting. Accordingly, we express no such opinion.
Our audits included performing procedures to assess the risks of material misstatement of the financial statements, whether due to error or fraud, and performing procedures that respond to those risks. Such procedures included examining, on a test basis, evidence regarding the amounts and disclosures in the financial statements. Our procedures included confirmation of securities owned as of August 31, 2019,by correspondence with the custodian andothers or by other appropriate auditing procedures where replies from others were not received. Our audits also included
35
Report of Independent Registered Public Accounting Firm – continued
evaluating the accounting principles used and significant estimates made by management, as well as evaluating the overall presentation of the financial statements. We believe that our audits provide a reasonable basis for our opinion.

We have served as the auditor of one or more MFS investment companies since 1993.
Boston, Massachusetts
October 17, 2019
36
TRUSTEES AND OFFICERS — IDENTIFICATION AND BACKGROUND
The Trustees and Officers of the Trust, as of October 1, 2019, are listed below, together with their principal occupations during the past five years. (Their titles may have varied during that period.) The address of each Trustee and Officer is 111 Huntington Avenue, Boston, Massachusetts 02199-7618.
| | | | | | | | | | |
Name, Age | | Position(s)
Held
with Fund | | Trustee/Officer
Since (h) | | Number of
MFS Funds
overseen
by the
Trustee | | Principal
Occupations During the Past Five Years | | Other
Directorships
During the Past
Five Years (j) |
| INTERESTED TRUSTEES |
Robert J. Manning (k)
(age 55) | | Trustee | | February 2004 | | 135 | | Massachusetts Financial Services Company, Executive Chairman (since January 2017); Director; Chairman of the Board; Chief Executive Officer (until 2015);Co-Chief Executive Officer (2015-2016) | | N/A |
| | | | | |
Robin A. Stelmach (k) (age 58) | | Trustee | | January 2014 | | 135 | | Massachusetts Financial Services Company, Vice Chair (since January 2017); Chief Operating Officer and Executive Vice President (until January 2017) | | N/A |
| INDEPENDENT TRUSTEES |
John P. Kavanaugh (age 64) | | Trustee and Chair of Trustees | | January 2009 | | 135 | | Private investor | | N/A |
| | | | | |
Steven E. Buller (age 68) | | Trustee | | February 2014 | | 135 | | Financial Accounting Standards Advisory Council, Chairman (2014-2015); Public Company Accounting Oversight Board, Standing Advisory Group, Member (until 2014); BlackRock, Inc. (investment management), Managing Director (until 2014), BlackRock Finco UK (investment management), Director (until 2014) | | N/A |
37
Trustees and Officers – continued
| | | | | | | | | | |
Name, Age | | Position(s)
Held
with Fund | | Trustee/Officer
Since (h) | | Number of
MFS Funds
overseen
by the
Trustee | | Principal
Occupations During the Past Five Years | | Other
Directorships
During the Past
Five Years (j) |
John A. Caroselli (age 65) | | Trustee | | March 2017 | | 135 | | JC Global Advisors, LLC (management consulting), President (since 2015); First Capital Corporation (commercial finance), Executive Vice President (until 2015) | | N/A |
| | | | | |
Maureen R. Goldfarb (age 64) | | Trustee | | January 2009 | | 135 | | Private investor | | N/A |
| | | | | |
Michael Hegarty
(age 74) | | Trustee | | December 2004 | | 135 | | Private investor | | Rouse Properties Inc., Director (until 2016); Capmark Financial Group Inc., Director (until 2015) |
| | | | | |
Peter D. Jones
(age 64) | | Trustee | | January 2019 | | 135 | | Franklin Templeton Distributors, Inc. (investment management), President (until 2015); Franklin Templeton Institutional, LLC (investment management), Chairman (until 2015) | | N/A |
| | | | | |
James W. Kilman, Jr.
(age 58) | | Trustee | | January 2019 | | 135 | | Burford Capital Limited (finance and investment management), Chief Financial Officer (since 2019); KielStrand Capital LLC (family office and merchant bank), Chief Executive Officer (since 2016); Morgan Stanley & Co. (financial services), Vice Chairman of Investment Banking,Co-Head of Diversified Financials Coverage – Financial Institutions Investment Banking Group (until 2016) | | Alpha-En Corporation, Director (since 2016) |
38
Trustees and Officers – continued
| | | | | | | | | | |
Name, Age | | Position(s)
Held
with Fund | | Trustee/Officer
Since (h) | | Number of
MFS Funds
overseen
by the
Trustee | | Principal
Occupations During the Past Five Years | | Other
Directorships
During the Past
Five Years (j) |
Clarence Otis, Jr. (age 63) | | Trustee | | March 2017 | | 135 | | Darden Restaurants, Inc., Chief Executive Officer (until 2014) | | VF Corporation, Director; Verizon Communications, Inc., Director; The Travelers Companies, Director; Federal Reserve Bank of Atlanta, Director (until 2015) |
| | | | | |
Maryanne L. Roepke (age 63) | | Trustee | | May 2014 | | 135 | | American Century Investments (investment management), Senior Vice President and Chief Compliance Officer (until 2014) | | N/A |
| | | | | |
Laurie J. Thomsen
(age 62) | | Trustee | | March 2005 | | 135 | | Private investor | | The Travelers Companies, Director; Dycom Industries, Inc., Director (since 2015) |
| | | | | | | | |
Name, Age | | Position(s) Held
with Fund | | Trustee/Officer
Since (h) | | Number of
MFS Funds
for which
the Person
is an Officer | | Principal
Occupations During
the Past Five Years |
| OFFICERS | | | | | | | | |
Christopher R. Bohane (k)
(age 45) | | Assistant Secretary and Assistant Clerk | | July 2005 | | 135 | | Massachusetts Financial Services Company, Vice President and Assistant General Counsel |
| | | | |
Kino Clark (k) (age 51) | | Assistant Treasurer | | January 2012 | | 135 | | Massachusetts Financial Services Company, Vice President |
39
Trustees and Officers – continued
| | | | | | | | |
Name, Age | | Position(s) Held
with Fund | | Trustee/Officer
Since (h) | | Number of
MFS Funds
for which
the Person
is an Officer | | Principal
Occupations During
the Past Five Years |
John W. Clark, Jr. (k) (age 52) | | Assistant Treasurer | | April 2017 | | 135 | | Massachusetts Financial Services Company, Vice President (since March 2017); Deutsche Bank (financial services), Department Head – Treasurer’s Office (until February 2017) |
| | | | |
Thomas H. Connors (k) (age 60) | | Assistant Secretary and Assistant Clerk | | September 2012 | | 135 | | Massachusetts Financial Services Company, Vice President and Senior Counsel |
| | | | |
David L. DiLorenzo (k)
(age 51) | | President | | July 2005 | | 135 | | Massachusetts Financial Services Company, Senior Vice President |
| | | | |
Heidi W. Hardin (k)
(age 52) | | Secretary and Clerk | | April 2017 | | 135 | | Massachusetts Financial Services Company, Executive Vice President and General Counsel (since March 2017); Harris Associates (investment management), General Counsel (from September 2015 to January 2017); Janus Capital Management LLC (investment management), Senior Vice President and General Counsel (until September 2015) |
| | | | |
Brian E. Langenfeld (k)
(age 46) | | Assistant
Secretary and Assistant Clerk | | June 2006 | | 135 | | Massachusetts Financial Services Company, Vice President and Senior Counsel |
| | | | |
Amanda S. Mooradian (k)
(age 40) | | Assistant
Secretary and Assistant Clerk | | September 2018 | | 135 | | Massachusetts Financial Services Company, Assistant Vice President and Counsel |
40
Trustees and Officers – continued
| | | | | | | | |
Name, Age | | Position(s) Held
with Fund | | Trustee/Officer
Since (h) | | Number of
MFS Funds
for which
the Person
is an Officer | | Principal
Occupations During
the Past Five Years |
Susan A. Pereira (k)
(age 48) | | Assistant
Secretary and Assistant Clerk | | July 2005 | | 135 | | Massachusetts Financial Services Company, Vice President and Assistant General Counsel |
| | | | |
Kasey L. Phillips (k)
(age 48) | | Assistant Treasurer | | September 2012 | | 135 | | Massachusetts Financial Services Company, Vice President |
| | | | |
Matthew A. Stowe (k)
(age 44) | | Assistant Secretary and Assistant Clerk | | October 2014 | | 135 | | Massachusetts Financial Services Company, Vice President and Assistant General Counsel |
| | | | |
Martin J. Wolin (k)
(age 52) | | Chief Compliance Officer | | July 2015 | | 135 | | Massachusetts Financial Services Company, Senior Vice President and Chief Compliance Officer (since July 2015); Mercer (financial service provider), Chief Risk and Compliance Officer, North America and Latin America (until June 2015) |
| | | | |
James O. Yost (k)
(age 59) | | Treasurer | | September 1990 | | 135 | | Massachusetts Financial Services Company, Senior Vice President |
| (h) | Date first appointed to serve as Trustee/officer of an MFS Fund. Each Trustee has served continuously since appointment unless indicated otherwise. For the period from December 15, 2004 until February 22, 2005, Mr. Manning served as Advisory Trustee. From January 2012 through December 2016, Messrs. DiLorenzo and Yost served as Treasurer and Deputy Treasurer of the Funds, respectively. |
| (j) | Directorships or trusteeships of companies required to report to the Securities and Exchange Commission (i.e., “public companies”). |
| (k) | “Interested person” of the Trust within the meaning of the Investment Company Act of 1940 (referred to as the 1940 Act), which is the principal federal law governing investment companies like the fund, as a result of a position with MFS. The address of MFS is 111 Huntington Avenue, Boston, Massachusetts 02199-7618. |
Each Trustee (other than Messrs. Jones and Kilman) has been elected by shareholders and each Trustee and Officer holds office until his or her successor is chosen and qualified or until his or her earlier death, resignation, retirement or removal. Messrs. Jones and Kilman became Trustees of the Funds on January 1, 2019. The Trust does
41
Trustees and Officers – continued
not hold annual meetings for the purpose of electing Trustees, and Trustees are not elected for fixed terms. Under the terms of the Board’s retirement policy, an Independent Trustee shall retire at the end of the calendar year in which he or she reaches the earlier of 75 years of age or 15 years of service on the Board (or, in the case of any Independent Trustee who joined the Board prior to 2015, 20 years of service on the Board).
Messrs. Buller, Hegarty, Kilman and Otis and Ms. Roepke are members of the Trust’s Audit Committee.
Each of the Interested Trustees and certain Officers hold comparable officer positions with certain affiliates of MFS.
The Statement of Additional Information for a Fund includes further information about the Trustees and is available without charge upon request by calling1-800-225-2606.
| | |
| Investment Adviser | | Custodian |
Massachusetts Financial Services Company
111 Huntington Avenue Boston, MA 02199-7618 | | State Street Bank and Trust Company 1 Lincoln Street Boston, MA 02111-2900 |
| Distributor | | Independent Registered Public Accounting Firm |
MFS Fund Distributors, Inc.
111 Huntington Avenue Boston, MA 02199-7618 | | Ernst & Young LLP 200 Clarendon Street Boston, MA 02116 |
| Portfolio Manager(s) | | |
Jim Fallon Matt Krummell Jonathan Sage Jed Stocks | | |
42
BOARD REVIEW OF INVESTMENT ADVISORY AGREEMENT
The Investment Company Act of 1940 requires that both the full Board of Trustees and a majority of thenon-interested (“independent”) Trustees, voting separately, annually approve the continuation of the Fund’s investment advisory agreement with MFS. The Trustees consider matters bearing on the Fund and its advisory arrangements at their meetings throughout the year, including a review of performance data at each regular meeting. In addition, the independent Trustees met several times over the course of three months beginning in May and ending in July, 2019 (“contract review meetings”) for the specific purpose of considering whether to approve the continuation of the investment advisory agreement for the Fund and the other investment companies that the Board oversees (the “MFS Funds”). The independent Trustees were assisted in their evaluation of the Fund’s investment advisory agreement by independent legal counsel, from whom they received separate legal advice and with whom they met separately from MFS during various contract review meetings. The independent Trustees were also assisted in this process by the MFS Funds’ Independent Senior Officer, a senior officer appointed by and reporting to the independent Trustees.
In connection with their deliberations regarding the continuation of the investment advisory agreement, the Trustees, including the independent Trustees, considered such information and factors as they believed, in light of the legal advice furnished to them and their own business judgment, to be relevant. The investment advisory agreement for the Fund was considered separately, although the Trustees also took into account the common interests of all MFS Funds in their review. As described below, the Trustees considered the nature, quality, and extent of the various investment advisory, administrative, and shareholder services to be performed by MFS under the existing investment advisory agreement and other arrangements with the Fund.
In connection with their contract review meetings, the Trustees received and relied upon materials that included, among other items: (i) information provided by Broadridge Financial Solutions, Inc. (“Broadridge”), an independent third party, on the investment performance of the Fund for various time periods ended December 31, 2018 and the investment performance of a group of funds with substantially similar investment classifications/objectives (the “Broadridge performance universe”), (ii) information provided by Broadridge on the Fund’s advisory fees and other expenses and the advisory fees and other expenses of comparable funds identified by Broadridge as well as all other funds in the same investment classification/category (the “Broadridge expense group and universe”), (iii) information provided by MFS on the advisory fees of portfolios of other clients of MFS, including institutional separate accounts and other clients, (iv) information as to whether and to what extent applicable expense waivers, reimbursements or fee “breakpoints” are observed for the Fund, (v) information regarding MFS’ financial results and financial condition, including MFS’ and certain of its affiliates’ estimated profitability from services performed for the Fund and the MFS Funds as a whole, and compared to MFS’ institutional business, (vi) MFS’ views regarding the outlook for the mutual fund industry and the strategic business plans of MFS, (vii) descriptions of various functions performed by MFS for the Funds, such as compliance monitoring and portfolio trading practices, and (viii) information regarding the overall organization of MFS, including
43
Board Review of Investment Advisory Agreement – continued
information about MFS’ senior management and other personnel providing investment advisory, administrative and other services to the Fund and the other MFS Funds. The comparative performance, fee and expense information prepared and provided by Broadridge was not independently verified and the independent Trustees did not independently verify any information provided to them by MFS.
The Trustees’ conclusion as to the continuation of the investment advisory agreement was based on a comprehensive consideration of all information provided to the Trustees and not the result of any single factor. Some of the factors that figured particularly in the Trustees’ deliberations are described below, although individual Trustees may have evaluated the information presented differently from one another, giving different weights to various factors. It is also important to recognize that the fee arrangements for the Fund and other MFS Funds are the result of years of review and discussion between the independent Trustees and MFS, that certain aspects of such arrangements may receive greater scrutiny in some years than in others, and that the Trustees’ conclusions may be based, in part, on their consideration of these same arrangements during the course of the year and in prior years.
Based on information provided by Broadridge and MFS, the Trustees reviewed the Fund’s total return investment performance as well as the Broadridge performance universe over various time periods. The Trustees placed particular emphasis on the total return performance of the Fund’s Class A shares in comparison to the performance of funds in its Broadridge performance universe over the five-year period ended December 31, 2018, which the Trustees believed was a long enough period to reflect differing market conditions. The total return performance of the Fund’s Class A shares was in the 1st quintile relative to the other funds in the universe for this five-year period (the 1st quintile being the best performers and the 5th quintile being the worst performers). The total return performance of the Fund’s Class A shares was in the 1st quintile for theone-year period and the 2nd quintile for the three-year period ended December 31, 2018 relative to the Broadridge performance universe. Because of the passage of time, these performance results may differ from the performance results for more recent periods, including those shown elsewhere in this report.
In the course of their deliberations, the Trustees took into account information provided by MFS in connection with the contract review meetings, as well as during investment review meetings conducted with portfolio management personnel during the course of the year regarding the Fund’s performance. After reviewing these and related factors, the Trustees concluded, within the context of their overall conclusions regarding the investment advisory agreement, that they were satisfied with MFS’ responses and efforts relating to investment performance.
In assessing the reasonableness of the Fund’s advisory fee, the Trustees considered, among other information, the Fund’s advisory fee and the total expense ratio of the Fund’s Class A shares as a percentage of average daily net assets and the advisory fee and total expense ratios of the Broadridge expense group based on information provided by Broadridge. The Trustees considered that MFS currently observes an expense limitation for the Fund, which may not be changed without the Trustees’ approval. The Trustees also considered that, according to the data provided by Broadridge (which takes into account any fee reductions or expense limitations that
44
Board Review of Investment Advisory Agreement – continued
were in effect during the Fund’s last fiscal year), the Fund’s effective advisory fee rate and the Fund’s total expense ratio were each approximately at the Broadridge expense group median.
The Trustees also considered the advisory fees charged by MFS to any institutional separate accounts advised by MFS (“separate accounts”) and unaffiliated investment companies for which MFS serves as subadviser (“subadvised funds”) that have comparable investment strategies to the Fund, if any. In comparing these fees, the Trustees considered information provided by MFS as to the generally broader scope of services provided by MFS to the Fund, as well as the more extensive regulatory burdens imposed on MFS in managing the Fund, in comparison to separate accounts and subadvised funds. The Trustees also considered the higher demands placed on MFS’ investment personnel and trading infrastructure as a result of the daily cashin-flows andout-flows of the Fund in comparison to separate accounts.
The Trustees also considered whether the Fund may benefit from any economies of scale in the management of the Fund in the event of growth in assets of the Fund and/or growth in assets of the MFS Funds as a whole. They noted that the Fund’s advisory fee rate schedule is subject to contractual breakpoints that reduce the Fund’s advisory fee rate on average daily net assets over $1 billion and $2.5 billion. The Trustees also noted that MFS has agreed in writing to waive a portion of the management fees of certain MFS Funds, including the Fund, if the total combined assets of certain funds within the MFS Funds’ complex increase above agreed upon thresholds (the “group fee waiver”), enabling the Fund’s shareholders to share in the benefits from any economies of scale at the complex level. The group fee waiver is reviewed and renewed annually between the Board and MFS. The Trustees concluded that the breakpoints and the group fee waiver were sufficient to allow the Fund to benefit from economies of scale as its assets and overall complex assets grow.
The Trustees also considered information prepared by MFS relating to MFS’ costs and profits with respect to the Fund, the MFS Funds considered as a group, and other investment companies and accounts advised by MFS, as well as MFS’ methodologies used to determine and allocate its costs to the MFS Funds, the Fund and other accounts and products for purposes of estimating profitability.
After reviewing these and other factors described herein, the Trustees concluded, within the context of their overall conclusions regarding the investment advisory agreement, that the advisory fees charged to the Fund represent reasonable compensation in light of the services being provided by MFS to the Fund.
In addition, the Trustees considered MFS’ resources and related efforts to continue to retain, attract and motivate capable personnel to serve the Fund. The Trustees also considered current and developing conditions in the financial services industry, including the presence of large and well-capitalized companies which are spending, and appear to be prepared to continue to spend, substantial sums to engage personnel and to provide services to competing investment companies. In this regard, the Trustees also considered the financial resources of MFS and its ultimate parent, Sun Life Financial Inc. The Trustees also considered the advantages and possible disadvantages to the Fund of having an adviser that also serves other investment companies as well as other accounts.
45
Board Review of Investment Advisory Agreement – continued
The Trustees also considered the nature, quality, cost, and extent of administrative, transfer agency, and distribution services provided to the Fund by MFS and its affiliates under agreements and plans other than the investment advisory agreement, including any12b-1 fees the Fund pays to MFS Fund Distributors, Inc., an affiliate of MFS. The Trustees also considered the nature, extent and quality of certain other services MFS performs or arranges for on the Fund’s behalf, which may include securities lending programs, directed expense payment programs, class action recovery programs, and MFS’ interaction with third-party service providers, principally custodians andsub-custodians. The Trustees concluded that the variousnon-advisory services provided by MFS and its affiliates on behalf of the Fund were satisfactory.
The Trustees consideredso-called“fall-out benefits” to MFS such as reputational value derived from serving as investment manager to the MFS Funds. The Trustees also considered that, effective January 3, 2018, MFS had discontinued its historic practice of obtaining investment research from portfolio brokerage commissions paid by certain MFS Funds and would thereafter directly pay for or voluntarily reimburse a Fund, if applicable, for the costs of external research acquired through the use of the Fund’s portfolio brokerage commissions.
Based on their evaluation of factors that they deemed to be material, including those factors described above, the Board of Trustees, including the independent Trustees, concluded that the Fund’s investment advisory agreement with MFS should be continued for an additionalone-year period, commencing August 1, 2019.
46
PROXY VOTING POLICIES AND INFORMATION
MFS votes proxies on behalf of the fund pursuant to proxy voting policies and procedures that are available without charge, upon request, by calling1-800-225-2606, by visitingmfs.com/proxyvoting,or by visiting the SEC’s Web site athttp://www.sec.gov.
Information regarding how the fund voted proxies relating to portfolio securities during the most recent twelve-month period ended June 30 is available by August 31 of each year without charge by visitingmfs.com/proxyvoting,or by visiting the SEC’s Web site athttp://www.sec.gov.
QUARTERLY PORTFOLIO DISCLOSURE
The fund files a complete schedule of portfolio holdings with the SEC for the first and third quarters of each fiscal year on Form N-Q or as an exhibit to its reports onForm N-PORT (for first and third fiscal quarters ending March 31, 2019 or after). The fund’s Form N-Q or Form N-PORT reports are available on the SEC’s website athttp://www.sec.gov.A shareholder can obtain the portfolio holdings report for the first and third quarters of the fund’s fiscal year atmfs.com/openendfunds by choosing the fund’s name and then selecting the “Resources” tab and clicking on “Prospectus and Reports”.
FURTHER INFORMATION
From time to time, MFS may post important information about the fund or the MFS funds on the MFS web site (mfs.com). This information is available athttps://www.mfs.com/en-us/what-we-do/announcements.htmlor atmfs.com/openendfundsby choosing the fund’s name.
INFORMATION ABOUT FUND CONTRACTS AND LEGAL CLAIMS
The fund has entered into contractual arrangements with an investment adviser, administrator, distributor, shareholder servicing agent, 529 program manager (if applicable), and custodian who each provide services to the fund. Unless expressly stated otherwise, shareholders are not parties to, or intended beneficiaries of these contractual arrangements, and these contractual arrangements are not intended to create any shareholder right to enforce them against the service providers or to seek any remedy under them against the service providers, either directly or on behalf of the fund.
Under the Trust’s By-Laws and Declaration of Trust, any claims asserted against or on behalf of the MFS Funds, including claims against Trustees and Officers, must be brought in state and federal courts located within the Commonwealth of Massachusetts.
FEDERAL TAX INFORMATION (unaudited)
The fund will notify shareholders of amounts for use in preparing 2019 income tax forms in January 2020. The following information is provided pursuant to provisions of the Internal Revenue Code.
The fund designates the maximum amount allowable as qualified dividend income eligible to be taxed at the same rate as long-term capital gain.
The fund designates $3,134,000 as capital gain dividends paid during the fiscal year.
For corporate shareholders, 93.28% of the ordinary income dividends paid during the fiscal year qualify for the corporate dividends received deduction.
The fund designates the maximum amount allowable as Section 199A dividends as defined in Proposed Treasury Regulation §1.199A-3(d).
47
rev. 3/16
| | | | |
| | | |
FACTS | | WHAT DOES MFS DO WITH YOUR PERSONAL INFORMATION? | |  |
| | |
| Why? | | Financial companies choose how they share your personal information. Federal law gives consumers the right to limit some but not all sharing. Federal law also requires us to tell you how we collect, share, and protect your personal information. Please read this notice carefully to understand what we do. |
| | |
| What? | | The types of personal information we collect and share depend on the product or service you have with us. This information can include: • Social Security number and account balances • Account transactions and transaction history • Checking account information and wire transfer instructions When you areno longer our customer, we continue to share your information as described in this notice. |
| | |
| How? | | All financial companies need to share customers’ personal information to run their everyday business. In the section below, we list the reasons financial companies can share their customers’ personal information; the reasons MFS chooses to share; and whether you can limit this sharing. |
| | | | |
Reasons we can share your
personal information | | Does MFS
share? | | Can you limit
this sharing? |
For our everyday business purposes – such as to process your transactions, maintain your account(s), respond to court orders and legal investigations, or report to credit bureaus | | Yes | | No |
For our marketing purposes – to offer our products and services to you | | No | | We don’t share |
For joint marketing with other financial companies | | No | | We don’t share |
For our affiliates’ everyday business purposes – information about your transactions and experiences | | No | | We don’t share |
For our affiliates’ everyday business purposes – information about your creditworthiness | | No | | We don’t share |
| For nonaffiliates to market to you | | No | | We don’t share |
| | |
| | |
| Questions? | | Call800-225-2606 or go tomfs.com. |
48
| | |
| Who we are |
| Who is providing this notice? | | MFS Funds, MFS Investment Management, MFS Institutional Advisors, Inc., and MFS Heritage Trust Company. |
| | |
| What we do |
| How does MFS protect my personal information? | | To protect your personal information from unauthorized access and use, we use security measures that comply with federal law. These measures include procedural, electronic, and physical safeguards for the protection of the personal information we collect about you. |
| How does MFS collect my personal information? | | We collect your personal information, for example, when you • open an account or provide account information • direct us to buy securities or direct us to sell your securities • make a wire transfer We also collect your personal information from others, such as credit bureaus, affiliates, or other companies. |
| Why can’t I limit all sharing? | | Federal law gives you the right to limit only • sharing for affiliates’ everyday business purposes – information about your creditworthiness • affiliates from using your information to market to you • sharing for nonaffiliates to market to you State laws and individual companies may give you additional rights to limit sharing. |
| | |
| Definitions |
| Affiliates | | Companies related by common ownership or control. They can be financial and nonfinancial companies. • MFS does not share personal information with affiliates, except for everyday business purposes as described on page one of this notice. |
| Nonaffiliates | | Companies not related by common ownership or control. They can be financial and nonfinancial companies. • MFS does not share with nonaffiliates so they can market to you. |
| Joint marketing | | A formal agreement between nonaffiliated financial companies that together market financial products or services to you. • MFS doesn’t jointly market. |
| | |
| Other important information |
| If you own an MFS product or receive an MFS service in the name of a third party such as a bank or broker-dealer, their privacy policy may apply to you instead of ours. |
49
Save paper with eDelivery.

| MFS® will send you prospectuses, |
reports, and proxies directly viae-mail so you will get information faster with less mailbox clutter.
To sign up:
1. Go to mfs.com.
2. Log in via MFS® Access.
3. Select eDelivery.
If you own your MFS fund shares through a financial institution or a retirement plan, MFS® TALK, MFS® Access, or eDelivery may not be available to you.
CONTACT
WEB SITE
mfs.com
MFS TALK
1-800-637-8255
24 hours a day
ACCOUNT SERVICE AND LITERATURE
Shareholders
1-800-225-2606
Financial advisors
1-800-343-2829
Retirement plan services
1-800-637-1255
MAILING ADDRESS
MFS Service Center, Inc.
P.O. Box 219341
Kansas City, MO 64121-9341
OVERNIGHT MAIL
MFS Service Center, Inc.
Suite 219341
430 W 7th Street
Kansas City, MO 64105-1407
Annual Report
August 31, 2019

MFS® New Discovery Fund

Beginning on January 1, 2021, as permitted by regulations adopted by the U.S. Securities and Exchange Commission, paper copies of the fund’s annual and semiannual shareholder reports will no longer be sent by mail, unless you specifically request paper copies of the reports. Instead, the complete reports will be made available on the fund’s Web site (funds.mfs.com), and you will be notified by mail each time a report is posted and provided with a Web site link to access the report.
If you are already signed up to receive shareholder reports by email, you will not be affected by this change and you need not take any action. You may sign up to receive shareholder reports and other communications from the fund by email by contacting your financial intermediary (such as a broker-dealer or bank) or, if you hold your shares directly with the fund, by calling 1-800-225-2606 or by logging on to MFS Access at mfs.com.
Beginning on January 1, 2019, you may elect to receive all future reports in paper free of charge. Contact your financial intermediary to request that you continue to receive paper copies of your shareholder reports. If you invest directly with the fund, you can call 1-800-225-2606 or send an email request to orderliterature@mfs.com to let the fund know that you wish to continue receiving paper copies of your shareholder reports. Your election to receive reports in paper will apply to all funds held in your account if you invest through your financial intermediary or all funds held with the MFS fund complex if you invest directly.
NDF-ANN
MFS® New Discovery Fund
CONTENTS
The report is prepared for the general information of shareholders.
It is authorized for distribution to prospective investors only when preceded or accompanied by a current prospectus.
NOT FDIC INSURED• MAY LOSE VALUE• NO BANK GUARANTEE

LETTER FROM THE EXECUTIVE CHAIRMAN
Dear Shareholders:
Slowing global growth, low inflation, and increasing trade friction between the United States and China have been hallmarks of the past 12 months. After experiencing an
uptick in market volatility in late 2018, markets steadied during the first half of 2019, thanks in large measure to the adoption of a dovish policy stance on the part of global central banks, focused on supporting economic growth. The U.S. and China have raised tariffs on each other, heightening tensions and uncertainty. Despite repeated declarations by British Prime Minister Boris Johnson that the United Kingdom will leave the European Union on October 31, 2019, with or without a deal, apprehension over the possibility of a no-deal Brexit has eased somewhat, with Parliament having taken steps to block such an outcome.
Markets expect that the longest economic expansion in U.S. history will continue for the time being, albeit at a slower pace. In an effort to prolong the expansion, the U.S. Federal Reserve lowered interest rates for the first time in more than a decade in July and again in September. Similarly, the European Central Bank loosened policy in September. While markets have grown more risk averse, the accommodative monetary environment has helped push global interest rates toward record-low levels and has been somewhat supportive of risk assets despite the unsettled economic and geopolitical backdrop.
Since launching the first U.S. open-end mutual fund in 1924, MFS® has been committed to a single purpose: to create value by allocating capital responsibly for clients. Through our powerful global investment platform, we combine collective expertise, thoughtful risk management, and long-term discipline to uncover what we believe are the best investment opportunities in the market.
Respectfully,

Robert J. Manning
Executive Chairman
MFS Investment Management
October 17, 2019
The opinions expressed in this letter are subject to change and may not be relied upon for investment advice. No forecasts can be guaranteed.
1
PORTFOLIO COMPOSITION
Portfolio structure

| | | | |
| Top ten holdings | | | | |
| Performance Food Group Co. | | | 1.6% | |
| Bright Horizons Family Solutions, Inc. | | | 1.6% | |
| CACI International, Inc., “A” | | | 1.5% | |
| WNS (Holdings) Ltd., ADR | | | 1.4% | |
| TMX Group Ltd. | | | 1.4% | |
| Generac Holdings, Inc. | | | 1.4% | |
| Everbridge, Inc. | | | 1.4% | |
| Planet Fitness, Inc. | | | 1.4% | |
| Axalta Coating Systems Ltd. | | | 1.4% | |
| ICON PLC | | | 1.3% | |
| | | | |
| GICS equity sectors (g) | |
| Health Care | | | 24.8% | |
| Information Technology | | | 24.1% | |
| Consumer Discretionary | | | 13.9% | |
| Industrials | | | 10.6% | |
| Financials | | | 7.1% | |
| Materials | | | 5.2% | |
| Communication Services | | | 3.3% | |
| Real Estate | | | 3.2% | |
| Consumer Staples | | | 2.7% | |
| Energy | | | 1.5% | |
| (g) | The Global Industry Classification Standard (GICS®) was developed by and/or is the exclusive property of MSCI, Inc. and S&P Global Market Intelligence Inc. (“S&P Global Market Intelligence”). GICS is a service mark of MSCI and S&P Global Market Intelligence and has been licensed for use by MFS. |
Cash & Cash Equivalents includes any cash, investments in money market funds, short-term securities, and other assets less liabilities. Please see the Statement of Assets and Liabilities for additional information related to the fund’s cash position and other assets and liabilities.
Percentages are based on net assets as of August 31, 2019.
The portfolio is actively managed and current holdings may be different.
2
MANAGEMENT REVIEW
Summary of Results
For the twelve months ended August 31, 2019, Class A shares of the MFS New Discovery Fund (fund) provided a total return of 3.49%, at net asset value. This compares with a return of –11.02% for the fund’s benchmark, the Russell 2000® Growth Index.
Market Environment
Changes in market sentiment, driven largely by uncertainty over the outcome of trade negotiations between the United States and China, contributed to periodic bouts of volatility during the reporting period. The global economy decelerated, led by weakness in China and Europe.
The deteriorating global growth backdrop, along with declining inflationary pressures, prompted the US Federal Reserve to cut interest rates for the first time in over a decade at the end of July, which, combined with a more dovish posture beginning in early 2019, resulted in a sharp decline in long-term interest rates during the period’s second half, inverting portions of the US Treasury yield curve. Consequently, markets anticipate additional rate cuts in the coming quarters.
Globally, central banks have tilted more dovish as well, with China lowering reserve requirements, the Bank of Canada and Bank of England holding rates steady and the European Central Bank extending alow-interest-rate refinancing facility for eurozone banks to encourage the continued flow of credit. The ECB also indicated that it would likely lower rates further and possibly resume asset purchases this fall.
Emerging markets experienced considerable volatility earlier in the period (through the end of 2018) as tighter global financial conditions exposed structural weakness in some countries. Those conditions improved in 2019 as the Fed became more dovish, but diminished hopes for a trade deal between the US and China weighed on sentiment. Idiosyncratic factors negatively impacted some emerging economies, such as Argentina and Turkey.
From a geopolitical perspective, uncertainty over Brexit remains high. British Prime Minister Boris Johnson has shown a willingness to leave the European Union on October 31, 2019, without a withdrawal agreement, although Parliament has taken steps to prevent the United Kingdom from leaving the EU without a deal. The combination of Brexit uncertainty and the deteriorating outlook for global trade has damaged business confidence and hampered investment.
Contributors to Performance
Stock selection in both thehealth care andindustrials sectors contributed to performance relative to the Russell 2000® Growth Index. Within thehealth care sector, the timing of the fund’s overweight position in precision oncology company Guardant Health, as well as holding shares of medical and surgical equipment manufacturer STERIS (b) and global medical technology company Masimo (b), lifted relative returns. Shares of Guardant Health advanced on the back of better-than-expected revenue from its clinical and biopharma segments and favorable guidance from management.
3
Management Review – continued
Although stock selection in theindustrials sector was a positive factor for relative performance, there were no individual stocks within the sector that were among the fund’s top relative contributors during the reporting period.
Security selection and an overweight position in theinformation technology sector further benefited relative results. Within this sector, the timing of the fund’s overweight position in cloud based software provider Avalara, holding shares of technology services provider Endava (b) and an overweight position in event management and enterprise safety software developer Everbridge aided relative performance. After going public in the summer of 2018, Avalara’s stock benefited from strong customer growth, increased brand awareness and robust earnings.
Elsewhere, holding shares of child care and early education provider Bright Horizons Family Solutions (b) and financial markets clearing and data services firm TMX Group (b) (Canada), as well as overweighting shares of food product distributor Performance Food Group, supported relative returns.
The fund’s cash and/or cash equivalents position during the period was also a contributor to relative performance. Under normal market conditions, the fund strives to be fully invested and generally holds cash to buy new holdings and to provide liquidity. In a period when equity markets fell, as measured by the fund’s benchmark, holding cash benefited performance versus the benchmark, which has no cash position.
Detractors from Performance
Compared to the benchmark, not holding a position in the strong-performingutilities sector was a primary factor that weakened relative performance. There were no individual stocks within this sector that were among the fund’s top relative detractors during the reporting period.
An overweight position in thematerials sector also weighed on relative results. Notably, the fund’s overweight position in industrial coatings and pigment producer Ferro and holdings of specialty metals producer Ferroglobe (b) (United Kingdom) held back relative returns. Shares of Ferro declined over the reporting period as higher-than-expected raw materials costs, foreign exchange headwinds and a difficult macro environment weighed on the company’s financial results and led its management to lower itsfull-year guidance.
Stocks in other sectors that further hindered relative performance included not holding shares of biopharmaceutical firm Array Biopharma, global oncology company Novocure and business spend management solutions provider Coupa Software. The fund’s overweight positions in travel store operator Hudson and closeout merchandise retailer Ollie’s Bargain Outlet also dampened relative returns. The share price of Hudson came under pressure after the company reported disappointing earnings results that were negatively impacted by higher costs, disappointing duty-free sales and a challenging foreign exchange environment. Lastly, holding shares of poor-performing oil and gas
4
Management Review – continued
reservoir services company Core Laboratories (b) (Netherlands), information technology education company Pluralsight (b) and apparel retailer Levi Strauss (b) hindered relative results.
Respectfully,
Portfolio Manager(s)
Michael Grossman
| (b) | Security is not a benchmark constituent. |
The views expressed in this report are those of the portfolio manager(s) only through the end of the period of the report as stated on the cover and do not necessarily reflect the views of MFS or any other person in the MFS organization. These views are subject to change at any time based on market or other conditions, and MFS disclaims any responsibility to update such views. These views may not be relied upon as investment advice or an indication of trading intent on behalf of any MFS portfolio. References to specific securities are not recommendations of such securities, and may not be representative of any MFS portfolio’s current or future investments.
5
PERFORMANCE SUMMARYTHROUGH 8/31/19
The following chart illustrates a representative class of the fund’s historical performance in comparison to its benchmark(s). Performance results include the deduction of the maximum applicable sales charge and reflect the percentage change in net asset value, including reinvestment of dividends and capital gains distributions. The performance of other share classes will be greater than or less than that of the class depicted below. Benchmarks are unmanaged and may not be invested in directly. Benchmark returns do not reflect sales charges, commissions or expenses. (See Notes to Performance Summary.)
Performance data shown represents past performance and is no guarantee of future results. Investment return and principal value fluctuate so your shares, when sold, may be worth more or less than the original cost; current performance may be lower or higher than quoted. The performance shown does not reflect the deduction of taxes, if any, that a shareholder would pay on fund distributions or the redemption of fund shares.
Growth of a Hypothetical $10,000 Investment
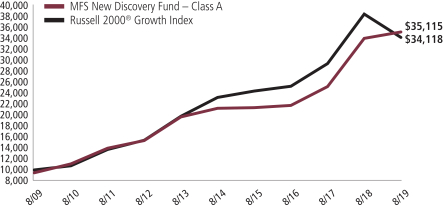
6
Performance Summary – continued
Total Returns through 8/31/19
Average annual without sales charge
| | | | | | | | | | | | | | |
| | | Share Class | | Class Inception Date | | 1-yr | | 5-yr | | 10-yr | | Life (t) | | |
| | | A | | 1/02/97 | | 3.49% | | 10.59% | | 14.06% | | N/A | | |
| | | B | | 11/03/97 | | 2.69% | | 9.77% | | 13.20% | | N/A | | |
| | | C | | 11/03/97 | | 2.72% | | 9.76% | | 13.20% | | N/A | | |
| | | I | | 1/02/97 | | 3.76% | | 10.87% | | 14.34% | | N/A | | |
| | | R1 | | 4/01/05 | | 2.67% | | 9.76% | | 13.20% | | N/A | | |
| | | R2 | | 10/31/03 | | 3.22% | | 10.31% | | 13.76% | | N/A | | |
| | | R3 | | 4/01/05 | | 3.45% | | 10.58% | | 14.04% | | N/A | | |
| | | R4 | | 4/01/05 | | 3.72% | | 10.88% | | 14.34% | | N/A | | |
| | | R6 | | 6/01/12 | | 3.85% | | 10.99% | | N/A | | 13.83% | | |
| | | | | |
| Comparative benchmark(s) | | | | | | | | | | |
| | | Russell 2000® Growth Index (f) | | (11.02)% | | 8.06% | | 13.06% | | N/A | | |
| | | | | |
| Average annual with sales charge | | | | | | | | | | |
| | | A
With Initial Sales Charge (5.75%) | | (2.46)% | | 9.29% | | 13.38% | | N/A | | |
| | | B
With CDSC (Declining over six years from 4% to 0%) (v) | | (0.39)% | | 9.51% | | 13.20% | | N/A | | |
| | | C
With CDSC (1% for 12 months) (v) | | 1.95% | | 9.76% | | 13.20% | | N/A | | |
CDSC – Contingent Deferred Sales Charge.
Class I, R1, R2, R3, R4, and R6 shares do not have a sales charge.
| (f) | Source: FactSet Research Systems Inc. |
| (t) | For the period from the class inception date through the stated period end (for those share classes with less than 10 years of performance history). No comparative benchmark performance information is provided for “life” periods. (See Notes to Performance Summary.) |
| (v) | Assuming redemption at the end of the applicable period. |
Benchmark Definition(s)
Russell 2000® Growth Index – constructed to provide a comprehensive barometer for growth securities in the small-cap segment of the U.S. equity universe. Companies in this index generally have higher price-to-book ratios and higher forecasted growth values. The Russell 2000® Growth Index is a trademark/service mark of the Frank Russell Company. Russell® is a trademark of the Frank Russell Company.
It is not possible to invest directly in an index.
Notes to Performance Summary
Average annual total return represents the average annual change in value for each share class for the periods presented. Life returns are presented where the share class has less than 10 years of performance history and represent the average annual total return from the class inception date to the stated period end date. As the fund’s share
7
Performance Summary – continued
classes may have different inception dates, the life returns may represent different time periods and may not be comparable. As a result, no comparative benchmark performance information is provided for life periods.
Performance results reflect any applicable expense subsidies and waivers in effect during the periods shown. Without such subsidies and waivers the fund’s performance results would be less favorable. Please see the prospectus and financial statements for complete details.
Performance results do not include adjustments made for financial reporting purposes in accordance with U.S. generally accepted accounting principles and may differ from amounts reported in the financial highlights.
From time to time the fund may receive proceeds from litigation settlements, without which performance would be lower.
8
EXPENSE TABLE
Fund expenses borne by the shareholders during the period, March 1, 2019 through August 31, 2019
As a shareholder of the fund, you incur two types of costs: (1) transaction costs, including sales charges (loads) on certain purchase or redemption payments, and (2) ongoing costs, including management fees; distribution and service(12b-1) fees; and other fund expenses. This example is intended to help you understand your ongoing costs (in dollars) of investing in the fund and to compare these costs with the ongoing costs of investing in other mutual funds.
The example is based on an investment of $1,000 invested at the beginning of the period and held for the entire period March 1, 2019 through August 31, 2019.
Actual Expenses
The first line for each share class in the following table provides information about actual account values and actual expenses. You may use the information in this line, together with the amount you invested, to estimate the expenses that you paid over the period. Simply divide your account value by $1,000 (for example, an $8,600 account value divided by $1,000 = 8.6), then multiply the result by the number in the first line under the heading entitled “Expenses Paid During Period” to estimate the expenses you paid on your account during this period.
Hypothetical Example for Comparison Purposes
The second line for each share class in the following table provides information about hypothetical account values and hypothetical expenses based on the fund’s actual expense ratio and an assumed rate of return of 5% per year before expenses, which is not the fund’s actual return. The hypothetical account values and expenses may not be used to estimate the actual ending account balance or expenses you paid for the period. You may use this information to compare the ongoing costs of investing in the fund and other funds. To do so, compare this 5% hypothetical example with the 5% hypothetical examples that appear in the shareholder reports of the other funds.
Please note that the expenses shown in the table are meant to highlight your ongoing costs only and do not reflect any transactional costs, such as sales charges (loads). Therefore, the second line for each share class in the table is useful in comparing ongoing costs only, and will not help you determine the relative total costs of owning different funds. In addition, if these transactional costs were included, your costs would have been higher.
9
Expense Table – continued
| | | | | | | | | | | | | | | | | | |
Share
Class | | | | Annualized
Expense Ratio | | | Beginning
Account Value
3/01/19 | | | Ending
Account Value
8/31/19 | | | Expenses Paid During
Period (p) 3/01/19-8/31/19 | |
| A | | Actual | | | 1.29% | | | | $1,000.00 | | | | $1,067.39 | | | | $6.72 | |
| | Hypothetical (h) | | | 1.29% | | | | $1,000.00 | | | | $1,018.70 | | | | $6.56 | |
| B | | Actual | | | 2.04% | | | | $1,000.00 | | | | $1,063.11 | | | | $10.61 | |
| | Hypothetical (h) | | | 2.04% | | | | $1,000.00 | | | | $1,014.92 | | | | $10.36 | |
| C | | Actual | | | 2.04% | | | | $1,000.00 | | | | $1,063.46 | | | | $10.61 | |
| | Hypothetical (h) | | | 2.04% | | | | $1,000.00 | | | | $1,014.92 | | | | $10.36 | |
| I | | Actual | | | 1.04% | | | | $1,000.00 | | | | $1,068.65 | | | | $5.42 | |
| | Hypothetical (h) | | | 1.04% | | | | $1,000.00 | | | | $1,019.96 | | | | $5.30 | |
| R1 | | Actual | | | 2.04% | | | | $1,000.00 | | | | $1,062.69 | | | | $10.61 | |
| | Hypothetical (h) | | | 2.04% | | | | $1,000.00 | | | | $1,014.92 | | | | $10.36 | |
| R2 | | Actual | | | 1.54% | | | | $1,000.00 | | | | $1,065.83 | | | | $8.02 | |
| | Hypothetical (h) | | | 1.54% | | | | $1,000.00 | | | | $1,017.44 | | | | $7.83 | |
| R3 | | Actual | | | 1.29% | | | | $1,000.00 | | | | $1,067.11 | | | | $6.72 | |
| | Hypothetical (h) | | | 1.29% | | | | $1,000.00 | | | | $1,018.70 | | | | $6.56 | |
| R4 | | Actual | | | 1.04% | | | | $1,000.00 | | | | $1,068.60 | | | | $5.42 | |
| | Hypothetical (h) | | | 1.04% | | | | $1,000.00 | | | | $1,019.96 | | | | $5.30 | |
| R6 | | Actual | | | 0.94% | | | | $1,000.00 | | | | $1,068.92 | | | | $4.90 | |
| | Hypothetical (h) | | | 0.94% | | | | $1,000.00 | | | | $1,020.47 | | | | $4.79 | |
| (h) | 5% class return per year before expenses. |
| (p) | “Expenses Paid During Period” are equal to each class’s annualized expense ratio, as shown above, multiplied by the average account value over the period, multiplied by 184/365 (to reflect theone-half year period). Expenses paid do not include any applicable sales charges (loads). If these transaction costs had been included, your costs would have been higher. |
Notes to Expense Table
Each class with a Rule12b-1 service fee is subject to a rebate of a portion of such fee. Such rebates are included in the expense ratios above. For Class A shares this rebate reduced the expense ratio above by 0.01%. See Note 3 in the Notes to Financial Statements for additional information.
10
PORTFOLIO OF INVESTMENTS
8/31/19
The Portfolio of Investments is a complete list of all securities owned by your fund. It is categorized by broad-based asset classes.
| | | | | | | | |
| Common Stocks - 96.4% | | | | | | | | |
| | |
| Issuer | | Shares/Par | | | Value ($) | |
| Aerospace - 4.1% | | | | | | | | |
| CACI International, Inc., “A” (a) | | | 95,650 | | | $ | 21,262,039 | |
| Cubic Corp. | | | 274,841 | | | | 19,038,236 | |
| FLIR Systems, Inc. | | | 373,342 | | | | 18,394,560 | |
| | | | | | | | |
| | | | | | | $ | 58,694,835 | |
| Apparel Manufacturers - 2.1% | | | | | | | | |
| Levi Strauss & Co., “A” (a) | | | 1,113,895 | | | $ | 18,824,826 | |
| Skechers USA, Inc., “A” (a) | | | 357,482 | | | | 11,317,880 | |
| | | | | | | | |
| | | | | | | $ | 30,142,706 | |
| Automotive - 4.0% | | | | | | | | |
| Hella KGaA Hueck & Co. | | | 181,624 | | | $ | 7,561,371 | |
| IAA, Inc. (a) | | | 294,288 | | | | 14,375,969 | |
| KAR Auction Services, Inc. | | | 294,288 | | | | 7,816,289 | |
| Stoneridge, Inc. (a) | | | 493,393 | | | | 15,152,099 | |
| Visteon Corp. (a) | | | 173,793 | | | | 11,986,503 | |
| | | | | | | | |
| | | | | | | $ | 56,892,231 | |
| Biotechnology - 5.7% | | | | | | | | |
| Adaptive Biotechnologies Corp. (a) | | | 198,963 | | | $ | 10,117,269 | |
| Aimmune Therapeutics, Inc. (a) | | | 313,702 | | | | 6,396,384 | |
| Alder BioPharmaceuticals, Inc. (a) | | | 678,222 | | | | 6,070,087 | |
| Amicus Therapeutics, Inc. (a) | | | 711,145 | | | | 7,033,224 | |
| Bio-Techne Corp. | | | 71,172 | | | | 13,634,420 | |
| Immunomedics, Inc. (a) | | | 298,015 | | | | 3,814,592 | |
| Morphosys AG, ADR (a)(l) | | | 300,196 | | | | 8,849,778 | |
| Neurocrine Biosciences, Inc. (a) | | | 84,636 | | | | 8,414,511 | |
| Sarepta Therapeutics, Inc. (a) | | | 39,462 | | | | 3,557,499 | |
| Tricida, Inc. (a) | | | 202,940 | | | | 7,080,577 | |
| Twist Bioscience Corp. (a) | | | 240,775 | | | | 6,989,698 | |
| | | | | | | | |
| | | | | | | $ | 81,958,039 | |
| Brokerage & Asset Managers - 3.2% | | | | | | | | |
| Hamilton Lane, Inc., “A” | | | 295,813 | | | $ | 18,381,820 | |
| TMX Group Ltd. | | | 237,305 | | | | 20,552,531 | |
| WisdomTree Investments, Inc. | | | 1,331,260 | | | | 6,403,360 | |
| | | | | | | | |
| | | | | | | $ | 45,337,711 | |
| Business Services - 4.2% | | | | | | | | |
| Endava PLC, ADR (a) | | | 455,432 | | | $ | 17,119,689 | |
| EVO Payments, Inc., “A” (a) | | | 310,244 | | | | 9,208,042 | |
11
Portfolio of Investments – continued
| | | | | | | | |
| | |
| Issuer | | Shares/Par | | | Value ($) | |
| Common Stocks - continued | | | | | | | | |
| Business Services - continued | | | | | | | | |
| TriNet Group, Inc. (a) | | | 198,408 | | | $ | 13,319,129 | |
| WNS (Holdings) Ltd., ADR (a) | | | 340,187 | | | | 20,676,566 | |
| | | | | | | | |
| | | | | | | $ | 60,323,426 | |
| Chemicals - 1.0% | | | | | | | | |
| Ingevity Corp. (a) | | | 184,869 | | | $ | 14,081,472 | |
| | |
| Computer Software - 7.2% | | | | | | | | |
| Avalara, Inc. (a) | | | 150,066 | | | $ | 12,656,566 | |
| DocuSign, Inc. (a) | | | 312,610 | | | | 14,595,761 | |
| Everbridge, Inc. (a) | | | 236,821 | | | | 20,413,970 | |
| Pagerduty, Inc. (a) | | | 243,167 | | | | 9,549,168 | |
| Paylocity Holding Corp. (a) | | | 148,427 | | | | 16,211,197 | |
| Phreesia, Inc. (a) | | | 257,367 | | | | 6,889,715 | |
| RingCentral, Inc. (a) | | | 68,610 | | | | 9,682,929 | |
| Zendesk, Inc. (a) | | | 168,084 | | | | 13,480,337 | |
| | | | | | | | |
| | | | | | | $ | 103,479,643 | |
| Computer Software - Systems - 6.5% | | | | | | | | |
| Box, Inc., “A” (a) | | | 740,684 | | | $ | 10,836,207 | |
| Five9, Inc. (a) | | | 111,041 | | | | 7,018,902 | |
| Pluralsight, Inc., “A” (a) | | | 779,906 | | | | 12,556,486 | |
| Proofpoint, Inc. (a) | | | 95,113 | | | | 10,805,788 | |
| Q2 Holdings, Inc. (a) | | | 209,681 | | | | 18,860,806 | |
| Rapid7, Inc. (a) | | | 356,206 | | | | 19,124,700 | |
| RealPage, Inc. (a) | | | 212,009 | | | | 13,498,613 | |
| | | | | | | | |
| | | | | | | $ | 92,701,502 | |
| Construction - 2.1% | | | | | | | | |
| Summit Materials, Inc., “A” (a) | | | 610,475 | | | $ | 12,807,766 | |
| Trex Co., Inc. (a) | | | 198,233 | | | | 16,954,868 | |
| | | | | | | | |
| | | | | | | $ | 29,762,634 | |
| Consumer Services - 5.1% | | | | | | | | |
| Bright Horizons Family Solutions, Inc. (a) | | | 135,323 | | | $ | 22,335,061 | |
| MakeMyTrip Ltd. (a) | | | 611,074 | | | | 14,036,370 | |
| OneSpaWorld Holdings Ltd. (a)(l) | | | 1,033,703 | | | | 16,229,137 | |
| Planet Fitness, Inc. (a) | | | 288,813 | | | | 20,393,086 | |
| | | | | | | | |
| | | | | | | $ | 72,993,654 | |
| Electrical Equipment - 3.4% | | | | | | | | |
| CTS Corp. | | | 262,530 | | | $ | 7,489,981 | |
| Evoqua Water Technologies LLC (a) | | | 526,573 | | | | 8,140,818 | |
| Generac Holdings, Inc. (a) | | | 262,836 | | | | 20,498,580 | |
12
Portfolio of Investments – continued
| | | | | | | | |
| | |
| Issuer | | Shares/Par | | | Value ($) | |
| Common Stocks - continued | | | | | | | | |
| Electrical Equipment - continued | | | | | | | | |
| Littlefuse, Inc. | | | 83,199 | | | $ | 12,984,868 | |
| | | | | | | | |
| | | | | | | $ | 49,114,247 | |
| Electronics - 2.1% | | | | | | | | |
| Brooks Automation, Inc. | | | 179,631 | | | $ | 5,987,101 | |
| Monolithic Power Systems, Inc. | | | 57,855 | | | | 8,710,649 | |
| nLIGHT, Inc. (a) | | | 394,855 | | | | 5,101,527 | |
| Silicon Laboratories, Inc. (a) | | | 87,431 | | | | 9,529,979 | |
| | | | | | | | |
| | | | | | | $ | 29,329,256 | |
| Entertainment - 2.5% | | | | | | | | |
| CTS Eventim AG | | | 254,253 | | | $ | 13,915,946 | |
| Live Nation, Inc. (a) | | | 107,829 | | | | 7,495,194 | |
| Manchester United PLC, “A” | | | 831,399 | | | | 14,216,923 | |
| | | | | | | | |
| | | | | | | $ | 35,628,063 | |
| Food & Drug Stores - 1.1% | | | | | | | | |
| Grocery Outlet Holding Corp. (a) | | | 378,191 | | | $ | 15,297,826 | |
| | |
| Gaming & Lodging - 1.0% | | | | | | | | |
| Wyndham Hotels Group LLC | | | 282,560 | | | $ | 14,517,933 | |
| | |
| General Merchandise - 0.9% | | | | | | | | |
| Ollie’s Bargain Outlet Holdings, Inc. (a) | | | 239,008 | | | $ | 13,252,993 | |
| | |
| Internet - 0.8% | | | | | | | | |
| CarGurus, Inc. (a) | | | 357,366 | | | $ | 11,657,279 | |
| | |
| Leisure & Toys - 1.1% | | | | | | | | |
| Funko, Inc., “A” (a)(l) | | | 629,723 | | | $ | 15,107,055 | |
| | |
| Machinery & Tools - 0.9% | | | | | | | | |
| Ritchie Bros. Auctioneers, Inc. | | | 305,788 | | | $ | 12,093,915 | |
| | |
| Medical & Health Technology & Services - 5.9% | | | | | | | | |
| Charles River Laboratories International, Inc. (a) | | | 146,433 | | | $ | 19,212,010 | |
| Guardant Health, Inc. (a) | | | 95,715 | | | | 8,377,934 | |
| HealthEquity, Inc. (a) | | | 153,640 | | | | 9,120,070 | |
| ICON PLC (a) | | | 124,940 | | | | 19,264,499 | |
| PRA Health Sciences, Inc. (a) | | | 40,928 | | | | 4,045,323 | |
| Syneos Health, Inc. (a) | | | 208,469 | | | | 10,950,877 | |
| Teladoc Health, Inc. (a)(l) | | | 242,975 | | | | 14,063,393 | |
| | | | | | | | |
| | | | | | | $ | 85,034,106 | |
13
Portfolio of Investments – continued
| | | | | | | | |
| | |
| Issuer | | Shares/Par | | | Value ($) | |
| Common Stocks - continued | | | | | | | | |
| Medical Equipment - 10.4% | | | | | | | | |
| Inspire Medical Systems, Inc. (a) | | | 109,856 | | | $ | 7,636,091 | |
| iRhythm Technologies, Inc. (a) | | | 140,851 | | | | 10,721,578 | |
| Masimo Corp. (a) | | | 111,497 | | | | 17,086,915 | |
| Merit Medical Systems, Inc. (a) | | | 335,329 | | | | 11,662,743 | |
| Mesa Laboratories, Inc. | | | 23,343 | | | | 5,164,172 | |
| Nevro Corp. (a) | | | 127,965 | | | | 10,714,509 | |
| OptiNose, Inc. (a)(l) | | | 664,356 | | | | 5,088,967 | |
| OrthoPediatrics Corp. (a) | | | 427,235 | | | | 13,752,695 | |
| PerkinElmer, Inc. | | | 149,727 | | | | 12,382,423 | |
| Quidel Corp. (a) | | | 203,245 | | | | 12,814,597 | |
| Silk Road Medical, Inc. (a) | | | 175,679 | | | | 7,570,008 | |
| STERIS PLC | | | 73,881 | | | | 11,407,226 | |
| TransMedics Group, Inc. (a) | | | 236,061 | | | | 5,653,661 | |
| West Pharmaceutical Services, Inc. | | | 120,877 | | | | 17,582,768 | |
| | | | | | | | |
| | | | | | | $ | 149,238,353 | |
| Network & Telecom - 1.3% | | | | | | | | |
| Interxion Holding N.V. (a) | | | 235,838 | | | $ | 19,088,728 | |
| | |
| Oil Services - 1.3% | | | | | | | | |
| Core Laboratories N.V. | | | 319,119 | | | $ | 12,633,921 | |
| Patterson-UTI Energy, Inc. | | | 704,136 | | | | 6,090,776 | |
| | | | | | | | |
| | | | | | | $ | 18,724,697 | |
| Other Banks & Diversified Financials - 4.0% | | | | | | | | |
| Bank OZK | | | 245,538 | | | $ | 6,334,880 | |
| LegacyTexas Financial Group, Inc. | | | 333,665 | | | | 13,480,066 | |
| Signature Bank | | | 81,468 | | | | 9,503,242 | |
| Texas Capital Bancshares, Inc. (a) | | | 245,517 | | | | 13,228,456 | |
| Wintrust Financial Corp. | | | 229,761 | | | | 14,435,884 | |
| | | | | | | | |
| | | | | | | $ | 56,982,528 | |
| Pharmaceuticals - 2.3% | | | | | | | | |
| Aquestive Therapeutics, Inc. (a) | | | 300,541 | | | $ | 1,142,056 | |
| BridgeBio Pharma, Inc. (a) | | | 202,345 | | | | 6,167,476 | |
| Collegium Pharmaceutical, Inc. (a) | | | 373,235 | | | | 4,322,061 | |
| Forty Seven, Inc. (a) | | | 197,921 | | | | 1,500,241 | |
| GW Pharmaceuticals PLC, ADR (a)(l) | | | 54,779 | | | | 7,801,077 | |
| Orchard RX Ltd., ADR (a) | | | 321,588 | | | | 4,759,503 | |
| Principia Biopharma, Inc. (a) | | | 171,800 | | | | 6,820,460 | |
| | | | | | | | |
| | | | | | | $ | 32,512,874 | |
| Railroad & Shipping - 0.2% | | | | | | | | |
| StealthGas, Inc. (a) | | | 1,008,631 | | | $ | 3,177,188 | |
14
Portfolio of Investments – continued
| | | | | | | | |
| | |
| Issuer | | Shares/Par | | | Value ($) | |
| Common Stocks - continued | | | | | | | | |
| Real Estate - 3.2% | | | | | | | | |
| Big Yellow Group PLC, REIT | | | 686,100 | | | $ | 8,932,855 | |
| Industrial Logistics Properties Trust, REIT | | | 843,460 | | | | 18,041,609 | |
| STAG Industrial, Inc., REIT | | | 633,966 | | | | 18,435,731 | |
| | | | | | | | |
| | | | | | | $ | 45,410,195 | |
| Restaurants - 1.6% | | | | | | | | |
| Performance Food Group Co. (a) | | | 484,693 | | | $ | 22,678,785 | |
| | |
| Special Products & Services - 1.2% | | | | | | | | |
| Boyd Group Income Fund, IEU | | | 126,572 | | | $ | 16,933,307 | |
| | |
| Specialty Chemicals - 4.0% | | | | | | | | |
| Axalta Coating Systems Ltd. (a) | | | 704,734 | | | $ | 20,352,718 | |
| Ferro Corp. (a) | | | 1,416,239 | | | | 14,431,475 | |
| Ferroglobe PLC | | | 1,020,417 | | | | 1,336,746 | |
| RPM International, Inc. | | | 162,525 | | | | 10,998,067 | |
| Univar, Inc. (a) | | | 545,272 | | | | 10,551,013 | |
| | | | | | | | |
| | | | | | | $ | 57,670,019 | |
| Specialty Stores - 1.2% | | | | | | | | |
| Chewy, Inc., “A” (a) | | | 170,529 | | | $ | 5,627,457 | |
| Hudson Ltd., “A” (a) | | | 1,100,571 | | | | 11,941,195 | |
| | | | | | | | |
| | | | | | | $ | 17,568,652 | |
| Trucking - 0.8% | | | | | | | | |
| Schneider National, Inc. | | | 610,266 | | | $ | 11,863,571 | |
| Total Common Stocks (Identified Cost, $1,140,158,820) | | | | | | $ | 1,379,249,423 | |
| | |
| Investment Companies (h) - 3.4% | | | | | | | | |
| Money Market Funds - 3.4% | | | | | | | | |
MFS Institutional Money Market Portfolio, 2.17% (v)
(Identified Cost, $48,495,729) | | | 48,500,270 | | | $ | 48,505,120 | |
| | |
| Collateral for Securities Loaned - 0.4% | | | | | | | | |
| State Street Navigator Securities Lending Government Money Market Portfolio, 2.12% (j) (Identified Cost, $5,985,100) | | | 5,985,100 | | | $ | 5,985,100 | |
| | |
| Other Assets, Less Liabilities - (0.2)% | | | | | | | (2,282,355 | ) |
| Net Assets - 100.0% | | | | | | $ | 1,431,457,288 | |
| (a) | Non-income producing security. |
| (h) | An affiliated issuer, which may be considered one in which the fund owns 5% or more of the outstanding voting securities, or a company which is under common control. At period end, the aggregate values of the fund’s investments in affiliated issuers and in unaffiliated issuers were $48,505,120 and $1,385,234,523, respectively. |
15
Portfolio of Investments – continued
| (j) | The rate quoted is the annualizedseven-day yield of the fund at period end. |
| (l) | A portion of this security is on loan. See Note 2 for additional information. |
| (v) | Affiliated issuer that is available only to investment companies managed by MFS. The rate quoted for the MFS Institutional Money Market Portfolio is the annualizedseven-day yield of the fund at period end. |
The following abbreviations are used in this report and are defined:
| ADR | | American Depositary Receipt |
| IEU | | International Equity Unit |
| REIT | | Real Estate Investment Trust |
See Notes to Financial Statements
16
Financial Statements
STATEMENT OF ASSETS AND LIABILITIES
At 8/31/19
This statement represents your fund’s balance sheet, which details the assets and liabilities comprising the total value of the fund.
| | | | |
| Assets | | | | |
Investments in unaffiliated issuers, at value, including $21,799,402 of securities on loan (identified cost, $1,146,143,920) | | | $1,385,234,523 | |
Investments in affiliated issuers, at value (identified cost, $48,495,729) | | | 48,505,120 | |
Cash | | | 220,606 | |
Receivables for | | | | |
Investments sold | | | 11,011,132 | |
Fund shares sold | | | 3,190,358 | |
Interest and dividends | | | 433,340 | |
Other assets | | | 1,154 | |
Total assets | | | $1,448,596,233 | |
| |
| Liabilities | | | | |
Payables for | | | | |
Investments purchased | | | $9,159,662 | |
Fund shares reacquired | | | 1,340,129 | |
Collateral for securities loaned, at value (c) | | | 5,985,100 | |
Payable to affiliates | | | | |
Investment adviser | | | 100,834 | |
Administrative services fee | | | 1,648 | |
Shareholder servicing costs | | | 351,334 | |
Distribution and service fees | | | 17,567 | |
Payable for independent Trustees’ compensation | | | 1,337 | |
Accrued expenses and other liabilities | | | 181,334 | |
Total liabilities | | | $17,138,945 | |
Net assets | | | $1,431,457,288 | |
| |
| Net assets consist of | | | | |
Paid-in capital | | | $1,093,396,809 | |
Total distributable earnings (loss) | | | 338,060,479 | |
Net assets | | | $1,431,457,288 | |
Shares of beneficial interest outstanding | | | 49,762,654 | |
| (c) | Non-cash collateral is not included. |
17
Statement of Assets and Liabilities – continued
| | | | | | | | | | | | |
| | | |
| | | Net assets | | | Shares
outstanding | | | Net asset value
per share (a) | |
| Class A | | | $549,660,296 | | | | 19,945,441 | | | | $27.56 | |
| Class B | | | 18,708,015 | | | | 902,836 | | | | 20.72 | |
| Class C | | | 59,252,624 | | | | 2,851,736 | | | | 20.78 | |
| Class I | | | 164,593,463 | | | | 5,260,699 | | | | 31.29 | |
| Class R1 | | | 4,651,748 | | | | 226,753 | | | | 20.51 | |
| Class R2 | | | 32,381,302 | | | | 1,273,631 | | | | 25.42 | |
| Class R3 | | | 52,559,476 | | | | 1,910,276 | | | | 27.51 | |
| Class R4 | | | 8,384,254 | | | | 284,764 | | | | 29.44 | |
| Class R6 | | | 541,266,110 | | | | 17,106,518 | | | | 31.64 | |
| (a) | Maximum offering price per share was equal to the net asset value per share for all share classes, except for Class A, for which the maximum offering price per share was $29.24 [100 / 94.25 x $27.56]. On sales of $50,000 or more, the maximum offering price of Class A shares is reduced. A contingent deferred sales charge may be imposed on redemptions of Class A, Class B, and Class C shares. Redemption price per share was equal to the net asset value per share for Classes I, R1, R2, R3, R4, and R6. |
See Notes to Financial Statements
18
Financial Statements
STATEMENT OF OPERATIONS
Year ended 8/31/19
This statement describes how much your fund earned in investment income and accrued in expenses. It also describes any gains and/or losses generated by fund operations.
| | | | |
| Net investment income (loss) | | | | |
Income | | | | |
Dividends | | | $6,733,788 | |
Dividends from affiliated issuers | | | 1,034,192 | |
Income on securities loaned | | | 134,054 | |
Other | | | 119,643 | |
Foreign taxes withheld | | | (225,993 | ) |
Total investment income | | | $7,795,684 | |
Expenses | | | | |
Management fee | | | $11,499,169 | |
Distribution and service fees | | | 2,372,822 | |
Shareholder servicing costs | | | 1,133,752 | |
Administrative services fee | | | 186,090 | |
Independent Trustees’ compensation | | | 25,926 | |
Custodian fee | | | 108,700 | |
Shareholder communications | | | 122,672 | |
Audit and tax fees | | | 57,468 | |
Legal fees | | | 12,377 | |
Miscellaneous | | | 219,100 | |
Total expenses | | | $15,738,076 | |
Reduction of expenses by investment adviser and distributor | | | (157,111 | ) |
Net expenses | | | $15,580,965 | |
Net investment income (loss) | | | $(7,785,281 | ) |
| |
| Realized and unrealized gain (loss) | | | | |
Realized gain (loss) (identified cost basis) | | | | |
Unaffiliated issuers | | | $164,306,669 | |
Affiliated issuers | | | 577 | |
Foreign currency | | | (2,261 | ) |
Net realized gain (loss) | | | $164,304,985 | |
Change in unrealized appreciation or depreciation | | | | |
Unaffiliated issuers | | | $(111,645,705 | ) |
Affiliated issuers | | | 1,424 | |
Translation of assets and liabilities in foreign currencies | | | (2,685 | ) |
Net unrealized gain (loss) | | | $(111,646,966 | ) |
Net realized and unrealized gain (loss) | | | $52,658,019 | |
Change in net assets from operations | | | $44,872,738 | |
See Notes to Financial Statements
19
Financial Statements
STATEMENTS OF CHANGES IN NET ASSETS
These statements describe the increases and/or decreases in net assets resulting from operations, any distributions, and any shareholder transactions.
| | | | | | | | |
| | | Year ended | |
| | | 8/31/19 | | | 8/31/18 | |
| Change in net assets | | | | | | |
| | |
| From operations | | | | | | | | |
Net investment income (loss) | | | $(7,785,281 | ) | | | $(8,559,359 | ) |
Net realized gain (loss) | | | 164,304,985 | | | | 249,291,803 | |
Net unrealized gain (loss) | | | (111,646,966 | ) | | | 126,094,358 | |
Change in net assets from operations | | | $44,872,738 | | | | $366,826,802 | |
Total distributions to shareholders (a) | | | $(230,450,032 | ) | | | $(110,787,326 | ) |
Change in net assets from fund share transactions | | | $236,885,028 | | | | $(26,394,220 | ) |
Total change in net assets | | | $51,307,734 | | | | $229,645,256 | |
| | |
| Net assets | | | | | | | | |
At beginning of period | | | 1,380,149,554 | | | | 1,150,504,298 | |
At end of period (b) | | | $1,431,457,288 | | | | $1,380,149,554 | |
| (a) | Distributions from net investment income and from net realized gain are no longer required to be separately disclosed. For the year ended August 31, 2018, distributions from net realized gain were $110,787,326. |
| (b) | Parenthetical disclosure of accumulated net investment loss is no longer required. For the year ended August 31, 2018, end of period net assets included accumulated net investment loss of $1,660. |
See Notes to Financial Statements
20
Financial Statements
FINANCIAL HIGHLIGHTS
The financial highlights table is intended to help you understand the fund’s financial performance for the past 5 years. Certain information reflects financial results for a single fund share. The total returns in the table represent the rate that an investor would have earned (or lost) on an investment in the fund share class (assuming reinvestment of all distributions) held for the entire period.
| | | | | | | | | | | | | | | | | | | | |
| Class A | | Year ended | |
| | | | | |
| | | 8/31/19 | | | 8/31/18 | | | 8/31/17 | | | 8/31/16 | | | 8/31/15 | |
Net asset value, beginning of period | | | $33.30 | | | | $27.27 | | | | $24.11 | | | | $23.69 | | | | $25.49 | |
| | | | |
| Income (loss) from investment operations | | | | | | | | | | | | | | | | | |
Net investment income (loss) (d) | | | $(0.19 | ) | | | $(0.23 | ) | | | $(0.18 | )(c) | | | $(0.11 | ) | | | $(0.20 | ) |
Net realized and unrealized gain (loss) | | | 0.06 | (g) | | | 9.07 | | | | 3.92 | | | | 0.53 | | | | 0.22 | |
Total from investment operations | | | $(0.13 | ) | | | $8.84 | | | | $3.74 | | | | $0.42 | | | | $0.02 | |
| | | | |
| Less distributions declared to shareholders | | | | | | | | | | | | | | | | | |
From net realized gain | | | $(5.61 | ) | | | $(2.81 | ) | | | $(0.58 | ) | | | $— | | | | $(1.82 | ) |
Net asset value, end of period (x) | | | $27.56 | | | | $33.30 | | | | $27.27 | | | | $24.11 | | | | $23.69 | |
Total return (%) (r)(s)(t)(x) | | | 3.49 | | | | 34.98 | | | | 15.83 | (c) | | | 1.77 | | | | 0.47 | |
| | | | |
Ratios (%) (to average net assets)
and Supplemental data: | | | | | | | | | | | | | | | | | |
Expenses before expense reductions (f) | | | 1.30 | | | | 1.33 | | | | 1.35 | (c) | | | 1.36 | | | | 1.36 | |
Expenses after expense reductions (f) | | | 1.29 | | | | 1.31 | | | | 1.33 | (c) | | | 1.34 | | | | 1.31 | |
Net investment income (loss) | | | (0.70 | ) | | | (0.80 | ) | | | (0.70 | )(c) | | | (0.50 | ) | | | (0.81 | ) |
Portfolio turnover | | | 69 | | | | 67 | | | | 53 | | | | 49 | | | | 56 | |
Net assets at end of period (000 omitted) | | | $549,660 | | | | $525,698 | | | | $394,878 | | | | $400,997 | | | | $457,437 | |
See Notes to Financial Statements
21
Financial Highlights – continued
| | | | | | | | | | | | | | | | | | | | |
| Class B | | Year ended | |
| | | | | |
| | | 8/31/19 | | | 8/31/18 | | | 8/31/17 | | | 8/31/16 | | | 8/31/15 | |
Net asset value, beginning of period | | | $26.86 | | | | $22.65 | | | | $20.27 | | | | $20.07 | | | | $22.04 | |
| | | | |
| Income (loss) from investment operations | | | | | | | | | | | | | | | | | |
Net investment income (loss) (d) | | | $(0.30 | ) | | | $(0.37 | ) | | | $(0.30 | )(c) | | | $(0.24 | ) | | | $(0.32 | ) |
Net realized and unrealized gain (loss) | | | (0.23 | )(g) | | | 7.39 | | | | 3.26 | | | | 0.44 | | | | 0.17 | |
Total from investment operations | | | $(0.53 | ) | | | $7.02 | | | | $2.96 | | | | $0.20 | | | | $(0.15 | ) |
| | | | |
| Less distributions declared to shareholders | | | | | | | | | | | | | | | | | |
From net realized gain | | | $(5.61 | ) | | | $(2.81 | ) | | | $(0.58 | ) | | | $— | | | | $(1.82 | ) |
Net asset value, end of period (x) | | | $20.72 | | | | $26.86 | | | | $22.65 | | | | $20.27 | | | | $20.07 | |
Total return (%) (r)(s)(t)(x) | | | 2.69 | | | | 34.00 | | | | 14.97 | (c) | | | 1.00 | | | | (0.27 | ) |
| | | | |
Ratios (%) (to average net assets)
and Supplemental data: | | | | | | | | | | | | | | | | | |
Expenses before expense reductions (f) | | | 2.06 | | | | 2.08 | | | | 2.10 | (c) | | | 2.11 | | | | 2.11 | |
Expenses after expense reductions (f) | | | 2.04 | | | | 2.06 | | | | 2.08 | (c) | | | 2.09 | | | | 2.06 | |
Net investment income (loss) | | | (1.45 | ) | | | (1.55 | ) | | | (1.45 | )(c) | | | (1.26 | ) | | | (1.57 | ) |
Portfolio turnover | | | 69 | | | | 67 | | | | 53 | | | | 49 | | | | 56 | |
Net assets at end of period (000 omitted) | | | $18,708 | | | | $23,424 | | | | $20,143 | | | | $22,906 | | | | $27,455 | |
| |
| Class C | | Year ended | |
| | | | | |
| | | 8/31/19 | | | 8/31/18 | | | 8/31/17 | | | 8/31/16 | | | 8/31/15 | |
Net asset value, beginning of period | | | $26.91 | | | | $22.70 | | | | $20.31 | | | | $20.11 | | | | $22.08 | |
| | | | |
| Income (loss) from investment operations | | | | | | | | | | | | | | | | | |
Net investment income (loss) (d) | | | $(0.30 | ) | | | $(0.37 | ) | | | $(0.31 | )(c) | | | $(0.24 | ) | | | $(0.32 | ) |
Net realized and unrealized gain (loss) | | | (0.22 | )(g) | | | 7.39 | | | | 3.28 | | | | 0.44 | | | | 0.17 | |
Total from investment operations | | | $(0.52 | ) | | | $7.02 | | | | $2.97 | | | | $0.20 | | | | $(0.15 | ) |
| | | | |
| Less distributions declared to shareholders | | | | | | | | | | | | | | | | | |
From net realized gain | | | $(5.61 | ) | | | $(2.81 | ) | | | $(0.58 | ) | | | $— | | | | $(1.82 | ) |
Net asset value, end of period (x) | | | $20.78 | | | | $26.91 | | | | $22.70 | | | | $20.31 | | | | $20.11 | |
Total return (%) (r)(s)(t)(x) | | | 2.72 | | | | 33.92 | | | | 14.99 | (c) | | | 0.99 | | | | (0.28 | ) |
| | | | |
Ratios (%) (to average net assets)
and Supplemental data: | | | | | | | | | | | | | | | | | |
Expenses before expense reductions (f) | | | 2.05 | | | | 2.08 | | | | 2.10 | (c) | | | 2.11 | | | | 2.11 | |
Expenses after expense reductions (f) | | | 2.04 | | | | 2.07 | | | | 2.09 | (c) | | | 2.09 | | | | 2.06 | |
Net investment income (loss) | | | (1.45 | ) | | | (1.55 | ) | | | (1.45 | )(c) | | | (1.27 | ) | | | (1.57 | ) |
Portfolio turnover | | | 69 | | | | 67 | | | | 53 | | | | 49 | | | | 56 | |
Net assets at end of period (000 omitted) | | | $59,253 | | | | $69,498 | | | | $76,724 | | | | $85,370 | | | | $105,686 | |
See Notes to Financial Statements
22
Financial Highlights – continued
| | | | | | | | | | | | | | | | | | | | |
| Class I | | Year ended | |
| | | | | |
| | | 8/31/19 | | | 8/31/18 | | | 8/31/17 | | | 8/31/16 | | | 8/31/15 | |
Net asset value, beginning of period | | | $36.82 | | | | $29.81 | | | | $26.24 | | | | $25.72 | | | | $27.44 | |
| | | | |
| Income (loss) from investment operations | | | | | | | | | | | | | | | | | |
Net investment income (loss) (d) | | | $(0.14 | ) | | | $(0.18 | ) | | | $(0.12 | )(c) | | | $(0.07 | ) | | | $(0.14 | ) |
Net realized and unrealized gain (loss) | | | 0.22 | (g) | | | 10.00 | | | | 4.27 | | | | 0.59 | | | | 0.24 | |
Total from investment operations | | | $0.08 | | | | $9.82 | | | | $4.15 | | | | $0.52 | | | | $0.10 | |
| | | | |
| Less distributions declared to shareholders | | | | | | | | | | | | | | | | | |
From net realized gain | | | $(5.61 | ) | | | $(2.81 | ) | | | $(0.58 | ) | | | $— | | | | $(1.82 | ) |
Net asset value, end of period (x) | | | $31.29 | | | | $36.82 | | | | $29.81 | | | | $26.24 | | | | $25.72 | |
Total return (%) (r)(s)(t)(x) | | | 3.76 | | | | 35.31 | | | | 16.12 | (c) | | | 2.02 | | | | 0.74 | |
| | | | |
Ratios (%) (to average net assets)
and Supplemental data: | | | | | | | | | | | | | | | | | |
Expenses before expense reductions (f) | | | 1.05 | | | | 1.08 | | | | 1.10 | (c) | | | 1.12 | | | | 1.11 | |
Expenses after expense reductions (f) | | | 1.05 | | | | 1.07 | | | | 1.09 | (c) | | | 1.09 | | | | 1.06 | |
Net investment income (loss) | | | (0.45 | ) | | | (0.55 | ) | | | (0.45 | )(c) | | | (0.30 | ) | | | (0.55 | ) |
Portfolio turnover | | | 69 | | | | 67 | | | | 53 | | | | 49 | | | | 56 | |
Net assets at end of period (000 omitted) | | | $164,593 | | | | $180,591 | | | | $106,459 | | | | $101,635 | | | | $166,513 | |
| |
| Class R1 | | Year ended | |
| | | | | |
| | | 8/31/19 | | | 8/31/18 | | | 8/31/17 | | | 8/31/16 | | | 8/31/15 | |
Net asset value, beginning of period | | | $26.66 | | | | $22.50 | | | | $20.15 | | | | $19.94 | | | | $21.91 | |
| | | | |
| Income (loss) from investment operations | | | | | | | | | | | | | | | | | |
Net investment income (loss) (d) | | | $(0.30 | ) | | | $(0.37 | ) | | | $(0.30 | )(c) | | | $(0.23 | ) | | | $(0.32 | ) |
Net realized and unrealized gain (loss) | | | (0.24 | )(g) | | | 7.34 | | | | 3.23 | | | | 0.44 | | | | 0.17 | |
Total from investment operations | | | $(0.54 | ) | | | $6.97 | | | | $2.93 | | | | $0.21 | | | | $(0.15 | ) |
| | | | |
| Less distributions declared to shareholders | | | | | | | | | | | | | | | | | |
From net realized gain | | | $(5.61 | ) | | | $(2.81 | ) | | | $(0.58 | ) | | | $— | | | | $(1.82 | ) |
Net asset value, end of period (x) | | | $20.51 | | | | $26.66 | | | | $22.50 | | | | $20.15 | | | | $19.94 | |
Total return (%) (r)(s)(t)(x) | | | 2.67 | | | | 34.01 | | | | 14.91 | (c) | | | 1.05 | | | | (0.28 | ) |
| | | | |
Ratios (%) (to average net assets)
and Supplemental data: | | | | | | | | | | | | | | | | | |
Expenses before expense reductions (f) | | | 2.05 | | | | 2.08 | | | | 2.10 | (c) | | | 2.11 | | | | 2.11 | |
Expenses after expense reductions (f) | | | 2.05 | | | | 2.07 | | | | 2.09 | (c) | | | 2.09 | | | | 2.06 | |
Net investment income (loss) | | | (1.45 | ) | | | (1.55 | ) | | | (1.45 | )(c) | | | (1.26 | ) | | | (1.57 | ) |
Portfolio turnover | | | 69 | | | | 67 | | | | 53 | | | | 49 | | | | 56 | |
Net assets at end of period (000 omitted) | | | $4,652 | | | | $5,342 | | | | $4,377 | | | | $5,647 | | | | $6,573 | |
See Notes to Financial Statements
23
Financial Highlights – continued
| | | | | | | | | | | | | | | | | | | | |
| Class R2 | | Year ended | |
| | | | | |
| | | 8/31/19 | | | 8/31/18 | | | 8/31/17 | | | 8/31/16 | | | 8/31/15 | |
Net asset value, beginning of period | | | $31.31 | | | | $25.85 | | | | $22.95 | | | | $22.60 | | | | $24.46 | |
| | | | |
| Income (loss) from investment operations | | | | | | | | | | | | | | | | | |
Net investment income (loss) (d) | | | $(0.24 | ) | | | $(0.29 | ) | | | $(0.23 | )(c) | | | $(0.17 | ) | | | $(0.25 | ) |
Net realized and unrealized gain (loss) | | | (0.04 | )(g) | | | 8.56 | | | | 3.71 | | | | 0.52 | | | | 0.21 | |
Total from investment operations | | | $(0.28 | ) | | | $8.27 | | | | $3.48 | | | | $0.35 | | | | $(0.04 | ) |
| | | | |
| Less distributions declared to shareholders | | | | | | | | | | | | | | | | | |
From net realized gain | | | $(5.61 | ) | | | $(2.81 | ) | | | $(0.58 | ) | | | $— | | | | $(1.82 | ) |
Net asset value, end of period (x) | | | $25.42 | | | | $31.31 | | | | $25.85 | | | | $22.95 | | | | $22.60 | |
Total return (%) (r)(s)(t)(x) | | | 3.19 | | | | 34.68 | | | | 15.50 | (c) | | | 1.55 | | | | 0.23 | |
| | | | |
Ratios (%) (to average net assets)
and Supplemental data: | | | | | | | | | | | | | | | | | |
Expenses before expense reductions (f) | | | 1.56 | | | | 1.58 | | | | 1.60 | (c) | | | 1.62 | | | | 1.61 | |
Expenses after expense reductions (f) | | | 1.54 | | | | 1.57 | | | | 1.59 | (c) | | | 1.59 | | | | 1.56 | |
Net investment income (loss) | | | (0.95 | ) | | | (1.05 | ) | | | (0.95 | )(c) | | | (0.82 | ) | | | (1.07 | ) |
Portfolio turnover | | | 69 | | | | 67 | | | | 53 | | | | 49 | | | | 56 | |
Net assets at end of period (000 omitted) | | | $32,381 | | | | $36,272 | | | | $29,130 | | | | $35,890 | | | | $57,077 | |
| |
| Class R3 | | Year ended | |
| | | | | |
| | | 8/31/19 | | | 8/31/18 | | | 8/31/17 | | | 8/31/16 | | | 8/31/15 | |
Net asset value, beginning of period | | | $33.26 | | | | $27.24 | | | | $24.09 | | | | $23.67 | | | | $25.47 | |
| | | | |
| Income (loss) from investment operations | | | | | | | | | | | | | | | | | |
Net investment income (loss) (d) | | | $(0.19 | ) | | | $(0.24 | ) | | | $(0.17 | )(c) | | | $(0.12 | ) | | | $(0.20 | ) |
Net realized and unrealized gain (loss) | | | 0.05 | (g) | | | 9.07 | | | | 3.90 | | | | 0.54 | | | | 0.22 | |
Total from investment operations | | | $(0.14 | ) | | | $8.83 | | | | $3.73 | | | | $0.42 | | | | $0.02 | |
| | | | |
| Less distributions declared to shareholders | | | | | | | | | | | | | | | | | |
From net realized gain | | | $(5.61 | ) | | | $(2.81 | ) | | | $(0.58 | ) | | | $— | | | | $(1.82 | ) |
Net asset value, end of period (x) | | | $27.51 | | | | $33.26 | | | | $27.24 | | | | $24.09 | | | | $23.67 | |
Total return (%) (r)(s)(t)(x) | | | 3.45 | | | | 34.98 | | | | 15.81 | (c) | | | 1.77 | | | | 0.47 | |
| | | | |
Ratios (%) (to average net assets)
and Supplemental data: | | | | | | | | | | | | | | | | | |
Expenses before expense reductions (f) | | | 1.30 | | | | 1.33 | | | | 1.35 | (c) | | | 1.37 | | | | 1.36 | |
Expenses after expense reductions (f) | | | 1.30 | | | | 1.32 | | | | 1.34 | (c) | | | 1.34 | | | | 1.31 | |
Net investment income (loss) | | | (0.70 | ) | | | (0.80 | ) | | | (0.70 | )(c) | | | (0.55 | ) | | | (0.82 | ) |
Portfolio turnover | | | 69 | | | | 67 | | | | 53 | | | | 49 | | | | 56 | |
Net assets at end of period (000 omitted) | | | $52,559 | | | | $50,895 | | | | $42,346 | | | | $57,593 | | | | $89,659 | |
See Notes to Financial Statements
24
Financial Highlights – continued
| | | | | | | | | | | | | | | | | | | | |
| Class R4 | | Year ended | |
| | | | | |
| | | 8/31/19 | | | 8/31/18 | | | 8/31/17 | | | 8/31/16 | | | 8/31/15 | |
Net asset value, beginning of period | | | $35.05 | | | | $28.48 | | | | $25.09 | | | | $24.60 | | | | $26.33 | |
| | | | |
| Income (loss) from investment operations | | | | | | | | | | | | | | | | | |
Net investment income (loss) (d) | | | $(0.13 | ) | | | $(0.15 | ) | | | $(0.12 | )(c) | | | $(0.07 | ) | | | $(0.14 | ) |
Net realized and unrealized gain (loss) | | | 0.13 | (g) | | | 9.53 | | | | 4.09 | | | | 0.56 | | | | 0.23 | |
Total from investment operations | | | $0.00 | (w) | | | $9.38 | | | | $3.97 | | | | $0.49 | | | | $0.09 | |
| | | | |
| Less distributions declared to shareholders | | | | | | | | | | | | | | | | | |
From net realized gain | | | $(5.61 | ) | | | $(2.81 | ) | | | $(0.58 | ) | | | $— | | | | $(1.82 | ) |
Net asset value, end of period (x) | | | $29.44 | | | | $35.05 | | | | $28.48 | | | | $25.09 | | | | $24.60 | |
Total return (%) (r)(s)(t)(x) | | | 3.72 | | | | 35.42 | | | | 16.14 | (c) | | | 1.99 | | | | 0.73 | |
| | | | |
Ratios (%) (to average net assets)
and Supplemental data: | | | | | | | | | | | | | | | | | |
Expenses before expense reductions (f) | | | 1.05 | | | | 1.08 | | | | 1.10 | (c) | | | 1.12 | | | | 1.11 | |
Expenses after expense reductions (f) | | | 1.05 | | | | 1.07 | | | | 1.09 | (c) | | | 1.09 | | | | 1.06 | |
Net investment income (loss) | | | (0.45 | ) | | | (0.51 | ) | | | (0.45 | )(c) | | | (0.32 | ) | | | (0.57 | ) |
Portfolio turnover | | | 69 | | | | 67 | | | | 53 | | | | 49 | | | | 56 | |
Net assets at end of period (000 omitted) | | | $8,384 | | | | $10,612 | | | | $83,186 | | | | $91,974 | | | | $142,857 | |
| |
| Class R6 | | Year ended | |
| | | | | |
| | | 8/31/19 | | | 8/31/18 | | | 8/31/17 | | | 8/31/16 | | | 8/31/15 | |
Net asset value, beginning of period | | | $37.13 | | | | $30.01 | | | | $26.38 | | | | $25.83 | | | | $27.52 | |
| | | | |
| Income (loss) from investment operations | | | | | | | | | | | | | | | | | |
Net investment income (loss) (d) | | | $(0.11 | ) | | | $(0.14 | ) | | | $(0.09 | )(c) | | | $(0.03 | ) | | | $(0.12 | ) |
Net realized and unrealized gain (loss) | | | 0.23 | (g) | | | 10.07 | | | | 4.30 | | | | 0.58 | | | | 0.25 | |
Total from investment operations | | | $0.12 | | | | $9.93 | | | | $4.21 | | | | $0.55 | | | | $0.13 | |
| | | | |
| Less distributions declared to shareholders | | | | | | | | | | | | | | | | | |
From net realized gain | | | $(5.61 | ) | | | $(2.81 | ) | | | $(0.58 | ) | | | $— | | | | $(1.82 | ) |
Net asset value, end of period (x) | | | $31.64 | | | | $37.13 | | | | $30.01 | | | | $26.38 | | | | $25.83 | |
Total return (%) (r)(s)(t)(x) | | | 3.85 | | | | 35.45 | | | | 16.26 | (c) | | | 2.13 | | | | 0.85 | |
| | | | |
Ratios (%) (to average net assets)
and Supplemental data: | | | | | | | | | | | | | | | | | |
Expenses before expense reductions (f) | | | 0.96 | | | | 0.97 | | | | 0.98 | (c) | | | 0.99 | | | | 0.98 | |
Expenses after expense reductions (f) | | | 0.95 | | | | 0.96 | | | | 0.97 | (c) | | | 0.97 | | | | 0.93 | |
Net investment income (loss) | | | (0.35 | ) | | | (0.44 | ) | | | (0.34 | )(c) | | | (0.11 | ) | | | (0.44 | ) |
Portfolio turnover | | | 69 | | | | 67 | | | | 53 | | | | 49 | | | | 56 | |
Net assets at end of period (000 omitted) | | | $541,266 | | | | $477,818 | | | | $385,440 | | | | $320,645 | | | | $313,080 | |
See Notes to Financial Statements
25
Financial Highlights – continued
| (c) | Amount reflects aone-time reimbursement of expenses by the custodian (or former custodian) without which net investment income and performance would be lower and expenses would be higher. |
| (d) | Per share data is based on average shares outstanding. |
| (f) | Ratios do not reflect reductions from fees paid indirectly, if applicable. |
| (g) | The per share amount varies from the net realized and unrealized gain/loss for the period because of the timing of sales of fund shares and the per share amount of realized and unrealized gains and losses at such time. |
| (r) | Certain expenses have been reduced without which performance would have been lower. |
| (s) | From time to time the fund may receive proceeds from litigation settlements, without which performance would be lower. |
| (t) | Total returns do not include any applicable sales charges. |
| (w) | Per share amount was less than $0.01. |
| (x) | The net asset values and total returns have been calculated on net assets which include adjustments made in accordance with U.S. generally accepted accounting principles required at period end for financial reporting purposes. |
See Notes to Financial Statements
26
NOTES TO FINANCIAL STATEMENTS
(1) Business and Organization
MFS New Discovery Fund (the fund) is a diversified series of MFS Series Trust I (the trust). The trust is organized as a Massachusetts business trust and is registered under the Investment Company Act of 1940, as amended, as anopen-end management investment company.
The fund is an investment company and accordingly follows the investment company accounting and reporting guidance of the Financial Accounting Standards Board (FASB) Accounting Standards Codification Topic 946 Financial Services – Investment Companies.
(2) Significant Accounting Policies
General– The preparation of financial statements in conformity with U.S. generally accepted accounting principles requires management to make estimates and assumptions that affect the reported amounts of assets and liabilities, and disclosure of contingent assets and liabilities at the date of the financial statements and the reported amounts of increases and decreases in net assets from operations during the reporting period. Actual results could differ from those estimates. In the preparation of these financial statements, management has evaluated subsequent events occurring after the date of the fund’s Statement of Assets and Liabilities through the date that the financial statements were issued. The fund will generally focus on securities of small size companies which may be more volatile than those of larger companies.
Balance Sheet Offsetting– The fund’s accounting policy with respect to balance sheet offsetting is that, absent an event of default by the counterparty or a termination of the agreement, the International Swaps and Derivatives Association (ISDA) Master Agreement, or similar agreement, does not result in an offset of reported amounts of financial assets and financial liabilities in the Statement of Assets and Liabilities across transactions between the fund and the applicable counterparty. The fund’s right to setoff may be restricted or prohibited by the bankruptcy or insolvency laws of the particular jurisdiction to which a specific master netting agreement counterparty is subject. Balance sheet offsetting disclosures, to the extent applicable to the fund, have been included in the fund’s Significant Accounting Policies note under the captions for each of the fund’sin-scope financial instruments and transactions.
Investment Valuations– Equity securities, including restricted equity securities, are generally valued at the last sale or official closing price on their primary market or exchange as provided by a third-party pricing service. Equity securities, for which there were no sales reported that day, are generally valued at the last quoted daily bid quotation on their primary market or exchange as provided by a third-party pricing service. Short-term instruments with a maturity at issuance of 60 days or less may be valued at amortized cost, which approximates market value.Open-end investment companies are generally valued at net asset value per share. Securities and other assets generally valued on the basis of information from a third-party pricing service may also be valued at a broker/dealer bid quotation. In determining values, third-party pricing services can utilize both transaction data and market information such as yield, quality, coupon rate, maturity, type of issue, trading characteristics, and other market data. The
27
Notes to Financial Statements – continued
values of foreign securities and other assets and liabilities expressed in foreign currencies are converted to U.S. dollars using the mean of bid and asked prices for rates provided by a third-party pricing service.
The Board of Trustees has delegated primary responsibility for determining or causing to be determined the value of the fund’s investments (including any fair valuation) to the adviser pursuant to valuation policies and procedures approved by the Board. If the adviser determines that reliable market quotations are not readily available, investments are valued at fair value as determined in good faith by the adviser in accordance with such procedures under the oversight of the Board of Trustees. Under the fund’s valuation policies and procedures, market quotations are not considered to be readily available for most types of debt instruments and floating rate loans and many types of derivatives. These investments are generally valued at fair value based on information from third-party pricing services. In addition, investments may be valued at fair value if the adviser determines that an investment’s value has been materially affected by events occurring after the close of the exchange or market on which the investment is principally traded (such as foreign exchange or market) and prior to the determination of the fund’s net asset value, or after the halt of trading of a specific security where trading does not resume prior to the close of the exchange or market on which the security is principally traded. Events that occur after foreign markets close (such as developments in foreign markets and significant movements in the U.S. markets) and prior to the determination of the fund’s net asset value may be deemed to have a material effect on the value of securities traded in foreign markets. Accordingly, the fund’s foreign equity securities may often be valued at fair value. The adviser generally relies on third-party pricing services or other information (such as the correlation with price movements of similar securities in the same or other markets; the type, cost and investment characteristics of the security; the business and financial condition of the issuer; and trading and other market data) to assist in determining whether to fair value and at what value to fair value an investment. The value of an investment for purposes of calculating the fund’s net asset value can differ depending on the source and method used to determine value. When fair valuation is used, the value of an investment used to determine the fund’s net asset value may differ from quoted or published prices for the same investment. There can be no assurance that the fund could obtain the fair value assigned to an investment if it were to sell the investment at the same time at which the fund determines its net asset value per share.
Various inputs are used in determining the value of the fund’s assets or liabilities. These inputs are categorized into three broad levels. In certain cases, the inputs used to measure fair value may fall into different levels of the fair value hierarchy. In such cases, an investment’s level within the fair value hierarchy is based on the lowest level of input that is significant to the fair value measurement. The fund’s assessment of the significance of a particular input to the fair value measurement in its entirety requires judgment, and considers factors specific to the investment. Level 1 includes unadjusted quoted prices in active markets for identical assets or liabilities. Level 2 includes other significant observable market-based inputs (including quoted prices for similar securities, interest rates, prepayment speed, and credit risk). Level 3 includes
28
Notes to Financial Statements – continued
unobservable inputs, which may include the adviser’s own assumptions in determining the fair value of investments. The following is a summary of the levels used as of August 31, 2019 in valuing the fund’s assets or liabilities:
| | | | | | | | | | | | | | | | |
| | | | |
| Financial Instruments | | Level 1 | | | Level 2 | | | Level 3 | | | Total | |
| Equity Securities | | | $1,379,249,423 | | | | $— | | | | $— | | | | $1,379,249,423 | |
| Mutual Funds | | | 54,490,220 | | | | — | | | | — | | | | 54,490,220 | |
| Total | | | $1,433,739,643 | | | | $— | | | | $— | | | | $1,433,739,643 | |
For further information regarding security characteristics, see the Portfolio of Investments.
Foreign Currency Translation– Purchases and sales of foreign investments, income, and expenses are converted into U.S. dollars based upon currency exchange rates prevailing on the respective dates of such transactions or on the reporting date for foreign denominated receivables and payables. Gains and losses attributable to foreign currency exchange rates on sales of securities are recorded for financial statement purposes as net realized gains and losses on investments. Gains and losses attributable to foreign exchange rate movements on receivables, payables, income and expenses are recorded for financial statement purposes as foreign currency transaction gains and losses. That portion of both realized and unrealized gains and losses on investments that results from fluctuations in foreign currency exchange rates is not separately disclosed.
Security Loans– Under its Securities Lending Agency Agreement with the fund, State Street Bank and Trust Company, as lending agent, loans the securities of the fund to certain qualified institutions (the “Borrowers”) approved by the fund. Security loans can be terminated at the discretion of either the lending agent or the fund and the related securities must be returned within the earlier of the standard trade settlement period for such securities or within three business days. The loans are collateralized by cash and/or U.S. Treasury and federal agency obligations in an amount typically at least equal to the market value of the securities loaned. On loans collateralized by cash, the cash collateral is invested in a money market fund. The market value of the loaned securities is determined at the close of business of the fund and any additional required collateral is delivered to the fund on the next business day. The lending agent provides the fund with indemnification against Borrower default. In the event of Borrower default, the lending agent will, for the benefit of the fund, either purchase securities identical to those loaned or, when such purchase is commercially impracticable, pay the fund the market value of the loaned securities. In return, the lending agent assumes the fund’s rights to the related collateral. If the collateral value is less than the cost to purchase identical securities, the lending agent is responsible for the shortfall, but only to the extent that such shortfall is not due to a decline in collateral value resulting from collateral reinvestment for which the fund bears the risk of loss. At period end, the fund had investment securities on loan, all of which were classified as equity securities in the fund’s Portfolio of Investments, with a fair value of $21,799,402. The fair value of the fund’s investment securities on loan and a related liability of $5,985,100 for cash collateral received on securities loaned are both presented gross in the Statement of Assets and Liabilities. Additionally, these loans were collateralized by U.S. Treasury Obligations of $15,955,481 held by the lending agent. The collateral on securities
29
Notes to Financial Statements – continued
loaned exceeded the value of securities on loan at period end. The liability for cash collateral for securities loaned is carried at fair value, which is categorized as level 2 within the fair value hierarchy. A portion of the income generated upon investment of the collateral is remitted to the Borrowers, and the remainder is allocated between the fund and the lending agent. On loans collateralized by U.S. Treasury and/or federal agency obligations, a fee is received from the Borrower, and is allocated between the fund and the lending agent. Income from securities lending is separately reported in the Statement of Operations. The dividend and interest income earned on the securities loaned is accounted for in the same manner as other dividend and interest income.
Indemnifications– Under the fund’s organizational documents, its officers and Trustees may be indemnified against certain liabilities and expenses arising out of the performance of their duties to the fund. Additionally, in the normal course of business, the fund enters into agreements with service providers that may contain indemnification clauses. The fund’s maximum exposure under these agreements is unknown as this would involve future claims that may be made against the fund that have not yet occurred.
Investment Transactions and Income– Investment transactions are recorded on the trade date. Dividends received in cash are recorded on theex-dividend date. Certain dividends from foreign securities will be recorded when the fund is informed of the dividend if such information is obtained subsequent to theex-dividend date. Dividend payments received in additional securities are recorded on theex-dividend date in an amount equal to the value of the security on such date.
The fund may receive proceeds from litigation settlements. Any proceeds received from litigation involving portfolio holdings are reflected in the Statement of Operations in realized gain/loss if the security has been disposed of by the fund or in unrealized gain/loss if the security is still held by the fund. Any other proceeds from litigation not related to portfolio holdings are reflected as other income in the Statement of Operations.
Tax Matters and Distributions– The fund intends to qualify as a regulated investment company, as defined under Subchapter M of the Internal Revenue Code, and to distribute all of its taxable income, including realized capital gains. As a result, no provision for federal income tax is required. The fund’s federal tax returns, when filed, will remain subject to examination by the Internal Revenue Service for a three year period. Management has analyzed the fund’s tax positions taken on federal and state tax returns for all open tax years and does not believe that there are any uncertain tax positions that require recognition of a tax liability. Foreign taxes, if any, have been accrued by the fund in the accompanying financial statements in accordance with the applicable foreign tax law. Foreign income taxes may be withheld by certain countries in which the fund invests. Additionally, capital gains realized by the fund on securities issued in or by certain foreign countries may be subject to capital gains tax imposed by those countries.
Distributions to shareholders are recorded on theex-dividend date. Income and capital gain distributions are determined in accordance with income tax regulations, which may differ from U.S. generally accepted accounting principles. Certain capital accounts in the financial statements are periodically adjusted for permanent differences in order
30
Notes to Financial Statements – continued
to reflect their tax character. These adjustments have no impact on net assets or net asset value per share. Temporary differences which arise from recognizing certain items of income, expense, gain or loss in different periods for financial statement and tax purposes will reverse at some time in the future. Distributions in excess of net investment income or net realized gains are temporary overdistributions for financial statement purposes resulting from differences in the recognition or classification of income or distributions for financial statement and tax purposes.
Book/tax differences primarily relate to wash sale loss deferrals and treating a portion of the proceeds from redemptions as a distribution for tax purposes.
The tax character of distributions declared to shareholders for the last two fiscal years is as follows:
| | | | | | | | |
| | |
| | | Year ended | | | Year ended | |
| | |
| | | 8/31/19 | | | 8/31/18 | |
| Ordinary income (including any short-term capital gains) | | | $77,700,077 | | | | $33,500,079 | |
| Long-term capital gains | | | 152,749,955 | | | | 77,287,247 | |
| Total distributions | | | $230,450,032 | | | | $110,787,326 | |
The federal tax cost and the tax basis components of distributable earnings were as follows:
| | | | |
| |
| As of 8/31/19 | | | |
| |
| Cost of investments | | | $1,199,592,692 | |
| Gross appreciation | | | 348,131,467 | |
| |
| Gross depreciation | | | (113,984,516 | ) |
| Net unrealized appreciation (depreciation) | | | $234,146,951 | |
| |
| Undistributed ordinary income | | | 33,529,410 | |
| Undistributed long-term capital gain | | | 70,388,231 | |
| Other temporary differences | | | (4,113 | ) |
Multiple Classes of Shares of Beneficial Interest– The fund offers multiple classes of shares, which differ in their respective distribution and service fees. The fund’s income, realized and unrealized gain (loss), and common expenses are allocated to shareholders based on the daily net assets of each class. Dividends are declared separately for each class. Differences in per share dividend rates are generally due to differences in separate class expenses. Class B shares will convert to Class A shares approximately eight years after purchase. Class C shares will convert to Class A shares
31
Notes to Financial Statements – continued
approximately ten years after purchase. The fund’s distributions declared to shareholders as reported in the Statements of Changes in Net Assets are presented by class as follows:
| | | | | | | | |
| | | From net realized
gain | |
| | |
| | | Year
ended
8/31/19 | | | Year
ended
8/31/18 | |
| Class A | | | $88,854,670 | | | | $37,646,733 | |
| Class B | | | 4,829,407 | | | | 2,381,568 | |
| Class C | | | 13,810,640 | | | | 9,115,914 | |
| Class I | | | 26,484,311 | | | | 10,159,237 | |
| Class R1 | | | 1,085,473 | | | | 533,248 | |
| Class R2 | | | 6,518,565 | | | | 3,004,285 | |
| Class R3 | | | 8,385,161 | | | | 4,128,606 | |
| Class R4 | | | 1,643,025 | | | | 7,995,727 | |
| Class R6 | | | 78,838,780 | | | | 34,950,101 | |
| Class 529A | | | — | | | | 634,438 | |
| Class 529B | | | — | | | | 39,739 | |
| Class 529C | | | — | | | | 197,730 | |
| Total | | | $230,450,032 | | | | $110,787,326 | |
Effective March 15, 2018, all Class 529A, Class 529B, and Class 529C shares were redeemed, and these share classes were terminated effective April 27, 2018.
(3) Transactions with Affiliates
Investment Adviser– The fund has an investment advisory agreement with MFS to provide overall investment management and related administrative services and facilities to the fund. The management fee is computed daily and paid monthly at the following annual rates based on the fund’s average daily net assets:
| | | | |
| Up to $1 billion | | | 0.90 | % |
| In excess of $1 billion and up to $2.5 billion | | | 0.80 | % |
| In excess of $2.5 billion and up to $5 billion | | | 0.75 | % |
| In excess of $5 billion | | | 0.70 | % |
MFS has agreed in writing to reduce its management fee by a specified amount if certain MFS mutual fund assets exceed thresholds agreed to by MFS and the fund’s Board of Trustees. For the year ended August 31, 2019, this management fee reduction amounted to $127,137, which is included in the reduction of total expenses in the Statement of Operations. The management fee incurred for the year ended August 31, 2019 was equivalent to an annual effective rate of 0.87% of the fund’s average daily net assets.
Distributor– MFS Fund Distributors, Inc. (MFD), a wholly-owned subsidiary of MFS, as distributor, received $215,222 for the year ended August 31, 2019, as its portion of the initial sales charge on sales of Class A shares of the fund.
The Board of Trustees has adopted a distribution plan for certain share classes pursuant to Rule12b-1 of the Investment Company Act of 1940.
32
Notes to Financial Statements – continued
The fund’s distribution plan provides that the fund will pay MFD for services provided by MFD and financial intermediaries in connection with the distribution and servicing of certain share classes. One component of the plan is a distribution fee paid to MFD and another component of the plan is a service fee paid to MFD. MFD may subsequently pay all, or a portion, of the distribution and/or service fees to financial intermediaries.
Distribution Plan Fee Table:
| | | | | | | | | | | | | | | | | | | | |
| | | | | |
| | | Distribution
Fee Rate (d) | | | Service
Fee Rate (d) | | | Total
Distribution
Plan (d) | | | Annual
Effective
Rate (e) | | | Distribution
and Service Fee | |
| Class A | | | — | | | | 0.25% | | | | 0.25% | | | | 0.24% | | | | $1,247,585 | |
| Class B | | | 0.75% | | | | 0.25% | | | | 1.00% | | | | 1.00% | | | | 200,024 | |
| Class C | | | 0.75% | | | | 0.25% | | | | 1.00% | | | | 1.00% | | | | 594,497 | |
| Class R1 | | | 0.75% | | | | 0.25% | | | | 1.00% | | | | 1.00% | | | | 47,083 | |
| Class R2 | | | 0.25% | | | | 0.25% | | | | 0.50% | | | | 0.50% | | | | 163,216 | |
| Class R3 | | | — | | | | 0.25% | | | | 0.25% | | | | 0.25% | | | | 120,417 | |
| Total Distribution and Service Fees | | | | | | | | | | | | $2,372,822 | |
| (d) | In accordance with the distribution plan for certain classes, the fund pays distribution and/or service fees equal to these annual percentage rates of each class’s average daily net assets. The distribution and service fee rates disclosed by class represent the current rates in effect at the end of the reporting period. Any rate changes, if applicable, are detailed below. |
| (e) | The annual effective rates represent actual fees incurred under the distribution plan for the year ended August 31, 2019 based on each class’s average daily net assets. MFD has voluntarily agreed to rebate a portion of each class’s 0.25% service fee attributable to accounts for which MFD retains the 0.25% service fee except for accounts attributable to MFS or its affiliates’ seed money. For the year ended August 31, 2019, this rebate amounted to $28,660, $773, $195, and $346 for Class A, Class B, Class C, and Class R2, respectively, and is included in the reduction of total expenses in the Statement of Operations. |
Certain Class A shares are subject to a contingent deferred sales charge (CDSC) in the event of a shareholder redemption within 18 months of purchase. Class B shares are subject to a CDSC in the event of a shareholder redemption within six years of purchase. Class C shares are subject to a CDSC in the event of a shareholder redemption within 12 months of purchase. All contingent deferred sales charges are paid to MFD and during the year ended August 31, 2019, were as follows:
| | | | |
| |
| | | Amount | |
| Class A | | | $7,383 | |
| Class B | | | 14,017 | |
| Class C | | | 3,013 | |
Shareholder Servicing Agent– MFS Service Center, Inc. (MFSC), a wholly-owned subsidiary of MFS, receives a fee from the fund for its services as shareholder servicing agent calculated as a percentage of the average daily net assets of the fund as determined periodically under the supervision of the fund’s Board of Trustees. For the year ended August 31, 2019, the fee was $177,380, which equated to 0.0135% annually of the fund’s average daily net assets. MFSC also receives payment from the fund forout-of-pocket expenses,sub-accounting and other shareholder servicing costs which may be paid to affiliated and unaffiliated service providers. Class R6 shares do
33
Notes to Financial Statements – continued
not incursub-accounting fees. For the year ended August 31, 2019, theseout-of-pocket expenses,sub-accounting and other shareholder servicing costs amounted to $956,372.
Administrator– MFS provides certain financial, legal, shareholder communications, compliance, and other administrative services to the fund. Under an administrative services agreement, the fund reimburses MFS the costs incurred to provide these services. The fund is charged an annual fixed amount of $17,500 plus a fee based on average daily net assets. The administrative services fee incurred for the year ended August 31, 2019 was equivalent to an annual effective rate of 0.0142% of the fund’s average daily net assets.
Trustees’ and Officers’ Compensation– The fund pays compensation to independent Trustees in the form of a retainer, attendance fees, and additional compensation to Board and Committee chairpersons. The fund does not pay compensation directly to Trustees or officers of the fund who are also officers of the investment adviser, all of whom receive remuneration from MFS for their services to the fund. Certain officers and Trustees of the fund are officers or directors of MFS, MFD, and MFSC.
Prior to December 31, 2001, the fund had an unfunded defined benefit plan (“DB plan”) for independent Trustees. As of December 31, 2001, the Board took action to terminate the DB plan with respect to then-current and any future independent Trustees, such that the DB plan covers only certain of those former independent Trustees who retired on or before December 31, 2001. The DB plan resulted in a pension expense of $771 and is included in “Independent Trustees’ compensation” in the Statement of Operations for the year ended August 31, 2019. The liability for deferred retirement benefits payable to those former independent Trustees under the DB plan amounted to $1,325 at August 31, 2019, and is included in “Payable for independent Trustees’ compensation” in the Statement of Assets and Liabilities.
Other– This fund and certain other funds managed by MFS (the funds) had entered into a service agreement (the ISO Agreement) which provided for payment of fees solely by the funds to Tarantino LLC in return for the provision of services of an Independent Senior Officer (ISO) for the funds. Frank L. Tarantino served as the ISO and was an officer of the funds and the sole member of Tarantino LLC. Effective June 30, 2019, Mr. Tarantino retired from his position as ISO for the funds, and the ISO Agreement was terminated. For the year ended August 31, 2019, the fee paid by the fund under this agreement was $2,315 and is included in “Miscellaneous” expense in the Statement of Operations. MFS had agreed to bear all expenses associated with office space, other administrative support, and supplies provided to the ISO.
The fund invests in the MFS Institutional Money Market Portfolio which is managed by MFS and seeks current income consistent with preservation of capital and liquidity. This money market fund does not pay a management fee to MFS.
On March 15, 2018, MFS redeemed 5 shares of Class 529A and 3 shares of Class 529C for an aggregate amount of $225.
The fund is permitted to engage in purchase and sale transactions with funds and accounts for which MFS serves as investment adviser orsub-adviser (“cross-trades”) pursuant to a policy adopted by the Board of Trustees. This policy has been designed to
34
Notes to Financial Statements – continued
ensure that cross-trades conducted by the fund comply with Rule17a-7 under the Investment Company Act of 1940. During the year ended August 31, 2019, the fund engaged in purchase and sale transactions pursuant to this policy, which amounted to $66,250 and $1,294,281, respectively. The sales transactions resulted in net realized gains (losses) of $188,747.
The adviser has voluntarily undertaken to reimburse the fund from its own resources on a quarterly basis for the cost of investment research embedded in the cost of the fund’s securities trades. This agreement may be rescinded at any time. For the year ended August 31, 2019, this reimbursement amounted to $116,562, which is included in “Other” income in the Statement of Operations.
(4) Portfolio Securities
For the year ended August 31, 2019, purchases and sales of investments, other than short-term obligations, aggregated $891,429,481 and $893,839,745, respectively.
(5) Shares of Beneficial Interest
The fund’s Declaration of Trust permits the Trustees to issue an unlimited number of full and fractional shares of beneficial interest. Transactions in fund shares were as follows:
| | | | | | | | | | | | | | | | |
| | | Year ended
8/31/19 | | | Year ended
8/31/18 | |
| | | | |
| | | Shares | | | Amount | | | Shares | | | Amount | |
| Shares sold | | | | | | | | | | | | | | | | |
Class A | | | 4,174,526 | | | | $111,128,979 | | | | 3,389,604 | | | | $100,467,972 | |
Class B | | | 119,514 | | | | 2,451,739 | | | | 90,601 | | | | 2,186,645 | |
Class C | | | 582,894 | | | | 11,635,600 | | | | 357,900 | | | | 8,620,852 | |
Class I | | | 2,246,267 | | | | 67,695,575 | | | | 2,247,120 | | | | 73,044,188 | |
Class R1 | | | 48,692 | | | | 1,012,673 | | | | 38,681 | | | | 921,436 | |
Class R2 | | | 283,452 | | | | 6,968,591 | | | | 290,264 | | | | 8,099,954 | |
Class R3 | | | 470,712 | | | | 12,582,867 | | | | 348,471 | | | | 10,380,772 | |
Class R4 | | | 85,788 | | | | 2,403,986 | | | | 261,111 | | | | 7,820,768 | |
Class R6 | | | 4,412,506 | | | | 134,149,812 | | | | 2,345,137 | | | | 76,446,348 | |
Class 529A | | | — | | | | — | | | | 22,321 | | | | 605,974 | |
Class 529B | | | — | | | | — | | | | 1,000 | | | | 21,980 | |
Class 529C | | | — | | | | — | | | | 2,215 | | | | 49,439 | |
| | | 12,424,351 | | | | $350,029,822 | | | | 9,394,425 | | | | $288,666,328 | |
35
Notes to Financial Statements – continued
| | | | | | | | | | | | | | | | |
| | | Year ended
8/31/19 | | | Year ended
8/31/18 | |
| | | | |
| | | Shares | | | Amount | | | Shares | | | Amount | |
| Shares issued to shareholders in reinvestment of distributions | | | | | | | | | | | | | | | | |
Class A | | | 3,869,394 | | | | $86,751,808 | | | | 1,371,460 | | | | $36,549,397 | |
Class B | | | 272,245 | | | | 4,614,555 | | | | 104,219 | | | | 2,252,175 | |
Class C | | | 703,090 | | | | 11,952,526 | | | | 375,674 | | | | 8,137,106 | |
Class I | | | 930,538 | | | | 23,644,963 | | | | 300,810 | | | | 8,849,833 | |
Class R1 | | | 64,689 | | | | 1,085,473 | | | | 24,860 | | | | 533,248 | |
Class R2 | | | 284,154 | | | | 5,887,667 | | | | 106,349 | | | | 2,669,351 | |
Class R3 | | | 374,505 | | | | 8,385,161 | | | | 155,094 | | | | 4,128,606 | |
Class R4 | | | 68,717 | | | | 1,643,025 | | | | 285,766 | | | | 7,995,727 | |
Class R6 | | | 2,885,648 | | | | 74,103,434 | | | | 1,114,183 | | | | 33,035,531 | |
Class 529A | | | — | | | | — | �� | | | 24,629 | | | | 634,438 | |
Class 529B | | | — | | | | — | | | | 1,907 | | | | 39,739 | |
Class 529C | | | — | | | | — | | | | 9,493 | | | | 197,730 | |
| | | 9,452,980 | | | | $218,068,612 | | | | 3,874,444 | | | | $105,022,881 | |
| | | | |
| Shares reacquired | | | | | | | | | | | | | | | | |
Class A | | | (3,885,501 | ) | | | $(100,360,171 | ) | | | (3,454,451 | ) | | | $(99,851,899 | ) |
Class B | | | (361,062 | ) | | | (7,129,308 | ) | | | (211,885 | ) | | | (5,017,707 | ) |
Class C | | | (1,016,652 | ) | | | (20,620,050 | ) | | | (1,531,753 | ) | | | (36,294,111 | ) |
Class I | | | (2,820,194 | ) | | | (80,345,484 | ) | | | (1,214,737 | ) | | | (39,308,831 | ) |
Class R1 | | | (87,036 | ) | | | (1,774,307 | ) | | | (57,620 | ) | | | (1,354,392 | ) |
Class R2 | | | (452,605 | ) | | | (10,891,533 | ) | | | (364,708 | ) | | | (10,084,972 | ) |
Class R3 | | | (465,291 | ) | | | (12,527,864 | ) | | | (527,813 | ) | | | (15,387,872 | ) |
Class R4 | | | (172,526 | ) | | | (5,073,303 | ) | | | (3,165,421 | ) | | | (91,120,045 | ) |
Class R6 | | | (3,059,304 | ) | | | (92,491,386 | ) | | | (3,435,661 | ) | | | (111,773,314 | ) |
Class 529A | | | — | | | | — | | | | (270,125 | ) | | | (7,574,319 | ) |
Class 529B | | | — | | | | — | | | | (17,737 | ) | | | (403,021 | ) |
Class 529C | | | — | | | | — | | | | (84,478 | ) | | | (1,912,946 | ) |
| | | (12,320,171 | ) | | | $(331,213,406 | ) | | | (14,336,389 | ) | | | $(420,083,429 | ) |
| | | | |
| Net change | | | | | | | | | | | | | | | | |
Class A | | | 4,158,419 | | | | $97,520,616 | | | | 1,306,613 | | | | $37,165,470 | |
Class B | | | 30,697 | | | | (63,014 | ) | | | (17,065 | ) | | | (578,887 | ) |
Class C | | | 269,332 | | | | 2,968,076 | | | | (798,179 | ) | | | (19,536,153 | ) |
Class I | | | 356,611 | | | | 10,995,054 | | | | 1,333,193 | | | | 42,585,190 | |
Class R1 | | | 26,345 | | | | 323,839 | | | | 5,921 | | | | 100,292 | |
Class R2 | | | 115,001 | | | | 1,964,725 | | | | 31,905 | | | | 684,333 | |
Class R3 | | | 379,926 | | | | 8,440,164 | | | | (24,248 | ) | | | (878,494 | ) |
Class R4 | | | (18,021 | ) | | | (1,026,292 | ) | | | (2,618,544 | ) | | | (75,303,550 | ) |
Class R6 | | | 4,238,850 | | | | 115,761,860 | | | | 23,659 | | | | (2,291,435 | ) |
Class 529A | | | — | | | | — | | | | (223,175 | ) | | | (6,333,907 | ) |
Class 529B | | | — | | | | — | | | | (14,830 | ) | | | (341,302 | ) |
Class 529C | | | — | | | | — | | | | (72,770 | ) | | | (1,665,777 | ) |
| | | 9,557,160 | | | | $236,885,028 | | | | (1,067,520 | ) | | | $(26,394,220 | ) |
Effective March 15, 2018, all Class 529A, Class 529B, and Class 529C shares were redeemed, and these share classes were terminated effective April 27, 2018.
36
Notes to Financial Statements – continued
Class T shares were not publicly available for sale during the period. Please see the fund’s prospectus for details.
Effective June 1, 2019, purchases of the fund’s Class B shares are closed to new and existing investors subject to certain exceptions. Please see the fund’s prospectus for details.
The fund is one of several mutual funds in which certain MFS funds may invest. The MFS funds do not invest in the underlying funds for the purpose of exercising management or control. At the end of the period, the MFS Growth Allocation Fund, the MFS Moderate Allocation Fund, the MFS Aggressive Growth Allocation Fund, and the MFS Conservative Allocation Fund were the owners of record of approximately 7%, 6%, 3%, and 2%, respectively, of the value of outstanding voting shares of the fund. In addition, the MFS Lifetime 2020 Fund, the MFS Lifetime 2025 Fund, the MFS Lifetime 2030 Fund, the MFS Lifetime 2035 Fund, the MFS Lifetime 2040 Fund, the MFS Lifetime 2045 Fund, the MFS Lifetime 2050 Fund, the MFS Lifetime 2055 Fund, the MFS Lifetime 2060 Fund, and the MFS Lifetime Income Fund were each the owners of record of less than 1% of the value of outstanding voting shares of the fund.
(6) Line of Credit
The fund and certain other funds managed by MFS participate in a $1.25 billion unsecured committed line of credit, subject to a $1 billion sublimit, provided by a syndicate of banks under a credit agreement. Borrowings may be made for temporary financing needs. Interest is charged to each fund, based on its borrowings, generally at a rate equal to the highest of one month LIBOR, the Federal Funds Effective Rate and the Overnight Bank Funding Rate, plus an agreed upon spread. A commitment fee, based on the average daily, unused portion of the committed line of credit, is allocated among the participating funds. In addition, the fund and other funds managed by MFS have established unsecured uncommitted borrowing arrangements with certain banks for temporary financing needs. Interest is charged to each fund, based on its borrowings, at rates equal to customary reference rates plus an agreed upon spread. For the year ended August 31, 2019, the fund’s commitment fee and interest expense were $7,554 and $0, respectively, and are included in “Miscellaneous” expense in the Statement of Operations.
(7) Investments in Affiliated Issuers
An affiliated issuer may be considered one in which the fund owns 5% or more of the outstanding voting securities, or a company which is under common control. For the purposes of this report, the following were affiliated issuers:
| | | | | | | | | | | | | | | | | | | | | | | | |
| | | | | | |
| Affiliated Issuers | | Beginning
Value | | | Purchases | | | Sales
Proceeds | | | Realized
Gain
(Loss) | | | Change in
Unrealized
Appreciation or
Depreciation | | | Ending
Value | |
| MFS Institutional Money Market Portfolio | | | $51,685,542 | | | | $390,068,072 | | | | $393,250,495 | | | | $577 | | | | $1,424 | | | | $48,505,120 | |
| | | | | | |
| Affiliated Issuers | | | | | | | | | | | | | | Dividend
Income | | | Capital Gain
Distributions | |
| MFS Institutional Money Market Portfolio | | | | | | | | | | | | | | | | $1,034,192 | | | | $— | |
37
REPORT OF INDEPENDENT REGISTERED PUBLIC ACCOUNTING FIRM
To the Shareholders of MFS New Discovery Fund and the Board of Trustees of MFS Series Trust I
Opinion on the Financial Statements
We have audited the accompanying statement of assets and liabilities of MFS New Discovery Fund (the “Fund”) (one of the funds constituting MFS Series Trust I (the “Trust”)), including the portfolio of investments, as of August 31, 2019,and the related statement of operations for the year then ended, the statements of changes in net assets for each of the two years in the period then ended, the financial highlights for each of the five years in the period then ended and the related notes (collectively referred to as the “financial statements”). In our opinion, the financial statements present fairly, in all material respects, the financial position of the Fund (one of the funds constituting MFS Series Trust I) at August 31, 2019, the results of its operations for the year then ended, the changes in its net assets for each of the two years in the period then ended and its financial highlights for each of the five years in the period then ended, in conformity with U.S. generally accepted accounting principles.
Basis for Opinion
These financial statements are the responsibility of the Trust’s management. Our responsibility is to express an opinion on the Fund’s financial statements based on our audits. We are a public accounting firm registered with the Public Company Accounting Oversight Board (United States) (“PCAOB”) and are required to be independent with respect to the Trust in accordance with the U.S. federal securities laws and the applicable rules and regulations of the Securities and Exchange Commission and the PCAOB.
We conducted our audits in accordance with the standards of the PCAOB. Those standards require that we plan and perform the audit to obtain reasonable assurance about whether the financial statements are free of material misstatement, whether due to error or fraud. The Trust is not required to have, nor were we engaged to perform, an audit of the Trust’s internal control over financial reporting. As part of our audits we are required to obtain an understanding of internal control over financial reporting but not for the purpose of expressing an opinion on the effectiveness of the Trust’s internal control over financial reporting. Accordingly, we express no such opinion.
Our audits included performing procedures to assess the risks of material misstatement of the financial statements, whether due to error or fraud, and performing procedures that respond to those risks. Such procedures included examining, on a test basis, evidence regarding the amounts and disclosures in the financial statements. Our procedures included confirmation of securities owned as of August 31, 2019,by correspondence with the custodian andothers or by other appropriate auditing procedures where replies from others were not received. Our audits also included
38
Report of Independent Registered Public Accounting Firm – continued
evaluating the accounting principles used and significant estimates made by management, as well as evaluating the overall presentation of the financial statements. We believe that our audits provide a reasonable basis for our opinion.

We have served as the auditor of one or more MFS investment companies since 1993.
Boston, Massachusetts
October 17, 2019
39
TRUSTEES AND OFFICERS — IDENTIFICATION AND BACKGROUND
The Trustees and Officers of the Trust, as of October 1, 2019, are listed below, together with their principal occupations during the past five years. (Their titles may have varied during that period.) The address of each Trustee and Officer is 111 Huntington Avenue, Boston, Massachusetts 02199-7618.
| | | | | | | | | | |
Name, Age | | Position(s)
Held
with Fund | | Trustee/Officer
Since (h) | | Number of
MFS Funds
overseen
by the
Trustee | | Principal
Occupations During the Past Five Years | | Other
Directorships
During the Past
Five Years (j) |
| INTERESTED TRUSTEES |
Robert J. Manning (k)
(age 55) | | Trustee | | February 2004 | | 135 | | Massachusetts Financial Services Company, Executive Chairman (since January 2017); Director; Chairman of the Board; Chief Executive Officer (until 2015);Co-Chief Executive Officer (2015-2016) | | N/A |
| | | | | |
Robin A. Stelmach (k) (age 58) | | Trustee | | January 2014 | | 135 | | Massachusetts Financial Services Company, Vice Chair (since January 2017); Chief Operating Officer and Executive Vice President (until January 2017) | | N/A |
| INDEPENDENT TRUSTEES |
John P. Kavanaugh (age 64) | | Trustee and Chair of Trustees | | January 2009 | | 135 | | Private investor | | N/A |
| | | | | |
Steven E. Buller (age 68) | | Trustee | | February 2014 | | 135 | | Financial Accounting Standards Advisory Council, Chairman (2014-2015); Public Company Accounting Oversight Board, Standing Advisory Group, Member (until 2014); BlackRock, Inc. (investment management), Managing Director (until 2014), BlackRock Finco UK (investment management), Director (until 2014) | | N/A |
40
Trustees and Officers – continued
| | | | | | | | | | |
Name, Age | | Position(s)
Held
with Fund | | Trustee/Officer
Since (h) | | Number of
MFS Funds
overseen
by the
Trustee | | Principal
Occupations During the Past Five Years | | Other
Directorships
During the Past
Five Years (j) |
John A. Caroselli (age 65) | | Trustee | | March 2017 | | 135 | | JC Global Advisors, LLC (management consulting), President (since 2015); First Capital Corporation (commercial finance), Executive Vice President (until 2015) | | N/A |
| | | | | |
Maureen R. Goldfarb (age 64) | | Trustee | | January 2009 | | 135 | | Private investor | | N/A |
| | | | | |
Michael Hegarty
(age 74) | | Trustee | | December 2004 | | 135 | | Private investor | | Rouse Properties Inc., Director (until 2016); Capmark Financial Group Inc., Director (until 2015) |
| | | | | |
Peter D. Jones
(age 64) | | Trustee | | January 2019 | | 135 | | Franklin Templeton Distributors, Inc. (investment management), President (until 2015); Franklin Templeton Institutional, LLC (investment management), Chairman (until 2015) | | N/A |
| | | | | |
| James W. Kilman, Jr. (age 58) | | Trustee | | January 2019 | | 135 | | Burford Capital Limited (finance and investment management), Chief Financial Officer (since 2019); KielStrand Capital LLC (family office and merchant bank), Chief Executive Officer (since 2016); Morgan Stanley & Co. (financial services), Vice Chairman of Investment Banking,Co-Head of Diversified Financials Coverage – Financial Institutions Investment Banking Group (until 2016) | | Alpha-En Corporation, Director (since 2016) |
41
Trustees and Officers – continued
| | | | | | | | | | |
Name, Age | | Position(s)
Held
with Fund | | Trustee/Officer
Since (h) | | Number of
MFS Funds
overseen
by the
Trustee | | Principal
Occupations During the Past Five Years | | Other
Directorships
During the Past
Five Years (j) |
Clarence Otis, Jr. (age 63) | | Trustee | | March 2017 | | 135 | | Darden Restaurants, Inc., Chief Executive Officer (until 2014) | | VF Corporation, Director; Verizon Communications, Inc., Director; The Travelers Companies, Director; Federal Reserve Bank of Atlanta, Director (until 2015) |
| | | | | |
Maryanne L. Roepke (age 63) | | Trustee | | May 2014 | | 135 | | American Century Investments (investment management), Senior Vice President and Chief Compliance Officer (until 2014) | | N/A |
| | | | | |
Laurie J. Thomsen
(age 62) | | Trustee | | March 2005 | | 135 | | Private investor | | The Travelers Companies, Director; Dycom Industries, Inc., Director (since 2015) |
| | | | | | | | |
Name, Age | | Position(s) Held
with Fund | | Trustee/Officer
Since (h) | | Number of
MFS Funds
for which
the Person
is an Officer | | Principal
Occupations During
the Past Five Years |
| OFFICERS | | | | | | | | |
| Christopher R. Bohane (k) (age 45) | | Assistant Secretary and Assistant Clerk | | July 2005 | | 135 | | Massachusetts Financial Services Company, Vice President and Assistant General Counsel |
| | | | |
Kino Clark (k) (age 51) | | Assistant Treasurer | | January 2012 | | 135 | | Massachusetts Financial Services Company, Vice President |
42
Trustees and Officers – continued
| | | | | | | | |
Name, Age | | Position(s) Held
with Fund | | Trustee/Officer
Since (h) | | Number of
MFS Funds
for which
the Person
is an Officer | | Principal
Occupations During
the Past Five Years |
John W. Clark, Jr. (k) (age 52) | | Assistant Treasurer | | April 2017 | | 135 | | Massachusetts Financial Services Company, Vice President (since March 2017); Deutsche Bank (financial services), Department Head – Treasurer’s Office (until February 2017) |
| | | | |
Thomas H. Connors (k) (age 60) | | Assistant Secretary and Assistant Clerk | | September 2012 | | 135 | | Massachusetts Financial Services Company, Vice President and Senior Counsel |
| | | | |
David L. DiLorenzo (k)
(age 51) | | President | | July 2005 | | 135 | | Massachusetts Financial Services Company, Senior Vice President |
| | | | |
Heidi W. Hardin (k)
(age 52) | | Secretary and Clerk | | April 2017 | | 135 | | Massachusetts Financial Services Company, Executive Vice President and General Counsel (since March 2017); Harris Associates (investment management), General Counsel (from September 2015 to January 2017); Janus Capital Management LLC (investment management), Senior Vice President and General Counsel (until September 2015) |
| | | | |
Brian E. Langenfeld (k)
(age 46) | | Assistant
Secretary and Assistant Clerk | | June 2006 | | 135 | | Massachusetts Financial Services Company, Vice President and Senior Counsel |
| | | | |
Amanda S. Mooradian (k)
(age 40) | | Assistant
Secretary and Assistant Clerk | | September 2018 | | 135 | | Massachusetts Financial Services Company, Assistant Vice President and Counsel |
43
Trustees and Officers – continued
| | | | | | | | |
Name, Age | | Position(s) Held
with Fund | | Trustee/Officer
Since (h) | | Number of
MFS Funds
for which
the Person
is an Officer | | Principal
Occupations During
the Past Five Years |
Susan A. Pereira (k)
(age 48) | | Assistant
Secretary and Assistant Clerk | | July 2005 | | 135 | | Massachusetts Financial Services Company, Vice President and Assistant General Counsel |
| | | | |
Kasey L. Phillips (k)
(age 48) | | Assistant Treasurer | | September 2012 | | 135 | | Massachusetts Financial Services Company, Vice President |
| | | | |
Matthew A. Stowe (k)
(age 44) | | Assistant Secretary and Assistant Clerk | | October 2014 | | 135 | | Massachusetts Financial Services Company, Vice President and Assistant General Counsel |
| | | | |
Martin J. Wolin (k)
(age 52) | | Chief Compliance Officer | | July 2015 | | 135 | | Massachusetts Financial Services Company, Senior Vice President and Chief Compliance Officer (since July 2015); Mercer (financial service provider), Chief Risk and Compliance Officer, North America and Latin America (until June 2015) |
| | | | |
James O. Yost (k)
(age 59) | | Treasurer | | September 1990 | | 135 | | Massachusetts Financial Services Company, Senior Vice President |
| (h) | Date first appointed to serve as Trustee/officer of an MFS Fund. Each Trustee has served continuously since appointment unless indicated otherwise. For the period from December 15, 2004 until February 22, 2005, Mr. Manning served as Advisory Trustee. From January 2012 through December 2016, Messrs. DiLorenzo and Yost served as Treasurer and Deputy Treasurer of the Funds, respectively. |
| (j) | Directorships or trusteeships of companies required to report to the Securities and Exchange Commission (i.e., “public companies”). |
| (k) | “Interested person” of the Trust within the meaning of the Investment Company Act of 1940 (referred to as the 1940 Act), which is the principal federal law governing investment companies like the fund, as a result of a position with MFS. The address of MFS is 111 Huntington Avenue, Boston, Massachusetts 02199-7618. |
Each Trustee (other than Messrs. Jones and Kilman) has been elected by shareholders and each Trustee and Officer holds office until his or her successor is chosen and qualified or until his or her earlier death, resignation, retirement or removal. Messrs. Jones and Kilman became Trustees of the Funds on January 1, 2019. The Trust does
44
Trustees and Officers – continued
not hold annual meetings for the purpose of electing Trustees, and Trustees are not elected for fixed terms. Under the terms of the Board’s retirement policy, an Independent Trustee shall retire at the end of the calendar year in which he or she reaches the earlier of 75 years of age or 15 years of service on the Board (or, in the case of any Independent Trustee who joined the Board prior to 2015, 20 years of service on the Board).
Messrs. Buller, Hegarty, Kilman and Otis and Ms. Roepke are members of the Trust’s Audit Committee.
Each of the Interested Trustees and certain Officers hold comparable officer positions with certain affiliates of MFS.
The Statement of Additional Information for a Fund includes further information about the Trustees and is available without charge upon request by calling1-800-225-2606.
| | |
| Investment Adviser | | Custodian |
Massachusetts Financial Services Company
111 Huntington Avenue Boston, MA 02199-7618 | | State Street Bank and Trust Company 1 Lincoln Street Boston, MA 02111-2900 |
| Distributor | | Independent Registered Public Accounting Firm |
MFS Fund Distributors, Inc.
111 Huntington Avenue Boston, MA 02199-7618 | | Ernst & Young LLP 200 Clarendon Street Boston, MA 02116 |
| Portfolio Manager(s) | | |
| Michael Grossman | | |
45
BOARD REVIEW OF INVESTMENT ADVISORY AGREEMENT
The Investment Company Act of 1940 requires that both the full Board of Trustees and a majority of thenon-interested (“independent”) Trustees, voting separately, annually approve the continuation of the Fund’s investment advisory agreement with MFS. The Trustees consider matters bearing on the Fund and its advisory arrangements at their meetings throughout the year, including a review of performance data at each regular meeting. In addition, the independent Trustees met several times over the course of three months beginning in May and ending in July, 2019 (“contract review meetings”) for the specific purpose of considering whether to approve the continuation of the investment advisory agreement for the Fund and the other investment companies that the Board oversees (the “MFS Funds”). The independent Trustees were assisted in their evaluation of the Fund’s investment advisory agreement by independent legal counsel, from whom they received separate legal advice and with whom they met separately from MFS during various contract review meetings. The independent Trustees were also assisted in this process by the MFS Funds’ Independent Senior Officer, a senior officer appointed by and reporting to the independent Trustees.
In connection with their deliberations regarding the continuation of the investment advisory agreement, the Trustees, including the independent Trustees, considered such information and factors as they believed, in light of the legal advice furnished to them and their own business judgment, to be relevant. The investment advisory agreement for the Fund was considered separately, although the Trustees also took into account the common interests of all MFS Funds in their review. As described below, the Trustees considered the nature, quality, and extent of the various investment advisory, administrative, and shareholder services performed by MFS under the existing investment advisory agreement and other arrangements with the Fund.
In connection with their contract review meetings, the Trustees received and relied upon materials that included, among other items: (i) information provided by Broadridge Financial Solutions, Inc. (“Broadridge”), an independent third party, on the investment performance of the Fund for various time periods ended December 31, 2018 and the investment performance of a group of funds with substantially similar investment classifications/objectives (the “Broadridge performance universe”), (ii) information provided by Broadridge on the Fund’s advisory fees and other expenses and the advisory fees and other expenses of comparable funds identified by Broadridge as well as all other funds in the same investment classification/category (the “Broadridge expense group and universe”), (iii) information provided by MFS on the advisory fees of portfolios of other clients of MFS, including institutional separate accounts and other clients, (iv) information as to whether and to what extent applicable expense waivers, reimbursements or fee “breakpoints” are observed for the Fund, (v) information regarding MFS’ financial results and financial condition, including MFS’ and certain of its affiliates’ estimated profitability from services performed for the Fund and the MFS Funds as a whole, and compared to MFS’ institutional business, (vi) MFS’ views regarding the outlook for the mutual fund industry and the strategic business plans of MFS, (vii) descriptions of various functions performed by MFS for the Funds, such as compliance monitoring and portfolio trading practices, and (viii) information regarding the overall organization of MFS, including
46
Board Review of Investment Advisory Agreement – continued
information about MFS’ senior management and other personnel providing investment advisory, administrative and other services to the Fund and the other MFS Funds. The comparative performance, fee and expense information prepared and provided by Broadridge was not independently verified and the independent Trustees did not independently verify any information provided to them by MFS.
The Trustees’ conclusion as to the continuation of the investment advisory agreement was based on a comprehensive consideration of all information provided to the Trustees and not the result of any single factor. Some of the factors that figured particularly in the Trustees’ deliberations are described below, although individual Trustees may have evaluated the information presented differently from one another, giving different weights to various factors. It is also important to recognize that the fee arrangements for the Fund and other MFS Funds are the result of years of review and discussion between the independent Trustees and MFS, that certain aspects of such arrangements may receive greater scrutiny in some years than in others, and that the Trustees’ conclusions may be based, in part, on their consideration of these same arrangements during the course of the year and in prior years.
Based on information provided by Broadridge and MFS, the Trustees reviewed the Fund’s total return investment performance as well as the Broadridge performance universe over various time periods. The Trustees placed particular emphasis on the total return performance of the Fund’s Class A shares in comparison to the performance of funds in its Broadridge performance universe over the five-year period ended December 31, 2018, which the Trustees believed was a long enough period to reflect differing market conditions. The total return performance of the Fund’s Class A shares was in the 4th quintile relative to the other funds in the universe for this five-year period (the 1st quintile being the best performers and the 5th quintile being the worst performers). The total return performance of the Fund’s Class A shares was in the 2nd quintile for each of theone- and three-year periods ended December 31, 2018 relative to the Broadridge performance universe. Because of the passage of time, these performance results may differ from the performance results for more recent periods, including those shown elsewhere in this report.
In the course of their deliberations, the Trustees took into account information provided by MFS in connection with the contract review meetings, as well as during investment review meetings conducted with portfolio management personnel during the course of the year regarding the Fund’s performance. The Trustees noted that although the Fund’s five-year performance was substandard relative to its Broadridge performance universe, the Trustees observed that the Fund’sone- and three-year performance as compared to its Broadridge performance universe improved for the period ended December 31, 2018, as compared to the prior year. After reviewing these and related factors, the Trustees concluded, within the context of their overall conclusions regarding the investment advisory agreement, that they were satisfied with MFS’ responses and efforts relating to investment performance.
In assessing the reasonableness of the Fund’s advisory fee, the Trustees considered, among other information, the Fund’s advisory fee and the total expense ratio of the Fund’s Class A shares as a percentage of average daily net assets and the advisory fee and total expense ratios of the Broadridge expense group based on information
47
Board Review of Investment Advisory Agreement – continued
provided by Broadridge. The Trustees considered that, according to the data provided by Broadridge (which takes into account any fee reductions or expense limitations that were in effect during the Fund’s last fiscal year), the Fund’s effective advisory fee rate and total expense ratio were each approximately at the Broadridge expense group median.
The Trustees also considered the advisory fees charged by MFS to any institutional separate accounts advised by MFS (“separate accounts”) and unaffiliated investment companies for which MFS serves as subadviser (“subadvised funds”) that have comparable investment strategies to the Fund, if any. In comparing these fees, the Trustees considered information provided by MFS as to the generally broader scope of services provided by MFS to the Fund, as well as the more extensive regulatory burdens imposed on MFS in managing the Fund, in comparison to separate accounts and subadvised funds. The Trustees also considered the higher demands placed on MFS’ investment personnel and trading infrastructure as a result of the daily cashin-flows andout-flows of the Fund in comparison to separate accounts.
The Trustees also considered whether the Fund may benefit from any economies of scale in the management of the Fund in the event of growth in assets of the Fund and/or growth in assets of the MFS Funds as a whole. They noted that the Fund’s advisory fee rate schedule is subject to contractual breakpoints that reduce the Fund’s advisory fee rate on average daily net assets over $1 billion, $2.5 billion and $5 billion. The Trustees also noted that MFS has agreed in writing to waive a portion of the management fees of certain MFS Funds, including the Fund, if the total combined assets of certain funds within the MFS Funds’ complex increase above agreed upon thresholds (the “group fee waiver”), enabling the Fund’s shareholders to share in the benefits from any economies of scale at the complex level. The group fee waiver is reviewed and renewed annually between the Board and MFS. The Trustees concluded that the breakpoints and the group fee waiver were sufficient to allow the Fund to benefit from economies of scale as its assets and overall complex assets grow.
The Trustees also considered information prepared by MFS relating to MFS’ costs and profits with respect to the Fund, the MFS Funds considered as a group, and other investment companies and accounts advised by MFS, as well as MFS’ methodologies used to determine and allocate its costs to the MFS Funds, the Fund and other accounts and products for purposes of estimating profitability.
After reviewing these and other factors described herein, the Trustees concluded, within the context of their overall conclusions regarding the investment advisory agreement, that the advisory fees charged to the Fund represent reasonable compensation in light of the services being provided by MFS to the Fund.
In addition, the Trustees considered MFS’ resources and related efforts to continue to retain, attract and motivate capable personnel to serve the Fund. The Trustees also considered current and developing conditions in the financial services industry, including the presence of large and well-capitalized companies which are spending, and appear to be prepared to continue to spend, substantial sums to engage personnel and to provide services to competing investment companies. In this regard, the Trustees also considered the financial resources of MFS and its ultimate parent, Sun Life
48
Board Review of Investment Advisory Agreement – continued
Financial Inc. The Trustees also considered the advantages and possible disadvantages to the Fund of having an adviser that also serves other investment companies as well as other accounts.
The Trustees also considered the nature, quality, cost, and extent of administrative, transfer agency, and distribution services provided to the Fund by MFS and its affiliates under agreements and plans other than the investment advisory agreement, including any12b-1 fees the Fund pays to MFS Fund Distributors, Inc., an affiliate of MFS. The Trustees also considered the nature, extent and quality of certain other services MFS performs or arranges for on the Fund’s behalf, which may include securities lending programs, directed expense payment programs, class action recovery programs, and MFS’ interaction with third-party service providers, principally custodians andsub-custodians. The Trustees concluded that the variousnon-advisory services provided by MFS and its affiliates on behalf of the Fund were satisfactory.
The Trustees consideredso-called“fall-out benefits” to MFS such as reputational value derived from serving as investment manager to the MFS Funds. The Trustees also considered that, effective January 3, 2018, MFS had discontinued its historic practice of obtaining investment research from portfolio brokerage commissions paid by certain MFS Funds and would thereafter directly pay for or voluntarily reimburse a Fund, if applicable, for the costs of external research acquired through the use of the Fund’s portfolio brokerage commissions.
Based on their evaluation of factors that they deemed to be material, including those factors described above, the Board of Trustees, including the independent Trustees, concluded that the Fund’s investment advisory agreement with MFS should be continued for an additionalone-year period, commencing August 1, 2019.
49
PROXY VOTING POLICIES AND INFORMATION
MFS votes proxies on behalf of the fund pursuant to proxy voting policies and procedures that are available without charge, upon request, by calling1-800-225-2606, by visitingmfs.com/proxyvoting,or by visiting the SEC’s Web site athttp://www.sec.gov.
Information regarding how the fund voted proxies relating to portfolio securities during the most recent twelve-month period ended June 30 is available by August 31 of each year without charge by visitingmfs.com/proxyvoting,or by visiting the SEC’s Web site athttp://www.sec.gov.
QUARTERLY PORTFOLIO DISCLOSURE
The fund files a complete schedule of portfolio holdings with the SEC for the first and third quarters of each fiscal year on Form N-Q or as an exhibit to its reports onForm N-PORT (for first and third fiscal quarters ending March 31, 2019 or after). The fund’s Form N-Q or Form N-PORT reports are available on the SEC’s website athttp://www.sec.gov.A shareholder can obtain the portfolio holdings report for the first and third quarters of the fund’s fiscal year atmfs.com/openendfunds by choosing the fund’s name and then selecting the “Resources” tab and clicking on “Prospectus and Reports”.
FURTHER INFORMATION
From time to time, MFS may post important information about the fund or the MFS funds on the MFS web site (mfs.com). This information is available athttps://www.mfs.com/en-us/what-we-do/announcements.htmlor atmfs.com/openendfundsby choosing the fund’s name.
INFORMATION ABOUT FUND CONTRACTS AND LEGAL CLAIMS
The fund has entered into contractual arrangements with an investment adviser, administrator, distributor, shareholder servicing agent, 529 program manager (if applicable), and custodian who each provide services to the fund. Unless expressly stated otherwise, shareholders are not parties to, or intended beneficiaries of these contractual arrangements, and these contractual arrangements are not intended to create any shareholder right to enforce them against the service providers or to seek any remedy under them against the service providers, either directly or on behalf of the fund.
Under the Trust’s By-Laws and Declaration of Trust, any claims asserted against or on behalf of the MFS Funds, including claims against Trustees and Officers, must be brought in state and federal courts located within the Commonwealth of Massachusetts.
FEDERAL TAX INFORMATION (unaudited)
The fund will notify shareholders of amounts for use in preparing 2019 income tax forms in January 2020. The following information is provided pursuant to provisions of the Internal Revenue Code.
The fund designates the maximum amount allowable as qualified dividend income eligible to be taxed at the same rate as long-term capital gain.
The fund designates $173,403,000 as capital gain dividends paid during the fiscal year.
For corporate shareholders, 4.31% of the ordinary income dividends paid during the fiscal year qualify for the corporate dividends received deduction.
The fund designates the maximum amount allowable as Section 199A dividends as defined in Proposed Treasury Regulation §1.199A-3(d).
50
rev. 3/16
| | | | |
| | | |
FACTS | | WHAT DOES MFS DO WITH YOUR PERSONAL INFORMATION? | |  |
| | |
| Why? | | Financial companies choose how they share your personal information. Federal law gives consumers the right to limit some but not all sharing. Federal law also requires us to tell you how we collect, share, and protect your personal information. Please read this notice carefully to understand what we do. |
| | |
| What? | | The types of personal information we collect and share depend on the product or service you have with us. This information can include: • Social Security number and account balances • Account transactions and transaction history • Checking account information and wire transfer instructions When you areno longer our customer, we continue to share your information as described in this notice. |
| | |
| How? | | All financial companies need to share customers’ personal information to run their everyday business. In the section below, we list the reasons financial companies can share their customers’ personal information; the reasons MFS chooses to share; and whether you can limit this sharing. |
| | | | |
Reasons we can share your
personal information | | Does MFS
share? | | Can you limit
this sharing? |
For our everyday business purposes – such as to process your transactions, maintain your account(s), respond to court orders and legal investigations, or report to credit bureaus | | Yes | | No |
For our marketing purposes – to offer our products and services to you | | No | | We don’t share |
For joint marketing with other financial companies | | No | | We don’t share |
For our affiliates’ everyday business purposes – information about your transactions and experiences | | No | | We don’t share |
For our affiliates’ everyday business purposes – information about your creditworthiness | | No | | We don’t share |
| For nonaffiliates to market to you | | No | | We don’t share |
| | |
| | |
| Questions? | | Call800-225-2606 or go tomfs.com. |
51
| | |
| Who we are |
| Who is providing this notice? | | MFS Funds, MFS Investment Management, MFS Institutional Advisors, Inc., and MFS Heritage Trust Company. |
| | |
| What we do |
| How does MFS protect my personal information? | | To protect your personal information from unauthorized access and use, we use security measures that comply with federal law. These measures include procedural, electronic, and physical safeguards for the protection of the personal information we collect about you. |
| How does MFS collect my personal information? | | We collect your personal information, for example, when you • open an account or provide account information • direct us to buy securities or direct us to sell your securities • make a wire transfer We also collect your personal information from others, such as credit bureaus, affiliates, or other companies. |
| Why can’t I limit all sharing? | | Federal law gives you the right to limit only • sharing for affiliates’ everyday business purposes – information about your creditworthiness • affiliates from using your information to market to you • sharing for nonaffiliates to market to you State laws and individual companies may give you additional rights to limit sharing. |
| | |
| Definitions |
| Affiliates | | Companies related by common ownership or control. They can be financial and nonfinancial companies. • MFS does not share personal information with affiliates, except for everyday business purposes as described on page one of this notice. |
| Nonaffiliates | | Companies not related by common ownership or control. They can be financial and nonfinancial companies. • MFS does not share with nonaffiliates so they can market to you. |
| Joint marketing | | A formal agreement between nonaffiliated financial companies that together market financial products or services to you. • MFS doesn’t jointly market. |
| | |
| Other important information |
| If you own an MFS product or receive an MFS service in the name of a third party such as a bank or broker-dealer, their privacy policy may apply to you instead of ours. |
52
Save paper with eDelivery.

| MFS® will send you prospectuses, |
reports, and proxies directly viae-mail so you will get information faster with less mailbox clutter.
To sign up:
1. Go to mfs.com.
2. Log in via MFS® Access.
3. Select eDelivery.
If you own your MFS fund shares through a financial institution or a retirement plan, MFS® TALK, MFS® Access, or eDelivery may not be available to you.
CONTACT
WEB SITE
mfs.com
MFS TALK
1-800-637-8255
24 hours a day
ACCOUNT SERVICE AND LITERATURE
Shareholders
1-800-225-2606
Financial advisors
1-800-343-2829
Retirement plan services
1-800-637-1255
MAILING ADDRESS
MFS Service Center, Inc.
P.O. Box 219341
Kansas City, MO 64121-9341
OVERNIGHT MAIL
MFS Service Center, Inc.
Suite 219341
430 W 7th Street
Kansas City, MO 64105-1407
Annual Report
August 31, 2019

MFS® Research International Fund

Beginning on January 1, 2021, as permitted by regulations adopted by the U.S. Securities and Exchange Commission, paper copies of the fund’s annual and semiannual shareholder reports will no longer be sent by mail, unless you specifically request paper copies of the reports. Instead, the complete reports will be made available on the fund’s Web site (funds.mfs.com), and you will be notified by mail each time a report is posted and provided with a Web site link to access the report.
If you are already signed up to receive shareholder reports by email, you will not be affected by this change and you need not take any action. You may sign up to receive shareholder reports and other communications from the fund by email by contacting your financial intermediary (such as a broker-dealer or bank) or, if you hold your shares directly with the fund, by calling 1-800-225-2606 or by logging on to MFS Access at mfs.com.
Beginning on January 1, 2019, you may elect to receive all future reports in paper free of charge. Contact your financial intermediary to request that you continue to receive paper copies of your shareholder reports. If you invest directly with the fund, you can call 1-800-225-2606 or send an email request to orderliterature@mfs.com to let the fund know that you wish to continue receiving paper copies of your shareholder reports. Your election to receive reports in paper will apply to all funds held in your account if you invest through your financial intermediary or all funds held with the MFS fund complex if you invest directly.
RIF-ANN
MFS® Research International Fund
CONTENTS
The report is prepared for the general information of shareholders.
It is authorized for distribution to prospective investors only when preceded or accompanied by a current prospectus.
NOT FDIC INSURED• MAY LOSE VALUE• NO BANK GUARANTEE

LETTER FROM THE EXECUTIVE CHAIRMAN
Dear Shareholders:
Slowing global growth, low inflation, and increasing trade friction between the United States and China have been hallmarks of the past 12 months. After experiencing an
uptick in market volatility in late 2018, markets steadied during the first half of 2019, thanks in large measure to the adoption of a dovish policy stance on the part of global central banks, focused on supporting economic growth. The U.S. and China have raised tariffs on each other, heightening tensions and uncertainty. Despite repeated declarations by British Prime Minister Boris Johnson that the United Kingdom will leave the European Union on October 31, 2019, with or without a deal, apprehension over the possibility of a no-deal Brexit has eased somewhat, with Parliament having taken steps to block such an outcome.
Markets expect that the longest economic expansion in U.S. history will continue for the time being, albeit at a slower pace. In an effort to prolong the expansion, the U.S. Federal Reserve lowered interest rates for the first time in more than a decade in July and again in September. Similarly, the European Central Bank loosened policy in September. While markets have grown more risk averse, the accommodative monetary environment has helped push global interest rates toward record-low levels and has been somewhat supportive of risk assets despite the unsettled economic and geopolitical backdrop.
Since launching the first U.S. open-end mutual fund in 1924, MFS® has been committed to a single purpose: to create value by allocating capital responsibly for clients. Through our powerful global investment platform, we combine collective expertise, thoughtful risk management, and long-term discipline to uncover what we believe are the best investment opportunities in the market.
Respectfully,

Robert J. Manning
Executive Chairman
MFS Investment Management
October 17, 2019
The opinions expressed in this letter are subject to change and may not be relied upon for investment advice. No forecasts can be guaranteed.
1
PORTFOLIO COMPOSITION
Portfolio structure

| | | | |
| Top ten holdings | |
| Nestle S.A. | | | 3.7% | |
| Roche Holding AG | | | 2.8% | |
| Linde PLC | | | 2.4% | |
| Schneider Electric S.A. | | | 2.1% | |
| LVMH Moet Hennessy Louis Vuitton SE | | | 2.0% | |
| AIA Group Ltd. | | | 1.9% | |
| Novo Nordisk A.S., “B” | | | 1.9% | |
| Aon PLC | | | 1.7% | |
| Santen Pharmaceutical Co. Ltd. | | | 1.6% | |
| EssilorLuxottica | | | 1.5% | |
|
| Global equity sectors (k) | |
| Financial Services | | | 21.8% | |
| Capital Goods | | | 21.6% | |
| Health Care | | | 11.5% | |
| Technology | | | 11.4% | |
| Consumer Staples | | | 10.6% | |
| Energy | | | 8.9% | |
| Consumer Cyclicals | | | 8.8% | |
| Telecommunications/Cable Television | | | 4.1% | |
| | | | |
| Issuer country weightings (x) | |
| Japan | | | 20.0% | |
| Switzerland | | | 13.4% | |
| France | | | 11.4% | |
| United Kingdom | | | 9.1% | |
| United States | | | 8.3% | |
| Germany | | | 7.5% | |
| Hong Kong | | | 4.5% | |
| Australia | | | 3.1% | |
| Spain | | | 2.7% | |
| Other Countries | | | 20.0% | |
|
| Currency exposure weightings (y) | |
| Euro | | | 32.0% | |
| Japanese Yen | | | 20.0% | |
| Swiss Franc | | | 13.4% | |
| British Pound Sterling | | | 8.1% | |
| United States Dollar | | | 7.5% | |
| Hong Kong Dollar | | | 5.0% | |
| Australian Dollar | | | 3.1% | |
| Canadian Dollar | | | 2.6% | |
| Danish Krone | | | 2.4% | |
| Other Currencies | | | 5.9% | |
| (k) | The sectors set forth above and the associated portfolio composition are based on MFS’ own custom sector classification methodology. |
| (x) | Represents the portfolio’s exposure to issuer countries as a percentage of a portfolio’s net assets. For purposes of this presentation, United States includes Cash & Cash Equivalents. |
| (y) | Represents the portfolio’s exposure to a particular currency as a percentage of a portfolio’s net assets. For purposes of this presentation, United States Dollar includes Cash & Cash Equivalents. |
2
Portfolio Composition – continued
Cash & Cash Equivalents includes any cash, investments in money market funds, short-term securities, and other assets less liabilities. Please see the Statement of Assets and Liabilities for additional information related to the fund’s cash position and other assets and liabilities.
Percentages are based on net assets as of August 31, 2019.
The portfolio is actively managed and current holdings may be different.
3
MANAGEMENT REVIEW
Summary of Results
For the twelve months ended August 31, 2019, Class A shares of the MFS Research International Fund (fund) provided a total return of –1.82%, at net asset value. This compares with a return of –3.26% for the fund’s benchmark, the MSCI EAFE Index (net div).
Market Environment
Changes in market sentiment, driven largely by uncertainty over the outcome of trade negotiations between the United States and China, contributed to periodic bouts of volatility during the reporting period. The global economy decelerated, led by weakness in China and Europe.
The deteriorating global growth backdrop, along with declining inflationary pressures, prompted the US Federal Reserve to cut interest rates for the first time in over a decade at the end of July, which, combined with a more dovish posture beginning in early 2019, resulted in a sharp decline in long-term interest rates during the period’s second half, inverting portions of the US Treasury yield curve. Consequently, markets anticipate additional rate cuts in the coming quarters.
Globally, central banks have tilted more dovish as well, with China lowering reserve requirements, the Bank of Canada and Bank of England holding rates steady and the European Central Bank extending alow-interest-rate refinancing facility for eurozone banks to encourage the continued flow of credit. The ECB also indicated that it would likely lower rates further and possibly resume asset purchases this fall.
Emerging markets experienced considerable volatility earlier in the period (through the end of 2018) as tighter global financial conditions exposed structural weakness in some countries. Those conditions improved in 2019 as the Fed became more dovish, but diminished hopes for a trade deal between the US and China weighed on sentiment. Idiosyncratic factors negatively impacted some emerging economies, such as Argentina and Turkey.
From a geopolitical perspective, uncertainty over Brexit remains high. British Prime Minister Boris Johnson has shown a willingness to leave the European Union on October 31, 2019, without a withdrawal agreement, although Parliament has taken steps to prevent the United Kingdom from leaving the EU without a deal. The combination of Brexit uncertainty and the deteriorating outlook for global trade has damaged business confidence and hampered investment.
Contributors to Performance
Stock selection in both thecapital goodsandfinancial servicessectors contributed to performance relative to the MSCI EAFE Index. Within thecapital goodssector, overweight positions in industrial gas supplier Linde (Germany) and mining operator Rio Tinto (h) (Australia) boosted relative returns. The share price of Linde appreciated on the back of better-than-anticipated revenue and earnings, driven by robust sales growth and an increase in prices across all regions. Management also increased guidance for 2019, which further supported the stock. Within thefinancial servicessector,the fund’s positions in risk management and human capital consulting services provider Aon (b),
4
Management Review – continued
stock exchanges TMX Group (b) and Euronext (b) (Netherlands) and debit and credit transaction processing company Mastercard (b) also aided relative returns. The share price of Aon grew during the period as the company announced strong organic revenue growth, particularly within its reinsurance and commercial risk solutions segments. Additionally, operating margin expansion and a lower-than-expected tax rate further supported the company’s share price growth.
Other areas of relative strength included the fund’s overweight positions in global food company Nestle (Switzerland), electric utility company Iberdrola (Spain) and pharmaceutical products manufacturer Santen Pharmaceutical Co. (Japan). The share price of Nestle appreciated on the back of significant improvement in organic sales growth, with North American, Brazilian and Chinese operations performing particularly well year over year. Additionally, the fund’s position in software engineering solutions and technology services provider EPAM Systems (b) further supported relative results.
During the reporting period, the fund’s relative currency exposure, resulting primarily from differences between the fund’s and the benchmark’s exposures to holdings of securities denominated in foreign currencies, was another contributor to relative performance. All of MFS’ investment decisions are driven by the fundamentals of each individual opportunity and as such, it is common for our portfolios to have different currency exposure than the benchmark.
Detractors from Performance
Stock selection in theconsumer staplessector held back relative performance. However, there were no individual stocks within this sector that were among the fund’s largest relative detractors during the reporting period.
Stocks in other sectors that further diminished relative returns included overweight positions in financial services provider AIB Group (Ireland), investment management and banking firm UBS Group (Switzerland), financial services provider AEON Financial Service Co. (Japan), wealth management firm Julius Baer Group (Switzerland), industrial adhesive tapes maker Nitto Denko (Japan), parcel delivery services company Yamato Holdings Co. (Japan), automotive lighting systems manufacturer Koito Manufacturing Co. (Japan) and oil and gas company Galp Energia SGPS (Portugal). The share price of AIB Group fell towards the end of the reporting period after the company lowered its Net Interest Margin (NIM) growth, which was hurt by the negative interest rate environment. This, together with higher operating costs and growing capital demand, put pressure on the share price during the period. Additionally, not owning shares of pharmaceutical company Novartis (Switzerland) weakened relative returns. The stock of Novartis traded higher on the back of better-than-expected sales from innovative medicines and lower selling, general and administrative expenses. The company also announced FDA approval of Mayzent, a medicine for treating relapsing forms of multiple sclerosis, which further helped the stock price. The fund’s position in custom IT consulting and technology services provider Cognizant Technology Solutions (b) further weakened relative performance due to lower-than-expected revenues in its Financial
5
Management Review – continued
Services and Healthcare segments, which reflected a slowdown in the company’s mergers & acquisitions activity and shifts in spending patterns at a few of its large clients.
Respectfully,
Portfolio Manager(s)
Victoria Higley and Camille Humphries Lee
| (b) | Security is not a benchmark constituent. |
| (h) | Security was not held in the portfolio at period end. |
Note to Shareholders: Effective September 1, 2018, Camille Humphries Lee became a Portfolio Manager of the Fund. Effective March 31, 2019, Thomas Melendez was no longer a Portfolio Manager of the Fund. Effective April 30, 2019, Jose Luis Garcia was no longer a Portfolio Manager of the Fund.
The views expressed in this report are those of the portfolio manager(s) only through the end of the period of the report as stated on the cover and do not necessarily reflect the views of MFS or any other person in the MFS organization. These views are subject to change at any time based on market or other conditions, and MFS disclaims any responsibility to update such views. These views may not be relied upon as investment advice or an indication of trading intent on behalf of any MFS portfolio. References to specific securities are not recommendations of such securities, and may not be representative of any MFS portfolio’s current or future investments.
6
PERFORMANCE SUMMARYTHROUGH 8/31/19
The following chart illustrates a representative class of the fund’s historical performance in comparison to its benchmark(s). Performance results include the deduction of the maximum applicable sales charge and reflect the percentage change in net asset value, including reinvestment of dividends and capital gains distributions. The performance of other share classes will be greater than or less than that of the class depicted below. Benchmarks are unmanaged and may not be invested in directly. Benchmark returns do not reflect sales charges, commissions or expenses. (See Notes to Performance Summary.)
Performance data shown represents past performance and is no guarantee of future results. Investment return and principal value fluctuate so your shares, when sold, may be worth more or less than the original cost; current performance may be lower or higher than quoted. The performance shown does not reflect the deduction of taxes, if any, that a shareholder would pay on fund distributions or the redemption of fund shares.
Growth of a Hypothetical $10,000 Investment
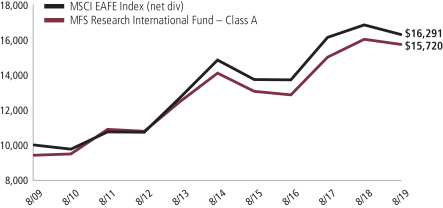
7
Performance Summary – continued
Total Returns through 8/31/19
Average annual without sales charge
| | | | | | | | | | | | |
| | | Share Class | | Class Inception Date | | 1-yr | | 5-yr | | 10-yr | | |
| | | A | | 1/02/97 | | (1.82)% | | 2.20% | | 5.25% | | |
| | | B | | 1/02/98 | | (2.63)% | | 1.43% | | 4.46% | | |
| | | C | | 1/02/98 | | (2.56)% | | 1.43% | | 4.47% | | |
| | | I | | 1/02/97 | | (1.61)% | | 2.46% | | 5.51% | | |
| | | R1 | | 4/01/05 | | (2.62)% | | 1.43% | | 4.46% | | |
| | | R2 | | 10/31/03 | | (2.14)% | | 1.94% | | 4.98% | | |
| | | R3 | | 4/01/05 | | (1.83)% | | 2.20% | | 5.25% | | |
| | | R4 | | 4/01/05 | | (1.65)% | | 2.44% | | 5.51% | | |
| | | R6 | | 5/01/06 | | (1.48)% | | 2.55% | | 5.56% | | |
| | | 529A | | 7/31/02 | | (1.94)% | | 2.17% | | 5.19% | | |
| | | 529B | | 7/31/02 | | (2.64)% | | 1.38% | | 4.40% | | |
| | | 529C | | 7/31/02 | | (2.68)% | | 1.38% | | 4.40% | | |
| | | | |
| Comparative benchmark(s) | | | | | | | | |
| | | MSCI EAFE Index (net div) (f) | | (3.26)% | | 1.89% | | 5.00% | | |
| | | | |
| Average annual with sales charge | | | | | | | | |
| | | A
With Initial Sales Charge (5.75%) | | (7.47)% | | 1.00% | | 4.63% | | |
| | | B
With CDSC (Declining over six years from 4% to 0%) (v) | | (6.36)% | | 1.05% | | 4.46% | | |
| | | C
With CDSC (1% for 12 months) (v) | | (3.49)% | | 1.43% | | 4.47% | | |
| | | 529A
With Initial Sales Charge (5.75%) | | (7.58)% | | 0.96% | | 4.57% | | |
| | | 529B
With CDSC (Declining over six years from 4% to 0%) (v) | | (6.36)% | | 1.01% | | 4.40% | | |
| | | 529C
With CDSC (1% for 12 months) (v) | | (3.61)% | | 1.38% | | 4.40% | | |
CDSC – Contingent Deferred Sales Charge.
Class I, R1, R2, R3, R4, and R6 shares do not have a sales charge.
On May 30, 2012, Class W shares were redesignated Class R5 shares. Total returns for Class R5 shares prior to May 30, 2012 reflect the performance history of Class W shares which had different fees and expenses than Class R5 shares. Effective August 26, 2016, Class R5 shares were renamed Class R6 shares.
| (f) | Source: FactSet Research Systems Inc. |
| (v) | Assuming redemption at the end of the applicable period. |
8
Performance Summary – continued
Benchmark Definition(s)
MSCI EAFE (Europe, Australasia, Far East) Index (net div) – a market capitalization-weighted index that is designed to measure equity market performance in the developed markets, excluding the U.S. and Canada.
It is not possible to invest directly in an index.
Notes to Performance Summary
Class 529 shares are only available in conjunction with qualified tuition programs, such as the MFS 529 Savings Plan. There also is an additional fee, which is detailed in the program description, on qualified tuition programs. If this fee was reflected, the performance for Class 529 shares would have been lower. This annual fee is waived for Oregon residents and for those accounts with assets of $25,000 or more.
Average annual total return represents the average annual change in value for each share class for the periods presented.
Performance results reflect any applicable expense subsidies and waivers in effect during the periods shown. Without such subsidies and waivers the fund’s performance results would be less favorable. Please see the prospectus and financial statements for complete details.
Performance results do not include adjustments made for financial reporting purposes in accordance with U.S. generally accepted accounting principles and may differ from amounts reported in the financial highlights.
From time to time the fund may receive proceeds from litigation settlements, without which performance would be lower.
9
EXPENSE TABLE
Fund expenses borne by the shareholders during the period, March 1, 2019 through August 31, 2019
As a shareholder of the fund, you incur two types of costs: (1) transaction costs, including sales charges (loads) on certain purchase or redemption payments, and (2) ongoing costs, including management fees; distribution and service(12b-1) fees; and other fund expenses. This example is intended to help you understand your ongoing costs (in dollars) of investing in the fund and to compare these costs with the ongoing costs of investing in other mutual funds.
The example is based on an investment of $1,000 invested at the beginning of the period and held for the entire period March 1, 2019 through August 31, 2019.
Actual Expenses
The first line for each share class in the following table provides information about actual account values and actual expenses. You may use the information in this line, together with the amount you invested, to estimate the expenses that you paid over the period. Simply divide your account value by $1,000 (for example, an $8,600 account value divided by $1,000 = 8.6), then multiply the result by the number in the first line under the heading entitled “Expenses Paid During Period” to estimate the expenses you paid on your account during this period.
Hypothetical Example for Comparison Purposes
The second line for each share class in the following table provides information about hypothetical account values and hypothetical expenses based on the fund’s actual expense ratio and an assumed rate of return of 5% per year before expenses, which is not the fund’s actual return. The hypothetical account values and expenses may not be used to estimate the actual ending account balance or expenses you paid for the period. You may use this information to compare the ongoing costs of investing in the fund and other funds. To do so, compare this 5% hypothetical example with the 5% hypothetical examples that appear in the shareholder reports of the other funds.
Please note that the expenses shown in the table are meant to highlight your ongoing costs only and do not reflect any transactional costs, such as sales charges (loads). Therefore, the second line for each share class in the table is useful in comparing ongoing costs only, and will not help you determine the relative total costs of owning different funds. In addition, if these transactional costs were included, your costs would have been higher.
10
Expense Table – continued
| | | | | | | | | | | | | | | | | | |
Share
Class | | | | Annualized
Expense Ratio | | | Beginning
Account Value
3/01/19 | | | Ending Account Value
8/31/19 | | | Expenses Paid During
Period (p) 3/01/19-8/31/19 | |
| A | | Actual | | | 1.10% | | | | $1,000.00 | | | | $1,025.22 | | | | $5.62 | |
| | Hypothetical (h) | | | 1.10% | | | | $1,000.00 | | | | $1,019.66 | | | | $5.60 | |
| B | | Actual | | | 1.85% | | | | $1,000.00 | | | | $1,021.34 | | | | $9.43 | |
| | Hypothetical (h) | | | 1.85% | | | | $1,000.00 | | | | $1,015.88 | | | | $9.40 | |
| C | | Actual | | | 1.85% | | | | $1,000.00 | | | | $1,021.29 | | | | $9.43 | |
| | Hypothetical (h) | | | 1.85% | | | | $1,000.00 | | | | $1,015.88 | | | | $9.40 | |
| I | | Actual | | | 0.85% | | | | $1,000.00 | | | | $1,026.56 | | | | $4.34 | |
| | Hypothetical (h) | | | 0.85% | | | | $1,000.00 | | | | $1,020.92 | | | | $4.33 | |
| R1 | | Actual | | | 1.85% | | | | $1,000.00 | | | | $1,021.09 | | | | $9.42 | |
| | Hypothetical (h) | | | 1.85% | | | | $1,000.00 | | | | $1,015.88 | | | | $9.40 | |
| R2 | | Actual | | | 1.35% | | | | $1,000.00 | | | | $1,023.74 | | | | $6.89 | |
| | Hypothetical (h) | | | 1.35% | | | | $1,000.00 | | | | $1,018.40 | | | | $6.87 | |
| R3 | | Actual | | | 1.10% | | | | $1,000.00 | | | | $1,025.49 | | | | $5.62 | |
| | Hypothetical (h) | | | 1.10% | | | | $1,000.00 | | | | $1,019.66 | | | | $5.60 | |
| R4 | | Actual | | | 0.85% | | | | $1,000.00 | | | | $1,026.33 | | | | $4.34 | |
| | Hypothetical (h) | | | 0.85% | | | | $1,000.00 | | | | $1,020.92 | | | | $4.33 | |
| R6 | | Actual | | | 0.72% | | | | $1,000.00 | | | | $1,027.12 | | | | $3.68 | |
| | Hypothetical (h) | | | 0.72% | | | | $1,000.00 | | | | $1,021.58 | | | | $3.67 | |
| 529A | | Actual | | | 1.13% | | | | $1,000.00 | | | | $1,024.56 | | | | $5.77 | |
| | Hypothetical (h) | | | 1.13% | | | | $1,000.00 | | | | $1,019.51 | | | | $5.75 | |
| 529B | | Actual | | | 1.90% | | | | $1,000.00 | | | | $1,021.08 | | | | $9.68 | |
| | Hypothetical (h) | | | 1.90% | | | | $1,000.00 | | | | $1,015.63 | | | | $9.65 | |
| 529C | | Actual | | | 1.89% | | | | $1,000.00 | | | | $1,020.89 | | | | $9.63 | |
| | Hypothetical (h) | | | 1.89% | | | | $1,000.00 | | | | $1,015.68 | | | | $9.60 | |
| (h) | 5% class return per year before expenses. |
| (p) | “Expenses Paid During Period” are equal to each class’s annualized expense ratio, as shown above, multiplied by the average account value over the period, multiplied by 184/365 (to reflect theone-half year period). Expenses paid do not include any applicable sales charges (loads). If these transaction costs had been included, your costs would have been higher. |
Notes to Expense Table
Each class with a Rule12b-1 service fee is subject to a rebate of a portion of such fee. Such rebates are included in the expense ratios above. For Class 529A and Class 529C shares, this rebate reduced the expense ratios above by 0.02% and 0.01%, respectively. See Note 3 in the Notes to Financial Statements for additional information.
11
PORTFOLIO OF INVESTMENTS
8/31/19
The Portfolio of Investments is a complete list of all securities owned by your fund. It is categorized by broad-based asset classes.
| | | | | | | | |
| Common Stocks - 98.7% | | | | | | | | |
| | |
| Issuer | | Shares/Par | | | Value ($) | |
| Airlines - 0.8% | | | | | | | | |
| Aena S.A. | | | 154,678 | | | $ | 27,879,804 | |
| Malaysia Airports Holdings Berhad | | | 8,399,400 | | | | 16,437,299 | |
| Ryanair Holdings PLC, ADR (a) | | | 490,409 | | | | 28,100,436 | |
| | | | | | | | |
| | | | | | | $ | 72,417,539 | |
| Alcoholic Beverages - 0.4% | | | | | | | | |
| Ambev S.A., ADR | | | 7,663,374 | | | $ | 34,791,718 | |
| | |
| Apparel Manufacturers - 4.0% | | | | | | | | |
| Adidas AG | | | 355,875 | | | $ | 105,486,222 | |
| Compagnie Financiere Richemont S.A. | | | 922,076 | | | | 71,548,812 | |
| LVMH Moet Hennessy Louis Vuitton SE | | | 436,704 | | | | 173,937,279 | |
| | | | | | | | |
| | | | | | | $ | 350,972,313 | |
| Automotive - 1.9% | | | | | | | | |
| Koito Manufacturing Co. Ltd. | | | 1,554,100 | | | $ | 72,998,155 | |
| USS Co. Ltd. | | | 4,929,100 | | | | 93,167,344 | |
| | | | | | | | |
| | | | | | | $ | 166,165,499 | |
| Brokerage & Asset Managers - 2.8% | | | | | | | | |
| Euronext N.V. | | | 1,224,355 | | | $ | 96,010,482 | |
| Hong Kong Exchanges & Clearing Ltd. | | | 2,220,500 | | | | 67,971,022 | |
| TMX Group Ltd. | | | 1,000,885 | | | | 86,684,730 | |
| | | | | | | | |
| | | | | | | $ | 250,666,234 | |
| Business Services - 1.8% | | | | | | | | |
| Cerved Information Solutions S.p.A. | | | 1,159,933 | | | $ | 9,338,086 | |
| Cognizant Technology Solutions Corp., “A” | | | 891,661 | | | | 54,739,069 | |
| Nomura Research Institute Ltd. | | | 4,824,000 | | | | 95,948,717 | |
| | | | | | | | |
| | | | | | | $ | 160,025,872 | |
| Computer Software - 1.2% | | | | | | | | |
| Cadence Design Systems, Inc. (a) | | | 504,323 | | | $ | 34,536,039 | |
| Check Point Software Technologies Ltd. (a) | | | 676,433 | | | | 72,851,834 | |
| | | | | | | | |
| | | | | | | $ | 107,387,873 | |
| Computer Software - Systems - 3.8% | | | | | | | | |
| Amadeus IT Group S.A. | | | 1,243,288 | | | $ | 92,589,652 | |
| Constellation Software, Inc. | | | 51,670 | | | | 50,323,724 | |
| EPAM Systems, Inc. (a) | | | 254,701 | | | | 48,731,942 | |
| Fujitsu Ltd. | | | 708,700 | | | | 54,722,701 | |
12
Portfolio of Investments – continued
| | | | | | | | |
| | |
| Issuer | | Shares/Par | | | Value ($) | |
| Common Stocks - continued | | | | | | | | |
| Computer Software - Systems - continued | | | | | | | | |
| Hitachi Ltd. | | | 2,632,100 | | | $ | 89,912,843 | |
| | | | | | | | |
| | | | | | | $ | 336,280,862 | |
| Conglomerates - 0.4% | | | | | | | | |
| Melrose Industries PLC | | | 17,333,555 | | | $ | 38,165,003 | |
| | |
| Construction - 1.9% | | | | | | | | |
| Techtronic Industries Co. Ltd. | | | 13,001,500 | | | $ | 89,878,233 | |
| Toto Ltd. | | | 2,214,700 | | | | 80,157,401 | |
| | | | | | | | |
| | | | | | | $ | 170,035,634 | |
| Consumer Products - 3.3% | | | | | | | | |
| Kao Corp. | | | 1,159,300 | | | $ | 83,743,288 | |
| L’Oréal | | | 381,453 | | | | 104,222,017 | |
| Reckitt Benckiser Group PLC | | | 1,340,455 | | | | 104,371,858 | |
| | | | | | | | |
| | | | | | | $ | 292,337,163 | |
| Consumer Services - 0.5% | | | | | | | | |
| 51job, Inc., ADR (a) | | | 611,152 | | | $ | 43,960,163 | |
| | |
| Containers - 0.9% | | | | | | | | |
| Brambles Ltd. | | | 10,537,865 | | | $ | 80,193,007 | |
| | |
| Electrical Equipment - 3.2% | | | | | | | | |
| Legrand S.A. | | | 1,359,642 | | | $ | 95,964,850 | |
| Schneider Electric SE | | | 2,188,103 | | | | 183,152,145 | |
| | | | | | | | |
| | | | | | | $ | 279,116,995 | |
| Electronics - 3.2% | | | | | | | | |
| Kyocera Corp. | | | 918,500 | | | $ | 54,599,026 | |
| Mellanox Technologies Ltd. (a) | | | 471,729 | | | | 50,498,589 | |
| Samsung Electronics Co. Ltd. | | | 1,505,426 | | | | 54,686,270 | |
| Silicon Motion Technology Corp., ADR | | | 969,882 | | | | 31,298,092 | |
| Taiwan Semiconductor Manufacturing Co. Ltd. | | | 11,473,326 | | | | 94,606,540 | |
| | | | | | | | |
| | | | | | | $ | 285,688,517 | |
| Energy - Independent - 1.5% | | | | | | | | |
| Cairn Energy PLC (a) | | | 19,821,869 | | | $ | 40,279,135 | |
| Caltex Australia Ltd. | | | 3,174,702 | | | | 51,226,562 | |
| Oil Search Ltd. | | | 8,292,173 | | | | 37,080,182 | |
| | | | | | | | |
| | | | | | | $ | 128,585,879 | |
| Energy - Integrated - 3.3% | | | | | | | | |
| BP PLC | | | 21,300,729 | | | $ | 129,645,433 | |
| Eni S.p.A. | | | 5,365,526 | | | | 80,670,679 | |
13
Portfolio of Investments – continued
| | | | | | | | |
| | |
| Issuer | | Shares/Par | | | Value ($) | |
| Common Stocks - continued | | | | | | | | |
| Energy - Integrated - continued | | | | | | | | |
| Galp Energia SGPS S.A., “B” | | | 5,412,411 | | | $ | 77,687,520 | |
| | | | | | | | |
| | | | | | | $ | 288,003,632 | |
| Food & Beverages - 4.9% | | | | | | | | |
| Danone S.A. | | | 1,242,900 | | | $ | 111,275,078 | |
| Nestle S.A. | | | 2,872,085 | | | | 322,102,991 | |
| | | | | | | | |
| | | | | | | $ | 433,378,069 | |
| Food & Drug Stores - 0.4% | | | | | | | | |
| Sundrug Co. Ltd. | | | 1,221,900 | | | $ | 38,013,644 | |
| | |
| Gaming & Lodging - 0.3% | | | | | | | | |
| Flutter Entertainment PLC | | | 377,498 | | | $ | 31,078,905 | |
| | |
| Insurance - 6.2% | | | | | | | | |
| AIA Group Ltd. | | | 17,500,800 | | | $ | 170,199,990 | |
| Aon PLC | | | 753,918 | | | | 146,900,923 | |
| Hiscox Ltd. | | | 3,847,509 | | | | 72,565,536 | |
| Swiss Re Ltd. | | | 585,274 | | | | 56,271,456 | |
| Zurich Insurance Group AG | | | 277,878 | | | | 98,882,174 | |
| | | | | | | | |
| | | | | | | $ | 544,820,079 | |
| Internet - 1.0% | | | | | | | | |
| NAVER Corp. | | | 330,412 | | | $ | 39,963,144 | |
| Scout24 AG | | | 767,655 | | | | 45,390,574 | |
| | | | | | | | |
| | | | | | | $ | 85,353,718 | |
| Machinery & Tools - 4.9% | | | | | | | | |
| Daikin Industries Ltd. | | | 1,066,800 | | | $ | 132,101,040 | |
| GEA Group AG | | | 2,311,607 | | | | 62,320,203 | |
| Kubota Corp. | | | 6,743,000 | | | | 96,795,548 | |
| Ritchie Bros. Auctioneers, Inc. | | | 1,354,952 | | | | 53,601,714 | |
| Schindler Holding AG | | | 390,702 | | | | 89,213,086 | |
| | | | | | | | |
| | | | | | | $ | 434,031,591 | |
| Major Banks - 4.0% | | | | | | | | |
| Barclays PLC | | | 23,395,495 | | | $ | 38,886,782 | |
| BNP Paribas | | | 2,405,248 | | | | 108,475,488 | |
| Mitsubishi UFJ Financial Group, Inc. | | | 20,849,300 | | | | 100,169,273 | |
| UBS Group AG | | | 10,408,936 | | | | 109,899,855 | |
| | | | | | | | |
| | | | | | | $ | 357,431,398 | |
| Medical & Health Technology & Services - 0.6% | | | | | | | | |
| Sonic Healthcare Ltd. | | | 2,795,221 | | | $ | 55,437,913 | |
14
Portfolio of Investments – continued
| | | | | | | | |
| | |
| Issuer | | Shares/Par | | | Value ($) | |
| Common Stocks - continued | | | | | | | | |
| Medical Equipment - 2.7% | | | | | | | | |
| EssilorLuxottica | | | 908,890 | | | $ | 134,104,371 | |
| Terumo Corp. | | | 3,496,600 | | | | 101,604,972 | |
| | | | | | | | |
| | | | | | | $ | 235,709,343 | |
| Natural Gas - Distribution - 0.5% | | | | | | | | |
| China Resources Gas Group Ltd. | | | 8,894,000 | | | $ | 43,957,260 | |
| | |
| Natural Gas - Pipeline - 1.1% | | | | | | | | |
| APA Group | | | 7,079,029 | | | $ | 52,488,775 | |
| Enbridge, Inc. | | | 1,256,658 | | | | 42,030,179 | |
| | | | | | | | |
| | | | | | | $ | 94,518,954 | |
| Network & Telecom - 0.4% | | | | | | | | |
| LM Ericsson Telephone Co., “B” | | | 4,759,925 | | | $ | 37,081,696 | |
| | |
| Other Banks & Diversified Financials - 6.1% | | | | | | | | |
| AEON Financial Service Co. Ltd. | | | 5,086,400 | | | $ | 74,499,350 | |
| AIB Group PLC | | | 19,896,794 | | | | 50,339,134 | |
| HDFC Bank Ltd. | | | 2,329,697 | | | | 72,687,721 | |
| Intesa Sanpaolo S.p.A. | | | 46,956,103 | | | | 102,863,249 | |
| Julius Baer Group Ltd. | | | 2,086,894 | | | | 82,505,847 | |
| KBC Group N.V. | | | 1,370,599 | | | | 79,294,598 | |
| Mastercard, Inc., “A” | | | 257,736 | | | | 72,519,178 | |
| | | | | | | | |
| | | | | | | $ | 534,709,077 | |
| Pharmaceuticals - 8.1% | | | | | | | | |
| Bayer AG | | | 1,738,654 | | | $ | 128,677,788 | |
| Kyowa Kirin Co. Ltd. | | | 2,190,700 | | | | 40,108,359 | |
| Novo Nordisk A.S., “B” | | | 3,204,969 | | | | 166,423,798 | |
| Roche Holding AG | | | 888,468 | | | | 242,909,261 | |
| Santen Pharmaceutical Co. Ltd. | | | 7,885,700 | | | | 138,139,857 | |
| | | | | | | | |
| | | | | | | $ | 716,259,063 | |
| Printing & Publishing - 1.3% | | | | | | | | |
| RELX PLC | | | 4,830,676 | | | $ | 115,527,164 | |
| | |
| Real Estate - 2.5% | | | | | | | | |
| Grand City Properties S.A. | | | 4,494,867 | | | $ | 103,148,912 | |
| LEG Immobilien AG | | | 974,190 | | | | 114,348,964 | |
| | | | | | | | |
| | | | | | | $ | 217,497,876 | |
| Restaurants - 0.7% | | | | | | | | |
| Yum China Holdings, Inc. | | | 1,302,472 | | | $ | 59,171,303 | |
15
Portfolio of Investments – continued
| | | | | | | | |
| | |
| Issuer | | Shares/Par | | | Value ($) | |
| Common Stocks - continued | | | | | | | | |
| Specialty Chemicals - 8.2% | | | | | | | | |
| Akzo Nobel N.V. | | | 1,404,132 | | | $ | 125,725,383 | |
| Croda International PLC | | | 1,712,999 | | | | 98,007,385 | |
| Kansai Paint Co. Ltd. | | | 2,127,300 | | | | 44,274,112 | |
| Linde PLC | | | 1,107,206 | | | | 207,720,455 | |
| Nitto Denko Corp. | | | 1,246,100 | | | | 58,014,878 | |
| Sika AG | | | 610,367 | | | | 87,631,372 | |
| Symrise AG | | | 1,067,390 | | | | 99,620,892 | |
| | | | | | | | |
| | | | | | | $ | 720,994,477 | |
| Specialty Stores - 0.8% | | | | | | | | |
| Dufry AG | | | 272,526 | | | $ | 22,093,949 | |
| Just Eat PLC (a) | | | 5,340,888 | | | | 51,067,496 | |
| | | | | | | | |
| | | | | | | $ | 73,161,445 | |
| Telecommunications - Wireless - 3.6% | | | | | | | | |
| Advanced Info Service Public Co. Ltd. | | | 8,089,500 | | | $ | 61,387,325 | |
| KDDI Corp. | | | 4,350,400 | | | | 116,095,298 | |
| SoftBank Corp. | | | 2,290,000 | | | | 103,986,069 | |
| Tele2 AB, “B” | | | 2,379,335 | | | | 33,564,002 | |
| | | | | | | | |
| | | | | | | $ | 315,032,694 | |
| Telephone Services - 0.5% | | | | | | | | |
| Hellenic Telecommunications Organization S.A. | | | 3,223,630 | | | $ | 43,011,163 | |
| | |
| Tobacco - 2.0% | | | | | | | | |
| British American Tobacco PLC | | | 3,238,823 | | | $ | 113,500,760 | |
| Japan Tobacco, Inc. | | | 2,899,200 | | | | 61,417,137 | |
| | | | | | | | |
| | | | | | | $ | 174,917,897 | |
| Trucking - 0.4% | | | | | | | | |
| Yamato Holdings Co. Ltd. | | | 1,909,800 | | | $ | 33,059,935 | |
| | |
| Utilities - Electric Power - 2.6% | | | | | | | | |
| CLP Holdings Ltd. | | | 6,706,500 | | | $ | 69,071,715 | |
| Iberdrola S.A. | | | 11,117,752 | | | | 114,271,728 | |
| Orsted A/S | | | 443,929 | | | | 42,387,071 | |
| | | | | | | | |
| | | | | | | $ | 225,730,514 | |
| Total Common Stocks (Identified Cost, $7,989,607,018) | | | $ | 8,704,679,081 | |
| | |
| Investment Companies (h) - 0.8% | | | | | | | | |
| Money Market Funds - 0.8% | | | | | | | | |
MFS Institutional Money Market Portfolio, 2.17% (v)
(Identified Cost, $73,234,464) | | | 73,238,661 | | | $ | 73,245,985 | |
| | |
| Other Assets, Less Liabilities - 0.5% | | | | | | | 45,917,324 | |
| Net Assets - 100.0% | | | | | | $ | 8,823,842,390 | |
16
Portfolio of Investments – continued
| (a) | Non-income producing security. |
| (h) | An affiliated issuer, which may be considered one in which the fund owns 5% or more of the outstanding voting securities, or a company which is under common control. At period end, the aggregate values of the fund’s investments in affiliated issuers and in unaffiliated issuers were $73,245,985 and $8,704,679,081, respectively. |
| (v) | Affiliated issuer that is available only to investment companies managed by MFS. The rate quoted for the MFS Institutional Money Market Portfolio is the annualizedseven-day yield of the fund at period end. |
The following abbreviations are used in this report and are defined:
| ADR | | American Depositary Receipt |
See Notes to Financial Statements
17
Financial Statements
STATEMENT OF ASSETS AND LIABILITIES
At 8/31/19
This statement represents your fund’s balance sheet, which details the assets and liabilities comprising the total value of the fund.
| | | | |
| Assets | | | | |
Investments in unaffiliated issuers, at value (identified cost, $7,989,607,018) | | | $8,704,679,081 | |
Investments in affiliated issuers, at value (identified cost, $73,234,464) | | | 73,245,985 | |
Foreign currency, at value (identified cost, $755,018) | | | 747,979 | |
Receivables for | | | | |
Investments sold | | | 4,386,565 | |
Fund shares sold | | | 22,402,975 | |
Dividends | | | 36,102,082 | |
Other assets | | | 6,185 | |
Total assets | | | $8,841,570,852 | |
| |
| Liabilities | | | | |
Payables for | | | | |
Investments purchased | | | $5,248,597 | |
Fund shares reacquired | | | 7,906,708 | |
Payable to affiliates | | | | |
Investment adviser | | | 491,479 | |
Administrative services fee | | | 4,737 | |
Shareholder servicing costs | | | 616,274 | |
Distribution and service fees | | | 19,631 | |
Program manager fees | | | 62 | |
Payable for independent Trustees’ compensation | | | 431 | |
Deferred country tax expense payable | | | 2,638,258 | |
Accrued expenses and other liabilities | | | 802,285 | |
Total liabilities | | | $17,728,462 | |
Net assets | | | $8,823,842,390 | |
| |
| Net assets consist of | | | | |
Paid-in capital | | | $8,180,070,173 | |
Total distributable earnings (loss) | | | 643,772,217 | |
Net assets | | | $8,823,842,390 | |
Shares of beneficial interest outstanding | | | 494,554,842 | |
18
Statement of Assets and Liabilities – continued
| | | | | | | | | | | | |
| | | |
| | | Net assets | | | Shares
outstanding | | | Net asset value
per share (a) | |
Class A | | | $622,639,247 | | | | 34,812,308 | | | | $17.89 | |
Class B | | | 3,346,612 | | | | 194,218 | | | | 17.23 | |
Class C | | | 22,825,267 | | | | 1,359,791 | | | | 16.79 | |
Class I | | | 593,064,477 | | | | 31,977,494 | | | | 18.55 | |
Class R1 | | | 1,751,160 | | | | 106,361 | | | | 16.46 | |
Class R2 | | | 98,935,216 | | | | 5,733,752 | | | | 17.25 | |
Class R3 | | | 61,213,793 | | | | 3,459,049 | | | | 17.70 | |
Class R4 | | | 54,352,403 | | | | 3,031,411 | | | | 17.93 | |
Class R6 | | | 7,350,640,526 | | | | 413,004,495 | | | | 17.80 | |
Class 529A | | | 11,805,353 | | | | 673,756 | | | | 17.52 | |
Class 529B | | | 287,173 | | | | 17,434 | | | | 16.47 | |
Class 529C | | | 2,981,163 | | | | 184,773 | | | | 16.13 | |
| (a) | Maximum offering price per share was equal to the net asset value per share for all share classes, except for Classes A and 529A, for which the maximum offering prices per share were $18.98 [100 / 94.25 x $17.89] and $18.59 [100 / 94.25 x $17.52], respectively. On sales of $50,000 or more, the maximum offering prices of Class A and Class 529A shares are reduced. A contingent deferred sales charge may be imposed on redemptions of Class A, Class B, Class C, Class 529B, and Class 529C shares. Redemption price per share was equal to the net asset value per share for Classes I, R1, R2, R3, R4, R6, and 529A. |
See Notes to Financial Statements
19
Financial Statements
STATEMENT OF OPERATIONS
Year ended 8/31/19
This statement describes how much your fund earned in investment income and accrued in expenses. It also describes any gains and/or losses generated by fund operations.
| | | | |
| Net investment income (loss) | | | | |
Income | | | | |
Dividends | | | $256,953,457 | |
Dividends from affiliated issuers | | | 2,346,425 | |
Income on securities loaned | | | 270,136 | |
Other | | | 56,155 | |
Interest | | | 119 | |
Foreign taxes withheld | | | (22,826,154 | ) |
Total investment income | | | $236,800,138 | |
Expenses | | | | |
Management fee | | | $57,016,907 | |
Distribution and service fees | | | 2,665,468 | |
Shareholder servicing costs | | | 2,024,561 | |
Program manager fees | | | 7,650 | |
Administrative services fee | | | 577,628 | |
Independent Trustees’ compensation | | | 96,788 | |
Custodian fee | | | 1,298,660 | |
Shareholder communications | | | 279,374 | |
Audit and tax fees | | | 73,031 | |
Legal fees | | | 75,785 | |
Miscellaneous | | | 444,248 | |
Total expenses | | | $64,560,100 | |
Reduction of expenses by investment adviser and distributor | | | (804,509 | ) |
Net expenses | | | $63,755,591 | |
Net investment income (loss) | | | $173,044,547 | |
| |
| Realized and unrealized gain (loss) | | | | |
Realized gain (loss) (identified cost basis) | | | | |
Unaffiliated issuers (net of $420,528 country tax) | | | $(158,729,760 | ) |
Affiliated issuers | | | 24,350 | |
Foreign currency | | | (914,679 | ) |
Net realized gain (loss) | | | $(159,620,089 | ) |
Change in unrealized appreciation or depreciation | | | | |
Unaffiliated issuers (net of $1,443,540 increase in deferred country tax) | | | $(109,137,766 | ) |
Affiliated issuers | | | 3,654 | |
Translation of assets and liabilities in foreign currencies | | | (316,725 | ) |
Net unrealized gain (loss) | | | $(109,450,837 | ) |
Net realized and unrealized gain (loss) | | | $(269,070,926 | ) |
Change in net assets from operations | | | $(96,026,379 | ) |
See Notes to Financial Statements
20
Financial Statements
STATEMENTS OF CHANGES IN NET ASSETS
These statements describe the increases and/or decreases in net assets resulting from operations, any distributions, and any shareholder transactions.
| | | | | | | | |
| | | Year ended | |
| | | 8/31/19 | | | 8/31/18 | |
| Change in net assets | | | | | | |
| | |
| From operations | | | | | | | | |
Net investment income (loss) | | | $173,044,547 | | | | $137,220,315 | |
Net realized gain (loss) | | | (159,620,089 | ) | | | 404,682,579 | |
Net unrealized gain (loss) | | | (109,450,837 | ) | | | (18,262,607 | ) |
Change in net assets from operations | | | $(96,026,379 | ) | | | $523,640,287 | |
Total distributions to shareholders (a) | | | $(399,506,930 | ) | | | $(107,400,473 | ) |
Change in net assets from fund share transactions | | | $904,797,447 | | | | $617,169,873 | |
Total change in net assets | | | $409,264,138 | | | | $1,033,409,687 | |
| | |
| Net assets | | | | | | | | |
At beginning of period | | | 8,414,578,252 | | | | 7,381,168,565 | |
At end of period (b) | | | $8,823,842,390 | | | | $8,414,578,252 | |
| (a) | Distributions from net investment income and from net realized gain are no longer required to be separately disclosed. For the year ended August 31, 2018, distributions from net investment income were $107,400,473. |
| (b) | Parenthetical disclosure of undistributed net investment income is no longer required. For the year ended August 31, 2018, end of period net assets included undistributed net investment income of $140,407,506. |
See Notes to Financial Statements
21
Financial Statements
FINANCIAL HIGHLIGHTS
The financial highlights table is intended to help you understand the fund’s financial performance for the past 5 years. Certain information reflects financial results for a single fund share. The total returns in the table represent the rate that an investor would have earned (or lost) on an investment in the fund share class (assuming reinvestment of all distributions) held for the entire period.
| | | | | | | | | | | | | | | | | | | | |
| Class A | | Year ended | |
| | | | | |
| | | 8/31/19 | | | 8/31/18 | | | 8/31/17 | | | 8/31/16 | | | 8/31/15 | |
Net asset value, beginning of period | | | $19.19 | | | | $18.16 | | | | $15.83 | | | | $16.34 | | | | $18.06 | |
|
| Income (loss) from investment operations | |
Net investment income (loss) (d) | | | $0.32 | | | | $0.26 | | | | $0.20 | (c) | | | $0.25 | | | | $0.26 | |
Net realized and unrealized gain (loss) | | | (0.77 | ) | | | 0.97 | | | | 2.39 | | | | (0.50 | ) | | | (1.60 | ) |
Total from investment operations | | | $(0.45 | ) | | | $1.23 | | | | $2.59 | | | | $(0.25 | ) | | | $(1.34 | ) |
|
| Less distributions declared to shareholders | |
From net investment income | | | $(0.72 | ) | | | $(0.20 | ) | | | $(0.26 | ) | | | $(0.26 | ) | | | $(0.38 | ) |
From net realized gain | | | (0.13 | ) | | | — | | | | — | | | | — | | | | — | |
Total distributions declared to shareholders | | | $(0.85 | ) | | | $(0.20 | ) | | | $(0.26 | ) | | | $(0.26 | ) | | | $(0.38 | ) |
Net asset value, end of period (x) | | | $17.89 | | | | $19.19 | | | | $18.16 | | | | $15.83 | | | | $16.34 | |
Total return (%) (r)(s)(t)(x) | | | (1.82 | ) | | | 6.79 | | | | 16.66 | (c) | | | (1.50 | ) | | | (7.44 | ) |
|
Ratios (%) (to average net assets)
and Supplemental data: | |
Expenses before expense reductions (f) | | | 1.10 | | | | 1.09 | | | | 1.12 | (c) | | | 1.14 | | | | 1.13 | |
Expenses after expense reductions (f) | | | 1.09 | | | | 1.08 | | | | 1.10 | (c) | | | 1.11 | | | | 1.09 | |
Net investment income (loss) | | | 1.79 | | | | 1.37 | | | | 1.25 | (c) | | | 1.62 | | | | 1.53 | |
Portfolio turnover | | | 22 | | | | 25 | | | | 33 | | | | 40 | | | | 28 | |
Net assets at end of period (000 omitted) | | | $622,639 | | | | $686,128 | | | | $693,538 | | | | $971,630 | | | | $1,178,013 | |
See Notes to Financial Statements
22
Financial Highlights – continued
| | | | | | | | | | | | | | | | | | | | |
| Class B | | Year ended | |
| | | | | |
| | | 8/31/19 | | | 8/31/18 | | | 8/31/17 | | | 8/31/16 | | | 8/31/15 | |
Net asset value, beginning of period | | | $18.48 | | | | $17.48 | | | | $15.21 | | | | $15.65 | | | | $17.26 | |
|
| Income (loss) from investment operations | |
Net investment income (loss) (d) | | | $0.16 | | | | $0.10 | | | | $0.10 | (c) | | | $0.12 | | | | $0.12 | |
Net realized and unrealized gain (loss) | | | (0.72 | ) | | | 0.95 | | | | 2.28 | | | | (0.47 | ) | | | (1.52 | ) |
Total from investment operations | | | $(0.56 | ) | | | $1.05 | | | | $2.38 | | | | $(0.35 | ) | | | $(1.40 | ) |
|
| Less distributions declared to shareholders | |
From net investment income | | | $(0.56 | ) | | | $(0.05 | ) | | | $(0.11 | ) | | | $(0.09 | ) | | | $(0.21 | ) |
From net realized gain | | | (0.13 | ) | | | — | | | | — | | | | — | | | | — | |
Total distributions declared to shareholders | | | $(0.69 | ) | | | $(0.05 | ) | | | $(0.11 | ) | | | $(0.09 | ) | | | $(0.21 | ) |
Net asset value, end of period (x) | | | $17.23 | | | | $18.48 | | | | $17.48 | | | | $15.21 | | | | $15.65 | |
Total return (%) (r)(s)(t)(x) | | | (2.63 | ) | | | 6.01 | | | | 15.77 | (c) | | | (2.20 | ) | | | (8.15 | ) |
|
Ratios (%) (to average net assets)
and Supplemental data: | |
Expenses before expense reductions (f) | | | 1.85 | | | | 1.84 | | | | 1.87 | (c) | | | 1.89 | | | | 1.88 | |
Expenses after expense reductions (f) | | | 1.84 | | | | 1.82 | | | | 1.85 | (c) | | | 1.86 | | | | 1.84 | |
Net investment income (loss) | | | 0.97 | | | | 0.55 | | | | 0.61 | (c) | | | 0.82 | | | | 0.70 | |
Portfolio turnover | | | 22 | | | | 25 | | | | 33 | | | | 40 | | | | 28 | |
Net assets at end of period (000 omitted) | | | $3,347 | | | | $4,922 | | | | $6,228 | | | | $7,967 | | | | $11,228 | |
| |
| Class C | | Year ended | |
| | | | | |
| | | 8/31/19 | | | 8/31/18 | | | 8/31/17 | | | 8/31/16 | | | 8/31/15 | |
Net asset value, beginning of period | | | $17.99 | | | | $17.03 | | | | $14.85 | | | | $15.31 | | | | $16.93 | |
|
| Income (loss) from investment operations | |
Net investment income (loss) (d) | | | $0.17 | | | | $0.08 | | | | $0.10 | (c) | | | $0.12 | | | | $0.12 | |
Net realized and unrealized gain (loss) | | | (0.70 | ) | | | 0.94 | | | | 2.21 | | | | (0.45 | ) | | | (1.50 | ) |
Total from investment operations | | | $(0.53 | ) | | | $1.02 | | | | $2.31 | | | | $(0.33 | ) | | | $(1.38 | ) |
|
| Less distributions declared to shareholders | |
From net investment income | | | $(0.54 | ) | | | $(0.06 | ) | | | $(0.13 | ) | | | $(0.13 | ) | | | $(0.24 | ) |
From net realized gain | | | (0.13 | ) | | | — | | | | — | | | | — | | | | — | |
Total distributions declared to shareholders | | | $(0.67 | ) | | | $(0.06 | ) | | | $(0.13 | ) | | | $(0.13 | ) | | | $(0.24 | ) |
Net asset value, end of period (x) | | | $16.79 | | | | $17.99 | | | | $17.03 | | | | $14.85 | | | | $15.31 | |
Total return (%) (r)(s)(t)(x) | | | (2.56 | ) | | | 5.97 | | | | 15.74 | (c) | | | (2.16 | ) | | | (8.17 | ) |
|
Ratios (%) (to average net assets)
and Supplemental data: | |
Expenses before expense reductions (f) | | | 1.85 | | | | 1.84 | | | | 1.87 | (c) | | | 1.89 | | | | 1.88 | |
Expenses after expense reductions (f) | | | 1.84 | | | | 1.83 | | | | 1.85 | (c) | | | 1.86 | | | | 1.84 | |
Net investment income (loss) | | | 1.05 | | | | 0.44 | | | | 0.64 | (c) | | | 0.85 | | | | 0.76 | |
Portfolio turnover | | | 22 | | | | 25 | | | | 33 | | | | 40 | | | | 28 | |
Net assets at end of period (000 omitted) | | | $22,825 | | | | $27,800 | | | | $48,570 | | | | $62,124 | | | | $77,442 | |
See Notes to Financial Statements
23
Financial Highlights – continued
| | | | | | | | | | | | | | | | | | | | |
| Class I | | Year ended | |
| | | | | |
| | | 8/31/19 | | | 8/31/18 | | | 8/31/17 | | | 8/31/16 | | | 8/31/15 | |
Net asset value, beginning of period | | | $19.87 | | | | $18.79 | | | | $16.38 | | | | $16.90 | | | | $18.66 | |
|
| Income (loss) from investment operations | |
Net investment income (loss) (d) | | | $0.37 | | | | $0.26 | | | | $0.30 | (c) | | | $0.30 | | | | $0.32 | |
Net realized and unrealized gain (loss) | | | (0.80 | ) | | | 1.06 | | | | 2.42 | | | | (0.51 | ) | | | (1.66 | ) |
Total from investment operations | | | $(0.43 | ) | | | $1.32 | | | | $2.72 | | | | $(0.21 | ) | | | $(1.34 | ) |
|
| Less distributions declared to shareholders | |
From net investment income | | | $(0.76 | ) | | | $(0.24 | ) | | | $(0.31 | ) | | | $(0.31 | ) | | | $(0.42 | ) |
From net realized gain | | | (0.13 | ) | | | — | | | | — | | | | — | | | | — | |
Total distributions declared to shareholders | | | $(0.89 | ) | | | $(0.24 | ) | | | $(0.31 | ) | | | $(0.31 | ) | | | $(0.42 | ) |
Net asset value, end of period (x) | | | $18.55 | | | | $19.87 | | | | $18.79 | | | | $16.38 | | | | $16.90 | |
Total return (%) (r)(s)(t)(x) | | | (1.61 | ) | | | 7.05 | | | | 16.95 | (c) | | | (1.24 | ) | | | (7.19 | ) |
|
Ratios (%) (to average net assets)
and Supplemental data: | |
Expenses before expense reductions (f) | | | 0.85 | | | | 0.84 | | | | 0.87 | (c) | | | 0.89 | | | | 0.88 | |
Expenses after expense reductions (f) | | | 0.84 | | | | 0.83 | | | | 0.86 | (c) | | | 0.86 | | | | 0.84 | |
Net investment income (loss) | | | 2.03 | | | | 1.31 | | | | 1.79 | (c) | | | 1.86 | | | | 1.80 | |
Portfolio turnover | | | 22 | | | | 25 | | | | 33 | | | | 40 | | | | 28 | |
Net assets at end of period (000 omitted) | | | $593,064 | | | | $658,193 | | | | $1,099,134 | | | | $2,187,011 | | | | $2,410,936 | |
| |
| Class R1 | | Year ended | |
| | | | | |
| | | 8/31/19 | | | 8/31/18 | | | 8/31/17 | | | 8/31/16 | | | 8/31/15 | |
Net asset value, beginning of period | | | $17.72 | | | | $16.80 | | | | $14.63 | | | | $15.08 | | | | $16.69 | |
|
| Income (loss) from investment operations | |
Net investment income (loss) (d) | | | $0.15 | | | | $0.11 | | | | $0.09 | (c) | | | $0.11 | | | | $0.11 | |
Net realized and unrealized gain (loss) | | | (0.69 | ) | | | 0.90 | | | | 2.20 | | | | (0.44 | ) | | | (1.47 | ) |
Total from investment operations | | | $(0.54 | ) | | | $1.01 | | | | $2.29 | | | | $(0.33 | ) | | | $(1.36 | ) |
|
| Less distributions declared to shareholders | |
From net investment income | | | $(0.59 | ) | | | $(0.09 | ) | | | $(0.12 | ) | | | $(0.12 | ) | | | $(0.25 | ) |
From net realized gain | | | (0.13 | ) | | | — | | | | — | | | | — | | | | — | |
Total distributions declared to shareholders | | | $(0.72 | ) | | | $(0.09 | ) | | | $(0.12 | ) | | | $(0.12 | ) | | | $(0.25 | ) |
Net asset value, end of period (x) | | | $16.46 | | | | $17.72 | | | | $16.80 | | | | $14.63 | | | | $15.08 | |
Total return (%) (r)(s)(t)(x) | | | (2.62 | ) | | | 5.99 | | | | 15.79 | (c) | | | (2.19 | ) | | | (8.18 | ) |
|
Ratios (%) (to average net assets)
and Supplemental data: | |
Expenses before expense reductions (f) | | | 1.85 | | | | 1.84 | | | | 1.87 | (c) | | | 1.89 | | | | 1.88 | |
Expenses after expense reductions (f) | | | 1.84 | | | | 1.83 | | | | 1.85 | (c) | | | 1.86 | | | | 1.84 | |
Net investment income (loss) | | | 0.95 | | | | 0.60 | | | | 0.61 | (c) | | | 0.78 | | | | 0.72 | |
Portfolio turnover | | | 22 | | | | 25 | | | | 33 | | | | 40 | | | | 28 | |
Net assets at end of period (000 omitted) | | | $1,751 | | | | $2,153 | | | | $2,089 | | | | $2,418 | | | | $3,509 | |
See Notes to Financial Statements
24
Financial Highlights – continued
| | | | | | | | | | | | | | | | | | | | |
| Class R2 | | Year ended | |
| | | | | |
| | | 8/31/19 | | | 8/31/18 | | | 8/31/17 | | | 8/31/16 | | | 8/31/15 | |
Net asset value, beginning of period | | | $18.53 | | | | $17.55 | | | | $15.31 | | | | $15.80 | | | | $17.48 | |
|
| Income (loss) from investment operations | |
Net investment income (loss) (d) | | | $0.26 | | | | $0.19 | | | | $0.17 | (c) | | | $0.21 | | | | $0.22 | |
Net realized and unrealized gain (loss) | | | (0.75 | ) | | | 0.95 | | | | 2.30 | | | | (0.48 | ) | | | (1.56 | ) |
Total from investment operations | | | $(0.49 | ) | | | $1.14 | | | | $2.47 | | | | $(0.27 | ) | | | $(1.34 | ) |
|
| Less distributions declared to shareholders | |
From net investment income | | | $(0.66 | ) | | | $(0.16 | ) | | | $(0.23 | ) | | | $(0.22 | ) | | | $(0.34 | ) |
From net realized gain | | | (0.13 | ) | | | — | | | | — | | | | — | | | | — | |
Total distributions declared to shareholders | | | $(0.79 | ) | | | $(0.16 | ) | | | $(0.23 | ) | | | $(0.22 | ) | | | $(0.34 | ) |
Net asset value, end of period (x) | | | $17.25 | | | | $18.53 | | | | $17.55 | | | | $15.31 | | | | $15.80 | |
Total return (%) (r)(s)(t)(x) | | | (2.14 | ) | | | 6.49 | | | | 16.37 | (c) | | | (1.69 | ) | | | (7.69 | ) |
|
Ratios (%) (to average net assets)
and Supplemental data: | |
Expenses before expense reductions (f) | | | 1.35 | | | | 1.34 | | | | 1.37 | (c) | | | 1.39 | | | | 1.38 | |
Expenses after expense reductions (f) | | | 1.34 | | | | 1.33 | | | | 1.35 | (c) | | | 1.36 | | | | 1.34 | |
Net investment income (loss) | | | 1.51 | | | | 1.04 | | | | 1.10 | (c) | | | 1.38 | | | | 1.29 | |
Portfolio turnover | | | 22 | | | | 25 | | | | 33 | | | | 40 | | | | 28 | |
Net assets at end of period (000 omitted) | | | $98,935 | | | | $121,197 | | | | $132,988 | | | | $152,133 | | | | $169,812 | |
| |
| Class R3 | | Year ended | |
| | | | | |
| | | 8/31/19 | | | 8/31/18 | | | 8/31/17 | | | 8/31/16 | | | 8/31/15 | |
Net asset value, beginning of period | | | $18.99 | | | | $17.98 | | | | $15.67 | | | | $16.16 | | | | $17.86 | |
|
| Income (loss) from investment operations | |
Net investment income (loss) (d) | | | $0.30 | | | | $0.25 | | | | $0.22 | (c) | | | $0.24 | | | | $0.25 | |
Net realized and unrealized gain (loss) | | | (0.75 | ) | | | 0.96 | | | | 2.35 | | | | (0.48 | ) | | | (1.58 | ) |
Total from investment operations | | | $(0.45 | ) | | | $1.21 | | | | $2.57 | | | | $(0.24 | ) | | | $(1.33 | ) |
|
| Less distributions declared to shareholders | |
From net investment income | | | $(0.71 | ) | | | $(0.20 | ) | | | $(0.26 | ) | | | $(0.25 | ) | | | $(0.37 | ) |
From net realized gain | | | (0.13 | ) | | | — | | | | — | | | | — | | | | — | |
Total distributions declared to shareholders | | | $(0.84 | ) | | | $(0.20 | ) | | | $(0.26 | ) | | | $(0.25 | ) | | | $(0.37 | ) |
Net asset value, end of period (x) | | | $17.70 | | | | $18.99 | | | | $17.98 | | | | $15.67 | | | | $16.16 | |
Total return (%) (r)(s)(t)(x) | | | (1.83 | ) | | | 6.75 | | | | 16.67 | (c) | | | (1.47 | ) | | | (7.44 | ) |
|
Ratios (%) (to average net assets)
and Supplemental data: | |
Expenses before expense reductions (f) | | | 1.10 | | | | 1.09 | | | | 1.12 | (c) | | | 1.14 | | | | 1.13 | |
Expenses after expense reductions (f) | | | 1.09 | | | | 1.08 | | | | 1.10 | (c) | | | 1.11 | | | | 1.09 | |
Net investment income (loss) | | | 1.73 | | | | 1.31 | | | | 1.37 | (c) | | | 1.59 | | | | 1.46 | |
Portfolio turnover | | | 22 | | | | 25 | | | | 33 | | | | 40 | | | | 28 | |
Net assets at end of period (000 omitted) | | | $61,214 | | | | $82,289 | | | | $91,653 | | | | $126,980 | | | | $165,656 | |
See Notes to Financial Statements
25
Financial Highlights – continued
| | | | | | | | | | | | | | | | | | | | |
| Class R4 | | Year ended | |
| | | | | |
| | | 8/31/19 | | | 8/31/18 | | | 8/31/17 | | | 8/31/16 | | | 8/31/15 | |
Net asset value, beginning of period | | | $19.25 | | | | $18.21 | | | | $15.86 | | | | $16.36 | | | | $18.09 | |
|
| Income (loss) from investment operations | |
Net investment income (loss) (d) | | | $0.36 | | | | $0.30 | | | | $0.28 | (c) | | | $0.30 | | | | $0.29 | |
Net realized and unrealized gain (loss) | | | (0.78 | ) | | | 0.98 | | | | 2.35 | | | | (0.50 | ) | | | (1.60 | ) |
Total from investment operations | | | $(0.42 | ) | | | $1.28 | | | | $2.63 | | | | $(0.20 | ) | | | $(1.31 | ) |
|
| Less distributions declared to shareholders | |
From net investment income | | | $(0.77 | ) | | | $(0.24 | ) | | | $(0.28 | ) | | | $(0.30 | ) | | | $(0.42 | ) |
From net realized gain | | | (0.13 | ) | | | — | | | | — | | | | — | | | | — | |
Total distributions declared to shareholders | | | $(0.90 | ) | | | $(0.24 | ) | | | $(0.28 | ) | | | $(0.30 | ) | | | $(0.42 | ) |
Net asset value, end of period (x) | | | $17.93 | | | | $19.25 | | | | $18.21 | | | | $15.86 | | | | $16.36 | |
Total return (%) (r)(s)(t)(x) | | | (1.65 | ) | | | 7.07 | | | | 16.92 | (c) | | | (1.20 | ) | | | (7.26 | ) |
|
Ratios (%) (to average net assets)
and Supplemental data: | |
Expenses before expense reductions (f) | | | 0.85 | | | | 0.84 | | | | 0.87 | (c) | | | 0.89 | | | | 0.88 | |
Expenses after expense reductions (f) | | | 0.84 | | | | 0.83 | | | | 0.86 | (c) | | | 0.86 | | | | 0.85 | |
Net investment income (loss) | | | 2.04 | | | | 1.57 | | | | 1.73 | (c) | | | 1.93 | | | | 1.70 | |
Portfolio turnover | | | 22 | | | | 25 | | | | 33 | | | | 40 | | | | 28 | |
Net assets at end of period (000 omitted) | | | $54,352 | | | | $58,578 | | | | $63,884 | | | | $148,243 | | | | $343,475 | |
| |
| Class R6 | | Year ended | |
| | | | | |
| | | 8/31/19 | | | 8/31/18 | | | 8/31/17 | | | 8/31/16 | | | 8/31/15 | |
Net asset value, beginning of period | | | $19.11 | | | | $18.10 | | | | $15.79 | | | | $16.30 | | | | $18.02 | |
|
| Income (loss) from investment operations | |
Net investment income (loss) (d) | | | $0.38 | | | | $0.34 | | | | $0.28 | (c) | | | $0.31 | | | | $0.32 | |
Net realized and unrealized gain (loss) | | | (0.77 | ) | | | 0.95 | | | | 2.36 | | | | (0.50 | ) | | | (1.60 | ) |
Total from investment operations | | | $(0.39 | ) | | | $1.29 | | | | $2.64 | | | | $(0.19 | ) | | | $(1.28 | ) |
|
| Less distributions declared to shareholders | |
From net investment income | | | $(0.79 | ) | | | $(0.28 | ) | | | $(0.33 | ) | | | $(0.32 | ) | | | $(0.44 | ) |
From net realized gain | | | (0.13 | ) | | | — | | | | — | | | | — | | | | — | |
Total distributions declared to shareholders | | | $(0.92 | ) | | | $(0.28 | ) | | | $(0.33 | ) | | | $(0.32 | ) | | | $(0.44 | ) |
Net asset value, end of period (x) | | | $17.80 | | | | $19.11 | | | | $18.10 | | | | $15.79 | | | | $16.30 | |
Total return (%) (r)(s)(t)(x) | | | (1.48 | ) | | | 7.12 | | | | 17.07 | (c) | | | (1.13 | ) | | | (7.13 | ) |
|
Ratios (%) (to average net assets)
and Supplemental data: | |
Expenses before expense reductions (f) | | | 0.74 | | | | 0.74 | | | | 0.77 | (c) | | | 0.79 | | | | 0.79 | |
Expenses after expense reductions (f) | | | 0.73 | | | | 0.73 | | | | 0.76 | (c) | | | 0.76 | | | | 0.75 | |
Net investment income (loss) | | | 2.18 | | | | 1.80 | | | | 1.72 | (c) | | | 2.02 | | | | 1.88 | |
Portfolio turnover | | | 22 | | | | 25 | | | | 33 | | | | 40 | | | | 28 | |
Net assets at end of period (000 omitted) | | | $7,350,641 | | | | $6,756,773 | | | | $5,228,377 | | | | $2,766,544 | | | | $3,010,863 | |
See Notes to Financial Statements
26
Financial Highlights – continued
| | | | | | | | | | | | | | | | | | | | |
| Class 529A | | Year ended | |
| | | | | |
| | | 8/31/19 | | | 8/31/18 | | | 8/31/17 | | | 8/31/16 | | | 8/31/15 | |
Net asset value, beginning of period | | | $18.83 | | | | $17.84 | | | | $15.61 | | | | $16.12 | | | | $17.81 | |
|
| Income (loss) from investment operations | |
Net investment income (loss) (d) | | | $0.31 | | | | $0.26 | | | | $0.23 | (c) | | | $0.19 | | | | $0.26 | |
Net realized and unrealized gain (loss) | | | (0.77 | ) | | | 0.95 | | | | 2.31 | | | | (0.44 | ) | | | (1.58 | ) |
Total from investment operations | | | $(0.46 | ) | | | $1.21 | | | | $2.54 | | | | $(0.25 | ) | | | $(1.32 | ) |
|
| Less distributions declared to shareholders | |
From net investment income | | | $(0.72 | ) | | | $(0.22 | ) | | | $(0.31 | ) | | | $(0.26 | ) | | | $(0.37 | ) |
From net realized gain | | | (0.13 | ) | | | — | | | | — | | | | — | | | | — | |
Total distributions declared to shareholders | | | $(0.85 | ) | | | $(0.22 | ) | | | $(0.31 | ) | | | $(0.26 | ) | | | $(0.37 | ) |
Net asset value, end of period (x) | | | $17.52 | | | | $18.83 | | | | $17.84 | | | | $15.61 | | | | $16.12 | |
Total return (%) (r)(s)(t)(x) | | | (1.94 | ) | | | 6.78 | | | | 16.60 | (c) | | | (1.52 | ) | | | (7.43 | ) |
|
Ratios (%) (to average net assets)
and Supplemental data: | |
Expenses before expense reductions (f) | | | 1.15 | | | | 1.15 | | | | 1.22 | (c) | | | 1.23 | | | | 1.23 | |
Expenses after expense reductions (f) | | | 1.13 | | | | 1.11 | | | | 1.13 | (c) | | | 1.13 | | | | 1.12 | |
Net investment income (loss) | | | 1.77 | | | | 1.37 | | | | 1.39 | (c) | | | 1.22 | | | | 1.51 | |
Portfolio turnover | | | 22 | | | | 25 | | | | 33 | | | | 40 | | | | 28 | |
Net assets at end of period (000 omitted) | | | $11,805 | | | | $12,615 | | | | $10,464 | | | | $9,101 | | | | $2,419 | |
| |
| Class 529B | | Year ended | |
| | | | | |
| | | 8/31/19 | | | 8/31/18 | | | 8/31/17 | | | 8/31/16 | | | 8/31/15 | |
Net asset value, beginning of period | | | $17.72 | | | | $16.79 | | | | $14.78 | | | | $15.19 | | | | $16.80 | |
|
| Income (loss) from investment operations | |
Net investment income (loss) (d) | | | $0.16 | | | | $0.10 | | | | $0.09 | (c) | | | $0.05 | | | | $0.10 | |
Net realized and unrealized gain (loss) | | | (0.71 | ) | | | 0.90 | | | | 2.18 | | | | (0.39 | ) | | | (1.47 | ) |
Total from investment operations | | | $(0.55 | ) | | | $1.00 | | | | $2.27 | | | | $(0.34 | ) | | | $(1.37 | ) |
|
| Less distributions declared to shareholders | |
From net investment income | | | $(0.57 | ) | | | $(0.07 | ) | | | $(0.26 | ) | | | $(0.07 | ) | | | $(0.24 | ) |
From net realized gain | | | (0.13 | ) | | | — | | | | — | | | | — | | | | — | |
Total distributions declared to shareholders | | | $(0.70 | ) | | | $(0.07 | ) | | | $(0.26 | ) | | | $(0.07 | ) | | | $(0.24 | ) |
Net asset value, end of period (x) | | | $16.47 | | | | $17.72 | | | | $16.79 | | | | $14.78 | | | | $15.19 | |
Total return (%) (r)(s)(t)(x) | | | (2.64 | ) | | | 5.94 | | | | 15.68 | (c) | | | (2.25 | ) | | | (8.17 | ) |
|
Ratios (%) (to average net assets)
and Supplemental data: | |
Expenses before expense reductions (f) | | | 1.90 | | | | 1.90 | | | | 1.97 | (c) | | | 1.98 | | | | 1.98 | |
Expenses after expense reductions (f) | | | 1.89 | | | | 1.88 | | | | 1.90 | (c) | | | 1.90 | | | | 1.89 | |
Net investment income (loss) | | | 1.00 | | | | 0.56 | | | | 0.58 | (c) | | | 0.37 | | | | 0.63 | |
Portfolio turnover | | | 22 | | | | 25 | | | | 33 | | | | 40 | | | | 28 | |
Net assets at end of period (000 omitted) | | | $287 | | | | $358 | | | | $386 | | | | $434 | | | | $138 | |
See Notes to Financial Statements
27
Financial Highlights – continued
| | | | | | | | | | | | | | | | | | | | |
| Class 529C | | Year ended | |
| | | | | |
| | | 8/31/19 | | | 8/31/18 | | | 8/31/17 | | | 8/31/16 | | | 8/31/15 | |
Net asset value, beginning of period | | | $17.38 | | | | $16.51 | | | | $14.53 | | | | $15.01 | | | | $16.61 | |
|
| Income (loss) from investment operations | |
Net investment income (loss) (d) | | | $0.15 | | | | $0.09 | | | | $0.10 | (c) | | | $0.07 | | | | $0.11 | |
Net realized and unrealized gain (loss) | | | (0.69 | ) | | | 0.89 | | | | 2.15 | | | | (0.41 | ) | | | (1.46 | ) |
Total from investment operations | | | $(0.54 | ) | | | $0.98 | | | | $2.25 | | | | $(0.34 | ) | | | $(1.35 | ) |
|
| Less distributions declared to shareholders | |
From net investment income | | | $(0.58 | ) | | | $(0.11 | ) | | | $(0.27 | ) | | | $(0.14 | ) | | | $(0.25 | ) |
From net realized gain | | | (0.13 | ) | | | — | | | | — | | | | — | | | | — | |
Total distributions declared to shareholders | | | $(0.71 | ) | | | $(0.11 | ) | | | $(0.27 | ) | | | $(0.14 | ) | | | $(0.25 | ) |
Net asset value, end of period (x) | | | $16.13 | | | | $17.38 | | | | $16.51 | | | | $14.53 | | | | $15.01 | |
Total return (%) (r)(s)(t)(x) | | | (2.68 | ) | | | 5.93 | | | | 15.78 | (c) | | | (2.28 | ) | | | (8.17 | ) |
|
Ratios (%) (to average net assets)
and Supplemental data: | |
Expenses before expense reductions (f) | | | 1.90 | | | | 1.90 | | | | 1.97 | (c) | | | 1.99 | | | | 1.98 | |
Expenses after expense reductions (f) | | | 1.89 | | | | 1.87 | | | | 1.89 | (c) | | | 1.90 | | | | 1.89 | |
Net investment income (loss) | | | 0.95 | | | | 0.53 | | | | 0.63 | (c) | | | 0.47 | | | | 0.72 | |
Portfolio turnover | | | 22 | | | | 25 | | | | 33 | | | | 40 | | | | 28 | |
Net assets at end of period (000 omitted) | | | $2,981 | | | | $3,572 | | | | $3,856 | | | | $3,298 | | | | $980 | |
| (c) | Amount reflects aone-time reimbursement of expenses by the custodian (or former custodian) without which net investment income and performance would be lower and expenses would be higher. |
| (d) | Per share data is based on average shares outstanding. |
| (f) | Ratios do not reflect reductions from fees paid indirectly, if applicable. |
| (r) | Certain expenses have been reduced without which performance would have been lower. |
| (s) | From time to time the fund may receive proceeds from litigation settlements, without which performance would be lower. |
| (t) | Total returns do not include any applicable sales charges. |
| (x) | The net asset values and total returns have been calculated on net assets which include adjustments made in accordance with U.S. generally accepted accounting principles required at period end for financial reporting purposes. |
See Notes to Financial Statements
28
NOTES TO FINANCIAL STATEMENTS
(1) Business and Organization
MFS Research International Fund (the fund) is a diversified series of MFS Series Trust I (the trust). The trust is organized as a Massachusetts business trust and is registered under the Investment Company Act of 1940, as amended, as anopen-end management investment company.
The fund is an investment company and accordingly follows the investment company accounting and reporting guidance of the Financial Accounting Standards Board (FASB) Accounting Standards Codification Topic 946 Financial Services – Investment Companies.
(2) Significant Accounting Policies
General– The preparation of financial statements in conformity with U.S. generally accepted accounting principles requires management to make estimates and assumptions that affect the reported amounts of assets and liabilities, and disclosure of contingent assets and liabilities at the date of the financial statements and the reported amounts of increases and decreases in net assets from operations during the reporting period. Actual results could differ from those estimates. In the preparation of these financial statements, management has evaluated subsequent events occurring after the date of the fund’s Statement of Assets and Liabilities through the date that the financial statements were issued. The fund invests in foreign securities. Investments in foreign securities are vulnerable to the effects of changes in the relative values of the local currency and the U.S. dollar and to the effects of changes in each country’s market, economic, industrial, political, regulatory, geopolitical, and other conditions.
Balance Sheet Offsetting– The fund’s accounting policy with respect to balance sheet offsetting is that, absent an event of default by the counterparty or a termination of the agreement, the International Swaps and Derivatives Association (ISDA) Master Agreement, or similar agreement, does not result in an offset of reported amounts of financial assets and financial liabilities in the Statement of Assets and Liabilities across transactions between the fund and the applicable counterparty. The fund’s right to setoff may be restricted or prohibited by the bankruptcy or insolvency laws of the particular jurisdiction to which a specific master netting agreement counterparty is subject. Balance sheet offsetting disclosures, to the extent applicable to the fund, have been included in the fund’s Significant Accounting Policies note under the captions for each of the fund’sin-scope financial instruments and transactions.
Investment Valuations– Equity securities, including restricted equity securities, are generally valued at the last sale or official closing price on their primary market or exchange as provided by a third-party pricing service. Equity securities, for which there were no sales reported that day, are generally valued at the last quoted daily bid quotation on their primary market or exchange as provided by a third-party pricing service. Short-term instruments with a maturity at issuance of 60 days or less may be valued at amortized cost, which approximates market value.Open-end investment companies are generally valued at net asset value per share. Securities and other assets generally valued on the basis of information from a third-party pricing service may also be valued at a broker/dealer bid quotation. In determining values, third-party pricing
29
Notes to Financial Statements – continued
services can utilize both transaction data and market information such as yield, quality, coupon rate, maturity, type of issue, trading characteristics, and other market data. The values of foreign securities and other assets and liabilities expressed in foreign currencies are converted to U.S. dollars using the mean of bid and asked prices for rates provided by a third-party pricing service.
The Board of Trustees has delegated primary responsibility for determining or causing to be determined the value of the fund’s investments (including any fair valuation) to the adviser pursuant to valuation policies and procedures approved by the Board. If the adviser determines that reliable market quotations are not readily available, investments are valued at fair value as determined in good faith by the adviser in accordance with such procedures under the oversight of the Board of Trustees. Under the fund’s valuation policies and procedures, market quotations are not considered to be readily available for most types of debt instruments and floating rate loans and many types of derivatives. These investments are generally valued at fair value based on information from third-party pricing services. In addition, investments may be valued at fair value if the adviser determines that an investment’s value has been materially affected by events occurring after the close of the exchange or market on which the investment is principally traded (such as foreign exchange or market) and prior to the determination of the fund’s net asset value, or after the halt of trading of a specific security where trading does not resume prior to the close of the exchange or market on which the security is principally traded. Events that occur after foreign markets close (such as developments in foreign markets and significant movements in the U.S. markets) and prior to the determination of the fund’s net asset value may be deemed to have a material effect on the value of securities traded in foreign markets. Accordingly, the fund’s foreign equity securities may often be valued at fair value. The adviser generally relies on third-party pricing services or other information (such as the correlation with price movements of similar securities in the same or other markets; the type, cost and investment characteristics of the security; the business and financial condition of the issuer; and trading and other market data) to assist in determining whether to fair value and at what value to fair value an investment. The value of an investment for purposes of calculating the fund’s net asset value can differ depending on the source and method used to determine value. When fair valuation is used, the value of an investment used to determine the fund’s net asset value may differ from quoted or published prices for the same investment. There can be no assurance that the fund could obtain the fair value assigned to an investment if it were to sell the investment at the same time at which the fund determines its net asset value per share.
Various inputs are used in determining the value of the fund’s assets or liabilities. These inputs are categorized into three broad levels. In certain cases, the inputs used to measure fair value may fall into different levels of the fair value hierarchy. In such cases, an investment’s level within the fair value hierarchy is based on the lowest level of input that is significant to the fair value measurement. The fund’s assessment of the significance of a particular input to the fair value measurement in its entirety requires judgment, and considers factors specific to the investment. Level 1 includes unadjusted quoted prices in active markets for identical assets or liabilities. Level 2 includes other significant observable market-based inputs (including quoted prices for similar securities, interest rates, prepayment speed, and credit risk). Level 3 includes
30
Notes to Financial Statements – continued
unobservable inputs, which may include the adviser’s own assumptions in determining the fair value of investments. The following is a summary of the levels used as of August 31, 2019 in valuing the fund’s assets or liabilities:
| | | | | | | | | | | | | | | | |
| | | | |
| Financial Instruments | | Level 1 | | | Level 2 | | | Level 3 | | | Total | |
| Equity Securities: | | | | | | | | | | | | | | | | |
Japan | | | $1,763,528,948 | | | | $— | | | | $— | | | | $1,763,528,948 | |
Switzerland | | | 1,183,058,803 | | | | — | | | | — | | | | 1,183,058,803 | |
France | | | 1,007,141,709 | | | | — | | | | — | | | | 1,007,141,709 | |
United Kingdom | | | 802,016,551 | | | | — | | | | — | | | | 802,016,551 | |
Germany | | | 658,993,557 | | | | — | | | | — | | | | 658,993,557 | |
United States | | | 615,646,195 | | | | — | | | | — | | | | 615,646,195 | |
Hong Kong | | | 397,120,960 | | | | — | | | | — | | | | 397,120,960 | |
Australia | | | 276,426,439 | | | | — | | | | — | | | | 276,426,439 | |
Spain | | | 234,741,183 | | | | — | | | | — | | | | 234,741,183 | |
Other Countries | | | 1,704,617,411 | | | | 61,387,325 | | | | — | | | | 1,766,004,736 | |
| Mutual Funds | | | 73,245,985 | | | | — | | | | — | | | | 73,245,985 | |
| Total | | | $8,716,537,741 | | | | $61,387,325 | | | | $— | | | | $8,777,925,066 | |
For further information regarding security characteristics, see the Portfolio of Investments.
Foreign Currency Translation– Purchases and sales of foreign investments, income, and expenses are converted into U.S. dollars based upon currency exchange rates prevailing on the respective dates of such transactions or on the reporting date for foreign denominated receivables and payables. Gains and losses attributable to foreign currency exchange rates on sales of securities are recorded for financial statement purposes as net realized gains and losses on investments. Gains and losses attributable to foreign exchange rate movements on receivables, payables, income and expenses are recorded for financial statement purposes as foreign currency transaction gains and losses. That portion of both realized and unrealized gains and losses on investments that results from fluctuations in foreign currency exchange rates is not separately disclosed.
Security Loans– Under its Securities Lending Agency Agreement with the fund, State Street Bank and Trust Company, as lending agent, loans the securities of the fund to certain qualified institutions (the “Borrowers”) approved by the fund. Security loans can be terminated at the discretion of either the lending agent or the fund and the related securities must be returned within the earlier of the standard trade settlement period for such securities or within three business days. The loans are collateralized by cash and/or U.S. Treasury and federal agency obligations in an amount typically at least equal to the market value of the securities loaned. On loans collateralized by cash, the cash collateral is invested in a money market fund. The market value of the loaned securities is determined at the close of business of the fund and any additional required collateral is delivered to the fund on the next business day. The lending agent provides the fund with indemnification against Borrower default. In the event of Borrower default, the lending agent will, for the benefit of the fund, either purchase securities identical to those loaned or, when such purchase is commercially impracticable, pay the fund the market value of the loaned securities. In return, the lending agent assumes
31
Notes to Financial Statements – continued
the fund’s rights to the related collateral. If the collateral value is less than the cost to purchase identical securities, the lending agent is responsible for the shortfall, but only to the extent that such shortfall is not due to a decline in collateral value resulting from collateral reinvestment for which the fund bears the risk of loss. A portion of the income generated upon investment of the collateral is remitted to the Borrowers, and the remainder is allocated between the fund and the lending agent. On loans collateralized by U.S. Treasury and/or federal agency obligations, a fee is received from the Borrower, and is allocated between the fund and the lending agent. Income from securities lending is separately reported in the Statement of Operations. The dividend and interest income earned on the securities loaned is accounted for in the same manner as other dividend and interest income. At August 31, 2019, there were no securities on loan or collateral outstanding.
Indemnifications– Under the fund’s organizational documents, its officers and Trustees may be indemnified against certain liabilities and expenses arising out of the performance of their duties to the fund. Additionally, in the normal course of business, the fund enters into agreements with service providers that may contain indemnification clauses. The fund’s maximum exposure under these agreements is unknown as this would involve future claims that may be made against the fund that have not yet occurred.
Investment Transactions and Income– Investment transactions are recorded on the trade date. Interest income is recorded on the accrual basis. Dividends received in cash are recorded on theex-dividend date. Certain dividends from foreign securities will be recorded when the fund is informed of the dividend if such information is obtained subsequent to theex-dividend date. Dividend and interest payments received in additional securities are recorded on theex-dividend orex-interest date in an amount equal to the value of the security on such date.
The fund may receive proceeds from litigation settlements. Any proceeds received from litigation involving portfolio holdings are reflected in the Statement of Operations in realized gain/loss if the security has been disposed of by the fund or in unrealized gain/loss if the security is still held by the fund. Any other proceeds from litigation not related to portfolio holdings are reflected as other income in the Statement of Operations.
Tax Matters and Distributions– The fund intends to qualify as a regulated investment company, as defined under Subchapter M of the Internal Revenue Code, and to distribute all of its taxable income, including realized capital gains. As a result, no provision for federal income tax is required. The fund’s federal tax returns, when filed, will remain subject to examination by the Internal Revenue Service for a three year period. Management has analyzed the fund’s tax positions taken on federal and state tax returns for all open tax years and does not believe that there are any uncertain tax positions that require recognition of a tax liability. Foreign taxes, if any, have been accrued by the fund in the accompanying financial statements in accordance with the applicable foreign tax law. Foreign income taxes may be withheld by certain countries in which the fund invests. Additionally, capital gains realized by the fund on securities issued in or by certain foreign countries may be subject to capital gains tax imposed by those countries.
32
Notes to Financial Statements – continued
Distributions to shareholders are recorded on theex-dividend date. Income and capital gain distributions are determined in accordance with income tax regulations, which may differ from U.S. generally accepted accounting principles. Certain capital accounts in the financial statements are periodically adjusted for permanent differences in order to reflect their tax character. These adjustments have no impact on net assets or net asset value per share. Temporary differences which arise from recognizing certain items of income, expense, gain or loss in different periods for financial statement and tax purposes will reverse at some time in the future. Distributions in excess of net investment income or net realized gains are temporary overdistributions for financial statement purposes resulting from differences in the recognition or classification of income or distributions for financial statement and tax purposes.
Book/tax differences primarily relate to passive foreign investment companies and wash sale loss deferrals.
The tax character of distributions declared to shareholders for the last two fiscal years is as follows:
| | | | | | | | |
| | |
| | | Year ended
8/31/19 | | | Year ended
8/31/18 | |
| Ordinary income (including any short-term capital gains) | | | $342,429,321 | | | | $107,400,473 | |
| Long-term capital gains | | | 57,077,609 | | | | — | |
| | |
| Total distributions | | | $399,506,930 | | | | $107,400,473 | |
The federal tax cost and the tax basis components of distributable earnings were as follows:
| | | | |
| |
| As of 8/31/19 | | | |
| |
| Cost of investments | | | $8,130,578,038 | |
| Gross appreciation | | | 1,392,055,785 | |
| |
| Gross depreciation | | | (744,708,757 | ) |
| Net unrealized appreciation (depreciation) | | | $647,347,028 | |
| |
| Undistributed ordinary income | | | 161,295,878 | |
| Post-October capital loss deferral | | | (163,984,198 | ) |
| Other temporary differences | | | (886,491 | ) |
Multiple Classes of Shares of Beneficial Interest– The fund offers multiple classes of shares, which differ in their respective distribution, service, and program manager fees. The fund’s income, realized and unrealized gain (loss), and common expenses are allocated to shareholders based on the daily net assets of each class. Dividends are declared separately for each class. Differences in per share dividend rates are generally due to differences in separate class expenses. Class B and Class 529B shares will convert to Class A and Class 529A shares, respectively, approximately eight years after purchase. Class C and Class 529C shares will convert to Class A and Class 529A shares,
33
Notes to Financial Statements – continued
respectively, approximately ten years after purchase. The fund’s distributions declared to shareholders as reported in the Statements of Changes in Net Assets are presented by class as follows:
| | | | | | | | | | | | | | | | |
| | | From net investment
income | | | From net realized
gain | |
| | | | |
| | | Year
ended
8/31/19 | | | Year
ended
8/31/18 | | | Year
ended
8/31/19 | | | Year
ended
8/31/18 | |
| Class A | | | $25,901,069 | | | | $7,325,996 | | | | $4,647,196 | | | | $— | |
| Class B | | | 137,137 | | | | 16,831 | | | | 31,746 | | | | — | |
| Class C | | | 790,024 | | | | 151,470 | | | | 190,635 | | | | — | |
| Class I | | | 24,754,668 | | | | 14,314,497 | | | | 4,190,792 | | | | — | |
| Class R1 | | | 69,066 | | | | 10,568 | | | | 15,219 | | | | — | |
| Class R2 | | | 4,169,222 | | | | 1,118,075 | | | | 813,076 | | | | — | |
| Class R3 | | | 2,863,469 | | | | 992,523 | | | | 518,390 | | | | — | |
| Class R4 | | | 2,230,773 | | | | 791,803 | | | | 376,275 | | | | — | |
| Class R6 | | | 280,916,284 | | | | 82,520,374 | | | | 46,180,904 | | | | — | |
| Class 529A | | | 471,755 | | | | 130,984 | | | | 85,101 | | | | — | |
| Class 529B | | | 11,248 | | | | 1,445 | | | | 2,533 | | | | — | |
| Class 529C | | | 114,606 | | | | 25,907 | | | | 25,742 | | | | — | |
| Total | | | $342,429,321 | | | | $107,400,473 | | | | $57,077,609 | | | | $— | |
(3) Transactions with Affiliates
Investment Adviser– The fund has an investment advisory agreement with MFS to provide overall investment management and related administrative services and facilities to the fund. For the period from September 1, 2018 through July 31, 2019, the management fee was computed daily and paid monthly at the following annual rates based on the fund’s average daily net assets:
| | | | |
| Up to $1 billion | | | 0.90 | % |
| In excess of $1 billion and up to $2 billion | | | 0.80 | % |
| In excess of $2 billion and up to $5 billion | | | 0.70 | % |
| In excess of $5 billion and up to $10 billion | | | 0.60 | % |
| In excess of $10 billion | | | 0.55 | % |
Effective August 1, 2019, the management fee is computed daily and paid monthly at the following annual rates based on the fund’s average daily net assets:
| | | | |
| Up to $1 billion | | | 0.90 | % |
| In excess of $1 billion and up to $2 billion | | | 0.80 | % |
| In excess of $2 billion and up to $5 billion | | | 0.70 | % |
| In excess of $5 billion and up to $10 billion | | | 0.60 | % |
| In excess of $10 billion and up to $20 billion | | | 0.55 | % |
| In excess of $20 billion | | | 0.50 | % |
MFS has agreed in writing to reduce its management fee by a specified amount if certain MFS mutual fund assets exceed thresholds agreed to by MFS and the fund’s Board of Trustees. For the year ended August 31, 2019, this management fee reduction amounted to $791,339, which is included in the reduction of total expenses
34
Notes to Financial Statements – continued
in the Statement of Operations. The management fee incurred for the year ended August 31, 2019 was equivalent to an annual effective rate of 0.69% of the fund’s average daily net assets.
Distributor– MFS Fund Distributors, Inc. (MFD), a wholly-owned subsidiary of MFS, as distributor, received $66,839 and $4,444 for the year ended August 31, 2019, as its portion of the initial sales charge on sales of Class A and Class 529A shares of the fund, respectively.
The Board of Trustees has adopted a distribution plan for certain share classes pursuant to Rule12b-1 of the Investment Company Act of 1940.
The fund’s distribution plan provides that the fund will pay MFD for services provided by MFD and financial intermediaries in connection with the distribution and servicing of certain share classes. One component of the plan is a distribution fee paid to MFD and another component of the plan is a service fee paid to MFD. MFD may subsequently pay all, or a portion, of the distribution and/or service fees to financial intermediaries.
Distribution Plan Fee Table:
| | | | | | | | | | | | | | | | | | | | |
| | | | | |
| | | Distribution
Fee Rate (d) | | | Service
Fee Rate (d) | | | Total
Distribution
Plan (d) | | | Annual
Effective
Rate (e) | | | Distribution
and Service
Fee | |
| Class A | | | — | | | | 0.25% | | | | 0.25% | | | | 0.25% | | | | $1,595,483 | |
| Class B | | | 0.75% | | | | 0.25% | | | | 1.00% | | | | 1.00% | | | | 39,059 | |
| Class C | | | 0.75% | | | | 0.25% | | | | 1.00% | | | | 1.00% | | | | 248,950 | |
| Class R1 | | | 0.75% | | | | 0.25% | | | | 1.00% | | | | 1.00% | | | | 18,026 | |
| Class R2 | | | 0.25% | | | | 0.25% | | | | 0.50% | | | | 0.50% | | | | 527,758 | |
| Class R3 | | | — | | | | 0.25% | | | | 0.25% | | | | 0.25% | | | | 172,063 | |
| Class 529A | | | — | | | | 0.25% | | | | 0.25% | | | | 0.23% | | | | 29,625 | |
| Class 529B | | | 0.75% | | | | 0.25% | | | | 1.00% | | | | 1.00% | | | | 3,191 | |
| Class 529C | | | 0.75% | | | | 0.25% | | | | 1.00% | | | | 0.99% | | | | 31,313 | |
| Total Distribution and Service Fees | | | | | | | | | | | | $2,665,468 | |
| (d) | In accordance with the distribution plan for certain classes, the fund pays distribution and/or service fees equal to these annual percentage rates of each class’s average daily net assets. The distribution and service fee rates disclosed by class represent the current rates in effect at the end of the reporting period. Any rate changes, if applicable, are detailed below. |
| (e) | The annual effective rates represent actual fees incurred under the distribution plan for the year ended August 31, 2019 based on each class’s average daily net assets. MFD has voluntarily agreed to rebate a portion of each class’s 0.25% service fee attributable to accounts for which MFD retains the 0.25% service fee except for accounts attributable to MFS or its affiliates’ seed money. For the year ended August 31, 2019, this rebate amounted to $9,977, $117, $113, $757, $1, $2,004, and $201 for Class A, Class B, Class C, Class R2, Class R3, Class 529A, and Class 529C, respectively, and is included in the reduction of total expenses in the Statement of Operations. |
Certain Class A shares are subject to a contingent deferred sales charge (CDSC) in the event of a shareholder redemption within 18 months of purchase. Class B and Class 529B shares are subject to a CDSC in the event of a shareholder redemption within six years of purchase. Class C and Class 529C shares are subject to a CDSC in
35
Notes to Financial Statements – continued
the event of a shareholder redemption within 12 months of purchase. All contingent deferred sales charges are paid to MFD and during the year ended August 31, 2019, were as follows:
| | | | |
| |
| | | Amount | |
| Class A | | | $4,058 | |
| Class B | | | 4,884 | |
| Class C | | | 2,935 | |
| Class 529B | | | — | |
| Class 529C | | | 42 | |
The fund has entered into and may from time to time enter into contracts with program managers and other parties which administer the tuition programs through which an investment in the fund’s 529 share classes is made. The fund has entered into an agreement with MFD pursuant to which MFD receives an annual fee of up to 0.05% of the average daily net assets attributable to each 529 share class. The services provided by MFD, or a third party with which MFD contracts, include recordkeeping and tax reporting and account services, as well as services designed to maintain the program’s compliance with the Internal Revenue Code and other regulatory requirements. Program manager fees for the year ended August 31, 2019, were as follows:
| | | | |
| |
| | | Fee | |
| Class 529A | | | $5,925 | |
| Class 529B | | | 159 | |
| Class 529C | | | 1,566 | |
| Total Program Manager Fees | | | $7,650 | |
Shareholder Servicing Agent– MFS Service Center, Inc. (MFSC), a wholly-owned subsidiary of MFS, receives a fee from the fund for its services as shareholder servicing agent calculated as a percentage of the average daily net assets of the fund as determined periodically under the supervision of the fund’s Board of Trustees. For the year ended August 31, 2019, the fee was $145,855, which equated to 0.0018% annually of the fund’s average daily net assets. MFSC also receives payment from the fund forout-of-pocket expenses,sub-accounting and other shareholder servicing costs which may be paid to affiliated and unaffiliated service providers. Class R6 shares do not incursub-accounting fees. For the year ended August 31, 2019, theseout-of-pocket expenses,sub-accounting and other shareholder servicing costs amounted to $1,878,706.
Administrator– MFS provides certain financial, legal, shareholder communications, compliance, and other administrative services to the fund. Under an administrative services agreement, the fund reimburses MFS the costs incurred to provide these services. The fund is charged an annual fixed amount of $17,500 plus a fee based on average daily net assets. The administrative services fee incurred for the year ended August 31, 2019 was equivalent to an annual effective rate of 0.0071% of the fund’s average daily net assets.
Trustees’ and Officers’ Compensation– The fund pays compensation to independent Trustees in the form of a retainer, attendance fees, and additional compensation to Board and Committee chairpersons. The fund does not pay
36
Notes to Financial Statements – continued
compensation directly to Trustees or officers of the fund who are also officers of the investment adviser, all of whom receive remuneration from MFS for their services to the fund. Certain officers and Trustees of the fund are officers or directors of MFS, MFD, and MFSC.
Prior to December 31, 2001, the fund had an unfunded defined benefit plan (“DB plan”) for independent Trustees. As of December 31, 2001, the Board took action to terminate the DB plan with respect to then-current and any future independent Trustees, such that the DB plan covers only certain of those former independent Trustees who retired on or before December 31, 2001. The DB plan resulted in a pension expense of $296 and is included in “Independent Trustees’ compensation” in the Statement of Operations for the year ended August 31, 2019. The liability for deferred retirement benefits payable to those former independent Trustees under the DB plan amounted to $418 at August 31, 2019, and is included in “Payable for independent Trustees’ compensation” in the Statement of Assets and Liabilities.
Other– This fund and certain other funds managed by MFS (the funds) had entered into a service agreement (the ISO Agreement) which provided for payment of fees solely by the funds to Tarantino LLC in return for the provision of services of an Independent Senior Officer (ISO) for the funds. Frank L. Tarantino served as the ISO and was an officer of the funds and the sole member of Tarantino LLC. Effective June 30, 2019, Mr. Tarantino retired from his position as ISO for the funds, and the ISO Agreement was terminated. For the year ended August 31, 2019, the fee paid by the fund under this agreement was $14,526 and is included in “Miscellaneous” expense in the Statement of Operations. MFS had agreed to bear all expenses associated with office space, other administrative support, and supplies provided to the ISO.
The fund invests in the MFS Institutional Money Market Portfolio which is managed by MFS and seeks current income consistent with preservation of capital and liquidity. This money market fund does not pay a management fee to MFS.
The fund is permitted to engage in purchase and sale transactions with funds and accounts for which MFS serves as investment adviser orsub-adviser (“cross-trades”) pursuant to a policy adopted by the Board of Trustees. This policy has been designed to ensure that cross-trades conducted by the fund comply with Rule17a-7 under the Investment Company Act of 1940. During the year ended August 31, 2019, the fund engaged in purchase and sale transactions pursuant to this policy, which amounted to $14,284,063 and $3,950,171, respectively. The sales transactions resulted in net realized gains (losses) of $(1,464,255).
(4) Portfolio Securities
For the year ended August 31, 2019, purchases and sales of investments, other than short-term obligations, aggregated $2,471,928,876 and $1,754,413,405, respectively.
37
Notes to Financial Statements – continued
(5) Shares of Beneficial Interest
The fund’s Declaration of Trust permits the Trustees to issue an unlimited number of full and fractional shares of beneficial interest. Transactions in fund shares were as follows:
| | | | | | | | | | | | | | | | |
| | | Year ended
8/31/19 | | | Year ended
8/31/18 | |
| | | | |
| | | Shares | | | Amount | | | Shares | | | Amount | |
| Shares sold | | | | | | | | | | | | | | | | |
Class A | | | 6,308,181 | | | | $108,057,448 | | | | 7,069,268 | | | | $134,383,066 | |
Class B | | | 6,034 | | | | 99,733 | | | | 13,876 | | | | 255,158 | |
Class C | | | 376,118 | | | | 5,774,726 | | | | 218,850 | | | | 3,929,096 | |
Class I | | | 10,627,716 | | | | 191,924,273 | | | | 10,911,336 | | | | 215,968,481 | |
Class R1 | | | 11,118 | | | | 182,062 | | | | 17,274 | | | | 312,093 | |
Class R2 | | | 671,662 | | | | 11,368,179 | | | | 2,824,542 | | | | 52,534,049 | |
Class R3 | | | 431,846 | | | | 7,494,227 | | | | 727,392 | | | | 13,825,352 | |
Class R4 | | | 550,567 | | | | 9,576,959 | | | | 660,938 | | | | 12,682,200 | |
Class R6 | | | 108,922,349 | | | | 1,895,362,745 | | | | 97,088,940 | | | | 1,858,939,244 | |
Class 529A | | | 87,876 | | | | 1,489,187 | | | | 142,814 | | | | 2,703,844 | |
Class 529B | | | 805 | | | | 12,865 | | | | 1,799 | | | | 32,223 | |
Class 529C | | | 17,370 | | | | 275,909 | | | | 25,705 | | | | 446,045 | |
| | | 128,011,642 | | | | $2,231,618,313 | | | | 119,702,734 | | | | $2,296,010,851 | |
| | | |
Shares issued to shareholders in
reinvestment of distributions | | | | | | | | | | | | | |
Class A | | | 1,384,970 | | | | $22,173,336 | | | | 278,096 | | | | $5,278,247 | |
Class B | | | 8,845 | | | | 137,183 | | | | 776 | | | | 14,248 | |
Class C | | | 44,618 | | | | 674,185 | | | | 6,372 | | | | 113,995 | |
Class I | | | 1,213,492 | | | | 20,107,565 | | | | 370,149 | | | | 7,262,325 | |
Class R1 | | | 5,660 | | | | 83,875 | | | | 597 | | | | 10,519 | |
Class R2 | | | 310,892 | | | | 4,809,494 | | | | 58,080 | | | | 1,066,343 | |
Class R3 | | | 213,501 | | | | 3,381,859 | | | | 52,822 | | | | 992,523 | |
Class R4 | | | 160,956 | | | | 2,578,518 | | | | 41,572 | | | | 789,876 | |
Class R6 | | | 19,346,528 | | | | 307,416,337 | | | | 4,368,877 | | | | 82,397,020 | |
Class 529A | | | 35,487 | | | | 556,785 | | | | 7,033 | | | | 130,963 | |
Class 529B | | | 929 | | | | 13,781 | | | | 82 | | | | 1,445 | |
Class 529C | | | 9,666 | | | | 140,348 | | | | 1,499 | | | | 25,907 | |
| | | 22,735,544 | | | | $362,073,266 | | | | 5,185,955 | | | | $98,083,411 | |
38
Notes to Financial Statements – continued
| | | | | | | | | | | | | | | | |
| | | Year ended
8/31/19 | | | Year ended
8/31/18 | |
| | | | |
| | | Shares | | | Amount | | | Shares | | | Amount | |
| Shares reacquired | | | | | | | | | | | | | | | | |
Class A | | | (8,627,351 | ) | | | $(149,525,414 | ) | | | (9,782,601 | ) | | | $(185,844,596 | ) |
Class B | | | (87,072 | ) | | | (1,469,628 | ) | | | (104,573 | ) | | | (1,939,229 | ) |
Class C | | | (606,008 | ) | | | (9,833,848 | ) | | | (1,532,236 | ) | | | (27,742,773 | ) |
Class I | | | (12,990,232 | ) | | | (235,108,050 | ) | | | (36,650,383 | ) | | | (733,359,445 | ) |
Class R1 | | | (31,884 | ) | | | (499,317 | ) | | | (20,748 | ) | | | (370,130 | ) |
Class R2 | | | (1,789,045 | ) | | | (30,140,366 | ) | | | (3,921,714 | ) | | | (72,878,654 | ) |
Class R3 | | | (1,518,596 | ) | | | (26,270,828 | ) | | | (1,546,205 | ) | | | (29,443,847 | ) |
Class R4 | | | (723,854 | ) | | | (12,619,137 | ) | | | (1,167,421 | ) | | | (22,319,483 | ) |
Class R6 | | | (68,790,407 | ) | | | (1,220,513,670 | ) | | | (36,858,067 | ) | | | (700,719,685 | ) |
Class 529A | | | (119,736 | ) | | | (2,083,794 | ) | | | (66,288 | ) | | | (1,251,041 | ) |
Class 529B | | | (4,495 | ) | | | (74,302 | ) | | | (4,676 | ) | | | (82,960 | ) |
Class 529C | | | (47,818 | ) | | | (755,778 | ) | | | (55,236 | ) | | | (972,546 | ) |
| | | (95,336,498 | ) | | | $(1,688,894,132 | ) | | | (91,710,148 | ) | | | $(1,776,924,389 | ) |
| | | | |
| Net change | | | | | | | | | | | | | | | | |
Class A | | | (934,200 | ) | | | $(19,294,630 | ) | | | (2,435,237 | ) | | | $(46,183,283 | ) |
Class B | | | (72,193 | ) | | | (1,232,712 | ) | | | (89,921 | ) | | | (1,669,823 | ) |
Class C | | | (185,272 | ) | | | (3,384,937 | ) | | | (1,307,014 | ) | | | (23,699,682 | ) |
Class I | | | (1,149,024 | ) | | | (23,076,212 | ) | | | (25,368,898 | ) | | | (510,128,639 | ) |
Class R1 | | | (15,106 | ) | | | (233,380 | ) | | | (2,877 | ) | | | (47,518 | ) |
Class R2 | | | (806,491 | ) | | | (13,962,693 | ) | | | (1,039,092 | ) | | | (19,278,262 | ) |
Class R3 | | | (873,249 | ) | | | (15,394,742 | ) | | | (765,991 | ) | | | (14,625,972 | ) |
Class R4 | | | (12,331 | ) | | | (463,660 | ) | | | (464,911 | ) | | | (8,847,407 | ) |
Class R6 | | | 59,478,470 | | | | 982,265,412 | | | | 64,599,750 | | | | 1,240,616,579 | |
Class 529A | | | 3,627 | | | | (37,822 | ) | | | 83,559 | | | | 1,583,766 | |
Class 529B | | | (2,761 | ) | | | (47,656 | ) | | | (2,795 | ) | | | (49,292 | ) |
Class 529C | | | (20,782 | ) | | | (339,521 | ) | | | (28,032 | ) | | | (500,594 | ) |
| | | 55,410,688 | | | | $904,797,447 | | | | 33,178,541 | | | | $617,169,873 | |
Class T shares were not publicly available for sale during the period. Please see the fund’s prospectus for details.
Effective June 1, 2019, purchases of the fund’s Class B and Class 529B shares are closed to new and existing investors subject to certain exceptions. Please see the fund’s prospectus for details.
The fund is one of several mutual funds in which certain MFS funds may invest. The MFS funds do not invest in the underlying funds for the purpose of exercising management or control. At the end of the period, the MFS International Diversification Fund, the MFS Growth Allocation Fund, the MFS Moderate Allocation Fund, the MFS Aggressive Growth Allocation Fund, and the MFS Conservative Allocation Fund were the owners of record of approximately 62%, 4%, 4%, 2%, and 1%, respectively, of the value of outstanding voting shares of the fund. In addition, the MFS Lifetime 2020 Fund, the MFS Lifetime 2025 Fund, the MFS Lifetime 2030 Fund, the MFS Lifetime 2035 Fund, the MFS Lifetime 2040 Fund, the MFS Lifetime 2045 Fund, the MFS Lifetime
39
Notes to Financial Statements – continued
2050 Fund, the MFS Lifetime 2055 Fund, the MFS Lifetime 2060 Fund, and the MFS Lifetime Income Fund were each the owners of record of less than 1% of the value of outstanding voting shares of the fund.
(6) Line of Credit
The fund and certain other funds managed by MFS participate in a $1.25 billion unsecured committed line of credit, subject to a $1 billion sublimit, provided by a syndicate of banks under a credit agreement. Borrowings may be made for temporary financing needs. Interest is charged to each fund, based on its borrowings, generally at a rate equal to the highest of one month LIBOR, the Federal Funds Effective Rate and the Overnight Bank Funding Rate, plus an agreed upon spread. A commitment fee, based on the average daily, unused portion of the committed line of credit, is allocated among the participating funds. In addition, the fund and other funds managed by MFS have established unsecured uncommitted borrowing arrangements with certain banks for temporary financing needs. Interest is charged to each fund, based on its borrowings, at rates equal to customary reference rates plus an agreed upon spread. For the year ended August 31, 2019, the fund’s commitment fee and interest expense were $47,665 and $15,626, respectively, and are included in “Miscellaneous” expense in the Statement of Operations.
(7) Investments in Affiliated Issuers
An affiliated issuer may be considered one in which the fund owns 5% or more of the outstanding voting securities, or a company which is under common control. For the purposes of this report, the following were affiliated issuers:
| | | | | | | | | | | | | | | | | | | | | | | | |
| | | | | | |
| Affiliated Issuers | | Beginning
Value | | | Purchases | | | Sales
Proceeds | | | Realized
Gain
(Loss) | | | Change in
Unrealized
Appreciation or
Depreciation | | | Ending
Value | |
| MFS Institutional Money Market Portfolio | | | $78,815,546 | | | | $1,715,181,671 | | | | $1,720,779,236 | | | | $24,350 | | | | $3,654 | | | | $73,245,985 | |
| | | | | | |
| Affiliated Issuers | | | | | | | | | | | | | | Dividend
Income | | | Capital Gain
Distributions | |
| MFS Institutional Money Market Portfolio | | | | | | | | | | | | $2,346,425 | | | | $— | |
40
REPORT OF INDEPENDENT REGISTERED PUBLIC ACCOUNTING FIRM
To the Shareholders of MFS Research International Fund and the Board of Trustees of MFS Series Trust I
Opinion on the Financial Statements
We have audited the accompanying statement of assets and liabilities of MFS Research International Fund (the “Fund”) (one of the funds constituting MFS Series Trust I (the “Trust”)), including the portfolio of investments, as of August 31, 2019,and the related statement of operations for the year then ended, the statements of changes in net assets for each of the two years in the period then ended, the financial highlights for each of the five years in the period then ended and the related notes (collectively referred to as the “financial statements”). In our opinion, the financial statements present fairly, in all material respects, the financial position of the Fund (one of the funds constituting MFS Series Trust I) at August 31, 2019, the results of its operations for the year then ended, the changes in its net assets for each of the two years in the period then ended and its financial highlights for each of the five years in the period then ended, in conformity with U.S. generally accepted accounting principles.
Basis for Opinion
These financial statements are the responsibility of the Trust’s management. Our responsibility is to express an opinion on the Fund’s financial statements based on our audits. We are a public accounting firm registered with the Public Company Accounting Oversight Board (United States) (“PCAOB”) and are required to be independent with respect to the Trust in accordance with the U.S. federal securities laws and the applicable rules and regulations of the Securities and Exchange Commission and the PCAOB.
We conducted our audits in accordance with the standards of the PCAOB. Those standards require that we plan and perform the audit to obtain reasonable assurance about whether the financial statements are free of material misstatement, whether due to error or fraud. The Trust is not required to have, nor were we engaged to perform, an audit of the Trust’s internal control over financial reporting. As part of our audits we are required to obtain an understanding of internal control over financial reporting but not for the purpose of expressing an opinion on the effectiveness of the Trust’s internal control over financial reporting. Accordingly, we express no such opinion.
Our audits included performing procedures to assess the risks of material misstatement of the financial statements, whether due to error or fraud, and performing procedures that respond to those risks. Such procedures included examining, on a test basis, evidence regarding the amounts and disclosures in the financial statements. Our procedures included confirmation of securities owned as of August 31, 2019,by correspondence with the custodian andothers or by other appropriate auditing procedures where replies from others were not received. Our audits also included
41
Report of Independent Registered Public Accounting Firm – continued
evaluating the accounting principles used and significant estimates made by management, as well as evaluating the overall presentation of the financial statements. We believe that our audits provide a reasonable basis for our opinion.

We have served as the auditor of one or more MFS investment companies since 1993.
Boston, Massachusetts
October 17, 2019
42
TRUSTEES AND OFFICERS — IDENTIFICATION AND BACKGROUND
The Trustees and Officers of the Trust, as of October 1, 2019, are listed below, together with their principal occupations during the past five years. (Their titles may have varied during that period.) The address of each Trustee and Officer is 111 Huntington Avenue, Boston, Massachusetts 02199-7618.
| | | | | | | | | | |
Name, Age | | Position(s)
Held
with Fund | | Trustee/Officer
Since (h) | | Number of
MFS Funds
overseen
by the
Trustee | | Principal
Occupations During the Past Five Years | | Other
Directorships
During the Past
Five Years (j) |
| INTERESTED TRUSTEES |
Robert J. Manning (k)
(age 55) | | Trustee | | February 2004 | | 135 | | Massachusetts Financial Services Company, Executive Chairman (since January 2017); Director; Chairman of the Board; Chief Executive Officer (until 2015);Co-Chief Executive Officer (2015-2016) | | N/A |
| | | | | |
Robin A. Stelmach (k) (age 58) | | Trustee | | January 2014 | | 135 | | Massachusetts Financial Services Company, Vice Chair (since January 2017); Chief Operating Officer and Executive Vice President (until January 2017) | | N/A |
| INDEPENDENT TRUSTEES |
John P. Kavanaugh (age 64) | | Trustee and Chair of Trustees | | January 2009 | | 135 | | Private investor | | N/A |
| | | | | |
Steven E. Buller (age 68) | | Trustee | | February 2014 | | 135 | | Financial Accounting Standards Advisory Council, Chairman (2014-2015); Public Company Accounting Oversight Board, Standing Advisory Group, Member (until 2014); BlackRock, Inc. (investment management), Managing Director (until 2014), BlackRock Finco UK (investment management), Director (until 2014) | | N/A |
43
Trustees and Officers – continued
| | | | | | | | | | |
Name, Age | | Position(s)
Held
with Fund | | Trustee/Officer
Since (h) | | Number of
MFS Funds
overseen
by the
Trustee | | Principal
Occupations During the Past Five Years | | Other
Directorships
During the Past
Five Years (j) |
John A. Caroselli (age 65) | | Trustee | | March 2017 | | 135 | | JC Global Advisors, LLC (management consulting), President (since 2015); First Capital Corporation (commercial finance), Executive Vice President (until 2015) | | N/A |
| | | | | |
Maureen R. Goldfarb (age 64) | | Trustee | | January 2009 | | 135 | | Private investor | | N/A |
| | | | | |
Michael Hegarty
(age 74) | | Trustee | | December 2004 | | 135 | | Private investor | | Rouse Properties Inc., Director (until 2016); Capmark Financial Group Inc., Director (until 2015) |
| | | | | |
Peter D. Jones
(age 64) | | Trustee | | January 2019 | | 135 | | Franklin Templeton Distributors, Inc. (investment management), President (until 2015); Franklin Templeton Institutional, LLC (investment management), Chairman (until 2015) | | N/A |
| | | | | |
James W. Kilman, Jr.
(age 58) | | Trustee | | January 2019 | | 135 | | Burford Capital Limited (finance and investment management), Chief Financial Officer (since 2019); KielStrand Capital LLC (family office and merchant bank), Chief Executive Officer (since 2016); Morgan Stanley & Co. (financial services), Vice Chairman of Investment Banking,Co-Head of Diversified Financials Coverage – Financial Institutions Investment Banking Group (until 2016) | | Alpha-En Corporation, Director (since 2016) |
44
Trustees and Officers – continued
| | | | | | | | | | |
Name, Age | | Position(s)
Held
with Fund | | Trustee/Officer
Since (h) | | Number of
MFS Funds
overseen
by the
Trustee | | Principal
Occupations During the Past Five Years | | Other
Directorships
During the Past
Five Years (j) |
Clarence Otis, Jr. (age 63) | | Trustee | | March 2017 | | 135 | | Darden Restaurants, Inc., Chief Executive Officer (until 2014) | | VF Corporation, Director; Verizon Communications, Inc., Director; The Travelers Companies, Director; Federal Reserve Bank of Atlanta, Director (until 2015) |
| | | | | |
Maryanne L. Roepke (age 63) | | Trustee | | May 2014 | | 135 | | American Century Investments (investment management), Senior Vice President and Chief Compliance Officer (until 2014) | | N/A |
| | | | | |
Laurie J. Thomsen
(age 62) | | Trustee | | March 2005 | | 135 | | Private investor | | The Travelers Companies, Director; Dycom Industries, Inc., Director (since 2015) |
| | | | | | | | |
Name, Age | | Position(s) Held
with Fund | | Trustee/Officer
Since (h) | | Number of
MFS Funds
for which
the Person
is an Officer | | Principal
Occupations During
the Past Five Years |
| OFFICERS | | | | | | | | |
Christopher R. Bohane (k)
(age 45) | | Assistant Secretary and Assistant Clerk | | July 2005 | | 135 | | Massachusetts Financial Services Company, Vice President and Assistant General Counsel |
| | | | |
Kino Clark (k) (age 51) | | Assistant Treasurer | | January 2012 | | 135 | | Massachusetts Financial Services Company, Vice President |
45
Trustees and Officers – continued
| | | | | | | | |
Name, Age | | Position(s) Held
with Fund | | Trustee/Officer
Since (h) | | Number of
MFS Funds
for which
the Person
is an Officer | | Principal
Occupations During
the Past Five Years |
John W. Clark, Jr. (k) (age 52) | | Assistant Treasurer | | April 2017 | | 135 | | Massachusetts Financial Services Company, Vice President (since March 2017); Deutsche Bank (financial services), Department Head – Treasurer’s Office (until February 2017) |
| | | | |
Thomas H. Connors (k) (age 60) | | Assistant Secretary and Assistant Clerk | | September 2012 | | 135 | | Massachusetts Financial Services Company, Vice President and Senior Counsel |
| | | | |
David L. DiLorenzo (k)
(age 51) | | President | | July 2005 | | 135 | | Massachusetts Financial Services Company, Senior Vice President |
| | | | |
Heidi W. Hardin (k)
(age 52) | | Secretary and Clerk | | April 2017 | | 135 | | Massachusetts Financial Services Company, Executive Vice President and General Counsel (since March 2017); Harris Associates (investment management), General Counsel (from September 2015 to January 2017); Janus Capital Management LLC (investment management), Senior Vice President and General Counsel (until September 2015) |
| | | | |
Brian E. Langenfeld (k)
(age 46) | | Assistant
Secretary and Assistant Clerk | | June 2006 | | 135 | | Massachusetts Financial Services Company, Vice President and Senior Counsel |
| | | | |
Amanda S. Mooradian (k)
(age 40) | | Assistant
Secretary and Assistant Clerk | | September 2018 | | 135 | | Massachusetts Financial Services Company, Assistant Vice President and Counsel |
46
Trustees and Officers – continued
| | | | | | | | |
Name, Age | | Position(s) Held
with Fund | | Trustee/Officer
Since (h) | | Number of
MFS Funds
for which
the Person
is an Officer | | Principal
Occupations During
the Past Five Years |
Susan A. Pereira (k)
(age 48) | | Assistant
Secretary and Assistant Clerk | | July 2005 | | 135 | | Massachusetts Financial Services Company, Vice President and Assistant General Counsel |
| | | | |
Kasey L. Phillips (k)
(age 48) | | Assistant Treasurer | | September 2012 | | 135 | | Massachusetts Financial Services Company, Vice President |
| | | | |
Matthew A. Stowe (k)
(age 44) | | Assistant Secretary and Assistant Clerk | | October 2014 | | 135 | | Massachusetts Financial Services Company, Vice President and Assistant General Counsel |
| | | | |
Martin J. Wolin (k)
(age 52) | | Chief Compliance Officer | | July 2015 | | 135 | | Massachusetts Financial Services Company, Senior Vice President and Chief Compliance Officer (since July 2015); Mercer (financial service provider), Chief Risk and Compliance Officer, North America and Latin America (until June 2015) |
| | | | |
James O. Yost (k)
(age 59) | | Treasurer | | September 1990 | | 135 | | Massachusetts Financial Services Company, Senior Vice President |
| (h) | Date first appointed to serve as Trustee/officer of an MFS Fund. Each Trustee has served continuously since appointment unless indicated otherwise. For the period from December 15, 2004 until February 22, 2005, Mr. Manning served as Advisory Trustee. From January 2012 through December 2016, Messrs. DiLorenzo and Yost served as Treasurer and Deputy Treasurer of the Funds, respectively. |
| (j) | Directorships or trusteeships of companies required to report to the Securities and Exchange Commission (i.e., “public companies”). |
| (k) | “Interested person” of the Trust within the meaning of the Investment Company Act of 1940 (referred to as the 1940 Act), which is the principal federal law governing investment companies like the fund, as a result of a position with MFS. The address of MFS is 111 Huntington Avenue, Boston, Massachusetts 02199-7618. |
Each Trustee (other than Messrs. Jones and Kilman) has been elected by shareholders and each Trustee and Officer holds office until his or her successor is chosen and qualified or until his or her earlier death, resignation, retirement or removal. Messrs. Jones and Kilman became Trustees of the Funds on January 1, 2019. The Trust does
47
Trustees and Officers – continued
not hold annual meetings for the purpose of electing Trustees, and Trustees are not elected for fixed terms. Under the terms of the Board’s retirement policy, an Independent Trustee shall retire at the end of the calendar year in which he or she reaches the earlier of 75 years of age or 15 years of service on the Board (or, in the case of any Independent Trustee who joined the Board prior to 2015, 20 years of service on the Board).
Messrs. Buller, Hegarty, Kilman and Otis and Ms. Roepke are members of the Trust’s Audit Committee.
Each of the Interested Trustees and certain Officers hold comparable officer positions with certain affiliates of MFS.
The Statement of Additional Information for a Fund includes further information about the Trustees and is available without charge upon request by calling1-800-225-2606.
| | |
| Investment Adviser | | Custodian |
Massachusetts Financial Services Company
111 Huntington Avenue Boston, MA 02199-7618 | | State Street Bank and Trust Company 1 Lincoln Street Boston, MA 02111-2900 |
| Distributor | | Independent Registered Public Accounting Firm |
MFS Fund Distributors, Inc.
111 Huntington Avenue Boston, MA 02199-7618 | | Ernst & Young LLP 200 Clarendon Street Boston, MA 02116 |
| Portfolio Manager(s) | | |
Victoria Higley
Camille Humphries Lee | | |
48
BOARD REVIEW OF INVESTMENT ADVISORY AGREEMENT
The Investment Company Act of 1940 requires that both the full Board of Trustees and a majority of thenon-interested (“independent”) Trustees, voting separately, annually approve the continuation of the Fund’s investment advisory agreement with MFS. The Trustees consider matters bearing on the Fund and its advisory arrangements at their meetings throughout the year, including a review of performance data at each regular meeting. In addition, the independent Trustees met several times over the course of three months beginning in May and ending in July, 2019 (“contract review meetings”) for the specific purpose of considering whether to approve the continuation of the investment advisory agreement for the Fund and the other investment companies that the Board oversees (the “MFS Funds”). The independent Trustees were assisted in their evaluation of the Fund’s investment advisory agreement by independent legal counsel, from whom they received separate legal advice and with whom they met separately from MFS during various contract review meetings. The independent Trustees were also assisted in this process by the MFS Funds’ Independent Senior Officer, a senior officer appointed by and reporting to the independent Trustees.
In connection with their deliberations regarding the continuation of the investment advisory agreement, the Trustees, including the independent Trustees, considered such information and factors as they believed, in light of the legal advice furnished to them and their own business judgment, to be relevant. The investment advisory agreement for the Fund was considered separately, although the Trustees also took into account the common interests of all MFS Funds in their review. As described below, the Trustees considered the nature, quality, and extent of the various investment advisory, administrative, and shareholder services performed by MFS under the existing investment advisory agreement and other arrangements with the Fund.
In connection with their contract review meetings, the Trustees received and relied upon materials that included, among other items: (i) information provided by Broadridge Financial Solutions, Inc. (“Broadridge”), an independent third party, on the investment performance of the Fund for various time periods ended December 31, 2018 and the investment performance of a group of funds with substantially similar investment classifications/objectives (the “Broadridge performance universe”), (ii) information provided by Broadridge on the Fund’s advisory fees and other expenses and the advisory fees and other expenses of comparable funds identified by Broadridge as well as all other funds in the same investment classification/category (the “Broadridge expense group and universe”), (iii) information provided by MFS on the advisory fees of portfolios of other clients of MFS, including institutional separate accounts and other clients, (iv) information as to whether and to what extent applicable expense waivers, reimbursements or fee “breakpoints” are observed for the Fund, (v) information regarding MFS’ financial results and financial condition, including MFS’ and certain of its affiliates’ estimated profitability from services performed for the Fund and the MFS Funds as a whole, and compared to MFS’ institutional business, (vi) MFS’ views regarding the outlook for the mutual fund industry and the strategic business plans of MFS, (vii) descriptions of various functions performed by MFS for the Funds, such as compliance monitoring and portfolio trading practices, and (viii) information regarding the overall organization of MFS, including
49
Board Review of Investment Advisory Agreement – continued
information about MFS’ senior management and other personnel providing investment advisory, administrative and other services to the Fund and the other MFS Funds. The comparative performance, fee and expense information prepared and provided by Broadridge was not independently verified and the independent Trustees did not independently verify any information provided to them by MFS.
The Trustees’ conclusion as to the continuation of the investment advisory agreement was based on a comprehensive consideration of all information provided to the Trustees and not the result of any single factor. Some of the factors that figured particularly in the Trustees’ deliberations are described below, although individual Trustees may have evaluated the information presented differently from one another, giving different weights to various factors. It is also important to recognize that the fee arrangements for the Fund and other MFS Funds are the result of years of review and discussion between the independent Trustees and MFS, that certain aspects of such arrangements may receive greater scrutiny in some years than in others, and that the Trustees’ conclusions may be based, in part, on their consideration of these same arrangements during the course of the year and in prior years.
Based on information provided by Broadridge and MFS, the Trustees reviewed the Fund’s total return investment performance as well as the Broadridge performance universe over various time periods. The Trustees placed particular emphasis on the total return performance of the Fund’s Class A shares in comparison to the performance of funds in its Broadridge performance universe over the five-year period ended December 31, 2018, which the Trustees believed was a long enough period to reflect differing market conditions. The total return performance of the Fund’s Class A shares was in the 4th quintile relative to the other funds in the universe for this five-year period (the 1st quintile being the best performers and the 5th quintile being the worst performers). The total return performance of the Fund’s Class A shares was in the 2nd quintile for theone-year period and the 3rd quintile for the three-year period ended December 31, 2018 relative to the Broadridge performance universe. Because of the passage of time, these performance results may differ from the performance results for more recent periods, including those shown elsewhere in this report.
In the course of their deliberations, the Trustees took into account information provided by MFS in connection with the contract review meetings, as well as during investment review meetings conducted with portfolio management personnel during the course of the year regarding the Fund’s performance. The Trustees noted that although the Fund’s five-year performance was substandard relative to its Broadridge performance universe, the Trustees observed that the Fund’sone- and three-year performance as compared to its Broadridge performance universe improved for the period ended December 31, 2018, as compared to the prior year. After reviewing these and related factors, the Trustees concluded, within the context of their overall conclusions regarding the investment advisory agreement, that they were satisfied with MFS’ responses and efforts relating to investment performance.
In assessing the reasonableness of the Fund’s advisory fee, the Trustees considered, among other information, the Fund’s advisory fee and the total expense ratio of the Fund’s Class A shares as a percentage of average daily net assets and the advisory fee and total expense ratios of the Broadridge expense group based on information
50
Board Review of Investment Advisory Agreement – continued
provided by Broadridge. The Trustees considered that, according to the data provided by Broadridge (which takes into account any fee reductions or expense limitations that were in effect during the Fund’s last fiscal year), the Fund’s effective advisory fee rate was approximately at the Broadridge expense group median and the Fund’s total expense ratio was lower than the Broadridge expense group median.
The Trustees also considered the advisory fees charged by MFS to any institutional separate accounts advised by MFS (“separate accounts”) and unaffiliated investment companies for which MFS serves as subadviser (“subadvised funds”) that have comparable investment strategies to the Fund, if any. In comparing these fees, the Trustees considered information provided by MFS as to the generally broader scope of services provided by MFS to the Fund, as well as the more extensive regulatory burdens imposed on MFS in managing the Fund, in comparison to separate accounts and subadvised funds. The Trustees also considered the higher demands placed on MFS’ investment personnel and trading infrastructure as a result of the daily cashin-flows andout-flows of the Fund in comparison to separate accounts.
The Trustees also considered whether the Fund may benefit from any economies of scale in the management of the Fund in the event of growth in assets of the Fund and/or growth in assets of the MFS Funds as a whole. They noted that the Fund’s advisory fee rate schedule is subject to contractual breakpoints that reduce the Fund’s advisory fee rate on average daily net assets over $1 billion, $2 billion, $5 billion and $10 billion. They noted that MFS has agreed to implement an additional contractual breakpoint that reduces its advisory fee rate on the Fund’s average daily net assets over $20 billion effective August 1, 2019. The Trustees also noted that MFS has agreed in writing to waive a portion of the management fees of certain MFS Funds, including the Fund, if the total combined assets of certain funds within the MFS Funds’ complex increase above agreed upon thresholds (the “group fee waiver”), enabling the Fund’s shareholders to share in the benefits from any economies of scale at the complex level. The group fee waiver is reviewed and renewed annually between the Board and MFS. The Trustees concluded that the breakpoints and the group fee waiver were sufficient to allow the Fund to benefit from economies of scale as its assets and overall complex assets grow.
The Trustees also considered information prepared by MFS relating to MFS’ costs and profits with respect to the Fund, the MFS Funds considered as a group, and other investment companies and accounts advised by MFS, as well as MFS’ methodologies used to determine and allocate its costs to the MFS Funds, the Fund and other accounts and products for purposes of estimating profitability.
After reviewing these and other factors described herein, the Trustees concluded, within the context of their overall conclusions regarding the investment advisory agreement, that the advisory fees charged to the Fund represent reasonable compensation in light of the services being provided by MFS to the Fund.
In addition, the Trustees considered MFS’ resources and related efforts to continue to retain, attract and motivate capable personnel to serve the Fund. The Trustees also considered current and developing conditions in the financial services industry, including the presence of large and well-capitalized companies which are spending, and appear to be prepared to continue to spend, substantial sums to engage personnel
51
Board Review of Investment Advisory Agreement – continued
and to provide services to competing investment companies. In this regard, the Trustees also considered the financial resources of MFS and its ultimate parent, Sun Life Financial Inc. The Trustees also considered the advantages and possible disadvantages to the Fund of having an adviser that also serves other investment companies as well as other accounts.
The Trustees also considered the nature, quality, cost, and extent of administrative, transfer agency, and distribution services provided to the Fund by MFS and its affiliates under agreements and plans other than the investment advisory agreement, including any12b-1 fees the Fund pays to MFS Fund Distributors, Inc., an affiliate of MFS. The Trustees also considered the nature, extent and quality of certain other services MFS performs or arranges for on the Fund’s behalf, which may include securities lending programs, directed expense payment programs, class action recovery programs, and MFS’ interaction with third-party service providers, principally custodians andsub-custodians. The Trustees concluded that the variousnon-advisory services provided by MFS and its affiliates on behalf of the Fund were satisfactory.
The Trustees consideredso-called“fall-out benefits” to MFS such as reputational value derived from serving as investment manager to the MFS Funds. The Trustees also considered that, effective January 3, 2018, MFS had discontinued its historic practice of obtaining investment research from portfolio brokerage commissions paid by certain MFS Funds and would thereafter directly pay for or voluntarily reimburse a Fund, if applicable, for the costs of external research acquired through the use of the Fund’s portfolio brokerage commissions.
Based on their evaluation of factors that they deemed to be material, including those factors described above, the Board of Trustees, including the independent Trustees, concluded that the Fund’s investment advisory agreement with MFS should be continued for an additionalone-year period, commencing August 1, 2019.
52
PROXY VOTING POLICIES AND INFORMATION
MFS votes proxies on behalf of the fund pursuant to proxy voting policies and procedures that are available without charge, upon request, by calling1-800-225-2606, by visitingmfs.com/proxyvoting,or by visiting the SEC’s Web site athttp://www.sec.gov.
Information regarding how the fund voted proxies relating to portfolio securities during the most recent twelve-month period ended June 30 is available by August 31 of each year without charge by visitingmfs.com/proxyvoting,or by visiting the SEC’s Web site athttp://www.sec.gov.
QUARTERLY PORTFOLIO DISCLOSURE
The fund files a complete schedule of portfolio holdings with the SEC for the first and third quarters of each fiscal year on Form N-Q or as an exhibit to its reports onForm N-PORT (for first and third fiscal quarters ending March 31, 2019 or after). The fund’s Form N-Q or Form N-PORT reports are available on the SEC’s website athttp://www.sec.gov.A shareholder can obtain the portfolio holdings report for the first and third quarters of the fund’s fiscal year atmfs.com/openendfunds by choosing the fund’s name and then selecting the “Resources” tab and clicking on “Prospectus and Reports”.
FURTHER INFORMATION
From time to time, MFS may post important information about the fund or the MFS funds on the MFS web site (mfs.com). This information is available athttps://www.mfs.com/en-us/what-we-do/announcements.htmlor atmfs.com/openendfundsby choosing the fund’s name.
INFORMATION ABOUT FUND CONTRACTS AND LEGAL CLAIMS
The fund has entered into contractual arrangements with an investment adviser, administrator, distributor, shareholder servicing agent, 529 program manager (if applicable), and custodian who each provide services to the fund. Unless expressly stated otherwise, shareholders are not parties to, or intended beneficiaries of these contractual arrangements, and these contractual arrangements are not intended to create any shareholder right to enforce them against the service providers or to seek any remedy under them against the service providers, either directly or on behalf of the fund.
Under the Trust’s By-Laws and Declaration of Trust, any claims asserted against or on behalf of the MFS Funds, including claims against Trustees and Officers, must be brought in state and federal courts located within the Commonwealth of Massachusetts.
FEDERAL TAX INFORMATION (unaudited)
The fund will notify shareholders of amounts for use in preparing 2019 income tax forms in January 2020. The following information is provided pursuant to provisions of the Internal Revenue Code.
The fund designates the maximum amount allowable as qualified dividend income eligible to be taxed at the same rate as long-term capital gain.
The fund designates $64,585,000 as capital gain dividends paid during the fiscal year.
Income derived from foreign sources was $255,083,348. The fund intends to pass through foreign tax credits of $21,044,398 for the fiscal year.
53
rev. 3/16
| | | | |
| | | |
FACTS | | WHAT DOES MFS DO WITH YOUR PERSONAL INFORMATION? | |  |
| | |
| Why? | | Financial companies choose how they share your personal information. Federal law gives consumers the right to limit some but not all sharing. Federal law also requires us to tell you how we collect, share, and protect your personal information. Please read this notice carefully to understand what we do. |
| | |
| What? | | The types of personal information we collect and share depend on the product or service you have with us. This information can include: • Social Security number and account balances • Account transactions and transaction history • Checking account information and wire transfer instructions When you areno longer our customer, we continue to share your information as described in this notice. |
| | |
| How? | | All financial companies need to share customers’ personal information to run their everyday business. In the section below, we list the reasons financial companies can share their customers’ personal information; the reasons MFS chooses to share; and whether you can limit this sharing. |
| | | | |
Reasons we can share your
personal information | | Does MFS
share? | | Can you limit
this sharing? |
For our everyday business purposes – such as to process your transactions, maintain your account(s), respond to court orders and legal investigations, or report to credit bureaus | | Yes | | No |
For our marketing purposes – to offer our products and services to you | | No | | We don’t share |
For joint marketing with other financial companies | | No | | We don’t share |
For our affiliates’ everyday business purposes – information about your transactions and experiences | | No | | We don’t share |
For our affiliates’ everyday business purposes – information about your creditworthiness | | No | | We don’t share |
| For nonaffiliates to market to you | | No | | We don’t share |
| | |
| | |
| Questions? | | Call800-225-2606 or go tomfs.com. |
54
| | |
| Who we are |
| Who is providing this notice? | | MFS Funds, MFS Investment Management, MFS Institutional Advisors, Inc., and MFS Heritage Trust Company. |
| | |
| What we do |
| How does MFS protect my personal information? | | To protect your personal information from unauthorized access and use, we use security measures that comply with federal law. These measures include procedural, electronic, and physical safeguards for the protection of the personal information we collect about you. |
| How does MFS collect my personal information? | | We collect your personal information, for example, when you • open an account or provide account information • direct us to buy securities or direct us to sell your securities • make a wire transfer We also collect your personal information from others, such as credit bureaus, affiliates, or other companies. |
| Why can’t I limit all sharing? | | Federal law gives you the right to limit only • sharing for affiliates’ everyday business purposes – information about your creditworthiness • affiliates from using your information to market to you • sharing for nonaffiliates to market to you State laws and individual companies may give you additional rights to limit sharing. |
| | |
| Definitions |
| Affiliates | | Companies related by common ownership or control. They can be financial and nonfinancial companies. • MFS does not share personal information with affiliates, except for everyday business purposes as described on page one of this notice. |
| Nonaffiliates | | Companies not related by common ownership or control. They can be financial and nonfinancial companies. • MFS does not share with nonaffiliates so they can market to you. |
| Joint marketing | | A formal agreement between nonaffiliated financial companies that together market financial products or services to you. • MFS doesn’t jointly market. |
| | |
| Other important information |
| If you own an MFS product or receive an MFS service in the name of a third party such as a bank or broker-dealer, their privacy policy may apply to you instead of ours. |
55
Save paper with eDelivery.

| MFS® will send you prospectuses, |
reports, and proxies directly viae-mail so you will get information faster with less mailbox clutter.
To sign up:
1. Go to mfs.com.
2. Log in via MFS® Access.
3. Select eDelivery.
If you own your MFS fund shares through a financial institution or a retirement plan, MFS® TALK, MFS® Access, or eDelivery may not be available to you.
CONTACT
WEB SITE
mfs.com
MFS TALK
1-800-637-8255
24 hours a day
ACCOUNT SERVICE AND LITERATURE
Shareholders
1-800-225-2606
Financial advisors
1-800-343-2829
Retirement plan services
1-800-637-1255
MAILING ADDRESS
MFS Service Center, Inc.
P.O. Box 219341
Kansas City, MO 64121-9341
OVERNIGHT MAIL
MFS Service Center, Inc.
Suite 219341
430 W 7th Street
Kansas City, MO 64105-1407
Annual Report
August 31, 2019

MFS® Technology Fund

Beginning on January 1, 2021, as permitted by regulations adopted by the U.S. Securities and Exchange Commission, paper copies of the fund’s annual and semiannual shareholder reports will no longer be sent by mail, unless you specifically request paper copies of the reports. Instead, the complete reports will be made available on the fund’s Web site (funds.mfs.com), and you will be notified by mail each time a report is posted and provided with a Web site link to access the report.
If you are already signed up to receive shareholder reports by email, you will not be affected by this change and you need not take any action. You may sign up to receive shareholder reports and other communications from the fund by email by contacting your financial intermediary (such as a broker-dealer or bank) or, if you hold your shares directly with the fund, by calling 1-800-225-2606 or by logging on to MFS Access at mfs.com.
Beginning on January 1, 2019, you may elect to receive all future reports in paper free of charge. Contact your financial intermediary to request that you continue to receive paper copies of your shareholder reports. If you invest directly with the fund, you can call 1-800-225-2606 or send an email request to orderliterature@mfs.com to let the fund know that you wish to continue receiving paper copies of your shareholder reports. Your election to receive reports in paper will apply to all funds held in your account if you invest through your financial intermediary or all funds held with the MFS fund complex if you invest directly.
SCT-ANN
MFS® Technology Fund
CONTENTS
The report is prepared for the general information of shareholders.
It is authorized for distribution to prospective investors only when preceded or accompanied by a current prospectus.
NOT FDIC INSURED• MAY LOSE VALUE• NO BANK GUARANTEE

LETTER FROM THE EXECUTIVE CHAIRMAN
Dear Shareholders:
Slowing global growth, low inflation, and increasing trade friction between the United States and China have been hallmarks of the past 12 months. After experiencing an
uptick in market volatility in late 2018, markets steadied during the first half of 2019, thanks in large measure to the adoption of a dovish policy stance on the part of global central banks, focused on supporting economic growth. The U.S. and China have raised tariffs on each other, heightening tensions and uncertainty. Despite repeated declarations by British Prime Minister Boris Johnson that the United Kingdom will leave the European Union on October 31, 2019, with or without a deal, apprehension over the possibility of a no-deal Brexit has eased somewhat, with Parliament having taken steps to block such an outcome.
Markets expect that the longest economic expansion in U.S. history will continue for the time being, albeit at a slower pace. In an effort to prolong the expansion, the U.S. Federal Reserve lowered interest rates for the first time in more than a decade in July and again in September. Similarly, the European Central Bank loosened policy in September. While markets have grown more risk averse, the accommodative monetary environment has helped push global interest rates toward record-low levels and has been somewhat supportive of risk assets despite the unsettled economic and geopolitical backdrop.
Since launching the first U.S. open-end mutual fund in 1924, MFS® has been committed to a single purpose: to create value by allocating capital responsibly for clients. Through our powerful global investment platform, we combine collective expertise, thoughtful risk management, and long-term discipline to uncover what we believe are the best investment opportunities in the market.
Respectfully,

Robert J. Manning
Executive Chairman
MFS Investment Management
October 17, 2019
The opinions expressed in this letter are subject to change and may not be relied upon for investment advice. No forecasts can be guaranteed.
1
PORTFOLIO COMPOSITION
Portfolio structure

| | | | |
| Top ten holdings | |
| Amazon.com, Inc. | | | 9.5% | |
| Alphabet, Inc., “A” | | | 9.0% | |
| Facebook, Inc., “A” | | | 6.6% | |
| Microsoft Corp. | | | 6.3% | |
| Visa, Inc., “A” | | | 5.1% | |
| Mastercard, Inc., “A” | | | 4.6% | |
| Adobe Systems, Inc. | | | 3.8% | |
| Salesforce.com, Inc. | | | 3.7% | |
| Fiserv, Inc. | | | 3.3% | |
| Global Payments, Inc. | | | 2.4% | |
| | | | |
| Top five industries | |
| Internet | | | 18.4% | |
| Business Services | | | 18.1% | |
| Computer Software | | | 17.8% | |
| Specialty Stores | | | 10.0% | |
| Other Banks and Financial Institutions | | | 9.7% | |
| (s) | Includes securities sold short. |
Cash & Cash Equivalents includes any cash, investments in money market funds, short-term securities, and other assets less liabilities. Please see the Statement of Assets and Liabilities for additional information related to the fund’s cash position and other assets and liabilities.
Percentages are based on net assets as of August 31, 2019.
The portfolio is actively managed and current holdings may be different.
2
MANAGEMENT REVIEW
Summary of Results
For the twelve months ended August 31, 2019, Class A shares of the MFS Technology Fund (fund) provided a total return of 2.97%, at net asset value. This compares with a return of 2.92% for the fund’s benchmark, the Standard & Poor’s 500 Stock Index and a return of 4.28% for the fund’s other benchmark, the Standard & Poor’s North American Technology Sector Index.
Market Environment
Changes in market sentiment, driven largely by uncertainty over the outcome of trade negotiations between the United States and China, contributed to periodic bouts of volatility during the reporting period. The global economy decelerated, led by weakness in China and Europe.
The deteriorating global growth backdrop, along with declining inflationary pressures, prompted the US Federal Reserve to cut interest rates for the first time in over a decade at the end of July, which, combined with a more dovish posture beginning in early 2019, resulted in a sharp decline in long-term interest rates during the period’s second half, inverting portions of the US Treasury yield curve. Consequently, markets anticipate additional rate cuts in the coming quarters.
Globally, central banks have tilted more dovish as well, with China lowering reserve requirements, the Bank of Canada and Bank of England holding rates steady and the European Central Bank extending alow-interest-rate refinancing facility for eurozone banks to encourage the continued flow of credit. The ECB also indicated that it would likely lower rates further and possibly resume asset purchases this fall.
Emerging markets experienced considerable volatility earlier in the period (through the end of 2018) as tighter global financial conditions exposed structural weakness in some countries. Those conditions improved in 2019 as the Fed became more dovish, but diminished hopes for a trade deal between the US and China weighed on sentiment. Idiosyncratic factors negatively impacted some emerging economies, such as Argentina and Turkey.
From a geopolitical perspective, uncertainty over Brexit remains high. British Prime Minister Boris Johnson has shown a willingness to leave the European Union on October 31, 2019, without a withdrawal agreement, although Parliament has taken steps to prevent the United Kingdom from leaving the EU without a deal. The combination of Brexit uncertainty and the deteriorating outlook for global trade has damaged business confidence and hampered investment.
Detractors from Performance
Stock selection and, to a lesser extent, anunderweight position in thecomputer softwareindustry weakened performance relative to the Standard & Poor’s North American Technology Sector Index. Within this industry, an underweight position in software giant Microsoft held back relative results. The stock price of Microsoft advanced during the period as the company posted solid earnings results, driven by strong revenue growth in both its Commercial and Azure cloud segments.In addition, holding shares of transportation network company Uber Technologies(b) and software company Blue Prism Group(b) (United Kingdom) further detracted from relative returns.
3
Management Review – continued
Stock selection and, to a lesser extent, anoverweight position in theinternetindustry also weighed on relative performance. Within this industry, the fund’s overweight positions in Internet domain registrar and web hosting company GoDaddy and technology company Alphabet hindered relative results.
An overweight position in theleisure & toysindustry negatively impacted relative returns, led by the fund’s overweight holdings of video game maker Electronic Arts.
Elsewhere, the fund’s overweight positions in information technology company DXC Technology and technology skill development solutions company Pluralsight, detracted from relative results. The stock price of DXC Technologies declined as the company lowered its earnings per share guidance, owing to foreign exchange headwinds and an accelerating shift to cloud computing, which affected the company’s Global Infrastructure Services (GIS) business. Additionally, the timing of the fund’s ownership in shares of broadband communications and networking services provider Broadcom (h) and not holding shares of strong-performing cloud-basede-commerce platform operator Shopify (Canada) further hurt relative results.
Contributors to Performance
Stock selection and an underweight position in thecomputer systemsindustry contributed to relative performance, led by an underweight position in computer and personal electronics maker Apple. The stock price of Apple declined early in the period following softer-than-anticipated iPhone demand, lower revenue from the company’s Services segment and following news of a potential new tariff on iPhones, imposed by the US administration.
The combination of an underweight position and stock selection in theelectronicsindustry also bolstered relative results, driven by the fund’s underweight position in computer graphics processors maker NVIDIA (h). The stock price of NVIDIA depreciated as the company’s data center division reported softer-than-expected results and after company management withdrew its full-year guidance, later in the period, citing limited visibility in its datacenter segment.
The fund’s position in themedical servicesindustry, which is not represented in the benchmark, aided relative performance. Within this industry, holding shares of precision oncology company Guardant Health (b) supported relative performance.
Other top relative contributors for the period included the fund’s overweight positions in electronic payments solutions providers Total System Services, Global Payments, Fiserv and Mastercard. Additionally, the fund’s short position in electric vehicle manufacturer Tesla (b),and holding shares of global aerospace and defense technology company L3Harris Technologies (b) and technology services provider Endava (b), further helped relative returns.
Respectfully,
Portfolio Manager(s)
Matthew Sabel
| (b) | Security is not a benchmark constituent. |
| (h) | Security was not held in the portfolio at period end. |
4
Management Review – continued
The views expressed in this report are those of the portfolio manager(s) only through the end of the period of the report as stated on the cover and do not necessarily reflect the views of MFS or any other person in the MFS organization. These views are subject to change at any time based on market or other conditions, and MFS disclaims any responsibility to update such views. These views may not be relied upon as investment advice or an indication of trading intent on behalf of any MFS portfolio. References to specific securities are not recommendations of such securities, and may not be representative of any MFS portfolio’s current or future investments.
5
PERFORMANCE SUMMARYTHROUGH 8/31/19
The following chart illustrates a representative class of the fund’s historical performance in comparison to its benchmark(s). Performance results include the deduction of the maximum applicable sales charge and reflect the percentage change in net asset value, including reinvestment of dividends and capital gains distributions. The performance of other share classes will be greater than or less than that of the class depicted below. Benchmarks are unmanaged and may not be invested in directly. Benchmark returns do not reflect sales charges, commissions or expenses. (See Notes to Performance Summary.)
Performance data shown represents past performance and is no guarantee of future results. Investment return and principal value fluctuate so your shares, when sold, may be worth more or less than the original cost; current performance may be lower or higher than quoted. The performance shown does not reflect the deduction of taxes, if any, that a shareholder would pay on fund distributions or the redemption of fund shares.
Growth of a Hypothetical $10,000 Investment
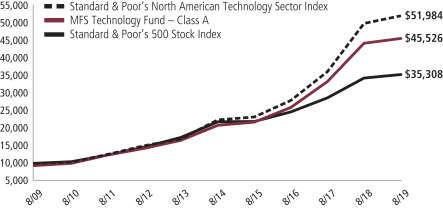
6
Performance Summary – continued
Total Returns through 8/31/19
Average annual without sales charge
| | | | | | | | | | | | | | |
| | | Share Class | | Class Inception Date | | 1-yr | | 5-yr | | 10-yr | | Life (t) | | |
| | | A | | 1/02/97 | | 2.97% | | 16.90% | | 17.06% | | N/A | | |
| | | B | | 4/14/00 | | 2.21% | | 16.03% | | 16.18% | | N/A | | |
| | | C | | 4/14/00 | | 2.19% | | 16.02% | | 16.18% | | N/A | | |
| | | I | | 1/02/97 | | 3.20% | | 17.19% | | 17.34% | | N/A | | |
| | | R1 | | 4/01/05 | | 2.19% | | 16.03% | | 16.17% | | N/A | | |
| | | R2 | | 10/31/03 | | 2.69% | | 16.60% | | 16.76% | | N/A | | |
| | | R3 | | 4/01/05 | | 2.97% | | 16.90% | | 17.05% | | N/A | | |
| | | R4 | | 4/01/05 | | 3.22% | | 17.19% | | 17.34% | | N/A | | |
| | | R6 | | 1/02/13 | | 3.33% | | 17.32% | | N/A | | 19.25% | | |
| | | |
| Comparative benchmark(s) | | | | | | |
| | | Standard & Poor’s 500 Stock Index (f) | | 2.92% | | 10.11% | | 13.45% | | N/A | | |
| | | Standard & Poor’s North American Technology Sector Index (f) | | 4.28% | | 18.34% | | 17.92% | | N/A | | |
| | | |
| Average annual with sales charge | | | | | | |
| | | A
With Initial Sales Charge (5.75%) | | (2.95)% | | 15.53% | | 16.37% | | N/A | | |
| | | B
With CDSC (Declining over six years from 4% to 0%) (v) | | (1.65)% | | 15.81% | | 16.18% | | N/A | | |
| | | C
With CDSC (1% for 12 months) (v) | | 1.22% | | 16.02% | | 16.18% | | N/A | | |
CDSC – Contingent Deferred Sales Charge.
Class I, R1, R2, R3, R4, and R6 shares do not have a sales charge.
| (f) | Source: FactSet Research Systems Inc. |
| (t) | For the period from the class inception date through the stated period end (for those share classes with less than 10 years of performance history). No comparative benchmark performance information is provided for “life” periods. (See Notes to Performance Summary.) |
| (v) | Assuming redemption at the end of the applicable period. |
Benchmark Definition(s)
Standard & Poor’s 500 Stock Index – a market capitalization-weighted index of 500 widely held equity securities, designed to measure broad U.S. equity performance.
Standard & Poor’s North American Technology Sector Index – a modified market capitalization-weighted index that measures the performance of selected technology stocks.
It is not possible to invest directly in an index.
7
Performance Summary – continued
Notes to Performance Summary
Average annual total return represents the average annual change in value for each share class for the periods presented. Life returns are presented where the share class has less than 10 years of performance history and represent the average annual total return from the class inception date to the stated period end date. As the fund’s share classes may have different inception dates, the life returns may represent different time periods and may not be comparable. As a result, no comparative benchmark performance information is provided for life periods.
Performance results reflect any applicable expense subsidies and waivers in effect during the periods shown. Without such subsidies and waivers the fund’s performance results would be less favorable. Please see the prospectus and financial statements for complete details.
Performance results do not include adjustments made for financial reporting purposes in accordance with U.S. generally accepted accounting principles and may differ from amounts reported in the financial highlights.
From time to time the fund may receive proceeds from litigation settlements, without which performance would be lower.
8
EXPENSE TABLE
Fund expenses borne by the shareholders during the period, March 1, 2019 through August 31, 2019
As a shareholder of the fund, you incur two types of costs: (1) transaction costs, including sales charges (loads) on certain purchase or redemption payments, and (2) ongoing costs, including management fees; distribution and service(12b-1) fees; and other fund expenses. This example is intended to help you understand your ongoing costs (in dollars) of investing in the fund and to compare these costs with the ongoing costs of investing in other mutual funds.
The example is based on an investment of $1,000 invested at the beginning of the period and held for the entire period March 1, 2019 through August 31, 2019.
Actual Expenses
The first line for each share class in the following table provides information about actual account values and actual expenses. You may use the information in this line, together with the amount you invested, to estimate the expenses that you paid over the period. Simply divide your account value by $1,000 (for example, an $8,600 account value divided by $1,000 = 8.6), then multiply the result by the number in the first line under the heading entitled “Expenses Paid During Period” to estimate the expenses you paid on your account during this period.
Hypothetical Example for Comparison Purposes
The second line for each share class in the following table provides information about hypothetical account values and hypothetical expenses based on the fund’s actual expense ratio and an assumed rate of return of 5% per year before expenses, which is not the fund’s actual return. The hypothetical account values and expenses may not be used to estimate the actual ending account balance or expenses you paid for the period. You may use this information to compare the ongoing costs of investing in the fund and other funds. To do so, compare this 5% hypothetical example with the 5% hypothetical examples that appear in the shareholder reports of the other funds.
Please note that the expenses shown in the table are meant to highlight your ongoing costs only and do not reflect any transactional costs, such as sales charges (loads). Therefore, the second line for each share class in the table is useful in comparing ongoing costs only, and will not help you determine the relative total costs of owning different funds. In addition, if these transactional costs were included, your costs would have been higher.
9
Expense Table – continued
| | | | | | | | | | | | | | | | | | |
Share
Class | | | | Annualized
Expense
Ratio | | | Beginning
Account Value
3/01/19 | | | Ending
Account Value
8/31/19 | | | Expenses
Paid During
Period (p)
3/01/19-8/31/19 | |
| A | | Actual | | | 1.18% | | | | $1,000.00 | | | | $1,084.63 | | | | $6.20 | |
| | Hypothetical (h) | | | 1.18% | | | | $1,000.00 | | | | $1,019.26 | | | | $6.01 | |
| B | | Actual | | | 1.94% | | | | $1,000.00 | | | | $1,080.71 | | | | $10.17 | |
| | Hypothetical (h) | | | 1.94% | | | | $1,000.00 | | | | $1,015.43 | | | | $9.86 | |
| C | | Actual | | | 1.94% | | | | $1,000.00 | | | | $1,080.31 | | | | $10.17 | |
| | Hypothetical (h) | | | 1.94% | | | | $1,000.00 | | | | $1,015.43 | | | | $9.86 | |
| I | | Actual | | | 0.94% | | | | $1,000.00 | | | | $1,085.93 | | | | $4.94 | |
| | Hypothetical (h) | | | 0.94% | | | | $1,000.00 | | | | $1,020.47 | | | | $4.79 | |
| R1 | | Actual | | | 1.94% | | | | $1,000.00 | | | | $1,080.49 | | | | $10.17 | |
| | Hypothetical (h) | | | 1.94% | | | | $1,000.00 | | | | $1,015.43 | | | | $9.86 | |
| R2 | | Actual | | | 1.44% | | | | $1,000.00 | | | | $1,083.18 | | | | $7.56 | |
| | Hypothetical (h) | | | 1.44% | | | | $1,000.00 | | | | $1,017.95 | | | | $7.32 | |
| R3 | | Actual | | | 1.19% | | | | $1,000.00 | | | | $1,084.67 | | | | $6.25 | |
| | Hypothetical (h) | | | 1.19% | | | | $1,000.00 | | | | $1,019.21 | | | | $6.06 | |
| R4 | | Actual | | | 0.94% | | | | $1,000.00 | | | | $1,086.01 | | | | $4.94 | |
| | Hypothetical (h) | | | 0.94% | | | | $1,000.00 | | | | $1,020.47 | | | | $4.79 | |
| R6 | | Actual | | | 0.83% | | | | $1,000.00 | | | | $1,086.46 | | | | $4.36 | |
| | Hypothetical (h) | | | 0.83% | | | | $1,000.00 | | | | $1,021.02 | | | | $4.23 | |
| (h) | 5% class return per year before expenses. |
| (p) | “Expenses Paid During Period” are equal to each class’s annualized expense ratio, as shown above, multiplied by the average account value over the period, multiplied by 184/365 (to reflect theone-half year period). Expenses paid do not include any applicable sales charges (loads). If these transaction costs had been included, your costs would have been higher. |
Notes to Expense Table
Expense ratios include 0.03% of investment related expenses from short sales (See Note 2 of the Notes to Financial Statements).
10
PORTFOLIO OF INVESTMENTS
8/31/19
The Portfolio of Investments is a complete list of all securities owned by your fund. It is categorized by broad-based asset classes.
| | | | | | | | |
| Common Stocks - 98.0% | | | | | | | | |
| | |
| Issuer | | Shares/Par | | | Value ($) | |
| Aerospace - 3.1% | | | | | | | | |
| CACI International, Inc., “A” (a) | | | 12,237 | | | $ | 2,720,163 | |
| FLIR Systems, Inc. | | | 135,759 | | | | 6,688,846 | |
| L3Harris Technologies, Inc. | | | 99,429 | | | | 21,020,285 | |
| Northrop Grumman Corp. | | | 24,233 | | | | 8,914,593 | |
| | | | | | | | |
| | | | | | | $ | 39,343,887 | |
| Biotechnology - 1.4% | | | | | | | | |
| Bio-Techne Corp. | | | 63,935 | | | $ | 12,248,028 | |
| Illumina, Inc. (a) | | | 17,850 | | | | 5,021,919 | |
| | | | | | | | |
| | | | | | | $ | 17,269,947 | |
| Broadcasting - 0.3% | | | | | | | | |
| Netflix, Inc. (a) | | | 11,813 | | | $ | 3,470,069 | |
| | |
| Brokerage & Asset Managers - 1.2% | | | | | | | | |
| NASDAQ, Inc. | | | 90,113 | | | $ | 8,996,882 | |
| Tradeweb Markets, Inc. | | | 134,866 | | | | 5,743,943 | |
| | | | | | | | |
| | | | | | | $ | 14,740,825 | |
| Business Services - 18.1% | | | | | | | | |
| Cognizant Technology Solutions Corp., “A” | | | 42,704 | | | $ | 2,621,599 | |
| DXC Technology Co. | | | 678,382 | | | | 22,535,850 | |
| Endava PLC, ADR (a) | | | 405,668 | | | | 15,249,060 | |
| Fidelity National Information Services, Inc. | | | 197,371 | | | | 26,885,878 | |
| Fiserv, Inc. (a) | | | 386,237 | | | | 41,304,185 | |
| FleetCor Technologies, Inc. (a) | | | 45,266 | | | | 13,507,374 | |
| Global Payments, Inc. | | | 183,329 | | | | 30,428,947 | |
| PayPal Holdings, Inc. (a) | | | 270,255 | | | | 29,471,308 | |
| Total System Services, Inc. | | | 216,257 | | | | 29,026,014 | |
| TransUnion | | | 113,402 | | | | 9,486,077 | |
| Verisk Analytics, Inc., “A” | | | 54,703 | | | | 8,836,723 | |
| | | | | | | | |
| | | | | | | $ | 229,353,015 | |
| Cable TV - 1.2% | | | | | | | | |
| Altice USA, Inc., “A” (a) | | | 520,773 | | | $ | 15,039,924 | |
| | |
| Computer Software - 17.8% | | | | | | | | |
| Adobe Systems, Inc. (a) | | | 168,808 | | | $ | 48,027,564 | |
| Autodesk, Inc. (a) | | | 83,709 | | | | 11,955,319 | |
| Blue Prism Group PLC (a) | | | 275,745 | | | | 3,115,363 | |
| DocuSign, Inc. (a) | | | 96,119 | | | | 4,487,796 | |
11
Portfolio of Investments – continued
| | | | | | | | |
| | |
| Issuer | | Shares/Par | | | Value ($) | |
| Common Stocks - continued | | | | | | | | |
| Computer Software - continued | | | | | | | | |
| Microsoft Corp. | | | 581,961 | | | $ | 80,229,143 | |
| RingCentral, Inc. (a) | | | 70,673 | | | | 9,974,081 | |
| Salesforce.com, Inc. (a) | | | 301,493 | | | | 47,054,013 | |
| Uber Technologies, Inc. (a)(l) | | | 331,853 | | | | 10,808,452 | |
| Zendesk, Inc. (a) | | | 115,529 | | | | 9,265,426 | |
| | | | | | | | |
| | | | | | | $ | 224,917,157 | |
| Computer Software - Systems - 8.4% | | | | | | | | |
| Apple, Inc. | | | 143,756 | | | $ | 30,007,627 | |
| Constellation Software, Inc. | | | 12,856 | | | | 12,521,033 | |
| Descartes Systems Group, Inc. (a) | | | 175,910 | | | | 6,238,899 | |
| EPAM Systems, Inc. (a) | | | 26,162 | | | | 5,005,576 | |
| HubSpot, Inc. (a) | | | 49,525 | | | | 9,889,152 | |
| Linx S.A. | | | 545,800 | | | | 4,201,909 | |
| Pluralsight, Inc., “A” (a) | | | 341,008 | | | | 5,490,229 | |
| Presidio, Inc. | | | 445,582 | | | | 7,138,224 | |
| Rapid7, Inc. (a) | | | 47,796 | | | | 2,566,167 | |
| ServiceNow, Inc. (a) | | | 55,030 | | | | 14,409,055 | |
| Square, Inc., “A” (a) | | | 146,614 | | | | 9,066,610 | |
| | | | | | | | |
| | | | | | | $ | 106,534,481 | |
| Consumer Services - 1.0% | | | | | | | | |
| Grand Canyon Education, Inc. (a) | | | 103,586 | | | $ | 13,010,402 | |
| | |
| Electrical Equipment - 0.7% | | | | | | | | |
| Amphenol Corp., “A” | | | 106,367 | | | $ | 9,311,367 | |
| | |
| Electronics - 3.2% | | | | | | | | |
| Applied Materials, Inc. | | | 378,882 | | | $ | 18,193,914 | |
| Microchip Technology, Inc. | | | 250,244 | | | | 21,603,564 | |
| Silicon Laboratories, Inc. (a) | | | 6,803 | | | | 741,527 | |
| | | | | | | | |
| | | | | | | $ | 40,539,005 | |
| Internet - 18.4% | | | | | | | | |
| Alibaba Group Holding Ltd., ADR (a) | | | 45,488 | | | $ | 7,961,765 | |
| Alphabet, Inc., “A” (a)(s) | | | 96,171 | | | | 114,494,461 | |
| Facebook, Inc., “A” (a)(s) | | | 448,289 | | | | 83,233,819 | |
| GoDaddy, Inc. (a) | | | 243,790 | | | | 15,441,658 | |
| Spotify Technology S.A. (a) | | | 34,181 | | | | 4,612,726 | |
| Wix.com Ltd. (a) | | | 54,506 | | | | 7,644,466 | |
| | | | | | | | |
| | | | | | | $ | 233,388,895 | |
| Leisure & Toys - 1.7% | | | | | | | | |
| Electronic Arts, Inc. (a) | | | 234,184 | | | $ | 21,938,357 | |
12
Portfolio of Investments – continued
| | | | | | | | |
| | |
| Issuer | | Shares/Par | | | Value ($) | |
| Common Stocks - continued | | | | | | | | |
| Medical & Health Technology & Services - 0.7% | | | | | | | | |
| Guardant Health, Inc. (a) | | | 99,800 | | | $ | 8,735,494 | |
| | |
| Other Banks & Diversified Financials - 9.7% | | | | | | | | |
| Mastercard, Inc., “A” | | | 206,338 | | | $ | 58,057,323 | |
| Visa, Inc., “A” | | | 359,896 | | | | 65,076,395 | |
| | | | | | | | |
| | | | | | | $ | 123,133,718 | |
| Printing & Publishing - 1.1% | | | | | | | | |
| IHS Markit Ltd. (a) | | | 206,327 | | | $ | 13,537,114 | |
| | |
| Specialty Stores - 10.0% | | | | | | | | |
| Amazon.com, Inc. (a)(s) | | | 67,803 | | | $ | 120,437,791 | |
| Chewy, Inc., “A” (a) | | | 184,434 | | | | 6,086,322 | |
| | | | | | | | |
| | | | | | | $ | 126,524,113 | |
| Total Common Stocks (Identified Cost, $686,315,517) | | | | | | $ | 1,240,787,770 | |
| | |
| Investment Companies (h) - 2.8% | | | | | | | | |
| Money Market Funds - 2.8% | | | | | | | | |
| MFS Institutional Money Market Portfolio, 2.17% (v) (Identified Cost, $34,873,542) | | | 34,875,849 | | | $ | 34,879,336 | |
| | |
| Collateral for Securities Loaned - 0.6% | | | | | | | | |
| State Street Navigator Securities Lending Government Money Market Portfolio, 2.12% (j) (Identified Cost, $7,703,526) | | | 7,703,526 | | | $ | 7,703,526 | |
| | |
| Securities Sold Short - (0.7)% | | | | | | | | |
| Automotive - (0.7)% | | | | | | | | |
| Tesla, Inc. (Proceeds Received, $10,623,146) | | | (38,211 | ) | | $ | (8,620,784 | ) |
| | |
| Other Assets, Less Liabilities - (0.7)% | | | | | | | (8,833,788 | ) |
| Net Assets - 100.0% | | | | | | $ | 1,265,916,060 | |
| (a) | Non-income producing security. |
| (h) | An affiliated issuer, which may be considered one in which the fund owns 5% or more of the outstanding voting securities, or a company which is under common control. At period end, the aggregate values of the fund’s investments in affiliated issuers and in unaffiliated issuers were $34,879,336 and $1,248,491,296, respectively. |
| (j) | The rate quoted is the annualizedseven-day yield of the fund at period end. |
| (l) | A portion of this security is on loan. See Note 2 for additional information. |
| (s) | Security or a portion of the security was pledged to cover collateral requirements for securities sold short and/or certain derivative transactions. |
| (v) | Affiliated issuer that is available only to investment companies managed by MFS. The rate quoted for the MFS Institutional Money Market Portfolio is the annualizedseven-day yield of the fund at period end. |
13
Portfolio of Investments – continued
The following abbreviations are used in this report and are defined:
| ADR | | American Depositary Receipt |
At August 31, 2019, the fund had cash collateral of $1,475,261 and other liquid securities with an aggregate value of $14,948,566 to cover any collateral or margin obligations for securities sold short and certain derivative contracts. Restricted cash and/or deposits with brokers in the Statement of Assets and Liabilities are comprised of cash collateral.
See Notes to Financial Statements
14
Financial Statements
STATEMENT OF ASSETS AND LIABILITIES
At 8/31/19
This statement represents your fund’s balance sheet, which details the assets and liabilities comprising the total value of the fund.
| | | | |
| Assets | | | | |
Investments in unaffiliated issuers, at value, including $7,489,667 of securities on loan (identified cost, $694,019,043) | | | $1,248,491,296 | |
Investments in affiliated issuers, at value (identified cost, $34,873,542) | | | 34,879,336 | |
Deposits with brokers for | | | | |
Securities sold short | | | 1,475,261 | |
Receivables for | | | | |
Fund shares sold | | | 1,101,521 | |
Interest and dividends | | | 576,359 | |
Other assets | | | 1,100 | |
Total assets | | | $1,286,524,873 | |
| |
| Liabilities | | | | |
Payable to custodian | | | $24,351 | |
Payables for | | | | |
Securities sold short, at value (proceeds received, $10,623,146) | | | 8,620,784 | |
Fund shares reacquired | | | 3,601,243 | |
Collateral for securities loaned, at value | | | 7,703,526 | |
Payable to affiliates | | | | |
Investment adviser | | | 75,935 | |
Administrative services fee | | | 1,473 | |
Shareholder servicing costs | | | 421,603 | |
Distribution and service fees | | | 24,832 | |
Payable for independent Trustees’ compensation | | | 428 | |
Accrued expenses and other liabilities | | | 134,638 | |
Total liabilities | | | $20,608,813 | |
Net assets | | | $1,265,916,060 | |
| |
| Net assets consist of | | | | |
Paid-in capital | | | $694,783,033 | |
Total distributable earnings (loss) | | | 571,133,027 | |
Net assets | | | $1,265,916,060 | |
Shares of beneficial interest outstanding | | | 28,228,722 | |
15
Statement of Assets and Liabilities – continued
| | | | | | | | | | | | |
| | | |
| | | Net assets | | | Shares
outstanding | | | Net asset value
per share (a) | |
| Class A | | | $471,467,779 | | | | 10,539,734 | | | | $44.73 | |
| Class B | | | 41,017,211 | | | | 1,074,946 | | | | 38.16 | |
| Class C | | | 128,817,333 | | | | 3,383,256 | | | | 38.07 | |
| Class I | | | 315,655,271 | | | | 6,572,895 | | | | 48.02 | |
| Class R1 | | | 5,714,939 | | | | 150,417 | | | | 37.99 | |
| Class R2 | | | 29,339,431 | | | | 691,102 | | | | 42.45 | |
| Class R3 | | | 80,242,326 | | | | 1,794,773 | | | | 44.71 | |
| Class R4 | | | 25,309,746 | | | | 541,721 | | | | 46.72 | |
| Class R6 | | | 168,352,024 | | | | 3,479,878 | | | | 48.38 | |
| (a) | Maximum offering price per share was equal to the net asset value per share for all share classes, except for Class A, for which the maximum offering price per share was $47.46 [100 / 94.25 x $44.73]. On sales of $50,000 or more, the maximum offering price of Class A shares is reduced. A contingent deferred sales charge may be imposed on redemptions of Class A, Class B, and Class C shares. Redemption price per share was equal to the net asset value per share for Classes I, R1, R2, R3, R4, and R6. |
See Notes to Financial Statements
16
Financial Statements
STATEMENT OF OPERATIONS
Year ended 8/31/19
This statement describes how much your fund earned in investment income and accrued in expenses. It also describes any gains and/or losses generated by fund operations.
| | | | |
| Net investment income (loss) | | | | |
Income | | | | |
Dividends | | | $5,328,922 | |
Dividends from affiliated issuers | | | 684,197 | |
Other | | | 339,128 | |
Income on securities loaned | | | 39,875 | |
Foreign taxes withheld | | | (54,025 | ) |
Total investment income | | | $6,338,097 | |
Expenses | | | | |
Management fee | | | $8,790,370 | |
Distribution and service fees | | | 3,150,225 | |
Shareholder servicing costs | | | 1,287,082 | |
Administrative services fee | | | 169,045 | |
Independent Trustees’ compensation | | | 23,511 | |
Custodian fee | | | 76,652 | |
Shareholder communications | | | 75,527 | |
Audit and tax fees | | | 60,447 | |
Legal fees | | | 10,989 | |
Dividend and interest expense on securities sold short | | | 295,439 | |
Interest expense and fees | | | 7,047 | |
Miscellaneous | | | 205,165 | |
Total expenses | | | $14,151,499 | |
Reduction of expenses by investment adviser and distributor | | | (138,714 | ) |
Net expenses | | | $14,012,785 | |
Net investment income (loss) | | | $(7,674,688 | ) |
| |
| Realized and unrealized gain (loss) | | | | |
Realized gain (loss) (identified cost basis) | | | | |
Unaffiliated issuers | | | $32,452,549 | |
Affiliated issuers | | | 60 | |
Written options | | | 368,827 | |
Securities sold short | | | (2,017,464 | ) |
Foreign currency | | | (2,370 | ) |
Net realized gain (loss) | | | $30,801,602 | |
Change in unrealized appreciation or depreciation | | | | |
Unaffiliated issuers | | | $4,503,270 | |
Affiliated issuers | | | 3,162 | |
Securities sold short | | | 5,705,479 | |
Net unrealized gain (loss) | | | $10,211,911 | |
Net realized and unrealized gain (loss) | | | $41,013,513 | |
Change in net assets from operations | | | $33,338,825 | |
See Notes to Financial Statements
17
Financial Statements
STATEMENTS OF CHANGES IN NET ASSETS
These statements describe the increases and/or decreases in net assets resulting from operations, any distributions, and any shareholder transactions.
| | | | | | | | |
| | | Year ended | |
| | | 8/31/19 | | | 8/31/18 | |
| Change in net assets | | | | | | |
| | |
| From operations | | | | | | | | |
Net investment income (loss) | | | $(7,674,688 | ) | | | $(6,927,690 | ) |
Net realized gain (loss) | | | 30,801,602 | | | | 62,489,446 | |
Net unrealized gain (loss) | | | 10,211,911 | | | | 230,387,318 | |
Change in net assets from operations | | | $33,338,825 | | | | $285,949,074 | |
Total distributions to shareholders (a) | | | $(51,440,197 | ) | | | $(34,022,224 | ) |
Change in net assets from fund share transactions | | | $47,069,408 | | | | $123,938,358 | |
Total change in net assets | | | $28,968,036 | | | | $375,865,208 | |
| | |
| Net assets | | | | | | | | |
At beginning of period | | | 1,236,948,024 | | | | 861,082,816 | |
At end of period (b) | | | $1,265,916,060 | | | | $1,236,948,024 | |
| (a) | Distributions from net investment income and from net realized gain are no longer required to be separately disclosed. For the year ended August 31, 2018, distributions from net realized gain were $34,022,224. |
| (b) | Parenthetical disclosure of accumulated net investment loss is no longer required. For the year ended August 31, 2018, end of period net assets included accumulated net investment loss of $510. |
See Notes to Financial Statements
18
Financial Statements
FINANCIAL HIGHLIGHTS
The financial highlights table is intended to help you understand the fund’s financial performance for the past 5 years. Certain information reflects financial results for a single fund share. The total returns in the table represent the rate that an investor would have earned (or lost) on an investment in the fund share class (assuming reinvestment of all distributions) held for the entire period.
| | | | | | | | | | | | | | | | | | | | |
| Class A | | Year ended | |
| | | | | |
| | | 8/31/19 | | | 8/31/18 | | | 8/31/17 | | | 8/31/16 | | | 8/31/15 | |
Net asset value, beginning of period | | | $45.65 | | | | $35.67 | | | | $28.27 | | | | $24.62 | | | | $24.47 | |
|
| Income (loss) from investment operations | |
Net investment income (loss) (d) | | | $(0.27 | ) | | | $(0.26 | ) | | | $(0.19 | )(c) | | | $(0.12 | ) | | | $(0.15 | ) |
Net realized and unrealized gain (loss) | | | 1.24 | | | | 11.61 | | | | 8.13 | | | | 4.76 | | | | 1.15 | |
Total from investment operations | | | $0.97 | | | | $11.35 | | | | $7.94 | | | | $4.64 | | | | $1.00 | |
|
| Less distributions declared to shareholders | |
From net realized gain | | | $(1.89 | ) | | | $(1.37 | ) | | | $(0.54 | ) | | | $(0.99 | ) | | | $(0.85 | ) |
Net asset value, end of period (x) | | | $44.73 | | | | $45.65 | | | | $35.67 | | | | $28.27 | | | | $24.62 | |
Total return (%) (r)(s)(t)(x) | | | 2.97 | | | | 32.79 | | | | 28.58 | (c) | | | 19.20 | | | | 4.18 | |
|
Ratios (%) (to average net assets)
and Supplemental data: | |
Expenses before expense reductions (f) | | | 1.19 | | | | 1.24 | | | | 1.24 | (c) | | | 1.27 | | | | 1.30 | |
Expenses after expense reductions (f) | | | 1.18 | | | | 1.22 | | | | 1.23 | (c) | | | 1.26 | | | | 1.29 | |
Net investment income (loss) | | | (0.64 | ) | | | (0.66 | ) | | | (0.63 | )(c) | | | (0.48 | ) | | | (0.60 | ) |
Portfolio turnover | | | 32 | | | | 30 | | | | 43 | | | | 30 | | | | 43 | |
Net assets at end of period (000 omitted) | | | $471,468 | | | | $484,477 | | | | $359,698 | | | | $320,898 | | | | $199,313 | |
|
| Supplemental Ratios (%): | |
Ratio of expenses to average net assets after
expense reductions excluding short sale
expenses and interest expense and fees (f) | | | 1.15 | | | | 1.16 | | | | 1.19 | (c) | | | 1.24 | | | | 1.27 | |
See Notes to Financial Statements
19
Financial Highlights – continued
| | | | | | | | | | | | | | | | | | | | |
| Class B | | Year ended | |
| | | | | |
| | | 8/31/19 | | | 8/31/18 | | | 8/31/17 | | | 8/31/16 | | | 8/31/15 | |
Net asset value, beginning of period | | | $39.55 | | | | $31.31 | | | | $25.06 | | | | $22.09 | | | | $22.20 | |
|
| Income (loss) from investment operations | |
Net investment income (loss) (d) | | | $(0.50 | ) | | | $(0.49 | ) | | | $(0.38 | )(c) | | | $(0.28 | ) | | | $(0.30 | ) |
Net realized and unrealized gain (loss) | | | 1.00 | | | | 10.10 | | | | 7.17 | | | | 4.24 | | | | 1.04 | |
Total from investment operations | | | $0.50 | | | | $9.61 | | | | $6.79 | | | | $3.96 | | | | $0.74 | |
|
| Less distributions declared to shareholders | |
From net realized gain | | | $(1.89 | ) | | | $(1.37 | ) | | | $(0.54 | ) | | | $(0.99 | ) | | | $(0.85 | ) |
Net asset value, end of period (x) | | | $38.16 | | | | $39.55 | | | | $31.31 | | | | $25.06 | | | | $22.09 | |
Total return (%) (r)(s)(t)(x) | | | 2.21 | | | | 31.77 | | | | 27.64 | (c) | | | 18.29 | | | | 3.41 | |
|
Ratios (%) (to average net assets)
and Supplemental data: | |
Expenses before expense reductions (f) | | | 1.94 | | | | 1.99 | | | | 1.99 | (c) | | | 2.02 | | | | 2.05 | |
Expenses after expense reductions (f) | | | 1.93 | | | | 1.98 | | | | 1.98 | (c) | | | 2.01 | | | | 2.04 | |
Net investment income (loss) | | | (1.39 | ) | | | (1.41 | ) | | | (1.38 | )(c) | | | (1.22 | ) | | | (1.35 | ) |
Portfolio turnover | | | 32 | | | | 30 | | | | 43 | | | | 30 | | | | 43 | |
Net assets at end of period (000 omitted) | | | $41,017 | | | | $45,337 | | | | $34,396 | | | | $25,990 | | | | $18,791 | |
|
| Supplemental Ratios (%): | |
Ratio of expenses to average net assets after
expense reductions excluding short sale
expenses and interest expense and fees (f) | | | 1.90 | | | | 1.92 | | | | 1.94 | (c) | | | 1.99 | | | | 2.02 | |
See Notes to Financial Statements
20
Financial Highlights – continued
| | | | | | | | | | | | | | | | | | | | |
| Class C | | Year ended | |
| | | | | |
| | | 8/31/19 | | | 8/31/18 | | | 8/31/17 | | | 8/31/16 | | | 8/31/15 | |
Net asset value, beginning of period | | | $39.47 | | | | $31.24 | | | | $25.01 | | | | $22.05 | | | | $22.16 | |
|
| Income (loss) from investment operations | |
Net investment income (loss) (d) | | | $(0.50 | ) | | | $(0.49 | ) | | | $(0.38 | )(c) | | | $(0.28 | ) | | | $(0.30 | ) |
Net realized and unrealized gain (loss) | | | 0.99 | | | | 10.09 | | | | 7.15 | | | | 4.23 | | | | 1.04 | |
Total from investment operations | | | $0.49 | | | | $9.60 | | | | $6.77 | | | | $3.95 | | | | $0.74 | |
|
| Less distributions declared to shareholders | |
From net realized gain | | | $(1.89 | ) | | | $(1.37 | ) | | | $(0.54 | ) | | | $(0.99 | ) | | | $(0.85 | ) |
Net asset value, end of period (x) | | | $38.07 | | | | $39.47 | | | | $31.24 | | | | $25.01 | | | | $22.05 | |
Total return (%) (r)(s)(t)(x) | | | 2.19 | | | | 31.81 | | | | 27.62 | (c) | | | 18.28 | | | | 3.42 | |
|
Ratios (%) (to average net assets)
and Supplemental data: | |
Expenses before expense reductions (f) | | | 1.94 | | | | 1.98 | | | | 1.99 | (c) | | | 2.02 | | | | 2.05 | |
Expenses after expense reductions (f) | | | 1.93 | | | | 1.97 | | | | 1.98 | (c) | | | 2.01 | | | | 2.04 | |
Net investment income (loss) | | | (1.40 | ) | | | (1.41 | ) | | | (1.38 | )(c) | | | (1.23 | ) | | | (1.35 | ) |
Portfolio turnover | | | 32 | | | | 30 | | | | 43 | | | | 30 | | | | 43 | |
Net assets at end of period (000 omitted) | | | $128,817 | | | | $128,707 | | | | $101,656 | | | | $73,071 | | | | $43,037 | |
|
| Supplemental Ratios (%): | |
Ratio of expenses to average net assets after
expense reductions excluding short sale
expenses and interest expense and fees (f) | | | 1.91 | | | | 1.92 | | | | 1.94 | (c) | | | 2.00 | | | | 2.02 | |
See Notes to Financial Statements
21
Financial Highlights – continued
| | | | | | | | | | | | | | | | | | | | |
| Class I | | Year ended | |
| | | | | |
| | | 8/31/19 | | | 8/31/18 | | | 8/31/17 | | | 8/31/16 | | | 8/31/15 | |
Net asset value, beginning of period | | | $48.74 | | | | $37.90 | | | | $29.93 | | | | $25.96 | | | | $25.69 | |
|
| Income (loss) from investment operations | |
Net investment income (loss) (d) | | | $(0.18 | ) | | | $(0.18 | ) | | | $(0.13 | )(c) | | | $(0.07 | ) | | | $(0.09 | ) |
Net realized and unrealized gain (loss) | | | 1.35 | | | | 12.39 | | | | 8.64 | | | | 5.03 | | | | 1.21 | |
Total from investment operations | | | $1.17 | | | | $12.21 | | | | $8.51 | | | | $4.96 | | | | $1.12 | |
|
| Less distributions declared to shareholders | |
From net realized gain | | | $(1.89 | ) | | | $(1.37 | ) | | | $(0.54 | ) | | | $(0.99 | ) | | | $(0.85 | ) |
Net asset value, end of period (x) | | | $48.02 | | | | $48.74 | | | | $37.90 | | | | $29.93 | | | | $25.96 | |
Total return (%) (r)(s)(t)(x) | | | 3.20 | | | | 33.14 | | | | 28.91 | (c) | | | 19.45 | | | | 4.45 | |
|
Ratios (%) (to average net assets)
and Supplemental data: | |
Expenses before expense reductions (f) | | | 0.94 | | | | 0.99 | | | | 0.99 | (c) | | | 1.02 | | | | 1.05 | |
Expenses after expense reductions (f) | | | 0.93 | | | | 0.98 | | | | 0.98 | (c) | | | 1.01 | | | | 1.04 | |
Net investment income (loss) | | | (0.40 | ) | | | (0.41 | ) | | | (0.39 | )(c) | | | (0.24 | ) | | | (0.35 | ) |
Portfolio turnover | | | 32 | | | | 30 | | | | 43 | | | | 30 | | | | 43 | |
Net assets at end of period (000 omitted) | | | $315,655 | | | | $303,359 | | | | $174,275 | | | | $96,700 | | | | $56,619 | |
|
| Supplemental Ratios (%): | |
Ratio of expenses to average net assets after
expense reductions excluding short sale
expenses and interest expense and fees (f) | | | 0.91 | | | | 0.92 | | | | 0.95 | (c) | | | 1.00 | | | | 1.02 | |
See Notes to Financial Statements
22
Financial Highlights – continued
| | | | | | | | | | | | | | | | | | | | |
| Class R1 | | Year ended | |
| | | | | |
| | | 8/31/19 | | | 8/31/18 | | | 8/31/17 | | | 8/31/16 | | | 8/31/15 | |
Net asset value, beginning of period | | | $39.39 | | | | $31.18 | | | | $24.96 | | | | $22.01 | | | | $22.12 | |
|
| Income (loss) from investment operations | |
Net investment income (loss) (d) | | | $(0.50 | ) | | | $(0.49 | ) | | | $(0.38 | )(c) | | | $(0.28 | ) | | | $(0.30 | ) |
Net realized and unrealized gain (loss) | | | 0.99 | | | | 10.07 | | | | 7.14 | | | | 4.22 | | | | 1.04 | |
Total from investment operations | | | $0.49 | | | | $9.58 | | | | $6.76 | | | | $3.94 | | | | $0.74 | |
|
| Less distributions declared to shareholders | |
From net realized gain | | | $(1.89 | ) | | | $(1.37 | ) | | | $(0.54 | ) | | | $(0.99 | ) | | | $(0.85 | ) |
Net asset value, end of period (x) | | | $37.99 | | | | $39.39 | | | | $31.18 | | | | $24.96 | | | | $22.01 | |
Total return (%) (r)(s)(t)(x) | | | 2.19 | | | | 31.80 | | | | 27.63 | (c) | | | 18.27 | | | | 3.43 | |
|
Ratios (%) (to average net assets)
and Supplemental data: | |
Expenses before expense reductions (f) | | | 1.94 | | | | 1.99 | | | | 1.99 | (c) | | | 2.02 | | | | 2.05 | |
Expenses after expense reductions (f) | | | 1.93 | | | | 1.98 | | | | 1.98 | (c) | | | 2.01 | | | | 2.04 | |
Net investment income (loss) | | | (1.40 | ) | | | (1.41 | ) | | | (1.38 | )(c) | | | (1.22 | ) | | | (1.36 | ) |
Portfolio turnover | | | 32 | | | | 30 | | | | 43 | | | | 30 | | | | 43 | |
Net assets at end of period (000 omitted) | | | $5,715 | | | | $5,534 | | | | $4,256 | | | | $3,073 | | | | $2,516 | |
|
| Supplemental Ratios (%): | |
Ratio of expenses to average net assets after
expense reductions excluding short sale
expenses and interest expense and fees (f) | | | 1.91 | | | | 1.92 | | | | 1.95 | (c) | | | 1.99 | | | | 2.02 | |
See Notes to Financial Statements
23
Financial Highlights – continued
| | | | | | | | | | | | | | | | | | | | |
| Class R2 | | Year ended | |
| | | | | |
| | | 8/31/19 | | | 8/31/18 | | | 8/31/17 | | | 8/31/16 | | | 8/31/15 | |
Net asset value, beginning of period | | | $43.55 | | | | $34.17 | | | | $27.17 | | | | $23.76 | | | | $23.70 | |
|
| Income (loss) from investment operations | |
Net investment income (loss) (d) | | | $(0.36 | ) | | | $(0.35 | ) | | | $(0.26 | )(c) | | | $(0.18 | ) | | | $(0.20 | ) |
Net realized and unrealized gain (loss) | | | 1.15 | | | | 11.10 | | | | 7.80 | | | | 4.58 | | | | 1.11 | |
Total from investment operations | | | $0.79 | | | | $10.75 | | | | $7.54 | | | | $4.40 | | | | $0.91 | |
|
| Less distributions declared to shareholders | |
From net realized gain | | | $(1.89 | ) | | | $(1.37 | ) | | | $(0.54 | ) | | | $(0.99 | ) | | | $(0.85 | ) |
Net asset value, end of period (x) | | | $42.45 | | | | $43.55 | | | | $34.17 | | | | $27.17 | | | | $23.76 | |
Total return (%) (r)(s)(t)(x) | | | 2.69 | | | | 32.46 | | | | 28.27 | (c) | | | 18.88 | | | | 3.93 | |
|
Ratios (%) (to average net assets)
and Supplemental data: | |
Expenses before expense reductions (f) | | | 1.44 | | | | 1.48 | | | | 1.49 | (c) | | | 1.52 | | | | 1.55 | |
Expenses after expense reductions (f) | | | 1.43 | | | | 1.48 | | | | 1.49 | (c) | | | 1.51 | | | | 1.54 | |
Net investment income (loss) | | | (0.90 | ) | | | (0.91 | ) | | | (0.89 | )(c) | | | (0.72 | ) | | | (0.84 | ) |
Portfolio turnover | | | 32 | | | | 30 | | | | 43 | | | | 30 | | | | 43 | |
Net assets at end of period (000 omitted) | | | $29,339 | | | | $28,071 | | | | $23,625 | | | | $17,031 | | | | $14,946 | |
|
| Supplemental Ratios (%): | |
Ratio of expenses to average net assets after
expense reductions excluding short sale
expenses and interest expense and fees (f) | | | 1.41 | | | | 1.42 | | | | 1.45 | (c) | | | 1.49 | | | | 1.52 | |
See Notes to Financial Statements
24
Financial Highlights – continued
| | | | | | | | | | | | | | | | | | | | |
| Class R3 | | Year ended | |
| | | | | |
| | | 8/31/19 | | | 8/31/18 | | | 8/31/17 | | | 8/31/16 | | | 8/31/15 | |
Net asset value, beginning of period | | | $45.63 | | | | $35.66 | | | | $28.26 | | | | $24.61 | | | | $24.46 | |
|
| Income (loss) from investment operations | |
Net investment income (loss) (d) | | | $(0.27 | ) | | | $(0.27 | ) | | | $(0.20 | )(c) | | | $(0.13 | ) | | | $(0.15 | ) |
Net realized and unrealized gain (loss) | | | 1.24 | | | | 11.61 | | | | 8.14 | | | | 4.77 | | | | 1.15 | |
Total from investment operations | | | $0.97 | | | | $11.34 | | | | $7.94 | | | | $4.64 | | | | $1.00 | |
|
| Less distributions declared to shareholders | |
From net realized gain | | | $(1.89 | ) | | | $(1.37 | ) | | | $(0.54 | ) | | | $(0.99 | ) | | | $(0.85 | ) |
Net asset value, end of period (x) | | | $44.71 | | | | $45.63 | | | | $35.66 | | | | $28.26 | | | | $24.61 | |
Total return (%) (r)(s)(t)(x) | | | 2.97 | | | | 32.77 | | | | 28.59 | (c) | | | 19.21 | | | | 4.18 | |
|
Ratios (%) (to average net assets)
and Supplemental data: | |
Expenses before expense reductions (f) | | | 1.19 | | | | 1.24 | | | | 1.24 | (c) | | | 1.27 | | | | 1.30 | |
Expenses after expense reductions (f) | | | 1.18 | | | | 1.23 | | | | 1.23 | (c) | | | 1.26 | | | | 1.29 | |
Net investment income (loss) | | | (0.65 | ) | | | (0.66 | ) | | | (0.65 | )(c) | | | (0.49 | ) | | | (0.60 | ) |
Portfolio turnover | | | 32 | | | | 30 | | | | 43 | | | | 30 | | | | 43 | |
Net assets at end of period (000 omitted) | | | $80,242 | | | | $79,534 | | | | $53,199 | | | | $20,180 | | | | $9,732 | |
|
| Supplemental Ratios (%): | |
Ratio of expenses to average net assets after
expense reductions excluding short sale
expenses and interest expense and fees (f) | | | 1.16 | | | | 1.17 | | | | 1.20 | (c) | | | 1.25 | | | | 1.27 | |
See Notes to Financial Statements
25
Financial Highlights – continued
| | | | | | | | | | | | | | | | | | | | |
| Class R4 | | Year ended | |
| | | | | |
| | | 8/31/19 | | | 8/31/18 | | | 8/31/17 | | | 8/31/16 | | | 8/31/15 | |
Net asset value, beginning of period | | | $47.47 | | | | $36.95 | | | | $29.19 | | | | $25.34 | | | | $25.10 | |
|
| Income (loss) from investment operations | |
Net investment income (loss) (d) | | | $(0.17 | ) | | | $(0.17 | ) | | | $(0.13 | )(c) | | | $(0.06 | ) | | | $(0.09 | ) |
Net realized and unrealized gain (loss) | | | 1.31 | | | | 12.06 | | | | 8.43 | | | | 4.90 | | | | 1.18 | |
Total from investment operations | | | $1.14 | | | | $11.89 | | | | $8.30 | | | | $4.84 | | | | $1.09 | |
|
| Less distributions declared to shareholders | |
From net realized gain | | | $(1.89 | ) | | | $(1.37 | ) | | | $(0.54 | ) | | | $(0.99 | ) | | | $(0.85 | ) |
Net asset value, end of period (x) | | | $46.72 | | | | $47.47 | | | | $36.95 | | | | $29.19 | | | | $25.34 | |
Total return (%) (r)(s)(t)(x) | | | 3.22 | | | | 33.12 | | | | 28.92 | (c) | | | 19.45 | | | | 4.44 | |
|
Ratios (%) (to average net assets)
and Supplemental data: | |
Expenses before expense reductions (f) | | | 0.94 | | | | 0.99 | | | | 0.99 | (c) | | | 1.02 | | | | 1.05 | |
Expenses after expense reductions (f) | | | 0.93 | | | | 0.98 | | | | 0.99 | (c) | | | 1.01 | | | | 1.04 | |
Net investment income (loss) | | | (0.40 | ) | | | (0.41 | ) | | | (0.39 | )(c) | | | (0.24 | ) | | | (0.37 | ) |
Portfolio turnover | | | 32 | | | | 30 | | | | 43 | | | | 30 | | | | 43 | |
Net assets at end of period (000 omitted) | | | $25,310 | | | | $23,004 | | | | $14,443 | | | | $8,141 | | | | $2,234 | |
|
| Supplemental Ratios (%): | |
Ratio of expenses to average net assets after
expense reductions excluding short sale
expenses and interest expense and fees (f) | | | 0.91 | | | | 0.92 | | | | 0.95 | (c) | | | 1.00 | | | | 1.02 | |
See Notes to Financial Statements
26
Financial Highlights – continued
| | | | | | | | | | | | | | | | | | | | |
| Class R6 | | Year ended | |
| | | | | |
| | | 8/31/19 | | | 8/31/18 | | | 8/31/17 | | | 8/31/16 | | | 8/31/15 | |
Net asset value, beginning of period | | | $49.03 | | | | $38.09 | | | | $30.05 | | | | $26.03 | | | | $25.73 | |
|
| Income (loss) from investment operations | |
Net investment income (loss) (d) | | | $(0.13 | ) | | | $(0.13 | ) | | | $(0.10 | )(c) | | | $(0.04 | ) | | | $(0.07 | ) |
Net realized and unrealized gain (loss) | | | 1.37 | | | | 12.44 | | | | 8.68 | | | | 5.05 | | | | 1.22 | |
Total from investment operations | | | $1.24 | | | | $12.31 | | | | $8.58 | | | | $5.01 | | | | $1.15 | |
|
| Less distributions declared to shareholders | |
From net realized gain | | | $(1.89 | ) | | | $(1.37 | ) | | | $(0.54 | ) | | | $(0.99 | ) | | | $(0.85 | ) |
Net asset value, end of period (x) | | | $48.38 | | | | $49.03 | | | | $38.09 | | | | $30.05 | | | | $26.03 | |
Total return (%) (r)(s)(t)(x) | | | 3.33 | | | | 33.24 | | | | 29.03 | (c) | | | 19.59 | | | | 4.57 | |
|
Ratios (%) (to average net assets)
and Supplemental data: | |
Expenses before expense reductions (f) | | | 0.84 | | | | 0.89 | | | | 0.90 | (c) | | | 0.92 | | | | 0.95 | |
Expenses after expense reductions (f) | | | 0.83 | | | | 0.88 | | | | 0.89 | (c) | | | 0.91 | | | | 0.94 | |
Net investment income (loss) | | | (0.30 | ) | | | (0.31 | ) | | | (0.30 | )(c) | | | (0.13 | ) | | | (0.27 | ) |
Portfolio turnover | | | 32 | | | | 30 | | | | 43 | | | | 30 | | | | 43 | |
Net assets at end of period (000 omitted) | | | $168,352 | | | | $138,924 | | | | $95,534 | | | | $33,411 | | | | $7,079 | |
|
| Supplemental Ratios (%): | |
Ratio of expenses to average net assets after
expense reductions excluding short sale
expenses and interest expense and fees (f) | | | 0.81 | | | | 0.82 | | | | 0.85 | (c) | | | 0.90 | | | | 0.92 | |
| (c) | Amount reflects aone-time reimbursement of expenses by the custodian (or former custodian) without which net investment income and performance would be lower and expenses would be higher. |
| (d) | Per share data is based on average shares outstanding. |
| (f) | Ratios do not reflect reductions from fees paid indirectly, if applicable. |
| (r) | Certain expenses have been reduced without which performance would have been lower. |
| (s) | From time to time the fund may receive proceeds from litigation settlements, without which performance would be lower. |
| (t) | Total returns do not include any applicable sales charges. |
| (x) | The net asset values and total returns have been calculated on net assets which include adjustments made in accordance with U.S. generally accepted accounting principles required at period end for financial reporting purposes. |
See Notes to Financial Statements
27
NOTES TO FINANCIAL STATEMENTS
(1) Business and Organization
MFS Technology Fund (the fund) is anon-diversified series of MFS Series Trust I (the trust). The trust is organized as a Massachusetts business trust and is registered under the Investment Company Act of 1940, as amended, as anopen-end management investment company.
The fund is an investment company and accordingly follows the investment company accounting and reporting guidance of the Financial Accounting Standards Board (FASB) Accounting Standards Codification Topic 946 Financial Services – Investment Companies.
(2) Significant Accounting Policies
General– The preparation of financial statements in conformity with U.S. generally accepted accounting principles requires management to make estimates and assumptions that affect the reported amounts of assets and liabilities, and disclosure of contingent assets and liabilities at the date of the financial statements and the reported amounts of increases and decreases in net assets from operations during the reporting period. Actual results could differ from those estimates. In the preparation of these financial statements, management has evaluated subsequent events occurring after the date of the fund’s Statement of Assets and Liabilities through the date that the financial statements were issued. The fund invests primarily in securities of issuers in the technology industry. Issuers in a single industry can react similarly to market, currency, political, economic, regulatory, geopolitical, and other conditions. The value of stocks in the technology sector can be very volatile due to the rapid pace of product change, technological developments, and other factors.
Balance Sheet Offsetting– The fund’s accounting policy with respect to balance sheet offsetting is that, absent an event of default by the counterparty or a termination of the agreement, the International Swaps and Derivatives Association (ISDA) Master Agreement, or similar agreement, does not result in an offset of reported amounts of financial assets and financial liabilities in the Statement of Assets and Liabilities across transactions between the fund and the applicable counterparty. The fund’s right to setoff may be restricted or prohibited by the bankruptcy or insolvency laws of the particular jurisdiction to which a specific master netting agreement counterparty is subject. Balance sheet offsetting disclosures, to the extent applicable to the fund, have been included in the fund’s Significant Accounting Policies note under the captions for each of the fund’sin-scope financial instruments and transactions.
Investment Valuations– Equity securities, including restricted equity securities and equity securities sold short, are generally valued at the last sale or official closing price on their primary market or exchange as provided by a third-party pricing service. Equity securities, for which there were no sales reported that day, are generally valued at the last quoted daily bid quotation on their primary market or exchange as provided by a third-party pricing service. Equity securities sold short, for which there were no sales reported for that day, are generally valued at the last quoted daily ask quotation on their primary market or exchange as provided by a third-party pricing service.Short-term instruments with a maturity at issuance of 60 days or less may be valued at amortized cost, which approximates market value. Exchange-traded options are
28
Notes to Financial Statements – continued
generally valued at the last sale or official closing price on their primary exchange as provided by a third-party pricing service. Exchange-traded options for which there were no sales reported that day are generally valued at the last daily bid quotation on their primary exchange as provided by a third-party pricing service. Options not traded on an exchange are generally valued at a broker/dealer bid quotation. Foreign currency options are generally valued at valuations provided by athird-party pricing service.Open-end investment companies are generally valued at net asset value per share. Securities and other assets generally valued on the basis of information from athird-party pricing service may also be valued at a broker/dealer bid quotation. In determining values, third-party pricing services can utilize both transaction data and market information such as yield, quality, coupon rate, maturity, type of issue, trading characteristics, and other market data. The values of foreign securities and other assets and liabilities expressed in foreign currencies are converted to U.S. dollars using the mean of bid and asked prices for rates provided by a third-party pricing service.
The Board of Trustees has delegated primary responsibility for determining or causing to be determined the value of the fund’s investments (including any fair valuation) to the adviser pursuant to valuation policies and procedures approved by the Board. If the adviser determines that reliable market quotations are not readily available, investments are valued at fair value as determined in good faith by the adviser in accordance with such procedures under the oversight of the Board of Trustees. Under the fund’s valuation policies and procedures, market quotations are not considered to be readily available for most types of debt instruments and floating rate loans and many types of derivatives. These investments are generally valued at fair value based on information from third-party pricing services. In addition, investments may be valued at fair value if the adviser determines that an investment’s value has been materially affected by events occurring after the close of the exchange or market on which the investment is principally traded (such as foreign exchange or market) and prior to the determination of the fund’s net asset value, or after the halt of trading of a specific security where trading does not resume prior to the close of the exchange or market on which the security is principally traded. Events that occur after foreign markets close (such as developments in foreign markets and significant movements in the U.S. markets) and prior to the determination of the fund’s net asset value may be deemed to have a material effect on the value of securities traded in foreign markets. Accordingly, the fund’s foreign equity securities may often be valued at fair value. The adviser generally relies on third-party pricing services or other information (such as the correlation with price movements of similar securities in the same or other markets; the type, cost and investment characteristics of the security; the business and financial condition of the issuer; and trading and other market data) to assist in determining whether to fair value and at what value to fair value an investment. The value of an investment for purposes of calculating the fund’s net asset value can differ depending on the source and method used to determine value. When fair valuation is used, the value of an investment used to determine the fund’s net asset value may differ from quoted or published prices for the same investment. There can be no assurance that the fund could obtain the fair value assigned to an investment if it were to sell the investment at the same time at which the fund determines its net asset value per share.
29
Notes to Financial Statements – continued
Various inputs are used in determining the value of the fund’s assets or liabilities. These inputs are categorized into three broad levels. In certain cases, the inputs used to measure fair value may fall into different levels of the fair value hierarchy. In such cases, an investment’s level within the fair value hierarchy is based on the lowest level of input that is significant to the fair value measurement. The fund’s assessment of the significance of a particular input to the fair value measurement in its entirety requires judgment, and considers factors specific to the investment. Level 1 includes unadjusted quoted prices in active markets for identical assets or liabilities. Level 2 includes other significant observable market-based inputs (including quoted prices for similar securities, interest rates, prepayment speed, and credit risk). Level 3 includes unobservable inputs, which may include the adviser’s own assumptions in determining the fair value of investments. The following is a summary of the levels used as of August 31, 2019 in valuing the fund’s assets or liabilities:
| | | | | | | | | | | | | | | | |
| | | | |
| Financial Instruments | | Level 1 | | | Level 2 | | | Level 3 | | | Total | |
| Equity Securities | | | $1,240,787,770 | | | | $— | | | | $— | | | | $1,240,787,770 | |
| Mutual Funds | | | 42,582,862 | | | | — | | | | — | | | | 42,582,862 | |
| Total | | | $1,283,370,632 | | | | $— | | | | $— | | | | $1,283,370,632 | |
| Securities Sold Short | | | $(8,620,784 | ) | | | $— | | | | $— | | | | $(8,620,784 | ) |
For further information regarding security characteristics, see the Portfolio of Investments.
Foreign Currency Translation– Purchases and sales of foreign investments, income, and expenses are converted into U.S. dollars based upon currency exchange rates prevailing on the respective dates of such transactions or on the reporting date for foreign denominated receivables and payables. Gains and losses attributable to foreign currency exchange rates on sales of securities are recorded for financial statement purposes as net realized gains and losses on investments. Gains and losses attributable to foreign exchange rate movements on receivables, payables, income and expenses are recorded for financial statement purposes as foreign currency transaction gains and losses. That portion of both realized and unrealized gains and losses on investments that results from fluctuations in foreign currency exchange rates is not separately disclosed.
Derivatives – The fund uses derivatives primarily to increase or decrease exposure to a particular market or segment of the market, or security, to increase or decrease interest rate or currency exposure, or as alternatives to direct investments. Derivatives are used for hedging or non-hedging purposes. While hedging can reduce or eliminate losses, it can also reduce or eliminate gains. When the fund uses derivatives as an investment to increase market exposure, or for hedging purposes, gains and losses from derivative instruments may be substantially greater than the derivative’s original cost.
The derivative instruments used by the fund during the period were written options and purchased options. Depending on the type of derivative, the fund may exit a derivative position by entering into an offsetting transaction with a counterparty or exchange, negotiating an agreement with the derivative counterparty, or novating the position to a third party. At August 31, 2019, the fund did not have any outstanding derivative instruments.
30
Notes to Financial Statements – continued
The following table presents, by major type of derivative contract, the realized gain (loss) on derivatives held by the fund for the year ended August 31, 2019 as reported in the Statement of Operations:
| | | | | | | | |
| | |
| Risk | | Unaffiliated
Issuers
(Purchased
Options) | | | Written
Options | |
| Equity | | | $209,609 | | | | $368,827 | |
There is no change in unrealized appreciation (depreciation) on derivative transactions at period end.
Derivative counterparty credit risk is managed through formal evaluation of the creditworthiness of all potential counterparties. On certain, but not all, uncleared derivatives, the fund attempts to reduce its exposure to counterparty credit risk whenever possible by entering into an ISDA Master Agreement on a bilateral basis. The ISDA Master Agreement gives each party to the agreement the right to terminate all transactions traded under such agreement if there is a specified deterioration in the credit quality of the other party. Upon an event of default or a termination of the ISDA Master Agreement, the non-defaulting party has the right to close out all transactions traded under such agreement and to net amounts owed under each agreement to one net amount payable by one party to the other. This right to close out and net payments across all transactions traded under the ISDA Master Agreement could result in a reduction of the fund’s credit risk to such counterparty equal to any amounts payable by the fund under the applicable transactions, if any.
Collateral and margin requirements differ by type of derivative. For cleared derivatives (e.g., futures contracts, cleared swaps, and exchange-traded options), margin requirements are set by the clearing broker and the clearing house and collateral, in the form of cash or securities, is posted by the fund directly with the clearing broker. Collateral terms are counterparty agreement specific for uncleared derivatives (e.g., forward foreign currency exchange contracts, uncleared swap agreements, and uncleared options) and collateral, in the form of cash and securities, is held in segregated accounts with the fund’s custodian in connection with these agreements. For derivatives traded under an ISDA Master Agreement, which contains a collateral support annex, the collateral requirements are netted across all transactions traded under such counterparty-specific agreement and an amount is posted from one party to the other to collateralize such obligations. Cash that has been segregated or delivered to cover the fund’s collateral or margin obligations under derivative contracts, if any, will be reported separately in the Statement of Assets and Liabilities as restricted cash for uncleared derivatives and/or deposits with brokers for cleared derivatives. Securities pledged as collateral or margin for the same purpose, if any, are noted in the Portfolio of Investments. The fund may be required to make payments of interest on uncovered collateral or margin obligations with the broker. Any such payments are included in “Interest expense and fees” in the Statement of Operations.
Written Options – In exchange for a premium, the fund wrote call options on securities for which it anticipated the price would decline and also wrote put options on securities for which it anticipated the price would increase. At the time the option was written, the fund believed the premium received exceeded the potential loss that
31
Notes to Financial Statements – continued
could result from adverse price changes in the options’ underlying securities. In a written option, the fund as the option writer grants the buyer the right to purchase from, or sell to, the fund a specified number of shares or units of a particular security, currency or index at a specified price within a specified period of time.
The premium received is initially recorded as a liability in the Statement of Assets and Liabilities. The option is subsequently marked-to-market daily with the difference between the premium received and the market value of the written option being recorded as unrealized appreciation or depreciation. When a written option expires, the fund realizes a gain equal to the amount of the premium received. The difference between the premium received and the amount paid on effecting a closing transaction is considered a realized gain or loss. When a written call option is exercised, the premium received is offset against the proceeds to determine the realized gain or loss. When a written put option is exercised, the premium reduces the cost basis of the security purchased by the fund.
At the initiation of the written option contract, for exchange traded options, the fund is required to deposit securities or cash as collateral with the custodian for the benefit of the broker or directly with the clearing broker, based on the type of option. For uncleared options, the fund may post collateral subject to the terms of an ISDA Master Agreement as generally described above if the market value of the options contract moves against it. The fund, as writer of an option, may have no control over whether the underlying securities may be sold (call) or purchased (put) and, as a result, bears the market risk of an unfavorable change in the price of the securities underlying the written option. Losses from writing options can exceed the premium received and can exceed the potential loss from an ordinary buy and sell transaction. Although the fund’s market risk may be significant, the maximum counterparty credit risk to the fund is equal to the market value of any collateral posted to the broker. For uncleared options, this risk is mitigated in cases where there is an ISDA Master Agreement between the fund and the counterparty providing for netting as described above.
Purchased Options – The fund purchased put options for a premium. Purchased put options entitle the holder to buy and sell a specified number of shares or units of a particular security, currency or index at a specified price at a specified date or within a specified period of time. Purchasing put options may hedge against an anticipated decline in the value of portfolio securities or currency or decrease the fund’s exposure to an underlying instrument.
The premium paid is initially recorded as an investment in the Statement of Assets and Liabilities. That investment is subsequently marked-to-market daily with the difference between the premium paid and the market value of the purchased option being recorded as unrealized appreciation or depreciation. Premiums paid for purchased put options which have expired are treated as realized losses on investments in the Statement of Operations. Upon the exercise or closing of a purchased put option, the premium paid is offset against the proceeds on the sale of the underlying security or financial instrument in order to determine the realized gain or loss on investments.
Whether or not the option is exercised, the fund’s maximum risk of loss from purchasing an option is the amount of premium paid. All option contracts involve credit risk if the counterparty to the option contract fails to perform. For uncleared
32
Notes to Financial Statements – continued
options, this risk is mitigated in cases where there is an ISDA Master Agreement between the fund and the counterparty providing for netting as described above and, where applicable, by the posting of collateral by the counterparty to the fund to cover the fund’s exposure to the counterparty under such ISDA Master Agreement.
Short Sales– The fund entered into short sales whereby it sells a security it does not own in anticipation of a decline in the value of that security. The fund will realize a gain if the security price decreases and a loss if the security price increases between the date of the short sale and the date on which the fund replaces the borrowed security. Losses from short sales can exceed the proceeds of the security sold; and they can also exceed the potential loss from an ordinary buy and sell transaction. The amount of any premium, dividends, or interest the fund may be required to pay in connection with a short sale will be recognized as a fund expense. During the year ended August 31, 2019, this expense amounted to $295,439. The fund segregates cash or marketable securities in an amount that, when combined with the amount of proceeds from the short sale deposited with the broker, at least equals the current market value of the security sold short.
Security Loans– Under its Securities Lending Agency Agreement with the fund, State Street Bank and Trust Company, as lending agent, loans the securities of the fund to certain qualified institutions (the “Borrowers”) approved by the fund. Security loans can be terminated at the discretion of either the lending agent or the fund and the related securities must be returned within the earlier of the standard trade settlement period for such securities or within three business days. The loans are collateralized by cash and/or U.S. Treasury and federal agency obligations in an amount typically at least equal to the market value of the securities loaned. On loans collateralized by cash, the cash collateral is invested in a money market fund. The market value of the loaned securities is determined at the close of business of the fund and any additional required collateral is delivered to the fund on the next business day. The lending agent provides the fund with indemnification against Borrower default. In the event of Borrower default, the lending agent will, for the benefit of the fund, either purchase securities identical to those loaned or, when such purchase is commercially impracticable, pay the fund the market value of the loaned securities. In return, the lending agent assumes the fund’s rights to the related collateral. If the collateral value is less than the cost to purchase identical securities, the lending agent is responsible for the shortfall, but only to the extent that such shortfall is not due to a decline in collateral value resulting from collateral reinvestment for which the fund bears the risk of loss. At period end, the fund had investment securities on loan, all of which were classified as equity securities in the fund’s Portfolio of Investments, with a fair value of $7,489,667. The fair value of the fund’s investment securities on loan and a related liability of $7,703,526 for cash collateral received on securities loaned are both presented gross in the Statement of Assets and Liabilities. The collateral on securities loaned exceeded the value of securities on loan at period end. The liability for cash collateral for securities loaned is carried at fair value, which is categorized as level 2 within the fair value hierarchy. A portion of the income generated upon investment of the collateral is remitted to the Borrowers, and the remainder is allocated between the fund and the lending agent. On loans collateralized by U.S. Treasury and/or federal agency obligations, a fee is received from the Borrower, and is allocated between the fund and the lending agent. Income
33
Notes to Financial Statements – continued
from securities lending is separately reported in the Statement of Operations. The dividend and interest income earned on the securities loaned is accounted for in the same manner as other dividend and interest income.
Indemnifications– Under the fund’s organizational documents, its officers and Trustees may be indemnified against certain liabilities and expenses arising out of the performance of their duties to the fund. Additionally, in the normal course of business, the fund enters into agreements with service providers that may contain indemnification clauses. The fund’s maximum exposure under these agreements is unknown as this would involve future claims that may be made against the fund that have not yet occurred.
Investment Transactions and Income– Investment transactions are recorded on the trade date. Dividends received in cash are recorded on theex-dividend date. Certain dividends from foreign securities will be recorded when the fund is informed of the dividend if such information is obtained subsequent to theex-dividend date. Dividend payments received in additional securities are recorded on theex-dividend date in an amount equal to the value of the security on such date.
The fund may receive proceeds from litigation settlements. Any proceeds received from litigation involving portfolio holdings are reflected in the Statement of Operations in realized gain/loss if the security has been disposed of by the fund or in unrealized gain/loss if the security is still held by the fund. Any other proceeds from litigation not related to portfolio holdings are reflected as other income in the Statement of Operations.
Tax Matters and Distributions– The fund intends to qualify as a regulated investment company, as defined under Subchapter M of the Internal Revenue Code, and to distribute all of its taxable income, including realized capital gains. As a result, no provision for federal income tax is required. The fund’s federal tax returns, when filed, will remain subject to examination by the Internal Revenue Service for a three year period. Management has analyzed the fund’s tax positions taken on federal and state tax returns for all open tax years and does not believe that there are any uncertain tax positions that require recognition of a tax liability. Foreign taxes, if any, have been accrued by the fund in the accompanying financial statements in accordance with the applicable foreign tax law. Foreign income taxes may be withheld by certain countries in which the fund invests. Additionally, capital gains realized by the fund on securities issued in or by certain foreign countries may be subject to capital gains tax imposed by those countries.
Distributions to shareholders are recorded on theex-dividend date. Income and capital gain distributions are determined in accordance with income tax regulations, which may differ from U.S. generally accepted accounting principles. Certain capital accounts in the financial statements are periodically adjusted for permanent differences in order to reflect their tax character. These adjustments have no impact on net assets or net asset value per share. Temporary differences which arise from recognizing certain items of income, expense, gain or loss in different periods for financial statement and tax purposes will reverse at some time in the future. Distributions in excess of net investment income or net realized gains are temporary overdistributions for financial statement purposes resulting from differences in the recognition or classification of income or distributions for financial statement and tax purposes.
34
Notes to Financial Statements – continued
Book/tax differences primarily relate to net operating losses, wash sale loss deferrals, straddle loss deferrals, and treating a portion of the proceeds from redemptions as a distribution for tax purposes.
The tax character of distributions declared to shareholders for the last two fiscal years is as follows:
| | | | | | | | |
| | |
| | | Year ended
8/31/19 | | | Year ended
8/31/18 | |
| Ordinary income (including any short-term capital gains) | | | $8,438,597 | | | | $10,346,187 | |
| Long-term capital gains | | | 43,001,600 | | | | 23,676,037 | |
| | |
| Total distributions | | | $51,440,197 | | | | $34,022,224 | |
The federal tax cost and the tax basis components of distributable earnings were as follows:
| | | | |
| |
| As of 8/31/19 | | | |
| |
| Cost of investments | | | $723,652,638 | |
| Gross appreciation | | | 579,223,971 | |
| |
| Gross depreciation | | | (28,126,761 | ) |
| Net unrealized appreciation (depreciation) | | | $551,097,210 | |
| |
| Undistributed long-term capital gain | | | 27,685,821 | |
| Post-October capital loss deferral | | | (2,429,753 | ) |
| Late year ordinary loss deferral | | | (5,219,836 | ) |
| Other temporary differences | | | (415 | ) |
Multiple Classes of Shares of Beneficial Interest– The fund offers multiple classes of shares, which differ in their respective distribution and service fees. The fund’s income, realized and unrealized gain (loss), and common expenses are allocated to shareholders based on the daily net assets of each class. Dividends are declared separately for each class. Differences in per share dividend rates are generally due to differences in separate class expenses. Class B shares will convert to Class A shares approximately eight years after purchase. Class C shares will convert to Class A shares approximately ten years after purchase. The fund’s distributions declared to shareholders as reported in the Statements of Changes in Net Assets are presented by class as follows:
| | | | | | | | |
| | | From net realized
gain | |
| | |
| | | Year ended
8/31/19 | | | Year ended
8/31/18 | |
| Class A | | | $20,061,820 | | | | $13,806,022 | |
| Class B | | | 2,165,547 | | | | 1,454,317 | |
| Class C | | | 6,237,227 | | | | 4,487,570 | |
| Class I | | | 11,628,427 | | | | 6,827,614 | |
| Class R1 | | | 267,264 | | | | 182,847 | |
| Class R2 | | | 1,292,150 | | | | 964,012 | |
| Class R3 | | | 3,217,992 | | | | 2,088,034 | |
| Class R4 | | | 875,507 | | | | 546,050 | |
| Class R6 | | | 5,694,263 | | | | 3,665,758 | |
| Total | | | $51,440,197 | | | | $34,022,224 | |
35
Notes to Financial Statements – continued
(3) Transactions with Affiliates
Investment Adviser– The fund has an investment advisory agreement with MFS to provide overall investment management and related administrative services and facilities to the fund. For the period from September 1, 2018 through July 31, 2019, the management fee was computed daily and paid monthly at the following annual rates based on the fund’s average daily net assets:
| | | | |
| Up to $1 billion | | | 0.75 | % |
| In excess of $1 billion | | | 0.70 | % |
Effective August 1, 2019, the management fee is computed daily and paid monthly at the following annual rates based on the fund’s average daily net assets:
| | | | |
| Up to $1 billion | | | 0.75 | % |
| In excess of $1 billion and up to $2.5 billion | | | 0.70 | % |
| In excess of $2.5 billion | | | 0.65 | % |
MFS has agreed in writing to reduce its management fee by a specified amount if certain MFS mutual fund assets exceed thresholds agreed to by MFS and the fund’s Board of Trustees. For the year ended August 31, 2019, this management fee reduction amounted to $114,767, which is included in the reduction of total expenses in the Statement of Operations. The management fee incurred for the year ended August 31, 2019 was equivalent to an annual effective rate of 0.73% of the fund’s average daily net assets.
Distributor– MFS Fund Distributors, Inc. (MFD), a wholly-owned subsidiary of MFS, as distributor, received $224,094 for the year ended August 31, 2019, as its portion of the initial sales charge on sales of Class A shares of the fund.
The Board of Trustees has adopted a distribution plan for certain share classes pursuant to Rule12b-1 of the Investment Company Act of 1940.
The fund’s distribution plan provides that the fund will pay MFD for services provided by MFD and financial intermediaries in connection with the distribution and servicing of certain share classes. One component of the plan is a distribution fee paid to MFD and another component of the plan is a service fee paid to MFD. MFD may subsequently pay all, or a portion, of the distribution and/or service fees to financial intermediaries.
Distribution Plan Fee Table:
| | | | | | | | | | | | | | | | | | | | |
| | | | | |
| | | Distribution
Fee Rate (d) | | | Service
Fee Rate (d) | | | Total
Distribution
Plan (d) | | | Annual
Effective
Rate (e) | | | Distribution
and Service
Fee | |
| Class A | | | — | | | | 0.25% | | | | 0.25% | | | | 0.24% | | | | $1,128,703 | |
| Class B | | | 0.75% | | | | 0.25% | | | | 1.00% | | | | 1.00% | | | | 414,333 | |
| Class C | | | 0.75% | | | | 0.25% | | | | 1.00% | | | | 1.00% | | | | 1,226,052 | |
| Class R1 | | | 0.75% | | | | 0.25% | | | | 1.00% | | | | 1.00% | | | | 54,423 | |
| Class R2 | | | 0.25% | | | | 0.25% | | | | 0.50% | | | | 0.50% | | | | 137,936 | |
| Class R3 | | | — | | | | 0.25% | | | | 0.25% | | | | 0.25% | | | | 188,778 | |
| Total Distribution and Service Fees | | | | | | | | | | | | $3,150,225 | |
| (d) | In accordance with the distribution plan for certain classes, the fund pays distribution and/or service fees equal to these annual percentage rates of each class’s average daily net assets. The distribution and service fee rates disclosed by class represent the current rates in effect at the end of the reporting period. Any rate changes, if applicable, are detailed below. |
36
Notes to Financial Statements – continued
| (e) | The annual effective rates represent actual fees incurred under the distribution plan for the year ended August 31, 2019 based on each class’s average daily net assets. MFD has voluntarily agreed to rebate a portion of each class’s 0.25% service fee attributable to accounts for which MFD retains the 0.25% service fee except for accounts attributable to MFS or its affiliates’ seed money. For the year ended August 31, 2019, this rebate amounted to $23,007, $412, $518, and $10 for Class A, Class B, Class C, and Class R2, respectively, and is included in the reduction of total expenses in the Statement of Operations. |
Certain Class A shares are subject to a contingent deferred sales charge (CDSC) in the event of a shareholder redemption within 18 months of purchase. Class B shares are subject to a CDSC in the event of a shareholder redemption within six years of purchase. Class C shares are subject to a CDSC in the event of a shareholder redemption within 12 months of purchase. All contingent deferred sales charges are paid to MFD and during the year ended August 31, 2019, were as follows:
| | | | |
| |
| | | Amount | |
| Class A | | | $3,705 | |
| Class B | | | 37,800 | |
| Class C | | | 17,860 | |
Shareholder Servicing Agent– MFS Service Center, Inc. (MFSC), a wholly-owned subsidiary of MFS, receives a fee from the fund for its services as shareholder servicing agent calculated as a percentage of the average daily net assets of the fund as determined periodically under the supervision of the fund’s Board of Trustees. For the year ended August 31, 2019, the fee was $148,638, which equated to 0.0125% annually of the fund’s average daily net assets. MFSC also receives payment from the fund forout-of-pocket expenses,sub-accounting and other shareholder servicing costs which may be paid to affiliated and unaffiliated service providers. Class R6 shares do not incursub-accounting fees. For the year ended August 31, 2019, theseout-of-pocket expenses,sub-accounting and other shareholder servicing costs amounted to $1,138,444.
Administrator– MFS provides certain financial, legal, shareholder communications, compliance, and other administrative services to the fund. Under an administrative services agreement, the fund reimburses MFS the costs incurred to provide these services. The fund is charged an annual fixed amount of $17,500 plus a fee based on average daily net assets. The administrative services fee incurred for the year ended August 31, 2019 was equivalent to an annual effective rate of 0.0143% of the fund’s average daily net assets.
Trustees’ and Officers’ Compensation– The fund pays compensation to independent Trustees in the form of a retainer, attendance fees, and additional compensation to Board and Committee chairpersons. The fund does not pay compensation directly to Trustees or officers of the fund who are also officers of the investment adviser, all of whom receive remuneration from MFS for their services to the fund. Certain officers and Trustees of the fund are officers or directors of MFS, MFD, and MFSC.
Prior to December 31, 2001, the fund had an unfunded defined benefit plan (“DB plan”) for independent Trustees. As of December 31, 2001, the Board took action to terminate the DB plan with respect to then-current and any future independent
37
Notes to Financial Statements – continued
Trustees, such that the DB plan covers only certain of those former independent Trustees who retired on or before December 31, 2001. The DB plan resulted in a pension expense of $292 and is included in “Independent Trustees’ compensation” in the Statement of Operations for the year ended August 31, 2019. The liability for deferred retirement benefits payable to those former independent Trustees under the DB plan amounted to $414 at August 31, 2019, and is included in “Payable for independent Trustees’ compensation” in the Statement of Assets and Liabilities.
Other– This fund and certain other funds managed by MFS (the funds) had entered into a service agreement (the ISO Agreement) which provided for payment of fees solely by the funds to Tarantino LLC in return for the provision of services of an Independent Senior Officer (ISO) for the funds. Frank L. Tarantino served as the ISO and was an officer of the funds and the sole member of Tarantino LLC. Effective June 30, 2019, Mr. Tarantino retired from his position as ISO for the funds, and the ISO Agreement was terminated. For the year ended August 31, 2019, the fee paid by the fund under this agreement was $2,074 and is included in “Miscellaneous” expense in the Statement of Operations. MFS had agreed to bear all expenses associated with office space, other administrative support, and supplies provided to the ISO.
The fund invests in the MFS Institutional Money Market Portfolio which is managed by MFS and seeks current income consistent with preservation of capital and liquidity. This money market fund does not pay a management fee to MFS.
The fund is permitted to engage in purchase transactions with funds and accounts for which MFS serves as investment adviser orsub-adviser (“cross-trades”) pursuant to a policy adopted by the Board of Trustees. This policy has been designed to ensure that cross-trades conducted by the fund comply with Rule17a-7 under the Investment Company Act of 1940. During the year ended August 31, 2019, the fund engaged in purchase transactions pursuant to this policy, which amounted to $830,302.
The adviser has voluntarily undertaken to reimburse the fund from its own resources on a quarterly basis for the cost of investment research embedded in the cost of the fund’s securities trades. This agreement may be rescinded at any time. For the year ended August 31, 2019, this reimbursement amounted to $85,012, which is included in “Other” income in the Statement of Operations.
(4) Portfolio Securities
For the year ended August 31, 2019, purchases and sales of investments, other than short sales and short-term obligations, aggregated $373,678,505 and $397,639,045, respectively.
38
Notes to Financial Statements – continued
(5) Shares of Beneficial Interest
The fund’s Declaration of Trust permits the Trustees to issue an unlimited number of full and fractional shares of beneficial interest. Transactions in fund shares were as follows:
| | | | | | | | | | | | | | | | |
| | | Year ended
8/31/19 | | | Year ended
8/31/18 | |
| | | | |
| | | Shares | | | Amount | | | Shares | | | Amount | |
| Shares sold | | | | | | | | | | | | | | | | |
Class A | | | 1,975,893 | | | | $83,003,835 | | | | 2,690,325 | | | | $108,662,252 | |
Class B | | | 120,191 | | | | 4,301,477 | | | | 261,237 | | | | 9,196,477 | |
Class C | | | 677,632 | | | | 24,341,867 | | | | 950,938 | | | | 33,466,725 | |
Class I | | | 2,550,161 | | | | 113,611,517 | | | | 2,958,330 | | | | 128,312,062 | |
Class R1 | | | 47,490 | | | | 1,684,411 | | | | 60,302 | | | | 2,103,398 | |
Class R2 | | | 299,032 | | | | 11,915,742 | | | | 260,110 | | | | 9,845,066 | |
Class R3 | | | 666,590 | | | | 27,985,848 | | | | 775,526 | | | | 31,215,720 | |
Class R4 | | | 204,948 | | | | 8,719,675 | | | | 218,412 | | | | 9,129,215 | |
Class R6 | | | 1,474,545 | | | | 66,395,491 | | | | 1,371,227 | | | | 58,758,765 | |
| | | 8,016,482 | | | | $341,959,863 | | | | 9,546,407 | | | | $390,689,680 | |
| | | | |
Shares issued to shareholders in
reinvestment of distributions | | | | | | | | | | | | | | | | |
Class A | | | 520,757 | | | | $19,351,348 | | | | 360,827 | | | | $13,188,223 | |
Class B | | | 67,268 | | | | 2,143,844 | | | | 45,085 | | | | 1,435,497 | |
Class C | | | 179,366 | | | | 5,703,832 | | | | 130,689 | | | | 4,151,976 | |
Class I | | | 255,108 | | | | 10,158,414 | | | | 150,118 | | | | 5,847,113 | |
Class R1 | | | 8,390 | | | | 266,220 | | | | 5,742 | | | | 182,089 | |
Class R2 | | | 32,936 | | | | 1,163,614 | | | | 24,374 | | | | 851,394 | |
Class R3 | | | 86,645 | | | | 3,217,992 | | | | 57,144 | | | | 2,088,034 | |
Class R4 | | | 18,432 | | | | 714,074 | | | | 11,457 | | | | 434,687 | |
Class R6 | | | 113,449 | | | | 4,548,175 | | | | 74,971 | | | | 2,935,862 | |
| | | 1,282,351 | | | | $47,267,513 | | | | 860,407 | | | | $31,114,875 | |
| | | | |
| Shares reacquired | | | | | | | | | | | | | | | | |
Class A | | | (2,568,696 | ) | | | $(105,539,945 | ) | | | (2,523,190 | ) | | | $(99,736,743 | ) |
Class B | | | (258,701 | ) | | | (9,209,777 | ) | | | (258,851 | ) | | | (8,881,072 | ) |
Class C | | | (734,328 | ) | | | (26,311,197 | ) | | | (1,074,694 | ) | | | (37,302,290 | ) |
Class I | | | (2,456,918 | ) | | | (109,249,971 | ) | | | (1,482,125 | ) | | | (62,341,899 | ) |
Class R1 | | | (45,940 | ) | | | (1,644,386 | ) | | | (62,046 | ) | | | (2,178,877 | ) |
Class R2 | | | (285,477 | ) | | | (11,417,715 | ) | | | (331,292 | ) | | | (12,646,255 | ) |
Class R3 | | | (701,327 | ) | | | (29,333,688 | ) | | | (581,770 | ) | | | (23,285,213 | ) |
Class R4 | | | (166,210 | ) | | | (7,057,361 | ) | | | (136,161 | ) | | | (5,632,477 | ) |
Class R6 | | | (941,393 | ) | | | (42,393,928 | ) | | | (1,121,142 | ) | | | (45,861,371 | ) |
| | | (8,158,990 | ) | | | $(342,157,968 | ) | | | (7,571,271 | ) | | | $(297,866,197 | ) |
39
Notes to Financial Statements – continued
| | | | | | | | | | | | | | | | |
| | | Year ended
8/31/19 | | | Year ended
8/31/18 | |
| | | | |
| | | Shares | | | Amount | | | Shares | | | Amount | |
| Net change | | | | | | | | | | | | | | | | |
Class A | | | (72,046 | ) | | | $(3,184,762 | ) | | | 527,962 | | | | $22,113,732 | |
Class B | | | (71,242 | ) | | | (2,764,456 | ) | | | 47,471 | | | | 1,750,902 | |
Class C | | | 122,670 | | | | 3,734,502 | | | | 6,933 | | | | 316,411 | |
Class I | | | 348,351 | | | | 14,519,960 | | | | 1,626,323 | | | | 71,817,276 | |
Class R1 | | | 9,940 | | | | 306,245 | | | | 3,998 | | | | 106,610 | |
Class R2 | | | 46,491 | | | | 1,661,641 | | | | (46,808 | ) | | | (1,949,795 | ) |
Class R3 | | | 51,908 | | | | 1,870,152 | | | | 250,900 | | | | 10,018,541 | |
Class R4 | | | 57,170 | | | | 2,376,388 | | | | 93,708 | | | | 3,931,425 | |
Class R6 | | | 646,601 | | | | 28,549,738 | | | | 325,056 | | | | 15,833,256 | |
| | | 1,139,843 | | | | $47,069,408 | | | | 2,835,543 | | | | $123,938,358 | |
Class T shares were not publicly available for sale during the period. Please see the fund’s prospectus for details.
Effective June 1, 2019, purchases of the fund’s Class B shares are closed to new and existing investors subject to certain exceptions. Please see the fund’s prospectus for details.
(6) Line of Credit
The fund and certain other funds managed by MFS participate in a $1.25 billion unsecured committed line of credit, subject to a $1 billion sublimit, provided by a syndicate of banks under a credit agreement. Borrowings may be made for temporary financing needs. Interest is charged to each fund, based on its borrowings, generally at a rate equal to the highest of one month LIBOR, the Federal Funds Effective Rate and the Overnight Bank Funding Rate, plus an agreed upon spread. A commitment fee, based on the average daily, unused portion of the committed line of credit, is allocated among the participating funds. In addition, the fund and other funds managed by MFS have established unsecured uncommitted borrowing arrangements with certain banks for temporary financing needs. Interest is charged to each fund, based on its borrowings, at rates equal to customary reference rates plus an agreed upon spread. For the year ended August 31, 2019, the fund’s commitment fee and interest expense were $6,738 and $0, respectively, and are included in “Interest expense and fees” in the Statement of Operations.
40
Notes to Financial Statements – continued
(7) Investments in Affiliated Issuers
An affiliated issuer may be considered one in which the fund owns 5% or more of the outstanding voting securities, or a company which is under common control. For the purposes of this report, the following were affiliated issuers:
| | | | | | | | | | | | | | | | | | | | | | | | |
| | | | | | |
| Affiliated Issuers | | Beginning
Value | | | Purchases | | | Sales
Proceeds | | | Realized
Gain
(Loss) | | | Change in
Unrealized
Appreciation or
Depreciation | | | Ending
Value | |
| MFS Institutional Money Market Portfolio | | | $26,383,831 | | | | $237,752,487 | | | | $229,260,204 | | | | $60 | | | | $3,162 | | | | $34,879,336 | |
| | | | | | |
| Affiliated Issuers | | | | | | | | | | | | | | Dividend
Income | | | Capital Gain
Distributions | |
| MFS Institutional Money Market Portfolio | | | | | | | | | | | | $684,197 | | | | $— | |
41
REPORT OF INDEPENDENT REGISTERED PUBLIC ACCOUNTING FIRM
To the Shareholders of MFS Technology Fund and the Board of Trustees of MFS Series Trust I
Opinion on the Financial Statements
We have audited the accompanying statement of assets and liabilities of MFS Technology Fund (the “Fund”) (one of the funds constituting MFS Series Trust I (the “Trust”)), including the portfolio of investments, as of August 31, 2019,and the related statement of operations for the year then ended, the statements of changes in net assets for each of the two years in the period then ended, the financial highlights for each of the five years in the period then ended and the related notes (collectively referred to as the “financial statements”). In our opinion, the financial statements present fairly, in all material respects, the financial position of the Fund (one of the funds constituting MFS Series Trust I) at August 31, 2019, the results of its operations for the year then ended, the changes in its net assets for each of the two years in the period then ended and its financial highlights for each of the five years in the period then ended, in conformity with U.S. generally accepted accounting principles.
Basis for Opinion
These financial statements are the responsibility of the Trust’s management. Our responsibility is to express an opinion on the Fund’s financial statements based on our audits. We are a public accounting firm registered with the Public Company Accounting Oversight Board (United States) (“PCAOB”) and are required to be independent with respect to the Trust in accordance with the U.S. federal securities laws and the applicable rules and regulations of the Securities and Exchange Commission and the PCAOB.
We conducted our audits in accordance with the standards of the PCAOB. Those standards require that we plan and perform the audit to obtain reasonable assurance about whether the financial statements are free of material misstatement, whether due to error or fraud. The Trust is not required to have, nor were we engaged to perform, an audit of the Trust’s internal control over financial reporting. As part of our audits we are required to obtain an understanding of internal control over financial reporting but not for the purpose of expressing an opinion on the effectiveness of the Trust’s internal control over financial reporting. Accordingly, we express no such opinion.
Our audits included performing procedures to assess the risks of material misstatement of the financial statements, whether due to error or fraud, and performing procedures that respond to those risks. Such procedures included examining, on a test basis, evidence regarding the amounts and disclosures in the financial statements. Our procedures included confirmation of securities owned as of August 31, 2019,by correspondence with the custodian andothers. Our audits also included evaluating the
42
Report of Independent Registered Public Accounting Firm – continued
accounting principles used and significant estimates made by management, as well as evaluating the overall presentation of the financial statements. We believe that our audits provide a reasonable basis for our opinion.

We have served as the auditor of one or more MFS investment companies since 1993.
Boston, Massachusetts
October 17, 2019
43
TRUSTEES AND OFFICERS — IDENTIFICATION AND BACKGROUND
The Trustees and Officers of the Trust, as of October 1, 2019, are listed below, together with their principal occupations during the past five years. (Their titles may have varied during that period.) The address of each Trustee and Officer is 111 Huntington Avenue, Boston, Massachusetts 02199-7618.
| | | | | | | | | | |
Name, Age | | Position(s)
Held
with Fund | | Trustee/Officer
Since (h) | | Number of
MFS Funds
overseen
by the
Trustee | | Principal
Occupations During the Past Five Years | | Other
Directorships
During the Past
Five Years (j) |
| INTERESTED TRUSTEES |
Robert J. Manning (k)
(age 55) | | Trustee | | February 2004 | | 135 | | Massachusetts Financial Services Company, Executive Chairman (since January 2017); Director; Chairman of the Board; Chief Executive Officer (until 2015);Co-Chief Executive Officer (2015-2016) | | N/A |
| | | | | |
Robin A. Stelmach (k) (age 58) | | Trustee | | January 2014 | | 135 | | Massachusetts Financial Services Company, Vice Chair (since January 2017); Chief Operating Officer and Executive Vice President (until January 2017) | | N/A |
| INDEPENDENT TRUSTEES |
John P. Kavanaugh (age 64) | | Trustee and Chair of Trustees | | January 2009 | | 135 | | Private investor | | N/A |
| | | | | |
Steven E. Buller (age 68) | | Trustee | | February 2014 | | 135 | | Financial Accounting Standards Advisory Council, Chairman (2014-2015); Public Company Accounting Oversight Board, Standing Advisory Group, Member (until 2014); BlackRock, Inc. (investment management), Managing Director (until 2014), BlackRock Finco UK (investment management), Director (until 2014) | | N/A |
44
Trustees and Officers – continued
| | | | | | | | | | |
Name, Age | | Position(s)
Held
with Fund | | Trustee/Officer
Since (h) | | Number of
MFS Funds
overseen
by the
Trustee | | Principal
Occupations During the Past Five Years | | Other
Directorships
During the Past
Five Years (j) |
John A. Caroselli (age 65) | | Trustee | | March 2017 | | 135 | | JC Global Advisors, LLC (management consulting), President (since 2015); First Capital Corporation (commercial finance), Executive Vice President (until 2015) | | N/A |
| | | | | |
Maureen R. Goldfarb (age 64) | | Trustee | | January 2009 | | 135 | | Private investor | | N/A |
| | | | | |
Michael Hegarty
(age 74) | | Trustee | | December 2004 | | 135 | | Private investor | | Rouse Properties Inc., Director (until 2016); Capmark Financial Group Inc., Director (until 2015) |
| | | | | |
Peter D. Jones
(age 64) | | Trustee | | January 2019 | | 135 | | Franklin Templeton Distributors, Inc. (investment management), President (until 2015); Franklin Templeton Institutional, LLC (investment management), Chairman (until 2015) | | N/A |
| | | | | |
James W. Kilman, Jr. (age 58) | | Trustee | | January 2019 | | 135 | | Burford Capital Limited (finance and investment management), Chief Financial Officer (since 2019); KielStrand Capital LLC (family office and merchant bank), Chief Executive Officer (since 2016); Morgan Stanley & Co. (financial services), Vice Chairman of Investment Banking,Co-Head of Diversified Financials Coverage – Financial Institutions Investment Banking Group (until 2016) | | Alpha-En Corporation, Director (since 2016) |
45
Trustees and Officers – continued
| | | | | | | | | | |
Name, Age | | Position(s)
Held
with Fund | | Trustee/Officer
Since (h) | | Number of
MFS Funds
overseen
by the
Trustee | | Principal
Occupations During the Past Five Years | | Other
Directorships
During the Past
Five Years (j) |
Clarence Otis, Jr. (age 63) | | Trustee | | March 2017 | | 135 | | Darden Restaurants, Inc., Chief Executive Officer (until 2014) | | VF Corporation, Director; Verizon Communications, Inc., Director; The Travelers Companies, Director; Federal Reserve Bank of Atlanta, Director (until 2015) |
| | | | | |
Maryanne L. Roepke (age 63) | | Trustee | | May 2014 | | 135 | | American Century Investments (investment management), Senior Vice President and Chief Compliance Officer (until 2014) | | N/A |
| | | | | |
Laurie J. Thomsen
(age 62) | | Trustee | | March 2005 | | 135 | | Private investor | | The Travelers Companies, Director; Dycom Industries, Inc., Director (since 2015) |
| | | | | | | | |
Name, Age | | Position(s) Held
with Fund | | Trustee/Officer
Since (h) | | Number of
MFS Funds
for which
the Person
is an Officer | | Principal
Occupations During
the Past Five Years |
| OFFICERS | | | | | | | | |
Christopher R. Bohane (k) (age 45) | | Assistant Secretary and Assistant Clerk | | July 2005 | | 135 | | Massachusetts Financial Services Company, Vice President and Assistant General Counsel |
| | | | |
Kino Clark (k) (age 51) | | Assistant Treasurer | | January 2012 | | 135 | | Massachusetts Financial Services Company, Vice President |
46
Trustees and Officers – continued
| | | | | | | | |
Name, Age | | Position(s) Held
with Fund | | Trustee/Officer
Since (h) | | Number of
MFS Funds
for which
the Person
is an Officer | | Principal
Occupations During
the Past Five Years |
John W. Clark, Jr. (k) (age 52) | | Assistant Treasurer | | April 2017 | | 135 | | Massachusetts Financial Services Company, Vice President (since March 2017); Deutsche Bank (financial services), Department Head – Treasurer’s Office (until February 2017) |
| | | | |
Thomas H. Connors (k) (age 60) | | Assistant Secretary and Assistant Clerk | | September 2012 | | 135 | | Massachusetts Financial Services Company, Vice President and Senior Counsel |
| | | | |
David L. DiLorenzo (k)
(age 51) | | President | | July 2005 | | 135 | | Massachusetts Financial Services Company, Senior Vice President |
| | | | |
Heidi W. Hardin (k)
(age 52) | | Secretary and Clerk | | April 2017 | | 135 | | Massachusetts Financial Services Company, Executive Vice President and General Counsel (since March 2017); Harris Associates (investment management), General Counsel (from September 2015 to January 2017); Janus Capital Management LLC (investment management), Senior Vice President and General Counsel (until September 2015) |
| | | | |
Brian E. Langenfeld (k)
(age 46) | | Assistant
Secretary and Assistant Clerk | | June 2006 | | 135 | | Massachusetts Financial Services Company, Vice President and Senior Counsel |
| | | | |
Amanda S. Mooradian (k)
(age 40) | | Assistant
Secretary and Assistant Clerk | | September 2018 | | 135 | | Massachusetts Financial Services Company, Assistant Vice President and Counsel |
47
Trustees and Officers – continued
| | | | | | | | |
Name, Age | | Position(s) Held
with Fund | | Trustee/Officer
Since (h) | | Number of
MFS Funds
for which
the Person
is an Officer | | Principal
Occupations During
the Past Five Years |
Susan A. Pereira (k)
(age 48) | | Assistant
Secretary and Assistant Clerk | | July 2005 | | 135 | | Massachusetts Financial Services Company, Vice President and Assistant General Counsel |
| | | | |
Kasey L. Phillips (k)
(age 48) | | Assistant Treasurer | | September 2012 | | 135 | | Massachusetts Financial Services Company, Vice President |
| | | | |
Matthew A. Stowe (k)
(age 44) | | Assistant Secretary and Assistant Clerk | | October 2014 | | 135 | | Massachusetts Financial Services Company, Vice President and Assistant General Counsel |
| | | | |
Martin J. Wolin (k)
(age 52) | | Chief Compliance Officer | | July 2015 | | 135 | | Massachusetts Financial Services Company, Senior Vice President and Chief Compliance Officer (since July 2015); Mercer (financial service provider), Chief Risk and Compliance Officer, North America and Latin America (until June 2015) |
| | | | |
James O. Yost (k)
(age 59) | | Treasurer | | September 1990 | | 135 | | Massachusetts Financial Services Company, Senior Vice President |
| (h) | Date first appointed to serve as Trustee/officer of an MFS Fund. Each Trustee has served continuously since appointment unless indicated otherwise. For the period from December 15, 2004 until February 22, 2005, Mr. Manning served as Advisory Trustee. From January 2012 through December 2016, Messrs. DiLorenzo and Yost served as Treasurer and Deputy Treasurer of the Funds, respectively. |
| (j) | Directorships or trusteeships of companies required to report to the Securities and Exchange Commission (i.e., “public companies”). |
| (k) | “Interested person” of the Trust within the meaning of the Investment Company Act of 1940 (referred to as the 1940 Act), which is the principal federal law governing investment companies like the fund, as a result of a position with MFS. The address of MFS is 111 Huntington Avenue, Boston, Massachusetts 02199-7618. |
Each Trustee (other than Messrs. Jones and Kilman) has been elected by shareholders and each Trustee and Officer holds office until his or her successor is chosen and qualified or until his or her earlier death, resignation, retirement or removal. Messrs. Jones and Kilman became Trustees of the Funds on January 1, 2019. The Trust does
48
Trustees and Officers – continued
not hold annual meetings for the purpose of electing Trustees, and Trustees are not elected for fixed terms. Under the terms of the Board’s retirement policy, an Independent Trustee shall retire at the end of the calendar year in which he or she reaches the earlier of 75 years of age or 15 years of service on the Board (or, in the case of any Independent Trustee who joined the Board prior to 2015, 20 years of service on the Board).
Messrs. Buller, Hegarty, Kilman and Otis and Ms. Roepke are members of the Trust’s Audit Committee.
Each of the Interested Trustees and certain Officers hold comparable officer positions with certain affiliates of MFS.
The Statement of Additional Information for a Fund includes further information about the Trustees and is available without charge upon request by calling1-800-225-2606.
| | |
| Investment Adviser | | Custodian |
Massachusetts Financial Services Company
111 Huntington Avenue Boston, MA 02199-7618 | | State Street Bank and Trust Company 1 Lincoln Street Boston, MA 02111-2900 |
| Distributor | | Independent Registered Public Accounting Firm |
MFS Fund Distributors, Inc.
111 Huntington Avenue Boston, MA 02199-7618 | | Ernst & Young LLP 200 Clarendon Street Boston, MA 02116 |
| Portfolio Manager(s) | | |
Matthew Sabel | | |
49
BOARD REVIEW OF INVESTMENT ADVISORY AGREEMENT
The Investment Company Act of 1940 requires that both the full Board of Trustees and a majority of thenon-interested (“independent”) Trustees, voting separately, annually approve the continuation of the Fund’s investment advisory agreement with MFS. The Trustees consider matters bearing on the Fund and its advisory arrangements at their meetings throughout the year, including a review of performance data at each regular meeting. In addition, the independent Trustees met several times over the course of three months beginning in May and ending in July, 2019 (“contract review meetings”) for the specific purpose of considering whether to approve the continuation of the investment advisory agreement for the Fund and the other investment companies that the Board oversees (the “MFS Funds”). The independent Trustees were assisted in their evaluation of the Fund’s investment advisory agreement by independent legal counsel, from whom they received separate legal advice and with whom they met separately from MFS during various contract review meetings. The independent Trustees were also assisted in this process by the MFS Funds’ Independent Senior Officer, a senior officer appointed by and reporting to the independent Trustees.
In connection with their deliberations regarding the continuation of the investment advisory agreement, the Trustees, including the independent Trustees, considered such information and factors as they believed, in light of the legal advice furnished to them and their own business judgment, to be relevant. The investment advisory agreement for the Fund was considered separately, although the Trustees also took into account the common interests of all MFS Funds in their review. As described below, the Trustees considered the nature, quality, and extent of the various investment advisory, administrative, and shareholder services performed by MFS under the existing investment advisory agreement and other arrangements with the Fund.
In connection with their contract review meetings, the Trustees received and relied upon materials that included, among other items: (i) information provided by Broadridge Financial Solutions, Inc. (“Broadridge”), an independent third party, on the investment performance of the Fund for various time periods ended December 31, 2018 and the investment performance of a group of funds with substantially similar investment classifications/objectives (the “Broadridge performance universe”), (ii) information provided by Broadridge on the Fund’s advisory fees and other expenses and the advisory fees and other expenses of comparable funds identified by Broadridge as well as all other funds in the same investment classification/category (the “Broadridge expense group and universe”), (iii) information provided by MFS on the advisory fees of portfolios of other clients of MFS, including institutional separate accounts and other clients, (iv) information as to whether and to what extent applicable expense waivers, reimbursements or fee “breakpoints” are observed for the Fund, (v) information regarding MFS’ financial results and financial condition, including MFS’ and certain of its affiliates’ estimated profitability from services performed for the Fund and the MFS Funds as a whole, and compared to MFS’ institutional business, (vi) MFS’ views regarding the outlook for the mutual fund industry and the strategic business plans of MFS, (vii) descriptions of various functions performed by MFS for the Funds, such as compliance monitoring and portfolio trading practices, and (viii) information regarding the overall organization of MFS, including information about MFS’ senior management
50
Board Review of Investment Advisory Agreement – continued
and other personnel providing investment advisory, administrative and other services to the Fund and the other MFS Funds. The comparative performance, fee and expense information prepared and provided by Broadridge was not independently verified and the independent Trustees did not independently verify any information provided to them by MFS.
The Trustees’ conclusion as to the continuation of the investment advisory agreement was based on a comprehensive consideration of all information provided to the Trustees and not the result of any single factor. Some of the factors that figured particularly in the Trustees’ deliberations are described below, although individual Trustees may have evaluated the information presented differently from one another, giving different weights to various factors. It is also important to recognize that the fee arrangements for the Fund and other MFS Funds are the result of years of review and discussion between the independent Trustees and MFS, that certain aspects of such arrangements may receive greater scrutiny in some years than in others, and that the Trustees’ conclusions may be based, in part, on their consideration of these same arrangements during the course of the year and in prior years.
Based on information provided by Broadridge and MFS, the Trustees reviewed the Fund’s total return investment performance as well as the Broadridge performance universe over various time periods. The Trustees placed particular emphasis on the total return performance of the Fund’s Class A shares in comparison to the performance of funds in its Broadridge performance universe over the five-year period ended December 31, 2018, which the Trustees believed was a long enough period to reflect differing market conditions. The total return performance of the Fund’s Class A shares was in the 2nd quintile relative to the other funds in the universe for this five-year period (the 1st quintile being the best performers and the 5th quintile being the worst performers). The total return performance of the Fund’s Class A shares was in the 2nd quintile for each of theone- and three-year periods ended December 31, 2018 relative to the Broadridge performance universe. Because of the passage of time, these performance results may differ from the performance results for more recent periods, including those shown elsewhere in this report.
In the course of their deliberations, the Trustees took into account information provided by MFS in connection with the contract review meetings, as well as during investment review meetings conducted with portfolio management personnel during the course of the year regarding the Fund’s performance. After reviewing these and related factors, the Trustees concluded, within the context of their overall conclusions regarding the investment advisory agreement, that they were satisfied with MFS’ responses and efforts relating to investment performance.
In assessing the reasonableness of the Fund’s advisory fee, the Trustees considered, among other information, the Fund’s advisory fee and the total expense ratio of the Fund’s Class A shares as a percentage of average daily net assets and the advisory fee and total expense ratios of the Broadridge expense group based on information provided by Broadridge. The Trustees considered that, according to the data provided by Broadridge (which takes into account any fee reductions or expense limitations that were in effect during the Fund’s last fiscal year), the Fund’s effective advisory fee rate was approximately at the Broadridge expense group median and the Fund’s total expense ratio was lower than the Broadridge expense group median.
51
Board Review of Investment Advisory Agreement – continued
The Trustees also considered the advisory fees charged by MFS to any institutional separate accounts advised by MFS (“separate accounts”) and unaffiliated investment companies for which MFS serves as subadviser (“subadvised funds”) that have comparable investment strategies to the Fund, if any. In comparing these fees, the Trustees considered information provided by MFS as to the generally broader scope of services provided by MFS to the Fund, as well as the more extensive regulatory burdens imposed on MFS in managing the Fund, in comparison to separate accounts and subadvised funds. The Trustees also considered the higher demands placed on MFS’ investment personnel and trading infrastructure as a result of the daily cashin-flows andout-flows of the Fund in comparison to separate accounts.
The Trustees also considered whether the Fund may benefit from any economies of scale in the management of the Fund in the event of growth in assets of the Fund and/or growth in assets of the MFS Funds as a whole. They noted that the Fund’s advisory fee rate schedule is subject to a contractual breakpoint that reduces the Fund’s advisory fee rate on average daily net assets over $1 billion. They also noted that MFS has agreed to implement an additional contractual breakpoint that reduces its advisory fee rate on the Fund’s average daily net assets over $2.5 billion effective August 1, 2019. The Trustees also noted that MFS has agreed in writing to waive a portion of the management fees of certain MFS Funds, including the Fund, if the total combined assets of certain funds within the MFS Funds’ complex increase above agreed upon thresholds (the “group fee waiver”), enabling the Fund’s shareholders to share in the benefits from any economies of scale at the complex level. The group fee waiver is reviewed and renewed annually between the Board and MFS. The Trustees concluded that the breakpoints and the group fee waiver were sufficient to allow the Fund to benefit from economies of scale as its assets and overall complex assets grow.
The Trustees also considered information prepared by MFS relating to MFS’ costs and profits with respect to the Fund, the MFS Funds considered as a group, and other investment companies and accounts advised by MFS, as well as MFS’ methodologies used to determine and allocate its costs to the MFS Funds, the Fund and other accounts and products for purposes of estimating profitability.
After reviewing these and other factors described herein, the Trustees concluded, within the context of their overall conclusions regarding the investment advisory agreement, that the advisory fees charged to the Fund represent reasonable compensation in light of the services being provided by MFS to the Fund.
In addition, the Trustees considered MFS’ resources and related efforts to continue to retain, attract and motivate capable personnel to serve the Fund. The Trustees also considered current and developing conditions in the financial services industry, including the presence of large and well-capitalized companies which are spending, and appear to be prepared to continue to spend, substantial sums to engage personnel and to provide services to competing investment companies. In this regard, the Trustees also considered the financial resources of MFS and its ultimate parent, Sun Life Financial Inc. The Trustees also considered the advantages and possible disadvantages to the Fund of having an adviser that also serves other investment companies as well as other accounts.
52
Board Review of Investment Advisory Agreement – continued
The Trustees also considered the nature, quality, cost, and extent of administrative, transfer agency, and distribution services provided to the Fund by MFS and its affiliates under agreements and plans other than the investment advisory agreement, including any12b-1 fees the Fund pays to MFS Fund Distributors, Inc., an affiliate of MFS. The Trustees also considered the nature, extent and quality of certain other services MFS performs or arranges for on the Fund’s behalf, which may include securities lending programs, directed expense payment programs, class action recovery programs, and MFS’ interaction with third-party service providers, principally custodians andsub-custodians. The Trustees concluded that the variousnon-advisory services provided by MFS and its affiliates on behalf of the Fund were satisfactory.
The Trustees consideredso-called“fall-out benefits” to MFS such as reputational value derived from serving as investment manager to the MFS Funds. The Trustees also considered that, effective January 3, 2018, MFS had discontinued its historic practice of obtaining investment research from portfolio brokerage commissions paid by certain MFS Funds and would thereafter directly pay for or voluntarily reimburse a Fund, if applicable, for the costs of external research acquired through the use of the Fund’s portfolio brokerage commissions.
Based on their evaluation of factors that they deemed to be material, including those factors described above, the Board of Trustees, including the independent Trustees, concluded that the Fund’s investment advisory agreement with MFS should be continued for an additionalone-year period, commencing August 1, 2019.
53
PROXY VOTING POLICIES AND INFORMATION
MFS votes proxies on behalf of the fund pursuant to proxy voting policies and procedures that are available without charge, upon request, by calling1-800-225-2606, by visitingmfs.com/proxyvoting,or by visiting the SEC’s Web site athttp://www.sec.gov.
Information regarding how the fund voted proxies relating to portfolio securities during the most recent twelve-month period ended June 30 is available by August 31 of each year without charge by visitingmfs.com/proxyvoting,or by visiting the SEC’s Web site athttp://www.sec.gov.
QUARTERLY PORTFOLIO DISCLOSURE
The fund files a complete schedule of portfolio holdings with the SEC for the first and third quarters of each fiscal year on Form N-Q or as an exhibit to its reports onForm N-PORT (for first and third fiscal quarters ending March 31, 2019 or after). The fund’s Form N-Q or Form N-PORT reports are available on the SEC’s website athttp://www.sec.gov.A shareholder can obtain the portfolio holdings report for the first and third quarters of the fund’s fiscal year atmfs.com/openendfunds by choosing the fund’s name and then selecting the “Resources” tab and clicking on “Prospectus and Reports”.
FURTHER INFORMATION
From time to time, MFS may post important information about the fund or the MFS funds on the MFS web site (mfs.com). This information is available athttps://www.mfs.com/en-us/what-we-do/announcements.htmlor atmfs.com/openendfundsby choosing the fund’s name.
INFORMATION ABOUT FUND CONTRACTS AND LEGAL CLAIMS
The fund has entered into contractual arrangements with an investment adviser, administrator, distributor, shareholder servicing agent, 529 program manager (if applicable), and custodian who each provide services to the fund. Unless expressly stated otherwise, shareholders are not parties to, or intended beneficiaries of these contractual arrangements, and these contractual arrangements are not intended to create any shareholder right to enforce them against the service providers or to seek any remedy under them against the service providers, either directly or on behalf of the fund.
Under the Trust’s By-Laws and Declaration of Trust, any claims asserted against or on behalf of the MFS Funds, including claims against Trustees and Officers, must be brought in state and federal courts located within the Commonwealth of Massachusetts.
FEDERAL TAX INFORMATION (unaudited)
The fund will notify shareholders of amounts for use in preparing 2019 income tax forms in January 2020. The following information is provided pursuant to provisions of the Internal Revenue Code.
The fund designates the maximum amount allowable as qualified dividend income eligible to be taxed at the same rate as long-term capital gain.
The fund designates $49,622,000 as capital gain dividends paid during the fiscal year.
For corporate shareholders, 51.97% of the ordinary income dividends paid during the fiscal year qualify for the corporate dividends received deduction.
The fund designates the maximum amount allowable as Section 199A dividends as defined in Proposed Treasury Regulation §1.199A-3(d).
54
rev. 3/16
| | | | |
| | | |
FACTS | | WHAT DOES MFS DO WITH YOUR PERSONAL INFORMATION? | |  |
| | |
| Why? | | Financial companies choose how they share your personal information. Federal law gives consumers the right to limit some but not all sharing. Federal law also requires us to tell you how we collect, share, and protect your personal information. Please read this notice carefully to understand what we do. |
| | |
| What? | | The types of personal information we collect and share depend on the product or service you have with us. This information can include: • Social Security number and account balances • Account transactions and transaction history • Checking account information and wire transfer instructions When you areno longer our customer, we continue to share your information as described in this notice. |
| | |
| How? | | All financial companies need to share customers’ personal information to run their everyday business. In the section below, we list the reasons financial companies can share their customers’ personal information; the reasons MFS chooses to share; and whether you can limit this sharing. |
| | | | |
Reasons we can share your
personal information | | Does MFS
share? | | Can you limit
this sharing? |
For our everyday business purposes – such as to process your transactions, maintain your account(s), respond to court orders and legal investigations, or report to credit bureaus | | Yes | | No |
For our marketing purposes – to offer our products and services to you | | No | | We don’t share |
For joint marketing with other financial companies | | No | | We don’t share |
For our affiliates’ everyday business purposes – information about your transactions and experiences | | No | | We don’t share |
For our affiliates’ everyday business purposes – information about your creditworthiness | | No | | We don’t share |
| For nonaffiliates to market to you | | No | | We don’t share |
| | |
| | |
| Questions? | | Call800-225-2606 or go tomfs.com. |
55
| | |
| Who we are |
| Who is providing this notice? | | MFS Funds, MFS Investment Management, MFS Institutional Advisors, Inc., and MFS Heritage Trust Company. |
| | |
| What we do |
| How does MFS protect my personal information? | | To protect your personal information from unauthorized access and use, we use security measures that comply with federal law. These measures include procedural, electronic, and physical safeguards for the protection of the personal information we collect about you. |
| How does MFS collect my personal information? | | We collect your personal information, for example, when you • open an account or provide account information • direct us to buy securities or direct us to sell your securities • make a wire transfer We also collect your personal information from others, such as credit bureaus, affiliates, or other companies. |
| Why can’t I limit all sharing? | | Federal law gives you the right to limit only • sharing for affiliates’ everyday business purposes – information about your creditworthiness • affiliates from using your information to market to you • sharing for nonaffiliates to market to you State laws and individual companies may give you additional rights to limit sharing. |
| | |
| Definitions |
| Affiliates | | Companies related by common ownership or control. They can be financial and nonfinancial companies. • MFS does not share personal information with affiliates, except for everyday business purposes as described on page one of this notice. |
| Nonaffiliates | | Companies not related by common ownership or control. They can be financial and nonfinancial companies. • MFS does not share with nonaffiliates so they can market to you. |
| Joint marketing | | A formal agreement between nonaffiliated financial companies that together market financial products or services to you. • MFS doesn’t jointly market. |
| | |
| Other important information |
| If you own an MFS product or receive an MFS service in the name of a third party such as a bank or broker-dealer, their privacy policy may apply to you instead of ours. |
56
Save paper with eDelivery.

| MFS® will send you prospectuses, |
reports, and proxies directly viae-mail so you will get information faster with less mailbox clutter.
To sign up:
1. Go to mfs.com.
2. Log in via MFS® Access.
3. Select eDelivery.
If you own your MFS fund shares through a financial institution or a retirement plan, MFS® TALK, MFS® Access, or eDelivery may not be available to you.
CONTACT
WEB SITE
mfs.com
MFS TALK
1-800-637-8255
24 hours a day
ACCOUNT SERVICE AND LITERATURE
Shareholders
1-800-225-2606
Financial advisors
1-800-343-2829
Retirement plan services
1-800-637-1255
MAILING ADDRESS
MFS Service Center, Inc.
P.O. Box 219341
Kansas City, MO 64121-9341
OVERNIGHT MAIL
MFS Service Center, Inc.
Suite 219341
430 W 7th Street
Kansas City, MO 64105-1407
Annual Report
August 31, 2019

MFS® U.S. Government Cash Reserve Fund

Beginning on January 1, 2021, as permitted by regulations adopted by the U.S. Securities and Exchange Commission, paper copies of the fund’s annual and semiannual shareholder reports will no longer be sent by mail, unless you specifically request paper copies of the reports. Instead, the complete reports will be made available on the fund’s Web site (funds.mfs.com), and you will be notified by mail each time a report is posted and provided with a Web site link to access the report.
If you are already signed up to receive shareholder reports by email, you will not be affected by this change and you need not take any action. You may sign up to receive shareholder reports and other communications from the fund by email by contacting your financial intermediary (such as a broker-dealer or bank) or, if you hold your shares directly with the fund, by calling 1-800-225-2606 or by logging on to MFS Access at mfs.com.
Beginning on January 1, 2019, you may elect to receive all future reports in paper free of charge. Contact your financial intermediary to request that you continue to receive paper copies of your shareholder reports. If you invest directly with the fund, you can call 1-800-225-2606 or send an email request to orderliterature@mfs.com to let the fund know that you wish to continue receiving paper copies of your shareholder reports. Your election to receive reports in paper will apply to all funds held in your account if you invest through your financial intermediary or all funds held with the MFS fund complex if you invest directly.
LMM-ANN
MFS® U.S. Government Cash Reserve Fund
CONTENTS
The report is prepared for the general information of shareholders.
It is authorized for distribution to prospective investors only when preceded or accompanied by a current prospectus.
NOT FDIC INSURED• MAY LOSE VALUE• NO BANK GUARANTEE

LETTER FROM THE EXECUTIVE CHAIRMAN
Dear Shareholders:
Slowing global growth, low inflation, and increasing trade friction between the United States and China have been hallmarks of the past 12 months. After experiencing an
uptick in market volatility in late 2018, markets steadied during the first half of 2019, thanks in large measure to the adoption of a dovish policy stance on the part of global central banks, focused on supporting economic growth. The U.S. and China have raised tariffs on each other, heightening tensions and uncertainty. Despite repeated declarations by British Prime Minister Boris Johnson that the United Kingdom will leave the European Union on October 31, 2019, with or without a deal, apprehension over the possibility of a no-deal Brexit has eased somewhat, with Parliament having taken steps to block such an outcome.
Markets expect that the longest economic expansion in U.S. history will continue for the time being, albeit at a slower pace. In an effort to prolong the expansion, the U.S. Federal Reserve lowered interest rates for the first time in more than a decade in July and again in September. Similarly, the European Central Bank loosened policy in September. While markets have grown more risk averse, the accommodative monetary environment has helped push global interest rates toward record-low levels and has been somewhat supportive of risk assets despite the unsettled economic and geopolitical backdrop.
Since launching the first U.S. open-end mutual fund in 1924, MFS® has been committed to a single purpose: to create value by allocating capital responsibly for clients. Through our powerful global investment platform, we combine collective expertise, thoughtful risk management, and long-term discipline to uncover what we believe are the best investment opportunities in the market.
Respectfully,

Robert J. Manning
Executive Chairman
MFS Investment Management
October 17, 2019
The opinions expressed in this letter are subject to change and may not be relied upon for investment advice. No forecasts can be guaranteed.
1
PORTFOLIO COMPOSITION
Portfolio structure (u)
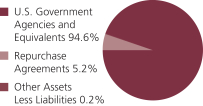
| | | | |
| Composition including fixed income credit quality (a)(u) | |
| A-1+ | | | 11.0% | |
| A-1 | | | 88.8% | |
| Other Assets Less Liabilities | | | 0.2% | |
| | | | |
| Maturity breakdown (u) | | | | |
| 0 - 7 days | | | 25.4% | |
| 8 - 29 days | | | 44.9% | |
| 30 - 59 days | | | 17.0% | |
| 60 - 89 days | | | 9.4% | |
| 90 - 360 days | | | 3.1% | |
| Other Assets Less Liabilities | | | 0.2% | |
| (a) | Ratings are assigned to portfolio securities utilizing ratings from Moody’s, Fitch, and Standard & Poor’s rating agencies and applying the following hierarchy: If all three agencies provide a rating, the middle rating (after dropping the highest and lowest ratings) is assigned; if two of the three agencies rate a security, the lower of the two is assigned. Ratings are shown in the S&P scale. All ratings are subject to change. The fund did not hold unrated securities. The fund is not rated by these agencies. |
| (u) | For purposes of this presentation, accrued interest, where applicable, is included. |
Percentages are based on net assets as of August 31, 2019.
The portfolio is actively managed and current holdings may be different.
2
PERFORMANCE SUMMARYTHROUGH 8/31/19
Total returns as well as the current7-day yield have been provided for the applicable time periods. Performance results reflect the percentage change in net asset value, including the reinvestment of any dividends and capital gains distributions. (See Notes to Performance Summary.)
Performance data shown represents past performance and is no guarantee of future results. You could lose money by investing in the fund. Although the fund seeks to preserve the value of your investment at $1.00 per share, it cannot guarantee it will do so. An investment in the fund is not insured or guaranteed by the Federal Deposit Insurance Corporation or any other governmental agency. The fund’s sponsor has no legal obligation to provide financial support to the fund, and you should not expect the sponsor will provide financial support to the fund at any time. The performance shown does not reflect the deduction of taxes, if any, that a shareholder would pay on fund distributions or the redemption of fund shares.
| | | | | | | | | | | | |
| | | Share Class | | Inception | | 1-Year Total
Return (without
sales charge) (t) | | Current
7-day yield | | | |
| | | A | | 9/07/93 | | 1.58% | | | 1.33% | | | |
| | | B | | 12/29/86 | | 1.58% | | | 1.33% | | | |
| | | C | | 4/01/96 | | 1.58% | | | 1.33% | | | |
| | | I | | 9/18/18 | | 1.52% | | | 1.32% | | | |
| | | R1 | | 4/01/05 | | 1.57% | | | 1.33% | | | |
| | | R2 | | 4/01/05 | | 1.57% | | | 1.33% | | | |
| | | R3 | | 4/01/05 | | 1.57% | | | 1.33% | | | |
| | | R4 | | 4/01/05 | | 1.57% | | | 1.33% | | | |
| | | R6 | | 9/18/18 | | 1.58% | | | 1.33% | | | |
| | | 529A | | 7/31/02 | | 1.53% | | | 1.28% | | | |
| | | 529B | | 7/31/02 | | 1.53% | | | 1.28% | | | |
| | | 529C | | 7/31/02 | | 1.53% | | | 1.28% | | | |
| | | |
| | | | | 1-Year
Total Return | | | |
| | | B
With CDSC (Declining over six years from 4% to 0%) (v) | | | (2.42)% | | | |
| | | C
With CDSC (1% for 12 months) (v) | | | 0.58% | | | |
| | | 529B
With CDSC (Declining over six years from 4% to 0%) (v) | | | (2.47)% | | | |
| | | 529C
With CDSC (1% for 12 months) (v) | | | 0.53% | | | |
3
Performance Summary – continued
CDSC – Contingent Deferred Sales Charge.
Class I, R1, R2, R3, R4, R6, and 529A shares do not have a sales charge. Certain Class A shares acquired through an exchange may be subject to a CDSC upon redemption depending on when the shares exchanged were originally purchased.
| (t) | For Classes I and R6, the return is for the period from the class inception through the stated period end. |
| (v) | Assuming redemption at the end of the applicable period. |
Yields quoted are based on the latest seven days ended as of August 31, 2019, with dividends annualized. The yield quotations more closely reflect the current earnings of the fund than the total return quotations. Shares of the fund can be purchased at net asset value without a sales charge.
Notes to Performance Summary
Class 529 shares are only available in conjunction with qualified tuition programs, such as the MFS 529 Savings Plan. There also is an additional fee, which is detailed in the program description, on qualified tuition programs. If this fee was reflected, the performance for Class 529 shares would have been lower. This annual fee is waived for Oregon residents and for those accounts with assets of $25,000 or more.
Performance results reflect any applicable expense subsidies, waivers and adjustments in effect during the periods shown. Without such subsidies and waivers the fund’s performance results would be less favorable. Please see the prospectus and financial statements for complete details. All results are historical and assume the reinvestment of any dividends and capital gain distributions.
4
EXPENSE TABLE
Fund expenses borne by the shareholders during the period,
March 1, 2019 through August 31, 2019
As a shareholder of the fund, you incur two types of costs: (1) transaction costs, including sales charges (loads) on certain purchase or redemption payments, and (2) ongoing costs, including management fees; distribution and service(12b-1) fees; and other fund expenses. This example is intended to help you understand your ongoing costs (in dollars) of investing in the fund and to compare these costs with the ongoing costs of investing in other mutual funds.
The example is based on an investment of $1,000 invested at the beginning of the period and held for the entire period March 1, 2019 through August 31, 2019.
Actual Expenses
The first line for each share class in the following table provides information about actual account values and actual expenses. You may use the information in this line, together with the amount you invested, to estimate the expenses that you paid over the period. Simply divide your account value by $1,000 (for example, an $8,600 account value divided by $1,000 = 8.6), then multiply the result by the number in the first line under the heading entitled “Expenses Paid During Period” to estimate the expenses you paid on your account during this period.
Hypothetical Example for Comparison Purposes
The second line for each share class in the following table provides information about hypothetical account values and hypothetical expenses based on the fund’s actual expense ratio and an assumed rate of return of 5% per year before expenses, which is not the fund’s actual return. The hypothetical account values and expenses may not be used to estimate the actual ending account balance or expenses you paid for the period. You may use this information to compare the ongoing costs of investing in the fund and other funds. To do so, compare this 5% hypothetical example with the 5% hypothetical examples that appear in the shareholder reports of the other funds.
Please note that the expenses shown in the table are meant to highlight your ongoing costs only and do not reflect any transactional costs, such as sales charges (loads). Therefore, the second line for each share class in the table is useful in comparing ongoing costs only, and will not help you determine the relative total costs of owning different funds. In addition, if these transactional costs were included, your costs would have been higher.
5
Expense Table – continued
| | | | | | | | | | | | | | | | | | |
Share
Class | | | | Annualized
Expense
Ratio | | | Beginning
Account Value
3/01/19 | | | Ending
Account Value
8/31/19 | | | Expenses
Paid During
Period (p)
3/01/19-8/31/19 | |
| A | | Actual | | | 0.73% | | | | $1,000.00 | | | | $1,008.13 | | | | $3.69 | |
| | Hypothetical (h) | | | 0.73% | | | | $1,000.00 | | | | $1,021.53 | | | | $3.72 | |
| B | | Actual | | | 0.73% | | | | $1,000.00 | | | | $1,008.13 | | | | $3.69 | |
| | Hypothetical (h) | | | 0.73% | | | | $1,000.00 | | | | $1,021.53 | | | | $3.72 | |
| C | | Actual | | | 0.74% | | | | $1,000.00 | | | | $1,008.13 | | | | $3.75 | |
| | Hypothetical (h) | | | 0.74% | | | | $1,000.00 | | | | $1,021.48 | | | | $3.77 | |
| I | | Actual | | | 0.73% | | | | $1,000.00 | | | | $1,008.13 | | | | $3.69 | |
| | Hypothetical (h) | | | 0.73% | | | | $1,000.00 | | | | $1,021.53 | | | | $3.72 | |
| R1 | | Actual | | | 0.73% | | | | $1,000.00 | | | | $1,008.13 | | | | $3.69 | |
| | Hypothetical (h) | | | 0.73% | | | | $1,000.00 | | | | $1,021.53 | | | | $3.72 | |
| R2 | | Actual | | | 0.73% | | | | $1,000.00 | | | | $1,008.13 | | | | $3.69 | |
| | Hypothetical (h) | | | 0.73% | | | | $1,000.00 | | | | $1,021.53 | | | | $3.72 | |
| R3 | | Actual | | | 0.73% | | | | $1,000.00 | | | | $1,008.13 | | | | $3.69 | |
| | Hypothetical (h) | | | 0.73% | | | | $1,000.00 | | | | $1,021.53 | | | | $3.72 | |
| R4 | | Actual | | | 0.73% | | | | $1,000.00 | | | | $1,008.13 | | | | $3.69 | |
| | Hypothetical (h) | | | 0.73% | | | | $1,000.00 | | | | $1,021.53 | | | | $3.72 | |
| R6 | | Actual | | | 0.67% | | | | $1,000.00 | | | | $1,008.46 | | | | $3.39 | |
| | Hypothetical (h) | | | 0.67% | | | | $1,000.00 | | | | $1,021.83 | | | | $3.41 | |
| 529A | | Actual | | | 0.78% | | | | $1,000.00 | | | | $1,007.87 | | | | $3.95 | |
| | Hypothetical (h) | | | 0.78% | | | | $1,000.00 | | | | $1,021.27 | | | | $3.97 | |
| 529B | | Actual | | | 0.78% | | | | $1,000.00 | | | | $1,007.87 | | | | $3.95 | |
| | Hypothetical (h) | | | 0.78% | | | | $1,000.00 | | | | $1,021.27 | | | | $3.97 | |
| 529C | | Actual | | | 0.78% | | | | $1,000.00 | | | | $1,007.87 | | | | $3.95 | |
| | Hypothetical (h) | | | 0.78% | | | | $1,000.00 | | | | $1,021.27 | | | | $3.97 | |
| (h) | 5% class return per year before expenses. |
| (p) | “Expenses Paid During Period” are equal to each class’s annualized expense ratio, as shown above, multiplied by the average account value over the period, multiplied by 184/365 (to reflect theone-half year period). Expenses paid do not include any applicable sales charges (loads). If these transaction costs had been included, your costs would have been higher. |
6
PORTFOLIO OF INVESTMENTS
8/31/19
The Portfolio of Investments is a complete list of all securities owned by your fund. It is categorized by broad-based asset classes.
| | | | | | | | |
| U.S. Government Agencies and Equivalents (y) - 94.6% | | | | | |
| | |
| Issuer | | Shares/Par | | | Value ($) | |
| Fannie Mae, 2.134%, due 9/09/2019 | | $ | 8,500,000 | | | $ | 8,496,033 | |
| Fannie Mae, 2.036%, due 9/18/2019 | | | 3,998,000 | | | | 3,994,215 | |
| Fannie Mae, 2.051%, due 9/24/2019 | | | 10,909,000 | | | | 10,894,921 | |
| Federal Farm Credit Bank, 2.059%, due 9/03/2019 | | | 19,500,000 | | | | 19,497,801 | |
| Federal Farm Credit Bank, 2.103%, due 9/05/2019 | | | 10,555,000 | | | | 10,552,572 | |
| Federal Farm Credit Bank, 2.032%, due 9/18/2019 | | | 8,500,000 | | | | 8,491,972 | |
| Federal Farm Credit Bank, 2.045%, due 10/07/2019 | | | 4,100,000 | | | | 4,091,759 | |
| Federal Home Loan Bank, 2.133%, due 9/04/2019 | | | 4,300,000 | | | | 4,299,248 | |
| Federal Home Loan Bank, 2.082%, due 9/10/2019 | | | 5,569,000 | | | | 5,566,146 | |
| Federal Home Loan Bank, 2.02%, due 9/11/2019 | | | 3,627,000 | | | | 3,624,995 | |
| Federal Home Loan Bank, 2.305%, due 9/11/2019 | | | 8,700,000 | | | | 8,694,538 | |
| Federal Home Loan Bank, 2.051%, due 9/18/2019 | | | 6,328,000 | | | | 6,321,964 | |
| Federal Home Loan Bank, 2.052%, due 9/19/2019 | | | 5,214,000 | | | | 5,208,734 | |
| Federal Home Loan Bank, 2.031%, due 9/20/2019 | | | 34,054,000 | | | | 34,018,054 | |
| Federal Home Loan Bank, 2.08%, due 10/02/2019 | | | 8,500,000 | | | | 8,485,032 | |
| Freddie Mac, 2.438%, due 9/04/2019 | | | 8,770,000 | | | | 8,768,261 | |
| Freddie Mac, 2.168%, due 11/13/2019 | | | 4,719,000 | | | | 4,698,714 | |
| Freddie Mac, 2.205%, due 11/13/2019 | | | 8,700,000 | | | | 8,661,982 | |
| Freddie Mac, 2.169%, due 11/19/2019 | | | 6,610,000 | | | | 6,579,249 | |
| Freddie Mac, 2.054%, due 12/03/2019 | | | 4,400,000 | | | | 4,377,153 | |
| Freddie Mac, 1.969%, due 12/04/2019 | | | 2,200,000 | | | | 2,188,913 | |
| U.S. Treasury Bill, 2.044%, due 10/01/2019 | | | 12,700,000 | | | | 12,678,727 | |
| U.S. Treasury Bill, 2.131%, due 10/10/2019 | | | 10,720,000 | | | | 10,695,728 | |
| Total U.S. Government Agencies and Equivalents, at Amortized Cost and Value | | | | | | $ | 200,886,711 | |
| | |
| Repurchase Agreements - 5.2% | | | | | | | | |
| Bank of America Corp. Repurchase Agreement, 2.13%, dated 8/30/2019, due 9/03/2019, total to be received $10,974,597 (secured by U.S. Treasury and Federal Agency obligations valued $11,300,640 in a jointly traded account), at Cost and Value | | $ | 10,972,000 | | | $ | 10,972,000 | |
| | |
| Other Assets, Less Liabilities - 0.2% | | | | | | | 351,933 | |
| Net Assets - 100.0% | | | | | | $ | 212,210,644 | |
| (y) | The rate shown represents an annualized yield at time of purchase. |
See Notes to Financial Statements
7
Financial Statements
STATEMENT OF ASSETS AND LIABILITIES
At 8/31/19
This statement represents your fund’s balance sheet, which details the assets and liabilities comprising the total value of the fund.
| | | | |
| Assets | | | | |
Investments in unaffiliated issuers, at cost and value | | | $211,858,711 | |
Cash | | | 652 | |
Receivables for | | | | |
Fund shares sold | | | 689,023 | |
Interest | | | 1,298 | |
Other assets | | | 270 | |
Total assets | | | $212,549,954 | |
| |
| Liabilities | | | | |
Payables for | | | | |
Distributions | | | $3,541 | |
Fund shares reacquired | | | 175,741 | |
Payable to affiliates | | | | |
Investment adviser | | | 6,793 | |
Administrative services fee | | | 321 | |
Shareholder servicing costs | | | 83,565 | |
Program manager fees | | | 105 | |
Payable for independent Trustees’ compensation | | | 3,982 | |
Accrued expenses and other liabilities | | | 65,262 | |
Total liabilities | | | $339,310 | |
Net assets | | | $212,210,644 | |
| |
| Net assets consist of | | | | |
| Paid-in capital | | | $212,218,170 | |
Total distributable earnings (loss) | | | (7,526 | ) |
Net assets | | | $212,210,644 | |
Shares of beneficial interest outstanding | | | 212,440,651 | |
8
Statement of Assets and Liabilities – continued
| | | | | | | | | | | | |
| | | |
| | | Net assets | | | Shares
outstanding | | | Net asset value
per share | |
Class A | | | $99,510,881 | | | | 99,619,212 | | | | $1.00 | |
Class B | | | 8,977,109 | | | | 8,986,839 | | | | 1.00 | |
Class C | | | 19,437,528 | | | | 19,458,469 | | | | 1.00 | |
Class I | | | 55,827 | | | | 55,888 | | | | 1.00 | |
Class R1 | | | 7,610,256 | | | | 7,618,605 | | | | 1.00 | |
Class R2 | | | 31,672,313 | | | | 31,706,660 | | | | 1.00 | |
Class R3 | | | 16,470,916 | | | | 16,488,418 | | | | 1.00 | |
Class R4 | | | 2,676,322 | | | | 2,679,229 | | | | 1.00 | |
Class R6 | | | 54,424 | | | | 54,504 | | | | 1.00 | |
Class 529A | | | 19,060,525 | | | | 19,081,014 | | | | 1.00 | |
Class 529B | | | 247,066 | | | | 247,322 | | | | 1.00 | |
Class 529C | | | 6,437,477 | | | | 6,444,491 | | | | 1.00 | |
A contingent deferred sales charge may be imposed on redemptions of Class A, Class B, Class C, Class 529B, and Class 529C shares. Redemption price per share was equal to the net asset value per share for Classes I, R1, R2, R3, R4, R6, and 529A.
See Notes to Financial Statements
9
Financial Statements
STATEMENT OF OPERATIONS
Year ended 8/31/19
This statement describes how much your fund earned in investment income and accrued in expenses. It also describes any gains and/or losses generated by fund operations.
| | | | |
| Net investment income (loss) | | | | |
Income | | | | |
Interest | | | $5,019,048 | |
Expenses | | | | |
Management fee | | | $877,367 | |
Distribution and service fees | | | 966,982 | |
Shareholder servicing costs | | | 395,404 | |
Program manager fees | | | 12,255 | |
Administrative services fee | | | 40,083 | |
Independent Trustees’ compensation | | | 10,814 | |
Custodian fee | | | 18,578 | |
Shareholder communications | | | 20,510 | |
Audit and tax fees | | | 40,875 | |
Legal fees | | | 2,247 | |
Registration fees | | | 153,315 | |
Miscellaneous | | | 40,462 | |
Total expenses | | | $2,578,892 | |
Reduction of expenses by investment adviser and distributor | | | (988,265 | ) |
Net expenses | | | $1,590,627 | |
Net investment income (loss) | | | $3,428,421 | |
Realized gain (loss) (identified cost basis) | | | | |
Unaffiliated issuers | | | $1 | |
Change in net assets from operations | | | $3,428,422 | |
See Notes to Financial Statements
10
Financial Statements
STATEMENTS OF CHANGES IN NET ASSETS
These statements describe the increases and/or decreases in net assets resulting from operations, any distributions, and any shareholder transactions.
| | | | | | | | |
| | | Year ended | |
| | | 8/31/19 | | | 8/31/18 | |
| Change in net assets | | | | | | |
| | |
| From operations | | | | | | | | |
Net investment income (loss) | | | $3,428,421 | | | | $1,815,726 | |
Net realized gain (loss) | | | 1 | | | | — | |
Change in net assets from operations | | | $3,428,422 | | | | $1,815,726 | |
Total distributions to shareholders (a) | | | $(3,428,422 | ) | | | $(1,815,726 | ) |
Change in net assets from fund share transactions | | | $(12,531,450 | ) | | | $(56,291,230 | ) |
Total change in net assets | | | $(12,531,450 | ) | | | $(56,291,230 | ) |
| | |
| Net assets | | | | | | | | |
At beginning of period | | | 224,742,094 | | | | 281,033,324 | |
At end of period (b) | | | $212,210,644 | | | | $224,742,094 | |
| (a) | Distributions from net investment income and from net realized gain are no longer required to be separately disclosed. For the year ended August 31, 2018, distributions from net investment income were $1,815,726. |
| (b) | Parenthetical disclosure of accumulated distributions in excess of net investment income is no longer required. For the year ended August 31, 2018, end of period net assets included accumulated distributions in excess of net investment income of $7,719. |
See Notes to Financial Statements
11
Financial Statements
FINANCIAL HIGHLIGHTS
The financial highlights table is intended to help you understand the fund’s financial performance for the past 5 years (or life of a particular share class, if shorter). Certain information reflects financial results for a single fund share. The total returns in the table represent the rate that an investor would have earned (or lost) on an investment in the fund share class (assuming reinvestment of all distributions) held for the entire period.
| | | | | | | | | | | | | | | | | | | | |
| Class A | | Year ended | |
| | | | | |
| | | 8/31/19 | | | 8/31/18 | | | 8/31/17 | | | 8/31/16 | | | 8/31/15 | |
Net asset value, beginning of period | | | $1.00 | | | | $1.00 | | | | $1.00 | | | | $1.00 | | | | $1.00 | |
| | | | |
| Income (loss) from investment operations | | | | | | | | | | | | | | | | | |
Net investment income (loss) (d) | | | $0.02 | | | | $0.01 | | | | $0.00 | (c)(w) | | | $0.00 | | | | $0.00 | |
Net realized and unrealized gain (loss) | | | 0.00 | (w) | | | — | | | | (0.00 | )(w) | | | — | | | | 0.00 | (w) |
Total from investment operations | | | $0.02 | | | | $0.01 | | | | $0.00 | (w) | | | $0.00 | | | | $0.00 | (w) |
| | | | |
| Less distributions declared to shareholders | | | | | | | | | | | | | | | | | |
From net investment income | | | $(0.02 | ) | | | $(0.01 | ) | | | $(0.00 | )(w) | | | $— | | | | $— | |
Net asset value, end of period | | | $1.00 | | | | $1.00 | | | | $1.00 | | | | $1.00 | | | | $1.00 | |
Total return (%) (r)(t) | | | 1.58 | | | | 0.76 | | | | 0.08 | (c) | | | 0.00 | | | | 0.00 | (w) |
| | | | |
Ratios (%) (to average net assets)
and Supplemental data: | | | | | | | | | | | | | | | | | |
Expenses before expense reductions (f) | | | 0.98 | | | | 0.94 | | | | 0.91 | (c) | | | 0.91 | | | | 0.92 | |
Expenses after expense reductions (f) | | | 0.72 | | | | 0.68 | | | | 0.50 | (c) | | | 0.23 | | | | 0.07 | |
Net investment income (loss) | | | 1.57 | | | | 0.76 | | | | 0.08 | (c) | | | 0.00 | | | | 0.00 | |
Net assets at end of period (000 omitted) | | | $99,511 | | | | $100,463 | | | | $105,859 | | | | $120,740 | | | | $122,085 | |
See Notes to Financial Statements
12
Financial Highlights – continued
| | | | | | | | | | | | | | | | | | | | |
| Class B | | Year ended | |
| | | | | |
| | | 8/31/19 | | | 8/31/18 | | | 8/31/17 | | | 8/31/16 | | | 8/31/15 | |
Net asset value, beginning of period | | | $1.00 | | | | $1.00 | | | | $1.00 | | | | $1.00 | | | | $1.00 | |
| | | | |
| Income (loss) from investment operations | | | | | | | | | | | | | | | | | |
Net investment income (loss) (d) | | | $0.02 | | | | $0.01 | | | | $0.00 | (c)(w) | | | $0.00 | | | | $0.00 | |
Net realized and unrealized gain (loss) | | | 0.00 | (w) | | | — | | | | (0.00 | )(w) | | | — | | | | 0.00 | (w) |
Total from investment operations | | | $0.02 | | | | $0.01 | | | | $0.00 | (w) | | | $0.00 | | | | $0.00 | (w) |
| | | | |
| Less distributions declared to shareholders | | | | | | | | | | | | | | | | | |
From net investment income | | | $(0.02 | ) | | | $(0.01 | ) | | | $(0.00 | )(w) | | | $— | | | | $— | |
Net asset value, end of period | | | $1.00 | | | | $1.00 | | | | $1.00 | | | | $1.00 | | | | $1.00 | |
Total return (%) (r)(t) | | | 1.58 | | | | 0.76 | | | | 0.08 | (c) | | | 0.00 | | | | 0.00 | (w) |
| | | | |
Ratios (%) (to average net assets)
and Supplemental data: | | | | | | | | | | | | | | | | | |
Expenses before expense reductions (f) | | | 1.73 | | | | 1.69 | | | | 1.66 | (c) | | | 1.66 | | | | 1.67 | |
Expenses after expense reductions (f) | | | 0.72 | | | | 0.68 | | | | 0.51 | (c) | | | 0.23 | | | | 0.07 | |
Net investment income (loss) | | | 1.57 | | | | 0.72 | | | | 0.07 | (c) | | | 0.00 | | | | 0.00 | |
Net assets at end of period (000 omitted) | | | $8,977 | | | | $11,664 | | | | $17,338 | | | | $18,096 | | | | $18,831 | |
| | | | | | | | | | | | | | | | | | | | |
| Class C | | Year ended | |
| | | | | |
| | | 8/31/19 | | | 8/31/18 | | | 8/31/17 | | | 8/31/16 | | | 8/31/15 | |
Net asset value, beginning of period | | | $1.00 | | | | $1.00 | | | | $1.00 | | | | $1.00 | | | | $1.00 | |
| | | | |
| Income (loss) from investment operations | | | | | | | | | | | | | | | | | |
Net investment income (loss) (d) | | | $0.02 | | | | $0.01 | | | | $0.00 | (c)(w) | | | $0.00 | | | | $0.00 | |
Net realized and unrealized gain (loss) | | | 0.00 | (w) | | | — | | | | (0.00 | )(w) | | | — | | | | 0.00 | (w) |
Total from investment operations | | | $0.02 | | | | $0.01 | | | | $0.00 | (w) | | | $0.00 | | | | $0.00 | (w) |
| | | | |
| Less distributions declared to shareholders | | | | | | | | | | | | | | | | | |
From net investment income | | | $(0.02 | ) | | | $(0.01 | ) | | | $(0.00 | )(w) | | | $— | | | | $— | |
Net asset value, end of period | | | $1.00 | | | | $1.00 | | | | $1.00 | | | | $1.00 | | | | $1.00 | |
Total return (%) (r)(t) | | | 1.58 | | | | 0.76 | | | | 0.08 | (c) | | | 0.00 | | | | 0.00 | (w) |
| | | | |
Ratios (%) (to average net assets)
and Supplemental data: | | | | | | | | | | | | | | | | | |
Expenses before expense reductions (f) | | | 1.73 | | | | 1.69 | | | | 1.66 | (c) | | | 1.66 | | | | 1.67 | |
Expenses after expense reductions (f) | | | 0.72 | | | | 0.68 | | | | 0.50 | (c) | | | 0.24 | | | | 0.07 | |
Net investment income (loss) | | | 1.57 | | | | 0.68 | | | | 0.07 | (c) | | | 0.00 | | | | 0.00 | |
Net assets at end of period (000 omitted) | | | $19,438 | | | | $18,451 | | | | $38,458 | | | | $48,749 | | | | $42,522 | |
See Notes to Financial Statements
13
Financial Highlights – continued
| | | | |
| |
| Class I | | Year ended | |
| |
| | | 8/31/19 (i) | |
Net asset value, beginning of period | | | $1.00 | |
|
| Income (loss) from investment operations | |
Net investment income (loss) (d) | | | $0.02 | |
Net realized and unrealized gain (loss) | | | 0.00 | (w) |
Total from investment operations | | | $0.02 | |
|
| Less distributions declared to shareholders | |
From net investment income | | | $(0.02 | ) |
Net asset value, end of period | | | $1.00 | |
Total return (%) (r)(t) | | | 1.52 | (n) |
|
Ratios (%) (to average net assets)
and Supplemental data: | |
Expenses before expense reductions (f) | | | 0.73 | (a) |
Expenses after expense reductions (f) | | | 0.72 | (a) |
Net investment income (loss) | | | 1.60 | (a) |
Net assets at end of period (000 omitted) | | | $56 | |
| | | | | | | | | | | | | | | | | | | | |
| Class R1 | | Year ended | |
| | | | | |
| | | 8/31/19 | | | 8/31/18 | | | 8/31/17 | | | 8/31/16 | | | 8/31/15 | |
Net asset value, beginning of period | | | $1.00 | | | | $1.00 | | | | $1.00 | | | | $1.00 | | | | $1.00 | |
| | | | |
| Income (loss) from investment operations | | | | | | | | | | | | | | | | | |
Net investment income (loss) (d) | | | $0.02 | | | | $0.01 | | | | $0.00 | (c)(w) | | | $0.00 | | | | $0.00 | |
Net realized and unrealized gain (loss) | | | 0.00 | (w) | | | — | | | | (0.00 | )(w) | | | — | | | | 0.00 | (w) |
Total from investment operations | | | $0.02 | | | | $0.01 | | | | $0.00 | (w) | | | $0.00 | | | | $0.00 | (w) |
| | | | |
| Less distributions declared to shareholders | | | | | | | | | | | | | | | | | |
From net investment income | | | $(0.02 | ) | | | $(0.01 | ) | | | $(0.00 | )(w) | | | $— | | | | $— | |
Net asset value, end of period | | | $1.00 | | | | $1.00 | | | | $1.00 | | | | $1.00 | | | | $1.00 | |
Total return (%) (r)(t) | | | 1.57 | | | | 0.76 | | | | 0.08 | (c) | | | 0.00 | | | | 0.00 | (w) |
| | | | |
Ratios (%) (to average net assets)
and Supplemental data: | | | | | | | | | | | | | | | | | |
Expenses before expense reductions (f) | | | 1.73 | | | | 1.69 | | | | 1.66 | (c) | | | 1.66 | | | | 1.67 | |
Expenses after expense reductions (f) | | | 0.72 | | | | 0.68 | | | | 0.50 | (c) | | | 0.23 | | | | 0.07 | |
Net investment income (loss) | | | 1.57 | | | | 0.72 | | | | 0.07 | (c) | | | 0.00 | | | | 0.00 | |
Net assets at end of period (000 omitted) | | | $7,610 | | | | $8,305 | | | | $12,236 | | | | $14,569 | | | | $14,363 | |
See Notes to Financial Statements
14
Financial Highlights – continued
| | | | | | | | | | | | | | | | | | | | |
| Class R2 | | Year ended | |
| | | | | |
| | | 8/31/19 | | | 8/31/18 | | | 8/31/17 | | | 8/31/16 | | | 8/31/15 | |
Net asset value, beginning of period | | | $1.00 | | | | $1.00 | | | | $1.00 | | | | $1.00 | | | | $1.00 | |
| | | | |
| Income (loss) from investment operations | | | | | | | | | | | | | | | | | |
Net investment income (loss) (d) | | | $0.02 | | | | $0.01 | | | | $0.00 | (c)(w) | | | $0.00 | | | | $0.00 | |
Net realized and unrealized gain (loss) | | | 0.00 | (w) | | | — | | | | (0.00 | )(w) | | | — | | | | 0.00 | (w) |
Total from investment operations | | | $0.02 | | | | $0.01 | | | | $0.00 | (w) | | | $0.00 | | | | $0.00 | (w) |
| | | | |
| Less distributions declared to shareholders | | | | | | | | | | | | | | | | | |
From net investment income | | | $(0.02 | ) | | | $(0.01 | ) | | | $(0.00 | )(w) | | | $— | | | | $— | |
Net asset value, end of period | | | $1.00 | | | | $1.00 | | | | $1.00 | | | | $1.00 | | | | $1.00 | |
Total return (%) (r)(t) | | | 1.57 | | | | 0.76 | | | | 0.08 | (c) | | | 0.00 | | | | 0.00 | (w) |
| | | | |
Ratios (%) (to average net assets)
and Supplemental data: | | | | | | | | | | | | | | | | | |
Expenses before expense reductions (f) | | | 1.23 | | | | 1.19 | | | | 1.16 | (c) | | | 1.16 | | | | 1.17 | |
Expenses after expense reductions (f) | | | 0.72 | | | | 0.68 | | | | 0.51 | (c) | | | 0.23 | | | | 0.07 | |
Net investment income (loss) | | | 1.57 | | | | 0.73 | | | | 0.08 | (c) | | | 0.00 | | | | 0.00 | |
Net assets at end of period (000 omitted) | | | $31,672 | | | | $34,993 | | | | $48,184 | | | | $51,537 | | | | $53,058 | |
| | | | | | | | | | | | | | | | | | | | |
| Class R3 | | Year ended | |
| | | | | |
| | | 8/31/19 | | | 8/31/18 | | | 8/31/17 | | | 8/31/16 | | | 8/31/15 | |
Net asset value, beginning of period | | | $1.00 | | | | $1.00 | | | | $1.00 | | | | $1.00 | | | | $1.00 | |
| | | | |
| Income (loss) from investment operations | | | | | | | | | | | | | | | | | |
Net investment income (loss) (d) | | | $0.02 | | | | $0.01 | | | | $0.00 | (c)(w) | | | $0.00 | | | | $0.00 | |
Net realized and unrealized gain (loss) | | | 0.00 | (w) | | | — | | | | (0.00 | )(w) | | | — | | | | 0.00 | (w) |
Total from investment operations | | | $0.02 | | | | $0.01 | | | | $0.00 | (w) | | | $0.00 | | | | $0.00 | (w) |
| | | | |
| Less distributions declared to shareholders | | | | | | | | | | | | | | | | | |
From net investment income | | | $(0.02 | ) | | | $(0.01 | ) | | | $(0.00 | )(w) | | | $— | | | | $— | |
Net asset value, end of period | | | $1.00 | | | | $1.00 | | | | $1.00 | | | | $1.00 | | | | $1.00 | |
Total return (%) (r)(t) | | | 1.57 | | | | 0.76 | | | | 0.08 | (c) | | | 0.00 | | | | 0.00 | (w) |
| | | | |
Ratios (%) (to average net assets)
and Supplemental data: | | | | | | | | | | | | | | | | | |
Expenses before expense reductions (f) | | | 0.98 | | | | 0.94 | | | | 0.91 | (c) | | | 0.91 | | | | 0.92 | |
Expenses after expense reductions (f) | | | 0.72 | | | | 0.68 | | | | 0.51 | (c) | | | 0.23 | | | | 0.07 | |
Net investment income (loss) | | | 1.55 | | | | 0.73 | | | | 0.08 | (c) | | | 0.00 | | | | 0.00 | |
Net assets at end of period (000 omitted) | | | $16,471 | | | | $26,227 | | | | $35,196 | | | | $37,650 | | | | $44,872 | |
See Notes to Financial Statements
15
Financial Highlights – continued
| | | | | | | | | | | | | | | | | | | | |
| Class R4 | | Year ended | |
| | | | | |
| | | 8/31/19 | | | 8/31/18 | | | 8/31/17 | | | 8/31/16 | | | 8/31/15 | |
Net asset value, beginning of period | | | $1.00 | | | | $1.00 | | | | $1.00 | | | | $1.00 | | | | $1.00 | |
| | | | |
| Income (loss) from investment operations | | | | | | | | | | | | | | | | | |
Net investment income (loss) (d) | | | $0.02 | | | | $0.01 | | | | $0.00 | (c)(w) | | | $0.00 | | | | $0.00 | |
Net realized and unrealized gain (loss) | | | 0.00 | (w) | | | — | | | | (0.00 | )(w) | | | — | | | | 0.00 | (w) |
Total from investment operations | | | $0.02 | | | | $0.01 | | | | $0.00 | (w) | | | $0.00 | | | | $0.00 | (w) |
| | | | |
| Less distributions declared to shareholders | | | | | | | | | | | | | | | | | |
From net investment income | | | $(0.02 | ) | | | $(0.01 | ) | | | $(0.00 | )(w) | | | $— | | | | $— | |
Net asset value, end of period | | | $1.00 | | | | $1.00 | | | | $1.00 | | | | $1.00 | | | | $1.00 | |
Total return (%) (r)(t) | | | 1.57 | | | | 0.76 | | | | 0.08 | (c) | | | 0.00 | | | | 0.00 | (w) |
| | | | |
Ratios (%) (to average net assets)
and Supplemental data: | | | | | | | | | | | | | | | | | |
Expenses before expense reductions (f) | | | 0.73 | | | | 0.69 | | | | 0.67 | (c) | | | 0.66 | | | | 0.67 | |
Expenses after expense reductions (f) | | | 0.72 | | | | 0.68 | | | | 0.52 | (c) | | | 0.23 | | | | 0.07 | |
Net investment income (loss) | | | 1.57 | | | | 0.74 | | | | 0.08 | (c) | | | 0.00 | | | | 0.00 | |
Net assets at end of period (000 omitted) | | | $2,676 | | | | $2,729 | | | | $3,250 | | | | $3,077 | | | | $3,034 | |
| | | | |
| Class R6 | | Year ended | |
| |
| | | 8/31/19 (i) | |
Net asset value, beginning of period | | | $1.00 | |
|
| Income (loss) from investment operations | |
Net investment income (loss) (d) | | | $0.02 | |
Net realized and unrealized gain (loss) | | | 0.00 | (w) |
Total from investment operations | | | $0.02 | |
|
| Less distributions declared to shareholders | |
From net investment income | | | $(0.02 | ) |
Net asset value, end of period | | | $1.00 | |
Total return (%) (r)(t) | | | 1.58 | (n) |
|
Ratios (%) (to average net assets)
and Supplemental data: | |
Expenses before expense reductions (f) | | | 0.66 | (a) |
Expenses after expense reductions (f) | | | 0.65 | (a) |
Net investment income (loss) | | | 1.65 | (a) |
Net assets at end of period (000 omitted) | | | $54 | |
See Notes to Financial Statements
16
Financial Highlights – continued
| | | | | | | | | | | | | | | | | | | | |
| Class 529A | | Year ended | |
| | | | | |
| | | 8/31/19 | | | 8/31/18 | | | 8/31/17 | | | 8/31/16 | | | 8/31/15 | |
Net asset value, beginning of period | | | $1.00 | | | | $1.00 | | | | $1.00 | | | | $1.00 | | | | $1.00 | |
| | | | |
| Income (loss) from investment operations | | | | | | | | | | | | | | | | | |
Net investment income (loss) (d) | | | $0.02 | | | | $0.01 | | | | $0.00 | (c)(w) | | | $0.00 | | | | $0.00 | |
Net realized and unrealized gain (loss) | | | 0.00 | (w) | | | — | | | | (0.00 | )(w) | | | — | | | | 0.00 | (w) |
Total from investment operations | | | $0.02 | | | | $0.01 | | | | $0.00 | (w) | | | $0.00 | | | | $0.00 | (w) |
| | | | |
| Less distributions declared to shareholders | | | | | | | | | | | | | | | | | |
From net investment income | | | $(0.02 | ) | | | $(0.01 | ) | | | $(0.00 | )(w) | | | $— | | | | $— | |
Net asset value, end of period | | | $1.00 | | | | $1.00 | | | | $1.00 | | | | $1.00 | | | | $1.00 | |
Total return (%) (r)(t) | | | 1.53 | | | | 0.71 | | | | 0.06 | (c) | | | 0.00 | | | | 0.00 | (w) |
| | | | |
Ratios (%) (to average net assets)
and Supplemental data: | | | | | | | | | | | | | | | | | |
Expenses before expense reductions (f) | | | 1.03 | | | | 1.00 | | | | 1.01 | (c) | | | 1.00 | | | | 1.02 | |
Expenses after expense reductions (f) | | | 0.77 | | | | 0.73 | | | | 0.53 | (c) | | | 0.23 | | | | 0.07 | |
Net investment income (loss) | | | 1.52 | | | | 0.73 | | | | 0.06 | (c) | | | 0.00 | | | | 0.00 | |
Net assets at end of period (000 omitted) | | | $19,061 | | | | $15,197 | | | | $13,208 | | | | $12,841 | | | | $11,383 | |
| | | | | | | | | | | | | | | | | | | | |
| Class 529B | | Year ended | |
| | | | | |
| | | 8/31/19 | | | 8/31/18 | | | 8/31/17 | | | 8/31/16 | | | 8/31/15 | |
Net asset value, beginning of period | | | $1.00 | | | | $1.00 | | | | $1.00 | | | | $1.00 | | | | $1.00 | |
| | | | |
| Income (loss) from investment operations | | | | | | | | | | | | | | | | | |
Net investment income (loss) (d) | | | $0.02 | | | | $0.01 | | | | $0.00 | (c)(w) | | | $0.00 | | | | $0.00 | |
Net realized and unrealized gain (loss) | | | 0.00 | (w) | | | — | | | | (0.00 | )(w) | | | — | | | | 0.00 | (w) |
Total from investment operations | | | $0.02 | | | | $0.01 | | | | $0.00 | (w) | | | $0.00 | | | | $0.00 | (w) |
| | | | |
| Less distributions declared to shareholders | | | | | | | | | | | | | | | | | |
From net investment income | | | $(0.02 | ) | | | $(0.01 | ) | | | $(0.00 | )(w) | | | $— | | | | $— | |
Net asset value, end of period | | | $1.00 | | | | $1.00 | | | | $1.00 | | | | $1.00 | | | | $1.00 | |
Total return (%) (r)(t) | | | 1.53 | | | | 0.71 | | | | 0.06 | (c) | | | 0.00 | | | | 0.00 | (w) |
| | | | |
Ratios (%) (to average net assets)
and Supplemental data: | | | | | | | | | | | | | | | | | |
Expenses before expense reductions (f) | | | 1.78 | | | | 1.75 | | | | 1.76 | (c) | | | 1.76 | | | | 1.77 | |
Expenses after expense reductions (f) | | | 0.77 | | | | 0.73 | | | | 0.53 | (c) | | | 0.22 | | | | 0.07 | |
Net investment income (loss) | | | 1.51 | | | | 0.71 | | | | 0.06 | (c) | | | 0.00 | | | | 0.00 | |
Net assets at end of period (000 omitted) | | | $247 | | | | $293 | | | | $348 | | | | $355 | | | | $440 | |
See Notes to Financial Statements
17
Financial Highlights – continued
| | | | | | | | | | | | | | | | | | | | |
| Class 529C | | Year ended | |
| | | | | |
| | | 8/31/19 | | | 8/31/18 | | | 8/31/17 | | | 8/31/16 | | | 8/31/15 | |
Net asset value, beginning of period | | | $1.00 | | | | $1.00 | | | | $1.00 | | | | $1.00 | | | | $1.00 | |
| | | | |
| Income (loss) from investment operations | | | | | | | | | | | | | | | | | |
Net investment income (loss) (d) | | | $0.02 | | | | $0.01 | | | | $0.00 | (c)(w) | | | $0.00 | | | | $0.00 | |
Net realized and unrealized gain (loss) | | | 0.00 | (w) | | | — | | | | (0.00 | )(w) | | | — | | | | 0.00 | (w) |
Total from investment operations | | | $0.02 | | | | $0.01 | | | | $0.00 | (w) | | | $0.00 | | | | $0.00 | (w) |
| | | | |
| Less distributions declared to shareholders | | | | | | | | | | | | | | | | | |
From net investment income | | | $(0.02 | ) | | | $(0.01 | ) | | | $(0.00 | )(w) | | | $— | | | | $— | |
Net asset value, end of period | | | $1.00 | | | | $1.00 | | | | $1.00 | | | | $1.00 | | | | $1.00 | |
Total return (%) (r)(t) | | | 1.53 | | | | 0.71 | | | | 0.06 | (c) | | | 0.00 | | | | 0.00 | (w) |
| | | | |
Ratios (%) (to average net assets)
and Supplemental data: | | | | | | | | | | | | | | | | | |
Expenses before expense reductions (f) | | | 1.78 | | | | 1.75 | | | | 1.76 | (c) | | | 1.76 | | | | 1.77 | |
Expenses after expense reductions (f) | | | 0.77 | | | | 0.73 | | | | 0.54 | (c) | | | 0.24 | | | | 0.07 | |
Net investment income (loss) | | | 1.52 | | | | 0.70 | | | | 0.06 | (c) | | | 0.00 | | | | 0.00 | |
Net assets at end of period (000 omitted) | | | $6,437 | | | | $6,419 | | | | $6,957 | | | | $6,728 | | | | $5,866 | |
| (c) | Amount reflects aone-time reimbursement of expenses by the custodian (or former custodian) without which net investment income and performance would be lower and expenses would be higher. |
| (d) | Per share data is based on average shares outstanding. |
| (f) | Ratios do not reflect reductions from fees paid indirectly, if applicable. |
| (i) | For Class I and Class R6, the period is from the class inception, September 18, 2018, through the stated period end. |
| (r) | Certain expenses have been reduced without which performance would have been lower. |
| (t) | Total returns do not include any applicable sales charges. |
| (w) | Per share amount was less than $0.01 and total return or ratio was less than 0.01%, as applicable. |
See Notes to Financial Statements
18
NOTES TO FINANCIAL STATEMENTS
(1) Business and Organization
MFS U.S. Government Cash Reserve Fund (the fund) is a diversified series of MFS Series Trust I (the trust). The trust is organized as a Massachusetts business trust and is registered under the Investment Company Act of 1940, as amended, as anopen-end management investment company.
The fund is an investment company and accordingly follows the investment company accounting and reporting guidance of the Financial Accounting Standards Board (FASB) Accounting Standards Codification Topic 946 Financial Services – Investment Companies.
(2) Significant Accounting Policies
General– The preparation of financial statements in conformity with U.S. generally accepted accounting principles requires management to make estimates and assumptions that affect the reported amounts of assets and liabilities, and disclosure of contingent assets and liabilities at the date of the financial statements and the reported amounts of increases and decreases in net assets from operations during the reporting period. Actual results could differ from those estimates. In the preparation of these financial statements, management has evaluated subsequent events occurring after the date of the fund’s Statement of Assets and Liabilities through the date that the financial statements were issued.
Balance Sheet Offsetting– The fund’s accounting policy with respect to balance sheet offsetting is that, absent an event of default by the counterparty or a termination of the agreement, the International Swaps and Derivatives Association (ISDA) Master Agreement, or similar agreement, does not result in an offset of reported amounts of financial assets and financial liabilities in the Statement of Assets and Liabilities across transactions between the fund and the applicable counterparty. The fund’s right to setoff may be restricted or prohibited by the bankruptcy or insolvency laws of the particular jurisdiction to which a specific master netting agreement counterparty is subject. Balance sheet offsetting disclosures, to the extent applicable to the fund, have been included in the fund’s Significant Accounting Policies note under the captions for each of the fund’sin-scope financial instruments and transactions.
Investment Valuations– Pursuant to procedures approved by the Board of Trustees, investments held by the fund are generally valued at amortized cost, which approximates market value. Amortized cost involves valuing an instrument at its cost as adjusted for amortization of premium or accretion of discount rather than its current market value. The amortized cost value of an instrument can be different from the market value of an instrument.
Various inputs are used in determining the value of the fund’s assets or liabilities. These inputs are categorized into three broad levels. In certain cases, the inputs used to measure fair value may fall into different levels of the fair value hierarchy. In such cases, an investment’s level within the fair value hierarchy is based on the lowest level of input that is significant to the fair value measurement. The fund’s assessment of the significance of a particular input to the fair value measurement in its entirety requires judgment, and considers factors specific to the investment. Level 1 includes unadjusted
19
Notes to Financial Statements – continued
quoted prices in active markets for identical assets or liabilities. Level 2 includes other significant observable market-based inputs (including quoted prices for similar securities, interest rates, prepayment speed, and credit risk). Level 3 includes unobservable inputs, which may include the adviser’s own assumptions in determining the fair value of investments. The following is a summary of the levels used as of August 31, 2019 in valuing the fund’s assets or liabilities:
| | | | | | | | | | | | | | | | |
| | | | |
| Financial Instruments | | Level 1 | | | Level 2 | | | Level 3 | | | Total | |
| Short-Term Securities | | | $— | | | | $211,858,711 | | | | $— | | | | $211,858,711 | |
For further information regarding security characteristics, see the Portfolio of Investments.
Repurchase Agreements– The fund enters into repurchase agreements under the terms of Master Repurchase Agreements with approved counterparties. Each repurchase agreement is recorded at cost. The fund requires that the securities collateral in a repurchase transaction be transferred to a custodian. The fund monitors, on a daily basis, the value of the collateral to ensure that its value, including accrued interest, is greater than amounts owed to the fund under each such repurchase agreement. Upon an event of default under a Master Repurchase Agreement, thenon-defaulting party may close out all transactions traded under such agreement and net amounts owed under each transaction to one net amount payable by one party to the other. Absent an event of default, the Master Repurchase Agreement does not result in an offset of reported amounts of assets and liabilities in the Statement of Assets and Liabilities across transactions between the fund and the applicable counterparty. The fund and other funds managed by MFS may utilize a joint trading account for the purpose of entering into one or more repurchase agreements. At August 31, 2019, the fund had investments in repurchase agreements with a gross value of $10,972,000 included in investments in unaffiliated issuers in the Statement of Assets and Liabilities. The value of the related collateral exceeded the value of the repurchase agreements at period end.
Indemnifications– Under the fund’s organizational documents, its officers and Trustees may be indemnified against certain liabilities and expenses arising out of the performance of their duties to the fund. Additionally, in the normal course of business, the fund enters into agreements with service providers that may contain indemnification clauses. The fund’s maximum exposure under these agreements is unknown as this would involve future claims that may be made against the fund that have not yet occurred.
Investment Transactions and Income– Investment transactions are recorded on the trade date. Interest income is recorded on the accrual basis. All premium and discount is amortized or accreted for financial statement purposes in accordance with U.S. generally accepted accounting principles.
Tax Matters and Distributions– The fund intends to qualify as a regulated investment company, as defined under Subchapter M of the Internal Revenue Code, and to distribute all of its taxable income, including realized capital gains. As a result, no provision for federal income tax is required. The fund’s federal tax returns, when filed, will remain subject to examination by the Internal Revenue Service for a
20
Notes to Financial Statements – continued
three year period. Management has analyzed the fund’s tax positions taken on federal and state tax returns for all open tax years and does not believe that there are any uncertain tax positions that require recognition of a tax liability.
Distributions to shareholders are recorded on theex-dividend date. Income and capital gain distributions are determined in accordance with income tax regulations, which may differ from U.S. generally accepted accounting principles. Certain capital accounts in the financial statements are periodically adjusted for permanent differences in order to reflect their tax character. These adjustments have no impact on net assets or net asset value per share. Temporary differences which arise from recognizing certain items of income, expense, gain or loss in different periods for financial statement and tax purposes will reverse at some time in the future. Distributions in excess of net investment income or net realized gains are temporary overdistributions for financial statement purposes resulting from differences in the recognition or classification of income or distributions for financial statement and tax purposes.
During the year ended August 31, 2019, there were no significant adjustments due to differences between book and tax accounting.
The tax character of distributions declared to shareholders for the last two fiscal years is as follows:
| | | | | | | | |
| | |
| | | Year ended
8/31/19 | | | Year ended
8/31/18 | |
| Ordinary income (including anyshort-term capital gains) | | | $3,428,422 | | | | $1,815,726 | |
The federal tax cost and the tax basis components of distributable earnings were as follows:
| | | | |
| |
| As of 8/31/19 | | | |
| |
| Cost of investments | | | $211,858,711 | |
| Capital loss carryforwards | | | (4 | ) |
| Other temporary differences | | | (7,522 | ) |
As of August 31, 2019, the fund had capital loss carryforwards available to offset future realized gains. These net capital losses may be carried forward indefinitely and their character is retained as short-term and/or long-term losses. Such losses are characterized as follows:
Multiple Classes of Shares of Beneficial Interest– The fund offers multiple classes of shares, which differ in their respective distribution, service, and program manager fees. The fund’s income and common expenses are allocated to shareholders based on the value of settled shares outstanding of each class. The fund’s realized and unrealized gain (loss) are allocated to shareholders based on the daily net assets of each class. Dividends are declared separately for each class. Differences in per share dividend rates are generally due to differences in separate class expenses. Class B and Class 529B shares will convert to Class A and Class 529A shares, respectively, approximately eight years after purchase. Class C and Class 529C shares will convert to Class A and
21
Notes to Financial Statements – continued
Class 529A shares, respectively, approximately ten years after purchase. The fund’s
distributions declared to shareholders as reported in the Statements of Changes in Net Assets are presented by class as follows:
| | | | | | | | |
| | | From net investment
income | |
| | |
| | | Year
ended
8/31/19 (i) | | | Year
ended
8/31/18 | |
| Class A | | | $1,584,216 | | | | $762,528 | |
| Class B | | | 162,414 | | | | 105,124 | |
| Class C | | | 317,540 | | | | 199,742 | |
| Class I | | | 1,185 | | | | — | |
| Class R1 | | | 127,647 | | | | 68,974 | |
| Class R2 | | | 527,732 | | | | 288,493 | |
| Class R3 | | | 291,144 | | | | 218,089 | |
| Class R4 | | | 42,820 | | | | 21,305 | |
| Class R6 | | | 819 | | | | — | |
| Class 529A | | | 268,010 | | | | 100,631 | |
| Class 529B | | | 3,915 | | | | 2,240 | |
| Class 529C | | | 100,980 | | | | 48,600 | |
| Total | | | $3,428,422 | | | | $1,815,726 | |
| (i) | For Class I and Class R6, the period is from the class inception, September 18, 2018, through the stated period end. |
(3) Transactions with Affiliates
Investment Adviser– The fund has an investment advisory agreement with MFS to provide overall investment management and related administrative services and facilities to the fund. The management fee is computed daily and paid monthly at an annual rate of 0.40% of the fund’s average daily net assets.
MFS has also agreed in writing to reduce its management fee by a specified amount if certain MFS mutual fund assets exceed thresholds agreed to by MFS and the fund’s Board of Trustees. For the year ended August 31, 2019, this management fee reduction amounted to $21,283, which is included in the reduction of total expenses in the Statement of Operations. The management fee incurred for the year ended August 31, 2019 was equivalent to an annual effective rate of 0.39% of the fund’s average daily net assets.
Distributor– The Board of Trustees has adopted a distribution plan for certain share classes pursuant to Rule12b-1 of the Investment Company Act of 1940.
The fund’s distribution plan provides that the fund will pay MFS Fund Distributors, Inc. (MFD), a wholly-owned subsidiary of MFS, for services provided by MFD and financial intermediaries in connection with the distribution and servicing of certain share classes. One component of the plan is a distribution fee paid to MFD and another component of the plan is a service fee paid to MFD. MFD may subsequently pay all, or a portion, of the distribution and/or service fees to financial intermediaries.
22
Notes to Financial Statements – continued
Distribution Plan Fee Table:
| | | | | | | | | | | | | | | | | | | | |
| | | | | |
| | | Distribution
Fee Rate (d) | | | Service
Fee Rate (d) | | | Total
Distribution
Plan (d) | | | Annual
Effective
Rate (e) | | | Distribution
and Service
Fee | |
| Class A | | | — | | | | 0.25% | | | | 0.25% | | | | 0.00% | | | | $252,246 | |
| Class B | | | 0.75% | | | | 0.25% | | | | 1.00% | | | | 0.00% | | | | 103,535 | |
| Class C | | | 0.75% | | | | 0.25% | | | | 1.00% | | | | 0.00% | | | | 201,626 | |
| Class R1 | | | 0.75% | | | | 0.25% | | | | 1.00% | | | | 0.00% | | | | 81,355 | |
| Class R2 | | | 0.25% | | | | 0.25% | | | | 0.50% | | | | 0.00% | | | | 168,263 | |
| Class R3 | | | — | | | | 0.25% | | | | 0.25% | | | | 0.00% | | | | 46,934 | |
| Class 529A | | | — | | | | 0.25% | | | | 0.25% | | | | 0.00% | | | | 44,024 | |
| Class 529B | | | 0.75% | | | | 0.25% | | | | 1.00% | | | | 0.00% | | | | 2,587 | |
| Class 529C | | | 0.75% | | | | 0.25% | | | | 1.00% | | | | 0.00% | | | | 66,412 | |
| Total Distribution and Service Fees | | | | | | | | | | | | $966,982 | |
| (d) | In accordance with the distribution plan for certain classes, the fund pays distribution and/or service fees equal to these annual percentage rates of each class’s average daily net assets. The distribution and service fee rates disclosed by class represent the current rates in effect at the end of the reporting period. Any rate changes, if applicable, are detailed below. |
| (e) | The annual effective rates represent actual fees incurred under the distribution plan for the year ended August 31, 2019 based on each class’s average daily net assets. MFD has agreed in writing to waive any distribution and/or service fees for Class A, Class B, Class C, Class R1, Class R2, Class R3, Class 529A, Class 529B, and Class 529C. This written agreement will continue until modified by the fund’s Board of Trustees, but such agreement will continue until at least December 31, 2020. These reductions, for the year ended August 31, 2019, for Class A, Class B, Class C, Class R1, Class R2, Class R3, Class 529A, Class 529B, and Class 529C amounted to $252,246, $103,535, $201,626, $81,355, $168,263, $46,934, $44,024, $2,587, and $66,412, respectively, and are included in the reduction of total expenses in the Statement of Operations. |
Certain Class A shares are subject to a contingent deferred sales charge (CDSC) in the event of a shareholder redemption within 18 months of purchase. Class B and Class 529B shares are subject to a CDSC in the event of a shareholder redemption within six years of purchase. Class C and Class 529C shares are subject to a CDSC in the event of a shareholder redemption within 12 months of purchase. All contingent deferred sales charges are paid to MFD and during the year ended August 31, 2019, were as follows:
| | | | |
| |
| | | Amount | |
| Class A | | | $28,935 | |
| Class B | | | 44,347 | |
| Class C | | | 6,367 | |
| Class 529B | | | 465 | |
| Class 529C | | | 316 | |
The fund has entered into and may from time to time enter into contracts with program managers and other parties which administer the tuition programs through which an investment in the fund’s 529 share classes is made. The fund has entered into an agreement with MFD pursuant to which MFD receives an annual fee of up to 0.05% of the average daily net assets attributable to each 529 share class. The services provided by MFD, or a third party with which MFD contracts, include recordkeeping
23
Notes to Financial Statements – continued
and tax reporting and account services, as well as services designed to maintain the program’s compliance with the Internal Revenue Code and other regulatory requirements. Program manager fees for the year ended August 31, 2019, were as follows:
| | | | |
| |
| | | Fee | |
| Class 529A | | | $8,805 | |
| Class 529B | | | 129 | |
| Class 529C | | | 3,321 | |
| Total Program Manager Fees | | | $12,255 | |
Shareholder Servicing Agent– MFS Service Center, Inc. (MFSC), a wholly-owned subsidiary of MFS, receives a fee from the fund for its services as shareholder servicing agent calculated as a percentage of the average daily net assets of the fund as determined periodically under the supervision of the fund’s Board of Trustees. For the year ended August 31, 2019, the fee was $143,299, which equated to 0.0653% annually of the fund’s average daily net assets. MFSC also receives payment from the fund forout-of-pocket expenses,sub-accounting and other shareholder servicing costs which may be paid to affiliated and unaffiliated service providers. Class R6 shares do not incursub-accounting fees. For the year ended August 31, 2019, theseout-of-pocket expenses,sub-accounting and other shareholder servicing costs amounted to $252,105.
Administrator– MFS provides certain financial, legal, shareholder communications, compliance, and other administrative services to the fund. Under an administrative services agreement, the fund reimburses MFS the costs incurred to provide these services. The fund is charged an annual fixed amount of $17,500 plus a fee based on average daily net assets. The administrative services fee incurred for the year ended August 31, 2019 was equivalent to an annual effective rate of 0.0183% of the fund’s average daily net assets.
Trustees’ and Officers’ Compensation– The fund pays compensation to independent Trustees in the form of a retainer, attendance fees, and additional compensation to Board and Committee chairpersons. The fund does not pay compensation directly to Trustees or officers of the fund who are also officers of the investment adviser, all of whom receive remuneration from MFS for their services to the fund. Certain officers and Trustees of the fund are officers or directors of MFS, MFD, and MFSC.
Prior to December 31, 2001, the fund had an unfunded defined benefit plan (“DB plan”) for independent Trustees. As of December 31, 2001, the Board took action to terminate the DB plan with respect to then-current and any future independent Trustees, such that the DB plan covers only certain of those former independent Trustees who retired on or before December 31, 2001. The DB plan resulted in a pension expense of $1,624 and is included in “Independent Trustees’ compensation” in the Statement of Operations for the year ended August 31, 2019. The liability for deferred retirement benefits payable to those former independent Trustees under the DB plan amounted to $3,981 at August 31, 2019, and is included in “Payable for independent Trustees’ compensation” in the Statement of Assets and Liabilities.
24
Notes to Financial Statements – continued
Other– This fund and certain other funds managed by MFS (the funds) had entered into a service agreement (the ISO Agreement) which provided for payment of fees solely by the funds to Tarantino LLC in return for the provision of services of an Independent Senior Officer (ISO) for the funds. Frank L. Tarantino served as the ISO and was an officer of the funds and the sole member of Tarantino LLC. Effective June 30, 2019, Mr. Tarantino retired from his position as ISO for the funds, and the ISO Agreement was terminated. For the year ended August 31, 2019, the fee paid by the fund under this agreement was $397 and is included in “Miscellaneous” expense in the Statement of Operations. MFS had agreed to bear all expenses associated with office space, other administrative support, and supplies provided to the ISO.
On September 17, 2018, MFS purchased 50,000 shares of Class I for an aggregate amount of $50,000 and 50,000 shares of Class R6 for an aggregate amount of $50,000 as an initial investment in the class.
At August 31, 2019, MFS held approximately 99%, 93%, and 90% of the outstanding shares of Class R4, Class R6, and Class I, respectively.
(4) Shares of Beneficial Interest
The fund’s Declaration of Trust permits the Trustees to issue an unlimited number of full and fractional shares of beneficial interest. The number of shares sold, reinvested and reacquired corresponds to the net proceeds from the sale of shares, reinvestment of distributions and cost of shares reacquired, respectively, since shares are sold and reacquired at $1.00 per share. Transactions in fund shares were as follows:
| | | | | | | | |
| | | Year ended
8/31/19 (i) | | | Year ended
8/31/18 | |
| Shares sold | | | | | | | | |
Class A | | | 59,431,027 | | | | 50,403,828 | |
Class B | | | 5,310,326 | | | | 5,082,750 | |
Class C | | | 24,050,108 | | | | 16,082,381 | |
Class I | | | 354,368 | | | | — | |
Class R1 | | | 2,191,482 | | | | 2,510,582 | |
Class R2 | | | 10,113,188 | | | | 9,654,539 | |
Class R3 | | | 8,456,459 | | | | 9,589,275 | |
Class R4 | | | 17,622 | | | | 88,457 | |
Class R6 | | | 72,440 | | | | — | |
Class 529A | | | 12,190,039 | | | | 8,912,194 | |
Class 529B | | | 126,828 | | | | 203,096 | |
Class 529C | | | 3,281,304 | | | | 3,549,891 | |
| | | 125,595,191 | | | | 106,076,993 | |
25
Notes to Financial Statements – continued
| | | | | | | | |
| | | Year ended
8/31/19 (i) | | | Year ended
8/31/18 | |
Shares issued to shareholders in
reinvestment of distributions | | | | | | | | |
Class A | | | 1,537,241 | | | | 738,779 | |
Class B | | | 152,269 | | | | 99,285 | |
Class C | | | 307,001 | | | | 190,726 | |
Class I | | | 888 | | | | — | |
Class R1 | | | 127,564 | | | | 68,975 | |
Class R2 | | | 527,539 | | | | 288,942 | |
Class R3 | | | 291,144 | | | | 218,049 | |
Class R4 | | | 42,820 | | | | 21,171 | |
Class R6 | | | 819 | | | | — | |
Class 529A | | | 266,573 | | | | 100,031 | |
Class 529B | | | 3,891 | | | | 2,210 | |
Class 529C | | | 100,345 | | | | 48,180 | |
| | | 3,358,094 | | | | 1,776,348 | |
| | |
| Shares reacquired | | | | | | | | |
Class A | | | (61,915,466 | ) | | | (56,520,250 | ) |
Class B | | | (8,152,109 | ) | | | (10,860,547 | ) |
Class C | | | (23,369,100 | ) | | | (36,291,473 | ) |
Class I | | | (299,368 | ) | | | — | |
Class R1 | | | (3,014,203 | ) | | | (6,511,979 | ) |
Class R2 | | | (13,961,909 | ) | | | (23,138,962 | ) |
Class R3 | | | (18,513,241 | ) | | | (18,779,075 | ) |
Class R4 | | | (113,448 | ) | | | (629,737 | ) |
Class R6 | | | (18,755 | ) | | | — | |
Class 529A | | | (8,587,889 | ) | | | (7,018,022 | ) |
Class 529B | | | (176,267 | ) | | | (260,288 | ) |
Class 529C | | | (3,362,980 | ) | | | (4,134,238 | ) |
| | | (141,484,735 | ) | | | (164,144,571 | ) |
| | |
| Net change | | | | | | | | |
Class A | | | (947,198 | ) | | | (5,377,643 | ) |
Class B | | | (2,689,514 | ) | | | (5,678,512 | ) |
Class C | | | 988,009 | | | | (20,018,366 | ) |
Class I | | | 55,888 | | | | — | |
Class R1 | | | (695,157 | ) | | | (3,932,422 | ) |
Class R2 | | | (3,321,182 | ) | | | (13,195,481 | ) |
Class R3 | | | (9,765,638 | ) | | | (8,971,751 | ) |
Class R4 | | | (53,006 | ) | | | (520,109 | ) |
Class R6 | | | 54,504 | | | | — | |
Class 529A | | | 3,868,723 | | | | 1,994,203 | |
Class 529B | | | (45,548 | ) | | | (54,982 | ) |
Class 529C | | | 18,669 | | | | (536,167 | ) |
| | | (12,531,450 | ) | | | (56,291,230 | ) |
| (i) | For Class I and Class R6, the period is from the class inception, September 18, 2018, through the stated period end. |
26
Notes to Financial Statements – continued
Effective June 1, 2019, purchases of the fund’s Class B and Class 529B shares are closed to new and existing investors subject to certain exceptions. Please see the fund’s prospectus for details.
(5) Line of Credit
The fund and certain other funds managed by MFS participate in a $1.25 billion unsecured committed line of credit, subject to a $1 billion sublimit, provided by a syndicate of banks under a credit agreement. Borrowings may be made for temporary financing needs. Interest is charged to each fund, based on its borrowings, generally at a rate equal to the highest of one month LIBOR, the Federal Funds Effective Rate and the Overnight Bank Funding Rate, plus an agreed upon spread. A commitment fee, based on the average daily, unused portion of the committed line of credit, is allocated among the participating funds. In addition, the fund and other funds managed by MFS have established unsecured uncommitted borrowing arrangements with certain banks for temporary financing needs. Interest is charged to each fund, based on its borrowings, at rates equal to customary reference rates plus an agreed upon spread. For the year ended August 31, 2019, the fund’s commitment fee and interest expense were $1,365 and $0, respectively, and are included in “Miscellaneous” expense in the Statement of Operations.
27
REPORT OF INDEPENDENT REGISTERED PUBLIC ACCOUNTING FIRM
To the Board of Trustees of MFS Series Trust I and the Shareholders of MFS U.S. Government Cash Reserve Fund:
Opinion on the Financial Statements and Financial Highlights
We have audited the accompanying statement of assets and liabilities of MFS U.S. Government Cash Reserve Fund (the “Fund”), including the portfolio of investments, as of August 31, 2019, the related statement of operations for the year then ended, the statements of changes in net assets for each of the two years in the period then ended, the financial highlights for each of the five years in the period then ended, and the related notes. In our opinion, the financial statements and financial highlights present fairly, in all material respects, the financial position of the Fund as of August 31, 2019, and the results of its operations for the year then ended, the changes in its net assets for each of the two years in the period then ended, and the financial highlights for each of the five years in the period then ended, in conformity with accounting principles generally accepted in the United States of America.
Basis for Opinion
These financial statements and financial highlights are the responsibility of the Fund’s management. Our responsibility is to express an opinion on the Fund’s financial statements and financial highlights based on our audits. We are a public accounting firm registered with the Public Company Accounting Oversight Board (United States) (PCAOB) and are required to be independent with respect to the Fund in accordance with the U.S. federal securities laws and the applicable rules and regulations of the Securities and Exchange Commission and the PCAOB.
We conducted our audits in accordance with the standards of the PCAOB. Those standards require that we plan and perform the audit to obtain reasonable assurance about whether the financial statements and financial highlights are free of material misstatement, whether due to error or fraud. The Fund is not required to have, nor were we engaged to perform, an audit of its internal control over financial reporting. As part of our audits we are required to obtain an understanding of internal control over financial reporting but not for the purpose of expressing an opinion on the effectiveness of the Fund’s internal control over financial reporting. Accordingly, we express no such opinion.
Our audits included performing procedures to assess the risks of material misstatement of the financial statements and financial highlights, whether due to error or fraud, and performing procedures that respond to those risks. Such procedures included examining, on a test basis, evidence regarding the amounts and disclosures in the financial statements and financial highlights. Our audits also included evaluating the accounting principles used and significant estimates made by management, as well as evaluating the overall presentation of the financial statements and financial highlights.
28
Report of Independent Registered Public Accounting Firm – continued
Our procedures included confirmation of securities owned as of August 31, 2019, by correspondence with the custodian and brokers. We believe that our audits provide a reasonable basis for our opinion.
DELOITTE & TOUCHE LLP
Boston, Massachusetts
October 17, 2019
We have served as the auditor of one or more of the MFS investment companies since 1924.
29
TRUSTEES AND OFFICERS — IDENTIFICATION AND BACKGROUND
The Trustees and Officers of the Trust, as of October 1, 2019, are listed below, together with their principal occupations during the past five years. (Their titles may have varied during that period.) The address of each Trustee and Officer is 111 Huntington Avenue, Boston, Massachusetts 02199-7618.
| | | | | | | | | | |
Name, Age | | Position(s)
Held
with Fund | | Trustee/Officer
Since (h) | | Number of
MFS Funds
overseen
by the
Trustee | | Principal
Occupations During the Past Five Years | | Other
Directorships
During the Past
Five Years (j) |
| INTERESTED TRUSTEES |
Robert J. Manning (k)
(age 55) | | Trustee | | February 2004 | | 135 | | Massachusetts Financial Services Company, Executive Chairman (since January 2017); Director; Chairman of the Board; Chief Executive Officer (until 2015);Co-Chief Executive Officer (2015-2016) | | N/A |
| | | | | |
Robin A. Stelmach (k) (age 58) | | Trustee | | January 2014 | | 135 | | Massachusetts Financial Services Company, Vice Chair (since January 2017); Chief Operating Officer and Executive Vice President (until January 2017) | | N/A |
| INDEPENDENT TRUSTEES |
John P. Kavanaugh (age 64) | | Trustee and Chair of Trustees | | January 2009 | | 135 | | Private investor | | N/A |
| | | | | |
Steven E. Buller (age 68) | | Trustee | | February 2014 | | 135 | | Financial Accounting Standards Advisory Council, Chairman (2014-2015); Public Company Accounting Oversight Board, Standing Advisory Group, Member (until 2014); BlackRock, Inc. (investment management), Managing Director (until 2014), BlackRock Finco UK (investment management), Director (until 2014) | | N/A |
30
Trustees and Officers – continued
| | | | | | | | | | |
Name, Age | | Position(s)
Held
with Fund | | Trustee/Officer
Since (h) | | Number of
MFS Funds
overseen
by the
Trustee | | Principal
Occupations During the Past Five Years | | Other
Directorships
During the Past
Five Years (j) |
John A. Caroselli (age 65) | | Trustee | | March 2017 | | 135 | | JC Global Advisors, LLC (management consulting), President (since 2015); First Capital Corporation (commercial finance), Executive Vice President (until 2015) | | N/A |
| | | | | |
Maureen R. Goldfarb (age 64) | | Trustee | | January 2009 | | 135 | | Private investor | | N/A |
| | | | | |
Michael Hegarty
(age 74) | | Trustee | | December 2004 | | 135 | | Private investor | | Rouse Properties Inc., Director (until 2016); Capmark Financial Group Inc., Director (until 2015) |
| | | | | |
Peter D. Jones
(age 64) | | Trustee | | January 2019 | | 135 | | Franklin Templeton Distributors, Inc. (investment management), President (until 2015); Franklin Templeton Institutional, LLC (investment management), Chairman (until 2015) | | N/A |
| | | | | |
James W. Kilman, Jr.
(age 58) | | Trustee | | January 2019 | | 135 | | Burford Capital Limited (finance and investment management), Chief Financial Officer (since 2019); KielStrand Capital LLC (family office and merchant bank), Chief Executive Officer (since 2016); Morgan Stanley & Co. (financial services), Vice Chairman of Investment Banking,Co-Head of Diversified Financials Coverage – Financial Institutions Investment Banking Group (until 2016) | | Alpha-En Corporation, Director (since 2016) |
31
Trustees and Officers – continued
| | | | | | | | | | |
Name, Age | | Position(s)
Held
with Fund | | Trustee/Officer
Since (h) | | Number of
MFS Funds
overseen
by the
Trustee | | Principal
Occupations During the Past Five Years | | Other
Directorships
During the Past
Five Years (j) |
Clarence Otis, Jr. (age 63) | | Trustee | | March 2017 | | 135 | | Darden Restaurants, Inc., Chief Executive Officer (until 2014) | | VF Corporation, Director; Verizon Communications, Inc., Director; The Travelers Companies, Director; Federal Reserve Bank of Atlanta, Director (until 2015) |
| | | | | |
Maryanne L. Roepke (age 63) | | Trustee | | May 2014 | | 135 | | American Century Investments (investment management), Senior Vice President and Chief Compliance Officer (until 2014) | | N/A |
| | | | | |
Laurie J. Thomsen
(age 62) | | Trustee | | March 2005 | | 135 | | Private investor | | The Travelers Companies, Director; Dycom Industries, Inc., Director (since 2015) |
| | | | | | | | |
Name, Age | | Position(s) Held
with Fund | | Trustee/Officer
Since (h) | | Number of
MFS Funds
for which
the Person
is an Officer | | Principal
Occupations During
the Past Five Years |
| OFFICERS | | | | | | | | |
Christopher R. Bohane (k) (age 45) | | Assistant Secretary and Assistant Clerk | | July 2005 | | 135 | | Massachusetts Financial Services Company, Vice President and Assistant General Counsel |
| | | | |
Kino Clark (k) (age 51) | | Assistant Treasurer | | January 2012 | | 135 | | Massachusetts Financial Services Company, Vice President |
32
Trustees and Officers – continued
| | | | | | | | |
Name, Age | | Position(s) Held
with Fund | | Trustee/Officer
Since (h) | | Number of
MFS Funds
for which
the Person
is an Officer | | Principal
Occupations During
the Past Five Years |
John W. Clark, Jr. (k) (age 52) | | Assistant Treasurer | | April 2017 | | 135 | | Massachusetts Financial Services Company, Vice President (since March 2017); Deutsche Bank (financial services), Department Head – Treasurer’s Office (until February 2017) |
| | | | |
Thomas H. Connors (k) (age 60) | | Assistant Secretary and Assistant Clerk | | September 2012 | | 135 | | Massachusetts Financial Services Company, Vice President and Senior Counsel |
| | | | |
David L. DiLorenzo (k)
(age 51) | | President | | July 2005 | | 135 | | Massachusetts Financial Services Company, Senior Vice President |
| | | | |
Heidi W. Hardin (k)
(age 52) | | Secretary and Clerk | | April 2017 | | 135 | | Massachusetts Financial Services Company, Executive Vice President and General Counsel (since March 2017); Harris Associates (investment management), General Counsel (from September 2015 to January 2017); Janus Capital Management LLC (investment management), Senior Vice President and General Counsel (until September 2015) |
| | | | |
Brian E. Langenfeld (k)
(age 46) | | Assistant
Secretary and Assistant Clerk | | June 2006 | | 135 | | Massachusetts Financial Services Company, Vice President and Senior Counsel |
| | | | |
Amanda S. Mooradian (k)
(age 40) | | Assistant
Secretary and Assistant Clerk | | September 2018 | | 135 | | Massachusetts Financial Services Company, Assistant Vice President and Counsel |
33
Trustees and Officers – continued
| | | | | | | | |
Name, Age | | Position(s) Held
with Fund | | Trustee/Officer
Since (h) | | Number of
MFS Funds
for which
the Person
is an Officer | | Principal
Occupations During
the Past Five Years |
Susan A. Pereira (k)
(age 48) | | Assistant
Secretary and Assistant Clerk | | July 2005 | | 135 | | Massachusetts Financial Services Company, Vice President and Assistant General Counsel |
| | | | |
Kasey L. Phillips (k)
(age 48) | | Assistant Treasurer | | September 2012 | | 135 | | Massachusetts Financial Services Company, Vice President |
| | | | |
Matthew A. Stowe (k)
(age 44) | | Assistant Secretary and Assistant Clerk | | October 2014 | | 135 | | Massachusetts Financial Services Company, Vice President and Assistant General Counsel |
| | | | |
Martin J. Wolin (k)
(age 52) | | Chief Compliance Officer | | July 2015 | | 135 | | Massachusetts Financial Services Company, Senior Vice President and Chief Compliance Officer (since July 2015); Mercer (financial service provider), Chief Risk and Compliance Officer, North America and Latin America (until June 2015) |
| | | | |
James O. Yost (k)
(age 59) | | Treasurer | | September 1990 | | 135 | | Massachusetts Financial Services Company, Senior Vice President |
| (h) | Date first appointed to serve as Trustee/officer of an MFS Fund. Each Trustee has served continuously since appointment unless indicated otherwise. For the period from December 15, 2004 until February 22, 2005, Mr. Manning served as Advisory Trustee. From January 2012 through December 2016, Messrs. DiLorenzo and Yost served as Treasurer and Deputy Treasurer of the Funds, respectively. |
| (j) | Directorships or trusteeships of companies required to report to the Securities and Exchange Commission (i.e., “public companies”). |
| (k) | “Interested person” of the Trust within the meaning of the Investment Company Act of 1940 (referred to as the 1940 Act), which is the principal federal law governing investment companies like the fund, as a result of a position with MFS. The address of MFS is 111 Huntington Avenue, Boston, Massachusetts 02199-7618. |
Each Trustee (other than Messrs. Jones and Kilman) has been elected by shareholders and each Trustee and Officer holds office until his or her successor is chosen and qualified or until his or her earlier death, resignation, retirement or removal. Messrs. Jones and Kilman became Trustees of the Funds on January 1, 2019. The Trust does
34
Trustees and Officers – continued
not hold annual meetings for the purpose of electing Trustees, and Trustees are not elected for fixed terms. Under the terms of the Board’s retirement policy, an Independent Trustee shall retire at the end of the calendar year in which he or she reaches the earlier of 75 years of age or 15 years of service on the Board (or, in the case of any Independent Trustee who joined the Board prior to 2015, 20 years of service on the Board).
Messrs. Buller, Hegarty, Kilman and Otis and Ms. Roepke are members of the Trust’s Audit Committee.
Each of the Interested Trustees and certain Officers hold comparable officer positions with certain affiliates of MFS.
The Statement of Additional Information for a Fund includes further information about the Trustees and is available without charge upon request by calling1-800-225-2606.
| | |
| Investment Adviser | | Custodian |
Massachusetts Financial Services Company
111 Huntington Avenue
Boston, MA 02199-7618 | | State Street Bank and Trust Company 1 Lincoln Street Boston, MA 02111-2900 |
| Distributor | | Independent Registered Public Accounting Firm |
MFS Fund Distributors, Inc.
111 Huntington Avenue
Boston, MA 02199-7618 | | Deloitte & Touche LLP 200 Berkeley Street Boston, MA 02116 |
| Portfolio Manager(s) | | |
| Edward O’Dette | | |
35
BOARD REVIEW OF INVESTMENT ADVISORY AGREEMENT
The Investment Company Act of 1940 requires that both the full Board of Trustees and a majority of thenon-interested (“independent”) Trustees, voting separately, annually approve the continuation of the Fund’s investment advisory agreement with MFS. The Trustees consider matters bearing on the Fund and its advisory arrangements at their meetings throughout the year, including a review of performance data at each regular meeting. In addition, the independent Trustees met several times over the course of three months beginning in May and ending in July, 2019 (“contract review meetings”) for the specific purpose of considering whether to approve the continuation of the investment advisory agreement for the Fund and the other investment companies that the Board oversees (the “MFS Funds”). The independent Trustees were assisted in their evaluation of the Fund’s investment advisory agreement by independent legal counsel, from whom they received separate legal advice and with whom they met separately from MFS during various contract review meetings. The independent Trustees were also assisted in this process by the MFS Funds’ Independent Senior Officer, a senior officer appointed by and reporting to the independent Trustees.
In connection with their deliberations regarding the continuation of the investment advisory agreement, the Trustees, including the independent Trustees, considered such information and factors as they believed, in light of the legal advice furnished to them and their own business judgment, to be relevant. The investment advisory agreement for the Fund was considered separately, although the Trustees also took into account the common interests of all MFS Funds in their review. As described below, the Trustees considered the nature, quality, and extent of the various investment advisory, administrative, and shareholder services performed by MFS under the existing investment advisory agreement and other arrangements with the Fund.
In connection with their contract review meetings, the Trustees received and relied upon materials that included, among other items: (i) information provided by Broadridge Financial Solutions, Inc. (“Broadridge”), an independent third party, on the investment performance of the Fund for various time periods ended December 31, 2018 and the investment performance of a group of funds with substantially similar investment classifications/objectives (the “Broadridge performance universe”), (ii) information provided by Broadridge on the Fund’s advisory fees and other expenses and the advisory fees and other expenses of comparable funds identified by Broadridge as well as all other funds in the same investment classification/category (the “Broadridge expense group and universe”), (iii) information provided by MFS on the advisory fees of portfolios of other clients of MFS, including institutional separate accounts and other clients, (iv) information as to whether and to what extent applicable expense waivers, reimbursements or fee “breakpoints” are observed for the Fund, (v) information regarding MFS’ financial results and financial condition, including MFS’ and certain of its affiliates’ estimated profitability from services performed for the Fund and the MFS Funds as a whole, and compared to MFS’ institutional business, (vi) MFS’ views regarding the outlook for the mutual fund industry and the strategic business plans of MFS, (vii) descriptions of various functions performed by MFS for the Funds, such as compliance monitoring and portfolio trading practices, and (viii) information regarding the overall organization of MFS, including information
36
Board Review of Investment Advisory Agreement – continued
about MFS’ senior management and other personnel providing investment advisory, administrative and other services to the Fund and the other MFS Funds. The comparative performance, fee and expense information prepared and provided by Broadridge was not independently verified and the independent Trustees did not independently verify any information provided to them by MFS.
The Trustees’ conclusion as to the continuation of the investment advisory agreement was based on a comprehensive consideration of all information provided to the Trustees and not the result of any single factor. Some of the factors that figured particularly in the Trustees’ deliberations are described below, although individual Trustees may have evaluated the information presented differently from one another, giving different weights to various factors. It is also important to recognize that the fee arrangements for the Fund and other MFS Funds are the result of years of review and discussion between the independent Trustees and MFS, that certain aspects of such arrangements may receive greater scrutiny in some years than in others, and that the Trustees’ conclusions may be based, in part, on their consideration of these same arrangements during the course of the year and in prior years.
Based on information provided by Broadridge and MFS, the Trustees reviewed the Fund’s total return investment performance as well as the Broadridge performance universe over various time periods. The Trustees placed particular emphasis on the total return performance of the Fund’s Class A shares in comparison to the performance of funds in its Broadridge performance universe over the five-year period ended December 31, 2018, which the Trustees believed was a long enough period to reflect differing market conditions. The total return performance of the Fund’s Class A shares was in the 4th quintile relative to the other funds in the universe for this five-year period (the 1st quintile being the best performers and the 5th quintile being the worst performers). The total return performance of the Fund’s Class A shares was in the 4th quintile for each of theone- and three-year periods ended December 31, 2018 relative to the Broadridge performance universe. Because of the passage of time, these performance results may differ from the performance results for more recent periods, including those shown elsewhere in this report.
In the course of their deliberations, the Trustees took into account information provided by MFS in connection with the contract review meetings, as well as during investment review meetings conducted with portfolio management personnel during the course of the year regarding the Fund’s performance. In addition, the Trustees noted the market conditions affecting all money market funds, in particular the low interest rate environment during portions of the three- and five-year periods, and MFS’ voluntary waiver of all or a portion of its fees to ensure that the Fund avoided a negative yield during those periods. After reviewing these and related factors, the Trustees concluded, within the context of their overall conclusions regarding the investment advisory agreement, that they were satisfied with MFS’ responses and efforts relating to investment performance.
In assessing the reasonableness of the Fund’s advisory fee, the Trustees considered, among other information, the Fund’s advisory fee and the total expense ratio of the Fund’s Class A shares as a percentage of average daily net assets and the advisory fee and total expense ratios of the Broadridge expense group based on information
37
Board Review of Investment Advisory Agreement – continued
provided by Broadridge. The Trustees considered that MFS Fund Distributors, Inc. (“MFD”), an affiliate of MFS, currently observes a Class A12b-1 fee waiver, which may not be changed without the Trustees’ approval. The Trustees also considered that, according to the data provided by Broadridge (which takes into account any fee reductions or expense limitations that were in effect during the Fund’s last fiscal year), the Fund’s effective advisory fee rate was approximately at the Broadridge expense group median and the Fund’s total expense ratio was higher than the Broadridge expense group median.
The Trustees also considered the advisory fees charged by MFS to any institutional separate accounts advised by MFS (“separate accounts”) and unaffiliated investment companies for which MFS serves as subadviser (“subadvised funds”) that have comparable investment strategies to the Fund, if any. In comparing these fees, the Trustees considered information provided by MFS as to the generally broader scope of services provided by MFS to the Fund, as well as the more extensive regulatory burdens imposed on MFS in managing the Fund, in comparison to separate accounts and subadvised funds. The Trustees also considered the higher demands placed on MFS’ investment personnel and trading infrastructure as a result of the daily cashin-flows andout-flows of the Fund in comparison to separate accounts.
The Trustees also considered whether the Fund may benefit from any economies of scale in the management of the Fund in the event of growth in assets of the Fund and/or growth in assets of the MFS Funds as a whole. They noted that the Fund’s advisory fee rate schedule is not subject to any breakpoints. Taking into account that the Fund’s effective advisory fee rate was approximately at the Broadridge expense group median described above, the Trustees determined not to recommend any advisory fee breakpoints for the Fund at this time. The Trustees also noted that MFS has agreed in writing to waive a portion of the management fees of certain MFS Funds, including the Fund, if the total combined assets of certain funds within the MFS Funds’ complex increase above agreed upon thresholds (the “group fee waiver”), enabling the Fund’s shareholders to share in the benefits from any economies of scale at the complex level. The group fee waiver is reviewed and renewed annually between the Board and MFS. The Trustees concluded that the group fee waiver was sufficient to allow the Fund to benefit from economies of scale as its assets and overall complex assets grow.
The Trustees also considered information prepared by MFS relating to MFS’ costs and profits with respect to the Fund, the MFS Funds considered as a group, and other investment companies and accounts advised by MFS, as well as MFS’ methodologies used to determine and allocate its costs to the MFS Funds, the Fund and other accounts and products for purposes of estimating profitability.
After reviewing these and other factors described herein, the Trustees concluded, within the context of their overall conclusions regarding the investment advisory agreement, that the advisory fees charged to the Fund represent reasonable compensation in light of the services being provided by MFS to the Fund.
In addition, the Trustees considered MFS’ resources and related efforts to continue to retain, attract and motivate capable personnel to serve the Fund. The Trustees also considered current and developing conditions in the financial services industry,
38
Board Review of Investment Advisory Agreement – continued
including the presence of large and well-capitalized companies which are spending, and appear to be prepared to continue to spend, substantial sums to engage personnel and to provide services to competing investment companies. In this regard, the Trustees also considered the financial resources of MFS and its ultimate parent, Sun Life Financial Inc. The Trustees also considered the advantages and possible disadvantages to the Fund of having an adviser that also serves other investment companies as well as other accounts.
The Trustees also considered the nature, quality, cost, and extent of administrative, transfer agency, and distribution services provided to the Fund by MFS and its affiliates under agreements and plans other than the investment advisory agreement, including any12b-1 fees the Fund pays to MFD. The Trustees also considered the nature, extent and quality of certain other services MFS performs or arranges for on the Fund’s behalf, which may include securities lending programs, directed expense payment programs, class action recovery programs, and MFS’ interaction with third-party service providers, principally custodians andsub-custodians. The Trustees concluded that the variousnon-advisory services provided by MFS and its affiliates on behalf of the Fund were satisfactory.
The Trustees consideredso-called“fall-out benefits” to MFS such as reputational value derived from serving as investment manager to the MFS Funds. The Trustees also considered that, effective January 3, 2018, MFS had discontinued its historic practice of obtaining investment research from portfolio brokerage commissions paid by certain MFS Funds and would thereafter directly pay for or voluntarily reimburse a Fund, if applicable, for the costs of external research acquired through the use of the Fund’s portfolio brokerage commissions.
Based on their evaluation of factors that they deemed to be material, including those factors described above, the Board of Trustees, including the independent Trustees, concluded that the Fund’s investment advisory agreement with MFS should be continued for an additionalone-year period, commencing August 1, 2019.
39
PROXY VOTING POLICIES AND INFORMATION
MFS votes proxies on behalf of the fund pursuant to proxy voting policies and procedures that are available without charge, upon request, by calling1-800-225-2606, by visitingmfs.com/proxyvoting, or by visiting the SEC’s Web site athttp://www.sec.gov.
Information regarding how the fund voted proxies relating to portfolio securities during the most recent twelve-month period ended June 30 is available by August 31 of each year without charge by visitingmfs.com/proxyvoting, or by visiting the SEC’s Web site athttp://www.sec.gov.
PORTFOLIO HOLDINGS INFORMATION
The fund files monthly portfolio information with the SEC on Form N-MFP. The fund’s Form N-MFP reports are available on the SEC’s website athttp://www.sec.gov. A shareholder can also access the fund’s portfolio holdings as of each month end and the fund’s Form N-MFP reports atmfs.com/openendfunds after choosing “Click here for access to Money Market fund reports”.
FURTHER INFORMATION
From time to time, MFS may post important information about the fund or the MFS funds on the MFS web site (mfs.com). This information is available athttps://www.mfs.com/en-us/what-we-do/announcements.htmlor atmfs.com/openendfunds by choosing the fund’s name.
INFORMATION ABOUT FUND CONTRACTS AND LEGAL CLAIMS
The fund has entered into contractual arrangements with an investment adviser, administrator, distributor, shareholder servicing agent, 529 program manager (if applicable), and custodian who each provide services to the fund. Unless expressly stated otherwise, shareholders are not parties to, or intended beneficiaries of these contractual arrangements, and these contractual arrangements are not intended to create any shareholder right to enforce them against the service providers or to seek any remedy under them against the service providers, either directly or on behalf of the fund.
Under the Trust’sBy-Laws and Declaration of Trust, any claims asserted against or on behalf of the MFS Funds, including claims against Trustees and Officers, must be brought in state and federal courts located within the Commonwealth of Massachusetts.
FEDERAL TAX INFORMATION (unaudited)
The fund will notify shareholders of amounts for use in preparing 2019 income tax forms in January 2020.
40
rev. 3/16
| | | | |
| | | |
FACTS | | WHAT DOES MFS DO WITH YOUR PERSONAL INFORMATION? | |  |
| | |
| Why? | | Financial companies choose how they share your personal information. Federal law gives consumers the right to limit some but not all sharing. Federal law also requires us to tell you how we collect, share, and protect your personal information. Please read this notice carefully to understand what we do. |
| | |
| What? | | The types of personal information we collect and share depend on the product or service you have with us. This information can include: • Social Security number and account balances • Account transactions and transaction history • Checking account information and wire transfer instructions When you areno longer our customer, we continue to share your information as described in this notice. |
| | |
| How? | | All financial companies need to share customers’ personal information to run their everyday business. In the section below, we list the reasons financial companies can share their customers’ personal information; the reasons MFS chooses to share; and whether you can limit this sharing. |
| | | | |
Reasons we can share your
personal information | | Does MFS
share? | | Can you limit
this sharing? |
For our everyday business purposes – such as to process your transactions, maintain your account(s), respond to court orders and legal investigations, or report to credit bureaus | | Yes | | No |
For our marketing purposes – to offer our products and services to you | | No | | We don’t share |
For joint marketing with other financial companies | | No | | We don’t share |
For our affiliates’ everyday business purposes – information about your transactions and experiences | | No | | We don’t share |
For our affiliates’ everyday business purposes – information about your creditworthiness | | No | | We don’t share |
| For nonaffiliates to market to you | | No | | We don’t share |
| | |
| | |
| Questions? | | Call800-225-2606 or go tomfs.com. |
41
| | |
| Who we are |
| Who is providing this notice? | | MFS Funds, MFS Investment Management, MFS Institutional Advisors, Inc., and MFS Heritage Trust Company. |
| | |
| What we do |
| How does MFS protect my personal information? | | To protect your personal information from unauthorized access and use, we use security measures that comply with federal law. These measures include procedural, electronic, and physical safeguards for the protection of the personal information we collect about you. |
| How does MFS collect my personal information? | | We collect your personal information, for example, when you • open an account or provide account information • direct us to buy securities or direct us to sell your securities • make a wire transfer We also collect your personal information from others, such as credit bureaus, affiliates, or other companies. |
| Why can’t I limit all sharing? | | Federal law gives you the right to limit only • sharing for affiliates’ everyday business purposes – information about your creditworthiness • affiliates from using your information to market to you • sharing for nonaffiliates to market to you State laws and individual companies may give you additional rights to limit sharing. |
| | |
| Definitions |
| Affiliates | | Companies related by common ownership or control. They can be financial and nonfinancial companies. • MFS does not share personal information with affiliates, except for everyday business purposes as described on page one of this notice. |
| Nonaffiliates | | Companies not related by common ownership or control. They can be financial and nonfinancial companies. • MFS does not share with nonaffiliates so they can market to you. |
| Joint marketing | | A formal agreement between nonaffiliated financial companies that together market financial products or services to you. • MFS doesn’t jointly market. |
| | |
| Other important information |
| If you own an MFS product or receive an MFS service in the name of a third party such as a bank or broker-dealer, their privacy policy may apply to you instead of ours. |
42
Save paper with eDelivery.

| MFS® will send you prospectuses, |
reports, and proxies directly viae-mail so you will get information faster with less mailbox clutter.
To sign up:
1. Go to mfs.com.
2. Log in via MFS® Access.
3. Select eDelivery.
If you own your MFS fund shares through a financial institution or a retirement plan, MFS® TALK, MFS® Access, or eDelivery may not be available to you.
CONTACT
WEB SITE
mfs.com
MFS TALK
1-800-637-8255
24 hours a day
ACCOUNT SERVICE AND LITERATURE
Shareholders
1-800-225-2606
Financial advisors
1-800-343-2829
Retirement plan services
1-800-637-1255
MAILING ADDRESS
MFS Service Center, Inc.
P.O. Box 219341
Kansas City, MO 64121-9341
OVERNIGHT MAIL
MFS Service Center, Inc.
Suite 219341
430 W 7th Street
Kansas City, MO 64105-1407
Annual Report
August 31, 2019

MFS® Value Fund

Beginning on January 1, 2021, as permitted by regulations adopted by the U.S. Securities and Exchange Commission, paper copies of the fund’s annual and semiannual shareholder reports will no longer be sent by mail, unless you specifically request paper copies of the reports. Instead, the complete reports will be made available on the fund’s Web site (funds.mfs.com), and you will be notified by mail each time a report is posted and provided with a Web site link to access the report.
If you are already signed up to receive shareholder reports by email, you will not be affected by this change and you need not take any action. You may sign up to receive shareholder reports and other communications from the fund by email by contacting your financial intermediary (such as a broker-dealer or bank) or, if you hold your shares directly with the fund, by calling 1-800-225-2606 or by logging on to MFS Access at mfs.com.
Beginning on January 1, 2019, you may elect to receive all future reports in paper free of charge. Contact your financial intermediary to request that you continue to receive paper copies of your shareholder reports. If you invest directly with the fund, you can call 1-800-225-2606 or send an email request to orderliterature@mfs.com to let the fund know that you wish to continue receiving paper copies of your shareholder reports. Your election to receive reports in paper will apply to all funds held in your account if you invest through your financial intermediary or all funds held with the MFS fund complex if you invest directly.
EIF-ANN
MFS® Value Fund
CONTENTS
The report is prepared for the general information of shareholders.
It is authorized for distribution to prospective investors only when preceded or accompanied by a current prospectus.
NOT FDIC INSURED• MAY LOSE VALUE• NO BANK GUARANTEE

LETTER FROM THE EXECUTIVE CHAIRMAN
Dear Shareholders:
Slowing global growth, low inflation, and increasing trade friction between the United States and China have been hallmarks of the past 12 months. After experiencing an
uptick in market volatility in late 2018, markets steadied during the first half of 2019, thanks in large measure to the adoption of a dovish policy stance on the part of global central banks, focused on supporting economic growth. The U.S. and China have raised tariffs on each other, heightening tensions and uncertainty. Despite repeated declarations by British Prime Minister Boris Johnson that the United Kingdom will leave the European Union on October 31, 2019, with or without a deal, apprehension over the possibility of a no-deal Brexit has eased somewhat, with Parliament having taken steps to block such an outcome.
Markets expect that the longest economic expansion in U.S. history will continue for the time being, albeit at a slower pace. In an effort to prolong the expansion, the U.S. Federal Reserve lowered interest rates for the first time in more than a decade in July and again in September. Similarly, the European Central Bank loosened policy in September. While markets have grown more risk averse, the accommodative monetary environment has helped push global interest rates toward record-low levels and has been somewhat supportive of risk assets despite the unsettled economic and geopolitical backdrop.
Since launching the first U.S. open-end mutual fund in 1924, MFS® has been committed to a single purpose: to create value by allocating capital responsibly for clients. Through our powerful global investment platform, we combine collective expertise, thoughtful risk management, and long-term discipline to uncover what we believe are the best investment opportunities in the market.
Respectfully,

Robert J. Manning
Executive Chairman
MFS Investment Management
October 17, 2019
The opinions expressed in this letter are subject to change and may not be relied upon for investment advice. No forecasts can be guaranteed.
1
PORTFOLIO COMPOSITION
Portfolio structure

| | | | |
| Top ten holdings | | | | |
| JPMorgan Chase & Co. | | | 4.4% | |
| Johnson & Johnson | | | 3.2% | |
| Accenture PLC, “A” | | | 3.0% | |
| Medtronic PLC | | | 3.0% | |
| Comcast Corp., “A” | | | 3.0% | |
| Aon PLC | | | 2.4% | |
| Northrop Grumman Corp. | | | 2.3% | |
| Texas Instruments, Inc. | | | 2.2% | |
| Duke Energy Corp. | | | 2.2% | |
| U.S. Bancorp | | | 2.1% | |
| | | | |
| GICS equity sectors (g) | | | | |
| Financials | | | 28.5% | |
| Health Care | | | 17.0% | |
| Industrials | | | 16.8% | |
| Information Technology | | | 9.8% | |
| Consumer Staples | | | 8.5% | |
| Utilities | | | 5.8% | |
| Communication Services | | | 3.8% | |
| Materials | | | 3.4% | |
| Energy | | | 3.3% | |
| Consumer Discretionary | | | 1.2% | |
| Real Estate | | | 0.5% | |
| (g) | The Global Industry Classification Standard (GICS®) was developed by and/or is the exclusive property of MSCI, Inc. and S&P Global Market Intelligence Inc. (“S&P Global Market Intelligence”). GICS is a service mark of MSCI and S&P Global Market Intelligence and has been licensed for use by MFS. |
Cash & Cash Equivalents includes any cash, investments in money market funds, short-term securities, and other assets less liabilities. Please see the Statement of Assets and Liabilities for additional information related to the fund’s cash position and other assets and liabilities.
Percentages are based on net assets as of August 31, 2019.
The portfolio is actively managed and current holdings may be different.
2
MANAGEMENT REVIEW
Summary of Results
For the twelve months ended August 31, 2019, Class A shares of the MFS Value Fund (fund) provided a total return of 4.85%, at net asset value. This compares with a return of 0.62% for the fund’s benchmark, the Russell 1000® Value Index.
Market Environment
Changes in market sentiment, driven largely by uncertainty over the outcome of trade negotiations between the United States and China, contributed to periodic bouts of volatility during the reporting period. The global economy decelerated, led by weakness in China and Europe.
The deteriorating global growth backdrop, along with declining inflationary pressures, prompted the US Federal Reserve to cut interest rates for the first time in over a decade at the end of July, which, combined with a more dovish posture beginning in early 2019, resulted in a sharp decline in long-term interest rates during the period’s second half, inverting portions of the US Treasury yield curve. Consequently, markets anticipate additional rate cuts in the coming quarters.
Globally, central banks have tilted more dovish as well, with China lowering reserve requirements, the Bank of Canada and Bank of England holding rates steady and the European Central Bank extending alow-interest-rate refinancing facility for eurozone banks to encourage the continued flow of credit. The ECB also indicated that it would likely lower rates further and possibly resume asset purchases this fall.
Emerging markets experienced considerable volatility earlier in the period (through the end of 2018) as tighter global financial conditions exposed structural weakness in some countries. Those conditions improved in 2019 as the Fed became more dovish, but diminished hopes for a trade deal between the US and China weighed on sentiment. Idiosyncratic factors negatively impacted some emerging economies, such as Argentina and Turkey.
From a geopolitical perspective, uncertainty over Brexit remains high. British Prime Minister Boris Johnson has shown a willingness to leave the European Union on October 31, 2019, without a withdrawal agreement, although Parliament has taken steps to prevent the United Kingdom from leaving the EU without a deal. The combination of Brexit uncertainty and the deteriorating outlook for global trade has damaged business confidence and hampered investment.
Contributors to Performance
Stock selection in both theindustrialsandhealth caresectors contributed to performance relative to the Russell 1000® Value Index. Within theindustrialssector, holding shares of global security company Northrop Grumman (b)bolstered relative returns. Within thehealth care sector, an overweight position in healthcare equipment manufacturer Danaher aided relative results.
An underweight position in theenergysector also benefited relative results. However, there were no individual stocks within this sector that were among the fund’s top relative contributors during the reporting period.
3
Management Review – continued
Stock selection in thefinancials sector supported relative returns, led by the fund’s holdings of risk management and human capital consulting services provider Aon (b). The company’s share price appreciated as management announced strong earnings results, driven by better-than-expected organic growth and operating margin expansion due to the firm’s cost savings program.
Stocks in other sectors that strengthened relative returns included the fund’s positions in global food company Nestle (b)(Switzerland), IT services firm Accenture (b), financial services technology company Fiserv (b), semiconductor company Texas Instruments (b) and premium drinks distributor Diageo (b)(United Kingdom). The stock price of Nestle advanced as the company reported solid financial results during the period, driven in part by a significantimprovement in organic sales growth in Brazil, China and the US.In addition, overweight positions in cable services provider Comcast and retail electric services provider Southern Company further benefited relative performance.
Detractors from Performance
An underweight position in thereal estate sector hindered relative performance. However, there were no individual stocks within this sector that were among the fund’s top relative detractors during the reporting period.
Stock selection and, to a lesser extent, an underweight position in theconsumer discretionarysector also detracted from relative results, led by not owning shares of fast food company McDonald’s.
Elsewhere, the fund’s underweight position in household products maker Procter & Gamble, and overweight positions in oil field services company Schlumberger, custody bank State Street, global health service organization Cigna, financial services firm Goldman Sachs Group, diversified financial services firm Wells Fargo and information technology company DXC Technology weakened relative returns. The share price of Schlumberger depreciated after the company reported a larger-than-anticipated decline in revenues due to softer pricing and lower activity in both its hydraulic fracturing and drilling-related service segments in North America. The stock price of State Street also declined during the period as the company reported earnings per share that missed consensus estimates, primarily due to lower-than-expected revenues, while its net interest income and fee income, notably in its asset servicing segment, fell short of expectations. Additionally, not owning shares of telecommunications media technology services company AT&T and network equipment company Cisco Systems held back relative results.
Respectfully,
Portfolio Manager(s)
Nevin Chitkara and Steven Gorham
| (b) | Security is not a benchmark constituent. |
Note to Shareholders: Effective December 31, 2019, Katherine Cannan will be added as a Portfolio Manager of the Fund. Effective December 31, 2020, Steven Gorham will no longer be a Portfolio Manager of the Fund.
4
Management Review – continued
The views expressed in this report are those of the portfolio manager(s) only through the end of the period of the report as stated on the cover and do not necessarily reflect the views of MFS or any other person in the MFS organization. These views are subject to change at any time based on market or other conditions, and MFS disclaims any responsibility to update such views. These views may not be relied upon as investment advice or an indication of trading intent on behalf of any MFS portfolio. References to specific securities are not recommendations of such securities, and may not be representative of any MFS portfolio’s current or future investments.
5
PERFORMANCE SUMMARYTHROUGH 8/31/19
The following chart illustrates a representative class of the fund’s historical performance in comparison to its benchmark(s). Performance results include the deduction of the maximum applicable sales charge and reflect the percentage change in net asset value, including reinvestment of dividends and capital gains distributions. The performance of other share classes will be greater than or less than that of the class depicted below. Benchmarks are unmanaged and may not be invested in directly. Benchmark returns do not reflect sales charges, commissions or expenses. (See Notes to Performance Summary.)
Performance data shown represents past performance and is no guarantee of future results. Investment return and principal value fluctuate so your shares, when sold, may be worth more or less than the original cost; current performance may be lower or higher than quoted. The performance shown does not reflect the deduction of taxes, if any, that a shareholder would pay on fund distributions or the redemption of fund shares.
Growth of a Hypothetical $10,000 Investment
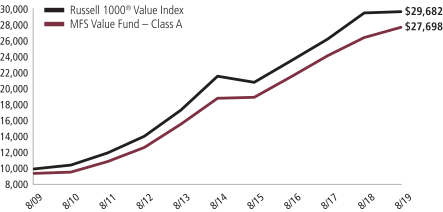
6
Performance Summary – continued
Total Returns through 8/31/19
Average annual without sales charge
| | | | | | | | | | | | |
| | | Share Class | | Class Inception Date | | 1-yr | | 5-yr | | 10-yr | | |
| | | A | | 1/02/96 | | 4.85% | | 8.04% | | 11.38% | | |
| | | B | | 11/04/97 | | 4.08% | | 7.24% | | 10.55% | | |
| | | C | | 11/05/97 | | 4.10% | | 7.24% | | 10.55% | | |
| | | I | | 1/02/97 | | 5.11% | | 8.31% | | 11.66% | | |
| | | R1 | | 4/01/05 | | 4.05% | | 7.23% | | 10.55% | | |
| | | R2 | | 10/31/03 | | 4.60% | | 7.77% | | 11.11% | | |
| | | R3 | | 4/01/05 | | 4.87% | | 8.04% | | 11.39% | | |
| | | R4 | | 4/01/05 | | 5.14% | | 8.31% | | 11.67% | | |
| | | R6 | | 5/01/06 | | 5.22% | | 8.42% | | 11.73% | | |
| | | 529A | | 7/31/02 | | 4.85% | | 8.03% | | 11.35% | | |
| | | 529B | | 7/31/02 | | 4.46% | | 7.55% | | 10.68% | | |
| | | 529C | | 7/31/02 | | 4.04% | | 7.19% | | 10.49% | | |
| | | | |
| Comparative benchmark(s) | | | | | | | | |
| | | Russell 1000® Value Index (f) | | 0.62% | | 6.59% | | 11.49% | | |
| | | | |
| Average annual with sales charge | | | | | | | | |
| | | A
With Initial Sales Charge (5.75%) | | (1.18)% | | 6.77% | | 10.72% | | |
| | | B
With CDSC (Declining over six years from 4% to 0%) (v) | | 0.08% | | 6.94% | | 10.55% | | |
| | | C
With CDSC (1% for 12 months) (v) | | 3.10% | | 7.24% | | 10.55% | | |
| | | 529A
With Initial Sales Charge (5.75%) | | (1.18)% | | 6.76% | | 10.69% | | |
| | | 529B
With CDSC (Declining over six years from 4% to 0%) (v) | | 0.46% | | 7.25% | | 10.68% | | |
| | | 529C
With CDSC (1% for 12 months) (v) | | 3.04% | | 7.19% | | 10.49% | | |
CDSC – Contingent Deferred Sales Charge.
Class I, R1, R2, R3, R4, and R6 shares do not have a sales charge.
On May 30, 2012, Class W shares were redesignated Class R5 shares. Total returns for Class R5 shares prior to May 30, 2012 reflect the performance history of Class W shares which had different fees and expenses than Class R5 shares. Effective August 26, 2016, Class R5 shares were renamed Class R6 shares.
| (f) | Source: FactSet Research Systems Inc. |
| (v) | Assuming redemption at the end of the applicable period. |
7
Performance Summary – continued
Benchmark Definition(s)
Russell 1000® Value Index – constructed to provide a comprehensive barometer for the value securities in the large-cap segment of the U.S. equity universe. Companies in this index generally have lower price-to-book ratios and lower forecasted growth values. The Russell 1000® Value Index is a trademark/service mark of the Frank Russell Company. Russell® is a trademark of the Frank Russell Company.
It is not possible to invest directly in an index.
Notes to Performance Summary
Class 529 shares are only available in conjunction with qualified tuition programs, such as the MFS 529 Savings Plan. There also is an additional fee, which is detailed in the program description, on qualified tuition programs. If this fee was reflected, the performance for Class 529 shares would have been lower. This annual fee is waived for Oregon residents and for those accounts with assets of $25,000 or more.
Average annual total return represents the average annual change in value for each share class for the periods presented.
Performance results reflect any applicable expense subsidies and waivers in effect during the periods shown. Without such subsidies and waivers the fund’s performance results would be less favorable. Please see the prospectus and financial statements for complete details.
Performance results do not include adjustments made for financial reporting purposes in accordance with U.S. generally accepted accounting principles and may differ from amounts reported in the financial highlights.
From time to time the fund may receive proceeds from litigation settlements, without which performance would be lower.
8
EXPENSE TABLE
Fund expenses borne by the shareholders during the period, March 1, 2019 through August 31, 2019
As a shareholder of the fund, you incur two types of costs: (1) transaction costs, including sales charges (loads) on certain purchase or redemption payments, and (2) ongoing costs, including management fees; distribution and service(12b-1) fees; and other fund expenses. This example is intended to help you understand your ongoing costs (in dollars) of investing in the fund and to compare these costs with the ongoing costs of investing in other mutual funds.
The example is based on an investment of $1,000 invested at the beginning of the period and held for the entire period March 1, 2019 through August 31, 2019.
Actual Expenses
The first line for each share class in the following table provides information about actual account values and actual expenses. You may use the information in this line, together with the amount you invested, to estimate the expenses that you paid over the period. Simply divide your account value by $1,000 (for example, an $8,600 account value divided by $1,000 = 8.6), then multiply the result by the number in the first line under the heading entitled “Expenses Paid During Period” to estimate the expenses you paid on your account during this period.
Hypothetical Example for Comparison Purposes
The second line for each share class in the following table provides information about hypothetical account values and hypothetical expenses based on the fund’s actual expense ratio and an assumed rate of return of 5% per year before expenses, which is not the fund’s actual return. The hypothetical account values and expenses may not be used to estimate the actual ending account balance or expenses you paid for the period. You may use this information to compare the ongoing costs of investing in the fund and other funds. To do so, compare this 5% hypothetical example with the 5% hypothetical examples that appear in the shareholder reports of the other funds.
Please note that the expenses shown in the table are meant to highlight your ongoing costs only and do not reflect any transactional costs, such as sales charges (loads). Therefore, the second line for each share class in the table is useful in comparing ongoing costs only, and will not help you determine the relative total costs of owning different funds. In addition, if these transactional costs were included, your costs would have been higher.
9
Expense Table – continued
| | | | | | | | | | | | | | | | | | |
Share
Class | | | | Annualized
Expense
Ratio | | | Beginning
Account Value
3/01/19 | | | Ending
Account Value
8/31/19 | | | Expenses
Paid During
Period (p)
3/01/19-8/31/19 | |
| A | | Actual | | | 0.82% | | | | $1,000.00 | | | | $1,057.25 | | | | $4.25 | |
| | Hypothetical (h) | | | 0.82% | | | | $1,000.00 | | | | $1,021.07 | | | | $4.18 | |
| B | | Actual | | | 1.57% | | | | $1,000.00 | | | | $1,053.47 | | | | $8.13 | |
| | Hypothetical (h) | | | 1.57% | | | | $1,000.00 | | | | $1,017.29 | | | | $7.98 | |
| C | | Actual | | | 1.57% | | | | $1,000.00 | | | | $1,053.70 | | | | $8.13 | |
| | Hypothetical (h) | | | 1.57% | | | | $1,000.00 | | | | $1,017.29 | | | | $7.98 | |
| I | | Actual | | | 0.57% | | | | $1,000.00 | | | | $1,058.61 | | | | $2.96 | |
| | Hypothetical (h) | | | 0.57% | | | | $1,000.00 | | | | $1,022.33 | | | | $2.91 | |
| R1 | | Actual | | | 1.57% | | | | $1,000.00 | | | | $1,053.28 | | | | $8.13 | |
| | Hypothetical (h) | | | 1.57% | | | | $1,000.00 | | | | $1,017.29 | | | | $7.98 | |
| R2 | | Actual | | | 1.07% | | | | $1,000.00 | | | | $1,056.10 | | | | $5.55 | |
| | Hypothetical (h) | | | 1.07% | | | | $1,000.00 | | | | $1,019.81 | | | | $5.45 | |
| R3 | | Actual | | | 0.82% | | | | $1,000.00 | | | | $1,057.47 | | | | $4.25 | |
| | Hypothetical (h) | | | 0.82% | | | | $1,000.00 | | | | $1,021.07 | | | | $4.18 | |
| R4 | | Actual | | | 0.57% | | | | $1,000.00 | | | | $1,058.97 | | | | $2.96 | |
| | Hypothetical (h) | | | 0.57% | | | | $1,000.00 | | | | $1,022.33 | | | | $2.91 | |
| R6 | | Actual | | | 0.46% | | | | $1,000.00 | | | | $1,059.43 | | | | $2.39 | |
| | Hypothetical (h) | | | 0.46% | | | | $1,000.00 | | | | $1,022.89 | | | | $2.35 | |
| 529A | | Actual | | | 0.84% | | | | $1,000.00 | | | | $1,057.42 | | | | $4.36 | |
| | Hypothetical (h) | | | 0.84% | | | | $1,000.00 | | | | $1,020.97 | | | | $4.28 | |
| 529B | | Actual | | | 1.61% | | | | $1,000.00 | | | | $1,053.39 | | | | $8.33 | |
| | Hypothetical (h) | | | 1.61% | | | | $1,000.00 | | | | $1,017.09 | | | | $8.19 | |
| 529C | | Actual | | | 1.62% | | | | $1,000.00 | | | | $1,053.35 | | | | $8.38 | |
| | Hypothetical (h) | | | 1.62% | | | | $1,000.00 | | | | $1,017.04 | | | | $8.24 | |
| (h) | 5% class return per year before expenses. |
| (p) | “Expenses Paid During Period” are equal to each class’s annualized expense ratio, as shown above, multiplied by the average account value over the period, multiplied by 184/365 (to reflect theone-half year period). Expenses paid do not include any applicable sales charges (loads). If these transaction costs had been included, your costs would have been higher. |
Notes to Expense Table
Each class with a Rule12b-1 service fee is subject to a rebate of a portion of such fee. Such rebates are included in the expense ratios above. For Class 529A shares this rebate reduced the expense ratio above by 0.03%. See Note 3 in the Notes to Financial Statements for additional information.
10
PORTFOLIO OF INVESTMENTS
8/31/19
The Portfolio of Investments is a complete list of all securities owned by your fund. It is categorized by broad-based asset classes.
| | | | | | | | |
| Common Stocks - 98.6% | | | | | | | | |
| | |
| Issuer | | Shares/Par | | | Value ($) | |
| Aerospace - 6.6% | | | | | | | | |
| Honeywell International, Inc. | | | 5,871,120 | | | $ | 966,503,774 | |
| Lockheed Martin Corp. | | | 1,451,570 | | | | 557,562,553 | |
| Northrop Grumman Corp. | | | 2,963,214 | | | | 1,090,077,534 | |
| United Technologies Corp. | | | 4,217,199 | | | | 549,247,998 | |
| | | | | | | | |
| | | | | | | $ | 3,163,391,859 | |
| Alcoholic Beverages - 1.4% | | | | | | | | |
| Diageo PLC | | | 15,489,476 | | | $ | 660,325,265 | |
| | |
| Apparel Manufacturers - 0.1% | | | | | | | | |
| Hanesbrands, Inc. | | | 5,126,874 | | | $ | 70,033,099 | |
| | |
| Automotive - 1.1% | | | | | | | | |
| Aptiv PLC | | | 4,884,678 | | | $ | 406,258,669 | |
| Harley-Davidson, Inc. | | | 1,461,328 | | | | 46,616,363 | |
| Lear Corp. | | | 675,631 | | | | 75,846,336 | |
| | | | | | | | |
| | | | | | | $ | 528,721,368 | |
| Broadcasting - 0.3% | | | | | | | | |
| Omnicom Group, Inc. | | | 2,100,879 | | | $ | 159,792,857 | |
| | |
| Brokerage & Asset Managers - 2.6% | | | | | | | | |
| BlackRock, Inc. | | | 1,012,699 | | | $ | 427,926,089 | |
| NASDAQ, Inc. | | | 5,677,232 | | | | 566,814,843 | |
| T. Rowe Price Group, Inc. | | | 2,104,819 | | | | 232,835,078 | |
| | | | | | | | |
| | | | | | | $ | 1,227,576,010 | |
| Business Services - 7.5% | | | | | | | | |
| Accenture PLC, “A” | | | 7,255,033 | | | $ | 1,437,729,890 | |
| Amdocs Ltd. | | | 268,833 | | | | 17,404,248 | |
| Cognizant Technology Solutions Corp., “A” | | | 3,197,403 | | | | 196,288,570 | |
| DXC Technology Co. | | | 2,852,415 | | | | 94,757,226 | |
| Equifax, Inc. | | | 3,134,213 | | | | 458,786,099 | |
| Fidelity National Information Services, Inc. | | | 4,950,957 | | | | 674,419,363 | |
| Fiserv, Inc. (a) | | | 6,762,147 | | | | 723,144,000 | |
| | | | | | | | |
| | | | | | | $ | 3,602,529,396 | |
| Cable TV - 3.0% | | | | | | | | |
| Comcast Corp., “A” | | | 32,373,978 | | | $ | 1,432,872,266 | |
11
Portfolio of Investments – continued
| | | | | | | | |
| | |
| Issuer | | Shares/Par | | | Value ($) | |
| Common Stocks - continued | | | | | | | | |
| Chemicals - 2.6% | | | | | | | | |
| 3M Co. | | | 2,554,046 | | | $ | 413,040,319 | |
| PPG Industries, Inc. | | | 7,663,606 | | | | 849,050,909 | |
| | | | | | | | |
| | | | | | | $ | 1,262,091,228 | |
| Construction - 2.1% | | | | | | | | |
| Sherwin-Williams Co. | | | 992,427 | | | $ | 522,760,922 | |
| Stanley Black & Decker, Inc. | | | 3,580,287 | | | | 475,676,931 | |
| | | | | | | | |
| | | | | | | $ | 998,437,853 | |
| Consumer Products - 1.3% | | | | | | | | |
| Colgate-Palmolive Co. | | | 1,397,430 | | | $ | 103,619,434 | |
| Kimberly-Clark Corp. | | | 1,276,805 | | | | 180,169,954 | |
| Procter & Gamble Co. | | | 908,956 | | | | 109,283,780 | |
| Reckitt Benckiser Group PLC | | | 2,719,559 | | | | 211,753,044 | |
| | | | | | | | |
| | | | | | | $ | 604,826,212 | |
| Electrical Equipment - 1.8% | | | | | | | | |
| HD Supply Holdings, Inc. (a) | | | 2,257,984 | | | $ | 87,858,157 | |
| Johnson Controls International PLC | | | 17,844,845 | | | | 761,796,433 | |
| | | | | | | | |
| | | | | | | $ | 849,654,590 | |
| Electronics - 3.3% | | | | | | | | |
| Analog Devices, Inc. | | | 3,330,206 | | | $ | 365,756,525 | |
| NXP Semiconductors N.V. | | | 1,164,109 | | | | 118,902,093 | |
| Texas Instruments, Inc. | | | 8,660,754 | | | | 1,071,768,308 | |
| | | | | | | | |
| | | | | | | $ | 1,556,426,926 | |
| Energy - Independent - 1.0% | | | | | | | | |
| EOG Resources, Inc. | | | 3,580,622 | | | $ | 265,646,346 | |
| Occidental Petroleum Corp. | | | 2,630,847 | | | | 114,389,227 | |
| Pioneer Natural Resources Co. | | | 790,604 | | | | 97,576,346 | |
| | | | | | | | |
| | | | | | | $ | 477,611,919 | |
| Energy - Integrated - 1.4% | | | | | | | | |
| Chevron Corp. | | | 3,188,418 | | | $ | 375,340,567 | |
| Exxon Mobil Corp. | | | 4,562,714 | | | | 312,454,655 | |
| | | | | | | | |
| | | | | | | $ | 687,795,222 | |
| Food & Beverages - 4.0% | | | | | | | | |
| Archer Daniels Midland Co. | | | 6,213,411 | | | $ | 236,420,289 | |
| Danone S.A. | | | 2,764,547 | | | | 247,505,980 | |
| General Mills, Inc. | | | 1,635,504 | | | | 87,990,115 | |
| J.M. Smucker Co. | | | 1,647,093 | | | | 173,208,300 | |
| Nestle S.A. | | | 8,075,144 | | | | 905,623,626 | |
12
Portfolio of Investments – continued
| | | | | | | | |
| | |
| Issuer | | Shares/Par | | | Value ($) | |
| Common Stocks - continued | | | | | | | | |
| Food & Beverages - continued | | | | | | | | |
| PepsiCo, Inc. | | | 2,040,248 | | | $ | 278,963,109 | |
| | | | | | | | |
| | | | | | | $ | 1,929,711,419 | |
| Health Maintenance Organizations - 1.7% | | | | | | | | |
| Cigna Corp. | | | 5,228,133 | | | $ | 804,975,638 | |
| | |
| Insurance - 7.9% | | | | | | | | |
| Aon PLC | | | 5,836,380 | | | $ | 1,137,218,643 | |
| Chubb Ltd. | | | 6,460,757 | | | | 1,009,687,104 | |
| Marsh & McLennan Cos., Inc. | | | 3,958,923 | | | | 395,456,819 | |
| MetLife, Inc. | | | 5,225,253 | | | | 231,478,708 | |
| Travelers Cos., Inc. | | | 6,770,444 | | | | 994,984,450 | |
| | | | | | | | |
| | | | | | | $ | 3,768,825,724 | |
| Machinery & Tools - 3.7% | | | | | | | | |
| Eaton Corp. PLC | | | 6,610,098 | | | $ | 533,567,111 | |
| Illinois Tool Works, Inc. | | | 4,910,547 | | | | 735,894,573 | |
| Ingersoll-Rand Co. PLC, “A” | | | 4,054,259 | | | | 490,930,222 | |
| | | | | | | | |
| | | | | | | $ | 1,760,391,906 | |
| Major Banks - 10.8% | | | | | | | | |
| Bank of New York Mellon Corp. | | | 8,899,437 | | | $ | 374,310,320 | |
| Goldman Sachs Group, Inc. | | | 3,785,119 | | | | 771,823,615 | |
| JPMorgan Chase & Co. | | | 19,265,229 | | | | 2,116,478,058 | |
| PNC Financial Services Group, Inc. | | | 4,819,793 | | | | 621,415,911 | |
| State Street Corp. | | | 5,510,351 | | | | 282,736,110 | |
| Wells Fargo & Co. | | | 21,446,110 | | | | 998,745,343 | |
| | | | | | | | |
| | | | | | | $ | 5,165,509,357 | |
| Medical & Health Technology & Services - 0.7% | | | | | | | | |
| McKesson Corp. | | | 2,480,741 | | | $ | 343,012,058 | |
| | |
| Medical Equipment - 7.6% | | | | | | | | |
| Abbott Laboratories | | | 7,743,325 | | | $ | 660,660,489 | |
| Danaher Corp. | | | 6,155,381 | | | | 874,618,086 | |
| Medtronic PLC | | | 13,301,185 | | | | 1,435,064,850 | |
| Thermo Fisher Scientific, Inc. | | | 2,270,952 | | | | 651,899,481 | |
| | | | | | | | |
| | | | | | | $ | 3,622,242,906 | |
| Oil Services - 0.9% | | | | | | | | |
| Schlumberger Ltd. | | | 12,725,635 | | | $ | 412,692,343 | |
| | |
| Other Banks & Diversified Financials - 6.3% | | | | | | | | |
| American Express Co. | | | 3,126,957 | | | $ | 376,391,814 | |
| BB&T Corp. | | | 13,732,735 | | | | 654,364,823 | |
13
Portfolio of Investments – continued
| | | | | | | | |
| | |
| Issuer | | Shares/Par | | | Value ($) | |
| Common Stocks - continued | | | | | | | | |
| Other Banks & Diversified Financials - continued | | | | | | | | |
| Citigroup, Inc. | | | 15,403,494 | | | $ | 991,214,839 | |
| U.S. Bancorp | | | 19,242,255 | | | | 1,013,874,416 | |
| | | | | | | | |
| | | | | | | $ | 3,035,845,892 | |
| Pharmaceuticals - 7.0% | | | | | | | | |
| Johnson & Johnson | | | 12,057,393 | | | $ | 1,547,686,965 | |
| Merck & Co., Inc. | | | 6,506,787 | | | | 562,641,872 | |
| Novartis AG | | | 1,269,564 | | | | 114,174,177 | |
| Pfizer, Inc. | | | 26,138,914 | | | | 929,238,393 | |
| Roche Holding AG | | | 725,818 | | | | 198,440,364 | |
| | | | | | | | |
| | | | | | | $ | 3,352,181,771 | |
| Printing & Publishing - 0.9% | | | | | | | | |
| Moody’s Corp. | | | 1,949,132 | | | $ | 420,193,877 | |
| | |
| Railroad & Shipping - 1.9% | | | | | | | | |
| Canadian National Railway Co. | | | 3,169,464 | | | $ | 292,034,413 | |
| Union Pacific Corp. | | | 3,706,660 | | | | 600,330,654 | |
| | | | | | | | |
| | | | | | | $ | 892,365,067 | |
| Real Estate - 0.5% | | | | | | | | |
| Public Storage, Inc., REIT | | | 819,254 | | | $ | 216,889,304 | |
| | |
| Specialty Chemicals - 0.5% | | | | | | | | |
| Corteva, Inc. | | | 2,039,902 | | | $ | 59,809,926 | |
| DuPont de Nemours, Inc. | | | 2,829,102 | | | | 192,180,899 | |
| | | | | | | | |
| | | | | | | $ | 251,990,825 | |
| Telephone Services - 0.5% | | | | | | | | |
| Verizon Communications, Inc. | | | 3,994,699 | | | $ | 232,331,694 | |
| | |
| Tobacco - 1.8% | | | | | | | | |
| Altria Group, Inc. | | | 4,808,310 | | | $ | 210,315,479 | |
| Philip Morris International, Inc. | | | 9,124,388 | | | | 657,777,131 | |
| | | | | | | | |
| | | | | | | $ | 868,092,610 | |
| Utilities - Electric Power - 5.8% | | | | | | | | |
| Duke Energy Corp. | | | 11,351,956 | | | $ | 1,052,780,400 | |
| FirstEnergy Corp. | | | 13,987,786 | | | | 643,438,156 | |
| Southern Co. | | | 14,222,186 | | | | 828,584,556 | |
| Xcel Energy, Inc. | | | 3,939,873 | | | | 253,018,644 | |
| | | | | | | | |
| | | | | | | $ | 2,777,821,756 | |
| Total Common Stocks (Identified Cost, $28,881,506,324) | | | $ | 47,137,160,217 | |
14
Portfolio of Investments – continued
| | | | | | | | |
| Investment Companies (h) - 1.0% | | | | | | | | |
| | |
| Issuer | | Shares/Par | | | Value ($) | |
| Money Market Funds - 1.0% | | | | | | | | |
MFS Institutional Money Market Portfolio, 2.17% (v)
(Identified Cost, $453,088,443) | | | 453,086,810 | | | $ | 453,132,119 | |
| | |
| Other Assets, Less Liabilities - 0.4% | | | | | | | 193,799,027 | |
| Net Assets - 100.0% | | | | | | $ | 47,784,091,363 | |
| (a) | Non-income producing security. |
| (h) | An affiliated issuer, which may be considered one in which the fund owns 5% or more of the outstanding voting securities, or a company which is under common control. At period end, the aggregate values of the fund’s investments in affiliated issuers and in unaffiliated issuers were $453,132,119 and $47,137,160,217, respectively. |
| (v) | Affiliated issuer that is available only to investment companies managed by MFS. The rate quoted for the MFS Institutional Money Market Portfolio is the annualizedseven-day yield of the fund at period end. |
The following abbreviations are used in this report and are defined:
| REIT | | Real Estate Investment Trust |
See Notes to Financial Statements
15
Financial Statements
STATEMENT OF ASSETS AND LIABILITIES
At 8/31/19
This statement represents your fund’s balance sheet, which details the assets and liabilities comprising the total value of the fund.
| | | | |
| Assets | | | | |
Investments in unaffiliated issuers, at value (identified cost, $28,881,506,324) | | | $47,137,160,217 | |
Investments in affiliated issuers, at value (identified cost, $453,088,443) | | | 453,132,119 | |
Cash | | | 1,585 | |
Receivables for | | | | |
Investments sold | | | 64,548,374 | |
Fund shares sold | | | 96,393,341 | |
Dividends | | | 143,227,642 | |
Other assets | | | 35,588 | |
Total assets | | | $47,894,498,866 | |
| |
| Liabilities | | | | |
Payables for | | | | |
Investments purchased | | | $27,048,781 | |
Fund shares reacquired | | | 66,763,323 | |
Payable to affiliates | | | | |
Investment adviser | | | 1,749,899 | |
Administrative services fee | | | 4,737 | |
Shareholder servicing costs | | | 13,373,059 | |
Distribution and service fees | | | 267,771 | |
Program manager fees | | | 134 | |
Payable for independent Trustees’ compensation | | | 2,464 | |
Accrued expenses and other liabilities | | | 1,197,335 | |
Total liabilities | | | $110,407,503 | |
Net assets | | | $47,784,091,363 | |
| |
| Net assets consist of | | | | |
Paid-in capital | | | $28,910,177,699 | |
Total distributable earnings (loss) | | | 18,873,913,664 | |
Net assets | | | $47,784,091,363 | |
Shares of beneficial interest outstanding | | | 1,154,212,538 | |
16
Statement of Assets and Liabilities – continued
| | | | | | | | | | | | |
| | | |
| | | Net assets | | | Shares
outstanding | | | Net asset value
per share (a) | |
| Class A | | | $6,520,131,739 | | | | 157,815,394 | | | | $41.31 | |
| Class B | | | 84,737,485 | | | | 2,062,328 | | | | 41.09 | |
| Class C | | | 881,020,467 | | | | 21,596,148 | | | | 40.80 | |
| Class I | | | 20,076,773,041 | | | | 483,034,308 | | | | 41.56 | |
| Class R1 | | | 21,820,493 | | | | 539,243 | | | | 40.47 | |
| Class R2 | | | 437,220,637 | | | | 10,697,826 | | | | 40.87 | |
| Class R3 | | | 2,096,742,955 | | | | 50,956,036 | | | | 41.15 | |
| Class R4 | | | 2,916,673,956 | | | | 70,589,790 | | | | 41.32 | |
| Class R6 | | | 14,716,194,203 | | | | 356,118,955 | | | | 41.32 | |
| Class 529A | | | 27,149,220 | | | | 662,820 | | | | 40.96 | |
| Class 529B | | | 679,705 | | | | 16,801 | | | | 40.46 | |
| Class 529C | | | 4,947,462 | | | | 122,889 | | | | 40.26 | |
| (a) | Maximum offering price per share was equal to the net asset value per share for all share classes, except for Classes A and 529A, for which the maximum offering prices per share were $43.83 [100 / 94.25 x $41.31] and $43.46 [100 / 94.25 x $40.96], respectively. On sales of $50,000 or more, the maximum offering prices of Class A and Class 529A shares are reduced. A contingent deferred sales charge may be imposed on redemptions of Class A, Class B, Class C, Class 529B, and Class 529C shares. Redemption price per share was equal to the net asset value per share for Classes I, R1, R2, R3, R4, R6, and 529A. |
See Notes to Financial Statements
17
Financial Statements
STATEMENT OF OPERATIONS
Year ended 8/31/19
This statement describes how much your fund earned in investment income and accrued in expenses. It also describes any gains and/or losses generated by fund operations.
| | | | |
| Net investment income (loss) | | | | |
Income | | | | |
Dividends | | | $1,303,461,333 | |
Dividends from affiliated issuers | | | 9,362,702 | |
Other | | | 847,696 | |
Foreign taxes withheld | | | (6,134,359 | ) |
Total investment income | | | $1,307,537,372 | |
Expenses | | | | |
Management fee | | | $213,989,516 | |
Distribution and service fees | | | 34,283,078 | |
Shareholder servicing costs | | | 35,229,922 | |
Program manager fees | | | 15,751 | |
Administrative services fee | | | 577,628 | |
Independent Trustees’ compensation | | | 223,681 | |
Custodian fee | | | 674,636 | |
Shareholder communications | | | 1,752,703 | |
Audit and tax fees | | | 70,969 | |
Legal fees | | | 429,116 | |
Miscellaneous | | | 1,267,913 | |
Total expenses | | | $288,514,913 | |
Reduction of expenses by investment adviser and distributor | | | (4,591,544 | ) |
Net expenses | | | $283,923,369 | |
Net investment income (loss) | | | $1,023,614,003 | |
| |
| Realized and unrealized gain (loss) | | | | |
Realized gain (loss) (identified cost basis) | | | | |
Unaffiliated issuers | | | $748,868,260 | |
Affiliated issuers | | | 11,149 | |
Foreign currency | | | (725,041 | ) |
Net realized gain (loss) | | | $748,154,368 | |
Change in unrealized appreciation or depreciation | | | | |
Unaffiliated issuers | | | $492,395,667 | |
Affiliated issuers | | | (5,407 | ) |
Translation of assets and liabilities in foreign currencies | | | (159,534 | ) |
Net unrealized gain (loss) | | | $492,230,726 | |
Net realized and unrealized gain (loss) | | | $1,240,385,094 | |
Change in net assets from operations | | | $2,263,999,097 | |
See Notes to Financial Statements
18
Financial Statements
STATEMENTS OF CHANGES IN NET ASSETS
These statements describe the increases and/or decreases in net assets resulting from operations, any distributions, and any shareholder transactions.
| | | | | | | | |
| | | Year ended | |
| | | 8/31/19 | | | 8/31/18 | |
| Change in net assets | | | | | | |
| | |
| From operations | | | | | | | | |
Net investment income (loss) | | | $1,023,614,003 | | | | $788,166,589 | |
Net realized gain (loss) | | | 748,154,368 | | | | 1,173,543,965 | |
Net unrealized gain (loss) | | | 492,230,726 | | | | 2,302,666,965 | |
Change in net assets from operations | | | $2,263,999,097 | | | | $4,264,377,519 | |
Total distributions to shareholders (a) | | | $(1,629,458,929 | ) | | | $(2,172,546,240 | ) |
Change in net assets from fund share transactions | | | $(1,485,669,529 | ) | | | $2,328,693,215 | |
Total change in net assets | | | $(851,129,361 | ) | | | $4,420,524,494 | |
| | |
| Net assets | | | | | | | | |
At beginning of period | | | 48,635,220,724 | | | | 44,214,696,230 | |
At end of period (b) | | | $47,784,091,363 | | | | $48,635,220,724 | |
| (a) | Distributions from net investment income and from net realized gain are no longer required to be separately disclosed. For the year ended August 31, 2018, distributions from net investment income and from net realized gain were $793,759,240 and $1,378,787,000, respectively. |
| (b) | Parenthetical disclosure of undistributed net investment income is no longer required. For the year ended August 31, 2018, end of period net assets included undistributed net investment income of $127,744,500. |
See Notes to Financial Statements
19
Financial Statements
FINANCIAL HIGHLIGHTS
The financial highlights table is intended to help you understand the fund’s financial performance for the past 5 years. Certain information reflects financial results for a single fund share. The total returns in the table represent the rate that an investor would have earned (or lost) on an investment in the fund share class (assuming reinvestment of all distributions) held for the entire period.
| | | | | | | | | | | | | | | | | | | | |
| Class A | | Year ended | |
| | | | | |
| | | 8/31/19 | | | 8/31/18 | | | 8/31/17 | | | 8/31/16 | | | 8/31/15 | |
Net asset value, beginning of period | | | $40.82 | | | | $39.00 | | | | $35.93 | | | | $33.38 | | | | $34.70 | |
| | |
| Income (loss) from investment operations | | | | | | | | | |
Net investment income (loss) (d) | | | $0.79 | | | | $0.59 | | | | $0.66 | (c) | | | $0.54 | | | | $0.63 | |
Net realized and unrealized gain (loss) | | | 1.03 | | | | 3.04 | | | | 3.65 | | | | 3.81 | | | | (0.36 | ) |
Total from investment operations | | | $1.82 | | | | $3.63 | | | | $4.31 | | | | $4.35 | | | | $0.27 | |
| | |
| Less distributions declared to shareholders | | | | | | | | | |
From net investment income | | | $(0.79 | ) | | | $(0.60 | ) | | | $(0.62 | ) | | | $(0.56 | ) | | | $(0.67 | ) |
From net realized gain | | | (0.54 | ) | | | (1.21 | ) | | | (0.62 | ) | | | (1.24 | ) | | | (0.92 | ) |
Total distributions declared to shareholders | | | $(1.33 | ) | | | $(1.81 | ) | | | $(1.24 | ) | | | $(1.80 | ) | | | $(1.59 | ) |
Net asset value, end of period (x) | | | $41.31 | | | | $40.82 | | | | $39.00 | | | | $35.93 | | | | $33.38 | |
Total return (%) (r)(s)(t)(x) | | | 4.85 | | | | 9.42 | | | | 12.24 | (c) | | | 13.55 | | | | 0.68 | |
| | |
Ratios (%) (to average net assets)
and Supplemental data: | | | | | | | | | |
Expenses before expense reductions (f) | | | 0.83 | | | | 0.82 | | | | 0.86 | (c) | | | 0.90 | | | | 0.90 | |
Expenses after expense reductions (f) | | | 0.82 | | | | 0.81 | | | | 0.84 | (c) | | | 0.86 | | | | 0.86 | |
Net investment income (loss) | | | 2.00 | | | | 1.46 | | | | 1.77 | (c) | | | 1.60 | | | | 1.80 | |
Portfolio turnover | | | 11 | | | | 11 | | | | 14 | | | | 12 | | | | 12 | |
Net assets at end of period (000 omitted) | | | $6,520,132 | | | | $6,736,296 | | | | $6,344,965 | | | | $9,033,842 | | | | $8,478,761 | |
See Notes to Financial Statements
20
Financial Highlights – continued
| | | | | | | | | | | | | | | | | | | | |
| Class B | | Year ended | |
| | | | | |
| | | 8/31/19 | | | 8/31/18 | | | 8/31/17 | | | 8/31/16 | | | 8/31/15 | |
Net asset value, beginning of period | | | $40.59 | | | | $38.76 | | | | $35.72 | | | | $33.19 | | | | $34.50 | |
| | |
| Income (loss) from investment operations | | | | | | | | | |
Net investment income (loss) (d) | | | $0.49 | | | | $0.28 | | | | $0.37 | (c) | | | $0.28 | | | | $0.37 | |
Net realized and unrealized gain (loss) | | | 1.03 | | | | 3.04 | | | | 3.64 | | | | 3.79 | | | | (0.35 | ) |
Total from investment operations | | | $1.52 | | | | $3.32 | | | | $4.01 | | | | $4.07 | | | | $0.02 | |
| | |
| Less distributions declared to shareholders | | | | | | | | | |
From net investment income | | | $(0.48 | ) | | | $(0.28 | ) | | | $(0.35 | ) | | | $(0.30 | ) | | | $(0.41 | ) |
From net realized gain | | | (0.54 | ) | | | (1.21 | ) | | | (0.62 | ) | | | (1.24 | ) | | | (0.92 | ) |
Total distributions declared to shareholders | | | $(1.02 | ) | | | $(1.49 | ) | | | $(0.97 | ) | | | $(1.54 | ) | | | $(1.33 | ) |
Net asset value, end of period (x) | | | $41.09 | | | | $40.59 | | | | $38.76 | | | | $35.72 | | | | $33.19 | |
Total return (%) (r)(s)(t)(x) | | | 4.08 | | | | 8.62 | | | | 11.40 | (c) | | | 12.68 | | | | (0.06 | ) |
| | |
Ratios (%) (to average net assets)
and Supplemental data: | | | | | | | | | |
Expenses before expense reductions (f) | | | 1.58 | | | | 1.57 | | | | 1.61 | (c) | | | 1.65 | | | | 1.65 | |
Expenses after expense reductions (f) | | | 1.57 | | | | 1.56 | | | | 1.59 | (c) | | | 1.61 | | | | 1.61 | |
Net investment income (loss) | | | 1.24 | | | | 0.71 | | | | 0.99 | (c) | | | 0.85 | | | | 1.05 | |
Portfolio turnover | | | 11 | | | | 11 | | | | 14 | | | | 12 | | | | 12 | |
Net assets at end of period (000 omitted) | | | $84,737 | | | | $111,494 | | | | $137,361 | | | | $154,742 | | | | $154,205 | |
| |
| Class C | | Year ended | |
| | | | | |
| | | 8/31/19 | | | 8/31/18 | | | 8/31/17 | | | 8/31/16 | | | 8/31/15 | |
Net asset value, beginning of period | | | $40.31 | | | | $38.52 | | | | $35.50 | | | | $33.00 | | | | $34.33 | |
| | |
| Income (loss) from investment operations | | | | | | | | | |
Net investment income (loss) (d) | | | $0.49 | | | | $0.28 | | | | $0.37 | (c) | | | $0.28 | | | | $0.37 | |
Net realized and unrealized gain (loss) | | | 1.03 | | | | 3.01 | | | | 3.62 | | | | 3.77 | | | | (0.36 | ) |
Total from investment operations | | | $1.52 | | | | $3.29 | | | | $3.99 | | | | $4.05 | | | | $0.01 | |
| | |
| Less distributions declared to shareholders | | | | | | | | | |
From net investment income | | | $(0.49 | ) | | | $(0.29 | ) | | | $(0.35 | ) | | | $(0.31 | ) | | | $(0.42 | ) |
From net realized gain | | | (0.54 | ) | | | (1.21 | ) | | | (0.62 | ) | | | (1.24 | ) | | | (0.92 | ) |
Total distributions declared to shareholders | | | $(1.03 | ) | | | $(1.50 | ) | | | $(0.97 | ) | | | $(1.55 | ) | | | $(1.34 | ) |
Net asset value, end of period (x) | | | $40.80 | | | | $40.31 | | | | $38.52 | | | | $35.50 | | | | $33.00 | |
Total return (%) (r)(s)(t)(x) | | | 4.10 | | | | 8.58 | | | | 11.43 | (c) | | | 12.69 | | | | (0.09 | ) |
| | |
Ratios (%) (to average net assets)
and Supplemental data: | | | | | | | | | |
Expenses before expense reductions (f) | | | 1.58 | | | | 1.57 | | | | 1.61 | (c) | | | 1.65 | | | | 1.65 | |
Expenses after expense reductions (f) | | | 1.57 | | | | 1.56 | | | | 1.59 | (c) | | | 1.61 | | | | 1.61 | |
Net investment income (loss) | | | 1.24 | | | | 0.71 | | | | 0.99 | (c) | | | 0.85 | | | | 1.06 | |
Portfolio turnover | | | 11 | | | | 11 | | | | 14 | | | | 12 | | | | 12 | |
Net assets at end of period (000 omitted) | | | $881,020 | | | | $1,050,477 | | | | $1,389,685 | | | | $1,538,605 | | | | $1,335,968 | |
See Notes to Financial Statements
21
Financial Highlights – continued
| | | | | | | | | | | | | | | | | | | | |
| Class I | | Year ended | |
| | | | | |
| | | 8/31/19 | | | 8/31/18 | | | 8/31/17 | | | 8/31/16 | | | 8/31/15 | |
Net asset value, beginning of period | | | $41.06 | | | | $39.22 | | | | $36.13 | | | | $33.56 | | | | $34.88 | |
| | |
| Income (loss) from investment operations | | | | | | | | | |
Net investment income (loss) (d) | | | $0.90 | | | | $0.70 | | | | $0.74 | (c) | | | $0.63 | | | | $0.72 | |
Net realized and unrealized gain (loss) | | | 1.02 | | | | 3.05 | | | | 3.70 | | | | 3.82 | | | | (0.36 | ) |
Total from investment operations | | | $1.92 | | | | $3.75 | | | | $4.44 | | | | $4.45 | | | | $0.36 | |
| | | |
| Less distributions declared to shareholders | | | | | | | | | | | | | |
From net investment income | | | $(0.88 | ) | | | $(0.70 | ) | | | $(0.73 | ) | | | $(0.64 | ) | | | $(0.76 | ) |
From net realized gain | | | (0.54 | ) | | | (1.21 | ) | | | (0.62 | ) | | | (1.24 | ) | | | (0.92 | ) |
Total distributions declared to shareholders | | | $(1.42 | ) | | | $(1.91 | ) | | | $(1.35 | ) | | | $(1.88 | ) | | | $(1.68 | ) |
Net asset value, end of period (x) | | | $41.56 | | | | $41.06 | | | | $39.22 | | | | $36.13 | | | | $33.56 | |
Total return (%) (r)(s)(t)(x) | | | 5.11 | | | | 9.69 | | | | 12.54 | (c) | | | 13.83 | | | | 0.93 | |
| | | |
Ratios (%) (to average net assets)
and Supplemental data: | | | | | | | | | | | | | |
Expenses before expense reductions (f) | | | 0.58 | | | | 0.57 | | | | 0.61 | (c) | | | 0.65 | | | | 0.65 | |
Expenses after expense reductions (f) | | | 0.57 | | | | 0.57 | | | | 0.59 | (c) | | | 0.61 | | | | 0.61 | |
Net investment income (loss) | | | 2.25 | | | | 1.72 | | | | 1.98 | (c) | | | 1.84 | | | | 2.06 | |
Portfolio turnover | | | 11 | | | | 11 | | | | 14 | | | | 12 | | | | 12 | |
Net assets at end of period (000 omitted) | | | $20,076,773 | | | | $20,727,676 | | | | $19,624,016 | | | | $17,134,836 | | | | $13,888,395 | |
| |
| Class R1 | | Year ended | |
| | | | | |
| | | 8/31/19 | | | 8/31/18 | | | 8/31/17 | | | 8/31/16 | | | 8/31/15 | |
Net asset value, beginning of period | | | $40.01 | | | | $38.25 | | | | $35.27 | | | | $32.79 | | | | $34.11 | |
| | | |
| Income (loss) from investment operations | | | | | | | | | | | | | |
Net investment income (loss) (d) | | | $0.48 | | | | $0.28 | | | | $0.36 | (c) | | | $0.28 | | | | $0.36 | |
Net realized and unrealized gain (loss) | | | 1.02 | | | | 2.99 | | | | 3.60 | | | | 3.74 | | | | (0.34 | ) |
Total from investment operations | | | $1.50 | | | | $3.27 | | | | $3.96 | | | | $4.02 | | | | $0.02 | |
| | | |
| Less distributions declared to shareholders | | | | | | | | | | | | | |
From net investment income | | | $(0.50 | ) | | | $(0.30 | ) | | | $(0.36 | ) | | | $(0.30 | ) | | | $(0.42 | ) |
From net realized gain | | | (0.54 | ) | | | (1.21 | ) | | | (0.62 | ) | | | (1.24 | ) | | | (0.92 | ) |
Total distributions declared to shareholders | | | $(1.04 | ) | | | $(1.51 | ) | | | $(0.98 | ) | | | $(1.54 | ) | | | $(1.34 | ) |
Net asset value, end of period (x) | | | $40.47 | | | | $40.01 | | | | $38.25 | | | | $35.27 | | | | $32.79 | |
Total return (%) (r)(s)(t)(x) | | | 4.08 | | | | 8.61 | | | | 11.40 | (c) | | | 12.69 | | | | (0.07 | ) |
| | | |
Ratios (%) (to average net assets)
and Supplemental data: | | | | | | | | | | | | | |
Expenses before expense reductions (f) | | | 1.58 | | | | 1.57 | | | | 1.61 | (c) | | | 1.65 | | | | 1.65 | |
Expenses after expense reductions (f) | | | 1.57 | | | | 1.56 | | | | 1.59 | (c) | | | 1.61 | | | | 1.61 | |
Net investment income (loss) | | | 1.24 | | | | 0.72 | | | | 0.99 | (c) | | | 0.85 | | | | 1.06 | |
Portfolio turnover | | | 11 | | | | 11 | | | | 14 | | | | 12 | | | | 12 | |
Net assets at end of period (000 omitted) | | | $21,820 | | | | $24,791 | | | | $26,663 | | | | $27,096 | | | | $27,860 | |
See Notes to Financial Statements
22
Financial Highlights – continued
| | | | | | | | | | | | | | | | | | | | |
| Class R2 | | Year ended | |
| | | | | |
| | | 8/31/19 | | | 8/31/18 | | | 8/31/17 | | | 8/31/16 | | | 8/31/15 | |
Net asset value, beginning of period | | | $40.39 | | | | $38.60 | | | | $35.59 | | | | $33.08 | | | | $34.40 | |
| | | |
| Income (loss) from investment operations | | | | | | | | | | | | | |
Net investment income (loss) (d) | | | $0.68 | | | | $0.48 | | | | $0.55 | (c) | | | $0.45 | | | | $0.54 | |
Net realized and unrealized gain (loss) | | | 1.03 | | | | 3.02 | | | | 3.62 | | | | 3.78 | | | | (0.35 | ) |
Total from investment operations | | | $1.71 | | | | $3.50 | | | | $4.17 | | | | $4.23 | | | | $0.19 | |
| | | |
| Less distributions declared to shareholders | | | | | | | | | | | | | |
From net investment income | | | $(0.69 | ) | | | $(0.50 | ) | | | $(0.54 | ) | | | $(0.48 | ) | | | $(0.59 | ) |
From net realized gain | | | (0.54 | ) | | | (1.21 | ) | | | (0.62 | ) | | | (1.24 | ) | | | (0.92 | ) |
Total distributions declared to shareholders | | | $(1.23 | ) | | | $(1.71 | ) | | | $(1.16 | ) | | | $(1.72 | ) | | | $(1.51 | ) |
Net asset value, end of period (x) | | | $40.87 | | | | $40.39 | | | | $38.60 | | | | $35.59 | | | | $33.08 | |
Total return (%) (r)(s)(t)(x) | | | 4.60 | | | | 9.15 | | | | 11.95 | (c) | | | 13.27 | | | | 0.43 | |
| | | |
Ratios (%) (to average net assets)
and Supplemental data: | | | | | | | | | | | | | |
Expenses before expense reductions (f) | | | 1.08 | | | | 1.07 | | | | 1.11 | (c) | | | 1.15 | | | | 1.15 | |
Expenses after expense reductions (f) | | | 1.07 | | | | 1.07 | | | | 1.09 | (c) | | | 1.11 | | | | 1.11 | |
Net investment income (loss) | | | 1.73 | | | | 1.21 | | | | 1.49 | (c) | | | 1.35 | | | | 1.54 | |
Portfolio turnover | | | 11 | | | | 11 | | | | 14 | | | | 12 | | | | 12 | |
Net assets at end of period (000 omitted) | | | $437,221 | | | | $550,200 | | | | $614,044 | | | | $567,665 | | | | $521,592 | |
| |
| Class R3 | | Year ended | |
| | | | | |
| | | 8/31/19 | | | 8/31/18 | | | 8/31/17 | | | 8/31/16 | | | 8/31/15 | |
Net asset value, beginning of period | | | $40.66 | | | | $38.85 | | | | $35.81 | | | | $33.28 | | | | $34.60 | |
| | | |
| Income (loss) from investment operations | | | | | | | | | | | | | |
Net investment income (loss) (d) | | | $0.79 | | | | $0.59 | | | | $0.65 | (c) | | | $0.54 | | | | $0.63 | |
Net realized and unrealized gain (loss) | | | 1.03 | | | | 3.03 | | | | 3.64 | | | | 3.79 | | | | (0.35 | ) |
Total from investment operations | | | $1.82 | | | | $3.62 | | | | $4.29 | | | | $4.33 | | | | $0.28 | |
| | | |
| Less distributions declared to shareholders | | | | | | | | | | | | | |
From net investment income | | | $(0.79 | ) | | | $(0.60 | ) | | | $(0.63 | ) | | | $(0.56 | ) | | | $(0.68 | ) |
From net realized gain | | | (0.54 | ) | | | (1.21 | ) | | | (0.62 | ) | | | (1.24 | ) | | | (0.92 | ) |
Total distributions declared to shareholders | | | $(1.33 | ) | | | $(1.81 | ) | | | $(1.25 | ) | | | $(1.80 | ) | | | $(1.60 | ) |
Net asset value, end of period (x) | | | $41.15 | | | | $40.66 | | | | $38.85 | | | | $35.81 | | | | $33.28 | |
Total return (%) (r)(s)(t)(x) | | | 4.87 | | | | 9.43 | | | | 12.23 | (c) | | | 13.54 | | | | 0.69 | |
| | | |
Ratios (%) (to average net assets)
and Supplemental data: | | | | | | | | | | | | | |
Expenses before expense reductions (f) | | | 0.83 | | | | 0.82 | | | | 0.86 | (c) | | | 0.90 | | | | 0.90 | |
Expenses after expense reductions (f) | | | 0.82 | | | | 0.82 | | | | 0.84 | (c) | | | 0.86 | | | | 0.86 | |
Net investment income (loss) | | | 1.99 | | | | 1.47 | | | | 1.74 | (c) | | | 1.60 | | | | 1.80 | |
Portfolio turnover | | | 11 | | | | 11 | | | | 14 | | | | 12 | | | | 12 | |
Net assets at end of period (000 omitted) | | | $2,096,743 | | | | $2,259,562 | | | | $2,030,023 | | | | $1,903,910 | | | | $1,571,281 | |
See Notes to Financial Statements
23
Financial Highlights – continued
| | | | | | | | | | | | | | | | | | | | |
| Class R4 | | Year ended | |
| | | | | |
| | | 8/31/19 | | | 8/31/18 | | | 8/31/17 | | | 8/31/16 | | | 8/31/15 | |
Net asset value, beginning of period | | | $40.82 | | | | $39.00 | | | | $35.94 | | | | $33.40 | | | | $34.72 | |
| | | |
| Income (loss) from investment operations | | | | | | | | | | | | | |
Net investment income (loss) (d) | | | $0.89 | | | | $0.69 | | | | $0.74 | (c) | | | $0.62 | | | | $0.72 | |
Net realized and unrealized gain (loss) | | | 1.03 | | | | 3.04 | | | | 3.67 | | | | 3.80 | | | | (0.36 | ) |
Total from investment operations | | | $1.92 | | | | $3.73 | | | | $4.41 | | | | $4.42 | | | | $0.36 | |
| | | |
| Less distributions declared to shareholders | | | | | | | | | | | | | |
From net investment income | | | $(0.88 | ) | | | $(0.70 | ) | | | $(0.73 | ) | | | $(0.64 | ) | | | $(0.76 | ) |
From net realized gain | | | (0.54 | ) | | | (1.21 | ) | | | (0.62 | ) | | | (1.24 | ) | | | (0.92 | ) |
Total distributions declared to shareholders | | | $(1.42 | ) | | | $(1.91 | ) | | | $(1.35 | ) | | | $(1.88 | ) | | | $(1.68 | ) |
Net asset value, end of period (x) | | | $41.32 | | | | $40.82 | | | | $39.00 | | | | $35.94 | | | | $33.40 | |
Total return (%) (r)(s)(t)(x) | | | 5.14 | | | | 9.70 | | | | 12.52 | (c) | | | 13.80 | | | | 0.93 | |
| | | |
Ratios (%) (to average net assets)
and Supplemental data: | | | | | | | | | | | | | |
Expenses before expense reductions (f) | | | 0.58 | | | | 0.57 | | | | 0.61 | (c) | | | 0.65 | | | | 0.65 | |
Expenses after expense reductions (f) | | | 0.57 | | | | 0.57 | | | | 0.59 | (c) | | | 0.61 | | | | 0.61 | |
Net investment income (loss) | | | 2.24 | | | | 1.72 | | | | 1.99 | (c) | | | 1.85 | | | | 2.05 | |
Portfolio turnover | | | 11 | | | | 11 | | | | 14 | | | | 12 | | | | 12 | |
Net assets at end of period (000 omitted) | | | $2,916,674 | | | | $3,201,331 | | | | $3,060,883 | | | | $3,233,421 | | | | $2,787,041 | |
| |
| Class R6 | | Year ended | |
| | | | | |
| | | 8/31/19 | | | 8/31/18 | | | 8/31/17 | | | 8/31/16 | | | 8/31/15 | |
Net asset value, beginning of period | | | $40.83 | | | | $39.01 | | | | $35.94 | | | | $33.40 | | | | $34.72 | |
| | | |
| Income (loss) from investment operations | | | | | | | | | | | | | |
Net investment income (loss) (d) | | | $0.93 | | | | $0.73 | | | | $0.76 | (c) | | | $0.66 | | | | $0.76 | |
Net realized and unrealized gain (loss) | | | 1.02 | | | | 3.04 | | | | 3.69 | | | | 3.80 | | | | (0.36 | ) |
Total from investment operations | | | $1.95 | | | | $3.77 | | | | $4.45 | | | | $4.46 | | | | $0.40 | |
| | | |
| Less distributions declared to shareholders | | | | | | | | | | | | | |
From net investment income | | | $(0.92 | ) | | | $(0.74 | ) | | | $(0.76 | ) | | | $(0.68 | ) | | | $(0.80 | ) |
From net realized gain | | | (0.54 | ) | | | (1.21 | ) | | | (0.62 | ) | | | (1.24 | ) | | | (0.92 | ) |
Total distributions declared to shareholders | | | $(1.46 | ) | | | $(1.95 | ) | | | $(1.38 | ) | | | $(1.92 | ) | | | $(1.72 | ) |
Net asset value, end of period (x) | | | $41.32 | | | | $40.83 | | | | $39.01 | | | | $35.94 | | | | $33.40 | |
Total return (%) (r)(s)(t)(x) | | | 5.22 | | | | 9.81 | | | | 12.66 | (c) | | | 13.93 | | | | 1.04 | |
| | | | |
Ratios (%) (to average net assets)
and Supplemental data: | | | | | | | | | | | | | | | | | |
Expenses before expense reductions (f) | | | 0.48 | | | | 0.47 | | | | 0.51 | (c) | | | 0.54 | | | | 0.54 | |
Expenses after expense reductions (f) | | | 0.47 | | | | 0.47 | | | | 0.49 | (c) | | | 0.50 | | | | 0.50 | |
Net investment income (loss) | | | 2.35 | | | | 1.83 | | | | 2.04 | (c) | | | 1.95 | | | | 2.17 | |
Portfolio turnover | | | 11 | | | | 11 | | | | 14 | | | | 12 | | | | 12 | |
Net assets at end of period (000 omitted) | | | $14,716,194 | | | | $13,941,823 | | | | $10,957,734 | | | | $6,218,954 | | | | $4,846,172 | |
See Notes to Financial Statements
24
Financial Highlights – continued
| | | | | | | | | | | | | | | | | | | | |
| Class 529A | | Year ended | |
| | | | | |
| | | 8/31/19 | | | 8/31/18 | | | 8/31/17 | | | 8/31/16 | | | 8/31/15 | |
Net asset value, beginning of period | | | $40.48 | | | | $38.69 | | | | $35.67 | | | | $33.15 | | | | $34.48 | |
| | | |
| Income (loss) from investment operations | | | | | | | | | | | | | |
Net investment income (loss) (d) | | | $0.78 | | | | $0.58 | | | | $0.63 | (c) | | | $0.53 | | | | $0.63 | |
Net realized and unrealized gain (loss) | | | 1.02 | | | | 3.02 | | | | 3.64 | | | | 3.79 | | | | (0.36 | ) |
Total from investment operations | | | $1.80 | | | | $3.60 | | | | $4.27 | | | | $4.32 | | | | $0.27 | |
| | | |
| Less distributions declared to shareholders | | | | | | | | | | | | | |
From net investment income | | | $(0.78 | ) | | | $(0.60 | ) | | | $(0.63 | ) | | | $(0.56 | ) | | | $(0.68 | ) |
From net realized gain | | | (0.54 | ) | | | (1.21 | ) | | | (0.62 | ) | | | (1.24 | ) | | | (0.92 | ) |
Total distributions declared to shareholders | | | $(1.32 | ) | | | $(1.81 | ) | | | $(1.25 | ) | | | $(1.80 | ) | | | $(1.60 | ) |
Net asset value, end of period (x) | | | $40.96 | | | | $40.48 | | | | $38.69 | | | | $35.67 | | | | $33.15 | |
Total return (%) (r)(s)(t)(x) | | | 4.85 | | | | 9.40 | | | | 12.21 | (c) | | | 13.55 | | | | 0.67 | |
| | | |
Ratios (%) (to average net assets)
and Supplemental data: | | | | | | | | | | | | | |
Expenses before expense reductions (f) | | | 0.88 | | | | 0.89 | | | | 0.96 | (c) | | | 1.00 | | | | 1.00 | |
Expenses after expense reductions (f) | | | 0.84 | | | | 0.83 | | | | 0.85 | (c) | | | 0.86 | | | | 0.86 | |
Net investment income (loss) | | | 1.98 | | | | 1.45 | | | | 1.71 | (c) | | | 1.59 | | | | 1.82 | |
Portfolio turnover | | | 11 | | | | 11 | | | | 14 | | | | 12 | | | | 12 | |
Net assets at end of period (000 omitted) | | | $27,149 | | | | $25,416 | | | | $22,490 | | | | $18,625 | | | | $16,543 | |
| |
| Class 529B | | Year ended | |
| | | | | |
| | | 8/31/19 | | | 8/31/18 | | | 8/31/17 | | | 8/31/16 | | | 8/31/15 | |
Net asset value, beginning of period | | | $40.05 | | | | $38.23 | | | | $35.27 | | | | $32.78 | | | | $34.08 | |
| | | |
| Income (loss) from investment operations | | | | | | | | | | | | | |
Net investment income (loss) (d) | | | $0.63 | | | | $0.43 | | | | $0.47 | (c) | | | $0.29 | | | | $0.47 | |
Net realized and unrealized gain (loss) | | | 1.00 | | | | 3.00 | | | | 3.61 | | | | 3.73 | | | | (0.34 | ) |
Total from investment operations | | | $1.63 | | | | $3.43 | | | | $4.08 | | | | $4.02 | | | | $0.13 | |
| | | |
| Less distributions declared to shareholders | | | | | | | | | | | | | |
From net investment income | | | $(0.68 | ) | | | $(0.40 | ) | | | $(0.50 | ) | | | $(0.29 | ) | | | $(0.51 | ) |
From net realized gain | | | (0.54 | ) | | | (1.21 | ) | | | (0.62 | ) | | | (1.24 | ) | | | (0.92 | ) |
Total distributions declared to shareholders | | | $(1.22 | ) | | | $(1.61 | ) | | | $(1.12 | ) | | | $(1.53 | ) | | | $(1.43 | ) |
Net asset value, end of period (x) | | | $40.46 | | | | $40.05 | | | | $38.23 | | | | $35.27 | | | | $32.78 | |
Total return (%) (r)(s)(t)(x) | | | 4.46 | | | | 9.05 | | | | 11.78 | (c) | | | 12.70 | | | | 0.27 | |
| | | |
Ratios (%) (to average net assets)
and Supplemental data: | | | | | | | | | | | | | |
Expenses before expense reductions (f) | | | 1.22 | | | | 1.22 | | | | 1.34 | (c) | | | 1.68 | | | | 1.37 | |
Expenses after expense reductions (f) | | | 1.20 | | | | 1.19 | | | | 1.26 | (c) | | | 1.58 | | | | 1.27 | |
Net investment income (loss) | | | 1.61 | | | | 1.10 | | | | 1.28 | (c) | | | 0.87 | | | | 1.38 | |
Portfolio turnover | | | 11 | | | | 11 | | | | 14 | | | | 12 | | | | 12 | |
Net assets at end of period (000 omitted) | | | $680 | | | | $835 | | | | $908 | | | | $941 | | | | $888 | |
See Notes to Financial Statements
25
Financial Highlights – continued
| | | | | | | | | | | | | | | | | | | | |
| Class 529C | | Year ended | |
| | | | | |
| | | 8/31/19 | | | 8/31/18 | | | 8/31/17 | | | 8/31/16 | | | 8/31/15 | |
Net asset value, beginning of period | | | $39.81 | | | | $38.07 | | | | $35.11 | | | | $32.66 | | | | $34.00 | |
| | | | |
| Income (loss) from investment operations | | | | | | | | | | | | | | | | | |
Net investment income (loss) (d) | | | $0.46 | | | | $0.26 | | | | $0.34 | (c) | | | $0.26 | | | | $0.35 | |
Net realized and unrealized gain (loss) | | | 1.01 | | | | 2.97 | | | | 3.59 | | | | 3.73 | | | | (0.36 | ) |
Total from investment operations | | | $1.47 | | | | $3.23 | | | | $3.93 | | | | $3.99 | | | | $(0.01 | ) |
| | | | |
| Less distributions declared to shareholders | | | | | | | | | | | | | | | | | |
From net investment income | | | $(0.48 | ) | | | $(0.28 | ) | | | $(0.35 | ) | | | $(0.30 | ) | | | $(0.41 | ) |
From net realized gain | | | (0.54 | ) | | | (1.21 | ) | | | (0.62 | ) | | | (1.24 | ) | | | (0.92 | ) |
Total distributions declared to shareholders | | | $(1.02 | ) | | | $(1.49 | ) | | | $(0.97 | ) | | | $(1.54 | ) | | | $(1.33 | ) |
Net asset value, end of period (x) | | | $40.26 | | | | $39.81 | | | | $38.07 | | | | $35.11 | | | | $32.66 | |
Total return (%) (r)(s)(t)(x) | | | 4.04 | | | | 8.54 | | | | 11.38 | (c) | | | 12.64 | | | | (0.14 | ) |
| | | | |
Ratios (%) (to average net assets)
and Supplemental data: | | | | | | | | | | | | | | | | | |
Expenses before expense reductions (f) | | | 1.63 | | | | 1.64 | | | | 1.71 | (c) | | | 1.75 | | | | 1.75 | |
Expenses after expense reductions (f) | | | 1.61 | | | | 1.61 | | | | 1.63 | (c) | | | 1.65 | | | | 1.66 | |
Net investment income (loss) | | | 1.19 | | | | 0.67 | | | | 0.93 | (c) | | | 0.80 | | | | 1.03 | |
Portfolio turnover | | | 11 | | | | 11 | | | | 14 | | | | 12 | | | | 12 | |
Net assets at end of period (000 omitted) | | | $4,947 | | | | $5,320 | | | | $5,924 | | | | $5,381 | | | | $4,434 | |
| (c) | Amount reflects aone-time reimbursement of expenses by the custodian (or former custodian) without which net investment income and performance would be lower and expenses would be higher. |
| (d) | Per share data is based on average shares outstanding. |
| (f) | Ratios do not reflect reductions from fees paid indirectly, if applicable. |
| (r) | Certain expenses have been reduced without which performance would have been lower. |
| (s) | From time to time the fund may receive proceeds from litigation settlements, without which performance would be lower. |
| (t) | Total returns do not include any applicable sales charges. |
| (x) | The net asset values and total returns have been calculated on net assets which include adjustments made in accordance with U.S. generally accepted accounting principles required at period end for financial reporting purposes. |
See Notes to Financial Statements
26
NOTES TO FINANCIAL STATEMENTS
(1) Business and Organization
MFS Value Fund (the fund) is a diversified series of MFS Series Trust I (the trust). The trust is organized as a Massachusetts business trust and is registered under the Investment Company Act of 1940, as amended, as anopen-end management investment company.
The fund is an investment company and accordingly follows the investment company accounting and reporting guidance of the Financial Accounting Standards Board (FASB) Accounting Standards Codification Topic 946 Financial Services – Investment Companies.
(2) Significant Accounting Policies
General– The preparation of financial statements in conformity with U.S. generally accepted accounting principles requires management to make estimates and assumptions that affect the reported amounts of assets and liabilities, and disclosure of contingent assets and liabilities at the date of the financial statements and the reported amounts of increases and decreases in net assets from operations during the reporting period. Actual results could differ from those estimates. In the preparation of these financial statements, management has evaluated subsequent events occurring after the date of the fund’s Statement of Assets and Liabilities through the date that the financial statements were issued.
Balance Sheet Offsetting– The fund’s accounting policy with respect to balance sheet offsetting is that, absent an event of default by the counterparty or a termination of the agreement, the International Swaps and Derivatives Association (ISDA) Master Agreement, or similar agreement, does not result in an offset of reported amounts of financial assets and financial liabilities in the Statement of Assets and Liabilities across transactions between the fund and the applicable counterparty. The fund’s right to setoff may be restricted or prohibited by the bankruptcy or insolvency laws of the particular jurisdiction to which a specific master netting agreement counterparty is subject. Balance sheet offsetting disclosures, to the extent applicable to the fund, have been included in the fund’s Significant Accounting Policies note under the captions for each of the fund’sin-scope financial instruments and transactions.
Investment Valuations– Equity securities, including restricted equity securities, are generally valued at the last sale or official closing price on their primary market or exchange as provided by a third-party pricing service. Equity securities, for which there were no sales reported that day, are generally valued at the last quoted daily bid quotation on their primary market or exchange as provided by a third-party pricing service. Short-term instruments with a maturity at issuance of 60 days or less may be valued at amortized cost, which approximates market value.Open-end investment companies are generally valued at net asset value per share. Securities and other assets generally valued on the basis of information from a third-party pricing service may also be valued at a broker/dealer bid quotation. In determining values, third-party pricing services can utilize both transaction data and market information such as yield, quality, coupon rate, maturity, type of issue, trading characteristics, and other market data. The
27
Notes to Financial Statements – continued
values of foreign securities and other assets and liabilities expressed in foreign currencies are converted to U.S. dollars using the mean of bid and asked prices for rates provided by a third-party pricing service.
The Board of Trustees has delegated primary responsibility for determining or causing to be determined the value of the fund’s investments (including any fair valuation) to the adviser pursuant to valuation policies and procedures approved by the Board. If the adviser determines that reliable market quotations are not readily available, investments are valued at fair value as determined in good faith by the adviser in accordance with such procedures under the oversight of the Board of Trustees. Under the fund’s valuation policies and procedures, market quotations are not considered to be readily available for most types of debt instruments and floating rate loans and many types of derivatives. These investments are generally valued at fair value based on information from third-party pricing services. In addition, investments may be valued at fair value if the adviser determines that an investment’s value has been materially affected by events occurring after the close of the exchange or market on which the investment is principally traded (such as foreign exchange or market) and prior to the determination of the fund’s net asset value, or after the halt of trading of a specific security where trading does not resume prior to the close of the exchange or market on which the security is principally traded. Events that occur after foreign markets close (such as developments in foreign markets and significant movements in the U.S. markets) and prior to the determination of the fund’s net asset value may be deemed to have a material effect on the value of securities traded in foreign markets. Accordingly, the fund’s foreign equity securities may often be valued at fair value. The adviser generally relies on third-party pricing services or other information (such as the correlation with price movements of similar securities in the same or other markets; the type, cost and investment characteristics of the security; the business and financial condition of the issuer; and trading and other market data) to assist in determining whether to fair value and at what value to fair value an investment. The value of an investment for purposes of calculating the fund’s net asset value can differ depending on the source and method used to determine value. When fair valuation is used, the value of an investment used to determine the fund’s net asset value may differ from quoted or published prices for the same investment. There can be no assurance that the fund could obtain the fair value assigned to an investment if it were to sell the investment at the same time at which the fund determines its net asset value per share.
Various inputs are used in determining the value of the fund’s assets or liabilities. These inputs are categorized into three broad levels. In certain cases, the inputs used to measure fair value may fall into different levels of the fair value hierarchy. In such cases, an investment’s level within the fair value hierarchy is based on the lowest level of input that is significant to the fair value measurement. The fund’s assessment of the significance of a particular input to the fair value measurement in its entirety requires judgment, and considers factors specific to the investment. Level 1 includes unadjusted quoted prices in active markets for identical assets or liabilities. Level 2 includes other significant observable market-based inputs (including quoted prices for similar securities, interest rates, prepayment speed, and credit risk). Level 3 includes
28
Notes to Financial Statements – continued
unobservable inputs, which may include the adviser’s own assumptions in determining the fair value of investments. The following is a summary of the levels used as of August 31, 2019 in valuing the fund’s assets or liabilities:
| | | | | | | | | | | | | | | | |
| | | | |
| Financial Instruments | | Level 1 | | | Level 2 | | | Level 3 | | | Total | |
| Equity Securities | | | $47,137,160,217 | | | | $— | | | | $— | | | | $47,137,160,217 | |
| Mutual Funds | | | 453,132,119 | | | | — | | | | — | | | | 453,132,119 | |
| Total | | | $47,590,292,336 | | | | $— | | | | $— | | | | $47,590,292,336 | |
For further information regarding security characteristics, see the Portfolio of Investments.
Foreign Currency Translation– Purchases and sales of foreign investments, income, and expenses are converted into U.S. dollars based upon currency exchange rates prevailing on the respective dates of such transactions or on the reporting date for foreign denominated receivables and payables. Gains and losses attributable to foreign currency exchange rates on sales of securities are recorded for financial statement purposes as net realized gains and losses on investments. Gains and losses attributable to foreign exchange rate movements on receivables, payables, income and expenses are recorded for financial statement purposes as foreign currency transaction gains and losses. That portion of both realized and unrealized gains and losses on investments that results from fluctuations in foreign currency exchange rates is not separately disclosed.
Indemnifications– Under the fund’s organizational documents, its officers and Trustees may be indemnified against certain liabilities and expenses arising out of the performance of their duties to the fund. Additionally, in the normal course of business, the fund enters into agreements with service providers that may contain indemnification clauses. The fund’s maximum exposure under these agreements is unknown as this would involve future claims that may be made against the fund that have not yet occurred.
Investment Transactions and Income– Investment transactions are recorded on the trade date. Dividends received in cash are recorded on theex-dividend date. Certain dividends from foreign securities will be recorded when the fund is informed of the dividend if such information is obtained subsequent to theex-dividend date. Dividend payments received in additional securities are recorded on theex-dividend date in an amount equal to the value of the security on such date.
The fund may receive proceeds from litigation settlements. Any proceeds received from litigation involving portfolio holdings are reflected in the Statement of Operations in realized gain/loss if the security has been disposed of by the fund or in unrealized gain/loss if the security is still held by the fund. Any other proceeds from litigation not related to portfolio holdings are reflected as other income in the Statement of Operations.
Tax Matters and Distributions– The fund intends to qualify as a regulated investment company, as defined under Subchapter M of the Internal Revenue Code, and to distribute all of its taxable income, including realized capital gains. As a result, no provision for federal income tax is required. The fund’s federal tax returns, when filed, will remain subject to examination by the Internal Revenue Service for a
29
Notes to Financial Statements – continued
three year period. Management has analyzed the fund’s tax positions taken on federal and state tax returns for all open tax years and does not believe that there are any uncertain tax positions that require recognition of a tax liability. Foreign taxes, if any, have been accrued by the fund in the accompanying financial statements in accordance with the applicable foreign tax law. Foreign income taxes may be withheld by certain countries in which the fund invests. Additionally, capital gains realized by the fund on securities issued in or by certain foreign countries may be subject to capital gains tax imposed by those countries.
Distributions to shareholders are recorded on theex-dividend date. Income and capital gain distributions are determined in accordance with income tax regulations, which may differ from U.S. generally accepted accounting principles. Certain capital accounts in the financial statements are periodically adjusted for permanent differences in order to reflect their tax character. These adjustments have no impact on net assets or net asset value per share. Temporary differences which arise from recognizing certain items of income, expense, gain or loss in different periods for financial statement and tax purposes will reverse at some time in the future. Distributions in excess of net investment income or net realized gains are temporary overdistributions for financial statement purposes resulting from differences in the recognition or classification of income or distributions for financial statement and tax purposes.
Book/tax differences primarily relate to wash sale loss deferrals, treating a portion of the proceeds from redemptions as a distribution for tax purposes, and redemptionsin-kind.
The tax character of distributions declared to shareholders for the last two fiscal years are as follows:
| | | | | | | | |
| | |
| | | Year ended | | | Year ended | |
| | |
| | | 8/31/19 | | | 8/31/18 | |
| Ordinary income (including any short-term capital gains) | | | $1,031,454,957 | | | | $929,534,546 | |
| Long-term capital gains | | | 598,003,972 | | | | 1,243,011,694 | |
| | |
| Total distributions | | | $1,629,458,929 | | | | $2,172,546,240 | |
The federal tax cost and the tax basis components of distributable earnings were as follows:
| | | | |
| |
| As of 8/31/19 | | | |
| |
| Cost of investments | | | $29,497,544,432 | |
| Gross appreciation | | | 19,125,288,407 | |
| |
| Gross depreciation | | | (1,032,540,503 | ) |
| Net unrealized appreciation (depreciation) | | | $18,092,747,904 | |
| |
| Undistributed ordinary income | | | 144,928,850 | |
| Undistributed long-term capital gain | | | 636,255,955 | |
| Other temporary differences | | | (19,045 | ) |
Multiple Classes of Shares of Beneficial Interest– The fund offers multiple classes of shares, which differ in their respective distribution, service, and program manager fees. The fund’s income, realized and unrealized gain (loss), and common expenses are
30
Notes to Financial Statements – continued
allocated to shareholders based on the daily net assets of each class. Dividends are declared separately for each class. Differences in per share dividend rates are generally due to differences in separate class expenses. Class B and Class 529B shares will convert to Class A and Class 529A shares, respectively, approximately eight years after purchase. Class C and Class 529C shares will convert to Class A and Class 529A shares, respectively, approximately ten years after purchase. The fund’s distributions declared to shareholders as reported in the Statements of Changes in Net Assets are presented by class as follows:
| | | | | | | | | | | | | | | | |
| | | From net investment
income | | | From net realized
gain | |
| | | | |
| | | Year
ended
8/31/19 | | | Year
ended
8/31/18 | | | Year
ended
8/31/19 | | | Year
ended
8/31/18 | |
| Class A | | | $125,866,907 | | | | $96,760,816 | | | | $86,260,498 | | | | $186,688,046 | |
| Class B | | | 1,129,879 | | | | 885,026 | | | | 1,376,715 | | | | 3,950,558 | |
| Class C | | | 11,411,219 | | | | 9,179,928 | | | | 13,384,014 | | | | 41,974,501 | |
| Class I | | | 432,294,292 | | | | 356,095,252 | | | | 262,698,552 | | | | 602,257,349 | |
| Class R1 | | | 287,896 | | | | 205,831 | | | | 315,686 | | | | 825,125 | |
| Class R2 | | | 8,234,837 | | | | 7,432,906 | | | | 6,747,942 | | | | 18,360,568 | |
| Class R3 | | | 41,527,973 | | | | 33,116,822 | | | | 28,625,707 | | | | 65,139,368 | |
| Class R4 | | | 64,797,797 | | | | 57,058,987 | | | | 40,361,046 | | | | 99,811,881 | |
| Class R6 | | | 319,568,983 | | | | 232,612,347 | | | | 183,561,996 | | | | 358,857,685 | |
| Class 529A | | | 509,506 | | | | 360,191 | | | | 342,700 | | | | 706,810 | |
| Class 529B | | | 13,425 | | | | 9,004 | | | | 10,937 | | | | 28,292 | |
| Class 529C | | | 61,042 | | | | 42,130 | | | | 69,380 | | | | 186,817 | |
| Total | | | $1,005,703,756 | | | | $793,759,240 | | | | $623,755,173 | | | | $1,378,787,000 | |
(3) Transactions with Affiliates
Investment Adviser– The fund has an investment advisory agreement with MFS to provide overall investment management and related administrative services and facilities to the fund. For the period from September 1, 2018 to July 31, 2019, the management fee was computed daily and paid monthly at the following annual rates based on the fund’s average daily net assets:
| | | | |
| Up to $7.5 billion | | | 0.60 | % |
| In excess of $7.5 billion and up to $10 billion | | | 0.53 | % |
| In excess of $10 billion and up to $20 billion | | | 0.50 | % |
| In excess of $20 billion and up to $25 billion | | | 0.45 | % |
| In excess of $25 billion and up to $30 billion | | | 0.42 | % |
| In excess of $30 billion and up to $35 billion | | | 0.40 | % |
| In excess of $35 billion and up to $40 billion | | | 0.38 | % |
| In excess of $40 billion and up to $45 billion | | | 0.36 | % |
| In excess of $45 billion and up to $50 billion | | | 0.35 | % |
| In excess of $50 billion | | | 0.34 | % |
31
Notes to Financial Statements – continued
Effective August 1, 2019, the management fee is computed daily and paid monthly at the following annual rates based on the fund’s average daily net assets:
| | | | |
| Up to $7.5 billion | | | 0.60 | % |
| In excess of $7.5 billion and up to $10 billion | | | 0.53 | % |
| In excess of $10 billion and up to $20 billion | | | 0.50 | % |
| In excess of $20 billion and up to $25 billion | | | 0.45 | % |
| In excess of $25 billion and up to $30 billion | | | 0.42 | % |
| In excess of $30 billion and up to $35 billion | | | 0.40 | % |
| In excess of $35 billion and up to $40 billion | | | 0.38 | % |
| In excess of $40 billion and up to $45 billion | | | 0.36 | % |
| In excess of $45 billion and up to $50 billion | | | 0.35 | % |
| In excess of $50 billion and up to $60 billion | | | 0.34 | % |
| In excess of $60 billion | | | 0.33 | % |
MFS has agreed in writing to reduce its management fee by a specified amount if certain MFS mutual fund assets exceed thresholds agreed to by MFS and the fund’s Board of Trustees. For the year ended August 31, 2019, this management fee reduction amounted to $4,505,311, which is included in the reduction of total expenses in the Statement of Operations. The management fee incurred for the year ended August 31, 2019 was equivalent to an annual effective rate of 0.45% of the fund’s average daily net assets.
Distributor– MFS Fund Distributors, Inc. (MFD), a wholly-owned subsidiary of MFS, as distributor, received $1,112,359 and $12,723 for the year ended August 31, 2019, as its portion of the initial sales charge on sales of Class A and Class 529A shares of the fund, respectively.
The Board of Trustees has adopted a distribution plan for certain share classes pursuant to Rule12b-1 of the Investment Company Act of 1940.
The fund’s distribution plan provides that the fund will pay MFD for services provided by MFD and financial intermediaries in connection with the distribution and servicing of certain share classes. One component of the plan is a distribution fee paid to MFD and another component of the plan is a service fee paid to MFD. MFD may subsequently pay all, or a portion, of the distribution and/or service fees to financial intermediaries.
Distribution Plan Fee Table:
| | | | | | | | | | | | | | | | | | | | |
| | | | | |
| | | Distribution
Fee Rate (d) | | | Service
Fee Rate (d) | | | Total
Distribution
Plan (d) | | | Annual
Effective
Rate (e) | | | Distribution
and Service
Fee | |
| Class A | | | — | | | | 0.25% | | | | 0.25% | | | | 0.25% | | | | $15,984,675 | |
| Class B | | | 0.75% | | | | 0.25% | | | | 1.00% | | | | 1.00% | | | | 955,275 | |
| Class C | | | 0.75% | | | | 0.25% | | | | 1.00% | | | | 1.00% | | | | 9,348,143 | |
| Class R1 | | | 0.75% | | | | 0.25% | | | | 1.00% | | | | 1.00% | | | | 226,160 | |
| Class R2 | | | 0.25% | | | | 0.25% | | | | 0.50% | | | | 0.50% | | | | 2,383,212 | |
| Class R3 | | | — | | | | 0.25% | | | | 0.25% | | | | 0.25% | | | | 5,267,338 | |
| Class 529A | | | — | | | | 0.25% | | | | 0.25% | | | | 0.22% | | | | 64,533 | |
| Class 529B | | | 0.75% | | | | 0.25% | | | | 1.00% | | | | 0.59% | | | | 4,550 | |
| Class 529C | | | 0.75% | | | | 0.25% | | | | 1.00% | | | | 1.00% | | | | 49,192 | |
| Total Distribution and Service Fees | | | | | | | | | | | | $34,283,078 | |
32
Notes to Financial Statements – continued
| (d) | In accordance with the distribution plan for certain classes, the fund pays distribution and/or service fees equal to these annual percentage rates of each class’s average daily net assets. The distribution and service fee rates disclosed by class represent the current rates in effect at the end of the reporting period. Any rate changes, if applicable, are detailed below. |
| (e) | The annual effective rates represent actual fees incurred under the distribution plan for the year ended August 31, 2019 based on each class’s average daily net assets. MFD has voluntarily agreed to rebate a portion of each class’s 0.25% service fee attributable to accounts for which MFD retains the 0.25% service fee except for accounts attributable to MFS or its affiliates’ seed money. For the year ended August 31, 2019, this rebate amounted to $73,291, $1,300, $2,174, $4, $775, $949, $7,548, $44, and $148 for Class A, Class B, Class C, Class R1, Class R2, Class R3, Class 529A, Class 529B, and Class 529C, respectively, and is included in the reduction of total expenses in the Statement of Operations. For the period from September 1, 2018 through February 28, 2019, the 0.75% distribution fee was not imposed for Class 529B shares due to the sales charge limitations contained in Financial Industry Regulatory Authority (“FINRA”) Rule 2341. |
Certain Class A shares are subject to a contingent deferred sales charge (CDSC) in the event of a shareholder redemption within 18 months of purchase. Class B and Class 529B shares are subject to a CDSC in the event of a shareholder redemption within six years of purchase. Class C and Class 529C shares are subject to a CDSC in the event of a shareholder redemption within 12 months of purchase. All contingent deferred sales charges are paid to MFD and during the year ended August 31, 2019, were as follows:
| | | | |
| |
| | | Amount | |
| Class A | | | $62,528 | |
| Class B | | | 98,421 | |
| Class C | | | 64,706 | |
| Class 529B | | | — | |
| Class 529C | | | 136 | |
During the year ended August 31, 2019, to meet requirements of FINRA Rule 2341, MFD returned $254 of the CDSC collected in the prior fiscal year for Class 529B.
The fund has entered into and may from time to time enter into contracts with program managers and other parties which administer the tuition programs through which an investment in the fund’s 529 share classes is made. The fund has entered into an agreement with MFD pursuant to which MFD receives an annual fee of up to 0.05% of the average daily net assets attributable to each 529 share class. The services provided by MFD, or a third party with which MFD contracts, include recordkeeping and tax reporting and account services, as well as services designed to maintain the program’s compliance with the Internal Revenue Code and other regulatory requirements. Program manager fees for the year ended August 31, 2019, were as follows:
| | | | |
| |
| | | Fee | |
| Class 529A | | | $12,907 | |
| Class 529B | | | 385 | |
| Class 529C | | | 2,459 | |
| Total Program Manager Fees | | | $15,751 | |
33
Notes to Financial Statements – continued
Shareholder Servicing Agent– MFS Service Center, Inc. (MFSC), a wholly-owned subsidiary of MFS, receives a fee from the fund for its services as shareholder servicing agent calculated as a percentage of the average daily net assets of the fund as determined periodically under the supervision of the fund’s Board of Trustees. For the year ended August 31, 2019, the fee was $1,125,248, which equated to 0.0024% annually of the fund’s average daily net assets. MFSC also receives payment from the fund forout-of-pocket expenses,sub-accounting and other shareholder servicing costs which may be paid to affiliated and unaffiliated service providers. Class R6 shares do not incursub-accounting fees. For the year ended August 31, 2019, theseout-of-pocket expenses,sub-accounting and other shareholder servicing costs amounted to $34,104,674.
Administrator– MFS provides certain financial, legal, shareholder communications, compliance, and other administrative services to the fund. Under an administrative services agreement, the fund reimburses MFS the costs incurred to provide these services. The fund is charged an annual fixed amount of $17,500 plus a fee based on average daily net assets. The administrative services fee incurred for the year ended August 31, 2019 was equivalent to an annual effective rate of 0.0012% of the fund’s average daily net assets.
Trustees’ and Officers’ Compensation– The fund pays compensation to independent Trustees in the form of a retainer, attendance fees, and additional compensation to Board and Committee chairpersons. The fund does not pay compensation directly to Trustees or officers of the fund who are also officers of the investment adviser, all of whom receive remuneration from MFS for their services to the fund. Certain officers and Trustees of the fund are officers or directors of MFS, MFD, and MFSC.
Prior to December 31, 2001, the fund had an unfunded defined benefit plan (“DB plan”) for independent Trustees. As of December 31, 2001, the Board took action to terminate the DB plan with respect to then-current and any future independent Trustees, such that the DB plan covers only certain of those former independent Trustees who retired on or before December 31, 2001. The DB plan resulted in a pension expense of $712 and is included in “Independent Trustees’ compensation” in the Statement of Operations for the year ended August 31, 2019. The liability for deferred retirement benefits payable to those former independent Trustees under the DB plan amounted to $1,196 at August 31, 2019, and is included in “Payable for independent Trustees’ compensation” in the Statement of Assets and Liabilities.
Other– This fund and certain other funds managed by MFS (the funds) had entered into a service agreement (the ISO Agreement) which provided for payment of fees solely by the funds to Tarantino LLC in return for the provision of services of an Independent Senior Officer (ISO) for the funds. Frank L. Tarantino served as the ISO and was an officer of the funds and the sole member of Tarantino LLC. Effective June 30, 2019, Mr. Tarantino retired from his position as ISO for the funds, and the ISO Agreement was terminated. For the year ended August 31, 2019, the fee paid by the fund under this agreement was $82,027 and is included in “Miscellaneous” expense in the Statement of Operations. MFS had agreed to bear all expenses associated with office space, other administrative support, and supplies provided to the ISO.
34
Notes to Financial Statements – continued
The fund invests in the MFS Institutional Money Market Portfolio which is managed by MFS and seeks current income consistent with preservation of capital and liquidity. This money market fund does not pay a management fee to MFS.
The fund is permitted to engage in purchase and sale transactions with funds and accounts for which MFS serves as investment adviser orsub-adviser (“cross-trades”) pursuant to a policy adopted by the Board of Trustees. This policy has been designed to ensure that cross-trades conducted by the fund comply with Rule17a-7 under the Investment Company Act of 1940. During the year ended August 31, 2019, the fund engaged in purchase and sale transactions pursuant to this policy, which amounted to $2,382,011 and $9,410,597, respectively. The sales transactions resulted in net realized gains (losses) of $(753,615).
The adviser has voluntarily undertaken to reimburse the fund from its own resources on a quarterly basis for the cost of investment research embedded in the cost of the fund’s securities trades. This agreement may be rescinded at any time. For the year ended August 31, 2019, this reimbursement amounted to $841,625 which is included in “Other” income in the Statement of Operations.
(4) Portfolio Securities
For the year ended August 31, 2019, purchases and sales of investments, other than short-term obligations, aggregated $4,989,108,372 and $7,121,054,845, respectively.
(5) Shares of Beneficial Interest
The fund’s Declaration of Trust permits the Trustees to issue an unlimited number of full and fractional shares of beneficial interest. Transactions in fund shares were as follows:
| | | | | | | | | | | | | | | | |
| | | Year ended
8/31/19 | | | Year ended
8/31/18 | |
| | | | |
| | | Shares | | | Amount | | | Shares | | | Amount | |
| Shares sold | | | | | | | | | | | | | | | | |
Class A | | | 24,411,847 | | | | $961,411,776 | | | | 44,076,293 | | | | $1,757,559,480 | |
Class B | | | 109,994 | | | | 4,271,448 | | | | 176,038 | | | | 7,050,932 | |
Class C | | | 2,602,286 | | | | 100,772,015 | | | | 3,349,289 | | | | 133,548,102 | |
Class I | | | 101,624,206 | | | | 4,014,273,147 | | | | 127,402,197 | | | | 5,159,868,065 | |
Class R1 | | | 105,084 | | | | 4,054,356 | | | | 156,785 | | | | 6,192,764 | |
Class R2 | | | 1,393,443 | | | | 54,090,884 | | | | 2,355,417 | | | | 93,706,489 | |
Class R3 | | | 8,683,642 | | | | 336,653,144 | | | | 16,357,394 | | | | 659,298,107 | |
Class R4 | | | 10,512,327 | | | | 416,155,664 | | | | 22,870,513 | | | | 926,126,695 | |
Class R6 | | | 74,625,324 | | | | 2,951,676,391 | | | | 116,249,017 | | | | 4,676,874,449 | |
Class 529A | | | 100,457 | | | | 3,921,061 | | | | 107,287 | | | | 4,273,598 | |
Class 529B | | | 954 | | | | 37,532 | | | | 2,465 | | | | 97,445 | |
Class 529C | | | 20,871 | | | | 805,355 | | | | 15,016 | | | | 592,294 | |
| | | 224,190,435 | | | | $8,848,122,773 | | | | 333,117,711 | | | | $13,425,188,420 | |
35
Notes to Financial Statements – continued
| | | | | | | | | | | | | | | | |
| | | Year ended
8/31/19 | | | Year ended
8/31/18 | |
| | | | |
| | | Shares | | | Amount | | | Shares | | | Amount | |
Shares issued to shareholders in
reinvestment of distributions | | | | | | | | | | | | | |
Class A | | | 4,662,710 | | | | $173,102,129 | | | | 6,053,234 | | | | $243,649,001 | |
Class B | | | 64,869 | | | | 2,361,216 | | | | 112,004 | | | | 4,510,553 | |
Class C | | | 522,160 | | | | 18,897,156 | | | | 1,035,498 | | | | 41,436,539 | |
Class I | | | 14,708,512 | | | | 550,689,358 | | | | 18,342,158 | | | | 741,412,732 | |
Class R1 | | | 16,758 | | | | 603,573 | | | | 25,985 | | | | 1,030,956 | |
Class R2 | | | 389,696 | | | | 14,250,967 | | | | 604,456 | | | | 24,126,659 | |
Class R3 | | | 1,897,634 | | | | 70,152,285 | | | | 2,450,848 | | | | 98,255,320 | |
Class R4 | | | 2,733,062 | | | | 101,624,334 | | | | 3,751,509 | | | | 150,843,900 | |
Class R6 | | | 12,268,131 | | | | 457,296,101 | | | | 13,711,952 | | | | 550,598,803 | |
Class 529A | | | 23,109 | | | | 851,636 | | | | 26,729 | | | | 1,066,973 | |
Class 529B | | | 675 | | | | 24,362 | | | | 943 | | | | 37,287 | |
Class 529C | | | 3,642 | | | | 130,422 | | | | 5,793 | | | | 228,919 | |
| | | 37,290,958 | | | | $1,389,983,539 | | | | 46,121,109 | | | | $1,857,197,642 | |
| | | | |
| Shares reacquired | | | | | | | | | | | | | | | | |
Class A | | | (36,282,831 | ) | | | $(1,436,501,478 | ) | | | (47,805,299 | ) | | | $(1,924,584,307 | ) |
Class B | | | (859,557 | ) | | | (33,877,544 | ) | | | (1,084,583 | ) | | | (43,543,928 | ) |
Class C | | | (7,585,556 | ) | | | (295,149,445 | ) | | | (14,408,676 | ) | | | (567,501,368 | ) |
Class I | | | (138,135,941 | ) | | | (5,477,840,045 | ) | | | (141,304,181 | ) | | | (5,715,110,426 | ) |
Class R1 | | | (202,277 | ) | | | (7,851,973 | ) | | | (260,226 | ) | | | (10,260,995 | ) |
Class R2 | | | (4,707,159 | ) | | | (184,847,134 | ) | | | (5,245,661 | ) | | | (209,097,090 | ) |
Class R3 | | | (15,196,245 | ) | | | (597,739,263 | ) | | | (15,484,603 | ) | | | (621,317,976 | ) |
Class R4 | | | (21,071,772 | ) | | | (822,107,531 | ) | | | (26,680,448 | ) | | | (1,076,351,548 | ) |
Class R6 | | | (72,236,188 | ) | | | (2,862,769,021 | ) | | | (69,399,253 | ) | | | (2,780,507,602 | ) |
Class 529A | | | (88,534 | ) | | | (3,526,656 | ) | | | (87,482 | ) | | | (3,498,874 | ) |
Class 529B | | | (5,685 | ) | | | (222,222 | ) | | | (6,300 | ) | | | (247,228 | ) |
Class 529C | | | (35,246 | ) | | | (1,343,529 | ) | | | (42,795 | ) | | | (1,671,505 | ) |
| | | (296,406,991 | ) | | | $(11,723,775,841 | ) | | | (321,809,507 | ) | | | $(12,953,692,847 | ) |
| | | | |
| Net change | | | | | | | | | | | | | | | | |
Class A | | | (7,208,274 | ) | | | $(301,987,573 | ) | | | 2,324,228 | | | | $76,624,174 | |
Class B | | | (684,694 | ) | | | (27,244,880 | ) | | | (796,541 | ) | | | (31,982,443 | ) |
Class C | | | (4,461,110 | ) | | | (175,480,274 | ) | | | (10,023,889 | ) | | | (392,516,727 | ) |
Class I | | | (21,803,223 | ) | | | (912,877,540 | ) | | | 4,440,174 | | | | 186,170,371 | |
Class R1 | | | (80,435 | ) | | | (3,194,044 | ) | | | (77,456 | ) | | | (3,037,275 | ) |
Class R2 | | | (2,924,020 | ) | | | (116,505,283 | ) | | | (2,285,788 | ) | | | (91,263,942 | ) |
Class R3 | | | (4,614,969 | ) | | | (190,933,834 | ) | | | 3,323,639 | | | | 136,235,451 | |
Class R4 | | | (7,826,383 | ) | | | (304,327,533 | ) | | | (58,426 | ) | | | 619,047 | |
Class R6 | | | 14,657,267 | | | | 546,203,471 | | | | 60,561,716 | | | | 2,446,965,650 | |
Class 529A | | | 35,032 | | | | 1,246,041 | | | | 46,534 | | | | 1,841,697 | |
Class 529B | | | (4,056 | ) | | | (160,328 | ) | | | (2,892 | ) | | | (112,496 | ) |
Class 529C | | | (10,733 | ) | | | (407,752 | ) | | | (21,986 | ) | | | (850,292 | ) |
| | | (34,925,598 | ) | | | $(1,485,669,529 | ) | | | 57,429,313 | | | | $2,328,693,215 | |
Class T shares were not publicly available for sale during the period. Please see the fund’s prospectus for details.
36
Notes to Financial Statements – continued
Effective June 1, 2019, purchases of the fund’s Class B and Class 529B shares are closed to new and existing investors subject to certain exceptions. Please see the fund’s prospectus for details.
The fund is one of several mutual funds in which certain MFS funds may invest. The MFS funds do not invest in the underlying funds for the purpose of exercising management or control. At the end of the period, the MFS Growth Allocation Fund was the owner of record of approximately 1% of the value of outstanding voting shares of the fund. In addition, the MFS Aggressive Growth Allocation Fund, the MFS Conservative Allocation Fund, the MFS Lifetime 2020 Fund, the MFS Lifetime 2025 Fund, the MFS Lifetime 2030 Fund, the MFS Lifetime 2035 Fund, the MFS Lifetime 2040 Fund, the MFS Lifetime 2045 Fund, the MFS Lifetime 2050 Fund, the MFS Lifetime 2055 Fund, the MFS Lifetime 2060 Fund, the MFS Lifetime Income Fund, the MFS Managed Wealth Fund, and the MFS Moderate Allocation Fund were each the owners of record of less than 1% of the value of outstanding voting shares of the fund.
(6) Line of Credit
The fund and certain other funds managed by MFS participate in a $1.25 billion unsecured committed line of credit, subject to a $1 billion sublimit, provided by a syndicate of banks under a credit agreement. Borrowings may be made for temporary financing needs. Interest is charged to each fund, based on its borrowings, generally at a rate equal to the highest of one month LIBOR, the Federal Funds Effective Rate and the Overnight Bank Funding Rate, plus an agreed upon spread. A commitment fee, based on the average daily, unused portion of the committed line of credit, is allocated among the participating funds. In addition, the fund and other funds managed by MFS have established unsecured uncommitted borrowing arrangements with certain banks for temporary financing needs. Interest is charged to each fund, based on its borrowings, at rates equal to customary reference rates plus an agreed upon spread. For the year ended August 31, 2019, the fund’s commitment fee and interest expense were $268,868 and $0, respectively, and are included in “Miscellaneous” expense in the Statement of Operations.
(7) Investments in Affiliated Issuers
An affiliated issuer may be considered one in which the fund owns 5% or more of the outstanding voting securities, or a company which is under common control. For the purposes of this report, the following were affiliated issuers:
| | | | | | | | | | | | | | | | | | | | | | | | |
| | | | | | |
| Affiliated Issuers | | Beginning
Value | | | Purchases | | | Sales
Proceeds | | | Realized
Gain
(Loss) | | | Change in
Unrealized
Appreciation or
Depreciation | | | Ending
Value | |
| MFS Institutional Money Market Portfolio | | | $372,957,411 | | | | $4,819,832,904 | | | | $4,739,663,938 | | | | $11,149 | | | | $(5,407 | ) | | | $453,132,119 | |
| | | | | | |
| Affiliated Issuers | | | | | | | | | | | | | | Dividend
Income | | | Capital Gain
Distributions | |
| MFS Institutional Money Market Portfolio | | | | | | | | | | | | $9,362,702 | | | | $— | |
37
Notes to Financial Statements – continued
(8) Redemptions In-Kind
On November 16, 2018, the fund recorded a redemption in-kind of portfolio securities and cash that was valued at $96,466,346. The redeeming shareholder generally receives a pro rata share of the securities held by the fund. The distribution of such securities generated a realized gain of $51,529,296 for the fund, which is included in Net realized gain (loss) in the Statement of Operations. For tax purposes, no gains or losses were recognized.
38
REPORT OF INDEPENDENT REGISTERED PUBLIC ACCOUNTING FIRM
To the Shareholders of MFS Value Fund and the Board of Trustees of MFS Series Trust I
Opinion on the Financial Statements
We have audited the accompanying statement of assets and liabilities of MFS Value Fund (the “Fund”) (one of the funds constituting MFS Series Trust I (the “Trust”)), including the portfolio of investments, as of August 31, 2019,and the related statement of operations for the year then ended, the statements of changes in net assets for each of the two years in the period then ended, the financial highlights for each of the five years in the period then ended and the related notes (collectively referred to as the “financial statements”). In our opinion, the financial statements present fairly, in all material respects, the financial position of the Fund (one of the funds constituting MFS Series Trust I) at August 31, 2019, the results of its operations for the year then ended, the changes in its net assets for each of the two years in the period then ended and its financial highlights for each of the five years in the period then ended, in conformity with U.S. generally accepted accounting principles.
Basis for Opinion
These financial statements are the responsibility of the Trust’s management. Our responsibility is to express an opinion on the Fund’s financial statements based on our audits. We are a public accounting firm registered with the Public Company Accounting Oversight Board (United States) (“PCAOB”) and are required to be independent with respect to the Trust in accordance with the U.S. federal securities laws and the applicable rules and regulations of the Securities and Exchange Commission and the PCAOB.
We conducted our audits in accordance with the standards of the PCAOB. Those standards require that we plan and perform the audit to obtain reasonable assurance about whether the financial statements are free of material misstatement, whether due to error or fraud. The Trust is not required to have, nor were we engaged to perform, an audit of the Trust’s internal control over financial reporting. As part of our audits we are required to obtain an understanding of internal control over financial reporting but not for the purpose of expressing an opinion on the effectiveness of the Trust’s internal control over financial reporting. Accordingly, we express no such opinion.
Our audits included performing procedures to assess the risks of material misstatement of the financial statements, whether due to error or fraud, and performing procedures that respond to those risks. Such procedures included examining, on a test basis, evidence regarding the amounts and disclosures in the financial statements. Our procedures included confirmation of securities owned as of August 31, 2019,by correspondence with the custodian andothers or by other appropriate procedures where replies from others are not received. Our audits also included evaluating the
39
Report of Independent Registered Public Accounting Firm – continued
accounting principles used and significant estimates made by management, as well as evaluating the overall presentation of the financial statements. We believe that our audits provide a reasonable basis for our opinion.

We have served as the auditor of one or more MFS investment companies since 1993.
Boston, Massachusetts
October 17, 2019
40
TRUSTEES AND OFFICERS — IDENTIFICATION AND BACKGROUND
The Trustees and Officers of the Trust, as of October 1, 2019, are listed below, together with their principal occupations during the past five years. (Their titles may have varied during that period.) The address of each Trustee and Officer is 111 Huntington Avenue, Boston, Massachusetts 02199-7618.
| | | | | | | | | | |
Name, Age | | Position(s)
Held
with Fund | | Trustee/Officer
Since (h) | | Number of
MFS Funds
overseen
by the
Trustee | | Principal
Occupations During the Past Five Years | | Other
Directorships
During the Past
Five Years (j) |
| INTERESTED TRUSTEES |
Robert J. Manning (k)
(age 55) | | Trustee | | February 2004 | | 135 | | Massachusetts Financial Services Company, Executive Chairman (since January 2017); Director; Chairman of the Board; Chief Executive Officer (until 2015);Co-Chief Executive Officer (2015-2016) | | N/A |
| | | | | |
Robin A. Stelmach (k) (age 58) | | Trustee | | January 2014 | | 135 | | Massachusetts Financial Services Company, Vice Chair (since January 2017); Chief Operating Officer and Executive Vice President (until January 2017) | | N/A |
| INDEPENDENT TRUSTEES |
John P. Kavanaugh (age 64) | | Trustee and Chair of Trustees | | January 2009 | | 135 | | Private investor | | N/A |
| | | | | |
Steven E. Buller (age 68) | | Trustee | | February 2014 | | 135 | | Financial Accounting Standards Advisory Council, Chairman (2014-2015); Public Company Accounting Oversight Board, Standing Advisory Group, Member (until 2014); BlackRock, Inc. (investment management), Managing Director (until 2014), BlackRock Finco UK (investment management), Director (until 2014) | | N/A |
41
Trustees and Officers – continued
| | | | | | | | | | |
Name, Age | | Position(s)
Held
with Fund | | Trustee/Officer
Since (h) | | Number of
MFS Funds
overseen
by the
Trustee | | Principal
Occupations During the Past Five Years | | Other
Directorships
During the Past
Five Years (j) |
John A. Caroselli (age 65) | | Trustee | | March 2017 | | 135 | | JC Global Advisors, LLC (management consulting), President (since 2015); First Capital Corporation (commercial finance), Executive Vice President (until 2015) | | N/A |
| | | | | |
Maureen R. Goldfarb (age 64) | | Trustee | | January 2009 | | 135 | | Private investor | | N/A |
| | | | | |
Michael Hegarty
(age 74) | | Trustee | | December 2004 | | 135 | | Private investor | | Rouse Properties Inc., Director (until 2016); Capmark Financial Group Inc., Director (until 2015) |
| | | | | |
Peter D. Jones
(age 64) | | Trustee | | January 2019 | | 135 | | Franklin Templeton Distributors, Inc. (investment management), President (until 2015); Franklin Templeton Institutional, LLC (investment management), Chairman (until 2015) | | N/A |
| | | | | |
James W. Kilman, Jr. (age 58) | | Trustee | | January 2019 | | 135 | | Burford Capital Limited (finance and investment management), Chief Financial Officer (since 2019); KielStrand Capital LLC (family office and merchant bank), Chief Executive Officer (since 2016); Morgan Stanley & Co. (financial services), Vice Chairman of Investment Banking,Co-Head of Diversified Financials Coverage – Financial Institutions Investment Banking Group (until 2016) | | Alpha-En Corporation, Director (since 2016) |
42
Trustees and Officers – continued
| | | | | | | | | | |
Name, Age | | Position(s)
Held
with Fund | | Trustee/Officer
Since (h) | | Number of
MFS Funds
overseen
by the
Trustee | | Principal
Occupations During the Past Five Years | | Other
Directorships
During the Past
Five Years (j) |
Clarence Otis, Jr. (age 63) | | Trustee | | March 2017 | | 135 | | Darden Restaurants, Inc., Chief Executive Officer (until 2014) | | VF Corporation, Director; Verizon Communications, Inc., Director; The Travelers Companies, Director; Federal Reserve Bank of Atlanta, Director (until 2015) |
| | | | | |
Maryanne L. Roepke (age 63) | | Trustee | | May 2014 | | 135 | | American Century Investments (investment management), Senior Vice President and Chief Compliance Officer (until 2014) | | N/A |
| | | | | |
Laurie J. Thomsen
(age 62) | | Trustee | | March 2005 | | 135 | | Private investor | | The Travelers Companies, Director; Dycom Industries, Inc., Director (since 2015) |
| | | | | | | | |
Name, Age | | Position(s) Held
with Fund | | Trustee/Officer
Since (h) | | Number of
MFS Funds
for which
the Person
is an Officer | | Principal
Occupations During
the Past Five Years |
| OFFICERS | | | | | | | | |
Christopher R. Bohane (k) (age 45) | | Assistant Secretary and Assistant Clerk | | July 2005 | | 135 | | Massachusetts Financial Services Company, Vice President and Assistant General Counsel |
| | | | |
Kino Clark (k) (age 51) | | Assistant Treasurer | | January 2012 | | 135 | | Massachusetts Financial Services Company, Vice President |
43
Trustees and Officers – continued
| | | | | | | | |
Name, Age | | Position(s) Held
with Fund | | Trustee/Officer
Since (h) | | Number of
MFS Funds
for which
the Person
is an Officer | | Principal
Occupations During
the Past Five Years |
John W. Clark, Jr. (k) (age 52) | | Assistant Treasurer | | April 2017 | | 135 | | Massachusetts Financial Services Company, Vice President (since March 2017); Deutsche Bank (financial services), Department Head – Treasurer’s Office (until February 2017) |
| | | | |
Thomas H. Connors (k) (age 60) | | Assistant Secretary and Assistant Clerk | | September 2012 | | 135 | | Massachusetts Financial Services Company, Vice President and Senior Counsel |
| | | | |
David L. DiLorenzo (k)
(age 51) | | President | | July 2005 | | 135 | | Massachusetts Financial Services Company, Senior Vice President |
| | | | |
Heidi W. Hardin (k)
(age 52) | | Secretary and Clerk | | April 2017 | | 135 | | Massachusetts Financial Services Company, Executive Vice President and General Counsel (since March 2017); Harris Associates (investment management), General Counsel (from September 2015 to January 2017); Janus Capital Management LLC (investment management), Senior Vice President and General Counsel (until September 2015) |
| | | | |
Brian E. Langenfeld (k)
(age 46) | | Assistant
Secretary and Assistant Clerk | | June 2006 | | 135 | | Massachusetts Financial Services Company, Vice President and Senior Counsel |
| | | | |
Amanda S. Mooradian (k)
(age 40) | | Assistant
Secretary and Assistant Clerk | | September 2018 | | 135 | | Massachusetts Financial Services Company, Assistant Vice President and Counsel |
44
Trustees and Officers – continued
| | | | | | | | |
Name, Age | | Position(s) Held
with Fund | | Trustee/Officer
Since (h) | | Number of
MFS Funds
for which
the Person
is an Officer | | Principal
Occupations During
the Past Five Years |
Susan A. Pereira (k)
(age 48) | | Assistant
Secretary and Assistant Clerk | | July 2005 | | 135 | | Massachusetts Financial Services Company, Vice President and Assistant General Counsel |
| | | | |
Kasey L. Phillips (k)
(age 48) | | Assistant Treasurer | | September 2012 | | 135 | | Massachusetts Financial Services Company, Vice President |
| | | | |
Matthew A. Stowe (k)
(age 44) | | Assistant Secretary and Assistant Clerk | | October 2014 | | 135 | | Massachusetts Financial Services Company, Vice President and Assistant General Counsel |
| | | | |
Martin J. Wolin (k)
(age 52) | | Chief Compliance Officer | | July 2015 | | 135 | | Massachusetts Financial Services Company, Senior Vice President and Chief Compliance Officer (since July 2015); Mercer (financial service provider), Chief Risk and Compliance Officer, North America and Latin America (until June 2015) |
| | | | |
James O. Yost (k)
(age 59) | | Treasurer | | September 1990 | | 135 | | Massachusetts Financial Services Company, Senior Vice President |
| (h) | Date first appointed to serve as Trustee/officer of an MFS Fund. Each Trustee has served continuously since appointment unless indicated otherwise. For the period from December 15, 2004 until February 22, 2005, Mr. Manning served as Advisory Trustee. From January 2012 through December 2016, Messrs. DiLorenzo and Yost served as Treasurer and Deputy Treasurer of the Funds, respectively. |
| (j) | Directorships or trusteeships of companies required to report to the Securities and Exchange Commission (i.e., “public companies”). |
| (k) | “Interested person” of the Trust within the meaning of the Investment Company Act of 1940 (referred to as the 1940 Act), which is the principal federal law governing investment companies like the fund, as a result of a position with MFS. The address of MFS is 111 Huntington Avenue, Boston, Massachusetts 02199-7618. |
Each Trustee (other than Messrs. Jones and Kilman) has been elected by shareholders and each Trustee and Officer holds office until his or her successor is chosen and qualified or until his or her earlier death, resignation, retirement or removal. Messrs. Jones and Kilman became Trustees of the Funds on January 1, 2019. The Trust does
45
Trustees and Officers – continued
not hold annual meetings for the purpose of electing Trustees, and Trustees are not elected for fixed terms. Under the terms of the Board’s retirement policy, an Independent Trustee shall retire at the end of the calendar year in which he or she reaches the earlier of 75 years of age or 15 years of service on the Board (or, in the case of any Independent Trustee who joined the Board prior to 2015, 20 years of service on the Board).
Messrs. Buller, Hegarty, Kilman and Otis and Ms. Roepke are members of the Trust’s Audit Committee.
Each of the Interested Trustees and certain Officers hold comparable officer positions with certain affiliates of MFS.
The Statement of Additional Information for a Fund includes further information about the Trustees and is available without charge upon request by calling1-800-225-2606.
| | |
| Investment Adviser | | Custodian |
Massachusetts Financial Services Company
111 Huntington Avenue Boston, MA 02199-7618 | | State Street Bank and Trust Company 1 Lincoln Street Boston, MA 02111-2900 |
| Distributor | | Independent Registered Public Accounting Firm |
MFS Fund Distributors, Inc.
111 Huntington Avenue Boston, MA 02199-7618 | | Ernst & Young LLP 200 Clarendon Street Boston, MA 02116 |
| Portfolio Manager(s) | | |
Nevin Chitkara Steven Gorham | | |
46
BOARD REVIEW OF INVESTMENT ADVISORY AGREEMENT
The Investment Company Act of 1940 requires that both the full Board of Trustees and a majority of thenon-interested (“independent”) Trustees, voting separately, annually approve the continuation of the Fund’s investment advisory agreement with MFS. The Trustees consider matters bearing on the Fund and its advisory arrangements at their meetings throughout the year, including a review of performance data at each regular meeting. In addition, the independent Trustees met several times over the course of three months beginning in May and ending in July, 2019 (“contract review meetings”) for the specific purpose of considering whether to approve the continuation of the investment advisory agreement for the Fund and the other investment companies that the Board oversees (the “MFS Funds”). The independent Trustees were assisted in their evaluation of the Fund’s investment advisory agreement by independent legal counsel, from whom they received separate legal advice and with whom they met separately from MFS during various contract review meetings. The independent Trustees were also assisted in this process by the MFS Funds’ Independent Senior Officer, a senior officer appointed by and reporting to the independent Trustees.
In connection with their deliberations regarding the continuation of the investment advisory agreement, the Trustees, including the independent Trustees, considered such information and factors as they believed, in light of the legal advice furnished to them and their own business judgment, to be relevant. The investment advisory agreement for the Fund was considered separately, although the Trustees also took into account the common interests of all MFS Funds in their review. As described below, the Trustees considered the nature, quality, and extent of the various investment advisory, administrative, and shareholder services performed by MFS under the existing investment advisory agreement and other arrangements with the Fund.
In connection with their contract review meetings, the Trustees received and relied upon materials that included, among other items: (i) information provided by Broadridge Financial Solutions, Inc. (“Broadridge”), an independent third party, on the investment performance of the Fund for various time periods ended December 31, 2018 and the investment performance of a group of funds with substantially similar investment classifications/objectives (the “Broadridge performance universe”), (ii) information provided by Broadridge on the Fund’s advisory fees and other expenses and the advisory fees and other expenses of comparable funds identified by Broadridge as well as all other funds in the same investment classification/category (the “Broadridge expense group and universe”), (iii) information provided by MFS on the advisory fees of portfolios of other clients of MFS, including institutional separate accounts and other clients, (iv) information as to whether and to what extent applicable expense waivers, reimbursements or fee “breakpoints” are observed for the Fund, (v) information regarding MFS’ financial results and financial condition, including MFS’ and certain of its affiliates’ estimated profitability from services performed for the Fund and the MFS Funds as a whole, and compared to MFS’ institutional business, (vi) MFS’ views regarding the outlook for the mutual fund industry and the strategic business plans of MFS, (vii) descriptions of various functions performed by MFS for the Funds, such as compliance monitoring and portfolio trading practices, and (viii) information regarding the overall organization of MFS, including information
47
Board Review of Investment Advisory Agreement – continued
about MFS’ senior management and other personnel providing investment advisory, administrative and other services to the Fund and the other MFS Funds. The comparative performance, fee and expense information prepared and provided by Broadridge was not independently verified and the independent Trustees did not independently verify any information provided to them by MFS.
The Trustees’ conclusion as to the continuation of the investment advisory agreement was based on a comprehensive consideration of all information provided to the Trustees and not the result of any single factor. Some of the factors that figured particularly in the Trustees’ deliberations are described below, although individual Trustees may have evaluated the information presented differently from one another, giving different weights to various factors. It is also important to recognize that the fee arrangements for the Fund and other MFS Funds are the result of years of review and discussion between the independent Trustees and MFS, that certain aspects of such arrangements may receive greater scrutiny in some years than in others, and that the Trustees’ conclusions may be based, in part, on their consideration of these same arrangements during the course of the year and in prior years.
Based on information provided by Broadridge and MFS, the Trustees reviewed the Fund’s total return investment performance as well as the Broadridge performance universe over various time periods. The Trustees placed particular emphasis on the total return performance of the Fund’s Class A shares in comparison to the performance of funds in its Broadridge performance universe over the five-year period ended December 31, 2018, which the Trustees believed was a long enough period to reflect differing market conditions. The total return performance of the Fund’s Class A shares was in the 3rd quintile relative to the other funds in the universe for this five-year period (the 1st quintile being the best performers and the 5th quintile being the worst performers). The total return performance of the Fund’s Class A shares was in the 4th quintile for theone-year period and the 3rd quintile for the three-year period ended December 31, 2018 relative to the Broadridge performance universe. Because of the passage of time, these performance results may differ from the performance results for more recent periods, including those shown elsewhere in this report.
In the course of their deliberations, the Trustees took into account information provided by MFS in connection with the contract review meetings, as well as during investment review meetings conducted with portfolio management personnel during the course of the year regarding the Fund’s performance. After reviewing these and related factors, the Trustees concluded, within the context of their overall conclusions regarding the investment advisory agreement, that they were satisfied with MFS’ responses and efforts relating to investment performance.
In assessing the reasonableness of the Fund’s advisory fee, the Trustees considered, among other information, the Fund’s advisory fee and the total expense ratio of the Fund’s Class A shares as a percentage of average daily net assets and the advisory fee and total expense ratios of the Broadridge expense group based on information provided by Broadridge. The Trustees considered that, according to the data provided by Broadridge (which takes into account any fee reductions or expense limitations that were in effect during the Fund’s last fiscal year), the Fund’s effective advisory fee rate and total expense ratio were each lower than the Broadridge expense group median.
48
Board Review of Investment Advisory Agreement – continued
The Trustees also considered the advisory fees charged by MFS to any institutional separate accounts advised by MFS (“separate accounts”) and unaffiliated investment companies for which MFS serves as subadviser (“subadvised funds”) that have comparable investment strategies to the Fund, if any. In comparing these fees, the Trustees considered information provided by MFS as to the generally broader scope of services provided by MFS to the Fund, as well as the more extensive regulatory burdens imposed on MFS in managing the Fund, in comparison to separate accounts and subadvised funds. The Trustees also considered the higher demands placed on MFS’ investment personnel and trading infrastructure as a result of the daily cashin-flows andout-flows of the Fund in comparison to separate accounts.
The Trustees also considered whether the Fund may benefit from any economies of scale in the management of the Fund in the event of growth in assets of the Fund and/or growth in assets of the MFS Funds as a whole. They noted that the Fund’s advisory fee rate schedule is subject to contractual breakpoints that reduce the Fund’s advisory fee rate on average daily net assets over $7.5 billion, $10 billion, $20 billion, $25 billion, $30 billion, $35 billion, $40 billion, $45 billion, and $50 billion. They also noted that MFS has agreed to implement an additional contractual breakpoint that reduces its advisory fee rate on the Fund’s average daily net assets over $60 billion effective August 1, 2019. The Trustees also noted that MFS has agreed in writing to waive a portion of the management fees of certain MFS Funds, including the Fund, if the total combined assets of certain funds within the MFS Funds’ complex increase above agreed upon thresholds (the “group fee waiver”), enabling the Fund’s shareholders to share in the benefits from any economies of scale at the complex level. The group fee waiver is reviewed and renewed annually between the Board and MFS. The Trustees concluded that the breakpoints and the group fee waiver were sufficient to allow the Fund to benefit from economies of scale as its assets and overall complex assets grow.
The Trustees also considered information prepared by MFS relating to MFS’ costs and profits with respect to the Fund, the MFS Funds considered as a group, and other investment companies and accounts advised by MFS, as well as MFS’ methodologies used to determine and allocate its costs to the MFS Funds, the Fund and other accounts and products for purposes of estimating profitability.
After reviewing these and other factors described herein, the Trustees concluded, within the context of their overall conclusions regarding the investment advisory agreement, that the advisory fees charged to the Fund represent reasonable compensation in light of the services being provided by MFS to the Fund.
In addition, the Trustees considered MFS’ resources and related efforts to continue to retain, attract and motivate capable personnel to serve the Fund. The Trustees also considered current and developing conditions in the financial services industry, including the presence of large and well-capitalized companies which are spending, and appear to be prepared to continue to spend, substantial sums to engage personnel and to provide services to competing investment companies. In this regard, the Trustees also considered the financial resources of MFS and its ultimate parent, Sun Life Financial Inc. The Trustees also considered the advantages and possible disadvantages to the Fund of having an adviser that also serves other investment companies as well as other accounts.
49
Board Review of Investment Advisory Agreement – continued
The Trustees also considered the nature, quality, cost, and extent of administrative, transfer agency, and distribution services provided to the Fund by MFS and its affiliates under agreements and plans other than the investment advisory agreement, including any12b-1 fees the Fund pays to MFS Fund Distributors, Inc., an affiliate of MFS. The Trustees also considered the nature, extent and quality of certain other services MFS performs or arranges for on the Fund’s behalf, which may include securities lending programs, directed expense payment programs, class action recovery programs, and MFS’ interaction with third-party service providers, principally custodians andsub-custodians. The Trustees concluded that the variousnon-advisory services provided by MFS and its affiliates on behalf of the Fund were satisfactory.
The Trustees consideredso-called“fall-out benefits” to MFS such as reputational value derived from serving as investment manager to the MFS Funds. The Trustees also considered that, effective January 3, 2018, MFS had discontinued its historic practice of obtaining investment research from portfolio brokerage commissions paid by certain MFS Funds and would thereafter directly pay for or voluntarily reimburse a Fund, if applicable, for the costs of external research acquired through the use of the Fund’s portfolio brokerage commissions.
Based on their evaluation of factors that they deemed to be material, including those factors described above, the Board of Trustees, including the independent Trustees, concluded that the Fund’s investment advisory agreement with MFS should be continued for an additionalone-year period, commencing August 1, 2019.
50
PROXY VOTING POLICIES AND INFORMATION
MFS votes proxies on behalf of the fund pursuant to proxy voting policies and procedures that are available without charge, upon request, by calling1-800-225-2606, by visitingmfs.com/proxyvoting,or by visiting the SEC’s Web site athttp://www.sec.gov.
Information regarding how the fund voted proxies relating to portfolio securities during the most recent twelve-month period ended June 30 is available by August 31 of each year without charge by visitingmfs.com/proxyvoting,or by visiting the SEC’s Web site athttp://www.sec.gov.
QUARTERLY PORTFOLIO DISCLOSURE
The fund files a complete schedule of portfolio holdings with the SEC for the first and third quarters of each fiscal year on Form N-Q or as an exhibit to its reports onForm N-PORT (for first and third fiscal quarters ending March 31, 2019 or after). The fund’s Form N-Q or Form N-PORT reports are available on the SEC’s website athttp://www.sec.gov.A shareholder can obtain the portfolio holdings report for the first and third quarters of the fund’s fiscal year atmfs.com/openendfunds by choosing the fund’s name and then selecting the “Resources” tab and clicking on “Prospectus and Reports”.
FURTHER INFORMATION
From time to time, MFS may post important information about the fund or the MFS funds on the MFS web site (mfs.com). This information is available athttps://www.mfs.com/en-us/what-we-do/announcements.htmlor atmfs.com/openendfundsby choosing the fund’s name.
INFORMATION ABOUT FUND CONTRACTS AND LEGAL CLAIMS
The fund has entered into contractual arrangements with an investment adviser, administrator, distributor, shareholder servicing agent, 529 program manager (if applicable), and custodian who each provide services to the fund. Unless expressly stated otherwise, shareholders are not parties to, or intended beneficiaries of these contractual arrangements, and these contractual arrangements are not intended to create any shareholder right to enforce them against the service providers or to seek any remedy under them against the service providers, either directly or on behalf of the fund.
Under the Trust’s By-Laws and Declaration of Trust, any claims asserted against or on behalf of the MFS Funds, including claims against Trustees and Officers, must be brought in state and federal courts located within the Commonwealth of Massachusetts.
FEDERAL TAX INFORMATION (unaudited)
The fund will notify shareholders of amounts for use in preparing 2019 income tax forms in January 2020. The following information is provided pursuant to provisions of the Internal Revenue Code.
The fund designates the maximum amount allowable as qualified dividend income eligible to be taxed at the same rate as long-term capital gain.
The fund designates $724,016,000 as capital gain dividends paid during the fiscal year.
For corporate shareholders, 100.00% of the ordinary income dividends paid during the fiscal year qualify for the corporate dividends received deduction.
The fund designates the maximum amount allowable as Section 199A dividends as defined in Proposed Treasury Regulation §1.199A-3(d).
51
rev. 3/16
| | | | |
| | | |
FACTS | | WHAT DOES MFS DO WITH YOUR PERSONAL INFORMATION? | |  |
| | |
| Why? | | Financial companies choose how they share your personal information. Federal law gives consumers the right to limit some but not all sharing. Federal law also requires us to tell you how we collect, share, and protect your personal information. Please read this notice carefully to understand what we do. |
| | |
| What? | | The types of personal information we collect and share depend on the product or service you have with us. This information can include: • Social Security number and account balances • Account transactions and transaction history • Checking account information and wire transfer instructions When you areno longer our customer, we continue to share your information as described in this notice. |
| | |
| How? | | All financial companies need to share customers’ personal information to run their everyday business. In the section below, we list the reasons financial companies can share their customers’ personal information; the reasons MFS chooses to share; and whether you can limit this sharing. |
| | | | |
Reasons we can share your
personal information | | Does MFS
share? | | Can you limit
this sharing? |
For our everyday business purposes – such as to process your transactions, maintain your account(s), respond to court orders and legal investigations, or report to credit bureaus | | Yes | | No |
For our marketing purposes – to offer our products and services to you | | No | | We don’t share |
For joint marketing with other financial companies | | No | | We don’t share |
For our affiliates’ everyday business purposes – information about your transactions and experiences | | No | | We don’t share |
For our affiliates’ everyday business purposes – information about your creditworthiness | | No | | We don’t share |
| For nonaffiliates to market to you | | No | | We don’t share |
| | |
| | |
| Questions? | | Call800-225-2606 or go tomfs.com. |
52
| | |
| Who we are |
| Who is providing this notice? | | MFS Funds, MFS Investment Management, MFS Institutional Advisors, Inc., and MFS Heritage Trust Company. |
| | |
| What we do |
| How does MFS protect my personal information? | | To protect your personal information from unauthorized access and use, we use security measures that comply with federal law. These measures include procedural, electronic, and physical safeguards for the protection of the personal information we collect about you. |
| How does MFS collect my personal information? | | We collect your personal information, for example, when you • open an account or provide account information • direct us to buy securities or direct us to sell your securities • make a wire transfer We also collect your personal information from others, such as credit bureaus, affiliates, or other companies. |
| Why can’t I limit all sharing? | | Federal law gives you the right to limit only • sharing for affiliates’ everyday business purposes – information about your creditworthiness • affiliates from using your information to market to you • sharing for nonaffiliates to market to you State laws and individual companies may give you additional rights to limit sharing. |
| | |
| Definitions |
| Affiliates | | Companies related by common ownership or control. They can be financial and nonfinancial companies. • MFS does not share personal information with affiliates, except for everyday business purposes as described on page one of this notice. |
| Nonaffiliates | | Companies not related by common ownership or control. They can be financial and nonfinancial companies. • MFS does not share with nonaffiliates so they can market to you. |
| Joint marketing | | A formal agreement between nonaffiliated financial companies that together market financial products or services to you. • MFS doesn’t jointly market. |
| | |
| Other important information |
| If you own an MFS product or receive an MFS service in the name of a third party such as a bank or broker-dealer, their privacy policy may apply to you instead of ours. |
53
Save paper with eDelivery.

| MFS® will send you prospectuses, |
reports, and proxies directly viae-mail so you will get information faster with less mailbox clutter.
To sign up:
1. Go to mfs.com.
2. Log in via MFS® Access.
3. Select eDelivery.
If you own your MFS fund shares through a financial institution or a retirement plan, MFS® TALK, MFS® Access, or eDelivery may not be available to you.
CONTACT
WEB SITE
mfs.com
MFS TALK
1-800-637-8255
24 hours a day
ACCOUNT SERVICE AND LITERATURE
Shareholders
1-800-225-2606
Financial advisors
1-800-343-2829
Retirement plan services
1-800-637-1255
MAILING ADDRESS
MFS Service Center, Inc.
P.O. Box 219341
Kansas City, MO 64121-9341
OVERNIGHT MAIL
MFS Service Center, Inc.
Suite 219341
430 W 7th Street
Kansas City, MO 64105-1407
The Registrant has adopted a Code of Ethics (the “Code”) pursuant to Section 406 of the Sarbanes-Oxley Act and as defined in FormN-CSR that applies to the Registrant’s principal executive officer and principal financial and accounting officer. During the period covered by this report, the Registrant has not amended any provision in the Code that relates to an element of the Code’s definition enumerated in paragraph (b) of Item 2 of this FormN-CSR. During the period covered by this report, the Registrant did not grant a waiver, including an implicit waiver, from any provision of the Code.
A copy of the Code is attached hereto asEX-99.COE.
| ITEM 3. | AUDIT COMMITTEE FINANCIAL EXPERT. |
Messrs. Steven E. Buller, Michael Hegarty, James Kilman, and Clarence Otis, Jr. and Ms. Maryanne L. Roepke, members of the Audit Committee, have been determined by the Board of Trustees in their reasonable business judgment to meet the definition of “audit committee financial expert” as such term is defined in FormN-CSR. In addition, Messrs. Buller, Hegarty, Kilman, and Otis and Ms. Roepke are “independent” members of the Audit Committee (as such term has been defined by the Securities and Exchange Commission in regulations implementing Section 407 of the Sarbanes-Oxley Act of 2002). The Securities and Exchange Commission has stated that the designation of a person as an audit committee financial expert pursuant to this Item 3 on the FormN-CSR does not impose on such a person any duties, obligations or liability that are greater than the duties, obligations or liability imposed on such person as a member of the Audit Committee and the Board of Trustees in the absence of such designation or identification.
| ITEM 4. | PRINCIPAL ACCOUNTANT FEES AND SERVICES. |
Items 4(a) through 4(d) and 4(g):
The Board of Trustees has appointed Deloitte & Touche LLP (“Deloitte”) to serve as independent accountants to certain series of the Registrant and Ernst & Young LLP (“E&Y”) to serve in the same capacity to certain other series of the Registrant (each a “Fund” and collectively the “Funds”). The tables below set forth the audit fees billed to each Fund as well as fees fornon-audit services provided to each Fund and/or to each Fund’s investment adviser, Massachusetts Financial Services Company (“MFS”), and to various entities either controlling, controlled by, or under common control with MFS that provide ongoing services to the Funds (“MFS Related Entities”).
For the fiscal years ended August 31, 2019 and 2018, audit fees billed to each Fund by Deloitte and E&Y were as follows:
| | | | | | | | |
| | | Audit Fees | |
| | | 2019 | | | 2018 | |
Fees Billed by Deloitte | | | | | | | | |
MFS Low Volatility Global Equity Fund | | | 47,436 | | | | 46,387 | |
MFS U.S. Government Cash Reserve Fund | | | 34,434 | | | | 32,700 | |
| | | | | | | | |
Total | | | 81,870 | | | | 79,087 | |
| | | | | | | | |
| | | Audit Fees | |
| | | 2019 | | | 2018 | |
Fees Billed by E&Y | | | | | | | | |
MFS Core Equity Fund | | | 47,851 | | | | 46,793 | |
MFS Low Volatility Equity Fund | | | 41,425 | | | | 40,512 | |
MFS New Discovery Fund | | | 46,328 | | | | 45,304 | |
MFS Research International Fund | | | 51,014 | | | | 49,885 | |
MFS Technology Fund | | | 47,851 | | | | 46,793 | |
MFS Value Fund | | | 47,986 | | | | 46,925 | |
| | | | | | | | |
Total | | | 282,455 | | | | 276,212 | |
For the fiscal years ended August 31, 2019 and 2018, fees billed by Deloitte and E&Y for audit-related, tax and other services provided to each Fund and for audit-related, tax and other services provided to MFS and MFS Related Entities were as follows:
| | | | | | | | | | | | | | | | | | | | | | | | |
| | | Audit-Related Fees1 | | | Tax Fees2 | | | All Other Fees3 | |
| | | 2019 | | | 2018 | | | 2019 | | | 2018 | | | 2019 | | | 2018 | |
Fees Billed by Deloitte | | | | | | | | | | | | | | | | | | | | | | | | |
To MFS Low Volatility Global Equity Fund | | | 0 | | | | 0 | | | | 6,978 | | | | 6,821 | | | | 0 | | | | 0 | |
To MFS U.S. Government Cash Reserve Fund | | | 0 | | | | 2,000 | | | | 3,377 | | | | 3,301 | | | | 0 | | | | 0 | |
Total fees billed by Deloitte To above Funds | | | 0 | | | | 2,000 | | | | 10,355 | | | | 10,122 | | | | 0 | | | | 0 | |
| | | |
| | | Audit-Related Fees1 | | | Tax Fees2 | | | All Other Fees3 | |
| | | 2019 | | | 2018 | | | 2019 | | | 2018 | | | 2019 | | | 2018 | |
Fees Billed by Deloitte | | | | | | | | | | | | | | | | | | | | | | | | |
To MFS and MFS Related Entities of MFS Low Volatility Global Equity Fund* | | | 0 | | | | 0 | | | | 0 | | | | 0 | | | | 3,790 | | | | 5,390 | |
To MFS and MFS Related Entities of MFS U.S. Government Cash Reserve Fund* | | | 0 | | | | 0 | | | | 0 | | | | 0 | | | | 3,790 | | | | 5,390 | |
| | | | | | | | |
| | | Aggregate Fees for Non-audit
Services | |
| | | 2019 | | | 2018 | |
Fees Billed by Deloitte | | | | | | | | |
To MFS Low Volatility Global Equity Fund, MFS and MFS Related Entities# | | | 10,768 | | | | 12,211 | |
To MFS U.S. Government Cash Reserve Fund, MFS and MFS Related Entities# | | | 7,167 | | | | 10,691 | |
| | | | | | | | | | | | | | | | | | | | | | | | |
| | | Audit-Related Fees1 | | | Tax Fees2 | | | All Other Fees4 | |
| | | 2019 | | | 2018 | | | 2019 | | | 2018 | | | 2019 | | | 2018 | |
Fees Billed by E&Y | | | | | | | | | | | | | | | | | | | | | | | | |
To MFS Core Equity Fund | | | 2,500 | | | | 0 | | | | 9,176 | | | | 8,976 | | | | 1,543 | | | | 1,586 | |
To MFS Low Volatility Equity Fund | | | 0 | | | | 0 | | | | 9,136 | | | | 8,542 | | | | 1,027 | | | | 1,026 | |
To MFS New Discovery Fund | | | 0 | | | | 0 | | | | 9,176 | | | | 8,976 | | | | 1,332 | | | | 1,415 | |
To MFS Research International Fund | | | 0 | | | | 0 | | | | 9,642 | | | | 9,431 | | | | 3,211 | | | | 3,530 | |
To MFS Technology Fund | | | 0 | | | | 0 | | | | 9,176 | | | | 8,976 | | | | 1,289 | | | | 1,272 | |
To MFS Value Fund | | | 0 | | | | 0 | | | | 9,176 | | | | 8,976 | | | | 13,758 | | | | 16,432 | |
Total fees billed by E&Y To above Funds | | | 2,500 | | | | 0 | | | | 55,482 | | | | 53,877 | | | | 22,160 | | | | 25,261 | |
| | | | | | | | | | | | | | | | | | | | | | | | |
| | | Audit-Related Fees1 | | | Tax Fees2 | | | All Other Fees4 | |
| | | 2019 | | | 2018 | | | 2019 | | | 2018 | | | 2019 | | | 2018 | |
Fees Billed by E&Y | | | | | | | | | | | | | | | | | | | | | | | | |
To MFS and MFS Related Entities of MFS Core Equity Fund* | | | 1,679,277 | | | | 1,728,076 | | | | 0 | | | | 0 | | | | 104,750 | | | | 102,450 | |
To MFS and MFS Related Entities of Low Volatility Equity Fund* | | | 1,679,277 | | | | 1,728,076 | | | | 0 | | | | 0 | | | | 104,750 | | | | 102,450 | |
To MFS and MFS Related Entities of MFS New Discovery Fund* | | | 1,679,277 | | | | 1,728,076 | | | | 0 | | | | 0 | | | | 104,750 | | | | 102,450 | |
To MFS and MFS Related Entities of MFS Research International Fund* | | | 1,679,277 | | | | 1,728,076 | | | | 0 | | | | 0 | | | | 104,750 | | | | 102,450 | |
To MFS and MFS Related Entities of MFS Technology Fund* | | | 1,679,277 | | | | 1,728,076 | | | | 0 | | | | 0 | | | | 104,750 | | | | 102,450 | |
To MFS and MFS Related Entities of MFS Value Fund* | | | 1,679,277 | | | | 1,728,076 | | | | 0 | | | | 0 | | | | 104,750 | | | | 102,450 | |
| | | | | | | | |
| | | Aggregate Fees for Non-audit
Services | |
| | | 2019 | | | 2018 | |
Fees Billed by E&Y | | | | | | | | |
To MFS Core Equity Fund, MFS and MFS Related Entities# | | | 1,984,446 | | | | 2,038,788 | |
To Low Volatility Equity Fund, MFS and MFS Related Entities# | | | 1,981,390 | | | | 2,037,794 | |
To MFS New Discovery Fund, MFS and MFS Related Entities# | | | 1,981,735 | | | | 2,038,617 | |
To MFS Research International Fund, MFS and MFS Related Entities# | | | 1,984,080 | | | | 2,041,187 | |
To MFS Technology Fund, MFS and MFS Related Entities# | | | 1,981,692 | | | | 2,038,474 | |
To MFS Value Fund, MFS and MFS Related Entities# | | | 1,994,161 | | | | 2,053,634 | |
| * | This amount reflects the fees billed to MFS and MFS Related Entities fornon-audit services relating directly to the operations and financial reporting of the Funds (portions of which services also related to the operations and financial reporting of other funds within the MFS Funds complex). |
| # | This amount reflects the aggregate fees billed by Deloitte or E&Y fornon-audit services rendered to the Funds and fornon-audit services rendered to MFS and the MFS Related Entities. |
| 1 | The fees included under “Audit-Related Fees” are fees related to assurance and related services that are reasonably related to the performance of the audit or review of financial statements, but not reported under ‘‘Audit Fees,’’ including accounting consultations, agreed-upon procedure reports, attestation reports, comfort letters and internal control reviews. |
| 2 | The fees included under “Tax Fees” are fees associated with tax compliance, tax advice and tax planning, including services relating to the filing or amendment of federal, state or local income tax returns, regulated investment company qualification reviews and tax distribution and analysis. |
| 3 | The fees included under “All Other Fees” are fees for products and services provided by Deloitte other than those reported under “Audit Fees,” “Audit-Related Fees” and “Tax Fees”. |
| 4 | The fees included under “All Other Fees” are fees for products and services provided by E&Y other than those reported under “Audit Fees,” “Audit-Related Fees” and “Tax Fees,” including fees for services related to review of internal controls and review of Rule38a-1 compliance program. |
Item 4(e)(1):
Set forth below are the policies and procedures established by the Audit Committee of the Board of Trustees relating to thepre-approval of audit andnon-audit related services:
To the extent required by applicable law,pre-approval by the Audit Committee of the Board is needed for all audit and permissiblenon-audit services rendered to the Fund and all permissiblenon-audit services rendered to MFS or MFS Related Entities if the services relate directly to the operations and financial reporting of the Registrant.Pre-approval is currently on anengagement-by-engagement basis. In the eventpre-approval of such services is necessary between regular meetings of the Audit Committee and it is not practical to wait to seekpre-approval at the next regular meeting of the Audit Committee,pre-approval of such services may be referred to the Chair of the Audit Committee for approval; provided that the Chair may notpre-approve any individual engagement for such services exceeding $50,000 or multiple engagements for such services in the aggregate exceeding $100,000 in each period between regular meetings of the Audit Committee. Any engagementpre-approved by the Chair between regular meetings of the Audit Committee shall be presented for ratification by the entire Audit Committee at its next regularly scheduled meeting.
Item 4(e)(2):
None, or 0%, of the services relating to the Audit-Related Fees, Tax Fees and All Other Fees paid by the Fund and MFS and MFS Related Entities relating directly to the operations and financial reporting of the Registrant disclosed above were approved by the audit committee pursuant to paragraphs (c)(7)(i)(C) of Rule2-01 of RegulationS-X (which permits audit committee approval after the start of the engagement with respect to services other than audit, review or attest services, if certain conditions are satisfied).
Item 4(f):
Not applicable.
Item 4(h):
The Registrant’s Audit Committee has considered whether the provision by a Registrant’s independent registered public accounting firm ofnon-audit services to MFS and MFS Related Entities that were notpre-approved by the Committee (because such services did not relate directly to the operations and financial reporting of the Registrant) was compatible with maintaining the independence of the independent registered public accounting firm as the Registrant’s principal auditors.
| ITEM 5. | AUDIT COMMITTEE OF LISTED REGISTRANTS. |
Not applicable to the Registrant.
A schedule of investments of the Registrant is included as part of the report to shareholders of such series under Item 1 of this FormN-CSR.
| ITEM 7. | DISCLOSURE OF PROXY VOTING POLICIES AND PROCEDURES FORCLOSED-END MANAGEMENT INVESTMENT COMPANIES. |
Not applicable to the Registrant.
| ITEM 8. | PORTFOLIO MANAGERS OFCLOSED-END MANAGEMENT INVESTMENT COMPANIES. |
Not applicable to the Registrant.
| ITEM 9. | PURCHASES OF EQUITY SECURITIES BYCLOSED-END MANAGEMENT INVESTMENT COMPANY AND AFFILIATED PURCHASERS. |
Not applicable to the Registrant.
| ITEM 10. | SUBMISSION OF MATTERS TO A VOTE OF SECURITY HOLDERS. |
There were no material changes to the procedures by which shareholders may send recommendations to the Board for nominees to the Registrant’s Board since the Registrant last provided disclosure as to such procedures in response to the requirements of Item 407 (c)(2)(iv) of RegulationS-K or this Item.
| ITEM 11. | CONTROLS AND PROCEDURES. |
| (a) | Based upon their evaluation of the effectiveness of the registrant’s disclosure controls and procedures (as defined in Rule30a-3(c) under the Investment Company Act of 1940 (the “Act”)) as conducted within 90 days of the filing date of this report on FormN-CSR, the registrant’s principal financial officer and principal executive officer have concluded that those disclosure controls and procedures provide reasonable assurance that the material information required to be disclosed by the registrant on this report is recorded, processed, summarized and reported within the time periods specified in the Securities and Exchange Commission’s rules and forms. |
| (b) | There were no changes in the registrant’s internal controls over financial reporting (as defined in Rule30a-3(d) under the Act) that occurred during the period covered by the report* that have materially affected, or are reasonably likely to materially affect, the registrant’s internal control over financial reporting. |
| * | With respect to the following series of the Registrant only, the phrase “during the period” in item 11(b) is replaced with the phrase “during the second fiscal quarter of the period”: MFS U.S. Government Cash Reserve Fund. |
| ITEM 12. | DISCLOSURE OF SECURITIES LENDING ACTIVITIES FORCLOSED-END MANAGEMENT INVESTMENT COMPANIES. |
Not applicable to the Registrant.
| | | | |
| (a) | | (1) | | Any code of ethics, or amendment thereto, that is the subject of the disclosure required by Item 2, to the extent that the registrant intends to satisfy the Item 2 requirements through filing of an exhibit: Attached hereto asEX-99.COE. |
| | |
| | (2) | | A separate certification for each principal executive officer and principal financial officer of the registrant as required by Rule30a-2(a) under the Act (17 CFR270.30a-2): Attached hereto asEX-99.302CERT. |
| | |
| | (3) | | Any written solicitation to purchase securities under Rule23c-1 under the Act (17 CFR270.23c-1) sent or given during the period covered by the report by or on behalf of the registrant to 10 or more persons. Not applicable. |
| | |
| | (4) | | Change in the registrant’s independent public accountant. Not applicable. |
| |
| (b) | | If the report is filed under Section 13(a) or 15(d) of the Exchange Act, provide the certifications required by Rule30a-2(b) under the Act (17 CFR270.30a-2(b)), Rule13a-14(b) or Rule15d-14(b) under the Exchange Act (17 CFR240.13a-14(b) or240.15d-14(b)) and Section 1350 of Chapter 63 of Title 18 of the United States Code (18 U.S.C. 1350) as an exhibit. A certification furnished pursuant to this paragraph will not be deemed “filed” for the purposes of Section 18 of the Exchange Act (15 U.S.C. 78r), or otherwise subject to the liability of that section. Such certification will not be deemed to be incorporated by reference into any filing under the Securities Act of 1933 or the Exchange Act, except to the extent that the registrant specifically incorporates it by reference. Attached hereto asEX-99.906CERT. |
Notice
A copy of the Amended and Restated Declaration of Trust, as amended, of the Registrant is on file with the Secretary of State of The Commonwealth of Massachusetts and notice is hereby given that this instrument is executed on behalf of the Registrant by an officer of the Registrant as an officer and not individually and the obligations of or arising out of this instrument are not binding upon any of the Trustees or shareholders individually, but are binding only upon the assets and property of the respective constituent series of the Registrant.
SIGNATURES
Pursuant to the requirements of the Securities Exchange Act of 1934 and the Investment Company Act of 1940, the registrant has duly caused this report to be signed on its behalf by the undersigned, thereunto duly authorized.
(Registrant) MFS SERIES TRUST I
| | |
| By (Signature and Title)* | | DAVID L. DILORENZO |
| | David L. DiLorenzo, President |
Date: October 17, 2019
Pursuant to the requirements of the Securities Exchange Act of 1934 and the Investment Company Act of 1940, this report has been signed below by the following persons on behalf of the registrant and in the capacities and on the dates indicated.
| | |
| By (Signature and Title)* | | DAVID L. DILORENZO |
| | David L. DiLorenzo, President (Principal Executive Officer) |
Date: October 17, 2019
| | |
| By (Signature and Title)* | | JAMES O. YOST |
| | James O. Yost, Treasurer (Principal Financial Officer and Accounting Officer) |
Date: October 17, 2019
| * | Print name and title of each signing officer under his or her signature. |