UNITED STATES
SECURITIES AND EXCHANGE COMMISSION
Washington, D.C. 20549
FORM N-CSR
CERTIFIED SHAREHOLDER REPORT OF
REGISTERED MANAGEMENT INVESTMENT COMPANIES
Investment Company Act file number 811-4777
MFS SERIES TRUST I
(Exact name of registrant as specified in charter)
111 Huntington Avenue, Boston, Massachusetts 02199
(Address of principal executive offices) (Zip code)
Kristin V. Collins
Massachusetts Financial Services Company
111 Huntington Avenue
Boston, Massachusetts 02199
(Name and address of agents for service)
Registrant’s telephone number, including area code: (617) 954-5000
Date of fiscal year end: August 31
Date of reporting period: August 31, 2015
| ITEM 1. | REPORTS TO STOCKHOLDERS. |
ANNUAL REPORT
August 31, 2015

MFS® CORE EQUITY FUND

RGI-ANN
MFS® CORE EQUITY FUND
CONTENTS
The report is prepared for the general information of shareholders.
It is authorized for distribution to prospective investors only when preceded or accompanied by a current prospectus.
NOT FDIC INSURED • MAY LOSE VALUE • NO BANK GUARANTEE

LETTER FROM THE CHAIRMAN
Dear Shareholders:
The U.S. economy bounced back after another harsh winter curtailed domestic consumption. Despite strengthening labor and housing markets, however, a stronger U.S. dollar and weak overseas demand have held back corporate earnings.
China’s economic growth continues to slow, raising concerns and adding to global market volatility. Commodity exporters, including Australia and Canada, have been hurt by weaker Chinese demand. Global oil markets remain oversupplied, putting pressure on crude oil and gasoline prices.
In Europe, concerns about a potential Greek debt default have faded, and the eurozone’s economy is expanding mildly. Hopes for a more robust regionwide recovery rest on the European Central Bank’s quantitative easing program.
The world’s financial markets have become increasingly complex in recent years. Now, more than ever, it is important to understand companies on a global basis. At MFS®, we believe our integrated research platform, collaborative culture, active risk management process and long-term focus give us a research advantage.
As investors, we aim to add long-term value. We believe this approach will serve you well as you work with your financial advisor to reach your investment objectives.
Respectfully,

Robert J. Manning
Chairman
MFS Investment Management
October 15, 2015
The opinions expressed in this letter are subject to change and may not be relied upon for investment advice. No forecasts can be guaranteed.
1
PORTFOLIO COMPOSITION
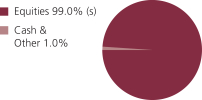
Portfolio structure
| | | | |
| Top ten holdings | | | | |
| Apple, Inc. | | | 2.7% | |
| JPMorgan Chase & Co. | | | 1.8% | |
| Wells Fargo & Co. | | | 1.6% | |
| Allergan PLC | | | 1.6% | |
| Hess Corp. | | | 1.5% | |
| Google, Inc., “A” | | | 1.5% | |
| American International Group, Inc. | | | 1.4% | |
| American Express Co. | | | 1.3% | |
| American Tower Corp., REIT | | | 1.3% | |
| Valero Energy Corp. | | | 1.3% | |
| | | | |
| Equity sectors | | | | |
| Financial Services | | | 18.2% | |
| Technology | | | 15.9% | |
| Health Care | | | 15.1% | |
| Retailing | | | 7.5% | |
| Industrial Goods & Services | | | 7.4% | |
| Consumer Staples | | | 6.8% | |
| Energy | | | 6.1% | |
| Utilities & Communications (s) | | | 5.7% | |
| Leisure | | | 5.2% | |
| Basic Materials | | | 4.0% | |
| Special Products & Services | | | 4.0% | |
| Transportation (s) | | | 1.7% | |
| Autos & Housing | | | 1.4% | |
| (s) | Includes securities sold short. |
Cash & Other can include cash, other assets less liabilities, offsets to derivative positions, and short-term securities. Please see the Statement of Assets and Liabilities for additional information related to the fund’s cash position and the Notes to Financial Statements for additional information related to certain risks associated with assets included in “Other”.
Percentages are based on net assets as of 8/31/15.
The portfolio is actively managed and current holdings may be different.
2
MANAGEMENT REVIEW
Summary of Results
For the twelve months ended August 31, 2015, Class A shares of the MFS Core Equity Fund (“fund”) provided a total return of 0.98%, at net asset value. This compares with a return of 0.36% for the fund’s benchmark, the Russell 3000 Index.
Market Environment
A generally risk-friendly environment prevailed in the first half of the period and any market setbacks, triggered by global growth concerns, were short-lived as central banks responded and kept monetary policy accommodative. For example, the US tempered rate hike expectations while Japan, Europe and China provided fresh stimulus measures which ultimately supported risk assets. Early in the second half of the period, the European Central Bank cut policy interest rates and announced non-conventional easing measures, pushing yields on a significant portion of Eurozone sovereign bonds deeper into negative territory, a notable highlight amid a mini-wave of global easing due to declining inflation and inflation expectations. However, the environment supporting risk began to break down in the latter phases of the period, with both US investment grade and high yield corporate spreads widening out and any individual company performance below expectations resulted in market selling.
A dominant trend for most of the period was the ongoing rise in US equities. Until early in the second half of the period, this was paired with a decline in US and global bond yields. The uptrend in US corporate margins and profits continued throughout the second half of 2014, but in the latter part of the period the margin results became more bifurcated with energy and materials suffering and the rest of the companies holding on to net margins in an ongoing slow revenue growth environment. A rising dollar and a sharp decline in commodity prices, particularly crude oil prices, negatively impacted credit markets, notably US high yield and emerging market debt. The higher weightings of oil and gas credits in these asset classes resulted in widening spreads and increased volatility. In the second half of the period, global sovereign bond yields rose, shrugging off concerns over a Greek debt default. The rise tempered the equity advance, as odds of a 2015 US Federal Reserve rate hike increased. At the end of the period, the stronger US dollar slowed revenues in many US-based multinational companies. As the last month of the period began, risk shedding became a theme across emerging market countries and continued to weaken Chinese economic data as well as economic data of the commodity-driven countries. Risk shedding accelerated outflows and cross-border selling. By the end of the period, many of the world’s equity markets had entered into “correction” territory.
Contributors to performance
Security selection in the technology sector was a significant factor that contributed positively to performance relative to the Russell 3000 Index. The fund’s overweight position in analog semiconductor manufacturer Avago Technologies (Singapore) aided relative results as the stock benefited from strong quarterly results which were driven by their wireless communications division.
Strong stock selection in the health care sector further strengthened relative returns. The fund’s holdings of pharmaceutical company Valeant Pharmaceuticals (b) (Canada)
3
Management Review – continued
boosted relative returns as shares advanced on news of solid organic growth, strong new product launches and the announcement of the company’s acquisition of Salix Pharmaceuticals. The fund’s overweight position in eye and skin care products company Allergan (formerly Activis) performed well as the merger between Activis and Allergan was successful. The timing of holdings in biopharmaceutical company AMAG Pharmaceuticals, particularly an overweight position for the majority of the first half of the reporting period, further lifted relative performance. Strong quarterly results were aided by the recent acquisition of Lumara Health which specializes in maternal health. In particular, the drug Makena, which aims to lower the risk of pre-term births, captured increased market share and continued to be very successful.
Security selection in the consumer staples sector also helped relative performance however, there were no individual securities within this sector that were among the fund’s top relative contributors.
Elsewhere, avoiding integrated oil and gas company Exxon Mobil improved relative results. Shares of Exxon Mobil were negatively impacted by the overall decline in global commodity markets. The timing of the fund’s ownership in shares of coating systems manufacturer Axalta Coating Systems (h) benefited relative results as shares reacted favorably to strong earnings and guidance announcements. Lastly, the fund’s overweight positions in global payments technology company Visa, apparel retailer Burlington Stores (h), child care and early education provider Bright Horizons and cable services provider Time Warner Cable also added to relative performance.
Detractors from performance
Stock selection in the leisure sector detracted from performance relative to the Russell 3000 Index. Overweight positions in resort casino operator Wynn and global media company Twenty-First Century Fox weighed on relative results. Wynn shares declined over the period on a combination of results that missed market expectations and a poor outlook from management. Weak demand in the key markets of Macau and Las Vegas led the firm to slash its quarterly dividend earlier this year. Shares of Twenty-First Century Fox tumbled after management lowered guidance despite fourth-quarter results that were in line with market expectations.
Poor security selection in the transportation sector also hindered relative results. There were no individual securities within this sector that were among the fund’s top relative detractors.
A slightly overweight allocation and stock selection within the energy sector also weakened relative results. Notably, overweight positions in global integrated energy company Hess, oilfield services provider Halliburton and offshore drilling company Noble Energy weighed on relative performance as all three stocks lagged the benchmark due to the global correction in commodities markets.
Elsewhere, an underweight position in internet retailer Amazon.com and overweight positions in mining equipment manufacturer Joy Global (h), global industrial manufacturing and engineering company Colfax (h) and online foreign exchange trading provider FXCM (h) dampened relative results.
The fund’s cash and/or cash equivalents position during the period was also a detractor from relative performance. Under normal market conditions, the fund strives to be fully
4
Management Review – continued
invested and generally holds cash to buy new holdings and to provide liquidity. In a period when equity markets rose, as measured by the fund’s benchmark, holding cash hurt performance versus the benchmark, which has no cash position.
Respectfully,
Joseph MacDougall
Portfolio Manager
| (b) | Security is not a benchmark constituent. |
| (h) | Security was not held in the portfolio at period end. |
The views expressed in this report are those of the portfolio manager only through the end of the period of the report as stated on the cover and do not necessarily reflect the views of MFS or any other person in the MFS organization. These views are subject to change at any time based on market or other conditions, and MFS disclaims any responsibility to update such views. These views may not be relied upon as investment advice or an indication of trading intent on behalf of any MFS portfolio. References to specific securities are not recommendations of such securities, and may not be representative of any MFS portfolio’s current or future investments.
5
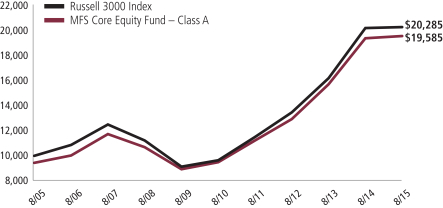
PERFORMANCE SUMMARY THROUGH 8/31/15
The following chart illustrates a representative class of the fund’s historical performance in comparison to its benchmark(s). Performance results include the deduction of the maximum applicable sales charge and reflect the percentage change in net asset value, including reinvestment of dividends and capital gains distributions. The performance of other share classes will be greater than or less than that of the class depicted below. Benchmarks are unmanaged and may not be invested in directly. Benchmark returns do not reflect sales charges, commissions or expenses. (See Notes to Performance Summary.)
Performance data shown represents past performance and is no guarantee of future results. Investment return and principal value fluctuate so your shares, when sold, may be worth more or less than the original cost; current performance may be lower or higher than quoted. The performance shown does not reflect the deduction of taxes, if any, that a shareholder would pay on fund distributions or the redemption of fund shares.
Growth of a Hypothetical $10,000 Investment
6
Performance Summary – continued
Total Returns through 8/31/15
Average annual without sales charge
| | | | | | | | | | | | | | |
| | | Share Class | | Class Inception Date | | 1-yr | | 5-yr | | 10-yr | | Life (t) | | |
| | | A | | 1/02/96 | | 0.98% | | 15.61% | | 7.59% | | N/A | | |
| | | B | | 1/02/97 | | 0.25% | | 14.74% | | 6.82% | | N/A | | |
| | | C | | 1/02/97 | | 0.26% | | 14.76% | | 6.82% | | N/A | | |
| | | I | | 1/02/97 | | 1.23% | | 15.90% | | 7.90% | | N/A | | |
| | | R1 | | 4/01/05 | | 0.22% | | 14.75% | | 6.79% | | N/A | | |
| | | R2 | | 10/31/03 | | 0.75% | | 15.32% | | 7.32% | | N/A | | |
| | | R3 | | 4/01/05 | | 0.99% | | 15.61% | | 7.58% | | N/A | | |
| | | R4 | | 4/01/05 | | 1.22% | | 15.89% | | 7.85% | | N/A | | |
| | | R5 | | 1/02/13 | | 1.34% | | N/A | | N/A | | 15.89% | | |
| Comparative benchmark | | | | | | | | | | |
| | | Russell 3000 Index (f) | | 0.36% | | 16.03% | | 7.33% | | N/A | | |
| Average annual with sales charge | | | | | | | | | | |
| | | A
With initial Sales Charge (5.75%) | | (4.82)% | | 14.25% | | 6.95% | | N/A | | |
| | | B
With CDSC (Declining over six years
from 4% to 0%) (v) | | (3.43)% | | 14.51% | | 6.82% | | N/A | | |
| | | C
With CDSC (1% for 12 months) (v) | | (0.66)% | | 14.76% | | 6.82% | | N/A | | |
CDSC – Contingent Deferred Sales Charge.
Class I, R1, R2, R3, R4, and R5 shares do not have a sales charge.
| (f) | Source: FactSet Research Systems Inc. |
| (t) | For the period from the class inception date through the stated period end (for those share classes with less than 10 years of performance history). No comparative benchmark performance information is provided for “life” periods. (See Notes to Performance Summary.) |
| (v) | Assuming redemption at the end of the applicable period. |
Benchmark Definition
Russell 3000 Index – constructed to provide a comprehensive barometer for the 3,000 largest U.S. companies based on total market capitalization, which represents approximately 98% of the investable U.S. equity market.
It is not possible to invest directly in an index.
Notes to Performance Summary
Average annual total return represents the average annual change in value for each share class for the periods presented. Life returns are presented where the share class has less than 10 years of performance history and represent the average annual total return from the class inception date to the stated period end date. As the fund’s share
7
Performance Summary – continued
classes may have different inception dates, the life returns may represent different time periods and may not be comparable. As a result, no comparative benchmark performance information is provided for life periods.
Performance results reflect any applicable expense subsidies and waivers in effect during the periods shown. Without such subsidies and waivers the fund’s performance results would be less favorable. Please see the prospectus and financial statements for complete details.
Performance results do not include adjustments made for financial reporting purposes in accordance with U.S. generally accepted accounting principles and may differ from amounts reported in the financial highlights.
From time to time the fund may receive proceeds from litigation settlements, without which performance would be lower.
8
EXPENSE TABLE
Fund expenses borne by the shareholders during the period,
March 1, 2015 through August 31, 2015
As a shareholder of the fund, you incur two types of costs: (1) transaction costs, including sales charges (loads) on certain purchase or redemption payments, and (2) ongoing costs, including management fees; distribution and service (12b-1) fees; and other fund expenses. This example is intended to help you understand your ongoing costs (in dollars) of investing in the fund and to compare these costs with the ongoing costs of investing in other mutual funds.
The example is based on an investment of $1,000 invested at the beginning of the period and held for the entire period March 1, 2015 through August 31, 2015.
Actual Expenses
The first line for each share class in the following table provides information about actual account values and actual expenses. You may use the information in this line, together with the amount you invested, to estimate the expenses that you paid over the period. Simply divide your account value by $1,000 (for example, an $8,600 account value divided by $1,000 = 8.6), then multiply the result by the number in the first line under the heading entitled “Expenses Paid During Period” to estimate the expenses you paid on your account during this period.
Hypothetical Example for Comparison Purposes
The second line for each share class in the following table provides information about hypothetical account values and hypothetical expenses based on the fund’s actual expense ratio and an assumed rate of return of 5% per year before expenses, which is not the fund’s actual return. The hypothetical account values and expenses may not be used to estimate the actual ending account balance or expenses you paid for the period. You may use this information to compare the ongoing costs of investing in the fund and other funds. To do so, compare this 5% hypothetical example with the 5% hypothetical examples that appear in the shareholder reports of the other funds.
Please note that the expenses shown in the table are meant to highlight your ongoing costs only and do not reflect any transactional costs, such as sales charges (loads). Therefore, the second line for each share class in the table is useful in comparing ongoing costs only, and will not help you determine the relative total costs of owning different funds. In addition, if these transactional costs were included, your costs would have been higher.
9
Expense Table – continued
| | | | | | | | | | | | | | | | | | |
Share
Class | | | | Annualized
Expense
Ratio | | | Beginning
Account Value
3/01/15 | | | Ending
Account Value
8/31/15 | | | Expenses
Paid During
Period (p)
3/01/15-8/31/15 | |
| A | | Actual | | | 1.04% | | | | $1,000.00 | | | | $950.04 | | | | $5.11 | |
| | Hypothetical (h) | | | 1.04% | | | | $1,000.00 | | | | $1,019.96 | | | | $5.30 | |
| B | | Actual | | | 1.80% | | | | $1,000.00 | | | | $946.72 | | | | $8.83 | |
| | Hypothetical (h) | | | 1.80% | | | | $1,000.00 | | | | $1,016.13 | | | | $9.15 | |
| C | | Actual | | | 1.80% | | | | $1,000.00 | | | | $946.62 | | | | $8.83 | |
| | Hypothetical (h) | | | 1.80% | | | | $1,000.00 | | | | $1,016.13 | | | | $9.15 | |
| I | | Actual | | | 0.80% | | | | $1,000.00 | | | | $951.17 | | | | $3.93 | |
| | Hypothetical (h) | | | 0.80% | | | | $1,000.00 | | | | $1,021.17 | | | | $4.08 | |
| R1 | | Actual | | | 1.80% | | | | $1,000.00 | | | | $946.57 | | | �� | $8.83 | |
| | Hypothetical (h) | | | 1.80% | | | | $1,000.00 | | | | $1,016.13 | | | | $9.15 | |
| R2 | | Actual | | | 1.30% | | | | $1,000.00 | | | | $949.02 | | | | $6.39 | |
| | Hypothetical (h) | | | 1.30% | | | | $1,000.00 | | | | $1,018.65 | | | | $6.61 | |
| R3 | | Actual | | | 1.05% | | | | $1,000.00 | | | | $950.21 | | | | $5.16 | |
| | Hypothetical (h) | | | 1.05% | | | | $1,000.00 | | | | $1,019.91 | | | | $5.35 | |
| R4 | | Actual | | | 0.80% | | | | $1,000.00 | | | | $951.37 | | | | $3.93 | |
| | Hypothetical (h) | | | 0.80% | | | | $1,000.00 | | | | $1,021.17 | | | | $4.08 | |
| R5 | | Actual | | | 0.70% | | | | $1,000.00 | | | | $951.89 | | | | $3.44 | |
| | Hypothetical (h) | | | 0.70% | | | | $1,000.00 | | | | $1,021.68 | | | | $3.57 | |
| (h) | 5% class return per year before expenses. |
| (p) | “Expenses Paid During Period” are equal to each class’s annualized expense ratio, as shown above, multiplied by the average account value over the period, multiplied by 184/365 (to reflect the one-half year period). Expenses paid do not include any applicable sales charges (loads). If these transaction costs had been included, your costs would have been higher. |
Notes to Expense Table
Each class with a Rule 12b-1 service fee is subject to a rebate of a portion of such fee. Such rebates are included in the expense ratios above. For Class A shares, this rebate reduced the expense ratio above by 0.01%. See Note 3 in the Notes to Financial Statements for additional information.
Expense ratios include 0.01% of investment related expenses from short sales (See Note 2 of the Notes to Financial Statements).
10
PORTFOLIO OF INVESTMENTS
8/31/15
The Portfolio of Investments is a complete list of all securities owned by your fund. It is categorized by broad-based asset classes.
| | | | | | | | |
| Common Stocks - 99.0% | | | | | | | | |
| Issuer | | Shares/Par | | | Value ($) | |
| Aerospace - 3.3% | | | | | | | | |
| Honeywell International, Inc. | | | 142,939 | | | $ | 14,189,555 | |
| Northrop Grumman Corp. | | | 59,904 | | | | 9,808,681 | |
| Rockwell Collins, Inc. | | | 61,679 | | | | 5,048,426 | |
| Textron, Inc. | | | 53,151 | | | | 2,062,259 | |
| United Technologies Corp. | | | 115,592 | | | | 10,589,383 | |
| | | | | | | | |
| | | | | | | $ | 41,698,304 | |
| Alcoholic Beverages - 0.5% | | | | | | | | |
| Constellation Brands, Inc., “A” | | | 45,762 | | | $ | 5,857,536 | |
| | |
| Apparel Manufacturers - 1.0% | | | | | | | | |
| Hanesbrands, Inc. | | | 192,184 | | | $ | 5,786,660 | |
| PVH Corp. | | | 53,734 | | | | 6,393,271 | |
| | | | | | | | |
| | | | $ | 12,179,931 | |
| Automotive - 0.4% | | | | | | | | |
| Delphi Automotive PLC | | | 71,787 | | | $ | 5,421,354 | |
| | |
| Biotechnology - 2.3% | | | | | | | | |
| Alder Biopharmaceuticals, Inc. (a) | | | 51,122 | | | $ | 1,980,978 | |
| Alexion Pharmaceuticals, Inc. (a) | | | 76,204 | | | | 13,121,567 | |
| AMAG Pharmaceuticals, Inc. (a) | | | 107,001 | | | | 6,691,843 | |
| Biogen, Inc. (a) | | | 19,329 | | | | 5,746,512 | |
| Exact Sciences Corp. (a)(l) | | | 24,567 | | | | 543,176 | |
| | | | | | | | |
| | | | $ | 28,084,076 | |
| Broadcasting - 2.0% | | | | | | | | |
| Nielsen Holdings PLC | | | 70,857 | | | $ | 3,204,862 | |
| Time Warner, Inc. | | | 132,751 | | | | 9,438,596 | |
| Twenty-First Century Fox, Inc. | | | 449,687 | | | | 12,316,927 | |
| | | | | | | | |
| | | | $ | 24,960,385 | |
| Brokerage & Asset Managers - 2.3% | | | | | | | | |
| Affiliated Managers Group, Inc. (a) | | | 14,398 | | | $ | 2,684,363 | |
| BlackRock, Inc. | | | 32,187 | | | | 9,735,602 | |
| Franklin Resources, Inc. | | | 174,607 | | | | 7,085,552 | |
| NASDAQ OMX Group, Inc. | | | 171,731 | | | | 8,790,910 | |
| | | | | | | | |
| | | | $ | 28,296,427 | |
11
Portfolio of Investments – continued
| | | | | | | | |
| Issuer | | Shares/Par | | | Value ($) | |
| Common Stocks - continued | | | | | | | | |
| Business Services - 2.6% | | | | | | | | |
| Accenture PLC, “A” | | | 54,455 | | | $ | 5,133,473 | |
| Bright Horizons Family Solutions, Inc. (a) | | | 90,148 | | | | 5,509,846 | |
| Equifax, Inc. | | | 20,201 | | | | 1,977,678 | |
| Fidelity National Information Services, Inc. | | | 94,752 | | | | 6,543,573 | |
| Gartner, Inc. (a) | | | 79,948 | | | | 6,836,353 | |
| Global Payments, Inc. | | | 25,328 | | | | 2,821,286 | |
| IMS Health Holdings, Inc. (a) | | | 92,178 | | | | 2,753,357 | |
| Univar, Inc. (a) | | | 35,779 | | | | 810,037 | |
| | | | | | | | |
| | | | $ | 32,385,603 | |
| Cable TV - 1.5% | | | | | | | | |
| Charter Communications, Inc., “A” (a) | | | 31,843 | | | $ | 5,783,007 | |
| Time Warner Cable, Inc. | | | 70,425 | | | | 13,100,459 | |
| | | | | | | | |
| | | | $ | 18,883,466 | |
| Chemicals - 2.1% | |
| Agrium, Inc. | | | 39,927 | | | $ | 4,145,962 | |
| LyondellBasell Industries N.V., “A” | | | 63,945 | | | | 5,459,624 | |
| Monsanto Co. | | | 49,428 | | | | 4,826,644 | |
| PPG Industries, Inc. | | | 124,135 | | | | 11,828,824 | |
| | | | | | | | |
| | | | $ | 26,261,054 | |
| Computer Software - 3.3% | | | | | | | | |
| Adobe Systems, Inc. (a) | | | 153,837 | | | $ | 12,086,973 | |
| Intuit, Inc. | | | 44,138 | | | | 3,784,834 | |
| Oracle Corp. | | | 211,561 | | | | 7,846,797 | |
| Qlik Technologies, Inc. (a) | | | 130,993 | | | | 4,959,395 | |
| Salesforce.com, Inc. (a) | | | 179,950 | | | | 12,481,332 | |
| | | | | | | | |
| | | | $ | 41,159,331 | |
| Computer Software - Systems - 4.8% | | | | | | | | |
| Apple, Inc. (s) | | | 295,625 | | | $ | 33,334,675 | |
| EMC Corp. | | | 418,891 | | | | 10,417,819 | |
| Hewlett-Packard Co. | | | 67,720 | | | | 1,900,223 | |
| NCR Corp. (a) | | | 128,094 | | | | 3,213,878 | |
| Rapid7, Inc. (a) | | | 24,768 | | | | 522,357 | |
| Sabre Corp. | | | 177,770 | | | | 4,838,899 | |
| SS&C Technologies Holdings, Inc. | | | 70,354 | | | | 4,765,780 | |
| Western Digital Corp. | | | 12,271 | | | | 1,005,731 | |
| | | | | | | | |
| | | | $ | 59,999,362 | |
| Construction - 1.0% | | | | | | | | |
| Interface, Inc. | | | 267,258 | | | $ | 6,478,334 | |
| Sherwin-Williams Co. | | | 23,055 | | | | 5,897,700 | |
| | | | | | | | |
| | | | $ | 12,376,034 | |
12
Portfolio of Investments – continued
| | | | | | | | |
| Issuer | | Shares/Par | | | Value ($) | |
| Common Stocks - continued | | | | | | | | |
| Consumer Products - 2.1% | | | | | | | | |
| Colgate-Palmolive Co. | | | 214,097 | | | $ | 13,447,433 | |
| Estee Lauder Cos., Inc., “A” | | | 82,699 | | | | 6,596,899 | |
| Newell Rubbermaid, Inc. | | | 147,294 | | | | 6,205,496 | |
| | | | | | | | |
| | | | $ | 26,249,828 | |
| Consumer Services - 1.4% | | | | | | | | |
| Capella Education Co. | | | 32,407 | | | $ | 1,579,841 | |
| Nord Anglia Education, Inc. (a) | | | 208,260 | | | | 4,277,660 | |
| Priceline Group, Inc. (a) | | | 8,936 | | | | 11,157,847 | |
| | | | | | | | |
| | | | $ | 17,015,348 | |
| Containers - 0.3% | | | | | | | | |
| Crown Holdings, Inc. (a) | | | 33,697 | | | $ | 1,670,360 | |
| Graphic Packaging Holding Co. | | | 117,676 | | | | 1,659,232 | |
| | | | | | | | |
| | | | $ | 3,329,592 | |
| Electrical Equipment - 2.2% | | | | | | | | |
| Advanced Drainage Systems, Inc. | | | 146,267 | | | $ | 4,155,445 | |
| AMETEK, Inc. | | | 133,405 | | | | 7,179,857 | |
| Danaher Corp. | | | 151,179 | | | | 13,155,597 | |
| W.W. Grainger, Inc. | | | 12,253 | | | | 2,737,810 | |
| | | | | | | | |
| | | | $ | 27,228,709 | |
| Electronics - 3.2% | | | | | | | | |
| Analog Devices, Inc. | | | 26,997 | | | $ | 1,508,052 | |
| Avago Technologies Ltd. | | | 109,268 | | | | 13,764,490 | |
| KLA-Tencor Corp. | | | 56,237 | | | | 2,818,036 | |
| Mellanox Technologies Ltd. (a) | | | 88,396 | | | | 3,574,734 | |
| Skyworks Solutions, Inc. | | | 26,494 | | | | 2,314,251 | |
| Texas Instruments, Inc. | | | 307,965 | | | | 14,733,046 | |
| Ultratech, Inc. (a) | | | 85,419 | | | | 1,469,207 | |
| | | | | | | | |
| | | | $ | 40,181,816 | |
| Energy - Independent - 4.5% | | | | | | | | |
| Anadarko Petroleum Corp. | | | 60,569 | | | $ | 4,335,529 | |
| Concho Resources, Inc. (a) | | | 15,833 | | | | 1,712,497 | |
| Energen Corp. | | | 13,734 | | | | 714,168 | |
| EOG Resources, Inc. | | | 71,738 | | | | 5,617,803 | |
| Goodrich Petroleum Corp. (a)(l) | | | 126,142 | | | | 115,193 | |
| Hess Corp. (s) | | | 318,071 | | | | 18,909,321 | |
| Memorial Resource Development Corp. (a) | | | 131,477 | | | | 2,551,969 | |
| Noble Energy, Inc. | | | 54,387 | | | | 1,817,070 | |
| Parsley Energy, Inc., “A” (a) | | | 52,681 | | | | 906,113 | |
| PDC Energy, Inc. (a) | | | 9,373 | | | | 526,575 | |
13
Portfolio of Investments – continued
| | | | | | | | |
| Issuer | | Shares/Par | | | Value ($) | |
| Common Stocks - continued | | | | | | | | |
| Energy - Independent - continued | | | | | | | | |
| Pioneer Natural Resources Co. | | | 18,255 | | | $ | 2,246,460 | |
| Rice Energy, Inc. (a) | | | 44,013 | | | | 856,053 | |
| Valero Energy Corp. | | | 270,153 | | | | 16,030,879 | |
| | | | | | | | |
| | | | $ | 56,339,630 | |
| Energy - Integrated - 0.3% | | | | | | | | |
| Chevron Corp. | | | 51,115 | | | $ | 4,139,804 | |
| | |
| Food & Beverages - 3.1% | | | | | | | | |
| Coca-Cola Co. | | | 316,912 | | | $ | 12,460,980 | |
| General Mills, Inc. | | | 103,026 | | | | 5,847,756 | |
| Mead Johnson Nutrition Co., “A” | | | 44,860 | | | | 3,514,332 | |
| Mondelez International, Inc. | | | 194,007 | | | | 8,218,137 | |
| Snyders-Lance, Inc. | | | 86,881 | | | | 2,933,971 | |
| WhiteWave Foods Co., “A” (a) | | | 115,880 | | | | 5,346,703 | |
| | | | | | | | |
| | | | $ | 38,321,879 | |
| Food & Drug Stores - 1.3% | | | | | | | | |
| CVS Health Corp. | | | 151,286 | | | $ | 15,491,686 | |
| Fairway Group Holdings Corp. (a)(l) | | | 354,644 | | | | 805,042 | |
| | | | | | | | |
| | | | $ | 16,296,728 | |
| Gaming & Lodging - 0.6% | | | | | | | | |
| La Quinta Holdings, Inc. (a) | | | 155,911 | | | $ | 2,938,922 | |
| Wynn Resorts Ltd. | | | 57,420 | | | | 4,309,371 | |
| | | | | | | | |
| | | | $ | 7,248,293 | |
| General Merchandise - 2.2% | | | | | | | | |
| Costco Wholesale Corp. | | | 13,458 | | | $ | 1,884,793 | |
| Dollar Tree, Inc. (a) | | | 95,725 | | | | 7,299,989 | |
| Five Below, Inc. (a) | | | 185,234 | | | | 7,162,999 | |
| Kohl’s Corp. | | | 72,968 | | | | 3,723,557 | |
| Target Corp. | | | 89,812 | | | | 6,979,291 | |
| | | | | | | | |
| | | | $ | 27,050,629 | |
| Health Maintenance Organizations - 1.3% | | | | | | | | |
| Cigna Corp. | | | 34,446 | | | $ | 4,849,652 | |
| UnitedHealth Group, Inc. | | | 97,448 | | | | 11,274,734 | |
| | | | | | | | |
| | | | $ | 16,124,386 | |
| Insurance - 2.7% | | | | | | | | |
| American International Group, Inc. | | | 298,843 | | | $ | 18,032,187 | |
| MetLife, Inc. | | | 110,860 | | | | 5,554,086 | |
| Symetra Financial Corp. | | | 192,725 | | | | 6,065,056 | |
14
Portfolio of Investments – continued
| | | | | | | | |
| Issuer | | Shares/Par | | | Value ($) | |
| Common Stocks - continued | | | | | | | | |
| Insurance - continued | | | | | | | | |
| Unum Group | | | 127,933 | | | $ | 4,290,873 | |
| | | | | | | | |
| | | | $ | 33,942,202 | |
| Internet - 3.5% | | | | | | | | |
| Facebook, Inc., “A “ (a) | | | 87,590 | | | $ | 7,833,174 | |
| Google, Inc., “A” (a) | | | 28,108 | | | | 18,208,925 | |
| Google, Inc., “C” (a) | | | 18,092 | | | | 11,185,379 | |
| LinkedIn Corp., “A” (a) | | | 38,599 | | | | 6,970,979 | |
| | | | | | | | |
| | | | $ | 44,198,457 | |
| Machinery & Tools - 1.9% | | | | | | | | |
| Allison Transmission Holdings, Inc. | | | 155,244 | | | $ | 4,439,978 | |
| Illinois Tool Works, Inc. | | | 52,018 | | | | 4,397,082 | |
| IPG Photonics Corp. (a) | | | 49,572 | | | | 4,184,868 | |
| Roper Technologies, Inc. | | | 63,708 | | | | 10,326,430 | |
| | | | | | | | |
| | | | $ | 23,348,358 | |
| Major Banks - 4.3% | | | | | | | | |
| Goldman Sachs Group, Inc. | | | 60,995 | | | $ | 11,503,657 | |
| JPMorgan Chase & Co. (s) | | | 349,347 | | | | 22,393,143 | |
| Wells Fargo & Co. | | | 377,835 | | | | 20,149,941 | |
| | | | | | | | |
| | | | $ | 54,046,741 | |
| Medical & Health Technology & Services - 1.8% | | | | | | | | |
| Cerner Corp. (a) | | | 27,487 | | | $ | 1,697,597 | |
| Community Health Systems, Inc. (a) | | | 37,615 | | | | 2,019,926 | |
| HCA Holdings, Inc. (a) | | | 37,144 | | | | 3,217,413 | |
| Healthcare Services Group, Inc. | | | 70,333 | | | | 2,351,936 | |
| Henry Schein, Inc. (a) | | | 16,914 | | | | 2,314,004 | |
| McKesson Corp. | | | 45,983 | | | | 9,085,321 | |
| MedAssets, Inc. (a) | | | 67,121 | | | | 1,417,596 | |
| | | | | | | | |
| | | | $ | 22,103,793 | |
| Medical Equipment - 4.2% | | | | | | | | |
| Abbott Laboratories | | | 204,417 | | | $ | 9,258,046 | |
| AtriCure, Inc. (a) | | | 49,752 | | | | 1,216,934 | |
| Cepheid, Inc. (a) | | | 23,202 | | | | 1,130,865 | |
| Cooper Cos., Inc. | | | 32,764 | | | | 5,321,529 | |
| DexCom, Inc. (a) | | | 24,773 | | | | 2,332,130 | |
| Insulet Corp. (a) | | | 43,816 | | | | 1,301,773 | |
| Medtronic PLC | | | 174,370 | | | | 12,605,207 | |
| OraSure Technologies, Inc. (a) | | | 208,513 | | | | 1,125,970 | |
| PerkinElmer, Inc. | | | 51,143 | | | | 2,489,641 | |
| STERIS Corp. | | | 14,649 | | | | 938,268 | |
15
Portfolio of Investments – continued
| | | | | | | | |
| Issuer | | Shares/Par | | | Value ($) | |
| Common Stocks - continued | | | | | | | | |
| Medical Equipment - continued | | | | | | | | |
| Stryker Corp. | | | 114,957 | | | $ | 11,340,508 | |
| TearLab Corp. (a)(l) | | | 279,086 | | | | 759,114 | |
| VWR Corp. (a) | | | 113,034 | | | | 2,967,143 | |
| | | | | | | | |
| | | | $ | 52,787,128 | |
| Metals & Mining - 0.2% | | | | | | | | |
| First Quantum Minerals Ltd. (l) | | | 120,336 | | | $ | 627,474 | |
| Lundin Mining Corp. (a) | | | 512,617 | | | | 1,741,713 | |
| | | | | | | | |
| | | | $ | 2,369,187 | |
| Natural Gas - Distribution - 0.3% | | | | | | | | |
| NorthWestern Corp. | | | 79,241 | | | $ | 4,092,005 | |
| | |
| Natural Gas - Pipeline - 0.5% | | | | | | | | |
| EQT GP Holdings LP | | | 24,564 | | | $ | 798,821 | |
| Plains GP Holdings LP | | | 91,671 | | | | 1,795,835 | |
| Williams Partners LP | | | 78,859 | | | | 3,142,531 | |
| | | | | | | | |
| | | | $ | 5,737,187 | |
| Network & Telecom - 1.1% | | | | | | | | |
| Cisco Systems, Inc. | | | 405,921 | | | $ | 10,505,235 | |
| Ixia (a) | | | 172,080 | | | | 2,662,078 | |
| | | | | | | | |
| | | | $ | 13,167,313 | |
| Oil Services - 1.3% | | | | | | | | |
| Forum Energy Technologies, Inc. (a) | | | 45,003 | | | $ | 707,447 | |
| Halliburton Co. | | | 99,206 | | | | 3,903,756 | |
| Oil States International, Inc. (a) | | | 19,326 | | | | 548,279 | |
| Schlumberger Ltd. | | | 133,699 | | | | 10,344,292 | |
| Tesco Corp. | | | 83,602 | | | | 709,781 | |
| | | | | | | | |
| | | | $ | 16,213,555 | |
| Other Banks & Diversified Financials - 5.4% | | | | | | | | |
| American Express Co. | | | 217,017 | | | $ | 16,649,544 | |
| Discover Financial Services | | | 224,774 | | | | 12,077,107 | |
| EuroDekania Ltd. | | | 580,280 | | | | 202,674 | |
| Fifth Third Bancorp | | | 414,723 | | | | 8,261,282 | |
| PrivateBancorp, Inc. | | | 110,783 | | | | 4,193,137 | |
| Texas Capital Bancshares, Inc. (a) | | | 110,002 | | | | 5,924,708 | |
| Visa, Inc., “A” | | | 201,568 | | | | 14,371,798 | |
| Wintrust Financial Corp. | | | 122,697 | | | | 6,257,547 | |
| | | | | | | | |
| | | | $ | 67,937,797 | |
16
Portfolio of Investments – continued
| | | | | | | | |
| Issuer | | Shares/Par | | | Value ($) | |
| Common Stocks - continued | | | | | | | | |
| Pharmaceuticals - 5.6% | | | | | | | | |
| Allergan PLC (a) | | | 65,242 | | | $ | 19,816,605 | |
| Bristol-Myers Squibb Co. | | | 202,700 | | | | 12,054,569 | |
| Eli Lilly & Co. | | | 194,259 | | | | 15,997,229 | |
| Merck & Co., Inc. | | | 191,417 | | | | 10,307,805 | |
| Valeant Pharmaceuticals International, Inc. (a) | | | 49,567 | | | | 11,430,150 | |
| | | | | | | | |
| | | | $ | 69,606,358 | |
| Railroad & Shipping - 1.3% | | | | | | | | |
| Canadian Pacific Railway Ltd. | | | 41,522 | | | $ | 6,028,994 | |
| Union Pacific Corp. | | | 113,822 | | | | 9,759,098 | |
| | | | | | | | |
| | | | $ | 15,788,092 | |
| Real Estate - 3.4% | | | | | | | | |
| Equity Lifestyle Properties, Inc., REIT | | | 104,536 | | | $ | 5,828,927 | |
| Gramercy Property Trust, Inc., REIT | | | 157,054 | | | | 3,472,464 | |
| Medical Properties Trust, Inc., REIT | | | 523,298 | | | | 6,106,888 | |
| Mid-America Apartment Communities, Inc., REIT | | | 101,893 | | | | 8,007,771 | |
| Plum Creek Timber Co. Inc., REIT | | | 184,608 | | | | 7,105,562 | |
| STAG Industrial, Inc., REIT | | | 69,592 | | | | 1,187,240 | |
| Tanger Factory Outlet Centers, Inc., REIT | | | 260,205 | | | | 8,232,886 | |
| WP GLIMCHER, Inc., REIT | | | 196,999 | | | | 2,385,658 | |
| | | | | | | | |
| | | | $ | 42,327,396 | |
| Restaurants - 1.1% | | | | | | | | |
| Aramark | | | 169,624 | | | $ | 5,316,016 | |
| Chuy’s Holdings, Inc. (a) | | | 6,337 | | | | 194,166 | |
| Domino’s Pizza, Inc. | | | 21,504 | | | | 2,278,134 | |
| YUM! Brands, Inc. | | | 81,066 | | | | 6,466,635 | |
| | | | | | | | |
| | | | $ | 14,254,951 | |
| Specialty Chemicals - 1.4% | | | | | | | | |
| Albemarle Corp. | | | 128,035 | | | $ | 5,788,462 | |
| Amira Nature Foods Ltd. (a)(l) | | | 69,772 | | | | 277,693 | |
| Ecolab, Inc. | | | 70,621 | | | | 7,707,576 | |
| W.R. Grace & Co. (a) | | | 42,741 | | | | 4,228,795 | |
| | | | | | | | |
| | | | $ | 18,002,526 | |
| Specialty Stores - 3.0% | | | | | | | | |
| Amazon.com, Inc. (a) | | | 5,990 | | | $ | 3,072,211 | |
| American Eagle Outfitters, Inc. | | | 87,038 | | | | 1,481,387 | |
| AutoZone, Inc. (a) | | | 11,445 | | | | 8,194,506 | |
| Cabela’s, Inc. (a) | | | 70,173 | | | | 3,155,680 | |
| Gap, Inc. | | | 153,657 | | | | 5,041,486 | |
| Lumber Liquidators Holdings, Inc. (a)(l) | | | 32,460 | | | | 490,471 | |
17
Portfolio of Investments – continued
| | | | | | | | |
| Issuer | | Shares/Par | | | Value ($) | |
| Common Stocks - continued | | | | | | | | |
| Specialty Stores - continued | | | | | | | | |
| Ross Stores, Inc. | | | 126,976 | | | $ | 6,173,573 | |
| Sally Beauty Holdings, Inc. (a) | | | 167,057 | | | | 4,366,870 | |
| Urban Outfitters, Inc. (a) | | | 190,180 | | | | 5,868,955 | |
| | | | | | | | |
| | | | $ | 37,845,139 | |
| Telecommunications - Wireless - 1.3% | | | | | | | | |
| American Tower Corp., REIT | | | 174,449 | | | $ | 16,082,453 | |
| | |
| Telephone Services - 1.0% | | | | | | | | |
| Verizon Communications, Inc. | | | 272,729 | | | $ | 12,548,261 | |
| | |
| Tobacco - 1.1% | | | | | | | | |
| Altria Group, Inc. | | | 128,420 | | | $ | 6,880,744 | |
| Philip Morris International, Inc. | | | 44,686 | | | | 3,565,943 | |
| Reynolds American, Inc. | | | 44,261 | | | | 3,706,859 | |
| | | | | | | | |
| | | | $ | 14,153,546 | |
| Trucking - 0.6% | | | | | | | | |
| FedEx Corp. | | | 15,556 | | | $ | 2,342,889 | |
| Swift Transportation Co. (a) | | | 267,268 | | | | 5,209,053 | |
| | | | | | | | |
| | | | $ | 7,551,942 | |
| Utilities - Electric Power - 2.4% | | | | | | | | |
| Abengoa Yield PLC | | | 41,352 | | | $ | 941,172 | |
| American Electric Power Co., Inc. | | | 74,149 | | | | 4,025,549 | |
| Calpine Corp. (a) | | | 148,034 | | | | 2,359,662 | |
| CMS Energy Corp. | | | 134,010 | | | | 4,392,848 | |
| Dominion Resources, Inc. | | | 55,696 | | | | 3,884,796 | |
| Edison International | | | 58,066 | | | | 3,395,700 | |
| Exelon Corp. | | | 119,168 | | | | 3,665,608 | |
| NextEra Energy, Inc. | | | 46,164 | | | | 4,542,999 | |
| NRG Energy, Inc. | | | 83,936 | | | | 1,672,005 | |
| Pattern Energy Group, Inc. | | | 61,893 | | | | 1,403,111 | |
| | | | | | | | |
| | | | $ | 30,283,450 | |
| Total Common Stocks (Identified Cost, $1,045,681,030) | | | $ | 1,235,477,342 | |
| | |
| Convertible Preferred Stocks - 0.4% | | | | | | | | |
| Telephone Services - 0.4% | | | | | | | | |
| Frontier Communications Corp., 11.125% (Identified Cost, $4,457,362) | | | 44,116 | | | $ | 4,446,893 | |
| | |
| Money Market Funds - 1.0% | | | | | | | | |
| MFS Institutional Money Market Portfolio, 0.11%, at Cost and Net Asset Value (v) | | | 12,260,098 | | | $ | 12,260,098 | |
18
Portfolio of Investments – continued
| | | | | | | | |
| Collateral for Securities Loaned - 0.1% | | | | | | | | |
| Issuer | | Shares/Par | | | Value ($) | |
| Navigator Securities Lending Prime Portfolio, 0.19%, at Cost and Net Asset Value (j) | | | 1,847,684 | | | $ | 1,847,684 | |
| Total Investments (Identified Cost, $1,064,246,174) | | | $ | 1,254,032,017 | |
| | |
| Securities Sold Short - (0.4)% | | | | | | | | |
| Telecommunications - Wireless - (0.2)% | | | | | | | | |
| Crown Castle International Corp., REIT | | | (24,607 | ) | | $ | (2,051,978 | ) |
| | |
| Trucking - (0.2)% | | | | | | | | |
| United Parcel Service, Inc., “B” | | | (27,702 | ) | | $ | (2,705,100 | ) |
| Total Securities Sold Short (Proceeds Received, $4,692,331) | | | $ | (4,757,078 | ) |
| |
| Other Assets, Less Liabilities - (0.1)% | | | | (1,104,771 | ) |
| Net Assets - 100.0% | | | $ | 1,248,170,168 | |
| (a) | Non-income producing security. |
| (j) | The rate quoted is the annualized seven-day yield of the fund at period end. |
| (l) | A portion of this security is on loan. |
| (s) | Security or a portion of the security was pledged to cover collateral requirements for securities sold short and certain derivative transactions. |
| (v) | Underlying affiliated fund that is available only to investment companies managed by MFS. The rate quoted for the MFS Institutional Money Market Portfolio is the annualized seven-day yield of the fund at period end. |
At August 31, 2015, the fund had cash collateral of $61,976 and other liquid securities with an aggregate value of $8,472,587 to cover any commitments for securities sold short and/or certain derivative contracts. Cash collateral is comprised of “Deposits with brokers” on the Statement of Assets and Liabilities.
The following abbreviations are used in this report and are defined:
| PLC | | Public Limited Company |
| REIT | | Real Estate Investment Trust |
See Notes to Financial Statements
19
Financial Statements
STATEMENT OF ASSETS AND LIABILITIES
At 8/31/15
This statement represents your fund’s balance sheet, which details the assets and liabilities comprising the total value of the fund.
| | | | |
| Assets | | | | |
Investments | | | | |
Non-affiliated issuers, at value (identified cost, $1,051,986,076) | | | $1,241,771,919 | |
Underlying affiliated funds, at cost and value | | | 12,260,098 | |
Total investments, at value, including $1,754,411 of securities on loan (identified cost, $1,064,246,174) | | | $1,254,032,017 | |
Cash | | | 21,859 | |
Deposits with brokers | | | 61,976 | |
Receivables for | | | | |
Investments sold | | | 7,162,734 | |
Fund shares sold | | | 1,565,460 | |
Interest and dividends | | | 1,764,812 | |
Other assets | | | 1,651 | |
Total assets | | | $1,264,610,509 | |
| Liabilities | | | | |
Payables for | | | | |
Dividends on securities sold short | | | $20,222 | |
Securities sold short, at value (proceeds received, $4,692,331) | | | 4,757,078 | |
Investments purchased | | | 7,204,608 | |
Fund shares reacquired | | | 1,674,685 | |
Collateral for securities loaned, at value | | | 1,847,684 | |
Payable to affiliates | | | | |
Investment adviser | | | 75,475 | |
Shareholder servicing costs | | | 590,588 | |
Distribution and service fees | | | 38,106 | |
Payable for independent Trustees’ compensation | | | 88,547 | |
Accrued expenses and other liabilities | | | 143,348 | |
Total liabilities | | | $16,440,341 | |
Net assets | | | $1,248,170,168 | |
| Net assets consist of | | | | |
Paid-in capital | | | $938,039,572 | |
Unrealized appreciation (depreciation) on investments and translation of assets and liabilities in foreign currencies | | | 189,721,124 | |
Accumulated net realized gain (loss) on investments and foreign currency | | | 114,672,621 | |
Undistributed net investment income | | | 5,736,851 | |
Net assets | | | $1,248,170,168 | |
Shares of beneficial interest outstanding | | | 46,328,446 | |
20
Statement of Assets and Liabilities – continued
| | | | | | | | | | | | |
| | | Net assets | | | Shares
outstanding | | | Net asset value
per share (a) | |
Class A | | | $963,167,375 | | | | 35,420,685 | | | | $27.19 | |
Class B | | | 34,126,201 | | | | 1,381,810 | | | | 24.70 | |
Class C | | | 88,019,937 | | | | 3,597,595 | | | | 24.47 | |
Class I | | | 49,767,924 | | | | 1,749,740 | | | | 28.44 | |
Class R1 | | | 3,625,276 | | | | 148,256 | | | | 24.45 | |
Class R2 | | | 16,331,867 | | | | 613,459 | | | | 26.62 | |
Class R3 | | | 65,775,113 | | | | 2,426,955 | | | | 27.10 | |
Class R4 | | | 21,158,674 | | | | 772,383 | | | | 27.39 | |
Class R5 | | | 6,197,801 | | | | 217,563 | | | | 28.49 | |
| (a) | Maximum offering price per share was equal to the net asset value per share for all share classes, except for Class A, for which the maximum offering price per share was $28.85 [100 / 94.25 x $27.19]. On sales of $50,000 or more, the maximum offering price of Class A shares is reduced. A contingent deferred sales charge may be imposed on redemptions of Class A, Class B, and Class C shares. Redemption price per share was equal to the net asset value per share for Classes I, R1, R2, R3, R4, and R5. |
See Notes to Financial Statements
21
Financial Statements
STATEMENT OF OPERATIONS
Year ended 8/31/15
This statement describes how much your fund earned in investment income and accrued in expenses. It also describes any gains and/or losses generated by fund operations.
| | | | |
| Net investment income | | | | |
Income | | | | |
Dividends | | | $20,295,832 | |
Interest | | | 289,355 | |
Dividends from underlying affiliated funds | | | 12,226 | |
Foreign taxes withheld | | | (35,694 | ) |
Total investment income | | | $20,561,719 | |
Expenses | | | | |
Management fee | | | $7,720,097 | |
Distribution and service fees | | | 4,142,896 | |
Shareholder servicing costs | | | 2,000,825 | |
Administrative services fee | | | 218,243 | |
Independent Trustees’ compensation | | | 37,700 | |
Custodian fee | | | 125,068 | |
Shareholder communications | | | 100,325 | |
Audit and tax fees | | | 54,606 | |
Legal fees | | | 9,954 | |
Dividend and interest expense on securities sold short | | | 105,796 | |
Miscellaneous | | | 184,089 | |
Total expenses | | | $14,699,599 | |
Fees paid indirectly | | | (52 | ) |
Reduction of expenses by investment adviser and distributor | | | (145,045 | ) |
Net expenses | | | $14,554,502 | |
Net investment income | | | $6,007,217 | |
| Realized and unrealized gain (loss) on investments and foreign currency | |
Realized gain (loss) (identified cost basis) | | | | |
Investments | | | $132,835,087 | |
Securities sold short | | | (373,305 | ) |
Foreign currency | | | (3,977 | ) |
Net realized gain (loss) on investments and foreign currency | | | $132,457,805 | |
Change in unrealized appreciation (depreciation) | | | | |
Investments | | | $(124,429,514 | ) |
Securities sold short | | | 19,239 | |
Translation of assets and liabilities in foreign currencies | | | (11 | ) |
Net unrealized gain (loss) on investments and foreign currency translation | | | $(124,410,286 | ) |
Net realized and unrealized gain (loss) on investments and foreign currency | | | $8,047,519 | |
Change in net assets from operations | | | $14,054,736 | |
See Notes to Financial Statements
22
Financial Statements
STATEMENTS OF CHANGES IN NET ASSETS
These statements describe the increases and/or decreases in net assets resulting from operations, any distributions, and any shareholder transactions.
| | | | | | | | |
| | | Years ended 8/31 | |
| | | 2015 | | | 2014 | |
| Change in net assets | | | | | | |
| From operations | | | | | | | | |
Net investment income | | | $6,007,217 | | | | $5,110,168 | |
Net realized gain (loss) on investments and foreign currency | | | 132,457,805 | | | | 105,521,459 | |
Net unrealized gain (loss) on investments and foreign currency translation | | | (124,410,286 | ) | | | 142,264,064 | |
Change in net assets from operations | | | $14,054,736 | | | | $252,895,691 | |
| Distributions declared to shareholders | | | | | | | | |
From net investment income | | | $(5,098,135 | ) | | | $(7,149,277 | ) |
From net realized gain on investments | | | (95,270,510 | ) | | | — | |
Total distributions declared to shareholders | | | $(100,368,645 | ) | | | $(7,149,277 | ) |
Change in net assets from fund share transactions | | | $42,386,413 | | | | $(64,001,160 | ) |
Total change in net assets | | | $(43,927,496 | ) | | | $181,745,254 | |
| Net assets | | | | | | | | |
At beginning of period | | | 1,292,097,664 | | | | 1,110,352,410 | |
At end of period (including undistributed net investment income of $5,736,851 and $4,997,534, respectively) | | | $1,248,170,168 | | | | $1,292,097,664 | |
See Notes to Financial Statements
23
Financial Statements
FINANCIAL HIGHLIGHTS
The financial highlights table is intended to help you understand the fund’s financial performance for the past 5 years (or life of a particular share class, if shorter). Certain information reflects financial results for a single fund share. The total returns in the table represent the rate by which an investor would have earned (or lost) on an investment in the fund share class (assuming reinvestment of all distributions) held for the entire period.
| | | | | | | | | | | | | | | | | | | | |
| Class A | | Years ended 8/31 | |
| | | 2015 | | | 2014 | | | 2013 | | | 2012 | | | 2011 | |
Net asset value, beginning of period | | | $29.19 | | | | $23.82 | | | | $19.68 | | | | $17.20 | | | | $14.62 | |
| Income (loss) from investment operations | | | | | | | | | |
Net investment income (d) | | | $0.15 | | | | $0.13 | | | | $0.18 | | | | $0.11 | | | | $0.11 | |
Net realized and unrealized gain (loss)
on investments and foreign currency | | | 0.13 | | | | 5.41 | | | | 4.07 | | | | 2.47 | | | | 2.58 | |
Total from investment operations | | | $0.28 | | | | $5.54 | | | | $4.25 | | | | $2.58 | | | | $2.69 | |
| Less distributions declared to shareholders | | | | | | | | | |
From net investment income | | | $(0.13 | ) | | | $(0.17 | ) | | | $(0.11 | ) | | | $(0.10 | ) | | | $(0.11 | ) |
From net realized gain on investments | | | (2.15 | ) | | | — | | | | — | | | | — | | | | — | |
Total distributions declared to shareholders | | | $(2.28 | ) | | | $(0.17 | ) | | | $(0.11 | ) | | | $(0.10 | ) | | | $(0.11 | ) |
Net asset value, end of period (x) | | | $27.19 | | | | $29.19 | | | | $23.82 | | | | $19.68 | | | | $17.20 | |
Total return (%) (r)(s)(t)(x) | | | 0.98 | | | | 23.33 | | | | 21.69 | | | | 15.10 | | | | 18.39 | |
Ratios (%) (to average net assets)
and Supplemental data: | | | | | |
Expenses before expense reductions (f) | | | 1.05 | | | | 1.05 | | | | 1.11 | | | | 1.15 | | | | 1.18 | |
Expenses after expense reductions (f) | | | 1.04 | | | | 1.04 | | | | 1.11 | | | | 1.15 | | | | 1.18 | |
Net investment income | | | 0.52 | | | | 0.49 | | | | 0.81 | | | | 0.61 | | | | 0.60 | |
Portfolio turnover | | | 53 | | | | 48 | | | | 58 | | | | 65 | | | | 66 | |
Net assets at end of period (000 omitted) | | | $963,167 | | | | $1,002,028 | | | | $873,139 | | | | $686,616 | | | | $612,504 | |
| Supplemental Ratios (%): | | | | | |
Ratio of expenses to average net assets after expense
reductions excluding short sale dividend and interest
expense (f) | | | 1.03 | | | | 1.04 | | | | 1.10 | | | | 1.15 | | | | 1.17 | |
See Notes to Financial Statements
24
Financial Highlights – continued
| | | | | | | | | | | | | | | | | | | | |
| Class B | | Years ended 8/31 | |
| | | 2015 | | | 2014 | | | 2013 | | | 2012 | | | 2011 | |
Net asset value, beginning of period | | | $26.78 | | | | $21.88 | | | | $18.11 | | | | $15.86 | | | | $13.50 | |
| Income (loss) from investment operations | | | | | | | | | |
Net investment income (loss) (d) | | | $(0.06 | ) | | | $(0.06 | ) | | | $0.01 | | | | $(0.02 | ) | | | $(0.02 | ) |
Net realized and unrealized gain (loss)
on investments and foreign currency | | | 0.13 | | | | 4.96 | | | | 3.76 | | | | 2.27 | | | | 2.38 | |
Total from investment operations | | | $0.07 | | | | $4.90 | | | | $3.77 | | | | $2.25 | | | | $2.36 | |
| Less distributions declared to shareholders | | | | | | | | | |
From net realized gain on investments | | | $(2.15 | ) | | | $— | | | | $— | | | | $— | | | | $— | |
Net asset value, end of period (x) | | | $24.70 | | | | $26.78 | | | | $21.88 | | | | $18.11 | | | | $15.86 | |
Total return (%) (r)(s)(t)(x) | | | 0.25 | | | | 22.39 | | | | 20.82 | | | | 14.19 | | | | 17.48 | |
Ratios (%) (to average net assets)
and Supplemental data: | | | | | |
Expenses before expense reductions (f) | | | 1.80 | | | | 1.80 | | | | 1.86 | | | | 1.91 | | | | 1.93 | |
Expenses after expense reductions (f) | | | 1.80 | | | | 1.80 | | | | 1.86 | | | | 1.90 | | | | 1.93 | |
Net investment income (loss) | | | (0.23 | ) | | | (0.26 | ) | | | 0.07 | | | | (0.14 | ) | | | (0.15 | ) |
Portfolio turnover | | | 53 | | | | 48 | | | | 58 | | | | 65 | | | | 66 | |
Net assets at end of period (000 omitted) | | | $34,126 | | | | $40,536 | | | | $40,495 | | | | $43,320 | | | | $49,181 | |
| Supplemental Ratios (%): | | | | | |
Ratio of expenses to average net assets after expense
reductions excluding short sale dividend and interest
expense (f) | | | 1.79 | | | | 1.80 | | | | 1.86 | | | | 1.90 | | | | 1.92 | |
See Notes to Financial Statements
25
Financial Highlights – continued
| | | | | | | | | | | | | | | | | | | | |
| Class C | | Years ended 8/31 | |
| | | 2015 | | | 2014 | | | 2013 | | | 2012 | | | 2011 | |
Net asset value, beginning of period | | | $26.55 | | | | $21.72 | | | | $17.98 | | | | $15.74 | | | | $13.39 | |
| Income (loss) from investment operations | | | | | | | | | |
Net investment income (loss) (d) | | | $(0.06 | ) | | | $(0.06 | ) | | | $0.01 | | | | $(0.02 | ) | | | $(0.02 | ) |
Net realized and unrealized gain (loss)
on investments and foreign currency | | | 0.13 | | | | 4.92 | | | | 3.73 | | | | 2.26 | | | | 2.37 | |
Total from investment operations | | | $0.07 | | | | $4.86 | | | | $3.74 | | | | $2.24 | | | | $2.35 | |
| Less distributions declared to shareholders | | | | | | | | | |
From net investment income | | | $— | | | | $(0.03 | ) | | | $— | | | | $— | | | | $— | |
From net realized gain on investments | | | (2.15 | ) | | | — | | | | — | | | | — | | | | — | |
Total distributions declared to shareholders | | | $(2.15 | ) | | | $(0.03 | ) | | | $— | | | | $— | | | | $— | |
Net asset value, end of period (x) | | | $24.47 | | | | $26.55 | | | | $21.72 | | | | $17.98 | | | | $15.74 | |
Total return (%) (r)(s)(t)(x) | | | 0.26 | | | | 22.38 | | | | 20.80 | | | | 14.23 | | | | 17.55 | |
Ratios (%) (to average net assets)
and Supplemental data: | | | | | |
Expenses before expense reductions (f) | | | 1.80 | | | | 1.80 | | | | 1.86 | | | | 1.90 | | | | 1.93 | |
Expenses after expense reductions (f) | | | 1.80 | | | | 1.80 | | | | 1.86 | | | | 1.90 | | | | 1.93 | |
Net investment income (loss) | | | (0.23 | ) | | | (0.26 | ) | | | 0.06 | | | | (0.14 | ) | | | (0.15 | ) |
Portfolio turnover | | | 53 | | | | 48 | | | | 58 | | | | 65 | | | | 66 | |
Net assets at end of period (000 omitted) | | | $88,020 | | | | $89,702 | | | | $78,777 | | | | $64,258 | | | | $62,249 | |
| Supplemental Ratios (%): | | | | | |
Ratio of expenses to average net assets after expense
reductions excluding short sale dividend and interest
expense (f) | | | 1.79 | | | | 1.80 | | | | 1.86 | | | | 1.90 | | | | 1.92 | |
See Notes to Financial Statements
26
Financial Highlights – continued
| | | | | | | | | | | | | | | | | | | | |
| Class I | | Years ended 8/31 | |
| | | 2015 | | | 2014 | | | 2013 | | | 2012 | | | 2011 | |
Net asset value, beginning of period | | | $30.43 | | | | $24.82 | | | | $20.49 | | | | $17.91 | | | | $15.21 | |
| Income (loss) from investment operations | | | | | | | | | |
Net investment income (d) | | | $0.23 | | | | $0.21 | | | | $0.24 | | | | $0.16 | | | | $0.15 | |
Net realized and unrealized gain (loss)
on investments and foreign currency | | | 0.13 | | | | 5.62 | | | | 4.25 | | | | 2.57 | | | | 2.70 | |
Total from investment operations | | | $0.36 | | | | $5.83 | | | | $4.49 | | | | $2.73 | | | | $2.85 | |
| Less distributions declared to shareholders | | | | | | | | | |
From net investment income | | | $(0.20 | ) | | | $(0.22 | ) | | | $(0.16 | ) | | | $(0.15 | ) | | | $(0.15 | ) |
From net realized gain on investments | | | (2.15 | ) | | | — | | | | — | | | | — | | | | — | |
Total distributions declared to shareholders | | | $(2.35 | ) | | | $(0.22 | ) | | | $(0.16 | ) | | | $(0.15 | ) | | | $(0.15 | ) |
Net asset value, end of period (x) | | | $28.44 | | | | $30.43 | | | | $24.82 | | | | $20.49 | | | | $17.91 | |
Total return (%) (r)(s)(x) | | | 1.23 | | | | 23.61 | | | | 22.03 | | | | 15.36 | | | | 18.73 | |
Ratios (%) (to average net assets)
and Supplemental data: | | | | | |
Expenses before expense reductions (f) | | | 0.80 | | | | 0.80 | | | | 0.86 | | | | 0.90 | | | | 0.93 | |
Expenses after expense reductions (f) | | | 0.80 | | | | 0.80 | | | | 0.86 | | | | 0.90 | | | | 0.93 | |
Net investment income | | | 0.77 | | | | 0.73 | | | | 1.05 | | | | 0.86 | | | | 0.83 | |
Portfolio turnover | | | 53 | | | | 48 | | | | 58 | | | | 65 | | | | 66 | |
Net assets at end of period (000 omitted) | | | $49,768 | | | | $45,089 | | | | $29,812 | | | | $20,441 | | | | $17,250 | |
| Supplemental Ratios (%): | | | | | |
Ratio of expenses to average net assets after expense
reductions excluding short sale dividend and interest
expense (f) | | | 0.79 | | | | 0.80 | | | | 0.86 | | | | 0.90 | | | | 0.92 | |
See Notes to Financial Statements
27
Financial Highlights – continued
| | | | | | | | | | | | | | | | | | | | |
| Class R1 | | Years ended 8/31 | |
| | | 2015 | | | 2014 | | | 2013 | | | 2012 | | | 2011 | |
Net asset value, beginning of period | | | $26.54 | | | | $21.69 | | | | $17.95 | | | | $15.72 | | | | $13.38 | |
| Income (loss) from investment operations | | | | | | | | | |
Net investment income (loss) (d) | | | $(0.06 | ) | | | $(0.06 | ) | | | $0.02 | | | | $(0.02 | ) | | | $(0.02 | ) |
Net realized and unrealized gain (loss)
on investments and foreign currency | | | 0.12 | | | | 4.91 | | | | 3.72 | | | | 2.25 | | | | 2.37 | |
Total from investment operations | | | $0.06 | | | | $4.85 | | | | $3.74 | | | | $2.23 | | | | $2.35 | |
| Less distributions declared to shareholders | | | | | | | | | |
From net investment income | | | $— | | | | $(0.00 | )(w) | | | $— | | | | $— | | | | $(0.01 | ) |
From net realized gain on investments | | | (2.15 | ) | | | — | | | | — | | | | — | | | | — | |
Total distributions declared to shareholders | | | $(2.15 | ) | | | $(0.00 | )(w) | | | $— | | | | $— | | | | $(0.01 | ) |
Net asset value, end of period (x) | | | $24.45 | | | | $26.54 | | | | $21.69 | | | | $17.95 | | | | $15.72 | |
Total return (%) (r)(s)(x) | | | 0.22 | | | | 22.38 | | | | 20.84 | | | | 14.19 | | | | 17.56 | |
Ratios (%) (to average net assets)
and Supplemental data: | | | | | |
Expenses before expense reductions (f) | | | 1.80 | | | | 1.80 | | | | 1.86 | | | | 1.90 | | | | 1.93 | |
Expenses after expense reductions (f) | | | 1.80 | | | | 1.80 | | | | 1.86 | | | | 1.90 | | | | 1.93 | |
Net investment income (loss) | | | (0.23 | ) | | | (0.26 | ) | | | 0.08 | | | | (0.14 | ) | | | (0.15 | ) |
Portfolio turnover | | | 53 | | | | 48 | | | | 58 | | | | 65 | | | | 66 | |
Net assets at end of period (000 omitted) | | | $3,625 | | | | $4,132 | | | | $3,839 | | | | $4,098 | | | | $3,904 | |
| Supplemental Ratios (%): | | | | | |
Ratio of expenses to average net assets after expense
reductions excluding short sale dividend and interest
expense (f) | | | 1.79 | | | | 1.80 | | | | 1.85 | | | | 1.90 | | | | 1.92 | |
See Notes to Financial Statements
28
Financial Highlights – continued
| | | | | | | | | | | | | | | | | | | | |
| Class R2 | | Years ended 8/31 | |
| | | 2015 | | | 2014 | | | 2013 | | | 2012 | | | 2011 | |
Net asset value, beginning of period | | | $28.59 | | | | $23.35 | | | | $19.28 | | | | $16.86 | | | | $14.33 | |
| Income (loss) from investment operations | | | | | | | | | |
Net investment income (d) | | | $0.07 | | | | $0.06 | | | | $0.12 | | | | $0.06 | | | | $0.06 | |
Net realized and unrealized gain (loss)
on investments and foreign currency | | | 0.14 | | | | 5.29 | | | | 4.00 | | | | 2.42 | | | | 2.54 | |
Total from investment operations | | | $0.21 | | | | $5.35 | | | | $4.12 | | | | $2.48 | | | | $2.60 | |
| Less distributions declared to shareholders | | | | | | | | | |
From net investment income | | | $(0.03 | ) | | | $(0.11 | ) | | | $(0.05 | ) | | | $(0.06 | ) | | | $(0.07 | ) |
From net realized gain on investments | | | (2.15 | ) | | | — | | | | — | | | | — | | | | — | |
Total distributions declared to shareholders | | | $(2.18 | ) | | | $(0.11 | ) | | | $(0.05 | ) | | | $(0.06 | ) | | | $(0.07 | ) |
Net asset value, end of period (x) | | | $26.62 | | | | $28.59 | | | | $23.35 | | | | $19.28 | | | | $16.86 | |
Total return (%) (r)(s)(x) | | | 0.75 | | | | 22.96 | | | | 21.44 | | | | 14.74 | | | | 18.14 | |
Ratios (%) (to average net assets)
and Supplemental data: | | | | | |
Expenses before expense reductions (f) | | | 1.30 | | | | 1.30 | | | | 1.36 | | | | 1.40 | | | | 1.43 | |
Expenses after expense reductions (f) | | | 1.30 | | | | 1.30 | | | | 1.36 | | | | 1.40 | | | | 1.43 | |
Net investment income | | | 0.27 | | | | 0.24 | | | | 0.56 | | | | 0.36 | | | | 0.35 | |
Portfolio turnover | | | 53 | | | | 48 | | | | 58 | | | | 65 | | | | 66 | |
Net assets at end of period (000 omitted) | | | $16,332 | | | | $19,434 | | | | $19,625 | | | | $17,369 | | | | $16,424 | |
| Supplemental Ratios (%): | | | | | |
Ratio of expenses to average net assets after expense
reductions excluding short sale dividend and interest
expense (f) | | | 1.29 | | | | 1.30 | | | | 1.36 | | | | 1.40 | | | | 1.42 | |
See Notes to Financial Statements
29
Financial Highlights – continued
| | | | | | | | | | | | | | | | | | | | |
| Class R3 | | Years ended 8/31 | |
| | | 2015 | | | 2014 | | | 2013 | | | 2012 | | | 2011 | |
Net asset value, beginning of period | | | $29.10 | | | | $23.75 | | | | $19.63 | | | | $17.16 | | | | $14.59 | |
| Income (loss) from investment operations | | | | | | | | | |
Net investment income (d) | | | $0.15 | | | | $0.13 | | | | $0.18 | | | | $0.11 | | | | $0.11 | |
Net realized and unrealized gain (loss)
on investments and foreign currency | | | 0.13 | | | | 5.39 | | | | 4.05 | | | | 2.47 | | | | 2.57 | |
Total from investment operations | | | $0.28 | | | | $5.52 | | | | $4.23 | | | | $2.58 | | | | $2.68 | |
| Less distributions declared to shareholders | | | | | | | | | |
From net investment income | | | $(0.13 | ) | | | $(0.17 | ) | | | $(0.11 | ) | | | $(0.11 | ) | | | $(0.11 | ) |
From net realized gain on investments | | | (2.15 | ) | | | — | | | | — | | | | — | | | | — | |
Total distributions declared to shareholders | | | $(2.28 | ) | | | $(0.17 | ) | | | $(0.11 | ) | | | $(0.11 | ) | | | $(0.11 | ) |
Net asset value, end of period (x) | | | $27.10 | | | | $29.10 | | | | $23.75 | | | | $19.63 | | | | $17.16 | |
Total return (%) (r)(s)(x) | | | 0.99 | | | | 23.32 | | | | 21.68 | | | | 15.12 | | | | 18.38 | |
Ratios (%) (to average net assets)
and Supplemental data: | | | | | |
Expenses before expense reductions (f) | | | 1.05 | | | | 1.05 | | | | 1.11 | | | | 1.15 | | | | 1.18 | |
Expenses after expense reductions (f) | | | 1.05 | | | | 1.05 | | | | 1.11 | | | | 1.15 | | | | 1.18 | |
Net investment income | | | 0.52 | | | | 0.49 | | | | 0.81 | | | | 0.61 | | | | 0.60 | |
Portfolio turnover | | | 53 | | | | 48 | | | | 58 | | | | 65 | | | | 66 | |
Net assets at end of period (000 omitted) | | | $65,775 | | | | $68,977 | | | | $58,381 | | | | $46,833 | | | | $32,277 | |
| Supplemental Ratios (%): | | | | | |
Ratio of expenses to average net assets after expense
reductions excluding short sale dividend and interest
expense (f) | | | 1.04 | | | | 1.05 | | | | 1.10 | | | | 1.15 | | | | 1.17 | |
See Notes to Financial Statements
30
Financial Highlights – continued
| | | | | | | | | | | | | | | | | | | | |
| Class R4 | | Years ended 8/31 | |
| | | 2015 | | | 2014 | | | 2013 | | | 2012 | | | 2011 | |
Net asset value, beginning of period | | | $29.40 | | | | $23.99 | | | | $19.81 | | | | $17.32 | | | | $14.72 | |
| Income (loss) from investment operations | | | | | | | | | |
Net investment income (d) | | | $0.22 | | | | $0.20 | | | | $0.23 | | | | $0.16 | | | | $0.13 | |
Net realized and unrealized gain (loss)
on investments and foreign currency | | | 0.12 | | | | 5.44 | | | | 4.11 | | | | 2.48 | | | | 2.62 | |
Total from investment operations | | | $0.34 | | | | $5.64 | | | | $4.34 | | | | $2.64 | | | | $2.75 | |
| Less distributions declared to shareholders | | | | | | | | | |
From net investment income | | | $(0.20 | ) | | | $(0.23 | ) | | | $(0.16 | ) | | | $(0.15 | ) | | | $(0.15 | ) |
From net realized gain on investments | | | (2.15 | ) | | | — | | | | — | | | | — | | | | — | |
Total distributions declared to shareholders | | | $(2.35 | ) | | | $(0.23 | ) | | | $(0.16 | ) | | | $(0.15 | ) | | | $(0.15 | ) |
Net asset value, end of period (x) | | | $27.39 | | | | $29.40 | | | | $23.99 | | | | $19.81 | | | | $17.32 | |
Total return (%) (r)(s)(x) | | | 1.22 | | | | 23.62 | | | | 22.03 | | | | 15.36 | | | | 18.68 | |
Ratios (%) (to average net assets)
and Supplemental data: | | | | | |
Expenses before expense reductions (f) | | | 0.80 | | | | 0.81 | | | | 0.86 | | | | 0.91 | | | | 0.92 | |
Expenses after expense reductions (f) | | | 0.80 | | | | 0.80 | | | | 0.86 | | | | 0.90 | | | | 0.92 | |
Net investment income | | | 0.76 | | | | 0.72 | | | | 1.04 | | | | 0.86 | | | | 0.75 | |
Portfolio turnover | | | 53 | | | | 48 | | | | 58 | | | | 65 | | | | 66 | |
Net assets at end of period (000 omitted) | | | $21,159 | | | | $19,706 | | | | $6,165 | | | | $1,871 | | | | $1,367 | |
| Supplemental Ratios (%): | | | | | |
Ratio of expenses to average net assets after expense
reductions excluding short sale dividend and interest
expense (f) | | | 0.79 | | | | 0.80 | | | | 0.86 | | | | 0.90 | | | | 0.91 | |
See Notes to Financial Statements
31
Financial Highlights – continued
| | | | | | | | | | | | |
| Class R5 | | Years ended 8/31 | |
| | | 2015 | | | 2014 | | | 2013 (i) | |
Net asset value, beginning of period | | | $30.47 | | | | $24.84 | | | | $21.02 | |
| Income (loss) from investment operations | |
Net investment income (d) | | | $0.24 | | | | $0.23 | | | | $0.22 | |
Net realized and unrealized gain (loss) on investments and foreign currency | | | 0.15 | | | | 5.64 | | | | 3.60 | |
Total from investment operations | | | $0.39 | | | | $5.87 | | | | $3.82 | |
| Less distributions declared to shareholders | |
From net investment income | | | $(0.22 | ) | | | $(0.24 | ) | | | $— | |
From net realized gain on investments | | | (2.15 | ) | | | — | | | | — | |
Total distributions declared to shareholders | | | $(2.37 | ) | | | $(0.24 | ) | | | $— | |
Net asset value, end of period (x) | | | $28.49 | | | | $30.47 | | | | $24.84 | |
Total return (%) (r)(s)(x) | | | 1.34 | | | | 23.73 | | | | 18.17 | (n) |
Ratios (%) (to average net assets)
and Supplemental data: | |
Expenses before expense reductions (f) | | | 0.71 | | | | 0.71 | | | | 0.76 | (a) |
Expenses after expense reductions (f) | | | 0.70 | | | | 0.71 | | | | 0.76 | (a) |
Net investment income | | | 0.82 | | | | 0.80 | | | | 1.39 | (a) |
Portfolio turnover | | | 53 | | | | 48 | | | | 58 | |
Net assets at end of period (000 omitted) | | | $6,198 | | | | $2,492 | | | | $119 | |
| Supplemental Ratios (%): | |
Ratio of expenses to average net assets after expense reductions excluding
short sale dividend and interest expense (f) | | | 0.69 | | | | 0.71 | | | | 0.75 | (a) |
| (d) | Per share data is based on average shares outstanding. |
| (f) | Ratios do not reflect reductions from fees paid indirectly, if applicable. |
| (i) | For the period from the class inception, January 2, 2013, through the stated period end. |
| (r) | Certain expenses have been reduced without which performance would have been lower. |
| (s) | From time to time the fund may receive proceeds from litigation settlements, without which performance would be lower. |
| (t) | Total returns do not include any applicable sales charges. |
| (w) | Per share amount was less than $0.01. |
| (x) | The net asset values and total returns have been calculated on net assets which include adjustments made in accordance with U.S. generally accepted accounting principles required at period end for financial reporting purposes. |
See Notes to Financial Statements
32
NOTES TO FINANCIAL STATEMENTS
(1) Business and Organization
MFS Core Equity Fund (the fund) is a diversified series of MFS Series Trust I (the trust). The trust is organized as a Massachusetts business trust and is registered under the Investment Company Act of 1940, as amended, as an open-end management investment company.
The fund is an investment company and accordingly follows the investment company accounting and reporting guidance of the Financial Accounting Standards Board (FASB) Accounting Standards Codification Topic 946 Financial Services – Investment Companies.
(2) Significant Accounting Policies
General – The preparation of financial statements in conformity with U.S. generally accepted accounting principles requires management to make estimates and assumptions that affect the reported amounts of assets and liabilities, and disclosure of contingent assets and liabilities at the date of the financial statements and the reported amounts of increases and decreases in net assets from operations during the reporting period. Actual results could differ from those estimates. In the preparation of these financial statements, management has evaluated subsequent events occurring after the date of the fund’s Statement of Assets and Liabilities through the date that the financial statements were issued.
In June 2014, FASB issued Accounting Standards Update 2014-11, Transfers and Servicing (Topic 860) – Repurchase-to-Maturity Transactions, Repurchase Financings, and Disclosures (“ASU 2014-11”). ASU 2014-11 changes the accounting for repurchase-to-maturity transactions (i.e., repurchase agreements that settle at the same time as the maturity of the transferred financial asset) and enhances the required disclosures for repurchase agreements and other similar transactions. Although still evaluating the potential impacts of ASU 2014-11 to the fund, management expects that the impact of the fund’s adoption will be limited to additional financial statement disclosures which would first be effective for interim reporting periods beginning after March 15, 2015.
Balance Sheet Offsetting – The fund’s accounting policy with respect to balance sheet offsetting is that, absent an event of default by the counterparty or a termination of the agreement, the International Swaps and Derivatives Association (ISDA) Master Agreement does not result in an offset of reported amounts of financial assets and financial liabilities in the Statement of Assets and Liabilities across transactions between the fund and the applicable counterparty. The fund’s right to setoff may be restricted or prohibited by the bankruptcy or insolvency laws of the particular jurisdiction to which a specific master netting agreement counterparty is subject. Balance sheet offsetting disclosures, to the extent applicable to the fund, have been included in the fund’s Significant Accounting Policies note under the captions for each of the fund’s in-scope financial instruments and transactions.
Investment Valuations – Equity securities, including restricted equity securities, are generally valued at the last sale or official closing price as provided by a third-party pricing service on the market or exchange on which they are primarily traded. Equity
33
Notes to Financial Statements – continued
securities, for which there were no sales reported that day, are generally valued at the last quoted daily bid quotation as provided by a third-party pricing service on the market or exchange on which such securities are primarily traded. Equity securities held short, for which there were no sales reported for that day, are generally valued at the last quoted daily ask quotation as provided by a third-party pricing service on the market or exchange on which such securities are primarily traded. Short-term instruments with a maturity at issuance of 60 days or less may be valued at amortized cost, which approximates market value. Open-end investment companies are generally valued at net asset value per share. Securities and other assets generally valued on the basis of information from a third-party pricing service may also be valued at a broker/dealer bid quotation. Values obtained from third-party pricing services can utilize both transaction data and market information such as yield, quality, coupon rate, maturity, type of issue, trading characteristics, and other market data. The values of foreign securities and other assets and liabilities expressed in foreign currencies are converted to U.S. dollars using the mean of bid and asked prices for rates provided by a third-party pricing service.
The Board of Trustees has delegated primary responsibility for determining or causing to be determined the value of the fund’s investments (including any fair valuation) to the adviser pursuant to valuation policies and procedures approved by the Board. If the adviser determines that reliable market quotations are not readily available, investments are valued at fair value as determined in good faith by the adviser in accordance with such procedures under the oversight of the Board of Trustees. Under the fund’s valuation policies and procedures, market quotations are not considered to be readily available for most types of debt instruments and floating rate loans and many types of derivatives. These investments are generally valued at fair value based on information from third-party pricing services. In addition, investments may be valued at fair value if the adviser determines that an investment’s value has been materially affected by events occurring after the close of the exchange or market on which the investment is principally traded (such as foreign exchange or market) and prior to the determination of the fund’s net asset value, or after the halting of trading of a specific security where trading does not resume prior to the close of the exchange or market on which the security is principally traded. Events that occur on a frequent basis after foreign markets close (such as developments in foreign markets and significant movements in the U.S. markets) and prior to the determination of the fund’s net asset value may be deemed to have a material effect on the value of securities traded in foreign markets. Accordingly, the fund’s foreign equity securities may often be valued at fair value. The adviser generally relies on third-party pricing services or other information (such as the correlation with price movements of similar securities in the same or other markets; the type, cost and investment characteristics of the security; the business and financial condition of the issuer; and trading and other market data) to assist in determining whether to fair value and at what value to fair value an investment. The value of an investment for purposes of calculating the fund’s net asset value can differ depending on the source and method used to determine value. When fair valuation is used, the value of an investment used to determine the fund’s net asset value may differ from quoted or published prices for the same investment. There can be no assurance that
34
Notes to Financial Statements – continued
the fund could obtain the fair value assigned to an investment if it were to sell the investment at the same time at which the fund determines its net asset value per share.
Various inputs are used in determining the value of the fund’s assets or liabilities. These inputs are categorized into three broad levels. In certain cases, the inputs used to measure fair value may fall into different levels of the fair value hierarchy. In such cases, an investment’s level within the fair value hierarchy is based on the lowest level of input that is significant to the fair value measurement. The fund’s assessment of the significance of a particular input to the fair value measurement in its entirety requires judgment, and considers factors specific to the investment. Level 1 includes unadjusted quoted prices in active markets for identical assets or liabilities. Level 2 includes other significant observable market-based inputs (including quoted prices for similar securities, interest rates, prepayment speed, and credit risk). Level 3 includes unobservable inputs, which may include the adviser’s own assumptions in determining the fair value of investments. The following is a summary of the levels used as of August 31, 2015 in valuing the fund’s assets or liabilities:
| | | | | | | | | | | | | | | | |
| Investments at Value | | Level 1 | | | Level 2 | | | Level 3 | | | Total | |
| Equity Securities: | | | | | | | | | | | | | | | | |
United States | | | $1,210,250,743 | | | | $— | | | | $— | | | | $1,210,250,743 | |
Canada | | | 23,974,293 | | | | — | | | | — | | | | 23,974,293 | |
Hong Kong | | | 4,277,660 | | | | — | | | | — | | | | 4,277,660 | |
United Kingdom | | | 941,172 | | | | — | | | | — | | | | 941,172 | |
United Arab Emirates | | | 277,693 | | | | — | | | | — | | | | 277,693 | |
Cayman Islands | | | — | | | | — | | | | 202,674 | | | | 202,674 | |
| Mutual Funds | | | 14,107,782 | | | | — | | | | — | | | | 14,107,782 | |
| Total Investments | | | $1,253,829,343 | | | | $— | | | | $202,674 | | | | $1,254,032,017 | |
| Short Sales | | | (4,757,078 | ) | | | — | | | | — | | | | (4,757,078 | ) |
For further information regarding security characteristics, see the Portfolio of Investments.
The following is a reconciliation of level 3 assets for which significant unobservable inputs were used to determine fair value. The fund’s policy is to recognize transfers between the levels as of the end of the period. The table presents the activity of level 3 securities held at the beginning and the end of the period.
| | | | |
| | | Equity Securities | |
| Balance as of 8/31/14 | | | $274,485 | |
Change in unrealized appreciation (depreciation) | | | (71,811 | ) |
| Balance as of 8/31/15 | | | $202,674 | |
The net change in unrealized appreciation (depreciation) from investments still held as level 3 at August 31, 2015 is $(71,811). At August 31, 2015, the fund held one level 3 security.
Foreign Currency Translation – Purchases and sales of foreign investments, income, and expenses are converted into U.S. dollars based upon currency exchange rates prevailing on the respective dates of such transactions or on the reporting date for foreign denominated receivables and payables. Gains and losses attributable to foreign currency exchange rates on sales of securities are recorded for financial statement purposes as net realized gains and losses on investments. Gains and losses attributable
35
Notes to Financial Statements – continued
to foreign exchange rate movements on receivables, payables, income and expenses are recorded for financial statement purposes as foreign currency transaction gains and losses. That portion of both realized and unrealized gains and losses on investments that results from fluctuations in foreign currency exchange rates is not separately disclosed.
Short Sales – The fund entered into short sales whereby it sells a security it does not own in anticipation of a decline in the value of that security. The fund will realize a gain if the security price decreases and a loss if the security price increases between the date of the short sale and the date on which the fund replaces the borrowed security. Losses from short sales can exceed the proceeds of the security sold; and they can also exceed the potential loss from an ordinary buy and sell transaction. The amount of any premium, dividends, or interest the fund may be required to pay in connection with a short sale will be recognized as a fund expense. During the year ended August 31, 2015, this expense amounted to $105,796. The fund segregates cash or marketable securities in an amount that, when combined with the amount of proceeds from the short sale deposited with the broker, at least equals the current market value of the security sold short.
Security Loans – Under its Securities Lending Agency Agreement with the fund, State Street Bank and Trust Company (“State Street”), as lending agent, loans the securities of the fund to certain qualified institutions (the “Borrowers”) approved by the fund. The loans are collateralized by cash and/or U.S. Treasury and federal agency obligations in an amount typically at least equal to the market value of the securities loaned. On loans collateralized by cash, the cash collateral is invested in a money market fund. The market value of the loaned securities is determined at the close of business of the fund and any additional required collateral is delivered to the fund on the next business day. State Street provides the fund with indemnification against Borrower default. In the event of Borrower default, State Street will for the benefit of the fund either purchase securities identical to those loaned or, when such purchase is commercially impracticable, pay the fund the market value of the loaned securities. In return, State Street assumes the fund’s rights to the related collateral. If the collateral value is less than the cost to purchase identical securities, State Street is responsible for the shortfall, but only to the extent that such shortfall is not due to a decline in collateral value resulting from collateral reinvestment for which the fund bears the risk of loss. At period end, the fund had investment securities on loan with a fair value of $1,754,411 and a related liability of $1,847,684 for cash collateral received on securities loaned, both of which are presented gross in the Statement of Assets and Liabilities. The collateral received on securities loaned exceeded the value of securities on loan at period end. The liability for cash collateral for securities loaned is carried at fair value, which is categorized as level 2 within the fair value hierarchy. A portion of the income generated upon investment of the collateral is remitted to the Borrowers, and the remainder is allocated between the fund and the lending agent. On loans collateralized by U.S. Treasury and/or federal agency obligations, a fee is received from the Borrower, and is allocated between the fund and the lending agent. Income from securities lending is included in “Interest” income in the Statement of Operations. The dividend and interest income earned on the securities loaned is accounted for in the same manner as other dividend and interest income.
36
Notes to Financial Statements – continued
Indemnifications – Under the fund’s organizational documents, its officers and Trustees may be indemnified against certain liabilities and expenses arising out of the performance of their duties to the fund. Additionally, in the normal course of business, the fund enters into agreements with service providers that may contain indemnification clauses. The fund’s maximum exposure under these agreements is unknown as this would involve future claims that may be made against the fund that have not yet occurred.
Investment Transactions and Income – Investment transactions are recorded on the trade date. Interest income is recorded on the accrual basis. Dividends received in cash are recorded on the ex-dividend date. Certain dividends from foreign securities will be recorded when the fund is informed of the dividend if such information is obtained subsequent to the ex-dividend date. Dividend and interest payments received in additional securities are recorded on the ex-dividend or ex-interest date in an amount equal to the value of the security on such date.
The fund may receive proceeds from litigation settlements. Any proceeds received from litigation involving portfolio holdings are reflected in the Statement of Operations in realized gain/loss if the security has been disposed of by the fund or in unrealized gain/loss if the security is still held by the fund. Any other proceeds from litigation not related to portfolio holdings are reflected as other income in the Statement of Operations.
Fees Paid Indirectly – The fund’s custody fee may be reduced by a credit earned under an arrangement that measures the value of U.S. dollars deposited with the custodian by the fund. The amount of the credit, for the year ended August 31, 2015, is shown as a reduction of total expenses in the Statement of Operations.
Tax Matters and Distributions – The fund intends to qualify as a regulated investment company, as defined under Subchapter M of the Internal Revenue Code, and to distribute all of its taxable income, including realized capital gains. As a result, no provision for federal income tax is required. The fund’s federal tax returns, when filed, will remain subject to examination by the Internal Revenue Service for a three year period. Management has analyzed the fund’s tax positions taken on federal and state tax returns for all open tax years and does not believe that there are any uncertain tax positions that require recognition of a tax liability. Foreign taxes, if any, have been accrued by the fund in the accompanying financial statements in accordance with the applicable foreign tax law. Foreign income taxes may be withheld by certain countries in which the fund invests. Additionally, capital gains realized by the fund on securities issued in or by certain foreign countries may be subject to capital gains tax imposed by those countries.
Distributions to shareholders are recorded on the ex-dividend date. Income and capital gain distributions are determined in accordance with income tax regulations, which may differ from U.S. generally accepted accounting principles. Certain capital accounts in the financial statements are periodically adjusted for permanent differences in order to reflect their tax character. These adjustments have no impact on net assets or net asset value per share. Temporary differences which arise from recognizing certain items of income, expense, gain or loss in different periods for financial statement and tax purposes will reverse at some time in the future. Distributions in excess of net
37
Notes to Financial Statements – continued
investment income or net realized gains are temporary overdistributions for financial statement purposes resulting from differences in the recognition or classification of income or distributions for financial statement and tax purposes.
Book/tax differences primarily relate to wash sale loss deferrals, straddle loss deferrals, and treating a portion of the proceeds from redemptions as a distribution for tax purposes.
The tax character of distributions declared to shareholders for the last two fiscal years is as follows:
| | | | | | | | |
| | | 8/31/15 | | | 8/31/14 | |
| Ordinary income (including any short-term capital gains) | | | $40,341,379 | | | | $7,149,277 | |
| Long-term capital gain | | | 60,027,266 | | | | — | |
| Total distributions | | | $100,368,645 | | | | $7,149,277 | |
The federal tax cost and the tax basis components of distributable earnings were as follows:
| | | | |
| As of 8/31/15 | | | |
| Cost of investments | | | $1,065,349,268 | |
| Gross appreciation | | | 253,473,774 | |
| Gross depreciation | | | (64,791,025 | ) |
| Net unrealized appreciation (depreciation) | | | $188,682,749 | |
| Undistributed ordinary income | | | 31,501,291 | |
| Undistributed long-term capital gain | | | 93,547,223 | |
| Capital loss carryforwards | | | (3,199,908 | ) |
| Other temporary differences | | | (400,759 | ) |
Under the Regulated Investment Company Modernization Act of 2010 (the “Act”), net capital losses recognized for fund fiscal years beginning after August 31, 2011, may be carried forward indefinitely, and their character is retained as short-term and/or long-term losses (“post-enactment losses”). Previously, net capital losses were carried forward for eight years and treated as short-term losses (“pre-enactment losses”). As a transition rule, the Act requires that all post-enactment net capital losses be used before pre-enactment net capital losses.
As of August 31, 2015, the fund had capital loss carryforwards available to offset future realized gains. Such pre-enactment losses expire as follows:
The availability of $3,199,908 of the capital loss carryforwards, which were acquired on July 24, 2009 in connection with the MFS New Endeavor Fund merger, may be limited in a given year.
Multiple Classes of Shares of Beneficial Interest – The fund offers multiple classes of shares, which differ in their respective distribution and service fees. The fund’s income, realized and unrealized gain (loss), and common expenses are allocated to shareholders based on the daily net assets of each class. Dividends are declared separately for each class. Differences in per share dividend rates are generally due to
38
Notes to Financial Statements – continued
differences in separate class expenses. Class B shares will convert to Class A shares approximately eight years after purchase. The fund’s distributions declared to shareholders as reported in the Statements of Changes in Net Assets are presented by class as follows:
| | | | | | | | | | | | | | | | |
| | | From net investment
income | | | From net realized gain on
investments | |
| | | Year
ended
8/31/15 | | | Year
ended
8/31/14 | | | Year
ended
8/31/15 | | | Year
ended
8/31/14 | |
| Class A | | | $4,295,674 | | | | $6,151,825 | | | | $73,002,676 | | | | $— | |
| Class B | | | — | | | | — | | | | 3,135,634 | | | | — | |
| Class C | | | — | | | | 97,951 | | | | 7,201,066 | | | | — | |
| Class I | | | 325,586 | | | | 313,713 | | | | 3,509,320 | | | | — | |
| Class R1 | | | — | | | | 485 | | | | 336,539 | | | | — | |
| Class R2 | | | 18,884 | | | | 88,902 | | | | 1,366,894 | | | | — | |
| Class R3 | | | 301,920 | | | | 423,237 | | | | 5,094,315 | | | | — | |
| Class R4 | | | 137,694 | | | | 72,032 | | | | 1,445,918 | | | | — | |
| Class R5 | | | 18,377 | | | | 1,132 | | | | 178,148 | | | | — | |
| Total | | | $5,098,135 | | | | $7,149,277 | | | | $95,270,510 | | | | $— | |
(3) Transactions with Affiliates
Investment Adviser – The fund has an investment advisory agreement with MFS to provide overall investment management and related administrative services and facilities to the fund. The management fee is computed daily and paid monthly at the following annual rates:
| | | | |
| First $500 million of average daily net assets | | | 0.65 | % |
| Average daily net assets in excess of $500 million | | | 0.55 | % |
The investment adviser has agreed in writing to reduce its management fee to 0.50% of average daily net assets in excess of $2.5 billion. This written agreement will continue until modified by the fund’s Board of Trustees, but such agreement will continue at least until December 31, 2016. For the year ended August 31, 2015, the fund’s average daily net assets did not exceed $2.5 billion and therefore, the management fee was not reduced in accordance with this agreement. MFS has also agreed in writing to reduce its management fee by a specified amount if certain MFS mutual fund assets exceed thresholds agreed to by MFS and the fund’s Board of Trustees. For the year ended August 31, 2015, this management fee reduction amounted to $84,861, which is included in the reduction of total expenses in the Statement of Operations. The management fee incurred for the year ended August 31, 2015 was equivalent to an annual effective rate of 0.58% of the fund’s average daily net assets.
Distributor – MFS Fund Distributors, Inc. (MFD), a wholly-owned subsidiary of MFS, as distributor, received $299,851 for the year ended August 31, 2015, as its portion of the initial sales charge on sales of Class A shares of the fund.
The Board of Trustees has adopted a distribution plan for certain share classes pursuant to Rule 12b-1 of the Investment Company Act of 1940.
39
Notes to Financial Statements – continued
The fund’s distribution plan provides that the fund will pay MFD for services provided by MFD and financial intermediaries in connection with the distribution and servicing of certain share classes. One component of the plan is a distribution fee paid to MFD and another component of the plan is a service fee paid to MFD. MFD may subsequently pay all, or a portion, of the distribution and/or service fees to financial intermediaries.
Distribution Plan Fee Table:
| | | | | | | | | | | | | | | | | | | | |
| | | Distribution
Fee Rate (d) | | | Service
Fee Rate (d) | | | Total
Distribution
Plan (d) | | | Annual
Effective
Rate (e) | | | Distribution
and Service
Fee | |
| Class A | | | — | | | | 0.25% | | | | 0.25% | | | | 0.24% | | | | $2,536,116 | |
| Class B | | | 0.75% | | | | 0.25% | | | | 1.00% | | | | 1.00% | | | | 384,310 | |
| Class C | | | 0.75% | | | | 0.25% | | | | 1.00% | | | | 1.00% | | | | 913,511 | |
| Class R1 | | | 0.75% | | | | 0.25% | | | | 1.00% | | | | 1.00% | | | | 42,253 | |
| Class R2 | | | 0.25% | | | | 0.25% | | | | 0.50% | | | | 0.50% | | | | 90,859 | |
| Class R3 | | | — | | | | 0.25% | | | | 0.25% | | | | 0.25% | | | | 175,847 | |
| Total Distribution and Service Fees | | | | $4,142,896 | |
| (d) | In accordance with the distribution plan for certain classes, the fund pays distribution and/or service fees equal to these annual percentage rates of each class’s average daily net assets. The distribution and service fee rates disclosed by class represent the current rates in effect at the end of the reporting period. Any rate changes, if applicable, are detailed below. |
| (e) | The annual effective rates represent actual fees incurred under the distribution plan for the year ended August 31, 2015 based on each class’s average daily net assets. MFD has voluntarily agreed to rebate a portion of each class’s 0.25% service fee attributable to accounts for which MFD retains the 0.25% service fee except for accounts attributable to MFS or its affiliates’ seed money. For the year ended August 31, 2015, this rebate amounted to $57,050, $511, $2,131, and $65 for Class A, Class B, Class C, and Class R3, respectively, and is included in the reduction of total expenses in the Statement of Operations. |
Certain Class A shares are subject to a contingent deferred sales charge (CDSC) in the event of a shareholder redemption within 18 months of purchase. Class C shares are subject to a CDSC in the event of a shareholder redemption within 12 months of purchase. Class B shares are subject to a CDSC in the event of a shareholder redemption within six years of purchase. All contingent deferred sales charges are paid to MFD and during the year ended August 31, 2015, were as follows:
| | | | |
| | | Amount | |
| Class A | | | $521 | |
| Class B | | | 32,394 | |
| Class C | | | 3,917 | |
Shareholder Servicing Agent – MFS Service Center, Inc. (MFSC), a wholly-owned subsidiary of MFS, receives a fee from the fund for its services as shareholder servicing agent calculated as a percentage of the average daily net assets of the fund as determined periodically under the supervision of the fund’s Board of Trustees. For the year ended August 31, 2015, the fee was $476,465, which equated to 0.0363% annually of the fund’s average daily net assets. MFSC also receives payment from the fund for out-of-pocket expenses, sub-accounting and other shareholder servicing costs which may be paid to affiliated and unaffiliated service providers. Class R5 shares do
40
Notes to Financial Statements – continued
not incur sub-accounting fees. For the year ended August 31, 2015, these out-of-pocket expenses, sub-accounting and other shareholder servicing costs amounted to $1,524,360.
Administrator – MFS provides certain financial, legal, shareholder communications, compliance, and other administrative services to the fund. Under an administrative services agreement, the fund reimburses MFS the costs incurred to provide these services. The fund is charged an annual fixed amount of $17,500 plus a fee based on average daily net assets. The administrative services fee incurred for the year ended August 31, 2015 was equivalent to an annual effective rate of 0.0166% of the fund’s average daily net assets.
Trustees’ and Officers’ Compensation – The fund pays compensation to independent Trustees in the form of a retainer, attendance fees, and additional compensation to Board and Committee chairpersons. The fund does not pay compensation directly to Trustees or officers of the fund who are also officers of the investment adviser, all of whom receive remuneration for their services to the fund from MFS. Certain officers and Trustees of the fund are officers or directors of MFS, MFD, and MFSC.
Prior to December 31, 2001, the fund had an unfunded defined benefit plan (“DB plan”) for independent Trustees. As of December 31, 2001, the Board took action to terminate the DB plan with respect to then-current and any future independent Trustees, such that the DB plan covers only certain of those former independent Trustees who retired on or before December 31, 2001. Effective January 1, 2002, accrued benefits under the DB plan for then-current independent Trustees who continued were credited to an unfunded retirement deferral plan (the “Retirement Deferral plan”), which was established for and exists solely with respect to these credited amounts, and is not available for other deferrals by these or other independent Trustees. Although the Retirement Deferral plan is unfunded, amounts deferred under the plan are periodically adjusted for investment experience as if they had been invested in shares of the fund. The DB plan resulted in a pension expense of $4,034 and the Retirement Deferral plan resulted in an expense of $7,970. Both amounts are included in “Independent Trustees’ compensation” in the Statement of Operations for the year ended August 31, 2015. The liability for deferred retirement benefits payable to certain independent Trustees under both plans amounted to $88,534 at August 31, 2015, and is included in “Payable for independent Trustees’ compensation” in the Statement of Assets and Liabilities.
Other – Effective November 1, 2014, this fund and certain other funds managed by MFS (the funds) have entered into a service agreement (the ISO Agreement) which provides for payment of fees solely by the funds to Tarantino LLC in return for the provision of services of an Independent Senior Officer (ISO) for the funds. Frank L. Tarantino serves as the ISO and is an officer of the funds and the sole member of Tarantino LLC. The funds can terminate the ISO Agreement with Tarantino LLC at any time under the terms of the ISO Agreement. Prior to November 1, 2014, the funds had entered into a service agreement (the Compliance Officer Agreement) which provided for payment of fees by the funds to Tarantino LLC in return for the provision of services of an Independent Chief Compliance Officer (ICCO) for the funds. Prior to November 1, 2014, Frank L. Tarantino served as the ICCO. Effective October 31, 2014, Mr. Tarantino
41
Notes to Financial Statements – continued
resigned as ICCO and the Compliance Officer Agreement between the funds and Tarantino LLC was terminated. For the year ended August 31, 2015, the aggregate fees paid by the fund under these agreements were $4,922 and are included in “Miscellaneous” expense in the Statement of Operations. MFS had agreed to reimburse the fund for a portion of the payments made by the fund for the services under the Compliance Officer Agreement in the amount of $427, which is included in the reduction of total expenses in the Statement of Operations. Additionally, MFS has agreed to bear all expenses associated with office space, other administrative support, and supplies provided to the ICCO and ISO.
The fund invests in the MFS Institutional Money Market Portfolio which is managed by MFS and seeks current income consistent with preservation of capital and liquidity. Income earned on this investment is included in “Dividends from underlying affiliated funds” in the Statement of Operations. This money market fund does not pay a management fee to MFS.
(4) Portfolio Securities
For the year ended August 31, 2015, purchases and sales of investments, other than short sales, and short-term obligations, aggregated $693,477,130 and $746,227,527, respectively.
(5) Shares of Beneficial Interest
The fund’s Declaration of Trust permits the Trustees to issue an unlimited number of full and fractional shares of beneficial interest. Transactions in fund shares were as follows:
| | | | | | | | | | | | | | | | |
| | | Year ended
8/31/15 | | | Year ended
8/31/14 | |
| | | Shares | | | Amount | | | Shares | | | Amount | |
| Shares sold | | | | | | | | | | | | | | | | |
Class A | | | 3,965,636 | | | | $112,014,177 | | | | 3,726,575 | | | | $98,779,253 | |
Class B | | | 144,954 | | | | 3,744,055 | | | | 128,799 | | | | 3,156,038 | |
Class C | | | 483,286 | | | | 12,349,102 | | | | 320,385 | | | | 7,756,813 | |
Class I | | | 537,955 | | | | 15,955,057 | | | | 489,647 | | | | 13,383,291 | |
Class R1 | | | 33,450 | | | | 848,942 | | | | 25,142 | | | | 616,104 | |
Class R2 | | | 93,037 | | | | 2,598,442 | | | | 114,651 | | | | 3,009,148 | |
Class R3 | | | 370,484 | | | | 10,502,693 | | | | 388,156 | | | | 10,206,825 | |
Class R4 | | | 227,230 | | | | 6,506,590 | | | | 568,620 | | | | 15,584,037 | |
Class R5 | | | 148,888 | | | | 4,468,849 | | | | 80,363 | | | | 2,205,958 | |
| | | 6,004,920 | | | | $168,987,907 | | | | 5,842,338 | | | | $154,697,467 | |
42
Notes to Financial Statements – continued
| | | | | | | | | | | | | | | | |
| | | Year ended
8/31/15 | | | Year ended
8/31/14 | |
| | | Shares | | | Amount | | | Shares | | | Amount | |
| Shares issued to shareholders in reinvestment of distributions | | | | | | | | | | | | | | | | |
Class A | | | 2,710,275 | | | | $73,340,043 | | | | 219,909 | | | | $5,744,030 | |
Class B | | | 123,687 | | | | 3,056,300 | | | | — | | | | — | |
Class C | | | 267,888 | | | | 6,557,903 | | | | 3,671 | | | | 87,708 | |
Class I | | | 127,373 | | | | 3,598,289 | | | | 10,378 | | | | 282,064 | |
Class R1 | | | 13,757 | | | | 336,495 | | | | 20 | | | | 485 | |
Class R2 | | | 49,416 | | | | 1,311,498 | | | | 3,341 | | | | 85,652 | |
Class R3 | | | 200,083 | | | | 5,396,235 | | | | 16,253 | | | | 423,237 | |
Class R4 | | | 58,200 | | | | 1,583,612 | | | | 2,743 | | | | 72,032 | |
Class R5 | | | 6,949 | | | | 196,525 | | | | 41 | | | | 1,122 | |
| | | 3,557,628 | | | | $95,376,900 | | | | 256,356 | | | | $6,696,330 | |
| | | | |
| Shares reacquired | | | | | | | | | | | | | | | | |
Class A | | | (5,587,471 | ) | | | $(158,712,829 | ) | | | (6,266,489 | ) | | | $(167,777,284 | ) |
Class B | | | (400,550 | ) | | | (10,367,317 | ) | | | (465,704 | ) | | | (11,473,848 | ) |
Class C | | | (532,303 | ) | | | (13,614,273 | ) | | | (572,495 | ) | | | (13,987,990 | ) |
Class I | | | (397,463 | ) | | | (11,692,783 | ) | | | (219,406 | ) | | | (6,160,376 | ) |
Class R1 | | | (54,672 | ) | | | (1,395,060 | ) | | | (46,483 | ) | | | (1,136,563 | ) |
Class R2 | | | (208,631 | ) | | | (5,735,645 | ) | | | (278,899 | ) | | | (7,430,972 | ) |
Class R3 | | | (514,010 | ) | | | (14,579,521 | ) | | | (491,785 | ) | | | (13,044,811 | ) |
Class R4 | | | (183,408 | ) | | | (5,295,081 | ) | | | (158,003 | ) | | | (4,285,803 | ) |
Class R5 | | | (20,075 | ) | | | (585,885 | ) | | | (3,403 | ) | | | (97,310 | ) |
| | | (7,898,583 | ) | | | $(221,978,394 | ) | | | (8,502,667 | ) | | | $(225,394,957 | ) |
| | | | |
| Net change | | | | | | | | | | | | | | | | |
Class A | | | 1,088,440 | | | | $26,641,391 | | | | (2,320,005 | ) | | | $(63,254,001 | ) |
Class B | | | (131,909 | ) | | | (3,566,962 | ) | | | (336,905 | ) | | | (8,317,810 | ) |
Class C | | | 218,871 | | | | 5,292,732 | | | | (248,439 | ) | | | (6,143,469 | ) |
Class I | | | 267,865 | | | | 7,860,563 | | | | 280,619 | | | | 7,504,979 | |
Class R1 | | | (7,465 | ) | | | (209,623 | ) | | | (21,321 | ) | | | (519,974 | ) |
Class R2 | | | (66,178 | ) | | | (1,825,705 | ) | | | (160,907 | ) | | | (4,336,172 | ) |
Class R3 | | | 56,557 | | | | 1,319,407 | | | | (87,376 | ) | | | (2,414,749 | ) |
Class R4 | | | 102,022 | | | | 2,795,121 | | | | 413,360 | | | | 11,370,266 | |
Class R5 | | | 135,762 | | | | 4,079,489 | | | | 77,001 | | | | 2,109,770 | |
| | | 1,663,965 | | | | $42,386,413 | | | | (2,403,973 | ) | | | $(64,001,160 | ) |
(6) Line of Credit
The fund and certain other funds managed by MFS participate in a $1.25 billion unsecured committed line of credit, subject to a $1 billion sublimit, provided by a syndication of banks under a credit agreement. Borrowings may be made for temporary financing needs. Interest is charged to each fund, based on its borrowings, generally at a rate equal to the higher of the Overnight Federal Reserve funds rate or daily one month LIBOR plus an agreed upon spread. A commitment fee, based on the average daily, unused portion of the committed line of credit, is allocated among the
43
Notes to Financial Statements – continued
participating funds at the end of each calendar quarter. In addition, the fund and other funds managed by MFS have established unsecured uncommitted borrowing arrangements with certain banks for temporary financing needs. Interest is charged to each fund, based on its borrowings, at a rate equal to the Overnight Federal Reserve funds rate plus an agreed upon spread. For the year ended August 31, 2015, the fund’s commitment fee and interest expense were $4,431 and $0, respectively, and are included in “Miscellaneous” expense in the Statement of Operations. The period-end carrying value of the outstanding borrowings under this agreement on the fund’s Statement of Assets and Liabilities approximates its fair value which would have been considered level 2 under the fair value hierarchy disclosure if the liability were carried at fair value.
(7) Transactions in Underlying Affiliated Funds-Affiliated Issuers
An affiliated issuer may be considered one in which the fund owns 5% or more of the outstanding voting securities, or a company which is under common control. For the purposes of this report, the fund assumes the following to be an affiliated issuer:
| | | | | | | | | | | | | | | | |
| Underlying Affiliated Fund | | Beginning
Shares/Par
Amount | | | Acquisitions
Shares/Par
Amount | | | Dispositions
Shares/Par
Amount | | | Ending
Shares/Par
Amount | |
MFS Institutional Money
Market Portfolio | | | 4,714,652 | | | | 200,201,465 | | | | (192,656,019 | ) | | | 12,260,098 | |
| | | | |
| Underlying Affiliated Fund | | Realized
Gain (Loss) | | | Capital Gain
Distributions | | | Dividend
Income | | | Ending
Value | |
MFS Institutional Money
Market Portfolio | | | $— | | | | $— | | | | $12,226 | | | | $12,260,098 | |
44
REPORT OF INDEPENDENT REGISTERED PUBLIC ACCOUNTING FIRM
To the Board of Trustees of MFS Series Trust I and Shareholders of MFS Core Equity Fund:
We have audited the accompanying statement of assets and liabilities of MFS Core Equity Fund (the Fund) (one of the series constituting MFS Series Trust I), including the portfolio of investments, as of August 31, 2015, and the related statement of operations for the year then ended, the statements of changes in net assets for each of the two years in the period then ended and the financial highlights for each of the periods indicated therein. These financial statements and financial highlights are the responsibility of the Fund’s management. Our responsibility is to express an opinion on these financial statements and financial highlights based on our audits.
We conducted our audits in accordance with the standards of the Public Company Accounting Oversight Board (United States). Those standards require that we plan and perform the audit to obtain reasonable assurance about whether the financial statements and financial highlights are free of material misstatement. We were not engaged to perform an audit of the Fund’s internal control over financial reporting. Our audits included consideration of internal control over financial reporting as a basis for designing audit procedures that are appropriate in the circumstances, but not for the purpose of expressing an opinion on the effectiveness of the Fund’s internal control over financial reporting. Accordingly, we express no such opinion. An audit also includes examining, on a test basis, evidence supporting the amounts and disclosures in the financial statements and financial highlights, assessing the accounting principles used and significant estimates made by management, and evaluating the overall financial statement presentation. Our procedures included confirmation of securities owned as of August 31, 2015, by correspondence with the custodian and others or by other appropriate auditing procedures where replies from others were not received. We believe that our audits provide a reasonable basis for our opinion.
In our opinion, the financial statements and financial highlights referred to above present fairly, in all material respects, the financial position of MFS Core Equity Fund (one of the series constituting MFS Series Trust I) at August 31, 2015, the results of its operations for the year then ended the changes in its net assets for each of the two years in the period then ended, and the financial highlights for each of the periods indicated therein, in conformity with U.S. generally accepted accounting principles.

Boston, Massachusetts
October 15, 2015
45
TRUSTEES AND OFFICERS — IDENTIFICATION AND BACKGROUND
The Trustees and Officers of the Trust, as of October 1, 2015, are listed below, together with their principal occupations during the past five years. (Their titles may have varied during that period.) The address of each Trustee and Officer is 111 Huntington Avenue, Boston, Massachusetts 02199-7618.
| | | | | | | | |
Name, Age | | Position(s) Held with Fund | | Trustee/Officer
Since (h) | | Principal
Occupations During the Past Five Years | | Other Directorships (j) |
| INTERESTED TRUSTEES |
Robert J. Manning (k) (age 51) | | Trustee | | February 2004 | | Massachusetts Financial Services Company, Chairman, Co-Chief Executive Officer and Director; Chief Investment Officer (until 2010) | | N/A |
Robin A. Stelmach (k) (age 54) | | Trustee and President | | January 2014 | | Massachusetts Financial Services Company, Executive Vice President and Chief Operating Officer | | N/A |
| INDEPENDENT TRUSTEES | | | | | | |
David H. Gunning (age 73) | | Trustee and Chair of Trustees | | January 2004 | | Private investor | | Lincoln Electric Holdings, Inc., Director; Development Alternatives, Inc., Director/Non-Executive Chairman |
Steven E. Buller (age 64) | | Trustee | | February 2014 | | Chairman, Financial Accounting Standards Advisory Council; Standing Advisory Group, Public Company Accounting Oversight Board, Member (until 2014); BlackRock, Inc. (investment management), Managing Director (until 2014), BlackRock Finco UK (investment management), Director (until 2014) | | N/A |
Robert E. Butler (age 73) | | Trustee | | January 2006 | | Consultant – investment company industry regulatory and compliance matters | | N/A |
46
Trustees and Officers – continued
| | | | | | | | |
Name, Age | | Position(s) Held with Fund | | Trustee/Officer
Since (h) | | Principal
Occupations During the Past Five Years | | Other Directorships (j) |
Maureen R. Goldfarb (age 60) | | Trustee | | January 2009 | | Private investor | | N/A |
William R. Gutow (age 74) | | Trustee | | December 1993 | | Private investor and real estate consultant; Capitol Entertainment Management Company (video franchise), Vice Chairman | | Texas Donuts, Vice Chairman (until 2010) |
Michael Hegarty (age 70) | | Trustee | | December 2004 | | Private investor | | Rouse Properties Inc., Director; Capmark Financial Group Inc., Director |
John P. Kavanaugh (age 60) | | Trustee | | January 2009 | | Private investor | | N/A |
Maryanne L. Roepke (age 59) | | Trustee | | May 2014 | | American Century Investments (investment management), Senior Vice President and Chief Compliance Officer (until 2014) | | N/A |
Laurie J. Thomsen (age 58) | | Trustee | | March 2005 | | Private investor; New Profit, Inc. (venture philanthropy), Executive Partner (until 2010) | | The Travelers Companies, Director; Dycom Industries, Inc. |
Robert W. Uek (age 74) | | Trustee | | January 2006 | | Consultant to investment company industry | | N/A |
| OFFICERS | | | | | | |
Christopher R. Bohane (k) (age 41) | | Assistant Secretary and Assistant Clerk | | July 2005 | | Massachusetts Financial Services Company, Vice President and Assistant General Counsel | | N/A |
Kino Clark (k) (age 47) | | Assistant Treasurer | | January 2012 | | Massachusetts Financial Services Company, Vice President | | N/A |
Kristin V. Collins (k) (age 42) | | Assistant Secretary and Assistant Clerk | | September 2015 | | Massachusetts Financial Services Company, Vice President and Assistant General Counsel | | N/A |
47
Trustees and Officers – continued
| | | | | | | | |
Name, Age | | Position(s) Held with Fund | | Trustee/Officer
Since (h) | | Principal
Occupations During the Past Five Years | | Other Directorships (j) |
Thomas H. Connors (k) (age 56) | | Assistant Secretary and Assistant Clerk | | September 2012 | | Massachusetts Financial Services Company, Vice President and Senior Counsel; Deutsche Investment Management Americas Inc. (financial service provider), Director and Senior Counsel (until 2012) | | N/A |
Ethan D. Corey (k) (age 51) | | Assistant Secretary and Assistant Clerk | | July 2005 | | Massachusetts Financial Services Company, Senior Vice President and Associate General Counsel | | N/A |
David L. DiLorenzo (k) (age 47) | | Treasurer | | July 2005 | | Massachusetts Financial Services Company, Senior Vice President | | N/A |
Susan S. Newton (k) (age 65) | | Assistant Secretary and Assistant Clerk | | May 2005 | | Massachusetts Financial Services Company, Senior Vice President and Associate General Counsel | | N/A |
Kenneth Paek (k) (age 41) | | Assistant Treasurer | | February 2015 | | Massachusetts Financial Services Company, Vice President; Cohen & Steers, Vice President/Head of Fund Administration (until 2014) | | N/A |
Susan A. Pereira (k) (age 44) | | Assistant Secretary and Assistant Clerk | | July 2005 | | Massachusetts Financial Services Company, Vice President and Senior Counsel | | N/A |
Kasey L. Phillips (k) (age 44) | | Assistant Treasurer | | September 2012 | | Massachusetts Financial Services Company, Vice President; Wells Fargo Funds Management, LLC, Senior Vice President, Fund Treasurer (until 2012) | | N/A |
48
Trustees and Officers – continued
| | | | | | | | |
Name, Age | | Position(s) Held with Fund | | Trustee/Officer
Since (h) | | Principal
Occupations During the Past Five Years | | Other Directorships (j) |
Mark N. Polebaum (k) (age 63) | | Secretary and Clerk | | January 2006 | | Massachusetts Financial Services Company, Executive Vice President, General Counsel and Secretary | | N/A |
Matthew A. Stowe (k) (age 40) | | Assistant Secretary and Assistant Clerk | | October 2014 | | Massachusetts Financial Services Company, Vice President and Assistant General Counsel | | N/A |
Frank L. Tarantino (age 71) | | Independent Senior Officer | | June 2004 | | Tarantino LLC (provider of compliance services), Principal | | N/A |
Richard S. Weitzel (k) (age 45) | | Assistant Secretary and Assistant Clerk | | October 2007 | | Massachusetts Financial Services Company, Senior Vice President and Associate General Counsel | | N/A |
Martin J. Wolin (k) (age 48) | | Chief Compliance Officer | | July 2015 | | Massachusetts Financial Services Company, Senior Vice President and Chief Compliance Officer (since July 2015); Mercer (financial service provider), Chief Risk and Compliance Officer, North America and Latin America (until June 2015) | | N/A |
James O. Yost (k) (age 55) | | Deputy Treasurer | | September 1990 | | Massachusetts Financial Services Company, Senior Vice President | | N/A |
| (h) | Date first appointed to serve as Trustee/officer of an MFS Fund. Each Trustee has served continuously since appointment unless indicated otherwise. For the period from December 15, 2004 until February 22, 2005, Mr. Manning served as Advisory Trustee. Prior to January 2012, Messrs. DiLorenzo and Yost served as Assistant Treasurers of the Funds. Ms. Stelmach was appointed as President of the Funds as of October 1, 2014. |
| (j) | Directorships or trusteeships of companies required to report to the Securities and Exchange Commission (i.e., “public companies”). |
| (k) | “Interested person” of the Trust within the meaning of the Investment Company Act of 1940 (referred to as the 1940 Act), which is the principal federal law governing investment companies like the fund, as a result of a position with MFS. The address of MFS is 111 Huntington Avenue, Boston, Massachusetts 02199-7618. |
49
Trustees and Officers – continued
Each Trustee (except Ms. Stelmach, Mr. Buller and Ms. Roepke) has been elected by shareholders and each Trustee and officer holds office until his or her successor is chosen and qualified or until his or her earlier death, resignation, retirement or removal. The Trust does not hold annual meetings for the purpose of electing Trustees, and Trustees are not elected for fixed terms. Messrs. Butler, Kavanaugh, Uek and Mses. Thomsen and Roepke are members of the Trust’s Audit Committee.
Each of the Fund’s Trustees and officers holds comparable positions with certain other funds of which MFS or a subsidiary is the investment adviser or distributor, and, in the case of the officers, with certain affiliates of MFS. As of October 1, 2015, the Trustees served as board members of 138 funds within the MFS Family of Funds.
The Statement of Additional Information for a Fund includes further information about the Trustees and is available without charge upon request by calling 1-800-225-2606.
| | |
| Investment Adviser | | Custodian |
Massachusetts Financial Services Company
111 Huntington Avenue
Boston, MA 02199-7618 | | State Street Bank and Trust Company 1 Lincoln Street Boston, MA 02111-2900 |
| Distributor | | Independent Registered Public Accounting Firm |
MFS Fund Distributors, Inc.
111 Huntington Avenue
Boston, MA 02199-7618 | | Ernst & Young LLP 200 Clarendon Street Boston, MA 02116 |
| Portfolio Manager | | |
Joseph MacDougall | | |
50
BOARD REVIEW OF INVESTMENT ADVISORY AGREEMENT
The Investment Company Act of 1940 requires that both the full Board of Trustees and a majority of the non-interested (“independent”) Trustees, voting separately, annually approve the continuation of the Fund’s investment advisory agreement with MFS. The Trustees consider matters bearing on the Fund and its advisory arrangements at their meetings throughout the year, including a review of performance data at each regular meeting. In addition, the independent Trustees met several times over the course of three months beginning in May and ending in July, 2015 (“contract review meetings”) for the specific purpose of considering whether to approve the continuation of the investment advisory agreement for the Fund and the other investment companies that the Board oversees (the “MFS Funds”). The independent Trustees were assisted in their evaluation of the Fund’s investment advisory agreement by independent legal counsel, from whom they received separate legal advice and with whom they met separately from MFS during various contract review meetings. The independent Trustees were also assisted in this process by the MFS Funds’ Independent Senior Officer, a senior officer appointed by and reporting to the independent Trustees.
In connection with their deliberations regarding the continuation of the investment advisory agreement, the Trustees, including the independent Trustees, considered such information and factors as they believed, in light of the legal advice furnished to them and their own business judgment, to be relevant. The investment advisory agreement for the Fund was considered separately, although the Trustees also took into account the common interests of all MFS Funds in their review. As described below, the Trustees considered the nature, quality, and extent of the various investment advisory, administrative, and shareholder services performed by MFS under the existing investment advisory agreement and other arrangements with the Fund.
In connection with their contract review meetings, the Trustees received and relied upon materials that included, among other items: (i) information provided by Lipper Inc., an independent third party, on the investment performance of the Fund for various time periods ended December 31, 2014 and the investment performance of a group of funds with substantially similar investment classifications/objectives (the “Lipper performance universe”), (ii) information provided by Lipper Inc. on the Fund’s advisory fees and other expenses and the advisory fees and other expenses of comparable funds identified by Lipper Inc. (the “Lipper expense group”), (iii) information provided by MFS on the advisory fees of comparable portfolios of other clients of MFS, including institutional separate accounts and other clients, (iv) information as to whether and to what extent applicable expense waivers, reimbursements or fee “breakpoints” are observed for the Fund, (v) information regarding MFS’ financial results and financial condition, including MFS’ and certain of its affiliates’ estimated profitability from services performed for the Fund and the MFS Funds as a whole, and compared to MFS’ institutional business, (vi) MFS’ views regarding the outlook for the mutual fund industry and the strategic business plans of MFS, (vii) descriptions of various functions performed by MFS for the Funds, such as compliance monitoring and portfolio trading practices, and (viii) information regarding the overall organization of MFS, including information about MFS’ senior management and other personnel providing investment advisory, administrative and other services to
51
Board Review of Investment Advisory Agreement – continued
the Fund and the other MFS Funds. The comparative performance, fee and expense information prepared and provided by Lipper Inc. was not independently verified and the independent Trustees did not independently verify any information provided to them by MFS.
The Trustees’ conclusion as to the continuation of the investment advisory agreement was based on a comprehensive consideration of all information provided to the Trustees and not the result of any single factor. Some of the factors that figured particularly in the Trustees’ deliberations are described below, although individual Trustees may have evaluated the information presented differently from one another, giving different weights to various factors. It is also important to recognize that the fee arrangements for the Fund and other MFS Funds are the result of years of review and discussion between the independent Trustees and MFS, that certain aspects of such arrangements may receive greater scrutiny in some years than in others, and that the Trustees’ conclusions may be based, in part, on their consideration of these same arrangements during the course of the year and in prior years.
Based on information provided by Lipper Inc. and MFS, the Trustees reviewed the Fund’s total return investment performance as well as the performance of peer groups of funds over various time periods. The Trustees placed particular emphasis on the total return performance of the Fund’s Class A shares in comparison to the performance of funds in its Lipper performance universe over the three-year period ended December 31, 2014, which the Trustees believed was a long enough period to reflect differing market conditions. The total return performance of the Fund’s Class A shares was in the 2nd quintile relative to the other funds in the universe for this three-year period (the 1st quintile being the best performers and the 5th quintile being the worst performers). The total return performance of the Fund’s Class A shares was in the 3rd quintile for the one-year period and the 2nd quintile for the five-year period ended December 31, 2014 relative to the Lipper performance universe. Because of the passage of time, these performance results may differ from the performance results for more recent periods, including those shown elsewhere in this report.
In the course of their deliberations, the Trustees took into account information provided by MFS in connection with the contract review meetings, as well as during investment review meetings conducted with portfolio management personnel during the course of the year regarding the Fund’s performance. After reviewing these and related factors, the Trustees concluded, within the context of their overall conclusions regarding the investment advisory agreement, that they were satisfied with MFS’ responses and efforts relating to investment performance.
In assessing the reasonableness of the Fund’s advisory fee, the Trustees considered, among other information, the Fund’s advisory fee and the total expense ratio of the Fund’s Class A shares as a percentage of average daily net assets and the advisory fee and total expense ratios of peer groups of funds based on information provided by Lipper Inc. The Trustees considered that, according to the Lipper data (which takes into account any fee reductions or expense limitations that were in effect during the Fund’s last fiscal year), the Fund’s effective advisory fee rate and total expense ratio were each lower than the Lipper expense group median.
52
Board Review of Investment Advisory Agreement – continued
The Trustees also considered the advisory fees charged by MFS to any institutional separate accounts advised by MFS (“separate accounts”) and unaffiliated investment companies for which MFS serves as subadviser (“subadvised funds”) that have comparable investment strategies to the Fund. In comparing these fees, the Trustees considered information provided by MFS as to the generally broader scope of services provided by MFS to the Fund, as well as the more extensive regulatory burdens imposed on MFS in managing the Fund, in comparison to separate accounts and subadvised funds. The Trustees also considered the higher demands placed on MFS’ investment personnel and trading infrastructure as a result of the daily cash in-flows and out-flows of the Fund in comparison to separate accounts.
The Trustees also considered whether the Fund may benefit from any economies of scale in the management of the Fund in the event of growth in assets of the Fund and/or growth in assets of the MFS Funds as a whole. They noted that the Fund’s advisory fee rate schedule is subject to a contractual breakpoint that reduces the Fund’s advisory fee rate on average daily net assets over $500 million, and that MFS has agreed in writing to further reduce its advisory fee rate on the Fund’s average daily net assets over $2.5 billion, which may not be changed without the Trustees’ approval. The Trustees also noted that MFS has agreed in writing to waive a portion of the management fees of certain MFS Funds, including the Fund, if the total combined assets of certain funds within the MFS Funds’ complex increase above agreed upon thresholds (the “group fee waiver”), enabling the Fund’s shareholders to share in the benefits from any economies of scale at the complex level. The group fee waiver is reviewed and renewed annually between the Board and MFS. The Trustees concluded that the breakpoints and the group fee waiver were sufficient to allow the Fund to benefit from economies of scale as its assets and overall complex assets grow.
The Trustees also considered information prepared by MFS relating to MFS’ costs and profits with respect to the Fund, the MFS Funds considered as a group, and other investment companies and accounts advised by MFS, as well as MFS’ methodologies used to determine and allocate its costs to the MFS Funds, the Fund and other accounts and products for purposes of estimating profitability.
After reviewing these and other factors described herein, the Trustees concluded, within the context of their overall conclusions regarding the investment advisory agreement, that the advisory fees charged to the Fund represent reasonable compensation in light of the services being provided by MFS to the Fund.
In addition, the Trustees considered MFS’ resources and related efforts to continue to retain, attract and motivate capable personnel to serve the Fund. The Trustees also considered current and developing conditions in the financial services industry, including the presence of large and well-capitalized companies which are spending, and appear to be prepared to continue to spend, substantial sums to engage personnel and to provide services to competing investment companies. In this regard, the Trustees also considered the financial resources of MFS and its ultimate parent, Sun Life Financial Inc. The Trustees also considered the advantages and possible disadvantages to the Fund of having an adviser that also serves other investment companies as well as other accounts.
53
Board Review of Investment Advisory Agreement – continued
The Trustees also considered the nature, quality, cost, and extent of administrative, transfer agency, and distribution services provided to the Fund by MFS and its affiliates under agreements and plans other than the investment advisory agreement, including any 12b-1 fees the Fund pays to MFS Fund Distributors, Inc., an affiliate of MFS. The Trustees also considered the nature, extent and quality of certain other services MFS performs or arranges for on the Fund’s behalf, which may include securities lending programs, directed expense payment programs, class action recovery programs, and MFS’ interaction with third-party service providers, principally custodians and sub-custodians. The Trustees concluded that the various non-advisory services provided by MFS and its affiliates on behalf of the Fund were satisfactory.
The Trustees also considered benefits to MFS from the use of the Fund’s portfolio brokerage commissions, if applicable, to pay for investment research and various other factors. Additionally, the Trustees considered so-called “fall-out benefits” to MFS such as reputational value derived from serving as investment manager to the Fund.
Based on their evaluation of factors that they deemed to be material, including those factors described above, the Board of Trustees, including the independent Trustees, concluded that the Fund’s investment advisory agreement with MFS should be continued for an additional one-year period, commencing August 1, 2015.
54
PROXY VOTING POLICIES AND INFORMATION
MFS votes proxies on behalf of the fund pursuant to proxy voting policies and procedures that are available without charge, upon request, by calling 1-800-225-2606, by visiting the Proxy Voting section of mfs.com or by visiting the SEC’s Web site at http://www.sec.gov.
Information regarding how the fund voted proxies relating to portfolio securities during the most recent twelve-month period ended June 30 is available without charge by visiting the Proxy Voting section of mfs.com or by visiting the SEC’s Web site at http://www.sec.gov.
QUARTERLY PORTFOLIO DISCLOSURE
The fund will file a complete schedule of portfolio holdings with the Securities and Exchange Commission (the Commission) for the first and third quarters of each fiscal year on Form N-Q. A shareholder can obtain the quarterly portfolio holdings report at mfs.com. The fund’s Form N-Q is also available on the EDGAR database on the Commission’s Internet Web site at http://www.sec.gov, and may be reviewed and copied at the:
Public Reference Room
Securities and Exchange Commission
100 F Street, NE, Room 1580
Washington, D.C. 20549
Information on the operation of the Public Reference Room may be obtained by calling the Commission at 1-800-SEC-0330. Copies of the fund’s Form N-Q also may be obtained, upon payment of a duplicating fee, by electronic request at the following e-mail address: publicinfo@sec.gov or by writing the Public Reference Section at the above address.
FURTHER INFORMATION
From time to time, MFS may post important information about the fund or the MFS funds on the MFS web site (mfs.com). This information is available by visiting the “Market Commentary” and “Announcements” sub sections in the “Market Outlooks” section of mfs.com or by clicking on the fund’s name under “Mutual Funds” in the “Products” section of mfs.com.
FEDERAL TAX INFORMATION (unaudited)
The fund will notify shareholders of amounts for use in preparing 2015 income tax forms in January 2016. The following information is provided pursuant to provisions of the Internal Revenue Code.
The fund designates the maximum amount allowable as qualified dividend income eligible to be taxed at the same rate as long-term capital gain.
The fund designates $76,947,000 as capital gain dividends paid during the fiscal year.
For corporate shareholders, 38.06% of the ordinary income dividends paid during the fiscal year qualify for the corporate dividends received deduction.
55
rev. 3/11
| | | | |
| | | |
FACTS | | WHAT DOES MFS DO WITH YOUR PERSONAL INFORMATION? | |  |
| | |
| Why? | | Financial companies choose how they share your personal information. Federal law gives consumers the right to limit some but not all sharing. Federal law also requires us to tell you how we collect, share, and protect your personal information. Please read this notice carefully to understand what we do. |
| | |
| What? | | The types of personal information we collect and share depend on the product or service you have with us. This information can include: • Social Security number and account balances • Account transactions and transaction history • Checking account information and wire transfer instructions When you are no longer our customer, we continue to share your information as described in this notice. |
| | |
| How? | | All financial companies need to share customers’ personal information to run their everyday business. In the section below, we list the reasons financial companies can share their customers’ personal information; the reasons MFS chooses to share; and whether you can limit this sharing. |
| | | | |
Reasons we can share your
personal information | | Does MFS
share? | | Can you limit
this sharing? |
For our everyday business purposes – such as to process your transactions, maintain your account(s), respond to court orders and legal investigations, or report to credit bureaus | | Yes | | No |
For our marketing purposes – to offer our products and services to you | | No | | We don’t share |
| For joint marketing with other financial companies | | No | | We don’t share |
For our affiliates’ everyday business purposes – information about your transactions and experiences | | No | | We don’t share |
For our affiliates’ everyday business purposes – information about your creditworthiness | | No | | We don’t share |
| For nonaffiliates to market to you | | No | | We don’t share |
| | |
| Questions? | | Call 800-225-2606 or go to mfs.com. |
56
| | |
| Who we are |
| Who is providing this notice? | | MFS Funds, MFS Investment Management, MFS Institutional Advisors, Inc., MFS Fund Distributors, Inc., MFS Heritage Trust Company, and MFS Service Center, Inc. |
| | |
| What we do |
| How does MFS protect my personal information? | | To protect your personal information from unauthorized access and use, we use security measures that comply with federal law. These measures include procedural, electronic, and physical safeguards for the protection of the personal information we collect about you. |
| How does MFS collect my personal information? | | We collect your personal information, for example, when you • open an account or provide account information • direct us to buy securities or direct us to sell your securities • make a wire transfer We also collect your personal information from others, such as credit bureaus, affiliates and other companies. |
| Why can’t I limit all sharing? | | Federal law gives you the right to limit only • sharing for affiliates’ everyday business purposes – information about your creditworthiness • affiliates from using your information to market to you • sharing for nonaffiliates to market to you State laws and individual companies may give you additional rights to limit sharing. |
| | |
| Definitions |
| Affiliates | | Companies related by common ownership or control. They can be financial and nonfinancial companies. • MFS does not share personal information with affiliates, except for everyday business purposes as described on page one of this notice. |
| Nonaffiliates | | Companies not related by common ownership or control. They can be financial and nonfinancial companies. • MFS does not share with nonaffiliates so they can market to you. |
| Joint Marketing | | A formal agreement between nonaffiliated financial companies that together market financial products or services to you. • MFS doesn’t jointly market. |
| | |
| Other important information |
| If you own an MFS product or receive an MFS service in the name of a third party such as a bank or broker-dealer, their privacy policy may apply to you instead of ours. |
57
Save paper with eDelivery.

| MFS® will send you prospectuses, |
reports, and proxies directly via e-mail so you will get information faster with less mailbox clutter.
To sign up:
1. Go to mfs.com.
2. Log in via MFS® Access.
3. Select eDelivery.
If you own your MFS fund shares through a financial institution or a retirement plan, MFS® TALK, MFS® Access, or eDelivery may not be available to you.
CONTACT
WEB SITE
mfs.com
MFS TALK
1-800-637-8255
24 hours a day
ACCOUNT SERVICE AND LITERATURE
Shareholders
1-800-225-2606
Financial advisors
1-800-343-2829
Retirement plan services
1-800-637-1255
MAILING ADDRESS
MFS Service Center, Inc.
P.O. Box 55824
Boston, MA 02205-5824
OVERNIGHT MAIL
MFS Service Center, Inc.
c/o Boston Financial Data Services
30 Dan Road
Canton, MA 02021-2809
ANNUAL REPORT
August 31, 2015

MFS® GLOBAL LEADERS FUND

GLD-ANN
MFS® GLOBAL LEADERS FUND
CONTENTS
The report is prepared for the general information of shareholders.
It is authorized for distribution to prospective investors only when preceded or accompanied by a current prospectus.
NOT FDIC INSURED • MAY LOSE VALUE • NO BANK GUARANTEE

LETTER FROM THE CHAIRMAN
Dear Shareholders:
The U.S. economy bounced back after another harsh winter curtailed domestic consumption. Despite strengthening labor and housing markets, however, a stronger U.S. dollar and weak overseas demand have held back corporate earnings.
China’s economic growth continues to slow, raising concerns and adding to global market volatility. Commodity exporters, including Australia and Canada, have been hurt by weaker Chinese demand. Global oil markets remain oversupplied, putting pressure on crude oil and gasoline prices.
In Europe, concerns about a potential Greek debt default have faded, and the eurozone’s economy is expanding mildly. Hopes for a more robust regionwide recovery rest on the European Central Bank’s quantitative easing program.
The world’s financial markets have become increasingly complex in recent years. Now, more than ever, it is important to understand companies on a global basis. At MFS®, we believe our integrated research platform, collaborative culture, active risk management process and long-term focus give us a research advantage.
As investors, we aim to add long-term value. We believe this approach will serve you well as you work with your financial advisor to reach your investment objectives.
Respectfully,

Robert J. Manning
Chairman
MFS Investment Management
October 15, 2015
The opinions expressed in this letter are subject to change and may not be relied upon for investment advice. No forecasts can be guaranteed.
1
PORTFOLIO COMPOSITION
Portfolio structure
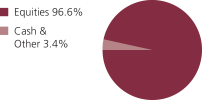
| | | | |
| Top ten holdings | | | | |
| Nestle S.A. | | | 3.9% | |
| AutoZone, Inc. | | | 3.4% | |
| Visa, Inc., “A” | | | 3.4% | |
| Japan Tobacco, Inc. | | | 3.4% | |
| YUM! Brands, Inc. | | | 3.2% | |
| Danaher Corp. | | | 3.1% | |
| Danone S.A. | | | 2.9% | |
| Time Warner, Inc. | | | 2.9% | |
| McDonald’s Corp. | | | 2.9% | |
| Pernod Ricard S.A. | | | 2.9% | |
| |
| Equity sectors | | | | |
| Consumer Staples | | | 41.1% | |
| Retailing | | | 22.3% | |
| Leisure | | | 16.9% | |
| Industrial Goods & Services | | | 5.2% | |
| Financial Services | | | 3.4% | |
| Technology | | | 2.8% | |
| Basic Materials | | | 2.6% | |
| Special Products & Services | | | 2.3% | |
| | | | |
| Issuer country weightings (x) | |
| United States | | | 43.7% | |
| France | | | 17.3% | |
| United Kingdom | | | 12.5% | |
| Switzerland | | | 5.2% | |
| Japan | | | 4.9% | |
| Germany | | | 2.8% | |
| Brazil | | | 2.7% | |
| China | | | 2.5% | |
| Netherlands | | | 2.0% | |
| Other Countries | | | 6.4% | |
|
| Currency exposure weightings (y) | |
| United States Dollar | | | 43.7% | |
| Euro | | | 23.3% | |
| British Pound Sterling | | | 12.5% | |
| Swiss Franc | | | 5.2% | |
| Japanese Yen | | | 4.9% | |
| Hong Kong Dollar | | | 3.7% | |
| Brazilian Real | | | 2.7% | |
| Swedish Krona | | | 1.5% | |
| Danish Krone | | | 1.3% | |
| Other Currencies | | | 1.2% | |
| (x) | Represents the portfolio’s exposure to issuer countries as a percentage of a portfolio’s net assets. For purposes of this presentation, United States includes Cash & Other. |
| (y) | Represents the portfolio’s exposure to a particular currency as a percentage of a portfolio’s net assets. For purposes of this presentation, United States Dollar includes Cash & Other. |
2
Portfolio Composition – continued
Cash & Other can include cash, other assets less liabilities, offsets to derivative positions, and short-term securities. Please see the Statement of Assets and Liabilities for additional information related to the fund’s cash position and the Notes to Financial Statements for additional information related to certain risks associated with assets included in “Other”.
Percentages are based on net assets as of 8/31/15.
The portfolio is actively managed and current holdings may be different.
3
MANAGEMENT REVIEW
Summary of Results
For the twelve months ended August 31, 2015, Class A shares of the MFS Global Leaders Fund (“fund”) provided a total return of –5.09%, at net asset value. This compares with a return of –5.79% for the fund’s benchmark, the MSCI All Country World Index.
Market Environment
A generally risk-friendly environment prevailed in the first half of the period and any market setbacks, triggered by global growth concerns, were short-lived as central banks responded and kept monetary policy accommodative. For example, the US tempered rate hike expectations while Japan, Europe and China provided fresh stimulus measures which ultimately supported risk assets. Early in the second half of the period, the European Central Bank cut policy interest rates and announced non-conventional easing measures, pushing yields on a significant portion of eurozone sovereign bonds deeper into negative territory, a notable highlight amid a mini-wave of global easing due to declining inflation and inflation expectations. However, the environment supporting risk began to break down in the latter phases of the period, with both US investment grade and high yield corporate spreads widening out and any individual company performance below expectations resulted in market selling.
A dominant trend for most of the period was the ongoing rise in US equities. Until early in the second half of the period, this was paired with a decline in US and global bond yields. The uptrend in US corporate margins and profits continued throughout the second half of 2014, but in the latter part of the period the margin results became more bifurcated with energy and materials suffering and the rest of the companies holding on to net margins in an ongoing slow revenue growth environment. A rising dollar and a sharp decline in commodity prices, particularly crude oil prices, negatively impacted credit markets, notably US high yield and emerging market debt. The higher weightings of oil and gas credits in these asset classes resulted in widening spreads and increased volatility. In the second half of the period, global sovereign bond yields rose, shrugging off concerns over a Greek debt default. The rise tempered the equity advance, as odds of a 2015 US Federal Reserve rate hike increased. At the end of the period, the stronger US dollar slowed revenues in many US-based multinational companies. As the last month of the period began, risk shedding became a theme across emerging market countries and continued to weaken Chinese economic data as well as economic data of the commodity-driven countries. Risk shedding accelerated outflows and cross-border selling. By the end of the period, many of the world’s equity markets had entered into “correction” territory.
Contributors to performance
Not holding shares in the poor-performing energy sector aided performance relative to the MSCI All Country World Index.
Stock selection in the financial services sector also boosted relative returns. Here, an overweight position in global payments technology company Visa aided relative results. Shares of Visa grew early in the period after the company reported better-than-expected revenue and lower operating expenses. Additionally, management announced solid
4
Management Review – continued
earnings guidance for the full year 2015 that reflected a robust margin outlook which further supported its share price appreciation during the quarter.
A combination of stock selection and an underweight allocation to the basic materials sector also benefited relative performance. However, there were no individual stocks within this sector that were among the fund’s top relative contributors during the reporting period.
An overweight allocation to the retailing sector helped relative returns. Within this sector, overweight positions in automotive replacement parts distributor AutoZone, discount retailer Target, athletic shoes and apparel manufacturer NIKE, specialty retailer Limited Brands (h) and in the world’s largest luxury goods company, LVMH (France), aided relative performance. Shares of Autozone appreciated significantly in the first half of the reporting period. Lower fuel prices, favorable weather conditions and increased sales contributed to the stock’s outperformance. Management noted positive sales trends and an increase in same-store sales as additional areas of strength. The stock price of Target rose markedly after management announced that revenues during its fourth fiscal quarter accelerated meaningfully and gross margins came in better than expected as customers traded up within categories. Additionally, less markdown products during the period also strengthened the stock’s performance. The strong performance of NIKE reflected consistently robust results over the year on the back of management’s continued ability to drive the marketplace with premium, innovative products, elevated brand presentation and a best-in-class supply chain.
Elsewhere, overweight positions in consumer and commercial products manufacturer Newell Rubbermaid, industrial and consumer products manufacturer Danaher, fast food restaurant company Yum! Brands and tobacco company Japan Tobacco (Japan) also helped relative returns. Despite the challenging macroeconomic environment, shares of Newell Rubbermaid appreciated as increased investment behind the business in combination with enhanced new product offerings, as well as a keen focus on productivity, enabled the company to deliver stronger-than-anticipated top and bottom line results.
Detractors from performance
Stock selection in the consumer staples sector detracted from relative results. Within this sector, overweight positions in wheat-based foods producer M. Dias Branco (Brazil), snack food and beverages manufacturer Want Want China Holdings (China) and Brazilian-based brewer Companhia de Bebidas das Americas (h) held back relative performance. Shares of M. Dias Branco detracted from results as weakened economic conditions and higher inflation put downward pricing pressure on the firm’s products. A decline in real income and a rise in unemployment, especially in the Northeast region of Brazil, were the main factors for underperformance as this region represents a significant portion of the company’s sales. The share price of Want Want China Holdings dived in August after the company posted disappointing results for the first half of the year where net profit declined as a result of sluggish consumption demand and a weak macroeconomic outlook in China. Additionally, holdings of food and beverage company Super Group (b) (Singapore) also weighed on relative performance. Shares declined in the second half of the reporting period after the company reported
5
Management Review – continued
slower-than-expected sales growth due to weak demand in the Philippines and Malaysia. An increase in the corporate tax rate also hurt earnings due to the roll-off of some tax incentives.
Not holding shares in the strong-performing health care sector further hurt relative returns.
Elsewhere, overweight positions in global media company 21st Century Fox, electrical distribution equipment manufacturer Schneider Electric (France), retail and luxury goods distributor Kering (France), apparel retailer Urban Outfitters and Swiss luxury goods company Richemont weighed on relative returns. Shares of 21st Century Fox declined late in the period on the back of weak earnings guidance that was revised further below consensus estimates. Not holding computer and personal electronics maker Apple also detracted from relative results.
During the reporting period, the fund’s currency exposure, resulting primarily from differences between the fund’s and the benchmark’s exposures to holdings of securities denominated in foreign currencies, held back relative results. All of MFS’ investment decisions are driven by the fundamentals of each individual opportunity and as such, it is common for our portfolios to have different currency exposure than the benchmark.
Respectfully,
Maile Clark
Portfolio Manager
| (b) | Security is not a benchmark constituent. |
| (h) | Security was not held in the portfolio at period end. |
Note to Shareholders: Effective March 31, 2015, Matthew Barrett is no longer a Portfolio Manager of the Fund.
The views expressed in this report are those of the portfolio manager only through the end of the period of the report as stated on the cover and do not necessarily reflect the views of MFS or any other person in the MFS organization. These views are subject to change at any time based on market or other conditions, and MFS disclaims any responsibility to update such views. These views may not be relied upon as investment advice or an indication of trading intent on behalf of any MFS portfolio. References to specific securities are not recommendations of such securities, and may not be representative of any MFS portfolio’s current or future investments.
6
PERFORMANCE SUMMARY THROUGH 8/31/15
The following chart illustrates a representative class of the fund’s historical performance in comparison to its benchmark(s). Performance results include the deduction of the maximum applicable sales charge and reflect the percentage change in net asset value, including reinvestment of dividends and capital gains distributions. The performance of other share classes will be greater than or less than that of the class depicted below. Benchmarks are unmanaged and may not be invested in directly. Benchmark returns do not reflect sales charges, commissions or expenses. (See Notes to Performance Summary.)
Performance data shown represents past performance and is no guarantee of future results. Investment return and principal value fluctuate so your shares, when sold, may be worth more or less than the original cost; current performance may be lower or higher than quoted. The performance shown does not reflect the deduction of taxes, if any, that a shareholder would pay on fund distributions or the redemption of fund shares.
Growth of a Hypothetical $10,000 Investment (t)
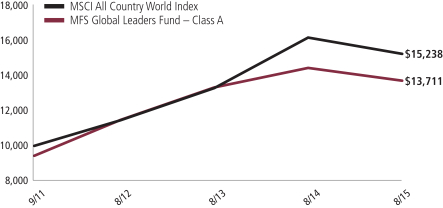
7
Performance Summary – continued
Total Returns through 8/31/15
Average annual without sales charge
| | | | | | | | | | |
| | | Share Class | | Class Inception Date | | 1-yr | | Life (t) | | |
| | | A | | 9/28/11 | | (5.09)% | | 10.01% | | |
| | | B | | 9/28/11 | | (5.78)% | | 9.19% | | |
| | | C | | 9/28/11 | | (5.78)% | | 9.19% | | |
| | | I | | 9/28/11 | | (4.80)% | | 10.29% | | |
| Comparative benchmark | | | | | | |
| | | MSCI All Country World Index (f) | | (5.79)% | | 11.32% | | |
| Average annual with sales charge | | | | | | |
| | | A
With initial Sales Charge (5.75%) | | (10.55)% | | 8.37% | | |
| | | B
With CDSC (Declining over six years from 4% to 0%) (v) | | (9.43)% | | 8.59% | | |
| | | C
With CDSC (1% for 12 months) (v) | | (6.69)% | | 9.19% | | |
CDSC – Contingent Deferred Sales Charge.
Class I shares do not have a sales charge.
| (f) | Source: FactSet Research Systems Inc. |
| (t) | For the period from the class inception date through the stated period end. (See Notes to Performance Summary.) |
| (v) | Assuming redemption at the end of the applicable period. |
Benchmark Definition
MSCI All Country World Index – a market capitalization-weighted index that is designed to measure equity market performance in the global developed and emerging markets.
It is not possible to invest directly in an index.
Notes to Performance Summary
Average annual total return represents the average annual change in value for each share class for the periods presented. Life returns are presented where the share class has less than 10 years of performance history and represent the average annual total return from the class inception date to the stated period end date.
Performance results reflect any applicable expense subsidies and waivers in effect during the periods shown. Without such subsidies and waivers the fund’s performance results would be less favorable. Please see the prospectus and financial statements for complete details.
Performance results do not include adjustments made for financial reporting purposes in accordance with U.S. generally accepted accounting principles and may differ from amounts reported in the financial highlights.
From time to time the fund may receive proceeds from litigation settlements, without which performance would be lower.
8
EXPENSE TABLE
Fund expenses borne by the shareholders during the period,
March 1, 2015 through August 31, 2015
As a shareholder of the fund, you incur two types of costs: (1) transaction costs, including sales charges (loads) on certain purchase or redemption payments, and (2) ongoing costs, including management fees; distribution and service (12b-1) fees; and other fund expenses. This example is intended to help you understand your ongoing costs (in dollars) of investing in the fund and to compare these costs with the ongoing costs of investing in other mutual funds.
The example is based on an investment of $1,000 invested at the beginning of the period and held for the entire period March 1, 2015 through August 31, 2015.
Actual Expenses
The first line for each share class in the following table provides information about actual account values and actual expenses. You may use the information in this line, together with the amount you invested, to estimate the expenses that you paid over the period. Simply divide your account value by $1,000 (for example, an $8,600 account value divided by $1,000 = 8.6), then multiply the result by the number in the first line under the heading entitled “Expenses Paid During Period” to estimate the expenses you paid on your account during this period.
Hypothetical Example for Comparison Purposes
The second line for each share class in the following table provides information about hypothetical account values and hypothetical expenses based on the fund’s actual expense ratio and an assumed rate of return of 5% per year before expenses, which is not the fund’s actual return. The hypothetical account values and expenses may not be used to estimate the actual ending account balance or expenses you paid for the period. You may use this information to compare the ongoing costs of investing in the fund and other funds. To do so, compare this 5% hypothetical example with the 5% hypothetical examples that appear in the shareholder reports of the other funds.
Please note that the expenses shown in the table are meant to highlight your ongoing costs only and do not reflect any transactional costs, such as sales charges (loads). Therefore, the second line for each share class in the table is useful in comparing ongoing costs only, and will not help you determine the relative total costs of owning different funds. In addition, if these transactional costs were included, your costs would have been higher.
9
Expense Table – continued
| | | | | | | | | | | | | | | | | | |
Share
Class | | | | Annualized
Expense
Ratio | | | Beginning
Account Value
3/01/15 | | | Ending
Account Value
8/31/15 | | | Expenses
Paid During
Period (p)
3/01/15-8/31/15 | |
| A | | Actual | | | 1.45% | | | | $1,000.00 | | | | $911.41 | | | | $6.99 | |
| | Hypothetical (h) | | | 1.45% | | | | $1,000.00 | | | | $1,017.90 | | | | $7.38 | |
| B | | Actual | | | 2.20% | | | | $1,000.00 | | | | $907.85 | | | | $10.58 | |
| | Hypothetical (h) | | | 2.20% | | | | $1,000.00 | | | | $1,014.12 | | | | $11.17 | |
| C | | Actual | | | 2.20% | | | | $1,000.00 | | | | $907.85 | | | | $10.58 | |
| | Hypothetical (h) | | | 2.20% | | | | $1,000.00 | | | | $1,014.12 | | | | $11.17 | |
| I | | Actual | | | 1.20% | | | | $1,000.00 | | | | $913.14 | | | | $5.79 | |
| | Hypothetical (h) | | | 1.20% | | | | $1,000.00 | | | | $1,019.16 | | | | $6.11 | |
| (h) | 5% class return per year before expenses. |
| (p) | “Expenses Paid During Period” are equal to each class’s annualized expense ratio, as shown above, multiplied by the average account value over the period, multiplied by 184/365 (to reflect the one-half year period). Expenses paid do not include any applicable sales charges (loads). If these transaction costs had been included, your costs would have been higher. |
10
PORTFOLIO OF INVESTMENTS
8/31/15
The Portfolio of Investments is a complete list of all securities owned by your fund. It is categorized by broad-based asset classes.
| | | | | | | | |
| Common Stocks - 96.6% | | | | | | | | |
| Issuer | | Shares/Par | | | Value ($) | |
| Alcoholic Beverages - 10.7% | | | | | | | | |
| AmBev S.A. | | | 33,552 | | | $ | 176,611 | |
| Carlsberg A.S., “B” | | | 1,965 | | | | 148,305 | |
| Diageo PLC | | | 11,449 | | | | 303,935 | |
| Pernod Ricard S.A. | | | 3,272 | | | | 343,375 | |
| SABMiller PLC | | | 6,274 | | | | 291,283 | |
| | | | | | | | |
| | | | | | | $ | 1,263,509 | |
| Apparel Manufacturers - 13.5% | | | | | | | | |
| Belle International Holdings Ltd. | | | 142,000 | | | $ | 129,906 | |
| Burberry Group PLC | | | 13,817 | | | | 297,302 | |
| Compagnie Financiere Richemont S.A. | | | 2,192 | | | | 164,063 | |
| Global Brands Group Holding Ltd. (a) | | | 748,000 | | | | 141,878 | |
| Kering S.A. | | | 1,061 | | | | 181,864 | |
| LVMH Moet Hennessy Louis Vuitton S.A. | | | 1,973 | | | | 329,112 | |
| NIKE, Inc., “B” | | | 1,938 | | | | 216,572 | |
| Tod’s S.p.A. | | | 1,585 | | | | 145,046 | |
| | | | | | | | |
| | | | | | | $ | 1,605,743 | |
| Broadcasting - 9.6% | | | | | | | | |
| Nippon Television Holdings, Inc. | | | 10,500 | | | $ | 182,138 | |
| Publicis Groupe S.A. | | | 3,997 | | | | 284,902 | |
| Time Warner, Inc. | | | 4,867 | | | | 346,044 | |
| Twenty-First Century Fox, Inc. | | | 11,756 | | | | 321,997 | |
| | | | | | | | |
| | | | | | | $ | 1,135,081 | |
| Business Services - 2.2% | | | | | | | | |
| Accenture PLC, “A” | | | 2,826 | | | $ | 266,407 | |
| | |
| Chemicals - 2.6% | | | | | | | | |
| 3M Co. | | | 2,192 | | | $ | 311,571 | |
| | |
| Computer Software - 2.8% | | | | | | | | |
| SAP AG | | | 4,949 | | | $ | 333,156 | |
| | |
| Consumer Products - 12.2% | | | | | | | | |
| Colgate-Palmolive Co. | | | 4,526 | | | $ | 284,278 | |
| L’Oreal S.A. | | | 1,839 | | | | 315,117 | |
| Newell Rubbermaid, Inc. | | | 6,938 | | | | 292,298 | |
| Reckitt Benckiser Group PLC | | | 3,614 | | | | 316,995 | |
11
Portfolio of Investments – continued
| | | | | | | | |
| Issuer | | Shares/Par | | | Value ($) | |
| Common Stocks - continued | | | | | | | | |
| Consumer Products - continued | | | | | | | | |
| Unilever N.V. | | | 5,827 | | | $ | 233,663 | |
| | | | | | | | |
| | | | | | | $ | 1,442,351 | |
| Electrical Equipment - 5.2% | | | | | | | | |
| Danaher Corp. | | | 4,249 | | | $ | 369,748 | |
| Schneider Electric S.A. | | | 3,878 | | | | 245,131 | |
| | | | | | | | |
| | | | | | | $ | 614,879 | |
| Food & Beverages - 12.4% | | | | | | | | |
| Danone S.A. | | | 5,598 | | | $ | 347,949 | |
| M. Dias Branco S.A. Industria e Comercio de Alimentos | | | 8,144 | | | | 142,146 | |
| Mead Johnson Nutrition Co., “A” | | | 2,755 | | | | 215,827 | |
| Nestle S.A. | | | 6,204 | | | | 457,606 | |
| Super Group Ltd. | | | 261,700 | | | | 146,517 | |
| Want Want China Holdings Ltd. | | | 200,000 | | | | 161,289 | |
| | | | | | | | |
| | | | | | | $ | 1,471,334 | |
| Gaming & Lodging - 1.3% | | | | | | | | |
| InterContinental Hotels Group PLC | | | 4,021 | | | $ | 150,817 | |
| | |
| General Merchandise - 2.0% | | | | | | | | |
| Target Corp. | | | 3,112 | | | $ | 241,834 | |
| | |
| Other Banks & Diversified Financials - 3.4% | | | | | | | | |
| Visa, Inc., “A” | | | 5,647 | | | $ | 402,631 | |
| | |
| Restaurants - 6.1% | | | | | | | | |
| McDonald’s Corp. | | | 3,617 | | | $ | 343,687 | |
| YUM! Brands, Inc. | | | 4,722 | | | | 376,674 | |
| | | | | | | | |
| | | | | | | $ | 720,361 | |
| Specialty Stores - 6.7% | | | | | | | | |
| AutoZone, Inc. (a) | | | 568 | | | $ | 406,682 | |
| Gap, Inc. | | | 5,264 | | | | 172,712 | |
| Urban Outfitters, Inc. (a) | | | 6,991 | | | | 215,742 | |
| | | | | | | | |
| | | | | | | $ | 795,136 | |
| Tobacco - 5.9% | | | | | | | | |
| Imperial Tobacco Group PLC | | | 2,525 | | | $ | 121,306 | |
| Japan Tobacco, Inc. | | | 11,200 | | | | 399,970 | |
| Swedish Match AB | | | 6,066 | | | | 179,343 | |
| | | | | | | | |
| | | | | | | $ | 700,619 | |
| Total Common Stocks (Identified Cost, $10,820,264) | | | | | | $ | 11,455,429 | |
12
Portfolio of Investments – continued
| | | | | | | | |
| Money Market Funds - 3.2% | | | | | | | | |
| Issuer | | Shares/Par | | | Value ($) | |
MFS Institutional Money Market Portfolio, 0.11%,
at Cost and Net Asset Value (v) | | | 380,016 | | | $ | 380,016 | |
| Total Investments (Identified Cost, $11,200,280) | | | | | | $ | 11,835,445 | |
| | |
| Other Assets, Less Liabilities - 0.2% | | | | | | | 21,876 | |
| Net Assets - 100.0% | | | | | | $ | 11,857,321 | |
| (a) | Non-income producing security. |
| (v) | Underlying affiliated fund that is available only to investment companies managed by MFS. The rate quoted for the MFS Institutional Money Market Portfolio is the annualized seven-day yield of the fund at period end. |
The following abbreviations are used in this report and are defined:
| PLC | | Public Limited Company |
See Notes to Financial Statements
13
Financial Statements
STATEMENT OF ASSETS AND LIABILITIES
At 8/31/15
This statement represents your fund’s balance sheet, which details the assets and liabilities comprising the total value of the fund.
| | | | |
| Assets | | | | |
Investments | | | | |
Non-affiliated issuers, at value (identified cost, $10,820,264) | | | $11,455,429 | |
Underlying affiliated funds, at cost and value | | | 380,016 | |
Total investments, at value (identified cost, $11,200,280) | | | $11,835,445 | |
Foreign currency, at value (identified cost, $39) | | | 39 | |
Receivables for | | | | |
Fund shares sold | | | 44,158 | |
Interest and dividends | | | 40,030 | |
Receivable from investment adviser | | | 10,001 | |
Other assets | | | 51 | |
Total assets | | | $11,929,724 | |
| Liabilities | | | | |
Payable for fund shares reacquired | | | $4,000 | |
Payable to affiliates | | | | |
Shareholder servicing costs | | | 5,074 | |
Distribution and service fees | | | 440 | |
Payable for independent Trustees’ compensation | | | 9 | |
Accrued expenses and other liabilities | | | 62,880 | |
Total liabilities | | | $72,403 | |
Net assets | | | $11,857,321 | |
| Net assets consist of | | | | |
Paid-in capital | | | $11,040,267 | |
Unrealized appreciation (depreciation) on investments and translation of assets and liabilities in foreign currencies | | | 634,710 | |
Accumulated net realized gain (loss) on investments and foreign currency | | | 81,807 | |
Undistributed net investment income | | | 100,537 | |
Net assets | | | $11,857,321 | |
Shares of beneficial interest outstanding | | | 924,327 | |
| | | | | | | | | | | | |
| | | Net assets | | | Shares
outstanding | | | Net asset value
per share (a) | |
Class A | | | $6,774,371 | | | | 526,606 | | | | $12.86 | |
Class B | | | 530,596 | | | | 42,072 | | | | 12.61 | |
Class C | | | 1,778,554 | | | | 141,045 | | | | 12.61 | |
Class I | | | 2,773,800 | | | | 214,604 | | | | 12.93 | |
| (a) | Maximum offering price per share was equal to the net asset value per share for all share classes, except for Class A, for which the maximum offering price per share was $13.64 [100 / 94.25 x $12.86]. On sales of $50,000 or more, the maximum offering price of Class A shares is reduced. A contingent deferred sales charge may be imposed on redemptions of Class A, Class B, and Class C shares. Redemption price per share was equal to the net asset value per share for Class I. |
See Notes to Financial Statements
14
Financial Statements
STATEMENT OF OPERATIONS
Year ended 8/31/15
This statement describes how much your fund earned in investment income and accrued in expenses. It also describes any gains and/or losses generated by fund operations.
| | | | |
| Net investment income | | | | |
Income | | | | |
Dividends | | | $306,610 | |
Dividends from underlying affiliated funds | | | 304 | |
Foreign taxes withheld | | | (21,435 | ) |
Total investment income | | | $285,479 | |
Expenses | | | | |
Management fee | | | $118,965 | |
Distribution and service fees | | | 43,062 | |
Shareholder servicing costs | | | 17,651 | |
Administrative services fee | | | 17,500 | |
Independent Trustees’ compensation | | | 1,197 | |
Custodian fee | | | 16,198 | |
Shareholder communications | | | 11,242 | |
Audit and tax fees | | | 52,870 | |
Legal fees | | | 127 | |
Registration fees | | | 53,384 | |
Miscellaneous | | | 11,225 | |
Total expenses | | | $343,421 | |
Fees paid indirectly | | | (1 | ) |
Reduction of expenses by investment adviser and distributor | | | (141,759 | ) |
Net expenses | | | $201,661 | |
Net investment income | | | $83,818 | |
| Realized and unrealized gain (loss) on investments and foreign currency | |
Realized gain (loss) (identified cost basis) | | | | |
Investments | | | $333,048 | |
Foreign currency | | | (3,544 | ) |
Net realized gain (loss) on investments and foreign currency | | | $329,504 | |
Change in unrealized appreciation (depreciation) | | | | |
Investments | | | $(1,077,629 | ) |
Translation of assets and liabilities in foreign currencies | | | (183 | ) |
Net unrealized gain (loss) on investments and foreign currency translation | | | $(1,077,812 | ) |
Net realized and unrealized gain (loss) on investments and foreign currency | | | $(748,308 | ) |
Change in net assets from operations | | | $(664,490 | ) |
See Notes to Financial Statements
15
Financial Statements
STATEMENTS OF CHANGES IN NET ASSETS
These statements describe the increases and/or decreases in net assets resulting from operations, any distributions, and any shareholder transactions.
| | | | | | | | |
| | | Years ended 8/31 | |
| | | 2015 | | | 2014 | |
| Change in net assets | | | | | | |
| From operations | | | | | | | | |
Net investment income | | | $83,818 | | | | $74,290 | |
Net realized gain (loss) on investments and foreign currency | | | 329,504 | | | | 249,780 | |
Net unrealized gain (loss) on investments and foreign currency translation | | | (1,077,812 | ) | | | 577,585 | |
Change in net assets from operations | | | $(664,490 | ) | | | $901,655 | |
| Distributions declared to shareholders | | | | | | | | |
From net investment income | | | $(50,007 | ) | | | $(68,001 | ) |
From net realized gain on investments | | | (409,274 | ) | | | (810,506 | ) |
Total distributions declared to shareholders | | | $(459,281 | ) | | | $(878,507 | ) |
Change in net assets from fund share transactions | | | $(769,074 | ) | | | $3,114,847 | |
Total change in net assets | | | $(1,892,845 | ) | | | $3,137,995 | |
| Net assets | | | | | | | | |
At beginning of period | | | 13,750,166 | | | | 10,612,171 | |
At end of period (including undistributed net investment income of $100,537 and $49,248, respectively) | | | $11,857,321 | | | | $13,750,166 | |
See Notes to Financial Statements
16
Financial Statements
FINANCIAL HIGHLIGHTS
The financial highlights table is intended to help you understand the fund’s financial performance for the past 5 years (or life of a particular share class, if shorter). Certain information reflects financial results for a single fund share. The total returns in the table represent the rate by which an investor would have earned (or lost) on an investment in the fund share class (assuming reinvestment of all distributions) held for the entire period.
| | | | | | | | | | | | | | | | |
| | | Years ended 8/31 | | | Period
ended 8/31/12 (c) | |
| Class A | | 2015 | | | 2014 | | | 2013 | | |
Net asset value, beginning of period | | | $14.04 | | | | $13.95 | | | | $12.16 | | | | $10.00 | |
| Income (loss) from investment operations | | | | | |
Net investment income (d) | | | $0.10 | | | | $0.09 | | | | $0.07 | | | | $0.20 | |
Net realized and unrealized gain (loss) on investments
and foreign currency | | | (0.80 | ) | | | 1.04 | | | | 1.91 | | | | 1.96 | |
Total from investment operations | | | $(0.70 | ) | | | $1.13 | | | | $1.98 | | | | $2.16 | |
| Less distributions declared to shareholders | | | | | |
From net investment income | | | $(0.05 | ) | | | $(0.08 | ) | | | $(0.06 | ) | | | $— | |
From net realized gain on investments | | | (0.43 | ) | | | (0.96 | ) | | | (0.13 | ) | | | — | |
Total distributions declared to shareholders | | | $(0.48 | ) | | | $(1.04 | ) | | | $(0.19 | ) | | | $— | |
Net asset value, end of period (x) | | | $12.86 | | | | $14.04 | | | | $13.95 | | | | $12.16 | |
Total return (%) (r)(s)(t)(x) | | | (5.09 | ) | | | 8.30 | | | | 16.39 | | | | 21.60 | (n) |
Ratios (%) (to average net assets)
and Supplemental data: | |
Expenses before expense reductions (f) | | | 2.52 | | | | 2.48 | | | | 2.89 | | | | 6.60 | (a) |
Expenses after expense reductions (f) | | | 1.45 | | | | 1.45 | | | | 1.45 | | | | 1.45 | (a) |
Net investment income | | | 0.71 | | | | 0.64 | | | | 0.55 | (l) | | | 1.83 | (a)(l) |
Portfolio turnover | | | 21 | | | | 17 | | | | 82 | | | | 19 | (n) |
Net assets at end of period (000 omitted) | | | $6,774 | | | | $8,639 | | | | $6,632 | | | | $8,331 | |
See Notes to Financial Statements
17
Financial Highlights – continued
| | | | | | | | | | | | | | | | |
| | | Years ended 8/31 | | | Period
ended
8/31/12 (c) | |
| Class B | | 2015 | | | 2014 | | | 2013 | | |
Net asset value, beginning of period | | | $13.82 | | | | $13.81 | | | | $12.07 | | | | $10.00 | |
| Income (loss) from investment operations | | | | | |
Net investment income (loss) (d) | | | $(0.01 | ) | | | $(0.02 | ) | | | $0.01 | | | | $(0.01 | ) |
Net realized and unrealized gain (loss) on investments
and foreign currency | | | (0.77 | ) | | | 1.03 | | | | 1.86 | | | | 2.08 | |
Total from investment operations | | | $(0.78 | ) | | | $1.01 | | | | $1.87 | | | | $2.07 | |
| Less distributions declared to shareholders | | | | | |
From net investment income | | | $— | | | | $(0.04 | ) | | | $— | | | | $— | |
From net realized gain on investments | | | (0.43 | ) | | | (0.96 | ) | | | (0.13 | ) | | | — | |
Total distributions declared to shareholders | | | $(0.43 | ) | | | $(1.00 | ) | | | $(0.13 | ) | | | $— | |
Net asset value, end of period (x) | | | $12.61 | | | | $13.82 | | | | $13.81 | | | | $12.07 | |
Total return (%) (r)(s)(t)(x) | | | (5.78 | ) | | | 7.48 | | | | 15.55 | | | | 20.70 | (n) |
Ratios (%) (to average net assets)
and Supplemental data: | |
Expenses before expense reductions (f) | | | 3.27 | | | | 3.23 | | | | 3.96 | | | | 5.96 | (a) |
Expenses after expense reductions (f) | | | 2.20 | | | | 2.20 | | | | 2.21 | | | | 2.20 | (a) |
Net investment income (loss) | | | (0.04 | ) | | | (0.12 | ) | | | 0.09 | | | | (0.10 | )(a) |
Portfolio turnover | | | 21 | | | | 17 | | | | 82 | | | | 19 | (n) |
Net assets at end of period (000 omitted) | | | $531 | | | | $486 | | | | $364 | | | | $131 | |
| | |
| | | Years ended 8/31 | | | Period
ended 8/31/12 (c) | |
| Class C | | 2015 | | | 2014 | | | 2013 | | |
Net asset value, beginning of period | | | $13.82 | | | | $13.81 | | | | $12.07 | | | | $10.00 | |
| Income (loss) from investment operations | | | | | |
Net investment income (loss) (d) | | | $(0.00 | )(w) | | | $(0.01 | ) | | | $0.02 | | | | $(0.01 | ) |
Net realized and unrealized gain (loss) on investments
and foreign currency | | | (0.78 | ) | | | 1.02 | | | | 1.85 | | | | 2.08 | |
Total from investment operations | | | $(0.78 | ) | | | $1.01 | | | | $1.87 | | | | $2.07 | |
| Less distributions declared to shareholders | | | | | |
From net investment income | | | $— | | | | $(0.04 | ) | | | $(0.00 | )(w) | | | $— | |
From net realized gain on investments | | | (0.43 | ) | | | (0.96 | ) | | | (0.13 | ) | | | — | |
Total distributions declared to shareholders | | | $(0.43 | ) | | | $(1.00 | ) | | | $(0.13 | ) | | | $— | |
Net asset value, end of period (x) | | | $12.61 | | | | $13.82 | | | | $13.81 | | | | $12.07 | |
Total return (%) (r)(s)(t)(x) | | | (5.78 | ) | | | 7.50 | | | | 15.57 | | | | 20.70 | (n) |
Ratios (%) (to average net assets)
and Supplemental data: | |
Expenses before expense reductions (f) | | | 3.27 | | | | 3.22 | | | | 4.02 | | | | 5.96 | (a) |
Expenses after expense reductions (f) | | | 2.20 | | | | 2.20 | | | | 2.21 | | | | 2.20 | (a) |
Net investment income (loss) | | | (0.03 | ) | | | (0.08 | ) | | | 0.16 | | | | (0.07 | )(a) |
Portfolio turnover | | | 21 | | | | 17 | | | | 82 | | | | 19 | (n) |
Net assets at end of period (000 omitted) | | | $1,779 | | | | $1,712 | | | | $927 | | | | $133 | |
See Notes to Financial Statements
18
Financial Highlights – continued
| | | | | | | | | | | | | | | | |
| | | Years ended 8/31 | | | Period
ended 8/31/12 (c) | |
| Class I | | 2015 | | | 2014 | | | 2013 | | |
Net asset value, beginning of period | | | $14.11 | | | | $14.00 | | | | $12.18 | | | | $10.00 | |
| Income (loss) from investment operations | | | | | |
Net investment income (d) | | | $0.13 | | | | $0.12 | | | | $0.14 | | | | $0.09 | |
Net realized and unrealized gain (loss) on investments
and foreign currency | | | (0.79 | ) | | | 1.05 | | | | 1.88 | | | | 2.09 | |
Total from investment operations | | | $(0.66 | ) | | | $1.17 | | | | $2.02 | | | | $2.18 | |
| Less distributions declared to shareholders | | | | | |
From net investment income | | | $(0.09 | ) | | | $(0.10 | ) | | | $(0.07 | ) | | | $— | |
From net realized gain on investments | | | (0.43 | ) | | | (0.96 | ) | | | (0.13 | ) | | | — | |
Total distributions declared to shareholders | | | $(0.52 | ) | | | $(1.06 | ) | | | $(0.20 | ) | | | $— | |
Net asset value, end of period (x) | | | $12.93 | | | | $14.11 | | | | $14.00 | | | | $12.18 | |
Total return (%) (r)(s)(x) | | | (4.80 | ) | | | 8.57 | | | | 16.72 | | | | 21.80 | (n) |
Ratios (%) (to average net assets)
and Supplemental data: | |
Expenses before expense reductions (f) | | | 2.27 | | | | 2.24 | | | | 2.86 | | | | 4.94 | (a) |
Expenses after expense reductions (f) | | | 1.20 | | | | 1.20 | | | | 1.21 | | | | 1.20 | (a) |
Net investment income | | | 0.96 | | | | 0.85 | | | | 1.03 | | | | 0.90 | (a) |
Portfolio turnover | | | 21 | | | | 17 | | | | 82 | | | | 19 | (n) |
Net assets at end of period (000 omitted) | | | $2,774 | | | | $2,913 | | | | $2,690 | | | | $2,193 | |
| (c) | For the period from the commencement of the fund’s investment operations, September 28, 2011, through the stated period end. |
| (d) | Per share data is based on average shares outstanding. |
| (f) | Ratios do not reflect reductions from fees paid indirectly, if applicable. |
| (l) | The net investment income ratio does not vary by the class specific expense differential because of the timing of sales of fund shares and the allocation of fund level income at such time. |
| (r) | Certain expenses have been reduced without which performance would have been lower. |
| (s) | From time to time the fund may receive proceeds from litigation settlements, without which performance would be lower. |
| (t) | Total returns do not include any applicable sales charges. |
| (w) | Per share amount was less than $0.01. |
| (x) | The net asset values and total returns have been calculated on net assets which include adjustments made in accordance with U.S. generally accepted accounting principles required at period end for financial reporting purposes. |
See Notes to Financial Statements
19
NOTES TO FINANCIAL STATEMENTS
(1) Business and Organization
MFS Global Leaders Fund (the fund) is a diversified series of MFS Series Trust I (the trust). Prior to September 29, 2014, the fund was a non-diversified series of the trust. The trust is organized as a Massachusetts business trust and is registered under the Investment Company Act of 1940, as amended, as an open-end management investment company.
The fund is an investment company and accordingly follows the investment company accounting and reporting guidance of the Financial Accounting Standards Board (FASB) Accounting Standards Codification Topic 946 Financial Services – Investment Companies.
(2) Significant Accounting Policies
General – The preparation of financial statements in conformity with U.S. generally accepted accounting principles requires management to make estimates and assumptions that affect the reported amounts of assets and liabilities, and disclosure of contingent assets and liabilities at the date of the financial statements and the reported amounts of increases and decreases in net assets from operations during the reporting period. Actual results could differ from those estimates. In the preparation of these financial statements, management has evaluated subsequent events occurring after the date of the fund’s Statement of Assets and Liabilities through the date that the financial statements were issued. The fund invests in foreign securities. Investments in foreign securities are vulnerable to the effects of changes in the relative values of the local currency and the U.S. dollar and to the effects of changes in each country’s legal, political, and economic environment.
In June 2014, FASB issued Accounting Standards Update 2014-11, Transfers and Servicing (Topic 860) – Repurchase-to-Maturity Transactions, Repurchase Financings, and Disclosures (“ASU 2014-11”). ASU 2014-11 changes the accounting for repurchase-to-maturity transactions (i.e., repurchase agreements that settle at the same time as the maturity of the transferred financial asset) and enhances the required disclosures for repurchase agreements and other similar transactions. Although still evaluating the potential impacts of ASU 2014-11 to the fund, management expects that the impact of the fund’s adoption will be limited to additional financial statement disclosures which would first be effective for interim reporting periods beginning after March 15, 2015.
Balance Sheet Offsetting – The fund’s accounting policy with respect to balance sheet offsetting is that, absent an event of default by the counterparty or a termination of the agreement, the International Swaps and Derivatives Association (ISDA) Master Agreement does not result in an offset of reported amounts of financial assets and financial liabilities in the Statement of Assets and Liabilities across transactions between the fund and the applicable counterparty. The fund’s right to setoff may be restricted or prohibited by the bankruptcy or insolvency laws of the particular jurisdiction to which a specific master netting agreement counterparty is subject. Balance sheet offsetting disclosures, to the extent applicable to the fund, have been included in the fund’s Significant Accounting Policies note under the captions for each of the fund’s in-scope financial instruments and transactions.
20
Notes to Financial Statements – continued
Investment Valuations – Equity securities, including restricted equity securities, are generally valued at the last sale or official closing price as provided by a third-party pricing service on the market or exchange on which they are primarily traded. Equity securities, for which there were no sales reported that day, are generally valued at the last quoted daily bid quotation as provided by a third-party pricing service on the market or exchange on which such securities are primarily traded. Short-term instruments with a maturity at issuance of 60 days or less may be valued at amortized cost, which approximates market value. Open-end investment companies are generally valued at net asset value per share. Securities and other assets generally valued on the basis of information from a third-party pricing service may also be valued at a broker/dealer bid quotation. Values obtained from third-party pricing services can utilize both transaction data and market information such as yield, quality, coupon rate, maturity, type of issue, trading characteristics, and other market data. The values of foreign securities and other assets and liabilities expressed in foreign currencies are converted to U.S. dollars using the mean of bid and asked prices for rates provided by a third-party pricing service.
The Board of Trustees has delegated primary responsibility for determining or causing to be determined the value of the fund’s investments (including any fair valuation) to the adviser pursuant to valuation policies and procedures approved by the Board. If the adviser determines that reliable market quotations are not readily available, investments are valued at fair value as determined in good faith by the adviser in accordance with such procedures under the oversight of the Board of Trustees. Under the fund’s valuation policies and procedures, market quotations are not considered to be readily available for most types of debt instruments and floating rate loans and many types of derivatives. These investments are generally valued at fair value based on information from third-party pricing services. In addition, investments may be valued at fair value if the adviser determines that an investment’s value has been materially affected by events occurring after the close of the exchange or market on which the investment is principally traded (such as foreign exchange or market) and prior to the determination of the fund’s net asset value, or after the halting of trading of a specific security where trading does not resume prior to the close of the exchange or market on which the security is principally traded. Events that occur on a frequent basis after foreign markets close (such as developments in foreign markets and significant movements in the U.S. markets) and prior to the determination of the fund’s net asset value may be deemed to have a material effect on the value of securities traded in foreign markets. Accordingly, the fund’s foreign equity securities may often be valued at fair value. The adviser generally relies on third-party pricing services or other information (such as the correlation with price movements of similar securities in the same or other markets; the type, cost and investment characteristics of the security; the business and financial condition of the issuer; and trading and other market data) to assist in determining whether to fair value and at what value to fair value an investment. The value of an investment for purposes of calculating the fund’s net asset value can differ depending on the source and method used to determine value. When fair valuation is used, the value of an investment used to determine the fund’s net asset value may differ from quoted or published prices for the same investment. There can be no assurance that
21
Notes to Financial Statements – continued
the fund could obtain the fair value assigned to an investment if it were to sell the investment at the same time at which the fund determines its net asset value per share.
Various inputs are used in determining the value of the fund’s assets or liabilities. These inputs are categorized into three broad levels. In certain cases, the inputs used to measure fair value may fall into different levels of the fair value hierarchy. In such cases, an investment’s level within the fair value hierarchy is based on the lowest level of input that is significant to the fair value measurement. The fund’s assessment of the significance of a particular input to the fair value measurement in its entirety requires judgment, and considers factors specific to the investment. Level 1 includes unadjusted quoted prices in active markets for identical assets or liabilities. Level 2 includes other significant observable market-based inputs (including quoted prices for similar securities, interest rates, prepayment speed, and credit risk). Level 3 includes unobservable inputs, which may include the adviser’s own assumptions in determining the fair value of investments. The following is a summary of the levels used as of August 31, 2015 in valuing the fund’s assets or liabilities:
| | | | | | | | | | | | | | | | |
| Investments at Value | | Level 1 | | | Level 2 | | | Level 3 | | | Total | |
| Equity Securities: | | | | | | | | | | | | | | | | |
United States | | | $4,784,704 | | | | $— | | | | $— | | | | $4,784,704 | |
France | | | 2,047,450 | | | | — | | | | — | | | | 2,047,450 | |
United Kingdom | | | 303,935 | | | | 1,177,703 | | | | — | | | | 1,481,638 | |
Switzerland | | | 621,669 | | | | — | | | | — | | | | 621,669 | |
Japan | | | 582,108 | | | | — | | | | — | | | | 582,108 | |
Germany | | | 333,156 | | | | — | | | | — | | | | 333,156 | |
Brazil | | | 318,757 | | | | — | | | | — | | | | 318,757 | |
China | | | 291,195 | | | | — | | | | — | | | | 291,195 | |
Netherlands | | | 233,663 | | | | — | | | | — | | | | 233,663 | |
Other Countries | | | 761,089 | | | | — | | | | — | | | | 761,089 | |
| Mutual Funds | | | 380,016 | | | | — | | | | — | | | | 380,016 | |
| Total Investments | | | $10,657,742 | | | | $1,177,703 | | | | $— | | | | $11,835,445 | |
For further information regarding security characteristics, see the Portfolio of Investments.
Of the level 2 investments presented above, equity investments amounting to $1,177,703 would have been considered level 1 investments at the beginning of the period. The primary reason for changes in the classifications between levels 1 and 2 occurs when foreign equity securities are fair valued using other observable market-based inputs in place of the closing exchange price due to events occurring after the close of the exchange or market on which the investment is principally traded. The fund’s foreign equity securities may often be valued at fair value. The fund’s policy is to recognize transfers between the levels as of the end of the period.
Foreign Currency Translation – Purchases and sales of foreign investments, income, and expenses are converted into U.S. dollars based upon currency exchange rates prevailing on the respective dates of such transactions or on the reporting date for foreign denominated receivables and payables. Gains and losses attributable to foreign currency exchange rates on sales of securities are recorded for financial statement purposes as net realized gains and losses on investments. Gains and losses attributable
22
Notes to Financial Statements – continued
to foreign exchange rate movements on receivables, payables, income and expenses are recorded for financial statement purposes as foreign currency transaction gains and losses. That portion of both realized and unrealized gains and losses on investments that results from fluctuations in foreign currency exchange rates is not separately disclosed.
Indemnifications – Under the fund’s organizational documents, its officers and Trustees may be indemnified against certain liabilities and expenses arising out of the performance of their duties to the fund. Additionally, in the normal course of business, the fund enters into agreements with service providers that may contain indemnification clauses. The fund’s maximum exposure under these agreements is unknown as this would involve future claims that may be made against the fund that have not yet occurred.
Investment Transactions and Income – Investment transactions are recorded on the trade date. Dividends received in cash are recorded on the ex-dividend date. Certain dividends from foreign securities will be recorded when the fund is informed of the dividend if such information is obtained subsequent to the ex-dividend date. Dividend payments received in additional securities are recorded on the ex-dividend date in an amount equal to the value of the security on such date.
The fund may receive proceeds from litigation settlements. Any proceeds received from litigation involving portfolio holdings are reflected in the Statement of Operations in realized gain/loss if the security has been disposed of by the fund or in unrealized gain/loss if the security is still held by the fund. Any other proceeds from litigation not related to portfolio holdings are reflected as other income in the Statement of Operations.
Fees Paid Indirectly – The fund’s custody fee may be reduced by a credit earned under an arrangement that measures the value of U.S. dollars deposited with the custodian by the fund. The amount of the credit, for the year ended August 31, 2015, is shown as a reduction of total expenses in the Statement of Operations.
Tax Matters and Distributions – The fund intends to qualify as a regulated investment company, as defined under Subchapter M of the Internal Revenue Code, and to distribute all of its taxable income, including realized capital gains. As a result, no provision for federal income tax is required. The fund’s federal tax returns, when filed, will remain subject to examination by the Internal Revenue Service for a three year period. Management has analyzed the fund’s tax positions taken on federal and state tax returns for all open tax years and does not believe that there are any uncertain tax positions that require recognition of a tax liability. Foreign taxes, if any, have been accrued by the fund in the accompanying financial statements in accordance with the applicable foreign tax law. Foreign income taxes may be withheld by certain countries in which the fund invests. Additionally, capital gains realized by the fund on securities issued in or by certain foreign countries may be subject to capital gains tax imposed by those countries.
Distributions to shareholders are recorded on the ex-dividend date. Income and capital gain distributions are determined in accordance with income tax regulations, which may differ from U.S. generally accepted accounting principles. Certain capital accounts in the financial statements are periodically adjusted for permanent differences in order
23
Notes to Financial Statements – continued
to reflect their tax character. These adjustments have no impact on net assets or net asset value per share. Temporary differences which arise from recognizing certain items of income, expense, gain or loss in different periods for financial statement and tax purposes will reverse at some time in the future. Distributions in excess of net investment income or net realized gains are temporary overdistributions for financial statement purposes resulting from differences in the recognition or classification of income or distributions for financial statement and tax purposes.
Book/tax differences primarily relate to passive foreign investment companies, wash sale loss deferrals, and treating a portion of the proceeds from redemptions as a distribution for tax purposes.
The tax character of distributions declared to shareholders for the last two fiscal years is as follows:
| | | | | | | | |
| | | 8/31/15 | | | 8/31/14 | |
| Ordinary income (including any short-term capital gains) | | | $139,272 | | | | $795,002 | |
| Long-term capital gains | | | 320,009 | | | | 83,505 | |
| Total distributions | | | $459,281 | | | | $878,507 | |
The federal tax cost and the tax basis components of distributable earnings were as follows:
| | | | |
| As of 8/31/15 | | | |
| Cost of investments | | | $11,273,976 | |
| Gross appreciation | | | 1,407,181 | |
| Gross depreciation | | | (845,712 | ) |
| Net unrealized appreciation (depreciation) | | | $561,469 | |
| Undistributed ordinary income | | | 160,719 | |
| Undistributed long-term capital gain | | | 96,108 | |
| Other temporary differences | | | (1,242 | ) |
Multiple Classes of Shares of Beneficial Interest – The fund offers multiple classes of shares, which differ in their respective distribution and service fees. The fund’s income, realized and unrealized gain (loss), and common expenses are allocated to shareholders based on the daily net assets of each class. Dividends are declared separately for each class. Differences in per share dividend rates are generally due to differences in separate class expenses. Class B shares will convert to Class A shares
24
Notes to Financial Statements – continued
approximately eight years after purchase. The fund’s distributions declared to shareholders as reported in the Statements of Changes in Net Assets are presented by class as follows:
| | | | | | | | | | | | | | | | |
| | | From net investment
income | | | From net realized gain on
investments | |
| | | Year
ended
8/31/15 | | | Year
ended
8/31/14 | | | Year
ended
8/31/15 | | | Year
ended
8/31/14 | |
| Class A | | | $31,148 | | | | $43,141 | | | | $247,860 | | | | $505,890 | |
| Class B | | | — | | | | 1,474 | | | | 15,312 | | | | 32,256 | |
| Class C | | | — | | | | 4,066 | | | | 56,700 | | | | 87,699 | |
| Class I | | | 18,859 | | | | 19,320 | | | | 89,402 | | | | 184,661 | |
| Total | | | $50,007 | | | | $68,001 | | | | $409,274 | | | | $810,506 | |
(3) Transactions with Affiliates
Investment Adviser – The fund has an investment advisory agreement with MFS to provide overall investment management and related administrative services and facilities to the fund. The management fee is computed daily and paid monthly at the following annual rates:
| | | | |
| First $1 billion of average daily net assets | | | 0.90 | % |
| Next $1.5 billion of average daily net assets | | | 0.75 | % |
| Average daily net assets in excess of $2.5 billion | | | 0.65 | % |
MFS has agreed in writing to reduce its management fee by a specified amount if certain MFS mutual fund assets exceed thresholds agreed to by MFS and the fund’s Board of Trustees. For the year ended August 31, 2015, this management fee reduction amounted to $853, which is included in the reduction of total expenses in the Statement of Operations. The management fee incurred for the year ended August 31, 2015 was equivalent to an annual effective rate of 0.89% of the fund’s average daily net assets.
The investment adviser has agreed in writing to pay a portion of the fund’s total annual operating expenses, excluding interest, taxes, extraordinary expenses, brokerage and transaction costs, and investment-related expenses, such that total fund operating expenses do not exceed the following rates annually of each class’s average daily net assets:
| | | | | | | | | | | | | | |
| Class A | | | Class B | | | Class C | | | Class I | |
| | 1.45% | | | | 2.20 | % | | | 2.20 | % | | | 1.20 | % |
This written agreement will continue until modified by the fund’s Board of Trustees, but such agreement will continue at least until December 31, 2016. For the year ended August 31, 2015, this reduction amounted to $140,881, which is included in the reduction of total expenses in the Statement of Operations.
Distributor – MFS Fund Distributors, Inc. (MFD), a wholly-owned subsidiary of MFS, as distributor, received $7,459 for the year ended August 31, 2015, as its portion of the initial sales charge on sales of Class A shares of the fund, respectively.
The Board of Trustees has adopted a distribution plan for certain share classes pursuant to Rule 12b-1 of the Investment Company Act of 1940.
25
Notes to Financial Statements – continued
The fund’s distribution plan provides that the fund will pay MFD for services provided by MFD and financial intermediaries in connection with the distribution and servicing of certain share classes. One component of the plan is a distribution fee paid to MFD and another component of the plan is a service fee paid to MFD. MFD may subsequently pay all, or a portion, of the distribution and/or service fees to financial intermediaries.
Distribution Plan Fee Table:
| | | | | | | | | | | | | | | | | | | | |
| | | Distribution
Fee Rate (d) | | | Service
Fee Rate (d) | | | Total
Distribution
Plan (d) | | | Annual
Effective
Rate (e) | | | Distribution
and Service
Fee | |
| Class A | | | — | | | | 0.25% | | | | 0.25% | | | | 0.25% | | | | $19,882 | |
| Class B | | | 0.75% | | | | 0.25% | | | | 1.00% | | | | 1.00% | | | | 5,041 | |
| Class C | | | 0.75% | | | | 0.25% | | | | 1.00% | | | | 1.00% | | | | 18,139 | |
| Total Distribution and Service Fees | | | | $43,062 | |
| (d) | In accordance with the distribution plan for certain classes, the fund pays distribution and/or service fees equal to these annual percentage rates of each class’s average daily net assets. The distribution and service fee rates disclosed by class represent the current rates in effect at the end of the reporting period. Any rate changes, if applicable, are detailed below. |
| (e) | The annual effective rates represent actual fees incurred under the distribution plan for the year ended August 31, 2015 based on each class’s average daily net assets. MFD has voluntarily agreed to rebate a portion of each class’s 0.25% service fee attributable to accounts for which MFD retains the 0.25% service fee except for accounts attributable to MFS or its affiliates’ seed money. For the year ended August 31, 2015, this rebate amounted to $21 for Class A and is included in the reduction of total expenses in the Statement of Operations. |
Certain Class A shares are subject to a contingent deferred sales charge (CDSC) in the event of a shareholder redemption within 18 months of purchase. Class C shares are subject to a CDSC in the event of a shareholder redemption within 12 months of purchase. Class B shares are subject to a CDSC in the event of a shareholder redemption within six years of purchase. All contingent deferred sales charges are paid to MFD and during the year ended August 31, 2015, were as follows:
| | | | |
| | | Amount | |
| Class A | | | $— | |
| Class B | | | 79 | |
| Class C | | | 280 | |
Shareholder Servicing Agent – MFS Service Center, Inc. (MFSC), a wholly-owned subsidiary of MFS, receives a fee from the fund for its services as shareholder servicing agent calculated as a percentage of the average daily net assets of the fund as determined periodically under the supervision of the fund’s Board of Trustees. For the year ended August 31, 2015, the fee was $3,332, which equated to 0.0252% annually of the fund’s average daily net assets. MFSC also receives payment from the fund for out-of-pocket expenses, sub-accounting and other shareholder servicing costs which may be paid to affiliated and unaffiliated service providers. For the year ended August 31, 2015, these out-of-pocket expenses, sub-accounting and other shareholder servicing costs amounted to $14,319.
Administrator – MFS provides certain financial, legal, shareholder communications, compliance, and other administrative services to the fund. Under an administrative
26
Notes to Financial Statements – continued
services agreement, the fund reimburses MFS the costs incurred to provide these services. The fund is charged an annual fixed amount of $17,500 plus a fee based on average daily net assets. The administrative services fee incurred for the year ended August 31, 2015 was equivalent to an annual effective rate of 0.1325% of the fund’s average daily net assets.
Trustees’ and Officers’ Compensation – The fund pays compensation to independent Trustees in the form of a retainer, attendance fees, and additional compensation to Board and Committee chairpersons. The fund does not pay compensation directly to Trustees or officers of the fund who are also officers of the investment adviser, all of whom receive remuneration for their services to the fund from MFS. Certain officers and Trustees of the fund are officers or directors of MFS, MFD, and MFSC.
Other – Effective November 1, 2014, this fund and certain other funds managed by MFS (the funds) have entered into a service agreement (the ISO Agreement) which provides for payment of fees solely by the funds to Tarantino LLC in return for the provision of services of an Independent Senior Officer (ISO) for the funds. Frank L. Tarantino serves as the ISO and is an officer of the funds and the sole member of Tarantino LLC. The funds can terminate the ISO Agreement with Tarantino LLC at any time under the terms of the ISO Agreement. Prior to November 1, 2014, the funds had entered into a service agreement (the Compliance Officer Agreement) which provided for payment of fees by the funds to Tarantino LLC in return for the provision of services of an Independent Chief Compliance Officer (ICCO) for the funds. Prior to November 1, 2014, Frank L. Tarantino served as the ICCO. Effective October 31, 2014, Mr. Tarantino resigned as ICCO and the Compliance Officer Agreement between the funds and Tarantino LLC was terminated. For the year ended August 31, 2015, the aggregate fees paid by the fund under these agreements were $51 and are included in “Miscellaneous” expense in the Statement of Operations. MFS had agreed to reimburse the fund for a portion of the payments made by the fund for the services under the Compliance Officer Agreement in the amount of $4, which is included in the reduction of total expenses in the Statement of Operations. Additionally, MFS has agreed to bear all expenses associated with office space, other administrative support, and supplies provided to the ICCO and ISO.
The fund invests in the MFS Institutional Money Market Portfolio which is managed by MFS and seeks current income consistent with preservation of capital and liquidity. Income earned on this investment is included in “Dividends from underlying affiliated funds” in the Statement of Operations. This money market fund does not pay a management fee to MFS.
On September 11, 2013, MFS redeemed 10,143 shares of Class A for an aggregate amount of $147,378. At August 31, 2015, MFS held approximately 95% of the outstanding shares of Class I.
(4) Portfolio Securities
For the year ended August 31, 2015, purchases and sales of investments, other than short-term obligations, aggregated $2,691,654 and $3,742,169, respectively.
27
Notes to Financial Statements – continued
(5) Shares of Beneficial Interest
The fund’s Declaration of Trust permits the Trustees to issue an unlimited number of full and fractional shares of beneficial interest. Transactions in fund shares were as follows:
| | | | | | | | | | | | | | | | |
| | | Year ended
8/31/15 | | | Year ended
8/31/14 | |
| | | Shares | | | Amount | | | Shares | | | Amount | |
| Shares sold | | | | | | | | | | | | | | | | |
Class A | | | 162,707 | | | | $2,248,915 | | | | 255,307 | | | | $3,612,305 | |
Class B | | | 8,494 | | | | 116,775 | | | | 11,692 | | | | 169,040 | |
Class C | | | 26,232 | | | | 356,421 | | | | 70,847 | | | | 990,306 | |
Class I | | | 2,211 | | | | 30,667 | | | | 1,341 | | | | 19,082 | |
| | | 199,644 | | | | $2,752,778 | | | | 339,187 | | | | $4,790,733 | |
| | | | |
| Shares issued to shareholders in reinvestment of distributions | | | | | | | | | | | | | | | | |
Class A | | | 20,283 | | | | $274,026 | | | | 39,229 | | | | $537,433 | |
Class B | | | 1,115 | | | | 14,846 | | | | 2,406 | | | | 32,621 | |
Class C | | | 4,136 | | | | 55,051 | | | | 6,502 | | | | 88,100 | |
Class I | | | 7,990 | | | | 108,261 | | | | 14,846 | | | | 203,981 | |
| | | 33,524 | | | | $452,184 | | | | 62,983 | | | | $862,135 | |
| | | | |
| Shares reacquired | | | | | | | | | | | | | | | | |
Class A | | | (271,539 | ) | | | $(3,733,850 | ) | | | (154,628 | ) | | | $(2,164,259 | ) |
Class B | | | (2,695 | ) | | | (36,785 | ) | | | (5,284 | ) | | | (74,272 | ) |
Class C | | | (13,176 | ) | | | (174,994 | ) | | | (20,627 | ) | | | (273,867 | ) |
Class I | | | (2,045 | ) | | | (28,407 | ) | | | (1,869 | ) | | | (25,623 | ) |
| | | (289,455 | ) | | | $(3,974,036 | ) | | | (182,408 | ) | | | $(2,538,021 | ) |
| | | | |
| Net change | | | | | | | | | | | | | | | | |
Class A | | | (88,549 | ) | | | $(1,210,909 | ) | | | 139,908 | | | | $1,985,479 | |
Class B | | | 6,914 | | | | 94,836 | | | | 8,814 | | | | 127,389 | |
Class C | | | 17,192 | | | | 236,478 | | | | 56,722 | | | | 804,539 | |
Class I | | | 8,156 | | | | 110,521 | | | | 14,318 | | | | 197,440 | |
| | | (56,287 | ) | | | $(769,074 | ) | | | 219,762 | | | | $3,114,847 | |
(6) Line of Credit
The fund and certain other funds managed by MFS participate in a $1.25 billion unsecured committed line of credit, subject to a $1 billion sublimit, provided by a syndication of banks under a credit agreement. Borrowings may be made for temporary financing needs. Interest is charged to each fund, based on its borrowings, generally at a rate equal to the higher of the Overnight Federal Reserve funds rate or daily one month LIBOR plus an agreed upon spread. A commitment fee, based on the average daily, unused portion of the committed line of credit, is allocated among the participating funds at the end of each calendar quarter. In addition, the fund and other funds managed by MFS have established unsecured uncommitted borrowing arrangements with certain banks for temporary financing needs. Interest is charged to
28
Notes to Financial Statements – continued
each fund, based on its borrowings, at a rate equal to the Overnight Federal Reserve funds rate plus an agreed upon spread. For the year ended August 31, 2015, the fund’s commitment fee and interest expense were $47 and $0, respectively, and are included in “Miscellaneous” expense in the Statement of Operations.
(7) Transactions in Underlying Affiliated Funds-Affiliated Issuers
An affiliated issuer may be considered one in which the fund owns 5% or more of the outstanding voting securities, or a company which is under common control. For the purposes of this report, the fund assumes the following to be an affiliated issuer:
| | | | | | | | | | | | | | | | |
| Underlying Affiliated Fund | | Beginning
Shares/Par
Amount | | | Acquisitions
Shares/Par
Amount | | | Dispositions
Shares/Par
Amount | | | Ending
Shares/Par
Amount | |
MFS Institutional Money
Market Portfolio | | | 541,652 | | | | 3,402,321 | | | | (3,563,957 | ) | | | 380,016 | |
| | | | |
| Underlying Affiliated Fund | | Realized
Gain (Loss) | | | Capital Gain
Distributions | | | Dividend
Income | | | Ending
Value | |
MFS Institutional Money
Market Portfolio | | | $— | | | | $— | | | | $304 | | | | $380,016 | |
(8) Subsequent Event
On September 10, 2015, the Board of Trustees approved the liquidation of the fund on or about November 18, 2015. Effective on October 1, 2015, the fund will be closed to all purchases except by existing investors and distribution reinvestment or other automatic plans. After the close of business on November 16, 2015, the fund will cease accepting any purchases and/or contributions.
29
REPORT OF INDEPENDENT REGISTERED PUBLIC ACCOUNTING FIRM
To the Board of Trustees of MFS Series Trust I and the Shareholders of MFS Global Leaders Fund:
We have audited the accompanying statement of assets and liabilities, including the portfolio of investments, of MFS Global Leaders Fund (one of the series of MFS Series Trust I) (the “Fund”) as of August 31, 2015, and the related statement of operations for the year then ended, the statements of changes in net assets for each of the two years in the period then ended, and the financial highlights for each of the periods presented. These financial statements and financial highlights are the responsibility of the Fund’s management. Our responsibility is to express an opinion on these financial statements and financial highlights based on our audits.
We conducted our audits in accordance with the standards of the Public Company Accounting Oversight Board (United States). Those standards require that we plan and perform the audit to obtain reasonable assurance about whether the financial statements and financial highlights are free of material misstatement. The Fund is not required to have, nor were we engaged to perform, an audit of its internal control over financial reporting. Our audits included consideration of internal control over financial reporting as a basis for designing audit procedures that are appropriate in the circumstances, but not for the purpose of expressing an opinion on the effectiveness of the Fund’s internal control over financial reporting. Accordingly, we express no such opinion. An audit also includes examining, on a test basis, evidence supporting the amounts and disclosures in the financial statements, assessing the accounting principles used and significant estimates made by management, as well as evaluating the overall financial statement presentation. Our procedures included confirmation of securities owned as of August 31, 2015, by correspondence with the custodian. We believe that our audits provide a reasonable basis for our opinion.
In our opinion, the financial statements and financial highlights referred to above present fairly, in all material respects, the financial position of MFS Global Leaders Fund as of August 31, 2015, the results of its operations for the year then ended, the changes in its net assets for each of the two years in the period then ended, and the financial highlights for each of the periods presented, in conformity with accounting principles generally accepted in the United States of America.
DELOITTE & TOUCHE LLP
Boston, Massachusetts
October 15, 2015
30
TRUSTEES AND OFFICERS — IDENTIFICATION AND BACKGROUND
The Trustees and Officers of the Trust, as of October 1, 2015, are listed below, together with their principal occupations during the past five years. (Their titles may have varied during that period.) The address of each Trustee and Officer is 111 Huntington Avenue, Boston, Massachusetts 02199-7618.
| | | | | | | | |
Name, Age | | Position(s) Held with Fund | | Trustee/Officer
Since (h) | | Principal
Occupations During the Past Five Years | | Other Directorships (j) |
| INTERESTED TRUSTEES |
Robert J. Manning (k) (age 51) | | Trustee | | February 2004 | | Massachusetts Financial Services Company, Chairman, Co-Chief Executive Officer and Director; Chief Investment Officer (until 2010) | | N/A |
Robin A. Stelmach (k) (age 54) | | Trustee and President | | January 2014 | | Massachusetts Financial Services Company, Executive Vice President and Chief Operating Officer | | N/A |
| INDEPENDENT TRUSTEES | | | | | | |
David H. Gunning (age 73) | | Trustee and Chair of Trustees | | January 2004 | | Private investor | | Lincoln Electric Holdings, Inc., Director; Development Alternatives, Inc., Director/Non-Executive Chairman |
Steven E. Buller (age 64) | | Trustee | | February 2014 | | Chairman, Financial Accounting Standards Advisory Council; Standing Advisory Group, Public Company Accounting Oversight Board, Member (until 2014); BlackRock, Inc. (investment management), Managing Director (until 2014), BlackRock Finco UK (investment management), Director (until 2014) | | N/A |
Robert E. Butler (age 73) | | Trustee | | January 2006 | | Consultant – investment company industry regulatory and compliance matters | | N/A |
31
Trustees and Officers – continued
| | | | | | | | |
Name, Age | | Position(s) Held with Fund | | Trustee/Officer
Since (h) | | Principal
Occupations During the Past Five Years | | Other Directorships (j) |
Maureen R. Goldfarb (age 60) | | Trustee | | January 2009 | | Private investor | | N/A |
William R. Gutow (age 74) | | Trustee | | December 1993 | | Private investor and real estate consultant; Capitol Entertainment Management Company (video franchise), Vice Chairman | | Texas Donuts, Vice Chairman (until 2010) |
Michael Hegarty (age 70) | | Trustee | | December 2004 | | Private investor | | Rouse Properties Inc., Director; Capmark Financial Group Inc., Director |
John P. Kavanaugh (age 60) | | Trustee | | January 2009 | | Private investor | | N/A |
Maryanne L. Roepke (age 59) | | Trustee | | May 2014 | | American Century Investments (investment management), Senior Vice President and Chief Compliance Officer (until 2014) | | N/A |
Laurie J. Thomsen (age 58) | | Trustee | | March 2005 | | Private investor; New Profit, Inc. (venture philanthropy), Executive Partner (until 2010) | | The Travelers Companies, Director; Dycom Industries, Inc. |
Robert W. Uek (age 74) | | Trustee | | January 2006 | | Consultant to investment company industry | | N/A |
| OFFICERS | | | | | | |
Christopher R. Bohane (k) (age 41) | | Assistant Secretary and Assistant Clerk | | July 2005 | | Massachusetts Financial Services Company, Vice President and Assistant General Counsel | | N/A |
Kino Clark (k) (age 47) | | Assistant Treasurer | | January 2012 | | Massachusetts Financial Services Company, Vice President | | N/A |
Kristin V. Collins (k) (age 42) | | Assistant Secretary and Assistant Clerk | | September 2015 | | Massachusetts Financial Services Company, Vice President and Assistant General Counsel | | N/A |
32
Trustees and Officers – continued
| | | | | | | | |
Name, Age | | Position(s) Held with Fund | | Trustee/Officer
Since (h) | | Principal
Occupations During the Past Five Years | | Other Directorships (j) |
Thomas H. Connors (k) (age 56) | | Assistant Secretary and Assistant Clerk | | September 2012 | | Massachusetts Financial Services Company, Vice President and Senior Counsel; Deutsche Investment Management Americas Inc. (financial service provider), Director and Senior Counsel (until 2012) | | N/A |
Ethan D. Corey (k) (age 51) | | Assistant Secretary and Assistant Clerk | | July 2005 | | Massachusetts Financial Services Company, Senior Vice President and Associate General Counsel | | N/A |
David L. DiLorenzo (k) (age 47) | | Treasurer | | July 2005 | | Massachusetts Financial Services Company, Senior Vice President | | N/A |
Susan S. Newton (k) (age 65) | | Assistant Secretary and Assistant Clerk | | May 2005 | | Massachusetts Financial Services Company, Senior Vice President and Associate General Counsel | | N/A |
Kenneth Paek (k) (age 41) | | Assistant Treasurer | | February 2015 | | Massachusetts Financial Services Company, Vice President; Cohen & Steers, Vice President/Head of Fund Administration (until 2014) | | N/A |
Susan A. Pereira (k) (age 44) | | Assistant Secretary and Assistant Clerk | | July 2005 | | Massachusetts Financial Services Company, Vice President and Senior Counsel | | N/A |
Kasey L. Phillips (k) (age 44) | | Assistant Treasurer | | September 2012 | | Massachusetts Financial Services Company, Vice President; Wells Fargo Funds Management, LLC, Senior Vice President, Fund Treasurer (until 2012) | | N/A |
33
Trustees and Officers – continued
| | | | | | | | |
Name, Age | | Position(s) Held with Fund | | Trustee/Officer
Since (h) | | Principal
Occupations During the Past Five Years | | Other Directorships (j) |
Mark N. Polebaum (k) (age 63) | | Secretary and Clerk | | January 2006 | | Massachusetts Financial Services Company, Executive Vice President, General Counsel and Secretary | | N/A |
Matthew A. Stowe (k) (age 40) | | Assistant Secretary and Assistant Clerk | | October 2014 | | Massachusetts Financial Services Company, Vice President and Assistant General Counsel | | N/A |
Frank L. Tarantino (age 71) | | Independent Senior Officer | | June 2004 | | Tarantino LLC (provider of compliance services), Principal | | N/A |
Richard S. Weitzel (k) (age 45) | | Assistant Secretary and Assistant Clerk | | October 2007 | | Massachusetts Financial Services Company, Senior Vice President and Associate General Counsel | | N/A |
Martin J. Wolin (k) (age 48) | | Chief Compliance Officer | | July 2015 | | Massachusetts Financial Services Company, Senior Vice President and Chief Compliance Officer (since July 2015); Mercer (financial service provider), Chief Risk and Compliance Officer, North America and Latin America (until June 2015) | | N/A |
James O. Yost (k) (age 55) | | Deputy Treasurer | | September 1990 | | Massachusetts Financial Services Company, Senior Vice President | | N/A |
| (h) | Date first appointed to serve as Trustee/officer of an MFS Fund. Each Trustee has served continuously since appointment unless indicated otherwise. For the period from December 15, 2004 until February 22, 2005, Mr. Manning served as Advisory Trustee. Prior to January 2012, Messrs. DiLorenzo and Yost served as Assistant Treasurers of the Funds. Ms. Stelmach was appointed as President of the Funds as of October 1, 2014. |
| (j) | Directorships or trusteeships of companies required to report to the Securities and Exchange Commission (i.e., “public companies”). |
| (k) | “Interested person” of the Trust within the meaning of the Investment Company Act of 1940 (referred to as the 1940 Act), which is the principal federal law governing investment companies like the fund, as a result of a position with MFS. The address of MFS is 111 Huntington Avenue, Boston, Massachusetts 02199-7618. |
34
Trustees and Officers – continued
Each Trustee (except Ms. Stelmach, Mr. Buller and Ms. Roepke) has been elected by shareholders and each Trustee and officer holds office until his or her successor is chosen and qualified or until his or her earlier death, resignation, retirement or removal. The Trust does not hold annual meetings for the purpose of electing Trustees, and Trustees are not elected for fixed terms. Messrs. Butler, Kavanaugh, Uek and Mses. Thomsen and Roepke are members of the Trust’s Audit Committee.
Each of the Fund’s Trustees and officers holds comparable positions with certain other funds of which MFS or a subsidiary is the investment adviser or distributor, and, in the case of the officers, with certain affiliates of MFS. As of October 1, 2015, the Trustees served as board members of 138 funds within the MFS Family of Funds.
The Statement of Additional Information for a Fund includes further information about the Trustees and is available without charge upon request by calling 1-800-225-2606.
| | |
| Investment Adviser | | Custodian |
Massachusetts Financial Services Company
111 Huntington Avenue
Boston, MA 02199-7618 | | State Street Bank and Trust Company 1 Lincoln Street Boston, MA 02111-2900 |
| Distributor | | Independent Registered Public Accounting Firm |
MFS Fund Distributors, Inc.
111 Huntington Avenue
Boston, MA 02199-7618 | | Deloitte & Touche LLP 200 Berkeley Street Boston, MA 02116 |
| Portfolio Manager | | |
Maile Clark | | |
35
BOARD REVIEW OF INVESTMENT ADVISORY AGREEMENT
The Investment Company Act of 1940 requires that both the full Board of Trustees and a majority of the non-interested (“independent”) Trustees, voting separately, annually approve the continuation of the Fund’s investment advisory agreement with MFS. The Trustees consider matters bearing on the Fund and its advisory arrangements at their meetings throughout the year, including a review of performance data at each regular meeting. In addition, the independent Trustees met several times over the course of three months beginning in May and ending in July, 2015 (“contract review meetings”) for the specific purpose of considering whether to approve the continuation of the investment advisory agreement for the Fund and the other investment companies that the Board oversees (the “MFS Funds”). The independent Trustees were assisted in their evaluation of the Fund’s investment advisory agreement by independent legal counsel, from whom they received separate legal advice and with whom they met separately from MFS during various contract review meetings. The independent Trustees were also assisted in this process by the MFS Funds’ Independent Senior Officer, a senior officer appointed by and reporting to the independent Trustees.
In connection with their deliberations regarding the continuation of the investment advisory agreement, the Trustees, including the independent Trustees, considered such information and factors as they believed, in light of the legal advice furnished to them and their own business judgment, to be relevant. The investment advisory agreement for the Fund was considered separately, although the Trustees also took into account the common interests of all MFS Funds in their review. As described below, the Trustees considered the nature, quality, and extent of the various investment advisory, administrative, and shareholder services performed by MFS under the existing investment advisory agreement and other arrangements with the Fund.
In connection with their contract review meetings, the Trustees received and relied upon materials that included, among other items: (i) information provided by Lipper Inc., an independent third party, on the investment performance of the Fund for various time periods ended December 31, 2014 and the investment performance of a group of funds with substantially similar investment classifications/objectives (the “Lipper performance universe”), (ii) information provided by Lipper Inc. on the Fund’s advisory fees and other expenses and the advisory fees and other expenses of comparable funds identified by Lipper Inc. (the “Lipper expense group”), (iii) information provided by MFS on the advisory fees of comparable portfolios of other clients of MFS, including institutional separate accounts and other clients, (iv) information as to whether and to what extent applicable expense waivers, reimbursements or fee “breakpoints” are observed for the Fund, (v) information regarding MFS’ financial results and financial condition, including MFS’ and certain of its affiliates’ estimated profitability from services performed for the Fund and the MFS Funds as a whole, and compared to MFS’ institutional business, (vi) MFS’ views regarding the outlook for the mutual fund industry and the strategic business plans of MFS, (vii) descriptions of various functions performed by MFS for the Funds, such as compliance monitoring and portfolio trading practices, and (viii) information regarding the overall organization of MFS, including information about MFS’ senior management and other personnel providing investment advisory, administrative and other services to
36
Board Review of Investment Advisory Agreement – continued
the Fund and the other MFS Funds. The comparative performance, fee and expense information prepared and provided by Lipper Inc. was not independently verified and the independent Trustees did not independently verify any information provided to them by MFS.
The Trustees’ conclusion as to the continuation of the investment advisory agreement was based on a comprehensive consideration of all information provided to the Trustees and not the result of any single factor. Some of the factors that figured particularly in the Trustees’ deliberations are described below, although individual Trustees may have evaluated the information presented differently from one another, giving different weights to various factors. It is also important to recognize that the fee arrangements for the Fund and other MFS Funds are the result of years of review and discussion between the independent Trustees and MFS, that certain aspects of such arrangements may receive greater scrutiny in some years than in others, and that the Trustees’ conclusions may be based, in part, on their consideration of these same arrangements during the course of the year and in prior years.
Based on information provided by Lipper Inc. and MFS, the Trustees reviewed the Fund’s total return investment performance as well as the performance of peer groups of funds over various time periods. The Trustees placed particular emphasis on the total return performance of the Fund’s Class A shares in comparison to the performance of funds in its Lipper performance universe over the three-year period ended December 31, 2014, which the Trustees believed was a long enough period to reflect differing market conditions. The total return performance of the Fund’s Class A shares was in the 4th quintile relative to the other funds in the universe for this three-year period (the 1st quintile being the best performers and the 5th quintile being the worst performers). The total return performance of the Fund’s Class A shares was in the 4th quintile for the one-year period ended December 31, 2014 relative to the Lipper performance universe. The Fund commenced operations on September 28, 2011 and has a limited operating history and performance record; therefore no performance data for the five-year period was available. Because of the passage of time, these performance results may differ from the performance results for more recent periods, including those shown elsewhere in this report.
The Trustees expressed concern to MFS about the substandard investment performance of the Fund. In the course of their deliberations, the Trustees took into account information provided by MFS in connection with the contract review meetings as well as during investment review meetings conducted with portfolio management personnel during the course of the year, as to MFS’ efforts to improve the Fund’s performance. In addition, the Trustees requested that they receive a separate update on the Fund’s performance at each of their regular meetings. After reviewing these and related factors, the Trustees concluded, within the context of their overall conclusions regarding the investment advisory agreement, that MFS’ responses and efforts and plans to improve investment performance were sufficient to support approval of the continuance of the investment advisory agreement for an additional one-year period, but that they would continue to closely monitor the performance of the Fund.
In assessing the reasonableness of the Fund’s advisory fee, the Trustees considered, among other information, the Fund’s advisory fee and the total expense ratio of the Fund’s Class A shares as a percentage of average daily net assets and the advisory fee
37
Board Review of Investment Advisory Agreement – continued
and total expense ratios of peer groups of funds based on information provided by Lipper Inc. The Trustees considered that MFS currently observes an expense limitation for the Fund, which may not be changed without the Trustees’ approval. The Trustees also considered that, according to the Lipper data (which takes into account any fee reductions or expense limitations that were in effect during the Fund’s last fiscal year), the Fund’s effective advisory fee rate was lower than the Lipper expense group median and the Fund’s total expense ratio was approximately at the Lipper expense group median.
The Trustees also considered the advisory fees charged by MFS to any institutional separate accounts advised by MFS (“separate accounts”) and unaffiliated investment companies for which MFS serves as subadviser (“subadvised funds”) that have comparable investment strategies to the Fund. In comparing these fees, the Trustees considered information provided by MFS as to the generally broader scope of services provided by MFS to the Fund, as well as the more extensive regulatory burdens imposed on MFS in managing the Fund, in comparison to separate accounts and subadvised funds. The Trustees also considered the higher demands placed on MFS’ investment personnel and trading infrastructure as a result of the daily cash in-flows and out-flows of the Fund in comparison to separate accounts.
The Trustees also considered whether the Fund may benefit from any economies of scale in the management of the Fund in the event of growth in assets of the Fund and/or growth in assets of the MFS Funds as a whole. They noted that the Fund’s advisory fee rate schedule is subject to contractual breakpoints that reduce the Fund’s advisory fee rate on average daily net assets over $1 billion and $2.5 billion. The Trustees also noted that MFS has agreed in writing to waive a portion of the management fees of certain MFS Funds, including the Fund, if the total combined assets of certain funds within the MFS Funds’ complex increase above agreed upon thresholds (the “group fee waiver”), enabling the Fund’s shareholders to share in the benefits from any economies of scale at the complex level. The group fee waiver is reviewed and renewed annually between the Board and MFS. The Trustees concluded that the breakpoints and the group fee waiver were sufficient to allow the Fund to benefit from economies of scale as its assets and overall complex assets grow.
The Trustees also considered information prepared by MFS relating to MFS’ costs and profits with respect to the Fund, the MFS Funds considered as a group, and other investment companies and accounts advised by MFS, as well as MFS’ methodologies used to determine and allocate its costs to the MFS Funds, the Fund and other accounts and products for purposes of estimating profitability.
After reviewing these and other factors described herein, the Trustees concluded, within the context of their overall conclusions regarding the investment advisory agreement, that the advisory fees charged to the Fund represent reasonable compensation in light of the services being provided by MFS to the Fund.
In addition, the Trustees considered MFS’ resources and related efforts to continue to retain, attract and motivate capable personnel to serve the Fund. The Trustees also considered current and developing conditions in the financial services industry, including the presence of large and well-capitalized companies which are spending, and appear to be prepared to continue to spend, substantial sums to engage personnel
38
Board Review of Investment Advisory Agreement – continued
and to provide services to competing investment companies. In this regard, the Trustees also considered the financial resources of MFS and its ultimate parent, Sun Life Financial Inc. The Trustees also considered the advantages and possible disadvantages to the Fund of having an adviser that also serves other investment companies as well as other accounts.
The Trustees also considered the nature, quality, cost, and extent of administrative, transfer agency, and distribution services provided to the Fund by MFS and its affiliates under agreements and plans other than the investment advisory agreement, including any 12b-1 fees the Fund pays to MFS Fund Distributors, Inc., an affiliate of MFS. The Trustees also considered the nature, extent and quality of certain other services MFS performs or arranges for on the Fund’s behalf, which may include securities lending programs, directed expense payment programs, class action recovery programs, and MFS’ interaction with third-party service providers, principally custodians and sub-custodians. The Trustees concluded that the various non-advisory services provided by MFS and its affiliates on behalf of the Fund were satisfactory.
The Trustees also considered benefits to MFS from the use of the Fund’s portfolio brokerage commissions, if applicable, to pay for investment research and various other factors. Additionally, the Trustees considered so-called “fall-out benefits” to MFS such as reputational value derived from serving as investment manager to the Fund.
Based on their evaluation of factors that they deemed to be material, including those factors described above, the Board of Trustees, including the independent Trustees, concluded that the Fund’s investment advisory agreement with MFS should be continued for an additional one-year period, commencing August 1, 2015.
39
PROXY VOTING POLICIES AND INFORMATION
MFS votes proxies on behalf of the fund pursuant to proxy voting policies and procedures that are available without charge, upon request, by calling 1-800-225-2606, by visiting the Proxy Voting section of mfs.com or by visiting the SEC’s Web site at http://www.sec.gov.
Information regarding how the fund voted proxies relating to portfolio securities during the most recent twelve-month period ended June 30 is available without charge by visiting the Proxy Voting section of mfs.com or by visiting the SEC’s Web site at http://www.sec.gov.
QUARTERLY PORTFOLIO DISCLOSURE
The fund will file a complete schedule of portfolio holdings with the Securities and Exchange Commission (the Commission) for the first and third quarters of each fiscal year on Form N-Q. A shareholder can obtain the quarterly portfolio holdings report at mfs.com. The fund’s Form N-Q is also available on the EDGAR database on the Commission’s Internet Web site at http://www.sec.gov, and may be reviewed and copied at the:
Public Reference Room
Securities and Exchange Commission
100 F Street, NE, Room 1580
Washington, D.C. 20549
Information on the operation of the Public Reference Room may be obtained by calling the Commission at 1-800-SEC-0330. Copies of the fund’s Form N-Q also may be obtained, upon payment of a duplicating fee, by electronic request at the following e-mail address: publicinfo@sec.gov or by writing the Public Reference Section at the above address.
FURTHER INFORMATION
From time to time, MFS may post important information about the fund or the MFS funds on the MFS web site (mfs.com). This information is available by visiting the “Market Commentary” and “Announcements” sub sections in the “Market Outlooks” section of mfs.com or by clicking on the fund’s name under “Mutual Funds” in the “Products” section of mfs.com.
FEDERAL TAX INFORMATION (unaudited)
The fund will notify shareholders of amounts for use in preparing 2015 income tax forms in January 2016. The following information is provided pursuant to provisions of the Internal Revenue Code.
The fund designates the maximum amount allowable as qualified dividend income eligible to be taxed at the same rate as long-term capital gain.
The fund designates $390,000 as capital gain dividends paid during the fiscal year.
For corporate shareholders, 44.52% of the ordinary income dividends paid during the fiscal year qualify for the corporate dividends received deduction.
Income derived from foreign sources was $221,613. The fund intends to pass through foreign tax credits of $21,007 for the fiscal year.
40
rev. 3/11
| | | | |
| | | |
FACTS | | WHAT DOES MFS DO WITH YOUR PERSONAL INFORMATION? | |  |
| | |
| Why? | | Financial companies choose how they share your personal information. Federal law gives consumers the right to limit some but not all sharing. Federal law also requires us to tell you how we collect, share, and protect your personal information. Please read this notice carefully to understand what we do. |
| | |
| What? | | The types of personal information we collect and share depend on the product or service you have with us. This information can include: • Social Security number and account balances • Account transactions and transaction history • Checking account information and wire transfer instructions When you are no longer our customer, we continue to share your information as described in this notice. |
| | |
| How? | | All financial companies need to share customers’ personal information to run their everyday business. In the section below, we list the reasons financial companies can share their customers’ personal information; the reasons MFS chooses to share; and whether you can limit this sharing. |
| | | | |
Reasons we can share your
personal information | | Does MFS
share? | | Can you limit
this sharing? |
For our everyday business purposes – such as to process your transactions, maintain your account(s), respond to court orders and legal investigations, or report to credit bureaus | | Yes | | No |
For our marketing purposes – to offer our products and services to you | | No | | We don’t share |
| For joint marketing with other financial companies | | No | | We don’t share |
For our affiliates’ everyday business purposes – information about your transactions and experiences | | No | | We don’t share |
For our affiliates’ everyday business purposes – information about your creditworthiness | | No | | We don’t share |
| For nonaffiliates to market to you | | No | | We don’t share |
| | |
| Questions? | | Call 800-225-2606 or go to mfs.com. |
41
| | |
| Who we are |
| Who is providing this notice? | | MFS Funds, MFS Investment Management, MFS Institutional Advisors, Inc., MFS Fund Distributors, Inc., MFS Heritage Trust Company, and MFS Service Center, Inc. |
| | |
| What we do |
| How does MFS protect my personal information? | | To protect your personal information from unauthorized access and use, we use security measures that comply with federal law. These measures include procedural, electronic, and physical safeguards for the protection of the personal information we collect about you. |
| How does MFS collect my personal information? | | We collect your personal information, for example, when you • open an account or provide account information • direct us to buy securities or direct us to sell your securities • make a wire transfer We also collect your personal information from others, such as credit bureaus, affiliates and other companies. |
| Why can’t I limit all sharing? | | Federal law gives you the right to limit only • sharing for affiliates’ everyday business purposes – information about your creditworthiness • affiliates from using your information to market to you • sharing for nonaffiliates to market to you State laws and individual companies may give you additional rights to limit sharing. |
| | |
| Definitions |
| Affiliates | | Companies related by common ownership or control. They can be financial and nonfinancial companies. • MFS does not share personal information with affiliates, except for everyday business purposes as described on page one of this notice. |
| Nonaffiliates | | Companies not related by common ownership or control. They can be financial and nonfinancial companies. • MFS does not share with nonaffiliates so they can market to you. |
| Joint Marketing | | A formal agreement between nonaffiliated financial companies that together market financial products or services to you. • MFS doesn’t jointly market. |
| | |
| Other important information |
| If you own an MFS product or receive an MFS service in the name of a third party such as a bank or broker-dealer, their privacy policy may apply to you instead of ours. |
42
Save paper with eDelivery.

| MFS® will send you prospectuses, |
reports, and proxies directly via e-mail so you will get information faster with less mailbox clutter.
To sign up:
1. Go to mfs.com.
2. Log in via MFS® Access.
3. Select eDelivery.
If you own your MFS fund shares through a financial institution or a retirement plan, MFS® TALK, MFS® Access, or eDelivery may not be available to you.
CONTACT
WEB SITE
mfs.com
MFS TALK
1-800-637-8255
24 hours a day
ACCOUNT SERVICE AND LITERATURE
Shareholders
1-800-225-2606
Financial advisors
1-800-343-2829
Retirement plan services
1-800-637-1255
MAILING ADDRESS
MFS Service Center, Inc.
P.O. Box 55824
Boston, MA 02205-5824
OVERNIGHT MAIL
MFS Service Center, Inc.
c/o Boston Financial Data Services
30 Dan Road
Canton, MA 02021-2809
ANNUAL REPORT
August 31, 2015

MFS® LOW VOLATILITY GLOBAL EQUITY FUND

LVO-ANN
MFS® LOW VOLATILITY GLOBAL EQUITY FUND
CONTENTS
The report is prepared for the general information of shareholders.
It is authorized for distribution to prospective investors only when preceded or accompanied by a current prospectus.
NOT FDIC INSURED • MAY LOSE VALUE • NO BANK GUARANTEE

LETTER FROM THE CHAIRMAN
Dear Shareholders:
The U.S. economy bounced back after another harsh winter curtailed domestic consumption. Despite strengthening labor and housing markets, however, a stronger U.S. dollar and weak overseas demand have held back corporate earnings.
China’s economic growth continues to slow, raising concerns and adding to global market volatility. Commodity exporters, including Australia and Canada, have been hurt by weaker Chinese demand. Global oil markets remain oversupplied, putting pressure on crude oil and gasoline prices.
In Europe, concerns about a potential Greek debt default have faded, and the eurozone’s economy is expanding mildly. Hopes for a more robust regionwide recovery rest on the European Central Bank’s quantitative easing program.
The world’s financial markets have become increasingly complex in recent years. Now, more than ever, it is important to understand companies on a global basis. At MFS®, we believe our integrated research platform, collaborative culture, active risk management process and long-term focus give us a research advantage.
As investors, we aim to add long-term value. We believe this approach will serve you well as you work with your financial advisor to reach your investment objectives.
Respectfully,

Robert J. Manning
Chairman
MFS Investment Management
October 15, 2015
The opinions expressed in this letter are subject to change and may not be relied upon for investment advice. No forecasts can be guaranteed.
1
PORTFOLIO COMPOSITION
Portfolio structure

| | | | |
| Top ten holdings | | | | |
| General Mills, Inc. | | | 3.8% | |
| Taiwan Semiconductor Manufacturing Co. Ltd., ADR | | | 3.1% | |
| Roche Holding AG | | | 2.6% | |
| Discover Financial Services | | | 2.5% | |
| Fisher & Paykel Healthcare Corp. Ltd. | | | 2.2% | |
| Johnson & Johnson | | | 2.2% | |
| SBA Communications Corp. | | | 1.8% | |
| Norwegian Cruise Line Holdings Ltd. | | | 1.8% | |
| Lawson, Inc. | | | 1.8% | |
| Ross Stores, Inc. | | | 1.8% | |
| |
| Equity sectors | | | | |
| Utilities & Communications | | | 16.0% | |
| Financial Services | | | 15.1% | |
| Consumer Staples | | | 14.3% | |
| Health Care | | | 13.2% | |
| Retailing | | | 9.5% | |
| Technology | | | 8.9% | |
| Leisure | | | 8.5% | |
| Energy | | | 5.3% | |
| Industrial Goods & Services | | | 3.2% | |
| Basic Materials | | | 1.7% | |
| Autos & Housing | | | 1.5% | |
| Special Products & Services | | | 0.7% | |
| Transportation | | | 0.6% | |
| | | | |
| Issuer country weightings (x) | |
| United States | | | 49.5% | |
| Japan | | | 10.6% | |
| Switzerland | | | 5.7% | |
| Hong Kong | | | 5.0% | |
| United Kingdom | | | 4.7% | |
| Canada | | | 4.5% | |
| Taiwan | | | 4.3% | |
| Israel | | | 2.9% | |
| New Zealand | | | 2.2% | |
| Other Countries | | | 10.6% | |
|
| Currency exposure weightings (y) | |
| United States Dollar | | | 54.8% | |
| Japanese Yen | | | 10.6% | |
| Swiss Franc | | | 5.7% | |
| Euro | | | 5.2% | |
| British Pound Sterling | | | 4.7% | |
| Taiwan Dollar | | | 4.3% | |
| Hong Kong Dollar | | | 4.1% | |
| Israeli Shekel | | | 2.9% | |
| New Zealand Dollar | | | 2.2% | |
| Other Currencies | | | 5.5% | |
2
Portfolio Composition – continued
| (x) | Represents the portfolio’s exposure to issuer countries as a percentage of a portfolio’s net assets. For purposes of this presentation, United States includes Cash & Other. |
| (y) | Represents the portfolio’s exposure to a particular currency as a percentage of a portfolio’s net assets. For purposes of this presentation, United States Dollar includes Cash & Other. |
Cash & Other can include cash, other assets less liabilities, offsets to derivative positions, and short-term securities. Please see the Statement of Assets and Liabilities for additional information related to the fund’s cash position and the Notes to Financial Statements for additional information related to certain risks associated with assets included in “Other”.
Percentages are based on net assets as of 8/31/15.
The portfolio is actively managed and current holdings may be different.
3
MANAGEMENT REVIEW
Summary of Results
For the twelve months ended August 31, 2015, Class A shares of the MFS Low Volatility Global Equity Fund (“fund”) provided a total return of -0.36%, at net asset value. This compares with a return of –5.79% for the fund’s benchmark, the MSCI All Country World Index.
Market Environment
A generally risk-friendly environment prevailed in the first half of the period and any market setbacks, triggered by global growth concerns, were short-lived as central banks responded and kept monetary policy accommodative. For example, the US tempered rate hike expectations while Japan, Europe and China provided fresh stimulus measures which ultimately supported risk assets. Early in the second half of the period, the European Central Bank cut policy interest rates and announced non-conventional easing measures, pushing yields on a significant portion of eurozone sovereign bonds deeper into negative territory, a notable highlight amid a mini-wave of global easing due to declining inflation and inflation expectations. However, the environment supporting risk began to break down in the latter phases of the period, with both US investment grade and high yield corporate spreads widening out and any individual company performance below expectations resulted in market selling.
A dominant trend for most of the period was the ongoing rise in US equities. Until early in the second half of the period, this was paired with a decline in US and global bond yields. The uptrend in US corporate margins and profits continued throughout the second half of 2014, but in the latter part of the period the margin results became more bifurcated with energy and materials suffering and the rest of the companies holding on to net margins in an ongoing slow revenue growth environment. A rising dollar and a sharp decline in commodity prices, particularly crude oil prices, negatively impacted credit markets, notably US high yield and emerging market debt. The higher weightings of oil and gas credits in these asset classes resulted in widening spreads and increased volatility. In the second half of the period, global sovereign bond yields rose, shrugging off concerns over a Greek debt default. The rise tempered the equity advance, as odds of a 2015 US Federal Reserve rate hike increased. At the end of the period, the stronger US dollar slowed revenues in many US-based multinational companies. As the last month of the period began, risk shedding became a theme across emerging market countries and continued to weaken Chinese economic data as well as economic data of the commodity-driven countries. Risk shedding accelerated outflows and cross-border selling. By the end of the period, many of the world’s equity markets had entered into “correction” territory.
Contributors to Performance
Stock selection and, to a lesser extent, the fund’s overweight position in the consumer staples sector contributed to performance relative to the MSCI All Country World Index. The fund’s overweight position in consumer foods manufacturer General Mills, and holdings of Japanese drug manufacturer Kobayashi Pharmaceuticals (b), bolstered relative results. Shares of General Mills appreciated as the company reported strong earnings driven by better price/mix and lower operating and tax expenses.
4
Management Review – continued
Strong security selection in the utilities & communications sector supported relative performance. The fund’s overweight position in shares of Hong Kong-based infrastructure company Cheung Kong Infrastructure Holdings aided relative performance as the stock outpaced the benchmark during the reporting period. The company announced a group restructuring of Cheung Kong Holdings and Hutchison Whampoa aimed at unlocking value in both companies.
Other top relative contributors for the period included the fund’s overweight positions in pharmaceutical firm Santen Pharmaceutical (h) (Japan), call center software provider NICE Systems (Israel), supermarket operator Kroger, off-price retail apparel and home accessories store operator Ross Stores, biopharmaceutical company Amgen (h) and defense company Lockheed Martin. Shares of Santen Pharmaceutical outperformed the benchmark during the reporting period after the company reported solid earnings, fueled by a strong contribution from its ophthalmology products division acquired from Merck. Holdings of strong-performing international betting and gaming company Paddy Power (b) (Ireland) also helped.
During the reporting period, the fund’s currency exposure, resulting primarily from differences between the fund’s and the benchmark’s exposures to holdings of securities denominated in foreign currencies, also benefited relative results. All of MFS’ investment decisions are driven by the fundamentals of each individual opportunity and as such, it is common for our portfolios to have different currency exposure than the benchmark.
Detractors from Performance
The combination of stock selection and an underweight position in the special products & services sector detracted from relative performance. There were no individual securities within this sector that were among the fund’s top relative detractors during the reporting period.
Security selection in the financial services sector also dampened relative performance, led by overweighting shares of diversified financial services company Suncorp-Metway (h) (Australia). Shares of Suncorp-Metway fell following results that included weak commercial loan volumes and a decline in the company’s insurance division. An overweight position in integrated financial services group Alliance Financial (Malaysia) further weighed on relative performance
Elsewhere, the fund’s overweight positions in natural gas and oil company Range Resources (h), energy and petrochemicals company Royal Dutch Shell (United Kingdom), telecommunications provider DiGi.Com Berhard (Malaysia), natural gas company EQT Corporation (h) and integrated oil company Exxon Mobil held back relative performance. Shares of Range Resources declined due, in part, to lower-than-expected earnings, which were negatively affected by weak gas prices over the reporting period. Shares of Royal Dutch Shell also depreciated steadily over the reporting period as a result of continuous pressures from falling oil prices. The fund’s holdings of wireless commercial television station Television Broadcasts (b) (Hong Kong) and retail company Dairy Farm
5
Management Review – continued
International Holdings (b) (Hong Kong), and not holding computer and personal electronics maker Apple, also dampened relative performance.
Respectfully,
| | |
| James Fallon | | Jonathan Sage |
| Portfolio Manager | | Portfolio Manager |
| (b) | Security is not a benchmark constituent. |
| (h) | Security was not held in the portfolio at period end. |
The views expressed in this report are those of the portfolio managers only through the end of the period of the report as stated on the cover and do not necessarily reflect the views of MFS or any other person in the MFS organization. These views are subject to change at any time based on market or other conditions, and MFS disclaims any responsibility to update such views. These views may not be relied upon as investment advice or an indication of trading intent on behalf of any MFS portfolio. References to specific securities are not recommendations of such securities, and may not be representative of any MFS portfolio’s current or future investments.
6
PERFORMANCE SUMMARY THROUGH 8/31/15
The following chart illustrates a representative class of the fund’s historical performance in comparison to its benchmark(s). Performance results include the deduction of the maximum applicable sales charge and reflect the percentage change in net asset value, including reinvestment of dividends and capital gains distributions. The performance of other share classes will be greater than or less than that of the class depicted below. Benchmarks are unmanaged and may not be invested in directly. Benchmark returns do not reflect sales charges, commissions or expenses. (See Notes to Performance Summary.)
Performance data shown represents past performance and is no guarantee of future results. Investment return and principal value fluctuate so your shares, when sold, may be worth more or less than the original cost; current performance may be lower or higher than quoted. The performance shown does not reflect the deduction of taxes, if any, that a shareholder would pay on fund distributions or the redemption of fund shares.
Growth of a Hypothetical $10,000 Investment (t)
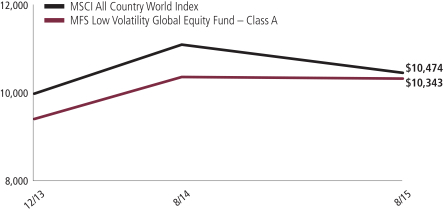
7
Performance Summary – continued
Total Returns through 8/31/15
Average annual without sales charge
| | | | | | | | | | |
| | | Share Class | | Class Inception Date | | 1-yr | | Life (t) | | |
| | | A | | 12/05/13 | | (0.36)% | | 5.48% | | |
| | | B | | 12/05/13 | | (1.06)% | | 4.65% | | |
| | | C | | 12/05/13 | | (1.14)% | | 4.61% | | |
| | | I | | 12/05/13 | | (0.09)% | | 5.68% | | |
| | | R1 | | 12/05/13 | | (1.13)% | | 4.62% | | |
| | | R2 | | 12/05/13 | | (0.62)% | | 5.14% | | |
| | | R3 | | 12/05/13 | | (0.34)% | | 5.45% | | |
| | | R4 | | 12/05/13 | | (0.18)% | | 5.68% | | |
| | | R5 | | 12/05/13 | | (0.09)% | | 5.69% | | |
| Comparative benchmark | | | | | | |
| | | MSCI All Country World Index (f) | | (5.79)% | | 2.70% | | |
| Average annual with sales charge | | | | | | |
| | | A
With initial Sales Charge (5.75%) | | (6.09)% | | 1.95% | | |
| | | B
With CDSC (Declining over six years from 4% to 0%) (v) | | (4.99)% | | 2.41% | | |
| | | C
With CDSC (1% for 12 months) (v) | | (2.12)% | | 4.61% | | |
CDSC – Contingent Deferred Sales Charge.
Class I, R1, R2, R3, R4, and R5 shares do not have a sales charge.
| (f) | Source: FactSet Research Systems Inc. |
| (t) | For the period from the class inception date through the stated period end. (See Notes to Performance Summary.) |
| (v) | Assuming redemption at the end of the applicable period. |
Benchmark Definition
MSCI All Country World Index – a market capitalization-weighted index that is designed to measure equity market performance in the global developed and emerging markets.
It is not possible to invest directly in an index.
Notes to Performance Summary
Average annual total return represents the average annual change in value for each share class for the periods presented. Life returns are presented where the share class has less than 10 years of performance history and represent the average annual total return from the class inception date to the stated period end date.
8
Performance Summary – continued
Performance results reflect any applicable expense subsidies and waivers in effect during the periods shown. Without such subsidies and waivers the fund’s performance results would be less favorable. Please see the prospectus and financial statements for complete details.
Performance results do not include adjustments made for financial reporting purposes in accordance with U.S. generally accepted accounting principles and may differ from amounts reported in the financial highlights.
From time to time the fund may receive proceeds from litigation settlements, without which performance would be lower.
9
EXPENSE TABLE
Fund expenses borne by the shareholders during the period, March 1, 2015 through August 31, 2015
As a shareholder of the fund, you incur two types of costs: (1) transaction costs, including sales charges (loads) on certain purchase or redemption payments, and (2) ongoing costs, including management fees; distribution and service (12b-1) fees; and other fund expenses. This example is intended to help you understand your ongoing costs (in dollars) of investing in the fund and to compare these costs with the ongoing costs of investing in other mutual funds.
The example is based on an investment of $1,000 invested at the beginning of the period and held for the entire period March 1, 2015 through August 31, 2015.
Actual Expenses
The first line for each share class in the following table provides information about actual account values and actual expenses. You may use the information in this line, together with the amount you invested, to estimate the expenses that you paid over the period. Simply divide your account value by $1,000 (for example, an $8,600 account value divided by $1,000 = 8.6), then multiply the result by the number in the first line under the heading entitled “Expenses Paid During Period” to estimate the expenses you paid on your account during this period.
Hypothetical Example for Comparison Purposes
The second line for each share class in the following table provides information about hypothetical account values and hypothetical expenses based on the fund’s actual expense ratio and an assumed rate of return of 5% per year before expenses, which is not the fund’s actual return. The hypothetical account values and expenses may not be used to estimate the actual ending account balance or expenses you paid for the period. You may use this information to compare the ongoing costs of investing in the fund and other funds. To do so, compare this 5% hypothetical example with the 5% hypothetical examples that appear in the shareholder reports of the other funds.
Please note that the expenses shown in the table are meant to highlight your ongoing costs only and do not reflect any transactional costs, such as sales charges (loads). Therefore, the second line for each share class in the table is useful in comparing ongoing costs only, and will not help you determine the relative total costs of owning different funds. In addition, if these transactional costs were included, your costs would have been higher.
10
Expense Table – continued
| | | | | | | | | | | | | | | | | | |
Share
Class | | | | Annualized Expense Ratio | | | Beginning Account Value 3/01/15 | | | Ending Account Value 8/31/15 | | | Expenses Paid During Period (p) 3/01/15-8/31/15 | |
| A | | Actual | | | 1.22% | | | | $1,000.00 | | | | $943.61 | | | | $5.98 | |
| | Hypothetical (h) | | | 1.22% | | | | $1,000.00 | | | | $1,019.06 | | | | $6.21 | |
| B | | Actual | | | 2.00% | | | | $1,000.00 | | | | $940.46 | | | | $9.78 | |
| | Hypothetical (h) | | | 2.00% | | | | $1,000.00 | | | | $1,015.12 | | | | $10.16 | |
| C | | Actual | | | 2.00% | | | | $1,000.00 | | | | $939.73 | | | | $9.78 | |
| | Hypothetical (h) | | | 2.00% | | | | $1,000.00 | | | | $1,015.12 | | | | $10.16 | |
| I | | Actual | | | 1.00% | | | | $1,000.00 | | | | $944.61 | | | | $4.90 | |
| | Hypothetical (h) | | | 1.00% | | | | $1,000.00 | | | | $1,020.16 | | | | $5.09 | |
| R1 | | Actual | | | 2.00% | | | | $1,000.00 | | | | $939.87 | | | | $9.78 | |
| | Hypothetical (h) | | | 2.00% | | | | $1,000.00 | | | | $1,015.12 | | | | $10.16 | |
| R2 | | Actual | | | 1.50% | | | | $1,000.00 | | | | $942.30 | | | | $7.34 | |
| | Hypothetical (h) | | | 1.50% | | | | $1,000.00 | | | | $1,017.64 | | | | $7.63 | |
| R3 | | Actual | | | 1.25% | | | | $1,000.00 | | | | $944.32 | | | | $6.13 | |
| | Hypothetical (h) | | | 1.25% | | | | $1,000.00 | | | | $1,018.90 | | | | $6.36 | |
| R4 | | Actual | | | 1.00% | | | | $1,000.00 | | | | $944.60 | | | | $4.90 | |
| | Hypothetical (h) | | | 1.00% | | | | $1,000.00 | | | | $1,020.16 | | | | $5.09 | |
| R5 | | Actual | | | 0.94% | | | | $1,000.00 | | | | $945.50 | | | | $4.61 | |
| | Hypothetical (h) | | | 0.94% | | | | $1,000.00 | | | | $1,020.47 | | | | $4.79 | |
| (h) | 5% class return per year before expenses. |
| (p) | “Expenses Paid During Period” are equal to each class’s annualized expense ratio, as shown above, multiplied by the average account value over the period, multiplied by 184/365 (to reflect the one-half year period). Expenses paid do not include any applicable sales charges (loads). If these transaction costs had been included, your costs would have been higher. |
Notes to Expense Table
Each class with a Rule 12b-1 service fee is subject to a rebate of a portion of such fee. Such rebates are included in the expense ratios above and are outside of the expense limitation arrangement. For Class A shares, this rebate reduced the expense ratio above by 0.03%. See Note 3 in the Notes to Financial Statements for additional information.
11
PORTFOLIO OF INVESTMENTS
8/31/15
The Portfolio of Investments is a complete list of all securities owned by your fund. It is categorized by broad-based asset classes.
| | | | | | | | |
| Common Stocks - 98.5% | | | | | | | | |
| Issuer | | Shares/Par | | | Value ($) | |
| Aerospace - 1.8% | | | | | | | | |
| Lockheed Martin Corp. | | | 3,160 | | | $ | 635,730 | |
| | |
| Automotive - 1.5% | | | | | | | | |
| USS Co. Ltd. | | | 30,700 | | | $ | 545,451 | |
| | |
| Broadcasting - 0.8% | | | | | | | | |
| Television Broadcasts Ltd. | | | 73,600 | | | $ | 276,354 | |
| | |
| Business Services - 0.7% | | | | | | | | |
| Forrester Research, Inc. | | | 8,269 | | | $ | 261,383 | |
| | |
| Cable TV - 1.8% | | | | | | | | |
| Liberty Global PLC, “A” (a) | | | 6,280 | | | $ | 302,194 | |
| Time Warner Cable, Inc. | | | 1,870 | | | | 347,857 | |
| | | | | | | | |
| | | | | | | $ | 650,051 | |
| Chemicals - 0.6% | | | | | | | | |
| Monsanto Co. | | | 2,087 | | | $ | 203,796 | |
| | |
| Computer Software - 1.0% | | | | | | | | |
| Dassault Systems S.A. | | | 5,018 | | | $ | 348,500 | |
| | |
| Computer Software - Systems - 1.9% | | | | | | | | |
| EMC Corp. | | | 6,859 | | | $ | 170,583 | |
| NICE Systems Ltd., ADR | | | 8,276 | | | | 509,471 | |
| | | | | | | | |
| | | | | | | $ | 680,054 | |
| Consumer Products - 4.6% | | | | | | | | |
| Colgate-Palmolive Co. | | | 2,629 | | | $ | 165,127 | |
| Kimberly-Clark Corp. | | | 3,710 | | | | 395,226 | |
| Kobayashi Pharmaceutical Co. Ltd. | | | 5,000 | | | | 388,914 | |
| Procter & Gamble Co. | | | 7,146 | | | | 505,008 | |
| Uni-Charm Corp. | | | 9,700 | | | | 196,104 | |
| | | | | | | | |
| | | | | | | $ | 1,650,379 | |
| Electronics - 5.3% | | | | | | | | |
| Kyocera Corp. | | | 7,200 | | | $ | 353,660 | |
| Siliconware Precision Industries Co. Ltd., ADR | | | 65,645 | | | | 405,030 | |
| Taiwan Semiconductor Manufacturing Co. Ltd., ADR | | | 56,545 | | | | 1,124,115 | |
| | | | | | | | |
| | | | | | | $ | 1,882,805 | |
12
Portfolio of Investments – continued
| | | | | | | | |
| Issuer | | Shares/Par | | | Value ($) | |
| Common Stocks - continued | | | | | | | | |
| Energy - Independent - 2.1% | | | | | | | | |
| Cabot Oil & Gas Corp. | | | 20,038 | | | $ | 474,299 | |
| Occidental Petroleum Corp. | | | 3,667 | | | | 267,728 | |
| | | | | | | | |
| | | | | | | $ | 742,027 | |
| Energy - Integrated - 3.3% | | | | | | | | |
| Exxon Mobil Corp. | | | 7,527 | | | $ | 566,331 | |
| Royal Dutch Shell PLC, “B” | | | 23,098 | | | | 602,687 | |
| | | | | | | | |
| | | | | | | $ | 1,169,018 | |
| Food & Beverages - 8.6% | | | | | | | | |
| Chr. Hansen Holding A.S. | | | 7,831 | | | $ | 394,296 | |
| General Mills, Inc. | | | 23,988 | | | | 1,361,559 | |
| Mondelez International, Inc. | | | 5,850 | | | | 247,806 | |
| Nestle S.A. | | | 4,281 | | | | 315,766 | |
| Pinnacle Foods, Inc. | | | 3,907 | | | | 175,190 | |
| Sligro Food Group N.V. | | | 5,910 | | | | 233,941 | |
| Toyo Suisan Kaisha Ltd. | | | 9,000 | | | | 337,774 | |
| | | | | | | | |
| | | | | | | $ | 3,066,332 | |
| Food & Drug Stores - 6.1% | | | | | | | | |
| CVS Health Corp. | | | 3,793 | | | $ | 388,403 | |
| Dairy Farm International Holdings Ltd. | | | 47,700 | | | | 310,050 | |
| Kroger Co. | | | 10,670 | | | | 368,115 | |
| Lawson, Inc. | | | 9,200 | | | | 657,170 | |
| METRO, Inc., “A” | | | 7,744 | | | | 204,490 | |
| Sundrug Co. Ltd. | | | 4,500 | | | | 253,145 | |
| | | | | | | | |
| | | | | | | $ | 2,181,373 | |
| Gaming & Lodging - 3.1% | | | | | | | | |
| Norwegian Cruise Line Holdings Ltd. (a) | | | 11,416 | | | $ | 657,562 | |
| Paddy Power PLC | | | 4,177 | | | | 458,862 | |
| | | | | | | | |
| | | | | | | $ | 1,116,424 | |
| Insurance - 3.1% | | | | | | | | |
| Allied World Assurance Co. | | | 3,533 | | | $ | 141,108 | |
| Beazley Group PLC | | | 43,887 | | | | 223,643 | |
| Intact Financial Corp. | | | 5,708 | | | | 393,625 | |
| Travelers Cos., Inc. | | | 1,710 | | | | 170,231 | |
| XL Group PLC | | | 5,067 | | | | 188,948 | |
| | | | | | | | |
| | | | | | | $ | 1,117,555 | |
| Internet - 0.7% | | | | | | | | |
| Google, Inc., “A” (a) | | | 396 | | | $ | 256,537 | |
13
Portfolio of Investments – continued
| | | | | | | | |
| Issuer | | Shares/Par | | | Value ($) | |
| Common Stocks - continued | | | | | | | | |
| Machinery & Tools - 1.4% | | | | | | | | |
| Schindler Holding AG | | | 3,195 | | | $ | 497,768 | |
| | |
| Major Banks - 5.0% | | | | | | | | |
| Bank of Nova Scotia | | | 3,848 | | | $ | 175,623 | |
| BOC Hong Kong Holdings Ltd. | | | 140,500 | | | | 474,978 | |
| HSBC Holdings PLC, ADR | | | 11,128 | | | | 441,448 | |
| Royal Bank of Canada | | | 2,847 | | | | 158,179 | |
| Sumitomo Mitsui Financial Group, Inc. | | | 9,200 | | | | 376,697 | |
| Wells Fargo & Co. | | | 3,116 | | | | 166,176 | |
| | | | | | | | |
| | | | | | | $ | 1,793,101 | |
| Medical & Health Technology & Services - 2.3% | | | | | | | | |
| Express Scripts Holding Co. (a) | | | 5,672 | | | $ | 474,179 | |
| McKesson Corp. | | | 1,771 | | | | 349,914 | |
| | | | | | | | |
| �� | | | | | | $ | 824,093 | |
| Medical Equipment - 2.8% | | | | | | | | |
| Abbott Laboratories | | | 4,408 | | | $ | 199,638 | |
| Fisher & Paykel Healthcare Corp. Ltd. | | | 175,196 | | | | 805,034 | |
| | | | | | | | |
| | | | | | | $ | 1,004,672 | |
| Natural Gas - Distribution - 1.0% | | | | | | | | |
| Hong Kong & China Gas Co. Ltd. | | | 74,000 | | | $ | 139,597 | |
| Osaka Gas Co. Ltd. | | | 57,000 | | | | 231,601 | |
| | | | | | | | |
| | | | | | | $ | 371,198 | |
| Other Banks & Diversified Financials - 4.2% | | | | | | | | |
| Alliance Financial Group | | | 335,700 | | | $ | 300,531 | |
| Credicorp Ltd. | | | 1,769 | | | | 194,555 | |
| DBS Group Holdings Ltd. | | | 10,200 | | | | 128,381 | |
| Discover Financial Services | | | 16,595 | | | | 891,649 | |
| | | | | | | | |
| | | | | | | $ | 1,515,116 | |
| Pharmaceuticals - 8.1% | | | | | | | | |
| Johnson & Johnson | | | 8,276 | | | $ | 777,778 | |
| Merck & Co., Inc. | | | 6,625 | | | | 356,756 | |
| Novartis AG | | | 2,998 | | | | 293,706 | |
| Roche Holding AG | | | 3,463 | | | | 945,774 | |
| Teva Pharmaceutical Industries Ltd., ADR | | | 8,352 | | | | 537,952 | |
| | | | | | | | |
| | | | | | | $ | 2,911,966 | |
| Railroad & Shipping - 0.6% | | | | | | | | |
| Canadian National Railway Co. | | | 4,145 | | | $ | 229,965 | |
14
Portfolio of Investments – continued
| | | | | | | | |
| Issuer | | Shares/Par | | | Value ($) | |
| Common Stocks - continued | | | | | | | | |
| Real Estate - 2.7% | | | | | | | | |
| AvalonBay Communities, Inc., REIT | | | 2,992 | | | $ | 493,860 | |
| Grand City Properties S.A. | | | 11,538 | | | | 204,051 | |
| Public Storage, Inc., REIT | | | 1,371 | | | | 275,941 | |
| | | | | | | | |
| | | | | | | $ | 973,852 | |
| Restaurants - 2.8% | | | | | | | | |
| McDonald’s Corp. | | | 6,258 | | | $ | 594,635 | |
| Whitbread PLC | | | 5,519 | | | | 402,732 | |
| | | | | | | | |
| | | | | | | $ | 997,367 | |
| Specialty Chemicals - 1.1% | | | | | | | | |
| Symrise AG | | | 6,561 | | | $ | 396,025 | |
| | |
| Specialty Stores - 3.4% | | | | | | | | |
| Home Depot, Inc. | | | 3,116 | | | $ | 362,889 | |
| Inditex | | | 6,330 | | | | 211,250 | |
| Ross Stores, Inc. | | | 13,151 | | | | 639,402 | |
| | | | | | | | |
| | | | | | | $ | 1,213,541 | |
| Telecommunications - Wireless - 4.9% | | | | | | | | |
| Advanced Info Service PLC | | | 66,300 | | | $ | 440,212 | |
| American Tower Corp., REIT | | | 2,412 | | | | 222,362 | |
| KDDI Corp. | | | 18,000 | | | | 448,088 | |
| SBA Communications Corp. (a) | | | 5,565 | | | | 657,783 | |
| | | | | | | | |
| | | | | | | $ | 1,768,445 | |
| Telephone Services - 3.0% | | | | | | | | |
| BCE, Inc. | | | 3,710 | | | $ | 150,032 | |
| DiGi.Com Berhad | | | 270,800 | | | | 337,210 | |
| TDC A.S. | | | 24,251 | | | | 153,461 | |
| TELUS Corp. | | | 8,428 | | | | 276,017 | |
| Verizon Communications, Inc. | | | 3,116 | | | | 143,367 | |
| | | | | | | | |
| | | | | | | $ | 1,060,087 | |
| Tobacco - 1.1% | | | | | | | | |
| Altria Group, Inc. | | | 4,284 | | | $ | 229,537 | |
| Reynolds American, Inc. | | | 2,059 | | | | 172,441 | |
| | | | | | | | |
| | | | | | | $ | 401,978 | |
| Utilities - Electric Power - 7.1% | | | | | | | | |
| Alliant Energy Corp. | | | 2,847 | | | $ | 161,339 | |
| American Electric Power Co., Inc. | | | 5,570 | | | | 302,395 | |
| Calpine Corp. (a) | | | 12,611 | | | | 201,019 | |
| Cheung Kong Infrastructure Holdings Ltd. | | | 72,000 | | | | 593,648 | |
15
Portfolio of Investments – continued
| | | | | | | | |
| Issuer | | Shares/Par | | | Value ($) | |
| Common Stocks - continued | | | | | | | | |
| Utilities - Electric Power - continued | | | | | | | | |
| Consolidated Edison, Inc. | | | 3,848 | | | $ | 242,078 | |
| Dominion Resources, Inc. | | | 2,272 | | | | 158,472 | |
| Duke Energy Corp. | | | 2,987 | | | | 211,808 | |
| PG&E Corp. | | | 8,545 | | | | 423,661 | |
| Xcel Energy, Inc. | | | 6,778 | | | | 228,622 | |
| | | | | | | | |
| | | | | | | $ | 2,523,042 | |
| Total Common Stocks (Identified Cost, $35,417,886) | | | | | | $ | 35,265,985 | |
| | |
| Money Market Funds - 1.6% | | | | | | | | |
MFS Institutional Money Market Portfolio, 0.11%,
at Cost and Net Asset Value (v) | | | 563,630 | | | $ | 563,630 | |
| Total Investments (Identified Cost, $35,981,516) | | | | | | $ | 35,829,615 | |
| | |
| Other Assets, Less Liabilities - (0.1)% | | | | | | | (22,012 | ) |
| Net Assets - 100.0% | | | | | | $ | 35,807,603 | |
| (a) | Non-income producing security. |
| (v) | Underlying affiliated fund that is available only to investment companies managed by MFS. The rate quoted for the MFS Institutional Money Market Portfolio is the annualized seven-day yield of the fund at period end. |
The following abbreviations are used in this report and are defined:
| ADR | | American Depositary Receipt |
| PLC | | Public Limited Company |
| REIT | | Real Estate Investment Trust |
See Notes to Financial Statements
16
Financial Statements
STATEMENT OF ASSETS AND LIABILITIES
At 8/31/15
This statement represents your fund’s balance sheet, which details the assets and liabilities comprising the total value of the fund.
| | | | |
| Assets | | | | |
Investments | | | | |
Non-affiliated issuers, at value (identified cost, $35,417,886) | | | $35,265,985 | |
Underlying affiliated funds, at cost and value | | | 563,630 | |
Total investments, at value (identified cost, $35,981,516) | | | $35,829,615 | |
Cash | | | 28,692 | |
Receivables for | | | | |
Fund shares sold | | | 1,325 | |
Interest and dividends | | | 123,662 | |
Receivable from investment adviser | | | 10,930 | |
Receivable from distributor | | | 227 | |
Other assets | | | 87 | |
Total assets | | | $35,994,538 | |
| Liabilities | | | | |
Payable for fund shares reacquired | | | $109,360 | |
Payable to affiliates | | | | |
Shareholder servicing costs | | | 3,071 | |
Payable for independent Trustees’ compensation | | | 7 | |
Accrued expenses and other liabilities | | | 74,497 | |
Total liabilities | | | $186,935 | |
Net assets | | | $35,807,603 | |
| Net assets consist of | | | | |
Paid-in capital | | | $36,414,766 | |
Unrealized appreciation (depreciation) on investments and translation of assets and liabilities in foreign currencies | | | (152,647 | ) |
Accumulated distributions in excess of net realized gain on investments and foreign currency | | | (639,134 | ) |
Undistributed net investment income | | | 184,618 | |
Net assets | | | $35,807,603 | |
Shares of beneficial interest outstanding | | | 3,328,998 | |
17
Statement of Assets and Liabilities – continued
| | | | | | | | | | | | |
| | | Net assets | | | Shares
outstanding | | | Net asset value
per share (a) | |
Class A | | | $3,981,262 | | | | 370,331 | | | | $10.75 | |
Class B | | | 445,770 | | | | 41,680 | | | | 10.70 | |
Class C | | | 453,110 | | | | 42,368 | | | | 10.69 | |
Class I | | | 2,684,958 | | | | 249,476 | | | | 10.76 | |
Class R1 | | | 108,203 | | | | 10,109 | | | | 10.70 | |
Class R2 | | | 112,187 | | | | 10,442 | | | | 10.74 | |
Class R3 | | | 109,625 | | | | 10,193 | | | | 10.76 | |
Class R4 | | | 110,102 | | | | 10,232 | | | | 10.76 | |
Class R5 | | | 27,802,386 | | | | 2,584,167 | | | | 10.76 | |
Shares outstanding are rounded for presentation purposes.
| (a) | Maximum offering price per share was equal to the net asset value per share for all share classes, except for Class A, for which the maximum offering price per share was $11.41 [100 / 94.25 x $10.75]. On sales of $50,000 or more, the maximum offering price of Class A shares is reduced. A contingent deferred sales charge may be imposed on redemptions of Class A, Class B, and Class C shares. Redemption price per share was equal to the net asset value per share for Classes I, R1, R2, R3, R4, and R5. |
See Notes to Financial Statements
18
Financial Statements
STATEMENT OF OPERATIONS
Year ended 8/31/15
This statement describes how much your fund earned in investment income and accrued in expenses. It also describes any gains and/or losses generated by fund operations.
| | | | |
| Net investment income | | | | |
Income | | | | |
Dividends | | | $1,117,843 | |
Dividends from underlying affiliated funds | | | 747 | |
Foreign taxes withheld | | | (60,282 | ) |
Total investment income | | | $1,058,308 | |
Expenses | | | | |
Management fee | | | $338,779 | |
Distribution and service fees | | | 27,407 | |
Shareholder servicing costs | | | 8,990 | |
Administrative services fee | | | 17,500 | |
Independent Trustees’ compensation | | | 1,255 | |
Custodian fee | | | 50,051 | |
Shareholder communications | | | 10,188 | |
Audit and tax fees | | | 52,946 | |
Legal fees | | | 277 | |
Registration fees | | | 121,276 | |
Miscellaneous | | | 13,701 | |
Total expenses | | | $642,370 | |
Fees paid indirectly | | | (6 | ) |
Reduction of expenses by investment adviser and distributor | | | (246,583 | ) |
Net expenses | | | $395,781 | |
Net investment income | | | $662,527 | |
| Realized and unrealized gain (loss) on investments and foreign currency | |
Realized gain (loss) (identified cost basis) | | | | |
Investments | | | $(614,794 | ) |
Foreign currency | | | (14,251 | ) |
Net realized gain (loss) on investments and foreign currency | | | $(629,045 | ) |
Change in unrealized appreciation (depreciation) | | | | |
Investments | | | $(321,962 | ) |
Translation of assets and liabilities in foreign currencies | | | (709 | ) |
Net unrealized gain (loss) on investments and foreign currency translation | | | $(322,671 | ) |
Net realized and unrealized gain (loss) on investments and foreign currency | | | $(951,716 | ) |
Change in net assets from operations | | | $(289,189 | ) |
See Notes to Financial Statements
19
Financial Statements
STATEMENTS OF CHANGES IN NET ASSETS
These statements describe the increases and/or decreases in net assets resulting from operations, any distributions, and any shareholder transactions.
| | | | | | | | |
| Change in net assets | | Year ended
8/31/15 | | | Period ended
8/31/14 (c) | |
| From operations | | | | | | | | |
Net investment income | | | $662,527 | | | | $31,198 | |
Net realized gain (loss) on investments and foreign currency | | | (629,045 | ) | | | 44,888 | |
Net unrealized gain (loss) on investments and foreign currency translation | | | (322,671 | ) | | | 170,024 | |
Change in net assets from operations | | | $(289,189 | ) | | | $246,110 | |
| Distributions declared to shareholders | | | | | | | | |
From net investment income | | | $(496,543 | ) | | | $(21,333 | ) |
From net realized gain on investments | | | (47,180 | ) | | | — | |
Total distributions declared to shareholders | | | $(543,723 | ) | | | $(21,333 | ) |
Change in net assets from fund share transactions | | | $29,050,145 | | | | $7,365,593 | |
Total change in net assets | | | $28,217,233 | | | | $7,590,370 | |
| Net assets | | | | | | | | |
At beginning of period | | | 7,590,370 | | | | — | |
At end of period (including undistributed net investment income of $184,618 and $8,741, respectively) | | | $35,807,603 | | | | $7,590,370 | |
| (c) | For the period from the commencement of the fund’s investment operations, December 5, 2013, through the stated period end. |
See Notes to Financial Statements
20
Financial Statements
FINANCIAL HIGHLIGHTS
The financial highlights table is intended to help you understand the fund’s financial performance for the past 5 years (or life of a particular share class, if shorter). Certain information reflects financial results for a single fund share. The total returns in the table represent the rate by which an investor would have earned (or lost) on an investment in the fund share class (assuming reinvestment of all distributions) held for the entire period.
| | | | | | | | |
| Class A | | Year ended
2015 | | | Period ended
8/31/14 (c) | |
Net asset value, beginning of period | | | $10.92 | | | | $10.00 | |
| Income (loss) from investment operations | | | | | |
Net investment income (d) | | | $0.19 | | | | $0.15 | |
Net realized and unrealized gain (loss) on investments and
foreign currency | | | (0.22 | ) | | | 0.86 | |
Total from investment operations | | | $(0.03 | ) | | | $1.01 | |
| Less distributions declared to shareholders | | | | | |
From net investment income | | | $(0.12 | ) | | | $(0.09 | ) |
From net realized gain on investments | | | (0.02 | ) | | | — | |
Total distributions declared to shareholders | | | $(0.14 | ) | | | $(0.09 | ) |
Net asset value, end of period (x) | | | $10.75 | | | | $10.92 | |
Total return (%) (r)(s)(t)(x) | | | (0.36 | ) | | | 10.13 | (n) |
Ratios (%) (to average net assets)
and Supplemental data: | | | | | |
Expenses before expense reductions (f) | | | 1.88 | | | | 5.81 | (a) |
Expenses after expense reductions (f) | | | 1.23 | | | | 1.22 | (a) |
Net investment income | | | 1.65 | | | | 1.86 | (a) |
Portfolio turnover | | | 61 | | | | 28 | (n) |
Net assets at end of period (000 omitted) | | | $3,981 | | | | $800 | |
See Notes to Financial Statements
21
Financial Highlights – continued
| | | | | | | | |
| Class B | | Year ended
2015 | | | Period ended
8/31/14 (c) | |
Net asset value, beginning of period | | | $10.91 | | | | $10.00 | |
| Income (loss) from investment operations | | | | | |
Net investment income (d) | | | $0.08 | | | | $0.06 | |
Net realized and unrealized gain (loss) on investments and
foreign currency | | | (0.20 | ) | | | 0.89 | |
Total from investment operations | | | $(0.12 | ) | | | $0.95 | |
| Less distributions declared to shareholders | | | | | |
From net investment income | | | $(0.07 | ) | | | $(0.04 | ) |
From net realized gain on investments | | | (0.02 | ) | | | — | |
Total distributions declared to shareholders | | | $(0.09 | ) | | | $(0.04 | ) |
Net asset value, end of period (x) | | | $10.70 | | | | $10.91 | |
Total return (%) (r)(s)(t)(x) | | | (1.16 | ) | | | 9.50 | (n) |
Ratios (%) (to average net assets)
and Supplemental data: | | | | | |
Expenses before expense reductions (f) | | | 2.68 | | | | 6.87 | (a) |
Expenses after expense reductions (f) | | | 2.01 | | | | 2.07 | (a) |
Net investment income | | | 0.74 | | | | 0.80 | (a) |
Portfolio turnover | | | 61 | | | | 28 | (n) |
Net assets at end of period (000 omitted) | | | $446 | | | | $116 | |
| | |
| Class C | | Year ended
2015 | | | Period ended
8/31/14 (c) | |
Net asset value, beginning of period | | | $10.91 | | | | $10.00 | |
| Income (loss) from investment operations | | | | | | | | |
Net investment income (d) | | | $0.10 | | | | $0.06 | |
Net realized and unrealized gain (loss) on investments and
foreign currency | | | (0.23 | ) | | | 0.89 | |
Total from investment operations | | | $(0.13 | ) | | | $0.95 | |
| Less distributions declared to shareholders | | | | | |
From net investment income | | | $(0.07 | ) | | | $(0.04 | ) |
From net realized gain on investments | | | (0.02 | ) | | | — | |
Total distributions declared to shareholders | | | $(0.09 | ) | | | $(0.04 | ) |
Net asset value, end of period (x) | | | $10.69 | | | | $10.91 | |
Total return (%) (r)(s)(t)(x) | | | (1.23 | ) | | | 9.50 | (n) |
Ratios (%) (to average net assets)
and Supplemental data: | | | | | |
Expenses before expense reductions (f) | | | 2.66 | | | | 6.85 | (a) |
Expenses after expense reductions (f) | | | 2.00 | | | | 2.07 | (a) |
Net investment income | | | 0.89 | | | | 0.82 | (a) |
Portfolio turnover | | | 61 | | | | 28 | (n) |
Net assets at end of period (000 omitted) | | | $453 | | | | $130 | |
See Notes to Financial Statements
22
Financial Highlights – continued
| | | | | | | | |
| Class I | | Year ended
2015 | | | Period ended
8/31/14 (c) | |
Net asset value, beginning of period | | | $10.93 | | | | $10.00 | |
| Income (loss) from investment operations | | | | | | | | |
Net investment income (d) | | | $0.24 | | | | $0.14 | |
Net realized and unrealized gain (loss) on investments and
foreign currency | | | (0.25 | ) | | | 0.89 | |
Total from investment operations | | | $(0.01 | ) | | | $1.03 | |
| Less distributions declared to shareholders | | | | | | | | |
From net investment income | | | $(0.14 | ) | | | $(0.10 | ) |
From net realized gain on investments | | | (0.02 | ) | | | — | |
Total distributions declared to shareholders | | | $(0.16 | ) | | | $(0.10 | ) |
Net asset value, end of period (x) | | | $10.76 | | | | $10.93 | |
Total return (%) (r)(s)(x) | | | (0.18 | ) | | | 10.29 | (n) |
Ratios (%) (to average net assets)
and Supplemental data: | | | | | | | | |
Expenses before expense reductions (f) | | | 1.63 | | | | 5.85 | (a) |
Expenses after expense reductions (f) | | | 1.00 | | | | 1.07 | (a) |
Net investment income | | | 2.10 | | | | 1.81 | (a) |
Portfolio turnover | | | 61 | | | | 28 | (n) |
Net assets at end of period (000 omitted) | | | $2,685 | | | | $138 | |
| | |
| Class R1 | | Year ended
2015 | | | Period ended
8/31/14 (c) | |
Net asset value, beginning of period | | | $10.91 | | | | $10.00 | |
| Income (loss) from investment operations | | | | | | | | |
Net investment income (d) | | | $0.07 | | | | $0.06 | |
Net realized and unrealized gain (loss) on investments and
foreign currency | | | (0.19 | ) | | | 0.89 | |
Total from investment operations | | | $(0.12 | ) | | | $0.95 | |
| Less distributions declared to shareholders | | | | | | | | |
From net investment income | | | $(0.07 | ) | | | $(0.04 | ) |
From net realized gain on investments | | | (0.02 | ) | | | — | |
Total distributions declared to shareholders | | | $(0.09 | ) | | | $(0.04 | ) |
Net asset value, end of period (x) | | | $10.70 | | | | $10.91 | |
Total return (%) (r)(s)(x) | | | (1.22 | ) | | | 9.50 | (n) |
Ratios (%) (to average net assets)
and Supplemental data: | | | | | | | | |
Expenses before expense reductions (f) | | | 2.69 | | | | 6.89 | (a) |
Expenses after expense reductions (f) | | | 2.01 | | | | 2.07 | (a) |
Net investment income | | | 0.66 | | | | 0.79 | (a) |
Portfolio turnover | | | 61 | | | | 28 | (n) |
Net assets at end of period (000 omitted) | | | $108 | | | | $109 | |
See Notes to Financial Statements
23
Financial Highlights – continued
| | | | | | | | |
| Class R2 | | Year ended
2015 | | | Period ended
8/31/14 (c) | |
Net asset value, beginning of period | | | $10.92 | | | | $10.00 | |
| Income (loss) from investment operations | | | | | | | | |
Net investment income (d) | | | $0.13 | | | | $0.10 | |
Net realized and unrealized gain (loss) on investments and
foreign currency | | | (0.20 | ) | | | 0.89 | |
Total from investment operations | | | $(0.07 | ) | | | $0.99 | |
| Less distributions declared to shareholders | | | | | | | | |
From net investment income | | | $(0.09 | ) | | | $(0.07 | ) |
From net realized gain on investments | | | (0.02 | ) | | | — | |
Total distributions declared to shareholders | | | $(0.11 | ) | | | $(0.07 | ) |
Net asset value, end of period (x) | | | $10.74 | | | | $10.92 | |
Total return (%) (r)(s)(x) | | | (0.71 | ) | | | 9.89 | (n) |
Ratios (%) (to average net assets)
and Supplemental data: | | | | | | | | |
Expenses before expense reductions (f) | | | 2.19 | | | | 6.39 | (a) |
Expenses after expense reductions (f) | | | 1.51 | | | | 1.57 | (a) |
Net investment income | | | 1.16 | | | | 1.29 | (a) |
Portfolio turnover | | | 61 | | | | 28 | (n) |
Net assets at end of period (000 omitted) | | | $112 | | | | $110 | |
| | |
| Class R3 | | Year ended
2015 | | | Period ended
8/31/14 (c) | |
Net asset value, beginning of period | | | $10.92 | | | | $10.00 | |
| Income (loss) from investment operations | | | | | | | | |
Net investment income (d) | | | $0.16 | | | | $0.12 | |
Net realized and unrealized gain (loss) on investments and
foreign currency | | | (0.19 | ) | | | 0.88 | |
Total from investment operations | | | $(0.03 | ) | | | $1.00 | |
| Less distributions declared to shareholders | | | | | | | | |
From net investment income | | | $(0.11 | ) | | | $(0.08 | ) |
From net realized gain on investments | | | (0.02 | ) | | | — | |
Total distributions declared to shareholders | | | $(0.13 | ) | | | $(0.08 | ) |
Net asset value, end of period (x) | | | $10.76 | | | | $10.92 | |
Total return (%) (r)(s)(x) | | | (0.34 | ) | | | 10.04 | (n) |
Ratios (%) (to average net assets)
and Supplemental data: | | | | | | | | |
Expenses before expense reductions (f) | | | 1.94 | | | | 6.14 | (a) |
Expenses after expense reductions (f) | | | 1.26 | | | | 1.32 | (a) |
Net investment income | | | 1.41 | | | | 1.54 | (a) |
Portfolio turnover | | | 61 | | | | 28 | (n) |
Net assets at end of period (000 omitted) | | | $110 | | | | $110 | |
See Notes to Financial Statements
24
Financial Highlights – continued
| | | | | | | | |
| Class R4 | | Year ended
2015 | | | Period ended
8/31/14 (c) | |
Net asset value, beginning of period | | | $10.93 | | | | $10.00 | |
| Income (loss) from investment operations | | | | | | | | |
Net investment income (d) | | | $0.19 | | | | $0.14 | |
Net realized and unrealized gain (loss) on investments and
foreign currency | | | (0.20 | ) | | | 0.89 | |
Total from investment operations | | | $(0.01 | ) | | | $1.03 | |
| Less distributions declared to shareholders | | | | | | | | |
From net investment income | | | $(0.14 | ) | | | $(0.10 | ) |
From net realized gain on investments | | | (0.02 | ) | | | — | |
Total distributions declared to shareholders | | | $(0.16 | ) | | | $(0.10 | ) |
Net asset value, end of period (x) | | | $10.76 | | | | $10.93 | |
Total return (%) (r)(s)(x) | | | (0.18 | ) | | | 10.29 | (n) |
Ratios (%) (to average net assets)
and Supplemental data: | | | | | | | | |
Expenses before expense reductions (f) | | | 1.69 | | | | 5.89 | (a) |
Expenses after expense reductions (f) | | | 1.02 | | | | 1.07 | (a) |
Net investment income | | | 1.66 | | | | 1.79 | (a) |
Portfolio turnover | | | 61 | | | | 28 | (n) |
Net assets at end of period (000 omitted) | | | $110 | | | | $110 | |
| | |
| Class R5 | | Year ended
2015 | | | Period ended
8/31/14 (c) | |
Net asset value, beginning of period | | | $10.92 | | | | $10.00 | |
| Income (loss) from investment operations | | | | | | | | |
Net investment income (d) | | | $0.20 | | | | $0.14 | |
Net realized and unrealized gain (loss) on investments and
foreign currency | | | (0.20 | ) | | | 0.88 | |
Total from investment operations | | | $— | | | | $1.02 | |
| Less distributions declared to shareholders | | | | | | | | |
From net investment income | | | $(0.14 | ) | | | $(0.10 | ) |
From net realized gain on investments | | | (0.02 | ) | | | — | |
Total distributions declared to shareholders | | | $(0.16 | ) | | | $(0.10 | ) |
Net asset value, end of period (x) | | | $10.76 | | | | $10.92 | |
Total return (%) (r)(s)(x) | | | (0.09 | ) | | | 10.21 | (n) |
Ratios (%) (to average net assets)
and Supplemental data: | | | | | | | | |
Expenses before expense reductions (f) | | | 1.63 | | | | 5.88 | (a) |
Expenses after expense reductions (f) | | | 0.97 | | | | 1.06 | (a) |
Net investment income | | | 1.79 | | | | 1.80 | (a) |
Portfolio turnover | | | 61 | | | | 28 | (n) |
Net assets at end of period (000 omitted) | | | $27,802 | | | | $5,966 | |
See Notes to Financial Statements
25
Financial Highlights – continued
| (c) | For the period from the commencement of the fund’s investment operations, December 5, 2013, through the stated period end. |
| (d) | Per share data is based on average shares outstanding. |
| (f) | Ratios do not reflect reductions from fees paid indirectly, if applicable. |
| (r) | Certain expenses have been reduced without which performance would have been lower. |
| (s) | From time to time the fund may receive proceeds from litigation settlements, without which performance would be lower. |
| (t) | Total returns do not include any applicable sales charges. |
| (x) | The net asset values per share and total returns have been calculated on net asset values which include adjustments made in accordance with U.S. generally accepted accounting principles required at period end for financial reporting purposes. |
See Notes to Financial Statements
26
NOTES TO FINANCIAL STATEMENTS
(1) Business and Organization
MFS Low Volatility Global Equity Fund (the fund) is a diversified series of MFS Series Trust I (the trust). The trust is organized as a Massachusetts business trust and is registered under the Investment Company Act of 1940, as amended, as an open-end management investment company.
The fund is an investment company and accordingly follows the investment company accounting and reporting guidance of the Financial Accounting Standards Board (FASB) Accounting Standards Codification Topic 946 Financial Services – Investment Companies.
(2) Significant Accounting Policies
General – The preparation of financial statements in conformity with U.S. generally accepted accounting principles requires management to make estimates and assumptions that affect the reported amounts of assets and liabilities, and disclosure of contingent assets and liabilities at the date of the financial statements and the reported amounts of increases and decreases in net assets from operations during the reporting period. Actual results could differ from those estimates. In the preparation of these financial statements, management has evaluated subsequent events occurring after the date of the fund’s Statement of Assets and Liabilities through the date that the financial statements were issued. The fund invests in foreign securities. Investments in foreign securities are vulnerable to the effects of changes in the relative values of the local currency and the U.S. dollar and to the effects of changes in each country’s legal, political, and economic environment.
In June 2014, FASB issued Accounting Standards Update 2014-11, Transfers and Servicing (Topic 860) – Repurchase-to-Maturity Transactions, Repurchase Financings, and Disclosures (“ASU 2014-11”). ASU 2014-11 changes the accounting for repurchase-to-maturity transactions (i.e., repurchase agreements that settle at the same time as the maturity of the transferred financial asset) and enhances the required disclosures for repurchase agreements and other similar transactions. Although still evaluating the potential impacts of ASU 2014-11 to the fund, management expects that the impact of the fund’s adoption will be limited to additional financial statement disclosures which would first be effective for interim reporting periods beginning after March 15, 2015.
Balance Sheet Offsetting – The fund’s accounting policy with respect to balance sheet offsetting is that, absent an event of default by the counterparty or a termination of the agreement, the International Swaps and Derivatives Association (ISDA) Master Agreement does not result in an offset of reported amounts of financial assets and financial liabilities in the Statement of Assets and Liabilities across transactions between the fund and the applicable counterparty. The fund’s right to setoff may be restricted or prohibited by the bankruptcy or insolvency laws of the particular jurisdiction to which a specific master netting agreement counterparty is subject. Balance sheet offsetting disclosures, to the extent applicable to the fund, have been included in the fund’s Significant Accounting Policies note under the captions for each of the fund’s in-scope financial instruments and transactions.
27
Notes to Financial Statements – continued
Investment Valuations – Equity securities, including restricted equity securities, are generally valued at the last sale or official closing price as provided by a third-party pricing service on the market or exchange on which they are primarily traded. Equity securities, for which there were no sales reported that day, are generally valued at the last quoted daily bid quotation as provided by a third-party pricing service on the market or exchange on which such securities are primarily traded. Short-term instruments with a maturity at issuance of 60 days or less may be valued at amortized cost, which approximates market value. Open-end investment companies are generally valued at net asset value per share. Securities and other assets generally valued on the basis of information from a third-party pricing service may also be valued at a broker/dealer bid quotation. Values obtained from third-party pricing services can utilize both transaction data and market information such as yield, quality, coupon rate, maturity, type of issue, trading characteristics, and other market data. The values of foreign securities and other assets and liabilities expressed in foreign currencies are converted to U.S. dollars using the mean of bid and asked prices for rates provided by a third-party pricing service.
The Board of Trustees has delegated primary responsibility for determining or causing to be determined the value of the fund’s investments (including any fair valuation) to the adviser pursuant to valuation policies and procedures approved by the Board. If the adviser determines that reliable market quotations are not readily available, investments are valued at fair value as determined in good faith by the adviser in accordance with such procedures under the oversight of the Board of Trustees. Under the fund’s valuation policies and procedures, market quotations are not considered to be readily available for most types of debt instruments and floating rate loans and many types of derivatives. These investments are generally valued at fair value based on information from third-party pricing services. In addition, investments may be valued at fair value if the adviser determines that an investment’s value has been materially affected by events occurring after the close of the exchange or market on which the investment is principally traded (such as foreign exchange or market) and prior to the determination of the fund’s net asset value, or after the halting of trading of a specific security where trading does not resume prior to the close of the exchange or market on which the security is principally traded. Events that occur on a frequent basis after foreign markets close (such as developments in foreign markets and significant movements in the U.S. markets) and prior to the determination of the fund’s net asset value may be deemed to have a material effect on the value of securities traded in foreign markets. Accordingly, the fund’s foreign equity securities may often be valued at fair value. The adviser generally relies on third-party pricing services or other information (such as the correlation with price movements of similar securities in the same or other markets; the type, cost and investment characteristics of the security; the business and financial condition of the issuer; and trading and other market data) to assist in determining whether to fair value and at what value to fair value an investment. The value of an investment for purposes of calculating the fund’s net asset value can differ depending on the source and method used to determine value. When fair valuation is used, the value of an investment used to determine the fund’s net asset value may differ from quoted or published prices for the same investment. There can be no assurance that
28
Notes to Financial Statements – continued
the fund could obtain the fair value assigned to an investment if it were to sell the investment at the same time at which the fund determines its net asset value per share.
Various inputs are used in determining the value of the fund’s assets or liabilities. These inputs are categorized into three broad levels. In certain cases, the inputs used to measure fair value may fall into different levels of the fair value hierarchy. In such cases, an investment’s level within the fair value hierarchy is based on the lowest level of input that is significant to the fair value measurement. The fund’s assessment of the significance of a particular input to the fair value measurement in its entirety requires judgment, and considers factors specific to the investment. Level 1 includes unadjusted quoted prices in active markets for identical assets or liabilities. Level 2 includes other significant observable market-based inputs (including quoted prices for similar securities, interest rates, prepayment speed, and credit risk). Level 3 includes unobservable inputs, which may include the adviser’s own assumptions in determining the fair value of investments. The following is a summary of the levels used as of August 31, 2015 in valuing the fund’s assets or liabilities:
| | | | | | | | | | | | | | | | |
| Investments at Value | | Level 1 | | | Level 2 | | | Level 3 | | | Total | |
| Equity Securities: | | | | | | | | | | | | | | | | |
United States | | | $17,188,422 | | | | $— | | | | $— | | | | $17,188,422 | |
Japan | | | 3,788,604 | | | | — | | | | — | | | | 3,788,604 | |
Switzerland | | | 2,053,014 | | | | — | | | | — | | | | 2,053,014 | |
Hong Kong | | | 1,794,627 | | | | — | | | | — | | | | 1,794,627 | |
United Kingdom | | | 441,448 | | | | 1,229,062 | | | | — | | | | 1,670,510 | |
Canada | | | 1,587,931 | | | | — | | | | — | | | | 1,587,931 | |
Taiwan | | | 1,529,145 | | | | — | | | | — | | | | 1,529,145 | |
Israel | | | 1,047,423 | | | | — | | | | — | | | | 1,047,423 | |
New Zealand | | | 805,034 | | | | — | | | | — | | | | 805,034 | |
Other Countries | | | 2,902,201 | | | | 899,074 | | | | — | | | | 3,801,275 | |
| Mutual Funds | | | 563,630 | | | | — | | | | — | | | | 563,630 | |
| Total Investments | | | $33,701,479 | | | | $2,128,136 | | | | $— | | | | $35,829,615 | |
For further information regarding security characteristics, see the Portfolio of Investments.
Of the level 2 investments presented above, equity investments amounting to $1,687,925 would have been considered level 1 investments at the beginning of the period. The primary reason for changes in the classifications between levels 1 and 2 occurs when foreign equity securities are fair valued using other observable market-based inputs in place of the closing exchange price due to events occurring after the close of the exchange or market on which the investment is principally traded. The fund’s foreign equity securities may often be valued at fair value. The fund’s policy is to recognize transfers between the levels as of the end of the period.
Foreign Currency Translation – Purchases and sales of foreign investments, income, and expenses are converted into U.S. dollars based upon currency exchange rates prevailing on the respective dates of such transactions or on the reporting date for foreign denominated receivables and payables. Gains and losses attributable to foreign currency exchange rates on sales of securities are recorded for financial statement purposes as net realized gains and losses on investments. Gains and losses attributable
29
Notes to Financial Statements – continued
to foreign exchange rate movements on receivables, payables, income and expenses are recorded for financial statement purposes as foreign currency transaction gains and losses. That portion of both realized and unrealized gains and losses on investments that results from fluctuations in foreign currency exchange rates is not separately disclosed.
Indemnifications – Under the fund’s organizational documents, its officers and Trustees may be indemnified against certain liabilities and expenses arising out of the performance of their duties to the fund. Additionally, in the normal course of business, the fund enters into agreements with service providers that may contain indemnification clauses. The fund’s maximum exposure under these agreements is unknown as this would involve future claims that may be made against the fund that have not yet occurred.
Investment Transactions and Income – Investment transactions are recorded on the trade date. Dividends received in cash are recorded on the ex-dividend date. Certain dividends from foreign securities will be recorded when the fund is informed of the dividend if such information is obtained subsequent to the ex-dividend date. Dividend payments received in additional securities are recorded on the ex-dividend date in an amount equal to the value of the security on such date.
The fund may receive proceeds from litigation settlements. Any proceeds received from litigation involving portfolio holdings are reflected in the Statement of Operations in realized gain/loss if the security has been disposed of by the fund or in unrealized gain/loss if the security is still held by the fund. Any other proceeds from litigation not related to portfolio holdings are reflected as other income in the Statement of Operations.
Fees Paid Indirectly – The fund’s custody fee may be reduced by a credit earned under an arrangement that measures the value of U.S. dollars deposited with the custodian by the fund. The amount of the credit, for the year ended August 31, 2015, is shown as a reduction of total expenses in the Statement of Operations.
Tax Matters and Distributions – The fund intends to qualify as a regulated investment company, as defined under Subchapter M of the Internal Revenue Code, and to distribute all of its taxable income, including realized capital gains. As a result, no provision for federal income tax is required. The fund’s federal tax returns, when filed, will remain subject to examination by the Internal Revenue Service for a three year period. Management has analyzed the fund’s tax positions taken on federal and state tax returns for all open tax years and does not believe that there are any uncertain tax positions that require recognition of a tax liability. Foreign taxes, if any, have been accrued by the fund in the accompanying financial statements in accordance with the applicable foreign tax law. Foreign income taxes may be withheld by certain countries in which the fund invests. Additionally, capital gains realized by the fund on securities issued in or by certain foreign countries may be subject to capital gains tax imposed by those countries.
Distributions to shareholders are recorded on the ex-dividend date. Income and capital gain distributions are determined in accordance with income tax regulations, which may differ from U.S. generally accepted accounting principles. Certain capital accounts in the financial statements are periodically adjusted for permanent differences in order
30
Notes to Financial Statements – continued
to reflect their tax character. These adjustments have no impact on net assets or net asset value per share. Temporary differences which arise from recognizing certain items of income, expense, gain or loss in different periods for financial statement and tax purposes will reverse at some time in the future. Distributions in excess of net investment income or net realized gains are temporary overdistributions for financial statement purposes resulting from differences in the recognition or classification of income or distributions for financial statement and tax purposes.
Book/tax differences primarily relate to passive foreign investment companies and wash sale loss deferrals.
The tax character of distributions declared to shareholders for the last two fiscal years is as follows:
| | | | | | | | |
| | | 8/31/15 | | | 8/31/14 | |
| Ordinary income (including any short-term capital gains) | | | $543,723 | | | | $21,333 | |
The federal tax cost and the tax basis components of distributable earnings were as follows:
| | | | |
| As of 8/31/15 | | | |
| Cost of investments | | | $36,203,668 | |
| Gross appreciation | | | 2,153,493 | |
| Gross depreciation | | | (2,527,546 | ) |
| Net unrealized appreciation (depreciation) | | | $(374,053 | ) |
| Undistributed ordinary income | | | 184,618 | |
| Capital loss carryforwards | | | (416,982 | ) |
| Other temporary differences | | | (746 | ) |
As of August 31, 2015, the fund had capital loss carryforwards available to offset future realized gains. Such losses are characterized as follows:
Under the Regulated Investment Company Modernization Act of 2010 (the “Act”), the above net capital losses may be carried forward indefinitely, and their character is retained as short-term and/or long-term losses. Previously, net capital losses were carried forward for eight years and treated as short-term losses.
Multiple Classes of Shares of Beneficial Interest – The fund offers multiple classes of shares, which differ in their respective distribution and service fees. The fund’s income, realized and unrealized gain (loss), and common expenses are allocated to shareholders based on the daily net assets of each class. Dividends are declared separately for each class. Differences in per share dividend rates are generally due to differences in separate class expenses. Class B shares will convert to Class A shares
31
Notes to Financial Statements – continued
approximately eight years after purchase. The fund’s distributions declared to shareholders as reported in the Statements of Changes in Net Assets are presented by class as follows:
| | | | | | | | | | | | | | | | |
| | | From net investment
income | | | From net realized gain on
investments | |
| | | Year
ended
8/31/15 | | | Period
ended
8/31/14 (c) | | | Year
ended
8/31/15 | | | Period
ended
8/31/14 (c) | |
| Class A | | | $109,668 | | | | $2,891 | | | | $12,199 | | | | $— | |
| Class B | | | 1,209 | | | | 389 | | | | 202 | | | | — | |
| Class C | | | 2,444 | | | | 403 | | | | 208 | | | | — | |
| Class I | | | 35,776 | | | | 1,071 | | | | 1,445 | | | | — | |
| Class R1 | | | 654 | | | | 389 | | | | 160 | | | | — | |
| Class R2 | | | 941 | | | | 673 | | | | 160 | | | | — | |
| Class R3 | | | 1,143 | | | | 816 | | | | 160 | | | | — | |
| Class R4 | | | 1,425 | | | | 959 | | | | 161 | | | | — | |
| Class R5 | | | 343,283 | | | | 13,742 | | | | 32,485 | | | | — | |
| Total | | | $496,543 | | | | $21,333 | | | | $47,180 | | | | $— | |
| (c) | For the period from the commencement of the fund’s investment operations, December 5, 2013, through the stated period end. |
(3) Transactions with Affiliates
Investment Adviser – The fund has an investment advisory agreement with MFS to provide overall investment management and related administrative services and facilities to the fund. The management fee is computed daily and paid monthly at the following annual rates:
| | | | |
| First $1 billion of average daily net assets | | | 0.90 | % |
| Next $1.5 billion of average daily net assets | | | 0.75 | % |
| Average daily net assets in excess of $2.5 billion | | | 0.65 | % |
The investment adviser had agreed in writing to reduce its management fee to 0.75% of average daily net assets for the first $1 billion, and 0.70% of average daily net assets in excess of $1 billion. This written agreement expired on December 28, 2014. For the period September 1, 2014 through December 28, 2014, this management fee reduction amounted to $12,751, which is included in the reduction of total expenses in the Statement of Operations. Effective December 29, 2014, the investment adviser has agreed in writing to reduce its management fee to 0.65% of average daily net assets. This written agreement will continue until modified by the fund’s Board of Trustees, but such agreement will continue at least until December 31, 2016. For the period December 29, 2014 through August 31, 2015, this management fee reduction amounted to $72,854 which is included in the reduction of total expenses in the Statement of Operations. MFS has also agreed in writing to reduce its management fee by a specified amount if certain MFS mutual fund assets exceed thresholds agreed to by MFS and the fund’s Board of Trustees. For the year ended August 31, 2015, this management fee reduction amounted to $2,472, which is included in the reduction of total expenses in the Statement of Operations. The management fee incurred for the year ended August 31, 2015 was equivalent to an annual effective rate of 0.67% of the fund’s average daily net assets.
32
Notes to Financial Statements – continued
The investment adviser had agreed in writing to pay a portion of the fund’s total annual operating expenses, excluding interest, taxes, extraordinary expenses, brokerage and transaction costs, and investment-related expenses, such that total fund operating expenses do not exceed the following rates annually of each class’s average daily net assets:
| | | | | | | | | | | | | | | | | | | | | | | | | | | | | | | | | | |
| Classes | |
| A | | | B | | | C | | | I | | | R1 | | | R2 | | | R3 | | | R4 | | | R5 | |
| | 1.35% | | | | 2.10% | | | | 2.10% | | | | 1.10% | | | | 2.10% | | | | 1.60% | | | | 1.35% | | | | 1.10% | | | | 1.06% | |
This written agreement expired on December 28, 2014. For the period September 1, 2014 through December 28, 2014, this reduction amounted to $46,218, which is included in the reduction of total expenses in the Statement of Operations. Effective December 29, 2014, the investment adviser has agreed in writing to pay a portion of the fund’s total annual operating expenses, excluding interest, taxes, extraordinary expenses, brokerage and transaction costs, and investment-related expenses, such that total fund operating expenses do not exceed the following rates annually of each class’s average daily net assets:
| | | | | | | | | | | | | | | | | | | | | | | | | | | | | | | | | | |
| Classes | |
| A | | | B | | | C | | | I | | | R1 | | | R2 | | | R3 | | | R4 | | | R5 | |
| | 1.24% | | | | 1.99% | | | | 1.99% | | | | 0.99% | | | | 1.99% | | | | 1.49% | | | | 1.24% | | | | 0.99% | | | | 0.95% | |
This written agreement will continue until modified by the fund’s Board of Trustees, but such agreement will continue at least until December 31, 2016. For the period December 29, 2014 through August 31, 2015, this reduction amounted to $110,618, which is included in the reduction of total expenses in the Statement of Operations.
Distributor – MFS Fund Distributors, Inc. (MFD), a wholly-owned subsidiary of MFS, as distributor, received $8,251 for the year ended August 31, 2015, as its portion of the initial sales charge on sales of Class A shares of the fund.
The Board of Trustees has adopted a distribution plan for certain share classes pursuant to Rule 12b-1 of the Investment Company Act of 1940.
The fund’s distribution plan provides that the fund will pay MFD for services provided by MFD and financial intermediaries in connection with the distribution and servicing of certain share classes. One component of the plan is a distribution fee paid to MFD and another component of the plan is a service fee paid to MFD. MFD may subsequently pay all, or a portion, of the distribution and/or service fees to financial intermediaries.
Distribution Plan Fee Table:
| | | | | | | | | | | | | | | | | | | | |
| | | Distribution
Fee Rate (d) | | | Service
Fee Rate (d) | | | Total
Distribution
Plan (d) | | | Annual
Effective
Rate (e) | | | Distribution
and Service
Fee | |
| Class A | | | — | | | | 0.25% | | | | 0.25% | | | | 0.23% | | | | $20,961 | |
| Class B | | | 0.75% | | | | 0.25% | | | | 1.00% | | | | 1.00% | | | | 1,761 | |
| Class C | | | 0.75% | | | | 0.25% | | | | 1.00% | | | | 1.00% | | | | 2,711 | |
| Class R1 | | | 0.75% | | | | 0.25% | | | | 1.00% | | | | 1.00% | | | | 1,123 | |
| Class R2 | | | 0.25% | | | | 0.25% | | | | 0.50% | | | | 0.50% | | | | 568 | |
| Class R3 | | | — | | | | 0.25% | | | | 0.25% | | | | 0.25% | | | | 283 | |
| Total Distribution and Service Fees | | | | $27,407 | |
33
Notes to Financial Statements – continued
| (d) | In accordance with the distribution plan for certain classes, the fund pays distribution and/or service fees equal to these annual percentage rates of each class’s average daily net assets. The distribution and service fee rates disclosed by class represent the current rates in effect at the end of the reporting period. Any rate changes, if applicable, are detailed below. |
| (e) | MFD has voluntarily agreed to rebate a portion of each class’s 0.25% service fee attributable to accounts for which MFD retains the 0.25% service fee except for accounts attributable to MFS or its affiliates’ seed money. For the year ended August 31, 2015, this rebate amounted to $1,666 for Class A, and is included in the reduction of total expenses in the Statement of Operations. |
Certain Class A shares are subject to a contingent deferred sales charge (CDSC) in the event of a shareholder redemption within 18 months of purchase. Class C shares are subject to a CDSC in the event of a shareholder redemption within 12 months of purchase. Class B shares are subject to a CDSC in the event of a shareholder redemption within six years of purchase. All contingent deferred sales charges are paid to MFD and during the year ended August 31, 2015, were as follows:
Shareholder Servicing Agent – MFS Service Center, Inc. (MFSC), a wholly-owned subsidiary of MFS, receives a fee from the fund for its services as shareholder servicing agent calculated as a percentage of the average daily net assets of the fund as determined periodically under the supervision of the fund’s Board of Trustees. For the year ended August 31, 2015, the fee was $3,419, which equated to 0.0091% annually of the fund’s average daily net assets. MFSC also receives payment from the fund for out-of-pocket expenses, sub-accounting and other shareholder servicing costs which may be paid to affiliated and unaffiliated service providers. Class R5 shares do not incur sub-accounting fees. For the year ended August 31, 2015, these out-of-pocket expenses, sub-accounting and other shareholder servicing costs amounted to $5,571.
Administrator – MFS provides certain financial, legal, shareholder communications, compliance, and other administrative services to the fund. Under an administrative services agreement, the fund reimburses MFS the costs incurred to provide these services. The fund is charged an annual fixed amount of $17,500 plus a fee based on average daily net assets. The administrative services fee incurred for the year ended August 31, 2015 was equivalent to an annual effective rate of 0.0465% of the fund’s average daily net assets.
Trustees’ and Officers’ Compensation – The fund pays compensation to independent Trustees in the form of a retainer, attendance fees, and additional compensation to Board and Committee chairpersons. The fund does not pay compensation directly to Trustees or officers of the fund who are also officers of the investment adviser, all of whom receive remuneration for their services to the fund from MFS. Certain officers and Trustees of the fund are officers or directors of MFS, MFD, and MFSC.
Other – Effective November 1, 2014, this fund and certain other funds managed by MFS (the funds) have entered into a service agreement (the ISO Agreement) which provides for payment of fees solely by the funds to Tarantino LLC in return for the provision of services of an Independent Senior Officer (ISO) for the funds. Frank L. Tarantino serves as the ISO and is an officer of the funds and the sole member of
34
Notes to Financial Statements – continued
Tarantino LLC. The funds can terminate the ISO Agreement with Tarantino LLC at any time under the terms of the ISO Agreement. Prior to November 1, 2014, the funds had entered into a service agreement (the Compliance Officer Agreement) which provided for payment of fees by the funds to Tarantino LLC in return for the provision of services of an Independent Chief Compliance Officer (ICCO) for the funds. Prior to November 1, 2014, Frank L. Tarantino served as the ICCO. Effective October 31, 2014, Mr. Tarantino resigned as ICCO and the Compliance Officer Agreement between the funds and Tarantino LLC was terminated. For the year ended August 31, 2015, the aggregate fees paid by the fund under these agreements were $110 and are included in “Miscellaneous” expense in the Statement of Operations. MFS had agreed to reimburse the fund for a portion of the payments made by the fund for the services under the Compliance Officer Agreement in the amount of $4, which is included in the reduction of total expenses in the Statement of Operations. Additionally, MFS has agreed to bear all expenses associated with office space, other administrative support, and supplies provided to the ICCO and ISO.
The fund invests in the MFS Institutional Money Market Portfolio which is managed by MFS and seeks current income consistent with preservation of capital and liquidity. Income earned on this investment is included in “Dividends from underlying affiliated funds” in the Statement of Operations. This money market fund does not pay a management fee to MFS.
On December 5, 2013, MFS purchased 140,000 shares of Class R5 and 10,000 shares of Class A, Class B, Class C, Class I, Class R1, Class R2, Class R3, and Class R4 for an aggregate amount of $2,200,000.
At August 31, 2015, MFS held approximately 97% of the outstanding shares of Class R2, and 100% of the outstanding shares each of Class R1, Class R3, and Class R4.
(4) Portfolio Securities
For the year ended August 31, 2015, purchases and sales of investments, other than short-term obligations, aggregated $54,724,877 and $21,156,407, respectively.
35
Notes to Financial Statements – continued
(5) Shares of Beneficial Interest
The fund’s Declaration of Trust permits the Trustees to issue an unlimited number of full and fractional shares of beneficial interest. Transactions in fund shares were as follows:
| | | | | | | | | | | | | | | | |
| | | Year ended
8/31/15 | | | Period ended
8/31/14 (c) | |
| | | Shares | | | Amount | | | Shares | | | Amount | |
| Shares sold | | | | | | | | | | | | | | | | |
Class A | | | 1,021,046 | | | | $11,323,787 | | | | 74,023 | | | | $777,936 | |
Class B | | | 31,453 | | | | 354,924 | | | | 10,644 | | | | 106,935 | |
Class C | | | 30,202 | | | | 339,599 | | | | 11,922 | | | | 120,556 | |
Class I | | | 342,383 | | | | 3,844,369 | | | | 12,538 | | | | 127,000 | |
Class R1 | | | — | | | | — | | | | 10,000 | | | | 100,000 | |
Class R2 | | | 282 | | | | 3,226 | | | | 10,000 | | | | 100,000 | |
Class R3 | | | — | | | | — | | | | 10,000 | | | | 100,000 | |
Class R4 | | | — | | | | — | | | | 10,000 | | | | 100,000 | |
Class R5 | | | 2,119,281 | | | | 23,166,421 | | | | 544,945 | | | | 5,822,000 | |
| | | 3,544,647 | | | | $39,032,326 | | | | 694,072 | | | | $7,354,427 | |
| | | | |
| Shares issued to shareholders in reinvestment of distributions | | | | | | | | | | | | | | | | |
Class A | | | 10,784 | | | | $121,867 | | | | 272 | | | | $2,891 | |
Class B | | | 125 | | | | 1,411 | | | | 37 | | | | 389 | |
Class C | | | 235 | | | | 2,652 | | | | 38 | | | | 403 | |
Class I | | | 3,282 | | | | 37,221 | | | | 101 | | | | 1,071 | |
Class R1 | | | 72 | | | | 814 | | | | 37 | | | | 389 | |
Class R2 | | | 97 | | | | 1,101 | | | | 63 | | | | 673 | |
Class R3 | | | 116 | | | | 1,303 | | | | 77 | | | | 816 | |
Class R4 | | | 141 | | | | 1,586 | | | | 91 | | | | 959 | |
Class R5 | | | 33,350 | | | | 375,768 | | | | 1,300 | | | | 13,742 | |
| | | 48,202 | | | | $543,723 | | | | 2,016 | | | | $21,333 | |
| | | | |
| Shares reacquired | | | | | | | | | | | | | | | | |
Class A | | | (734,771 | ) | | | $(8,050,054 | ) | | | (1,023 | ) | | | $(10,146 | ) |
Class B | | | (579 | ) | | | (6,485 | ) | | | — | | | | — | |
Class C | | | (27 | ) | | | (302 | ) | | | (2 | ) | | | (21 | ) |
Class I | | | (108,828 | ) | | | (1,185,046 | ) | | | — | | | | — | |
Class R5 | | | (114,709 | ) | | | (1,284,017 | ) | | | — | | | | — | |
| | | (958,914 | ) | | | $(10,525,904 | ) | | | (1,025 | ) | | | $(10,167 | ) |
36
Notes to Financial Statements – continued
| | | | | | | | | | | | | | | | |
| | | Year ended
8/31/15 | | | Period ended
8/31/14 (c) | |
| | | Shares | | | Amount | | | Shares | | | Amount | |
| Net change | | | | | | | | | | | | | | | | |
Class A | | | 297,059 | | | | $3,395,600 | | | | 73,272 | | | | $770,681 | |
Class B | | | 30,999 | | | | 349,850 | | | | 10,681 | | | | 107,324 | |
Class C | | | 30,410 | | | | 341,949 | | | | 11,958 | | | | 120,938 | |
Class I | | | 236,837 | | | | 2,696,544 | | | | 12,639 | | | | 128,071 | |
Class R1 | | | 72 | | | | 814 | | | | 10,037 | | | | 100,389 | |
Class R2 | | | 379 | | | | 4,327 | | | | 10,063 | | | | 100,673 | |
Class R3 | | | 116 | | | | 1,303 | | | | 10,077 | | | | 100,816 | |
Class R4 | | | 141 | | | | 1,586 | | | | 10,091 | | | | 100,959 | |
Class R5 | | | 2,037,922 | | | | 22,258,172 | | | | 546,245 | | | | 5,835,742 | |
| | | 2,633,935 | | | | $29,050,145 | | | | 695,063 | | | | $7,365,593 | |
| (c) | For the period from the commencement of the fund’s investment operations, December 5, 2013, through the stated period end. |
(6) Line of Credit
The fund and certain other funds managed by MFS participate in a $1.25 billion unsecured committed line of credit, subject to a $1 billion sublimit, provided by a syndication of banks under a credit agreement. Borrowings may be made for temporary financing needs. Interest is charged to each fund, based on its borrowings, generally at a rate equal to the higher of the Overnight Federal Reserve funds rate or daily one month LIBOR plus an agreed upon spread. A commitment fee, based on the average daily, unused portion of the committed line of credit, is allocated among the participating funds at the end of each calendar quarter. In addition, the fund and other funds managed by MFS have established unsecured uncommitted borrowing arrangements with certain banks for temporary financing needs. Interest is charged to each fund, based on its borrowings, at a rate equal to the Overnight Federal Reserve funds rate plus an agreed upon spread. For the year ended August 31, 2015, the fund’s commitment fee and interest expense were $105 and $0, respectively, and are included in “Miscellaneous” expense in the Statement of Operations.
(7) Transactions in Underlying Affiliated Funds-Affiliated Issuers
An affiliated issuer may be considered one in which the fund owns 5% or more of the outstanding voting securities, or a company which is under common control. For the purposes of this report, the fund assumes the following to be an affiliated issuer:
| | | | | | | | | | | | | | | | |
| Underlying Affiliated Fund | | Beginning
Shares/Par
Amount | | | Acquisitions
Shares/Par
Amount | | | Dispositions
Shares/Par
Amount | | | Ending
Shares/Par
Amount | |
MFS Institutional Money
Market Portfolio | | | 128,237 | | | | 43,282,783 | | | | (42,847,390 | ) | | | 563,630 | |
| | | | |
| Underlying Affiliated Fund | | Realized
Gain (Loss) | | | Capital Gain
Distributions | | | Dividend
Income | | | Ending
Value | |
MFS Institutional Money
Market Portfolio | | | $— | | | | $— | | | | $747 | | | | $563,630 | |
37
REPORT OF INDEPENDENT REGISTERED PUBLIC ACCOUNTING FIRM
To the Board of Trustees of MFS Series Trust I and the Shareholders of MFS Low Volatility Global Equity Fund:
We have audited the accompanying statement of assets and liabilities, including the portfolio of investments, of MFS Low Volatility Global Equity Fund (one of the series of MFS Series Trust I) (the “Fund”) as of August 31, 2015, and the related statement of operations for the year then ended, and the statements of changes in net assets and the financial highlights for the year then ended and for the period from December 5, 2013 (the commencement of the Fund’s investment operations) through August 31, 2014. These financial statements and financial highlights are the responsibility of the Fund’s management. Our responsibility is to express an opinion on these financial statements and financial highlights based on our audits.
We conducted our audits in accordance with the standards of the Public Company Accounting Oversight Board (United States). Those standards require that we plan and perform the audit to obtain reasonable assurance about whether the financial statements and financial highlights are free of material misstatement. The Fund is not required to have, nor were we engaged to perform, an audit of its internal control over financial reporting. Our audits included consideration of internal control over financial reporting as a basis for designing audit procedures that are appropriate in the circumstances, but not for the purpose of expressing an opinion on the effectiveness of the Fund’s internal control over financial reporting. Accordingly, we express no such opinion. An audit also includes examining, on a test basis, evidence supporting the amounts and disclosures in the financial statements, assessing the accounting principles used and significant estimates made by management, as well as evaluating the overall financial statement presentation. Our procedures included confirmation of securities owned as of August 31, 2015, by correspondence with the custodian. We believe that our audits provide a reasonable basis for our opinion.
In our opinion, such financial statements and financial highlights referred to above present fairly, in all material respects, the financial position of MFS Low Volatility Global Equity Fund as of August 31, 2015, the results of its operations for the year then ended, and the changes in its net assets and the financial highlights for the year then ended and for the period from December 5, 2013 (the commencement of the Fund’s investment operations) through August 31, 2014, in conformity with accounting principles generally accepted in the United States of America.
DELOITTE & TOUCHE LLP
Boston, Massachusetts
October 15, 2015
38
TRUSTEES AND OFFICERS — IDENTIFICATION AND BACKGROUND
The Trustees and Officers of the Trust, as of October 1, 2015, are listed below, together with their principal occupations during the past five years. (Their titles may have varied during that period.) The address of each Trustee and Officer is 111 Huntington Avenue, Boston, Massachusetts 02199-7618.
| | | | | | | | |
Name, Age | | Position(s) Held with Fund | | Trustee/Officer
Since (h) | | Principal
Occupations During the Past Five Years | | Other Directorships (j) |
| INTERESTED TRUSTEES |
Robert J. Manning (k) (age 51) | | Trustee | | February 2004 | | Massachusetts Financial Services Company, Chairman, Co-Chief Executive Officer and Director; Chief Investment Officer (until 2010) | | N/A |
Robin A. Stelmach (k) (age 54) | | Trustee and President | | January 2014 | | Massachusetts Financial Services Company, Executive Vice President and Chief Operating Officer | | N/A |
| INDEPENDENT TRUSTEES | | | | | | |
David H. Gunning (age 73) | | Trustee and Chair of Trustees | | January 2004 | | Private investor | | Lincoln Electric Holdings, Inc., Director; Development Alternatives, Inc., Director/Non-Executive Chairman |
Steven E. Buller (age 64) | | Trustee | | February 2014 | | Chairman, Financial Accounting Standards Advisory Council; Standing Advisory Group, Public Company Accounting Oversight Board, Member (until 2014); BlackRock, Inc. (investment management), Managing Director (until 2014), BlackRock Finco UK (investment management), Director (until 2014) | | N/A |
Robert E. Butler (age 73) | | Trustee | | January 2006 | | Consultant – investment company industry regulatory and compliance matters | | N/A |
39
Trustees and Officers – continued
| | | | | | | | |
Name, Age | | Position(s) Held with Fund | | Trustee/Officer
Since (h) | | Principal
Occupations During the Past Five Years | | Other Directorships (j) |
Maureen R. Goldfarb (age 60) | | Trustee | | January 2009 | | Private investor | | N/A |
William R. Gutow (age 74) | | Trustee | | December 1993 | | Private investor and real estate consultant; Capitol Entertainment Management Company (video franchise), Vice Chairman | | Texas Donuts, Vice Chairman (until 2010) |
Michael Hegarty (age 70) | | Trustee | | December 2004 | | Private investor | | Rouse Properties Inc., Director; Capmark Financial Group Inc., Director |
John P. Kavanaugh (age 60) | | Trustee | | January 2009 | | Private investor | | N/A |
Maryanne L. Roepke (age 59) | | Trustee | | May 2014 | | American Century Investments (investment management), Senior Vice President and Chief Compliance Officer (until 2014) | | N/A |
Laurie J. Thomsen (age 58) | | Trustee | | March 2005 | | Private investor; New Profit, Inc. (venture philanthropy), Executive Partner (until 2010) | | The Travelers Companies, Director; Dycom Industries, Inc. |
Robert W. Uek (age 74) | | Trustee | | January 2006 | | Consultant to investment company industry | | N/A |
| OFFICERS | | | | | | |
Christopher R. Bohane (k) (age 41) | | Assistant Secretary and Assistant Clerk | | July 2005 | | Massachusetts Financial Services Company, Vice President and Assistant General Counsel | | N/A |
Kino Clark (k) (age 47) | | Assistant Treasurer | | January 2012 | | Massachusetts Financial Services Company, Vice President | | N/A |
Kristin V. Collins (k) (age 42) | | Assistant Secretary and Assistant Clerk | | September 2015 | | Massachusetts Financial Services Company, Vice President and Assistant General Counsel | | N/A |
40
Trustees and Officers – continued
| | | | | | | | |
Name, Age | | Position(s) Held with Fund | | Trustee/Officer
Since (h) | | Principal
Occupations During the Past Five Years | | Other Directorships (j) |
Thomas H. Connors (k) (age 56) | | Assistant Secretary and Assistant Clerk | | September 2012 | | Massachusetts Financial Services Company, Vice President and Senior Counsel; Deutsche Investment Management Americas Inc. (financial service provider), Director and Senior Counsel (until 2012) | | N/A |
Ethan D. Corey (k) (age 51) | | Assistant Secretary and Assistant Clerk | | July 2005 | | Massachusetts Financial Services Company, Senior Vice President and Associate General Counsel | | N/A |
David L. DiLorenzo (k) (age 47) | | Treasurer | | July 2005 | | Massachusetts Financial Services Company, Senior Vice President | | N/A |
Susan S. Newton (k) (age 65) | | Assistant Secretary and Assistant Clerk | | May 2005 | | Massachusetts Financial Services Company, Senior Vice President and Associate General Counsel | | N/A |
Kenneth Paek (k) (age 41) | | Assistant Treasurer | | February 2015 | | Massachusetts Financial Services Company, Vice President; Cohen & Steers, Vice President/Head of Fund Administration (until 2014) | | N/A |
Susan A. Pereira (k) (age 44) | | Assistant Secretary and Assistant Clerk | | July 2005 | | Massachusetts Financial Services Company, Vice President and Senior Counsel | | N/A |
Kasey L. Phillips (k) (age 44) | | Assistant Treasurer | | September 2012 | | Massachusetts Financial Services Company, Vice President; Wells Fargo Funds Management, LLC, Senior Vice President, Fund Treasurer (until 2012) | | N/A |
41
Trustees and Officers – continued
| | | | | | | | |
Name, Age | | Position(s) Held with Fund | | Trustee/Officer
Since (h) | | Principal
Occupations During the Past Five Years | | Other Directorships (j) |
Mark N. Polebaum (k) (age 63) | | Secretary and Clerk | | January 2006 | | Massachusetts Financial Services Company, Executive Vice President, General Counsel and Secretary | | N/A |
Matthew A. Stowe (k) (age 40) | | Assistant Secretary and Assistant Clerk | | October 2014 | | Massachusetts Financial Services Company, Vice President and Assistant General Counsel | | N/A |
Frank L. Tarantino (age 71) | | Independent Senior Officer | | June 2004 | | Tarantino LLC (provider of compliance services), Principal | | N/A |
Richard S. Weitzel (k) (age 45) | | Assistant Secretary and Assistant Clerk | | October 2007 | | Massachusetts Financial Services Company, Senior Vice President and Associate General Counsel | | N/A |
Martin J. Wolin (k) (age 48) | | Chief Compliance Officer | | July 2015 | | Massachusetts Financial Services Company, Senior Vice President and Chief Compliance Officer (since July 2015); Mercer (financial service provider), Chief Risk and Compliance Officer, North America and Latin America (until June 2015) | | N/A |
James O. Yost (k) (age 55) | | Deputy Treasurer | | September 1990 | | Massachusetts Financial Services Company, Senior Vice President | | N/A |
| (h) | Date first appointed to serve as Trustee/officer of an MFS Fund. Each Trustee has served continuously since appointment unless indicated otherwise. For the period from December 15, 2004 until February 22, 2005, Mr. Manning served as Advisory Trustee. Prior to January 2012, Messrs. DiLorenzo and Yost served as Assistant Treasurers of the Funds. Ms. Stelmach was appointed as President of the Funds as of October 1, 2014. |
| (j) | Directorships or trusteeships of companies required to report to the Securities and Exchange Commission (i.e., “public companies”). |
| (k) | “Interested person” of the Trust within the meaning of the Investment Company Act of 1940 (referred to as the 1940 Act), which is the principal federal law governing investment companies like the fund, as a result of a position with MFS. The address of MFS is 111 Huntington Avenue, Boston, Massachusetts 02199-7618. |
42
Trustees and Officers – continued
Each Trustee (except Ms. Stelmach, Mr. Buller and Ms. Roepke) has been elected by shareholders and each Trustee and officer holds office until his or her successor is chosen and qualified or until his or her earlier death, resignation, retirement or removal. The Trust does not hold annual meetings for the purpose of electing Trustees, and Trustees are not elected for fixed terms. Messrs. Butler, Kavanaugh, Uek and Mses. Thomsen and Roepke are members of the Trust’s Audit Committee.
Each of the Fund’s Trustees and officers holds comparable positions with certain other funds of which MFS or a subsidiary is the investment adviser or distributor, and, in the case of the officers, with certain affiliates of MFS. As of October 1, 2015, the Trustees served as board members of 138 funds within the MFS Family of Funds.
The Statement of Additional Information for a Fund includes further information about the Trustees and is available without charge upon request by calling 1-800-225-2606.
| | |
| Investment Adviser | | Custodian |
Massachusetts Financial Services Company
111 Huntington Avenue
Boston, MA 02199-7618 | | State Street Bank and Trust Company 1 Lincoln Street Boston, MA 02111-2900 |
| Distributor | | Independent Registered Public Accounting Firm |
MFS Fund Distributors, Inc.
111 Huntington Avenue
Boston, MA 02199-7618 | | Deloitte & Touche LLP 200 Berkeley Street Boston, MA 02116 |
| Portfolio Managers | | |
James Fallon Jonathan Sage | | |
43
BOARD REVIEW OF INVESTMENT ADVISORY AGREEMENT
The Investment Company Act of 1940 requires that both the full Board of Trustees and a majority of the non-interested (“independent”) Trustees, voting separately, annually approve the continuation of the Fund’s investment advisory agreement with MFS. The Trustees consider matters bearing on the Fund and its advisory arrangements at their meetings throughout the year, including a review of performance data at each regular meeting. In addition, the independent Trustees met several times over the course of three months beginning in May and ending in July, 2015 (“contract review meetings”) for the specific purpose of considering whether to approve the continuation of the investment advisory agreement for the Fund and the other investment companies that the Board oversees (the “MFS Funds”). The independent Trustees were assisted in their evaluation of the Fund’s investment advisory agreement by independent legal counsel, from whom they received separate legal advice and with whom they met separately from MFS during various contract review meetings. The independent Trustees were also assisted in this process by the MFS Funds’ Independent Senior Officer, a senior officer appointed by and reporting to the independent Trustees.
In connection with their deliberations regarding the continuation of the investment advisory agreement, the Trustees, including the independent Trustees, considered such information and factors as they believed, in light of the legal advice furnished to them and their own business judgment, to be relevant. The investment advisory agreement for the Fund was considered separately, although the Trustees also took into account the common interests of all MFS Funds in their review. As described below, the Trustees considered the nature, quality, and extent of the various investment advisory, administrative, and shareholder services performed by MFS under the existing investment advisory agreement and other arrangements with the Fund.
In connection with their contract review meetings, the Trustees received and relied upon materials that included, among other items: (i) information provided by Lipper Inc., an independent third party, on the investment performance of the Fund for the one-year period ended December 31, 2014 and the investment performance of a group of funds with substantially similar investment classifications/objectives (the “Lipper performance universe”), (ii) information provided by Lipper Inc. on the Fund’s advisory fees and other expenses and the advisory fees and other expenses of comparable funds identified by Lipper Inc. (the “Lipper expense group”), (iii) information provided by MFS on the advisory fees of comparable portfolios of other clients of MFS, including institutional separate accounts and other clients, (iv) information as to whether and to what extent applicable expense waivers, reimbursements or fee “breakpoints” are observed for the Fund, (v) information regarding MFS’ financial results and financial condition, including MFS’ and certain of its affiliates’ estimated profitability from services performed for the Fund and the MFS Funds as a whole, and compared to MFS’ institutional business, (vi) MFS’ views regarding the outlook for the mutual fund industry and the strategic business plans of MFS, (vii) descriptions of various functions performed by MFS for the Funds, such as compliance monitoring and portfolio trading practices, and (viii) information regarding the overall organization of MFS, including information about MFS’ senior management and other personnel providing investment advisory, administrative and other services to
44
Board Review of Investment Advisory Agreement – continued
the Fund and the other MFS Funds. The comparative performance, fee and expense information prepared and provided by Lipper Inc. was not independently verified and the independent Trustees did not independently verify any information provided to them by MFS.
The Trustees’ conclusion as to the continuation of the investment advisory agreement was based on a comprehensive consideration of all information provided to the Trustees and not the result of any single factor. Some of the factors that figured particularly in the Trustees’ deliberations are described below, although individual Trustees may have evaluated the information presented differently from one another, giving different weights to various factors. It is also important to recognize that the fee arrangements for the Fund and other MFS Funds are the result of years of review and discussion between the independent Trustees and MFS, that certain aspects of such arrangements may receive greater scrutiny in some years than in others, and that the Trustees’ conclusions may be based, in part, on their consideration of these same arrangements during the course of the year and in prior years.
Based on information provided by Lipper Inc. and MFS, the Trustees reviewed the Fund’s total return investment performance as well as the performance of peer groups of funds for the one-year period ended December 31, 2014. The total return performance of the Fund’s Class A shares was in the 1st quintile relative to the other funds in the universe for this one-year period (the 1st quintile being the best performers and the 5th quintile being the worst performers). The Fund commenced operations on December 5, 2013 and has a limited operating history and performance record; therefore no performance data for the three- or five-year periods was available. Because of the passage of time, these performance results may differ from the performance results for more recent periods, including those shown elsewhere in this report.
In the course of their deliberations, the Trustees took into account information provided by MFS in connection with the contract review meetings, as well as during investment review meetings conducted with portfolio management personnel during the course of the year regarding the Fund’s performance. After reviewing these and related factors, the Trustees concluded, within the context of their overall conclusions regarding the investment advisory agreement, that they were satisfied with MFS’ responses and efforts relating to investment performance.
In assessing the reasonableness of the Fund’s advisory fee, the Trustees considered, among other information, the Fund’s advisory fee and the total expense ratio of the Fund’s Class A shares as a percentage of average daily net assets and the advisory fee and total expense ratios of peer groups of funds based on information provided by Lipper Inc. The Trustees considered that MFS has agreed in writing to reduce its advisory fee, and that MFS currently observes an expense limitation for the Fund, each of which may not be changed without the Trustees’ approval. The Trustees also considered that, according to the Lipper data (which takes into account any fee reductions or expense limitations that were in effect during the Fund’s last fiscal year), the Fund’s effective advisory fee rate and total expense ratio were each lower than the Lipper expense group median.
45
Board Review of Investment Advisory Agreement – continued
The Trustees also considered the advisory fees charged by MFS to any institutional separate accounts advised by MFS (“separate accounts”) and unaffiliated investment companies for which MFS serves as subadviser (“subadvised funds”) that have comparable investment strategies to the Fund. In comparing these fees, the Trustees considered information provided by MFS as to the generally broader scope of services provided by MFS to the Fund, as well as the more extensive regulatory burdens imposed on MFS in managing the Fund, in comparison to separate accounts and subadvised funds. The Trustees also considered the higher demands placed on MFS’ investment personnel and trading infrastructure as a result of the daily cash in-flows and out-flows of the Fund in comparison to separate accounts.
The Trustees also considered whether the Fund may benefit from any economies of scale in the management of the Fund in the event of growth in assets of the Fund and/or growth in assets of the MFS Funds as a whole. They noted that the Fund’s advisory fee rate schedule is subject to contractual breakpoints that reduce the Fund’s advisory fee rate on average daily net assets over $1 billion and $2.5 billion. The Trustees also noted that MFS has agreed in writing to waive a portion of the management fees of certain MFS Funds, including the Fund, if the total combined assets of certain funds within the MFS Funds’ complex increase above agreed upon thresholds (the “group fee waiver”), enabling the Fund’s shareholders to share in the benefits from any economies of scale at the complex level. The group fee waiver is reviewed and renewed annually between the Board and MFS. The Trustees concluded that the breakpoints and the group fee waiver were sufficient to allow the Fund to benefit from economies of scale as its assets and overall complex assets grow.
The Trustees also considered information prepared by MFS relating to MFS’ costs and profits with respect to the Fund, the MFS Funds considered as a group, and other investment companies and accounts advised by MFS, as well as MFS’ methodologies used to determine and allocate its costs to the MFS Funds, the Fund and other accounts and products for purposes of estimating profitability.
In addition, the Trustees considered MFS’ resources and related efforts to continue to retain, attract and motivate capable personnel to serve the Fund. The Trustees also considered current and developing conditions in the financial services industry, including the presence of large and well-capitalized companies which are spending, and appear to be prepared to continue to spend, substantial sums to engage personnel and to provide services to competing investment companies. In this regard, the Trustees also considered the financial resources of MFS and its ultimate parent, Sun Life Financial Inc. The Trustees also considered the advantages and possible disadvantages to the Fund of having an adviser that also serves other investment companies as well as other accounts.
The Trustees also considered the nature, quality, cost, and extent of administrative, transfer agency, and distribution services provided to the Fund by MFS and its affiliates under agreements and plans other than the investment advisory agreement, including any 12b-1 fees the Fund pays to MFS Fund Distributors, Inc., an affiliate of MFS. The Trustees also considered the nature, extent and quality of certain other services MFS performs or arranges for on the Fund’s behalf, which may include securities lending programs, directed expense payment programs, class action recovery programs, and
46
Board Review of Investment Advisory Agreement – continued
MFS’ interaction with third-party service providers, principally custodians and sub-custodians. The Trustees concluded that the various non-advisory services provided by MFS and its affiliates on behalf of the Fund were satisfactory.
The Trustees also considered benefits to MFS from the use of the Fund’s portfolio brokerage commissions, if applicable, to pay for investment research and various other factors. Additionally, the Trustees considered so-called “fall-out benefits” to MFS such as reputational value derived from serving as investment manager to the Fund.
Based on their evaluation of factors that they deemed to be material, including those factors described above, the Board of Trustees, including the independent Trustees, concluded that the Fund’s investment advisory agreement with MFS should be continued for an additional one-year period, commencing August 1, 2015.
47
PROXY VOTING POLICIES AND INFORMATION
MFS votes proxies on behalf of the fund pursuant to proxy voting policies and procedures that are available without charge, upon request, by calling 1-800-225-2606, by visiting the Proxy Voting section of mfs.com or by visiting the SEC’s Web site at http://www.sec.gov.
Information regarding how the fund voted proxies relating to portfolio securities during the most recent twelve-month period ended June 30 is available without charge by visiting the Proxy Voting section of mfs.com or by visiting the SEC’s Web site at http://www.sec.gov.
QUARTERLY PORTFOLIO DISCLOSURE
The fund will file a complete schedule of portfolio holdings with the Securities and Exchange Commission (the Commission) for the first and third quarters of each fiscal year on Form N-Q. A shareholder can obtain the quarterly portfolio holdings report at mfs.com. The fund’s Form N-Q is also available on the EDGAR database on the Commission’s Internet Web site at http://www.sec.gov, and may be reviewed and copied at the:
Public Reference Room
Securities and Exchange Commission
100 F Street, NE, Room 1580
Washington, D.C. 20549
Information on the operation of the Public Reference Room may be obtained by calling the Commission at 1-800-SEC-0330. Copies of the fund’s Form N-Q also may be obtained, upon payment of a duplicating fee, by electronic request at the following e-mail address: publicinfo@sec.gov or by writing the Public Reference Section at the above address.
FURTHER INFORMATION
From time to time, MFS may post important information about the fund or the MFS funds on the MFS web site (mfs.com). This information is available by visiting the “Market Commentary” and “Announcements” sub sections in the “Market Outlooks” section of mfs.com or by clicking on the fund’s name under “Mutual Funds” in the “Products” section of mfs.com.
FEDERAL TAX INFORMATION (unaudited)
The fund will notify shareholders of amounts for use in preparing 2015 income tax forms in January 2016. The following information is provided pursuant to provisions of the Internal Revenue Code.
The fund designates the maximum amount allowable as qualified dividend income eligible to be taxed at the same rate as long-term capital gain.
For corporate shareholders, 49.58% of the ordinary income dividends paid during the fiscal year qualify for the corporate dividends received deduction.
48
rev. 3/11
| | | | |
| | | |
FACTS | | WHAT DOES MFS DO WITH YOUR PERSONAL INFORMATION? | |  |
| | |
| Why? | | Financial companies choose how they share your personal information. Federal law gives consumers the right to limit some but not all sharing. Federal law also requires us to tell you how we collect, share, and protect your personal information. Please read this notice carefully to understand what we do. |
| | |
| What? | | The types of personal information we collect and share depend on the product or service you have with us. This information can include: • Social Security number and account balances • Account transactions and transaction history • Checking account information and wire transfer instructions When you are no longer our customer, we continue to share your information as described in this notice. |
| | |
| How? | | All financial companies need to share customers’ personal information to run their everyday business. In the section below, we list the reasons financial companies can share their customers’ personal information; the reasons MFS chooses to share; and whether you can limit this sharing. |
| | | | |
Reasons we can share your
personal information | | Does MFS
share? | | Can you limit
this sharing? |
For our everyday business purposes – such as to process your transactions, maintain your account(s), respond to court orders and legal investigations, or report to credit bureaus | | Yes | | No |
For our marketing purposes – to offer our products and services to you | | No | | We don’t share |
| For joint marketing with other financial companies | | No | | We don’t share |
For our affiliates’ everyday business purposes – information about your transactions and experiences | | No | | We don’t share |
For our affiliates’ everyday business purposes – information about your creditworthiness | | No | | We don’t share |
| For nonaffiliates to market to you | | No | | We don’t share |
| | |
| Questions? | | Call 800-225-2606 or go to mfs.com. |
49
| | |
| Who we are |
| Who is providing this notice? | | MFS Funds, MFS Investment Management, MFS Institutional Advisors, Inc., MFS Fund Distributors, Inc., MFS Heritage Trust Company, and MFS Service Center, Inc. |
| | |
| What we do |
| How does MFS protect my personal information? | | To protect your personal information from unauthorized access and use, we use security measures that comply with federal law. These measures include procedural, electronic, and physical safeguards for the protection of the personal information we collect about you. |
| How does MFS collect my personal information? | | We collect your personal information, for example, when you • open an account or provide account information • direct us to buy securities or direct us to sell your securities • make a wire transfer We also collect your personal information from others, such as credit bureaus, affiliates and other companies. |
| Why can’t I limit all sharing? | | Federal law gives you the right to limit only • sharing for affiliates’ everyday business purposes – information about your creditworthiness • affiliates from using your information to market to you • sharing for nonaffiliates to market to you State laws and individual companies may give you additional rights to limit sharing. |
| | |
| Definitions |
| Affiliates | | Companies related by common ownership or control. They can be financial and nonfinancial companies. • MFS does not share personal information with affiliates, except for everyday business purposes as described on page one of this notice. |
| Nonaffiliates | | Companies not related by common ownership or control. They can be financial and nonfinancial companies. • MFS does not share with nonaffiliates so they can market to you. |
| Joint Marketing | | A formal agreement between nonaffiliated financial companies that together market financial products or services to you. • MFS doesn’t jointly market. |
| | |
| Other important information |
| If you own an MFS product or receive an MFS service in the name of a third party such as a bank or broker-dealer, their privacy policy may apply to you instead of ours. |
50
Save paper with eDelivery.

| MFS® will send you prospectuses, |
reports, and proxies directly via e-mail so you will get information faster with less mailbox clutter.
To sign up:
1. Go to mfs.com.
2. Log in via MFS® Access.
3. Select eDelivery.
If you own your MFS fund shares through a financial institution or a retirement plan, MFS® TALK, MFS® Access, or eDelivery may not be available to you.
CONTACT
WEB SITE
mfs.com
MFS TALK
1-800-637-8255
24 hours a day
ACCOUNT SERVICE AND LITERATURE
Shareholders
1-800-225-2606
Financial advisors
1-800-343-2829
Retirement plan services
1-800-637-1255
MAILING ADDRESS
MFS Service Center, Inc.
P.O. Box 55824
Boston, MA 02205-5824
OVERNIGHT MAIL
MFS Service Center, Inc.
c/o Boston Financial Data Services
30 Dan Road
Canton, MA 02021-2809
ANNUAL REPORT
August 31, 2015

MFS® LOW VOLATILITY EQUITY FUND

LVU-ANN
MFS® LOW VOLATILITY EQUITY FUND
CONTENTS
The report is prepared for the general information of shareholders.
It is authorized for distribution to prospective investors only when preceded or accompanied by a current prospectus.
NOT FDIC INSURED • MAY LOSE VALUE • NO BANK GUARANTEE

LETTER FROM THE CHAIRMAN
Dear Shareholders:
The U.S. economy bounced back after another harsh winter curtailed domestic consumption. Despite strengthening labor and housing markets, however, a stronger U.S. dollar and weak overseas demand have held back corporate earnings.
China’s economic growth continues to slow, raising concerns and adding to global market volatility. Commodity exporters, including Australia and Canada, have been hurt by weaker Chinese demand. Global oil markets remain oversupplied, putting pressure on crude oil and gasoline prices.
In Europe, concerns about a potential Greek debt default have faded, and the eurozone’s economy is expanding mildly. Hopes for a more robust regionwide recovery rest on the European Central Bank’s quantitative easing program.
The world’s financial markets have become increasingly complex in recent years. Now, more than ever, it is important to understand companies on a global basis. At MFS®, we believe our integrated research platform, collaborative culture, active risk management process and long-term focus give us a research advantage.
As investors, we aim to add long-term value. We believe this approach will serve you well as you work with your financial advisor to reach your investment objectives.
Respectfully,

Robert J. Manning
Chairman
MFS Investment Management
October 15, 2015
The opinions expressed in this letter are subject to change and may not be relied upon for investment advice. No forecasts can be guaranteed.
1
PORTFOLIO COMPOSITION
Portfolio structure

| | | | |
| Top ten holdings | | | | |
| Eli Lilly & Co. | | | 3.0% | |
| Public Storage, Inc., REIT | | | 3.0% | |
| Visa, Inc., “A” | | | 2.8% | |
| Johnson & Johnson | | | 2.6% | |
| M&T Bank Corp. | | | 2.5% | |
| Merck & Co., Inc. | | | 2.4% | |
| Wal-Mart Stores, Inc. | | | 2.4% | |
| Costco Wholesale Corp. | | | 2.4% | |
| General Mills, Inc. | | | 2.3% | |
| McDonald’s Corp. | | | 2.2% | |
| | | | |
| Equity sectors | | | | |
| Financial Services | | | 21.5% | |
| Health Care | | | 17.2% | |
| Consumer Staples | | | 13.4% | |
| Technology | | | 9.9% | |
| Utilities & Communications | | | 8.7% | |
| Retailing | | | 8.1% | |
| Industrial Goods & Services | | | 6.6% | |
| Energy | | | 4.6% | |
| Special Products & Services | | | 3.4% | |
| Leisure | | | 3.3% | |
| Basic Materials | | | 0.9% | |
| Autos & Housing | | | 0.4% | |
Cash & Other can include cash, other assets less liabilities, offsets to derivative positions, and short-term securities. Please see the Statement of Assets and Liabilities for additional information related to the fund’s cash position and the Notes to Financial Statements for additional information related to certain risks associated with assets included in “Other”.
Percentages are based on net assets as of 8/31/15.
The portfolio is actively managed and current holdings may be different.
2
MANAGEMENT REVIEW
Summary of Results
For the twelve months ended August 31, 2015, Class A shares of the MFS Low Volatility Equity Fund (“fund”) provided a total return of 4.01%, at net asset value. This compares with a return of 0.48% for the fund’s benchmark, the Standard & Poor’s 500 Stock Index (S&P 500 Index).
Market Environment
A generally risk-friendly environment prevailed in the first half of the period and any market setbacks, triggered by global growth concerns, were short-lived as central banks responded and kept monetary policy accommodative. For example, the US tempered rate hike expectations while Japan, Europe and China provided fresh stimulus measures which ultimately supported risk assets. Early in the second half of the period, the European Central Bank cut policy interest rates and announced non-conventional easing measures, pushing yields on a significant portion of eurozone sovereign bonds deeper into negative territory, a notable highlight amid a mini-wave of global easing due to declining inflation and inflation expectations. However, the environment supporting risk began to break down in the latter phases of the period, with both US investment grade and high yield corporate spreads widening out and any individual company performance below expectations resulted in market selling.
A dominant trend for most of the period was the ongoing rise in US equities. Until early in the second half of the period, this was paired with a decline in US and global bond yields. The uptrend in US corporate margins and profits continued throughout the second half of 2014, but in the latter part of the period the margin results became more bifurcated with energy and materials suffering and the rest of the companies holding on to net margins in an ongoing slow revenue growth environment. A rising dollar and a sharp decline in commodity prices, particularly crude oil prices, negatively impacted credit markets, notably US high yield and emerging market debt. The higher weightings of oil and gas credits in these asset classes resulted in widening spreads and increased volatility. In the second half of the period, global sovereign bond yields rose, shrugging off concerns over a Greek debt default. The rise tempered the equity advance, as odds of a 2015 US Federal Reserve rate hike increased. At the end of the period, the stronger US dollar slowed revenues in many US-based multinational companies. As the last month of the period began, risk shedding became a theme across emerging market countries and continued to weaken Chinese economic data as well as economic data of the commodity-driven countries. Risk shedding accelerated outflows and cross-border selling. By the end of the period, many of the world’s equity markets had entered into “correction” territory.
Contributors to Performance
Stock selection in the financial services sector contributed to performance relative to the S&P 500 Index. The fund’s overweight positions in global payments technology company Visa and equity real estate investment trust Public Storage, and holdings of international reinsurance group PartnerRe (b), benefited relative results. Shares of Visa appreciated as the company delivered solid earnings results during the period.
3
Management Review – continued
The fund’s underweight position and, to a lesser extent, stock selection in the energy sector aided relative performance. However, there were no individual securities within this sector that were among the fund’s top relative contributors during the reporting period.
Stock selection in the industrial goods & services sector strengthened relative performance, led by the fund’s overweight position in waste management company Stericycle.
Stocks in other sectors that strengthened relative performance included the fund’s overweight positions in pharmaceutical company Eli Lilly, supermarket operator Kroger (h), pharmaceutical services company AmerisourceBergen and auto parts retailer O’Reilly Automotive. Shares of Eli Lilly rose after the company provided a promising update on its diabetes portfolio, representing a core driver for its business growth. Shares of Kroger appreciated after the company announced robust core results in its supermarket business and raised future guidance citing continued growth in identical store sales. Holdings of software company Amdocs (b) and global cruise line operator Norwegian Cruise Line (b) also benefited relative results.
Detractors from Performance
Stock selection in the technology sector detracted from relative performance. Not holding computer and personal electronics maker Apple and social networking service provider Facebook, and an overweight position in semiconductor company Microchip Technology, weighed on relative performance. Shares of Apple appreciated during the period due to strong consumer demand for the company’s iPhone 6 and 6 Plus smartphones.
Elsewhere, the fund’s overweight positions in energy company Chevron, retailer Wal-Mart, household products maker Procter & Gamble and pharmaceutical company Merck dampened relative returns. Shares of Chevron traded lower after the Organization of the Petroleum Exporting Countries’ (OPEC) unchanged production targets caused crude oil prices to fall. Not holding strong-performing internet retailer Amazon.com weakened relative returns as its shares appreciated after the company delivered solid results during the period supported by improved growth in its core retail segment and remote computing segment (Amazon Web Services). Holding shares of energy services provider OGE Energy (b), and an underweight position in home improvement retailer Home Depot, were also among the fund’s top relative detractors.
Respectfully,
| | |
| James Fallon | | Matthew Krummell |
| Portfolio Manager | | Portfolio Manager |
| (b) | Security is not a benchmark constituent. |
| (h) | Security was not held in the portfolio at period end. |
4
Management Review – continued
The views expressed in this report are those of the portfolio managers only through the end of the period of the report as stated on the cover and do not necessarily reflect the views of MFS or any other person in the MFS organization. These views are subject to change at any time based on market or other conditions, and MFS disclaims any responsibility to update such views. These views may not be relied upon as investment advice or an indication of trading intent on behalf of any MFS portfolio. References to specific securities are not recommendations of such securities, and may not be representative of any MFS portfolio’s current or future investments.
5
PERFORMANCE SUMMARY THROUGH 8/31/15
The following chart illustrates a representative class of the fund’s historical performance in comparison to its benchmark(s). Performance results include the deduction of the maximum applicable sales charge and reflect the percentage change in net asset value, including reinvestment of dividends and capital gains distributions. The performance of other share classes will be greater than or less than that of the class depicted below. Benchmarks are unmanaged and may not be invested in directly. Benchmark returns do not reflect sales charges, commissions or expenses. (See Notes to Performance Summary.)
Performance data shown represents past performance and is no guarantee of future results. Investment return and principal value fluctuate so your shares, when sold, may be worth more or less than the original cost; current performance may be lower or higher than quoted. The performance shown does not reflect the deduction of taxes, if any, that a shareholder would pay on fund distributions or the redemption of fund shares.
Growth of a Hypothetical $10,000 Investment (t)
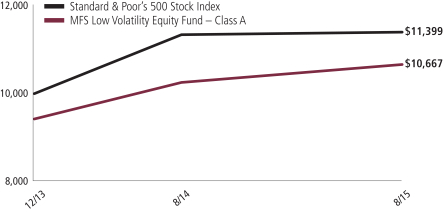
6
Performance Summary – continued
Total Returns through 8/31/15
Average annual without sales charge
| | | | | | | | | | |
| | | Share Class | | Class Inception Date | | 1-yr | | Life (t) | | |
| | | A | | 12/05/13 | | 4.01% | | 7.38% | | |
| | | B | | 12/05/13 | | 3.20% | | 6.56% | | |
| | | C | | 12/05/13 | | 3.23% | | 6.60% | | |
| | | I | | 12/05/13 | | 4.20% | | 7.65% | | |
| | | R1 | | 12/05/13 | | 3.18% | | 6.59% | | |
| | | R2 | | 12/05/13 | | 3.69% | | 7.12% | | |
| | | R3 | | 12/05/13 | | 4.04% | | 7.41% | | |
| | | R4 | | 12/05/13 | | 4.20% | | 7.64% | | |
| | | R5 | | 12/05/13 | | 4.22% | | 7.67% | | |
| Comparative benchmark | | | | | | |
| | | Standard & Poor’s 500 Stock Index (f) | | 0.48% | | 7.81% | | |
| Average annual with sales charge | | | | | | |
| | | A
With initial Sales Charge (5.75%) | | (1.97)% | | 3.78% | | |
| | | B
With CDSC (Declining over six years from 4% to 0%) (v) | | (0.80)% | | 4.35% | | |
| | | C
With CDSC (1% for 12 months) (v) | | 2.23% | | 6.60% | | |
CDSC – Contingent Deferred Sales Charge.
Class I, R1, R2, R3, R4, and R5 shares do not have a sales charge.
| (f) | Source: FactSet Research Systems Inc. |
| (t) | For the period from the class inception date through the stated period end. (See Notes to Performance Summary.) |
| (v) | Assuming redemption at the end of the applicable period. |
Benchmark Definition
Standard & Poor’s 500 Stock Index – a market capitalization-weighted index of 500 widely held equity securities, designed to measure broad U.S. equity performance.
It is not possible to invest directly in an index.
Notes to Performance Summary
Average annual total return represents the average annual change in value for each share class for the periods presented. Life returns are presented where the share class has less than 10 years of performance history and represent the average annual total return from the class inception date to the stated period end date.
Performance results reflect any applicable expense subsidies and waivers in effect during the periods shown. Without such subsidies and waivers the fund’s performance results would be less favorable. Please see the prospectus and financial statements for complete details.
7
Performance Summary – continued
Performance results do not include adjustments made for financial reporting purposes in accordance with U.S. generally accepted accounting principles and may differ from amounts reported in the financial highlights.
From time to time the fund may receive proceeds from litigation settlements, without which performance would be lower.
8
EXPENSE TABLE
Fund expenses borne by the shareholders during the period, March 1, 2015 through August 31, 2015
As a shareholder of the fund, you incur two types of costs: (1) transaction costs, including sales charges (loads) on certain purchase or redemption payments, and (2) ongoing costs, including management fees; distribution and service (12b-1) fees; and other fund expenses. This example is intended to help you understand your ongoing costs (in dollars) of investing in the fund and to compare these costs with the ongoing costs of investing in other mutual funds.
The example is based on an investment of $1,000 invested at the beginning of the period and held for the entire period March 1, 2015 through August 31, 2015.
Actual Expenses
The first line for each share class in the following table provides information about actual account values and actual expenses. You may use the information in this line, together with the amount you invested, to estimate the expenses that you paid over the period. Simply divide your account value by $1,000 (for example, an $8,600 account value divided by $1,000 = 8.6), then multiply the result by the number in the first line under the heading entitled “Expenses Paid During Period” to estimate the expenses you paid on your account during this period.
Hypothetical Example for Comparison Purposes
The second line for each share class in the following table provides information about hypothetical account values and hypothetical expenses based on the fund’s actual expense ratio and an assumed rate of return of 5% per year before expenses, which is not the fund’s actual return. The hypothetical account values and expenses may not be used to estimate the actual ending account balance or expenses you paid for the period. You may use this information to compare the ongoing costs of investing in the fund and other funds. To do so, compare this 5% hypothetical example with the 5% hypothetical examples that appear in the shareholder reports of the other funds.
Please note that the expenses shown in the table are meant to highlight your ongoing costs only and do not reflect any transactional costs, such as sales charges (loads). Therefore, the second line for each share class in the table is useful in comparing ongoing costs only, and will not help you determine the relative total costs of owning different funds. In addition, if these transactional costs were included, your costs would have been higher.
9
Expense Table – continued
| | | | | | | | | | | | | | | | | | |
Share
Class | | | | Annualized
Expense
Ratio | | | Beginning
Account Value
3/01/15 | | | Ending
Account Value
8/31/15 | | | Expenses
Paid During
Period (p)
3/01/15-8/31/15 | |
| A | | Actual | | | 1.18% | | | | $1,000.00 | | | | $968.12 | | | | $5.85 | |
| | Hypothetical (h) | | | 1.18% | | | | $1,000.00 | | | | $1,019.26 | | | | $6.01 | |
| B | | Actual | | | 1.96% | | | | $1,000.00 | | | | $963.81 | | | | $9.70 | |
| | Hypothetical (h) | | | 1.96% | | | | $1,000.00 | | | | $1,015.32 | | | | $9.96 | |
| C | | Actual | | | 1.95% | | | | $1,000.00 | | | | $964.17 | | | | $9.65 | |
| | Hypothetical (h) | | | 1.95% | | | | $1,000.00 | | | | $1,015.38 | | | | $9.91 | |
| I | | Actual | | | 0.95% | | | | $1,000.00 | | | | $969.07 | | | | $4.71 | |
| | Hypothetical (h) | | | 0.95% | | | | $1,000.00 | | | | $1,020.42 | | | | $4.84 | |
| R1 | | Actual | | | 1.96% | | | | $1,000.00 | | | | $964.41 | | | | $9.70 | |
| | Hypothetical (h) | | | 1.96% | | | | $1,000.00 | | | | $1,015.32 | | | | $9.96 | |
| R2 | | Actual | | | 1.46% | | | | $1,000.00 | | | | $966.72 | | | | $7.24 | |
| | Hypothetical (h) | | | 1.46% | | | | $1,000.00 | | | | $1,017.85 | | | | $7.43 | |
| R3 | | Actual | | | 1.21% | | | | $1,000.00 | | | | $967.89 | | | | $6.00 | |
| | Hypothetical (h) | | | 1.21% | | | | $1,000.00 | | | | $1,019.11 | | | | $6.16 | |
| R4 | | Actual | | | 0.96% | | | | $1,000.00 | | | | $969.03 | | | | $4.76 | |
| | Hypothetical (h) | | | 0.96% | | | | $1,000.00 | | | | $1,020.37 | | | | $4.89 | |
| R5 | | Actual | | | 0.90% | | | | $1,000.00 | | | | $969.16 | | | | $4.47 | |
| | Hypothetical (h) | | | 0.90% | | | | $1,000.00 | | | | $1,020.67 | | | | $4.58 | |
| (h) | 5% class return per year before expenses. |
| (p) | “Expenses Paid During Period” are equal to each class’s annualized expense ratio, as shown above, multiplied by the average account value over the period, multiplied by 184/365 (to reflect the one-half year period). Expenses paid do not include any applicable sales charges (loads). If these transaction costs had been included, your costs would have been higher. |
Notes to Expense Table
Each class with a Rule 12b-1 service fee is subject to a rebate of a portion of such fee. Such rebates are included in the expense ratios above and are outside of the expense limitation arrangement. For Class A shares, this rebate reduced the expense ratio above by 0.03%. See Note 3 in the Notes to Financial Statements for additional information.
10
PORTFOLIO OF INVESTMENTS
8/31/15
The Portfolio of Investments is a complete list of all securities owned by your fund. It is categorized by broad-based asset classes.
| | | | | | | | |
| Common Stocks - 98.0% | | | | | | | | |
| Issuer | | Shares/Par | | | Value ($) | |
| Aerospace - 3.1% | | | | | | | | |
| General Dynamics Corp. | | | 753 | | | $ | 106,940 | |
| Honeywell International, Inc. | | | 1,773 | | | | 176,006 | |
| Lockheed Martin Corp. | | | 486 | | | | 97,773 | |
| United Technologies Corp. | | | 1,415 | | | | 129,628 | |
| | | | | | | | |
| | | | | | | $ | 510,347 | |
| Automotive - 0.4% | | | | | | | | |
| Delphi Automotive PLC | | | 926 | | | $ | 69,932 | |
| | |
| Business Services - 3.4% | | | | | | | | |
| Amdocs Ltd. | | | 5,531 | | | $ | 316,429 | |
| Automatic Data Processing, Inc. | | | 3,126 | | | | 241,702 | |
| | | | | | | | |
| | | | | | | $ | 558,131 | |
| Cable TV - 0.4% | | | | | | | | |
| Charter Communications, Inc., “A” (a) | | | 400 | | | $ | 72,644 | |
| | |
| Chemicals - 0.5% | | | | | | | | |
| 3M Co. | | | 584 | | | $ | 83,010 | |
| | |
| Computer Software - 3.2% | | | | | | | | |
| Adobe Systems, Inc. (a) | | | 903 | | | $ | 70,949 | |
| Intuit, Inc. | | | 1,678 | | | | 143,889 | |
| Microsoft Corp. | | | 5,797 | | | | 252,285 | |
| Oracle Corp. | | | 1,632 | | | | 60,531 | |
| | | | | | | | |
| | | | | | | $ | 527,654 | |
| Computer Software - Systems - 1.5% | | | | | | | | |
| EMC Corp. | | | 4,065 | | | $ | 101,097 | |
| International Business Machines Corp. | | | 981 | | | | 145,080 | |
| | | | | | | | |
| | | | | | | $ | 246,177 | |
| Consumer Products - 3.7% | | | | | | | | |
| Colgate-Palmolive Co. | | | 3,272 | | | $ | 205,514 | |
| Kimberly-Clark Corp. | | | 620 | | | | 66,049 | |
| Procter & Gamble Co. | | | 4,750 | | | | 335,683 | |
| | | | | | | | |
| | | | | | | $ | 607,246 | |
| Electrical Equipment - 0.4% | | | | | | | | |
| Danaher Corp. | | | 777 | | | $ | 67,615 | |
11
Portfolio of Investments – continued
| | | | | | | | |
| Issuer | | Shares/Par | | | Value ($) | |
| Common Stocks - continued | | | | | | | | |
| Electronics - 2.2% | | | | | | | | |
| Microchip Technology, Inc. | | | 5,470 | | | $ | 232,475 | |
| Texas Instruments, Inc. | | | 2,721 | | | | 130,173 | |
| | | | | | | | |
| | | | | | | $ | 362,648 | |
| Energy - Integrated - 3.6% | | | | | | | | |
| Chevron Corp. | | | 2,986 | | | $ | 241,836 | |
| Exxon Mobil Corp. | | | 4,821 | | | | 362,732 | |
| | | | | | | | |
| | | | | | | $ | 604,568 | |
| Food & Beverages - 7.5% | | | | | | | | |
| Bunge Ltd. | | | 815 | | | $ | 59,047 | |
| Coca-Cola Co. | | | 5,162 | | | | 202,970 | |
| Dr Pepper Snapple Group, Inc. | | | 1,245 | | | | 95,529 | |
| General Mills, Inc. | | | 6,596 | | | | 374,389 | |
| Mondelez International, Inc. | | | 1,678 | | | | 71,080 | |
| PepsiCo, Inc. | | | 3,526 | | | | 327,671 | |
| Pinnacle Foods, Inc. | | | 2,522 | | | | 113,086 | |
| | | | | | | | |
| | | | | | | $ | 1,243,772 | |
| Food & Drug Stores - 0.5% | | | | | | | | |
| CVS Health Corp. | | | 798 | | | $ | 81,715 | |
| | |
| Gaming & Lodging - 0.6% | | | | | | | | |
| Norwegian Cruise Line Holdings Ltd. (a) | | | 1,739 | | | $ | 100,166 | |
| | |
| General Merchandise - 5.7% | | | | | | | | |
| Costco Wholesale Corp. | | | 2,819 | | | $ | 394,801 | |
| Macy’s, Inc. | | | 956 | | | | 56,031 | |
| Target Corp. | | | 1,167 | | | | 90,688 | |
| Wal-Mart Stores, Inc. | | | 6,105 | | | | 395,177 | |
| | | | | | | | |
| | | | | | | $ | 936,697 | |
| Health Maintenance Organizations - 0.9% | | | | | | | | |
| Aetna, Inc. | | | 669 | | | $ | 76,614 | |
| UnitedHealth Group, Inc. | | | 629 | | | | 72,775 | |
| | | | | | | | |
| | | | | | | $ | 149,389 | |
| Insurance - 7.9% | | | | | | | | |
| American International Group, Inc. | | | 1,615 | | | $ | 97,449 | |
| Chubb Corp. | | | 683 | | | | 82,513 | |
| Everest Re Group Ltd. | | | 1,746 | | | | 306,964 | |
| Loews Corp. | | | 3,630 | | | | 132,314 | |
| MetLife, Inc. | | | 1,185 | | | | 59,369 | |
| PartnerRe Ltd. | | | 1,471 | | | | 203,601 | |
12
Portfolio of Investments – continued
| | | | | | | | |
| Issuer | | Shares/Par | | | Value ($) | |
| Common Stocks - continued | | | | | | | | |
| Insurance - continued | | | | | | | | |
| Travelers Cos., Inc. | | | 1,442 | | | $ | 143,551 | |
| Validus Holdings Ltd. | | | 6,352 | | | | 281,267 | |
| | | | | | | | |
| | | | | | | $ | 1,307,028 | |
| Internet - 2.0% | | | | | | | | |
| Google, Inc., “A” (a) | | | 524 | | | $ | 339,458 | |
| | |
| Major Banks - 2.2% | | | | | | | | |
| PNC Financial Services Group, Inc. | | | 956 | | | $ | 87,111 | |
| Wells Fargo & Co. | | | 5,375 | | | | 286,649 | |
| | | | | | | | |
| | | | | | | $ | 373,760 | |
| Medical & Health Technology & Services - 3.9% | | | | | | | | |
| AmerisourceBergen Corp. | | | 1,797 | | | $ | 179,772 | |
| HCA Holdings, Inc. (a) | | | 808 | | | | 69,989 | |
| Henry Schein, Inc. (a) | | | 1,019 | | | | 139,409 | |
| McKesson Corp. | | | 867 | | | | 171,302 | |
| MEDNAX, Inc. (a) | | | 985 | | | | 79,342 | |
| | | | | | | | |
| | | | | | | $ | 639,814 | |
| Medical Equipment - 3.2% | | | | | | | | |
| Abbott Laboratories | | | 5,099 | | | $ | 230,934 | |
| Becton, Dickinson and Co. | | | 625 | | | | 88,138 | |
| Medtronic PLC | | | 1,225 | | | | 88,555 | |
| Zimmer Biomet Holdings, Inc. | | | 1,150 | | | | 119,094 | |
| | | | | | | | |
| | | | | | | $ | 526,721 | |
| Network & Telecom - 1.0% | | | | | | | | |
| Cisco Systems, Inc. | | | 6,335 | | | $ | 163,950 | |
| | |
| Oil Services - 0.9% | | | | | | | | |
| Schlumberger Ltd. | | | 1,967 | | | $ | 152,187 | |
| | |
| Other Banks & Diversified Financials - 7.3% | | | | | | | | |
| American Express Co. | | | 1,039 | | | $ | 79,712 | |
| East West Bancorp, Inc. | | | 2,133 | | | | 86,195 | |
| M&T Bank Corp. | | | 3,551 | | | | 419,870 | |
| MasterCard, Inc., “A” | | | 1,652 | | | | 152,595 | |
| Visa, Inc., “A” | | | 6,527 | | | | 465,375 | |
| | | | | | | | |
| | | | | | | $ | 1,203,747 | |
| Pharmaceuticals - 9.2% | | | | | | | | |
| Allergan PLC (a) | | | 228 | | | $ | 69,253 | |
| Bristol-Myers Squibb Co. | | | 1,124 | | | | 66,844 | |
13
Portfolio of Investments – continued
| | | | | | | | |
| Issuer | | Shares/Par | | | Value ($) | |
| Common Stocks - continued | | | | | | | | |
| Pharmaceuticals - continued | | | | | | | | |
| Eli Lilly & Co. | | | 6,113 | | | $ | 503,406 | |
| Johnson & Johnson | | | 4,515 | | | | 424,320 | |
| Merck & Co., Inc. | | | 7,480 | | | | 402,798 | |
| Pfizer, Inc. | | | 1,896 | | | | 61,089 | |
| | | | | | | | |
| | | | | | | $ | 1,527,710 | |
| Pollution Control - 3.1% | | | | | | | | |
| Republic Services, Inc. | | | 4,370 | | | $ | 179,083 | |
| Stericycle, Inc. (a) | | | 1,269 | | | | 179,107 | |
| Waste Connections, Inc. | | | 3,398 | | | | 161,609 | |
| | | | | | | | |
| | | | | | | $ | 519,799 | |
| Real Estate - 4.1% | | | | | | | | |
| AvalonBay Communities, Inc., REIT | | | 385 | | | $ | 63,548 | |
| Public Storage, Inc., REIT | | | 2,477 | | | | 498,546 | |
| Simon Property Group, Inc., REIT | | | 648 | | | | 116,199 | |
| | | | | | | | |
| | | | | | | $ | 678,293 | |
| Restaurants - 2.2% | | | | | | | | |
| McDonald’s Corp. | | | 3,895 | | | $ | 370,103 | |
| | |
| Specialty Chemicals - 0.4% | | | | | | | | |
| Praxair, Inc. | | | 618 | | | $ | 65,354 | |
| | |
| Specialty Stores - 2.0% | | | | | | | | |
| AutoZone, Inc. (a) | | | 187 | | | $ | 133,890 | |
| Home Depot, Inc. | | | 577 | | | | 67,197 | |
| O’Reilly Automotive, Inc. (a) | | | 532 | | | | 127,717 | |
| | | | | | | | |
| | | | | | | $ | 328,804 | |
| Telecommunications - Wireless - 0.6% | | | | | | | | |
| American Tower Corp., REIT | | | 1,079 | | | $ | 99,473 | |
| | |
| Telephone Services - 2.1% | | | | | | | | |
| AT&T, Inc. | | | 3,219 | | | $ | 106,871 | |
| Verizon Communications, Inc. | | | 5,110 | | | | 235,111 | |
| | | | | | | | |
| | | | | | | $ | 341,982 | |
| Tobacco - 2.2% | | | | | | | | |
| Altria Group, Inc. | | | 2,533 | | | $ | 135,718 | |
| Philip Morris International, Inc. | | | 1,970 | | | | 157,206 | |
| Reynolds American, Inc. | | | 882 | | | | 73,868 | |
| | | | | | | | |
| | | | | | | $ | 366,792 | |
14
Portfolio of Investments – continued
| | | | | | | | |
| Issuer | | Shares/Par | | | Value ($) | |
| Common Stocks - continued | | | | | | | | |
| Utilities - Electric Power - 6.1% | | | | | | | | |
| Alliant Energy Corp. | | | 1,049 | | | $ | 59,447 | |
| American Electric Power Co., Inc. | | | 2,095 | | | | 113,738 | |
| Consolidated Edison, Inc. | | | 1,158 | | | | 72,850 | |
| Dominion Resources, Inc. | | | 1,454 | | | | 101,417 | |
| Duke Energy Corp. | | | 994 | | | | 70,485 | |
| NextEra Energy, Inc. | | | 1,901 | | | | 187,077 | |
| OGE Energy Corp. | | | 5,818 | | | | 163,137 | |
| Pinnacle West Capital Corp. | | | 1,245 | | | | 74,115 | |
| Southern Co. | | | 2,339 | | | | 101,536 | |
| Xcel Energy, Inc. | | | 1,835 | | | | 61,895 | |
| | | | | | | | |
| | | | | | | $ | 1,005,697 | |
| Total Common Stocks (Identified Cost, $16,257,860) | | | | | | $ | 16,232,383 | |
| | |
| Money Market Funds - 2.8% | | | | | | | | |
MFS Institutional Money Market Portfolio, 0.11%,
at Cost and Net Asset Value (v) | | | 460,003 | | | $ | 460,003 | |
| Total Investments (Identified Cost, $16,717,863) | | | | | | $ | 16,692,386 | |
| | |
| Other Assets, Less Liabilities - (0.8)% | | | | | | | (136,192 | ) |
| Net Assets - 100.0% | | | | | | $ | 16,556,194 | |
| (a) | Non-income producing security. |
| (v) | Underlying affiliated fund that is available only to investment companies managed by MFS. The rate quoted for the MFS Institutional Money Market Portfolio is the annualized seven-day yield of the fund at period end. |
The following abbreviations are used in this report and are defined:
| PLC | | Public Limited Company |
| REIT | | Real Estate Investment Trust |
See Notes to Financial Statements
15
Financial Statements
STATEMENT OF ASSETS AND LIABILITIES
At 8/31/15
This statement represents your fund’s balance sheet, which details the assets and liabilities comprising the total value of the fund.
| | | | |
| Assets | | | | |
Investments | | | | |
Non-affiliated issuers, at value (identified cost, $16,257,860) | | | $16,232,383 | |
Underlying affiliated funds, at cost and value | | | 460,003 | |
Total investments, at value (identified cost, $16,717,863) | | | $16,692,386 | |
Receivables for | | | | |
Fund shares sold | | | 310,694 | |
Dividends | | | 44,527 | |
Receivable from investment adviser | | | 13,490 | |
Other assets | | | 34 | |
Total assets | | | $17,061,131 | |
| Liabilities | | | | |
Payables for | | | | |
Investments purchased | | | $381,325 | |
Fund shares reacquired | | | 71,722 | |
Payable to affiliates | | | | |
Shareholder servicing costs | | | 2,082 | |
Distribution and service fees | | | 83 | |
Payable for independent Trustees’ compensation | | | 9 | |
Accrued expenses and other liabilities | | | 49,716 | |
Total liabilities | | | $504,937 | |
Net assets | | | $16,556,194 | |
| Net assets consist of | | | | |
Paid-in capital | | | $16,471,901 | |
Unrealized appreciation (depreciation) on investments | | | (25,477 | ) |
Accumulated net realized gain (loss) on investments | | | 79,272 | |
Undistributed net investment income | | | 30,498 | |
Net assets | | | $16,556,194 | |
Shares of beneficial interest outstanding | | | 1,488,575 | |
16
Statement of Assets and Liabilities – continued
| | | | | | | | | | | | |
| | | Net assets | | | Shares
outstanding | | | Net asset value
per share (a) | |
Class A | | | $11,266,945 | | | | 1,012,964 | | | | $11.12 | |
Class B | | | 716,786 | | | | 64,553 | | | | 11.10 | |
Class C | | | 1,564,239 | | | | 141,056 | | | | 11.09 | |
Class I | | | 964,259 | | | | 86,549 | | | | 11.14 | |
Class R1 | | | 111,731 | | | | 10,049 | | | | 11.12 | |
Class R2 | | | 112,707 | | | | 10,126 | | | | 11.13 | |
Class R3 | | | 113,198 | | | | 10,165 | | | | 11.14 | |
Class R4 | | | 113,691 | | | | 10,204 | | | | 11.14 | |
Class R5 | | | 1,592,638 | | | | 142,909 | | | | 11.14 | |
| (a) | Maximum offering price per share was equal to the net asset value per share for all share classes, except for Class A, for which the maximum offering price per share was $11.80 [100 / 94.25 x $11.12]. On sales of $50,000 or more, the maximum offering price of Class A shares is reduced. A contingent deferred sales charge may be imposed on redemptions of Class A, Class B, and Class C shares. Redemption price per share was equal to the net asset value per share for Classes I, R1, R2, R3, R4, and R5. |
See Notes to Financial Statements
17
Financial Statements
STATEMENT OF OPERATIONS
Year ended 8/31/15
This statement describes how much your fund earned in investment income and accrued in expenses. It also describes any gains and/or losses generated by fund operations.
| | | | |
| Net investment income | | | | |
Income | | | | |
Dividends | | | $263,595 | |
Dividends from underlying affiliated funds | | | 184 | |
Total investment income | | | $263,779 | |
Expenses | | | | |
Management fee | | | $83,105 | |
Distribution and service fees | | | 34,106 | |
Shareholder servicing costs | | | 7,582 | |
Administrative services fee | | | 17,500 | |
Independent Trustees’ compensation | | | 1,190 | |
Custodian fee | | | 14,519 | |
Shareholder communications | | | 11,947 | |
Audit and tax fees | | | 38,425 | |
Legal fees | | | 87 | |
Registration fees | | | 105,491 | |
Miscellaneous | | | 12,365 | |
Total expenses | | | $326,317 | |
Reduction of expenses by investment adviser and distributor | | | (189,170 | ) |
Net expenses | | | $137,147 | |
Net investment income | | | $126,632 | |
| Realized and unrealized gain (loss) on investments | |
Realized gain (loss) on investments (identified cost basis) | | | $89,950 | |
Change in unrealized appreciation (depreciation) on investments | | | $(250,899 | ) |
Net realized and unrealized gain (loss) on investments | | | $(160,949 | ) |
Change in net assets from operations | | | $(34,317 | ) |
See Notes to Financial Statements
18
Financial Statements
STATEMENTS OF CHANGES IN NET ASSETS
These statements describe the increases and/or decreases in net assets resulting from operations, any distributions, and any shareholder transactions.
| | | | | | | | |
| Change in net assets | | Year ended
8/31/15 | | | Period ended
8/31/14 (c) | |
| From operations | | | | | | | | |
Net investment income | | | $126,632 | | | | $26,186 | |
Net realized gain (loss) on investments | | | 89,950 | | | | 743 | |
Net unrealized gain (loss) on investments | | | (250,899 | ) | | | 225,422 | |
Change in net assets from operations | | | $(34,317 | ) | | | $252,351 | |
| Distributions declared to shareholders | | | | | | | | |
From net investment income | | | $(106,873 | ) | | | $(16,493 | ) |
From net realized gain on investments | | | (2,950 | ) | | | — | |
Total distributions declared to shareholders | | | $(109,823 | ) | | | $(16,493 | ) |
Change in net assets from fund share transactions | | | $12,816,813 | | | | $3,647,663 | |
Total change in net assets | | | $12,672,673 | | | | $3,883,521 | |
| Net assets | | | | | | | | |
At beginning of period | | | 3,883,521 | | | | — | |
At end of period (including undistributed net investment income of $30,498 and $10,739, respectively) | | | $16,556,194 | | | | $3,883,521 | |
| (c) | For the period from the commencement of the fund’s investment operations, December 5, 2013, through the stated period end. |
See Notes to Financial Statements
19
Financial Statements
FINANCIAL HIGHLIGHTS
The financial highlights table is intended to help you understand the fund’s financial performance for the past 5 years (or life of a particular share class, if shorter). Certain information reflects financial results for a single fund share. The total returns in the table represent the rate by which an investor would have earned (or lost) on an investment in the fund share class (assuming reinvestment of all distributions) held for the entire period.
| | | | | | | | |
| Class A | | Year ended
2015 | | | Period ended
8/31/14 (c) | |
Net asset value, beginning of period | | | $10.82 | | | | $10.00 | |
| Income (loss) from investment operations | | | | | | | | |
Net investment income (d) | | | $0.14 | | | | $0.11 | |
Net realized and unrealized gain (loss) on investments and
foreign currency | | | 0.30 | (g) | | | 0.77 | |
Total from investment operations | | | $0.44 | | | | $0.88 | |
| Less distributions declared to shareholders | | | | | | | | |
From net investment income | | | $(0.13 | ) | | | $(0.06 | ) |
From net realized gain on investments | | | (0.01 | ) | | | — | |
Total distributions declared to shareholders | | | $(0.14 | ) | | | $(0.06 | ) |
Net asset value, end of period (x) | | | $11.12 | | | | $10.82 | |
Total return (%) (r)(s)(t)(x) | | | 4.01 | | | | 8.82 | (n) |
Ratios (%) (to average net assets)
and Supplemental data: | | | | | | | | |
Expenses before expense reductions (f) | | | 2.72 | | | | 4.45 | (a) |
Expenses after expense reductions (f) | | | 1.18 | �� | | | 1.15 | (a) |
Net investment income | | | 1.22 | | | | 1.40 | (a) |
Portfolio turnover | | | 33 | | | | 30 | (n) |
Net assets at end of period (000 omitted) | | | $11,267 | | | | $1,154 | |
See Notes to Financial Statements
20
Financial Highlights – continued
| | | | | | | | |
| Class B | | Years ended
2015 | | | Period ended
8/31/14 (c) | |
Net asset value, beginning of period | | | $10.81 | | | | $10.00 | |
| Income (loss) from investment operations | | | | | | | | |
Net investment income (d) | | | $0.05 | | | | $0.04 | |
Net realized and unrealized gain (loss) on investments and
foreign currency | | | 0.30 | (g) | | | 0.78 | |
Total from investment operations | | | $0.35 | | | | $0.82 | |
| Less distributions declared to shareholders | | | | | | | | |
From net investment income | | | $(0.05 | ) | | | $(0.01 | ) |
From net realized gain on investments | | | (0.01 | ) | | | — | |
Total distributions declared to shareholders | | | $(0.06 | ) | | | $(0.01 | ) |
Net asset value, end of period (x) | | | $11.10 | | | | $10.81 | |
Total return (%) (r)(s)(t)(x) | | | 3.20 | | | | 8.23 | (n) |
Ratios (%) (to average net assets)
and Supplemental data: | | | | | | | | |
Expenses before expense reductions (f) | | | 3.79 | | | | 5.75 | (a) |
Expenses after expense reductions (f) | | | 1.95 | | | | 1.93 | (a) |
Net investment income | | | 0.43 | | | | 0.46 | (a) |
Portfolio turnover | | | 33 | | | | 30 | (n) |
Net assets at end of period (000 omitted) | | | $717 | | | | $170 | |
| | |
| Class C | | Years ended
2015 | | | Period ended
8/31/14 (c) | |
Net asset value, beginning of period | | | $10.80 | | | | $10.00 | |
| Income (loss) from investment operations | | | | | | | | |
Net investment income (d) | | | $0.05 | | | | $0.04 | |
Net realized and unrealized gain (loss) on investments and
foreign currency | | | 0.30 | (g) | | | 0.79 | |
Total from investment operations | | | $0.35 | | | | $0.83 | |
| Less distributions declared to shareholders | | | | | | | | |
From net investment income | | | $(0.05 | ) | | | $(0.03 | ) |
From net realized gain on investments | | | (0.01 | ) | | | — | |
Total distributions declared to shareholders | | | $(0.06 | ) | | | $(0.03 | ) |
Net asset value, end of period (x) | | | $11.09 | | | | $10.80 | |
Total return (%) (r)(s)(t)(x) | | | 3.23 | | | | 8.27 | (n) |
Ratios (%) (to average net assets)
and Supplemental data: | | | | | | | | |
Expenses before expense reductions (f) | | | 3.73 | | | | 5.39 | (a) |
Expenses after expense reductions (f) | | | 1.95 | | | | 1.93 | (a) |
Net investment income | | | 0.43 | | | | 0.48 | (a) |
Portfolio turnover | | | 33 | | | | 30 | (n) |
Net assets at end of period (000 omitted) | | | $1,564 | | | | $421 | |
See Notes to Financial Statements
21
Financial Highlights – continued
| | | | | | | | |
| Class I | | Years ended
2015 | | | Period ended
8/31/14 (c) | |
Net asset value, beginning of period | | | $10.84 | | | | $10.00 | |
| Income (loss) from investment operations | | | | | | | | |
Net investment income (d) | | | $0.16 | | | | $0.11 | |
Net realized and unrealized gain (loss) on investments and
foreign currency | | | 0.30 | (g) | | | 0.80 | |
Total from investment operations | | | $0.46 | | | | $0.91 | |
| Less distributions declared to shareholders | | | | | | | | |
From net investment income | | | $(0.15 | ) | | | $(0.07 | ) |
From net realized gain on investments | | | (0.01 | ) | | | — | |
Total distributions declared to shareholders | | | $(0.16 | ) | | | $(0.07 | ) |
Net asset value, end of period (x) | | | $11.14 | | | | $10.84 | |
Total return (%) (r)(s)(x) | | | 4.20 | | | | 9.09 | (n) |
Ratios (%) (to average net assets)
and Supplemental data: | | | | | | | | |
Expenses before expense reductions (f) | | | 2.53 | | | | 4.72 | (a) |
Expenses after expense reductions (f) | | | 0.95 | | | | 0.93 | (a) |
Net investment income | | | 1.36 | | | | 1.43 | (a) |
Portfolio turnover | | | 33 | | | | 30 | (n) |
Net assets at end of period (000 omitted) | | | $964 | | | | $177 | |
| | |
| Class R1 | | Years ended
2015 | | | Period ended
8/31/14 (c) | |
Net asset value, beginning of period | | | $10.82 | | | | $10.00 | |
| Income (loss) from investment operations | | | | | | | | |
Net investment income (d) | | | $0.04 | | | | $0.03 | |
Net realized and unrealized gain (loss) on investments and
foreign currency | | | 0.31 | (g) | | | 0.80 | |
Total from investment operations | | | $0.35 | | | | $0.83 | |
| Less distributions declared to shareholders | | | | | | | | |
From net investment income | | | $(0.04 | ) | | | $(0.01 | ) |
From net realized gain on investments | | | (0.01 | ) | | | — | |
Total distributions declared to shareholders | | | $(0.05 | ) | | | $(0.01 | ) |
Net asset value, end of period (x) | | | $11.12 | | | | $10.82 | |
Total return (%) (r)(s)(x) | | | 3.18 | | | | 8.30 | (n) |
Ratios (%) (to average net assets)
and Supplemental data: | | | | | | | | |
Expenses before expense reductions (f) | | | 4.18 | | | | 5.92 | (a) |
Expenses after expense reductions (f) | | | 1.95 | | | | 1.93 | (a) |
Net investment income | | | 0.39 | | | | 0.40 | (a) |
Portfolio turnover | | | 33 | | | | 30 | (n) |
Net assets at end of period (000 omitted) | | | $112 | | | | $108 | |
See Notes to Financial Statements
22
Financial Highlights – continued
| | | | | | | | |
| Class R2 | | Years ended
2015 | | | Period ended
8/31/14 (c) | |
Net asset value, beginning of period | | | $10.83 | | | | $10.00 | |
| Income (loss) from investment operations | | | | | | | | |
Net investment income (d) | | | $0.10 | | | | $0.07 | |
Net realized and unrealized gain (loss) on investments and
foreign currency | | | 0.30 | (g) | | | 0.80 | |
Total from investment operations | | | $0.40 | | | | $0.87 | |
| Less distributions declared to shareholders | | | | | | | | |
From net investment income | | | $(0.09 | ) | | | $(0.04 | ) |
From net realized gain on investments | | | (0.01 | ) | | | — | |
Total distributions declared to shareholders | | | $(0.10 | ) | | | $(0.04 | ) |
Net asset value, end of period (x) | | | $11.13 | | | | $10.83 | |
Total return (%) (r)(s)(x) | | | 3.69 | | | | 8.69 | (n) |
Ratios (%) (to average net assets)
and Supplemental data: | | | | | | | | |
Expenses before expense reductions (f) | | | 3.68 | | | | 5.42 | (a) |
Expenses after expense reductions (f) | | | 1.45 | | | | 1.43 | (a) |
Net investment income | | | 0.89 | | | | 0.90 | (a) |
Portfolio turnover | | | 33 | | | | 30 | (n) |
Net assets at end of period (000 omitted) | | | $113 | | | | $109 | |
| | |
| Class R3 | | Years ended
2015 | | | Period ended
8/31/14 (c) | |
Net asset value, beginning of period | | | $10.83 | | | | $10.00 | |
| Income (loss) from investment operations | | | | | | | | |
Net investment income (d) | | | $0.13 | | | | $0.09 | |
Net realized and unrealized gain (loss) on investments and
foreign currency | | | 0.31 | (g) | | | 0.79 | |
Total from investment operations | | | $0.44 | | | | $0.88 | |
| Less distributions declared to shareholders | | | | | | | | |
From net investment income | | | $(0.12 | ) | | | $(0.05 | ) |
From net realized gain on investments | | | (0.01 | ) | | | — | |
Total distributions declared to shareholders | | | $(0.13 | ) | | | $(0.05 | ) |
Net asset value, end of period (x) | | | $11.14 | | | | $10.83 | |
Total return (%) (r)(s)(x) | | | 4.04 | | | | 8.84 | (n) |
Ratios (%) (to average net assets)
and Supplemental data: | | | | | | | | |
Expenses before expense reductions (f) | | | 3.43 | | | | 5.17 | (a) |
Expenses after expense reductions (f) | | | 1.20 | | | | 1.18 | (a) |
Net investment income | | | 1.14 | | | | 1.15 | (a) |
Portfolio turnover | | | 33 | | | | 30 | (n) |
Net assets at end of period (000 omitted) | | | $113 | | | | $109 | |
See Notes to Financial Statements
23
Financial Highlights – continued
| | | | | | | | |
| Class R4 | | Years ended
2015 | | | Period ended
8/31/14 (c) | |
Net asset value, beginning of period | | | $10.84 | | | | $10.00 | |
| Income (loss) from investment operations | | | | | | | | |
Net investment income (d) | | | $0.16 | | | | $0.11 | |
Net realized and unrealized gain (loss) on investments and
foreign currency | | | 0.30 | (g) | | | 0.80 | |
Total from investment operations | | | $0.46 | | | | $0.91 | |
| Less distributions declared to shareholders | | | | | | | | |
From net investment income | | | $(0.15 | ) | | | $(0.07 | ) |
From net realized gain on investments | | | (0.01 | ) | | | — | |
Total distributions declared to shareholders | | | $(0.16 | ) | | | $(0.07 | ) |
Net asset value, end of period (x) | | | $11.14 | | | | $10.84 | |
Total return (%) (r)(s)(x) | | | 4.20 | | | | 9.09 | (n) |
Ratios (%) (to average net assets)
and Supplemental data: | | | | | | | | |
Expenses before expense reductions (f) | | | 3.18 | | | | 4.92 | (a) |
Expenses after expense reductions (f) | | | 0.95 | | | | 0.93 | (a) |
Net investment income | | | 1.39 | | | | 1.40 | (a) |
Portfolio turnover | | | 33 | | | | 30 | (n) |
Net assets at end of period (000 omitted) | | | $114 | | | | $109 | |
| | |
| Class R5 | | Years ended
2015 | | | Period ended
8/31/14 (c) | |
Net asset value, beginning of period | | | $10.84 | | | | $10.00 | |
| Income (loss) from investment operations | | | | | | | | |
Net investment income (d) | | | $0.16 | | | | $0.11 | |
Net realized and unrealized gain (loss) on investments and
foreign currency | | | 0.30 | (g) | | | 0.80 | |
Total from investment operations | | | $0.46 | | | | $0.91 | |
| Less distributions declared to shareholders | | | | | | | | |
From net investment income | | | $(0.15 | ) | | | $(0.07 | ) |
From net realized gain on investments | | | (0.01 | ) | | | — | |
Total distributions declared to shareholders | | | $(0.16 | ) | | | $(0.07 | ) |
Net asset value, end of period (x) | | | $11.14 | | | | $10.84 | |
Total return (%) (r)(s)(x) | | | 4.22 | | | | 9.11 | (n) |
Ratios (%) (to average net assets)
and Supplemental data: | | | | | | | | |
Expenses before expense reductions (f) | | | 3.14 | | | | 4.90 | (a) |
Expenses after expense reductions (f) | | | 0.91 | | | | 0.91 | (a) |
Net investment income | | | 1.43 | | | | 1.42 | (a) |
Portfolio turnover | | | 33 | | | | 30 | (n) |
Net assets at end of period (000 omitted) | | | $1,593 | | | | $1,527 | |
See Notes to Financial Statements
24
Financial Highlights – continued
| (c) | For the period from the commencement of the fund’s investment operations, December 5, 2013, through the stated period end. |
| (d) | Per share data is based on average shares outstanding. |
| (f) | Ratios do not reflect reductions from fees paid indirectly, if applicable. |
| (g) | The per share amount varies from the net realized and unrealized gain/loss for the period because of the timing of sales of fund shares and the per share amount of realized and unrealized gains and losses at such time. |
| (r) | Certain expenses have been reduced without which performance would have been lower. |
| (s) | From time to time the fund may receive proceeds from litigation settlements, without which performance would be lower. |
| (t) | Total returns do not include any applicable sales charges. |
| (x) | The net asset values per share and total returns have been calculated on net asset values which include adjustments made in accordance with U.S. generally accepted accounting principles required at period end for financial reporting purposes. |
See Notes to Financial Statements
25
NOTES TO FINANCIAL STATEMENTS
(1) Business and Organization
MFS Low Volatility Equity Fund (the fund) is a diversified series of MFS Series Trust I (the trust). The trust is organized as a Massachusetts business trust and is registered under the Investment Company Act of 1940, as amended, as an open-end management investment company.
The fund is an investment company and accordingly follows the investment company accounting and reporting guidance of the Financial Accounting Standards Board (FASB) Accounting Standards Codification Topic 946 Financial Services – Investment Companies.
(2) Significant Accounting Policies
General – The preparation of financial statements in conformity with U.S. generally accepted accounting principles requires management to make estimates and assumptions that affect the reported amounts of assets and liabilities, and disclosure of contingent assets and liabilities at the date of the financial statements and the reported amounts of increases and decreases in net assets from operations during the reporting period. Actual results could differ from those estimates. In the preparation of these financial statements, management has evaluated subsequent events occurring after the date of the fund’s Statement of Assets and Liabilities through the date that the financial statements were issued.
In June 2014, FASB issued Accounting Standards Update 2014-11, Transfers and Servicing (Topic 860) – Repurchase-to-Maturity Transactions, Repurchase Financings, and Disclosures (“ASU 2014-11”). ASU 2014-11 changes the accounting for repurchase-to-maturity transactions (i.e., repurchase agreements that settle at the same time as the maturity of the transferred financial asset) and enhances the required disclosures for repurchase agreements and other similar transactions. Although still evaluating the potential impacts of ASU 2014-11 to the fund, management expects that the impact of the fund’s adoption will be limited to additional financial statement disclosures which would first be effective for interim reporting periods beginning after March 15, 2015.
Balance Sheet Offsetting – The fund’s accounting policy with respect to balance sheet offsetting is that, absent an event of default by the counterparty or a termination of the agreement, the International Swaps and Derivatives Association (ISDA) Master Agreement does not result in an offset of reported amounts of financial assets and financial liabilities in the Statement of Assets and Liabilities across transactions between the fund and the applicable counterparty. The fund’s right to setoff may be restricted or prohibited by the bankruptcy or insolvency laws of the particular jurisdiction to which a specific master netting agreement counterparty is subject. Balance sheet offsetting disclosures, to the extent applicable to the fund, have been included in the fund’s Significant Accounting Policies note under the captions for each of the fund’s in-scope financial instruments and transactions.
Investment Valuations – Equity securities, including restricted equity securities, are generally valued at the last sale or official closing price as provided by a third-party pricing service on the market or exchange on which they are primarily traded. Equity
26
Notes to Financial Statements – continued
securities, for which there were no sales reported that day, are generally valued at the last quoted daily bid quotation as provided by a third-party pricing service on the market or exchange on which such securities are primarily traded. Short-term instruments with a maturity at issuance of 60 days or less may be valued at amortized cost, which approximates market value. Open-end investment companies are generally valued at net asset value per share. Securities and other assets generally valued on the basis of information from a third-party pricing service may also be valued at a broker/dealer bid quotation. Values obtained from third-party pricing services can utilize both transaction data and market information such as yield, quality, coupon rate, maturity, type of issue, trading characteristics, and other market data.
The Board of Trustees has delegated primary responsibility for determining or causing to be determined the value of the fund’s investments (including any fair valuation) to the adviser pursuant to valuation policies and procedures approved by the Board. If the adviser determines that reliable market quotations are not readily available, investments are valued at fair value as determined in good faith by the adviser in accordance with such procedures under the oversight of the Board of Trustees. Under the fund’s valuation policies and procedures, market quotations are not considered to be readily available for most types of debt instruments and floating rate loans and many types of derivatives. These investments are generally valued at fair value based on information from third-party pricing services. In addition, investments may be valued at fair value if the adviser determines that an investment’s value has been materially affected by events occurring after the close of the exchange or market on which the investment is principally traded (such as foreign exchange or market) and prior to the determination of the fund’s net asset value, or after the halting of trading of a specific security where trading does not resume prior to the close of the exchange or market on which the security is principally traded. Events that occur on a frequent basis after foreign markets close (such as developments in foreign markets and significant movements in the U.S. markets) and prior to the determination of the fund’s net asset value may be deemed to have a material effect on the value of securities traded in foreign markets. Accordingly, the fund’s foreign equity securities may often be valued at fair value. The adviser generally relies on third-party pricing services or other information (such as the correlation with price movements of similar securities in the same or other markets; the type, cost and investment characteristics of the security; the business and financial condition of the issuer; and trading and other market data) to assist in determining whether to fair value and at what value to fair value an investment. The value of an investment for purposes of calculating the fund’s net asset value can differ depending on the source and method used to determine value. When fair valuation is used, the value of an investment used to determine the fund’s net asset value may differ from quoted or published prices for the same investment. There can be no assurance that the fund could obtain the fair value assigned to an investment if it were to sell the investment at the same time at which the fund determines its net asset value per share.
Various inputs are used in determining the value of the fund’s assets or liabilities. These inputs are categorized into three broad levels. In certain cases, the inputs used to measure fair value may fall into different levels of the fair value hierarchy. In such cases, an investment’s level within the fair value hierarchy is based on the lowest level of input that is significant to the fair value measurement. The fund’s assessment of the
27
Notes to Financial Statements – continued
significance of a particular input to the fair value measurement in its entirety requires judgment, and considers factors specific to the investment. Level 1 includes unadjusted quoted prices in active markets for identical assets or liabilities. Level 2 includes other significant observable market-based inputs (including quoted prices for similar securities, interest rates, prepayment speed, and credit risk). Level 3 includes unobservable inputs, which may include the adviser’s own assumptions in determining the fair value of investments. The following is a summary of the levels used as of August 31, 2015 in valuing the fund’s assets or liabilities:
| | | | | | | | | | | | | | | | |
| Investments at Value | | Level 1 | | | Level 2 | | | Level 3 | | | Total | |
| Equity Securities | | | $16,232,383 | | | | $— | | | | $— | | | | $16,232,383 | |
| Mutual Funds | | | 460,003 | | | | — | | | | — | | | | 460,003 | |
| Total Investments | | | $16,692,386 | | | | $— | | | | $— | | | | $16,692,386 | |
For further information regarding security characteristics, see the Portfolio of Investments.
Indemnifications – Under the fund’s organizational documents, its officers and Trustees may be indemnified against certain liabilities and expenses arising out of the performance of their duties to the fund. Additionally, in the normal course of business, the fund enters into agreements with service providers that may contain indemnification clauses. The fund’s maximum exposure under these agreements is unknown as this would involve future claims that may be made against the fund that have not yet occurred.
Investment Transactions and Income – Investment transactions are recorded on the trade date. Dividends received in cash are recorded on the ex-dividend date. Certain dividends from foreign securities will be recorded when the fund is informed of the dividend if such information is obtained subsequent to the ex-dividend date. Dividend payments received in additional securities are recorded on the ex-dividend date in an amount equal to the value of the security on such date.
The fund may receive proceeds from litigation settlements. Any proceeds received from litigation involving portfolio holdings are reflected in the Statement of Operations in realized gain/loss if the security has been disposed of by the fund or in unrealized gain/loss if the security is still held by the fund. Any other proceeds from litigation not related to portfolio holdings are reflected as other income in the Statement of Operations.
Fees Paid Indirectly – The fund’s custody fee may be reduced by a credit earned under an arrangement that measures the value of U.S. dollars deposited with the custodian by the fund. For the year ended August 31, 2015, custody fees were not reduced.
Tax Matters and Distributions – The fund intends to qualify as a regulated investment company, as defined under Subchapter M of the Internal Revenue Code, and to distribute all of its taxable income, including realized capital gains. As a result, no provision for federal income tax is required. The fund’s federal tax returns, when filed, will remain subject to examination by the Internal Revenue Service for a three year period. Management has analyzed the fund’s tax positions taken on federal and state tax returns for all open tax years and does not believe that there are any uncertain tax positions that require recognition of a tax liability.
28
Notes to Financial Statements – continued
Distributions to shareholders are recorded on the ex-dividend date. Income and capital gain distributions are determined in accordance with income tax regulations, which may differ from U.S. generally accepted accounting principles. Certain capital accounts in the financial statements are periodically adjusted for permanent differences in order to reflect their tax character. These adjustments have no impact on net assets or net asset value per share. Temporary differences which arise from recognizing certain items of income, expense, gain or loss in different periods for financial statement and tax purposes will reverse at some time in the future. Distributions in excess of net investment income or net realized gains are temporary overdistributions for financial statement purposes resulting from differences in the recognition or classification of income or distributions for financial statement and tax purposes.
Book/tax differences primarily relate to wash sale loss deferrals and treating a portion of the proceeds from redemptions as a distribution for tax purposes.
The tax character of distributions declared to shareholders for the last two fiscal years is as follows:
| | | | | | | | |
| | | 8/31/15 | | | 8/31/14 | |
| Ordinary income (including any short-term capital gains) | | | $109,823 | | | | $16,493 | |
The federal tax cost and the tax basis components of distributable earnings were as follows:
| | | | |
| As of 8/31/15 | | | |
| Cost of investments | | | $16,773,692 | |
| Gross appreciation | | | 722,691 | |
| Gross depreciation | | | (803,997 | ) |
| Net unrealized appreciation (depreciation) | | | $(81,306 | ) |
| Undistributed ordinary income | | | 79,094 | |
| Undistributed long-term capital gain | | | 86,505 | |
Multiple Classes of Shares of Beneficial Interest – The fund offers multiple classes of shares, which differ in their respective distribution and service fees. The fund’s income, realized and unrealized gain (loss), and common expenses are allocated to shareholders based on the daily net assets of each class. Dividends are declared separately for each class. Differences in per share dividend rates are generally due to differences in separate class expenses. Class B shares will convert to Class A shares approximately eight years after purchase. The fund’s distributions declared to
29
Notes to Financial Statements – continued
shareholders as reported in the Statements of Changes in Net Assets are presented by class as follows:
| | | | | | | | | | | | | | | | |
| | | From net investment
income | | | From net realized gain on
investments | |
| | | Year
ended
8/31/15 | | | Period
ended
8/31/14 (c) | | | Year
ended
8/31/15 | | | Period
ended
8/31/14 (c) | |
| Class A | | | $68,391 | | | | $3,470 | | | | $1,238 | | | | $— | |
| Class B | | | 1,540 | | | | 140 | | | | 145 | | | | — | |
| Class C | | | 4,579 | | | | 618 | | | | 355 | | | | — | |
| Class I | | | 6,873 | | | | 1,009 | | | | 100 | | | | — | |
| Class R1 | | | 384 | | | | 97 | | | | 61 | | | | — | |
| Class R2 | | | 944 | | | | 379 | | | | 62 | | | | — | |
| Class R3 | | | 1,226 | | | | 521 | | | | 62 | | | | — | |
| Class R4 | | | 1,510 | | | | 663 | | | | 62 | | | | — | |
| Class R5 | | | 21,426 | | | | 9,596 | | | | 865 | | | | — | |
| Total | | | $106,873 | | | | $16,493 | | | | $2,950 | | | | $— | |
| (c) | For the period from the commencement of the fund’s investment operations, December 5, 2013, through the stated period end. |
(3) Transactions with Affiliates
Investment Adviser – The fund has an investment advisory agreement with MFS to provide overall investment management and related administrative services and facilities to the fund. The management fee is computed daily and paid monthly at the following annual rates:
| | | | |
| First $1 billion of average daily net assets | | | 0.75 | % |
| Next $1.5 billion of average daily net assets | | | 0.70 | % |
| Average daily net assets in excess of $2.5 billion | | | 0.65 | % |
The investment adviser has agreed in writing to reduce its management fee to 0.60% of average daily net assets for the first $1 billion and 0.55% of average daily net assets in excess of $1 billion. This written agreement will continue until modified by the fund’s Board of Trustees, but such agreement will continue at least until December 31, 2016. For the year ended August 31, 2015, this management fee reduction amounted to $16,621, which is included in the reduction of total expenses in the Statement of Operations. MFS has also agreed in writing to reduce its management fee by a specified amount if certain MFS mutual fund assets exceed thresholds agreed to by MFS and the fund’s Board of Trustees. For the year ended August 31, 2015, this management fee reduction amounted to $736, which is included in the reduction of total expenses in the Statement of Operations. The management fee incurred for the year ended August 31, 2015 was equivalent to an annual effective rate of 0.59% of the fund’s average daily net assets.
The investment adviser has agreed in writing to pay a portion of the fund’s total annual operating expenses, excluding interest, taxes, extraordinary expenses, brokerage and
30
Notes to Financial Statements – continued
transaction costs, and investment-related expenses, such that total fund operating expenses do not exceed the following rates annually of each class’s average daily net assets:
| | | | | | | | | | | | | | | | | | | | | | | | | | | | | | | | | | |
| Classes | |
| A | | | B | | | C | | | I | | | R1 | | | R2 | | | R3 | | | R4 | | | R5 | |
| | 1.20% | | | | 1.95% | | | | 1.95% | | | | 0.95% | | | | 1.95% | | | | 1.45% | | | | 1.20% | | | | 0.95% | | | | 0.91% | |
This written agreement will continue until modified by the fund’s Board of Trustees, but such agreement will continue at least until December 31, 2016. For the year ended August 31, 2015, this reduction amounted to $170,240, which is included in the reduction of total expenses in the Statement of Operations.
Distributor – MFS Fund Distributors, Inc. (MFD), a wholly-owned subsidiary of MFS, as distributor, received $18,989 for the year ended August 31, 2015, as its portion of the initial sales charge on sales of Class A shares of the fund.
The Board of Trustees has adopted a distribution plan for certain share classes pursuant to Rule 12b-1 of the Investment Company Act of 1940.
The fund’s distribution plan provides that the fund will pay MFD for services provided by MFD and financial intermediaries in connection with the distribution and servicing of certain share classes. One component of the plan is a distribution fee paid to MFD and another component of the plan is a service fee paid to MFD. MFD may subsequently pay all, or a portion, of the distribution and/or service fees to financial intermediaries.
Distribution Plan Fee Table:
| | | | | | | | | | | | | | | | | | | | |
| | | Distribution
Fee Rate (d) | | | Service
Fee Rate (d) | | | Total
Distribution
Plan (d) | | | Annual
Effective
Rate (e) | | | Distribution
and Service
Fee | |
| Class A | | | — | | | | 0.25% | | | | 0.25% | | | | 0.23% | | | | $17,457 | |
| Class B | | | 0.75% | | | | 0.25% | | | | 1.00% | | | | 1.00% | | | | 4,127 | |
| Class C | | | 0.75% | | | | 0.25% | | | | 1.00% | | | | 1.00% | | | | 10,527 | |
| Class R1 | | | 0.75% | | | | 0.25% | | | | 1.00% | | | | 1.00% | | | | 1,136 | |
| Class R2 | | | 0.25% | | | | 0.25% | | | | 0.50% | | | | 0.50% | | | | 572 | |
| Class R3 | | | — | | | | 0.25% | | | | 0.25% | | | | 0.25% | | | | 287 | |
| Total Distribution and Service Fees | | | | $34,106 | |
| (d) | In accordance with the distribution plan for certain classes, the fund pays distribution and/or service fees equal to these annual percentage rates of each class’s average daily net assets. The distribution and service fee rates disclosed by class represent the current rates in effect at the end of the reporting period. Any rate changes, if applicable, are detailed below. |
| (e) | MFD has voluntarily agreed to rebate a portion of each class’s 0.25% service fee attributable to accounts for which MFD retains the 0.25% service fee except for accounts attributable to MFS or its affiliates’ seed money. For the year ended August 31, 2015, this rebate amounted to $1,572 for Class A, and is included in the reduction of total expenses in the Statement of Operations. |
Certain Class A shares are subject to a contingent deferred sales charge (CDSC) in the event of a shareholder redemption within 18 months of purchase. Class C shares are subject to a CDSC in the event of a shareholder redemption within 12 months of purchase. Class B shares are subject to a CDSC in the event of a shareholder
31
Notes to Financial Statements – continued
redemption within six years of purchase. All contingent deferred sales charges are paid to MFD and during the year ended August 31, 2015, were as follows:
Shareholder Servicing Agent – MFS Service Center, Inc. (MFSC), a wholly-owned subsidiary of MFS, receives a fee from the fund for its services as shareholder servicing agent calculated as a percentage of the average daily net assets of the fund as determined periodically under the supervision of the fund’s Board of Trustees. For the year ended August 31, 2015, the fee was $1,883, which equated to 0.0170% annually of the fund’s average daily net assets. MFSC also receives payment from the fund for out-of-pocket expenses, sub-accounting and other shareholder servicing costs which may be paid to affiliated and unaffiliated service providers. Class R5 shares do not incur sub-accounting fees. For the year ended August 31, 2015, these out-of-pocket expenses, sub-accounting and other shareholder servicing costs amounted to $5,699.
Administrator – MFS provides certain financial, legal, shareholder communications, compliance, and other administrative services to the fund. Under an administrative services agreement, the fund reimburses MFS the costs incurred to provide these services. The fund is charged an annual fixed amount of $17,500 plus a fee based on average daily net assets. The administrative services fee incurred for the year ended August 31, 2015 was equivalent to an annual effective rate of 0.1580% of the fund’s average daily net assets.
Trustees’ and Officers’ Compensation – The fund pays compensation to independent Trustees in the form of a retainer, attendance fees, and additional compensation to Board and Committee chairpersons. The fund does not pay compensation directly to Trustees or officers of the fund who are also officers of the investment adviser, all of whom receive remuneration for their services to the fund from MFS. Certain officers and Trustees of the fund are officers or directors of MFS, MFD, and MFSC.
Other – Effective November 1, 2014, this fund and certain other funds managed by MFS (the funds) have entered into a service agreement (the ISO Agreement) which provides for payment of fees solely by the funds to Tarantino LLC in return for the provision of services of an Independent Senior Officer (ISO) for the funds. Frank L. Tarantino serves as the ISO and is an officer of the funds and the sole member of Tarantino LLC. The funds can terminate the ISO Agreement with Tarantino LLC at any time under the terms of the ISO Agreement. Prior to November 1, 2014, the funds had entered into a service agreement (the Compliance Officer Agreement) which provided for payment of fees by the funds to Tarantino LLC in return for the provision of services of an Independent Chief Compliance Officer (ICCO) for the funds. Prior to November 1, 2014, Frank L. Tarantino served as the ICCO. Effective October 31, 2014, Mr. Tarantino resigned as ICCO and the Compliance Officer Agreement between the funds and Tarantino LLC was terminated. For the year ended August 31, 2015, the aggregate fees paid by the fund under these agreements were $31 and are included in “Miscellaneous” expense in the Statement of Operations. MFS had agreed to reimburse the fund for a portion of the payments made by the fund for the services under the Compliance Officer Agreement in the amount of $1, which is included in the
32
Notes to Financial Statements – continued
reduction of total expenses in the Statement of Operations. Additionally, MFS has agreed to bear all expenses associated with office space, other administrative support, and supplies provided to the ICCO and ISO.
The fund invests in the MFS Institutional Money Market Portfolio which is managed by MFS and seeks current income consistent with preservation of capital and liquidity. Income earned on this investment is included in “Dividends from underlying affiliated funds” in the Statement of Operations. This money market fund does not pay a management fee to MFS.
On December 5, 2013, MFS purchased 140,000 shares of Class R5 and 10,000 shares of Class A, Class B, Class C, Class I, Class R1, Class R2, Class R3, and Class R4 for an aggregate amount of $2,200,000.
At August 31, 2015, MFS held 100% of the outstanding shares of Class R1, Class R2, Class R3, Class R4, and Class R5.
(4) Portfolio Securities
For the year ended August 31, 2015, purchases and sales of investments, other than short-term obligations, aggregated $16,242,487 and $3,532,623, respectively.
(5) Shares of Beneficial Interest
The fund’s Declaration of Trust permits the Trustees to issue an unlimited number of full and fractional shares of beneficial interest. Transactions in fund shares were as follows:
| | | | | | | | | | | | | | | | |
| | | Year ended
8/31/15 | | | Period ended
8/31/14 (c) | |
| | | Shares | | | Amount | | | Shares | | | Amount | |
| Shares sold | | | | | | | | | | | | | | | | |
Class A | | | 1,255,223 | | | | $14,308,949 | | | | 110,758 | | | | $1,150,103 | |
Class B | | | 61,412 | | | | 699,282 | | | | 15,774 | | | | 160,956 | |
Class C | | | 108,089 | | | | 1,225,622 | | | | 38,895 | | | | 404,114 | |
Class I | | | 90,200 | | | | 1,029,639 | | | | 16,190 | | | | 163,700 | |
Class R1 | | | — | | | | — | | | | 10,000 | | | | 100,000 | |
Class R2 | | | — | | | | — | | | | 10,000 | | | | 100,000 | |
Class R3 | | | — | | | | — | | | | 10,000 | | | | 100,000 | |
Class R4 | | | — | | | | — | | | | 10,000 | | | | 100,000 | |
Class R5 | | | — | | | | — | | | | 140,000 | | | | 1,400,000 | |
| | | 1,514,924 | | | | $17,263,492 | | | | 361,617 | | | | $3,678,873 | |
33
Notes to Financial Statements – continued
| | | | | | | | | | | | | | | | |
| | | Year ended
8/31/15 | | | Period ended
8/31/14 (c) | |
| | | Shares | | | Amount | | | Shares | | | Amount | |
| Shares issued to shareholders in reinvestment of distributions | | | | | | | | | | | | | | | | |
Class A | | | 6,132 | | | | $69,629 | | | | 331 | | | | $3,470 | |
Class B | | | 148 | | | | 1,670 | | | | 13 | | | | 138 | |
Class C | | | 438 | | | | 4,934 | | | | 58 | | | | 618 | |
Class I | | | 614 | | | | 6,973 | | | | 96 | | | | 1,009 | |
Class R1 | | | 40 | | | | 445 | | | | 9 | | | | 97 | |
Class R2 | | | 90 | | | | 1,005 | | | | 36 | | | | 379 | |
Class R3 | | | 115 | | | | 1,288 | | | | 50 | | | | 521 | |
Class R4 | | | 141 | | | | 1,572 | | | | 63 | | | | 663 | |
Class R5 | | | 1,991 | | | | 22,291 | | | | 918 | | | | 9,596 | |
| | | 9,709 | | | | $109,807 | | | | 1,574 | | | | $16,491 | |
| | | | |
| Shares reacquired | | | | | | | | | | | | | | | | |
Class A | | | (354,999 | ) | | | $(4,099,493 | ) | | | (4,481 | ) | | | $(46,920 | ) |
Class B | | | (12,729 | ) | | | (147,017 | ) | | | (65 | ) | | | (700 | ) |
Class C | | | (6,416 | ) | | | (73,362 | ) | | | (8 | ) | | | (81 | ) |
Class I | | | (20,551 | ) | | | (236,614 | ) | | | — | | | | — | |
| | | (394,695 | ) | | | $(4,556,486 | ) | | | (4,554 | ) | | | $(47,701 | ) |
| | | | |
| Net change | | | | | | | | | | | | | | | | |
Class A | | | 906,356 | | | | $10,279,085 | | | | 106,608 | | | | $1,106,653 | |
Class B | | | 48,831 | | | | 553,935 | | | | 15,722 | | | | 160,394 | |
Class C | | | 102,111 | | | | 1,157,194 | | | | 38,945 | | | | 404,651 | |
Class I | | | 70,263 | | | | 799,998 | | | | 16,286 | | | | 164,709 | |
Class R1 | | | 40 | | | | 445 | | | | 10,009 | | | | 100,097 | |
Class R2 | | | 90 | | | | 1,005 | | | | 10,036 | | | | 100,379 | |
Class R3 | | | 115 | | | | 1,288 | | | | 10,050 | | | | 100,521 | |
Class R4 | | | 141 | | | | 1,572 | | | | 10,063 | | | | 100,663 | |
Class R5 | �� | | 1,991 | | | | 22,291 | | | | 140,918 | | | | 1,409,596 | |
| | | 1,129,938 | | | | $12,816,813 | | | | 358,637 | | | | $3,647,663 | |
| (c) | For the period from the commencement of the fund’s investment operations, December 5, 2013, through the stated period end. |
(6) Line of Credit
The fund and certain other funds managed by MFS participate in a $1.25 billion unsecured committed line of credit, subject to a $1 billion sublimit, provided by a syndication of banks under a credit agreement. Borrowings may be made for temporary financing needs. Interest is charged to each fund, based on its borrowings, generally at a rate equal to the higher of the Overnight Federal Reserve funds rate or daily one month LIBOR plus an agreed upon spread. A commitment fee, based on the average daily, unused portion of the committed line of credit, is allocated among the participating funds at the end of each calendar quarter. In addition, the fund and other funds managed by MFS have established unsecured uncommitted borrowing arrangements with certain banks for temporary financing needs. Interest is charged to
34
Notes to Financial Statements – continued
each fund, based on its borrowings, at a rate equal to the Overnight Federal Reserve funds rate plus an agreed upon spread. For the year ended August 31, 2015, the fund’s commitment fee and interest expense were $30 and $0, respectively, and are included in “Miscellaneous” expense in the Statement of Operations.
(7) Transactions in Underlying Affiliated Funds-Affiliated Issuers
An affiliated issuer may be considered one in which the fund owns 5% or more of the outstanding voting securities, or a company which is under common control. For the purposes of this report, the fund assumes the following to be an affiliated issuer:
| | | | | | | | | | | | | | | | |
| Underlying Affiliated Fund | | Beginning
Shares/Par
Amount | | | Acquisitions
Shares/Par
Amount | | | Dispositions
Shares/Par
Amount | | | Ending
Shares/Par
Amount | |
MFS Institutional Money
Market Portfolio | | | 132,053 | | | | 10,220,019 | | | | (9,892,069 | ) | | | 460,003 | |
| | | | |
| Underlying Affiliated Fund | | Realized
Gain (Loss) | | | Capital Gain
Distributions | | | Dividend
Income | | | Ending
Value | |
MFS Institutional Money
Market Portfolio | | | $— | | | | $— | | | | $184 | | | | $460,003 | |
35
REPORT OF INDEPENDENT REGISTERED PUBLIC ACCOUNTING FIRM
To the Board of Trustees of MFS Series Trust I and Shareholders of MFS Low Volatility Equity Fund:
We have audited the accompanying statement of assets and liabilities of MFS Low Volatility Equity Fund (the Fund) (one of the series constituting MFS Series Trust I), including the portfolio of investments, as of August 31, 2015, and the related statement of operations for the year then ended, the statements of changes in net assets and the financial highlights for each of the periods indicated therein. These financial statements and financial highlights are the responsibility of the Fund’s management. Our responsibility is to express an opinion on these financial statements and financial highlights based on our audits.
We conducted our audits in accordance with the standards of the Public Company Accounting Oversight Board (United States). Those standards require that we plan and perform the audit to obtain reasonable assurance about whether the financial statements and financial highlights are free of material misstatement. We were not engaged to perform an audit of the Fund’s internal control over financial reporting. Our audits included consideration of internal control over financial reporting as a basis for designing audit procedures that are appropriate in the circumstances, but not for the purpose of expressing an opinion on the effectiveness of the Fund’s internal control over financial reporting. Accordingly, we express no such opinion. An audit also includes examining, on a test basis, evidence supporting the amounts and disclosures in the financial statements and financial highlights, assessing the accounting principles used and significant estimates made by management, and evaluating the overall financial statement presentation. Our procedures included confirmation of securities owned as of August 31, 2015, by correspondence with the custodian and others or by other appropriate auditing procedures where replies from others were not received. We believe that our audits provide a reasonable basis for our opinion.
In our opinion, the financial statements and financial highlights referred to above present fairly, in all material respects, the financial position of MFS Low Volatility Equity Fund (one of the series constituting MFS Series Trust I) at August 31, 2015, the results of its operations for the year then ended, the statements of changes in net assets and the financial highlights for each of the periods indicated therein, in conformity with U.S. generally accepted accounting principles.

Boston, Massachusetts
October 15, 2015
36
TRUSTEES AND OFFICERS — IDENTIFICATION AND BACKGROUND
The Trustees and Officers of the Trust, as of October 1, 2015, are listed below, together with their principal occupations during the past five years. (Their titles may have varied during that period.) The address of each Trustee and Officer is 111 Huntington Avenue, Boston, Massachusetts 02199-7618.
| | | | | | | | |
Name, Age | | Position(s) Held with Fund | | Trustee/Officer
Since (h) | | Principal
Occupations During the Past Five Years | | Other Directorships (j) |
| INTERESTED TRUSTEES |
Robert J. Manning (k) (age 51) | | Trustee | | February 2004 | | Massachusetts Financial Services Company, Chairman, Co-Chief Executive Officer and Director; Chief Investment Officer (until 2010) | | N/A |
Robin A. Stelmach (k) (age 54) | | Trustee and President | | January 2014 | | Massachusetts Financial Services Company, Executive Vice President and Chief Operating Officer | | N/A |
| INDEPENDENT TRUSTEES | | | | | | |
David H. Gunning (age 73) | | Trustee and Chair of Trustees | | January 2004 | | Private investor | | Lincoln Electric Holdings, Inc., Director; Development Alternatives, Inc., Director/Non-Executive Chairman |
Steven E. Buller (age 64) | | Trustee | | February 2014 | | Chairman, Financial Accounting Standards Advisory Council; Standing Advisory Group, Public Company Accounting Oversight Board, Member (until 2014); BlackRock, Inc. (investment management), Managing Director (until 2014), BlackRock Finco UK (investment management), Director (until 2014) | | N/A |
Robert E. Butler (age 73) | | Trustee | | January 2006 | | Consultant – investment company industry regulatory and compliance matters | | N/A |
37
Trustees and Officers – continued
| | | | | | | | |
Name, Age | | Position(s) Held with Fund | | Trustee/Officer
Since (h) | | Principal
Occupations During the Past Five Years | | Other Directorships (j) |
Maureen R. Goldfarb (age 60) | | Trustee | | January 2009 | | Private investor | | N/A |
William R. Gutow (age 74) | | Trustee | | December 1993 | | Private investor and real estate consultant; Capitol Entertainment Management Company (video franchise), Vice Chairman | | Texas Donuts, Vice Chairman (until 2010) |
Michael Hegarty (age 70) | | Trustee | | December 2004 | | Private investor | | Rouse Properties Inc., Director; Capmark Financial Group Inc., Director |
John P. Kavanaugh (age 60) | | Trustee | | January 2009 | | Private investor | | N/A |
Maryanne L. Roepke (age 59) | | Trustee | | May 2014 | | American Century Investments (investment management), Senior Vice President and Chief Compliance Officer (until 2014) | | N/A |
Laurie J. Thomsen (age 58) | | Trustee | | March 2005 | | Private investor; New Profit, Inc. (venture philanthropy), Executive Partner (until 2010) | | The Travelers Companies, Director; Dycom Industries, Inc. |
Robert W. Uek (age 74) | | Trustee | | January 2006 | | Consultant to investment company industry | | N/A |
| OFFICERS | | | | | | |
Christopher R. Bohane (k) (age 41) | | Assistant Secretary and Assistant Clerk | | July 2005 | | Massachusetts Financial Services Company, Vice President and Assistant General Counsel | | N/A |
Kino Clark (k) (age 47) | | Assistant Treasurer | | January 2012 | | Massachusetts Financial Services Company, Vice President | | N/A |
Kristin V. Collins (k) (age 42) | | Assistant Secretary and Assistant Clerk | | September 2015 | | Massachusetts Financial Services Company, Vice President and Assistant General Counsel | | N/A |
38
Trustees and Officers – continued
| | | | | | | | |
Name, Age | | Position(s) Held with Fund | | Trustee/Officer
Since (h) | | Principal
Occupations During the Past Five Years | | Other Directorships (j) |
Thomas H. Connors (k) (age 56) | | Assistant Secretary and Assistant Clerk | | September 2012 | | Massachusetts Financial Services Company, Vice President and Senior Counsel; Deutsche Investment Management Americas Inc. (financial service provider), Director and Senior Counsel (until 2012) | | N/A |
Ethan D. Corey (k) (age 51) | | Assistant Secretary and Assistant Clerk | | July 2005 | | Massachusetts Financial Services Company, Senior Vice President and Associate General Counsel | | N/A |
David L. DiLorenzo (k) (age 47) | | Treasurer | | July 2005 | | Massachusetts Financial Services Company, Senior Vice President | | N/A |
Susan S. Newton (k) (age 65) | | Assistant Secretary and Assistant Clerk | | May 2005 | | Massachusetts Financial Services Company, Senior Vice President and Associate General Counsel | | N/A |
Kenneth Paek (k) (age 41) | | Assistant Treasurer | | February 2015 | | Massachusetts Financial Services Company, Vice President; Cohen & Steers, Vice President/Head of Fund Administration (until 2014) | | N/A |
Susan A. Pereira (k) (age 44) | | Assistant Secretary and Assistant Clerk | | July 2005 | | Massachusetts Financial Services Company, Vice President and Senior Counsel | | N/A |
Kasey L. Phillips (k) (age 44) | | Assistant Treasurer | | September 2012 | | Massachusetts Financial Services Company, Vice President; Wells Fargo Funds Management, LLC, Senior Vice President, Fund Treasurer (until 2012) | | N/A |
39
Trustees and Officers – continued
| | | | | | | | |
Name, Age | | Position(s) Held with Fund | | Trustee/Officer
Since (h) | | Principal
Occupations During the Past Five Years | | Other Directorships (j) |
Mark N. Polebaum (k) (age 63) | | Secretary and Clerk | | January 2006 | | Massachusetts Financial Services Company, Executive Vice President, General Counsel and Secretary | | N/A |
Matthew A. Stowe (k) (age 40) | | Assistant Secretary and Assistant Clerk | | October 2014 | | Massachusetts Financial Services Company, Vice President and Assistant General Counsel | | N/A |
Frank L. Tarantino (age 71) | | Independent Senior Officer | | June 2004 | | Tarantino LLC (provider of compliance services), Principal | | N/A |
Richard S. Weitzel (k) (age 45) | | Assistant Secretary and Assistant Clerk | | October 2007 | | Massachusetts Financial Services Company, Senior Vice President and Associate General Counsel | | N/A |
Martin J. Wolin (k) (age 48) | | Chief Compliance Officer | | July 2015 | | Massachusetts Financial Services Company, Senior Vice President and Chief Compliance Officer (since July 2015); Mercer (financial service provider), Chief Risk and Compliance Officer, North America and Latin America (until June 2015) | | N/A |
James O. Yost (k) (age 55) | | Deputy Treasurer | | September 1990 | | Massachusetts Financial Services Company, Senior Vice President | | N/A |
| (h) | Date first appointed to serve as Trustee/officer of an MFS Fund. Each Trustee has served continuously since appointment unless indicated otherwise. For the period from December 15, 2004 until February 22, 2005, Mr. Manning served as Advisory Trustee. Prior to January 2012, Messrs. DiLorenzo and Yost served as Assistant Treasurers of the Funds. Ms. Stelmach was appointed as President of the Funds as of October 1, 2014. |
| (j) | Directorships or trusteeships of companies required to report to the Securities and Exchange Commission (i.e., “public companies”). |
| (k) | “Interested person” of the Trust within the meaning of the Investment Company Act of 1940 (referred to as the 1940 Act), which is the principal federal law governing investment companies like the fund, as a result of a position with MFS. The address of MFS is 111 Huntington Avenue, Boston, Massachusetts 02199-7618. |
40
Trustees and Officers – continued
Each Trustee (except Ms. Stelmach, Mr. Buller and Ms. Roepke) has been elected by shareholders and each Trustee and officer holds office until his or her successor is chosen and qualified or until his or her earlier death, resignation, retirement or removal. The Trust does not hold annual meetings for the purpose of electing Trustees, and Trustees are not elected for fixed terms. Messrs. Butler, Kavanaugh, Uek and Mses. Thomsen and Roepke are members of the Trust’s Audit Committee.
Each of the Fund’s Trustees and officers holds comparable positions with certain other funds of which MFS or a subsidiary is the investment adviser or distributor, and, in the case of the officers, with certain affiliates of MFS. As of October 1, 2015, the Trustees served as board members of 138 funds within the MFS Family of Funds.
The Statement of Additional Information for a Fund includes further information about the Trustees and is available without charge upon request by calling 1-800-225-2606.
| | |
| Investment Adviser | | Custodian |
Massachusetts Financial Services Company
111 Huntington Avenue
Boston, MA 02199-7618 | | State Street Bank and Trust Company 1 Lincoln Street Boston, MA 02111-2900 |
| Distributor | | Independent Registered Public Accounting Firm |
MFS Fund Distributors, Inc.
111 Huntington Avenue
Boston, MA 02199-7618 | | Ernst & Young LLP 200 Clarendon Street Boston, MA 02116 |
| Portfolio Managers | | |
James Fallon Matthew Krummell | | |
41
BOARD REVIEW OF INVESTMENT ADVISORY AGREEMENT
The Investment Company Act of 1940 requires that both the full Board of Trustees and a majority of the non-interested (“independent”) Trustees, voting separately, annually approve the continuation of the Fund’s investment advisory agreement with MFS. The Trustees consider matters bearing on the Fund and its advisory arrangements at their meetings throughout the year, including a review of performance data at each regular meeting. In addition, the independent Trustees met several times over the course of three months beginning in May and ending in July, 2015 (“contract review meetings”) for the specific purpose of considering whether to approve the continuation of the investment advisory agreement for the Fund and the other investment companies that the Board oversees (the “MFS Funds”). The independent Trustees were assisted in their evaluation of the Fund’s investment advisory agreement by independent legal counsel, from whom they received separate legal advice and with whom they met separately from MFS during various contract review meetings. The independent Trustees were also assisted in this process by the MFS Funds’ Independent Senior Officer, a senior officer appointed by and reporting to the independent Trustees.
In connection with their deliberations regarding the continuation of the investment advisory agreement, the Trustees, including the independent Trustees, considered such information and factors as they believed, in light of the legal advice furnished to them and their own business judgment, to be relevant. The investment advisory agreement for the Fund was considered separately, although the Trustees also took into account the common interests of all MFS Funds in their review. As described below, the Trustees considered the nature, quality, and extent of the various investment advisory, administrative, and shareholder services to be performed by MFS under the existing investment advisory agreement and other arrangements with the Fund.
In connection with their contract review meetings, the Trustees received and relied upon materials that included, among other items: (i) information provided by Lipper Inc., an independent third party, on the investment performance of the Fund for the one-year period ended December 31, 2014 and the investment performance of a group of funds with substantially similar investment classifications/objectives (the “Lipper performance universe”), (ii) information provided by Lipper Inc. on the Fund’s advisory fees and other expenses and the advisory fees and other expenses of comparable funds identified by Lipper Inc. (the “Lipper expense group”), (iii) information provided by MFS on the advisory fees of comparable portfolios of other clients of MFS, including institutional separate accounts and other clients, (iv) information as to whether and to what extent applicable expense waivers, reimbursements or fee “breakpoints” are observed for the Fund, (v) information regarding MFS’ financial results and financial condition, including MFS’ and certain of its affiliates’ estimated profitability from services performed for the Fund and the MFS Funds as a whole, and compared to MFS’ institutional business, (vi) MFS’ views regarding the outlook for the mutual fund industry and the strategic business plans of MFS, (vii) descriptions of various functions performed by MFS for the Funds, such as compliance monitoring and portfolio trading practices, and (viii) information regarding the overall organization of MFS, including information about MFS’ senior management and other personnel providing investment advisory, administrative and other services to
42
Board Review of Investment Advisory Agreement – continued
the Fund and the other MFS Funds. The comparative performance, fee and expense information prepared and provided by Lipper Inc. was not independently verified and the independent Trustees did not independently verify any information provided to them by MFS.
The Trustees’ conclusion as to the continuation of the investment advisory agreement was based on a comprehensive consideration of all information provided to the Trustees and not the result of any single factor. Some of the factors that figured particularly in the Trustees’ deliberations are described below, although individual Trustees may have evaluated the information presented differently from one another, giving different weights to various factors. It is also important to recognize that the fee arrangements for the Fund and other MFS Funds are the result of years of review and discussion between the independent Trustees and MFS, that certain aspects of such arrangements may receive greater scrutiny in some years than in others, and that the Trustees’ conclusions may be based, in part, on their consideration of these same arrangements during the course of the year and in prior years.
Based on information provided by Lipper Inc. and MFS, the Trustees reviewed the Fund’s total return investment performance as well as the performance of peer groups of funds for the one-year period ended December 31, 2014. The total return performance of the Fund’s Class A shares was in the 2nd quintile relative to the other funds in the universe for this one-year period (the 1st quintile being the best performers and the 5th quintile being the worst performers). The Fund commenced operations on December 5, 2013 and has a limited operating history and performance record; therefore no performance data for the three- or five-year periods was available. Because of the passage of time, these performance results may differ from the performance results for more recent periods, including those shown elsewhere in this report.
In the course of their deliberations, the Trustees took into account information provided by MFS in connection with the contract review meetings, as well as during investment review meetings conducted with portfolio management personnel during the course of the year regarding the Fund’s performance. After reviewing these and related factors, the Trustees concluded, within the context of their overall conclusions regarding the investment advisory agreement, that they were satisfied with MFS’ responses and efforts relating to investment performance.
In assessing the reasonableness of the Fund’s advisory fee, the Trustees considered, among other information, the Fund’s advisory fee and the total expense ratio of the Fund’s Class A shares as a percentage of average daily net assets and the advisory fee and total expense ratios of peer groups of funds based on information provided by Lipper Inc. The Trustees considered that MFS currently observes an expense limitation for the Fund, which may not be changed without the Trustees’ approval. The Trustees also considered that, according to the Lipper data (which takes into account any fee reductions or expense limitations that were in effect during the Fund’s last fiscal year), the Fund’s effective advisory fee rate and total expense ratio were each lower than the Lipper expense group median.
The Trustees also considered the advisory fees charged by MFS to any institutional separate accounts advised by MFS (“separate accounts”) and unaffiliated investment
43
Board Review of Investment Advisory Agreement – continued
companies for which MFS serves as subadviser (“subadvised funds”) that have comparable investment strategies to the Fund. In comparing these fees, the Trustees considered information provided by MFS as to the generally broader scope of services provided by MFS to the Fund, as well as the more extensive regulatory burdens imposed on MFS in managing the Fund, in comparison to separate accounts and subadvised funds. The Trustees also considered the higher demands placed on MFS’ investment personnel and trading infrastructure as a result of the daily cash in-flows and out-flows of the Fund in comparison to separate accounts.
The Trustees also considered whether the Fund may benefit from any economies of scale in the management of the Fund in the event of growth in assets of the Fund and/or growth in assets of the MFS Funds as a whole. They noted that the Fund’s advisory fee rate schedule is subject to contractual breakpoints that reduce the Fund’s advisory fee rate on average daily net assets over $1 billion and $2.5 billion, and that MFS has agreed in writing to further reduce its advisory fee rate on the Fund’s average daily net assets up to $1 billion and over $1 billion, which may not be changed without the Trustees’ approval. The Trustees also noted that MFS has agreed in writing to waive a portion of the management fees of certain MFS Funds, including the Fund, if the total combined assets of certain funds within the MFS Funds’ complex increase above agreed upon thresholds (the “group fee waiver”), enabling the Fund’s shareholders to share in the benefits from any economies of scale at the complex level. The group fee waiver is reviewed and renewed annually between the Board and MFS. The Trustees concluded that the breakpoints and the group fee waiver were sufficient to allow the Fund to benefit from economies of scale as its assets and overall complex assets grow.
The Trustees also considered information prepared by MFS relating to MFS’ costs and profits with respect to the Fund, the MFS Funds considered as a group, and other investment companies and accounts advised by MFS, as well as MFS’ methodologies used to determine and allocate its costs to the MFS Funds, the Fund and other accounts and products for purposes of estimating profitability.
In addition, the Trustees considered MFS’ resources and related efforts to continue to retain, attract and motivate capable personnel to serve the Fund. The Trustees also considered current and developing conditions in the financial services industry, including the presence of large and well-capitalized companies which are spending, and appear to be prepared to continue to spend, substantial sums to engage personnel and to provide services to competing investment companies. In this regard, the Trustees also considered the financial resources of MFS and its ultimate parent, Sun Life Financial Inc. The Trustees also considered the advantages and possible disadvantages to the Fund of having an adviser that also serves other investment companies as well as other accounts.
The Trustees also considered the nature, quality, cost, and extent of administrative, transfer agency, and distribution services provided to the Fund by MFS and its affiliates under agreements and plans other than the investment advisory agreement, including any 12b-1 fees the Fund pays to MFS Fund Distributors, Inc., an affiliate of MFS. The Trustees also considered the nature, extent and quality of certain other services MFS performs or arranges for on the Fund’s behalf, which may include securities lending programs, directed expense payment programs, class action recovery programs, and
44
Board Review of Investment Advisory Agreement – continued
MFS’ interaction with third-party service providers, principally custodians and sub-custodians. The Trustees concluded that the various non-advisory services provided by MFS and its affiliates on behalf of the Fund were satisfactory.
The Trustees also considered benefits to MFS from the use of the Fund’s portfolio brokerage commissions, if applicable, to pay for investment research and various other factors. Additionally, the Trustees considered so-called “fall-out benefits” to MFS such as reputational value derived from serving as investment manager to the Fund.
Based on their evaluation of factors that they deemed to be material, including those factors described above, the Board of Trustees, including the independent Trustees, concluded that the Fund’s investment advisory agreement with MFS should be continued for an additional one-year period, commencing August 1, 2015.
45
PROXY VOTING POLICIES AND INFORMATION
MFS votes proxies on behalf of the fund pursuant to proxy voting policies and procedures that are available without charge, upon request, by calling 1-800-225-2606, by visiting the Proxy Voting section of mfs.com or by visiting the SEC’s Web site at http://www.sec.gov.
Information regarding how the fund voted proxies relating to portfolio securities during the most recent twelve-month period ended June 30 is available without charge by visiting the Proxy Voting section of mfs.com or by visiting the SEC’s Web site at http://www.sec.gov.
QUARTERLY PORTFOLIO DISCLOSURE
The fund will file a complete schedule of portfolio holdings with the Securities and Exchange Commission (the Commission) for the first and third quarters of each fiscal year on Form N-Q. A shareholder can obtain the quarterly portfolio holdings report at mfs.com. The fund’s Form N-Q is also available on the EDGAR database on the Commission’s Internet Web site at http://www.sec.gov, and may be reviewed and copied at the:
Public Reference Room
Securities and Exchange Commission
100 F Street, NE, Room 1580
Washington, D.C. 20549
Information on the operation of the Public Reference Room may be obtained by calling the Commission at 1-800-SEC-0330. Copies of the fund’s Form N-Q also may be obtained, upon payment of a duplicating fee, by electronic request at the following e-mail address: publicinfo@sec.gov or by writing the Public Reference Section at the above address.
FURTHER INFORMATION
From time to time, MFS may post important information about the fund or the MFS funds on the MFS web site (mfs.com). This information is available by visiting the “Market Commentary” and “Announcements” sub sections in the “Market Outlooks” section of mfs.com or by clicking on the fund’s name under “Mutual Funds” in the “Products” section of mfs.com.
FEDERAL TAX INFORMATION (unaudited)
The fund will notify shareholders of amounts for use in preparing 2015 income tax forms in January 2016. The following information is provided pursuant to provisions of the Internal Revenue Code.
The fund designates the maximum amount allowable as qualified dividend income eligible to be taxed at the same rate as long-term capital gain.
The fund designates $9,412 as capital gain dividends paid during the fiscal year.
For corporate shareholders, 100% of the ordinary income dividends paid during the fiscal year qualify for the corporate dividends received deduction.
46
rev. 3/11
| | | | |
| | | |
FACTS | | WHAT DOES MFS DO WITH YOUR PERSONAL INFORMATION? | |  |
| | |
| Why? | | Financial companies choose how they share your personal information. Federal law gives consumers the right to limit some but not all sharing. Federal law also requires us to tell you how we collect, share, and protect your personal information. Please read this notice carefully to understand what we do. |
| | |
| What? | | The types of personal information we collect and share depend on the product or service you have with us. This information can include: • Social Security number and account balances • Account transactions and transaction history • Checking account information and wire transfer instructions When you are no longer our customer, we continue to share your information as described in this notice. |
| | |
| How? | | All financial companies need to share customers’ personal information to run their everyday business. In the section below, we list the reasons financial companies can share their customers’ personal information; the reasons MFS chooses to share; and whether you can limit this sharing. |
| | | | |
Reasons we can share your
personal information | | Does MFS
share? | | Can you limit
this sharing? |
For our everyday business purposes – such as to process your transactions, maintain your account(s), respond to court orders and legal investigations, or report to credit bureaus | | Yes | | No |
For our marketing purposes – to offer our products and services to you | | No | | We don’t share |
| For joint marketing with other financial companies | | No | | We don’t share |
For our affiliates’ everyday business purposes – information about your transactions and experiences | | No | | We don’t share |
For our affiliates’ everyday business purposes – information about your creditworthiness | | No | | We don’t share |
| For nonaffiliates to market to you | | No | | We don’t share |
| | |
| Questions? | | Call 800-225-2606 or go to mfs.com. |
47
| | |
| Who we are |
| Who is providing this notice? | | MFS Funds, MFS Investment Management, MFS Institutional Advisors, Inc., MFS Fund Distributors, Inc., MFS Heritage Trust Company, and MFS Service Center, Inc. |
| | |
| What we do |
| How does MFS protect my personal information? | | To protect your personal information from unauthorized access and use, we use security measures that comply with federal law. These measures include procedural, electronic, and physical safeguards for the protection of the personal information we collect about you. |
| How does MFS collect my personal information? | | We collect your personal information, for example, when you • open an account or provide account information • direct us to buy securities or direct us to sell your securities • make a wire transfer We also collect your personal information from others, such as credit bureaus, affiliates and other companies. |
| Why can’t I limit all sharing? | | Federal law gives you the right to limit only • sharing for affiliates’ everyday business purposes – information about your creditworthiness • affiliates from using your information to market to you • sharing for nonaffiliates to market to you State laws and individual companies may give you additional rights to limit sharing. |
| | |
| Definitions |
| Affiliates | | Companies related by common ownership or control. They can be financial and nonfinancial companies. • MFS does not share personal information with affiliates, except for everyday business purposes as described on page one of this notice. |
| Nonaffiliates | | Companies not related by common ownership or control. They can be financial and nonfinancial companies. • MFS does not share with nonaffiliates so they can market to you. |
| Joint Marketing | | A formal agreement between nonaffiliated financial companies that together market financial products or services to you. • MFS doesn’t jointly market. |
| | |
| Other important information |
| If you own an MFS product or receive an MFS service in the name of a third party such as a bank or broker-dealer, their privacy policy may apply to you instead of ours. |
48
Save paper with eDelivery.

| MFS® will send you prospectuses, |
reports, and proxies directly via e-mail so you will get information faster with less mailbox clutter.
To sign up:
1. Go to mfs.com.
2. Log in via MFS® Access.
3. Select eDelivery.
If you own your MFS fund shares through a financial institution or a retirement plan, MFS® TALK, MFS® Access, or eDelivery may not be available to you.
CONTACT
WEB SITE
mfs.com
MFS TALK
1-800-637-8255
24 hours a day
ACCOUNT SERVICE AND LITERATURE
Shareholders
1-800-225-2606
Financial advisors
1-800-343-2829
Retirement plan services
1-800-637-1255
MAILING ADDRESS
MFS Service Center, Inc.
P.O. Box 55824
Boston, MA 02205-5824
OVERNIGHT MAIL
MFS Service Center, Inc.
c/o Boston Financial Data Services
30 Dan Road
Canton, MA 02021-2809
ANNUAL REPORT
August 31, 2015

MFS® NEW DISCOVERY FUND

NDF-ANN
MFS® NEW DISCOVERY FUND
CONTENTS
The report is prepared for the general information of shareholders.
It is authorized for distribution to prospective investors only when preceded or accompanied by a current prospectus.
NOT FDIC INSURED • MAY LOSE VALUE • NO BANK GUARANTEE

LETTER FROM THE CHAIRMAN
Dear Shareholders:
The U.S. economy bounced back after another harsh winter curtailed domestic consumption. Despite strengthening labor and housing markets, however, a stronger U.S. dollar and weak overseas demand have held back corporate earnings.
China’s economic growth continues to slow, raising concerns and adding to global market volatility. Commodity exporters, including Australia and Canada, have been hurt by weaker Chinese demand. Global oil markets remain oversupplied, putting pressure on crude oil and gasoline prices.
In Europe, concerns about a potential Greek debt default have faded, and the eurozone’s economy is expanding mildly. Hopes for a more robust regionwide recovery rest on the European Central Bank’s quantitative easing program.
The world’s financial markets have become increasingly complex in recent years. Now, more than ever, it is important to understand companies on a global basis. At MFS®, we believe our integrated research platform, collaborative culture, active risk management process and long-term focus give us a research advantage.
As investors, we aim to add long-term value. We believe this approach will serve you well as you work with your financial advisor to reach your investment objectives.
Respectfully,

Robert J. Manning
Chairman
MFS Investment Management
October 15, 2015
The opinions expressed in this letter are subject to change and may not be relied upon for investment advice. No forecasts can be guaranteed.
1
PORTFOLIO COMPOSITION
Portfolio structure

| | | | |
| Top ten holdings | | | | |
| Bright Horizons Family Solutions, Inc. | | | 2.8% | |
| Gartner, Inc. | | | 2.2% | |
| SS&C Technologies Holdings, Inc. | | | 1.9% | |
| Healthcare Services Group, Inc. | | | 1.8% | |
| Sabre Corp. | | | 1.7% | |
| AMETEK, Inc. | | | 1.7% | |
| Masimo Corp. | | | 1.6% | |
| Five Below, Inc. | | | 1.6% | |
| Live Nation, Inc. | | | 1.5% | |
| Axalta Coating Systems Ltd. | | | 1.5% | |
| | | | |
| Equity sectors | | | | |
| Health Care | | | 27.5% | |
| Technology | | | 14.2% | |
| Special Products & Services | | | 11.8% | |
| Leisure | | | 7.7% | |
| Industrial Goods & Services | | | 7.7% | |
| Retailing | | | 7.5% | |
| Autos & Housing | | | 5.5% | |
| Financial Services | | | 5.2% | |
| Basic Materials | | | 3.2% | |
| Transportation | | | 2.9% | |
| Consumer Staples | | | 2.7% | |
| Energy | | | 2.2% | |
Cash & Other can include cash, other assets less liabilities, offsets to derivative positions, and short-term securities. Please see the Statement of Assets and Liabilities for additional information related to the fund’s cash position and the Notes to Financial Statements for additional information related to certain risks associated with assets included in “Other”.
Percentages are based on net assets as of 8/31/15.
The portfolio is actively managed and current holdings may be different.
2
MANAGEMENT REVIEW
Summary of Results
For the twelve months ended August 31, 2015, Class A shares of the MFS New Discovery Fund (“fund”) provided a total return of 0.47%, at net asset value. This compares with a return of 5.11% for the fund’s benchmark, the Russell 2000 Growth Index.
Market Environment
A generally risk-friendly environment prevailed in the first half of the period and any market setbacks, triggered by global growth concerns, were short-lived as central banks responded and kept monetary policy accommodative. For example, the US tempered rate hike expectations while Japan, Europe and China provided fresh stimulus measures which ultimately supported risk assets. Early in the second half of the period, the European Central Bank cut policy interest rates and announced non-conventional easing measures, pushing yields on a significant portion of Eurozone sovereign bonds deeper into negative territory, a notable highlight amid a mini-wave of global easing due to declining inflation and inflation expectations. However, the environment supporting risk began to break down in the latter phases of the period, with both US investment grade and high yield corporate spreads widening out and any individual company performance below expectations resulted in market selling.
A dominant trend for most of the period was the ongoing rise in US equities. Until early in the second half of the period, this was paired with a decline in US and global bond yields. The uptrend in US corporate margins and profits continued throughout the second half of 2014, but in the latter part of the period the margin results became more bifurcated with energy and materials suffering and the rest of the companies holding on to net margins in an ongoing slow revenue growth environment. A rising dollar and a sharp decline in commodity prices, particularly crude oil prices, negatively impacted credit markets, notably US high yield and emerging market debt. The higher weightings of oil and gas credits in these asset classes resulted in widening spreads and increased volatility. In the second half of the period, global sovereign bond yields rose, shrugging off concerns over a Greek debt default. The rise tempered the equity advance, as odds of a 2015 US Federal Reserve rate hike increased. At the end of the period, the stronger US dollar slowed revenues in many US-based multinational companies. As the last month of the period began, risk shedding became a theme across emerging market countries and continued to weaken Chinese economic data as well as economic data of the commodity-driven countries. Risk shedding accelerated outflows and cross-border selling. By the end of the period, many of the world’s equity markets had entered into “correction” territory.
Detractors from Performance
Stock selection in both the transportation and retailing sectors detracted from performance relative to the Russell 2000 Growth Index. Within the transportation sector, the fund’s holdings of seaborne commodity shipping company Navios Maritime (b)(h) (Monaco) and shipping company Diana Shipping (b) (Greece) held back relative performance. Within the retailing sector, the fund’s overweight position in hardwood flooring retailer Lumber Liquidators hurt relative results. Shares of discount
3
Management Review – continued
wood flooring retailer Lumber Liquidators declined after the company was accused of selling flooring that contained formaldehyde levels that exceeded the acceptable limit. Although the flooring in question was a relatively small part of their overall business, the negative press led to a falloff in demand and a sharp decline in the stock.
The fund’s overweight allocation to the energy sector was a drag on relative performance. Notably, the fund’s holdings of offshore drilling contractor Atwood Oceanics (b)(h) and coal mining company Peabody Energy (b)(h) underperformed the fund’s benchmark and weighed on relative returns. Both firms were negatively impacted by the correction in global commodity markets.
Stock selection and, to a lesser extent, an underweight position in the technology sector also dampened relative performance. The fund’s holdings of 3D printer manufacturer Stratasys (b) and crowd-sourced review website Yelp (b)(h) hindered relative performance. Yelp lagged the benchmark as its shares performed poorly on what appeared to have been concerns over advertising revenue which led the firm to reduce 2015 guidance.
Weak stock selection in the basic materials sector was another area of relative weakness. Holdings of chemicals manufacturer Albemarle (b) weighed on relative results as the firm faced weaker demand for its clean fuel technology due to the decline in oil prices. Holdings of graphite electrode manufacturer Graftech International (b)(h) hampered relative results after the company significantly reduced guidance, citing weak demand, and announced further restructuring and management changes.
Elsewhere, an overweight position in pet food manufacturer Freshpet detracted from relative results.
During the reporting period, the fund’s currency exposure, resulting primarily from differences between the fund’s and the benchmark’s exposures to holdings of securities denominated in foreign currencies, also hurt relative results. All of MFS’ investment decisions are driven by the fundamentals of each individual opportunity and as such, it is common for our portfolios to have different currency exposure than the benchmark.
Contributors to Performance
Strong stock selection and, to a lesser extent, an underweight position in the industrial goods & services sector and positive security selection in the autos & housing sector contributed to relative performance. There were no individual securities within either sector that were among the fund’s top relative contributors.
Elsewhere, an overweight position in child care and early education provider Bright Horizons boosted relative performance as positive earnings and margin momentum drove shares to outperform the benchmark. Overweight positions in emergency rooms operator Adeptus Health, global medical technology company Masimo, biopharmaceutical companies, AMAG Pharmaceuticals and Receptos (h), organic food company Annie’s (h), medical device manufacturing company DexCom and clinical research provider INC Research aided relative performance. The fund’s holdings of
4
Management Review – continued
global cruise line operator Norwegian Cruise Lines (b) and expense management software company Concur Technologies (b)(h) further contributed to positive relative performance.
Respectfully,
| | |
| Paul Gordon | | Michael Grossman |
| Portfolio Manager | | Portfolio Manager |
| (b) | Security is not a benchmark constituent. |
| (h) | Security was not held in the portfolio at period end. |
Note to Shareholders: Effective December 29, 2014, Paul Gordon replaced Thomas Wetherald as a Portfolio Manager of the Fund.
The views expressed in this report are those of the portfolio managers only through the end of the period of the report as stated on the cover and do not necessarily reflect the views of MFS or any other person in the MFS organization. These views are subject to change at any time based on market or other conditions, and MFS disclaims any responsibility to update such views. These views may not be relied upon as investment advice or an indication of trading intent on behalf of any MFS portfolio. References to specific securities are not recommendations of such securities, and may not be representative of any MFS portfolio’s current or future investments.
5
PERFORMANCE SUMMARY THROUGH 8/31/15
The following chart illustrates a representative class of the fund’s historical performance in comparison to its benchmark(s). Performance results include the deduction of the maximum applicable sales charge and reflect the percentage change in net asset value, including reinvestment of dividends and capital gains distributions. The performance of other share classes will be greater than or less than that of the class depicted below. Benchmarks are unmanaged and may not be invested in directly. Benchmark returns do not reflect sales charges, commissions or expenses. (See Notes to Performance Summary.)
Performance data shown represents past performance and is no guarantee of future results. Investment return and principal value fluctuate so your shares, when sold, may be worth more or less than the original cost; current performance may be lower or higher than quoted. The performance shown does not reflect the deduction of taxes, if any, that a shareholder would pay on fund distributions or the redemption of fund shares.
Growth of a Hypothetical $10,000 Investment
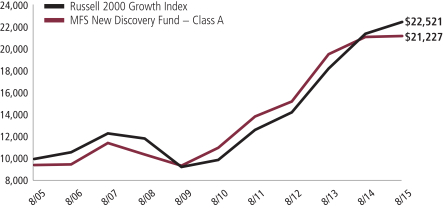
6
Performance Summary – continued
Total Returns through 8/31/15
Average annual without sales charge
| | | | | | | | | | | | | | |
| | | Share Class | | Class Inception Date | | 1-yr | | 5-yr | | 10-yr | | Life (t) | | |
| | | A | | 1/02/97 | | 0.47% | | 14.03% | | 8.46% | | N/A | | |
| | | B | | 11/03/97 | | (0.27)% | | 13.18% | | 7.68% | | N/A | | |
| | | C | | 11/03/97 | | (0.28)% | | 13.18% | | 7.68% | | N/A | | |
| | | I | | 1/02/97 | | 0.74% | | 14.32% | | 8.77% | | N/A | | |
| | | R1 | | 4/01/05 | | (0.28)% | | 13.18% | | 7.66% | | N/A | | |
| | | R2 | | 10/31/03 | | 0.23% | | 13.74% | | 8.19% | | N/A | | |
| | | R3 | | 4/01/05 | | 0.47% | | 14.03% | | 8.46% | | N/A | | |
| | | R4 | | 4/01/05 | | 0.69% | | 14.31% | | 8.74% | | N/A | | |
| | | R5 | | 6/01/12 | | 0.85% | | N/A | | N/A | | 14.01% | | |
| | | 529A | | 7/31/02 | | 0.44% | | 13.99% | | 8.33% | | N/A | | |
| | | 529B | | 7/31/02 | | (0.28)% | | 13.13% | | 7.57% | | N/A | | |
| | | 529C | | 7/31/02 | | (0.34)% | | 13.11% | | 7.56% | | N/A | | |
| Comparative benchmark | | | | | | | | | | |
| | | Russell 2000 Growth Index (f) | | 5.11% | | 17.83% | | 8.46% | | N/A | | |
| Average annual with sales charge | | | | | | | | | | |
| | | A
With initial Sales Charge (5.75%) | | (5.31)% | | 12.69% | | 7.82% | | N/A | | |
| | | B
With CDSC (Declining over six years from 4% to 0%) (v) | | (3.92)% | | 12.94% | | 7.68% | | N/A | | |
| | | C
With CDSC (1% for 12 months) (v) | | (1.19)% | | 13.18% | | 7.68% | | N/A | | |
| | | 529A
With initial Sales Charge (5.75%) | | (5.34)% | | 12.64% | | 7.69% | | N/A | | |
| | | 529B
With CDSC (Declining over six years from 4% to 0%) (v) | | (3.92)% | | 12.88% | | 7.57% | | N/A | | |
| | | 529C
With CDSC (1% for 12 months) (v) | | (1.25)% | | 13.11% | | 7.56% | | N/A | | |
CDSC – Contingent Deferred Sales Charge.
Class I, R1, R2, R3, R4, and R5 shares do not have a sales charge.
| (f) | Source: FactSet Research Systems Inc. |
| (t) | For the period from the class inception date through the stated period end (for those share classes with less than 10 years of performance history). No comparative benchmark performance information is provided for “life” periods. (See Notes to Performance Summary.) |
| (v) | Assuming redemption at the end of the applicable period. |
7
Performance Summary – continued
Benchmark Definition
Russell 2000 Growth Index – constructed to provide a comprehensive barometer for growth securities in the small-cap segment of the U.S. equity universe. Companies in this index generally have higher price-to-book ratios and higher forecasted growth values.
It is not possible to invest directly in an index.
Notes to Performance Summary
Class 529 shares are only available in conjunction with qualified tuition programs, such as the MFS 529 Savings Plan. There also is an additional fee, which is detailed in the program description, on qualified tuition programs. If this fee was reflected, the performance for Class 529 shares would have been lower. This annual fee is waived for Oregon residents and for those accounts with assets of $25,000 or more.
Average annual total return represents the average annual change in value for each share class for the periods presented. Life returns are presented where the share class has less than 10 years of performance history and represent the average annual total return from the class inception date to the stated period end date. As the fund’s share classes may have different inception dates, the life returns may represent different time periods and may not be comparable. As a result, no comparative benchmark performance information is provided for life periods.
Performance results reflect any applicable expense subsidies and waivers in effect during the periods shown. Without such subsidies and waivers the fund’s performance results would be less favorable. Please see the prospectus and financial statements for complete details.
Performance results do not include adjustments made for financial reporting purposes in accordance with U.S. generally accepted accounting principles and may differ from amounts reported in the financial highlights.
From time to time the fund may receive proceeds from litigation settlements, without which performance would be lower.
8
EXPENSE TABLE
Fund expenses borne by the shareholders during the period, March 1, 2015 through August 31, 2015
As a shareholder of the fund, you incur two types of costs: (1) transaction costs, including sales charges (loads) on certain purchase or redemption payments, and (2) ongoing costs, including management fees; distribution and service (12b-1) fees; and other fund expenses. This example is intended to help you understand your ongoing costs (in dollars) of investing in the fund and to compare these costs with the ongoing costs of investing in other mutual funds.
The example is based on an investment of $1,000 invested at the beginning of the period and held for the entire period March 1, 2015 through August 31, 2015.
Actual Expenses
The first line for each share class in the following table provides information about actual account values and actual expenses. You may use the information in this line, together with the amount you invested, to estimate the expenses that you paid over the period. Simply divide your account value by $1,000 (for example, an $8,600 account value divided by $1,000 = 8.6), then multiply the result by the number in the first line under the heading entitled “Expenses Paid During Period” to estimate the expenses you paid on your account during this period.
Hypothetical Example for Comparison Purposes
The second line for each share class in the following table provides information about hypothetical account values and hypothetical expenses based on the fund’s actual expense ratio and an assumed rate of return of 5% per year before expenses, which is not the fund’s actual return. The hypothetical account values and expenses may not be used to estimate the actual ending account balance or expenses you paid for the period. You may use this information to compare the ongoing costs of investing in the fund and other funds. To do so, compare this 5% hypothetical example with the 5% hypothetical examples that appear in the shareholder reports of the other funds.
Please note that the expenses shown in the table are meant to highlight your ongoing costs only and do not reflect any transactional costs, such as sales charges (loads). Therefore, the second line for each share class in the table is useful in comparing ongoing costs only, and will not help you determine the relative total costs of owning different funds. In addition, if these transactional costs were included, your costs would have been higher.
9
Expense Table – continued
| | | | | | | | | | | | | | | | | | |
Share
Class | | | | Annualized
Expense
Ratio | | | Beginning
Account Value
3/01/15 | | | Ending
Account Value
8/31/15 | | | Expenses
Paid During
Period (p)
3/01/15-8/31/15 | |
| A | | Actual | | | 1.30% | | | | $1,000.00 | | | | $989.14 | | | | $6.52 | |
| | Hypothetical (h) | | | 1.30% | | | | $1,000.00 | | | | $1,018.65 | | | | $6.61 | |
| B | | Actual | | | 2.05% | | | | $1,000.00 | | | | $985.27 | | | | $10.26 | |
| | Hypothetical (h) | | | 2.05% | | | | $1,000.00 | | | | $1,014.87 | | | | $10.41 | |
| C | | Actual | | | 2.06% | | | | $1,000.00 | | | | $985.30 | | | | $10.31 | |
| | Hypothetical (h) | | | 2.06% | | | | $1,000.00 | | | | $1,014.82 | | | | $10.46 | |
| I | | Actual | | | 1.06% | | | | $1,000.00 | | | | $990.37 | | | | $5.32 | |
| | Hypothetical (h) | | | 1.06% | | | | $1,000.00 | | | | $1,019.86 | | | | $5.40 | |
| R1 | | Actual | | | 2.06% | | | | $1,000.00 | | | | $985.18 | | | | $10.31 | |
| | Hypothetical (h) | | | 2.06% | | | | $1,000.00 | | | | $1,014.82 | | | | $10.46 | |
| R2 | | Actual | | | 1.56% | | | | $1,000.00 | | | | $987.76 | | | | $7.82 | |
| | Hypothetical (h) | | | 1.56% | | | | $1,000.00 | | | | $1,017.34 | | | | $7.93 | |
| R3 | | Actual | | | 1.31% | | | | $1,000.00 | | | | $989.14 | | | | $6.57 | |
| | Hypothetical (h) | | | 1.31% | | | | $1,000.00 | | | | $1,018.60 | | | | $6.67 | |
| R4 | | Actual | | | 1.06% | | | | $1,000.00 | | | | $989.94 | | | | $5.32 | |
| | Hypothetical (h) | | | 1.06% | | | | $1,000.00 | | | | $1,019.86 | | | | $5.40 | |
| R5 | | Actual | | | 0.93% | | | | $1,000.00 | | | | $991.17 | | | | $4.67 | |
| | Hypothetical (h) | | | 0.93% | | | | $1,000.00 | | | | $1,020.52 | | | | $4.74 | |
| 529A | | Actual | | | 1.33% | | | | $1,000.00 | | | | $989.25 | | | | $6.67 | |
| | Hypothetical (h) | | | 1.33% | | | | $1,000.00 | | | | $1,018.50 | | | | $6.77 | |
| 529B | | Actual | | | 2.08% | | | | $1,000.00 | | | | $985.32 | | | | $10.41 | |
| | Hypothetical (h) | | | 2.08% | | | | $1,000.00 | | | | $1,014.72 | | | | $10.56 | |
| 529C | | Actual | | | 2.10% | | | | $1,000.00 | | | | $984.82 | | | | $10.51 | |
| | Hypothetical (h) | | | 2.10% | | | | $1,000.00 | | | | $1,014.62 | | | | $10.66 | |
| (h) | 5% class return per year before expenses. |
| (p) | “Expenses Paid During Period” are equal to each class’s annualized expense ratio, as shown above, multiplied by the average account value over the period, multiplied by 184/365 (to reflect the one-half year period). Expenses paid do not include any applicable sales charges (loads). If these transaction costs had been included, your costs would have been higher. |
Notes to Expense Table
Each class with a Rule 12b-1 service fee is subject to a rebate of a portion of such fee. Such rebates are included in the expense ratios above. For Class 529A and Class 529B shares, this rebate reduced the expense ratios above by 0.02%. See Note 3 in the Notes to Financial Statements for additional information.
10
PORTFOLIO OF INVESTMENTS
8/31/15
The Portfolio of Investments is a complete list of all securities owned by your fund. It is categorized by broad-based asset classes.
| | | | | | | | |
| Common Stocks - 98.1% | | | | | | | | |
| Issuer | | Shares/Par | | | Value ($) | |
| Apparel Manufacturers - 0.4% | | | | | | | | |
| Tumi Holdings, Inc. (a) | | | 271,311 | | | $ | 5,350,250 | |
| | |
| Automotive - 1.0% | | | | | | | | |
| Fenix Parts, Inc. (a)(h) | | | 1,338,451 | | | $ | 13,344,356 | |
| | |
| Biotechnology - 6.2% | | | | | | | | |
| Aduro Biotech, Inc. (a)(l) | | | 43,500 | | | $ | 842,160 | |
| Alder Biopharmaceuticals, Inc. (a) | | | 69,230 | | | | 2,682,663 | |
| Alnylam Pharmaceuticals, Inc. (a) | | | 49,251 | | | | 5,068,420 | |
| AMAG Pharmaceuticals, Inc. (a) | | | 259,954 | | | | 16,257,523 | |
| Amicus Therapeutics, Inc. (a) | | | 599,392 | | | | 8,619,257 | |
| Chiasma, Inc. (a) | | | 149,659 | | | | 3,885,148 | |
| Esperion Therapeutics, Inc. (a) | | | 24,059 | | | | 1,153,629 | |
| Exact Sciences Corp. (a)(l) | | | 343,682 | | | | 7,598,809 | |
| Isis Pharmaceuticals, Inc. (a) | | | 208,215 | | | | 10,448,229 | |
| MiMedx Group, Inc. (a) | | | 921,308 | | | | 8,945,901 | |
| NantKwest, Inc. (a) | | | 111,075 | | | | 1,901,604 | |
| Novavax, Inc. (a) | | | 389,617 | | | | 4,196,175 | |
| Seres Therapeutics, Inc. (a)(l) | | | 61,534 | | | | 2,543,200 | |
| Tesaro, Inc. (a) | | | 174,569 | | | | 8,986,812 | |
| VTV Therapeutics, Inc. (a) | | | 275,016 | | | | 2,398,140 | |
| | | | | | | | |
| | | | | | | $ | 85,527,670 | |
| Broadcasting - 1.5% | | | | | | | | |
| Live Nation, Inc. (a) | | | 854,246 | | | $ | 21,031,537 | |
| | |
| Brokerage & Asset Managers - 1.9% | | | | | | | | |
| LPL Financial Holdings, Inc. (l) | | | 269,615 | | | $ | 10,843,915 | |
| NASDAQ OMX Group, Inc. | | | 289,476 | | | | 14,818,276 | |
| | | | | | | | |
| | | | | | | $ | 25,662,191 | |
| Business Services - 8.8% | | | | | | | | |
| Bright Horizons Family Solutions, Inc. (a) | | | 634,869 | | | $ | 38,803,193 | |
| CoStar Group, Inc. (a) | | | 73,046 | | | | 12,932,064 | |
| Gartner, Inc. (a) | | | 359,461 | | | | 30,737,510 | |
| Global Payments, Inc. | | | 123,212 | | | | 13,724,585 | |
| Ultimate Software Group, Inc. (a) | | | 69,715 | | | | 12,283,086 | |
| Univar, Inc. (a) | | | 563,310 | | | | 12,753,338 | |
| | | | | | | | |
| | | | | | | $ | 121,233,776 | |
11
Portfolio of Investments – continued
| | | | | | | | |
| Issuer | | Shares/Par | | | Value ($) | |
| Common Stocks - continued | | | | | | | | |
| Computer Software - 0.9% | | | | | | | | |
| Cornerstone OnDemand, Inc. (a) | | | 330,675 | | | $ | 11,818,325 | |
| | |
| Computer Software - Systems - 10.6% | | | | | | | | |
| 2U, Inc. (a) | | | 118,555 | | | $ | 4,145,868 | |
| Cvent, Inc. (a) | | | 644,715 | | | | 20,334,311 | |
| Demandware, Inc. (a) | | | 195,290 | | | | 10,895,229 | |
| Fleetmatics Group PLC (a) | | | 292,689 | | | | 13,100,760 | |
| Model N, Inc. (a) | | | 1,303,122 | | | | 13,422,157 | |
| Proofpoint, Inc. (a) | | | 188,146 | | | | 10,600,146 | |
| Rapid7, Inc. (a) | | | 570,738 | | | | 12,036,864 | |
| Sabre Corp. | | | 869,444 | | | | 23,666,266 | |
| ServiceNow, Inc. (a) | | | 154,755 | | | | 10,981,415 | |
| SS&C Technologies Holdings, Inc. | | | 380,923 | | | | 25,803,724 | |
| | | | | | | | |
| | | | | | | $ | 144,986,740 | |
| Construction - 4.5% | | | | | | | | |
| Interface, Inc. | | | 770,979 | | | $ | 18,688,531 | |
| Lennox International, Inc. | | | 115,789 | | | | 13,667,734 | |
| Pool Corp. | | | 157,127 | | | | 10,948,609 | |
| Summit Materials, Inc., “A” (a) | | | 538,321 | | | | 12,629,011 | |
| Trex Co., Inc. (a) | | | 147,284 | | | | 5,716,092 | |
| | | | | | | | |
| | | | | | | $ | 61,649,977 | |
| Consumer Services - 2.4% | | | | | | | | |
| MakeMyTrip Ltd. (a) | | | 375,498 | | | $ | 5,395,906 | |
| Nord Anglia Education, Inc. (a) | | | 663,733 | | | | 13,633,076 | |
| Servicemaster Global Holdings, Inc. (a) | | | 403,237 | | | | 14,185,878 | |
| | | | | | | | |
| | | | | | | $ | 33,214,860 | |
| Electrical Equipment - 3.1% | | | | | | | | |
| Advanced Drainage Systems, Inc. | | | 363,153 | | | $ | 10,317,177 | |
| AMETEK, Inc. | | | 421,686 | | | | 22,695,141 | |
| MSC Industrial Direct Co., Inc., “A” | | | 140,913 | | | | 9,538,401 | |
| | | | | | | | |
| | | | | | | $ | 42,550,719 | |
| Electronics - 1.9% | | | | | | | | |
| Iriso Electronics Co. Ltd. | | | 60,060 | | | $ | 2,719,754 | |
| Monolithic Power Systems, Inc. | | | 173,577 | | | | 8,347,318 | |
| Silicon Laboratories, Inc. (a) | | | 234,167 | | | | 10,181,581 | |
| Stratasys Ltd. (a) | | | 151,442 | | | | 4,643,212 | |
| | | | | | | | |
| | | | | | | $ | 25,891,865 | |
12
Portfolio of Investments – continued
| | | | | | | | |
| Issuer | | Shares/Par | | | Value ($) | |
| Common Stocks - continued | | | | | | | | |
| Energy - Independent - 1.3% | | | | | | | | |
| Memorial Resource Development Corp. (a) | | | 565,816 | | | $ | 10,982,489 | |
| PDC Energy, Inc. (a) | | | 118,341 | | | | 6,648,397 | |
| | | | | | | | |
| | | | | | | $ | 17,630,886 | |
| Engineering - Construction - 1.7% | | | | | | | | |
| Stantec, Inc. | | | 475,058 | | | $ | 11,136,203 | |
| Team, Inc. (a) | | | 283,484 | | | | 11,860,971 | |
| | | | | | | | |
| | | | | | | $ | 22,997,174 | |
| Food & Beverages - 2.7% | | | | | | | | |
| Amplify Snack Brands, Inc. (a) | | | 373,161 | | | $ | 4,918,262 | |
| Blue Buffalo Pet Products, Inc. (a) | | | 79,800 | | | | 2,038,890 | |
| Flex Pharma, Inc. (a) | | | 153,972 | | | | 1,852,283 | |
| Freshpet, Inc. (a)(l) | | | 1,298,507 | | | | 16,867,606 | |
| Snyders-Lance, Inc. | | | 344,159 | | | | 11,622,249 | |
| | | | | | | | |
| | | | | | | $ | 37,299,290 | |
| Gaming & Lodging - 2.9% | | | | | | | | |
| Diamond Resorts International, Inc. (a) | | | 373,684 | | | $ | 9,487,837 | |
| La Quinta Holdings, Inc. (a) | | | 860,311 | | | | 16,216,862 | |
| Norwegian Cruise Line Holdings Ltd. (a) | | | 253,759 | | | | 14,616,518 | |
| | | | | | | | |
| | | | | | | $ | 40,321,217 | |
| General Merchandise - 2.6% | | | | | | | | |
| Five Below, Inc. (a) | | | 573,020 | | | $ | 22,158,683 | |
| Ollie’s Bargain Outlet Holdings, Inc. (a) | | | 748,294 | | | | 13,386,980 | |
| | | | | | | | |
| | | | | | | $ | 35,545,663 | |
| Internet - 0.9% | | | | | | | | |
| Marketo, Inc. (a) | | | 440,712 | | | $ | 12,344,343 | |
| | |
| Machinery & Tools - 2.9% | | | | | | | | |
| Allison Transmission Holdings, Inc. | | | 522,648 | | | $ | 14,947,733 | |
| IPG Photonics Corp. (a) | | | 104,686 | | | | 8,837,592 | |
| Kennametal, Inc. | | | 277,877 | | | | 8,475,249 | |
| WABCO Holdings, Inc. (a) | | | 62,625 | | | | 7,221,915 | |
| | | | | | | | |
| | | | | | | $ | 39,482,489 | |
| Medical & Health Technology & Services - 6.1% | | | | | | | | |
| Adeptus Health, Inc., “A” (a) | | | 138,636 | | | $ | 13,813,691 | |
| Brookdale Senior Living, Inc. (a) | | | 470,239 | | | | 12,893,953 | |
| Capital Senior Living Corp. (a) | | | 421,058 | | | | 8,774,849 | |
| Healthcare Services Group, Inc. | | | 731,596 | | | | 24,464,570 | |
| HealthStream, Inc. (a) | | | 276,121 | | | | 6,861,607 | |
13
Portfolio of Investments – continued
| | | | | | | | |
| Issuer | | Shares/Par | | | Value ($) | |
| Common Stocks - continued | | | | | | | | |
| Medical & Health Technology & Services - continued | | | | | | | | |
| IDEXX Laboratories, Inc. (a) | | | 94,643 | | | $ | 6,764,135 | |
| INC Research Holdings, Inc., “A” (a) | | | 256,631 | | | | 10,524,437 | |
| | | | | | | | |
| | | | | | | $ | 84,097,242 | |
| Medical Equipment - 12.1% | | | | | | | | |
| Align Technology, Inc. (a) | | | 152,406 | | | $ | 8,626,180 | |
| AtriCure, Inc. (a) | | | 139,212 | | | | 3,405,126 | |
| Cardiovascular Systems, Inc. (a) | | | 373,379 | | | | 8,990,966 | |
| Cepheid, Inc. (a) | | | 309,182 | | | | 15,069,531 | |
| DexCom, Inc. (a) | | | 109,138 | | | | 10,274,251 | |
| GenMark Diagnostics, Inc. (a) | | | 637,186 | | | | 6,588,503 | |
| Hologic, Inc. (a) | | | 359,014 | | | | 13,933,333 | |
| Insulet Corp. (a) | | | 380,947 | | | | 11,317,935 | |
| Masimo Corp. (a) | | | 546,085 | | | | 22,187,434 | |
| Nevro Corp. (a) | | | 100,775 | | | | 4,537,898 | |
| Novadaq Technologies, Inc. (a) | | | 739,071 | | | | 8,536,270 | |
| NxStage Medical, Inc. (a) | | | 799,453 | | | | 13,886,499 | |
| PerkinElmer, Inc. | | | 343,782 | | | | 16,735,308 | |
| STERIS Corp. | | | 263,213 | | | | 16,858,793 | |
| Zeltiq Aesthetics, Inc. (a) | | | 165,113 | | | | 5,328,197 | |
| | | | | | | | |
| | | | | | | $ | 166,276,224 | |
| Metals & Mining - 0.8% | | | | | | | | |
| Globe Specialty Metals, Inc. | | | 822,241 | | | $ | 11,297,591 | |
| | |
| Oil Services - 1.0% | | | | | | | | |
| Forum Energy Technologies, Inc. (a) | | | 474,043 | | | $ | 7,451,956 | |
| Patterson-UTI Energy, Inc. | | | 353,621 | | | | 5,756,950 | |
| | | | | | | | |
| | | | | | | $ | 13,208,906 | |
| Other Banks & Diversified Financials - 3.3% | | | | | | | | |
| Air Lease Corp. | | | 302,181 | | | $ | 9,721,163 | |
| CAI International, Inc. (a) | | | 264,498 | | | | 3,480,794 | |
| First Republic Bank | | | 122,973 | | | | 7,416,502 | |
| PrivateBancorp, Inc. | | | 351,933 | | | | 13,320,664 | |
| Texas Capital Bancshares, Inc. (a) | | | 220,349 | | | | 11,867,997 | |
| | | | | | | | |
| | | | | | | $ | 45,807,120 | |
| Pharmaceuticals - 3.0% | | | | | | | | |
| Aratana Therapeutics, Inc. (a) | | | 597,298 | | | $ | 10,548,283 | |
| Collegium Pharmaceutical, Inc. (a)(l) | | | 297,044 | | | | 4,491,305 | |
| Horizon Pharma PLC (a) | | | 278,862 | | | | 8,148,348 | |
| Intercept Pharmaceuticals, Inc. (a) | | | 39,978 | | | | 7,586,225 | |
| MediWound Ltd. (a) | | | 309,012 | | | | 2,215,616 | |
14
Portfolio of Investments – continued
| | | | | | | | |
| Issuer | | Shares/Par | | | Value ($) | |
| Common Stocks - continued | | | | | | | | |
| Pharmaceuticals - continued | | | | | | | | |
| TherapeuticsMD, Inc. (a) | | | 1,454,025 | | | $ | 8,913,173 | |
| | | | | | | | |
| | | | | | | $ | 41,902,950 | |
| Railroad & Shipping - 1.9% | | | | | | | | |
| Diana Shipping, Inc. (a) | | | 1,732,220 | | | $ | 11,779,096 | |
| Genesee & Wyoming, Inc. (a) | | | 132,336 | | | | 9,049,136 | |
| StealthGas, Inc. (a) | | | 976,797 | | | | 4,776,537 | |
| | | | | | | | |
| | | | | | | $ | 25,604,769 | |
| Restaurants - 3.2% | | | | | | | | |
| Chuy’s Holdings, Inc. (a) | | | 425,680 | | | $ | 13,042,835 | |
| Domino’s Pizza, Inc. | | | 52,403 | | | | 5,551,574 | |
| Dunkin Brands Group, Inc. | | | 184,777 | | | | 9,268,414 | |
| El Pollo Loco Holdings, Inc. (a)(l) | | | 581,508 | | | | 7,565,419 | |
| Wingstop, Inc. (a) | | | 91,430 | | | | 2,501,525 | |
| Zoe’s Kitchen, Inc. (a)(l) | | | 183,797 | | | | 6,348,348 | |
| | | | | | | | |
| | | | | | | $ | 44,278,115 | |
| Special Products & Services - 0.6% | | | | | | | | |
| WL Ross Holding Corp., EU (a) | | | 707,014 | | | $ | 7,953,908 | |
| | |
| Specialty Chemicals - 2.4% | | | | | | | | |
| Albemarle Corp. | | | 255,848 | | | $ | 11,566,888 | |
| Axalta Coating Systems Ltd. (a) | | | 710,631 | | | | 20,743,319 | |
| | | | | | | | |
| | | | | | | $ | 32,310,207 | |
| Specialty Stores - 4.5% | | | | | | | | |
| Boot Barn Holdings, Inc. (a) | | | 285,262 | | | $ | 6,230,122 | |
| Burlington Stores, Inc. (a) | | | 219,723 | | | | 11,665,094 | |
| Cabela’s, Inc. (a) | | | 148,223 | | | | 6,665,588 | |
| Citi Trends, Inc. | | | 755,560 | | | | 19,954,340 | |
| Lumber Liquidators Holdings, Inc. (a)(l) | | | 302,449 | | | | 4,570,004 | |
| Urban Outfitters, Inc. (a) | | | 425,589 | | | | 13,133,677 | |
| | | | | | | | |
| | | | | | | $ | 62,218,825 | |
| Trucking - 1.0% | | | | | | | | |
| Swift Transportation Co. (a) | | | 699,217 | | | $ | 13,627,739 | |
| Total Common Stocks (Identified Cost, $1,188,029,359) | | | $ | 1,346,466,924 | |
| | |
| Money Market Funds - 1.8% | | | | | | | | |
MFS Institutional Money Market Portfolio, 0.11%,
at Cost and Net Asset Value (v) | | | 24,473,857 | | | $ | 24,473,857 | |
15
Portfolio of Investments – continued
| | | | | | | | |
| Collateral for Securities Loaned - 1.1% | | | | | | | | |
| Issuer | | Shares/Par | | | Value ($) | |
Navigator Securities Lending Prime Portfolio, 0.19%,
at Cost and Net Asset Value (j) | | | 15,350,953 | | | $ | 15,350,953 | |
| Total Investments (Identified Cost, $1,227,854,169) | | | | | | $ | 1,386,291,734 | |
| | |
| Other Assets, Less Liabilities - (1.0)% | | | | | | | (13,081,426 | ) |
| Net Assets - 100.0% | | | | | | $ | 1,373,210,308 | |
| (a) | Non-income producing security. |
| (h) | Affiliated issuers are those in which the fund’s holdings of an issuer represent 5% or more of the outstanding voting securities of the issuer. |
| (j) | The rate quoted is the annualized seven-day yield of the fund at period end. |
| (l) | A portion of this security is on loan. |
| (v) | Underlying affiliated fund that is available only to investment companies managed by MFS. The rate quoted for the MFS Institutional Money Market Portfolio is the annualized seven-day yield of the fund at period end. |
The following abbreviations are used in this report and are defined:
| PLC | | Public Limited Company |
See Notes to Financial Statements
16
Financial Statements
STATEMENT OF ASSETS AND LIABILITIES
At 8/31/15
This statement represents your fund’s balance sheet, which details the assets and liabilities comprising the total value of the fund.
| | | | |
| Assets | | | | |
Investments | | | | |
Non-affiliated issuers, at value (identified cost, $1,192,515,085) | | | $1,348,473,521 | |
Underlying affiliated funds, at cost and value | | | 24,473,857 | |
Other affiliated issuers, at value (identified cost, $10,865,227) | | | 13,344,356 | |
Total investments, at value, including $14,595,191 of securities on loan (identified cost, $1,227,854,169) | | | $1,386,291,734 | |
Receivables for | | | | |
Investments sold | | | 10,397,012 | |
Fund shares sold | | | 1,668,067 | |
Interest and dividends | | | 394,362 | |
Other assets | | | 2,279 | |
Total assets | | | $1,398,753,454 | |
| Liabilities | | | | |
Payables for | | | | |
Investments purchased | | | $6,215,811 | |
Fund shares reacquired | | | 3,009,240 | |
Collateral for securities loaned, at value | | | 15,350,953 | |
Payable to affiliates | | | | |
Investment adviser | | | 125,426 | |
Shareholder servicing costs | | | 656,607 | |
Distribution and service fees | | | 31,761 | |
Program manager fees | | | 38 | |
Payable for independent Trustees’ compensation | | | 3,188 | |
Accrued expenses and other liabilities | | | 150,122 | |
Total liabilities | | | $25,543,146 | |
Net assets | | | $1,373,210,308 | |
| Net assets consist of | | | | |
Paid-in capital | | | $1,234,823,337 | |
Unrealized appreciation (depreciation) on investments and translation of assets and liabilities in foreign currencies | | | 158,437,565 | |
Accumulated net realized gain (loss) on investments and foreign currency | | | (11,229,122 | ) |
Accumulated net investment loss | | | (8,821,472 | ) |
Net assets | | | $1,373,210,308 | |
Shares of beneficial interest outstanding | | | 57,291,902 | |
17
Statement of Assets and Liabilities – continued
| | | | | | | | | | | | |
| | | Net assets | | | Shares
outstanding | | | Net asset value
per share (a) | |
Class A | | | $457,436,935 | | | | 19,308,570 | | | | $23.69 | |
Class B | | | 27,454,815 | | | | 1,367,898 | | | | 20.07 | |
Class C | | | 105,686,049 | | | | 5,255,861 | | | | 20.11 | |
Class I | | | 166,513,470 | | | | 6,473,923 | | | | 25.72 | |
Class R1 | | | 6,572,684 | | | | 329,555 | | | | 19.94 | |
Class R2 | | | 57,077,105 | | | | 2,525,123 | | | | 22.60 | |
Class R3 | | | 89,659,376 | | | | 3,788,193 | | | | 23.67 | |
Class R4 | | | 142,856,866 | | | | 5,808,341 | | | | 24.60 | |
Class R5 | | | 313,079,935 | | | | 12,122,075 | | | | 25.83 | |
Class 529A | | | 5,149,429 | | | | 223,810 | | | | 23.01 | |
Class 529B | | | 340,865 | | | | 17,511 | | | | 19.47 | |
Class 529C | | | 1,382,779 | | | | 71,042 | | | | 19.46 | |
| (a) | Maximum offering price per share was equal to the net asset value per share for all share classes, except for Classes A and 529A, for which the maximum offering prices per share were $25.14 [100 / 94.25 x $23.69] and $24.41 [100 / 94.25 x $23.01], respectively. On sales of $50,000 or more, the maximum offering prices of Class A and Class 529A shares are reduced. A contingent deferred sales charge may be imposed on redemptions of Class A, Class B, Class C, Class 529B, and Class 529C shares. Redemption price per share was equal to the net asset value per share for Classes I, R1, R2, R3, R4, R5, and 529A. |
See Notes to Financial Statements
18
Financial Statements
STATEMENT OF OPERATIONS
Year ended 8/31/15
This statement describes how much your fund earned in investment income and accrued in expenses. It also describes any gains and/or losses generated by fund operations.
| | | | |
| Net investment loss | | | | |
Income | | | | |
Dividends | | | $7,306,010 | |
Income on securities loaned | | | 1,007,516 | |
Dividends from underlying affiliated funds | | | 15,085 | |
Foreign taxes withheld | | | (62,629 | ) |
Total investment income | | | $8,265,982 | |
Expenses | | | | |
Management fee | | | $15,011,698 | |
Distribution and service fees | | | 3,470,472 | |
Program manager fees | | | 6,832 | |
Shareholder servicing costs | | | 2,184,285 | |
Administrative services fee | | | 275,587 | |
Independent Trustees’ compensation | | | 37,519 | |
Custodian fee | | | 141,328 | |
Shareholder communications | | | 131,540 | |
Audit and tax fees | | | 56,904 | |
Legal fees | | | 11,907 | |
Miscellaneous | | | 209,873 | |
Total expenses | | | $21,537,945 | |
Fees paid indirectly | | | (174 | ) |
Reduction of expenses by investment adviser and distributor | | | (804,299 | ) |
Net expenses | | | $20,733,472 | |
Net investment loss | | | $(12,467,490 | ) |
| Realized and unrealized gain (loss) on investments and foreign currency | |
Realized gain (loss) (identified cost basis) | | | | |
Investments in non-affiliated issuers | | | $6,580,547 | |
Foreign currency | | | (21,980 | ) |
Net realized gain (loss) on investments and foreign currency | | | $6,558,567 | |
Change in unrealized appreciation (depreciation) | | | | |
Investments | | | $7,665,322 | |
Translation of assets and liabilities in foreign currencies | | | (960 | ) |
Net unrealized gain (loss) on investments and foreign currency translation | | | $7,664,362 | |
Net realized and unrealized gain (loss) on investments and foreign currency | | | $14,222,929 | |
Change in net assets from operations | | | $1,755,439 | |
See Notes to Financial Statements
19
Financial Statements
STATEMENTS OF CHANGES IN NET ASSETS
These statements describe the increases and/or decreases in net assets resulting from operations, any distributions, and any shareholder transactions.
| | | | | | | | |
| | | Years ended 8/31 | |
| | | 2015 | | | 2014 | |
| Change in net assets | | | | | | |
| From operations | | | | | | | | |
Net investment loss | | | $(12,467,490 | ) | | | $(16,765,231 | ) |
Net realized gain (loss) on investments and foreign currency | | | 6,558,567 | | | | 306,638,157 | |
Net unrealized gain (loss) on investments and foreign currency translation | | | 7,664,362 | | | | (131,752,340 | ) |
Change in net assets from operations | | | $1,755,439 | | | | $158,120,586 | |
| Distributions declared to shareholders | | | | | | | | |
From net realized gain on investments | | | $(126,855,750 | ) | | | $(182,188,311 | ) |
Change in net assets from fund share transactions | | | $(564,245,904 | ) | | | $48,101,270 | |
Total change in net assets | | | $(689,346,215 | ) | | | $24,033,545 | |
| Net assets | | | | | | | | |
At beginning of period | | | 2,062,556,523 | | | | 2,038,522,978 | |
At end of period (including accumulated net investment loss of $8,821,472 and $3,896, respectively) | | | $1,373,210,308 | | | | $2,062,556,523 | |
See Notes to Financial Statements
20
Financial Statements
FINANCIAL HIGHLIGHTS
The financial highlights table is intended to help you understand the fund’s financial performance for the past 5 years (or life of a particular share class, if shorter). Certain information reflects financial results for a single fund share. The total returns in the table represent the rate by which an investor would have earned (or lost) on an investment in the fund share class (assuming reinvestment of all distributions) held for the entire period.
| | | | | | | | | | | | | | | | | | | | |
| Class A | | Years ended 8/31 | |
| | | 2015 | | | 2014 | | | 2013 | | | 2012 | | | 2011 | |
Net asset value, beginning of period | | | $25.49 | | | | $25.86 | | | | $20.17 | | | | $22.63 | | | | $19.03 | |
| Income (loss) from investment operations | | | | | | | | | |
Net investment loss (d) | | | $(0.20 | ) | | | $(0.22 | ) | | | $(0.14 | ) | | | $(0.16 | ) | | | $(0.22 | ) |
Net realized and unrealized gain (loss)
on investments and foreign currency | | | 0.22 | | | | 2.30 | | | | 5.83 | | | | 1.80 | | | | 5.23 | |
Total from investment operations | | | $0.02 | | | | $2.08 | | | | $5.69 | | | | $1.64 | | | | $5.01 | |
| Less distributions declared to shareholders | | | | | | | | | |
From net realized gain on investments | | | $(1.82 | ) | | | $(2.45 | ) | | | $— | | | | $(4.10 | ) | | | $(1.41 | ) |
Net asset value, end of period (x) | | | $23.69 | | | | $25.49 | | | | $25.86 | | | | $20.17 | | | | $22.63 | |
Total return (%) (r)(s)(t)(x) | | | 0.47 | | | | 8.01 | | | | 28.21 | | | | 9.88 | | | | 26.13 | |
Ratios (%) (to average net assets)
and Supplemental data: | | | | | | | | | |
Expenses before expense reductions (f) | | | 1.36 | | | | 1.33 | | | | 1.35 | | | | 1.39 | | | | 1.40 | |
Expenses after expense reductions (f) | | | 1.31 | | | | 1.27 | | | | 1.31 | | | | 1.35 | | | | 1.30 | |
Net investment loss | | | (0.81 | ) | | | (0.83 | ) | | | (0.59 | ) | | | (0.83 | ) | | | (0.90 | ) |
Portfolio turnover | | | 56 | | | | 98 | | | | 96 | | | | 128 | | | | 205 | |
Net assets at end of period (000 omitted) | | | $457,437 | | | | $620,802 | | | | $866,006 | | | | $529,749 | | | | $626,258 | |
See Notes to Financial Statements
21
Financial Highlights – continued
| | | | | | | | | | | | | | | | | | | | |
| Class B | | Years ended 8/31 | |
| | | 2015 | | | 2014 | | | 2013 | | | 2012 | | | 2011 | |
Net asset value, beginning of period | | | $22.04 | | | | $22.83 | | | | $17.94 | | | | $20.73 | | | | $17.65 | |
| Income (loss) from investment operations | | | | | | | | | |
Net investment loss (d) | | | $(0.32 | ) | | | $(0.36 | ) | | | $(0.27 | ) | | | $(0.28 | ) | | | $(0.37 | ) |
Net realized and unrealized gain (loss)
on investments and foreign currency | | | 0.17 | | | | 2.02 | | | | 5.16 | | | | 1.59 | | | | 4.86 | |
Total from investment operations | | | $(0.15 | ) | | | $1.66 | | | | $4.89 | | | | $1.31 | | | | $4.49 | |
| Less distributions declared to shareholders | | | | | |
From net realized gain on investments | | | $(1.82 | ) | | | $(2.45 | ) | | | $— | | | | $(4.10 | ) | | | $(1.41 | ) |
Net asset value, end of period (x) | | | $20.07 | | | | $22.04 | | | | $22.83 | | | | $17.94 | | | | $20.73 | |
Total return (%) (r)(s)(t)(x) | | | (0.27 | ) | | | 7.18 | | | | 27.26 | | | | 9.08 | | | | 25.18 | |
Ratios (%) (to average net assets)
and Supplemental data: | | | | | | | | | |
Expenses before expense reductions (f) | | | 2.11 | | | | 2.08 | | | | 2.10 | | | | 2.14 | | | | 2.15 | |
Expenses after expense reductions (f) | | | 2.06 | | | | 2.02 | | | | 2.06 | | | | 2.10 | | | | 2.05 | |
Net investment loss | | | (1.57 | ) | | | (1.58 | ) | | | (1.34 | ) | | | (1.59 | ) | | | (1.65 | ) |
Portfolio turnover | | | 56 | | | | 98 | | | | 96 | | | | 128 | | | | 205 | |
Net assets at end of period (000 omitted) | | | $27,455 | | | | $34,971 | | | | $37,952 | | | | $30,308 | | | | $33,037 | |
| |
| Class C | | Years ended 8/31 | |
| | | 2015 | | | 2014 | | | 2013 | | | 2012 | | | 2011 | |
Net asset value, beginning of period | | | $22.08 | | | | $22.86 | | | | $17.96 | | | | $20.76 | | | | $17.67 | |
| Income (loss) from investment operations | | | | | | | | | |
Net investment loss (d) | | | $(0.32 | ) | | | $(0.36 | ) | | | $(0.27 | ) | | | $(0.28 | ) | | | $(0.37 | ) |
Net realized and unrealized gain (loss)
on investments and foreign currency | | | 0.17 | | | | 2.03 | | | | 5.17 | | | | 1.58 | | | | 4.87 | |
Total from investment operations | | | $(0.15 | ) | | | $1.67 | | | | $4.90 | | | | $1.30 | | | | $4.50 | |
| Less distributions declared to shareholders | | | | | | | | | |
From net realized gain on investments | | | $(1.82 | ) | | | $(2.45 | ) | | | $— | | | | $(4.10 | ) | | | $(1.41 | ) |
Net asset value, end of period (x) | | | $20.11 | | | | $22.08 | | | | $22.86 | | | | $17.96 | | | | $20.76 | |
Total return (%) (r)(s)(t)(x) | | | (0.28 | ) | | | 7.22 | | | | 27.28 | | | | 9.01 | | | | 25.21 | |
Ratios (%) (to average net assets)
and Supplemental data: | | | | | | | | | |
Expenses before expense reductions (f) | | | 2.11 | | | | 2.08 | | | | 2.10 | | | | 2.14 | | | | 2.15 | |
Expenses after expense reductions (f) | | | 2.06 | | | | 2.02 | | | | 2.06 | | | | 2.10 | | | | 2.05 | |
Net investment loss | | | (1.57 | ) | | | (1.59 | ) | | | (1.35 | ) | | | (1.59 | ) | | | (1.65 | ) |
Portfolio turnover | | | 56 | | | | 98 | | | | 96 | | | | 128 | | | | 205 | |
Net assets at end of period (000 omitted) | | | $105,686 | | | | $141,293 | | | | $136,913 | | | | $91,138 | | | | $95,479 | |
See Notes to Financial Statements
22
Financial Highlights – continued
| | | | | | | | | | | | | | | | | | | | |
| Class I | | Years ended 8/31 | |
| | | 2015 | | | 2014 | | | 2013 | | | 2012 | | | 2011 | |
Net asset value, beginning of period | | | $27.44 | | | | $27.61 | | | | $21.48 | | | | $23.77 | | | | $19.88 | |
| Income (loss) from investment operations | | | | | | | | | |
Net investment loss (d) | | | $(0.14 | ) | | | $(0.17 | ) | | | $(0.09 | ) | | | $(0.12 | ) | | | $(0.17 | ) |
Net realized and unrealized gain (loss)
on investments and foreign currency | | | 0.24 | | | | 2.45 | | | | 6.22 | | | | 1.93 | | | | 5.47 | |
Total from investment operations | | | $0.10 | | | | $2.28 | | | | $6.13 | | | | $1.81 | | | | $5.30 | |
| Less distributions declared to shareholders | | | | | | | | | |
From net realized gain on investments | | | $(1.82 | ) | | | $(2.45 | ) | | | $— | | | | $(4.10 | ) | | | $(1.41 | ) |
Net asset value, end of period (x) | | | $25.72 | | | | $27.44 | | | | $27.61 | | | | $21.48 | | | | $23.77 | |
Total return (%) (r)(s)(x) | | | 0.74 | | | | 8.25 | | | | 28.54 | | | | 10.16 | | | | 26.48 | |
Ratios (%) (to average net assets)
and Supplemental data: | | | | | | | | | |
Expenses before expense reductions (f) | | | 1.11 | | | | 1.08 | | | | 1.10 | | | | 1.15 | | | | 1.15 | |
Expenses after expense reductions (f) | | | 1.06 | | | | 1.02 | | | | 1.06 | | | | 1.10 | | | | 1.05 | |
Net investment loss | | | (0.55 | ) | | | (0.59 | ) | | | (0.36 | ) | | | (0.59 | ) | | | (0.65 | ) |
Portfolio turnover | | | 56 | | | | 98 | | | | 96 | | | | 128 | | | | 205 | |
Net assets at end of period (000 omitted) | | | $166,513 | | | | $483,893 | | | | $368,806 | | | | $170,830 | | | | $323,848 | |
| |
| Class R1 | | Years ended 8/31 | |
| | | 2015 | | | 2014 | | | 2013 | | | 2012 | | | 2011 | |
Net asset value, beginning of period | | | $21.91 | | | | $22.71 | | | | $17.84 | | | | $20.65 | | | | $17.58 | |
| Income (loss) from investment operations | | | | | | | | | |
Net investment loss (d) | | | $(0.32 | ) | | | $(0.36 | ) | | | $(0.27 | ) | | | $(0.28 | ) | | | $(0.37 | ) |
Net realized and unrealized gain (loss)
on investments and foreign currency | | | 0.17 | | | | 2.01 | | | | 5.14 | | | | 1.57 | | | | 4.85 | |
Total from investment operations | | | $(0.15 | ) | | | $1.65 | | | | $4.87 | | | | $1.29 | | | | $4.48 | |
| Less distributions declared to shareholders | | | | | | | | | |
From net realized gain on investments | | | $(1.82 | ) | | | $(2.45 | ) | | | $— | | | | $(4.10 | ) | | | $(1.41 | ) |
Net asset value, end of period (x) | | | $19.94 | | | | $21.91 | | | | $22.71 | | | | $17.84 | | | | $20.65 | |
Total return (%) (r)(s)(x) | | | (0.28 | ) | | | 7.17 | | | | 27.30 | | | | 9.00 | | | | 25.22 | |
Ratios (%) (to average net assets)
and Supplemental data: | | | | | | | | | |
Expenses before expense reductions (f) | | | 2.11 | | | | 2.08 | | | | 2.10 | | | | 2.14 | | | | 2.15 | |
Expenses after expense reductions (f) | | | 2.06 | | | | 2.02 | | | | 2.06 | | | | 2.10 | | | | 2.05 | |
Net investment loss | | | (1.57 | ) | | | (1.59 | ) | | | (1.34 | ) | | | (1.59 | ) | | | (1.65 | ) |
Portfolio turnover | | | 56 | | | | 98 | | | | 96 | | | | 128 | | | | 205 | |
Net assets at end of period (000 omitted) | | | $6,573 | | | | $8,490 | | | | $8,972 | | | | $7,506 | | | | $6,904 | |
See Notes to Financial Statements
23
Financial Highlights – continued
| | | | | | | | | | | | | | | | | | | | |
| Class R2 | | Years ended 8/31 | |
| | | 2015 | | | 2014 | | | 2013 | | | 2012 | | | 2011 | |
Net asset value, beginning of period | | | $24.46 | | | | $24.97 | | | | $19.52 | | | | $22.09 | | | | $18.65 | |
| Income (loss) from investment operations | | | | | | | | | |
Net investment loss (d) | | | $(0.25 | ) | | | $(0.27 | ) | | | $(0.19 | ) | | | $(0.21 | ) | | | $(0.28 | ) |
Net realized and unrealized gain (loss)
on investments and foreign currency | | | 0.21 | | | | 2.21 | | | | 5.64 | | | | 1.74 | | | | 5.13 | |
Total from investment operations | | | $(0.04 | ) | | | $1.94 | | | | $5.45 | | | | $1.53 | | | | $4.85 | |
| Less distributions declared to shareholders | | | | | | | | | |
From net realized gain on investments | | | $(1.82 | ) | | | $(2.45 | ) | | | $— | | | | $(4.10 | ) | | | $(1.41 | ) |
Net asset value, end of period (x) | | | $22.60 | | | | $24.46 | | | | $24.97 | | | | $19.52 | | | | $22.09 | |
Total return (%) (r)(s)(x) | | | 0.23 | | | | 7.72 | | | | 27.92 | | | | 9.58 | | | | 25.79 | |
Ratios (%) (to average net assets)
and Supplemental data: | | | | | | | | | |
Expenses before expense reductions (f) | | | 1.61 | | | | 1.58 | | | | 1.60 | | | | 1.64 | | | | 1.65 | |
Expenses after expense reductions (f) | | | 1.56 | | | | 1.52 | | | | 1.56 | | | | 1.60 | | | | 1.55 | |
Net investment loss | | | (1.07 | ) | | | (1.09 | ) | | | (0.85 | ) | | | (1.09 | ) | | | (1.15 | ) |
Portfolio turnover | | | 56 | | | | 98 | | | | 96 | | | | 128 | | | | 205 | |
Net assets at end of period (000 omitted) | | | $57,077 | | | | $66,923 | | | | $60,501 | | | | $35,599 | | | | $24,316 | |
| |
| Class R3 | | Years ended 8/31 | |
| | | 2015 | | | 2014 | | | 2013 | | | 2012 | | | 2011 | |
Net asset value, beginning of period | | | $25.47 | | | | $25.84 | | | | $20.15 | | | | $22.62 | | | | $19.02 | |
| Income (loss) from investment operations | | | | | | | | | |
Net investment loss (d) | | | $(0.20 | ) | | | $(0.22 | ) | | | $(0.14 | ) | | | $(0.16 | ) | | | $(0.22 | ) |
Net realized and unrealized gain (loss)
on investments and foreign currency | | | 0.22 | | | | 2.30 | | | | 5.83 | | | | 1.79 | | | | 5.23 | |
Total from investment operations | | | $0.02 | | | | $2.08 | | | | $5.69 | | | | $1.63 | | | | $5.01 | |
| Less distributions declared to shareholders | | | | | | | | | |
From net realized gain on investments | | | $(1.82 | ) | | | $(2.45 | ) | | | $— | | | | $(4.10 | ) | | | $(1.41 | ) |
Net asset value, end of period (x) | | | $23.67 | | | | $25.47 | | | | $25.84 | | | | $20.15 | | | | $22.62 | |
Total return (%) (r)(s)(x) | | | 0.47 | | | | 8.02 | | | | 28.24 | | | | 9.84 | | | | 26.14 | |
Ratios (%) (to average net assets)
and Supplemental data: | | | | | | | | | |
Expenses before expense reductions (f) | | | 1.36 | | | | 1.33 | | | | 1.35 | | | | 1.39 | | | | 1.40 | |
Expenses after expense reductions (f) | | | 1.31 | | | | 1.27 | | | | 1.31 | | | | 1.35 | | | | 1.30 | |
Net investment loss | | | (0.82 | ) | | | (0.84 | ) | | | (0.60 | ) | | | (0.83 | ) | | | (0.90 | ) |
Portfolio turnover | | | 56 | | | | 98 | | | | 96 | | | | 128 | | | | 205 | |
Net assets at end of period (000 omitted) | | | $89,659 | | | | $150,359 | | | | $110,562 | | | | $61,125 | | | | $28,966 | |
See Notes to Financial Statements
24
Financial Highlights – continued
| | | | | | | | | | | | | | | | | | | | |
| Class R4 | | Years ended 8/31 | |
| | | 2015 | | | 2014 | | | 2013 | | | 2012 | | | 2011 | |
Net asset value, beginning of period | | | $26.33 | | | | $26.57 | | | | $20.67 | | | | $23.04 | | | | $19.31 | |
| Income (loss) from investment operations | | | | | | | | | |
Net investment loss (d) | | | $(0.14 | ) | | | $(0.16 | ) | | | $(0.08 | ) | | | $(0.12 | ) | | | $(0.16 | ) |
Net realized and unrealized gain (loss)
on investments and foreign currency | | | 0.23 | | | | 2.37 | | | | 5.98 | | | | 1.85 | | | | 5.30 | |
Total from investment operations | | | $0.09 | | | | $2.21 | | | | $5.90 | | | | $1.73 | | | | $5.14 | |
| Less distributions declared to shareholders | | | | | | | | | |
From net realized gain on investments | | | $(1.82 | ) | | | $(2.45 | ) | | | $— | | | | $(4.10 | ) | | | $(1.41 | ) |
Net asset value, end of period (x) | | | $24.60 | | | | $26.33 | | | | $26.57 | | | | $20.67 | | | | $23.04 | |
Total return (%) (r)(s)(x) | | | 0.73 | | | | 8.31 | | | | 28.54 | | | | 10.13 | | | | 26.43 | |
Ratios (%) (to average net assets)
and Supplemental data: | | | | | | | | | |
Expenses before expense reductions (f) | | | 1.11 | | | | 1.08 | | | | 1.10 | | | | 1.14 | | | | 1.15 | |
Expenses after expense reductions (f) | | | 1.06 | | | | 1.02 | | | | 1.06 | | | | 1.10 | | | | 1.05 | |
Net investment loss | | | (0.57 | ) | | | (0.59 | ) | | | (0.35 | ) | | | (0.58 | ) | | | (0.66 | ) |
Portfolio turnover | | | 56 | | | | 98 | | | | 96 | | | | 128 | | | | 205 | |
Net assets at end of period (000 omitted) | | | $142,857 | | | | $229,964 | | | | $197,884 | | | | $141,694 | | | | $78,534 | |
| | | | | | | | | | | | | | | | |
| Class R5 | | Years ended 8/31 | |
| | | 2015 | | | 2014 | | | 2013 | | | 2012 (i) | |
Net asset value, beginning of period | | | $27.52 | | | | $27.64 | | | | $21.48 | | | | $19.73 | |
| Income (loss) from investment operations | | | | | | | | | |
Net investment loss (d) | | | $(0.12 | ) | | | $(0.13 | ) | | | $(0.06 | ) | | | $(0.03 | ) |
Net realized and unrealized gain (loss)
on investments and foreign currency | | | 0.25 | | | | 2.46 | | | | 6.22 | | | | 1.78 | |
Total from investment operations | | | $0.13 | | | | $2.33 | | | | $6.16 | | | | $1.75 | |
| Less distributions declared to shareholders | | | | | | | | | |
From net realized gain on investments | | | $(1.82 | ) | | | $(2.45 | ) | | | $— | | | | $— | |
Net asset value, end of period (x) | | | $25.83 | | | | $27.52 | | | | $27.64 | | | | $21.48 | |
Total return (%) (r)(s)(x) | | | 0.85 | | | | 8.43 | | | | 28.68 | | | | 8.87 | (n) |
Ratios (%) (to average net assets)
and Supplemental data: | | | | | | | | | |
Expenses before expense reductions (f) | | | 0.98 | | | | 0.97 | | | | 0.99 | | | | 1.07 | (a) |
Expenses after expense reductions (f) | | | 0.93 | | | | 0.91 | | | | 0.96 | | | | 1.05 | (a) |
Net investment loss | | | (0.44 | ) | | | (0.48 | ) | | | (0.24 | ) | | | (0.49 | )(a) |
Portfolio turnover | | | 56 | | | | 98 | | | | 96 | | | | 128 | |
Net assets at end of period (000 omitted) | | | $313,080 | | | | $319,139 | | | | $244,655 | | | | $174,681 | |
See Notes to Financial Statements
25
Financial Highlights – continued
| | | | | | | | | | | | | | | | | | | | |
| Class 529A | | Years ended 8/31 | |
| | | 2015 | | | 2014 | | | 2013 | | | 2012 | | | 2011 | |
Net asset value, beginning of period | | | $24.82 | | | | $25.25 | | | | $19.70 | | | | $22.22 | | | | $18.71 | |
| Income (loss) from investment operations | | | | | | | | | |
Net investment loss (d) | | | $(0.20 | ) | | | $(0.22 | ) | | | $(0.14 | ) | | | $(0.17 | ) | | | $(0.24 | ) |
Net realized and unrealized gain (loss)
on investments and foreign currency | | | 0.21 | | | | 2.24 | | | | 5.69 | | | | 1.75 | | | | 5.16 | |
Total from investment operations | | | $0.01 | | | | $2.02 | | | | $5.55 | | | | $1.58 | | | | $4.92 | |
| Less distributions declared to shareholders | | | | | | | | | |
From net realized gain on investments | | | $(1.82 | ) | | | $(2.45 | ) | | | $— | | | | $(4.10 | ) | | | $(1.41 | ) |
Net asset value, end of period (x) | | | $23.01 | | | | $24.82 | | | | $25.25 | | | | $19.70 | | | | $22.22 | |
Total return (%) (r)(s)(t)(x) | | | 0.44 | | | | 7.97 | | | | 28.17 | | | | 9.80 | | | | 26.09 | |
Ratios (%) (to average net assets)
and Supplemental data: | | | | | | | | | |
Expenses before expense reductions (f) | | | 1.46 | | | | 1.43 | | | | 1.45 | | | | 1.49 | | | | 1.50 | |
Expenses after expense reductions (f) | | | 1.34 | | | | 1.30 | | | | 1.34 | | | | 1.40 | | | | 1.39 | |
Net investment loss | | | (0.85 | ) | | | (0.86 | ) | | | (0.62 | ) | | | (0.89 | ) | | | (0.99 | ) |
Portfolio turnover | | | 56 | | | | 98 | | | | 96 | | | | 128 | | | | 205 | |
Net assets at end of period (000 omitted) | | | $5,149 | | | | $5,150 | | | | $4,519 | | | | $3,304 | | | | $2,848 | |
| | | | | | | | | | | | | | | | | | | | |
| Class 529B | | Years ended 8/31 | |
| | | 2015 | | | 2014 | | | 2013 | | | 2012 | | | 2011 | |
Net asset value, beginning of period | | | $21.44 | | | | $22.27 | | | | $17.51 | | | | $20.35 | | | | $17.36 | |
| Income (loss) from investment operations | | | | | | | | | |
Net investment loss (d) | | | $(0.32 | ) | | | $(0.36 | ) | | | $(0.28 | ) | | | $(0.28 | ) | | | $(0.38 | ) |
Net realized and unrealized gain (loss)
on investments and foreign currency | | | 0.17 | | | | 1.98 | | | | 5.04 | | | | 1.54 | | | | 4.78 | |
Total from investment operations | | | $(0.15 | ) | | | $1.62 | | | | $4.76 | | | | $1.26 | | | | $4.40 | |
| Less distributions declared to shareholders | | | | | | | | | |
From net realized gain on investments | | | $(1.82 | ) | | | $(2.45 | ) | | | $— | | | | $(4.10 | ) | | | $(1.41 | ) |
Net asset value, end of period (x) | | | $19.47 | | | | $21.44 | | | | $22.27 | | | | $17.51 | | | | $20.35 | |
Total return (%) (r)(s)(t)(x) | | | (0.28 | ) | | | 7.18 | | | | 27.18 | | | | 8.99 | | | | 25.08 | |
Ratios (%) (to average net assets)
and Supplemental data: | | | | | | | | | |
Expenses before expense reductions (f) | | | 2.21 | | | | 2.18 | | | | 2.20 | | | | 2.24 | | | | 2.24 | |
Expenses after expense reductions (f) | | | 2.09 | | | | 2.06 | | | | 2.10 | | | | 2.15 | | | | 2.14 | |
Net investment loss | | | (1.60 | ) | | | (1.62 | ) | | | (1.39 | ) | | | (1.64 | ) | | | (1.74 | ) |
Portfolio turnover | | | 56 | | | | 98 | | | | 96 | | | | 128 | | | | 205 | |
Net assets at end of period (000 omitted) | | | $341 | | | | $348 | | | | $300 | | | | $217 | | | | $197 | |
See Notes to Financial Statements
26
Financial Highlights – continued
| | | | | | | | | | | | | | | | | | | | |
| Class 529C | | Years ended 8/31 | |
| | | 2015 | | | 2014 | | | 2013 | | | 2012 | | | 2011 | |
Net asset value, beginning of period | | | $21.44 | | | | $22.28 | | | | $17.52 | | | | $20.36 | | | | $17.36 | |
| Income (loss) from investment operations | | | | | | | | | |
Net investment loss (d) | | | $(0.33 | ) | | | $(0.36 | ) | | | $(0.28 | ) | | | $(0.28 | ) | | | $(0.38 | ) |
Net realized and unrealized gain (loss)
on investments and foreign currency | | | 0.17 | | | | 1.97 | | | | 5.04 | | | | 1.54 | | | | 4.79 | |
Total from investment operations | | | $(0.16 | ) | | | $1.61 | | | | $4.76 | | | | $1.26 | | | | $4.41 | |
| Less distributions declared to shareholders | | | | | | | | | |
From net realized gain on investments | | | $(1.82 | ) | | | $(2.45 | ) | | | $— | | | | $(4.10 | ) | | | $(1.41 | ) |
Net asset value, end of period (x) | | | $19.46 | | | | $21.44 | | | | $22.28 | | | | $17.52 | | | | $20.36 | |
Total return (%) (r)(s)(t)(x) | | | (0.34 | ) | | | 7.13 | | | | 27.17 | | | | 8.98 | | | | 25.14 | |
Ratios (%) (to average net assets)
and Supplemental data: | | | | | | | | | |
Expenses before expense reductions (f) | | | 2.21 | | | | 2.18 | | | | 2.20 | | | | 2.24 | | | | 2.25 | |
Expenses after expense reductions (f) | | | 2.11 | | | | 2.07 | | | | 2.11 | | | | 2.15 | | | | 2.14 | |
Net investment loss | | | (1.62 | ) | | | (1.63 | ) | | | (1.39 | ) | | | (1.64 | ) | | | (1.74 | ) |
Portfolio turnover | | | 56 | | | | 98 | | | | 96 | | | | 128 | | | | 205 | |
Net assets at end of period (000 omitted) | | | $1,383 | | | | $1,223 | | | | $1,454 | | | | $906 | | | | $709 | |
| (d) | Per share data is based on average shares outstanding. |
| (f) | Ratios do not reflect reductions from fees paid indirectly, if applicable. |
| (i) | For the period from the class inception, June 1, 2012, through the stated period end. |
| (r) | Certain expenses have been reduced without which performance would have been lower. |
| (s) | From time to time the fund may receive proceeds from litigation settlements, without which performance would be lower. |
| (t) | Total returns do not include any applicable sales charges. |
| (x) | The net asset values and total returns have been calculated on net assets which include adjustments made in accordance with U.S. generally accepted accounting principles required at period end for financial reporting purposes. |
See Notes to Financial Statements
27
NOTES TO FINANCIAL STATEMENTS
(1) Business and Organization
MFS New Discovery Fund (the fund) is a diversified series of MFS Series Trust I (the trust). The trust is organized as a Massachusetts business trust and is registered under the Investment Company Act of 1940, as amended, as an open-end management investment company.
The fund is an investment company and accordingly follows the investment company accounting and reporting guidance of the Financial Accounting Standards Board (FASB) Accounting Standards Codification Topic 946 Financial Services – Investment Companies.
(2) Significant Accounting Policies
General – The preparation of financial statements in conformity with U.S. generally accepted accounting principles requires management to make estimates and assumptions that affect the reported amounts of assets and liabilities, and disclosure of contingent assets and liabilities at the date of the financial statements and the reported amounts of increases and decreases in net assets from operations during the reporting period. Actual results could differ from those estimates. In the preparation of these financial statements, management has evaluated subsequent events occurring after the date of the fund’s Statement of Assets and Liabilities through the date that the financial statements were issued. The fund will generally focus on securities of small size companies which may be more volatile than those of larger companies.
In June 2014, FASB issued Accounting Standards Update 2014-11, Transfers and Servicing (Topic 860) – Repurchase-to-Maturity Transactions, Repurchase Financings, and Disclosures (“ASU 2014-11”). ASU 2014-11 changes the accounting for repurchase-to-maturity transactions (i.e., repurchase agreements that settle at the same time as the maturity of the transferred financial asset) and enhances the required disclosures for repurchase agreements and other similar transactions. Although still evaluating the potential impacts of ASU 2014-11 to the fund, management expects that the impact of the fund’s adoption will be limited to additional financial statement disclosures which would first be effective for interim reporting periods beginning after March 15, 2015.
Balance Sheet Offsetting – The fund’s accounting policy with respect to balance sheet offsetting is that, absent an event of default by the counterparty or a termination of the agreement, the International Swaps and Derivatives Association (ISDA) Master Agreement does not result in an offset of reported amounts of financial assets and financial liabilities in the Statement of Assets and Liabilities across transactions between the fund and the applicable counterparty. The fund’s right to setoff may be restricted or prohibited by the bankruptcy or insolvency laws of the particular jurisdiction to which a specific master netting agreement counterparty is subject. Balance sheet offsetting disclosures, to the extent applicable to the fund, have been included in the fund’s Significant Accounting Policies note under the captions for each of the fund’s in-scope financial instruments and transactions.
Investment Valuations – Equity securities, including restricted equity securities, are generally valued at the last sale or official closing price as provided by a third-party
28
Notes to Financial Statements – continued
pricing service on the market or exchange on which they are primarily traded. Equity securities, for which there were no sales reported that day, are generally valued at the last quoted daily bid quotation as provided by a third-party pricing service on the market or exchange on which such securities are primarily traded. Short-term instruments with a maturity at issuance of 60 days or less may be valued at amortized cost, which approximates market value. Open-end investment companies are generally valued at net asset value per share. Securities and other assets generally valued on the basis of information from a third-party pricing service may also be valued at a broker/dealer bid quotation. Values obtained from third-party pricing services can utilize both transaction data and market information such as yield, quality, coupon rate, maturity, type of issue, trading characteristics, and other market data. The values of foreign securities and other assets and liabilities expressed in foreign currencies are converted to U.S. dollars using the mean of bid and asked prices for rates provided by a third-party pricing service.
The Board of Trustees has delegated primary responsibility for determining or causing to be determined the value of the fund’s investments (including any fair valuation) to the adviser pursuant to valuation policies and procedures approved by the Board. If the adviser determines that reliable market quotations are not readily available, investments are valued at fair value as determined in good faith by the adviser in accordance with such procedures under the oversight of the Board of Trustees. Under the fund’s valuation policies and procedures, market quotations are not considered to be readily available for most types of debt instruments and floating rate loans and many types of derivatives. These investments are generally valued at fair value based on information from third-party pricing services. In addition, investments may be valued at fair value if the adviser determines that an investment’s value has been materially affected by events occurring after the close of the exchange or market on which the investment is principally traded (such as foreign exchange or market) and prior to the determination of the fund’s net asset value, or after the halting of trading of a specific security where trading does not resume prior to the close of the exchange or market on which the security is principally traded. Events that occur on a frequent basis after foreign markets close (such as developments in foreign markets and significant movements in the U.S. markets) and prior to the determination of the fund’s net asset value may be deemed to have a material effect on the value of securities traded in foreign markets. Accordingly, the fund’s foreign equity securities may often be valued at fair value. The adviser generally relies on third-party pricing services or other information (such as the correlation with price movements of similar securities in the same or other markets; the type, cost and investment characteristics of the security; the business and financial condition of the issuer; and trading and other market data) to assist in determining whether to fair value and at what value to fair value an investment. The value of an investment for purposes of calculating the fund’s net asset value can differ depending on the source and method used to determine value. When fair valuation is used, the value of an investment used to determine the fund’s net asset value may differ from quoted or published prices for the same investment. There can be no assurance that the fund could obtain the fair value assigned to an investment if it were to sell the investment at the same time at which the fund determines its net asset value per share.
29
Notes to Financial Statements – continued
Various inputs are used in determining the value of the fund’s assets or liabilities. These inputs are categorized into three broad levels. In certain cases, the inputs used to measure fair value may fall into different levels of the fair value hierarchy. In such cases, an investment’s level within the fair value hierarchy is based on the lowest level of input that is significant to the fair value measurement. The fund’s assessment of the significance of a particular input to the fair value measurement in its entirety requires judgment, and considers factors specific to the investment. Level 1 includes unadjusted quoted prices in active markets for identical assets or liabilities. Level 2 includes other significant observable market-based inputs (including quoted prices for similar securities, interest rates, prepayment speed, and credit risk). Level 3 includes unobservable inputs, which may include the adviser’s own assumptions in determining the fair value of investments. The following is a summary of the levels used as of August 31, 2015 in valuing the fund’s assets or liabilities:
| | | | | | | | | | | | | | | | |
| Investments at Value | | Level 1 | | | Level 2 | | | Level 3 | | | Total | |
| Equity Securities | | | $1,346,466,924 | | | | $— | | | | $— | | | | $1,346,466,924 | |
| Mutual Funds | | | 39,824,810 | | | | — | | | | — | | | | 39,824,810 | |
| Total Investments | | | $1,386,291,734 | | | | $— | | | | $— | | | | $1,386,291,734 | |
For further information regarding security characteristics, see the Portfolio of Investments.
Foreign Currency Translation – Purchases and sales of foreign investments, income, and expenses are converted into U.S. dollars based upon currency exchange rates prevailing on the respective dates of such transactions or on the reporting date for foreign denominated receivables and payables. Gains and losses attributable to foreign currency exchange rates on sales of securities are recorded for financial statement purposes as net realized gains and losses on investments. Gains and losses attributable to foreign exchange rate movements on receivables, payables, income and expenses are recorded for financial statement purposes as foreign currency transaction gains and losses. That portion of both realized and unrealized gains and losses on investments that results from fluctuations in foreign currency exchange rates is not separately disclosed.
Security Loans – Under its Securities Lending Agency Agreement with the fund, State Street Bank and Trust Company (“State Street”), as lending agent, loans the securities of the fund to certain qualified institutions (the “Borrowers”) approved by the fund. The loans are collateralized by cash and/or U.S. Treasury and federal agency obligations in an amount typically at least equal to the market value of the securities loaned. On loans collateralized by cash, the cash collateral is invested in a money market fund. The market value of the loaned securities is determined at the close of business of the fund and any additional required collateral is delivered to the fund on the next business day. State Street provides the fund with indemnification against Borrower default. In the event of Borrower default, State Street will for the benefit of the fund either purchase securities identical to those loaned or, when such purchase is commercially impracticable, pay the fund the market value of the loaned securities. In return, State Street assumes the fund’s rights to the related collateral. If the collateral value is less than the cost to purchase identical securities, State Street is responsible for the shortfall, but only to the extent that such shortfall is not due to a decline in collateral
30
Notes to Financial Statements – continued
value resulting from collateral reinvestment for which the fund bears the risk of loss. At period end, the fund had investment securities on loan with a fair value of $14,595,191 and a related liability of $15,350,953 for cash collateral received on securities loaned, both of which are presented gross in the Statement of Assets and Liabilities. The collateral received on securities loaned exceeded the value of securities on loan at period end. The liability for cash collateral for securities loaned is carried at fair value, which is categorized as level 2 within the fair value hierarchy. A portion of the income generated upon investment of the collateral is remitted to the Borrowers, and the remainder is allocated between the fund and the lending agent. On loans collateralized by U.S. Treasury and/or federal agency obligations, a fee is received from the Borrower, and is allocated between the fund and the lending agent. Income from securities lending is separately reported in the Statement of Operations. The dividend and interest income earned on the securities loaned is accounted for in the same manner as other dividend and interest income.
Indemnifications – Under the fund’s organizational documents, its officers and Trustees may be indemnified against certain liabilities and expenses arising out of the performance of their duties to the fund. Additionally, in the normal course of business, the fund enters into agreements with service providers that may contain indemnification clauses. The fund’s maximum exposure under these agreements is unknown as this would involve future claims that may be made against the fund that have not yet occurred.
Investment Transactions and Income – Investment transactions are recorded on the trade date. Dividends received in cash are recorded on the ex-dividend date. Certain dividends from foreign securities will be recorded when the fund is informed of the dividend if such information is obtained subsequent to the ex-dividend date. Dividend payments received in additional securities are recorded on the ex-dividend date in an amount equal to the value of the security on such date.
The fund may receive proceeds from litigation settlements. Any proceeds received from litigation involving portfolio holdings are reflected in the Statement of Operations in realized gain/loss if the security has been disposed of by the fund or in unrealized gain/loss if the security is still held by the fund. Any other proceeds from litigation not related to portfolio holdings are reflected as other income in the Statement of Operations.
Fees Paid Indirectly – The fund’s custody fee may be reduced by a credit earned under an arrangement that measures the value of U.S. dollars deposited with the custodian by the fund. The amount of the credit, for the year ended August 31, 2015, is shown as a reduction of total expenses in the Statement of Operations.
Tax Matters and Distributions – The fund intends to qualify as a regulated investment company, as defined under Subchapter M of the Internal Revenue Code, and to distribute all of its taxable income, including realized capital gains. As a result, no provision for federal income tax is required. The fund’s federal tax returns, when filed, will remain subject to examination by the Internal Revenue Service for a three year period. Management has analyzed the fund’s tax positions taken on federal and state tax returns for all open tax years and does not believe that there are any uncertain tax positions that require recognition of a tax liability. Foreign taxes, if any, have been
31
Notes to Financial Statements – continued
accrued by the fund in the accompanying financial statements in accordance with the applicable foreign tax law. Foreign income taxes may be withheld by certain countries in which the fund invests. Additionally, capital gains realized by the fund on securities issued in or by certain foreign countries may be subject to capital gains tax imposed by those countries.
Distributions to shareholders are recorded on the ex-dividend date. Income and capital gain distributions are determined in accordance with income tax regulations, which may differ from U.S. generally accepted accounting principles. Certain capital accounts in the financial statements are periodically adjusted for permanent differences in order to reflect their tax character. These adjustments have no impact on net assets or net asset value per share. Temporary differences which arise from recognizing certain items of income, expense, gain or loss in different periods for financial statement and tax purposes will reverse at some time in the future. Distributions in excess of net investment income or net realized gains are temporary overdistributions for financial statement purposes resulting from differences in the recognition or classification of income or distributions for financial statement and tax purposes.
Book/tax differences primarily relate to net operating losses and wash sale loss deferrals.
The tax character of distributions declared to shareholders for the last two fiscal years is as follows:
| | | | | | | | |
| | | 8/31/15 | | | 8/31/14 | |
| Ordinary income (including any short-term capital gains) | | | $48,232,704 | | | | $94,156,613 | |
| Long-term capital gains | | | 78,623,046 | | | | 88,031,698 | |
| Total distributions | | | $126,855,750 | | | | $182,188,311 | |
The federal tax cost and the tax basis components of distributable earnings were as follows:
| | | | |
| As of 8/31/15 | | | |
| Cost of investments | | | $1,231,168,301 | |
| Gross appreciation | | | 243,774,956 | |
| Gross depreciation | | | (88,651,523 | ) |
| Net unrealized appreciation (depreciation) | | | $155,123,433 | |
| Capital loss carryforwards | | | (8,182,341 | ) |
| Late year ordinary loss deferral | | | (8,818,290 | ) |
| Other temporary differences | | | 264,169 | |
As of August 31, 2015, the fund had capital loss carryforwards available to offset future realized gains. Such losses are characterized as follows:
| | | | |
| Short-Term | | | $(7,287,652 | ) |
| Long-Term | | | (894,689 | ) |
| Total | | | $(8,182,341 | ) |
32
Notes to Financial Statements – continued
Under the Regulated Investment Company Modernization Act of 2010 (the “Act”), the above net capital losses may be carried forward indefinitely, and their character is retained as short-term and/or long-term losses. Previously, net capital losses were carried forward for eight years and treated as short-term losses.
Multiple Classes of Shares of Beneficial Interest – The fund offers multiple classes of shares, which differ in their respective distribution, service, and program manager fees. The fund’s income, realized and unrealized gain (loss), and common expenses are allocated to shareholders based on the daily net assets of each class. Dividends are declared separately for each class. Differences in per share dividend rates are generally due to differences in separate class expenses. Class B and Class 529B shares will convert to Class A and Class 529A shares, respectively, approximately eight years after purchase. The fund’s distributions declared to shareholders as reported in the Statements of Changes in Net Assets are presented by class as follows:
| | | | | | | | |
| | | From net realized gain on
investments | |
| | | Year
ended
8/31/15 | | | Year
ended
8/31/14 | |
| Class A | | | $37,499,564 | | | | $64,919,407 | |
| Class B | | | 2,602,265 | | | | 4,186,982 | |
| Class C | | | 10,467,996 | | | | 15,593,082 | |
| Class I | | | 23,496,764 | | | | 35,717,827 | |
| Class R1 | | | 677,901 | | | | 937,201 | |
| Class R2 | | | 4,749,388 | | | | 6,122,546 | |
| Class R3 | | | 10,116,834 | | | | 12,790,928 | |
| Class R4 | | | 15,023,639 | | | | 19,003,758 | |
| Class R5 | | | 21,708,105 | | | | 22,264,000 | |
| Class 529A | | | 376,407 | | | | 451,752 | |
| Class 529B | | | 29,302 | | | | 33,273 | |
| Class 529C | | | 107,585 | | | | 167,555 | |
| Total | | | $126,855,750 | | | | $182,188,311 | |
(3) Transactions with Affiliates
Investment Adviser – The fund has an investment advisory agreement with MFS to provide overall investment management and related administrative services and facilities to the fund. The management fee is computed daily and paid monthly at an annual rate of 0.90% of the fund’s average daily net assets. The investment adviser has agreed in writing to reduce its management fee to 0.80% of average daily net assets in excess of $1 billion up to $2.5 billion, 0.75% of average daily net assets in excess of $2.5 billion up to $5 billion, and 0.70% of average daily net assets in excess of $5 billion. This written agreement will continue until modified by the fund’s Board of Trustees, but such agreement will continue at least until December 31, 2016. For the year ended August 31, 2015, this management fee reduction amounted to $668,335, which is included in the reduction of total expenses in the Statement of Operations. MFS has also agreed in writing to reduce its management fee by a specified amount if certain MFS mutual fund assets exceed thresholds agreed to by MFS and the fund’s Board of Trustees. For the year ended August 31, 2015, this management fee
33
Notes to Financial Statements – continued
reduction amounted to $106,954, which is included in the reduction of total expenses in the Statement of Operations. The management fee incurred for the year ended August 31, 2015 was equivalent to an annual effective rate of 0.85% of the fund’s average daily net assets.
Distributor – MFS Fund Distributors, Inc. (MFD), a wholly-owned subsidiary of MFS, as distributor, received $213,380 and $2,422 for the year ended August 31, 2015, as its portion of the initial sales charge on sales of Class A and Class 529A shares of the fund, respectively.
The Board of Trustees has adopted a distribution plan for certain share classes pursuant to Rule 12b-1 of the Investment Company Act of 1940.
The fund’s distribution plan provides that the fund will pay MFD for services provided by MFD and financial intermediaries in connection with the distribution and servicing of certain share classes. One component of the plan is a distribution fee paid to MFD and another component of the plan is a service fee paid to MFD. MFD may subsequently pay all, or a portion, of the distribution and/or service fees to financial intermediaries.
Distribution Plan Fee Table:
| | | | | | | | | | | | | | | | | | | | |
| | | Distribution
Fee Rate (d) | | | Service
Fee Rate (d) | | | Total
Distribution
Plan (d) | | | Annual
Effective
Rate (e) | | | Distribution
and Service
Fee | |
| Class A | | | — | | | | 0.25% | | | | 0.25% | | | | 0.25% | | | | $1,260,124 | |
| Class B | | | 0.75% | | | | 0.25% | | | | 1.00% | | | | 1.00% | | | | 298,309 | |
| Class C | | | 0.75% | | | | 0.25% | | | | 1.00% | | | | 1.00% | | | | 1,187,944 | |
| Class R1 | | | 0.75% | | | | 0.25% | | | | 1.00% | | | | 1.00% | | | | 77,381 | |
| Class R2 | | | 0.25% | | | | 0.25% | | | | 0.50% | | | | 0.50% | | | | 306,860 | |
| Class R3 | | | — | | | | 0.25% | | | | 0.25% | | | | 0.25% | | | | 310,340 | |
| Class 529A | | | — | | | | 0.25% | | | | 0.25% | | | | 0.23% | | | | 12,934 | |
| Class 529B | | | 0.75% | | | | 0.25% | | | | 1.00% | | | | 0.98% | | | | 3,422 | |
| Class 529C | | | 0.75% | | | | 0.25% | | | | 1.00% | | | | 1.00% | | | | 13,158 | |
| Total Distribution and Service Fees | | | | $3,470,472 | |
| (d) | In accordance with the distribution plan for certain classes, the fund pays distribution and/or service fees equal to these annual percentage rates of each class’s average daily net assets. The distribution and service fee rates disclosed by class represent the current rates in effect at the end of the reporting period. Any rate changes, if applicable, are detailed below. |
| (e) | The annual effective rates represent actual fees incurred under the distribution plan for the year ended August 31, 2015 based on each class’s average daily net assets. MFD has voluntarily agreed to rebate a portion of each class’s 0.25% service fee attributable to accounts for which MFD retains the 0.25% service fee except for accounts attributable to MFS or its affiliates’ seed money. For the year ended August 31, 2015, this rebate amounted to $22,749, $705, $223, $1,160, $72, and $20 for Class A, Class B, Class C, Class 529A, Class 529B, and Class 529C, respectively, and is included in the reduction of total expenses in the Statement of Operations. |
Certain Class A shares are subject to a contingent deferred sales charge (CDSC) in the event of a shareholder redemption within 18 months of purchase. Class C and Class 529C shares are subject to a CDSC in the event of a shareholder redemption within 12 months of purchase. Class B and Class 529B shares are subject to a CDSC in the
34
Notes to Financial Statements – continued
event of a shareholder redemption within six years of purchase. All contingent deferred sales charges are paid to MFD and during the year ended August 31, 2015, were as follows:
| | | | |
| | | Amount | |
| Class A | | | $2,355 | |
| Class B | | | 88,820 | |
| Class C | | | 22,676 | |
| Class 529B | | | — | |
| Class 529C | | | 12 | |
The fund has entered into and may from time to time enter into contracts with program managers and other parties which administer the tuition programs through which an investment in the fund’s 529 share classes is made. The fund has entered into an agreement with MFD pursuant to which MFD receives an annual fee of up to 0.10% of the average daily net assets attributable to each 529 share class. MFD has agreed to waive a portion of this fee in an amount equal to 0.05% of the average daily net assets for each 529 share class. This waiver agreement will expire on December 31, 2016, unless MFD elects to extend the waiver. For the year ended August 31, 2015, this waiver amounted to $3,416 and is included in the reduction of total expenses in the Statement of Operations. The program manager fee incurred for the year ended August 31, 2015 was equivalent to an annual effective rate of 0.05% of the average daily net assets attributable to each 529 share class. The services provided by MFD, or a third party with which MFD contracts, include recordkeeping and tax reporting and account services, as well as services designed to maintain the program’s compliance with the Internal Revenue Code and other regulatory requirements. Program manager fees and waivers for the year ended August 31, 2015, were as follows:
| | | | | | | | |
| | | Fee | | | Waiver | |
| Class 529A | | | $5,174 | | | | $2,587 | |
| Class 529B | | | 342 | | | | 171 | |
| Class 529C | | | 1,316 | | | | 658 | |
| Total Program Manager Fees and Waivers | | | $6,832 | | | | $3,416 | |
Shareholder Servicing Agent – MFS Service Center, Inc. (MFSC), a wholly-owned subsidiary of MFS, receives a fee from the fund for its services as shareholder servicing agent calculated as a percentage of the average daily net assets of the fund as determined periodically under the supervision of the fund’s Board of Trustees. For the year ended August 31, 2015, the fee was $234,652, which equated to 0.0141% annually of the fund’s average daily net assets. MFSC also receives payment from the fund for out-of-pocket expenses, sub-accounting and other shareholder servicing costs which may be paid to affiliated and unaffiliated service providers. Class R5 shares do not incur sub-accounting fees. For the year ended August 31, 2015, these out-of-pocket expenses, sub-accounting and other shareholder servicing costs amounted to $1,949,633.
Administrator – MFS provides certain financial, legal, shareholder communications, compliance, and other administrative services to the fund. Under an administrative services agreement, the fund reimburses MFS the costs incurred to provide these services. The fund is charged an annual fixed amount of $17,500 plus a fee based on
35
Notes to Financial Statements – continued
average daily net assets. The administrative services fee incurred for the year ended August 31, 2015 was equivalent to an annual effective rate of 0.0165% of the fund’s average daily net assets.
Trustees’ and Officers’ Compensation – The fund pays compensation to independent Trustees in the form of a retainer, attendance fees, and additional compensation to Board and Committee chairpersons. The fund does not pay compensation directly to Trustees or officers of the fund who are also officers of the investment adviser, all of whom receive remuneration for their services to the fund from MFS. Certain officers and Trustees of the fund are officers or directors of MFS, MFD, and MFSC.
Prior to December 31, 2001, the fund had an unfunded defined benefit plan (“DB plan”) for independent Trustees. As of December 31, 2001, the Board took action to terminate the DB plan with respect to then-current and any future independent Trustees, such that the DB plan covers only certain of those former independent Trustees who retired on or before December 31, 2001. The DB plan resulted in a pension expense of $392 and is included in “Independent Trustees’ compensation” in the Statement of Operations for the year ended August 31, 2015. The liability for deferred retirement benefits payable to certain independent Trustees under the DB plan amounted to $3,182 at August 31, 2015, and is included in “Payable for independent Trustees’ compensation” in the Statement of Assets and Liabilities.
Other – Effective November 1, 2014, this fund and certain other funds managed by MFS (the funds) have entered into a service agreement (the ISO Agreement) which provides for payment of fees solely by the funds to Tarantino LLC in return for the provision of services of an Independent Senior Officer (ISO) for the funds. Frank L. Tarantino serves as the ISO and is an officer of the funds and the sole member of Tarantino LLC. The funds can terminate the ISO Agreement with Tarantino LLC at any time under the terms of the ISO Agreement. Prior to November 1, 2014, the funds had entered into a service agreement (the Compliance Officer Agreement) which provided for payment of fees by the funds to Tarantino LLC in return for the provision of services of an Independent Chief Compliance Officer (ICCO) for the funds. Prior to November 1, 2014, Frank L. Tarantino served as the ICCO. Effective October 31, 2014, Mr. Tarantino resigned as ICCO and the Compliance Officer Agreement between the funds and Tarantino LLC was terminated. For the year ended August 31, 2015, the aggregate fees paid by the fund under these agreements were $6,773 and are included in “Miscellaneous” expense in the Statement of Operations. MFS had agreed to reimburse the fund for a portion of the payments made by the fund for the services under the Compliance Officer Agreement in the amount of $665, which is included in the reduction of total expenses in the Statement of Operations. Additionally, MFS has agreed to bear all expenses associated with office space, other administrative support, and supplies provided to the ICCO and ISO.
The fund invests in the MFS Institutional Money Market Portfolio which is managed by MFS and seeks current income consistent with preservation of capital and liquidity. Income earned on this investment is included in “Dividends from underlying affiliated funds” in the Statement of Operations. This money market fund does not pay a management fee to MFS.
36
Notes to Financial Statements – continued
On September 11, 2013, MFS redeemed 5,066 shares of Class R5 for an aggregate amount of $148,181.
(4) Portfolio Securities
For the year ended August 31, 2015, purchases and sales of investments, other than short-term obligations, aggregated $918,620,934 and $1,649,579,287, respectively.
(5) Shares of Beneficial Interest
The fund’s Declaration of Trust permits the Trustees to issue an unlimited number of full and fractional shares of beneficial interest. Transactions in fund shares were as follows:
| | | | | | | | | | | | | | | | |
| | | Year ended
8/31/15 | | | Year ended
8/31/14 | |
| | | Shares | | | Amount | | | Shares | | | Amount | |
| Shares sold | | | | | | | | | | | | | | | | |
Class A | | | 4,144,692 | | | | $100,103,569 | | | | 7,663,272 | | | | $202,602,844 | |
Class B | | | 175,489 | | | | 3,625,737 | | | | 302,403 | | | | 6,974,766 | |
Class C | | | 742,719 | | | | 15,178,365 | | | | 1,723,327 | | | | 39,755,016 | |
Class I | | | 3,011,530 | | | | 78,476,753 | | | | 9,806,541 | | | | 275,081,634 | |
Class R1 | | | 70,933 | | | | 1,450,640 | | | | 106,194 | | | | 2,417,551 | |
Class R2 | | | 714,972 | | | | 16,565,026 | | | | 1,059,827 | | | | 26,814,007 | |
Class R3 | | | 1,423,934 | | | | 34,307,059 | | | | 3,285,711 | | | | 86,307,510 | |
Class R4 | | | 1,553,724 | | | | 38,585,743 | | | | 3,655,137 | | | | 99,348,416 | |
Class R5 | | | 1,487,646 | | | | 38,041,848 | | | | 2,964,479 | | | | 81,129,522 | |
Class 529A | | | 26,760 | | | | 623,232 | | | | 47,165 | | | | 1,207,593 | |
Class 529B | | | 2,301 | | | | 46,115 | | | | 4,218 | | | | 94,274 | |
Class 529C | | | 17,128 | | | | 335,609 | | | | 12,166 | | | | 272,203 | |
| | | 13,371,828 | | | | $327,339,696 | | | | 30,630,440 | | | | $822,005,336 | |
| | | | |
| Shares issued to shareholders in reinvestment of distributions | | | | | | | | | | | | | | | | |
Class A | | | 1,510,902 | | | | $33,904,606 | | | | 2,328,346 | | | | $59,512,523 | |
Class B | | | 119,940 | | | | 2,292,057 | | | | 163,157 | | | | 3,625,353 | |
Class C | | | 419,267 | | | | 8,028,972 | | | | 515,039 | | | | 11,464,768 | |
Class I | | | 673,187 | | | | 16,371,901 | | | | 902,424 | | | | 24,789,597 | |
Class R1 | | | 35,698 | | | | 677,901 | | | | 42,426 | | | | 937,201 | |
Class R2 | | | 201,430 | | | | 4,320,672 | | | | 223,362 | | | | 5,490,231 | |
Class R3 | | | 451,241 | | | | 10,116,834 | | | | 500,819 | | | | 12,790,928 | |
Class R4 | | | 641,547 | | | | 14,922,377 | | | | 718,763 | | | | 18,939,409 | |
Class R5 | | | 889,676 | | | | 21,708,105 | | | | 809,012 | | | | 22,264,000 | |
Class 529A | | | 17,266 | | | | 376,407 | | | | 18,150 | | | | 451,745 | |
Class 529B | | | 1,580 | | | | 29,302 | | | | 1,539 | | | | 33,273 | |
Class 529C | | | 5,800 | | | | 107,585 | | | | 7,745 | | | | 167,520 | |
| | | 4,967,534 | | | | $112,856,719 | | | | 6,230,782 | | | | $160,466,548 | |
37
Notes to Financial Statements – continued
| | | | | | | | | | | | | | | | |
| | | Year ended
8/31/15 | | | Year ended
8/31/14 | |
| | | Shares | | | Amount | | | Shares | | | Amount | |
| Shares reacquired | | | | | | | | | | | | | | | | |
Class A | | | (10,703,341 | ) | | | $(256,026,622 | ) | | | (19,125,143 | ) | | | $(506,940,419 | ) |
Class B | | | (514,205 | ) | | | (10,538,072 | ) | | | (541,566 | ) | | | (12,107,368 | ) |
Class C | | | (2,305,752 | ) | | | (47,206,923 | ) | | | (1,827,747 | ) | | | (40,779,135 | ) |
Class I | | | (14,842,562 | ) | | | (386,712,298 | ) | | | (6,437,022 | ) | | | (178,077,081 | ) |
Class R1 | | | (164,487 | ) | | | (3,369,134 | ) | | | (156,327 | ) | | | (3,527,623 | ) |
Class R2 | | | (1,126,756 | ) | | | (25,995,346 | ) | | | (970,658 | ) | | | (24,347,286 | ) |
Class R3 | | | (3,990,902 | ) | | | (96,230,924 | ) | | | (2,161,380 | ) | | | (55,844,205 | ) |
Class R4 | | | (5,121,872 | ) | | | (128,381,052 | ) | | | (3,085,619 | ) | | | (82,182,423 | ) |
Class R5 | | | (1,853,449 | ) | | | (49,110,314 | ) | | | (1,025,858 | ) | | | (28,960,837 | ) |
Class 529A | | | (27,758 | ) | | | (646,408 | ) | | | (36,759 | ) | | | (920,840 | ) |
Class 529B | | | (2,610 | ) | | | (51,738 | ) | | | (2,976 | ) | | | (65,601 | ) |
Class 529C | | | (8,936 | ) | | | (173,488 | ) | | | (28,105 | ) | | | (617,796 | ) |
| | | (40,662,630 | ) | | | $(1,004,442,319 | ) | | | (35,399,160 | ) | | | $(934,370,614 | ) |
| | | | |
| Net change | | | | | | | | | | | | | | | | |
Class A | | | (5,047,747 | ) | | | $(122,018,447 | ) | | | (9,133,525 | ) | | | $(244,825,052 | ) |
Class B | | | (218,776 | ) | | | (4,620,278 | ) | | | (76,006 | ) | | | (1,507,249 | ) |
Class C | | | (1,143,766 | ) | | | (23,999,586 | ) | | | 410,619 | | | | 10,440,649 | |
Class I | | | (11,157,845 | ) | | | (291,863,644 | ) | | | 4,271,943 | | | | 121,794,150 | |
Class R1 | | | (57,856 | ) | | | (1,240,593 | ) | | | (7,707 | ) | | | (172,871 | ) |
Class R2 | | | (210,354 | ) | | | (5,109,648 | ) | | | 312,531 | | | | 7,956,952 | |
Class R3 | | | (2,115,727 | ) | | | (51,807,031 | ) | | | 1,625,150 | | | | 43,254,233 | |
Class R4 | | | (2,926,601 | ) | | | (74,872,932 | ) | | | 1,288,281 | | | | 36,105,402 | |
Class R5 | | | 523,873 | | | | 10,639,639 | | | | 2,747,633 | | | | 74,432,685 | |
Class 529A | | | 16,268 | | | | 353,231 | | | | 28,556 | | | | 738,498 | |
Class 529B | | | 1,271 | | | | 23,679 | | | | 2,781 | | | | 61,946 | |
Class 529C | | | 13,992 | | | | 269,706 | | | | (8,194 | ) | | | (178,073 | ) |
| | | (22,323,268 | ) | | | $(564,245,904 | ) | | | 1,462,062 | | | | $48,101,270 | |
The fund is one of several mutual funds in which certain MFS funds may invest. The MFS funds do not invest in the underlying funds for the purpose of exercising management or control. At the end of the period, the MFS Growth Allocation Fund, the MFS Moderate Allocation Fund, the MFS Aggressive Growth Allocation Fund, and the MFS Conservative Allocation Fund were the owners of record of approximately 7%, 7%, 3%, and 2%, respectively, of the value of outstanding voting shares of the fund. In addition, the MFS Lifetime 2015 Fund, the MFS Lifetime 2020 Fund, the MFS Lifetime 2025 Fund, the MFS Lifetime 2030 Fund, the MFS Lifetime 2035 Fund, the MFS Lifetime 2040 Fund, the MFS Lifetime 2045 Fund, the MFS Lifetime 2050 Fund, the MFS Lifetime 2055 Fund, and the MFS Lifetime Income Fund were each the owners of record of less than 1% of the value of outstanding voting shares of the fund.
(6) Line of Credit
The fund and certain other funds managed by MFS participate in a $1.25 billion unsecured committed line of credit, subject to a $1 billion sublimit, provided by a
38
Notes to Financial Statements – continued
syndication of banks under a credit agreement. Borrowings may be made for temporary financing needs. Interest is charged to each fund, based on its borrowings, generally at a rate equal to the higher of the Overnight Federal Reserve funds rate or daily one month LIBOR plus an agreed upon spread. A commitment fee, based on the average daily, unused portion of the committed line of credit, is allocated among the participating funds at the end of each calendar quarter. In addition, the fund and other funds managed by MFS have established unsecured uncommitted borrowing arrangements with certain banks for temporary financing needs. Interest is charged to each fund, based on its borrowings, at a rate equal to the Overnight Federal Reserve funds rate plus an agreed upon spread. For the year ended August 31, 2015, the fund’s commitment fee and interest expense were $6,080 and $0, respectively, and are included in “Miscellaneous” expense in the Statement of Operations.
(7) Transactions in Underlying Affiliated Funds-Affiliated Issuers
An affiliated issuer may be considered one in which the fund owns 5% or more of the outstanding voting securities, or a company which is under common control. For the purposes of this report, the fund assumes the following to be affiliated issuers:
| | | | | | | | | | | | | | | | |
| Underlying Affiliated Fund | | Beginning
Shares/Par
Amount | | | Acquisitions
Shares/Par
Amount | | | Dispositions
Shares/Par
Amount | | | Ending
Shares/Par
Amount | |
MFS Institutional Money
Market Portfolio | | | 1,739,356 | | | | 552,531,557 | | | | (529,797,056 | ) | | | 24,473,857 | |
| | | | |
| Underlying Affiliated Fund | | Realized
Gain (Loss) | | | Capital Gain
Distributions | | | Dividend
Income | | | Ending
Value | |
MFS Institutional Money
Market Portfolio | | | $— | | | | $— | | | | $15,085 | | | | $24,473,857 | |
| | | | |
| Other Affiliated Issuers | | Beginning Shares/Par
Amount | | | Acquisitions
Shares/Par
Amount | | | Dispositions
Shares/Par
Amount | | | Ending
Shares/Par
Amount | |
| Fenix Parts, Inc. | | | — | | | | 1,338,451 | | | | — | | | | 1,338,451 | |
| | | | |
| Other Affiliated Issuers | | Realized
Gain (Loss) | | | Capital Gain
Distributions | | | Dividend
Income | | | Ending
Value | |
| Fenix Parts, Inc. | | | $— | | | | $— | | | | $— | | | | $13,344,356 | |
39
REPORT OF INDEPENDENT REGISTERED PUBLIC ACCOUNTING FIRM
To the Board of Trustees of MFS Series Trust I and Shareholders of MFS New Discovery Fund:
We have audited the accompanying statement of assets and liabilities of MFS New Discovery Fund (the Fund) (one of the series constituting MFS Series Trust I), including the portfolio of investments, as of August 31, 2015, and the related statement of operations for the year then ended, the statements of changes in net assets for each of the two years in the period then ended and the financial highlights for each of the periods indicated therein. These financial statements and financial highlights are the responsibility of the Fund’s management. Our responsibility is to express an opinion on these financial statements and financial highlights based on our audits.
We conducted our audits in accordance with the standards of the Public Company Accounting Oversight Board (United States). Those standards require that we plan and perform the audit to obtain reasonable assurance about whether the financial statements and financial highlights are free of material misstatement. We were not engaged to perform an audit of the Fund’s internal control over financial reporting. Our audits included consideration of internal control over financial reporting as a basis for designing audit procedures that are appropriate in the circumstances, but not for the purpose of expressing an opinion on the effectiveness of the Fund’s internal control over financial reporting. Accordingly, we express no such opinion. An audit also includes examining, on a test basis, evidence supporting the amounts and disclosures in the financial statements and financial highlights, assessing the accounting principles used and significant estimates made by management, and evaluating the overall financial statement presentation. Our procedures included confirmation of securities owned as of August 31, 2015, by correspondence with the custodian and others or by other appropriate auditing procedures where replies from others were not received. We believe that our audits provide a reasonable basis for our opinion.
In our opinion, the financial statements and financial highlights referred to above present fairly, in all material respects, the financial position of MFS New Discovery Fund (one of the series constituting MFS Series Trust I) at August 31, 2015, the results of its operations for the year then ended, the changes in its net assets for each of the two years in the period then ended and the financial highlights for each of the periods indicated therein, in conformity with U.S. generally accepted accounting principles.

Boston, Massachusetts
October 15, 2015
40
TRUSTEES AND OFFICERS — IDENTIFICATION AND BACKGROUND
The Trustees and Officers of the Trust, as of October 1, 2015, are listed below, together with their principal occupations during the past five years. (Their titles may have varied during that period.) The address of each Trustee and Officer is 111 Huntington Avenue, Boston, Massachusetts 02199-7618.
| | | | | | | | |
Name, Age | | Position(s) Held with Fund | | Trustee/Officer
Since (h) | | Principal
Occupations During the Past Five Years | | Other Directorships (j) |
| INTERESTED TRUSTEES |
Robert J. Manning (k) (age 51) | | Trustee | | February 2004 | | Massachusetts Financial Services Company, Chairman, Co-Chief Executive Officer and Director; Chief Investment Officer (until 2010) | | N/A |
Robin A. Stelmach (k) (age 54) | | Trustee and President | | January 2014 | | Massachusetts Financial Services Company, Executive Vice President and Chief Operating Officer | | N/A |
| INDEPENDENT TRUSTEES | | | | | | |
David H. Gunning (age 73) | | Trustee and Chair of Trustees | | January 2004 | | Private investor | | Lincoln Electric Holdings, Inc., Director; Development Alternatives, Inc., Director/Non-Executive Chairman |
Steven E. Buller (age 64) | | Trustee | | February 2014 | | Chairman, Financial Accounting Standards Advisory Council; Standing Advisory Group, Public Company Accounting Oversight Board, Member (until 2014); BlackRock, Inc. (investment management), Managing Director (until 2014), BlackRock Finco UK (investment management), Director (until 2014) | | N/A |
Robert E. Butler (age 73) | | Trustee | | January 2006 | | Consultant – investment company industry regulatory and compliance matters | | N/A |
41
Trustees and Officers – continued
| | | | | | | | |
Name, Age | | Position(s) Held with Fund | | Trustee/Officer
Since (h) | | Principal
Occupations During the Past Five Years | | Other Directorships (j) |
Maureen R. Goldfarb (age 60) | | Trustee | | January 2009 | | Private investor | | N/A |
William R. Gutow (age 74) | | Trustee | | December 1993 | | Private investor and real estate consultant; Capitol Entertainment Management Company (video franchise), Vice Chairman | | Texas Donuts, Vice Chairman (until 2010) |
Michael Hegarty (age 70) | | Trustee | | December 2004 | | Private investor | | Rouse Properties Inc., Director; Capmark Financial Group Inc., Director |
John P. Kavanaugh (age 60) | | Trustee | | January 2009 | | Private investor | | N/A |
Maryanne L. Roepke (age 59) | | Trustee | | May 2014 | | American Century Investments (investment management), Senior Vice President and Chief Compliance Officer (until 2014) | | N/A |
Laurie J. Thomsen (age 58) | | Trustee | | March 2005 | | Private investor; New Profit, Inc. (venture philanthropy), Executive Partner (until 2010) | | The Travelers Companies, Director; Dycom Industries, Inc. |
Robert W. Uek (age 74) | | Trustee | | January 2006 | | Consultant to investment company industry | | N/A |
| OFFICERS | | | | | | |
Christopher R. Bohane (k) (age 41) | | Assistant Secretary and Assistant Clerk | | July 2005 | | Massachusetts Financial Services Company, Vice President and Assistant General Counsel | | N/A |
Kino Clark (k) (age 47) | | Assistant Treasurer | | January 2012 | | Massachusetts Financial Services Company, Vice President | | N/A |
Kristin V. Collins (k) (age 42) | | Assistant Secretary and Assistant Clerk | | September 2015 | | Massachusetts Financial Services Company, Vice President and Assistant General Counsel | | N/A |
42
Trustees and Officers – continued
| | | | | | | | |
Name, Age | | Position(s) Held with Fund | | Trustee/Officer
Since (h) | | Principal
Occupations During the Past Five Years | | Other Directorships (j) |
Thomas H. Connors (k) (age 56) | | Assistant Secretary and Assistant Clerk | | September 2012 | | Massachusetts Financial Services Company, Vice President and Senior Counsel; Deutsche Investment Management Americas Inc. (financial service provider), Director and Senior Counsel (until 2012) | | N/A |
Ethan D. Corey (k) (age 51) | | Assistant Secretary and Assistant Clerk | | July 2005 | | Massachusetts Financial Services Company, Senior Vice President and Associate General Counsel | | N/A |
David L. DiLorenzo (k) (age 47) | | Treasurer | | July 2005 | | Massachusetts Financial Services Company, Senior Vice President | | N/A |
Susan S. Newton (k) (age 65) | | Assistant Secretary and Assistant Clerk | | May 2005 | | Massachusetts Financial Services Company, Senior Vice President and Associate General Counsel | | N/A |
Kenneth Paek (k) (age 41) | | Assistant Treasurer | | February 2015 | | Massachusetts Financial Services Company, Vice President; Cohen & Steers, Vice President/Head of Fund Administration (until 2014) | | N/A |
Susan A. Pereira (k) (age 44) | | Assistant Secretary and Assistant Clerk | | July 2005 | | Massachusetts Financial Services Company, Vice President and Senior Counsel | | N/A |
Kasey L. Phillips (k) (age 44) | | Assistant Treasurer | | September 2012 | | Massachusetts Financial Services Company, Vice President; Wells Fargo Funds Management, LLC, Senior Vice President, Fund Treasurer (until 2012) | | N/A |
43
Trustees and Officers – continued
| | | | | | | | |
Name, Age | | Position(s) Held with Fund | | Trustee/Officer
Since (h) | | Principal
Occupations During the Past Five Years | | Other Directorships (j) |
Mark N. Polebaum (k) (age 63) | | Secretary and Clerk | | January 2006 | | Massachusetts Financial Services Company, Executive Vice President, General Counsel and Secretary | | N/A |
Matthew A. Stowe (k) (age 40) | | Assistant Secretary and Assistant Clerk | | October 2014 | | Massachusetts Financial Services Company, Vice President and Assistant General Counsel | | N/A |
Frank L. Tarantino (age 71) | | Independent Senior Officer | | June 2004 | | Tarantino LLC (provider of compliance services), Principal | | N/A |
Richard S. Weitzel (k) (age 45) | | Assistant Secretary and Assistant Clerk | | October 2007 | | Massachusetts Financial Services Company, Senior Vice President and Associate General Counsel | | N/A |
Martin J. Wolin (k) (age 48) | | Chief Compliance Officer | | July 2015 | | Massachusetts Financial Services Company, Senior Vice President and Chief Compliance Officer (since July 2015); Mercer (financial service provider), Chief Risk and Compliance Officer, North America and Latin America (until June 2015) | | N/A |
James O. Yost (k) (age 55) | | Deputy Treasurer | | September 1990 | | Massachusetts Financial Services Company, Senior Vice President | | N/A |
| (h) | Date first appointed to serve as Trustee/officer of an MFS Fund. Each Trustee has served continuously since appointment unless indicated otherwise. For the period from December 15, 2004 until February 22, 2005, Mr. Manning served as Advisory Trustee. Prior to January 2012, Messrs. DiLorenzo and Yost served as Assistant Treasurers of the Funds. Ms. Stelmach was appointed as President of the Funds as of October 1, 2014. |
| (j) | Directorships or trusteeships of companies required to report to the Securities and Exchange Commission (i.e., “public companies”). |
| (k) | “Interested person” of the Trust within the meaning of the Investment Company Act of 1940 (referred to as the 1940 Act), which is the principal federal law governing investment companies like the fund, as a result of a position with MFS. The address of MFS is 111 Huntington Avenue, Boston, Massachusetts 02199-7618. |
44
Trustees and Officers – continued
Each Trustee (except Ms. Stelmach, Mr. Buller and Ms. Roepke) has been elected by shareholders and each Trustee and officer holds office until his or her successor is chosen and qualified or until his or her earlier death, resignation, retirement or removal. The Trust does not hold annual meetings for the purpose of electing Trustees, and Trustees are not elected for fixed terms. Messrs. Butler, Kavanaugh, Uek and Mses. Thomsen and Roepke are members of the Trust’s Audit Committee.
Each of the Fund’s Trustees and officers holds comparable positions with certain other funds of which MFS or a subsidiary is the investment adviser or distributor, and, in the case of the officers, with certain affiliates of MFS. As of October 1, 2015, the Trustees served as board members of 138 funds within the MFS Family of Funds.
The Statement of Additional Information for a Fund includes further information about the Trustees and is available without charge upon request by calling 1-800-225-2606.
| | |
| Investment Adviser | | Custodian |
Massachusetts Financial Services Company
111 Huntington Avenue
Boston, MA 02199-7618 | | State Street Bank and Trust Company 1 Lincoln Street Boston, MA 02111-2900 |
| Distributor | | Independent Registered Public Accounting Firm |
MFS Fund Distributors, Inc.
111 Huntington Avenue
Boston, MA 02199-7618 | | Ernst & Young LLP 200 Clarendon Street Boston, MA 02116 |
| Portfolio Managers | | |
Paul Gordon Michael Grossman | | |
45
BOARD REVIEW OF INVESTMENT ADVISORY AGREEMENT
The Investment Company Act of 1940 requires that both the full Board of Trustees and a majority of the non-interested (“independent”) Trustees, voting separately, annually approve the continuation of the Fund’s investment advisory agreement with MFS. The Trustees consider matters bearing on the Fund and its advisory arrangements at their meetings throughout the year, including a review of performance data at each regular meeting. In addition, the independent Trustees met several times over the course of three months beginning in May and ending in July, 2015 (“contract review meetings”) for the specific purpose of considering whether to approve the continuation of the investment advisory agreement for the Fund and the other investment companies that the Board oversees (the “MFS Funds”). The independent Trustees were assisted in their evaluation of the Fund’s investment advisory agreement by independent legal counsel, from whom they received separate legal advice and with whom they met separately from MFS during various contract review meetings. The independent Trustees were also assisted in this process by the MFS Funds’ Independent Senior Officer, a senior officer appointed by and reporting to the independent Trustees.
In connection with their deliberations regarding the continuation of the investment advisory agreement, the Trustees, including the independent Trustees, considered such information and factors as they believed, in light of the legal advice furnished to them and their own business judgment, to be relevant. The investment advisory agreement for the Fund was considered separately, although the Trustees also took into account the common interests of all MFS Funds in their review. As described below, the Trustees considered the nature, quality, and extent of the various investment advisory, administrative, and shareholder services performed by MFS under the existing investment advisory agreement and other arrangements with the Fund.
In connection with their contract review meetings, the Trustees received and relied upon materials that included, among other items: (i) information provided by Lipper Inc., an independent third party, on the investment performance of the Fund for various time periods ended December 31, 2014 and the investment performance of a group of funds with substantially similar investment classifications/objectives (the “Lipper performance universe”), (ii) information provided by Lipper Inc. on the Fund’s advisory fees and other expenses and the advisory fees and other expenses of comparable funds identified by Lipper Inc. (the “Lipper expense group”), (iii) information provided by MFS on the advisory fees of comparable portfolios of other clients of MFS, including institutional separate accounts and other clients, (iv) information as to whether and to what extent applicable expense waivers, reimbursements or fee “breakpoints” are observed for the Fund, (v) information regarding MFS’ financial results and financial condition, including MFS’ and certain of its affiliates’ estimated profitability from services performed for the Fund and the MFS Funds as a whole, and compared to MFS’ institutional business, (vi) MFS’ views regarding the outlook for the mutual fund industry and the strategic business plans of MFS, (vii) descriptions of various functions performed by MFS for the Funds, such as compliance monitoring and portfolio trading practices, and (viii) information regarding the overall organization of MFS, including information about MFS’ senior management and other personnel providing investment advisory, administrative and other services to
46
Board Review of Investment Advisory Agreement – continued
the Fund and the other MFS Funds. The comparative performance, fee and expense information prepared and provided by Lipper Inc. was not independently verified and the independent Trustees did not independently verify any information provided to them by MFS.
The Trustees’ conclusion as to the continuation of the investment advisory agreement was based on a comprehensive consideration of all information provided to the Trustees and not the result of any single factor. Some of the factors that figured particularly in the Trustees’ deliberations are described below, although individual Trustees may have evaluated the information presented differently from one another, giving different weights to various factors. It is also important to recognize that the fee arrangements for the Fund and other MFS Funds are the result of years of review and discussion between the independent Trustees and MFS, that certain aspects of such arrangements may receive greater scrutiny in some years than in others, and that the Trustees’ conclusions may be based, in part, on their consideration of these same arrangements during the course of the year and in prior years.
Based on information provided by Lipper Inc. and MFS, the Trustees reviewed the Fund’s total return investment performance as well as the performance of peer groups of funds over various time periods. The Trustees placed particular emphasis on the total return performance of the Fund’s Class A shares in comparison to the performance of funds in its Lipper performance universe over the three-year period ended December 31, 2014, which the Trustees believed was a long enough period to reflect differing market conditions. The total return performance of the Fund’s Class A shares was in the 4th quintile relative to the other funds in the universe for this three-year period (the 1st quintile being the best performers and the 5th quintile being the worst performers). The total return performance of the Fund’s Class A shares was in the 5th quintile for each of the one- and five-year periods ended December 31, 2014 relative to the Lipper performance universe. Because of the passage of time, these performance results may differ from the performance results for more recent periods, including those shown elsewhere in this report.
The Trustees expressed continued concern to MFS about the substandard investment performance of the Fund. In the course of their deliberations, the Trustees took into account information provided by MFS in connection with the contract review meetings, as well as during investment review meetings conducted with portfolio management personnel during the course of the year, as to MFS’ efforts to improve the Fund’s performance, including replacing one portfolio manager in 2014. In addition, the Trustees requested that they receive a separate update on the Fund’s performance at each of their regular meetings. After reviewing these and related factors, the Trustees concluded, within the context of their overall conclusions regarding the investment advisory agreement, that MFS’ responses and efforts and plans to improve investment performance were sufficient to support approval of the continuance of the investment advisory agreement for an additional one-year period, but that they would continue to closely monitor the performance of the Fund.
In assessing the reasonableness of the Fund’s advisory fee, the Trustees considered, among other information, the Fund’s advisory fee and the total expense ratio of the Fund’s Class A shares as a percentage of average daily net assets and the advisory fee
47
Board Review of Investment Advisory Agreement – continued
and total expense ratios of peer groups of funds based on information provided by Lipper Inc. The Trustees considered that, according to the Lipper data (which takes into account any fee reductions or expense limitations that were in effect during the Fund’s last fiscal year), the Fund’s effective advisory fee rate was higher than the Lipper expense group median and the Fund’s total expense ratio was approximately at the Lipper expense group median.
The Trustees also considered the advisory fees charged by MFS to any institutional separate accounts advised by MFS (“separate accounts”) and unaffiliated investment companies for which MFS serves as subadviser (“subadvised funds”) that have comparable investment strategies to the Fund. In comparing these fees, the Trustees considered information provided by MFS as to the generally broader scope of services provided by MFS to the Fund, as well as the more extensive regulatory burdens imposed on MFS in managing the Fund, in comparison to separate accounts and subadvised funds. The Trustees also considered the higher demands placed on MFS’ investment personnel and trading infrastructure as a result of the daily cash in-flows and out-flows of the Fund in comparison to separate accounts.
The Trustees also considered whether the Fund may benefit from any economies of scale in the management of the Fund in the event of growth in assets of the Fund and/or growth in assets of the MFS Funds as a whole. They noted that MFS has agreed in writing to reduce its advisory fee rate on the Fund’s average daily net assets over $1 billion, $2.5 billion and $5 billion, which may not be changed without the Trustees’ approval. The Trustees also noted that MFS has agreed in writing to waive a portion of the management fees of certain MFS Funds, including the Fund, if the total combined assets of certain funds within the MFS Funds’ complex increase above agreed upon thresholds (the “group fee waiver”), enabling the Fund’s shareholders to share in the benefits from any economies of scale at the complex level. The group fee waiver is reviewed and renewed annually between the Board and MFS. The Trustees concluded that the breakpoints and the group fee waiver were sufficient to allow the Fund to benefit from economies of scale as its assets and overall complex assets grow.
The Trustees also considered information prepared by MFS relating to MFS’ costs and profits with respect to the Fund, the MFS Funds considered as a group, and other investment companies and accounts advised by MFS, as well as MFS’ methodologies used to determine and allocate its costs to the MFS Funds, the Fund and other accounts and products for purposes of estimating profitability.
After reviewing these and other factors described herein, the Trustees concluded, within the context of their overall conclusions regarding the investment advisory agreement, that the advisory fees charged to the Fund represent reasonable compensation in light of the services being provided by MFS to the Fund.
In addition, the Trustees considered MFS’ resources and related efforts to continue to retain, attract and motivate capable personnel to serve the Fund. The Trustees also considered current and developing conditions in the financial services industry, including the presence of large and well-capitalized companies which are spending, and appear to be prepared to continue to spend, substantial sums to engage personnel and to provide services to competing investment companies. In this regard, the Trustees also considered the financial resources of MFS and its ultimate parent,
48
Board Review of Investment Advisory Agreement – continued
Sun Life Financial Inc. The Trustees also considered the advantages and possible disadvantages to the Fund of having an adviser that also serves other investment companies as well as other accounts.
The Trustees also considered the nature, quality, cost, and extent of administrative, transfer agency, and distribution services provided to the Fund by MFS and its affiliates under agreements and plans other than the investment advisory agreement, including any 12b-1 fees the Fund pays to MFS Fund Distributors, Inc., an affiliate of MFS. The Trustees also considered the nature, extent and quality of certain other services MFS performs or arranges for on the Fund’s behalf, which may include securities lending programs, directed expense payment programs, class action recovery programs, and MFS’ interaction with third-party service providers, principally custodians and sub-custodians. The Trustees concluded that the various non-advisory services provided by MFS and its affiliates on behalf of the Fund were satisfactory.
The Trustees also considered benefits to MFS from the use of the Fund’s portfolio brokerage commissions, if applicable, to pay for investment research and various other factors. Additionally, the Trustees considered so-called “fall-out benefits” to MFS such as reputational value derived from serving as investment manager to the Fund.
Based on their evaluation of factors that they deemed to be material, including those factors described above, the Board of Trustees, including the independent Trustees, concluded that the Fund’s investment advisory agreement with MFS should be continued for an additional one-year period, commencing August 1, 2015.
49
PROXY VOTING POLICIES AND INFORMATION
MFS votes proxies on behalf of the fund pursuant to proxy voting policies and procedures that are available without charge, upon request, by calling 1-800-225-2606, by visiting the Proxy Voting section of mfs.com or by visiting the SEC’s Web site at http://www.sec.gov.
Information regarding how the fund voted proxies relating to portfolio securities during the most recent twelve-month period ended June 30 is available without charge by visiting the Proxy Voting section of mfs.com or by visiting the SEC’s Web site at http://www.sec.gov.
QUARTERLY PORTFOLIO DISCLOSURE
The fund will file a complete schedule of portfolio holdings with the Securities and Exchange Commission (the Commission) for the first and third quarters of each fiscal year on Form N-Q. A shareholder can obtain the quarterly portfolio holdings report at mfs.com. The fund’s Form N-Q is also available on the EDGAR database on the Commission’s Internet Web site at http://www.sec.gov, and may be reviewed and copied at the:
Public Reference Room
Securities and Exchange Commission
100 F Street, NE, Room 1580
Washington, D.C. 20549
Information on the operation of the Public Reference Room may be obtained by calling the Commission at 1-800-SEC-0330. Copies of the fund’s Form N-Q also may be obtained, upon payment of a duplicating fee, by electronic request at the following e-mail address: publicinfo@sec.gov or by writing the Public Reference Section at the above address.
FURTHER INFORMATION
From time to time, MFS may post important information about the fund or the MFS funds on the MFS web site (mfs.com). This information is available by visiting the “Market Commentary” and “Announcements” sub sections in the “Market Outlooks” section of mfs.com or by clicking on the fund’s name under “Mutual Funds” in the “Products” section of mfs.com.
FEDERAL TAX INFORMATION (unaudited)
The fund will notify shareholders of amounts for use in preparing 2015 income tax forms in January 2016.The following information is provided pursuant to provisions of the Internal Revenue Code.
The fund designates the maximum amount allowable as qualified dividend income eligible to be taxed at the same rate as long-term capital gain.
The fund designates $86,486,000 as capital gain dividends paid during the fiscal year.
For corporate shareholders, 5.08% of the ordinary income dividends paid during the fiscal year qualify for the corporate dividends received deduction.
50
rev. 3/11
| | | | |
| | | |
FACTS | | WHAT DOES MFS DO WITH YOUR PERSONAL INFORMATION? | |  |
| | |
| Why? | | Financial companies choose how they share your personal information. Federal law gives consumers the right to limit some but not all sharing. Federal law also requires us to tell you how we collect, share, and protect your personal information. Please read this notice carefully to understand what we do. |
| | |
| What? | | The types of personal information we collect and share depend on the product or service you have with us. This information can include: • Social Security number and account balances • Account transactions and transaction history • Checking account information and wire transfer instructions When you are no longer our customer, we continue to share your information as described in this notice. |
| | |
| How? | | All financial companies need to share customers’ personal information to run their everyday business. In the section below, we list the reasons financial companies can share their customers’ personal information; the reasons MFS chooses to share; and whether you can limit this sharing. |
| | | | |
Reasons we can share your
personal information | | Does MFS
share? | | Can you limit
this sharing? |
For our everyday business purposes – such as to process your transactions, maintain your account(s), respond to court orders and legal investigations, or report to credit bureaus | | Yes | | No |
For our marketing purposes – to offer our products and services to you | | No | | We don’t share |
| For joint marketing with other financial companies | | No | | We don’t share |
For our affiliates’ everyday business purposes – information about your transactions and experiences | | No | | We don’t share |
For our affiliates’ everyday business purposes – information about your creditworthiness | | No | | We don’t share |
| For nonaffiliates to market to you | | No | | We don’t share |
| | |
| Questions? | | Call 800-225-2606 or go to mfs.com. |
51
| | |
| Who we are |
| Who is providing this notice? | | MFS Funds, MFS Investment Management, MFS Institutional Advisors, Inc., MFS Fund Distributors, Inc., MFS Heritage Trust Company, and MFS Service Center, Inc. |
| | |
| What we do |
| How does MFS protect my personal information? | | To protect your personal information from unauthorized access and use, we use security measures that comply with federal law. These measures include procedural, electronic, and physical safeguards for the protection of the personal information we collect about you. |
| How does MFS collect my personal information? | | We collect your personal information, for example, when you • open an account or provide account information • direct us to buy securities or direct us to sell your securities • make a wire transfer We also collect your personal information from others, such as credit bureaus, affiliates and other companies. |
| Why can’t I limit all sharing? | | Federal law gives you the right to limit only • sharing for affiliates’ everyday business purposes – information about your creditworthiness • affiliates from using your information to market to you • sharing for nonaffiliates to market to you State laws and individual companies may give you additional rights to limit sharing. |
| | |
| Definitions |
| Affiliates | | Companies related by common ownership or control. They can be financial and nonfinancial companies. • MFS does not share personal information with affiliates, except for everyday business purposes as described on page one of this notice. |
| Nonaffiliates | | Companies not related by common ownership or control. They can be financial and nonfinancial companies. • MFS does not share with nonaffiliates so they can market to you. |
| Joint Marketing | | A formal agreement between nonaffiliated financial companies that together market financial products or services to you. • MFS doesn’t jointly market. |
| | |
| Other important information |
| If you own an MFS product or receive an MFS service in the name of a third party such as a bank or broker-dealer, their privacy policy may apply to you instead of ours. |
52
Save paper with eDelivery.

| MFS® will send you prospectuses, |
reports, and proxies directly via e-mail so you will get information faster with less mailbox clutter.
To sign up:
1. Go to mfs.com.
2. Log in via MFS® Access.
3. Select eDelivery.
If you own your MFS fund shares through a financial institution or a retirement plan, MFS® TALK, MFS® Access, or eDelivery may not be available to you.
CONTACT
WEB SITE
mfs.com
MFS TALK
1-800-637-8255
24 hours a day
ACCOUNT SERVICE AND LITERATURE
Shareholders
1-800-225-2606
Financial advisors
1-800-343-2829
Retirement plan services
1-800-637-1255
MAILING ADDRESS
MFS Service Center, Inc.
P.O. Box 55824
Boston, MA 02205-5824
OVERNIGHT MAIL
MFS Service Center, Inc.
c/o Boston Financial Data Services
30 Dan Road
Canton, MA 02021-2809
ANNUAL REPORT
August 31, 2015

MFS® RESEARCH INTERNATIONAL FUND

RIF-ANN
MFS® RESEARCH INTERNATIONAL FUND
CONTENTS
The report is prepared for the general information of shareholders.
It is authorized for distribution to prospective investors only when preceded or accompanied by a current prospectus.
NOT FDIC INSURED • MAY LOSE VALUE • NO BANK GUARANTEE

LETTER FROM THE CHAIRMAN
Dear Shareholders:
The U.S. economy bounced back after another harsh winter curtailed domestic consumption. Despite strengthening labor and housing markets, however, a stronger U.S. dollar and weak overseas demand have held back corporate earnings.
China’s economic growth continues to slow, raising concerns and adding to global market volatility. Commodity exporters, including Australia and Canada, have been hurt by weaker Chinese demand. Global oil markets remain oversupplied, putting pressure on crude oil and gasoline prices.
In Europe, concerns about a potential Greek debt default have faded, and the eurozone’s economy is expanding mildly. Hopes for a more robust regionwide recovery rest on the European Central Bank’s quantitative easing program.
The world’s financial markets have become increasingly complex in recent years. Now, more than ever, it is important to understand companies on a global basis. At MFS®, we believe our integrated research platform, collaborative culture, active risk management process and long-term focus give us a research advantage.
As investors, we aim to add long-term value. We believe this approach will serve you well as you work with your financial advisor to reach your investment objectives.
Respectfully,

Robert J. Manning
Chairman
MFS Investment Management
October 15, 2015
The opinions expressed in this letter are subject to change and may not be relied upon for investment advice. No forecasts can be guaranteed.
1
PORTFOLIO COMPOSITION
Portfolio structure

| | | | |
| Top ten holdings | | | | |
| Novartis AG | | | 3.4% | |
| Nestle S.A. | | | 3.3% | |
| Roche Holding AG | | | 3.3% | |
| Bayer AG | | | 2.0% | |
| HSBC Holdings PLC | | | 2.0% | |
| Rio Tinto Ltd. | | | 2.0% | |
| DENSO Corp. | | | 1.8% | |
| Danone S.A. | | | 1.7% | |
| UBS AG | | | 1.6% | |
| Reckitt Benckiser Group PLC | | | 1.6% | |
| |
| Global equity sectors | | | | |
| Financial Services | | | 25.4% | |
| Capital Goods | | | 22.0% | |
| Health Care | | | 11.8% | |
| Consumer Staples | | | 9.6% | |
| Energy | | | 8.5% | |
| Consumer Cyclicals | | | 8.0% | |
| Technology | | | 7.7% | |
| Telecommunications/Cable Television | | | 5.4% | |
| | | | |
| Issuer country weightings (x) | |
| Japan | | | 20.2% | |
| United Kingdom | | | 19.3% | |
| Switzerland | | | 14.8% | |
| France | | | 9.0% | |
| Germany | | | 7.1% | |
| Netherlands | | | 4.3% | |
| United States | | | 3.9% | |
| Hong Kong | | | 3.7% | |
| Australia | | | 3.5% | |
| Other Countries | | | 14.2% | |
|
| Currency exposure weightings (y) | |
| Euro | | | 24.1% | |
| Japanese Yen | | | 20.2% | |
| British Pound Sterling | | | 19.3% | |
| Swiss Franc | | | 14.8% | |
| United States Dollar | | | 5.1% | |
| Hong Kong Dollar | | | 4.3% | |
| Australian Dollar | | | 3.5% | |
| Swedish Krona | | | 2.6% | |
| Taiwan Dollar | | | 1.9% | |
| Other Currencies | | | 4.2% | |
| (x) | Represents the portfolio’s exposure to issuer countries as a percentage of a portfolio’s net assets. For purposes of this presentation, United States includes Cash & Other. |
| (y) | Represents the portfolio’s exposure to a particular currency as a percentage of a portfolio’s net assets. For purposes of this presentation, United States Dollar includes Cash & Other. |
2
Portfolio Composition – continued
Cash & Other can include cash, other assets less liabilities, offsets to derivative positions, and short-term securities. Please see the Statement of Assets and Liabilities for additional information related to the fund’s cash position and the Notes to Financial Statements for additional information related to certain risks associated with assets included in “Other”.
Percentages are based on net assets as of 8/31/15.
The portfolio is actively managed and current holdings may be different.
3
MANAGEMENT REVIEW
Summary of Results
For the twelve months ended August 31, 2015, Class A shares of the MFS Research International Fund (“fund”) provided a total return of –7.44%, at net asset value. This compares with a return of –7.08% for the fund’s benchmark, the MSCI EAFE (Europe, Australasia, Far East) Index.
Market Environment
A generally risk-friendly environment prevailed in the first half of the period and any market setbacks, triggered by global growth concerns, were short-lived as central banks responded and kept monetary policy accommodative. For example, the US tempered rate hike expectations while Japan, Europe and China provided fresh stimulus measures which ultimately supported risk assets. Early in the second half of the period, the European Central Bank cut policy interest rates and announced non-conventional easing measures, pushing yields on a significant portion of eurozone sovereign bonds deeper into negative territory, a notable highlight amid a mini-wave of global easing due to declining inflation and inflation expectations. However, the environment supporting risk began to break down in the latter phases of the period, with both US investment grade and high yield corporate spreads widening out and any individual company performance below expectations resulted in market selling.
A dominant trend for most of the period was the ongoing rise in US equities. Until early in the second half of the period, this was paired with a decline in US and global bond yields. The uptrend in US corporate margins and profits continued throughout the second half of 2014, but in the latter part of the period the margin results became more bifurcated with energy and materials suffering and the rest of the companies holding on to net margins in an ongoing slow revenue growth environment. A rising dollar and a sharp decline in commodity prices, particularly crude oil prices, negatively impacted credit markets, notably US high yield and emerging market debt. The higher weightings of oil and gas credits in these asset classes resulted in widening spreads and increased volatility. In the second half of the period, global sovereign bond yields rose, shrugging off concerns over a Greek debt default. The rise tempered the equity advance, as odds of a 2015 US Federal Reserve rate hike increased. At the end of the period, the stronger US dollar slowed revenues in many US-based multinational companies. As the last month of the period began, risk shedding became a theme across emerging market countries and continued to weaken Chinese economic data as well as economic data of the commodity-driven countries. Risk shedding accelerated outflows and cross-border selling. By the end of the period, many of the world’s equity markets had entered into “correction” territory.
Detractors from Performance
Stock selection within the capital goods sector was a primary detractor from performance relative to the MSCI EAFE Index. The fund’s overweight positions in mining companies Rio Tinto (Australia) and Iluka Resources (Australia) and electrical distribution equipment manufacturer Schneider Electric (France) weakened relative results as all three stocks underperformed the benchmark over the period. Owning shares of steel producer Gerdau (b) (Brazil) and mining equipment manufacturer
4
Management Review – continued
Joy Global (b)(h) also hurt relative returns as both companies turned in poor performance. Shares of Gerdau depreciated as Brazilian demand for long steel continued to slide, with domestic shipments down 15% in 2015. Lava Jato, a money laundering investigation carried out by the Federal Police of Brazil, also continued to negatively impact construction and infrastructure projects throughout the region.
Elsewhere, the fund’s holdings of integrated circuits manufacturer Media Tek (b) (Taiwan) and food producer M. Dias Branco S.A. Industria e Comercio de Alimentos (b) (Brazil) held back relative performance. Overweight positions in diversified bank Westpac Banking (Australia) and global energy and petrochemicals company Royal Dutch Shell (United Kingdom) were other areas of relative weakness as both companies performed poorly over the reporting period. Not owning shares of pharmaceutical company Novo Nordisk (Denmark) also hurt relative results as investors appeared to have shown positive sentiment towards the company’s upcoming diabetes product launches set within the next five years.
Contributors to Performance
Stock selection in the financial services sector benefited relative performance. Within this sector, overweight positions in investment management and banking firm UBS (Switzerland) and banking firm KBC Groep (Belgium) supported relative results. Shares of UBS rose after the company posted year-over-year pre-tax revenue growth, recurring fee growth and Asian Pacific revenues growth. Not owning shares of poor-performing financial services firm Banco Santander (Spain) also strengthened relative returns. Shares of Banco Santander slumped after second-quarter results posted a bottom-line miss due to weak trading income.
Other areas of relative strength included the fund’s overweight positions in pharmaceutical companies, Santen Pharmaceutical (Japan) and Novartis (Switzerland), and telecommunications company KDDI (Japan). The fund’s avoidance of mining giant BHP Billiton (Australia) and commodities giant Glencore (Switzerland) also aided relative results as both companies underperformed the benchmark. Holdings of IT company Cognizant Technology Solutions (b) and pharmaceutical company Valeant Pharmaceuticals International (b) (Canada) also boosted relative performance. Valeant Pharmaceuticals International posted same-store sales organic growth of 19% during the second quarter, aggregating to the fourth consecutive quarter of 15% or more organic growth.
During the reporting period, the fund’s currency exposure, resulting primarily from differences between the fund’s and the benchmark’s exposures to holdings of securities denominated in foreign currencies, also benefited relative results. All of MFS’ investment decisions are driven by the fundamentals of each individual opportunity and as such, it is common for our portfolios to have different currency exposure than the benchmark.
Respectfully,
| | |
| Jose Luis Garcia | | Thomas Melendez |
| Portfolio Manager | | Portfolio Manager |
| (b) | Security is not a benchmark constituent. |
| (h) | Security was not held in the portfolio at period end. |
5
Management Review – continued
The views expressed in this report are those of the portfolio managers only through the end of the period of the report as stated on the cover and do not necessarily reflect the views of MFS or any other person in the MFS organization. These views are subject to change at any time based on market or other conditions, and MFS disclaims any responsibility to update such views. These views may not be relied upon as investment advice or an indication of trading intent on behalf of any MFS portfolio. References to specific securities are not recommendations of such securities, and may not be representative of any MFS portfolio’s current or future investments.
6
PERFORMANCE SUMMARY THROUGH 8/31/15
The following chart illustrates a representative class of the fund’s historical performance in comparison to its benchmark(s). Performance results include the deduction of the maximum applicable sales charge and reflect the percentage change in net asset value, including reinvestment of dividends and capital gains distributions. The performance of other share classes will be greater than or less than that of the class depicted below. Benchmarks are unmanaged and may not be invested in directly. Benchmark returns do not reflect sales charges, commissions or expenses. (See Notes to Performance Summary.)
Performance data shown represents past performance and is no guarantee of future results. Investment return and principal value fluctuate so your shares, when sold, may be worth more or less than the original cost; current performance may be lower or higher than quoted. The performance shown does not reflect the deduction of taxes, if any, that a shareholder would pay on fund distributions or the redemption of fund shares.
Growth of a Hypothetical $10,000 Investment
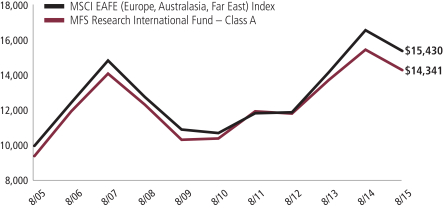
7
Performance Summary – continued
Total Returns through 8/31/15
Average annual without sales charge
| | | | | | | | | | | | | | |
| | | Share Class | | Class Inception Date | | 1-yr | | 5-yr | | 10-yr | | Life (t) | | |
| | | A | | 1/02/97 | | (7.44)% | | 6.59% | | 4.29% | | N/A | | |
| | | B | | 1/02/98 | | (8.15)% | | 5.79% | | 3.54% | | N/A | | |
| | | C | | 1/02/98 | | (8.17)% | | 5.78% | | 3.54% | | N/A | | |
| | | I | | 1/02/97 | | (7.19)% | | 6.85% | | 4.58% | | N/A | | |
| | | R1 | | 4/01/05 | | (8.18)% | | 5.78% | | 3.51% | | N/A | | |
| | | R2 | | 10/31/03 | | (7.69)% | | 6.31% | | 4.02% | | N/A | | |
| | | R3 | | 4/01/05 | | (7.44)% | | 6.58% | | 4.28% | | N/A | | |
| | | R4 | | 4/01/05 | | (7.26)% | | 6.84% | | 4.56% | | N/A | | |
| | | R5 | | 5/01/06 | | (7.13)% | | 6.88% | | N/A | | 2.13% | | |
| | | 529A | | 7/31/02 | | (7.43)% | | 6.54% | | 4.17% | | N/A | | |
| | | 529B | | 7/31/02 | | (8.17)% | | 5.72% | | 3.42% | | N/A | | |
| | | 529C | | 7/31/02 | | (8.17)% | | 5.72% | | 3.42% | | N/A | | |
| Comparative benchmark | | | | | | | | | | |
| | | MSCI EAFE (Europe, Australasia, Far
East) Index (f) | | (7.08)% | | 7.53% | | 4.43% | | N/A | | |
| Average annual with sales charge | | | | | | | | | | |
| | | A
With initial Sales Charge (5.75%) | | (12.77)% | | 5.33% | | 3.67% | | N/A | | |
| | | B
With CDSC (Declining over six years
from 4% to 0%) (v) | | (11.77)% | | 5.46% | | 3.54% | | N/A | | |
| | | C
With CDSC (1% for 12 months) (v) | | (9.08)% | | 5.78% | | 3.54% | | N/A | | |
| | | 529A
With initial Sales Charge (5.75%) | | (12.75)% | | 5.28% | | 3.55% | | N/A | | |
| | | 529B
With CDSC (Declining over six years
from 4% to 0%) (v) | | (11.79)% | | 5.40% | | 3.42% | | N/A | | |
| | | 529C
With CDSC (1% for 12 months) (v) | | (9.08)% | | 5.72% | | 3.42% | | N/A | | |
On May 30, 2012, Class W shares were redesignated Class R5 shares. Total returns for Class R5 shares prior to May 30, 2012 reflect the performance history of Class W shares which had different fees and expenses than Class R5 shares.
CDSC – Contingent Deferred Sales Charge.
Class I, R1, R2, R3, R4, and R5 shares do not have a sales charge.
| (f) | Source: FactSet Research Systems Inc. |
| (t) | For the period from the class inception date through the stated period end (for those share classes with less than 10 years of performance history). No comparative benchmark performance information is provided for “life” periods. (See Notes to Performance Summary.) |
| (v) | Assuming redemption at the end of the applicable period. |
8
Performance Summary – continued
Benchmark Definition
MSCI EAFE (Europe, Australasia, Far East) Index – a market capitalization-weighted index that is designed to measure equity market performance in the developed markets, excluding the U.S. and Canada.
It is not possible to invest directly in an index.
Notes to Performance Summary
Class 529 shares are only available in conjunction with qualified tuition programs, such as the MFS 529 Savings Plan. There also is an additional fee, which is detailed in the program description, on qualified tuition programs. If this fee was reflected, the performance for Class 529 shares would have been lower. This annual fee is waived for Oregon residents and for those accounts with assets of $25,000 or more.
Average annual total return represents the average annual change in value for each share class for the periods presented. Life returns are presented where the share class has less than 10 years of performance history and represent the average annual total return from the class inception date to the stated period end date. As the fund’s share classes may have different inception dates, the life returns may represent different time periods and may not be comparable. As a result, no comparative benchmark performance information is provided for life periods.
Performance results reflect any applicable expense subsidies and waivers in effect during the periods shown. Without such subsidies and waivers the fund’s performance results would be less favorable. Please see the prospectus and financial statements for complete details.
Performance results do not include adjustments made for financial reporting purposes in accordance with U.S. generally accepted accounting principles and may differ from amounts reported in the financial highlights.
From time to time the fund may receive proceeds from litigation settlements, without which performance would be lower.
9
EXPENSE TABLE
Fund expenses borne by the shareholders during the period,
March 1, 2015 through August 31, 2015
As a shareholder of the fund, you incur two types of costs: (1) transaction costs, including sales charges (loads) on certain purchase or redemption payments, and (2) ongoing costs, including management fees; distribution and service (12b-1) fees; and other fund expenses. This example is intended to help you understand your ongoing costs (in dollars) of investing in the fund and to compare these costs with the ongoing costs of investing in other mutual funds.
The example is based on an investment of $1,000 invested at the beginning of the period and held for the entire period March 1, 2015 through August 31, 2015.
Actual Expenses
The first line for each share class in the following table provides information about actual account values and actual expenses. You may use the information in this line, together with the amount you invested, to estimate the expenses that you paid over the period. Simply divide your account value by $1,000 (for example, an $8,600 account value divided by $1,000 = 8.6), then multiply the result by the number in the first line under the heading entitled “Expenses Paid During Period” to estimate the expenses you paid on your account during this period.
Hypothetical Example for Comparison Purposes
The second line for each share class in the following table provides information about hypothetical account values and hypothetical expenses based on the fund’s actual expense ratio and an assumed rate of return of 5% per year before expenses, which is not the fund’s actual return. The hypothetical account values and expenses may not be used to estimate the actual ending account balance or expenses you paid for the period. You may use this information to compare the ongoing costs of investing in the fund and other funds. To do so, compare this 5% hypothetical example with the 5% hypothetical examples that appear in the shareholder reports of the other funds.
Please note that the expenses shown in the table are meant to highlight your ongoing costs only and do not reflect any transactional costs, such as sales charges (loads). Therefore, the second line for each share class in the table is useful in comparing ongoing costs only, and will not help you determine the relative total costs of owning different funds. In addition, if these transactional costs were included, your costs would have been higher.
10
Expense Table – continued
| | | | | | | | | | | | | | | | | | |
Share
Class | | | | Annualized Expense Ratio | | | Beginning Account Value 3/01/15 | | | Ending Account Value 8/31/15 | | | Expenses Paid During Period (p) 3/01/15-8/31/15 | |
| A | | Actual | | | 1.08% | | | | $1,000.00 | | | | $938.54 | | | | $5.28 | |
| | Hypothetical (h) | | | 1.08% | | | | $1,000.00 | | | | $1,019.76 | | | | $5.50 | |
| B | | Actual | | | 1.83% | | | | $1,000.00 | | | | $934.89 | | | | $8.92 | |
| | Hypothetical (h) | | | 1.83% | | | | $1,000.00 | | | | $1,015.98 | | | | $9.30 | |
| C | | Actual | | | 1.83% | | | | $1,000.00 | | | | $934.68 | | | | $8.92 | |
| | Hypothetical (h) | | | 1.83% | | | | $1,000.00 | | | | $1,015.98 | | | | $9.30 | |
| I | | Actual | | | 0.83% | | | | $1,000.00 | | | | $939.41 | | | | $4.06 | |
| | Hypothetical (h) | | | 0.83% | | | | $1,000.00 | | | | $1,021.02 | | | | $4.23 | |
| R1 | | Actual | | | 1.83% | | | | $1,000.00 | | | | $934.33 | | | | $8.92 | |
| | Hypothetical (h) | | | 1.83% | | | | $1,000.00 | | | | $1,015.98 | | | | $9.30 | |
| R2 | | Actual | | | 1.33% | | | | $1,000.00 | | | | $937.13 | | | | $6.49 | |
| | Hypothetical (h) | | | 1.33% | | | | $1,000.00 | | | | $1,018.50 | | | | $6.77 | |
| R3 | | Actual | | | 1.08% | | | | $1,000.00 | | | | $937.90 | | | | $5.28 | |
| | Hypothetical (h) | | | 1.08% | | | | $1,000.00 | | | | $1,019.76 | | | | $5.50 | |
| R4 | | Actual | | | 0.83% | | | | $1,000.00 | | | | $939.15 | | | | $4.06 | |
| | Hypothetical (h) | | | 0.83% | | | | $1,000.00 | | | | $1,021.02 | | | | $4.23 | |
| R5 | | Actual | | | 0.74% | | | | $1,000.00 | | | | $940.02 | | | | $3.62 | |
| | Hypothetical (h) | | | 0.74% | | | | $1,000.00 | | | | $1,021.48 | | | | $3.77 | |
| 529A | | Actual | | | 1.10% | | | | $1,000.00 | | | | $938.30 | | | | $5.37 | |
| | Hypothetical (h) | | | 1.10% | | | | $1,000.00 | | | | $1,019.66 | | | | $5.60 | |
| 529B | | Actual | | | 1.87% | | | | $1,000.00 | | | | $934.19 | | | | $9.12 | |
| | Hypothetical (h) | | | 1.87% | | | | $1,000.00 | | | | $1,015.78 | | | | $9.50 | |
| 529C | | Actual | | | 1.88% | | | | $1,000.00 | | | | $934.62 | | | | $9.17 | |
| | Hypothetical (h) | | | 1.88% | | | | $1,000.00 | | | | $1,015.73 | | | | $9.55 | |
| (h) | 5% class return per year before expenses. |
| (p) | “Expenses Paid During Period” are equal to each class’s annualized expense ratio, as shown above, multiplied by the average account value over the period, multiplied by 184/365 (to reflect the one-half year period). Expenses paid do not include any applicable sales charges (loads). If these transaction costs had been included, your costs would have been higher. |
Notes to Expense Table
Each class with a Rule 12b-1 service fee is subject to a rebate of a portion of such fee. Such rebates are included in the expense ratios above. For Class 529A and Class 529B shares, this rebate reduced the expense ratios above by 0.03% and 0.02%, respectively. See Note 3 in the Notes to Financial Statements for additional information.
11
PORTFOLIO OF INVESTMENTS
8/31/15
The Portfolio of Investments is a complete list of all securities owned by your fund. It is categorized by broad-based asset classes.
| | | | | | | | |
| Common Stocks - 98.4% | | | | | | | | |
| Issuer | | Shares/Par | | | Value ($) | |
| Airlines - 0.3% | | | | | | | | |
| Stagecoach Group PLC | | | 3,702,509 | | | $ | 20,618,166 | |
| | |
| Apparel Manufacturers - 1.7% | | | | | | | | |
| Burberry Group PLC | | | 1,403,147 | | | $ | 30,191,657 | |
| Global Brands Group Holding Ltd. (a) | | | 92,064,000 | | | | 17,462,349 | |
| LVMH Moet Hennessy Louis Vuitton S.A. | | | 468,853 | | | | 78,208,283 | |
| | | | | | | | |
| | | | $ | 125,862,289 | |
| Automotive - 4.2% | | | | | | | | |
| DENSO Corp. | | | 2,917,900 | | | $ | 130,665,889 | |
| GKN PLC | | | 16,585,648 | | | | 73,384,770 | |
| Honda Motor Co. Ltd. | | | 3,305,000 | | | | 104,246,463 | |
| | | | | | | | |
| | | | $ | 308,297,122 | |
| Broadcasting - 1.1% | | | | | | | | |
| WPP PLC | | | 3,935,494 | | | $ | 81,332,963 | |
| | |
| Business Services - 3.8% | | | | | | | | |
| Amadeus IT Holding S.A. | | | 689,600 | | | $ | 28,871,785 | |
| Brenntag AG | | | 464,828 | | | | 25,861,276 | |
| Cognizant Technology Solutions Corp., “A” (a) | | | 1,344,388 | | | | 84,615,781 | |
| Compass Group PLC | | | 3,311,450 | | | | 52,236,912 | |
| Mitsubishi Corp. | | | 2,227,500 | | | | 41,432,033 | |
| Nomura Research, Inc. | | | 1,178,300 | | | | 47,866,767 | |
| | | | | | | | |
| | | | | | | $ | 280,884,554 | |
| Cable TV - 0.4% | | | | | | | | |
| British Sky Broadcasting Group PLC | | | 2,017,779 | | | $ | 32,212,971 | |
| | |
| Chemicals - 0.6% | | | | | | | | |
| Orica Ltd. | | | 3,956,289 | | | $ | 44,653,724 | |
| | |
| Computer Software - 0.3% | | | | | | | | |
| Dassault Systems S.A. | | | 359,090 | | | $ | 24,938,764 | |
| | |
| Conglomerates - 1.0% | | | | | | | | |
| CK Hutchison Holdings Ltd. | | | 5,295,356 | | | $ | 70,581,516 | |
12
Portfolio of Investments – continued
| | | | | | | | |
| Issuer | | Shares/Par | | | Value ($) | |
| Common Stocks - continued | | | | | | | | |
| Consumer Products - 3.0% | | | | | | | | |
| L’Oreal S.A. | | | 604,338 | | | $ | 103,554,763 | |
| Reckitt Benckiser Group PLC | | | 1,334,952 | | | | 117,092,855 | |
| | | | | | | | |
| | | | $ | 220,647,618 | |
| Electrical Equipment - 3.5% | | | | | | | | |
| Legrand S.A. | | | 444,968 | | | $ | 25,680,084 | |
| Schneider Electric S.A. | | | 1,847,081 | | | | 116,755,361 | |
| Siemens AG | | | 1,132,989 | | | | 112,466,652 | |
| | | | | | | | |
| | | | $ | 254,902,097 | |
| Electronics - 2.5% | | | | | | | | |
| Infineon Technologies AG | | | 4,355,123 | | | $ | 47,668,810 | |
| Media Tek, Inc. | | | 6,379,000 | | | | 49,210,997 | |
| Taiwan Semiconductor Manufacturing Co. Ltd. | | | 22,827,326 | | | | 90,506,671 | |
| | | | | | | | |
| | | | $ | 187,386,478 | |
| Energy - Independent - 1.7% | | | | | | | | |
| Cairn Energy PLC (a) | | | 5,569,524 | | | $ | 12,923,057 | |
| Galp Energia SGPS S.A., “B” | | | 2,446,428 | | | | 25,797,214 | |
| INPEX Corp. | | | 2,803,800 | | | | 28,261,175 | |
| Oil Search Ltd. | | | 5,703,142 | | | | 27,598,761 | |
| Reliance Industries Ltd. | | | 2,305,799 | | | | 29,688,354 | |
| | | | | | | | |
| | | | $ | 124,268,561 | |
| Energy - Integrated - 2.3% | | | | | | | | |
| BG Group PLC | | | 5,967,348 | | | $ | 90,281,780 | |
| Royal Dutch Shell PLC, “A” | | | 2,911,492 | | | | 75,461,987 | |
| | | | | | | | |
| | | | $ | 165,743,767 | |
| Food & Beverages - 5.2% | | | | | | | | |
| Danone S.A. | | | 1,996,043 | | | $ | 124,065,890 | |
| M. Dias Branco S.A. Industria e Comercio de Alimentos | | | 949,665 | | | | 16,575,571 | |
| Nestle S.A. | | | 3,318,062 | | | | 244,739,896 | |
| | | | | | | | |
| | | | $ | 385,381,357 | |
| Food & Drug Stores - 0.7% | | | | | | | | |
| Sundrug Co. Ltd. | | | 933,400 | | | $ | 52,507,840 | |
| | |
| Insurance - 4.4% | | | | | | | | |
| AIA Group Ltd. | | | 19,813,400 | | | $ | 109,548,221 | |
| Hiscox Ltd. | | | 2,506,135 | | | | 34,534,422 | |
| Prudential PLC | | | 1,767,667 | | | | 38,086,451 | |
| Sony Financial Holdings, Inc. | | | 2,283,900 | | | | 42,839,020 | |
| Zurich Insurance Group AG | | | 359,437 | | | | 98,797,301 | |
| | | | | | | | |
| | | | $ | 323,805,415 | |
13
Portfolio of Investments – continued
| | | | | | | | |
| Issuer | | Shares/Par | | | Value ($) | |
| Common Stocks - continued | | | | | | | | |
| Internet - 0.4% | | | | | | | | |
| Alibaba Group Holding Ltd., ADR (a) | | | 494,569 | | | $ | 32,700,902 | |
| | |
| Machinery & Tools - 3.9% | | | | | | | | |
| Atlas Copco AB, “A” | | | 4,220,406 | | | $ | 106,432,398 | |
| Kubota Corp. | | | 6,062,000 | | | | 94,928,915 | |
| Schindler Holding AG | | | 563,462 | | | | 86,444,333 | |
| | | | | | | | |
| | | | $ | 287,805,646 | |
| Major Banks - 9.8% | | | | | | | | |
| Barclays PLC | | | 24,948,235 | | | $ | 99,696,811 | |
| BNP Paribas | | | 1,645,769 | | | | 103,919,472 | |
| BOC Hong Kong Holdings Ltd. | | | 10,970,500 | | | | 37,087,128 | |
| HSBC Holdings PLC | | | 19,042,763 | | | | 150,139,299 | |
| Mitsubishi UFJ Financial Group, Inc. | | | 17,683,800 | | | | 116,705,641 | |
| Sumitomo Mitsui Financial Group, Inc. | | | 2,652,200 | | | | 108,595,049 | |
| Westpac Banking Corp. | | | 4,789,313 | | | | 105,998,594 | |
| | | | | | | | |
| | | | $ | 722,141,994 | |
| Medical Equipment - 0.7% | | | | | | | | |
| Terumo Corp. | | | 1,812,900 | | | $ | 49,571,192 | |
| | |
| Metals & Mining - 2.6% | | | | | | | | |
| Gerdau S.A., ADR | | | 8,371,255 | | | $ | 12,389,457 | |
| Iluka Resources Ltd. | | | 6,922,872 | | | | 36,605,101 | |
| Rio Tinto Ltd. | | | 3,993,520 | | | | 144,609,316 | |
| | | | | | | | |
| | | | $ | 193,603,874 | |
| Natural Gas - Distribution - 2.6% | | | | | | | | |
| Centrica PLC | | | 8,725,527 | | | $ | 32,258,667 | |
| China Resources Gas Group Ltd. | | | 15,510,000 | | | | 40,926,123 | |
| Engie | | | 3,655,426 | | | | 65,569,485 | |
| Tokyo Gas Co. Ltd. | | | 9,613,000 | | | | 52,594,572 | |
| | | | | | | | |
| | | | $ | 191,348,847 | |
| Natural Gas - Pipeline - 1.2% | | | | | | | | |
| APA Group | | | 7,250,908 | | | $ | 45,254,157 | |
| Enbridge, Inc. | | | 950,135 | | | | 39,266,373 | |
| | | | | | | | |
| | | | $ | 84,520,530 | |
| Network & Telecom - 0.6% | | | | | | | | |
| Ericsson, Inc., “B” | | | 4,188,889 | | | $ | 40,844,884 | |
| | |
| Oil Services - 0.3% | | | | | | | | |
| Technip | | | 370,273 | | | $ | 20,176,780 | |
14
Portfolio of Investments – continued
| | | | | | | | |
| Issuer | | Shares/Par | | | Value ($) | |
| Common Stocks - continued | | | | | | | | |
| Other Banks & Diversified Financials - 10.6% | | | | | | | | |
| Aeon Credit Service Co. Ltd. | | | 1,617,900 | | | $ | 36,779,250 | |
| DBS Group Holdings Ltd. | | | 3,610,700 | | | | 45,445,613 | |
| HDFC Bank Ltd., ADR | | | 779,644 | | | | 44,431,912 | |
| ING Groep N.V. | | | 7,177,854 | | | | 109,905,468 | |
| Intesa Sanpaolo S.p.A. | | | 25,002,842 | | | | 91,297,327 | |
| Julius Baer Group Ltd. | | | 1,016,790 | | | | 49,511,514 | |
| Kasikornbank Co. Ltd. | | | 3,832,400 | | | | 19,351,776 | |
| Kasikornbank PLC, NVDR | | | 252,800 | | | | 1,272,992 | |
| KBC Groep N.V. | | | 1,038,317 | | | | 68,941,809 | |
| Lloyds TSB Group PLC | | | 98,388,085 | | | | 115,666,896 | |
| MasterCard, Inc., “A” | | | 658,992 | | | | 60,871,091 | |
| Sberbank of Russia, ADR | | | 3,008,020 | | | | 14,441,257 | |
| UBS AG | | | 5,865,313 | | | | 121,535,426 | |
| | | | | | | | |
| | | | $ | 779,452,331 | |
| Pharmaceuticals - 11.1% | | | | | | | | |
| Bayer AG | | | 1,106,763 | | | $ | 150,214,426 | |
| Novartis AG | | | 2,546,570 | | | | 249,480,349 | |
| Roche Holding AG | | | 894,816 | | | | 244,381,549 | |
| Santen Pharmaceutical Co. Ltd. | | | 5,937,100 | | | | 92,801,621 | |
| Valeant Pharmaceuticals International, Inc. (a) | | | 365,082 | | | | 84,187,909 | |
| | | | | | | | |
| | | | $ | 821,065,854 | |
| Printing & Publishing - 1.3% | | | | | | | | |
| Reed Elsevier N.V. | | | 6,349,987 | | | $ | 97,870,687 | |
| | |
| Real Estate - 0.7% | | | | | | | | |
| Cheung Kong Property Holdings Ltd. (a) | | | 3,675,744 | | | $ | 25,753,756 | |
| Deutsche Wohnen AG | | | 982,758 | | | | 25,849,690 | |
| | | | | | | | |
| | | | $ | 51,603,446 | |
| Restaurants - 1.7% | | | | | | | | |
| Whitbread PLC | | | 1,295,241 | | | $ | 94,516,320 | |
| YUM! Brands, Inc. | | | 354,771 | | | | 28,300,083 | |
| | | | | | | | |
| | | | $ | 122,816,403 | |
| Specialty Chemicals - 4.9% | | | | | | | | |
| Akzo Nobel N.V. | | | 1,647,040 | | | $ | 111,522,011 | |
| JSR Corp. | | | 6,146,900 | | | | 96,740,093 | |
| Linde AG | | | 630,748 | | | | 109,637,327 | |
| Symrise AG | | | 774,749 | | | | 46,764,221 | |
| | | | | | | | |
| | | | $ | 364,663,652 | |
| Specialty Stores - 1.2% | | | | | | | | |
| ABC-MART, Inc. | | | 269,800 | | | $ | 16,379,164 | |
| Esprit Holdings Ltd. | | | 16,212,800 | | | | 13,597,745 | |
15
Portfolio of Investments – continued
| | | | | | | | |
| Issuer | | Shares/Par | | | Value ($) | |
| Common Stocks - continued | | | | | | | | |
| Specialty Stores - continued | | | | | | | | |
| Hennes & Mauritz AB, “B” | | | 1,235,523 | | | $ | 47,547,058 | |
| Ryohin Keikaku Co. Ltd. | | | 46,700 | | | | 10,385,054 | |
| | | | | | | | |
| | | | $ | 87,909,021 | |
| Telecommunications - Wireless - 3.6% | |
| KDDI Corp. | | | 4,103,000 | | | $ | 102,139,267 | |
| Mobile TeleSystems PJSC (a) | | | 3,114,800 | | | | 11,101,419 | |
| Philippine Long Distance Telephone Co. | | | 319,590 | | | | 17,217,108 | |
| SoftBank Corp. | | | 1,004,900 | | | | 58,544,222 | |
| Vodafone Group PLC | | | 23,134,411 | | | | 79,830,683 | |
| | | | | | | | |
| | | | $ | 268,832,699 | |
| Telephone Services - 1.3% | | | | | | | | |
| BT Group PLC | | | 7,092,729 | | | $ | 47,252,176 | |
| Hellenic Telecommunications Organization S.A. | | | 2,357,853 | | | | 21,563,809 | |
| TDC A.S. | | | 4,639,717 | | | | 29,360,309 | |
| | | | | | | | |
| | | | $ | 98,176,294 | |
| Tobacco - 1.4% | | | | | | | | |
| Japan Tobacco, Inc. | | | 2,965,600 | | | $ | 105,906,423 | |
| | |
| Trucking - 1.3% | | | | | | | | |
| Yamato Holdings Co. Ltd. | | | 4,930,700 | | | $ | 96,246,971 | |
| | |
| Utilities - Electric Power - 0.5% | | | | | | | | |
| Enel S.p.A. | | | 8,577,444 | | | $ | 38,654,738 | |
| Total Common Stocks (Identified Cost, $7,183,711,582) | | | $ | 7,259,938,370 | |
| | |
| Money Market Funds - 1.2% | | | | | | | | |
MFS Institutional Money Market Portfolio, 0.11%,
at Cost and Net Asset Value (v) | | | 89,081,615 | | | $ | 89,081,615 | |
| Total Investments (Identified Cost, $7,272,793,197) | | | $ | 7,349,019,985 | |
| |
| Other Assets, Less Liabilities - 0.4% | | | | 25,450,839 | |
| Net Assets - 100.0% | | | $ | 7,374,470,824 | |
| (a) | Non-income producing security. |
| (v) | Underlying affiliated fund that is available only to investment companies managed by MFS. The rate quoted for the MFS Institutional Money Market Portfolio is the annualized seven-day yield of the fund at period end. |
The following abbreviations are used in this report and are defined:
| ADR | | American Depositary Receipt |
| NVDR | | Non-Voting Depositary Receipt |
| PLC | | Public Limited Company |
See Notes to Financial Statements
16
Financial Statements
STATEMENT OF ASSETS AND LIABILITIES
At 8/31/15
This statement represents your fund’s balance sheet, which details the assets and liabilities comprising the total value of the fund.
| | | | |
| Assets | | | | |
Investments | | | | |
Non-affiliated issuers, at value (identified cost, $7,183,711,582) | | | $7,259,938,370 | |
Underlying affiliated funds, at cost and value | | | 89,081,615 | |
Total investments, at value (identified cost, $7,272,793,197) | | | $7,349,019,985 | |
Cash | | | 853 | |
Receivables for | | | | |
Investments sold | | | 30,812,254 | |
Fund shares sold | | | 12,732,804 | |
Interest and dividends | | | 29,353,307 | |
Other assets | | | 8,447 | |
Total assets | | | $7,421,927,650 | |
| Liabilities | | | | |
Payable to custodian | | | $24 | |
Payables for | | | | |
Investments purchased | | | 37,795,092 | |
Fund shares reacquired | | | 6,832,185 | |
Payable to affiliates | | | | |
Investment adviser | | | 533,608 | |
Shareholder servicing costs | | | 1,496,780 | |
Distribution and service fees | | | 55,728 | |
Program manager fees | | | 21 | |
Payable for independent Trustees’ compensation | | | 954 | |
Accrued expenses and other liabilities | | | 742,434 | |
Total liabilities | | | $47,456,826 | |
Net assets | | | $7,374,470,824 | |
| Net assets consist of | | | | |
Paid-in capital | | | $7,538,696,807 | |
Unrealized appreciation (depreciation) on investments and translation of assets and liabilities in foreign currencies | | | 75,479,926 | |
Accumulated net realized gain (loss) on investments and foreign currency | | | (365,362,273 | ) |
Undistributed net investment income | | | 125,656,364 | |
Net assets | | | $7,374,470,824 | |
Shares of beneficial interest outstanding | | | 447,750,402 | |
17
Statement of Assets and Liabilities – continued
| | | | | | | | | | | | |
| | | Net assets | | | Shares
outstanding | | | Net asset value
per share (a) | |
Class A | | | $1,178,012,937 | | | | 72,105,087 | | | | $16.34 | |
Class B | | | 11,227,928 | | | | 717,527 | | | | 15.65 | |
Class C | | | 77,442,464 | | | | 5,057,631 | | | | 15.31 | |
Class I | | | 2,410,936,412 | | | | 142,682,351 | | | | 16.90 | |
Class R1 | | | 3,508,598 | | | | 232,604 | | | | 15.08 | |
Class R2 | | | 169,811,506 | | | | 10,746,830 | | | | 15.80 | |
Class R3 | | | 165,655,881 | | | | 10,251,109 | | | | 16.16 | |
Class R4 | | | 343,475,222 | | | | 20,989,432 | | | | 16.36 | |
Class R5 | | | 3,010,862,876 | | | | 184,743,341 | | | | 16.30 | |
Class 529A | | | 2,419,134 | | | | 150,113 | | | | 16.12 | |
Class 529B | | | 138,158 | | | | 9,096 | | | | 15.19 | |
Class 529C | | | 979,708 | | | | 65,281 | | | | 15.01 | |
| (a) | Maximum offering price per share was equal to the net asset value per share for all share classes, except for Classes A and 529A, for which the maximum offering prices per share were $17.34 [100 / 94.25 x $16.34] and $17.10 [100 / 94.25 x $16.12], respectively. On sales of $50,000 or more, the maximum offering prices of Class A and Class 529A shares are reduced. A contingent deferred sales charge may be imposed on redemptions of Class A, Class B, Class C, Class 529B, and Class 529C shares. Redemption price per share was equal to the net asset value per share for Classes I, R1, R2, R3, R4, R5, and 529A. |
See Notes to Financial Statements
18
Financial Statements
STATEMENT OF OPERATIONS
Year ended 8/31/15
This statement describes how much your fund earned in investment income and accrued in expenses. It also describes any gains and/or losses generated by fund operations.
| | | | |
| Net investment income | | | | |
Income | | | | |
Dividends | | | $212,279,564 | |
Interest | | | 2,048,848 | |
Dividends from underlying affiliated funds | | | 71,854 | |
Foreign taxes withheld | | | (18,891,407 | ) |
Total investment income | | | $195,508,859 | |
Expenses | | | | |
Management fee | | | $55,199,650 | |
Distribution and service fees | | | 5,498,906 | |
Program manager fees | | | 3,596 | |
Shareholder servicing costs | | | 4,630,948 | |
Administrative services fee | | | 645,768 | |
Independent Trustees’ compensation | | | 99,676 | |
Custodian fee | | | 1,505,017 | |
Shareholder communications | | | 305,255 | |
Audit and tax fees | | | 68,788 | |
Legal fees | | | 53,878 | |
Miscellaneous | | | 414,255 | |
Total expenses | | | $68,425,737 | |
Fees paid indirectly | | | (149 | ) |
Reduction of expenses by investment adviser and distributor | | | (2,954,524 | ) |
Net expenses | | | $65,471,064 | |
Net investment income | | | $130,037,795 | |
| Realized and unrealized gain (loss) on investments and foreign currency | |
Realized gain (loss) (identified cost basis) | | | | |
Investments (net of $63,910 country tax) | | | $116,750,004 | |
Foreign currency | | | (3,545,748 | ) |
Net realized gain (loss) on investments and foreign currency | | | $113,204,256 | |
Change in unrealized appreciation (depreciation) | | | | |
Investments (net of $441,648 decrease in deferred country tax) | | | $(811,917,256 | ) |
Translation of assets and liabilities in foreign currencies | | | (554,805 | ) |
Net unrealized gain (loss) on investments and foreign currency translation | | | $(812,472,061 | ) |
Net realized and unrealized gain (loss) on investments and foreign currency | | | $(699,267,805 | ) |
Change in net assets from operations | | | $(569,230,010 | ) |
See Notes to Financial Statements
19
Financial Statements
STATEMENTS OF CHANGES IN NET ASSETS
These statements describe the increases and/or decreases in net assets resulting from operations, any distributions, and any shareholder transactions.
| | | | | | | | |
| | | Years ended 8/31 | |
| | | 2015 | | | 2014 | |
| Change in net assets | | | | | | |
| From operations | | | | | | | | |
Net investment income | | | $130,037,795 | | | | $175,860,090 | |
Net realized gain (loss) on investments and foreign currency | | | 113,204,256 | | | | 258,567,787 | |
Net unrealized gain (loss) on investments and foreign currency translation | | | (812,472,061 | ) | | | 373,522,243 | |
Change in net assets from operations | | | $(569,230,010 | ) | | | $807,950,120 | |
| Distributions declared to shareholders | | | | | | | | |
From net investment income | | | $(172,549,524 | ) | | | $(103,250,534 | ) |
Change in net assets from fund share transactions | | | $707,404,711 | | | | $512,989,442 | |
Total change in net assets | | | $(34,374,823 | ) | | | $1,217,689,028 | |
| Net assets | | | | | | | | |
At beginning of period | | | 7,408,845,647 | | | | 6,191,156,619 | |
At end of period (including undistributed net investment income of $125,656,364 and $171,861,460, respectively) | | | $7,374,470,824 | | | | $7,408,845,647 | |
See Notes to Financial Statements
20
Financial Statements
FINANCIAL HIGHLIGHTS
The financial highlights table is intended to help you understand the fund’s financial performance for the past 5 years. Certain information reflects financial results for a single fund share. The total returns in the table represent the rate by which an investor would have earned (or lost) on an investment in the fund share class (assuming reinvestment of all distributions) held for the entire period.
| | | | | | | | | | | | | | | | | | | | |
| Class A | | Years ended 8/31 | |
| | | 2015 | | | 2014 | | | 2013 | | | 2012 | | | 2011 | |
Net asset value, beginning of period | | | $18.06 | | | | $16.25 | | | | $14.25 | | | | $14.66 | | | | $12.93 | |
| Income (loss) from investment operations | | | | | | | | | |
Net investment income (d) | | | $0.26 | | | | $0.40 | | | | $0.26 | | | | $0.28 | | | | $0.26 | |
Net realized and unrealized gain (loss) on
investments and foreign currency | | | (1.60 | ) | | | 1.64 | | | | 2.01 | | | | (0.45 | ) | | | 1.67 | |
Total from investment operations | | | $(1.34 | ) | | | $2.04 | | | | $2.27 | | | | $(0.17 | ) | | | $1.93 | |
| Less distributions declared to shareholders | | | | | | | | | |
From net investment income | | | $(0.38 | ) | | | $(0.23 | ) | | | $(0.27 | ) | | | $(0.24 | ) | | | $(0.20 | ) |
Net asset value, end of period (x) | | | $16.34 | | | | $18.06 | | | | $16.25 | | | | $14.25 | | | | $14.66 | |
Total return (%) (r)(s)(t)(x) | | | (7.44 | ) | | | 12.60 | | | | 16.08 | | | | (1.03 | ) | | | 14.89 | |
Ratios (%) (to average net assets)
and Supplemental data: | | | | | |
Expenses before expense reductions (f) | | | 1.13 | | | | 1.13 | | | | 1.18 | | | | 1.21 | | | | 1.19 | |
Expenses after expense reductions (f) | | | 1.09 | | | | 1.11 | | | | 1.18 | | | | 1.21 | | | | 1.19 | |
Net investment income | | | 1.53 | | | | 2.24 | | | | 1.65 | | | | 2.02 | | | | 1.67 | |
Portfolio turnover | | | 28 | | | | 27 | | | | 32 | | | | 37 | | | | 43 | |
Net assets at end of period (000 omitted) | | | $1,178,013 | | | | $1,184,927 | | | | $1,108,795 | | | | $970,501 | | | | $1,008,654 | |
See Notes to Financial Statements
21
Financial Highlights – continued
| | | | | | | | | | | | | | | | | | | | |
| Class B | | Years ended 8/31 | |
| | | 2015 | | | 2014 | | | 2013 | | | 2012 | | | 2011 | |
Net asset value, beginning of period | | | $17.26 | | | | $15.52 | | | | $13.59 | | | | $13.96 | | | | $12.30 | |
| Income (loss) from investment operations | | | | | | | | | |
Net investment income (d) | | | $0.12 | | | | $0.25 | | | | $0.12 | | | | $0.16 | | | | $0.11 | |
Net realized and unrealized gain (loss) on
investments and foreign currency | | | (1.52 | ) | | | 1.57 | | | | 1.94 | | | | (0.42 | ) | | | 1.62 | |
Total from investment operations | | | $(1.40 | ) | | | $1.82 | | | | $2.06 | | | | $(0.26 | ) | | | $1.73 | |
| Less distributions declared to shareholders | | | | | | | | | |
From net investment income | | | $(0.21 | ) | | | $(0.08 | ) | | | $(0.13 | ) | | | $(0.11 | ) | | | $(0.07 | ) |
Net asset value, end of period (x) | | | $15.65 | | | | $17.26 | | | | $15.52 | | | | $13.59 | | | | $13.96 | |
Total return (%) (r)(s)(t)(x) | | | (8.15 | ) | | | 11.77 | | | | 15.27 | | | | (1.82 | ) | | | 14.02 | |
Ratios (%) (to average net assets)
and Supplemental data: | | | | | |
Expenses before expense reductions (f) | | | 1.88 | | | | 1.88 | | | | 1.93 | | | | 1.96 | | | | 1.95 | |
Expenses after expense reductions (f) | | | 1.84 | | | | 1.86 | | | | 1.93 | | | | 1.96 | | | | 1.94 | |
Net investment income | | | 0.70 | | | | 1.46 | | | | 0.83 | | | | 1.19 | | | | 0.76 | |
Portfolio turnover | | | 28 | | | | 27 | | | | 32 | | | | 37 | | | | 43 | |
Net assets at end of period (000 omitted) | | | $11,228 | | | | $16,932 | | | | $19,751 | | | | $23,369 | | | | $33,059 | |
| |
| Class C | | Years ended 8/31 | |
| | | 2015 | | | 2014 | | | 2013 | | | 2012 | | | 2011 | |
Net asset value, beginning of period | | | $16.93 | | | | $15.26 | | | | $13.39 | | | | $13.78 | | | | $12.16 | |
| Income (loss) from investment operations | | | | | | | | | |
Net investment income (d) | | | $0.12 | | | | $0.25 | | | | $0.13 | | | | $0.16 | | | | $0.12 | |
Net realized and unrealized gain (loss) on
investments and foreign currency | | | (1.50 | ) | | | 1.54 | | | | 1.90 | | | | (0.42 | ) | | | 1.59 | |
Total from investment operations | | | $(1.38 | ) | | | $1.79 | | | | $2.03 | | | | $(0.26 | ) | | | $1.71 | |
| Less distributions declared to shareholders | | | | | | | | | |
From net investment income | | | $(0.24 | ) | | | $(0.12 | ) | | | $(0.16 | ) | | | $(0.13 | ) | | | $(0.09 | ) |
Net asset value, end of period (x) | | | $15.31 | | | | $16.93 | | | | $15.26 | | | | $13.39 | | | | $13.78 | |
Total return (%) (r)(s)(t)(x) | | | (8.17 | ) | | | 11.74 | | | | 15.22 | | | | (1.80 | ) | | | 14.05 | |
Ratios (%) (to average net assets)
and Supplemental data: | | | | | |
Expenses before expense reductions (f) | | | 1.88 | | | | 1.88 | | | | 1.93 | | | | 1.96 | | | | 1.95 | |
Expenses after expense reductions (f) | | | 1.84 | | | | 1.86 | | | | 1.93 | | | | 1.96 | | | | 1.95 | |
Net investment income | | | 0.76 | | | | 1.50 | | | | 0.87 | | | | 1.23 | | | | 0.80 | |
Portfolio turnover | | | 28 | | | | 27 | | | | 32 | | | | 37 | | | | 43 | |
Net assets at end of period (000 omitted) | | | $77,442 | | | | $91,487 | | | | $86,793 | | | | $84,133 | | | | $99,830 | |
See Notes to Financial Statements
22
Financial Highlights – continued
| | | | | | | | | | | | | | | | | | | | |
| Class I | | Years ended 8/31 | |
| | | 2015 | | | 2014 | | | 2013 | | | 2012 | | | 2011 | |
Net asset value, beginning of period | | | $18.66 | | | | $16.78 | | | | $14.71 | | | | $15.15 | | | | $13.35 | |
| Income (loss) from investment operations | | | | | | | | | |
Net investment income (d) | | | $0.32 | | | | $0.46 | | | | $0.31 | | | | $0.35 | | | | $0.29 | |
Net realized and unrealized gain (loss) on
investments and foreign currency | | | (1.66 | ) | | | 1.69 | | | | 2.06 | | | | (0.49 | ) | | | 1.74 | |
Total from investment operations | | | $(1.34 | ) | | | $2.15 | | | | $2.37 | | | | $(0.14 | ) | | | $2.03 | |
| Less distributions declared to shareholders | | | | | | | | | |
From net investment income | | | $(0.42 | ) | | | $(0.27 | ) | | | $(0.30 | ) | | | $(0.30 | ) | | | $(0.23 | ) |
Net asset value, end of period (x) | | | $16.90 | | | | $18.66 | | | | $16.78 | | | | $14.71 | | | | $15.15 | |
Total return (%) (r)(s)(x) | | | (7.19 | ) | | | 12.89 | | | | 16.32 | | | | (0.82 | ) | | | 15.19 | |
Ratios (%) (to average net assets)
and Supplemental data: | | | | | |
Expenses before expense reductions (f) | | | 0.88 | | | | 0.88 | | | | 0.93 | | | | 0.96 | | | | 0.95 | |
Expenses after expense reductions (f) | | | 0.84 | | | | 0.86 | | | | 0.93 | | | | 0.96 | | | | 0.95 | |
Net investment income | | | 1.80 | | | | 2.51 | | | | 1.89 | | | | 2.45 | | | | 1.86 | |
Portfolio turnover | | | 28 | | | | 27 | | | | 32 | | | | 37 | | | | 43 | |
Net assets at end of period (000 omitted) | | | $2,410,936 | | | | $2,194,432 | | | | $1,834,498 | | | | $1,143,621 | | | | $2,484,795 | |
| |
| Class R1 | | Years ended 8/31 | |
| | | 2015 | | | 2014 | | | 2013 | | | 2012 | | | 2011 | |
Net asset value, beginning of period | | | $16.69 | | | | $15.02 | | | | $13.17 | | | | $13.57 | | | | $11.98 | |
| Income (loss) from investment operations | | | | | | | | | |
Net investment income (d) | | | $0.11 | | | | $0.24 | | | | $0.12 | | | | $0.15 | | | | $0.12 | |
Net realized and unrealized gain (loss) on
investments and foreign currency | | | (1.47 | ) | | | 1.52 | | | | 1.87 | | | | (0.40 | ) | | | 1.57 | |
Total from investment operations | | | $(1.36 | ) | | | $1.76 | | | | $1.99 | | | | $(0.25 | ) | | | $1.69 | |
| Less distributions declared to shareholders | | | | | | | | | |
From net investment income | | | $(0.25 | ) | | | $(0.09 | ) | | | $(0.14 | ) | | | $(0.15 | ) | | | $(0.10 | ) |
Net asset value, end of period (x) | | | $15.08 | | | | $16.69 | | | | $15.02 | | | | $13.17 | | | | $13.57 | |
Total return (%) (r)(s)(x) | | | (8.18 | ) | | | 11.73 | | | | 15.24 | | | | (1.80 | ) | | | 14.09 | |
Ratios (%) (to average net assets)
and Supplemental data: | | | | | |
Expenses before expense reductions (f) | | | 1.88 | | | | 1.88 | | | | 1.93 | | | | 1.96 | | | | 1.95 | |
Expenses after expense reductions (f) | | | 1.84 | | | | 1.86 | | | | 1.93 | | | | 1.96 | | | | 1.95 | |
Net investment income | | | 0.72 | | | | 1.47 | | | | 0.85 | | | | 1.18 | | | | 0.84 | |
Portfolio turnover | | | 28 | | | | 27 | | | | 32 | | | | 37 | | | | 43 | |
Net assets at end of period (000 omitted) | | | $3,509 | | | | $4,243 | | | | $4,034 | | | | $4,914 | | | | $6,288 | |
See Notes to Financial Statements
23
Financial Highlights – continued
| | | | | | | | | | | | | | | | | | | | |
| Class R2 | | Years ended 8/31 | |
| | | 2015 | | | 2014 | | | 2013 | | | 2012 | | | 2011 | |
Net asset value, beginning of period | | | $17.48 | | | | $15.75 | | | | $13.83 | | | | $14.26 | | | | $12.59 | |
| Income (loss) from investment operations | | | | | | | | | |
Net investment income (d) | | | $0.22 | | | | $0.36 | | | | $0.21 | | | | $0.24 | | | | $0.20 | |
Net realized and unrealized gain (loss) on
investments and foreign currency | | | (1.56 | ) | | | 1.57 | | | | 1.95 | | | | (0.44 | ) | | | 1.64 | |
Total from investment operations | | | $(1.34 | ) | | | $1.93 | | | | $2.16 | | | | $(0.20 | ) | | | $1.84 | |
| Less distributions declared to shareholders | | | | | | | | | |
From net investment income | | | $(0.34 | ) | | | $(0.20 | ) | | | $(0.24 | ) | | | $(0.23 | ) | | | $(0.17 | ) |
Net asset value, end of period (x) | | | $15.80 | | | | $17.48 | | | | $15.75 | | | | $13.83 | | | | $14.26 | |
Total return (%) (r)(s)(x) | | | (7.69 | ) | | | 12.32 | | | | 15.79 | | | | (1.32 | ) | | | 14.61 | |
Ratios (%) (to average net assets)
and Supplemental data: | | | | | |
Expenses before expense reductions (f) | | | 1.38 | | | | 1.38 | | | | 1.43 | | | | 1.46 | | | | 1.45 | |
Expenses after expense reductions (f) | | | 1.34 | | | | 1.36 | | | | 1.43 | | | | 1.46 | | | | 1.45 | |
Net investment income | | | 1.29 | | | | 2.06 | | | | 1.41 | | | | 1.78 | | | | 1.37 | |
Portfolio turnover | | | 28 | | | | 27 | | | | 32 | | | | 37 | | | | 43 | |
Net assets at end of period (000 omitted) | | | $169,812 | | | | $182,466 | | | | $136,444 | | | | $107,567 | | | | $91,693 | |
| |
| Class R3 | | Years ended 8/31 | |
| | | 2015 | | | 2014 | | | 2013 | | | 2012 | | | 2011 | |
Net asset value, beginning of period | | | $17.86 | | | | $16.08 | | | | $14.10 | | | | $14.53 | | | | $12.82 | |
| Income (loss) from investment operations | | | | | | | | | |
Net investment income (d) | | | $0.25 | | | | $0.40 | | | | $0.25 | | | | $0.28 | | | | $0.23 | |
Net realized and unrealized gain (loss) on
investments and foreign currency | | | (1.58 | ) | | | 1.61 | | | | 2.00 | | | | (0.45 | ) | | | 1.68 | |
Total from investment operations | | | $(1.33 | ) | | | $2.01 | | | | $2.25 | | | | $(0.17 | ) | | | $1.91 | |
| Less distributions declared to shareholders | | | | | | | | | |
From net investment income | | | $(0.37 | ) | | | $(0.23 | ) | | | $(0.27 | ) | | | $(0.26 | ) | | | $(0.20 | ) |
Net asset value, end of period (x) | | | $16.16 | | | | $17.86 | | | | $16.08 | | | | $14.10 | | | | $14.53 | |
Total return (%) (r)(s)(x) | | | (7.44 | ) | | | 12.56 | | | | 16.13 | | | | (1.06 | ) | | | 14.88 | |
Ratios (%) (to average net assets)
and Supplemental data: | | | | | |
Expenses before expense reductions (f) | | | 1.13 | | | | 1.13 | | | | 1.18 | | | | 1.21 | | | | 1.20 | |
Expenses after expense reductions (f) | | | 1.09 | | | | 1.11 | | | | 1.18 | | | | 1.21 | | | | 1.20 | |
Net investment income | | | 1.46 | | | | 2.28 | | | | 1.63 | | | | 2.05 | | | | 1.54 | |
Portfolio turnover | | | 28 | | | | 27 | | | | 32 | | | | 37 | | | | 43 | |
Net assets at end of period (000 omitted) | | | $165,656 | | | | $229,232 | | | | $195,358 | | | | $168,989 | | | | $154,869 | |
See Notes to Financial Statements
24
Financial Highlights – continued
| | | | | | | | | | | | | | | | | | | | |
| Class R4 | | Years ended 8/31 | |
| | | 2015 | | | 2014 | | | 2013 | | | 2012 | | | 2011 | |
Net asset value, beginning of period | | | $18.09 | | | | $16.27 | | | | $14.26 | | | | $14.70 | | | | $12.96 | |
| Income (loss) from investment operations | | | | | | | | | |
Net investment income (d) | | | $0.29 | | | | $0.45 | | | | $0.25 | | | | $0.32 | | | | $0.28 | |
Net realized and unrealized gain (loss) on
investments and foreign currency | | | (1.60 | ) | | | 1.63 | | | | 2.06 | | | | (0.46 | ) | | | 1.69 | |
Total from investment operations | | | $(1.31 | ) | | | $2.08 | | | | $2.31 | | | | $(0.14 | ) | | | $1.97 | |
| Less distributions declared to shareholders | | | | | | | | | |
From net investment income | | | $(0.42 | ) | | | $(0.26 | ) | | | $(0.30 | ) | | | $(0.30 | ) | | | $(0.23 | ) |
Net asset value, end of period (x) | | | $16.36 | | | | $18.09 | | | | $16.27 | | | | $14.26 | | | | $14.70 | |
Total return (%) (r)(s)(x) | | | (7.26 | ) | | | 12.87 | | | | 16.42 | | | | (0.84 | ) | | | 15.19 | |
Ratios (%) (to average net assets)
and Supplemental data: | | | | | |
Expenses before expense reductions (f) | | | 0.88 | | | | 0.88 | | | | 0.93 | | | | 0.96 | | | | 0.95 | |
Expenses after expense reductions (f) | | | 0.85 | | | | 0.86 | | | | 0.93 | | | | 0.96 | | | | 0.95 | |
Net investment income | | | 1.70 | | | | 2.54 | | | | 1.60 | | | | 2.28 | | | | 1.83 | |
Portfolio turnover | | | 28 | | | | 27 | | | | 32 | | | | 37 | | | | 43 | |
Net assets at end of period (000 omitted) | | | $343,475 | | | | $546,069 | | | | $470,915 | | | | $825,288 | | | | $561,557 | |
| |
| Class R5 (y) | | Years ended 8/31 | |
| | | 2015 | | | 2014 | | | 2013 | | | 2012 | | | 2011 | |
Net asset value, beginning of period | | | $18.02 | | | | $16.21 | | | | $14.20 | | | | $14.63 | | | | $12.90 | |
| Income (loss) from investment operations | | | | | | | | | |
Net investment income (d) | | | $0.32 | | | | $0.46 | | | | $0.33 | | | | $0.17 | | | | $0.26 | |
Net realized and unrealized gain (loss) on
investments and foreign currency | | | (1.60 | ) | | | 1.64 | | | | 1.99 | | | | (0.31 | )(g) | | | 1.69 | |
Total from investment operations | | | $(1.28 | ) | | | $2.10 | | | | $2.32 | | | | $(0.14 | ) | | | $1.95 | |
| Less distributions declared to shareholders | | | | | | | | | |
From net investment income | | | $(0.44 | ) | | | $(0.29 | ) | | | $(0.31 | ) | | | $(0.29 | ) | | | $(0.22 | ) |
Net asset value, end of period (x) | | | $16.30 | | | | $18.02 | | | | $16.21 | | | | $14.20 | | | | $14.63 | |
Total return (%) (r)(s)(x) | | | (7.13 | ) | | | 13.01 | | | | 16.50 | | | | (0.85 | ) | | | 15.07 | |
Ratios (%) (to average net assets)
and Supplemental data: | | | | | |
Expenses before expense reductions (f) | | | 0.79 | | | | 0.79 | | | | 0.81 | | | | 0.89 | | | | 1.05 | |
Expenses after expense reductions (f) | | | 0.75 | | | | 0.77 | | | | 0.81 | | | | 0.89 | | | | 1.05 | |
Net investment income | | | 1.88 | | | | 2.62 | | | | 2.09 | | | | 1.20 | (l) | | | 1.71 | |
Portfolio turnover | | | 28 | | | | 27 | | | | 32 | | | | 37 | | | | 43 | |
Net assets at end of period (000 omitted) | | | $3,010,863 | | | | $2,955,339 | | | | $2,331,325 | | | | $1,433,832 | | | | $26,173 | |
See Notes to Financial Statements
25
Financial Highlights – continued
| | | | | | | | | | | | | | | | | | | | |
| Class 529A | | Years ended 8/31 | |
| | | 2015 | | | 2014 | | | 2013 | | | 2012 | | | 2011 | |
Net asset value, beginning of period | | | $17.81 | | | | $16.03 | | | | $14.06 | | | | $14.49 | | | | $12.78 | |
| Income (loss) from investment operations | | | | | | | | | |
Net investment income (d) | | | $0.26 | | | | $0.39 | | | | $0.25 | | | | $0.27 | | | | $0.22 | |
Net realized and unrealized gain (loss) on
investments and foreign currency | | | (1.58 | ) | | | 1.62 | | | | 1.98 | | | | (0.45 | ) | | | 1.68 | |
Total from investment operations | | | $(1.32 | ) | | | $2.01 | | | | $2.23 | | | | $(0.18 | ) | | | $1.90 | |
| Less distributions declared to shareholders | | | | | | | | | |
From net investment income | | | $(0.37 | ) | | | $(0.23 | ) | | | $(0.26 | ) | | | $(0.25 | ) | | | $(0.19 | ) |
Net asset value, end of period (x) | | | $16.12 | | | | $17.81 | | | | $16.03 | | | | $14.06 | | | | $14.49 | |
Total return (%) (r)(s)(t)(x) | | | (7.43 | ) | | | 12.57 | | | | 16.05 | | | | (1.15 | ) | | | 14.80 | |
Ratios (%) (to average net assets)
and Supplemental data: | | | | | |
Expenses before expense reductions (f) | | | 1.23 | | | | 1.23 | | | | 1.28 | | | | 1.31 | | | | 1.30 | |
Expenses after expense reductions (f) | | | 1.12 | | | | 1.14 | | | | 1.21 | | | | 1.26 | | | | 1.29 | |
Net investment income | | | 1.51 | | | | 2.22 | | | | 1.62 | | | | 1.96 | | | | 1.47 | |
Portfolio turnover | | | 28 | | | | 27 | | | | 32 | | | | 37 | | | | 43 | |
Net assets at end of period (000 omitted) | | | $2,419 | | | | $2,428 | | | | $2,105 | | | | $1,762 | | | | $1,747 | |
| |
| Class 529B | | Years ended 8/31 | |
| | | 2015 | | | 2014 | | | 2013 | | | 2012 | | | 2011 | |
Net asset value, beginning of period | | | $16.80 | | | | $15.14 | | | | $13.25 | | | | $13.57 | | | | $11.99 | |
| Income (loss) from investment operations | | | | | | | | | |
Net investment income (d) | | | $0.10 | | | | $0.25 | | | | $0.12 | | | | $0.13 | | | | $0.09 | |
Net realized and unrealized gain (loss) on
investments and foreign currency | | | (1.47 | ) | | | 1.52 | | | | 1.88 | | | | (0.38 | ) | | | 1.58 | |
Total from investment operations | | | $(1.37 | ) | | | $1.77 | | | | $2.00 | | | | $(0.25 | ) | | | $1.67 | |
| Less distributions declared to shareholders | | | | | | | | | |
From net investment income | | | $(0.24 | ) | | | $(0.11 | ) | | | $(0.11 | ) | | | $(0.07 | ) | | | $(0.09 | ) |
Net asset value, end of period (x) | | | $15.19 | | | | $16.80 | | | | $15.14 | | | | $13.25 | | | | $13.57 | |
Total return (%) (r)(s)(t)(x) | | | (8.17 | ) | | | 11.71 | | | | 15.15 | | | | (1.84 | ) | | | 13.90 | |
Ratios (%) (to average net assets)
and Supplemental data: | | | | | |
Expenses before expense reductions (f) | | | 1.98 | | | | 1.98 | | | | 2.03 | | | | 2.06 | | | | 2.04 | |
Expenses after expense reductions (f) | | | 1.89 | | | | 1.91 | | | | 1.98 | | | | 2.01 | | | | 2.04 | |
Net investment income | | | 0.63 | | | | 1.49 | | | | 0.82 | | | | 1.03 | | | | 0.66 | |
Portfolio turnover | | | 28 | | | | 27 | | | | 32 | | | | 37 | | | | 43 | |
Net assets at end of period (000 omitted) | | | $138 | | | | $192 | | | | $188 | | | | $199 | | | | $366 | |
See Notes to Financial Statements
26
Financial Highlights – continued
| | | | | | | | | | | | | | | | | | | | |
| Class 529C | | Years ended 8/31 | |
| | | 2015 | | | 2014 | | | 2013 | | | 2012 | | | 2011 | |
Net asset value, beginning of period | | | $16.61 | | | | $14.98 | | | | $13.17 | | | | $13.56 | | | | $12.00 | |
| Income (loss) from investment operations | | | | | | | | | |
Net investment income (d) | | | $0.11 | | | | $0.23 | | | | $0.12 | | | | $0.15 | | | | $0.11 | |
Net realized and unrealized gain (loss) on
investments and foreign currency | | | (1.46 | ) | | | 1.52 | | | | 1.86 | | | | (0.41 | ) | | | 1.56 | |
Total from investment operations | | | $(1.35 | ) | | | $1.75 | | | | $1.98 | | | | $(0.26 | ) | | | $1.67 | |
| Less distributions declared to shareholders | | | | | | | | | |
From net investment income | | | $(0.25 | ) | | | $(0.12 | ) | | | $(0.17 | ) | | | $(0.13 | ) | | | $(0.11 | ) |
Net asset value, end of period (x) | | | $15.01 | | | | $16.61 | | | | $14.98 | | | | $13.17 | | | | $13.56 | |
Total return (%) (r)(s)(t)(x) | | | (8.17 | ) | | | 11.68 | | | | 15.17 | | | | (1.83 | ) | | | 13.89 | |
Ratios (%) (to average net assets)
and Supplemental data: | | | | | |
Expenses before expense reductions (f) | | | 1.98 | | | | 1.98 | | | | 2.03 | | | | 2.06 | | | | 2.05 | |
Expenses after expense reductions (f) | | | 1.89 | | | | 1.91 | | | | 1.98 | | | | 2.01 | | | | 2.04 | |
Net investment income | | | 0.72 | | | | 1.43 | | | | 0.81 | | | | 1.19 | | | | 0.81 | |
Portfolio turnover | | | 28 | | | | 27 | | | | 32 | | | | 37 | | | | 43 | |
Net assets at end of period (000 omitted) | | | $980 | | | | $1,098 | | | | $950 | | | | $914 | | | | $906 | |
| (d) | Per share data is based on average shares outstanding. |
| (f) | Ratios do not reflect reductions from fees paid indirectly, if applicable. |
| (g) | The per share amount varies from the net realized and unrealized gain/loss for the period because of the timing of sales of fund shares and the per share amount of realized and unrealized gains and losses at such time. |
| (l) | The net investment income ratio does not vary by the class specific expense differential because of the timing of sales of fund shares and the allocation of fund level income at such time. |
| (r) | Certain expenses have been reduced without which performance would have been lower. |
| (s) | From time to time the fund may receive proceeds from litigation settlements, without which performance would be lower. |
| (t) | Total returns do not include any applicable sales charges. |
| (x) | The net asset values and total returns have been calculated on net assets which include adjustments made in accordance with U.S. generally accepted accounting principles required at period end for financial reporting purposes. |
| (y) | On May 10, 2012, sales of Class W shares (including exchanges) were suspended. On May 11, 2012, certain Class W shares were automatically converted to Class I shares. Shareholders of certain Class W shares became shareholders of Class I and received Class I shares with a total net asset value equal to their Class W shares at the time of the conversion. On May 30, 2012, remaining Class W shares, which represented MFS seed money, were redesignated Class R5. Class R5 shares are generally available only to certain eligible retirement plans and to funds distributed by MFD. Class R5 shares do not pay a 12b-1 distribution fee or sub-accounting costs. On June 1, 2012, Class R5 shares were offered for sale to the public. |
See Notes to Financial Statements
27
NOTES TO FINANCIAL STATEMENTS
(1) Business and Organization
MFS Research International Fund (the fund) is a diversified series of MFS Series Trust I (the trust). The trust is organized as a Massachusetts business trust and is registered under the Investment Company Act of 1940, as amended, as an open-end management investment company.
The fund is an investment company and accordingly follows the investment company accounting and reporting guidance of the Financial Accounting Standards Board (FASB) Accounting Standards Codification Topic 946 Financial Services – Investment Companies.
(2) Significant Accounting Policies
General – The preparation of financial statements in conformity with U.S. generally accepted accounting principles requires management to make estimates and assumptions that affect the reported amounts of assets and liabilities, and disclosure of contingent assets and liabilities at the date of the financial statements and the reported amounts of increases and decreases in net assets from operations during the reporting period. Actual results could differ from those estimates. In the preparation of these financial statements, management has evaluated subsequent events occurring after the date of the fund’s Statement of Assets and Liabilities through the date that the financial statements were issued. The fund invests in foreign securities. Investments in foreign securities are vulnerable to the effects of changes in the relative values of the local currency and the U.S. dollar and to the effects of changes in each country’s legal, political, and economic environment.
In June 2014, FASB issued Accounting Standards Update 2014-11, Transfers and Servicing (Topic 860) – Repurchase-to-Maturity Transactions, Repurchase Financings, and Disclosures (“ASU 2014-11”). ASU 2014-11 changes the accounting for repurchase-to-maturity transactions (i.e., repurchase agreements that settle at the same time as the maturity of the transferred financial asset) and enhances the required disclosures for repurchase agreements and other similar transactions. Although still evaluating the potential impacts of ASU 2014-11 to the fund, management expects that the impact of the fund’s adoption will be limited to additional financial statement disclosures which would first be effective for interim reporting periods beginning after March 15, 2015.
Balance Sheet Offsetting – The fund’s accounting policy with respect to balance sheet offsetting is that, absent an event of default by the counterparty or a termination of the agreement, the International Swaps and Derivatives Association (ISDA) Master Agreement does not result in an offset of reported amounts of financial assets and financial liabilities in the Statement of Assets and Liabilities across transactions between the fund and the applicable counterparty. The fund’s right to setoff may be restricted or prohibited by the bankruptcy or insolvency laws of the particular jurisdiction to which a specific master netting agreement counterparty is subject. Balance sheet offsetting disclosures, to the extent applicable to the fund, have been included in the fund’s Significant Accounting Policies note under the captions for each of the fund’s in-scope financial instruments and transactions.
28
Notes to Financial Statements – continued
Investment Valuations – Equity securities, including restricted equity securities, are generally valued at the last sale or official closing price as provided by a third-party pricing service on the market or exchange on which they are primarily traded. Equity securities, for which there were no sales reported that day, are generally valued at the last quoted daily bid quotation as provided by a third-party pricing service on the market or exchange on which such securities are primarily traded. Short-term instruments with a maturity at issuance of 60 days or less may be valued at amortized cost, which approximates market value. Open-end investment companies are generally valued at net asset value per share. Securities and other assets generally valued on the basis of information from a third-party pricing service may also be valued at a broker/dealer bid quotation. Values obtained from third-party pricing services can utilize both transaction data and market information such as yield, quality, coupon rate, maturity, type of issue, trading characteristics, and other market data. The values of foreign securities and other assets and liabilities expressed in foreign currencies are converted to U.S. dollars using the mean of bid and asked prices for rates provided by a third-party pricing service.
The Board of Trustees has delegated primary responsibility for determining or causing to be determined the value of the fund’s investments (including any fair valuation) to the adviser pursuant to valuation policies and procedures approved by the Board. If the adviser determines that reliable market quotations are not readily available, investments are valued at fair value as determined in good faith by the adviser in accordance with such procedures under the oversight of the Board of Trustees. Under the fund’s valuation policies and procedures, market quotations are not considered to be readily available for most types of debt instruments and floating rate loans and many types of derivatives. These investments are generally valued at fair value based on information from third-party pricing services. In addition, investments may be valued at fair value if the adviser determines that an investment’s value has been materially affected by events occurring after the close of the exchange or market on which the investment is principally traded (such as foreign exchange or market) and prior to the determination of the fund’s net asset value, or after the halting of trading of a specific security where trading does not resume prior to the close of the exchange or market on which the security is principally traded. Events that occur on a frequent basis after foreign markets close (such as developments in foreign markets and significant movements in the U.S. markets) and prior to the determination of the fund’s net asset value may be deemed to have a material effect on the value of securities traded in foreign markets. Accordingly, the fund’s foreign equity securities may often be valued at fair value. The adviser generally relies on third-party pricing services or other information (such as the correlation with price movements of similar securities in the same or other markets; the type, cost and investment characteristics of the security; the business and financial condition of the issuer; and trading and other market data) to assist in determining whether to fair value and at what value to fair value an investment. The value of an investment for purposes of calculating the fund’s net asset value can differ depending on the source and method used to determine value. When fair valuation is used, the value of an investment used to determine the fund’s net asset value may differ from quoted or published prices for the same investment. There can be no assurance that the fund could obtain the fair value assigned to an investment if it were to sell the investment at the same time at which the fund determines its net asset value per share.
29
Notes to Financial Statements – continued
Various inputs are used in determining the value of the fund’s assets or liabilities. These inputs are categorized into three broad levels. In certain cases, the inputs used to measure fair value may fall into different levels of the fair value hierarchy. In such cases, an investment’s level within the fair value hierarchy is based on the lowest level of input that is significant to the fair value measurement. The fund’s assessment of the significance of a particular input to the fair value measurement in its entirety requires judgment, and considers factors specific to the investment. Level 1 includes unadjusted quoted prices in active markets for identical assets or liabilities. Level 2 includes other significant observable market-based inputs (including quoted prices for similar securities, interest rates, prepayment speed, and credit risk). Level 3 includes unobservable inputs, which may include the adviser’s own assumptions in determining the fair value of investments. The following is a summary of the levels used as of August 31, 2015 in valuing the fund’s assets or liabilities:
| | | | | | | | | | | | | | | | |
| Investments at Value | | Level 1 | | | Level 2 | | | Level 3 | | | Total | |
| Equity Securities: | | | | | | | | | | | | | | | | |
Japan | | | $1,486,136,623 | | | | $— | | | | $— | | | | $1,486,136,623 | |
United Kingdom | | | 20,618,166 | | | | 1,401,709,993 | | | | — | | | | 1,422,328,159 | |
Switzerland | | | 1,094,890,368 | | | | — | | | | — | | | | 1,094,890,368 | |
France | | | 662,868,882 | | | | — | | | | — | | | | 662,868,882 | |
Germany | | | 518,462,401 | | | | — | | | | — | | | | 518,462,401 | |
Netherlands | | | 319,298,165 | | | | — | | | | — | | | | 319,298,165 | |
Hong Kong | | | 274,030,715 | | | | — | | | | — | | | | 274,030,715 | |
Australia | | | 260,110,338 | | | | — | | | | — | | | | 260,110,338 | |
Sweden | | | 194,824,340 | | | | — | | | | — | | | | 194,824,340 | |
Other Countries | | | 1,001,445,703 | | | | 25,542,676 | | | | — | | | | 1,026,988,379 | |
| Mutual Funds | | | 89,081,615 | | | | — | | | | — | | | | 89,081,615 | |
| Total Investments | | | $5,921,767,316 | | | | $1,427,252,669 | | | | $— | | | | $7,349,019,985 | |
For further information regarding security characteristics, see the Portfolio of Investments.
Of the level 2 investments presented above, equity investments amounting to $1,064,998,145 would have been considered level 1 investments at the beginning of the period. Of the level 1 investments presented above, equity investments amounting to $29,688,354 would have been considered level 2 investments at the beginning of the period. The primary reason for changes in the classifications between levels 1 and 2 occurs when foreign equity securities are fair valued using other observable market-based inputs in place of the closing exchange price due to events occurring after the close of the exchange or market on which the investment is principally traded. The fund’s foreign equity securities may often be valued at fair value. The fund’s policy is to recognize transfers between the levels as of the end of the period.
Foreign Currency Translation – Purchases and sales of foreign investments, income, and expenses are converted into U.S. dollars based upon currency exchange rates prevailing on the respective dates of such transactions or on the reporting date for foreign denominated receivables and payables. Gains and losses attributable to foreign currency exchange rates on sales of securities are recorded for financial statement purposes as net realized gains and losses on investments. Gains and losses attributable
30
Notes to Financial Statements – continued
to foreign exchange rate movements on receivables, payables, income and expenses are recorded for financial statement purposes as foreign currency transaction gains and losses. That portion of both realized and unrealized gains and losses on investments that results from fluctuations in foreign currency exchange rates is not separately disclosed.
Security Loans – Under its Securities Lending Agency Agreement with the fund, State Street Bank and Trust Company (“State Street”), as lending agent, loans the securities of the fund to certain qualified institutions (the “Borrowers”) approved by the fund. The loans are collateralized by cash and/or U.S. Treasury and federal agency obligations in an amount typically at least equal to the market value of the securities loaned. On loans collateralized by cash, the cash collateral is invested in a money market fund. The market value of the loaned securities is determined at the close of business of the fund and any additional required collateral is delivered to the fund on the next business day. State Street provides the fund with indemnification against Borrower default. In the event of Borrower default, State Street will for the benefit of the fund either purchase securities identical to those loaned or, when such purchase is commercially impracticable, pay the fund the market value of the loaned securities. In return, State Street assumes the fund’s rights to the related collateral. If the collateral value is less than the cost to purchase identical securities, State Street is responsible for the shortfall, but only to the extent that such shortfall is not due to a decline in collateral value resulting from collateral reinvestment for which the fund bears the risk of loss. A portion of the income generated upon investment of the collateral is remitted to the Borrowers, and the remainder is allocated between the fund and the lending agent. On loans collateralized by U.S. Treasury and/or federal agency obligations, a fee is received from the Borrower, and is allocated between the fund and the lending agent. Income from securities lending is included in “Interest” income in the Statement of Operations. The dividend and interest income earned on the securities loaned is accounted for in the same manner as other dividend and interest income. At August 31, 2015, there were no securities on loan or collateral outstanding.
Indemnifications – Under the fund’s organizational documents, its officers and Trustees may be indemnified against certain liabilities and expenses arising out of the performance of their duties to the fund. Additionally, in the normal course of business, the fund enters into agreements with service providers that may contain indemnification clauses. The fund’s maximum exposure under these agreements is unknown as this would involve future claims that may be made against the fund that have not yet occurred.
Investment Transactions and Income – Investment transactions are recorded on the trade date. Interest income is recorded on the accrual basis. Dividends received in cash are recorded on the ex-dividend date. Certain dividends from foreign securities will be recorded when the fund is informed of the dividend if such information is obtained subsequent to the ex-dividend date. Dividend and interest payments received in additional securities are recorded on the ex-dividend or ex-interest date in an amount equal to the value of the security on such date.
The fund may receive proceeds from litigation settlements. Any proceeds received from litigation involving portfolio holdings are reflected in the Statement of Operations in
31
Notes to Financial Statements – continued
realized gain/loss if the security has been disposed of by the fund or in unrealized gain/loss if the security is still held by the fund. Any other proceeds from litigation not related to portfolio holdings are reflected as other income in the Statement of Operations.
Fees Paid Indirectly – The fund’s custody fee may be reduced by a credit earned under an arrangement that measures the value of U.S. dollars deposited with the custodian by the fund. The amount of the credit, for the year ended August 31, 2015, is shown as a reduction of total expenses in the Statement of Operations.
Tax Matters and Distributions – The fund intends to qualify as a regulated investment company, as defined under Subchapter M of the Internal Revenue Code, and to distribute all of its taxable income, including realized capital gains. As a result, no provision for federal income tax is required. The fund’s federal tax returns, when filed, will remain subject to examination by the Internal Revenue Service for a three year period. Management has analyzed the fund’s tax positions taken on federal and state tax returns for all open tax years and does not believe that there are any uncertain tax positions that require recognition of a tax liability. Foreign taxes, if any, have been accrued by the fund in the accompanying financial statements in accordance with the applicable foreign tax law. Foreign income taxes may be withheld by certain countries in which the fund invests. Additionally, capital gains realized by the fund on securities issued in or by certain foreign countries may be subject to capital gains tax imposed by those countries.
Distributions to shareholders are recorded on the ex-dividend date. Income and capital gain distributions are determined in accordance with income tax regulations, which may differ from U.S. generally accepted accounting principles. Certain capital accounts in the financial statements are periodically adjusted for permanent differences in order to reflect their tax character. These adjustments have no impact on net assets or net asset value per share. Temporary differences which arise from recognizing certain items of income, expense, gain or loss in different periods for financial statement and tax purposes will reverse at some time in the future. Distributions in excess of net investment income or net realized gains are temporary overdistributions for financial statement purposes resulting from differences in the recognition or classification of income or distributions for financial statement and tax purposes.
Book/tax differences primarily relate to wash sale loss deferrals.
The tax character of distributions declared to shareholders for the last two fiscal years is as follows:
| | | | | | | | |
| | | 8/31/15 | | | 8/31/14 | |
| Ordinary income (including any short-term capital gains) | | | $172,549,524 | | | | $103,250,534 | |
32
Notes to Financial Statements – continued
The federal tax cost and the tax basis components of distributable earnings were as follows:
| | | | |
| As of 8/31/15 | | | |
| Cost of investments | | | $7,315,470,859 | |
| Gross appreciation | | | 796,593,432 | |
| Gross depreciation | | | (763,044,306 | ) |
| Net unrealized appreciation (depreciation) | | | $33,549,126 | |
| Undistributed ordinary income | | | 126,269,068 | |
| Capital loss carryforwards | | | (322,684,611 | ) |
| Other temporary differences | | | (1,359,566 | ) |
Under the Regulated Investment Company Modernization Act of 2010 (the “Act”), net capital losses recognized for fund fiscal years beginning after August 31, 2011 may be carried forward indefinitely, and their character is retained as short-term and/or long-term losses (“post-enactment losses”). Previously, net capital losses were carried forward for eight years and treated as short-term losses (“pre-enactment losses”). As a transition rule, the Act requires that all post-enactment net capital losses be used before pre-enactment net capital losses.
As of August 31, 2015, the fund had capital loss carryforwards available to offset future realized gains. Such pre-enactment losses expire as follows:
Multiple Classes of Shares of Beneficial Interest – The fund offers multiple classes of shares, which differ in their respective distribution, service, and program manager fees. The fund’s income, realized and unrealized gain (loss), and common expenses are allocated to shareholders based on the daily net assets of each class. Dividends are declared separately for each class. Differences in per share dividend rates are generally due to differences in separate class expenses. Class B and Class 529B shares will convert to Class A and Class 529A shares, respectively, approximately eight years after
33
Notes to Financial Statements – continued
purchase. The fund’s distributions declared to shareholders as reported in the Statements of Changes in Net Assets are presented by class as follows:
| | | | | | | | |
| | | From net investment
income | |
| | | Year
ended
8/31/15 | | | Year
ended
8/31/14 | |
| Class A | | | $26,484,235 | | | | $15,702,653 | |
| Class B | | | 190,010 | | | | 102,139 | |
| Class C | | | 1,249,658 | | | | 675,749 | |
| Class I | | | 49,946,711 | | | | 31,156,722 | |
| Class R1 | | | 61,803 | | | | 23,279 | |
| Class R2 | | | 3,461,556 | | | | 1,827,492 | |
| Class R3 | | | 4,609,216 | | | | 2,842,760 | |
| Class R4 | | | 12,429,398 | | | | 7,705,916 | |
| Class R5 | | | 74,050,172 | | | | 43,174,399 | |
| Class 529A | | | 48,384 | | | | 30,527 | |
| Class 529B | | | 2,822 | | | | 1,412 | |
| Class 529C | | | 15,559 | | | | 7,486 | |
| Total | | | $172,549,524 | | | | $103,250,534 | |
(3) Transactions with Affiliates
Investment Adviser – The fund has an investment advisory agreement with MFS to provide overall investment management and related administrative services and facilities to the fund. The management fee is computed daily and paid monthly at the following annual rates:
| | | | |
| First $1 billion of average daily net assets | | | 0.90 | % |
| Next $1 billion of average daily net assets | | | 0.80 | % |
| Average daily net assets in excess of $2 billion | | | 0.70 | % |
The investment adviser has agreed in writing to reduce its management fee to 0.60% of average daily net assets in excess of $5 billion up to $10 billion and 0.55% of average daily net assets in excess of $10 billion. This written agreement will continue until modified by the fund’s Board of Trustees, but such agreement will continue at least until December 31, 2016. For the year ended August 31, 2015, this management fee reduction amounted to $2,457,093, which is included in the reduction of total expenses in the Statement of Operations. MFS has also agreed in writing to reduce its management fee by a specified amount if certain MFS mutual fund assets exceed thresholds agreed to by MFS and the fund’s Board of Trustees. For the year ended August 31, 2015, this management fee reduction amounted to $482,530, which is included in the reduction of total expenses in the Statement of Operations. The management fee incurred for the year ended August 31, 2015 was equivalent to an annual effective rate of 0.70% of the fund’s average daily net assets.
Distributor – MFS Fund Distributors, Inc. (MFD), a wholly-owned subsidiary of MFS, as distributor, received $97,010 and $1,918 for the year ended August 31, 2015, as its portion of the initial sales charge on sales of Class A and Class 529A shares of the fund, respectively.
34
Notes to Financial Statements – continued
The Board of Trustees has adopted a distribution plan for certain share classes pursuant to Rule 12b-1 of the Investment Company Act of 1940.
The fund’s distribution plan provides that the fund will pay MFD for services provided by MFD and financial intermediaries in connection with the distribution and servicing of certain share classes. One component of the plan is a distribution fee paid to MFD and another component of the plan is a service fee paid to MFD. MFD may subsequently pay all, or a portion, of the distribution and/or service fees to financial intermediaries.
Distribution Plan Fee Table:
| | | | | | | | | | | | | | | | | | | | |
| | | Distribution
Fee Rate (d) | | | Service
Fee Rate (d) | | | Total
Distribution Plan (d) | | | Annual
Effective Rate (e) | | | Distribution
and Service
Fee | |
| Class A | | | — | | | | 0.25% | | | | 0.25% | | | | 0.25% | | | | $3,072,274 | |
| Class B | | | 0.75% | | | | 0.25% | | | | 1.00% | | | | 1.00% | | | | 139,951 | |
| Class C | | | 0.75% | | | | 0.25% | | | | 1.00% | | | | 1.00% | | | | 842,813 | |
| Class R1 | | | 0.75% | | | | 0.25% | | | | 1.00% | | | | 1.00% | | | | 38,191 | |
| Class R2 | | | 0.25% | | | | 0.25% | | | | 0.50% | | | | 0.50% | | | | 891,538 | |
| Class R3 | | | — | | | | 0.25% | | | | 0.25% | | | | 0.25% | | | | 496,165 | |
| Class 529A | | | — | | | | 0.25% | | | | 0.25% | | | | 0.22% | | | | 5,996 | |
| Class 529B | | | 0.75% | | | | 0.25% | | | | 1.00% | | | | 0.99% | | | | 1,675 | |
| Class 529C | | | 0.75% | | | | 0.25% | | | | 1.00% | | | | 1.00% | | | | 10,303 | |
| Total Distribution and Service Fees | | | | | | | | $5,498,906 | |
| (d) | In accordance with the distribution plan for certain classes, the fund pays distribution and/or service fees equal to these annual percentage rates of each class’s average daily net assets. The distribution and service fee rates disclosed by class represent the current rates in effect at the end of the reporting period. Any rate changes, if applicable, are detailed below. |
| (e) | The annual effective rates represent actual fees incurred under the distribution plan for the year ended August 31, 2015 based on each class’s average daily net assets. MFD has voluntarily agreed to rebate a portion of each class’s 0.25% service fee attributable to accounts for which MFD retains the 0.25% service fee except for accounts attributable to MFS or its affiliates’ seed money. For the year ended August 31, 2015, this rebate amounted to $9,792, $102, $110, $2, $644, $14, and $4 for Class A, Class B, Class C, Class R2, Class 529A, Class 529B, and Class 529C, respectively, and is included in the reduction of total expenses in the Statement of Operations. |
Certain Class A shares are subject to a contingent deferred sales charge (CDSC) in the event of a shareholder redemption within 18 months of purchase. Class C and Class 529C shares are subject to a CDSC in the event of a shareholder redemption within 12 months of purchase. Class B and Class 529B shares are subject to a CDSC in the event of a shareholder redemption within six years of purchase. All contingent deferred sales charges are paid to MFD and during the year ended August 31, 2015, were as follows:
| | | | |
| | | Amount | |
| Class A | | | $243 | |
| Class B | | | 11,161 | |
| Class C | | | 5,549 | |
| Class 529B | | | 4 | |
| Class 529C | | | 39 | |
35
Notes to Financial Statements – continued
The fund has entered into and may from time to time enter into contracts with program managers and other parties which administer the tuition programs through which an investment in the fund’s 529 share classes is made. The fund has entered into an agreement with MFD pursuant to which MFD receives an annual fee of up to 0.10% of the average daily net assets attributable to each 529 share class. MFD has agreed to waive a portion of this fee in an amount equal to 0.05% of the average daily net assets for each 529 share class. This waiver agreement will expire on December 31, 2016, unless MFD elects to extend the waiver. For the year ended August 31, 2015, this waiver amounted to $1,798 and is included in the reduction of total expenses in the Statement of Operations. The program manager fee incurred for the year ended August 31, 2015 was equivalent to an annual effective rate of 0.05% of the average daily net assets attributable to each 529 share class. The services provided by MFD, or a third party with which MFD contracts, include recordkeeping and tax reporting and account services, as well as services designed to maintain the program’s compliance with the Internal Revenue Code and other regulatory requirements. Program manager fees and waivers for the year ended August 31, 2015, were as follows:
| | | | | | | | |
| | | Fee | | | Waiver | |
| Class 529A | | | $2,398 | | | | $1,199 | |
| Class 529B | | | 168 | | | | 84 | |
| Class 529C | | | 1,030 | | | | 515 | |
| Total Program Manager Fees and Waivers | | | $3,596 | | | | $1,798 | |
Shareholder Servicing Agent – MFS Service Center, Inc. (MFSC), a wholly-owned subsidiary of MFS, receives a fee from the fund for its services as shareholder servicing agent calculated as a percentage of the average daily net assets of the fund as determined periodically under the supervision of the fund’s Board of Trustees. For the year ended August 31, 2015, the fee was $265,665, which equated to 0.0036% annually of the fund’s average daily net assets. MFSC also receives payment from the fund for out-of-pocket expenses, sub-accounting and other shareholder servicing costs which may be paid to affiliated and unaffiliated service providers. Class R5 shares do not incur sub-accounting fees. For the year ended August 31, 2015, these out-of-pocket expenses, sub-accounting and other shareholder servicing costs amounted to $4,365,283.
Administrator – MFS provides certain financial, legal, shareholder communications, compliance, and other administrative services to the fund. Under an administrative services agreement, the fund reimburses MFS the costs incurred to provide these services. The fund is charged an annual fixed amount of $17,500 plus a fee based on average net assets. The administrative services fee incurred for the year ended August 31, 2015 was equivalent to an annual effective rate of 0.0087% of the fund’s average daily net assets.
Trustees’ and Officers’ Compensation – The fund pays compensation to independent Trustees in the form of a retainer, attendance fees, and additional compensation to Board and Committee chairpersons. The fund does not pay compensation directly to Trustees or officers of the fund who are also officers of the investment adviser, all of whom receive remuneration for their services to the fund from MFS. Certain officers and Trustees of the fund are officers or directors of MFS, MFD, and MFSC.
36
Notes to Financial Statements – continued
Prior to December 31, 2001, the fund had an unfunded defined benefit plan (“DB plan”) for independent Trustees. As of December 31, 2001, the Board took action to terminate the DB plan with respect to then-current and any future independent Trustees, such that the DB plan covers only certain of those former independent Trustees who retired on or before December 31, 2001. The DB plan resulted in a pension expense of $188 and is included in “Independent Trustees’ compensation” in the Statement of Operations for the year ended August 31, 2015. The liability for deferred retirement benefits payable to certain independent Trustees under the DB plan amounted to $945 at August 31, 2015, and is included in “Payable for independent Trustees’ compensation” in the Statement of Assets and Liabilities.
Other – Effective November 1, 2014, this fund and certain other funds managed by MFS (the funds) have entered into a service agreement (the ISO Agreement) which provides for payment of fees solely by the funds to Tarantino LLC in return for the provision of services of an Independent Senior Officer (ISO) for the funds. Frank L. Tarantino serves as the ISO and is an officer of the funds and the sole member of Tarantino LLC. The funds can terminate the ISO Agreement with Tarantino LLC at any time under the terms of the ISO Agreement. Prior to November 1, 2014, the funds had entered into a service agreement (the Compliance Officer Agreement) which provided for payment of fees by the funds to Tarantino LLC in return for the provision of services of an Independent Chief Compliance Officer (ICCO) for the funds. Prior to November 1, 2014, Frank L. Tarantino served as the ICCO. Effective October 31, 2014, Mr. Tarantino resigned as ICCO and the Compliance Officer Agreement between the funds and Tarantino LLC was terminated. For the year ended August 31, 2015, the aggregate fees paid by the fund under these agreements were $27,915 and are included in “Miscellaneous” expense in the Statement of Operations. MFS had agreed to reimburse the fund for a portion of the payments made by the fund for the services under the Compliance Officer Agreement in the amount of $2,435, which is included in the reduction of total expenses in the Statement of Operations. Additionally, MFS has agreed to bear all expenses associated with office space, other administrative support, and supplies provided to the ICCO and ISO.
The fund invests in the MFS Institutional Money Market Portfolio which is managed by MFS and seeks current income consistent with preservation of capital and liquidity. Income earned on this investment is included in “Dividends from underlying affiliated funds” in the Statement of Operations. This money market fund does not pay a management fee to MFS.
On September 11, 2013, MFS redeemed 7,903 shares of Class R5 for an aggregate amount of $135,774. On March 18, 2015, MFS purchased 1,445 shares of Class I for an aggregate amount of $25,994.
(4) Portfolio Securities
For the year ended August 31, 2015, purchases and sales of investments, other than short-term obligations, aggregated $2,738,118,188 and $2,061,826,358, respectively.
37
Notes to Financial Statements – continued
(5) Shares of Beneficial Interest
The fund’s Declaration of Trust permits the Trustees to issue an unlimited number of full and fractional shares of beneficial interest. Transactions in fund shares were as follows:
| | | | | | | | | | | | | | | | |
| | | Year ended
8/31/15 | | | Year ended
8/31/14 | |
| | | Shares | | | Amount | | | Shares | | | Amount | |
| Shares sold | | | | | | | | | | | | | | | | |
Class A | | | 25,761,448 | | | | $434,059,715 | | | | 11,795,045 | | | | $210,179,639 | |
Class B | | | 82,969 | | | | 1,374,515 | | | | 73,919 | | | | 1,254,919 | |
Class C | | | 806,647 | | | | 13,111,390 | | | | 779,624 | | | | 12,932,437 | |
Class I | | | 48,867,468 | | | | 884,069,791 | | | | 32,553,405 | | | | 597,030,708 | |
Class R1 | | | 53,694 | | | | 864,071 | | | | 48,002 | | | | 787,268 | |
Class R2 | | | 3,062,773 | | | | 51,036,056 | | | | 3,262,913 | | | | 55,773,824 | |
Class R3 | | | 2,335,740 | | | | 39,748,666 | | | | 4,217,815 | | | | 73,822,772 | |
Class R4 | | | 5,235,464 | | | | 89,945,000 | | | | 6,760,440 | | | | 120,226,134 | |
Class R5 | | | 25,520,269 | | | | 434,683,969 | | | | 23,987,940 | | | | 423,700,354 | |
Class 529A | | | 29,634 | | | | 509,312 | | | | 20,890 | | | | 363,424 | |
Class 529B | | | 2,076 | | | | 33,456 | | | | 2,494 | | | | 41,383 | |
Class 529C | | | 9,954 | | | | 158,597 | | | | 10,025 | | | | 164,945 | |
| | | 111,768,136 | | | | $1,949,594,538 | | | | 83,512,512 | | | | $1,496,277,807 | |
| | | | |
| Shares issued to shareholders in reinvestment of distributions | | | | | | | | | | | | | | | | |
Class A | | | 1,314,652 | | | | $21,665,465 | | | | 740,280 | | | | $12,917,878 | |
Class B | | | 9,844 | | | | 156,227 | | | | 5,142 | | | | 86,227 | |
Class C | | | 43,975 | | | | 682,930 | | | | 21,795 | | | | 358,525 | |
Class I | | | 2,157,499 | | | | 36,699,053 | | | | 1,243,827 | | | | 22,388,889 | |
Class R1 | | | 4,026 | | | | 61,593 | | | | 1,431 | | | | 23,203 | |
Class R2 | | | 205,523 | | | | 3,282,204 | | | | 101,560 | | | | 1,719,409 | |
Class R3 | | | 282,774 | | | | 4,609,216 | | | | 164,702 | | | | 2,842,760 | |
Class R4 | | | 747,936 | | | | 12,325,993 | | | | 428,261 | | | | 7,473,150 | |
Class R5 | | | 4,499,401 | | | | 73,790,177 | | | | 2,485,573 | | | | 43,174,399 | |
Class 529A | | | 2,978 | | | | 48,384 | | | | 1,773 | | | | 30,527 | |
Class 529B | | | 183 | | | | 2,822 | | | | 86 | | | | 1,412 | |
Class 529C | | | 1,022 | | | | 15,559 | | | | 464 | | | | 7,486 | |
| | | 9,269,813 | | | | $153,339,623 | | | | 5,194,894 | | | | $91,023,865 | |
38
Notes to Financial Statements – continued
| | | | | | | | | | | | | | | | |
| | | Year ended
8/31/15 | | | Year ended
8/31/14 | |
| | | Shares | | | Amount | | | Shares | | | Amount | |
| Shares reacquired | | | | | | | | | | | | | | | | |
Class A | | | (20,588,024 | ) | | | $(350,841,007 | ) | | | (15,156,261 | ) | | | $(270,617,354 | ) |
Class B | | | (356,450 | ) | | | (5,905,536 | ) | | | (370,599 | ) | | | (6,313,790 | ) |
Class C | | | (1,197,789 | ) | | | (19,367,452 | ) | | | (1,085,852 | ) | | | (18,135,045 | ) |
Class I | | | (25,928,712 | ) | | | (459,211,876 | ) | | | (25,510,410 | ) | | | (468,165,738 | ) |
Class R1 | | | (79,342 | ) | | | (1,263,041 | ) | | | (63,860 | ) | | | (1,051,501 | ) |
Class R2 | | | (2,959,541 | ) | | | (49,394,721 | ) | | | (1,589,201 | ) | | | (27,401,731 | ) |
Class R3 | | | (5,200,590 | ) | | | (88,179,329 | ) | | | (3,700,880 | ) | | | (65,149,095 | ) |
Class R4 | | | (15,183,056 | ) | | | (259,923,975 | ) | | | (5,948,182 | ) | | | (105,874,108 | ) |
Class R5 | | | (9,305,492 | ) | | | (160,868,507 | ) | | | (6,253,975 | ) | | | (111,106,638 | ) |
Class 529A | | | (18,777 | ) | | | (319,162 | ) | | | (17,644 | ) | | | (308,796 | ) |
Class 529B | | | (4,596 | ) | | | (72,458 | ) | | | (3,584 | ) | | | (59,757 | ) |
Class 529C | | | (11,785 | ) | | | (182,386 | ) | | | (7,843 | ) | | | (128,677 | ) |
| | | (80,834,154 | ) | | | $(1,395,529,450 | ) | | | (59,708,291 | ) | | | $(1,074,312,230 | ) |
| | | | |
| Net change | | | | | | | | | | | | | | | | |
Class A | | | 6,488,076 | | | | $104,884,173 | | | | (2,620,936 | ) | | | $(47,519,837 | ) |
Class B | | | (263,637 | ) | | | (4,374,794 | ) | | | (291,538 | ) | | | (4,972,644 | ) |
Class C | | | (347,167 | ) | | | (5,573,132 | ) | | | (284,433 | ) | | | (4,844,083 | ) |
Class I | | | 25,096,255 | | | | 461,556,968 | | | | 8,286,822 | | | | 151,253,859 | |
Class R1 | | | (21,622 | ) | | | (337,377 | ) | | | (14,427 | ) | | | (241,030 | ) |
Class R2 | | | 308,755 | | | | 4,923,539 | | | | 1,775,272 | | | | 30,091,502 | |
Class R3 | | | (2,582,076 | ) | | | (43,821,447 | ) | | | 681,637 | | | | 11,516,437 | |
Class R4 | | | (9,199,656 | ) | | | (157,652,982 | ) | | | 1,240,519 | | | | 21,825,176 | |
Class R5 | | | 20,714,178 | | | | 347,605,639 | | | | 20,219,538 | | | | 355,768,115 | |
Class 529A | | | 13,835 | | | | 238,534 | | | | 5,019 | | | | 85,155 | |
Class 529B | | | (2,337 | ) | | | (36,180 | ) | | | (1,004 | ) | | | (16,962 | ) |
Class 529C | | | (809 | ) | | | (8,230 | ) | | | 2,646 | | | | 43,754 | |
| | | 40,203,795 | | | | $707,404,711 | | | | 28,999,115 | | | | $512,989,442 | |
The fund is one of several mutual funds in which certain MFS funds may invest. The MFS funds do not invest in the underlying funds for the purpose of exercising management or control. At the end of the period, the MFS International Diversification Fund, the MFS Moderate Allocation Fund, the MFS Growth Allocation Fund, the MFS Aggressive Growth Allocation Fund, and the MFS Conservative Allocation Fund were the owners of record of approximately 18%, 5%, 5%, 2%, and 2%, respectively, of the value of outstanding voting shares of the fund. In addition, the MFS Lifetime 2015 Fund, the MFS Lifetime 2020 Fund, the MFS Lifetime 2025 Fund, the MFS Lifetime 2030 Fund, the MFS Lifetime 2035 Fund, the MFS Lifetime 2040 Fund, the MFS Lifetime 2045 Fund, the MFS Lifetime 2050 Fund, the MFS Lifetime 2055 Fund, and the MFS Lifetime Income Fund were each the owners of record of less than 1% of the value of outstanding voting shares of the fund.
(6) Line of Credit
The fund and certain other funds managed by MFS participate in a $1.25 billion unsecured committed line of credit, subject to a $1 billion sublimit, provided by a
39
Notes to Financial Statements – continued
syndication of banks under a credit agreement. Borrowings may be made for temporary financing needs. Interest is charged to each fund, based on its borrowings, generally at a rate equal to the higher of the Overnight Federal Reserve funds rate or daily one month LIBOR plus an agreed upon spread. A commitment fee, based on the average daily, unused portion of the committed line of credit, is allocated among the participating funds at the end of each calendar quarter. In addition, the fund and other funds managed by MFS have established unsecured uncommitted borrowing arrangements with certain banks for temporary financing needs. Interest is charged to each fund, based on its borrowings, at a rate equal to the Overnight Federal Reserve funds rate plus an agreed upon spread. For the year ended August 31, 2015, the fund’s commitment fee and interest expense were $24,587 and $0, respectively, and are included in “Miscellaneous” expense in the Statement of Operations
(7) Transactions in Underlying Affiliated Funds-Affiliated Issuers
An affiliated issuer may be considered one in which the fund owns 5% or more of the outstanding voting securities, or a company which is under common control. For the purposes of this report, the fund assumes the following to be an affiliated issuer:
| | | | | | | | | | | | | | | | |
| Underlying Affiliated Fund | | Beginning
Shares/Par
Amount | | | Acquisitions
Shares/Par
Amount | | | Dispositions
Shares/Par
Amount | | | Ending
Shares/Par
Amount | |
MFS Institutional Money
Market Portfolio | | | 102,287,398 | | | | 1,108,359,832 | | | | (1,121,565,615 | ) | | | 89,081,615 | |
| | | | |
| Underlying Affiliated Fund | | Realized
Gain (Loss) | | | Capital Gain
Distributions | | | Dividend
Income | | | Ending
Value | |
MFS Institutional Money
Market Portfolio | | | $— | | | | $— | | | | $71,854 | | | | $89,081,615 | |
40
REPORT OF INDEPENDENT REGISTERED PUBLIC ACCOUNTING FIRM
To the Board of Trustees of MFS Series Trust I and Shareholders of MFS Research International Fund:
We have audited the accompanying statement of assets and liabilities of MFS Research International Fund (the Fund) (one of the series constituting MFS Series Trust I), including the portfolio of investments, as of August 31, 2015, and the related statement of operations for the year then ended, the statements of changes in net assets for each of the two years in the period then ended and the financial highlights for each of the five years in the period then ended. These financial statements and financial highlights are the responsibility of the Fund’s management. Our responsibility is to express an opinion on these financial statements and financial highlights based on our audits.
We conducted our audits in accordance with the standards of the Public Company Accounting Oversight Board (United States). Those standards require that we plan and perform the audit to obtain reasonable assurance about whether the financial statements and financial highlights are free of material misstatement. We were not engaged to perform an audit of the Fund’s internal control over financial reporting. Our audits included consideration of internal control over financial reporting as a basis for designing audit procedures that are appropriate in the circumstances, but not for the purpose of expressing an opinion on the effectiveness of the Fund’s internal control over financial reporting. Accordingly, we express no such opinion. An audit also includes examining, on a test basis, evidence supporting the amounts and disclosures in the financial statements and financial highlights, assessing the accounting principles used and significant estimates made by management, and evaluating the overall financial statement presentation. Our procedures included confirmation of securities owned as of August 31, 2015, by correspondence with the custodian and others or by other appropriate auditing procedures where replies from others were not received. We believe that our audits provide a reasonable basis for our opinion.
In our opinion, the financial statements and financial highlights referred to above present fairly, in all material respects, the financial position of MFS Research International Fund (one of the series constituting MFS Series Trust I) at August 31, 2015, the results of its operations for the year then ended, the changes in its net assets for each of the two years in the period then ended and the financial highlights for each of the five years in the period then ended, in conformity with U.S. generally accepted accounting principles.

Boston, Massachusetts
October 15, 2015
41
TRUSTEES AND OFFICERS — IDENTIFICATION AND BACKGROUND
The Trustees and Officers of the Trust, as of October 1, 2015, are listed below, together with their principal occupations during the past five years. (Their titles may have varied during that period.) The address of each Trustee and Officer is 111 Huntington Avenue, Boston, Massachusetts 02199-7618.
| | | | | | | | |
Name, Age | | Position(s) Held with Fund | | Trustee/Officer
Since (h) | | Principal
Occupations During the Past Five Years | | Other Directorships (j) |
| INTERESTED TRUSTEES |
Robert J. Manning (k) (age 51) | | Trustee | | February 2004 | | Massachusetts Financial Services Company, Chairman, Co-Chief Executive Officer and Director; Chief Investment Officer (until 2010) | | N/A |
Robin A. Stelmach (k) (age 54) | | Trustee and President | | January 2014 | | Massachusetts Financial Services Company, Executive Vice President and Chief Operating Officer | | N/A |
| INDEPENDENT TRUSTEES | | | | | | |
David H. Gunning (age 73) | | Trustee and Chair of Trustees | | January 2004 | | Private investor | | Lincoln Electric Holdings, Inc., Director; Development Alternatives, Inc., Director/Non-Executive Chairman |
Steven E. Buller (age 64) | | Trustee | | February 2014 | | Chairman, Financial Accounting Standards Advisory Council; Standing Advisory Group, Public Company Accounting Oversight Board, Member (until 2014); BlackRock, Inc. (investment management), Managing Director (until 2014), BlackRock Finco UK (investment management), Director (until 2014) | | N/A |
Robert E. Butler (age 73) | | Trustee | | January 2006 | | Consultant – investment company industry regulatory and compliance matters | | N/A |
42
Trustees and Officers – continued
| | | | | | | | |
Name, Age | | Position(s) Held with Fund | | Trustee/Officer
Since (h) | | Principal
Occupations During the Past Five Years | | Other Directorships (j) |
Maureen R. Goldfarb (age 60) | | Trustee | | January 2009 | | Private investor | | N/A |
William R. Gutow (age 74) | | Trustee | | December 1993 | | Private investor and real estate consultant; Capitol Entertainment Management Company (video franchise), Vice Chairman | | Texas Donuts, Vice Chairman (until 2010) |
Michael Hegarty (age 70) | | Trustee | | December 2004 | | Private investor | | Rouse Properties Inc., Director; Capmark Financial Group Inc., Director |
John P. Kavanaugh (age 60) | | Trustee | | January 2009 | | Private investor | | N/A |
Maryanne L. Roepke (age 59) | | Trustee | | May 2014 | | American Century Investments (investment management), Senior Vice President and Chief Compliance Officer (until 2014) | | N/A |
Laurie J. Thomsen (age 58) | | Trustee | | March 2005 | | Private investor; New Profit, Inc. (venture philanthropy), Executive Partner (until 2010) | | The Travelers Companies, Director; Dycom Industries, Inc. |
Robert W. Uek (age 74) | | Trustee | | January 2006 | | Consultant to investment company industry | | N/A |
| OFFICERS | | | | | | |
Christopher R. Bohane (k) (age 41) | | Assistant Secretary and Assistant Clerk | | July 2005 | | Massachusetts Financial Services Company, Vice President and Assistant General Counsel | | N/A |
Kino Clark (k) (age 47) | | Assistant Treasurer | | January 2012 | | Massachusetts Financial Services Company, Vice President | | N/A |
Kristin V. Collins (k) (age 42) | | Assistant Secretary and Assistant Clerk | | September 2015 | | Massachusetts Financial Services Company, Vice President and Assistant General Counsel | | N/A |
43
Trustees and Officers – continued
| | | | | | | | |
Name, Age | | Position(s) Held with Fund | | Trustee/Officer
Since (h) | | Principal
Occupations During the Past Five Years | | Other Directorships (j) |
Thomas H. Connors (k) (age 56) | | Assistant Secretary and Assistant Clerk | | September 2012 | | Massachusetts Financial Services Company, Vice President and Senior Counsel; Deutsche Investment Management Americas Inc. (financial service provider), Director and Senior Counsel (until 2012) | | N/A |
Ethan D. Corey (k) (age 51) | | Assistant Secretary and Assistant Clerk | | July 2005 | | Massachusetts Financial Services Company, Senior Vice President and Associate General Counsel | | N/A |
David L. DiLorenzo (k) (age 47) | | Treasurer | | July 2005 | | Massachusetts Financial Services Company, Senior Vice President | | N/A |
Susan S. Newton (k) (age 65) | | Assistant Secretary and Assistant Clerk | | May 2005 | | Massachusetts Financial Services Company, Senior Vice President and Associate General Counsel | | N/A |
Kenneth Paek (k) (age 41) | | Assistant Treasurer | | February 2015 | | Massachusetts Financial Services Company, Vice President; Cohen & Steers, Vice President/Head of Fund Administration (until 2014) | | N/A |
Susan A. Pereira (k) (age 44) | | Assistant Secretary and Assistant Clerk | | July 2005 | | Massachusetts Financial Services Company, Vice President and Senior Counsel | | N/A |
Kasey L. Phillips (k) (age 44) | | Assistant Treasurer | | September 2012 | | Massachusetts Financial Services Company, Vice President; Wells Fargo Funds Management, LLC, Senior Vice President, Fund Treasurer (until 2012) | | N/A |
44
Trustees and Officers – continued
| | | | | | | | |
Name, Age | | Position(s) Held with Fund | | Trustee/Officer
Since (h) | | Principal
Occupations During the Past Five Years | | Other Directorships (j) |
Mark N. Polebaum (k) (age 63) | | Secretary and Clerk | | January 2006 | | Massachusetts Financial Services Company, Executive Vice President, General Counsel and Secretary | | N/A |
Matthew A. Stowe (k) (age 40) | | Assistant Secretary and Assistant Clerk | | October 2014 | | Massachusetts Financial Services Company, Vice President and Assistant General Counsel | | N/A |
Frank L. Tarantino (age 71) | | Independent Senior Officer | | June 2004 | | Tarantino LLC (provider of compliance services), Principal | | N/A |
Richard S. Weitzel (k) (age 45) | | Assistant Secretary and Assistant Clerk | | October 2007 | | Massachusetts Financial Services Company, Senior Vice President and Associate General Counsel | | N/A |
Martin J. Wolin (k) (age 48) | | Chief Compliance Officer | | July 2015 | | Massachusetts Financial Services Company, Senior Vice President and Chief Compliance Officer (since July 2015); Mercer (financial service provider), Chief Risk and Compliance Officer, North America and Latin America (until June 2015) | | N/A |
James O. Yost (k) (age 55) | | Deputy Treasurer | | September 1990 | | Massachusetts Financial Services Company, Senior Vice President | | N/A |
| (h) | Date first appointed to serve as Trustee/officer of an MFS Fund. Each Trustee has served continuously since appointment unless indicated otherwise. For the period from December 15, 2004 until February 22, 2005, Mr. Manning served as Advisory Trustee. Prior to January 2012, Messrs. DiLorenzo and Yost served as Assistant Treasurers of the Funds. Ms. Stelmach was appointed as President of the Funds as of October 1, 2014. |
| (j) | Directorships or trusteeships of companies required to report to the Securities and Exchange Commission (i.e., “public companies”). |
| (k) | “Interested person” of the Trust within the meaning of the Investment Company Act of 1940 (referred to as the 1940 Act), which is the principal federal law governing investment companies like the fund, as a result of a position with MFS. The address of MFS is 111 Huntington Avenue, Boston, Massachusetts 02199-7618. |
45
Trustees and Officers – continued
Each Trustee (except Ms. Stelmach, Mr. Buller and Ms. Roepke) has been elected by shareholders and each Trustee and officer holds office until his or her successor is chosen and qualified or until his or her earlier death, resignation, retirement or removal. The Trust does not hold annual meetings for the purpose of electing Trustees, and Trustees are not elected for fixed terms. Messrs. Butler, Kavanaugh, Uek and Mses. Thomsen and Roepke are members of the Trust’s Audit Committee.
Each of the Fund’s Trustees and officers holds comparable positions with certain other funds of which MFS or a subsidiary is the investment adviser or distributor, and, in the case of the officers, with certain affiliates of MFS. As of October 1, 2015, the Trustees served as board members of 138 funds within the MFS Family of Funds.
The Statement of Additional Information for a Fund includes further information about the Trustees and is available without charge upon request by calling 1-800-225-2606.
| | |
| Investment Adviser | | Custodian |
Massachusetts Financial Services Company
111 Huntington Avenue
Boston, MA 02199-7618 | | State Street Bank and Trust Company 1 Lincoln Street Boston, MA 02111-2900 |
| Distributor | | Independent Registered Public Accounting Firm |
MFS Fund Distributors, Inc.
111 Huntington Avenue
Boston, MA 02199-7618 | | Ernst & Young LLP 200 Clarendon Street Boston, MA 02116 |
| Portfolio Managers | | |
Jose Luis Garcia Thomas Melendez | | |
46
BOARD REVIEW OF INVESTMENT ADVISORY AGREEMENT
The Investment Company Act of 1940 requires that both the full Board of Trustees and a majority of the non-interested (“independent”) Trustees, voting separately, annually approve the continuation of the Fund’s investment advisory agreement with MFS. The Trustees consider matters bearing on the Fund and its advisory arrangements at their meetings throughout the year, including a review of performance data at each regular meeting. In addition, the independent Trustees met several times over the course of three months beginning in May and ending in July, 2015 (“contract review meetings”) for the specific purpose of considering whether to approve the continuation of the investment advisory agreement for the Fund and the other investment companies that the Board oversees (the “MFS Funds”). The independent Trustees were assisted in their evaluation of the Fund’s investment advisory agreement by independent legal counsel, from whom they received separate legal advice and with whom they met separately from MFS during various contract review meetings. The independent Trustees were also assisted in this process by the MFS Funds’ Independent Senior Officer, a senior officer appointed by and reporting to the independent Trustees.
In connection with their deliberations regarding the continuation of the investment advisory agreement, the Trustees, including the independent Trustees, considered such information and factors as they believed, in light of the legal advice furnished to them and their own business judgment, to be relevant. The investment advisory agreement for the Fund was considered separately, although the Trustees also took into account the common interests of all MFS Funds in their review. As described below, the Trustees considered the nature, quality, and extent of the various investment advisory, administrative, and shareholder services performed by MFS under the existing investment advisory agreement and other arrangements with the Fund.
In connection with their contract review meetings, the Trustees received and relied upon materials that included, among other items: (i) information provided by Lipper Inc., an independent third party, on the investment performance of the Fund for various time periods ended December 31, 2014 and the investment performance of a group of funds with substantially similar investment classifications/objectives (the “Lipper performance universe”), (ii) information provided by Lipper Inc. on the Fund’s advisory fees and other expenses and the advisory fees and other expenses of comparable funds identified by Lipper Inc. (the “Lipper expense group”), (iii) information provided by MFS on the advisory fees of comparable portfolios of other clients of MFS, including institutional separate accounts and other clients, (iv) information as to whether and to what extent applicable expense waivers, reimbursements or fee “breakpoints” are observed for the Fund, (v) information regarding MFS’ financial results and financial condition, including MFS’ and certain of its affiliates’ estimated profitability from services performed for the Fund and the MFS Funds as a whole, and compared to MFS’ institutional business, (vi) MFS’ views regarding the outlook for the mutual fund industry and the strategic business plans of MFS, (vii) descriptions of various functions performed by MFS for the Funds, such as compliance monitoring and portfolio trading practices, and (viii) information regarding the overall organization of MFS, including information about MFS’ senior management and other personnel providing investment advisory, administrative and other services to
47
Board Review of Investment Advisory Agreement – continued
the Fund and the other MFS Funds. The comparative performance, fee and expense information prepared and provided by Lipper Inc. was not independently verified and the independent Trustees did not independently verify any information provided to them by MFS.
The Trustees’ conclusion as to the continuation of the investment advisory agreement was based on a comprehensive consideration of all information provided to the Trustees and not the result of any single factor. Some of the factors that figured particularly in the Trustees’ deliberations are described below, although individual Trustees may have evaluated the information presented differently from one another, giving different weights to various factors. It is also important to recognize that the fee arrangements for the Fund and other MFS Funds are the result of years of review and discussion between the independent Trustees and MFS, that certain aspects of such arrangements may receive greater scrutiny in some years than in others, and that the Trustees’ conclusions may be based, in part, on their consideration of these same arrangements during the course of the year and in prior years.
Based on information provided by Lipper Inc. and MFS, the Trustees reviewed the Fund’s total return investment performance as well as the performance of peer groups of funds over various time periods. The Trustees placed particular emphasis on the total return performance of the Fund’s Class A shares in comparison to the performance of funds in its Lipper performance universe over the three-year period ended December 31, 2014, which the Trustees believed was a long enough period to reflect differing market conditions. The total return performance of the Fund’s Class A shares was in the 4th quintile relative to the other funds in the universe for this three-year period (the 1st quintile being the best performers and the 5th quintile being the worst performers). The total return performance of the Fund’s Class A shares was in the 5th quintile for the one-year period and the 3rd quintile for the five-year period ended December 31, 2014 relative to the Lipper performance universe. Because of the passage of time, these performance results may differ from the performance results for more recent periods, including those shown elsewhere in this report.
The Trustees expressed concern to MFS about the substandard investment performance of the Fund. In the course of their deliberations, the Trustees took into account information provided by MFS in connection with the contract review meetings, including more recent performance information, as well as during investment review meetings conducted with portfolio management personnel during the course of the year, as to MFS’ efforts to improve the Fund’s performance. In addition, the Trustees requested that they receive a separate update on the Fund’s performance at each of their regular meetings. After reviewing these and related factors, the Trustees concluded, within the context of their overall conclusions regarding the investment advisory agreement, that MFS’ responses and efforts and plans to improve investment performance were sufficient to support approval of the continuance of the investment advisory agreement for an additional one-year period, but that they would continue to closely monitor the performance of the Fund.
In assessing the reasonableness of the Fund’s advisory fee, the Trustees considered, among other information, the Fund’s advisory fee and the total expense ratio of the Fund’s Class A shares as a percentage of average daily net assets and the advisory fee and total expense ratios of peer groups of funds based on information provided by
48
Board Review of Investment Advisory Agreement – continued
Lipper Inc. The Trustees considered that, according to the Lipper data (which takes into account any fee reductions or expense limitations that were in effect during the Fund’s last fiscal year), the Fund’s effective advisory fee rate and total expense ratio were each approximately at the Lipper expense group median.
The Trustees also considered the advisory fees charged by MFS to any institutional separate accounts advised by MFS (“separate accounts”) and unaffiliated investment companies for which MFS serves as subadviser (“subadvised funds”) that have comparable investment strategies to the Fund. In comparing these fees, the Trustees considered information provided by MFS as to the generally broader scope of services provided by MFS to the Fund, as well as the more extensive regulatory burdens imposed on MFS in managing the Fund, in comparison to separate accounts and subadvised funds. The Trustees also considered the higher demands placed on MFS’ investment personnel and trading infrastructure as a result of the daily cash in-flows and out-flows of the Fund in comparison to separate accounts.
The Trustees also considered whether the Fund may benefit from any economies of scale in the management of the Fund in the event of growth in assets of the Fund and/or growth in assets of the MFS Funds as a whole. They noted that the Fund’s advisory fee rate schedule is subject to contractual breakpoints that reduce the Fund’s advisory fee rate on average daily net assets over $1 billion and $2 billion, and that MFS has agreed in writing to further reduce its advisory fee rate on average daily net assets over $5 billion and $10 billion, which may not be changed without the Trustees’ approval. The Trustees also noted that MFS has agreed in writing to waive a portion of the management fees of certain MFS Funds, including the Fund, if the total combined assets of certain funds within the MFS Funds’ complex increase above agreed upon thresholds (the “group fee waiver”), enabling the Fund’s shareholders to share in the benefits from any economies of scale at the complex level. The group fee waiver is reviewed and renewed annually between the Board and MFS. The Trustees concluded that the breakpoints and the group fee waiver were sufficient to allow the Fund to benefit from economies of scale as its assets and overall complex assets grow.
The Trustees also considered information prepared by MFS relating to MFS’ costs and profits with respect to the Fund, the MFS Funds considered as a group, and other investment companies and accounts advised by MFS, as well as MFS’ methodologies used to determine and allocate its costs to the MFS Funds, the Fund and other accounts and products for purposes of estimating profitability.
After reviewing these and other factors described herein, the Trustees concluded, within the context of their overall conclusions regarding the investment advisory agreement, that the advisory fees charged to the Fund represent reasonable compensation in light of the services being provided by MFS to the Fund.
In addition, the Trustees considered MFS’ resources and related efforts to continue to retain, attract and motivate capable personnel to serve the Fund. The Trustees also considered current and developing conditions in the financial services industry, including the presence of large and well-capitalized companies which are spending, and appear to be prepared to continue to spend, substantial sums to engage personnel and to provide services to competing investment companies. In this regard, the Trustees also considered the financial resources of MFS and its ultimate parent, Sun Life
49
Board Review of Investment Advisory Agreement – continued
Financial Inc. The Trustees also considered the advantages and possible disadvantages to the Fund of having an adviser that also serves other investment companies as well as other accounts.
The Trustees also considered the nature, quality, cost, and extent of administrative, transfer agency, and distribution services provided to the Fund by MFS and its affiliates under agreements and plans other than the investment advisory agreement, including any 12b-1 fees the Fund pays to MFS Fund Distributors, Inc., an affiliate of MFS. The Trustees also considered the nature, extent and quality of certain other services MFS performs or arranges for on the Fund’s behalf, which may include securities lending programs, directed expense payment programs, class action recovery programs, and MFS’ interaction with third-party service providers, principally custodians and sub-custodians. The Trustees concluded that the various non-advisory services provided by MFS and its affiliates on behalf of the Fund were satisfactory.
The Trustees also considered benefits to MFS from the use of the Fund’s portfolio brokerage commissions, if applicable, to pay for investment research and various other factors. Additionally, the Trustees considered so-called “fall-out benefits” to MFS such as reputational value derived from serving as investment manager to the Fund.
Based on their evaluation of factors that they deemed to be material, including those factors described above, the Board of Trustees, including the independent Trustees, concluded that the Fund’s investment advisory agreement with MFS should be continued for an additional one-year period, commencing August 1, 2015.
50
PROXY VOTING POLICIES AND INFORMATION
MFS votes proxies on behalf of the fund pursuant to proxy voting policies and procedures that are available without charge, upon request, by calling 1-800-225-2606, by visiting the Proxy Voting section of mfs.com or by visiting the SEC’s Web site at http://www.sec.gov.
Information regarding how the fund voted proxies relating to portfolio securities during the most recent twelve-month period ended June 30 is available without charge by visiting the Proxy Voting section of mfs.com or by visiting the SEC’s Web site at http://www.sec.gov.
QUARTERLY PORTFOLIO DISCLOSURE
The fund will file a complete schedule of portfolio holdings with the Securities and Exchange Commission (the Commission) for the first and third quarters of each fiscal year on Form N-Q. A shareholder can obtain the quarterly portfolio holdings report at mfs.com. The fund’s Form N-Q is also available on the EDGAR database on the Commission’s Internet Web site at http://www.sec.gov, and may be reviewed and copied at the:
Public Reference Room
Securities and Exchange Commission
100 F Street, NE, Room 1580
Washington, D.C. 20549
Information on the operation of the Public Reference Room may be obtained by calling the Commission at 1-800-SEC-0330. Copies of the fund’s Form N-Q also may be obtained, upon payment of a duplicating fee, by electronic request at the following e-mail address: publicinfo@sec.gov or by writing the Public Reference Section at the above address.
FURTHER INFORMATION
From time to time, MFS may post important information about the fund or the MFS funds on the MFS web site (mfs.com). This information is available by visiting the “Market Commentary” and “Announcements” sub sections in the “Market Outlooks” section of mfs.com or by clicking on the fund’s name under “Mutual Funds” in the “Products” section of mfs.com.
FEDERAL TAX INFORMATION (unaudited)
The fund will notify shareholders of amounts for use in preparing 2015 income tax forms in January 2016. The following information is provided pursuant to provisions of the Internal Revenue Code.
The fund designates the maximum amount allowable as qualified dividend income eligible to be taxed at the same rate as long-term capital gain.
Income derived from foreign sources was $192,886,919. The fund intends to pass through foreign tax credits of $16,738,971 for the fiscal year.
51
rev. 3/11
| | | | |
| | | |
FACTS | | WHAT DOES MFS DO WITH YOUR PERSONAL INFORMATION? | |  |
| | |
| Why? | | Financial companies choose how they share your personal information. Federal law gives consumers the right to limit some but not all sharing. Federal law also requires us to tell you how we collect, share, and protect your personal information. Please read this notice carefully to understand what we do. |
| | |
| What? | | The types of personal information we collect and share depend on the product or service you have with us. This information can include: • Social Security number and account balances • Account transactions and transaction history • Checking account information and wire transfer instructions When you are no longer our customer, we continue to share your information as described in this notice. |
| | |
| How? | | All financial companies need to share customers’ personal information to run their everyday business. In the section below, we list the reasons financial companies can share their customers’ personal information; the reasons MFS chooses to share; and whether you can limit this sharing. |
| | | | |
Reasons we can share your
personal information | | Does MFS
share? | | Can you limit
this sharing? |
For our everyday business purposes – such as to process your transactions, maintain your account(s), respond to court orders and legal investigations, or report to credit bureaus | | Yes | | No |
For our marketing purposes – to offer our products and services to you | | No | | We don’t share |
| For joint marketing with other financial companies | | No | | We don’t share |
For our affiliates’ everyday business purposes – information about your transactions and experiences | | No | | We don’t share |
For our affiliates’ everyday business purposes – information about your creditworthiness | | No | | We don’t share |
| For nonaffiliates to market to you | | No | | We don’t share |
| | |
| Questions? | | Call 800-225-2606 or go to mfs.com. |
52
| | |
| Who we are |
| Who is providing this notice? | | MFS Funds, MFS Investment Management, MFS Institutional Advisors, Inc., MFS Fund Distributors, Inc., MFS Heritage Trust Company, and MFS Service Center, Inc. |
| | |
| What we do |
| How does MFS protect my personal information? | | To protect your personal information from unauthorized access and use, we use security measures that comply with federal law. These measures include procedural, electronic, and physical safeguards for the protection of the personal information we collect about you. |
| How does MFS collect my personal information? | | We collect your personal information, for example, when you • open an account or provide account information • direct us to buy securities or direct us to sell your securities • make a wire transfer We also collect your personal information from others, such as credit bureaus, affiliates and other companies. |
| Why can’t I limit all sharing? | | Federal law gives you the right to limit only • sharing for affiliates’ everyday business purposes – information about your creditworthiness • affiliates from using your information to market to you • sharing for nonaffiliates to market to you State laws and individual companies may give you additional rights to limit sharing. |
| | |
| Definitions |
| Affiliates | | Companies related by common ownership or control. They can be financial and nonfinancial companies. • MFS does not share personal information with affiliates, except for everyday business purposes as described on page one of this notice. |
| Nonaffiliates | | Companies not related by common ownership or control. They can be financial and nonfinancial companies. • MFS does not share with nonaffiliates so they can market to you. |
| Joint Marketing | | A formal agreement between nonaffiliated financial companies that together market financial products or services to you. • MFS doesn’t jointly market. |
| | |
| Other important information |
| If you own an MFS product or receive an MFS service in the name of a third party such as a bank or broker-dealer, their privacy policy may apply to you instead of ours. |
53
Save paper with eDelivery.

| MFS® will send you prospectuses, |
reports, and proxies directly via e-mail so you will get information faster with less mailbox clutter.
To sign up:
1. Go to mfs.com.
2. Log in via MFS® Access.
3. Select eDelivery.
If you own your MFS fund shares through a financial institution or a retirement plan, MFS® TALK, MFS® Access, or eDelivery may not be available to you.
CONTACT
WEB SITE
mfs.com
MFS TALK
1-800-637-8255
24 hours a day
ACCOUNT SERVICE AND LITERATURE
Shareholders
1-800-225-2606
Financial advisors
1-800-343-2829
Retirement plan services
1-800-637-1255
MAILING ADDRESS
MFS Service Center, Inc.
P.O. Box 55824
Boston, MA 02205-5824
OVERNIGHT MAIL
MFS Service Center, Inc.
c/o Boston Financial Data Services
30 Dan Road
Canton, MA 02021-2809
ANNUAL REPORT
August 31, 2015

MFS® TECHNOLOGY FUND

SCT-ANN
MFS® TECHNOLOGY FUND
CONTENTS
The report is prepared for the general information of shareholders.
It is authorized for distribution to prospective investors only when preceded or accompanied by a current prospectus.
NOT FDIC INSURED • MAY LOSE VALUE • NO BANK GUARANTEE

LETTER FROM THE CHAIRMAN
Dear Shareholders:
The U.S. economy bounced back after another harsh winter curtailed domestic consumption. Despite strengthening labor and housing markets, however, a stronger U.S. dollar and weak overseas demand have held back corporate earnings.
China’s economic growth continues to slow, raising concerns and adding to global market volatility. Commodity exporters, including Australia and Canada, have been hurt by weaker Chinese demand. Global oil markets remain oversupplied, putting pressure on crude oil and gasoline prices.
In Europe, concerns about a potential Greek debt default have faded, and the eurozone’s economy is expanding mildly. Hopes for a more robust regionwide recovery rest on the European Central Bank’s quantitative easing program.
The world’s financial markets have become increasingly complex in recent years. Now, more than ever, it is important to understand companies on a global basis. At MFS®, we believe our integrated research platform, collaborative culture, active risk management process and long-term focus give us a research advantage.
As investors, we aim to add long-term value. We believe this approach will serve you well as you work with your financial advisor to reach your investment objectives.
Respectfully,

Robert J. Manning
Chairman
MFS Investment Management
October 15, 2015
The opinions expressed in this letter are subject to change and may not be relied upon for investment advice. No forecasts can be guaranteed.
1
PORTFOLIO COMPOSITION
Portfolio structure (i)

| | | | |
| Top ten holdings (i) | | | | |
| Google, Inc., “A” | | | 10.4% | |
| Facebook, Inc., “A” | | | 5.4% | |
| Amazon.com, Inc. | | | 5.4% | |
| Visa, Inc., “A” | | | 4.5% | |
| Apple, Inc. | | | 4.5% | |
| MasterCard, Inc., “A” | | | 3.2% | |
| Salesforce.com, Inc. | | | 2.9% | |
| Cisco Systems, Inc. | | | 2.9% | |
| Priceline Group, Inc. | | | 2.7% | |
| EMC Corp. | | | 2.7% | |
| | | | |
| Top five industries (i) | | | | |
| Internet | | | 18.6% | |
| Computer Software-Systems | | | 15.8% | |
| Computer Software | | | 14.3% | |
| Business Services | | | 10.5% | |
| Electronics (s) | | | 7.8% | |
| (i) | For purposes of this presentation, the components include the value of securities, less any securities sold short, and reflect the impact of the equivalent exposure of derivative positions. These amounts may be negative from time to time. Equivalent exposure is a calculated amount that translates the derivative position into a reasonable approximation of the amount of the underlying asset that the portfolio would have to hold at a given point in time to have the same price sensitivity that results from the portfolio’s ownership of the derivative contract. When dealing with derivatives, equivalent exposure is a more representative measure of the potential impact of a position on portfolio performance than value. |
| (s) | Includes securities sold short. |
Cash & Other can include cash, other assets less liabilities, offsets to derivative positions, and short-term securities. Please see the Statement of Assets and Liabilities for additional information related to the fund’s cash position and the Notes to Financial Statements for additional information related to certain risks associated with assets included in “Other”.
Percentages are based on net assets as of 8/31/15 and may not agree with the Portfolio of Investments due to the equivalent exposure of equity options.
The portfolio is actively managed and current holdings may be different.
2
MANAGEMENT REVIEW
Summary of Results
For the twelve months ended August 31, 2015, Class A shares of the MFS Technology Fund (“fund”) provided a total return of 4.18%, at net asset value. This compares with a return of 0.48% for the fund’s benchmark, the Standard & Poor’s 500 Stock Index and a return of 3.72% for the fund’s other benchmark, the Standard & Poor’s North American Technology Sector Index.
Market Environment
A generally risk-friendly environment prevailed in the first half of the period and any market setbacks, triggered by global growth concerns, were short-lived as central banks responded and kept monetary policy accommodative. For example, the US tempered rate hike expectations while Japan, Europe and China provided fresh stimulus measures which ultimately supported risk assets. Early in the second half of the period, the European Central Bank cut policy interest rates and announced non-conventional easing measures, pushing yields on a significant portion of eurozone sovereign bonds deeper into negative territory, a notable highlight amid a mini-wave of global easing due to declining inflation and inflation expectations. However, the environment supporting risk began to break down in the latter phases of the period, with both US investment grade and high yield corporate spreads widening out and any individual company performance below expectations resulted in market selling.
A dominant trend for most of the period was the ongoing rise in US equities. Until early in the second half of the period, this was paired with a decline in US and global bond yields. The uptrend in US corporate margins and profits continued throughout the second half of 2014, but in the latter part of the period the margin results became more bifurcated with energy and materials suffering and the rest of the companies holding on to net margins in an ongoing slow revenue growth environment. A rising dollar and a sharp decline in commodity prices, particularly crude oil prices, negatively impacted credit markets, notably US high yield and emerging market debt. The higher weightings of oil and gas credits in these asset classes resulted in widening spreads and increased volatility. In the second half of the period, global sovereign bond yields rose, shrugging off concerns over a Greek debt default. The rise tempered the equity advance, as odds of a 2015 US Federal Reserve rate hike increased. At the end of the period, the stronger US dollar slowed revenues in many US-based multinational companies. As the last month of the period began, risk shedding became a theme across emerging market countries and continued to weaken Chinese economic data as well as economic data of the commodity-driven countries. Risk shedding accelerated outflows and cross-border selling. By the end of the period, many of the world’s equity markets had entered into “correction” territory.
Contributors to Performance
The combination of strong stock selection and an underweight position in the poor-performing electronics industry was a positive factor that strengthened the fund’s performance relative to the Standard & Poor’s North American Technology Sector Index. The fund’s short position in semiconductor company Intel (h) during the reporting period benefited relative performance. Not holding semiconductor manufacturers,
3
Management Review – continued
Micron Technology and Applied Materials, and flash memory storage products maker SanDisk aided relative results as all three companies turned in weak performance over the reporting period. An overweight position in broadband communications and networking services company Broadcom also boosted relative performance as the stock rose after management announced approval for the company to be acquired by Avago in a cash and stock deal in late May.
Stock selection in the computer systems industry was another area of relative strength. Avoiding common shares of diversified technology products and services company International Business Machines Corporation (IBM) boosted relative results as its shares depreciated. Shares of IBM fell as the company’s revenues declined during the second quarter due to unfavorable software and services margins and foreign exchange effects. An overweight position in financial services software designer SS&C Technologies also benefited relative performance.
Elsewhere, an underweight position in wireless communications software company QUALCOMM (h) strengthened relative performance. While the company posted generally in-line results for the second quarter, management’s updated guidance was severely below consensus. This was attributed to an expected shortfall in demand, as iPhone continues to utilize its own baseband and Samsung increasingly uses in-house chipsets. The fund’s overweight positions in global payments technology company Visa and customer information software manager Salesforce.com also benefited relative results.
Detractors from Performance
Weak stock selection in the internet industry was a negative factor for relative performance. The fund’s overweight positions in social networking service provider Twitter, local businesses internet company Yelp (h) and online professional network operator LinkedIn were notable detractors that underperformed the fund’s benchmark. Despite having posted earnings that beat consensus estimates in the second quarter, Twitter warned that it did not expect any growth to its new-user trajectory anytime soon. The company also warned that it may approach a ceiling to its ad inventory due to the lackluster user and engagement growth.
Stock selection in the broadcasting industry also held back relative results. The fund’s out-of-benchmark holdings of global media companies, Twenty-First Century Fox (b) and Discovery Communications (b)(h), dampened relative results as both companies turned in weak performance over the reporting period. Twenty-First Century Fox declined late in the period after a competitor suggested that overall media viewership may be changing at a faster rate than the market had previously expected. Streaming media services and the increasing availability of alternative outlets for content have called into question the durability of the traditional TV subscriber base.
Elsewhere, overweight positions in computer and personal electronics maker Hewlett-Packard, data storage systems provider EMC and semiconductor manufacturer
4
Management Review – continued
Microchip Technology weighed on relative returns. The fund’s underweight position in network equipment company Cisco Systems and not owning shares of streaming media content provider Netflix also hurt relative results.
Respectfully,
Matthew Sabel
Portfolio Manager
| (b) | Security is not a benchmark constituent. |
| (h) | Security was not held in the portfolio at period end. |
The views expressed in this report are those of the portfolio manager only through the end of the period of the report as stated on the cover and do not necessarily reflect the views of MFS or any other person in the MFS organization. These views are subject to change at any time based on market or other conditions, and MFS disclaims any responsibility to update such views. These views may not be relied upon as investment advice or an indication of trading intent on behalf of any MFS portfolio. References to specific securities are not recommendations of such securities, and may not be representative of any MFS portfolio’s current or future investments.
5
PERFORMANCE SUMMARY THROUGH 8/31/15
The following chart illustrates a representative class of the fund’s historical performance in comparison to its benchmark(s). Performance results include the deduction of the maximum applicable sales charge and reflect the percentage change in net asset value, including reinvestment of dividends and capital gains distributions. The performance of other share classes will be greater than or less than that of the class depicted below. Benchmarks are unmanaged and may not be invested in directly. Benchmark returns do not reflect sales charges, commissions or expenses. (See Notes to Performance Summary.)
Performance data shown represents past performance and is no guarantee of future results. Investment return and principal value fluctuate so your shares, when sold, may be worth more or less than the original cost; current performance may be lower or higher than quoted. The performance shown does not reflect the deduction of taxes, if any, that a shareholder would pay on fund distributions or the redemption of fund shares.
Growth of a Hypothetical $10,000 Investment

6
Performance Summary – continued
Total Returns through 8/31/15
Average annual without sales charge
| | | | | | | | | | | | | | |
| | | Share Class | | Class Inception Date | | 1-yr | | 5-yr | | 10-yr | | Life (t) | | |
| | | A | | 1/02/97 | | 4.18% | | 16.66% | | 11.17% | | N/A | | |
| | | B | | 4/14/00 | | 3.41% | | 15.79% | | 10.38% | | N/A | | |
| | | C | | 4/14/00 | | 3.42% | | 15.79% | | 10.38% | | N/A | | |
| | | I | | 1/02/97 | | 4.49% | | 16.96% | | 11.49% | | N/A | | |
| | | R1 | | 4/01/05 | | 3.43% | | 15.79% | | 10.34% | | N/A | | |
| | | R2 | | 10/31/03 | | 3.93% | | 16.37% | | 10.89% | | N/A | | |
| | | R3 | | 4/01/05 | | 4.18% | | 16.67% | | 11.16% | | N/A | | |
| | | R4 | | 4/01/05 | | 4.44% | | 16.95% | | 11.46% | | N/A | | |
| | | R5 | | 1/02/13 | | 4.61% | | N/A | | N/A | | 17.06% | | |
| Comparative benchmarks | | | | | | | | | | |
| | | Standard & Poor’s 500 Stock Index (f) | | 0.48% | | 15.87% | | 7.15% | | N/A | | |
| | | Standard & Poor’s North American Technology Sector Index (f) | | 3.72% | | 17.42% | | 9.42% | | N/A | | |
| Average annual with sales charge | | | | | | | | | | |
| | | A
With initial Sales Charge (5.75%) | | (1.81)% | | 15.28% | | 10.52% | | N/A | | |
| | | B
With CDSC (Declining over six years from 4% to 0%) (v) | | (0.57)% | | 15.57% | | 10.38% | | N/A | | |
| | | C
With CDSC (1% for 12 months) (v) | | 2.42% | | 15.79% | | 10.38% | | N/A | | |
CDSC – Contingent Deferred Sales Charge.
Class I, R1, R2, R3, R4, and R5 shares do not have a sales charge.
| (f) | Source: FactSet Research Systems Inc. |
| (t) | For the period from the class inception date through the stated period end (for those share classes with less than 10 years of performance history). No comparative benchmark performance information is provided for “life” periods. (See Notes to Performance Summary.) |
| (v) | Assuming redemption at the end of the applicable period. |
Benchmark Definitions
Standard & Poor’s 500 Stock Index – a market capitalization-weighted index of 500 widely held equity securities, designed to measure broad U.S. equity performance.
Standard & Poor’s North American Technology Sector Index – a modified market capitalization-weighted index that measures the performance of selected technology stocks.
It is not possible to invest directly in an index.
7
Performance Summary – continued
Notes to Performance Summary
Average annual total return represents the average annual change in value for each share class for the periods presented. Life returns are presented where the share class has less than 10 years of performance history and represent the average annual total return from the class inception date to the stated period end date. As the fund’s share classes may have different inception dates, the life returns may represent different time periods and may not be comparable. As a result, no comparative benchmark performance information is provided for life periods.
Performance results reflect any applicable expense subsidies and waivers in effect during the periods shown. Without such subsidies and waivers the fund’s performance results would be less favorable. Please see the prospectus and financial statements for complete details.
Performance results do not include adjustments made for financial reporting purposes in accordance with U.S. generally accepted accounting principles and may differ from amounts reported in the financial highlights.
From time to time the fund may receive proceeds from litigation settlements, without which performance would be lower.
8
EXPENSE TABLE
Fund expenses borne by the shareholders during the period, March 1, 2015 through August 31, 2015
As a shareholder of the fund, you incur two types of costs: (1) transaction costs, including sales charges (loads) on certain purchase or redemption payments, and (2) ongoing costs, including management fees; distribution and service (12b-1) fees; and other fund expenses. This example is intended to help you understand your ongoing costs (in dollars) of investing in the fund and to compare these costs with the ongoing costs of investing in other mutual funds.
The example is based on an investment of $1,000 invested at the beginning of the period and held for the entire period March 1, 2015 through August 31, 2015.
Actual Expenses
The first line for each share class in the following table provides information about actual account values and actual expenses. You may use the information in this line, together with the amount you invested, to estimate the expenses that you paid over the period. Simply divide your account value by $1,000 (for example, an $8,600 account value divided by $1,000 = 8.6), then multiply the result by the number in the first line under the heading entitled “Expenses Paid During Period” to estimate the expenses you paid on your account during this period.
Hypothetical Example for Comparison Purposes
The second line for each share class in the following table provides information about hypothetical account values and hypothetical expenses based on the fund’s actual expense ratio and an assumed rate of return of 5% per year before expenses, which is not the fund’s actual return. The hypothetical account values and expenses may not be used to estimate the actual ending account balance or expenses you paid for the period. You may use this information to compare the ongoing costs of investing in the fund and other funds. To do so, compare this 5% hypothetical example with the 5% hypothetical examples that appear in the shareholder reports of the other funds.
Please note that the expenses shown in the table are meant to highlight your ongoing costs only and do not reflect any transactional costs, such as sales charges (loads). Therefore, the second line for each share class in the table is useful in comparing ongoing costs only, and will not help you determine the relative total costs of owning different funds. In addition, if these transactional costs were included, your costs would have been higher.
9
Expense Table – continued
| | | | | | | | | | | | | | | | | | |
Share
Class | | | | Annualized
Expense
Ratio | | | Beginning
Account Value
3/01/15 | | | Ending
Account Value
8/31/15 | | | Expenses
Paid During
Period (p)
3/01/15-8/31/15 | |
| A | | Actual | | | 1.28% | | | | $1,000.00 | | | | $974.28 | | | | $6.37 | |
| | Hypothetical (h) | | | 1.28% | | | | $1,000.00 | | | | $1,018.75 | | | | $6.51 | |
| B | | Actual | | | 2.03% | | | | $1,000.00 | | | | $970.56 | | | | $10.08 | |
| | Hypothetical (h) | | | 2.03% | | | | $1,000.00 | | | | $1,014.97 | | | | $10.31 | |
| C | | Actual | | | 2.03% | | | | $1,000.00 | | | | $970.51 | | | | $10.08 | |
| | Hypothetical (h) | | | 2.03% | | | | $1,000.00 | | | | $1,014.97 | | | | $10.31 | |
| I | | Actual | | | 1.03% | | | | $1,000.00 | | | | $975.57 | | | | $5.13 | |
| | Hypothetical (h) | | | 1.03% | | | | $1,000.00 | | | | $1,020.01 | | | | $5.24 | |
| R1 | | Actual | | | 2.03% | | | | $1,000.00 | | | | $970.46 | | | | $10.08 | |
| | Hypothetical (h) | | | 2.03% | | | | $1,000.00 | | | | $1,014.97 | | | | $10.31 | |
| R2 | | Actual | | | 1.53% | | | | $1,000.00 | | | | $972.97 | | | | $7.61 | |
| | Hypothetical (h) | | | 1.53% | | | | $1,000.00 | | | | $1,017.49 | | | | $7.78 | |
| R3 | | Actual | | | 1.28% | | | | $1,000.00 | | | | $973.88 | | | | $6.37 | |
| | Hypothetical (h) | | | 1.28% | | | | $1,000.00 | | | | $1,018.75 | | | | $6.51 | |
| R4 | | Actual | | | 1.03% | | | | $1,000.00 | | | | $975.37 | | | | $5.13 | |
| | Hypothetical (h) | | | 1.03% | | | | $1,000.00 | | | | $1,020.01 | | | | $5.24 | |
| R5 | | Actual | | | 0.93% | | | | $1,000.00 | | | | $976.00 | | | | $4.63 | |
| | Hypothetical (h) | | | 0.93% | | | | $1,000.00 | | | | $1,020.52 | | | | $4.74 | |
| (h) | 5% class return per year before expenses. |
| (p) | “Expenses Paid During Period” are equal to each class’s annualized expense ratio, as shown above, multiplied by the average account value over the period, multiplied by 184/365 (to reflect the one-half year period). Expenses paid do not include any applicable sales charges (loads). If these transaction costs had been included, your costs would have been higher. |
Notes to Expense Table
Expense ratios include 0.01% of investment related expenses from short sales (See Note 2 of the Notes to Financial Statements).
10
PORTFOLIO OF INVESTMENTS
8/31/15
The Portfolio of Investments is a complete list of all securities owned by your fund. It is categorized by broad-based asset classes.
| | | | | | | | |
| Common Stocks - 95.5% | | | | | | | | |
| Issuer | | Shares/Par | | | Value ($) | |
| Broadcasting - 3.1% | | | | | | | | |
| Time Warner, Inc. | | | 83,372 | | | $ | 5,927,745 | |
| Twenty-First Century Fox, Inc. | | | 153,718 | | | | 4,210,336 | |
| Walt Disney Co. | | | 8,800 | | | | 896,544 | |
| | | | | | | | |
| | | | | | | $ | 11,034,625 | |
| Brokerage & Asset Managers - 1.8% | | | | | | | | |
| Allied Minds PLC (a) | | | 323,024 | | | $ | 2,397,048 | |
| Intercontinental Exchange, Inc. | | | 9,025 | | | | 2,061,400 | |
| NASDAQ OMX Group, Inc. | | | 39,637 | | | | 2,029,018 | |
| | | | | | | | |
| | | | | | | $ | 6,487,466 | |
| Business Services - 10.5% | | | | | | | | |
| Accenture PLC, “A” | | | 34,048 | | | $ | 3,209,705 | |
| Cognizant Technology Solutions Corp., “A” (a) | | | 105,096 | | | | 6,614,742 | |
| CoStar Group, Inc. (a) | | | 7,494 | | | | 1,326,738 | |
| Equifax, Inc. | | | 22,088 | | | | 2,162,415 | |
| Evolent Health, Inc., “A” (a) | | | 65,725 | | | | 1,117,325 | |
| Fidelity National Information Services, Inc. | | | 78,336 | | | | 5,409,884 | |
| Fiserv, Inc. (a) | | | 40,131 | | | | 3,421,970 | |
| FleetCor Technologies, Inc. (a) | | | 19,097 | | | | 2,848,509 | |
| Gartner, Inc. (a) | | | 28,933 | | | | 2,474,061 | |
| Global Payments, Inc. | | | 34,143 | | | | 3,803,189 | |
| IMS Health Holdings, Inc. (a) | | | 59,703 | | | | 1,783,329 | |
| Press Ganey Holdings, Inc. (a) | | | 58,447 | | | | 1,884,916 | |
| Wex, Inc. (a) | | | 13,341 | | | | 1,261,125 | |
| | | | | | | | |
| | | | | | | $ | 37,317,908 | |
| Computer Software - 14.3% | | | | | | | | |
| Adobe Systems, Inc. (a) | | | 87,314 | | | $ | 6,860,261 | |
| Cornerstone OnDemand, Inc. (a) | | | 38,108 | | | | 1,361,980 | |
| Enghouse Systems Ltd. | | | 38,601 | | | | 1,495,510 | |
| Intuit, Inc. | | | 54,180 | | | | 4,645,935 | |
| Microsoft Corp. | | | 202,992 | | | | 8,834,212 | |
| Oracle Corp. | | | 233,339 | | | | 8,654,544 | |
| Qlik Technologies, Inc. (a) | | | 80,294 | | | | 3,039,931 | |
| Red Hat, Inc. (a) | | | 73,027 | | | | 5,273,280 | |
| Salesforce.com, Inc. (a) | | | 150,665 | | | | 10,450,124 | |
| | | | | | | | |
| | | | | | | $ | 50,615,777 | |
11
Portfolio of Investments – continued
| | | | | | | | |
| Issuer | | Shares/Par | | | Value ($) | |
| Common Stocks - continued | | | | | | | | |
| Computer Software - Systems - 15.8% | | | | | | | | |
| Apple, Inc. (s) | | | 140,168 | | | $ | 15,805,344 | |
| CDW Corp. | | | 19,246 | | | | 765,029 | |
| Constellation Software, Inc. | | | 840 | | | | 358,967 | |
| EMC Corp. | | | 379,086 | | | | 9,427,869 | |
| EPAM Systems, Inc. (a) | | | 12,414 | | | | 876,553 | |
| Hewlett-Packard Co. | | | 231,510 | | | | 6,496,171 | |
| Hortonworks, Inc. (a) | | | 65,605 | | | | 1,558,775 | |
| Kinaxis, Inc. (a) | | | 56,595 | | | | 1,568,020 | |
| Proofpoint, Inc. (a) | | | 31,874 | | | | 1,795,781 | |
| Qualys, Inc. (a) | | | 39,946 | | | | 1,160,831 | |
| Rapid7, Inc. (a) | | | 69,646 | | | | 1,468,834 | |
| Sabre Corp. | | | 99,285 | | | | 2,702,538 | |
| ServiceNow, Inc. (a) | | | 37,741 | | | | 2,678,101 | |
| Splunk, Inc. (a) | | | 20,068 | | | | 1,243,614 | |
| SS&C Technologies Holdings, Inc. | | | 53,245 | | | | 3,606,816 | |
| Vantiv, Inc., “A” (a) | | | 46,119 | | | | 2,031,081 | |
| Workday, Inc. (a) | | | 32,382 | | | | 2,275,159 | |
| | | | | | | | |
| | | | | | | $ | 55,819,483 | |
| Consumer Services - 2.7% | | | | | | | | |
| Priceline Group, Inc. (a) | | | 7,768 | | | $ | 9,699,436 | |
| | |
| Electrical Equipment - 1.7% | | | | | | | | |
| Amphenol Corp., “A” | | | 61,647 | | | $ | 3,227,837 | |
| TE Connectivity Ltd. | | | 48,792 | | | | 2,892,878 | |
| | | | | | | | |
| | | | | | | $ | 6,120,715 | |
| Electronics - 8.2% | | | | | | | | |
| Altera Corp. | | | 29,831 | | | $ | 1,448,295 | |
| Avago Technologies Ltd. | | | 24,298 | | | | 3,060,819 | |
| Broadcom Corp., “A” | | | 167,996 | | | | 8,680,353 | |
| Cypress Semiconductor Corp. | | | 87,843 | | | | 878,430 | |
| Mellanox Technologies Ltd. (a) | | | 21,384 | | | | 864,769 | |
| Microchip Technology, Inc. | | | 185,573 | | | | 7,886,853 | |
| NXP Semiconductors N.V. (a) | | | 26,022 | | | | 2,202,762 | |
| Silicon Laboratories, Inc. (a) | | | 28,702 | | | | 1,247,963 | |
| Solaredge Technologies, Inc. (a) | | | 65,285 | | | | 1,639,959 | |
| Viavi Solutions, Inc. (a) | | | 244,309 | | | | 1,311,939 | |
| | | | | | | | |
| | | | | | | $ | 29,222,142 | |
| Entertainment - 0.2% | | | | | | | | |
| AMC Networks, Inc., “A” (a) | | | 8,154 | | | $ | 590,187 | |
12
Portfolio of Investments – continued
| | | | | | | | |
| Issuer | | Shares/Par | | | Value ($) | |
| Common Stocks - continued | | | | | | | | |
| Internet - 18.7% | | | | | | | | |
| Alibaba Group Holding Ltd., ADR (a) | | | 22,795 | | | $ | 1,507,205 | |
| Facebook, Inc., “A “ (a)(s) | | | 215,349 | | | | 19,258,661 | |
| Google, Inc., “A” (a)(s) | | | 56,823 | | | | 36,811,076 | |
| LinkedIn Corp., “A” (a) | | | 21,642 | | | | 3,908,545 | |
| Twitter, Inc. (a) | | | 40,367 | | | | 1,121,799 | |
| Yahoo!, Inc. (a) | | | 108,437 | | | | 3,496,009 | |
| | | | | | | | |
| | | | | | | $ | 66,103,295 | |
| Machinery & Tools - 0.5% | | | | | | | | |
| Kornit Digital Ltd. (a)(l) | | | 142,096 | | | $ | 1,740,676 | |
| | |
| Network & Telecom - 3.5% | | | | | | | | |
| Cisco Systems, Inc. | | | 401,770 | | | $ | 10,397,808 | |
| Lumentum Holdings, Inc. (a) | | | 48,861 | | | | 964,516 | |
| Palo Alto Networks, Inc. (a) | | | 7,136 | | | | 1,171,874 | |
| | | | | | | | |
| | | | | | | $ | 12,534,198 | |
| Other Banks & Diversified Financials - 7.7% | | | | | | | | |
| MasterCard, Inc., “A” | | | 123,367 | | | $ | 11,395,410 | |
| Visa, Inc., “A” | | | 222,596 | | | | 15,871,095 | |
| | | | | | | | |
| | | | | | | $ | 27,266,505 | |
| Specialty Stores - 5.4% | | | | | | | | |
| Amazon.com, Inc. (a) | | | 37,096 | | | $ | 19,026,167 | |
| | |
| Telecommunications - Wireless - 1.4% | | | | | | | | |
| American Tower Corp., REIT | | | 35,189 | | | $ | 3,244,074 | |
| SBA Communications Corp. (a) | | | 13,419 | | | | 1,586,126 | |
| | | | | | | | |
| | | | | | | $ | 4,830,200 | |
| Total Common Stocks (Identified Cost, $243,767,137) | | | | | | $ | 338,408,780 | |
| | |
| Collateral for Securities Loaned - 0.0% | | | | | | | | |
Navigator Securities Lending Prime Portfolio, 0.19%,
at Cost and Net Asset Value (j) | | | 77,711 | | | $ | 77,711 | |
| | |
| Issuer/Expiration Date/Strike Price | | Number of
Contracts | | | | |
| Call Options Purchased - 0.1% | | | | | | | | |
| Network & Telecom - 0.1% | | | | | | | | |
| Cisco Systems, Inc. - January 2016 @ $27 (Premiums Paid, $910,020) | | | 3,485 | | | $ | 345,015 | |
13
Portfolio of Investments – continued
| | | | | | | | |
| Put Options Purchased - 0.1% | | | | | | | | |
| Issuer/Expiration Date/Strike Price | | Number of
Contracts | | | Value ($) | |
| Broadcasting - 0.1% | | | | |
| Omnicom Group, Inc. - October 2015 @ $80 (Premiums Paid, $125,541) | | | 159 | | | $ | 192,390 | |
| | |
| Issuer | | Shares/Par | | | | |
| Money Market Funds - 4.4% | | | | | | | | |
| MFS Institutional Money Market Portfolio, 0.11%, at Cost and Net Asset Value (v) | | | 15,640,239 | | | $ | 15,640,239 | |
| Total Investments (Identified Cost, $260,520,648) | | | | | | $ | 354,664,135 | |
| | |
| Issuer/Expiration Date/Strike Price | | Number of
Contracts | | | | |
| Call Options Written - 0.0% | | | | | | | | |
| Computer Software - 0.0% | | | | | | | | |
| Intuit Inc. - September 2015 @ $95 | | | (99 | ) | | $ | (2,970 | ) |
| | |
| Electronics - 0.0% | | | | | | | | |
| Avago Technologies Ltd. - September 2015 @ $140 | | | (45 | ) | | $ | (2,925 | ) |
| | |
| Internet - 0.0% | | | | | | | | |
| Facebook, Inc. - September 2015 @ $98 | | | (89 | ) | | $ | (2,848 | ) |
| Google, Inc. - September 2015 @ $725 | | | (21 | ) | | | (1,554 | ) |
| | | | | | | | |
| | | | | | | $ | (4,402 | ) |
| Total Call Options Written (Premiums Received, $15,702) | | | $ | (10,297 | ) |
| | |
| Issuer | | Shares/Par | | | | |
| Securities Sold Short - (0.4)% | | | | | | | | |
| Electronics - (0.4)% | | | | | | | | |
| Lam Research Corp. (Proceeds Received, $1,745,839) (a) | | | (22,300 | ) | | $ | (1,622,771 | ) |
| | |
| Other Assets, Less Liabilities - 0.3% | | | | | | | 1,238,284 | |
| Net Assets - 100.0% | | | | | | $ | 354,269,351 | |
| (a) | Non-income producing security. |
| (j) | The rate quoted is the annualized one-day yield of the fund at period end. |
| (l) | A portion of this security is on loan. |
| (s) | Security or a portion of the security was pledged to cover collateral requirements for securities sold short and/or certain derivative transactions. |
| (v) | Underlying affiliated fund that is available only to investment companies managed by MFS. The rate quoted for the MFS Institutional Money Market Portfolio is the annualized seven-day yield of the fund at period end. |
14
Portfolio of Investments – continued
At August 31, 2015, the fund had cash collateral of $180,075 and other liquid securities with an aggregate value of $2,797,724 to cover any commitments for securities sold short and/or certain derivative contracts. Cash collateral is comprised of “Deposits with brokers” on the Statement of Assets and Liabilities.
The following abbreviations are used in this report and are defined:
| ADR | | American Depositary Receipt |
| PLC | | Public Limited Company |
| REIT | | Real Estate Investment Trust |
See Notes to Financial Statements
15
Financial Statements
STATEMENT OF ASSETS AND LIABILITIES
At 8/31/15
This statement represents your fund’s balance sheet, which details the assets and liabilities comprising the total value of the fund.
| | | | |
| Assets | | | | |
Investments | | | | |
Non-affiliated issuers, at value (identified cost, $244,880,409) | | | $339,023,896 | |
Underlying affiliated funds, at cost and value | | | 15,640,239 | |
Total investments, at value, including $71,846 of securities on loan (identified cost, $260,520,648) | | | $354,664,135 | |
Deposits with brokers | | | 180,075 | |
Receivables for | | | | |
Investments sold | | | 648,711 | |
Fund shares sold | | | 1,240,578 | |
Interest and dividends | | | 178,527 | |
Other assets | | | 489 | |
Total assets | | | $356,912,515 | |
| Liabilities | | | | |
Payables for | | | | |
Securities sold short, at value (proceeds received, $1,745,839) | | | $1,622,771 | |
Investments purchased | | | 174,551 | |
Fund shares reacquired | | | 450,571 | |
Written options outstanding, at value (premiums received, $15,702) | | | 10,297 | |
Collateral for securities loaned, at value | | | 77,711 | |
Payable to affiliates | | | | |
Investment adviser | | | 27,897 | |
Shareholder servicing costs | | | 173,866 | |
Distribution and service fees | | | 12,926 | |
Payable for independent Trustees’ compensation | | | 953 | |
Accrued expenses and other liabilities | | | 91,621 | |
Total liabilities | | | $2,643,164 | |
Net assets | | | $354,269,351 | |
| Net assets consist of | | | | |
Paid-in capital | | | $246,992,840 | |
Unrealized appreciation (depreciation) on investments and translation of assets and liabilities in foreign currencies | | | 94,271,960 | |
Accumulated net realized gain (loss) on investments and foreign currency | | | 14,266,950 | |
Accumulated net investment loss | | | (1,262,399 | ) |
Net assets | | | $354,269,351 | |
Shares of beneficial interest outstanding | | | 14,577,455 | |
16
Statement of Assets and Liabilities – continued
| | | | | | | | | | | | |
| | | Net assets | | | Shares outstanding | | | Net asset value per share (a) | |
Class A | | | $199,313,270 | | | | 8,094,681 | | | | $24.62 | |
Class B | | | 18,791,634 | | | | 850,682 | | | | 22.09 | |
Class C | | | 43,036,869 | | | | 1,951,827 | | | | 22.05 | |
Class I | | | 56,619,415 | | | | 2,181,297 | | | | 25.96 | |
Class R1 | | | 2,516,134 | | | | 114,323 | | | | 22.01 | |
Class R2 | | | 14,946,379 | | | | 629,089 | | | | 23.76 | |
Class R3 | | | 9,732,128 | | | | 395,379 | | | | 24.61 | |
Class R4 | | | 2,234,063 | | | | 88,156 | | | | 25.34 | |
Class R5 | | | 7,079,459 | | | | 272,021 | | | | 26.03 | |
| (a) | Maximum offering price per share was equal to the net asset value per share for all share classes, except for Class A, for which the maximum offering price per share was $26.12 [100 / 94.25 x $24.62]. On sales of $50,000 or more, the maximum offering price of Class A shares is reduced. A contingent deferred sales charge may be imposed on redemptions of Class A, Class B, and Class C shares. Redemption price per share was equal to the net asset value per share for Classes I, R1, R2, R3, R4, and R5. |
See Notes to Financial Statements
17
Financial Statements
STATEMENT OF OPERATIONS
Year ended 8/31/15
This statement describes how much your fund earned in investment income and accrued in expenses. It also describes any gains and/or losses generated by fund operations.
| | | | |
| Net Investment loss | | | | |
Income | | | | |
Dividends | | | $2,270,094 | |
Interest | | | 12,388 | |
Dividends from underlying affiliated funds | | | 10,799 | |
Foreign taxes withheld | | | (984 | ) |
Total investment income | | | $2,292,297 | |
Expenses | | | | |
Management fee | | | $2,484,448 | |
Distribution and service fees | | | 1,181,551 | |
Shareholder servicing costs | | | 555,972 | |
Administrative services fee | | | 62,144 | |
Independent Trustees’ compensation | | | 9,630 | |
Custodian fee | | | 44,459 | |
Shareholder communications | | | 40,946 | |
Audit and tax fees | | | 56,269 | |
Legal fees | | | 2,525 | |
Dividend and interest expense on securities sold short | | | 71,846 | |
Miscellaneous | | | 145,358 | |
Total expenses | | | $4,655,148 | |
Fees paid indirectly | | | (58 | ) |
Reduction of expenses by investment adviser and distributor | | | (31,907 | ) |
Net expenses | | | $4,623,183 | |
Net investment loss | | | $(2,330,886 | ) |
| Realized and unrealized gain (loss) on investments and foreign currency | |
Realized gain (loss) (identified cost basis) | | | | |
Investments | | | $18,733,092 | |
Written options | | | 920,723 | |
Securities sold short | | | (258,329 | ) |
Foreign currency | | | (2,630 | ) |
Net realized gain (loss) on investments and foreign currency | | | $19,392,856 | |
Change in unrealized appreciation (depreciation) | | | | |
Investments | | | $(5,068,434 | ) |
Written options | | | (2,028 | ) |
Securities sold short | | | 337,299 | |
Translation of assets and liabilities in foreign currencies | | | (62 | ) |
Net unrealized gain (loss) on investments and foreign currency translation | | | $(4,733,225 | ) |
Net realized and unrealized gain (loss) on investments and foreign currency | | | $14,659,631 | |
Change in net assets from operations | | | $12,328,745 | |
See Notes to Financial Statements
18
Financial Statements
STATEMENTS OF CHANGES IN NET ASSETS
These statements describe the increases and/or decreases in net assets resulting from operations, any distributions, and any shareholder transactions.
| | | | | | | | |
| | | Years ended 8/31 | |
| | | 2015 | | | 2014 | |
| Change in net assets | | | | | | |
| From operations | | | | | | | | |
Net investment loss | | | $(2,330,886 | ) | | | $(1,913,552 | ) |
Net realized gain (loss) on investments and foreign currency | | | 19,392,856 | | | | 18,225,243 | |
Net unrealized gain (loss) on investments and foreign currency translation | | | (4,733,225 | ) | | | 44,993,780 | |
Change in net assets from operations | | | $12,328,745 | | | | $61,305,471 | |
| Distributions declared to shareholders | | | | | | | | |
From net realized gain on investments | | | $(10,909,819 | ) | | | $— | |
Change in net assets from fund share transactions | | | $55,669,659 | | | | $(1,601,290 | ) |
Total change in net assets | | | $57,088,585 | | | | $59,704,181 | |
| Net assets | | | | | | | | |
At beginning of period | | | 297,180,766 | | | | 237,476,585 | |
At end of period (including accumulated net investment loss of $1,262,399 and $1,142, respectively) | | | $354,269,351 | | | | $297,180,766 | |
See Notes to Financial Statements
19
Financial Statements
FINANCIAL HIGHLIGHTS
The financial highlights table is intended to help you understand the fund’s financial performance for the past 5 years (or life of a particular share class, if shorter). Certain information reflects financial results for a single fund share. The total returns in the table represent the rate by which an investor would have earned (or lost) on an investment in the fund share class (assuming reinvestment of all distributions) held for the entire period.
| | | | | | | | | | | | | | | | | | | | |
| Class A | | Years ended 8/31 | |
| | | 2015 | | | 2014 | | | 2013 | | | 2012 | | | 2011 | |
Net asset value, beginning of period | | | $24.47 | | | | $19.41 | | | | $16.80 | | | | $14.50 | | | | $11.80 | |
| Income (loss) from investment operations | | | | | | | | | |
Net investment loss (d) | | | $(0.15 | ) | | | $(0.13 | ) | | | $(0.12 | ) | | | $(0.17 | ) | | | $(0.09 | ) |
Net realized and unrealized gain (loss) on
investments and foreign currency | | | 1.15 | | | | 5.19 | | | | 2.73 | | | | 2.47 | | | | 2.79 | |
Total from investment operations | | | $1.00 | | | | $5.06 | | | | $2.61 | | | | $2.30 | | | | $2.70 | |
| Less distributions declared to shareholders | | | | | | | | | |
From net realized gain on investments | | | $(0.85 | ) | | | $— | | | | $— | | | | $— | | | | $— | |
Net asset value, end of period (x) | | | $24.62 | | | | $24.47 | | | | $19.41 | | | | $16.80 | | | | $14.50 | |
Total return (%) (r)(s)(t)(x) | | | 4.18 | | | | 26.07 | | | | 15.54 | | | | 15.86 | | | | 22.88 | |
Ratios (%) (to average net assets)
and Supplemental data: | | | | | |
Expenses before expense reductions (f) | | | 1.30 | | | | 1.33 | | | | 1.55 | | | | 1.45 | | | | 1.52 | |
Expenses after expense reductions (f) | | | 1.29 | | | | 1.32 | | | | 1.54 | | | | 1.45 | | | | 1.52 | |
Net investment loss | | | (0.60 | ) | | | (0.58 | ) | | | (0.70 | ) | | | (1.08 | ) | | | (0.61 | ) |
Portfolio turnover | | | 43 | | | | 38 | | | | 54 | | | | 68 | | | | 106 | |
Net assets at end of period (000 omitted) | | | $199,313 | | | | $171,020 | | | | $141,147 | | | | $143,595 | | | | $96,785 | |
| Supplemental Ratios (%): | | | | | |
Ratio of expenses to average net assets after expense
reductions excluding short sale dividend and
interest expense (f) | | | 1.27 | | | | 1.28 | | | | 1.36 | | | | 1.38 | | | | 1.43 | |
See Notes to Financial Statements
20
Financial Highlights – continued
| | | | | | | | | | | | | | | | | | | | |
| Class B | | Years ended 8/31 | |
| | | 2015 | | | 2014 | | | 2013 | | | 2012 | | | 2011 | |
Net asset value, beginning of period | | | $22.20 | | | | $17.75 | | | | $15.48 | | | | $13.45 | | | | $11.03 | |
| Income (loss) from investment operations | | | | | | | | | |
Net investment loss (d) | | | $(0.30 | ) | | | $(0.27 | ) | | | $(0.23 | ) | | | $(0.27 | ) | | | $(0.18 | ) |
Net realized and unrealized gain (loss) on
investments and foreign currency | | | 1.04 | | | | 4.72 | | | | 2.50 | | | | 2.30 | | | | 2.60 | |
Total from investment operations | | | $0.74 | | | | $4.45 | | | | $2.27 | | | | $2.03 | | | | $2.42 | |
| Less distributions declared to shareholders | | | | | | | | | |
From net realized gain on investments | | | $(0.85 | ) | | | $— | | | | $— | | | | $— | | | | $— | |
Net asset value, end of period (x) | | | $22.09 | | | | $22.20 | | | | $17.75 | | | | $15.48 | | | | $13.45 | |
Total return (%) (r)(s)(t)(x) | | | 3.41 | | | | 25.07 | | | | 14.66 | | | | 15.09 | | | | 21.94 | |
Ratios (%) (to average net assets)
and Supplemental data: | | | | | |
Expenses before expense reductions (f) | | | 2.05 | | | | 2.08 | | | | 2.30 | | | | 2.20 | | | | 2.27 | |
Expenses after expense reductions (f) | | | 2.04 | | | | 2.07 | | | | 2.29 | | | | 2.20 | | | | 2.27 | |
Net investment loss | | | (1.35 | ) | | | (1.34 | ) | | | (1.44 | ) | | | (1.83 | ) | | | (1.35 | ) |
Portfolio turnover | | | 43 | | | | 38 | | | | 54 | | | | 68 | | | | 106 | |
Net assets at end of period (000 omitted) | | | $18,791 | | | | $16,190 | | | | $13,009 | | | | $12,911 | | | | $11,365 | |
| Supplemental Ratios (%): | | | | | |
Ratio of expenses to average net assets after expense
reductions excluding short sale dividend and
interest expense (f) | | | 2.02 | | | | 2.03 | | | | 2.12 | | | | 2.13 | | | | 2.18 | |
See Notes to Financial Statements
21
Financial Highlights – continued
| | | | | | | | | | | | | | | | | | | | |
| Class C | | Years ended 8/31 | |
| | | 2015 | | | 2014 | | | 2013 | | | 2012 | | | 2011 | |
Net asset value, beginning of period | | | $22.16 | | | | $17.71 | | | | $15.45 | | | | $13.43 | | | | $11.01 | |
| Income (loss) from investment operations | | | | | | | | | |
Net investment loss (d) | | | $(0.30 | ) | | | $(0.28 | ) | | | $(0.24 | ) | | | $(0.27 | ) | | | $(0.19 | ) |
Net realized and unrealized gain (loss) on
investments and foreign currency | | | 1.04 | | | | 4.73 | | | | 2.50 | | | | 2.29 | | | | 2.61 | |
Total from investment operations | | | $0.74 | | | | $4.45 | | | | $2.26 | | | | $2.02 | | | | $2.42 | |
| Less distributions declared to shareholders | | | | | | | | | |
From net realized gain on investments | | | $(0.85 | ) | | | $— | | | | $— | | | | $— | | | | $— | |
Net asset value, end of period (x) | | | $22.05 | | | | $22.16 | | | | $17.71 | | | | $15.45 | | | | $13.43 | |
Total return (%) (r)(s)(t)(x) | | | 3.42 | | | | 25.13 | | | | 14.63 | | | | 15.04 | | | | 21.98 | |
Ratios (%) (to average net assets)
and Supplemental data: | | | | | |
Expenses before expense reductions (f) | | | 2.05 | | | | 2.07 | | | | 2.30 | | | | 2.20 | | | | 2.27 | |
Expenses after expense reductions (f) | | | 2.04 | | | | 2.07 | | | | 2.30 | | | | 2.20 | | | | 2.27 | |
Net investment loss | | | (1.35 | ) | | | (1.34 | ) | | | (1.45 | ) | | | (1.83 | ) | | | (1.37 | ) |
Portfolio turnover | | | 43 | | | | 38 | | | | 54 | | | | 68 | | | | 106 | |
Net assets at end of period (000 omitted) | | | $43,037 | | | | $35,998 | | | | $25,026 | | | | $23,940 | | | | $19,251 | |
| Supplemental Ratios (%): | | | | | |
Ratio of expenses to average net assets after expense
reductions excluding short sale dividend and
interest expense (f) | | | 2.02 | | | | 2.03 | | | | 2.12 | | | | 2.13 | | | | 2.18 | |
See Notes to Financial Statements
22
Financial Highlights – continued
| | | | | | | | | | | | | | | | | | | | |
| Class I | | Years ended 8/31 | |
| | | 2015 | | | 2014 | | | 2013 | | | 2012 | | | 2011 | |
Net asset value, beginning of period | | | $25.69 | | | | $20.33 | | | | $17.56 | | | | $15.11 | | | | $12.26 | |
| Income (loss) from investment operations | | | | | | | | | |
Net investment loss (d) | | | $(0.09 | ) | | | $(0.08 | ) | | | $(0.08 | ) | | | $(0.14 | ) | | | $(0.06 | ) |
Net realized and unrealized gain (loss) on
investments and foreign currency | | | 1.21 | | | | 5.44 | | | | 2.85 | | | | 2.59 | | | | 2.91 | |
Total from investment operations | | | $1.12 | | | | $5.36 | | | | $2.77 | | | | $2.45 | | | | $2.85 | |
| Less distributions declared to shareholders | | | | | | | | | |
From net realized gain on investments | | | $(0.85 | ) | | | $— | | | | $— | | | | $— | | | | $— | |
Net asset value, end of period (x) | | | $25.96 | | | | $25.69 | | | | $20.33 | | | | $17.56 | | | | $15.11 | |
Total return (%) (r)(s)(x) | | | 4.45 | | | | 26.36 | | | | 15.77 | | | | 16.21 | | | | 23.25 | |
Ratios (%) (to average net assets)
and Supplemental data: | | | | | |
Expenses before expense reductions (f) | | | 1.05 | | | | 1.08 | | | | 1.30 | | | | 1.20 | | | | 1.27 | |
Expenses after expense reductions (f) | | | 1.04 | | | | 1.07 | | | | 1.30 | | | | 1.20 | | | | 1.27 | |
Net investment loss | | | (0.35 | ) | | | (0.35 | ) | | | (0.45 | ) | | | (0.83 | ) | | | (0.38 | ) |
Portfolio turnover | | | 43 | | | | 38 | | | | 54 | | | | 68 | | | | 106 | |
Net assets at end of period (000 omitted) | | | $56,619 | | | | $40,359 | | | | $30,615 | | | | $21,898 | | | | $10,833 | |
| Supplemental Ratios (%): | | | | | |
Ratio of expenses to average net assets after expense
reductions excluding short sale dividend and
interest expense (f) | | | 1.02 | | | | 1.04 | | | | 1.12 | | | | 1.12 | | | | 1.18 | |
See Notes to Financial Statements
23
Financial Highlights – continued
| | | | | | | | | | | | | | | | | | | | |
| Class R1 | | Years ended 8/31 | |
| | | 2015 | | | 2014 | | | 2013 | | | 2012 | | | 2011 | |
Net asset value, beginning of period | | | $22.12 | | | | $17.68 | | | | $15.42 | | | | $13.41 | | | | $10.99 | |
| Income (loss) from investment operations | | | | | | | | | |
Net investment loss (d) | | | $(0.30 | ) | | | $(0.27 | ) | | | $(0.23 | ) | | | $(0.26 | ) | | | $(0.19 | ) |
Net realized and unrealized gain (loss) on
investments and foreign currency | | | 1.04 | | | | 4.71 | | | | 2.49 | | | | 2.27 | | | | 2.61 | |
Total from investment operations | | | $0.74 | | | | $4.44 | | | | $2.26 | | | | $2.01 | | | | $2.42 | |
| Less distributions declared to shareholders | | | | | | | | | |
From net realized gain on investments | | | $(0.85 | ) | | | $— | | | | $— | | | | $— | | | | $— | |
Net asset value, end of period (x) | | | $22.01 | | | | $22.12 | | | | $17.68 | | | | $15.42 | | | | $13.41 | |
Total return (%) (r)(s)(x) | | | 3.43 | | | | 25.11 | | | | 14.66 | | | | 14.99 | | | | 22.02 | |
Ratios (%) (to average net assets)
and Supplemental data: | | | | | |
Expenses before expense reductions (f) | | | 2.05 | | | | 2.08 | | | | 2.30 | | | | 2.21 | | | | 2.27 | |
Expenses after expense reductions (f) | | | 2.04 | | | | 2.07 | | | | 2.30 | | | | 2.21 | | | | 2.27 | |
Net investment loss | | | (1.36 | ) | | | (1.34 | ) | | | (1.45 | ) | | | (1.82 | ) | | | (1.39 | ) |
Portfolio turnover | | | 43 | | | | 38 | | | | 54 | | | | 68 | | | | 106 | |
Net assets at end of period (000 omitted) | | | $2,516 | | | | $2,033 | | | | $1,542 | | | | $1,666 | | | | $1,831 | |
| Supplemental Ratios (%): | | | | | |
Ratio of expenses to average net assets after expense
reductions excluding short sale dividend and
interest expense (f) | | | 2.02 | | | | 2.04 | | | | 2.12 | | | | 2.13 | | | | 2.18 | |
See Notes to Financial Statements
24
Financial Highlights – continued
| | | | | | | | | | | | | | | | | | | | |
| Class R2 | | Years ended 8/31 | |
| | | 2015 | | | 2014 | | | 2013 | | | 2012 | | | 2011 | |
Net asset value, beginning of period | | | $23.70 | | | | $18.85 | | | | $16.36 | | | | $14.15 | | | | $11.54 | |
| Income (loss) from investment operations | | | | | | | | | |
Net investment loss (d) | | | $(0.20 | ) | | | $(0.18 | ) | | | $(0.16 | ) | | | $(0.20 | ) | | | $(0.12 | ) |
Net realized and unrealized gain (loss) on
investments and foreign currency | | | 1.11 | | | | 5.03 | | | | 2.65 | | | | 2.41 | | | | 2.73 | |
Total from investment operations | | | $0.91 | | | | $4.85 | | | | $2.49 | | | | $2.21 | | | | $2.61 | |
| Less distributions declared to shareholders | | | | | | | | | |
From net realized gain on investments | | | $(0.85 | ) | | | $— | | | | $— | | | | $— | | | | $— | |
Net asset value, end of period (x) | | | $23.76 | | | | $23.70 | | | | $18.85 | | | | $16.36 | | | | $14.15 | |
Total return (%) (r)(s)(x) | | | 3.93 | | | | 25.73 | | | | 15.22 | | | | 15.62 | | | | 22.62 | |
Ratios (%) (to average net assets)
and Supplemental data: | | | | | |
Expenses before expense reductions (f) | | | 1.55 | | | | 1.58 | | | | 1.79 | | | | 1.70 | | | | 1.77 | |
Expenses after expense reductions (f) | | | 1.54 | | | | 1.58 | | | | 1.79 | | | | 1.70 | | | | 1.77 | |
Net investment loss | | | (0.84 | ) | | | (0.83 | ) | | | (0.94 | ) | | | (1.33 | ) | | | (0.87 | ) |
Portfolio turnover | | | 43 | | | | 38 | | | | 54 | | | | 68 | | | | 106 | |
Net assets at end of period (000 omitted) | | | $14,946 | | | | $17,123 | | | | $15,890 | | | | $17,748 | | | | $15,911 | |
| Supplemental Ratios (%): | | | | | |
Ratio of expenses to average net assets after expense
reductions excluding short sale dividend and
interest expense (f) | | | 1.52 | | | | 1.54 | | | | 1.62 | | | | 1.63 | | | | 1.68 | |
See Notes to Financial Statements
25
Financial Highlights – continued
| | | | | | | | | | | | | | | | | | | | |
| Class R3 | | Years ended 8/31 | |
| | | 2015 | | | 2014 | | | 2013 | | | 2012 | | | 2011 | |
Net asset value, beginning of period | | | $24.46 | | | | $19.41 | | | | $16.80 | | | | $14.49 | | | | $11.79 | |
| Income (loss) from investment operations | | | | | | | | | |
Net investment loss (d) | | | $(0.15 | ) | | | $(0.13 | ) | | | $(0.12 | ) | | | $(0.17 | ) | | | $(0.09 | ) |
Net realized and unrealized gain (loss) on
investments and foreign currency | | | 1.15 | | | | 5.18 | | | | 2.73 | | | | 2.48 | | | | 2.79 | |
Total from investment operations | | | $1.00 | | | | $5.05 | | | | $2.61 | | | | $2.31 | | | | $2.70 | |
| Less distributions declared to shareholders | | | | | | | | | |
From net realized gain on investments | | | $(0.85 | ) | | | $— | | | | $— | | | | $— | | | | $— | |
Net asset value, end of period (x) | | | $24.61 | | | | $24.46 | | | | $19.41 | | | | $16.80 | | | | $14.49 | |
Total return (%) (r)(s)(x) | | | 4.18 | | | | 26.02 | | | | 15.54 | | | | 15.94 | | | | 22.90 | |
Ratios (%) (to average net assets)
and Supplemental data: | | | | | |
Expenses before expense reductions (f) | | | 1.30 | | | | 1.33 | | | | 1.55 | | | | 1.45 | | | | 1.52 | |
Expenses after expense reductions (f) | | | 1.29 | | | | 1.32 | | | | 1.55 | | | | 1.45 | | | | 1.52 | |
Net investment loss | | | (0.60 | ) | | | (0.59 | ) | | | (0.70 | ) | | | (1.08 | ) | | | (0.63 | ) |
Portfolio turnover | | | 43 | | | | 38 | | | | 54 | | | | 68 | | | | 106 | |
Net assets at end of period (000 omitted) | | | $9,732 | | | | $10,626 | | | | $8,863 | | | | $8,720 | | | | $5,949 | |
| Supplemental Ratios (%): | | | | | |
Ratio of expenses to average net assets after expense
reductions excluding short sale dividend and
interest expense (f) | | | 1.27 | | | | 1.29 | | | | 1.37 | | | | 1.38 | | | | 1.43 | |
See Notes to Financial Statements
26
Financial Highlights – continued
| | | | | | | | | | | | | | | | | | | | |
| Class R4 | | Years ended 8/31 | |
| | | 2015 | | | 2014 | | | 2013 | | | 2012 | | | 2011 | |
Net asset value, beginning of period | | | $25.10 | | | | $19.86 | | | | $17.15 | | | | $14.76 | | | | $11.98 | |
| Income (loss) from investment operations | | | | | | | | | |
Net investment loss (d) | | | $(0.09 | ) | | | $(0.08 | ) | | | $(0.08 | ) | | | $(0.14 | ) | | | $(0.05 | ) |
Net realized and unrealized gain (loss) on
investments and foreign currency | | | 1.18 | | | | 5.32 | | | | 2.79 | | | | 2.53 | | | | 2.83 | |
Total from investment operations | | | $1.09 | | | | $5.24 | | | | $2.71 | | | | $2.39 | | | | $2.78 | |
| Less distributions declared to shareholders | | | | | | | | | |
From net realized gain on investments | | | $(0.85 | ) | | | $— | | | | $— | | | | $— | | | | $— | |
Net asset value, end of period (x) | | | $25.34 | | | | $25.10 | | | | $19.86 | | | | $17.15 | | | | $14.76 | |
Total return (%) (r)(s)(x) | | | 4.44 | | | | 26.38 | | | | 15.80 | | | | 16.19 | | | | 23.21 | |
Ratios (%) (to average net assets)
and Supplemental data: | | | | | |
Expenses before expense reductions (f) | | | 1.05 | | | | 1.07 | | | | 1.29 | | | | 1.20 | | | | 1.26 | |
Expenses after expense reductions (f) | | | 1.04 | | | | 1.07 | | | | 1.29 | | | | 1.20 | | | | 1.26 | |
Net investment loss | | | (0.37 | ) | | | (0.34 | ) | | | (0.45 | ) | | | (0.84 | ) | | | (0.32 | ) |
Portfolio turnover | | | 43 | | | | 38 | | | | 54 | | | | 68 | | | | 106 | |
Net assets at end of period (000 omitted) | | | $2,234 | | | | $1,403 | | | | $1,269 | | | | $823 | | | | $368 | |
| Supplemental Ratios (%): | | | | | |
Ratio of expenses to average net assets after expense
reductions excluding short sale dividend and
interest expense (f) | | | 1.02 | | | | 1.04 | | | | 1.12 | | | | 1.12 | | | | 1.17 | |
See Notes to Financial Statements
27
Financial Highlights – continued
| | | | | | | | | | | | |
| Class R5 | | Years ended 8/31 | |
| | | 2015 | | | 2014 | | | 2013 (i) | |
Net asset value, beginning of period | | | $25.73 | | | | $20.34 | | | | $17.68 | |
| Income (loss) from investment operations | |
Net investment income (loss) (d) | | | $(0.07 | ) | | | $(0.07 | ) | | | $(0.04 | ) |
Net realized and unrealized gain (loss) on investments and foreign
currency | | | 1.22 | | | | 5.46 | | | | 2.70 | |
Total from investment operations | | | $1.15 | | | | $5.39 | | | | $2.66 | |
| Less distributions declared to shareholders | |
From net realized gain on investments | | | $(0.85 | ) | | | $— | | | | $— | |
Net asset value, end of period (x) | | | $26.03 | | | | $25.73 | | | | $20.34 | |
Total return (%) (r)(s)(x) | | | 4.57 | | | | 26.50 | | | | 15.05 | (n) |
Ratios (%) (to average net assets)
and Supplemental data: | |
Expenses before expense reductions (f) | | | 0.95 | | | | 0.97 | | | | 1.13 | (a) |
Expenses after expense reductions (f) | | | 0.94 | | | | 0.96 | | | | 1.13 | (a) |
Net investment income (loss) | | | (0.27 | ) | | | (0.28 | ) | | | (0.35 | )(a) |
Portfolio turnover | | | 43 | | | | 38 | | | | 54 | |
Net assets at end of period (000 omitted) | | | $7,079 | | | | $2,429 | | | | $116 | |
| Supplemental Ratios (%): | |
Ratio of expenses to average net assets after expense reductions
excluding short sale dividend and interest expense (f) | | | 0.92 | | | | 0.95 | | | | 1.01 | (a) |
| (d) | Per share data is based on average shares outstanding. |
| (f) | Ratios do not reflect reductions from fees paid indirectly, if applicable. |
| (i) | For the period from the class’s inception, January 2, 2013, through the stated period end. |
| (r) | Certain expenses have been reduced without which performance would have been lower. |
| (s) | From time to time the fund may receive proceeds from litigation settlements, without which performance would be lower. |
| (t) | Total returns do not include any applicable sales charges. |
| (x) | The net asset values and total returns have been calculated on net assets which include adjustments made in accordance with U.S. generally accepted accounting principles required at period end for financial reporting purposes. |
See Notes to Financial Statements
28
NOTES TO FINANCIAL STATEMENTS
(1) Business and Organization
MFS Technology Fund (the fund) is a non-diversified series of MFS Series Trust I (the trust). The trust is organized as a Massachusetts business trust and is registered under the Investment Company Act of 1940, as amended, as an open-end management investment company.
The fund is an investment company and accordingly follows the investment company accounting and reporting guidance of the Financial Accounting Standards Board (FASB) Accounting Standards Codification Topic 946 Financial Services – Investment Companies.
(2) Significant Accounting Policies
General – The preparation of financial statements in conformity with U.S. generally accepted accounting principles requires management to make estimates and assumptions that affect the reported amounts of assets and liabilities, and disclosure of contingent assets and liabilities at the date of the financial statements and the reported amounts of increases and decreases in net assets from operations during the reporting period. Actual results could differ from those estimates. In the preparation of these financial statements, management has evaluated subsequent events occurring after the date of the fund’s Statement of Assets and Liabilities through the date that the financial statements were issued. The fund invests primarily in securities of issuers in the technology industry. Issuers in a single industry can react similarly to market, economic, political and regulatory conditions and developments.
In June 2014, FASB issued Accounting Standards Update 2014-11, Transfers and Servicing (Topic 860) – Repurchase-to-Maturity Transactions, Repurchase Financings, and Disclosures (“ASU 2014-11”). ASU 2014-11 changes the accounting for repurchase-to-maturity transactions (i.e., repurchase agreements that settle at the same time as the maturity of the transferred financial asset) and enhances the required disclosures for repurchase agreements and other similar transactions. Although still evaluating the potential impacts of ASU 2014-11 to the fund, management expects that the impact of the fund’s adoption will be limited to additional financial statement disclosures which would first be effective for interim reporting periods beginning after March 15, 2015.
Balance Sheet Offsetting – The fund’s accounting policy with respect to balance sheet offsetting is that, absent an event of default by the counterparty or a termination of the agreement, the International Swaps and Derivatives Association (ISDA) Master Agreement does not result in an offset of reported amounts of financial assets and financial liabilities in the Statement of Assets and Liabilities across transactions between the fund and the applicable counterparty. The fund’s right to setoff may be restricted or prohibited by the bankruptcy or insolvency laws of the particular jurisdiction to which a specific master netting agreement counterparty is subject. Balance sheet offsetting disclosures, to the extent applicable to the fund, have been included in the fund’s Significant Accounting Policies note under the captions for each of the fund’s in-scope financial instruments and transactions.
29
Notes to Financial Statements – continued
Investment Valuations – Equity securities, including restricted equity securities, are generally valued at the last sale or official closing price as provided by a third-party pricing service on the market or exchange on which they are primarily traded. Equity securities, for which there were no sales reported that day, are generally valued at the last quoted daily bid quotation as provided by a third-party pricing service on the market or exchange on which such securities are primarily traded. Equity securities held short, for which there were no sales reported for that day, are generally valued at the last quoted daily ask quotation as provided by a third-party pricing service on the market or exchange on which such securities are primarily traded. Short-term instruments with a maturity at issuance of 60 days or less may be valued at amortized cost, which approximates market value. Exchange-traded options are generally valued at the last sale or official closing price as provided by a third-party pricing service on the exchange on which such options are primarily traded. Exchange-traded options for which there were no sales reported that day are generally valued at the last daily bid quotation as provided by a third-party pricing service on the exchange on which such options are primarily traded. Options not traded on an exchange are generally valued at a broker/dealer bid quotation. Foreign currency options are generally valued at valuations provided by a third-party pricing service. Open-end investment companies are generally valued at net asset value per share. Securities and other assets generally valued on the basis of information from a third-party pricing service may also be valued at a broker/dealer bid quotation. Values obtained from third-party pricing services can utilize both transaction data and market information such as yield, quality, coupon rate, maturity, type of issue, trading characteristics, and other market data. The values of foreign securities and other assets and liabilities expressed in foreign currencies are converted to U.S. dollars using the mean of bid and asked prices for rates provided by a third-party pricing service.
The Board of Trustees has delegated primary responsibility for determining or causing to be determined the value of the fund’s investments (including any fair valuation) to the adviser pursuant to valuation policies and procedures approved by the Board. If the adviser determines that reliable market quotations are not readily available, investments are valued at fair value as determined in good faith by the adviser in accordance with such procedures under the oversight of the Board of Trustees. Under the fund’s valuation policies and procedures, market quotations are not considered to be readily available for most types of debt instruments and floating rate loans and many types of derivatives. These investments are generally valued at fair value based on information from third-party pricing services. In addition, investments may be valued at fair value if the adviser determines that an investment’s value has been materially affected by events occurring after the close of the exchange or market on which the investment is principally traded (such as foreign exchange or market) and prior to the determination of the fund’s net asset value, or after the halting of trading of a specific security where trading does not resume prior to the close of the exchange or market on which the security is principally traded. Events that occur on a frequent basis after foreign markets close (such as developments in foreign markets and significant movements in the U.S. markets) and prior to the determination of the fund’s net asset value may be deemed to have a material effect on the value of securities traded in foreign markets. Accordingly, the fund’s foreign equity securities may often be valued at fair value. The
30
Notes to Financial Statements – continued
adviser generally relies on third-party pricing services or other information (such as the correlation with price movements of similar securities in the same or other markets; the type, cost and investment characteristics of the security; the business and financial condition of the issuer; and trading and other market data) to assist in determining whether to fair value and at what value to fair value an investment. The value of an investment for purposes of calculating the fund’s net asset value can differ depending on the source and method used to determine value. When fair valuation is used, the value of an investment used to determine the fund’s net asset value may differ from quoted or published prices for the same investment. There can be no assurance that the fund could obtain the fair value assigned to an investment if it were to sell the investment at the same time at which the fund determines its net asset value per share.
Various inputs are used in determining the value of the fund’s assets or liabilities. These inputs are categorized into three broad levels. In certain cases, the inputs used to measure fair value may fall into different levels of the fair value hierarchy. In such cases, an investment’s level within the fair value hierarchy is based on the lowest level of input that is significant to the fair value measurement. The fund’s assessment of the significance of a particular input to the fair value measurement in its entirety requires judgment, and considers factors specific to the investment. Level 1 includes unadjusted quoted prices in active markets for identical assets or liabilities. Level 2 includes other significant observable market-based inputs (including quoted prices for similar securities, interest rates, prepayment speed, and credit risk). Level 3 includes unobservable inputs, which may include the adviser’s own assumptions in determining the fair value of investments. Other financial instruments are written options. The following is a summary of the levels used as of August 31, 2015 in valuing the fund’s assets or liabilities:
| | | | | | | | | | | | | | | | |
| Investments at Value | | Level 1 | | | Level 2 | | | Level 3 | | | Total | |
| Equity Securities: | | | | | | | | | | | | | | | | |
United States | | | $325,843,647 | | | | $192,390 | | | | $— | | | | $326,036,037 | |
Canada | | | 3,422,497 | | | | — | | | | — | | | | 3,422,497 | |
Israel | | | 3,380,635 | | | | — | | | | — | | | | 3,380,635 | |
United Kingdom | | | — | | | | 2,397,048 | | | | — | | | | 2,397,048 | |
Netherlands | | | 2,202,762 | | | | — | | | | — | | | | 2,202,762 | |
China | | | 1,507,205 | | | | — | | | | — | | | | 1,507,205 | |
| Mutual Funds | | | 15,717,950 | | | | — | | | | — | | | | 15,717,950 | |
| Total Investments | | | $352,074,697 | | | | $2,589,438 | | | | $— | | | | $354,664,135 | |
| Short Sales | | | (1,622,771 | ) | | | $— | | | | $— | | | | $(1,622,771 | ) |
| | | | |
| Other Financial Instruments | | | | | | | | | | | | |
| Written Options | | | $(10,297 | ) | | | $— | | | | $— | | | | $(10,297 | ) |
For further information regarding security characteristics, see the Portfolio of Investments.
Foreign Currency Translation – Purchases and sales of foreign investments, income, and expenses are converted into U.S. dollars based upon currency exchange rates prevailing on the respective dates of such transactions or on the reporting date for foreign denominated receivables and payables. Gains and losses attributable to foreign
31
Notes to Financial Statements – continued
currency exchange rates on sales of securities are recorded for financial statement purposes as net realized gains and losses on investments. Gains and losses attributable to foreign exchange rate movements on receivables, payables, income and expenses are recorded for financial statement purposes as foreign currency transaction gains and losses. That portion of both realized and unrealized gains and losses on investments that results from fluctuations in foreign currency exchange rates is not separately disclosed.
Derivatives – The fund uses derivatives for different purposes, primarily to increase or decrease exposure to a particular market or segment of the market, or security, to increase or decrease interest rate or currency exposure, or as alternatives to direct investments. Derivatives are used for hedging or non-hedging purposes. While hedging can reduce or eliminate losses, it can also reduce or eliminate gains. When the fund uses derivatives as an investment to increase market exposure, or for hedging purposes, gains and losses from derivative instruments may be substantially greater than the derivative’s original cost.
The derivative instruments used by the fund were written options, and purchased options. The fund’s period end derivatives, as presented in the Portfolio of Investments and the associated Derivative Contract tables, generally are indicative of the volume of its derivative activity during the period.
The following table presents, by major type of derivative contract, the fair value, on a gross basis, of the asset and liability components of derivatives held by the fund at August 31, 2015 as reported in the Statement of Assets and Liabilities:
| | | | | | | | | | |
| | | | | Fair Value (a) | |
| Risk | | Derivative Contracts | | Asset Derivatives | | | Liability Derivatives | |
| Equity | | Purchased Equity Options | | | $537,405 | | | | $— | |
| Equity | | Written Equity Options | | | — | | | | (10,297 | ) |
| (a) | The value of purchased options outstanding is included in total investments, at value, within the fund’s Statement of Assets and Liabilities. |
The following table presents, by major type of derivative contract, the realized gain (loss) on derivatives held by the fund for the year ended August 31, 2015 as reported in the Statement of Operations:
| | | | | | | | |
| Risk | | Investments
(Purchased
Options) | | | Written
Options | |
| Equity | | | $197,145 | | | | $920,723 | |
The following table presents, by major type of derivative contract, the change in unrealized appreciation (depreciation) on derivatives held by the fund for the year ended August 31, 2015 as reported in the Statement of Operations:
| | | | | | | | |
| Risk | | Investments
(Purchased
Options) | | | Written
Options | |
| Equity | | | $(211,466 | ) | | | $(2,028 | ) |
32
Notes to Financial Statements – continued
Derivative counterparty credit risk is managed through formal evaluation of the creditworthiness of all potential counterparties. On certain, but not all, uncleared derivatives, the fund attempts to reduce its exposure to counterparty credit risk whenever possible by entering into an ISDA Master Agreement on a bilateral basis. The ISDA Master Agreement gives each party to the agreement the right to terminate all transactions traded under such agreement if there is a certain deterioration in the credit quality of the other party. Upon an event of default or a termination of the ISDA Master Agreement, the non-defaulting party has the right to close out all transactions traded under such agreement and to net amounts owed under each transaction to one net amount payable by one party to the other. This right to close out and net payments across all transactions traded under the ISDA Master Agreement could result in a reduction of the fund’s credit risk to such counterparty equal to any amounts payable by the fund under the applicable transactions, if any.
Collateral and margin requirements differ by type of derivative. Margin requirements are set by the clearing broker and the clearing house for cleared derivatives (e.g., futures contracts, cleared swaps, and exchange-traded options) while collateral terms are contract specific for uncleared derivatives (e.g., forward foreign currency exchange contracts, uncleared swap agreements, and uncleared options). For derivatives traded under an ISDA Master Agreement, which contains a collateral support annex, the collateral requirements are netted across all transactions traded under such agreement and one amount is posted from one party to the other to collateralize such obligations. Cash that has been segregated to cover the fund’s collateral or margin obligations under derivative contracts, if any, will be reported separately in the Statement of Assets and Liabilities as “Restricted cash” or “Deposits with brokers.” Securities pledged as collateral or margin for the same purpose, if any, are noted in the Portfolio of Investments.
Written Options – In exchange for a premium, the fund wrote call options on securities for which it anticipated the price would decline and also wrote put options on securities for which it anticipated the price would increase. At the time the option was written, the fund believed the premium received exceeded the potential loss that could result from adverse price changes in the options’ underlying securities. In a written option, the fund as the option writer grants the buyer the right to purchase from, or sell to, the fund a specified number of shares or units of a particular security, currency or index at a specified price within a specified period of time.
The premium received is initially recorded as a liability in the Statement of Assets and Liabilities. The option is subsequently marked-to-market daily with the difference between the premium received and the market value of the written option being recorded as unrealized appreciation or depreciation. When a written option expires, the fund realizes a gain equal to the amount of the premium received. The difference between the premium received and the amount paid on effecting a closing transaction is considered a realized gain or loss. When a written call option is exercised, the premium received is offset against the proceeds to determine the realized gain or loss. When a written put option is exercised, the premium reduces the cost basis of the security purchased by the fund.
At the initiation of the written option contract, for exchange traded options, the fund is required to deposit securities or cash as collateral with the custodian for the benefit
33
Notes to Financial Statements – continued
of the broker or directly with the clearing broker, based on the type of option. For uncleared options, the fund may post collateral subject to the terms of an ISDA Master Agreement as generally described above if the market value of the options contract moves against it. The fund, as writer of an option, may have no control over whether the underlying securities may be sold (call) or purchased (put) and, as a result, bears the market risk of an unfavorable change in the price of the securities underlying the written option. Losses from writing options can exceed the premium received and can exceed the potential loss from an ordinary buy and sell transaction. Although the fund’s market risk may be significant, the maximum counterparty credit risk to the fund is equal to the market value of any collateral posted to the broker. For uncleared options, this risk is mitigated in cases where there is an ISDA Master Agreement between the fund and the counterparty providing for netting as described above.
The following table represents the written option activity in the fund during the year ended August 31, 2015:
| | | | | | | | |
| | | Number of
contracts | | | Premiums
received | |
| Outstanding, beginning of period | | | 936 | | | | $39,852 | |
| Options written | | | 58,228 | | | | 2,833,512 | |
| Options closed | | | (9,283 | ) | | | (676,933 | ) |
| Options exercised | | | (4,336 | ) | | | (208,794 | ) |
| Options expired | | | (45,291 | ) | | | (1,971,935 | ) |
| Outstanding, end of period | | | 254 | | | | $15,702 | |
Purchased Options – The fund purchased call and put options for a premium. Purchased call and put options entitle the holder to buy and sell a specified number of shares or units of a particular security, currency or index at a specified price at a specified date or within a specified period of time. Purchasing call options may hedge against an anticipated increase in the dollar cost of securities or currency to be acquired or increase the fund’s exposure to an underlying instrument. Purchasing put options may hedge against an anticipated decline in the value of portfolio securities or currency or decrease the fund’s exposure to an underlying instrument.
The premium paid is initially recorded as an investment in the Statement of Assets and Liabilities. That investment is subsequently marked-to-market daily with the difference between the premium paid and the market value of the purchased option being recorded as unrealized appreciation or depreciation. Premiums paid for purchased call and put options which have expired are treated as realized losses on investments in the Statement of Operations. Upon the exercise or closing of a purchased call option, the premium paid is added to the cost of the security or financial instrument purchased. Upon the exercise or closing of a purchased put option, the premium paid is offset against the proceeds on the sale of the underlying security or financial instrument in order to determine the realized gain or loss on investments.
Whether or not the option is exercised, the fund’s maximum risk of loss from purchasing an option is the amount of premium paid. All option contracts involve credit risk if the counterparty to the option contract fails to perform. For uncleared options, this risk is mitigated in cases where there is an ISDA Master Agreement between the fund and the counterparty providing for netting as described above and,
34
Notes to Financial Statements – continued
where applicable, by the posting of collateral by the counterparty to the fund to cover the fund’s exposure to the counterparty under such ISDA Master Agreement.
Short Sales – The fund entered into short sales whereby it sells a security it does not own in anticipation of a decline in the value of that security. The fund will realize a gain if the security price decreases and a loss if the security price increases between the date of the short sale and the date on which the fund replaces the borrowed security. Losses from short sales can exceed the proceeds of the security sold; and they can also exceed the potential loss from an ordinary buy and sell transaction. The amount of any premium, dividends, or interest the fund may be required to pay in connection with a short sale will be recognized as a fund expense. During the year ended August 31, 2015, this expense amounted to $71,846. The fund segregates cash or marketable securities in an amount that, when combined with the amount of proceeds from the short sale deposited with the broker, at least equals the current market value of the security sold short.
Security Loans – Under its Securities Lending Agency Agreement with the fund, State Street Bank and Trust Company (“State Street”), as lending agent, loans the securities of the fund to certain qualified institutions (the “Borrowers”) approved by the fund. The loans are collateralized by cash and/or U.S. Treasury and federal agency obligations in an amount typically at least equal to the market value of the securities loaned. On loans collateralized by cash, the cash collateral is invested in a money market fund. The market value of the loaned securities is determined at the close of business of the fund and any additional required collateral is delivered to the fund on the next business day. State Street provides the fund with indemnification against Borrower default. In the event of Borrower default, State Street will for the benefit of the fund either purchase securities identical to those loaned or, when such purchase is commercially impracticable, pay the fund the market value of the loaned securities. In return, State Street assumes the fund’s rights to the related collateral. If the collateral value is less than the cost to purchase identical securities, State Street is responsible for the shortfall, but only to the extent that such shortfall is not due to a decline in collateral value resulting from collateral reinvestment for which the fund bears the risk of loss. At period end, the fund had investment securities on loan with a fair value of $71,846 and a related liability of $77,711 for cash collateral received on securities loaned, both of which are presented gross in the Statement of Assets and Liabilities. The collateral received on securities loaned exceeded the value of securities on loan at period end. The liability for cash collateral for securities loaned is carried at fair value, which is categorized as level 2 within the fair value hierarchy. A portion of the income generated upon investment of the collateral is remitted to the Borrowers, and the remainder is allocated between the fund and the lending agent. On loans collateralized by U.S. Treasury and/or federal agency obligations, a fee is received from the Borrower, and is allocated between the fund and the lending agent. Income from securities lending is included in “Interest” income in the Statement of Operations. The dividend and interest income earned on the securities loaned is accounted for in the same manner as other dividend and interest income.
Indemnifications – Under the fund’s organizational documents, its officers and Trustees may be indemnified against certain liabilities and expenses arising out of the performance of their duties to the fund. Additionally, in the normal course of business,
35
Notes to Financial Statements – continued
the fund enters into agreements with service providers that may contain indemnification clauses. The fund’s maximum exposure under these agreements is unknown as this would involve future claims that may be made against the fund that have not yet occurred.
Investment Transactions and Income – Investment transactions are recorded on the trade date. Interest income is recorded on the accrual basis. Dividends received in cash are recorded on the ex-dividend date. Certain dividends from foreign securities will be recorded when the fund is informed of the dividend if such information is obtained subsequent to the ex-dividend date. Dividend and interest payments received in additional securities are recorded on the ex-dividend or ex-interest date in an amount equal to the value of the security on such date.
The fund may receive proceeds from litigation settlements. Any proceeds received from litigation involving portfolio holdings are reflected in the Statement of Operations in realized gain/loss if the security has been disposed of by the fund or in unrealized gain/loss if the security is still held by the fund. Any other proceeds from litigation not related to portfolio holdings are reflected as other income in the Statement of Operations.
Fees Paid Indirectly – The fund’s custody fee may be reduced by a credit earned under an arrangement that measures the value of U.S. dollars deposited with the custodian by the fund. The amount of the credit, for the year ended August 31, 2015, is shown as a reduction of total expenses in the Statement of Operations.
Tax Matters and Distributions – The fund intends to qualify as a regulated investment company, as defined under Subchapter M of the Internal Revenue Code, and to distribute all of its taxable income, including realized capital gains. As a result, no provision for federal income tax is required. The fund’s federal tax returns, when filed, will remain subject to examination by the Internal Revenue Service for a three year period. Management has analyzed the fund’s tax positions taken on federal and state tax returns for all open tax years and does not believe that there are any uncertain tax positions that require recognition of a tax liability. Foreign taxes, if any, have been accrued by the fund in the accompanying financial statements in accordance with the applicable foreign tax law. Foreign income taxes may be withheld by certain countries in which the fund invests. Additionally, capital gains realized by the fund on securities issued in or by certain foreign countries may be subject to capital gains tax imposed by those countries.
Distributions to shareholders are recorded on the ex-dividend date. Income and capital gain distributions are determined in accordance with income tax regulations, which may differ from U.S. generally accepted accounting principles. Certain capital accounts in the financial statements are periodically adjusted for permanent differences in order to reflect their tax character. These adjustments have no impact on net assets or net asset value per share. Temporary differences which arise from recognizing certain items of income, expense, gain or loss in different periods for financial statement and tax purposes will reverse at some time in the future. Distributions in excess of net investment income or net realized gains are temporary overdistributions for financial statement purposes resulting from differences in the recognition or classification of income or distributions for financial statement and tax purposes.
36
Notes to Financial Statements – continued
Book/tax differences primarily relate to wash sale loss deferrals, straddle loss deferrals and treating a portion of the proceeds from redemptions as a distribution for tax purposes.
The tax character of distributions declared to shareholders for the last two fiscal years is as follows:
| | | | | | | | |
| | | 8/31/15 | | | 8/31/14 | |
| Ordinary income (including any short-term capital gains) | | | $260,665 | | | | $— | |
| Long-term capital gains | | | 10,649,154 | | | | — | |
| Total distributions | | | $10,909,819 | | | | $— | |
The federal tax cost and the tax basis components of distributable earnings were as follows:
| | | | |
| As of 8/31/15 | | | |
| Cost of investments | | | $260,926,622 | |
| Gross appreciation | | | 99,990,106 | |
| Gross depreciation | | | (6,252,593 | ) |
| Net unrealized appreciation (depreciation) | | | $93,737,513 | |
| Undistributed long-term capital gain | | | 17,115,730 | |
| Post-October capital loss deferral | | | (200,566 | ) |
| Late year ordinary loss deferral | | | (1,261,459 | ) |
| Other temporary differences | | | (2,114,707 | ) |
Multiple Classes of Shares of Beneficial Interest – The fund offers multiple classes of shares, which differ in their respective distribution and service fees. The fund’s income, realized and unrealized gain (loss), and common expenses are allocated to shareholders based on the daily net assets of each class. Dividends are declared separately for each class. Differences in per share dividend rates are generally due to differences in separate class expenses. Class B shares will convert to Class A shares approximately eight years after purchase. The fund’s distributions declared to shareholders as reported in the Statements of Changes in Net Assets are presented by class as follows:
| | | | | | | | |
| | | From net realized gain on
investments | |
| | | Year ended
8/31/15 | | | Year ended
8/31/14 | |
| Class A | | | $6,168,353 | | | | $— | |
| Class B | | | 639,077 | | | | — | |
| Class C | | | 1,427,980 | | | | — | |
| Class I | | | 1,439,815 | | | | — | |
| Class R1 | | | 76,932 | | | | — | |
| Class R2 | | | 619,660 | | | | — | |
| Class R3 | | | 328,090 | | | | — | |
| Class R4 | | | 92,251 | | | | — | |
| Class R5 | | | 117,661 | | | | — | |
| Total | | | $10,909,819 | | | | $— | |
37
Notes to Financial Statements – continued
(3) Transactions with Affiliates
Investment Adviser – The fund has an investment advisory agreement with MFS to provide overall investment management and related administrative services and facilities to the fund. The management fee is computed daily and paid monthly at the following annual rates:
| | | | |
| First $1 billion of average daily net assets | | | 0.75 | % |
| Average daily net assets in excess of $1 billion | | | 0.70 | % |
MFS has agreed in writing to reduce its management fee by a specified amount if certain MFS mutual fund assets exceed thresholds agreed to by MFS and the fund’s Board of Trustees. For the year ended August 31, 2015, this management fee reduction amounted to $21,486, which is included in the reduction of total expenses in the Statement of Operations. The management fee incurred for the year ended August 31, 2015, was equivalent to an annual effective rate of 0.74% of the fund’s average daily net assets.
Distributor – MFS Fund Distributors, Inc. (MFD), a wholly-owned subsidiary of MFS, as distributor, received $115,163 for the year ended August 31, 2015, as its portion of the initial sales charge on sales of Class A shares of the fund.
The Board of Trustees has adopted a distribution plan for certain share classes pursuant to Rule 12b-1 of the Investment Company Act of 1940.
The fund’s distribution plan provides that the fund will pay MFD for services provided by MFD and financial intermediaries in connection with the distribution and servicing of certain share classes. One component of the plan is a distribution fee paid to MFD and another component of the plan is a service fee paid to MFD. MFD may subsequently pay all, or a portion, of the distribution and/or service fees to financial intermediaries.
Distribution Plan Fee Table:
| | | | | | | | | | | | | | | | | | | | |
| | | Distribution Fee Rate (d) | | | Service Fee Rate (d) | | | Total Distribution Plan (d) | | | Annual Effective Rate (e) | | | Distribution and Service Fee | |
| Class A | | | — | | | | 0.25% | | | | 0.25% | | | | 0.24% | | | | $470,951 | |
| Class B | | | 0.75% | | | | 0.25% | | | | 1.00% | | | | 1.00% | | | | 177,671 | |
| Class C | | | 0.75% | | | | 0.25% | | | | 1.00% | | | | 1.00% | | | | 399,295 | |
| Class R1 | | | 0.75% | | | | 0.25% | | | | 1.00% | | | | 1.00% | | | | 22,824 | |
| Class R2 | | | 0.25% | | | | 0.25% | | | | 0.50% | | | | 0.50% | | | | 85,188 | |
| Class R3 | | | — | | | | 0.25% | | | | 0.25% | | | | 0.25% | | | | 25,622 | |
| Total Distribution and Service Fees | | | | $1,181,551 | |
| (d) | In accordance with the distribution plan for certain classes, the fund pays distribution and/or service fees equal to these annual percentage rates of each class’s average daily net assets. The distribution and service fee rates disclosed by class represent the current rates in effect at the end of the reporting period. Any rate changes, if applicable, are detailed below. |
| (e) | The annual effective rates represent actual fees incurred under the distribution plan for the year ended August 31, 2015 based on each class’s average daily net assets. MFD has voluntarily agreed to rebate a portion of each class’s 0.25% service fee except for accounts attributable to MFS or its affiliates’ seed money. For the year ended August 31, 2015, this rebate amounted to $9,804, $198, and $320 for Class A, Class B, and Class C, respectively, and is included in the reduction of total expenses in the Statement of Operations. |
38
Notes to Financial Statements – continued
Certain Class A shares are subject to a contingent deferred sales charge (CDSC) in the event of a shareholder redemption within 18 months of purchase. Class C shares are subject to a CDSC in the event of a shareholder redemption within 12 months of purchase. Class B shares are subject to a CDSC in the event of a shareholder redemption within six years of purchase. All contingent deferred sales charges are paid to MFD and during the year ended August 31, 2015, were as follows:
| | | | |
| | | Amount | |
| Class A | | | $1,081 | |
| Class B | | | 16,012 | |
| Class C | | | 5,781 | |
Shareholder Servicing Agent – MFS Service Center, Inc. (MFSC), a wholly-owned subsidiary of MFS, receives a fee from the fund for its services as shareholder servicing agent calculated as a percentage of the average daily net assets of the fund as determined periodically under the supervision of the fund’s Board of Trustees. For the year ended August 31, 2015, the fee was $127,112, which equated to 0.0384% annually of the fund’s average daily net assets. MFSC also receives payment from the fund for out-of-pocket expenses, sub-accounting and other shareholder servicing costs which may be paid to affiliated and unaffiliated service providers. Class R5 shares do not incur sub-accounting fees. For the year ended August 31, 2015, these out-of-pocket expenses, sub-accounting and other shareholder servicing costs amounted to $428,860.
Administrator – MFS provides certain financial, legal, shareholder communications, compliance, and other administrative services to the fund. Under an administrative services agreement, the fund reimburses MFS the costs incurred to provide these services. The fund is charged an annual fixed amount of $17,500 plus a fee based on average daily net assets. The administrative services fee incurred for the year ended August 31, 2015 was equivalent to an annual effective rate of 0.0188% of the fund’s average daily net assets.
Trustees’ and Officers’ Compensation – The fund pays compensation to independent Trustees in the form of a retainer, attendance fees, and additional compensation to Board and Committee chairpersons. The fund does not pay compensation directly to Trustees or officers of the fund who are also officers of the investment adviser, all of whom receive remuneration for their services to the fund from MFS. Certain officers and Trustees of the fund are officers or directors of MFS, MFD, and MFSC.
Prior to December 31, 2001, the fund had an unfunded defined benefit plan (“DB plan”) for independent Trustees. As of December 31, 2001, the Board took action to terminate the DB plan with respect to then-current and any future independent Trustees, such that the DB plan covers only certain of those former independent Trustees who retired on or before December 31, 2001. The DB plan resulted in a pension expense of $186 and is included in “Independent Trustees’ compensation” in the Statement of Operations for the year ended August 31, 2015. The liability for deferred retirement benefits payable to certain independent Trustees under the DB plan amounted to $940 at August 31, 2015, and is included in “Payable for independent Trustees’ compensation” in the Statement of Assets and Liabilities.
39
Notes to Financial Statements – continued
Other – Effective November 1, 2014, this fund and certain other funds managed by MFS (the funds) have entered into a service agreement (the ISO Agreement) which provides for payment of fees solely by the funds to Tarantino LLC in return for the provision of services of an Independent Senior Officer (ISO) for the funds. Frank L. Tarantino serves as the ISO and is an officer of the funds and the sole member of Tarantino LLC. The funds can terminate the ISO Agreement with Tarantino LLC at any time under the terms of the ISO Agreement. Prior to November 1, 2014, the funds had entered into a service agreement (the Compliance Officer Agreement) which provided for payment of fees by the funds to Tarantino LLC in return for the provision of services of an Independent Chief Compliance Officer (ICCO) for the funds. Prior to November 1, 2014, Frank L. Tarantino served as the ICCO. Effective October 31, 2014, Mr. Tarantino resigned as ICCO and the Compliance Officer Agreement between the funds and Tarantino LLC was terminated. For the year ended August 31, 2015, the aggregate fees paid by the fund under these agreements were $1,201 and are included in “Miscellaneous” expense in the Statement of Operations. MFS had agreed to reimburse the fund for a portion of the payments made by the fund for the services under the Compliance Officer Agreement in the amount of $99, which is included in the reduction of total expenses in the Statement of Operations. Additionally, MFS has agreed to bear all expenses associated with office space, other administrative support, and supplies provided to the ICCO and ISO.
The fund invests in the MFS Institutional Money Market Portfolio which is managed by MFS and seeks current income consistent with preservation of capital and liquidity. Income earned on this investment is included in “Dividends from underlying affiliated funds” in the Statement of Operations. This money market fund does not pay a management fee to MFS.
On September 11, 2013, MFS redeemed 13,238 shares of Class R4 for an aggregate amount of $274,821.
(4) Portfolio Securities
For the year ended August 31, 2015, purchases and sales of investments, other than purchased option transactions, short sales, and short-term obligations, aggregated $177,853,091 and $137,020,611, respectively.
40
Notes to Financial Statements – continued
(5) Shares of Beneficial Interest
The fund’s Declaration of Trust permits the Trustees to issue an unlimited number of full and fractional shares of beneficial interest. Transactions in fund shares were as follows:
| | | | | | | | | | | | | | | | |
| | | Year ended
8/31/15 | | | Year ended
8/31/14 | |
| | | Shares | | | Amount | | | Shares | | | Amount | |
| Shares sold | | | | | | | | | | | | | | | | |
Class A | | | 2,241,507 | | | | $55,525,093 | | | | 1,925,678 | | | | $43,258,626 | |
Class B | | | 247,401 | | | | 5,526,117 | | | | 156,272 | | | | 3,221,334 | |
Class C | | | 500,699 | | | | 11,142,225 | | | | 437,949 | | | | 9,054,054 | |
Class I | | | 1,143,006 | | | | 29,588,966 | | | | 684,731 | | | | 16,296,362 | |
Class R1 | | | 48,003 | | | | 1,060,935 | | | | 58,654 | | | | 1,191,202 | |
Class R2 | | | 176,978 | | | | 4,207,508 | | | | 268,302 | | | | 5,825,941 | |
Class R3 | | | 124,472 | | | | 3,073,906 | | | | 185,343 | | | | 4,130,801 | |
Class R4 | | | 77,437 | | | | 1,980,406 | | | | 36,448 | | | | 830,516 | |
Class R5 | | | 205,623 | | | | 5,378,549 | | | | 97,026 | | | | 2,314,761 | |
| | | 4,765,126 | | | | $117,483,705 | | | | 3,850,403 | | | | $86,123,597 | |
| |
Shares issued to shareholders in reinvestment of distributions | | | | | |
Class A | | | 247,815 | | | | $5,935,159 | | | | — | | | | $— | |
Class B | | | 28,581 | | | | 617,360 | | | | — | | | | — | |
Class C | | | 55,394 | | | | 1,194,300 | | | | — | | | | — | |
Class I | | | 40,833 | | | | 1,028,984 | | | | — | | | | — | |
Class R1 | | | 3,575 | | | | 76,932 | | | | — | | | | — | |
Class R2 | | | 26,342 | | | | 609,819 | | | | — | | | | — | |
Class R3 | | | 13,705 | | | | 328,090 | | | | — | | | | — | |
Class R4 | | | 3,750 | | | | 92,251 | | | | — | | | | — | |
Class R5 | | | 4,660 | | | | 117,661 | | | | — | | | | — | |
| | | 424,655 | | | | $10,000,556 | | | | — | | | | $— | |
| |
| Shares reacquired | | | | | |
Class A | | | (1,384,224 | ) | | | $(34,114,765 | ) | | | (2,207,242 | ) | | | $(49,633,349 | ) |
Class B | | | (154,582 | ) | | | (3,449,270 | ) | | | (160,079 | ) | | | (3,283,048 | ) |
Class C | | | (228,706 | ) | | | (5,110,461 | ) | | | (226,224 | ) | | | (4,601,607 | ) |
Class I | | | (573,781 | ) | | | (14,838,971 | ) | | | (619,451 | ) | | | (14,855,590 | ) |
Class R1 | | | (29,169 | ) | | | (651,327 | ) | | | (53,964 | ) | | | (1,115,740 | ) |
Class R2 | | | (296,804 | ) | | | (7,132,965 | ) | | | (388,747 | ) | | | (8,456,797 | ) |
Class R3 | | | (177,203 | ) | | | (4,403,786 | ) | | | (207,625 | ) | | | (4,585,001 | ) |
Class R4 | | | (48,919 | ) | | | (1,259,257 | ) | | | (44,430 | ) | | | (988,142 | ) |
Class R5 | | | (32,669 | ) | | | (853,800 | ) | | | (8,330 | ) | | | (205,613 | ) |
| | | (2,926,057 | ) | | | $(71,814,602 | ) | | | (3,916,092 | ) | | | $(87,724,887 | ) |
41
Notes to Financial Statements – continued
| | | | | | | | | | | | | | | | |
| | | Year ended
8/31/15 | | | Year ended
8/31/14 | |
| | | Shares | | | Amount | | | Shares | | | Amount | |
| Net change | | | | | | | | | | | | | | | | |
Class A | | | 1,105,098 | | | | $27,345,487 | | | | (281,564 | ) | | | $(6,374,723 | ) |
Class B | | | 121,400 | | | | 2,694,207 | | | | (3,807 | ) | | | (61,714 | ) |
Class C | | | 327,387 | | | | 7,226,064 | | | | 211,725 | | | | 4,452,447 | |
Class I | | | 610,058 | | | | 15,778,979 | | | | 65,280 | | | | 1,440,772 | |
Class R1 | | | 22,409 | | | | 486,540 | | | | 4,690 | | | | 75,462 | |
Class R2 | | | (93,484 | ) | | | (2,315,638 | ) | | | (120,445 | ) | | | (2,630,856 | ) |
Class R3 | | | (39,026 | ) | | | (1,001,790 | ) | | | (22,282 | ) | | | (454,200 | ) |
Class R4 | | | 32,268 | | | | 813,400 | | | | (7,982 | ) | | | (157,626 | ) |
Class R5 | | | 177,614 | | | | 4,642,410 | | | | 88,696 | | | | 2,109,148 | |
| | | 2,263,724 | | | | $55,669,659 | | | | (65,689 | ) | | | $(1,601,290 | ) |
(6) Line of Credit
The fund and certain other funds managed by MFS participate in a $1.25 billion unsecured committed line of credit, subject to a $1 billion sublimit, provided by a syndication of banks under a credit agreement. Borrowings may be made for temporary financing needs. Interest is charged to each fund, based on its borrowings, generally at a rate equal to the higher of the Overnight Federal Reserve funds rate or daily one month LIBOR plus an agreed upon spread. A commitment fee, based on the average daily, unused portion of the committed line of credit, is allocated among the participating funds at the end of each calendar quarter. In addition, the fund and other funds managed by MFS have established unsecured uncommitted borrowing arrangements with certain banks for temporary financing needs. Interest is charged to each fund, based on its borrowings, at a rate equal to the Overnight Federal Reserve funds rate plus an agreed upon spread. For the year ended August 31, 2015, the fund’s commitment fee and interest expense were $1,078 and $0, respectively, and are included in “Miscellaneous” expense in the Statement of Operations.
(7) Transactions in Underlying Affiliated Funds-Affiliated Issuers
An affiliated issuer may be considered one in which the fund owns 5% or more of the outstanding voting securities, or a company which is under common control. For the purposes of this report, the fund assumes the following to be an affiliated issuer:
| | | | | | | | | | | | | | | | |
| Underlying Affiliated Fund | | Beginning Shares/Par Amount | | | Acquisitions Shares/Par Amount | | | Dispositions Shares/Par Amount | | | Ending Shares/Par Amount | |
MFS Institutional Money Market Portfolio | | | 11,677,042 | | | | 94,398,613 | | | | (90,435,416 | ) | | | 15,640,239 | |
| | | | |
| Underlying Affiliated Fund | | Realized
Gain (Loss) | | | Capital Gain Distributions | | | Dividend Income | | | Ending Value | |
MFS Institutional Money Market Portfolio | | | $— | | | | $— | | | | $10,799 | | | | $15,640,239 | |
42
REPORT OF INDEPENDENT REGISTERED PUBLIC ACCOUNTING FIRM
To the Board of Trustees of MFS Series Trust I and Shareholders of
MFS Technology Fund:
We have audited the accompanying statement of assets and liabilities of MFS Technology Fund (the Fund) (one of the series constituting MFS Series Trust I), including the portfolio of investments, as of August 31, 2015, and the related statement of operations for the year then ended, the statements of changes in net assets for each of the two years in the period then ended and the financial highlights for each of the periods indicated therein. These financial statements and financial highlights are the responsibility of the Fund’s management. Our responsibility is to express an opinion on these financial statements and financial highlights based on our audits.
We conducted our audits in accordance with the standards of the Public Company Accounting Oversight Board (United States). Those standards require that we plan and perform the audit to obtain reasonable assurance about whether the financial statements and financial highlights are free of material misstatement. We were not engaged to perform an audit of the Fund’s internal control over financial reporting. Our audits included consideration of internal control over financial reporting as a basis for designing audit procedures that are appropriate in the circumstances, but not for the purpose of expressing an opinion on the effectiveness of the Fund’s internal control over financial reporting. Accordingly, we express no such opinion. An audit also includes examining, on a test basis, evidence supporting the amounts and disclosures in the financial statements and financial highlights, assessing the accounting principles used and significant estimates made by management, and evaluating the overall financial statement presentation. Our procedures included confirmation of securities owned as of August 31, 2015, by correspondence with the custodian and others or by other appropriate auditing procedures where replies from others were not received. We believe that our audits provide a reasonable basis for our opinion.
In our opinion, the financial statements and financial highlights referred to above present fairly, in all material respects, the financial position of MFS Technology Fund (one of the series constituting MFS Series Trust I) at August 31, 2015, the results of its operations for the year then ended, the changes in its net assets for each of the two years in the period then ended and the financial highlights for each of the periods indicated therein, in conformity with U.S. generally accepted accounting principles.

Boston, Massachusetts
October 15, 2015
43
TRUSTEES AND OFFICERS — IDENTIFICATION AND BACKGROUND
The Trustees and Officers of the Trust, as of October 1, 2015, are listed below, together with their principal occupations during the past five years. (Their titles may have varied during that period.) The address of each Trustee and Officer is 111 Huntington Avenue, Boston, Massachusetts 02199-7618.
| | | | | | | | |
Name, Age | | Position(s) Held with Fund | | Trustee/Officer
Since (h) | | Principal
Occupations During the Past Five Years | | Other Directorships (j) |
| INTERESTED TRUSTEES |
Robert J. Manning (k) (age 51) | | Trustee | | February 2004 | | Massachusetts Financial Services Company, Chairman, Co-Chief Executive Officer and Director; Chief Investment Officer (until 2010) | | N/A |
Robin A. Stelmach (k) (age 54) | | Trustee and President | | January 2014 | | Massachusetts Financial Services Company, Executive Vice President and Chief Operating Officer | | N/A |
| INDEPENDENT TRUSTEES | | | | | | |
David H. Gunning (age 73) | | Trustee and Chair of Trustees | | January 2004 | | Private investor | | Lincoln Electric Holdings, Inc., Director; Development Alternatives, Inc., Director/Non-Executive Chairman |
Steven E. Buller (age 64) | | Trustee | | February 2014 | | Chairman, Financial Accounting Standards Advisory Council; Standing Advisory Group, Public Company Accounting Oversight Board, Member (until 2014); BlackRock, Inc. (investment management), Managing Director (until 2014), BlackRock Finco UK (investment management), Director (until 2014) | | N/A |
Robert E. Butler (age 73) | | Trustee | | January 2006 | | Consultant – investment company industry regulatory and compliance matters | | N/A |
44
Trustees and Officers – continued
| | | | | | | | |
Name, Age | | Position(s) Held with Fund | | Trustee/Officer
Since (h) | | Principal
Occupations During the Past Five Years | | Other Directorships (j) |
Maureen R. Goldfarb (age 60) | | Trustee | | January 2009 | | Private investor | | N/A |
William R. Gutow (age 74) | | Trustee | | December 1993 | | Private investor and real estate consultant; Capitol Entertainment Management Company (video franchise), Vice Chairman | | Texas Donuts, Vice Chairman (until 2010) |
Michael Hegarty (age 70) | | Trustee | | December 2004 | | Private investor | | Rouse Properties Inc., Director; Capmark Financial Group Inc., Director |
John P. Kavanaugh (age 60) | | Trustee | | January 2009 | | Private investor | | N/A |
Maryanne L. Roepke (age 59) | | Trustee | | May 2014 | | American Century Investments (investment management), Senior Vice President and Chief Compliance Officer (until 2014) | | N/A |
Laurie J. Thomsen (age 58) | | Trustee | | March 2005 | | Private investor; New Profit, Inc. (venture philanthropy), Executive Partner (until 2010) | | The Travelers Companies, Director; Dycom Industries, Inc. |
Robert W. Uek (age 74) | | Trustee | | January 2006 | | Consultant to investment company industry | | N/A |
| OFFICERS | | | | | | |
Christopher R. Bohane (k) (age 41) | | Assistant Secretary and Assistant Clerk | | July 2005 | | Massachusetts Financial Services Company, Vice President and Assistant General Counsel | | N/A |
Kino Clark (k) (age 47) | | Assistant Treasurer | | January 2012 | | Massachusetts Financial Services Company, Vice President | | N/A |
Kristin V. Collins (k) (age 42) | | Assistant Secretary and Assistant Clerk | | September 2015 | | Massachusetts Financial Services Company, Vice President and Assistant General Counsel | | N/A |
45
Trustees and Officers – continued
| | | | | | | | |
Name, Age | | Position(s) Held with Fund | | Trustee/Officer
Since (h) | | Principal
Occupations During the Past Five Years | | Other Directorships (j) |
Thomas H. Connors (k) (age 56) | | Assistant Secretary and Assistant Clerk | | September 2012 | | Massachusetts Financial Services Company, Vice President and Senior Counsel; Deutsche Investment Management Americas Inc. (financial service provider), Director and Senior Counsel (until 2012) | | N/A |
Ethan D. Corey (k) (age 51) | | Assistant Secretary and Assistant Clerk | | July 2005 | | Massachusetts Financial Services Company, Senior Vice President and Associate General Counsel | | N/A |
David L. DiLorenzo (k) (age 47) | | Treasurer | | July 2005 | | Massachusetts Financial Services Company, Senior Vice President | | N/A |
Susan S. Newton (k) (age 65) | | Assistant Secretary and Assistant Clerk | | May 2005 | | Massachusetts Financial Services Company, Senior Vice President and Associate General Counsel | | N/A |
Kenneth Paek (k) (age 41) | | Assistant Treasurer | | February 2015 | | Massachusetts Financial Services Company, Vice President; Cohen & Steers, Vice President/Head of Fund Administration (until 2014) | | N/A |
Susan A. Pereira (k) (age 44) | | Assistant Secretary and Assistant Clerk | | July 2005 | | Massachusetts Financial Services Company, Vice President and Senior Counsel | | N/A |
Kasey L. Phillips (k) (age 44) | | Assistant Treasurer | | September 2012 | | Massachusetts Financial Services Company, Vice President; Wells Fargo Funds Management, LLC, Senior Vice President, Fund Treasurer (until 2012) | | N/A |
46
Trustees and Officers – continued
| | | | | | | | |
Name, Age | | Position(s) Held with Fund | | Trustee/Officer
Since (h) | | Principal
Occupations During the Past Five Years | | Other Directorships (j) |
Mark N. Polebaum (k) (age 63) | | Secretary and Clerk | | January 2006 | | Massachusetts Financial Services Company, Executive Vice President, General Counsel and Secretary | | N/A |
Matthew A. Stowe (k) (age 40) | | Assistant Secretary and Assistant Clerk | | October 2014 | | Massachusetts Financial Services Company, Vice President and Assistant General Counsel | | N/A |
Frank L. Tarantino (age 71) | | Independent Senior Officer | | June 2004 | | Tarantino LLC (provider of compliance services), Principal | | N/A |
Richard S. Weitzel (k) (age 45) | | Assistant Secretary and Assistant Clerk | | October 2007 | | Massachusetts Financial Services Company, Senior Vice President and Associate General Counsel | | N/A |
Martin J. Wolin (k) (age 48) | | Chief Compliance Officer | | July 2015 | | Massachusetts Financial Services Company, Senior Vice President and Chief Compliance Officer (since July 2015); Mercer (financial service provider), Chief Risk and Compliance Officer, North America and Latin America (until June 2015) | | N/A |
James O. Yost (k) (age 55) | | Deputy Treasurer | | September 1990 | | Massachusetts Financial Services Company, Senior Vice President | | N/A |
| (h) | Date first appointed to serve as Trustee/officer of an MFS Fund. Each Trustee has served continuously since appointment unless indicated otherwise. For the period from December 15, 2004 until February 22, 2005, Mr. Manning served as Advisory Trustee. Prior to January 2012, Messrs. DiLorenzo and Yost served as Assistant Treasurers of the Funds. Ms. Stelmach was appointed as President of the Funds as of October 1, 2014. |
| (j) | Directorships or trusteeships of companies required to report to the Securities and Exchange Commission (i.e., “public companies”). |
| (k) | “Interested person” of the Trust within the meaning of the Investment Company Act of 1940 (referred to as the 1940 Act), which is the principal federal law governing investment companies like the fund, as a result of a position with MFS. The address of MFS is 111 Huntington Avenue, Boston, Massachusetts 02199-7618. |
47
Trustees and Officers – continued
Each Trustee (except Ms. Stelmach, Mr. Buller and Ms. Roepke) has been elected by shareholders and each Trustee and officer holds office until his or her successor is chosen and qualified or until his or her earlier death, resignation, retirement or removal. The Trust does not hold annual meetings for the purpose of electing Trustees, and Trustees are not elected for fixed terms. Messrs. Butler, Kavanaugh, Uek and Mses. Thomsen and Roepke are members of the Trust’s Audit Committee.
Each of the Fund’s Trustees and officers holds comparable positions with certain other funds of which MFS or a subsidiary is the investment adviser or distributor, and, in the case of the officers, with certain affiliates of MFS. As of October 1, 2015, the Trustees served as board members of 138 funds within the MFS Family of Funds.
The Statement of Additional Information for a Fund includes further information about the Trustees and is available without charge upon request by calling 1-800-225-2606.
| | |
| Investment Adviser | | Custodian |
Massachusetts Financial Services Company
111 Huntington Avenue
Boston, MA 02199-7618 | | State Street Bank and Trust Company 1 Lincoln Street Boston, MA 02111-2900 |
| Distributor | | Independent Registered Public Accounting Firm |
MFS Fund Distributors, Inc.
111 Huntington Avenue
Boston, MA 02199-7618 | | Ernst & Young LLP 200 Clarendon Street Boston, MA 02116 |
| Portfolio Manager | | |
Matthew Sabel | | |
48
BOARD REVIEW OF INVESTMENT ADVISORY AGREEMENT
The Investment Company Act of 1940 requires that both the full Board of Trustees and a majority of the non-interested (“independent”) Trustees, voting separately, annually approve the continuation of the Fund’s investment advisory agreement with MFS. The Trustees consider matters bearing on the Fund and its advisory arrangements at their meetings throughout the year, including a review of performance data at each regular meeting. In addition, the independent Trustees met several times over the course of three months beginning in May and ending in July, 2015 (“contract review meetings”) for the specific purpose of considering whether to approve the continuation of the investment advisory agreement for the Fund and the other investment companies that the Board oversees (the “MFS Funds”). The independent Trustees were assisted in their evaluation of the Fund’s investment advisory agreement by independent legal counsel, from whom they received separate legal advice and with whom they met separately from MFS during various contract review meetings. The independent Trustees were also assisted in this process by the MFS Funds’ Independent Senior Officer, a senior officer appointed by and reporting to the independent Trustees.
In connection with their deliberations regarding the continuation of the investment advisory agreement, the Trustees, including the independent Trustees, considered such information and factors as they believed, in light of the legal advice furnished to them and their own business judgment, to be relevant. The investment advisory agreement for the Fund was considered separately, although the Trustees also took into account the common interests of all MFS Funds in their review. As described below, the Trustees considered the nature, quality, and extent of the various investment advisory, administrative, and shareholder services performed by MFS under the existing investment advisory agreement and other arrangements with the Fund.
In connection with their contract review meetings, the Trustees received and relied upon materials that included, among other items: (i) information provided by Lipper Inc., an independent third party, on the investment performance of the Fund for various time periods ended December 31, 2014 and the investment performance of a group of funds with substantially similar investment classifications/objectives (the “Lipper performance universe”), (ii) information provided by Lipper Inc. on the Fund’s advisory fees and other expenses and the advisory fees and other expenses of comparable funds identified by Lipper Inc. (the “Lipper expense group”), (iii) information provided by MFS on the advisory fees of comparable portfolios of other clients of MFS, including institutional separate accounts and other clients, (iv) information as to whether and to what extent applicable expense waivers, reimbursements or fee “breakpoints” are observed for the Fund, (v) information regarding MFS’ financial results and financial condition, including MFS’ and certain of its affiliates’ estimated profitability from services performed for the Fund and the MFS Funds as a whole, and compared to MFS’ institutional business, (vi) MFS’ views regarding the outlook for the mutual fund industry and the strategic business plans of MFS, (vii) descriptions of various functions performed by MFS for the Funds, such as compliance monitoring and portfolio trading practices, and (viii) information regarding the overall organization of MFS, including information about MFS’ senior management and other personnel providing investment advisory, administrative and other services to
49
Board Review of Investment Advisory Agreement – continued
the Fund and the other MFS Funds. The comparative performance, fee and expense information prepared and provided by Lipper Inc. was not independently verified and the independent Trustees did not independently verify any information provided to them by MFS.
The Trustees’ conclusion as to the continuation of the investment advisory agreement was based on a comprehensive consideration of all information provided to the Trustees and not the result of any single factor. Some of the factors that figured particularly in the Trustees’ deliberations are described below, although individual Trustees may have evaluated the information presented differently from one another, giving different weights to various factors. It is also important to recognize that the fee arrangements for the Fund and other MFS Funds are the result of years of review and discussion between the independent Trustees and MFS, that certain aspects of such arrangements may receive greater scrutiny in some years than in others, and that the Trustees’ conclusions may be based, in part, on their consideration of these same arrangements during the course of the year and in prior years.
Based on information provided by Lipper Inc. and MFS, the Trustees reviewed the Fund’s total return investment performance as well as the performance of peer groups of funds over various time periods. The Trustees placed particular emphasis on the total return performance of the Fund’s Class A shares in comparison to the performance of funds in its Lipper performance universe over the three-year period ended December 31, 2014, which the Trustees believed was a long enough period to reflect differing market conditions. The total return performance of the Fund’s Class A shares was in the 3rd quintile relative to the other funds in the universe for this three-year period (the 1st quintile being the best performers and the 5th quintile being the worst performers). The total return performance of the Fund’s Class A shares was in the 3rd quintile for the one-year period and the 2nd quintile for the five-year period ended December 31, 2014 relative to the Lipper performance universe. Because of the passage of time, these performance results may differ from the performance results for more recent periods, including those shown elsewhere in this report.
In the course of their deliberations, the Trustees took into account information provided by MFS in connection with the contract review meetings, as well as during investment review meetings conducted with portfolio management personnel during the course of the year regarding the Fund’s performance. After reviewing these and related factors, the Trustees concluded, within the context of their overall conclusions regarding the investment advisory agreement, that they were satisfied with MFS’ responses and efforts relating to investment performance.
In assessing the reasonableness of the Fund’s advisory fee, the Trustees considered, among other information, the Fund’s advisory fee and the total expense ratio of the Fund’s Class A shares as a percentage of average daily net assets and the advisory fee and total expense ratios of peer groups of funds based on information provided by Lipper Inc. The Trustees considered that, according to the Lipper data (which takes into account any fee reductions or expense limitations that were in effect during the Fund’s last fiscal year), the Fund’s effective advisory fee rate and total expense ratio were each lower than the Lipper expense group median.
50
Board Review of Investment Advisory Agreement – continued
The Trustees also considered the advisory fees charged by MFS to any institutional separate accounts advised by MFS (“separate accounts”) and unaffiliated investment companies for which MFS serves as subadviser (“subadvised funds”) that have comparable investment strategies to the Fund. In comparing these fees, the Trustees considered information provided by MFS as to the generally broader scope of services provided by MFS to the Fund, as well as the more extensive regulatory burdens imposed on MFS in managing the Fund, in comparison to separate accounts and subadvised funds. The Trustees also considered the higher demands placed on MFS’ investment personnel and trading infrastructure as a result of the daily cash in-flows and out-flows of the Fund in comparison to separate accounts.
The Trustees also considered whether the Fund may benefit from any economies of scale in the management of the Fund in the event of growth in assets of the Fund and/or growth in assets of the MFS Funds as a whole. They noted that the Fund’s advisory fee rate schedule is subject to a contractual breakpoint that reduces the Fund’s advisory fee rate on average daily net assets over $1 billion. The Trustees also noted that MFS has agreed in writing to waive a portion of the management fees of certain MFS Funds, including the Fund, if the total combined assets of certain funds within the MFS Funds’ complex increase above agreed upon thresholds (the “group fee waiver”), enabling the Fund’s shareholders to share in the benefits from any economies of scale at the complex level. The group fee waiver is reviewed and renewed annually between the Board and MFS. The Trustees concluded that the breakpoint and the group fee waiver were sufficient to allow the Fund to benefit from economies of scale as its assets and overall complex assets grow.
The Trustees also considered information prepared by MFS relating to MFS’ costs and profits with respect to the Fund, the MFS Funds considered as a group, and other investment companies and accounts advised by MFS, as well as MFS’ methodologies used to determine and allocate its costs to the MFS Funds, the Fund and other accounts and products for purposes of estimating profitability.
After reviewing these and other factors described herein, the Trustees concluded, within the context of their overall conclusions regarding the investment advisory agreement, that the advisory fees charged to the Fund represent reasonable compensation in light of the services being provided by MFS to the Fund.
In addition, the Trustees considered MFS’ resources and related efforts to continue to retain, attract and motivate capable personnel to serve the Fund. The Trustees also considered current and developing conditions in the financial services industry, including the presence of large and well-capitalized companies which are spending, and appear to be prepared to continue to spend, substantial sums to engage personnel and to provide services to competing investment companies. In this regard, the Trustees also considered the financial resources of MFS and its ultimate parent, Sun Life Financial Inc. The Trustees also considered the advantages and possible disadvantages to the Fund of having an adviser that also serves other investment companies as well as other accounts.
The Trustees also considered the nature, quality, cost, and extent of administrative, transfer agency, and distribution services provided to the Fund by MFS and its affiliates under agreements and plans other than the investment advisory agreement, including
51
Board Review of Investment Advisory Agreement – continued
any 12b-1 fees the Fund pays to MFS Fund Distributors, Inc., an affiliate of MFS. The Trustees also considered the nature, extent and quality of certain other services MFS performs or arranges for on the Fund’s behalf, which may include securities lending programs, directed expense payment programs, class action recovery programs, and MFS’ interaction with third-party service providers, principally custodians and sub-custodians. The Trustees concluded that the various non-advisory services provided by MFS and its affiliates on behalf of the Fund were satisfactory.
The Trustees also considered benefits to MFS from the use of the Fund’s portfolio brokerage commissions, if applicable, to pay for investment research and various other factors. Additionally, the Trustees considered so-called “fall-out benefits” to MFS such as reputational value derived from serving as investment manager to the Fund.
Based on their evaluation of factors that they deemed to be material, including those factors described above, the Board of Trustees, including the independent Trustees, concluded that the Fund’s investment advisory agreement with MFS should be continued for an additional one-year period, commencing August 1, 2015.
52
PROXY VOTING POLICIES AND INFORMATION
MFS votes proxies on behalf of the fund pursuant to proxy voting policies and procedures that are available without charge, upon request, by calling 1-800-225-2606, by visiting the Proxy Voting section of mfs.com or by visiting the SEC’s Web site at http://www.sec.gov.
Information regarding how the fund voted proxies relating to portfolio securities during the most recent twelve-month period ended June 30 is available without charge by visiting the Proxy Voting section of mfs.com or by visiting the SEC’s Web site at http://www.sec.gov.
QUARTERLY PORTFOLIO DISCLOSURE
The fund will file a complete schedule of portfolio holdings with the Securities and Exchange Commission (the Commission) for the first and third quarters of each fiscal year on Form N-Q. A shareholder can obtain the quarterly portfolio holdings report at mfs.com. The fund’s Form N-Q is also available on the EDGAR database on the Commission’s Internet Web site at http://www.sec.gov, and may be reviewed and copied at the:
Public Reference Room
Securities and Exchange Commission
100 F Street, NE, Room 1580
Washington, D.C. 20549
Information on the operation of the Public Reference Room may be obtained by calling the Commission at 1-800-SEC-0330. Copies of the fund’s Form N-Q also may be obtained, upon payment of a duplicating fee, by electronic request at the following e-mail address: publicinfo@sec.gov or by writing the Public Reference Section at the above address.
FURTHER INFORMATION
From time to time, MFS may post important information about the fund or the MFS funds on the MFS web site (mfs.com). This information is available by visiting the “Market Commentary” and “Announcements” sub sections in the “Market Outlooks” section of mfs.com or by clicking on the fund’s name under “Mutual Funds” in the “Products” section of mfs.com.
FEDERAL TAX INFORMATION (unaudited)
The fund will notify shareholders of amounts for use in preparing 2015 income tax forms in January 2016. The following information is provided pursuant to provisions of the Internal Revenue Code.
The fund designates the maximum amount allowable as qualified dividend income eligible to be taxed at the same rate as long-term capital gain.
The fund designates $13,643,000 as capital gain dividends paid during the fiscal year.
For corporate shareholders, 100% of the ordinary income dividends paid during the fiscal year qualify for the corporate dividends received deduction.
53
rev. 3/11
| | | | |
| | | |
FACTS | | WHAT DOES MFS DO WITH YOUR PERSONAL INFORMATION? | |  |
| | |
| Why? | | Financial companies choose how they share your personal information. Federal law gives consumers the right to limit some but not all sharing. Federal law also requires us to tell you how we collect, share, and protect your personal information. Please read this notice carefully to understand what we do. |
| | |
| What? | | The types of personal information we collect and share depend on the product or service you have with us. This information can include: • Social Security number and account balances • Account transactions and transaction history • Checking account information and wire transfer instructions When you are no longer our customer, we continue to share your information as described in this notice. |
| | |
| How? | | All financial companies need to share customers’ personal information to run their everyday business. In the section below, we list the reasons financial companies can share their customers’ personal information; the reasons MFS chooses to share; and whether you can limit this sharing. |
| | | | |
Reasons we can share your
personal information | | Does MFS
share? | | Can you limit
this sharing? |
For our everyday business purposes – such as to process your transactions, maintain your account(s), respond to court orders and legal investigations, or report to credit bureaus | | Yes | | No |
For our marketing purposes – to offer our products and services to you | | No | | We don’t share |
| For joint marketing with other financial companies | | No | | We don’t share |
For our affiliates’ everyday business purposes – information about your transactions and experiences | | No | | We don’t share |
For our affiliates’ everyday business purposes – information about your creditworthiness | | No | | We don’t share |
| For nonaffiliates to market to you | | No | | We don’t share |
| | |
| Questions? | | Call 800-225-2606 or go to mfs.com. |
54
| | |
| Who we are |
| Who is providing this notice? | | MFS Funds, MFS Investment Management, MFS Institutional Advisors, Inc., MFS Fund Distributors, Inc., MFS Heritage Trust Company, and MFS Service Center, Inc. |
| | |
| What we do |
| How does MFS protect my personal information? | | To protect your personal information from unauthorized access and use, we use security measures that comply with federal law. These measures include procedural, electronic, and physical safeguards for the protection of the personal information we collect about you. |
| How does MFS collect my personal information? | | We collect your personal information, for example, when you • open an account or provide account information • direct us to buy securities or direct us to sell your securities • make a wire transfer We also collect your personal information from others, such as credit bureaus, affiliates and other companies. |
| Why can’t I limit all sharing? | | Federal law gives you the right to limit only • sharing for affiliates’ everyday business purposes – information about your creditworthiness • affiliates from using your information to market to you • sharing for nonaffiliates to market to you State laws and individual companies may give you additional rights to limit sharing. |
| | |
| Definitions |
| Affiliates | | Companies related by common ownership or control. They can be financial and nonfinancial companies. • MFS does not share personal information with affiliates, except for everyday business purposes as described on page one of this notice. |
| Nonaffiliates | | Companies not related by common ownership or control. They can be financial and nonfinancial companies. • MFS does not share with nonaffiliates so they can market to you. |
| Joint Marketing | | A formal agreement between nonaffiliated financial companies that together market financial products or services to you. • MFS doesn’t jointly market. |
| | |
| Other important information |
| If you own an MFS product or receive an MFS service in the name of a third party such as a bank or broker-dealer, their privacy policy may apply to you instead of ours. |
55
Save paper with eDelivery.

| MFS® will send you prospectuses, |
reports, and proxies directly via e-mail so you will get information faster with less mailbox clutter.
To sign up:
1. Go to mfs.com.
2. Log in via MFS® Access.
3. Select eDelivery.
If you own your MFS fund shares through a financial institution or a retirement plan, MFS® TALK, MFS® Access, or eDelivery may not be available to you.
CONTACT
WEB SITE
mfs.com
MFS TALK
1-800-637-8255
24 hours a day
ACCOUNT SERVICE AND LITERATURE
Shareholders
1-800-225-2606
Financial advisors
1-800-343-2829
Retirement plan services
1-800-637-1255
MAILING ADDRESS
MFS Service Center, Inc.
P.O. Box 55824
Boston, MA 02205-5824
OVERNIGHT MAIL
MFS Service Center, Inc.
c/o Boston Financial Data Services
30 Dan Road
Canton, MA 02021-2809
ANNUAL REPORT
August 31, 2015

MFS® U.S. GOVERNMENT
CASH RESERVE FUND

LMM-ANN
MFS® U.S. GOVERNMENT CASH RESERVE FUND
CONTENTS
The report is prepared for the general information of shareholders.
It is authorized for distribution to prospective investors only when preceded or accompanied by a current prospectus.
NOT FDIC INSURED • MAY LOSE VALUE • NO BANK GUARANTEE

LETTER FROM THE CHAIRMAN
Dear Shareholders:
The U.S. economy bounced back after another harsh winter curtailed domestic consumption. Despite strengthening labor and housing markets, however, a stronger U.S. dollar and weak overseas demand have held back corporate earnings.
China’s economic growth continues to slow, raising concerns and adding to global market volatility. Commodity exporters, including Australia and Canada, have been hurt by weaker Chinese demand. Global oil markets remain oversupplied, putting pressure on crude oil and gasoline prices.
In Europe, concerns about a potential Greek debt default have faded, and the eurozone’s economy is expanding mildly. Hopes for a more robust regionwide recovery rest on the European Central Bank’s quantitative easing program.
The world’s financial markets have become increasingly complex in recent years. Now, more than ever, it is important to understand companies on a global basis. At MFS®, we believe our integrated research platform, collaborative culture, active risk management process and long-term focus give us a research advantage.
As investors, we aim to add long-term value. We believe this approach will serve you well as you work with your financial advisor to reach your investment objectives.
Respectfully,

Robert J. Manning
Chairman
MFS Investment Management
October 15, 2015
The opinions expressed in this letter are subject to change and may not be relied upon for investment advice. No forecasts can be guaranteed.
1
PORTFOLIO COMPOSITION
Portfolio structure (u)
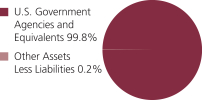
| | | | |
| Composition including fixed income credit quality (a)(u) | | | | |
| A-1+ | | | 15.8% | |
| A-1 | | | 84.0% | |
| Not Rated | | | 0.0% | |
| Other Assets Less Liabilities | | | 0.2% | |
| | | | |
| Maturity breakdown (u) | | | | |
| 0 - 7 days | | | 25.2% | |
| 8 - 29 days | | | 51.8% | |
| 30 - 59 days | | | 16.0% | |
| 60 - 89 days | | | 2.7% | |
| 90 - 365 days | | | 4.1% | |
| Other Assets Less Liabilities | | | 0.2% | |
| (a) | Ratings are assigned to portfolio securities utilizing ratings from Moody’s, Fitch, and Standard & Poor’s rating agencies and applying the following hierarchy: If all three agencies provide a rating, the middle rating (after dropping the highest and lowest ratings) is assigned; if two of the three agencies rate a security, the lower of the two is assigned. Ratings are shown in the S&P scale. All ratings are subject to change. The fund is not rated by these agencies. |
| (u) | For purposes of this presentation, accrued interest, where applicable, is included. |
Percentages are based on net assets as of 8/31/15.
The portfolio is actively managed and current holdings may be different.
2
PERFORMANCE SUMMARY THROUGH 8/31/15
Total returns as well as the current 7-day yield have been provided for the applicable time periods. Performance results reflect the percentage change in net asset value, including the reinvestment of any dividends and capital gains distributions. (See Notes to Performance Summary.)
Performance data shown represents past performance and is no guarantee of future results. Although the fund seeks to preserve the value of your investment at $1.00 per share, you could lose money on your investment in the fund. An investment in the fund is not a bank deposit and is not insured or guaranteed by the Federal Deposit Insurance Corporation or any other governmental agency. The performance shown does not reflect the deduction of taxes, if any, that a shareholder would pay on fund distributions or the redemption of fund shares.
| | | | | | | | | | |
| | | Share Class | | Inception | | 1-Year Total
Return (without
sales charge) (w) | | Current 7-day yield | | |
| | | A | | 9/07/93 | | 0.00% | | 0.00% | | |
| | | B | | 12/29/86 | | 0.00% | | 0.00% | | |
| | | C | | 4/01/96 | | 0.00% | | 0.00% | | |
| | | R1 | | 4/01/05 | | 0.00% | | 0.00% | | |
| | | R2 | | 4/01/05 | | 0.00% | | 0.00% | | |
| | | R3 | | 4/01/05 | | 0.00% | | 0.00% | | |
| | | R4 | | 4/01/05 | | 0.00% | | 0.00% | | |
| | | 529A | | 7/31/02 | | 0.00% | | 0.00% | | |
| | | 529B | | 7/31/02 | | 0.00% | | 0.00% | | |
| | | 529C | | 7/31/02 | | 0.00% | | 0.00% | | |
| | | | | |
| | | | | | | | | 1-Year
Total Return | | |
| | | B
With CDSC (Declining over six years from 4% to 0%) (v) | | | | (4.00)% | | |
| | | C
With CDSC (1% for 12 months) (v) | | | | (1.00)% | | |
| | | 529B
With CDSC (Declining over six years from 4% to 0%) (v) | | | | (4.00)% | | |
| | | 529C
With CDSC (1% for 12 months) (v) | | | | (1.00)% | | |
CDSC – Contingent Deferred Sales Charge.
Class R1, R2, R3, R4 and 529A shares do not have a sales charge. Certain Class A shares acquired through an exchange may be subject to a CDSC upon redemption depending on when the shares exchanged were originally purchased.
| (v) | Assuming redemption at the end of the applicable period. |
| (w) | Total return was less than 0.01%. |
3
Performance Summary – continued
Yields quoted are based on the latest seven days ended as of August 31, 2015, with dividends annualized. The yield quotations more closely reflect the current earnings of the fund than the total return quotations. Shares of the fund can be purchased at net asset value without a sales charge.
Notes to Performance Summary
Class 529 shares are only available in conjunction with qualified tuition programs, such as the MFS 529 Savings Plan. There also is an additional fee, which is detailed in the program description, on qualified tuition programs. If this fee was reflected, the performance for Class 529 shares would have been lower. This annual fee is waived for Oregon residents and for those accounts with assets of $25,000 or more.
Performance results reflect any applicable expense subsidies, waivers and adjustments in effect during the periods shown. Subsidies and fee waivers may be imposed to enhance a fund’s yield or to avoid a negative yield during periods when the fund’s operating expenses have a significant impact on the fund’s yield due to lower interest rates. Without such subsidies and waivers the fund’s performance results would be less favorable. Please see the prospectus and financial statements for complete details. All results are historical and assume the reinvestment of any dividends and capital gain distributions.
4
EXPENSE TABLE
Fund expenses borne by the shareholders during the period, March 1, 2015 through August 31, 2015
As a shareholder of the fund, you incur two types of costs: (1) transaction costs, including sales charges (loads) on certain purchase or redemption payments, and (2) ongoing costs, including management fees; distribution and service (12b-1) fees; and other fund expenses. This example is intended to help you understand your ongoing costs (in dollars) of investing in the fund and to compare these costs with the ongoing costs of investing in other mutual funds.
The example is based on an investment of $1,000 invested at the beginning of the
period and held for the entire period March 1, 2015 through August 31, 2015.
Actual Expenses
The first line for each share class in the following table provides information about actual account values and actual expenses. You may use the information in this line, together with the amount you invested, to estimate the expenses that you paid over the period. Simply divide your account value by $1,000 (for example, an $8,600 account value divided by $1,000 = 8.6), then multiply the result by the number in the first line under the heading entitled “Expenses Paid During Period” to estimate the
expenses you paid on your account during this period.
Hypothetical Example for Comparison Purposes
The second line for each share class in the following table provides information about hypothetical account values and hypothetical expenses based on the fund’s actual expense ratio and an assumed rate of return of 5% per year before expenses, which is not the fund’s actual return. The hypothetical account values and expenses may not be used to estimate the actual ending account balance or expenses you paid for the period. You may use this information to compare the ongoing costs of investing in the fund and other funds. To do so, compare this 5% hypothetical example with the 5% hypothetical examples that appear in the shareholder reports of the other funds.
Please note that the expenses shown in the table are meant to highlight your ongoing costs only and do not reflect any transactional costs, such as sales charges (loads). Therefore, the second line for each share class in the table is useful in comparing ongoing costs only, and will not help you determine the relative total costs of owning different funds. In addition, if these transactional costs were included, your costs would have been higher.
5
Expense Table – continued
| | | | | | | | | | | | | | | | | | |
Share
Class | | | | Annualized
Expense
Ratio | | | Beginning
Account Value
3/01/15 | | | Ending
Account Value
8/31/15 | | | Expenses
Paid During
Period (p)
3/01/15-8/31/15 | |
| A | | Actual | | | 0.07% | | | | $1,000.00 | | | | $1,000.00 | | | | $0.35 | |
| | Hypothetical (h) | | | 0.07% | | | | $1,000.00 | | | | $1,024.85 | | | | $0.36 | |
| B | | Actual | | | 0.07% | | | | $1,000.00 | | | | $1,000.00 | | | | $0.35 | |
| | Hypothetical (h) | | | 0.07% | | | | $1,000.00 | | | | $1,024.85 | | | | $0.36 | |
| C | | Actual | | | 0.07% | | | | $1,000.00 | | | | $1,000.00 | | | | $0.35 | |
| | Hypothetical (h) | | | 0.07% | | | | $1,000.00 | | | | $1,024.85 | | | | $0.36 | |
| R1 | | Actual | | | 0.07% | | | | $1,000.00 | | | | $1,000.00 | | | | $0.35 | |
| | Hypothetical (h) | | | 0.07% | | | | $1,000.00 | | | | $1,024.85 | | | | $0.36 | |
| R2 | | Actual | | | 0.07% | | | | $1,000.00 | | | | $1,000.00 | | | | $0.35 | |
| | Hypothetical (h) | | | 0.07% | | | | $1,000.00 | | | | $1,024.85 | | | | $0.36 | |
| R3 | | Actual | | | 0.07% | | | | $1,000.00 | | | | $1,000.00 | | | | $0.35 | |
| | Hypothetical (h) | | | 0.07% | | | | $1,000.00 | | | | $1,024.85 | | | | $0.36 | |
| R4 | | Actual | | | 0.07% | | | | $1,000.00 | | | | $1,000.00 | | | | $0.35 | |
| | Hypothetical (h) | | | 0.07% | | | | $1,000.00 | | | | $1,024.85 | | | | $0.36 | |
| 529A | | Actual | | | 0.07% | | | | $1,000.00 | | | | $1,000.00 | | | | $0.35 | |
| | Hypothetical (h) | | | 0.07% | | | | $1,000.00 | | | | $1,024.85 | | | | $0.36 | |
| 529B | | Actual | | | 0.07% | | | | $1,000.00 | | | | $1,000.00 | | | | $0.35 | |
| | Hypothetical (h) | | | 0.07% | | | | $1,000.00 | | | | $1,024.85 | | | | $0.36 | |
| 529C | | Actual | | | 0.07% | | | | $1,000.00 | | | | $1,000.00 | | | | $0.35 | |
| | Hypothetical (h) | | | 0.07% | | | | $1,000.00 | | | | $1,024.85 | | | | $0.36 | |
| (h) | 5% class return per year before expenses. |
| (p) | “Expenses Paid During Period” are equal to each class’s annualized expense ratio, as shown above, multiplied by the average account value over the period, multiplied by 184/365 (to reflect the one-half year period). Expenses paid do not include any applicable sales charges (loads). If these transaction costs had been included, your costs would have been higher. |
Notes to Expense Table
As more fully disclosed in footnote 3 to the financial statements, the expense ratios reported above include additional expense reductions to avoid a negative yield.
6
PORTFOLIO OF INVESTMENTS
8/31/15
The Portfolio of Investments is a complete list of all securities owned by your fund. It is categorized by broad-based asset classes.
| | | | | | | | |
| U.S. Government Agencies and Equivalents (y) - 99.8% | | | | | |
| Issuer | | Shares/Par | | | Value ($) | |
| Fannie Mae, 0.05%, due 9/02/15 | | $ | 6,185,000 | | | $ | 6,184,992 | |
| Federal Home Loan Bank, 0.06%, due 9/01/15 | | | 1,800,000 | | | | 1,800,000 | |
| Federal Home Loan Bank, 0.06%, due 9/02/15 | | | 20,691,000 | | | | 20,690,965 | |
| Federal Home Loan Bank, 0.06%, due 9/03/15 | | | 1,000,000 | | | | 999,997 | |
| Federal Home Loan Bank, 0.06%, due 9/04/15 | | | 29,235,000 | | | | 29,234,852 | |
| Federal Home Loan Bank, 0.05%, due 9/09/15 | | | 30,603,000 | | | | 30,602,655 | |
| Federal Home Loan Bank, 0.07%, due 9/11/15 | | | 24,276,000 | | | | 24,275,568 | |
| Federal Home Loan Bank, 0.06%, due 9/16/15 | | | 25,505,000 | | | | 25,504,323 | |
| Federal Home Loan Bank, 0.07%, due 9/18/15 | | | 30,863,000 | | | | 30,861,951 | |
| Federal Home Loan Bank, 0.06%, due 9/22/15 | | | 12,210,000 | | | | 12,209,580 | |
| Federal Home Loan Bank, 0.06%, due 9/24/15 | | | 11,500,000 | | | | 11,499,596 | |
| Federal Home Loan Bank, 0.07%, due 10/01/15 | | | 2,995,000 | | | | 2,994,825 | |
| Federal Home Loan Bank, 0.07%, due 10/02/15 | | | 7,000,000 | | | | 6,999,572 | |
| Federal Home Loan Bank, 0.12%, due 10/09/15 | | | 5,625,000 | | | | 5,624,315 | |
| Federal Home Loan Bank, 0.11%, due 10/14/15 | | | 2,000,000 | | | | 1,999,737 | |
| Federal Home Loan Bank, 0.16%, due 10/16/15 | | | 12,210,000 | | | | 12,207,665 | |
| Federal Home Loan Bank, 0.14%, due 10/21/15 | | | 14,615,000 | | | | 14,612,140 | |
| Federal Home Loan Bank, 0.12%, due 11/04/15 | | | 2,000,000 | | | | 1,999,573 | |
| Freddie Mac, 0.04%, due 9/08/15 | | | 8,635,000 | | | | 8,634,933 | |
| Freddie Mac, 0.05%, due 9/09/15 | | | 12,765,000 | | | | 12,764,858 | |
| Freddie Mac, 0.07%, due 9/29/15 | | | 3,939,000 | | | | 3,938,786 | |
| U.S. Treasury Bill, 0.04%, due 9/03/15 | | | 12,200,000 | | | | 12,199,973 | |
| U.S. Treasury Bill, 0.04%, due 9/17/15 | | | 12,190,000 | | | | 12,189,810 | |
| U.S. Treasury Bill, 0.13%, due 10/01/15 | | | 6,000,000 | | | | 5,999,375 | |
| U.S. Treasury Bill, 0.08%, due 11/05/15 | | | 6,667,000 | | | | 6,666,097 | |
| U.S. Treasury Bill, 0.275%, due 1/07/16 | | | 13,060,000 | | | | 13,047,230 | |
Total U.S. Government Agencies and Equivalents, at Amortized Cost and Value | | | | | | $ | 315,743,368 | |
| | |
| Other Assets, Less Liabilities - 0.2% | | | | | | | 709,855 | |
| Net Assets - 100.0% | | | | | | $ | 316,453,223 | |
| (y) | The rate shown represents an annualized yield at time of purchase. |
See Notes to Financial Statements
7
Financial Statements
STATEMENT OF ASSETS AND LIABILITIES
At 8/31/15
This statement represents your fund’s balance sheet, which details the assets and liabilities comprising the total value of the fund.
| | | | |
| Assets | | | | |
Investments, at amortized cost and value | | | $315,743,368 | |
Cash | | | 952 | |
Receivable for fund shares sold | | | 1,537,016 | |
Receivable from investment adviser and distributor | | | 87,624 | |
Other assets | | | 495 | |
Total assets | | | $317,369,455 | |
| Liabilities | | | | |
Payable for fund shares reacquired | | | $708,777 | |
Payable to affiliate for shareholder servicing costs | | | 139,687 | |
Payable for independent Trustees’ compensation | | | 9,624 | |
Accrued expenses and other liabilities | | | 58,144 | |
Total liabilities | | | $916,232 | |
Net assets | | | $316,453,223 | |
| Net assets consist of | | | | |
Paid-in capital | | | $316,670,216 | |
Accumulated net realized gain (loss) on investments | | | (207,379 | ) |
Accumulated net investment loss | | | (9,614 | ) |
Net assets | | | $316,453,223 | |
Shares of beneficial interest outstanding | | | 316,683,225 | |
8
Statement of Assets and Liabilities – continued
| | | | | | | | | | | | |
| | | Net assets | | | Shares
outstanding | | | Net asset value
per share | |
Class A | | | $122,085,486 | | | | 122,171,909 | | | | $1.00 | |
Class B | | | 18,830,649 | | | | 18,846,836 | | | | 1.00 | |
Class C | | | 42,522,272 | | | | 42,552,537 | | | | 1.00 | |
Class R1 | | | 14,362,725 | | | | 14,373,327 | | | | 1.00 | |
Class R2 | | | 53,057,934 | | | | 53,096,755 | | | | 1.00 | |
Class R3 | | | 44,871,977 | | | | 44,905,337 | | | | 1.00 | |
Class R4 | | | 3,033,517 | | | | 3,035,735 | | | | 1.00 | |
Class 529A | | | 11,383,043 | | | | 11,390,785 | | | | 1.00 | |
Class 529B | | | 439,556 | | | | 439,929 | | | | 1.00 | |
Class 529C | | | 5,866,064 | | | | 5,870,075 | | | | 1.00 | |
A contingent deferred sales charge may be imposed on redemptions of Class A, Class B, Class C, Class 529B, and Class 529C shares. Redemption price per share was equal to the net asset value per share for Classes R1, R2, R3, R4, and 529A.
See Notes to Financial Statements
9
Financial Statements
STATEMENT OF OPERATIONS
Year ended 8/31/15
This statement describes how much your fund earned in investment income and accrued in expenses. It also describes any gains and/or losses generated by fund operations.
| | | | |
| Net investment income | | | | |
Interest income | | | $214,549 | |
Expenses | | | | |
Management fee | | | $1,275,813 | |
Distribution and service fees | | | 1,552,729 | |
Program manager fees | | | 17,374 | |
Shareholder servicing costs | | | 563,309 | |
Administrative services fee | | | 60,328 | |
Independent Trustees’ compensation | | | 10,464 | |
Custodian fee | | | 35,705 | |
Shareholder communications | | | 32,258 | |
Audit and tax fees | | | 35,714 | |
Legal fees | | | 4,615 | |
Miscellaneous | | | 125,458 | |
Total expenses | | | $3,713,767 | |
Fees paid indirectly | | | (256 | ) |
Reduction of expenses by investment adviser and distributor | | | (3,498,962 | ) |
Net expenses | | | $214,549 | |
Net investment income | | | $0 | |
Net realized gain (loss) on investments | | | $2 | |
Change in net assets from operations | | | $2 | |
See Notes to Financial Statements
10
Financial Statements
STATEMENTS OF CHANGES IN NET ASSETS
These statements describe the increases and/or decreases in net assets resulting from operations, any distributions, and any shareholder transactions.
| | | | | | | | |
| | | Years ended 8/31 | |
| | | 2015 | | | 2014 | |
| Change in net assets | | | | | | |
| From operations | | | | | | | | |
Net investment income | | | $0 | | | | $0 | |
Net realized gain (loss) on investments | | | 2 | | | | 315 | |
Change in net assets from operations | | | $2 | | | | $315 | |
Change in net assets from fund share transactions | | | $(25,712,680 | ) | | | $(70,967,905 | ) |
Total change in net assets | | | $(25,712,678 | ) | | | $(70,967,590 | ) |
| Net assets | | | | | | | | |
At beginning of period | | | 342,165,901 | | | | 413,133,491 | |
At end of period (including accumulated net investment loss of
$9,614 and $12,622, respectively) | | | $316,453,223 | | | | $342,165,901 | |
See Notes to Financial Statements
11
Financial Statements
FINANCIAL HIGHLIGHTS
The financial highlights table is intended to help you understand the fund’s financial performance for the past 5 years. Certain information reflects financial results for a single fund share. The total returns in the table represent the rate by which an investor would have earned (or lost) on an investment in the fund share class (assuming reinvestment of all distributions) held for the entire period.
| | | | | | | | | | | | | | | | | | | | |
| Class A | | Years ended 8/31 | |
| | | 2015 | | | 2014 | | | 2013 | | | 2012 | | | 2011 | |
Net asset value, beginning of period | | | $1.00 | | | | $1.00 | | | | $1.00 | | | | $1.00 | | | | $1.00 | |
| Income (loss) from investment operations | | | | | | | | | | | | | | | | | |
Net investment income (d) | | | $0.00 | | | | $0.00 | | | | $0.00 | | | | $0.00 | | | | $0.00 | (w) |
Net realized and unrealized gain (loss)
on investments | | | 0.00 | (w) | | | 0.00 | (w) | | | — | | | | — | | | | (0.00 | )(w) |
Total from investment operations | | | $0.00 | (w) | | | $0.00 | (w) | | | $0.00 | | | | $0.00 | | | | $0.00 | (w) |
| Less distributions declared to shareholders | | | | | | | | | | | | | | | | | |
From net investment income | | | $— | | | | $— | | | | $— | | | | $— | | | | $(0.00 | )(w) |
From tax return of capital | | | — | | | | — | | | | — | | | | — | | | | (0.00 | )(w) |
Total distributions declared to shareholders | | | $— | | | | $— | | | | $— | | | | $— | | | | $(0.00 | )(w) |
Net asset value, end of period | | | $1.00 | | | | $1.00 | | | | $1.00 | | | | $1.00 | | | | $1.00 | |
Total return (%) (r)(t) | | | 0.00 | (w) | | | 0.00 | (w) | | | 0.00 | | | | 0.00 | | | | 0.00 | (w) |
Ratios (%) (to average net assets)
and Supplemental data: | | | | | | | | | | | | | | | | | | | | |
Expenses before expense reductions (f) | | | 0.92 | | | | 0.90 | | | | 0.93 | | | | 0.93 | | | | 0.94 | |
Expenses after expense reductions (f) | | | 0.07 | | | | 0.09 | | | | 0.15 | | | | 0.13 | | | | 0.20 | |
Net investment income | | | 0.00 | | | | 0.00 | | | | 0.00 | | | | 0.00 | | | | 0.00 | (w) |
Net assets at end of period (000 omitted) | | | $122,085 | | | | $124,550 | | | | $145,062 | | | | $126,283 | | | | $153,634 | |
See Notes to Financial Statements
12
Financial Highlights – continued
| | | | | | | | | | | | | | | | | | | | |
| Class B | | Years ended 8/31 | |
| | | 2015 | | | 2014 | | | 2013 | | | 2012 | | | 2011 | |
Net asset value, beginning of period | | | $1.00 | | | | $1.00 | | | | $1.00 | | | | $1.00 | | | | $1.00 | |
| Income (loss) from investment operations | | | | | | | | | | | | | | | | | |
Net investment income (d) | | | $0.00 | | | | $0.00 | | | | $0.00 | | | | $0.00 | | | | $0.00 | (w) |
Net realized and unrealized gain (loss)
on investments | | | 0.00 | (w) | | | 0.00 | (w) | | | — | | | | — | | | | (0.00 | )(w) |
Total from investment operations | | | $0.00 | (w) | | | $0.00 | (w) | | | $0.00 | | | | $0.00 | | | | $(0.00 | )(w) |
Net asset value, end of period | | | $1.00 | | | | $1.00 | | | | $1.00 | | | | $1.00 | | | | $1.00 | |
Total return (%) (r)(t) | | | 0.00 | (w) | | | 0.00 | (w) | | | 0.00 | | | | 0.00 | | | | 0.00 | (w) |
Ratios (%) (to average net assets)
and Supplemental data: | | | | | | | | | | | | | | | | | | | | |
Expenses before expense reductions (f) | | | 1.67 | | | | 1.65 | | | | 1.68 | | | | 1.68 | | | | 1.69 | |
Expenses after expense reductions (f) | | | 0.07 | | | | 0.10 | | | | 0.15 | | | | 0.12 | | | | 0.20 | |
Net investment income | | | 0.00 | | | | 0.00 | | | | 0.00 | | | | 0.00 | | | | 0.00 | (w) |
Net assets at end of period (000 omitted) | | | $18,831 | | | | $22,982 | | | | $30,833 | | | | $35,098 | | | | $50,379 | |
| |
| Class C | | Years ended 8/31 | |
| | | 2015 | | | 2014 | | | 2013 | | | 2012 | | | 2011 | |
Net asset value, beginning of period | | | $1.00 | | | | $1.00 | | | | $1.00 | | | | $1.00 | | | | $1.00 | |
| Income (loss) from investment operations | | | | | | | | | | | | | | | | | |
Net investment income (d) | | | $0.00 | | | | $0.00 | | | | $0.00 | | | | $0.00 | | | | $0.00 | |
Net realized and unrealized gain (loss)
on investments | | | 0.00 | (w) | | | 0.00 | (w) | | | — | | | | — | | | | (0.00 | )(w) |
Total from investment operations | | | $0.00 | (w) | | | $0.00 | (w) | | | $0.00 | | | | $0.00 | | | | $(0.00 | )(w) |
Net asset value, end of period | | | $1.00 | | | | $1.00 | | | | $1.00 | | | | $1.00 | | | | $1.00 | |
Total return (%) (r)(t) | | | 0.00 | (w) | | | 0.00 | (w) | | | 0.00 | | | | 0.00 | | | | 0.00 | (w) |
Ratios (%) (to average net assets)
and Supplemental data: | | | | | | | | | | | | | | | | | | | | |
Expenses before expense reductions (f) | | | 1.67 | | | | 1.65 | | | | 1.68 | | | | 1.68 | | | | 1.69 | |
Expenses after expense reductions (f) | | | 0.07 | | | | 0.10 | | | | 0.15 | | | | 0.13 | | | | 0.20 | |
Net investment income | | | 0.00 | | | | 0.00 | | | | 0.00 | | | | 0.00 | | | | 0.00 | |
Net assets at end of period (000 omitted) | | | $42,522 | | | | $45,662 | | | | $58,363 | | | | $49,851 | | | | $61,943 | |
See Notes to Financial Statements
13
Financial Highlights – continued
| | | | | | | | | | | | | | | | | | | | |
| Class R1 | | Years ended 8/31 | |
| | | 2015 | | | 2014 | | | 2013 | | | 2012 | | | 2011 | |
Net asset value, beginning of period | | | $1.00 | | | | $1.00 | | | | $1.00 | | | | $1.00 | | | | $1.00 | |
| Income (loss) from investment operations | | | | | | | | | | | | | | | | | |
Net investment income (d) | | | $0.00 | | | | $0.00 | | | | $0.00 | | | | $0.00 | | | | $0.00 | |
Net realized and unrealized gain (loss)
on investments | | | 0.00 | (w) | | | 0.00 | (w) | | | — | | | | — | | | | (0.00 | )(w) |
Total from investment operations | | | $0.00 | (w) | | | $0.00 | (w) | | | $0.00 | | | | $0.00 | | | | $(0.00 | )(w) |
Net asset value, end of period | | | $1.00 | | | | $1.00 | | | | $1.00 | | | | $1.00 | | | | $1.00 | |
Total return (%) (r) | | | 0.00 | (w) | | | 0.00 | (w) | | | 0.00 | | | | 0.00 | | | | 0.00 | (w) |
Ratios (%) (to average net assets)
and Supplemental data: | | | | | | | | | | | | | | | | | | | | |
Expenses before expense reductions (f) | | | 1.67 | | | | 1.65 | | | | 1.68 | | | | 1.68 | | | | 1.69 | |
Expenses after expense reductions (f) | | | 0.07 | | | | 0.09 | | | | 0.15 | | | | 0.13 | | | | 0.20 | |
Net investment income | | | 0.00 | | | | 0.00 | | | | 0.00 | | | | 0.00 | | | | 0.00 | |
Net assets at end of period (000 omitted) | | | $14,363 | | | | $16,819 | | | | $21,080 | | | | $24,361 | | | | $28,705 | |
| |
| Class R2 | | Years ended 8/31 | |
| | | 2015 | | | 2014 | | | 2013 | | | 2012 | | | 2011 | |
Net asset value, beginning of period | | | $1.00 | | | | $1.00 | | | | $1.00 | | | | $1.00 | | | | $1.00 | |
| Income (loss) from investment operations | | | | | | | | | | | | | | | | | |
Net investment income (d) | | | $0.00 | | | | $0.00 | | | | $0.00 | | | | $0.00 | | | | $0.00 | |
Net realized and unrealized gain (loss)
on investments | | | 0.00 | (w) | | | 0.00 | (w) | | | — | | | | — | | | | (0.00 | )(w) |
Total from investment operations | | | $0.00 | (w) | | | $0.00 | (w) | | | $0.00 | | | | $0.00 | | | | $(0.00 | )(w) |
Net asset value, end of period | | | $1.00 | | | | $1.00 | | | | $1.00 | | | | $1.00 | | | | $1.00 | |
Total return (%) (r) | | | 0.00 | (w) | | | 0.00 | (w) | | | 0.00 | | | | 0.00 | | | | 0.00 | (w) |
Ratios (%) (to average net assets)
and Supplemental data: | | | | | | | | | | | | | | | | | | | | |
Expenses before expense reductions (f) | | | 1.17 | | | | 1.15 | | | | 1.18 | | | | 1.18 | | | | 1.19 | |
Expenses after expense reductions (f) | | | 0.07 | | | | 0.09 | | | | 0.15 | | | | 0.13 | | | | 0.20 | |
Net investment income | | | 0.00 | | | | 0.00 | | | | 0.00 | | | | 0.00 | | | | 0.00 | |
Net assets at end of period (000 omitted) | | | $53,058 | | | | $57,634 | | | | $74,406 | | | | $83,723 | | | | $104,130 | |
See Notes to Financial Statements
14
Financial Highlights – continued
| | | | | | | | | | | | | | | | | | | | |
| Class R3 | | Years ended 8/31 | |
| | | 2015 | | | 2014 | | | 2013 | | | 2012 | | | 2011 | |
Net asset value, beginning of period | | | $1.00 | | | | $1.00 | | | | $1.00 | | | | $1.00 | | | | $1.00 | |
| Income (loss) from investment operations | | | | | | | | | | | | | | | | | |
Net investment income (d) | | | $0.00 | | | | $0.00 | | | | $0.00 | | | | $0.00 | | | | $0.00 | |
Net realized and unrealized gain (loss)
on investments | | | 0.00 | (w) | | | 0.00 | (w) | | | — | | | | — | | | | (0.00 | )(w) |
Total from investment operations | | | $0.00 | (w) | | | $0.00 | (w) | | | $0.00 | | | | $0.00 | | | | $(0.00 | )(w) |
Net asset value, end of period | | | $1.00 | | | | $1.00 | | | | $1.00 | | | | $1.00 | | | | $1.00 | |
Total return (%) (r) | | | 0.00 | (w) | | | 0.00 | (w) | | | 0.00 | | | | 0.00 | | | | 0.00 | (w) |
Ratios (%) (to average net assets)
and Supplemental data: | | | | | | | | | | | | | | | | | | | | |
Expenses before expense reductions (f) | | | 0.92 | | | | 0.90 | | | | 0.93 | | | | 0.93 | | | | 0.94 | |
Expenses after expense reductions (f) | | | 0.07 | | | | 0.09 | | | | 0.15 | | | | 0.13 | | | | 0.20 | |
Net investment income | | | 0.00 | | | | 0.00 | | | | 0.00 | | | | 0.00 | | | | 0.00 | |
Net assets at end of period (000 omitted) | | | $44,872 | | | | $53,916 | | | | $64,925 | | | | $79,029 | | | | $85,602 | |
| |
| Class R4 | | Years ended 8/31 | |
| | | 2015 | | | 2014 | | | 2013 | | | 2012 | | | 2011 | |
Net asset value, beginning of period | | | $1.00 | | | | $1.00 | | | | $1.00 | | | | $1.00 | | | | $1.00 | |
| Income (loss) from investment operations | | | | | | | | | | | | | | | | | |
Net investment income (d) | | | $0.00 | | | | $0.00 | | | | $0.00 | | | | $0.00 | | | | $0.00 | (w) |
Net realized and unrealized gain (loss)
on investments | | | 0.00 | (w) | | | 0.00 | (w) | | | — | | | | — | | | | (0.00 | )(w) |
Total from investment operations | | | $0.00 | (w) | | | $0.00 | (w) | | | $0.00 | | | | $0.00 | | | | $0.00 | (w) |
From net investment income | | | $— | | | | $— | | | | $— | | | | $— | | | | $(0.00 | )(w) |
From tax return of capital | | | — | | | | — | | | | — | | | | — | | | | (0.00 | )(w) |
Total distributions declared to shareholders | | | $— | | | | $— | | | | $— | | | | $— | | | | $(0.00 | )(w) |
Net asset value, end of period | | | $1.00 | | | | $1.00 | | | | $1.00 | | | | $1.00 | | | | $1.00 | |
Total return (%) (r) | | | 0.00 | (w) | | | 0.00 | (w) | | | 0.00 | | | | 0.00 | | | | 0.00 | (w) |
Ratios (%) (to average net assets)
and Supplemental data: | | | | | | | | | | | | | | | | | | | | |
Expenses before expense reductions (f) | | | 0.67 | | | | 0.65 | | | | 0.68 | | | | 0.69 | | | | 0.69 | |
Expenses after expense reductions (f) | | | 0.07 | | | | 0.09 | | | | 0.15 | | | | 0.12 | | | | 0.20 | |
Net investment income | | | 0.00 | | | | 0.00 | | | | 0.00 | | | | 0.00 | | | | 0.00 | (w) |
Net assets at end of period (000 omitted) | | | $3,034 | | | | $2,907 | | | | $820 | | | | $810 | | | | $5,743 | |
See Notes to Financial Statements
15
Financial Highlights – continued
| | | | | | | | | | | | | | | | | | | | |
| Class 529A | | Years ended 8/31 | |
| | | 2015 | | | 2014 | | | 2013 | | | 2012 | | | 2011 | |
Net asset value, beginning of period | | | $1.00 | | | | $1.00 | | | | $1.00 | | | | $1.00 | | | | $1.00 | |
| Income (loss) from investment operations | | | | | | | | | | | | | | | | | |
Net investment income (d) | | | $0.00 | | | | $0.00 | | | | $0.00 | | | | $0.00 | | | | $0.00 | |
Net realized and unrealized gain (loss)
on investments | | | 0.00 | (w) | | | 0.00 | (w) | | | — | | | | — | | | | (0.00 | )(w) |
Total from investment operations | | | $0.00 | (w) | | | $0.00 | (w) | | | $0.00 | | | | $0.00 | | | | $(0.00 | )(w) |
Net asset value, end of period | | | $1.00 | | | | $1.00 | | | | $1.00 | | | | $1.00 | | | | $1.00 | |
Total return (%) (r) | | | 0.00 | (w) | | | 0.00 | (w) | | | 0.00 | | | | 0.00 | | | | 0.00 | (w) |
Ratios (%) (to average net assets)
and Supplemental data: | | | | | | | | | | | | | | | | | | | | |
Expenses before expense reductions (f) | | | 1.02 | | | | 1.00 | | | | 1.03 | | | | 1.03 | | | | 1.04 | |
Expenses after expense reductions (f) | | | 0.07 | | | | 0.09 | | | | 0.15 | | | | 0.13 | | | | 0.20 | |
Net investment income | | | 0.00 | | | | 0.00 | | | | 0.00 | | | | 0.00 | | | | 0.00 | |
Net assets at end of period (000 omitted) | | | $11,383 | | | | $10,927 | | | | $10,897 | | | | $10,330 | | | | $9,710 | |
| |
| Class 529B | | Years ended 8/31 | |
| | | 2015 | | | 2014 | | | 2013 | | | 2012 | | | 2011 | |
Net asset value, beginning of period | | | $1.00 | | | | $1.00 | | | | $1.00 | | | | $1.00 | | | | $1.00 | |
| Income (loss) from investment operations | | | | | | | | | | | | | | | | | |
Net investment income (d) | | | $0.00 | | | | $0.00 | | | | $0.00 | | | | $0.00 | | | | $0.00 | |
Net realized and unrealized gain (loss)
on investments | | | 0.00 | (w) | | | 0.00 | (w) | | | — | | | | — | | | | (0.00 | )(w) |
Total from investment operations | | | $0.00 | (w) | | | $0.00 | (w) | | | $0.00 | | | | $0.00 | | | | $(0.00 | )(w) |
Net asset value, end of period | | | $1.00 | | | | $1.00 | | | | $1.00 | | | | $1.00 | | | | $1.00 | |
Total return (%) (r)(t) | | | 0.00 | (w) | | | 0.00 | (w) | | | 0.00 | | | | 0.00 | | | | 0.00 | (w) |
Ratios (%) (to average net assets)
and Supplemental data: | | | | | | | | | | | | | | | | | | | | |
Expenses before expense reductions (f) | | | 1.77 | | | | 1.75 | | | | 1.78 | | | | 1.78 | | | | 1.79 | |
Expenses after expense reductions (f) | | | 0.07 | | | | 0.10 | | | | 0.15 | | | | 0.12 | | | | 0.20 | |
Net investment income | | | 0.00 | | | | 0.00 | | | | 0.00 | | | | 0.00 | | | | 0.00 | |
Net assets at end of period (000 omitted) | | | $440 | | | | $531 | | | | $676 | | | | $665 | | | | $1,073 | |
See Notes to Financial Statements
16
Financial Highlights – continued
| | | | | | | | | | | | | | | | | | | | |
| Class 529C | | Years ended 8/31 | |
| | | 2015 | | | 2014 | | | 2013 | | | 2012 | | | 2011 | |
Net asset value, beginning of period | | | $1.00 | | | | $1.00 | | | | $1.00 | | | | $1.00 | | | | $1.00 | |
| Income (loss) from investment operations | | | | | | | | | | | | | | | | | |
Net investment income (d) | | | $0.00 | | | | $0.00 | | | | $0.00 | | | | $0.00 | | | | $0.00 | |
Net realized and unrealized gain (loss)
on investments | | | 0.00 | (w) | | | 0.00 | (w) | | | — | | | | — | | | | (0.00 | )(w) |
Total from investment operations | | | $0.00 | (w) | | | $0.00 | (w) | | | $0.00 | | | | $0.00 | | | | $(0.00 | )(w) |
Net asset value, end of period | | | $1.00 | | | | $1.00 | | | | $1.00 | | | | $1.00 | | | | $1.00 | |
Total return (%) (r)(t) | | | 0.00 | (w) | | | 0.00 | (w) | | | 0.00 | | | | 0.00 | | | | 0.00 | (w) |
Ratios (%) (to average net assets)
and Supplemental data: | | | | | | | | | | | | | | | | | | | | |
Expenses before expense reductions (f) | | | 1.77 | | | | 1.75 | | | | 1.78 | | | | 1.78 | | | | 1.79 | |
Expenses after expense reductions (f) | | | 0.07 | | | | 0.09 | | | | 0.15 | | | | 0.13 | | | | 0.20 | |
Net investment income | | | 0.00 | | | | 0.00 | | | | 0.00 | | | | 0.00 | | | | 0.00 | |
Net assets at end of period (000 omitted) | | | $5,866 | | | | $6,240 | | | | $6,072 | | | | $5,020 | | | | $5,525 | |
| (d) | Per share data is based on average shares outstanding. |
| (f) | Ratios do not reflect reductions from fees paid indirectly, if applicable. |
| (r) | Certain expenses have been reduced without which performance would have been lower. |
| (t) | Total returns do not include any applicable sales charges. |
| (w) | Per share amount was less than $0.01 and total return or ratio was less than 0.01%, as applicable. |
See Notes to Financial Statements
17
NOTES TO FINANCIAL STATEMENTS
(1) Business and Organization
MFS U.S. Government Cash Reserve Fund (the fund) is a diversified series of MFS Series Trust I (the trust). The trust is organized as a Massachusetts business trust and is registered under the Investment Company Act of 1940, as amended, as an open-end management investment company.
The fund is an investment company and accordingly follows the investment company accounting and reporting guidance of the Financial Accounting Standards Board (FASB) Accounting Standards Codification Topic 946 Financial Services – Investment Companies.
(2) Significant Accounting Policies
General – The preparation of financial statements in conformity with U.S. generally accepted accounting principles requires management to make estimates and assumptions that affect the reported amounts of assets and liabilities, and disclosure of contingent assets and liabilities at the date of the financial statements and the reported amounts of increases and decreases in net assets from operations during the reporting period. Actual results could differ from those estimates. In the preparation of these financial statements, management has evaluated subsequent events occurring after the date of the fund’s Statement of Assets and Liabilities through the date that the financial statements were issued.
In June 2014, FASB issued Accounting Standards Update 2014-11, Transfers and Servicing (Topic 860) – Repurchase-to-Maturity Transactions, Repurchase Financings, and Disclosures (“ASU 2014-11”). ASU 2014-11 changes the accounting for repurchase-to-maturity transactions (i.e., repurchase agreements that settle at the same time as the maturity of the transferred financial asset) and enhances the required disclosures for repurchase agreements and other similar transactions. Although still evaluating the potential impacts of ASU 2014-11 to the fund, management expects that the impact of the fund’s adoption will be limited to additional financial statement disclosures which would first be effective for interim reporting periods beginning after March 15, 2015.
Balance Sheet Offsetting – The fund’s accounting policy with respect to balance sheet offsetting is that, absent an event of default by the counterparty or a termination of the agreement, the International Swaps and Derivatives Association (ISDA) Master Agreement does not result in an offset of reported amounts of financial assets and financial liabilities in the Statement of Assets and Liabilities across transactions between the fund and the applicable counterparty. The fund’s right to setoff may be restricted or prohibited by the bankruptcy or insolvency laws of the particular jurisdiction to which a specific master netting agreement counterparty is subject. Balance sheet offsetting disclosures, to the extent applicable to the fund, have been included in the fund’s Significant Accounting Policies note under the captions for each of the fund’s in-scope financial instruments and transactions.
Investment Valuations – Pursuant to procedures approved by the Board of Trustees, investments held by the fund are generally valued at amortized cost, which approximates market value. Amortized cost involves valuing an instrument at its cost as
18
Notes to Financial Statements – continued
adjusted for amortization of premium or accretion of discount rather than its current market value. The amortized cost value of an instrument can be different from the market value of an instrument.
Various inputs are used in determining the value of the fund’s assets or liabilities. These inputs are categorized into three broad levels. In certain cases, the inputs used to measure fair value may fall into different levels of the fair value hierarchy. In such cases, an investment’s level within the fair value hierarchy is based on the lowest level of input that is significant to the fair value measurement. The fund’s assessment of the significance of a particular input to the fair value measurement in its entirety requires judgment, and considers factors specific to the investment. Level 1 includes unadjusted quoted prices in active markets for identical assets or liabilities. Level 2 includes other significant observable market-based inputs (including quoted prices for similar securities, interest rates, prepayment speed, and credit risk). Level 3 includes unobservable inputs, which may include the adviser’s own assumptions in determining the fair value of investments. The following is a summary of the levels used as of August 31, 2015 in valuing the fund’s assets or liabilities:
| | | | | | | | | | | | | | | | |
| Investments at Value | | Level 1 | | | Level 2 | | | Level 3 | | | Total | |
| Short Term Securities | | | $— | | | | $315,743,368 | | | | $— | | | | $315,743,368 | |
For further information regarding security characteristics, see the Portfolio of Investments.
Repurchase Agreements – The fund enters into repurchase agreements under the terms of Master Repurchase Agreements with approved counterparties. Each repurchase agreement is recorded at cost. The fund requires that the securities collateral in a repurchase transaction be transferred to a custodian. The fund monitors, on a daily basis, the value of the collateral to ensure that its value, including accrued interest, is greater than amounts owed to the fund under each such repurchase agreement. Upon an event of default under a Master Repurchase Agreement, the non-defaulting party may close out all transactions traded under such agreement and net amounts owed under each transaction to one net amount payable by one party to the other. Absent an event of default, the Master Repurchase Agreement does not result in an offset of reported amounts of assets and liabilities in the Statement of Assets and Liabilities across transactions between the fund and the applicable counterparty. The fund and other funds managed by MFS may utilize a joint trading account for the purpose of entering into one or more repurchase agreements.
Indemnifications – Under the fund’s organizational documents, its officers and Trustees may be indemnified against certain liabilities and expenses arising out of the performance of their duties to the fund. Additionally, in the normal course of business, the fund enters into agreements with service providers that may contain indemnification clauses. The fund’s maximum exposure under these agreements is unknown as this would involve future claims that may be made against the fund that have not yet occurred.
Investment Transactions and Income – Investment transactions are recorded on the trade date. Interest income is recorded on the accrual basis. All premium and discount is amortized or accreted for financial statement purposes in accordance with U.S. generally accepted accounting principles.
19
Notes to Financial Statements – continued
Fees Paid Indirectly – The fund’s custody fee may be reduced by a credit earned under an arrangement that measures the value of U.S. dollars deposited with the custodian by the fund. The amount of the credit, for the year ended August 31, 2015, is shown as a reduction of total expenses in the Statement of Operations.
Tax Matters and Distributions – The fund intends to qualify as a regulated investment company, as defined under Subchapter M of the Internal Revenue Code, and to distribute all of its taxable income, including realized capital gains. As a result, no provision for federal income tax is required. The fund’s federal tax returns, when filed, will remain subject to examination by the Internal Revenue Service for a three year period. Management has analyzed the fund’s tax positions taken on federal and state tax returns for all open tax years and does not believe that there are any uncertain tax positions that require recognition of a tax liability.
Distributions to shareholders are recorded on the ex-dividend date. Income and capital gain distributions are determined in accordance with income tax regulations, which may differ from U.S. generally accepted accounting principles. Certain capital accounts in the financial statements are periodically adjusted for permanent differences in order to reflect their tax character. These adjustments have no impact on net assets or net asset value per share. Temporary differences which arise from recognizing certain items of income, expense, gain or loss in different periods for financial statement and tax purposes will reverse at some time in the future. Distributions in excess of net investment income or net realized gains are temporary overdistributions for financial statement purposes resulting from differences in the recognition or classification of income or distributions for financial statement and tax purposes.
During the year ended August 31, 2015, there were no significant adjustments due to differences between book and tax accounting.
The fund declared no distributions for the years ended August 31, 2015 and August 31, 2014.
The federal tax cost and the tax basis components of distributable earnings were as follows:
| | | | |
| As of 8/31/15 | | | |
| Cost of investments | | | $315,743,368 | |
| Capital loss carryforwards | | | (207,379 | ) |
| Other temporary differences | | | (9,614 | ) |
Under the Regulated Investment Company Modernization Act of 2010 (the “Act”), net capital losses recognized for fund fiscal years beginning after August 31, 2011 may be carried forward indefinitely, and their character is retained as short-term and/or long-term losses (“post-enactment losses”). Previously, net capital losses were carried forward for eight years and treated as short-term losses (“pre-enactment losses”). As a transition rule, the Act requires that all post-enactment net capital losses be used before pre-enactment net capital losses.
20
Notes to Financial Statements – continued
As of August 31, 2015, the fund had capital loss carryforwards available to offset future realized gains. Such pre-enactment losses expire as follows:
| | | | |
| 8/31/16 | | | $(22,989 | ) |
| 8/31/17 | | | (184,390 | ) |
| Total | | | $(207,379 | ) |
Multiple Classes of Shares of Beneficial Interest – The fund offers multiple classes of shares, which differ in their respective distribution, service, and program manager fees. The fund’s income and common expenses are allocated to shareholders based on the value of settled shares outstanding of each class. The fund’s realized and unrealized gain (loss) are allocated to shareholders based on the daily net assets of each class. Dividends are declared separately for each class. Differences in per share dividend rates are generally due to differences in separate class expenses. Class B and Class 529B shares will convert to Class A and Class 529A shares, respectively, approximately eight years after purchase.
(3) Transactions with Affiliates
Investment Adviser – The fund has an investment advisory agreement with MFS to provide overall investment management and related administrative services and facilities to the fund. The management fee is computed daily and paid monthly at an annual rate of 0.40% of the fund’s average daily net assets.
During the year ended August 31, 2015, MFS voluntarily waived receipt of $1,255,272 of the fund’s management fee in order to avoid a negative yield. This amount, for the year ended August 31, 2015, is included in the reduction of total expenses in the Statement of Operations. MFS has also agreed in writing to reduce its management fee by a specified amount if certain MFS mutual fund assets exceed thresholds agreed to by MFS and the fund’s Board of Trustees. For the year ended August 31, 2015, this management fee reduction amounted to $20,541, which is included in the reduction of total expenses in the Statement of Operations. For the year ended August 31, 2015, these waivers had the effect of reducing the management fee by 0.40% of average daily net assets on an annualized basis. The management fee incurred for the year ended August 31, 2015 was equivalent to an annual effective rate of 0.00% of the fund’s average daily net assets.
In order to avoid a negative yield for the year ended August 31, 2015, MFS voluntarily agreed to reduce certain other expenses in the amount of $652,932, which is included in the reduction of total expenses in the Statement of Operations.
Distributor – The Board of Trustees has adopted a distribution plan for certain share classes pursuant to Rule 12b-1 of the Investment Company Act of 1940.
The fund’s distribution plan provides that the fund will pay MFS Fund Distributors, Inc. (MFD), a wholly-owned subsidiary of MFS, for services provided by MFD and financial intermediaries in connection with the distribution and servicing of certain share classes. One component of the plan is a distribution fee paid to MFD and another component of the plan is a service fee paid to MFD. MFD may subsequently pay all, or a portion, of the distribution and/or service fees to financial intermediaries.
21
Notes to Financial Statements – continued
Distribution Plan Fee Table:
| | | | | | | | | | | | | | | | | | | | |
| | | Distribution
Fee Rate (d) | | | Service
Fee Rate (d) | | | Total
Distribution
Plan (d) | | | Annual
Effective
Rate (e) | | | Distribution
and Service
Fee | |
| Class A | | | — | | | | 0.25% | | | | 0.25% | | | | 0.00% | | | | $294,895 | |
| Class B | | | 0.75% | | | | 0.25% | | | | 1.00% | | | | 0.00% | | | | 200,281 | |
| Class C | | | 0.75% | | | | 0.25% | | | | 1.00% | | | | 0.00% | | | | 406,024 | |
| Class R1 | | | 0.75% | | | | 0.25% | | | | 1.00% | | | | 0.00% | | | | 159,250 | |
| Class R2 | | | 0.25% | | | | 0.25% | | | | 0.50% | | | | 0.00% | | | | 280,414 | |
| Class R3 | | | — | | | | 0.25% | | | | 0.25% | | | | 0.00% | | | | 120,160 | |
| Class 529A | | | — | | | | 0.25% | | | | 0.25% | | | | 0.00% | | | | 27,345 | |
| Class 529B | | | 0.75% | | | | 0.25% | | | | 1.00% | | | | 0.00% | | | | 5,141 | |
| Class 529C | | | 0.75% | | | | 0.25% | | | | 1.00% | | | | 0.00% | | | | 59,219 | |
| Total Distribution and Service Fees | | | | $1,552,729 | |
| (d) | In accordance with the distribution plan for certain classes, the fund pays distribution and/or service fees equal to these annual percentage rates of each class’s average daily net assets. The distribution and service fee rates disclosed by class represent the current rates in effect at the end of the reporting period. Any rate changes, if applicable, are detailed below. |
| (e) | The annual effective rates represent actual fees incurred under the distribution plan for the year ended August 31, 2015 based on each class’s average daily net assets. MFD has agreed in writing to waive the Class A and Class 529A service fee. This written agreement will continue until modified by the fund’s Board of Trustees, but such agreement will continue until at least December 31, 2016. These reductions, for the year ended August 31, 2015, for Class A and Class 529A amounted to $294,895 and $27,345, respectively, and are included in the reduction of total expenses in the Statement of Operations. During the year ended August 31, 2015, MFD also voluntarily waived a receipt of $1,230,489 of the fund’s distribution and service fees to ensure the fund avoids a negative yield for Class B, Class C, Class R1, Class R2, Class R3, Class 529B, and Class 529C shares. This amount is included in the reduction of total expenses in the Statement of Operations. |
Certain Class A shares acquired through an exchange may be subject to a contingent deferred sales charge (CDSC) upon redemption depending on when the shares exchanged were originally purchased. Class C and Class 529C shares are subject to a CDSC in the event of a shareholder redemption within 12 months of purchase. Class B and Class 529B shares are subject to a CDSC in the event of a shareholder redemption within six years of purchase. All contingent deferred sales charges are paid to MFD and during the year ended August 31, 2015, were as follows:
| | | | |
| | | Amount | |
| Class A | | | $133 | |
| Class B | | | 70,706 | |
| Class C | | | 9,045 | |
| Class 529B | | | 134 | |
| Class 529C | | | 160 | |
The fund has entered into and may from time to time enter into contracts with program managers and other parties which administer the tuition programs through which an investment in the fund’s 529 share classes is made. The fund has entered into an agreement with MFD pursuant to which MFD receives an annual fee of up to
22
Notes to Financial Statements – continued
0.10% of the average daily net assets attributable to each 529 share class. MFD has agreed to waive a portion of this fee in an amount equal to 0.05% of the average daily net assets for each 529 share class. This waiver agreement will expire on December 31, 2016, unless MFD elects to extend the waiver. For the year ended August 31, 2015, this waiver amounted to $8,687 and is included in the reduction of total expenses in the Statement of Operations. In addition, MFS voluntarily waived receipt of $8,687 of the fund’s program manager fees in order to avoid a negative yield for Class 529A, Class 529B, and Class 529C shares. This amount, for the year ended August 31, 2015, is included in the reduction of total expenses in the Statement of Operations. This voluntary waiver had the effect of reducing the program manager fee by 0.05% of average daily net assets attributable to Class 529A, Class 529B, and Class 529C shares on an annualized basis. The program manager fee incurred for the year ended August 31, 2015 was equivalent to an annual effective rate of 0.00% of the average daily net assets attributable to each 529 share class. The services provided by MFD, or a third party with which MFD contracts, include recordkeeping and tax reporting and account services, as well as services designed to maintain the program’s compliance with the Internal Revenue Code and other regulatory requirements. Program manager fees and waivers for the year ended August 31, 2015, were as follows:
| | | | | | | | |
| | | Fee | | | Waiver | |
| Class 529A | | | $10,938 | | | | $10,938 | |
| Class 529B | | | 514 | | | | 514 | |
| Class 529C | | | 5,922 | | | | 5,922 | |
| Total Program Manager Fees and Waivers | | | $17,374 | | | | $17,374 | |
Shareholder Servicing Agent – MFS Service Center, Inc. (MFSC), a wholly-owned subsidiary of MFS, receives a fee from the fund for its services as shareholder servicing agent calculated as a percentage of the average daily net assets of the fund as determined periodically under the supervision of the fund’s Board of Trustees. For the year ended August 31, 2015, the fee was $196,010, which equated to 0.0615% annually of the fund’s average daily net assets. MFSC also receives payment from the fund for out-of-pocket expenses, sub-accounting and other shareholder servicing costs which may be paid to affiliated and unaffiliated service providers. For the year ended August 31, 2015, these out-of-pocket expenses, sub-accounting and other shareholder servicing costs amounted to $367,299.
Administrator – MFS provides certain financial, legal, shareholder communications, compliance, and other administrative services to the fund. Under an administrative services agreement, the fund reimburses MFS the costs incurred to provide these services. The fund is charged an annual fixed amount of $17,500 plus a fee based on average daily net assets. The administrative services fee incurred for the year ended August 31, 2015 was equivalent to an annual effective rate of 0.0189% of the fund’s average daily net assets.
Trustees’ and Officers’ Compensation – The fund pays compensation to independent Trustees in the form of a retainer, attendance fees, and additional compensation to Board and Committee chairpersons. The fund does not pay compensation directly to Trustees or officers of the fund who are also officers of the
23
Notes to Financial Statements – continued
investment adviser, all of whom receive remuneration for their services to the fund from MFS. Certain officers and Trustees of the fund are officers or directors of MFS, MFD, and MFSC.
Prior to December 31, 2001, the fund had an unfunded defined benefit plan (“DB plan”) for independent Trustees. As of December 31, 2001, the Board took action to terminate the DB plan with respect to then-current and any future independent Trustees, such that the DB plan covers only certain of those former independent Trustees who retired on or before December 31, 2001. The DB plan resulted in a pension expense of $1,061 and is included in “Independent Trustees’ compensation” in the Statement of Operations for the year ended August 31, 2015. The liability for deferred retirement benefits payable to certain independent Trustees under the DB plan amounted to $9,614 at August 31, 2015, and is included in “Payable for independent Trustees’ compensation” in the Statement of Assets and Liabilities.
Other – Effective November 1, 2014, this fund and certain other funds managed by MFS (the funds) have entered into a service agreement (the ISO Agreement) which provides for payment of fees solely by the funds to Tarantino LLC in return for the provision of services of an Independent Senior Officer (ISO) for the funds. Frank L. Tarantino serves as the ISO and is an officer of the funds and the sole member of Tarantino LLC. The funds can terminate the ISO Agreement with Tarantino LLC at any time under the terms of the ISO Agreement. Prior to November 1, 2014, the funds had entered into a service agreement (the Compliance Officer Agreement) which provided for payment of fees by the funds to Tarantino LLC in return for the provision of services of an Independent Chief Compliance Officer (ICCO) for the funds. Prior to November 1, 2014, Frank L. Tarantino served as the ICCO. Effective October 31, 2014, Mr. Tarantino resigned as ICCO and the Compliance Officer Agreement between the funds and Tarantino LLC was terminated. For the year ended August 31, 2015, the aggregate fees paid by the fund under these agreements were $1,236 and are included in “Miscellaneous” expense in the Statement of Operations. MFS had agreed to reimburse the fund for a portion of the payments made by the fund for the services under the Compliance Officer Agreement in the amount of $114, which is included in the reduction of total expenses in the Statement of Operations. Additionally, MFS has agreed to bear all expenses associated with office space, other administrative support, and supplies provided to the ICCO and ISO.
On October 9, 2013, MFS purchased 2,600,000 shares of Class R4 for an aggregate amount of $2,600,000. At August 31, 2015, MFS held approximately 86% of the outstanding shares of Class R4.
24
Notes to Financial Statements – continued
(4) Shares of Beneficial Interest
The fund’s Declaration of Trust permits the Trustees to issue an unlimited number of full and fractional shares of beneficial interest. Transactions in fund shares were as follows:
| | | | | | | | | | | | | | | | |
| | | Year ended
8/31/15 | | | Year ended
8/31/14 | |
| | | Shares | | | Amount | | | Shares | | | Amount | |
| Shares sold | | | | | | | | | | | | | | | | |
Class A | | | 55,042,333 | | | | $55,042,338 | | | | 68,204,993 | | | | $68,204,998 | |
Class B | | | 10,732,142 | | | | 10,732,143 | | | | 10,789,946 | | | | 10,789,945 | |
Class C | | | 29,557,580 | | | | 29,557,580 | | | | 34,883,605 | | | | 34,883,605 | |
Class R1 | | | 5,049,453 | | | | 5,049,453 | | | | 5,104,049 | | | | 5,104,049 | |
Class R2 | | | 16,809,554 | | | | 16,809,552 | | | | 14,432,020 | | | | 14,432,021 | |
Class R3 | | | 14,573,386 | | | | 14,573,387 | | | | 25,816,000 | | | | 25,816,000 | |
Class R4 | | | 387,453 | | | | 387,453 | | | | 2,901,681 | | | | 2,901,681 | |
Class 529A | | | 4,984,710 | | | | 4,984,710 | | | | 4,546,774 | | | | 4,546,774 | |
Class 529B | | | 225,018 | | | | 225,018 | | | | 329,642 | | | | 329,642 | |
Class 529C | | | 2,747,481 | | | | 2,747,481 | | | | 3,360,364 | | | | 3,360,364 | |
| | | 140,109,110 | | | | $140,109,115 | | | | 170,369,074 | | | | $170,369,079 | |
| | | | |
| Shares reacquired | | | | | | | | | | | | | | | | |
Class A | | | (57,491,363 | ) | | | $(57,491,364 | ) | | | (88,717,004 | ) | | | $(88,717,004 | ) |
Class B | | | (14,914,029 | ) | | | (14,914,033 | ) | | | (18,641,374 | ) | | | (18,641,379 | ) |
Class C | | | (32,696,325 | ) | | | (32,696,325 | ) | | | (47,585,499 | ) | | | (47,585,499 | ) |
Class R1 | | | (7,504,462 | ) | | | (7,504,462 | ) | | | (9,365,466 | ) | | | (9,365,466 | ) |
Class R2 | | | (21,383,600 | ) | | | (21,383,600 | ) | | | (31,204,212 | ) | | | (31,204,212 | ) |
Class R3 | | | (23,614,789 | ) | | | (23,614,789 | ) | | | (36,824,742 | ) | | | (36,824,742 | ) |
Class R4 | | | (260,421 | ) | | | (260,421 | ) | | | (814,201 | ) | | | (814,201 | ) |
Class 529A | | | (4,522,264 | ) | | | (4,522,264 | ) | | | (4,517,477 | ) | | | (4,517,477 | ) |
Class 529B | | | (316,097 | ) | | | (316,098 | ) | | | (474,489 | ) | | | (474,490 | ) |
Class 529C | | | (3,118,439 | ) | | | (3,118,439 | ) | | | (3,192,514 | ) | | | (3,192,514 | ) |
| | | (165,821,789 | ) | | | $(165,821,795 | ) | | | (241,336,978 | ) | | | $(241,336,984 | ) |
| | | | |
| Net change | | | | | | | | | | | | | | | | |
Class A | | | (2,449,030 | ) | | | $(2,449,026 | ) | | | (20,512,011 | ) | | | $(20,512,006 | ) |
Class B | | | (4,181,887 | ) | | | (4,181,890 | ) | | | (7,851,428 | ) | | | (7,851,434 | ) |
Class C | | | (3,138,745 | ) | | | (3,138,745 | ) | | | (12,701,894 | ) | | | (12,701,894 | ) |
Class R1 | | | (2,455,009 | ) | | | (2,455,009 | ) | | | (4,261,417 | ) | | | (4,261,417 | ) |
Class R2 | | | (4,574,046 | ) | | | (4,574,048 | ) | | | (16,772,192 | ) | | | (16,772,191 | ) |
Class R3 | | | (9,041,403 | ) | | | (9,041,402 | ) | | | (11,008,742 | ) | | | (11,008,742 | ) |
Class R4 | | | 127,032 | | | | 127,032 | | | | 2,087,480 | | | | 2,087,480 | |
Class 529A | | | 462,446 | | | | 462,446 | | | | 29,297 | | | | 29,297 | |
Class 529B | | | (91,079 | ) | | | (91,080 | ) | | | (144,847 | ) | | | (144,848 | ) |
Class 529C | | | (370,958 | ) | | | (370,958 | ) | | | 167,850 | | | | 167,850 | |
| | | (25,712,679 | ) | | | $(25,712,680 | ) | | | (70,967,904 | ) | | | $(70,967,905 | ) |
25
Notes to Financial Statements – continued
(5) Line of Credit
The fund and certain other funds managed by MFS participate in a $1.25 billion unsecured committed line of credit, subject to a $1 billion sublimit, provided by a syndication of banks under a credit agreement. Borrowings may be made for temporary financing needs. Interest is charged to each fund, based on its borrowings, generally at a rate equal to the higher of the Overnight Federal Reserve funds rate or daily one month LIBOR plus an agreed upon spread. A commitment fee, based on the average daily, unused portion of the committed line of credit, is allocated among the participating funds at the end of each calendar quarter. In addition, the fund and other funds managed by MFS have established unsecured uncommitted borrowing arrangements with certain banks for temporary financing needs. Interest is charged to each fund, based on its borrowings, at a rate equal to the Overnight Federal Reserve funds rate plus an agreed upon spread. For the year ended August 31, 2015, the fund’s commitment fee and interest expense were $1,115 and $0, respectively, and are included in “Miscellaneous” expense in the Statement of Operations.
26
REPORT OF INDEPENDENT REGISTERED PUBLIC ACCOUNTING FIRM
To the Board of Trustees of MFS Series Trust I and the Shareholders of MFS U.S. Government Cash Reserve Fund:
We have audited the accompanying statement of assets and liabilities, including the portfolio of investments, of MFS U.S. Government Cash Reserve Fund (one of the series of MFS Series Trust I) (the “Fund”) as of August 31, 2015, and the related statement of operations for the year then ended, the statements of changes in net assets for each of the two years in the period then ended, and the financial highlights for each of the five years in the period then ended. These financial statements and financial highlights are the responsibility of the Fund’s management. Our responsibility is to express an opinion on these financial statements and financial highlights based on our audits.
We conducted our audits in accordance with the standards of the Public Company Accounting Oversight Board (United States). Those standards require that we plan and perform the audit to obtain reasonable assurance about whether the financial statements and financial highlights are free of material misstatement. The Fund is not required to have, nor were we engaged to perform, an audit of its internal control over financial reporting. Our audits included consideration of internal control over financial reporting as a basis for designing audit procedures that are appropriate in the circumstances, but not for the purpose of expressing an opinion on the effectiveness of the Fund’s internal control over financial reporting. Accordingly, we express no such opinion. An audit also includes examining, on a test basis, evidence supporting the amounts and disclosures in the financial statements, assessing the accounting principles used and significant estimates made by management, as well as evaluating the overall financial statement presentation. Our procedures included confirmation of securities owned as of August 31, 2015, by correspondence with the custodian. We believe that our audits provide a reasonable basis for our opinion.
In our opinion, such financial statements and financial highlights referred to above present fairly, in all material respects, the financial position of MFS U.S. Government Cash Reserve Fund as of August 31, 2015, the results of its operations for the year then ended, the changes in its net assets for each of the two years in the period then ended, and the financial highlights for each of the five years in the period then ended, in conformity with accounting principles generally accepted in the United States of America.
DELOITTE & TOUCHE LLP
Boston, Massachusetts
October 15, 2015
27
TRUSTEES AND OFFICERS — IDENTIFICATION AND BACKGROUND
The Trustees and Officers of the Trust, as of October 1, 2015, are listed below, together with their principal occupations during the past five years. (Their titles may have varied during that period.) The address of each Trustee and Officer is 111 Huntington Avenue, Boston, Massachusetts 02199-7618.
| | | | | | | | |
Name, Age | | Position(s) Held with Fund | | Trustee/Officer
Since (h) | | Principal
Occupations During the Past Five Years | | Other Directorships (j) |
| INTERESTED TRUSTEES |
Robert J. Manning (k) (age 51) | | Trustee | | February 2004 | | Massachusetts Financial Services Company, Chairman, Co-Chief Executive Officer and Director; Chief Investment Officer (until 2010) | | N/A |
Robin A. Stelmach (k) (age 54) | | Trustee and President | | January 2014 | | Massachusetts Financial Services Company, Executive Vice President and Chief Operating Officer | | N/A |
| INDEPENDENT TRUSTEES | | | | | | |
David H. Gunning (age 73) | | Trustee and Chair of Trustees | | January 2004 | | Private investor | | Lincoln Electric Holdings, Inc., Director; Development Alternatives, Inc., Director/Non-Executive Chairman |
Steven E. Buller (age 64) | | Trustee | | February 2014 | | Chairman, Financial Accounting Standards Advisory Council; Standing Advisory Group, Public Company Accounting Oversight Board, Member (until 2014); BlackRock, Inc. (investment management), Managing Director (until 2014), BlackRock Finco UK (investment management), Director (until 2014) | | N/A |
Robert E. Butler (age 73) | | Trustee | | January 2006 | | Consultant – investment company industry regulatory and compliance matters | | N/A |
28
Trustees and Officers – continued
| | | | | | | | |
Name, Age | | Position(s) Held with Fund | | Trustee/Officer
Since (h) | | Principal
Occupations During the Past Five Years | | Other Directorships (j) |
Maureen R. Goldfarb (age 60) | | Trustee | | January 2009 | | Private investor | | N/A |
William R. Gutow (age 74) | | Trustee | | December 1993 | | Private investor and real estate consultant; Capitol Entertainment Management Company (video franchise), Vice Chairman | | Texas Donuts, Vice Chairman (until 2010) |
Michael Hegarty (age 70) | | Trustee | | December 2004 | | Private investor | | Rouse Properties Inc., Director; Capmark Financial Group Inc., Director |
John P. Kavanaugh (age 60) | | Trustee | | January 2009 | | Private investor | | N/A |
Maryanne L. Roepke (age 59) | | Trustee | | May 2014 | | American Century Investments (investment management), Senior Vice President and Chief Compliance Officer (until 2014) | | N/A |
Laurie J. Thomsen (age 58) | | Trustee | | March 2005 | | Private investor; New Profit, Inc. (venture philanthropy), Executive Partner (until 2010) | | The Travelers Companies, Director; Dycom Industries, Inc. |
Robert W. Uek (age 74) | | Trustee | | January 2006 | | Consultant to investment company industry | | N/A |
| OFFICERS | | | | | | |
Christopher R. Bohane (k) (age 41) | | Assistant Secretary and Assistant Clerk | | July 2005 | | Massachusetts Financial Services Company, Vice President and Assistant General Counsel | | N/A |
Kino Clark (k) (age 47) | | Assistant Treasurer | | January 2012 | | Massachusetts Financial Services Company, Vice President | | N/A |
Kristin V. Collins (k) (age 42) | | Assistant Secretary and Assistant Clerk | | September 2015 | | Massachusetts Financial Services Company, Vice President and Assistant General Counsel | | N/A |
29
Trustees and Officers – continued
| | | | | | | | |
Name, Age | | Position(s) Held with Fund | | Trustee/Officer
Since (h) | | Principal
Occupations During the Past Five Years | | Other Directorships (j) |
Thomas H. Connors (k) (age 56) | | Assistant Secretary and Assistant Clerk | | September 2012 | | Massachusetts Financial Services Company, Vice President and Senior Counsel; Deutsche Investment Management Americas Inc. (financial service provider), Director and Senior Counsel (until 2012) | | N/A |
Ethan D. Corey (k) (age 51) | | Assistant Secretary and Assistant Clerk | | July 2005 | | Massachusetts Financial Services Company, Senior Vice President and Associate General Counsel | | N/A |
David L. DiLorenzo (k) (age 47) | | Treasurer | | July 2005 | | Massachusetts Financial Services Company, Senior Vice President | | N/A |
Susan S. Newton (k) (age 65) | | Assistant Secretary and Assistant Clerk | | May 2005 | | Massachusetts Financial Services Company, Senior Vice President and Associate General Counsel | | N/A |
Kenneth Paek (k) (age 41) | | Assistant Treasurer | | February 2015 | | Massachusetts Financial Services Company, Vice President; Cohen & Steers, Vice President/Head of Fund Administration (until 2014) | | N/A |
Susan A. Pereira (k) (age 44) | | Assistant Secretary and Assistant Clerk | | July 2005 | | Massachusetts Financial Services Company, Vice President and Senior Counsel | | N/A |
Kasey L. Phillips (k) (age 44) | | Assistant Treasurer | | September 2012 | | Massachusetts Financial Services Company, Vice President; Wells Fargo Funds Management, LLC, Senior Vice President, Fund Treasurer (until 2012) | | N/A |
30
Trustees and Officers – continued
| | | | | | | | |
Name, Age | | Position(s) Held with Fund | | Trustee/Officer
Since (h) | | Principal
Occupations During the Past Five Years | | Other Directorships (j) |
Mark N. Polebaum (k) (age 63) | | Secretary and Clerk | | January 2006 | | Massachusetts Financial Services Company, Executive Vice President, General Counsel and Secretary | | N/A |
Matthew A. Stowe (k) (age 40) | | Assistant Secretary and Assistant Clerk | | October 2014 | | Massachusetts Financial Services Company, Vice President and Assistant General Counsel | | N/A |
Frank L. Tarantino (age 71) | | Independent Senior Officer | | June 2004 | | Tarantino LLC (provider of compliance services), Principal | | N/A |
Richard S. Weitzel (k) (age 45) | | Assistant Secretary and Assistant Clerk | | October 2007 | | Massachusetts Financial Services Company, Senior Vice President and Associate General Counsel | | N/A |
Martin J. Wolin (k) (age 48) | | Chief Compliance Officer | | July 2015 | | Massachusetts Financial Services Company, Senior Vice President and Chief Compliance Officer (since July 2015); Mercer (financial service provider), Chief Risk and Compliance Officer, North America and Latin America (until June 2015) | | N/A |
James O. Yost (k) (age 55) | | Deputy Treasurer | | September 1990 | | Massachusetts Financial Services Company, Senior Vice President | | N/A |
| (h) | Date first appointed to serve as Trustee/officer of an MFS Fund. Each Trustee has served continuously since appointment unless indicated otherwise. For the period from December 15, 2004 until February 22, 2005, Mr. Manning served as Advisory Trustee. Prior to January 2012, Messrs. DiLorenzo and Yost served as Assistant Treasurers of the Funds. Ms. Stelmach was appointed as President of the Funds as of October 1, 2014. |
| (j) | Directorships or trusteeships of companies required to report to the Securities and Exchange Commission (i.e., “public companies”). |
| (k) | “Interested person” of the Trust within the meaning of the Investment Company Act of 1940 (referred to as the 1940 Act), which is the principal federal law governing investment companies like the fund, as a result of a position with MFS. The address of MFS is 111 Huntington Avenue, Boston, Massachusetts 02199-7618. |
31
Trustees and Officers – continued
Each Trustee (except Ms. Stelmach, Mr. Buller and Ms. Roepke) has been elected by shareholders and each Trustee and officer holds office until his or her successor is chosen and qualified or until his or her earlier death, resignation, retirement or removal. The Trust does not hold annual meetings for the purpose of electing Trustees, and Trustees are not elected for fixed terms. Messrs. Butler, Kavanaugh, Uek and Mses. Thomsen and Roepke are members of the Trust’s Audit Committee.
Each of the Fund’s Trustees and officers holds comparable positions with certain other funds of which MFS or a subsidiary is the investment adviser or distributor, and, in the case of the officers, with certain affiliates of MFS. As of October 1, 2015, the Trustees served as board members of 138 funds within the MFS Family of Funds.
The Statement of Additional Information for a Fund includes further information about the Trustees and is available without charge upon request by calling 1-800-225-2606.
| | |
| Investment Adviser | | Custodian |
Massachusetts Financial Services Company
111 Huntington Avenue
Boston, MA 02199-7618 | | State Street Bank and Trust Company 1 Lincoln Street Boston, MA 02111-2900 |
| Distributor | | Independent Registered Public Accounting Firm |
MFS Fund Distributors, Inc.
111 Huntington Avenue
Boston, MA 02199-7618 | | Deloitte & Touche LLP 200 Berkeley Street Boston, MA 02116 |
| Portfolio Manager | | |
| Edward O’Dette | | |
32
BOARD REVIEW OF INVESTMENT ADVISORY AGREEMENT
The Investment Company Act of 1940 requires that both the full Board of Trustees and a majority of the non-interested (“independent”) Trustees, voting separately, annually approve the continuation of the Fund’s investment advisory agreement with MFS. The Trustees consider matters bearing on the Fund and its advisory arrangements at their meetings throughout the year, including a review of performance data at each regular meeting. In addition, the independent Trustees met several times over the course of three months beginning in May and ending in July, 2015 (“contract review meetings”) for the specific purpose of considering whether to approve the continuation of the investment advisory agreement for the Fund and the other investment companies that the Board oversees (the “MFS Funds”). The independent Trustees were assisted in their evaluation of the Fund’s investment advisory agreement by independent legal counsel, from whom they received separate legal advice and with whom they met separately from MFS during various contract review meetings. The independent Trustees were also assisted in this process by the MFS Funds’ Independent Senior Officer, a senior officer appointed by and reporting to the independent Trustees.
In connection with their deliberations regarding the continuation of the investment advisory agreement, the Trustees, including the independent Trustees, considered such information and factors as they believed, in light of the legal advice furnished to them and their own business judgment, to be relevant. The investment advisory agreement for the Fund was considered separately, although the Trustees also took into account the common interests of all MFS Funds in their review. As described below, the Trustees considered the nature, quality, and extent of the various investment advisory, administrative, and shareholder services performed by MFS under the existing investment advisory agreement and other arrangements with the Fund.
In connection with their contract review meetings, the Trustees received and relied upon materials that included, among other items: (i) information provided by Lipper Inc., an independent third party, on the investment performance of the Fund for various time periods ended December 31, 2014 and the investment performance of a group of funds with substantially similar investment classifications/objectives (the “Lipper performance universe”), (ii) information provided by Lipper Inc. on the Fund’s advisory fees and other expenses and the advisory fees and other expenses of comparable funds identified by Lipper Inc. (the “Lipper expense group”), (iii) information provided by MFS on the advisory fees of comparable portfolios of other clients of MFS, including institutional separate accounts and other clients, (iv) information as to whether and to what extent applicable expense waivers, reimbursements or fee “breakpoints” are observed for the Fund, (v) information regarding MFS’ financial results and financial condition, including MFS’ and certain of its affiliates’ estimated profitability from services performed for the Fund and the MFS Funds as a whole, and compared to MFS’ institutional business, (vi) MFS’ views regarding the outlook for the mutual fund industry and the strategic business plans of MFS, (vii) descriptions of various functions performed by MFS for the Funds, such as compliance monitoring and portfolio trading practices, and (viii) information regarding the overall organization of MFS, including information about MFS’ senior management and other personnel providing investment advisory, administrative and other services to
33
Board Review of Investment Advisory Agreement – continued
the Fund and the other MFS Funds. The comparative performance, fee and expense information prepared and provided by Lipper Inc. was not independently verified and the independent Trustees did not independently verify any information provided to them by MFS.
The Trustees’ conclusion as to the continuation of the investment advisory agreement was based on a comprehensive consideration of all information provided to the Trustees and not the result of any single factor. Some of the factors that figured particularly in the Trustees’ deliberations are described below, although individual Trustees may have evaluated the information presented differently from one another, giving different weights to various factors. It is also important to recognize that the fee arrangements for the Fund and other MFS Funds are the result of years of review and discussion between the independent Trustees and MFS, that certain aspects of such arrangements may receive greater scrutiny in some years than in others, and that the Trustees’ conclusions may be based, in part, on their consideration of these same arrangements during the course of the year and in prior years.
Based on information provided by Lipper Inc. and MFS, the Trustees reviewed the Fund’s total return investment performance as well as the performance of peer groups of funds over various time periods. The Trustees placed particular emphasis on the total return performance of the Fund’s Class A shares in comparison to the performance of funds in its Lipper performance universe over the three-year period ended December 31, 2014, which the Trustees believed was a long enough period to reflect differing market conditions. The total return performance of the Fund’s Class A shares was in the 4th quintile relative to the other funds in the universe for this three-year period (the 1st quintile being the best performers and the 5th quintile being the worst performers). The total return performance of the Fund’s Class A shares was in the 4th quintile for each of the one- and five-year periods ended December 31, 2014 relative to the Lipper performance universe. Because of the passage of time, these performance results may differ from the performance results for more recent periods, including those shown elsewhere in this report.
In the course of their deliberations, the Trustees took into account information provided by MFS in connection with the contract review meetings, as well as during investment review meetings conducted with portfolio management personnel during the course of the year regarding the Fund’s performance. In addition, the Trustees noted the market conditions affecting all money market funds, in particular the low interest rate environment, and MFS’ voluntary waiver of its fees to ensure that the Fund avoids a negative yield. After reviewing these and related factors, the Trustees concluded, within the context of their overall conclusions regarding the investment advisory agreement, that they were satisfied with MFS’ responses and efforts relating to investment performance.
In assessing the reasonableness of the Fund’s advisory fee, the Trustees considered, among other information, the Fund’s advisory fee and the total expense ratio of the Fund’s Class A shares as a percentage of average daily net assets and the advisory fee and total expense ratios of peer groups of funds based on information provided by Lipper Inc. The Trustees considered that MFS Fund Distributors, Inc. (“MFD”), an affiliate of MFS, currently observes a Class A 12b-1 fee waiver, which may not be changed without the Trustees’ approval. The Trustees also considered that, according
34
Board Review of Investment Advisory Agreement – continued
to the Lipper data (which takes into account any fee reductions or expense limitations that were in effect during the Fund’s last fiscal year), the Fund’s effective advisory fee rate was approximately at the Lipper expense group median, and the Fund’s total expense ratio was lower than the Lipper expense group median.
The Trustees also considered the advisory fees charged by MFS to any institutional separate accounts advised by MFS (“separate accounts”) and unaffiliated investment companies for which MFS serves as subadviser (“subadvised funds”) that have comparable investment strategies to the Fund. In comparing these fees, the Trustees considered information provided by MFS as to the generally broader scope of services provided by MFS to the Fund, as well as the more extensive regulatory burdens imposed on MFS in managing the Fund, in comparison to separate accounts and subadvised funds. The Trustees also considered the higher demands placed on MFS’ investment personnel and trading infrastructure as a result of the daily cash in-flows and out-flows of the Fund in comparison to separate accounts.
The Trustees also considered whether the Fund may benefit from any economies of scale in the management of the Fund in the event of growth in assets of the Fund and/or growth in assets of the MFS Funds as a whole. They noted that the Fund’s advisory fee rate schedule is not subject to any breakpoints. Taking into account the relatively small size of the Fund and that the Fund’s effective advisory fee rate was approximately at the Lipper expense group median described above, the Trustees determined not to recommend any advisory fee breakpoints for the Fund at this time. The Trustees also noted that MFS has agreed in writing to waive a portion of the management fees of certain MFS Funds, including the Fund, if the total combined assets of certain funds within the MFS Funds’ complex increase above agreed upon thresholds (the “group fee waiver”), enabling the Fund’s shareholders to share in the benefits from any economies of scale at the complex level. The group fee waiver is reviewed and renewed annually between the Board and MFS. The Trustees concluded that the group fee waiver was sufficient to allow the Fund to benefit from economies of scale as its assets and overall complex assets grow.
The Trustees also considered information prepared by MFS relating to MFS’ costs and profits with respect to the Fund, the MFS Funds considered as a group, and other investment companies and accounts advised by MFS, as well as MFS’ methodologies used to determine and allocate its costs to the MFS Funds, the Fund and other accounts and products for purposes of estimating profitability.
After reviewing these and other factors described herein, the Trustees concluded, within the context of their overall conclusions regarding the investment advisory agreement, that the advisory fees charged to the Fund represent reasonable compensation in light of the services being provided by MFS to the Fund.
In addition, the Trustees considered MFS’ resources and related efforts to continue to retain, attract and motivate capable personnel to serve the Fund. The Trustees also considered current and developing conditions in the financial services industry, including the presence of large and well-capitalized companies which are spending, and appear to be prepared to continue to spend, substantial sums to engage personnel and to provide services to competing investment companies. In this regard, the Trustees also considered the financial resources of MFS and its ultimate parent, Sun Life
35
Board Review of Investment Advisory Agreement – continued
Financial Inc. The Trustees also considered the advantages and possible disadvantages to the Fund of having an adviser that also serves other investment companies as well as other accounts.
The Trustees also considered the nature, quality, cost, and extent of administrative, transfer agency, and distribution services provided to the Fund by MFS and its affiliates under agreements and plans other than the investment advisory agreement, including any 12b-1 fees the Fund pays to MFD. The Trustees also considered the nature, extent and quality of certain other services MFS performs or arranges for on the Fund’s behalf, which may include securities lending programs, directed expense payment programs, class action recovery programs, and MFS’ interaction with third-party service providers, principally custodians and sub-custodians. The Trustees concluded that the various non-advisory services provided by MFS and its affiliates on behalf of the Fund were satisfactory.
The Trustees also considered benefits to MFS from the use of the Fund’s portfolio brokerage commissions, if applicable, to pay for investment research and various other factors. Additionally, the Trustees considered so-called “fall-out benefits” to MFS such as reputational value derived from serving as investment manager to the Fund.
Based on their evaluation of factors that they deemed to be material, including those factors described above, the Board of Trustees, including the independent Trustees, concluded that the Fund’s investment advisory agreement with MFS should be continued for an additional one-year period, commencing August 1, 2015.
36
PROXY VOTING POLICIES AND INFORMATION
MFS votes proxies on behalf of the fund pursuant to proxy voting policies and procedures that are available without charge, upon request, by calling 1-800-225-2606, by visiting the Proxy Voting section of mfs.com or by visiting the SEC’s Web site at http://www.sec.gov.
Information regarding how the fund voted proxies relating to portfolio securities during the most recent twelve-month period ended June 30 is available without charge by visiting the Proxy Voting section of mfs.com or by visiting the SEC’s Web site at http://www.sec.gov.
QUARTERLY PORTFOLIO DISCLOSURE
The fund will file a complete schedule of portfolio holdings with the Securities and Exchange Commission (the Commission) for the first and third quarters of each fiscal year on Form N-Q. A shareholder can obtain the quarterly portfolio holdings report at mfs.com. The fund’s Form N-Q is also available on the EDGAR database on the Commission’s Internet Web site at http://www.sec.gov, and may be reviewed and copied at the:
Public Reference Room
Securities and Exchange Commission
100 F Street, NE, Room 1580
Washington, D.C. 20549
Information on the operation of the Public Reference Room may be obtained by calling the Commission at 1-800-SEC-0330. Copies of the fund’s Form N-Q also may be obtained, upon payment of a duplicating fee, by electronic request at the following e-mail address: publicinfo@sec.gov or by writing the Public Reference Section at the above address.
FURTHER INFORMATION
From time to time, MFS may post important information about the fund or the MFS funds on the MFS web site (mfs.com). This information is available by visiting the “Market Commentary” and “Announcements” sub sections in the “Market Outlooks” section of mfs.com or by clicking on the fund’s name under “Mutual Funds” in the “Products” section of mfs.com.
FEDERAL TAX INFORMATION (unaudited)
The fund will notify shareholders of amounts for use in preparing 2015 income tax forms in January 2016.
37
rev. 3/11
| | | | |
| | | |
FACTS | | WHAT DOES MFS DO WITH YOUR PERSONAL INFORMATION? | |  |
| | |
| Why? | | Financial companies choose how they share your personal information. Federal law gives consumers the right to limit some but not all sharing. Federal law also requires us to tell you how we collect, share, and protect your personal information. Please read this notice carefully to understand what we do. |
| | |
| What? | | The types of personal information we collect and share depend on the product or service you have with us. This information can include: • Social Security number and account balances • Account transactions and transaction history • Checking account information and wire transfer instructions When you are no longer our customer, we continue to share your information as described in this notice. |
| | |
| How? | | All financial companies need to share customers’ personal information to run their everyday business. In the section below, we list the reasons financial companies can share their customers’ personal information; the reasons MFS chooses to share; and whether you can limit this sharing. |
| | | | |
Reasons we can share your
personal information | | Does MFS
share? | | Can you limit
this sharing? |
For our everyday business purposes – such as to process your transactions, maintain your account(s), respond to court orders and legal investigations, or report to credit bureaus | | Yes | | No |
For our marketing purposes – to offer our products and services to you | | No | | We don’t share |
| For joint marketing with other financial companies | | No | | We don’t share |
For our affiliates’ everyday business purposes – information about your transactions and experiences | | No | | We don’t share |
For our affiliates’ everyday business purposes – information about your creditworthiness | | No | | We don’t share |
| For nonaffiliates to market to you | | No | | We don’t share |
| | |
| Questions? | | Call 800-225-2606 or go to mfs.com. |
38
| | |
| Who we are |
| Who is providing this notice? | | MFS Funds, MFS Investment Management, MFS Institutional Advisors, Inc., MFS Fund Distributors, Inc., MFS Heritage Trust Company, and MFS Service Center, Inc. |
| | |
| What we do |
| How does MFS protect my personal information? | | To protect your personal information from unauthorized access and use, we use security measures that comply with federal law. These measures include procedural, electronic, and physical safeguards for the protection of the personal information we collect about you. |
| How does MFS collect my personal information? | | We collect your personal information, for example, when you • open an account or provide account information • direct us to buy securities or direct us to sell your securities • make a wire transfer We also collect your personal information from others, such as credit bureaus, affiliates and other companies. |
| Why can’t I limit all sharing? | | Federal law gives you the right to limit only • sharing for affiliates’ everyday business purposes – information about your creditworthiness • affiliates from using your information to market to you • sharing for nonaffiliates to market to you State laws and individual companies may give you additional rights to limit sharing. |
| | |
| Definitions |
| Affiliates | | Companies related by common ownership or control. They can be financial and nonfinancial companies. • MFS does not share personal information with affiliates, except for everyday business purposes as described on page one of this notice. |
| Nonaffiliates | | Companies not related by common ownership or control. They can be financial and nonfinancial companies. • MFS does not share with nonaffiliates so they can market to you. |
| Joint Marketing | | A formal agreement between nonaffiliated financial companies that together market financial products or services to you. • MFS doesn’t jointly market. |
| | |
| Other important information |
| If you own an MFS product or receive an MFS service in the name of a third party such as a bank or broker-dealer, their privacy policy may apply to you instead of ours. |
39
Save paper with eDelivery.

| MFS® will send you prospectuses, |
reports, and proxies directly via e-mail so you will get information faster with less mailbox clutter.
To sign up:
1. Go to mfs.com.
2. Log in via MFS® Access.
3. Select eDelivery.
If you own your MFS fund shares through a financial institution or a retirement plan, MFS® TALK, MFS® Access, or eDelivery may not be available to you.
CONTACT
WEB SITE
mfs.com
MFS TALK
1-800-637-8255
24 hours a day
ACCOUNT SERVICE AND LITERATURE
Shareholders
1-800-225-2606
Financial advisors
1-800-343-2829
Retirement plan services
1-800-637-1255
MAILING ADDRESS
MFS Service Center, Inc.
P.O. Box 55824
Boston, MA 02205-5824
OVERNIGHT MAIL
MFS Service Center, Inc.
c/o Boston Financial Data Services
30 Dan Road
Canton, MA 02021-2809
ANNUAL REPORT
August 31, 2015

MFS® VALUE FUND

EIF-ANN
MFS® VALUE FUND
CONTENTS
The report is prepared for the general information of shareholders.
It is authorized for distribution to prospective investors only when preceded or accompanied by a current prospectus.
NOT FDIC INSURED • MAY LOSE VALUE • NO BANK GUARANTEE

LETTER FROM THE CHAIRMAN
Dear Shareholders:
The U.S. economy bounced back after another harsh winter curtailed domestic consumption. Despite strengthening labor and housing markets, however, a stronger U.S. dollar and weak overseas demand have held back corporate earnings.
China’s economic growth continues to slow, raising concerns and adding to global market volatility. Commodity exporters, including Australia and Canada, have been hurt by weaker Chinese demand. Global oil markets remain oversupplied, putting pressure on crude oil and gasoline prices.
In Europe, concerns about a potential Greek debt default have faded, and the eurozone’s economy is expanding mildly. Hopes for a more robust regionwide recovery rest on the European Central Bank’s quantitative easing program.
The world’s financial markets have become increasingly complex in recent years. Now, more than ever, it is important to understand companies on a global basis. At MFS®, we believe our integrated research platform, collaborative culture, active risk management process and long-term focus give us a research advantage.
As investors, we aim to add long-term value. We believe this approach will serve you well as you work with your financial advisor to reach your investment objectives.
Respectfully,

Robert J. Manning
Chairman
MFS Investment Management
October 15, 2015
The opinions expressed in this letter are subject to change and may not be relied upon for investment advice. No forecasts can be guaranteed.
1
PORTFOLIO COMPOSITION
Portfolio structure

| | | | |
| Top ten holdings | | | | |
| JPMorgan Chase & Co. | | | 4.6% | |
| Wells Fargo & Co. | | | 3.3% | |
| Johnson & Johnson | | | 3.3% | |
| Philip Morris International, Inc. | | | 3.2% | |
| Accenture PLC, “A” | | | 2.6% | |
| Pfizer, Inc. | | | 2.6% | |
| Goldman Sachs Group, Inc. | | | 2.0% | |
| Honeywell International, Inc. | | | 1.9% | |
| Medtronic PLC | | | 1.9% | |
| Lockheed Martin Corp. | | | 1.9% | |
| | | | |
| Equity sectors | | | | |
| Financial Services | | | 26.8% | |
| Health Care | | | 14.0% | |
| Industrial Goods & Services | | | 11.5% | |
| Consumer Staples | | | 10.9% | |
| Leisure | | | 5.2% | |
| Energy | | | 5.2% | |
| Basic Materials | | | 4.8% | |
| Special Products & Services | | | 4.4% | |
| Retailing | | | 3.8% | |
| Technology | | | 3.7% | |
| Utilities & Communications | | | 3.1% | |
| Transportation | | | 2.3% | |
| Autos & Housing | | | 2.1% | |
Cash & Other can include cash, other assets less liabilities, offsets to derivative positions, and short-term securities. Please see the Statement of Assets and Liabilities for additional information related to the fund’s cash position and the Notes to Financial Statements for additional information related to certain risks associated with assets included in “Other”.
Percentages are based on net assets as of 8/31/15.
The portfolio is actively managed and current holdings may be different.
2
MANAGEMENT REVIEW
Summary of results
For the twelve months ended August 31, 2015, Class A shares of the MFS Value Fund (“fund”) provided a total return of 0.68%, at net asset value. This compares with a return of –3.48% for the fund’s benchmark, the Russell 1000 Value Index.
Market Environment
A generally risk-friendly environment prevailed in the first half of the period and any market setbacks, triggered by global growth concerns, were short-lived as central banks responded and kept monetary policy accommodative. For example, the US tempered rate hike expectations while Japan, Europe and China provided fresh stimulus measures which ultimately supported risk assets. Early in the second half of the period, the European Central Bank cut policy interest rates and announced non-conventional easing measures, pushing yields on a significant portion of eurozone sovereign bonds deeper into negative territory, a notable highlight amid a mini-wave of global easing due to declining inflation and inflation expectations. However, the environment supporting risk began to break down in the latter phases of the period, with both US investment grade and high yield corporate spreads widening out and any individual company performance below expectations resulted in market selling.
A dominant trend for most of the period was the ongoing rise in US equities. Until early in the second half of the period, this was paired with a decline in US and global bond yields. The uptrend in US corporate margins and profits continued throughout the second half of 2014, but in the latter part of the period the margin results became more bifurcated with energy and materials suffering and the rest of the companies holding on to net margins in an ongoing slow revenue growth environment. A rising dollar and a sharp decline in commodity prices, particularly crude oil prices, negatively impacted credit markets, notably US high yield and emerging market debt. The higher weightings of oil and gas credits in these asset classes resulted in widening spreads and increased volatility. In the second half of the period, global sovereign bond yields rose, shrugging off concerns over a Greek debt default. The rise tempered the equity advance, as odds of a 2015 US Federal Reserve rate hike increased. At the end of the period, the stronger US dollar slowed revenues in many US-based multinational companies. As the last month of the period began, risk shedding became a theme across emerging market countries and continued to weaken Chinese economic data as well as economic data of the commodity-driven countries. Risk shedding accelerated outflows and cross-border selling. By the end of the period, many of the world’s equity markets had entered into “correction” territory.
Contributors to performance
An underweight position in the poor-performing energy sector strengthened performance relative to the Russell 1000 Value Index. The fund’s underweight position in integrated energy companies Exxon Mobil and Chevron, and not holding oil and gas company Conoco Phillips, benefited relative results as this sector continued to be negatively impacted by the overall decline in global commodity markets.
Strong stock selection in the retailing sector was another area of relative strength. Most notably, overweight positions in retail giant Target and drugstore retailer CVS Health
3
Management Review – continued
aided relative performance. Shares of Target appreciated throughout the reporting period on margin improvements, increased digital sales and second-quarter results that surpassed consensus estimates.
Stocks in other sectors that boosted relative performance included overweight positions in defense contractor Lockheed Martin and global financial services firm JPMorgan Chase and holdings of management consulting firm Accenture (b) and financial services technology provide Fiserv (b). Accenture’s revenue and earnings both exceeded consensus, with highlights from growth in its Communication, Media and Technology segments. Not owning shares of mining company Freeport-McMoRan also supported relative returns as production cuts and commodity weakness negatively impacted results.
Detractors from performance
Weak stock selection in the health care sector was a primary detractor from relative performance. Not owning shares of health insurance and Medicare/Medicaid provider UnitedHealth Group, pharmaceutical companies Eli Lilly and Bristol Myers Squibb and global health service organization Cigna dampened relative results as all four companies outperformed the fund’s benchmark. Shares of Eli Lilly rose as the company announced that trials of Jardiance showed it to be the first drug ever to be a diabetic agent and also reduce cardiovascular events.
Elsewhere, overweight positions in media company Viacom, diversified technology products and services company International Business Machines Corporation (IBM), investment management firm Franklin Resources, manufacturing conglomerate Tyco International and oil and gas exploration and production company Occidental Petroleum held back relative performance as these companies underperformed the Russell 1000 Value Index. Shares of Franklin Resources depreciated as the company posted below-consensus results, driven by the worst outflow since 2012 within its retail and institutional segments. Not owning snack food and beverage producer Mondelez International also hurt relative results as the stock outperformed the benchmark over the reporting period.
Respectfully,
| | |
| Nevin Chitkara | | Steven Gorham |
| Portfolio Manager | | Portfolio Manager |
| (b) | Security is not a benchmark constituent. |
The views expressed in this report are those of the portfolio managers only through the end of the period of the report as stated on the cover and do not necessarily reflect the views of MFS or any other person in the MFS organization. These views are subject to change at any time based on market or other conditions, and MFS disclaims any responsibility to update such views. These views may not be relied upon as investment advice or an indication of trading intent on behalf of any MFS portfolio. References to specific securities are not recommendations of such securities, and may not be representative of any MFS portfolio’s current or future investments.
4
PERFORMANCE SUMMARY THROUGH 8/31/15
The following chart illustrates a representative class of the fund’s historical performance in comparison to its benchmark(s). Performance results include the deduction of the maximum applicable sales charge and reflect the percentage change in net asset value, including reinvestment of dividends and capital gains distributions. The performance of other share classes will be greater than or less than that of the class depicted below. Benchmarks are unmanaged and may not be invested in directly. Benchmark returns do not reflect sales charges, commissions or expenses. (See Notes to Performance Summary.)
Performance data shown represents past performance and is no guarantee of future results. Investment return and principal value fluctuate so your shares, when sold, may be worth more or less than the original cost; current performance may be lower or higher than quoted. The performance shown does not reflect the deduction of taxes, if any, that a shareholder would pay on fund distributions or the redemption of fund shares.
Growth of a Hypothetical $10,000 Investment
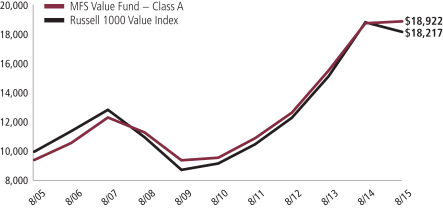
5
Performance Summary – continued
Total Returns through 8/31/15
Average annual without sales charge
| | | | | | | | | | | | | | |
| | | Share Class | | Class Inception Date | | 1-yr | | 5-yr | | 10-yr | | Life (t) | | |
| | | A | | 1/02/96 | | 0.68% | | 14.56% | | 7.22% | | N/A | | |
| | | B | | 11/04/97 | | (0.06)% | | 13.70% | | 6.45% | | N/A | | |
| | | C | | 11/05/97 | | (0.09)% | | 13.70% | | 6.45% | | N/A | | |
| | | I | | 1/02/97 | | 0.93% | | 14.84% | | 7.52% | | N/A | | |
| | | R1 | | 4/01/05 | | (0.07)% | | 13.71% | | 6.42% | | N/A | | |
| | | R2 | | 10/31/03 | | 0.43% | | 14.27% | | 6.95% | | N/A | | |
| | | R3 | | 4/01/05 | | 0.69% | | 14.56% | | 7.22% | | N/A | | |
| | | R4 | | 4/01/05 | | 0.93% | | 14.84% | | 7.49% | | N/A | | |
| | | R5 | | 5/01/06 | | 1.04% | | 14.90% | | N/A | | 6.80% | | |
| | | 529A | | 7/31/02 | | 0.67% | | 14.53% | | 7.10% | | N/A | | |
| | | 529B | | 7/31/02 | | 0.27% | | 13.73% | | 6.37% | | N/A | | |
| | | 529C | | 7/31/02 | | (0.14)% | | 13.63% | | 6.32% | | N/A | | |
| Comparative benchmark | | | | | | | | | | |
| | | Russell 1000 Value Index (f) | | (3.48)% | | 14.68% | | 6.18% | | N/A | | |
| Average annual with sales charge | | | | | | | | | | |
| | | A
With initial Sales Charge (5.75%) | | (5.11)% | | 13.21% | | 6.59% | | N/A | | |
| | | B
With CDSC (Declining over six years
from 4% to 0%) (v) | | (3.90)% | | 13.46% | | 6.45% | | N/A | | |
| | | C
With CDSC (1% for 12 months) (v) | | (1.05)% | | 13.70% | | 6.45% | | N/A | | |
| | | 529A
With initial Sales Charge (5.75%) | | (5.12)% | | 13.18% | | 6.47% | | N/A | | |
| | | 529B
With CDSC (Declining over six years
from 4% to 0%) (v) | | (3.58)% | | 13.49% | | 6.37% | | N/A | | |
| | | 529C
With CDSC (1% for 12 months) (v) | | (1.10)% | | 13.63% | | 6.32% | | N/A | | |
CDSC – Contingent Deferred Sales Charge.
Class I, R1, R2, R3, R4, and R5 shares do not have a sales charge.
On May 30, 2012, Class W shares were redesignated Class R5 shares. Total returns for Class R5 shares prior to May 30, 2012 reflect the performance history of Class W shares which had different fees and expenses than Class R5 shares.
| (f) | Source: FactSet Research Systems Inc. |
6
Performance Summary – continued
| (t) | For the period from the class inception date through the stated period end (for those share classes with less than 10 years of performance history). No comparative benchmark performance information is provided for “life” periods. (See Notes to Performance Summary.) |
| (v) | Assuming redemption at the end of the applicable period. |
Benchmark Definition
Russell 1000 Value Index – constructed to provide a comprehensive barometer for the value securities in the large-cap segment of the U.S. equity universe. Companies in this index generally have lower price-to-book ratios and lower forecasted growth values.
It is not possible to invest directly in an index.
Notes to Performance Summary
Class 529 shares are only available in conjunction with qualified tuition programs, such as the MFS 529 Savings Plan. There also is an additional fee, which is detailed in the program description, on qualified tuition programs. If this fee was reflected, the performance for Class 529 shares would have been lower. This annual fee is waived for Oregon residents and for those accounts with assets of $25,000 or more.
Average annual total return represents the average annual change in value for each share class for the periods presented. Life returns are presented where the share class has less than 10 years of performance history and represent the average annual total return from the class inception date to the stated period end date. As the fund’s share classes may have different inception dates, the life returns may represent different time periods and may not be comparable. As a result, no comparative benchmark performance information is provided for life periods.
Performance results reflect any applicable expense subsidies and waivers in effect during the periods shown. Without such subsidies and waivers the fund’s performance results would be less favorable. Please see the prospectus and financial statements for complete details.
Performance results do not include adjustments made for financial reporting purposes in accordance with U.S. generally accepted accounting principles and may differ from amounts reported in the financial highlights.
From time to time the fund may receive proceeds from litigation settlements, without which performance would be lower.
7
EXPENSE TABLE
Fund expenses borne by the shareholders during the period, March 1, 2015 through August 31, 2015
As a shareholder of the fund, you incur two types of costs: (1) transaction costs, including sales charges (loads) on certain purchase or redemption payments, and (2) ongoing costs, including management fees; distribution and service (12b-1) fees; and other fund expenses. This example is intended to help you understand your ongoing costs (in dollars) of investing in the fund and to compare these costs with the ongoing costs of investing in other mutual funds.
The example is based on an investment of $1,000 invested at the beginning of the period and held for the entire period March 1, 2015 through August 31, 2015.
Actual Expenses
The first line for each share class in the following table provides information about actual account values and actual expenses. You may use the information in this line, together with the amount you invested, to estimate the expenses that you paid over the period. Simply divide your account value by $1,000 (for example, an $8,600 account value divided by $1,000 = 8.6), then multiply the result by the number in the first line under the heading entitled “Expenses Paid During Period” to estimate the expenses you paid on your account during this period.
Hypothetical Example for Comparison Purposes
The second line for each share class in the following table provides information about hypothetical account values and hypothetical expenses based on the fund’s actual expense ratio and an assumed rate of return of 5% per year before expenses, which is not the fund’s actual return. The hypothetical account values and expenses may not be used to estimate the actual ending account balance or expenses you paid for the period. You may use this information to compare the ongoing costs of investing in the fund and other funds. To do so, compare this 5% hypothetical example with the 5% hypothetical examples that appear in the shareholder reports of the other funds.
Please note that the expenses shown in the table are meant to highlight your ongoing costs only and do not reflect any transactional costs, such as sales charges (loads). Therefore, the second line for each share class in the table is useful in comparing ongoing costs only, and will not help you determine the relative total costs of owning different funds. In addition, if these transactional costs were included, your costs would have been higher.
8
Expense Table – continued
| | | | | | | | | | | | | | | | | | |
Share
Class | | | | Annualized
Expense Ratio | | | Beginning
Account Value
3/01/15 | | | Ending Account Value
8/31/15 | | | Expenses Paid During Period (p) 3/01/15-8/31/15 | |
| A | | Actual | | | 0.87% | | | | $1,000.00 | | | | $946.22 | | | | $4.27 | |
| | Hypothetical (h) | | | 0.87% | | | | $1,000.00 | | | | $1,020.82 | | | | $4.43 | |
| B | | Actual | | | 1.62% | | | | $1,000.00 | | | | $942.74 | | | | $7.93 | |
| | Hypothetical (h) | | | 1.62% | | | | $1,000.00 | | | | $1,017.04 | | | | $8.24 | |
| C | | Actual | | | 1.62% | | | | $1,000.00 | | | | $942.57 | | | | $7.93 | |
| | Hypothetical (h) | | | 1.62% | | | | $1,000.00 | | | | $1,017.04 | | | | $8.24 | |
| I | | Actual | | | 0.62% | | | | $1,000.00 | | | | $947.33 | | | | $3.04 | |
| | Hypothetical (h) | | | 0.62% | | | | $1,000.00 | | | | $1,022.08 | | | | $3.16 | |
| R1 | | Actual | | | 1.62% | | | | $1,000.00 | | | | $942.73 | | | | $7.93 | |
| | Hypothetical (h) | | | 1.62% | | | | $1,000.00 | | | | $1,017.04 | | | | $8.24 | |
| R2 | | Actual | | | 1.12% | | | | $1,000.00 | | | | $945.15 | | | | $5.49 | |
| | Hypothetical (h) | | | 1.12% | | | | $1,000.00 | | | | $1,019.56 | | | | $5.70 | |
| R3 | | Actual | | | 0.87% | | | | $1,000.00 | | | | $946.34 | | | | $4.27 | |
| | Hypothetical (h) | | | 0.87% | | | | $1,000.00 | | | | $1,020.82 | | | | $4.43 | |
| R4 | | Actual | | | 0.62% | | | | $1,000.00 | | | | $947.63 | | | | $3.04 | |
| | Hypothetical (h) | | | 0.62% | | | | $1,000.00 | | | | $1,022.08 | | | | $3.16 | |
| R5 | | Actual | | | 0.50% | | | | $1,000.00 | | | | $947.86 | | | | $2.45 | |
| | Hypothetical (h) | | | 0.50% | | | | $1,000.00 | | | | $1,022.68 | | | | $2.55 | |
| 529A | | Actual | | | 0.87% | | | | $1,000.00 | | | | $946.18 | | | | $4.27 | |
| | Hypothetical (h) | | | 0.87% | | | | $1,000.00 | | | | $1,020.82 | | | | $4.43 | |
| 529B | | Actual | | | 1.27% | | | | $1,000.00 | | | | $944.39 | | | | $6.22 | |
| | Hypothetical (h) | | | 1.27% | | | | $1,000.00 | | | | $1,018.80 | | | | $6.46 | |
| 529C | | Actual | | | 1.66% | | | | $1,000.00 | | | | $942.25 | | | | $8.13 | |
| | Hypothetical (h) | | | 1.66% | | | | $1,000.00 | | | | $1,016.84 | | | | $8.44 | |
| (h) | 5% class return per year before expenses. |
| (p) | “Expenses Paid During Period” are equal to each class’s annualized expense ratio, as shown above, multiplied by the average account value over the period, multiplied by 184/365 (to reflect the one-half year period). Expenses paid do not include any applicable sales charges (loads). If these transaction costs had been included, your costs would have been higher. |
Notes to Expense Table
Each class with a Rule 12b-1 service fee is subject to a rebate of a portion of such fee. Such rebates are included in the expense ratios above. For Class 529A and Class 529B shares, this rebate reduced the expense ratios above by 0.05% and 0.01%, respectively. See Note 3 in the Notes to Financial Statements for additional information.
9
PORTFOLIO OF INVESTMENTS
8/31/15
The Portfolio of Investments is a complete list of all securities owned by your fund. It is categorized by broad-based asset classes.
| | | | | | | | |
| Common Stocks - 97.8% | | | | | | | | |
| Issuer | | Shares/Par | | | Value ($) | |
| Aerospace - 6.6% | | | | | | | | |
| Honeywell International, Inc. | | | 6,567,484 | | | $ | 651,954,143 | |
| Lockheed Martin Corp. | | | 3,206,986 | | | | 645,181,443 | |
| Northrop Grumman Corp. | | | 1,904,523 | | | | 311,846,596 | |
| United Technologies Corp. | | | 6,729,353 | | | | 616,476,028 | |
| | | | | | | | |
| | | | $ | 2,225,458,210 | |
| Alcoholic Beverages - 1.3% | | | | | | | | |
| Diageo PLC | | | 16,191,227 | | | $ | 429,826,121 | |
| | |
| Automotive - 1.6% | | | | | | | | |
| Delphi Automotive PLC | | | 3,405,753 | | | $ | 257,202,467 | |
| Johnson Controls, Inc. | | | 6,969,452 | | | | 286,723,255 | |
| | | | | | | | |
| | | | $ | 543,925,722 | |
| Broadcasting - 2.8% | | | | | | | | |
| Omnicom Group, Inc. | | | 5,327,991 | | | $ | 356,868,837 | |
| Time Warner, Inc. | | | 3,515,340 | | | | 249,940,674 | |
| Viacom, Inc., “B” | | | 3,037,732 | | | | 123,848,334 | |
| Walt Disney Co. | | | 1,978,765 | | | | 201,596,578 | |
| | | | | | | | |
| | | | $ | 932,254,423 | |
| Brokerage & Asset Managers - 2.7% | | | | | | | | |
| BlackRock, Inc. | | | 962,727 | | | $ | 291,196,036 | |
| Franklin Resources, Inc. | | | 8,553,072 | | | | 347,083,662 | |
| NASDAQ OMX Group, Inc. | | | 5,440,130 | | | | 278,480,255 | |
| | | | | | | | |
| | | | $ | 916,759,953 | |
| Business Services - 4.4% | | | | | | | | |
| Accenture PLC, “A” | | | 9,352,896 | | | $ | 881,697,506 | |
| Equifax, Inc. | | | 887,516 | | | | 86,887,816 | |
| Fidelity National Information Services, Inc. | | | 3,388,928 | | | | 234,039,368 | |
| Fiserv, Inc. (a) | | | 3,401,616 | | | | 290,055,796 | |
| | | | | | | | |
| | | | $ | 1,492,680,486 | |
| Cable TV - 1.2% | | | | | | | | |
| Comcast Corp., “Special A” | | | 7,142,947 | | | $ | 408,862,286 | |
| | |
| Chemicals - 4.3% | | | | | | | | |
| 3M Co. | | | 4,353,102 | | | $ | 618,749,918 | |
| E.I. du Pont de Nemours & Co. | | | 1,660,327 | | | | 85,506,841 | |
10
Portfolio of Investments – continued
| | | | | | | | |
| Issuer | | Shares/Par | | | Value ($) | |
| Common Stocks - continued | | | | | | | | |
| Chemicals - continued | | | | | | | | |
| Monsanto Co. | | | 1,383,945 | | | $ | 135,142,229 | |
| PPG Industries, Inc. | | | 6,307,670 | | | | 601,057,874 | |
| | | | | | | | |
| | | | $ | 1,440,456,862 | |
| Computer Software - 0.9% | | | | | | | | |
| Oracle Corp. | | | 7,941,169 | | | $ | 294,537,958 | |
| | |
| Computer Software - Systems - 1.3% | | | | | | | | |
| International Business Machines Corp. | | | 2,960,827 | | | $ | 437,876,705 | |
| | |
| Construction - 0.5% | | | | | | | | |
| Stanley Black & Decker, Inc. | | | 1,679,772 | | | $ | 170,530,453 | |
| | |
| Consumer Products - 0.7% | | | | | | | | |
| Newell Rubbermaid, Inc. | | | 1,821,678 | | | $ | 76,747,294 | |
| Procter & Gamble Co. | | | 2,106,505 | | | | 148,866,708 | |
| | | | | | | | |
| | | | $ | 225,614,002 | |
| Containers - 0.5% | |
| Crown Holdings, Inc. (a) | | | 3,423,514 | | | $ | 169,703,589 | |
| | |
| Electrical Equipment - 3.0% | | | | | | | | |
| Danaher Corp. | | | 5,258,260 | | | $ | 457,573,785 | |
| Pentair PLC | | | 2,733,795 | | | | 151,151,526 | |
| Tyco International PLC | | | 11,274,889 | | | | 409,165,722 | |
| | | | | | | | |
| | | | $ | 1,017,891,033 | |
| Electronics - 1.5% | | | | | | | | |
| Analog Devices, Inc. | | | 1,260,869 | | | $ | 70,432,142 | |
| NVIDIA Corp. | | | 1,720,365 | | | | 38,673,805 | |
| Texas Instruments, Inc. | | | 8,212,674 | | | | 392,894,324 | �� |
| | | | | | | | |
| | | | $ | 502,000,271 | |
| Energy - Independent - 1.4% | | | | | | | | |
| EOG Resources, Inc. | | | 1,791,044 | | | $ | 140,256,656 | |
| Occidental Petroleum Corp. | | | 4,650,626 | | | | 339,542,204 | |
| | | | | | | | |
| | | | $ | 479,798,860 | |
| Energy - Integrated - 2.7% | | | | | | | | |
| Chevron Corp. | | | 4,589,220 | | | $ | 371,680,928 | |
| Exxon Mobil Corp. | | | 7,216,995 | | | | 543,006,704 | |
| | | | | | | | |
| | | | $ | 914,687,632 | |
11
Portfolio of Investments – continued
| | | | | | | | |
| Issuer | | Shares/Par | | | Value ($) | |
| Common Stocks - continued | | | | | | | | |
| Food & Beverages - 4.5% | | | | | | | | |
| Archer Daniels Midland Co. | | | 1,849,899 | | | $ | 83,226,956 | |
| Danone S.A. | | | 3,794,410 | | | | 235,845,047 | |
| General Mills, Inc. | | | 9,582,184 | | | | 543,884,764 | |
| Kellogg Co. | | | 1,372,405 | | | | 90,963,003 | |
| Nestle S.A. | | | 7,415,001 | | | | 546,929,676 | |
| | | | | | | | |
| | | | $ | 1,500,849,446 | |
| Food & Drug Stores - 1.8% | | | | | | | | |
| CVS Health Corp. | | | 6,062,197 | | | $ | 620,768,973 | |
| | |
| General Merchandise - 1.4% | | | | | | | | |
| Kohl’s Corp. | | | 921,282 | | | $ | 47,013,020 | |
| Target Corp. | | | 5,393,951 | | | | 419,163,932 | |
| | | | | | | | |
| | | | $ | 466,176,952 | |
| Insurance - 7.8% | | | | | | | | |
| ACE Ltd. | | | 3,445,544 | | | $ | 351,996,775 | |
| Aon PLC | | | 4,283,296 | | | | 400,231,178 | |
| Chubb Corp. | | | 2,608,704 | | | | 315,157,530 | |
| MetLife, Inc. | | | 12,030,799 | | | | 602,743,030 | |
| Prudential Financial, Inc. | | | 3,834,660 | | | | 309,457,062 | |
| Travelers Cos., Inc. | | | 6,431,259 | | | | 640,231,833 | |
| | | | | | | | |
| | | | $ | 2,619,817,408 | |
| Leisure & Toys - 0.5% | | | | | | | | |
| Hasbro, Inc. | | | 2,213,331 | | | $ | 165,092,359 | |
| | |
| Machinery & Tools - 1.8% | | | | | | | | |
| Deere & Co. | | | 1,150,307 | | | $ | 94,072,106 | |
| Eaton Corp. PLC | | | 4,346,357 | | | | 248,003,130 | |
| Illinois Tool Works, Inc. | | | 2,567,310 | | | | 217,014,714 | |
| Parker Hannifin Corp. | | | 462,382 | | | | 49,780,046 | |
| | | | | | | | |
| | | | $ | 608,869,996 | |
| Major Banks - 12.9% | | | | | | | | |
| Bank of New York Mellon Corp. | | | 10,580,411 | | | $ | 421,100,358 | |
| Goldman Sachs Group, Inc. | | | 3,495,873 | | | | 659,321,648 | |
| JPMorgan Chase & Co. | | | 24,343,202 | | | | 1,560,399,248 | |
| PNC Financial Services Group, Inc. | | | 3,125,694 | | | | 284,813,237 | |
| State Street Corp. | | | 4,275,551 | | | | 307,497,628 | |
| Wells Fargo & Co. | | | 20,998,581 | | | | 1,119,854,325 | |
| | | | | | | | |
| | | | $ | 4,352,986,444 | |
| Medical & Health Technology & Services - 1.1% | | | | | | | | |
| Express Scripts Holding Co. (a) | | | 4,370,747 | | | $ | 365,394,449 | |
12
Portfolio of Investments – continued
| | | | | | | | |
| Issuer | | Shares/Par | | | Value ($) | |
| Common Stocks - continued | | | | | | | | |
| Medical Equipment - 5.0% | | | | | | | | |
| Abbott Laboratories | | | 8,639,623 | | | $ | 391,288,526 | |
| Medtronic PLC | | | 8,969,612 | | | | 648,413,251 | |
| St. Jude Medical, Inc. | | | 3,653,908 | | | | 258,733,225 | |
| Thermo Fisher Scientific, Inc. | | | 2,971,956 | | | | 372,594,124 | |
| | | | | | | | |
| | | | $ | 1,671,029,126 | |
| Oil Services - 1.0% | | | | | | | | |
| Baker Hughes, Inc. | | | 518,763 | | | $ | 29,050,728 | |
| National Oilwell Varco, Inc. | | | 1,004,908 | | | | 42,537,756 | |
| Schlumberger Ltd. | | | 3,519,724 | | | | 272,321,046 | |
| | | | | | | | |
| | | | $ | 343,909,530 | |
| Other Banks & Diversified Financials - 3.3% | | | | | | | | |
| American Express Co. | | | 4,534,471 | | | $ | 347,884,615 | |
| Citigroup, Inc. | | | 2,319,749 | | | | 124,060,177 | |
| U.S. Bancorp | | | 15,192,058 | | | | 643,383,656 | |
| | | | | | | | |
| | | | $ | 1,115,328,448 | |
| Pharmaceuticals - 8.0% | | | | | | | | |
| Johnson & Johnson | | | 11,751,683 | | | $ | 1,104,423,168 | |
| Merck & Co., Inc. | | | 9,276,338 | | | | 499,530,801 | |
| Novartis AG | | | 1,193,903 | | | | 116,963,342 | |
| Pfizer, Inc. | | | 27,137,462 | | | | 874,369,026 | |
| Roche Holding AG | | | 342,492 | | | | 93,537,359 | |
| | | | | | | | |
| | | | $ | 2,688,823,696 | |
| Printing & Publishing - 0.3% | | | | | | | | |
| McGraw-Hill Cos., Inc. | | | 867,021 | | | $ | 84,092,367 | |
| Time, Inc. | | | 373,311 | | | | 7,753,669 | |
| | | | | | | | |
| | | | $ | 91,846,036 | |
| Railroad & Shipping - 0.9% | | | | | | | | |
| Canadian National Railway Co. | | | 3,045,280 | | | $ | 168,952,134 | |
| Union Pacific Corp. | | | 1,604,394 | | | | 137,560,742 | |
| | | | | | | | |
| | | | $ | 306,512,876 | |
| Restaurants - 0.5% | | | | | | | | |
| McDonald’s Corp. | | | 1,749,057 | | | $ | 166,195,396 | |
| | |
| Specialty Stores - 0.6% | | | | | | | | |
| Advance Auto Parts, Inc. | | | 704,705 | | | $ | 123,499,551 | |
| Bed Bath & Beyond, Inc. (a) | | | 1,233,606 | | | | 76,619,269 | |
| | | | | | | | |
| | | | $ | 200,118,820 | |
13
Portfolio of Investments – continued
| | | | | | | | |
| Issuer | | Shares/Par | | | Value ($) | |
| Common Stocks - continued | | | | | | | | |
| Telecommunications - Wireless - 0.4% | | | | | | | | |
| Vodafone Group PLC | | | 43,558,311 | | | $ | 150,308,116 | |
| | |
| Telephone Services - 1.9% | | | | | | | | |
| AT&T, Inc. | | | 2,006,626 | | | $ | 66,619,983 | |
| Verizon Communications, Inc. | | | 12,384,179 | | | | 569,796,076 | |
| | | | | | | | |
| | | | $ | 636,416,059 | |
| Tobacco - 4.5% | |
| Altria Group, Inc. | | | 3,478,778 | | | $ | 186,392,925 | |
| Imperial Tobacco Group PLC | | | 1,597,140 | | | | 76,729,612 | |
| Philip Morris International, Inc. | | | 13,319,129 | | | | 1,062,866,494 | |
| Reynolds American, Inc. | | | 2,127,777 | | | | 178,201,324 | |
| | | | | | | | |
| | | | $ | 1,504,190,355 | |
| Trucking - 1.4% | | | | | | | | |
| United Parcel Service, Inc., “B” | | | 4,730,701 | | | $ | 461,952,953 | |
| | |
| Utilities - Electric Power - 0.8% | | | | | | | | |
| Duke Energy Corp. | | | 3,562,223 | | | $ | 252,597,233 | |
| Total Common Stocks (Identified Cost, $23,372,619,664) | | | $ | 32,892,049,237 | |
| | |
| Money Market Funds - 1.3% | | | | | | | | |
MFS Institutional Money Market Portfolio, 0.11%,
at Cost and Net Asset Value (v) | | | 437,841,714 | | | $ | 437,841,714 | |
| Total Investments (Identified Cost, $23,810,461,378) | | | $ | 33,329,890,951 | |
| |
| Other Assets, Less Liabilities - 0.9% | | | | 303,248,281 | |
| Net Assets - 100.0% | | | $ | 33,633,139,232 | |
| (a) | Non-income producing security. |
| (v) | Underlying affiliated fund that is available only to investment companies managed by MFS. The rate quoted for the MFS Institutional Money Market Portfolio is the annualized seven-day yield of the fund at period end. |
The following abbreviations are used in this report and are defined:
| PLC | | Public Limited Company |
See Notes to Financial Statements
14
Financial Statements
STATEMENT OF ASSETS AND LIABILITIES
At 8/31/15
This statement represents your fund’s balance sheet, which details the assets and liabilities comprising the total value of the fund.
| | | | |
| Assets | | | | |
Investments | | | | |
Non-affiliated issuers, at value (identified cost, $23,372,619,664) | | | $32,892,049,237 | |
Underlying affiliated funds, at cost and value | | | 437,841,714 | |
Total investments, at value (identified cost, $23,810,461,378) | | | $33,329,890,951 | |
Foreign currency, at value (identified cost, $2) | | | 2 | |
Receivables for | | | | |
Investments sold | | | 135,047,426 | |
Fund shares sold | | | 285,832,717 | |
Interest and dividends | | | 110,387,217 | |
Other assets | | | 39,535 | |
Total assets | | | $33,861,197,848 | |
| Liabilities | | | | |
Payables for | | | | |
Investments purchased | | | $157,658,276 | |
Fund shares reacquired | | | 55,193,207 | |
Payable to affiliates | | | | |
Investment adviser | | | 1,616,788 | |
Shareholder servicing costs | | | 12,144,049 | |
Distribution and service fees | | | 466,874 | |
Program manager fees | | | 122 | |
Payable for independent Trustees’ compensation | | | 2,847 | |
Accrued expenses and other liabilities | | | 976,453 | |
Total liabilities | | | $228,058,616 | |
Net assets | | | $33,633,139,232 | |
| Net assets consist of | | | | |
| Paid-in capital | | | $23,153,206,690 | |
Unrealized appreciation (depreciation) on investments and translation of assets and liabilities in foreign currencies | | | 9,518,708,629 | |
Accumulated net realized gain (loss) on investments and foreign currency | | | 838,033,065 | |
Undistributed net investment income | | | 123,190,848 | |
Net assets | | | $33,633,139,232 | |
Shares of beneficial interest outstanding | | | 1,005,988,097 | |
15
Statement of Assets and Liabilities – continued
| | | | | | | | | | | | |
| | | Net assets | | | Shares
outstanding | | | Net asset value
per share (a) | |
Class A | | | $8,478,761,072 | | | | 254,009,287 | | | | $33.38 | |
Class B | | | 154,205,258 | | | | 4,646,263 | | | | 33.19 | |
Class C | | | 1,335,967,909 | | | | 40,480,415 | | | | 33.00 | |
Class I | | | 13,888,394,711 | | | | 413,807,411 | | | | 33.56 | |
Class R1 | | | 27,859,568 | | | | 849,731 | | | | 32.79 | |
Class R2 | | | 521,592,022 | | | | 15,768,703 | | | | 33.08 | |
Class R3 | | | 1,571,280,525 | | | | 47,215,419 | | | | 33.28 | |
Class R4 | | | 2,787,040,769 | | | | 83,454,745 | | | | 33.40 | |
Class R5 | | | 4,846,171,979 | | | | 145,094,266 | | | | 33.40 | |
Class 529A | | | 16,543,349 | | | | 499,017 | | | | 33.15 | |
Class 529B | | | 887,814 | | | | 27,085 | | | | 32.78 | |
Class 529C | | | 4,434,256 | | | | 135,755 | | | | 32.66 | |
| (a) | Maximum offering price per share was equal to the net asset value per share for all share classes, except for Classes A and 529A, for which the maximum offering prices per share were $35.42 [100 / 94.25 x $33.38] and $35.17 [100 / 94.25 x $33.15], respectively. On sales of $50,000 or more, the maximum offering prices of Class A and Class 529A shares are reduced. A contingent deferred sales charge may be imposed on redemptions of Class A, Class B, Class C, Class 529B, and Class 529C shares. Redemption price per share was equal to the net asset value per share for Classes I, R1, R2, R3, R4, R5, and 529A. |
See Notes to Financial Statements
16
Financial Statements
STATEMENT OF OPERATIONS
Year ended 8/31/15
This statement describes how much your fund earned in investment income and accrued in expenses. It also describes any gains and/or losses generated by fund operations.
| | | | |
| Net investment income | |
Income | | | | |
Dividends | | | $939,767,647 | |
Interest | | | 205,871 | |
Dividends from underlying affiliated funds | | | 361,187 | |
Foreign taxes withheld | | | (4,900,428 | ) |
Total investment income | | | $935,434,277 | |
Expenses | | | | |
Management fee | | | $183,699,765 | |
Distribution and service fees | | | 46,023,075 | |
Program manager fees | | | 21,783 | |
Shareholder servicing costs | | | 35,390,487 | |
Administrative services fee | | | 645,768 | |
Independent Trustees’ compensation | | | 223,158 | |
Custodian fee | | | 840,769 | |
Shareholder communications | | | 1,466,094 | |
Audit and tax fees | | | 70,112 | |
Legal fees | | | 254,621 | |
Miscellaneous | | | 1,286,986 | |
Total expenses | | | $269,922,618 | |
Fees paid indirectly | | | (1,232 | ) |
Reduction of expenses by investment adviser and distributor | | | (13,983,338 | ) |
Net expenses | | | $255,938,048 | |
Net investment income | | | $679,496,229 | |
| Realized and unrealized gain (loss) on investments and foreign currency | |
Realized gain (loss) (identified cost basis) | | | | |
Investments | | | $1,253,350,103 | |
Foreign currency | | | (1,779,313 | ) |
Net realized gain (loss) on investments and foreign currency | | | $1,251,570,790 | |
Change in unrealized appreciation (depreciation) | | | | |
Investments | | | $(1,605,212,576 | ) |
Translation of assets and liabilities in foreign currencies | | | (519,211 | ) |
Net unrealized gain (loss) on investments and foreign currency translation | | | $(1,605,731,787 | ) |
Net realized and unrealized gain (loss) on investments and foreign currency | | | $(354,160,997 | ) |
Change in net assets from operations | | | $325,335,232 | |
See Notes to Financial Statements
17
Financial Statements
STATEMENTS OF CHANGES IN NET ASSETS
These statements describe the increases and/or decreases in net assets resulting from operations, any distributions, and any shareholder transactions.
| | | | | | | | |
| | | Years ended 8/31 | |
| | | 2015 | | | 2014 | |
| Change in net assets | | | | | | |
| From operations | | | | | | | | |
Net investment income | | | $679,496,229 | | | | $702,164,857 | |
Net realized gain (loss) on investments and foreign currency | | | 1,251,570,790 | | | | 1,252,691,611 | |
Net unrealized gain (loss) on investments and foreign currency translation | | | (1,605,731,787 | ) | | | 3,834,435,083 | |
Change in net assets from operations | | | $325,335,232 | | | | $5,789,291,551 | |
| Distributions declared to shareholders | | | | | | | | |
From net investment income | | | $(716,352,511 | ) | | | $(632,546,037 | ) |
From net realized gain on investments | | | (905,973,115 | ) | | | (534,397,478 | ) |
Total distributions declared to shareholders | | | $(1,622,325,626 | ) | | | $(1,166,943,515 | ) |
Change in net assets from fund share transactions | | | $537,432,078 | | | | $2,708,168,604 | |
Total change in net assets | | | $(759,558,316 | ) | | | $7,330,516,640 | |
| Net assets | | | | | | | | |
At beginning of period | | | 34,392,697,548 | | | | 27,062,180,908 | |
At end of period (including undistributed net investment income of $123,190,848 and $161,826,443, respectively) | | | $33,633,139,232 | | | | $34,392,697,548 | |
See Notes to Financial Statements
18
Financial Statements
FINANCIAL HIGHLIGHTS
The financial highlights table is intended to help you understand the fund’s financial performance for the past 5 years. Certain information reflects financial results for a single fund share. The total returns in the table represent the rate by which an investor would have earned (or lost) on an investment in the fund share class (assuming reinvestment of all distributions) held for the entire period.
| | | | | | | | | | | | | | | | | | | | |
| Class A | | Years ended 8/31 | |
| | | 2015 | | | 2014 | | | 2013 | | | 2012 | | | 2011 | |
Net asset value, beginning of period | | | $34.70 | | | | $29.81 | | | | $24.90 | | | | $21.83 | | | | $19.46 | |
| Income (loss) from investment operations | | | | | | | | | |
Net investment income (d) | | | $0.63 | | | | $0.69 | | | | $0.50 | | | | $0.43 | | | | $0.34 | |
Net realized and unrealized gain (loss)
on investments and foreign currency | | | (0.36 | ) | | | 5.41 | | | | 5.08 | | | | 3.05 | | | | 2.35 | |
Total from investment operations | | | $0.27 | | | | $6.10 | | | | $5.58 | | | | $3.48 | | | | $2.69 | |
| Less distributions declared to shareholders | | | | | | | | | |
From net investment income | | | $(0.67 | ) | | | $(0.63 | ) | | | $(0.48 | ) | | | $(0.41 | ) | | | $(0.32 | ) |
From net realized gain on investments | | | (0.92 | ) | | | (0.58 | ) | | | (0.19 | ) | | | — | | | | — | |
Total distributions declared to shareholders | | | $(1.59 | ) | | | $(1.21 | ) | | | $(0.67 | ) | | | $(0.41 | ) | | | $(0.32 | ) |
Net asset value, end of period (x) | | | $33.38 | | | | $34.70 | | | | $29.81 | | | | $24.90 | | | | $21.83 | |
Total return (%) (r)(s)(t)(x) | | | 0.68 | | | | 20.78 | | | | 22.75 | | | | 16.16 | | | | 13.78 | |
Ratios (%) (to average net assets)
and Supplemental data: | | | | | |
Expenses before expense reductions (f) | | | 0.90 | | | | 0.90 | | | | 0.93 | | | | 0.95 | | | | 0.95 | |
Expenses after expense reductions (f) | | | 0.86 | | | | 0.88 | | | | 0.92 | | | | 0.93 | | | | 0.94 | |
Net investment income | | | 1.80 | | | | 2.10 | | | | 1.80 | | | | 1.86 | | | | 1.49 | |
Portfolio turnover | | | 12 | | | | 13 | | | | 12 | | | | 14 | | | | 17 | |
Net assets at end of period (000 omitted) | | | $8,478,761 | | | | $9,448,535 | | | | $8,058,858 | | | | $6,628,244 | | | | $5,086,069 | |
See Notes to Financial Statements
19
Financial Highlights – continued
| | | | | | | | | | | | | | | | | | | | |
| Class B | | Years ended 8/31 | |
| | | 2015 | | | 2014 | | | 2013 | | | 2012 | | | 2011 | |
Net asset value, beginning of period | | | $34.50 | | | | $29.64 | | | | $24.76 | | | | $21.70 | | | | $19.34 | |
| Income (loss) from investment operations | | | | | | | | | |
Net investment income (d) | | | $0.37 | | | | $0.44 | | | | $0.29 | | | | $0.26 | | | | $0.16 | |
Net realized and unrealized gain (loss)
on investments and foreign currency | | | (0.35 | ) | | | 5.38 | | | | 5.05 | | | | 3.03 | | | | 2.34 | |
Total from investment operations | | | $0.02 | | | | $5.82 | | | | $5.34 | | | | $3.29 | | | | $2.50 | |
| Less distributions declared to shareholders | | | | | | | | | |
From net investment income | | | $(0.41 | ) | | | $(0.38 | ) | | | $(0.27 | ) | | | $(0.23 | ) | | | $(0.14 | ) |
From net realized gain on investments | | | (0.92 | ) | | | (0.58 | ) | | | (0.19 | ) | | | — | | | | — | |
Total distributions declared to shareholders | | | $(1.33 | ) | | | $(0.96 | ) | | | $(0.46 | ) | | | $(0.23 | ) | | | $(0.14 | ) |
Net asset value, end of period (x) | | | $33.19 | | | | $34.50 | | | | $29.64 | | | | $24.76 | | | | $21.70 | |
Total return (%) (r)(s)(t)(x) | | | (0.06 | ) | | | 19.89 | | | | 21.82 | | | | 15.28 | | | | 12.92 | |
Ratios (%) (to average net assets)
and Supplemental data: | | | | | |
Expenses before expense reductions (f) | | | 1.65 | | | | 1.65 | | | | 1.68 | | | | 1.70 | | | | 1.70 | |
Expenses after expense reductions (f) | | | 1.61 | | | | 1.63 | | | | 1.67 | | | | 1.68 | | | | 1.69 | |
Net investment income | | | 1.05 | | | | 1.35 | | | | 1.05 | | | | 1.11 | | | | 0.73 | |
Portfolio turnover | | | 12 | | | | 13 | | | | 12 | | | | 14 | | | | 17 | |
Net assets at end of period (000 omitted) | | | $154,205 | | | | $179,284 | | | | $169,208 | | | | $167,949 | | | | $182,654 | |
| |
| Class C | | Years ended 8/31 | |
| | | 2015 | | | 2014 | | | 2013 | | | 2012 | | | 2011 | |
Net asset value, beginning of period | | | $34.33 | | | | $29.50 | | | | $24.65 | | | | $21.62 | | | | $19.27 | |
| Income (loss) from investment operations | | | | | | | | | |
Net investment income (d) | | | $0.37 | | | | $0.44 | | | | $0.29 | | | | $0.25 | | | | $0.17 | |
Net realized and unrealized gain (loss)
on investments and foreign currency | | | (0.36 | ) | | | 5.36 | | | | 5.03 | | | | 3.02 | | | | 2.33 | |
Total from investment operations | | | $0.01 | | | | $5.80 | | | | $5.32 | | | | $3.27 | | | | $2.50 | |
| Less distributions declared to shareholders | | | | | | | | | |
From net investment income | | | $(0.42 | ) | | | $(0.39 | ) | | | $(0.28 | ) | | | $(0.24 | ) | | | $(0.15 | ) |
From net realized gain on investments | | | (0.92 | ) | | | (0.58 | ) | | | (0.19 | ) | | | — | | | | — | |
Total distributions declared to shareholders | | | $(1.34 | ) | | | $(0.97 | ) | | | $(0.47 | ) | | | $(0.24 | ) | | | $(0.15 | ) |
Net asset value, end of period (x) | | | $33.00 | | | | $34.33 | | | | $29.50 | | | | $24.65 | | | | $21.62 | |
Total return (%) (r)(s)(t)(x) | | | (0.09 | ) | | | 19.92 | | | | 21.83 | | | | 15.23 | | | | 12.97 | |
Ratios (%) (to average net assets)
and Supplemental data: | | | | | |
Expenses before expense reductions (f) | | | 1.65 | | | | 1.65 | | | | 1.68 | | | | 1.69 | | | | 1.70 | |
Expenses after expense reductions (f) | | | 1.61 | | | | 1.63 | | | | 1.67 | | | | 1.68 | | | | 1.69 | |
Net investment income | | | 1.06 | | | | 1.35 | | | | 1.05 | | | | 1.11 | | | | 0.74 | |
Portfolio turnover | | | 12 | | | | 13 | | | | 12 | | | | 14 | | | | 17 | |
Net assets at end of period (000 omitted) | | | $1,335,968 | | | | $1,359,860 | | | | $1,090,690 | | | | $906,572 | | | | $871,026 | |
See Notes to Financial Statements
20
Financial Highlights – continued
| | | | | | | | | | | | | | | | | | | | |
| Class I | | Years ended 8/31 | |
| | | 2015 | | | 2014 | | | 2013 | | | 2012 | | | 2011 | |
Net asset value, beginning of period | | | $34.88 | | | | $29.96 | | | | $25.02 | | | | $21.94 | | | | $19.55 | |
| Income (loss) from investment operations | | | | | | | | | |
Net investment income (d) | | | $0.72 | | | | $0.78 | | | | $0.57 | | | | $0.49 | | | | $0.40 | |
Net realized and unrealized gain (loss)
on investments and foreign currency | | | (0.36 | ) | | | 5.43 | | | | 5.10 | | | | 3.06 | | | | 2.37 | |
Total from investment operations | | | $0.36 | | | | $6.21 | | | | $5.67 | | | | $3.55 | | | | $2.77 | |
| Less distributions declared to shareholders | | | | | | | | | |
From net investment income | | | $(0.76 | ) | | | $(0.71 | ) | | | $(0.54 | ) | | | $(0.47 | ) | | | $(0.38 | ) |
From net realized gain on investments | | | (0.92 | ) | | | (0.58 | ) | | | (0.19 | ) | | | — | | | | — | |
Total distributions declared to shareholders | | | $(1.68 | ) | | | $(1.29 | ) | | | $(0.73 | ) | | | $(0.47 | ) | | | $(0.38 | ) |
Net asset value, end of period (x) | | | $33.56 | | | | $34.88 | | | | $29.96 | | | | $25.02 | | | | $21.94 | |
Total return (%) (r)(s)(x) | | | 0.93 | | | | 21.07 | | | | 23.06 | | | | 16.42 | | | | 14.10 | |
Ratios (%) (to average net assets)
and Supplemental data: | | | | | |
Expenses before expense reductions (f) | | | 0.65 | | | | 0.65 | | | | 0.68 | | | | 0.70 | | | | 0.70 | |
Expenses after expense reductions (f) | | | 0.61 | | | | 0.63 | | | | 0.67 | | | | 0.68 | | | | 0.69 | |
Net investment income | | | 2.06 | | | | 2.35 | | | | 2.05 | | | | 2.11 | | | | 1.75 | |
Portfolio turnover | | | 12 | | | | 13 | | | | 12 | | | | 14 | | | | 17 | |
Net assets at end of period (000 omitted) | | | $13,888,395 | | | | $13,905,910 | | | | $10,568,573 | | | | $7,472,693 | | | | $5,272,157 | |
| |
| Class R1 | | Years ended 8/31 | |
| | | 2015 | | | 2014 | | | 2013 | | | 2012 | | | 2011 | |
Net asset value, beginning of period | | | $34.11 | | | | $29.32 | | | | $24.50 | | | | $21.48 | | | | $19.15 | |
| Income (loss) from investment operations | | | | | | | | | |
Net investment income (d) | | | $0.36 | | | | $0.43 | | | | $0.29 | | | | $0.25 | | | | $0.17 | |
Net realized and unrealized gain (loss)
on investments and foreign currency | | | (0.34 | ) | | | 5.33 | | | | 5.00 | | | | 3.01 | | | | 2.32 | |
Total from investment operations | | | $0.02 | | | | $5.76 | | | | $5.29 | | | | $3.26 | | | | $2.49 | |
| Less distributions declared to shareholders | | | | | | | | | |
From net investment income | | | $(0.42 | ) | | | $(0.39 | ) | | | $(0.28 | ) | | | $(0.24 | ) | | | $(0.16 | ) |
From net realized gain on investments | | | (0.92 | ) | | | (0.58 | ) | | | (0.19 | ) | | | — | | | | — | |
Total distributions declared to shareholders | | | $(1.34 | ) | | | $(0.97 | ) | | | $(0.47 | ) | | | $(0.24 | ) | | | $(0.16 | ) |
Net asset value, end of period (x) | | | $32.79 | | | | $34.11 | | | | $29.32 | | | | $24.50 | | | | $21.48 | |
Total return (%) (r)(s)(x) | | | (0.07 | ) | | | 19.88 | | | | 21.83 | | | | 15.29 | | | | 12.95 | |
Ratios (%) (to average net assets)
and Supplemental data: | | | | | |
Expenses before expense reductions (f) | | | 1.65 | | | | 1.65 | | | | 1.68 | | | | 1.69 | | | | 1.70 | |
Expenses after expense reductions (f) | | | 1.61 | | | | 1.63 | | | | 1.67 | | | | 1.68 | | | | 1.69 | |
Net investment income | | | 1.06 | | | | 1.33 | | | | 1.06 | | | | 1.10 | | | | 0.74 | |
Portfolio turnover | | | 12 | | | | 13 | | | | 12 | | | | 14 | | | | 17 | |
Net assets at end of period (000 omitted) | | | $27,860 | | | | $33,390 | | | | $33,485 | | | | $32,389 | | | | $33,806 | |
See Notes to Financial Statements
21
Financial Highlights – continued
| | | | | | | | | | | | | | | | | | | | |
| Class R2 | | Years ended 8/31 | |
| | | 2015 | | | 2014 | | | 2013 | | | 2012 | | | 2011 | |
Net asset value, beginning of period | | | $34.40 | | | | $29.56 | | | | $24.69 | | | | $21.66 | | | | $19.31 | |
| Income (loss) from investment operations | | | | | | | | | |
Net investment income (d) | | | $0.54 | | | | $0.60 | | | | $0.43 | | | | $0.37 | | | | $0.28 | |
Net realized and unrealized gain (loss)
on investments and foreign currency | | | (0.35 | ) | | | 5.36 | | | | 5.04 | | | | 3.01 | | | | 2.34 | |
Total from investment operations | | | $0.19 | | | | $5.96 | | | | $5.47 | | | | $3.38 | | | | $2.62 | |
| Less distributions declared to shareholders | | | | | | | | | |
From net investment income | | | $(0.59 | ) | | | $(0.54 | ) | | | $(0.41 | ) | | | $(0.35 | ) | | | $(0.27 | ) |
From net realized gain on investments | | | (0.92 | ) | | | (0.58 | ) | | | (0.19 | ) | | | — | | | | — | |
Total distributions declared to shareholders | | | $(1.51 | ) | | | $(1.12 | ) | | | $(0.60 | ) | | | $(0.35 | ) | | | $(0.27 | ) |
Net asset value, end of period (x) | | | $33.08 | | | | $34.40 | | | | $29.56 | | | | $24.69 | | | | $21.66 | |
Total return (%) (r)(s)(x) | | | 0.43 | | | | 20.48 | | | | 22.47 | | | | 15.80 | | | | 13.51 | |
Ratios (%) (to average net assets)
and Supplemental data: | | | | | |
Expenses before expense reductions (f) | | | 1.15 | | | | 1.15 | | | | 1.18 | | | | 1.20 | | | | 1.20 | |
Expenses after expense reductions (f) | | | 1.11 | | | | 1.13 | | | | 1.17 | | | | 1.18 | | | | 1.19 | |
Net investment income | | | 1.54 | | | | 1.84 | | | | 1.55 | | | | 1.61 | | | | 1.24 | |
Portfolio turnover | | | 12 | | | | 13 | | | | 12 | | | | 14 | | | | 17 | |
Net assets at end of period (000 omitted) | | | $521,592 | | | | $607,340 | | | | $572,590 | | | | $517,005 | | | | $496,236 | |
| |
| Class R3 | | Years ended 8/31 | |
| | | 2015 | | | 2014 | | | 2013 | | | 2012 | | | 2011 | |
Net asset value, beginning of period | | | $34.60 | | | | $29.73 | | | | $24.83 | | | | $21.78 | | | | $19.41 | |
| Income (loss) from investment operations | | | | | | | | | |
Net investment income (d) | | | $0.63 | | | | $0.69 | | | | $0.50 | | | | $0.43 | | | | $0.34 | |
Net realized and unrealized gain (loss)
on investments and foreign currency | | | (0.35 | ) | | | 5.39 | | | | 5.07 | | | | 3.03 | | | | 2.35 | |
Total from investment operations | | | $0.28 | | | | $6.08 | | | | $5.57 | | | | $3.46 | | | | $2.69 | |
| Less distributions declared to shareholders | | | | | | | | | |
From net investment income | | | $(0.68 | ) | | | $(0.63 | ) | | | $(0.48 | ) | | | $(0.41 | ) | | | $(0.32 | ) |
From net realized gain on investments | | | (0.92 | ) | | | (0.58 | ) | | | (0.19 | ) | | | — | | | | — | |
Total distributions declared to shareholders | | | $(1.60 | ) | | | $(1.21 | ) | | | $(0.67 | ) | | | $(0.41 | ) | | | $(0.32 | ) |
Net asset value, end of period (x) | | | $33.28 | | | | $34.60 | | | | $29.73 | | | | $24.83 | | | | $21.78 | |
Total return (%) (r)(s)(x) | | | 0.69 | | | | 20.77 | | | | 22.77 | | | | 16.11 | | | | 13.82 | |
Ratios (%) (to average net assets)
and Supplemental data: | | | | | |
Expenses before expense reductions (f) | | | 0.90 | | | | 0.90 | | | | 0.93 | | | | 0.95 | | | | 0.95 | |
Expenses after expense reductions (f) | | | 0.86 | | | | 0.87 | | | | 0.91 | | | | 0.93 | | | | 0.94 | |
Net investment income | | | 1.80 | | | | 2.11 | | | | 1.80 | | | | 1.86 | | | | 1.49 | |
Portfolio turnover | | | 12 | | | | 13 | | | | 12 | | | | 14 | | | | 17 | |
Net assets at end of period (000 omitted) | | | $1,571,281 | | | | $1,559,863 | | | | $1,299,126 | | | | $1,022,504 | | | | $763,670 | |
See Notes to Financial Statements
22
Financial Highlights – continued
| | | | | | | | | | | | | | | | | | | | |
| Class R4 | | Years ended 8/31 | |
| | | 2015 | | | 2014 | | | 2013 | | | 2012 | | | 2011 | |
Net asset value, beginning of period | | | $34.72 | | | | $29.82 | | | | $24.90 | | | | $21.84 | | | | $19.47 | |
| Income (loss) from investment operations | | | | | | | | | |
Net investment income (d) | | | $0.72 | | | | $0.77 | | | | $0.57 | | | | $0.49 | | | | $0.40 | |
Net realized and unrealized gain (loss)
on investments and foreign currency | | | (0.36 | ) | | | 5.42 | | | | 5.08 | | | | 3.04 | | | | 2.35 | |
Total from investment operations | | | $0.36 | | | | $6.19 | | | | $5.65 | | | | $3.53 | | | | $2.75 | |
| Less distributions declared to shareholders | | | | | | | | | |
From net investment income | | | $(0.76 | ) | | | $(0.71 | ) | | | $(0.54 | ) | | | $(0.47 | ) | | | $(0.38 | ) |
From net realized gain on investments | | | (0.92 | ) | | | (0.58 | ) | | | (0.19 | ) | | | — | | | | — | |
Total distributions declared to shareholders | | | $(1.68 | ) | | | $(1.29 | ) | | | $(0.73 | ) | | | $(0.47 | ) | | | $(0.38 | ) |
Net asset value, end of period (x) | | | $33.40 | | | | $34.72 | | | | $29.82 | | | | $24.90 | | | | $21.84 | |
Total return (%) (r)(s)(x) | | | 0.93 | | | | 21.11 | | | | 23.09 | | | | 16.40 | | | | 14.05 | |
Ratios (%) (to average net assets)
and Supplemental data: | | | | | |
Expenses before expense reductions (f) | | | 0.65 | | | | 0.65 | | | | 0.68 | | | | 0.70 | | | | 0.70 | |
Expenses after expense reductions (f) | | | 0.61 | | | | 0.63 | | | | 0.67 | | | | 0.68 | | | | 0.69 | |
Net investment income | | | 2.05 | | | | 2.34 | | | | 2.07 | | | | 2.10 | | | | 1.74 | |
Portfolio turnover | | | 12 | | | | 13 | | | | 12 | | | | 14 | | | | 17 | |
Net assets at end of period (000 omitted) | | | $2,787,041 | | | | $3,283,133 | | | | $2,892,340 | | | | $2,907,088 | | | | $2,036,438 | |
| |
| Class R5 (y) | | Years ended 8/31 | |
| | | 2015 | | | 2014 | | | 2013 | | | 2012 | | | 2011 | |
Net asset value, beginning of period | | | $34.72 | | | | $29.82 | | | | $24.90 | | | | $21.81 | | | | $19.44 | |
| Income (loss) from investment operations | | | | | | | | | |
Net investment income (d) | | | $0.76 | | | | $0.82 | | | | $0.60 | | | | $0.46 | | | | $0.37 | |
Net realized and unrealized gain (loss)
on investments and foreign currency | | | (0.36 | ) | | | 5.40 | | | | 5.07 | | | | 3.08 | | | | 2.35 | |
Total from investment operations | | | $0.40 | | | | $6.22 | | | | $5.67 | | | | $3.54 | | | | $2.72 | |
| Less distributions declared to shareholders | | | | | | | | | |
From net investment income | | | $(0.80 | ) | | | $(0.74 | ) | | | $(0.56 | ) | | | $(0.45 | ) | | | $(0.35 | ) |
From net realized gain on investments | | | (0.92 | ) | | | (0.58 | ) | | | (0.19 | ) | | | — | | | | — | |
Total distributions declared to shareholders | | | $(1.72 | ) | | | $(1.32 | ) | | | $(0.75 | ) | | | $(0.45 | ) | | | $(0.35 | ) |
Net asset value, end of period (x) | | | $33.40 | | | | $34.72 | | | | $29.82 | | | | $24.90 | | | | $21.81 | |
Total return (%) (r)(s)(x) | | | 1.04 | | | | 21.23 | | | | 23.18 | | | | 16.48 | | | | 13.96 | |
Ratios (%) (to average net assets)
and Supplemental data: | | | | | |
Expenses before expense reductions (f) | | | 0.54 | | | | 0.55 | | | | 0.57 | | | | 0.77 | | | | 0.80 | |
Expenses after expense reductions (f) | | | 0.50 | | | | 0.53 | | | | 0.56 | | | | 0.76 | | | | 0.79 | |
Net investment income | | | 2.17 | | | | 2.48 | | | | 2.12 | | | | 1.98 | | | | 1.63 | |
Portfolio turnover | | | 12 | | | | 13 | | | | 12 | | | | 14 | | | | 17 | |
Net assets at end of period (000 omitted) | | | $4,846,172 | | | | $3,995,830 | | | | $2,362,012 | | | | $940,695 | | | | $1,334,446 | |
See Notes to Financial Statements
23
Financial Highlights – continued
| | | | | | | | | | | | | | | | | | | | |
| Class 529A | | Years ended 8/31 | |
| | | 2015 | | | 2014 | | | 2013 | | | 2012 | | | 2011 | |
Net asset value, beginning of period | | | $34.48 | | | | $29.62 | | | | $24.74 | | | | $21.70 | | | | $19.34 | |
| Income (loss) from investment operations | | | | | | | | | |
Net investment income (d) | | | $0.63 | | | | $0.69 | | | | $0.49 | | | | $0.42 | | | | $0.32 | |
Net realized and unrealized gain (loss)
on investments and foreign currency | | | (0.36 | ) | | | 5.38 | | | | 5.05 | | | | 3.02 | | | | 2.34 | |
Total from investment operations | | | $0.27 | | | | $6.07 | | | | $5.54 | | | | $3.44 | | | | $2.66 | |
| Less distributions declared to shareholders | | | | | | | | | |
From net investment income | | | $(0.68 | ) | | | $(0.63 | ) | | | $(0.47 | ) | | | $(0.40 | ) | | | $(0.30 | ) |
From net realized gain on investments | | | (0.92 | ) | | | (0.58 | ) | | | (0.19 | ) | | | — | | | | — | |
Total distributions declared to shareholders | | | $(1.60 | ) | | | $(1.21 | ) | | | $(0.66 | ) | | | $(0.40 | ) | | | $(0.30 | ) |
Net asset value, end of period (x) | | | $33.15 | | | | $34.48 | | | | $29.62 | | | | $24.74 | | | | $21.70 | |
Total return (%) (r)(s)(t)(x) | | | 0.67 | | | | 20.84 | | | | 22.73 | | | | 16.06 | | | | 13.71 | |
Ratios (%) (to average net assets)
and Supplemental data: | | | | | |
Expenses before expense reductions (f) | | | 1.00 | | | | 1.00 | | | | 1.03 | | | | 1.05 | | | | 1.05 | |
Expenses after expense reductions (f) | | | 0.86 | | | | 0.87 | | | | 0.93 | | | | 0.98 | | | | 1.03 | |
Net investment income | | | 1.82 | | | | 2.11 | | | | 1.79 | | | | 1.80 | | | | 1.40 | |
Portfolio turnover | | | 12 | | | | 13 | | | | 12 | | | | 14 | | | | 17 | |
Net assets at end of period (000 omitted) | | | $16,543 | | | | $14,547 | | | | $10,899 | | | | $8,195 | | | | $6,315 | |
| |
| Class 529B | | Years ended 8/31 | |
| | | 2015 | | | 2014 | | | 2013 | | | 2012 | | | 2011 | |
Net asset value, beginning of period | | | $34.08 | | | | $29.29 | | | | $24.48 | | | | $21.45 | | | | $19.12 | |
| Income (loss) from investment operations | | | | | | | | | |
Net investment income (d) | | | $0.47 | | | | $0.42 | | | | $0.27 | | | | $0.24 | | | | $0.14 | |
Net realized and unrealized gain (loss)
on investments and foreign currency | | | (0.34 | ) | | | 5.32 | | | | 4.99 | | | | 3.01 | | | | 2.32 | |
Total from investment operations | | | $0.13 | | | | $5.74 | | | | $5.26 | | | | $3.25 | | | | $2.46 | |
| Less distributions declared to shareholders | | | | | | | | | |
From net investment income | | | $(0.51 | ) | | | $(0.37 | ) | | | $(0.26 | ) | | | $(0.22 | ) | | | $(0.13 | ) |
From net realized gain on investments | | | (0.92 | ) | | | (0.58 | ) | | | (0.19 | ) | | | — | | | | — | |
Total distributions declared to shareholders | | | $(1.43 | ) | | | $(0.95 | ) | | | $(0.45 | ) | | | $(0.22 | ) | | | $(0.13 | ) |
Net asset value, end of period (x) | | | $32.78 | | | | $34.08 | | | | $29.29 | | | | $24.48 | | | | $21.45 | |
Total return (%) (r)(s)(t)(x) | | | 0.27 | | | | 19.85 | | | | 21.74 | | | | 15.27 | | | | 12.84 | |
Ratios (%) (to average net assets)
and Supplemental data: | | | | | |
Expenses before expense reductions (f) | | | 1.37 | | | | 1.75 | | | | 1.78 | | | | 1.79 | | | | 1.80 | |
Expenses after expense reductions (f) | | | 1.27 | | | | 1.67 | | | | 1.71 | | | | 1.73 | | | | 1.78 | |
Net investment income | | | 1.38 | | | | 1.30 | | | | 1.00 | | | | 1.05 | | | | 0.64 | |
Portfolio turnover | | | 12 | | | | 13 | | | | 12 | | | | 14 | | | | 17 | |
Net assets at end of period (000 omitted) | | | $888 | | | | $1,026 | | | | $1,013 | | | | $963 | | | | $1,147 | |
See Notes to Financial Statements
24
Financial Highlights – continued
| | | | | | | | | | | | | | | | | | | | |
| Class 529C | | Years ended 8/31 | |
| | | 2015 | | | 2014 | | | 2013 | | | 2012 | | | 2011 | |
Net asset value, beginning of period | | | $34.00 | | | | $29.23 | | | | $24.43 | | | | $21.43 | | | | $19.11 | |
| Income (loss) from investment operations | | | | | | | | | |
Net investment income (d) | | | $0.35 | | | | $0.41 | | | | $0.27 | | | | $0.24 | | | | $0.15 | |
Net realized and unrealized gain (loss)
on investments and foreign currency | | | (0.36 | ) | | | 5.32 | | | | 4.99 | | | | 2.99 | | | | 2.31 | |
Total from investment operations | | | $(0.01 | ) | | | $5.73 | | | | $5.26 | | | | $3.23 | | | | $2.46 | |
| Less distributions declared to shareholders | | | | | | | | | |
From net investment income | | | $(0.41 | ) | | | $(0.38 | ) | | | $(0.27 | ) | | | $(0.23 | ) | | | $(0.14 | ) |
From net realized gain on investments | | | (0.92 | ) | | | (0.58 | ) | | | (0.19 | ) | | | — | | | | — | |
Total distributions declared to shareholders | | | $(1.33 | ) | | | $(0.96 | ) | | | $(0.46 | ) | | | $(0.23 | ) | | | $(0.14 | ) |
Net asset value, end of period (x) | | | $32.66 | | | | $34.00 | | | | $29.23 | | | | $24.43 | | | | $21.43 | |
Total return (%) (r)(s)(t)(x) | | | (0.14 | ) | | | 19.85 | | | | 21.80 | | | | 15.18 | | | | 12.82 | |
Ratios (%) (to average net assets)
and Supplemental data: | | | | | |
Expenses before expense reductions (f) | | | 1.75 | | | | 1.75 | | | | 1.78 | | | | 1.79 | | | | 1.80 | |
Expenses after expense reductions (f) | | | 1.66 | | | | 1.67 | | | | 1.72 | | | | 1.73 | | | | 1.78 | |
Net investment income | | | 1.03 | | | | 1.28 | | | | 1.00 | | | | 1.06 | | | | 0.65 | |
Portfolio turnover | | | 12 | | | | 13 | | | | 12 | | | | 14 | | | | 17 | |
Net assets at end of period (000 omitted) | | | $4,434 | | | | $3,981 | | | | $3,387 | | | | $2,610 | | | | $2,438 | |
| (d) | Per share data is based on average shares outstanding. |
| (f) | Ratios do not reflect reductions from fees paid indirectly, if applicable. |
| (r) | Certain expenses have been reduced without which performance would have been lower. |
| (s) | From time to time the fund may receive proceeds from litigation settlements, without which performance would be lower. |
| (t) | Total returns do not include any applicable sales charges. |
| (x) | The net asset values and total returns have been calculated on net assets which include adjustments made in accordance with U.S. generally accepted accounting principles required at period end for financial reporting purposes. |
| (y) | On May 10, 2012, sales of Class W shares (including exchanges) were suspended. On May 11, 2012, certain Class W shares were automatically converted to Class I shares. Shareholders of certain Class W shares became shareholders of Class I and received Class I shares with a total net asset value equal to their Class W shares at the time of the conversion. On May 30, 2012, remaining Class W shares, which represented MFS seed money, were redesignated Class R5. Class R5 shares do not pay a 12b-1 distribution fee or sub-accounting costs. On June 1, 2012, Class R5 shares were offered for sale to the public. |
See Notes to Financial Statements
25
NOTES TO FINANCIAL STATEMENTS
(1) Business and Organization
MFS Value Fund (the fund) is a diversified series of MFS Series Trust I (the trust). The trust is organized as a Massachusetts business trust and is registered under the Investment Company Act of 1940, as amended, as an open-end management investment company.
The fund is an investment company and accordingly follows the investment company accounting and reporting guidance of the Financial Accounting Standards Board (FASB) Accounting Standards Codification Topic 946 Financial Services – Investment Companies.
(2) Significant Accounting Policies
General – The preparation of financial statements in conformity with U.S. generally accepted accounting principles requires management to make estimates and assumptions that affect the reported amounts of assets and liabilities, and disclosure of contingent assets and liabilities at the date of the financial statements and the reported amounts of increases and decreases in net assets from operations during the reporting period. Actual results could differ from those estimates. In the preparation of these financial statements, management has evaluated subsequent events occurring after the date of the fund’s Statement of Assets and Liabilities through the date that the financial statements were issued.
In June 2014, FASB issued Accounting Standards Update 2014-11, Transfers and Servicing (Topic 860) – Repurchase-to-Maturity Transactions, Repurchase Financings, and Disclosures (“ASU 2014-11”). ASU 2014-11 changes the accounting for repurchase-to-maturity transactions (i.e., repurchase agreements that settle at the same time as the maturity of the transferred financial asset) and enhances the required disclosures for repurchase agreements and other similar transactions. Although still evaluating the potential impacts of ASU 2014-11 to the fund, management expects that the impact of the fund’s adoption will be limited to additional financial statement disclosures which would first be effective for interim reporting periods beginning after March 15, 2015.
Balance Sheet Offsetting – The fund’s accounting policy with respect to balance sheet offsetting is that, absent an event of default by the counterparty or a termination of the agreement, the International Swaps and Derivatives Association (ISDA) Master Agreement does not result in an offset of reported amounts of financial assets and financial liabilities in the Statement of Assets and Liabilities across transactions between the fund and the applicable counterparty. The fund’s right to setoff may be restricted or prohibited by the bankruptcy or insolvency laws of the particular jurisdiction to which a specific master netting agreement counterparty is subject. Balance sheet offsetting disclosures, to the extent applicable to the fund, have been included in the fund’s Significant Accounting Policies note under the captions for each of the fund’s in-scope financial instruments and transactions.
Investment Valuations – Equity securities, including restricted equity securities, are generally valued at the last sale or official closing price as provided by a third-party pricing service on the market or exchange on which they are primarily traded. Equity
26
Notes to Financial Statements – continued
securities, for which there were no sales reported that day, are generally valued at the last quoted daily bid quotation as provided by a third-party pricing service on the market or exchange on which such securities are primarily traded. Short-term instruments with a maturity at issuance of 60 days or less may be valued at amortized cost, which approximates market value. Open-end investment companies are generally valued at net asset value per share. Securities and other assets generally valued on the basis of information from a third-party pricing service may also be valued at a broker/dealer bid quotation. Values obtained from third-party pricing services can utilize both transaction data and market information such as yield, quality, coupon rate, maturity, type of issue, trading characteristics, and other market data. The values of foreign securities and other assets and liabilities expressed in foreign currencies are converted to U.S. dollars using the mean of bid and asked prices for rates provided by a third-party pricing service.
The Board of Trustees has delegated primary responsibility for determining or causing to be determined the value of the fund’s investments (including any fair valuation) to the adviser pursuant to valuation policies and procedures approved by the Board. If the adviser determines that reliable market quotations are not readily available, investments are valued at fair value as determined in good faith by the adviser in accordance with such procedures under the oversight of the Board of Trustees. Under the fund’s valuation policies and procedures, market quotations are not considered to be readily available for most types of debt instruments and floating rate loans and many types of derivatives. These investments are generally valued at fair value based on information from third-party pricing services. In addition, investments may be valued at fair value if the adviser determines that an investment’s value has been materially affected by events occurring after the close of the exchange or market on which the investment is principally traded (such as foreign exchange or market) and prior to the determination of the fund’s net asset value, or after the halting of trading of a specific security where trading does not resume prior to the close of the exchange or market on which the security is principally traded. Events that occur on a frequent basis after foreign markets close (such as developments in foreign markets and significant movements in the U.S. markets) and prior to the determination of the fund’s net asset value may be deemed to have a material effect on the value of securities traded in foreign markets. Accordingly, the fund’s foreign equity securities may often be valued at fair value. The adviser generally relies on third-party pricing services or other information (such as the correlation with price movements of similar securities in the same or other markets; the type, cost and investment characteristics of the security; the business and financial condition of the issuer; and trading and other market data) to assist in determining whether to fair value and at what value to fair value an investment. The value of an investment for purposes of calculating the fund’s net asset value can differ depending on the source and method used to determine value. When fair valuation is used, the value of an investment used to determine the fund’s net asset value may differ from quoted or published prices for the same investment. There can be no assurance that the fund could obtain the fair value assigned to an investment if it were to sell the investment at the same time at which the fund determines its net asset value per share.
Various inputs are used in determining the value of the fund’s assets or liabilities. These inputs are categorized into three broad levels. In certain cases, the inputs used to
27
Notes to Financial Statements – continued
measure fair value may fall into different levels of the fair value hierarchy. In such cases, an investment’s level within the fair value hierarchy is based on the lowest level of input that is significant to the fair value measurement. The fund’s assessment of the significance of a particular input to the fair value measurement in its entirety requires judgment, and considers factors specific to the investment. Level 1 includes unadjusted quoted prices in active markets for identical assets or liabilities. Level 2 includes other significant observable market-based inputs (including quoted prices for similar securities, interest rates, prepayment speed, and credit risk). Level 3 includes unobservable inputs, which may include the adviser’s own assumptions in determining the fair value of investments. The following is a summary of the levels used as of August 31, 2015 in valuing the fund’s assets or liabilities:
| | | | | | | | | | | | | | | | |
| Investments at Value | | Level 1 | | | Level 2 | | | Level 3 | | | Total | |
| Equity Securities: | | | | | | | | | | | | | | | | |
United States | | | $31,072,957,831 | | | | $— | | | | $— | | | | $31,072,957,831 | |
Switzerland | | | 757,430,376 | | | | — | | | | — | | | | 757,430,376 | |
United Kingdom | | | 429,826,121 | | | | 227,037,728 | | | | — | | | | 656,863,849 | |
France | | | 235,845,047 | | | | — | | | | — | | | | 235,845,047 | |
Canada | | | 168,952,134 | | | | — | | | | — | | | | 168,952,134 | |
| Mutual Funds | | | 437,841,714 | | | | — | | | | — | | | | 437,841,714 | |
| Total Investments | | | $33,102,853,223 | | | | $227,037,728 | | | | $— | | | | $33,329,890,951 | |
For further information regarding security characteristics, see the Portfolio of Investments.
Of the level 2 investments presented above, equity investments amounting to $227,037,728 would have been considered level 1 investments at the beginning of the period. The primary reason for changes in the classifications between levels 1 and 2 occurs when foreign equity securities are fair valued using other observable market-based inputs in place of the closing exchange price due to events occurring after the close of the exchange or market on which the investment is principally traded. The fund’s foreign equity securities may often be valued at fair value. The fund’s policy is to recognize transfers between the levels as of the end of the period.
Foreign Currency Translation – Purchases and sales of foreign investments, income, and expenses are converted into U.S. dollars based upon currency exchange rates prevailing on the respective dates of such transactions or on the reporting date for foreign denominated receivables and payables. Gains and losses attributable to foreign currency exchange rates on sales of securities are recorded for financial statement purposes as net realized gains and losses on investments. Gains and losses attributable to foreign exchange rate movements on receivables, payables, income and expenses are recorded for financial statement purposes as foreign currency transaction gains and losses. That portion of both realized and unrealized gains and losses on investments that results from fluctuations in foreign currency exchange rates is not separately disclosed.
Security Loans – Under its Securities Lending Agency Agreement with the fund, State Street Bank and Trust Company (“State Street”), as lending agent, loans the securities of the fund to certain qualified institutions (the “Borrowers”) approved by the fund. The loans are collateralized by cash and/or U.S. Treasury and federal agency obligations
28
Notes to Financial Statements – continued
in an amount typically at least equal to the market value of the securities loaned. On loans collateralized by cash, the cash collateral is invested in a money market fund. The market value of the loaned securities is determined at the close of business of the fund and any additional required collateral is delivered to the fund on the next business day. State Street provides the fund with indemnification against Borrower default. In the event of Borrower default, State Street will for the benefit of the fund either purchase securities identical to those loaned or, when such purchase is commercially impracticable, pay the fund the market value of the loaned securities. In return, State Street assumes the fund’s rights to the related collateral. If the collateral value is less than the cost to purchase identical securities, State Street is responsible for the shortfall, but only to the extent that such shortfall is not due to a decline in collateral value resulting from collateral reinvestment for which the fund bears the risk of loss. A portion of the income generated upon investment of the collateral is remitted to the Borrowers, and the remainder is allocated between the fund and the lending agent. On loans collateralized by U.S. Treasury and/or federal agency obligations, a fee is received from the Borrower, and is allocated between the fund and the lending agent. Income from securities lending is included in “Interest” income in the Statement of Operations. The dividend and interest income earned on the securities loaned is accounted for in the same manner as other dividend and interest income. At August 31, 2015, there were no securities on loan or collateral outstanding.
Indemnifications – Under the fund’s organizational documents, its officers and Trustees may be indemnified against certain liabilities and expenses arising out of the performance of their duties to the fund. Additionally, in the normal course of business, the fund enters into agreements with service providers that may contain indemnification clauses. The fund’s maximum exposure under these agreements is unknown as this would involve future claims that may be made against the fund that have not yet occurred.
Investment Transactions and Income – Investment transactions are recorded on the trade date. Interest income is recorded on the accrual basis. Dividends received in cash are recorded on the ex-dividend date. Certain dividends from foreign securities will be recorded when the fund is informed of the dividend if such information is obtained subsequent to the ex-dividend date. Dividend and interest payments received in additional securities are recorded on the ex-dividend or ex-interest date in an amount equal to the value of the security on such date.
The fund may receive proceeds from litigation settlements. Any proceeds received from litigation involving portfolio holdings are reflected in the Statement of Operations in realized gain/loss if the security has been disposed of by the fund or in unrealized gain/loss if the security is still held by the fund. Any other proceeds from litigation not related to portfolio holdings are reflected as other income in the Statement of Operations.
Fees Paid Indirectly – The fund’s custody fee may be reduced by a credit earned under an arrangement that measures the value of U.S. dollars deposited with the custodian by the fund. The amount of the credit, for the year ended August 31, 2015, is shown as a reduction of total expenses in the Statement of Operations.
29
Notes to Financial Statements – continued
Tax Matters and Distributions – The fund intends to qualify as a regulated investment company, as defined under Subchapter M of the Internal Revenue Code, and to distribute all of its taxable income, including realized capital gains. As a result, no provision for federal income tax is required. The fund’s federal tax returns, when filed, will remain subject to examination by the Internal Revenue Service for a three year period. Management has analyzed the fund’s tax positions taken on federal and state tax returns for all open tax years and does not believe that there are any uncertain tax positions that require recognition of a tax liability. Foreign taxes, if any, have been accrued by the fund in the accompanying financial statements in accordance with the applicable foreign tax law. Foreign income taxes may be withheld by certain countries in which the fund invests. Additionally, capital gains realized by the fund on securities issued in or by certain foreign countries may be subject to capital gains tax imposed by those countries.
Distributions to shareholders are recorded on the ex-dividend date. Income and capital gain distributions are determined in accordance with income tax regulations, which may differ from U.S. generally accepted accounting principles. Certain capital accounts in the financial statements are periodically adjusted for permanent differences in order to reflect their tax character. These adjustments have no impact on net assets or net asset value per share. Temporary differences which arise from recognizing certain items of income, expense, gain or loss in different periods for financial statement and tax purposes will reverse at some time in the future. Distributions in excess of net investment income or net realized gains are temporary overdistributions for financial statement purposes resulting from differences in the recognition or classification of income or distributions for financial statement and tax purposes.
Book/tax differences primarily relate to wash sale loss deferrals and treating a portion of the proceeds from redemptions as a distribution for tax purposes.
The tax character of distributions declared to shareholders for the last two fiscal years is as follows:
| | | | | | | | |
| | | 8/31/15 | | | 8/31/14 | |
Ordinary income (including any
short-term capital gains) | | | $807,010,806 | | | | $760,612,303 | |
| Long-term capital gains | | | 815,314,820 | | | | 406,331,212 | |
| Total distributions | | | $1,622,325,626 | | | | $1,166,943,515 | |
The federal tax cost and the tax basis components of distributable earnings were as follows:
| | | | |
| As of 8/31/15 | | | |
| Cost of investments | | | $23,951,862,178 | |
| Gross appreciation | | | 9,695,967,995 | |
| Gross depreciation | | | (317,939,222 | ) |
| Net unrealized appreciation (depreciation) | | | $9,378,028,773 | |
| Undistributed ordinary income | | | 152,645,901 | |
| Undistributed long-term capital gain | | | 958,533,749 | |
| Capital loss carryforwards | | | (8,552,090 | ) |
| Other temporary differences | | | (723,791 | ) |
30
Notes to Financial Statements – continued
Under the Regulated Investment Company Modernization Act of 2010 (the “Act”), net capital losses recognized for fund fiscal years beginning after August 31, 2011 may be carried forward indefinitely, and their character is retained as short-term and/or long-term losses (“post-enactment losses”). Previously, net capital losses were carried forward for eight years and treated as short-term losses (“pre-enactment losses”). As a transition rule, the Act requires that all post-enactment net capital losses be used before pre-enactment net capital losses.
As of August 31, 2015, the fund had capital loss carryforwards available to offset future realized gains. Such pre-enactment losses expire as follows:
The availability of $8,552,090 of the capital loss carryforwards, which were acquired on July 24, 2009 in connection with the MFS Strategic Value Fund merger, may be limited in a given year.
Multiple Classes of Shares of Beneficial Interest – The fund offers multiple classes of shares, which differ in their respective distribution, service, and program manager fees. The fund’s income, realized and unrealized gain (loss), and common expenses are allocated to shareholders based on the daily net assets of each class. Dividends are declared separately for each class. Differences in per share dividend rates are generally due to differences in separate class expenses. Class B and Class 529B shares will convert to Class A and Class 529A shares, respectively, approximately eight years after purchase. The fund’s distributions declared to shareholders as reported in the Statements of Changes in Net Assets are presented by class as follows:
| | | | | | | | | | | | | | | | |
| | | From net investment
income | | | From net realized gain on
investments | |
| | | Year
ended
8/31/15 | | | Year
ended
8/31/14 | | | Year
ended
8/31/15 | | | Year
ended
8/31/14 | |
| Class A | | | $176,815,412 | | | | $173,579,969 | | | | $239,583,600 | | | | $158,274,114 | |
| Class B | | | 2,033,302 | | | | 2,090,774 | | | | 4,634,261 | | | | 3,249,251 | |
| Class C | | | 16,712,982 | | | | 15,134,051 | | | | 36,311,961 | | | | 21,935,733 | |
| Class I | | | 310,550,735 | | | | 261,803,666 | | | | 373,030,365 | | | | 207,624,418 | |
| Class R1 | | | 386,051 | | | | 399,161 | | | | 860,444 | | | | 629,904 | |
| Class R2 | | | 9,756,021 | | | | 10,006,893 | | | | 15,646,860 | | | | 10,778,017 | |
| Class R3 | | | 31,583,229 | | | | 27,923,409 | | | | 42,200,616 | | | | 25,565,924 | |
| Class R4 | | | 68,323,476 | | | | 68,672,815 | | | | 85,489,253 | | | | 55,241,972 | |
| Class R5 | | | 99,810,687 | | | | 72,631,471 | | | | 107,673,294 | | | | 50,791,793 | |
| Class 529A | | | 312,863 | | | | 248,321 | | | | 402,549 | | | | 220,123 | |
| Class 529B | | | 14,702 | | | | 11,886 | | | | 27,726 | | | | 18,765 | |
| Class 529C | | | 53,051 | | | | 43,621 | | | | 112,186 | | | | 67,464 | |
| Total | | | $716,352,511 | | | | $632,546,037 | | | | $905,973,115 | | | | $534,397,478 | |
31
Notes to Financial Statements – continued
(3) Transactions with Affiliates
Investment Adviser – The fund has an investment advisory agreement with MFS to provide overall investment management and related administrative services and facilities to the fund. The management fee is computed daily and paid monthly at the following annual rates:
| | | | |
| First $7.5 billion of average daily net assets | | | 0.60 | % |
| Next $2.5 billion of average daily net assets | | | 0.53 | % |
| Average daily net assets in excess of $10 billion | | | 0.50 | % |
The investment adviser had agreed in writing to reduce its management fee to 0.45% of average daily net assets in excess of $20 billion up to $25 billion, 0.42% of average daily net assets in excess of $25 billion up to $30 billion, and 0.40% of average daily
net assets in excess of $30 billion. This written agreement was terminated on July 31, 2015. For the period September 1, 2014 through July 31, 2015 this management fee reduction amounted to $10,638,809, which is included in the reduction of total
expenses in the Statement of Operations. Effective August 1, 2015 the investment adviser has agreed in writing to reduce its management fee to 0.45% of average daily net assets in excess of $20 billion up to $25 billion, 0.42% of average daily net assets in excess of $25 billion up to $30 billion, 0.40% of average daily net assets in excess of $30 billion up to $35 billion, 0.38% of average daily net assets in excess of $35 billion up to $40 billion, and 0.36% of average daily nets assets in excess of $40 billion. This written agreement will continue until modified by the fund’s Board of Trustees, but such agreement will continue at least until December 31, 2016. For the period August 1, 2015 through August 31, 2015, this management fee reduction amounted to $968,127, which is included in the reduction of total expenses in the Statement of Operations. MFS has also agreed in writing to reduce its management fee by a specified amount if certain MFS mutual fund assets exceed thresholds agreed to by MFS and the fund’s Board of Trustees. For the year ended August 31, 2015, this management fee reduction amounted to $2,268,576, which is included in the reduction of total expenses in the Statement of Operations. The management fee incurred for the year ended August 31, 2015 was equivalent to an annual effective rate of 0.48% of the fund’s average daily net assets.
Distributor – MFS Fund Distributors, Inc. (MFD), a wholly-owned subsidiary of MFS, as distributor, received $2,809,058 and $10,248 for the year ended August 31, 2015, as its portion of the initial sales charge on sales of Class A and Class 529A shares of the fund, respectively.
The Board of Trustees has adopted a distribution plan for certain share classes pursuant to Rule 12b-1 of the Investment Company Act of 1940.
The fund’s distribution plan provides that the fund will pay MFD for services provided by MFD and financial intermediaries in connection with the distribution and servicing of certain share classes. One component of the plan is a distribution fee paid to MFD and another component of the plan is a service fee paid to MFD. MFD may subsequently pay all, or a portion, of the distribution and/or service fees to financial intermediaries.
32
Notes to Financial Statements – continued
Distribution Plan Fee Table:
| | | | | | | | | | | | | | | | | | | | |
| | | Distribution
Fee Rate (d) | | | Service
Fee Rate (d) | | | Total
Distribution
Plan (d) | | | Annual
Effective
Rate (e) | | | Distribution
and Service
Fee | |
| Class A | | | — | | | | 0.25% | | | | 0.25% | | | | 0.25% | | | | $22,963,275 | |
| Class B | | | 0.75% | | | | 0.25% | | | | 1.00% | | | | 1.00% | | | | 1,729,229 | |
| Class C | | | 0.75% | | | | 0.25% | | | | 1.00% | | | | 1.00% | | | | 13,945,812 | |
| Class R1 | | | 0.75% | | | | 0.25% | | | | 1.00% | | | | 1.00% | | | | 315,071 | |
| Class R2 | | | 0.25% | | | | 0.25% | | | | 0.50% | | | | 0.50% | | | | 2,871,030 | |
| Class R3 | | | — | | | | 0.25% | | | | 0.25% | | | | 0.25% | | | | 4,107,101 | |
| Class 529A | | | — | | | | 0.25% | | | | 0.25% | | | | 0.20% | | | | 40,830 | |
| Class 529B | | | 0.75% | | | | 0.25% | | | | 1.00% | | | | 0.61% | | | | 6,164 | |
| Class 529C | | | 0.75% | | | | 0.25% | | | | 1.00% | | | | 1.00% | | | | 44,563 | |
| Total Distribution and Service Fees | | | | $46,023,075 | |
| (d) | In accordance with the distribution plan for certain classes, the fund pays distribution and/or service fees equal to these annual percentage rates of each class’s average daily net assets. The distribution and service fee rates disclosed by class represent the current rates in effect at the end of the reporting period. Any rate changes, if applicable, are detailed below. |
| (e) | The annual effective rates represent actual fees incurred under the distribution plan for the year ended August 31, 2015 based on each class’s average daily net assets. MFD has voluntarily agreed to rebate a portion of each class’s 0.25% service fee attributable to accounts for which MFD retains the 0.25% service fee except for accounts attributable to MFS or its affiliates’ seed money. For the year ended August 31, 2015, this rebate amounted to $73,768, $750, $1,132, $936, $191, $8,478, $76, and $157 for Class A, Class B, Class C, Class R2, Class R3, Class 529A, Class 529B, and Class 529C, respectively, and is included in the reduction of total expenses in the Statement of Operations. For the period December 1, 2014 through May 31, 2015, the 0.75% distribution fee was not imposed for Class 529B shares. |
Certain Class A shares are subject to a contingent deferred sales charge (CDSC) in the event of a shareholder redemption within 18 months of purchase. Class C and Class 529C shares are subject to a CDSC in the event of a shareholder redemption within 12 months of purchase. Class B and Class 529B shares are subject to a CDSC in the event of a shareholder redemption within six years of purchase. All contingent deferred sales charges are paid to MFD and during the year ended August 31, 2015, were as follows:
| | | | |
| | | Amount | |
| Class A | | | $41,885 | |
| Class B | | | 178,951 | |
| Class C | | | 84,515 | |
| Class 529B | | | 170 | |
| Class 529C | | | 41 | |
The fund has entered into and may from time to time enter into contracts with program managers and other parties which administer the tuition programs through which an investment in the fund’s 529 share classes is made. The fund has entered into an agreement with MFD pursuant to which MFD receives an annual fee of up to 0.10% of the average daily net assets attributable to each 529 share class. MFD has agreed to waive a portion of this fee in an amount equal to 0.05% of the average daily
33
Notes to Financial Statements – continued
net assets for each 529 share class. This waiver agreement will expire on December 31, 2016, unless MFD elects to extend the waiver. For the year ended August 31, 2015, this waiver amounted to $10,891 and is included in the reduction of total expenses in the Statement of Operations. The program manager fee incurred for the year ended August 31, 2015 was equivalent to an annual effective rate of 0.05% of the average daily net assets attributable to each 529 share class. The services provided by MFD, or a third party with which MFD contracts, include recordkeeping and tax reporting and account services, as well as services designed to maintain the program’s compliance with the Internal Revenue Code and other regulatory requirements. Program manager fees and waivers for the year ended August 31, 2015, were as follows:
| | | | | | | | |
| | | Fee | | | Waiver | |
| Class 529A | | | $16,332 | | | | $8,166 | |
| Class 529B | | | 995 | | | | 497 | |
| Class 529C | | | 4,456 | | | | 2,228 | |
| Total Program Manager Fees and Waivers | | | $21,783 | | | | $10,891 | |
Shareholder Servicing Agent – MFS Service Center, Inc. (MFSC), a wholly-owned subsidiary of MFS, receives a fee from the fund for its services as shareholder servicing agent calculated as a percentage of the average daily net assets of the fund as determined periodically under the supervision of the fund’s Board of Trustees. For the year ended August 31, 2015, the fee was $1,628,648, which equated to 0.0046% annually of the fund’s average daily net assets. MFSC also receives payment from the fund for out-of-pocket expenses, sub-accounting and other shareholder servicing costs which may be paid to affiliated and unaffiliated service providers. Class R5 shares do not incur sub-accounting fees. For the year ended August 31, 2015, these out-of-pocket expenses, sub-accounting and other shareholder servicing costs amounted to $33,761,839.
Administrator – MFS provides certain financial, legal, shareholder communications, compliance, and other administrative services to the fund. Under an administrative services agreement, the fund reimburses MFS the costs incurred to provide these services. The fund is charged an annual fixed amount of $17,500 plus a fee based on average daily net assets. The administrative services fee incurred for the year ended August 31, 2015 was equivalent to an annual effective rate of 0.0018% of the fund’s average daily net assets.
Trustees’ and Officers’ Compensation – The fund pays compensation to independent Trustees in the form of a retainer, attendance fees, and additional compensation to Board and Committee chairpersons. The fund does not pay compensation directly to Trustees or officers of the fund who are also officers of the investment adviser, all of whom receive remuneration for their services to the fund from MFS. Certain officers and Trustees of the fund are officers or directors of MFS, MFD, and MFSC.
Prior to December 31, 2001, the fund had an unfunded defined benefit plan (“DB plan”) for independent Trustees. As of December 31, 2001, the Board took action to terminate the DB plan with respect to then-current and any future independent Trustees, such that the DB plan covers only certain of those former independent Trustees who retired on or before December 31, 2001. The DB plan resulted in a
34
Notes to Financial Statements – continued
pension expense of $373 and is included in “Independent Trustees’ compensation” in the Statement of Operations for the year ended August 31, 2015. The liability for deferred retirement benefits payable to certain independent Trustees under the DB plan amounted to $2,847 at August 31, 2015, and is included in “Payable for independent Trustees’ compensation” in the Statement of Assets and Liabilities.
Other – Effective November 1, 2014, this fund and certain other funds managed by MFS (the funds) have entered into a service agreement (the ISO Agreement) which provides for payment of fees solely by the funds to Tarantino LLC in return for the provision of services of an Independent Senior Officer (ISO) for the funds. Frank L. Tarantino serves as the ISO and is an officer of the funds and the sole member of Tarantino LLC. The funds can terminate the ISO Agreement with Tarantino LLC at any time under the terms of the ISO Agreement. Prior to November 1, 2014, the funds had entered into a service agreement (the Compliance Officer Agreement) which provided for payment of fees by the funds to Tarantino LLC in return for the provision of services of an Independent Chief Compliance Officer (ICCO) for the funds. Prior to November 1, 2014, Frank L. Tarantino served as the ICCO. Effective October 31, 2014, Mr. Tarantino resigned as ICCO and the Compliance Officer Agreement between the funds and Tarantino LLC was terminated. For the year ended August 31, 2015, the aggregate fees paid by the fund under these agreements were $130,902 and are included in “Miscellaneous” expense in the Statement of Operations. MFS had agreed to reimburse the fund for a portion of the payments made by the fund for the services under the Compliance Officer Agreement in the amount of $11,447, which is included in the reduction of total expenses in the Statement of Operations. Additionally, MFS has agreed to bear all expenses associated with office space, other administrative support, and supplies provided to the ICCO and ISO.
The fund invests in the MFS Institutional Money Market Portfolio which is managed by MFS and seeks current income consistent with preservation of capital and liquidity. Income earned on this investment is included in “Dividends from underlying affiliated funds” in the Statement of Operations. This money market fund does not pay a management fee to MFS.
On September 11, 2013, MFS redeemed 4,432 shares of Class R5 for an aggregate amount of $137,259.
(4) Portfolio Securities
For the year ended August 31, 2015, purchases and sales of investments, other than short-term obligations, aggregated $4,027,513,695 and $4,457,812,702, respectively.
35
Notes to Financial Statements – continued
(5) Shares of Beneficial Interest
The fund’s Declaration of Trust permits the Trustees to issue an unlimited number of full and fractional shares of beneficial interest. Transactions in fund shares were as follows:
| | | | | | | | | | | | | | | | |
| | | Year ended
8/31/15 | | | Year ended
8/31/14 | |
| | | Shares | | | Amount | | | Shares | | | Amount | |
| Shares sold | | | | | | | | | | | | | | | | |
Class A | | | 49,247,083 | | | | $1,720,304,533 | | | | 60,870,511 | | | | $1,998,346,176 | |
Class B | | | 474,210 | | | | 16,501,936 | | | | 554,113 | | | | 18,053,263 | |
Class C | | | 5,808,165 | | | | 200,501,020 | | | | 6,897,860 | | | | 223,711,170 | |
Class I | | | 108,642,298 | | | | 3,817,171,582 | | | | 109,423,187 | | | | 3,625,117,953 | |
Class R1 | | | 201,725 | | | | 6,961,964 | | | | 194,673 | | | | 6,295,259 | |
Class R2 | | | 2,984,429 | | | | 103,269,247 | | | | 3,053,945 | | | | 99,572,053 | |
Class R3 | | | 12,269,841 | | | | 427,977,506 | | | | 12,218,431 | | | | 399,503,879 | |
Class R4 | | | 16,837,981 | | | | 590,906,632 | | | | 23,035,381 | | | | 757,348,601 | |
Class R5 | | | 38,456,054 | | | | 1,339,033,730 | | | | 41,463,392 | | | | 1,361,664,476 | |
Class 529A | | | 92,705 | | | | 3,229,160 | | | | 80,831 | | | | 2,657,258 | |
Class 529B | | | 3,950 | | | | 136,210 | | | | 3,899 | | | | 125,823 | |
Class 529C | | | 38,535 | | | | 1,312,684 | | | | 22,400 | | | | 724,788 | |
| | | 235,056,976 | | | | $8,227,306,204 | | | | 257,818,623 | | | | $8,493,120,699 | |
| | | | |
| Shares issued to shareholders in reinvestment of distributions | | | | | | | | | | | | | | | | |
Class A | | | 11,020,501 | | | | $381,730,885 | | | | 9,415,560 | | | | $305,704,358 | |
Class B | | | 175,247 | | | | 6,042,490 | | | | 150,377 | | | | 4,855,668 | |
Class C | | | 1,024,530 | | | | 35,140,048 | | | | 740,995 | | | | 23,828,112 | |
Class I | | | 13,805,145 | | | | 480,639,440 | | | | 9,622,407 | | | | 314,091,576 | |
Class R1 | | | 36,589 | | | | 1,246,495 | | | | 32,246 | | | | 1,029,065 | |
Class R2 | | | 709,794 | | | | 24,369,239 | | | | 618,578 | | | | 19,902,257 | |
Class R3 | | | 2,136,330 | | | | 73,783,097 | | | | 1,651,963 | | | | 53,489,015 | |
Class R4 | | | 4,260,453 | | | | 147,555,149 | | | | 3,656,123 | | | | 118,701,122 | |
Class R5 | | | 5,502,107 | | | | 190,678,543 | | | | 3,668,044 | | | | 119,290,819 | |
Class 529A | | | 20,774 | | | | 715,051 | | | | 14,540 | | | | 468,444 | |
Class 529B | | | 1,245 | | | | 42,428 | | | | 961 | | | | 30,651 | |
Class 529C | | | 4,865 | | | | 165,237 | | | | 3,488 | | | | 111,072 | |
| | | 38,697,580 | | | | $1,342,108,102 | | | | 29,575,282 | | | | $961,502,159 | |
36
Notes to Financial Statements – continued
| | | | | | | | | | | | | | | | |
| | | Year ended
8/31/15 | | | Year ended
8/31/14 | |
| | | Shares | | | Amount | | | Shares | | | Amount | |
| Shares reacquired | | | | | | | | | | | | | | | | |
Class A | | | (78,558,228 | ) | | | $(2,744,481,700 | ) | | | (68,358,836 | ) | | | $(2,261,976,774 | ) |
Class B | | | (1,199,156 | ) | | | (41,789,184 | ) | | | (1,216,763 | ) | | | (39,918,338 | ) |
Class C | | | (5,967,557 | ) | | | (206,426,604 | ) | | | (4,992,374 | ) | | | (162,937,252 | ) |
Class I | | | (107,304,538 | ) | | | (3,788,807,965 | ) | | | (73,189,862 | ) | | | (2,414,804,530 | ) |
Class R1 | | | (367,516 | ) | | | (12,669,041 | ) | | | (390,185 | ) | | | (12,621,777 | ) |
Class R2 | | | (5,581,617 | ) | | | (193,853,004 | ) | | | (5,389,359 | ) | | | (175,451,679 | ) |
Class R3 | | | (12,271,908 | ) | | | (428,092,172 | ) | | | (12,493,293 | ) | | | (410,560,625 | ) |
Class R4 | | | (32,216,590 | ) | | | (1,123,785,299 | ) | | | (29,116,657 | ) | | | (960,068,960 | ) |
Class R5 | | | (13,949,102 | ) | | | (489,679,864 | ) | | | (9,245,299 | ) | | | (305,654,695 | ) |
Class 529A | | | (36,398 | ) | | | (1,265,083 | ) | | | (41,342 | ) | | | (1,358,958 | ) |
Class 529B | | | (8,208 | ) | | | (282,744 | ) | | | (9,354 | ) | | | (303,416 | ) |
Class 529C | | | (24,740 | ) | | | (849,568 | ) | | | (24,670 | ) | | | (797,250 | ) |
| | | (257,485,558 | ) | | | $(9,031,982,228 | ) | | | (204,467,994 | ) | | | $(6,746,454,254 | ) |
| | | | |
| Net change | | | | | | | | | | | | | | | | |
Class A | | | (18,290,644 | ) | | | $(642,446,282 | ) | | | 1,927,235 | | | | $42,073,760 | |
Class B | | | (549,699 | ) | | | (19,244,758 | ) | | | (512,273 | ) | | | (17,009,407 | ) |
Class C | | | 865,138 | | | | 29,214,464 | | | | 2,646,481 | | | | 84,602,030 | |
Class I | | | 15,142,905 | | | | 509,003,057 | | | | 45,855,732 | | | | 1,524,404,999 | |
Class R1 | | | (129,202 | ) | | | (4,460,582 | ) | | | (163,266 | ) | | | (5,297,453 | ) |
Class R2 | | | (1,887,394 | ) | | | (66,214,518 | ) | | | (1,716,836 | ) | | | (55,977,369 | ) |
Class R3 | | | 2,134,263 | | | | 73,668,431 | | | | 1,377,101 | | | | 42,432,269 | |
Class R4 | | | (11,118,156 | ) | | | (385,323,518 | ) | | | (2,425,153 | ) | | | (84,019,237 | ) |
Class R5 | | | 30,009,059 | | | | 1,040,032,409 | | | | 35,886,137 | | | | 1,175,300,600 | |
Class 529A | | | 77,081 | | | | 2,679,128 | | | | 54,029 | | | | 1,766,744 | |
Class 529B | | | (3,013 | ) | | | (104,106 | ) | | | (4,494 | ) | | | (146,942 | ) |
Class 529C | | | 18,660 | | | | 628,353 | | | | 1,218 | | | | 38,610 | |
| | | 16,268,998 | | | | $537,432,078 | | | | 82,925,911 | | | | $2,708,168,604 | |
The fund is one of several mutual funds in which certain MFS funds may invest. The MFS funds do not invest in the underlying funds for the purpose of exercising management or control. At the end of the period, the MFS Growth Allocation Fund and the MFS Moderate Allocation Fund were the owners of record of approximately 2% and 1%, respectively, of the value of outstanding voting shares of the fund. In addition, the MFS Aggressive Growth Allocation Fund, the MFS Conservative Allocation Fund, the MFS Lifetime Income Fund, the MFS Lifetime 2015 Fund, the MFS Lifetime 2020 Fund, the MFS Lifetime 2025 Fund, the MFS Lifetime 2030 Fund, the MFS Lifetime 2035 Fund, the MFS Lifetime 2040 Fund, the MFS Lifetime 2045 Fund, the MFS Lifetime 2050 Fund, the MFS Lifetime 2055 Fund, and the MFS Managed Wealth Fund were each the owners of record of less than 1% of the value of outstanding voting shares of the fund.
37
Notes to Financial Statements – continued
(6) Line of Credit
The fund and certain other funds managed by MFS participate in a $1.25 billion unsecured committed line of credit, subject to a $1 billion sublimit, provided by a syndication of banks under a credit agreement. Borrowings may be made for temporary financing needs. Interest is charged to each fund, based on its borrowings, generally at a rate equal to the higher of the Overnight Federal Reserve funds rate or daily one month LIBOR plus an agreed upon spread. A commitment fee, based on the average daily, unused portion of the committed line of credit, is allocated among the participating funds at the end of each calendar quarter. In addition, the fund and other funds managed by MFS have established unsecured uncommitted borrowing arrangements with certain banks for temporary financing needs. Interest is charged to each fund, based on its borrowings, at a rate equal to the Overnight Federal Reserve funds rate plus an agreed upon spread. For the year ended August 31, 2015, the fund’s commitment fee and interest expense were $118,441 and $0, respectively, and are included in “Miscellaneous” expense in the Statement of Operations.
(7) Transactions in Underlying Affiliated Funds-Affiliated Issuers
An affiliated issuer may be considered one in which the fund owns 5% or more of the outstanding voting securities, or a company which is under common control. For the purposes of this report, the fund assumes the following to be an affiliated issuer:
| | | | | | | | | | | | | | | | |
| Underlying Affiliated Fund | | Beginning
Shares/Par
Amount | | | Acquisitions
Shares/Par
Amount | | | Dispositions
Shares/Par
Amount | | | Ending
Shares/Par
Amount | |
MFS Institutional Money
Market Portfolio | | | 329,051,729 | | | | 4,012,068,488 | | | | (3,903,278,503 | ) | | | 437,841,714 | |
| | | | |
| Underlying Affiliated Fund | | Realized
Gain (Loss) | | | Capital Gain
Distributions | | | Dividend
Income | | | Ending
Value | |
MFS Institutional Money
Market Portfolio | | | $— | | | | $— | | | | $361,187 | | | | $437,841,714 | |
38
REPORT OF INDEPENDENT REGISTERED PUBLIC ACCOUNTING FIRM
To the Board of Trustees of MFS Series Trust I and Shareholders of MFS Value Fund:
We have audited the accompanying statement of assets and liabilities of MFS Value Fund (the Fund) (one of the series constituting MFS Series Trust I), including the portfolio of investments, as of August 31, 2015, and the related statement of operations for the year then ended, the statements of changes in net assets for each of the two years in the period then ended and the financial highlights for each of the five years in the period then ended. These financial statements and financial highlights are the responsibility of the Fund’s management. Our responsibility is to express an opinion on these financial statements and financial highlights based on our audits.
We conducted our audits in accordance with the standards of the Public Company Accounting Oversight Board (United States). Those standards require that we plan and perform the audit to obtain reasonable assurance about whether the financial statements and financial highlights are free of material misstatement. We were not engaged to perform an audit of the Fund’s internal control over financial reporting. Our audits included consideration of internal control over financial reporting as a basis for designing audit procedures that are appropriate in the circumstances, but not for the purpose of expressing an opinion on the effectiveness of the Fund’s internal control over financial reporting. Accordingly, we express no such opinion. An audit also includes examining, on a test basis, evidence supporting the amounts and disclosures in the financial statements and financial highlights, assessing the accounting principles used and significant estimates made by management, and evaluating the overall financial statement presentation. Our procedures included confirmation of securities owned as of August 31, 2015, by correspondence with the custodian and others or by other appropriate auditing procedures where replies from others were not received. We believe that our audits provide a reasonable basis for our opinion.
In our opinion, the financial statements and financial highlights referred to above present fairly, in all material respects, the financial position of MFS Value Fund (one of the series constituting MFS Series Trust I) at August 31, 2015, the results of its operations for the year then ended, the changes in its net assets for each of the two years in the period then ended and the financial highlights for each of the five years in the period then ended, in conformity with U.S. generally accepted accounting principles.

Boston, Massachusetts
October 15, 2015
39
TRUSTEES AND OFFICERS — IDENTIFICATION AND BACKGROUND
The Trustees and Officers of the Trust, as of October 1, 2015, are listed below, together with their principal occupations during the past five years. (Their titles may have varied during that period.) The address of each Trustee and Officer is 111 Huntington Avenue, Boston, Massachusetts 02199-7618.
| | | | | | | | |
Name, Age | | Position(s) Held with Fund | | Trustee/Officer
Since (h) | | Principal
Occupations During the Past Five Years | | Other Directorships (j) |
| INTERESTED TRUSTEES |
Robert J. Manning (k) (age 51) | | Trustee | | February 2004 | | Massachusetts Financial Services Company, Chairman, Co-Chief Executive Officer and Director; Chief Investment Officer (until 2010) | | N/A |
Robin A. Stelmach (k) (age 54) | | Trustee and President | | January 2014 | | Massachusetts Financial Services Company, Executive Vice President and Chief Operating Officer | | N/A |
| INDEPENDENT TRUSTEES | | | | | | |
David H. Gunning (age 73) | | Trustee and Chair of Trustees | | January 2004 | | Private investor | | Lincoln Electric Holdings, Inc., Director; Development Alternatives, Inc., Director/Non-Executive Chairman |
Steven E. Buller (age 64) | | Trustee | | February 2014 | | Chairman, Financial Accounting Standards Advisory Council; Standing Advisory Group, Public Company Accounting Oversight Board, Member (until 2014); BlackRock, Inc. (investment management), Managing Director (until 2014), BlackRock Finco UK (investment management), Director (until 2014) | | N/A |
Robert E. Butler (age 73) | | Trustee | | January 2006 | | Consultant – investment company industry regulatory and compliance matters | | N/A |
40
Trustees and Officers – continued
| | | | | | | | |
Name, Age | | Position(s) Held with Fund | | Trustee/Officer
Since (h) | | Principal
Occupations During the Past Five Years | | Other Directorships (j) |
Maureen R. Goldfarb (age 60) | | Trustee | | January 2009 | | Private investor | | N/A |
William R. Gutow (age 74) | | Trustee | | December 1993 | | Private investor and real estate consultant; Capitol Entertainment Management Company (video franchise), Vice Chairman | | Texas Donuts, Vice Chairman (until 2010) |
Michael Hegarty (age 70) | | Trustee | | December 2004 | | Private investor | | Rouse Properties Inc., Director; Capmark Financial Group Inc., Director |
John P. Kavanaugh (age 60) | | Trustee | | January 2009 | | Private investor | | N/A |
Maryanne L. Roepke (age 59) | | Trustee | | May 2014 | | American Century Investments (investment management), Senior Vice President and Chief Compliance Officer (until 2014) | | N/A |
Laurie J. Thomsen (age 58) | | Trustee | | March 2005 | | Private investor; New Profit, Inc. (venture philanthropy), Executive Partner (until 2010) | | The Travelers Companies, Director; Dycom Industries, Inc. |
Robert W. Uek (age 74) | | Trustee | | January 2006 | | Consultant to investment company industry | | N/A |
| OFFICERS | | | | | | |
Christopher R. Bohane (k) (age 41) | | Assistant Secretary and Assistant Clerk | | July 2005 | | Massachusetts Financial Services Company, Vice President and Assistant General Counsel | | N/A |
Kino Clark (k) (age 47) | | Assistant Treasurer | | January 2012 | | Massachusetts Financial Services Company, Vice President | | N/A |
Kristin V. Collins (k) (age 42) | | Assistant Secretary and Assistant Clerk | | September 2015 | | Massachusetts Financial Services Company, Vice President and Assistant General Counsel | | N/A |
41
Trustees and Officers – continued
| | | | | | | | |
Name, Age | | Position(s) Held with Fund | | Trustee/Officer
Since (h) | | Principal
Occupations During the Past Five Years | | Other Directorships (j) |
Thomas H. Connors (k) (age 56) | | Assistant Secretary and Assistant Clerk | | September 2012 | | Massachusetts Financial Services Company, Vice President and Senior Counsel; Deutsche Investment Management Americas Inc. (financial service provider), Director and Senior Counsel (until 2012) | | N/A |
Ethan D. Corey (k) (age 51) | | Assistant Secretary and Assistant Clerk | | July 2005 | | Massachusetts Financial Services Company, Senior Vice President and Associate General Counsel | | N/A |
David L. DiLorenzo (k) (age 47) | | Treasurer | | July 2005 | | Massachusetts Financial Services Company, Senior Vice President | | N/A |
Susan S. Newton (k) (age 65) | | Assistant Secretary and Assistant Clerk | | May 2005 | | Massachusetts Financial Services Company, Senior Vice President and Associate General Counsel | | N/A |
Kenneth Paek (k) (age 41) | | Assistant Treasurer | | February 2015 | | Massachusetts Financial Services Company, Vice President; Cohen & Steers, Vice President/Head of Fund Administration (until 2014) | | N/A |
Susan A. Pereira (k) (age 44) | | Assistant Secretary and Assistant Clerk | | July 2005 | | Massachusetts Financial Services Company, Vice President and Senior Counsel | | N/A |
Kasey L. Phillips (k) (age 44) | | Assistant Treasurer | | September 2012 | | Massachusetts Financial Services Company, Vice President; Wells Fargo Funds Management, LLC, Senior Vice President, Fund Treasurer (until 2012) | | N/A |
42
Trustees and Officers – continued
| | | | | | | | |
Name, Age | | Position(s) Held with Fund | | Trustee/Officer
Since (h) | | Principal
Occupations During the Past Five Years | | Other Directorships (j) |
Mark N. Polebaum (k) (age 63) | | Secretary and Clerk | | January 2006 | | Massachusetts Financial Services Company, Executive Vice President, General Counsel and Secretary | | N/A |
Matthew A. Stowe (k) (age 40) | | Assistant Secretary and Assistant Clerk | | October 2014 | | Massachusetts Financial Services Company, Vice President and Assistant General Counsel | | N/A |
Frank L. Tarantino (age 71) | | Independent Senior Officer | | June 2004 | | Tarantino LLC (provider of compliance services), Principal | | N/A |
Richard S. Weitzel (k) (age 45) | | Assistant Secretary and Assistant Clerk | | October 2007 | | Massachusetts Financial Services Company, Senior Vice President and Associate General Counsel | | N/A |
Martin J. Wolin (k) (age 48) | | Chief Compliance Officer | | July 2015 | | Massachusetts Financial Services Company, Senior Vice President and Chief Compliance Officer (since July 2015); Mercer (financial service provider), Chief Risk and Compliance Officer, North America and Latin America (until June 2015) | | N/A |
James O. Yost (k) (age 55) | | Deputy Treasurer | | September 1990 | | Massachusetts Financial Services Company, Senior Vice President | | N/A |
| (h) | Date first appointed to serve as Trustee/officer of an MFS Fund. Each Trustee has served continuously since appointment unless indicated otherwise. For the period from December 15, 2004 until February 22, 2005, Mr. Manning served as Advisory Trustee. Prior to January 2012, Messrs. DiLorenzo and Yost served as Assistant Treasurers of the Funds. Ms. Stelmach was appointed as President of the Funds as of October 1, 2014. |
| (j) | Directorships or trusteeships of companies required to report to the Securities and Exchange Commission (i.e., “public companies”). |
| (k) | “Interested person” of the Trust within the meaning of the Investment Company Act of 1940 (referred to as the 1940 Act), which is the principal federal law governing investment companies like the fund, as a result of a position with MFS. The address of MFS is 111 Huntington Avenue, Boston, Massachusetts 02199-7618. |
43
Trustees and Officers – continued
Each Trustee (except Ms. Stelmach, Mr. Buller and Ms. Roepke) has been elected by shareholders and each Trustee and officer holds office until his or her successor is chosen and qualified or until his or her earlier death, resignation, retirement or removal. The Trust does not hold annual meetings for the purpose of electing Trustees, and Trustees are not elected for fixed terms. Messrs. Butler, Kavanaugh, Uek and Mses. Thomsen and Roepke are members of the Trust’s Audit Committee.
Each of the Fund’s Trustees and officers holds comparable positions with certain other funds of which MFS or a subsidiary is the investment adviser or distributor, and, in the case of the officers, with certain affiliates of MFS. As of October 1, 2015, the Trustees served as board members of 138 funds within the MFS Family of Funds.
The Statement of Additional Information for a Fund includes further information about the Trustees and is available without charge upon request by calling 1-800-225-2606.
| | |
| Investment Adviser | | Custodian |
Massachusetts Financial Services Company
111 Huntington Avenue
Boston, MA 02199-7618 | | State Street Bank and Trust Company 1 Lincoln Street Boston, MA 02111-2900 |
| Distributor | | Independent Registered Public Accounting Firm |
MFS Fund Distributors, Inc.
111 Huntington Avenue
Boston, MA 02199-7618 | | Ernst & Young LLP 200 Clarendon Street Boston, MA 02116 |
| Portfolio Managers | | |
Nevin Chitkara Steven Gorham | | |
44
BOARD REVIEW OF INVESTMENT ADVISORY AGREEMENT
The Investment Company Act of 1940 requires that both the full Board of Trustees and a majority of the non-interested (“independent”) Trustees, voting separately, annually approve the continuation of the Fund’s investment advisory agreement with MFS. The Trustees consider matters bearing on the Fund and its advisory arrangements at their meetings throughout the year, including a review of performance data at each regular meeting. In addition, the independent Trustees met several times over the course of three months beginning in May and ending in July, 2015 (“contract review meetings”) for the specific purpose of considering whether to approve the continuation of the investment advisory agreement for the Fund and the other investment companies that the Board oversees (the “MFS Funds”). The independent Trustees were assisted in their evaluation of the Fund’s investment advisory agreement by independent legal counsel, from whom they received separate legal advice and with whom they met separately from MFS during various contract review meetings. The independent Trustees were also assisted in this process by the MFS Funds’ Independent Senior Officer, a senior officer appointed by and reporting to the independent Trustees.
In connection with their deliberations regarding the continuation of the investment advisory agreement, the Trustees, including the independent Trustees, considered such information and factors as they believed, in light of the legal advice furnished to them and their own business judgment, to be relevant. The investment advisory agreement for the Fund was considered separately, although the Trustees also took into account the common interests of all MFS Funds in their review. As described below, the Trustees considered the nature, quality, and extent of the various investment advisory, administrative, and shareholder services performed by MFS under the existing investment advisory agreement and other arrangements with the Fund.
In connection with their contract review meetings, the Trustees received and relied upon materials that included, among other items: (i) information provided by Lipper Inc., an independent third party, on the investment performance of the Fund for various time periods ended December 31, 2014 and the investment performance of a group of funds with substantially similar investment classifications/objectives (the “Lipper performance universe”), (ii) information provided by Lipper Inc. on the Fund’s advisory fees and other expenses and the advisory fees and other expenses of comparable funds identified by Lipper Inc. (the “Lipper expense group”), (iii) information provided by MFS on the advisory fees of comparable portfolios of other clients of MFS, including institutional separate accounts and other clients, (iv) information as to whether and to what extent applicable expense waivers, reimbursements or fee “breakpoints” are observed for the Fund, (v) information regarding MFS’ financial results and financial condition, including MFS’ and certain of its affiliates’ estimated profitability from services performed for the Fund and the MFS Funds as a whole, and compared to MFS’ institutional business, (vi) MFS’ views regarding the outlook for the mutual fund industry and the strategic business plans of MFS, (vii) descriptions of various functions performed by MFS for the Funds, such as compliance monitoring and portfolio trading practices, and (viii) information regarding the overall organization of MFS, including information about MFS’ senior management and other personnel providing investment advisory, administrative and other services to
45
Board Review of Investment Advisory Agreement – continued
the Fund and the other MFS Funds. The comparative performance, fee and expense information prepared and provided by Lipper Inc. was not independently verified and the independent Trustees did not independently verify any information provided to them by MFS.
The Trustees’ conclusion as to the continuation of the investment advisory agreement was based on a comprehensive consideration of all information provided to the Trustees and not the result of any single factor. Some of the factors that figured particularly in the Trustees’ deliberations are described below, although individual Trustees may have evaluated the information presented differently from one another, giving different weights to various factors. It is also important to recognize that the fee arrangements for the Fund and other MFS Funds are the result of years of review and discussion between the independent Trustees and MFS, that certain aspects of such arrangements may receive greater scrutiny in some years than in others, and that the Trustees’ conclusions may be based, in part, on their consideration of these same arrangements during the course of the year and in prior years.
Based on information provided by Lipper Inc. and MFS, the Trustees reviewed the Fund’s total return investment performance as well as the performance of peer groups of funds over various time periods. The Trustees placed particular emphasis on the total return performance of the Fund’s Class A shares in comparison to the performance of funds in its Lipper performance universe over the three-year period ended December 31, 2014, which the Trustees believed was a long enough period to reflect differing market conditions. The total return performance of the Fund’s Class A shares was in the 2nd quintile relative to the other funds in the universe for this three-year period (the 1st quintile being the best performers and the 5th quintile being the worst performers). The total return performance of the Fund’s Class A shares was in the 4th quintile for the one-year period and the 3rd quintile for the five-year period ended December 31, 2014 relative to the Lipper performance universe. Because of the passage of time, these performance results may differ from the performance results for more recent periods, including those shown elsewhere in this report.
In the course of their deliberations, the Trustees took into account information provided by MFS in connection with the contract review meetings, as well as during investment review meetings conducted with portfolio management personnel during the course of the year regarding the Fund’s performance. After reviewing these and related factors, the Trustees concluded, within the context of their overall conclusions regarding the investment advisory agreement, that they were satisfied with MFS’ responses and efforts relating to investment performance.
In assessing the reasonableness of the Fund’s advisory fee, the Trustees considered, among other information, the Fund’s advisory fee and the total expense ratio of the Fund’s Class A shares as a percentage of average daily net assets and the advisory fee and total expense ratios of peer groups of funds based on information provided by Lipper Inc. The Trustees considered that, according to the Lipper data (which takes into account any fee reductions or expense limitations that were in effect during the Fund’s last fiscal year), the Fund’s effective advisory fee rate was approximately at the Lipper expense group median and the Fund’s total expense ratio was lower than the Lipper expense group median.
46
Board Review of Investment Advisory Agreement – continued
The Trustees also considered the advisory fees charged by MFS to any institutional separate accounts advised by MFS (“separate accounts”) and unaffiliated investment companies for which MFS serves as subadviser (“subadvised funds”) that have comparable investment strategies to the Fund. In comparing these fees, the Trustees considered information provided by MFS as to the generally broader scope of services provided by MFS to the Fund, as well as the more extensive regulatory burdens imposed on MFS in managing the Fund, in comparison to separate accounts and subadvised funds. The Trustees also considered the higher demands placed on MFS’ investment personnel and trading infrastructure as a result of the daily cash in-flows and out-flows of the Fund in comparison to separate accounts.
The Trustees also considered whether the Fund may benefit from any economies of scale in the management of the Fund in the event of growth in assets of the Fund and/or growth in assets of the MFS Funds as a whole. They noted that the Fund’s advisory fee rate schedule is subject to contractual breakpoints that reduce the Fund’s advisory fee rate on average daily net assets over $7.5 billion and $10 billion, and that MFS has agreed in writing to further reduce its advisory fee rate on the Fund’s average daily net assets over $20 billion, $25 billion and $30 billion and implement additional breakpoints that reduce its advisory fee rate on the Fund’s average daily net assets over $35 billion and $40 billion, each of which may not be changed without the Trustees’ approval. The Trustees also noted that MFS has agreed in writing to waive a portion of the management fees of certain MFS Funds, including the Fund, if the total combined assets of certain funds within the MFS Funds’ complex increase above agreed upon thresholds (the “group fee waiver”), enabling the Fund’s shareholders to share in the benefits from any economies of scale at the complex level. The group fee waiver is reviewed and renewed annually between the Board and MFS. The Trustees concluded that the breakpoints and the group fee waiver were sufficient to allow the Fund to benefit from economies of scale as its assets and overall complex assets grow.
The Trustees also considered information prepared by MFS relating to MFS’ costs and profits with respect to the Fund, the MFS Funds considered as a group, and other investment companies and accounts advised by MFS, as well as MFS’ methodologies used to determine and allocate its costs to the MFS Funds, the Fund and other accounts and products for purposes of estimating profitability.
After reviewing these and other factors described herein, the Trustees concluded, within the context of their overall conclusions regarding the investment advisory agreement, that the advisory fees charged to the Fund represent reasonable compensation in light of the services being provided by MFS to the Fund.
In addition, the Trustees considered MFS’ resources and related efforts to continue to retain, attract and motivate capable personnel to serve the Fund. The Trustees also considered current and developing conditions in the financial services industry, including the presence of large and well-capitalized companies which are spending, and appear to be prepared to continue to spend, substantial sums to engage personnel and to provide services to competing investment companies. In this regard, the Trustees also considered the financial resources of MFS and its ultimate parent, Sun Life Financial Inc. The Trustees also considered the advantages and possible disadvantages to the Fund of having an adviser that also serves other investment companies as well as other accounts.
47
Board Review of Investment Advisory Agreement – continued
The Trustees also considered the nature, quality, cost, and extent of administrative, transfer agency, and distribution services provided to the Fund by MFS and its affiliates under agreements and plans other than the investment advisory agreement, including any 12b-1 fees the Fund pays to MFS Fund Distributors, Inc., an affiliate of MFS. The Trustees also considered the nature, extent and quality of certain other services MFS performs or arranges for on the Fund’s behalf, which may include securities lending programs, directed expense payment programs, class action recovery programs, and MFS’ interaction with third-party service providers, principally custodians and sub-custodians. The Trustees concluded that the various non-advisory services provided by MFS and its affiliates on behalf of the Fund were satisfactory.
The Trustees also considered benefits to MFS from the use of the Fund’s portfolio brokerage commissions, if applicable, to pay for investment research and various other factors. Additionally, the Trustees considered so-called “fall-out benefits” to MFS such as reputational value derived from serving as investment manager to the Fund.
Based on their evaluation of factors that they deemed to be material, including those factors described above, the Board of Trustees, including the independent Trustees, concluded that the Fund’s investment advisory agreement with MFS should be continued for an additional one-year period, commencing August 1, 2015.
48
PROXY VOTING POLICIES AND INFORMATION
MFS votes proxies on behalf of the fund pursuant to proxy voting policies and procedures that are available without charge, upon request, by calling 1-800-225-2606, by visiting the Proxy Voting section of mfs.com or by visiting the SEC’s Web site at http://www.sec.gov.
Information regarding how the fund voted proxies relating to portfolio securities during the most recent twelve-month period ended June 30 is available without charge by visiting the Proxy Voting section of mfs.com or by visiting the SEC’s Web site at http://www.sec.gov.
QUARTERLY PORTFOLIO DISCLOSURE
The fund will file a complete schedule of portfolio holdings with the Securities and Exchange Commission (the Commission) for the first and third quarters of each fiscal year on Form N-Q. A shareholder can obtain the quarterly portfolio holdings report at mfs.com. The fund’s Form N-Q is also available on the EDGAR database on the Commission’s Internet Web site at http://www.sec.gov, and may be reviewed and copied at the:
Public Reference Room
Securities and Exchange Commission
100 F Street, NE, Room 1580
Washington, D.C. 20549
Information on the operation of the Public Reference Room may be obtained by calling the Commission at 1-800-SEC-0330. Copies of the fund’s Form N-Q also may be obtained, upon payment of a duplicating fee, by electronic request at the following e-mail address: publicinfo@sec.gov or by writing the Public Reference Section at the above address.
FURTHER INFORMATION
From time to time, MFS may post important information about the fund or the MFS funds on the MFS web site (mfs.com). This information is available by visiting the “Market Commentary” and “Announcements” sub sections in the “Market Outlooks” section of mfs.com or by clicking on the fund’s name under “Mutual Funds” in the “Products” section of mfs.com.
FEDERAL TAX INFORMATION (unaudited)
The fund will notify shareholders of amounts for use in preparing 2015 income tax forms in January 2016. The following information is provided pursuant to provisions of the Internal Revenue Code.
The fund designates the maximum amount allowable as qualified dividend income eligible to be taxed at the same rate as long-term capital gain.
The fund designates $1,018,444,000 as capital gain dividends paid during the fiscal year.
For corporate shareholders, 98.57% of the ordinary income dividends paid during the fiscal year qualify for the corporate dividends received deduction.
49
rev. 3/11
| | | | |
| | | |
FACTS | | WHAT DOES MFS DO WITH YOUR PERSONAL INFORMATION? | |  |
| | |
| Why? | | Financial companies choose how they share your personal information. Federal law gives consumers the right to limit some but not all sharing. Federal law also requires us to tell you how we collect, share, and protect your personal information. Please read this notice carefully to understand what we do. |
| | |
| What? | | The types of personal information we collect and share depend on the product or service you have with us. This information can include: • Social Security number and account balances • Account transactions and transaction history • Checking account information and wire transfer instructions When you are no longer our customer, we continue to share your information as described in this notice. |
| | |
| How? | | All financial companies need to share customers’ personal information to run their everyday business. In the section below, we list the reasons financial companies can share their customers’ personal information; the reasons MFS chooses to share; and whether you can limit this sharing. |
| | | | |
Reasons we can share your
personal information | | Does MFS
share? | | Can you limit
this sharing? |
For our everyday business purposes – such as to process your transactions, maintain your account(s), respond to court orders and legal investigations, or report to credit bureaus | | Yes | | No |
For our marketing purposes – to offer our products and services to you | | No | | We don’t share |
| For joint marketing with other financial companies | | No | | We don’t share |
For our affiliates’ everyday business purposes – information about your transactions and experiences | | No | | We don’t share |
For our affiliates’ everyday business purposes – information about your creditworthiness | | No | | We don’t share |
| For nonaffiliates to market to you | | No | | We don’t share |
| | |
| Questions? | | Call 800-225-2606 or go to mfs.com. |
50
| | |
| Who we are |
| Who is providing this notice? | | MFS Funds, MFS Investment Management, MFS Institutional Advisors, Inc., MFS Fund Distributors, Inc., MFS Heritage Trust Company, and MFS Service Center, Inc. |
| | |
| What we do |
| How does MFS protect my personal information? | | To protect your personal information from unauthorized access and use, we use security measures that comply with federal law. These measures include procedural, electronic, and physical safeguards for the protection of the personal information we collect about you. |
| How does MFS collect my personal information? | | We collect your personal information, for example, when you • open an account or provide account information • direct us to buy securities or direct us to sell your securities • make a wire transfer We also collect your personal information from others, such as credit bureaus, affiliates and other companies. |
| Why can’t I limit all sharing? | | Federal law gives you the right to limit only • sharing for affiliates’ everyday business purposes – information about your creditworthiness • affiliates from using your information to market to you • sharing for nonaffiliates to market to you State laws and individual companies may give you additional rights to limit sharing. |
| | |
| Definitions |
| Affiliates | | Companies related by common ownership or control. They can be financial and nonfinancial companies. • MFS does not share personal information with affiliates, except for everyday business purposes as described on page one of this notice. |
| Nonaffiliates | | Companies not related by common ownership or control. They can be financial and nonfinancial companies. • MFS does not share with nonaffiliates so they can market to you. |
| Joint Marketing | | A formal agreement between nonaffiliated financial companies that together market financial products or services to you. • MFS doesn’t jointly market. |
| | |
| Other important information |
| If you own an MFS product or receive an MFS service in the name of a third party such as a bank or broker-dealer, their privacy policy may apply to you instead of ours. |
51
Save paper with eDelivery.

| MFS® will send you prospectuses, |
reports, and proxies directly via e-mail so you will get information faster with less mailbox clutter.
To sign up:
1. Go to mfs.com.
2. Log in via MFS® Access.
3. Select eDelivery.
If you own your MFS fund shares through a financial institution or a retirement plan, MFS® TALK, MFS® Access, or eDelivery may not be available to you.
CONTACT
WEB SITE
mfs.com
MFS TALK
1-800-637-8255
24 hours a day
ACCOUNT SERVICE AND LITERATURE
Shareholders
1-800-225-2606
Financial advisors
1-800-343-2829
Retirement plan services
1-800-637-1255
MAILING ADDRESS
MFS Service Center, Inc.
P.O. Box 55824
Boston, MA 02205-5824
OVERNIGHT MAIL
MFS Service Center, Inc.
c/o Boston Financial Data Services
30 Dan Road
Canton, MA 02021-2809
The Registrant has adopted a Code of Ethics pursuant to Section 406 of the Sarbanes-Oxley Act and as defined in Form N-CSR that applies to the Registrant’s principal executive officer and principal financial and accounting officer. During the period covered by this report, the Registrant has not amended any provision in its Code of Ethics (the “Code”) that relates to an element of the Code’s definitions enumerated in paragraph (b) of Item 2 of this Form N-CSR. During the period covered by this report, the Registrant did not grant a waiver, including an implicit waiver, from any provision of the Code.
A copy of the Code of Ethics is filed as an exhibit to this Form N-CSR.
| ITEM 3. | AUDIT COMMITTEE FINANCIAL EXPERT. |
Messrs. Robert E. Butler, John P. Kavanaugh and Robert W. Uek and Mses. Maryanne L. Roepke and Laurie J. Thomsen, members of the Audit Committee, have been determined by the Board of Trustees in their reasonable business judgment to meet the definition of “audit committee financial expert” as such term is defined in Form N-CSR. In addition, Messrs. Butler, Kavanaugh and Uek and Mses. Roepke and Thomsen are “independent” members of the Audit Committee (as such term has been defined by the Securities and Exchange Commission in regulations implementing Section 407 of the Sarbanes-Oxley Act of 2002). The Securities and Exchange Commission has stated that the designation of a person as an audit committee financial expert pursuant to this Item 3 on the Form N-CSR does not impose on such a person any duties, obligations or liability that are greater than the duties, obligations or liability imposed on such person as a member of the Audit Committee and the Board of Trustees in the absence of such designation or identification.
| ITEM 4. | PRINCIPAL ACCOUNTANT FEES AND SERVICES. |
Items 4(a) through 4(d) and 4(g):
The Board of Trustees has appointed Deloitte & Touche LLP (“Deloitte”) to serve as independent accountant to certain series of the Registrant and Ernst & Young LLP (“E&Y”) to serve in the same capacity to certain other series of the Registrant (each a “Fund” and collectively the “Funds”). The tables below set forth the audit fees billed to each Fund as well as fees for non-audit services provided to each Fund and/or to each Fund’s investment adviser, Massachusetts Financial Services Company (“MFS”), and to various entities either controlling, controlled by, or under common control with MFS that provide ongoing services to the Fund (“MFS Related Entities”).
For the fiscal years ended August 31, 2015 and 2014, audit fees billed to each Fund by Deloitte and E&Y were as follows:
| | | | | | | | |
| | | Audit Fees | |
| | | 2015 | | | 2014 | |
Fees Billed by Deloitte | | | | | | | | |
MFS Global Leaders Fund | | | 44,891 | | | | 44,154 | |
MFS Low Volatility Global Equity Fund | | | 44,531 | | | | 22,300 | |
MFS U.S. Government Cash Reserve Fund | | | 31,401 | | | | 30,889 | |
| | | | | | | | |
Total | | | 120,823 | | | | 97,343 | |
| |
| | | Audit Fees | |
| | | 2015 | | | 2014 | |
Fees Billed by E&Y | | | | | | | | |
MFS Core Equity Fund | | | 44,492 | | | | 43,762 | |
MFS Low Volatility Equity Fund | | | 29,212 | | | | 19,425 | |
MFS New Discovery Fund | | | 44,503 | | | | 43,772 | |
MFS Research International Fund | | | 47,430 | | | | 46,651 | |
MFS Technology Fund | | | 44,492 | | | | 43,762 | |
MFS Value Fund | | | 44,618 | | | | 43,886 | |
| | | | | | | | |
Total | | | 254,747 | | | | 241,258 | |
For the fiscal years ended August 31, 2015 and 2014, fees billed by Deloitte and E&Y for audit-related, tax and other services provided to each Fund and for audit-related, tax and other services provided to MFS and MFS Related Entities were as follows:
| | | | | | | | | | | | | | | | | | | | | | | | |
| | | Audit-Related Fees1 | | | Tax Fees2 | | | All Other Fees3 | |
| | 2015 | | | 2014 | | | 2015 | | | 2014 | | | 2015 | | | 2014 | |
Fees Billed by Deloitte | | | | | | | | | | | | | | | | | | | | | | | | |
To MFS Global Leaders Fund | | | 0 | | | | 0 | | | | 5,863 | | | | 5,765 | | | | 1,003 | | | | 1,001 | |
To MFS Low Volatility Global Equity Fund | | | 0 | | | | 0 | | | | 6,575 | | | | 6,465 | | | | 1,002 | | | | 1,000 | |
To MFS U.S. Government Cash Reserve Fund | | | 0 | | | | 0 | | | | 3,182 | | | | 3,129 | | | | 1,080 | | | | 1,053 | |
Total fees billed by Deloitte To above Funds | | | 0 | | | | 0 | | | | 15,620 | | | | 15,359 | | | | 3,085 | | | | 3,054 | |
| | | |
| | | Audit-Related Fees1 | | | Tax Fees2 | | | All Other Fees3 | |
| | 2015 | | | 2014 | | | 2015 | | | 2014 | | | 2015 | | | 2014 | |
Fees Billed by Deloitte | | | | | | | | | | | | | | | | | | | | | | | | |
To MFS and MFS Related Entities of MFS Global Leaders Fund* | | | 968,289 | | | | 1,767,138 | | | | 0 | | | | 0 | | | | 5,000 | | | | 0 | |
To MFS and MFS Related Entities of MFS Low Volatility Global Equity Fund* | | | 968,289 | | | | 1,767,138 | | | | 0 | | | | 0 | | | | 5,000 | | | | 0 | |
To MFS and MFS Related Entities of MFS U.S. Government Cash Reserve Fund* | | | 968,289 | | | | 1,767,138 | | | | 0 | | | | 0 | | | | 5,000 | | | | 0 | |
| | | | | | | | |
| | | Aggregate Fees for Non-audit
Services | |
| | 2015 | | | 2014 | |
Fees Billed by Deloitte | | | | | | | | |
To MFS Global Leaders Fund, MFS and MFS Related Entities# | | | 980,155 | | | | 1,777,242 | |
To MFS Low Volatility Global Equity Fund, MFS and MFS Related Entities# | | | 980,866 | | | | 1,777,941 | |
To MFS U.S. Government Cash Reserve Fund, MFS and MFS Related Entities# | | | 977,551 | | | | 1,774,658 | |
| | | | | | | | | | | | | | | | | | | | | | | | |
| | | Audit-Related Fees1 | | | Tax Fees2 | | | All Other Fees4 | |
| | 2015 | | | 2014 | | | 2015 | | | 2014 | | | 2015 | | | 2014 | |
Fees Billed by E&Y | | | | | | | | | | | | | | | | | | | | | | | | |
To MFS Core Equity Fund | | | 0 | | | | 0 | | | | 8,564 | | | | 8,413 | | | | 568 | | | | 0 | |
To MFS Low Volatility Equity Fund | | | 0 | | | | 0 | | | | 8,212 | | | | 8,079 | | | | 568 | | | | 0 | |
To MFS New Discovery Fund | | | 0 | | | | 0 | | | | 8,564 | | | | 8,413 | | | | 568 | | | | 0 | |
To MFS Research International Fund | | | 0 | | | | 0 | | | | 9,003 | | | | 8,844 | | | | 568 | | | | 0 | |
To MFS Technology Fund | | | 0 | | | | 0 | | | | 8,564 | | | | 8,413 | | | | 568 | | | | 0 | |
To MFS Value Fund | | | 0 | | | | 0 | | | | 8,564 | | | | 8,413 | | | | 568 | | | | 0 | |
Total fees billed by E&Y To above Funds | | | 0 | | | | 0 | | | | 51,471 | | | | 50,575 | | | | 3,408 | | | | 0 | |
| | | |
| | | Audit-Related Fees1 | | | Tax Fees2 | | | All Other Fees4 | |
| | 2015 | | | 2014 | | | 2015 | | | 2014 | | | 2015 | | | 2014 | |
Fees Billed by E&Y | | | | | | | | | | | | | | | | | | | | | | | | |
To MFS and MFS Related Entities of MFS Core Equity Fund* | | | 825,954 | | | | 0 | | | | 0 | | | | 0 | | | | 0 | | | | 0 | |
To MFS and MFS Related Entities of Low Volatility Equity Fund* | | | 825,954 | | | | 0 | | | | 0 | | | | 0 | | | | 0 | | | | 0 | |
To MFS and MFS Related Entities of MFS New Discovery Fund* | | | 825,954 | | | | 0 | | | | 0 | | | | 0 | | | | 0 | | | | 0 | |
To MFS and MFS Related Entities of MFS Research International Fund* | | | 825,954 | | | | 0 | | | | 0 | | | | 0 | | | | 0 | | | | 0 | |
To MFS and MFS Related Entities of MFS Technology Fund* | | | 825,954 | | | | 0 | | | | 0 | | | | 0 | | | | 0 | | | | 0 | |
To MFS and MFS Related Entities of MFS Value Fund* | | | 825,954 | | | | 0 | | | | 0 | | | | 0 | | | | 0 | | | | 0 | |
| | | | | | | | |
| | | Aggregate Fees for Non-audit
Services | |
| | 2015 | | | 2014 | |
Fees Billed by E&Y | | | | | | | | |
To MFS Core Equity Fund, MFS and MFS Related Entities# | | | 1,011,086 | | | | 53,413 | |
To Low Volatility Equity Fund, MFS and MFS Related Entities# | | | 1,010,734 | | | | 53,079 | |
To MFS New Discovery Fund, MFS and MFS Related Entities# | | | 1,011,086 | | | | 53,413 | |
To MFS Research International Fund, MFS and MFS Related Entities# | | | 1,011,525 | | | | 53,844 | |
To MFS Technology Fund, MFS and MFS Related Entities# | | | 1,011,086 | | | | 53,413 | |
To MFS Value Fund, MFS and MFS Related Entities# | | | 1,011,086 | | | | 53,413 | |
| * | This amount reflects the fees billed to MFS and MFS Related Entities for non-audit services relating directly to the operations and financial reporting of the Funds (portions of which services also related to the operations and financial reporting of other funds within the MFS Funds complex). |
| # | This amount reflects the aggregate fees billed by Deloitte or E&Y for non-audit services rendered to the Funds and for non-audit services rendered to MFS and the MFS Related Entities. |
| 1 | The fees included under “Audit-Related Fees” are fees related to assurance and related services that are reasonably related to the performance of the audit or review of financial statements, but not reported under ‘‘Audit Fees,’’ including accounting consultations, agreed-upon procedure reports, attestation reports, comfort letters and internal control reviews. |
| 2 | The fees included under “Tax Fees” are fees associated with tax compliance, tax advice and tax planning, including services relating to the filing or amendment of federal, state or local income tax returns, regulated investment company qualification reviews and tax distribution and analysis. |
| 3 | The fees included under “All Other Fees” are fees for products and services provided by Deloitte other than those reported under “Audit Fees,” “Audit-Related Fees” and “Tax Fees,” including fees for services related to review of internal controls and Rule 38a-1 compliance program. |
| 4 | The fees included under “All Other Fees” are fees for products and services provided by E&Y other than those reported under “Audit Fees,” “Audit-Related Fees” and “Tax Fees,” including fees for services related to review of internal controls and Rule 38a-1 compliance program. |
Item 4(e)(1):
Set forth below are the policies and procedures established by the Audit Committee of the Board of Trustees relating to the pre-approval of audit and non-audit related services:
To the extent required by applicable law, pre-approval by the Audit Committee of the Board is needed for all audit and permissible non-audit services rendered to the Funds and all permissible non-audit services rendered to MFS or MFS Related Entities if the services relate directly to the operations and financial reporting of the Registrant. Pre-approval is currently on an engagement-by-engagement basis. In the event pre-approval of such services is necessary between regular meetings of the Audit Committee and it is not practical to wait to seek pre-approval at the next regular meeting of the Audit Committee, pre-approval of such services may be referred to the Chair of the Audit Committee for approval; provided that the Chair may not pre-approve any individual engagement for such services exceeding $50,000 or multiple engagements for such services in the aggregate exceeding $100,000 in each period between regular meetings of the Audit Committee. Any engagement pre-approved by the Chair between regular meetings of the Audit Committee shall be presented for ratification by the entire Audit Committee at its next regularly scheduled meeting.
Item 4(e)(2):
None, or 0%, of the services relating to the Audit-Related Fees, Tax Fees and All Other Fees paid by the Fund and MFS and MFS Related Entities relating directly to the operations and financial reporting of the Registrant disclosed above were approved by the audit committee pursuant to paragraphs (c)(7)(i)(C) of Rule 2-01 of Regulation S-X (which permits audit committee approval after the start of the engagement with respect to services other than audit, review or attest services, if certain conditions are satisfied).
Item 4(f): Not applicable.
Item 4(h): The Registrant’s Audit Committee has considered whether the provision by a Registrant’s independent registered public accounting firm of non-audit services to MFS and MFS Related Entities that were not pre-approved by the Committee (because such services did not relate directly to the operations and financial reporting of the Registrant) was compatible with maintaining the independence of the independent registered public accounting firm as the Registrant’s principal auditors.
| ITEM 5. | AUDIT COMMITTEE OF LISTED REGISTRANTS. |
Not applicable to the Registrant.
A schedule of investments of the Registrant is included as part of the report to shareholders of such series under Item 1 of this Form N-CSR.
| ITEM 7. | DISCLOSURE OF PROXY VOTING POLICIES AND PROCEDURES FOR CLOSED-END MANAGEMENT INVESTMENT COMPANIES. |
Not applicable to the Registrant.
| ITEM 8. | PORTFOLIO MANAGERS OF CLOSED-END MANAGEMENT INVESTMENT COMPANIES. |
Not applicable to the Registrant.
| ITEM 9. | PURCHASES OF EQUITY SECURITIES BY CLOSED-END MANAGEMENT INVESTMENT COMPANY AND AFFILIATED PURCHASERS. |
Not applicable to the Registrant.
| ITEM 10. | SUBMISSION OF MATTERS TO A VOTE OF SECURITY HOLDERS. |
There were no material changes to the procedures by which shareholders may send recommendations to the Board for nominees to the Registrant’s Board since the Registrant last provided disclosure as to such procedures in response to the requirements of Item 407 (c)(2)(iv) of Regulation S-K or this Item.
| ITEM 11. | CONTROLS AND PROCEDURES. |
| (a) | Based upon their evaluation of the effectiveness of the registrant’s disclosure controls and procedures (as defined in Rule 30a-3(c) under the Investment Company Act of 1940 (the “Act”)) as conducted within 90 days of the filing date of this report on Form N-CSR, the registrant’s principal financial officer and principal executive officer have concluded that those disclosure controls and procedures provide reasonable assurance that the material information required to be disclosed by the registrant on this report is recorded, processed, summarized and reported within the time periods specified in the Securities and Exchange Commission’s rules and forms. |
| (b) | There were no changes in the registrant’s internal controls over financial reporting (as defined in Rule 30a-3(d) under the Act) that occurred during the second fiscal quarter of the period covered by the report that have materially affected, or are reasonably likely to materially affect, the registrant’s internal control over financial reporting. |
| (a) | File the exhibits listed below as part of this form. Letter or number the exhibits in the sequence indicated. |
| | (1) | Any code of ethics, or amendment thereto, that is the subject of the disclosure required by Item 2, to the extent that the registrant intends to satisfy the Item 2 requirements through filing of an exhibit: Code of Ethics attached hereto. |
| | (2) | A separate certification for each principal executive officer and principal financial officer of the registrant as required by Rule 30a-2 under the Act (17 CFR 270.30a-2): Attached hereto. |
| (b) | If the report is filed under Section 13(a) or 15(d) of the Exchange Act, provide the certifications required by Rule 30a-2(b) under the Act (17 CFR 270.30a-2(b)), Rule 13a-14(b) or Rule 15d-14(b) under the Exchange Act (17 CFR 240.13a-14(b) or 240.15d-14(b)) and Section 1350 of Chapter 63 of Title 18 of the United States Code (18 U.S.C. 1350) as an exhibit. A certification furnished pursuant to this paragraph will not be deemed “filed” for the purposes of Section 18 of the Exchange Act (15 U.S.C. 78r), or otherwise subject to the liability of that section. Such certification will not be deemed to be incorporated by reference into any filing under the Securities Act of 1933 or the Exchange Act, except to the extent that the registrant specifically incorporates it by reference: Attached hereto. |
Notice
A copy of the Amended and Restated Declaration of Trust, as amended, of the Registrant is on file with the Secretary of State of The Commonwealth of Massachusetts and notice is hereby given that this instrument is executed on behalf of the Registrant by an officer of the Registrant as an officer and not individually and the obligations of or arising out of this instrument are not binding upon any of the Trustees or shareholders individually, but are binding only upon the assets and property of the respective constituent series of the Registrant.
SIGNATURES
Pursuant to the requirements of the Securities Exchange Act of 1934 and the Investment Company Act of 1940, the registrant has duly caused this report to be signed on its behalf by the undersigned, thereunto duly authorized.
(Registrant) MFS SERIES TRUST I
| | |
| By (Signature and Title)* | | ROBIN A. STELMACH |
| | Robin A. Stelmach, President |
Date: October 15, 2015
Pursuant to the requirements of the Securities Exchange Act of 1934 and the Investment Company Act of 1940, this report has been signed below by the following persons on behalf of the registrant and in the capacities and on the dates indicated.
| | |
| By (Signature and Title)* | | ROBIN A. STELMACH |
| | Robin A. Stelmach, President (Principal Executive Officer) |
Date: October 15, 2015
| | |
| By (Signature and Title)* | | DAVID L. DILORENZO |
| | David L. DiLorenzo, Treasurer (Principal Financial Officer and Accounting Officer) |
Date: October 15, 2015
| * | Print name and title of each signing officer under his or her signature. |