UNITED STATES
SECURITIES AND EXCHANGE COMMISSION
Washington, D.C. 20549
FORM N-CSR
CERTIFIED SHAREHOLDER REPORT OF
REGISTERED MANAGEMENT INVESTMENT COMPANIES
Investment Company Act file number 811-4777
MFS SERIES TRUST I
(Exact name of registrant as specified in charter)
111 Huntington Avenue, Boston, Massachusetts 02199
(Address of principal executive offices) (Zip code)
Susan S. Newton
Massachusetts Financial Services Company
111 Huntington Avenue
Boston, Massachusetts 02199
(Name and address of agents for service)
Registrant’s telephone number, including area code: (617) 954-5000
Date of fiscal year end: August 31
Date of reporting period: August 31, 2013*
| * | MFS Low Volatility Equity Fund and MFS Low Volatility Global Equity Fund, each a series of the Registrant, did not commence investment operations during the reporting period. |
| ITEM 1. | REPORTS TO STOCKHOLDERS. |
MFS Low Volatility Equity Fund and MFS Low Volatility Global Equity Fund, each a series of the Registrant, did not have any shareholders as of period end. For further information please see the introductory footnote.
ANNUAL REPORT
August 31, 2013

MFS® CASH RESERVE FUND

LMM-ANN
MFS® CASH RESERVE FUND
CONTENTS
The report is prepared for the general information of shareholders.
It is authorized for distribution to prospective investors only when preceded or accompanied by a current prospectus.
NOT FDIC INSURED Ÿ MAY LOSE VALUE Ÿ NO BANK GUARANTEE

LETTER FROM THE CHAIRMAN AND CEO
Dear Shareholders:
Global economic trends appear to favor growth again despite risks created by the U.S. government’s gridlock. The U.S. economy’s slow but steady expansion is no longer the
exception. The eurozone has emerged from its 18-month-long recession, with Germany leading the way. China’s monthly gauges of economic activity once again point toward expansion. And Japan is picking up momentum in response to its government’s and central bank’s aggressive program of monetary easing.
However, geopolitical risks have risen, with violence erupting in Egypt and Syria and the possibility of further unrest in the Middle East. The U.S. Federal Reserve’s expected tapering of its bond-buying stimulus program has weighed on global markets
since May. Emerging markets, including Brazil and India, have borne much of the brunt, as their currency values have dropped and nervous investors have fled to safety elsewhere. In Europe, unemployment persists at historically high levels. The trend towards a pickup in global growth, while encouraging, appears tenuous, particularly with the risk of a U.S. debt default.
As always, managing risk in the face of uncertainty remains a top priority for investors. At MFS®, our uniquely collaborative investment process employs integrated, global research and active risk management. Our global team of investment professionals shares ideas and evaluates opportunities across continents, investment disciplines and asset classes — all with a goal of building better insights, and ultimately better results, for our clients.
We are mindful of the many economic challenges investors face, and believe it is more important than ever to maintain a long-term view and employ time-tested principles, such as asset allocation and diversification. We remain confident that our unique approach can serve investors well as they work with their financial advisors to identify and pursue the most suitable opportunities.
Respectfully,

Robert J. Manning
Chairman and Chief Executive Officer
MFS Investment Management®
October 17, 2013
The opinions expressed in this letter are subject to change, may not be relied upon for investment advice, and no forecasts can be guaranteed.
1
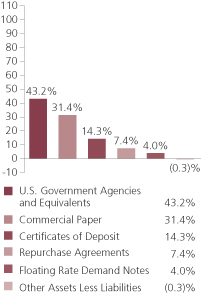
PORTFOLIO COMPOSITION
Portfolio structure (u)
| | | | |
| Composition including fixed income credit quality (a)(u) | |
| A-1+ | | | 28.1% | |
| A-1 | | | 64.7% | |
| A-2 | | | 7.5% | |
| Not Rated | | | 0.0% | |
| Cash & Other | | | (0.3)% | |
| | | | |
| Maturity breakdown (u) | |
| 0 - 7 days | | | 26.2% | |
| 8 - 29 days | | | 16.8% | |
| 30 - 59 days | | | 26.8% | |
| 60 - 89 days | | | 13.9% | |
| 90 - 365 days | | | 16.6% | |
| Other Assets Less Liabilities | | | (0.3)% | |
| (a) | Ratings are assigned to portfolio securities utilizing ratings from Moody’s, Fitch, and Standard & Poor’s rating agencies and applying the following hierarchy: If all three agencies provide a rating, the middle rating (after dropping the highest and lowest ratings) is assigned; if two of the three agencies rate a security, the lower of the two is assigned. Cash & Other portfolio assets that are not securities are not included in the categories mentioned above. Ratings are shown in the S&P scale. All ratings are subject to change. The fund is not rated by these agencies. |
| (u) | For purposes of this presentation, accrued interest, where applicable, is included. |
From time to time “Other Assets Less Liabilities” may be negative due to timing of cash receipts.
Percentages are based on net assets as of 8/31/13.
The portfolio is actively managed and current holdings may be different.
2
PERFORMANCE SUMMARY THROUGH 8/31/13
Total returns as well as the current 7-day yield have been provided for the applicable time periods. Performance results reflect the percentage change in net asset value, including the reinvestment of any dividends and capital gains distributions. (See Notes to Performance Summary.)
Performance data shown represents past performance and is no guarantee of future results. Although the fund seeks to preserve the value of your investment at $1.00 per share, you could lose money on your investment in the fund. An investment in the fund is not a bank deposit and is not insured or guaranteed by the Federal Deposit Insurance Corporation or any other governmental agency. The performance shown does not reflect the deduction of taxes, if any, that a shareholder would pay on fund distributions or the redemption of fund shares.
| | | | | | | | | | |
| | | Share Class | | Inception | | 1-Year Total
Return (without
sales charge) | | Current
7-day yield | | |
| | | A | | 9/07/93 | | 0.00% | | 0.00% | | |
| | | B | | 12/29/86 | | 0.00% | | 0.00% | | |
| | | C | | 4/01/96 | | 0.00% | | 0.00% | | |
| | | R1 | | 4/01/05 | | 0.00% | | 0.00% | | |
| | | R2 | | 4/01/05 | | 0.00% | | 0.00% | | |
| | | R3 | | 4/01/05 | | 0.00% | | 0.00% | | |
| | | R4 | | 4/01/05 | | 0.00% | | 0.00% | | |
| | | 529A | | 7/31/02 | | 0.00% | | 0.00% | | |
| | | 529B | | 7/31/02 | | 0.00% | | 0.00% | | |
| | | 529C | | 7/31/02 | | 0.00% | | 0.00% | | |
| | | | | |
| | | Share Class | | | | 1-Year Total
Return | | | | |
| | | B
With CDSC (Declining over six years from 4% to 0%) (x) | | (4.00)% | | N/A | | |
| | | C
With CDSC (1% for 12 months) (x) | | (1.00)% | | N/A | | |
| | | 529B
With CDSC (Declining over six years from 4% to 0%) (x) | | (4.00)% | | N/A | | |
| | | 529C
With CDSC (1% for 12 months) (x) | | (1.00)% | | N/A | | |
3
Performance Summary – continued
Class R1, R2, R3, R4 and 529A shares do not have a sales charge. Certain Class A shares acquired through an exchange may be subject to a CDSC upon redemption depending on when the shares exchanged were originally purchased.
CDSC – Contingent Deferred Sales Charge.
| (x) | Assuming redemption at the end of applicable period. |
Yields quoted are based on the latest seven days ended as of August 31, 2013, with dividends annualized. The yield quotations more closely reflect the current earnings of the fund than the total return quotations. Shares of the fund can be purchased at net asset value without a sales charge.
Notes to Performance Summary
Performance results reflect any applicable expense subsidies, waivers and adjustments in effect during the periods shown. Subsidies and fee waivers may be imposed to enhance a fund’s yield or to avoid a negative yield during periods when the fund’s operating expenses have a significant impact on the fund’s yield due to lower interest rates. Without such subsidies and waivers the fund’s performance results would be less favorable. Please see the prospectus and financial statements for complete details. All results are historical and assume the reinvestment of any dividends and capital gain distributions.
4
EXPENSE TABLE
Fund expenses borne by the shareholders during the period, March 1, 2013 through August 31, 2013
As a shareholder of the fund, you incur two types of costs: (1) transaction costs, including sales charges (loads) on certain purchase or redemption payments, and (2) ongoing costs, including management fees; distribution and service (12b-1) fees; and other fund expenses. This example is intended to help you understand your ongoing costs (in dollars) of investing in the fund and to compare these costs with the ongoing costs of investing in other mutual funds.
The example is based on an investment of $1,000 invested at the beginning of the period and held for the entire period March 1, 2013 through August 31, 2013.
Actual Expenses
The first line for each share class in the following table provides information about actual account values and actual expenses. You may use the information in this line, together with the amount you invested, to estimate the expenses that you paid over the period. Simply divide your account value by $1,000 (for example, an $8,600 account value divided by $1,000 = 8.6), then multiply the result by the number in the first line under the heading entitled “Expenses Paid During Period” to estimate the expenses you paid on your account during this period.
Hypothetical Example for Comparison Purposes
The second line for each share class in the following table provides information about hypothetical account values and hypothetical expenses based on the fund’s actual expense ratio and an assumed rate of return of 5% per year before expenses, which is not the fund’s actual return. The hypothetical account values and expenses may not be used to estimate the actual ending account balance or expenses you paid for the period. You may use this information to compare the ongoing costs of investing in the fund and other funds. To do so, compare this 5% hypothetical example with the 5% hypothetical examples that appear in the shareholder reports of the other funds.
Please note that the expenses shown in the table are meant to highlight your ongoing costs only and do not reflect any transactional costs, such as sales charges (loads). Therefore, the second line for each share class in the table is useful in comparing ongoing costs only, and will not help you determine the relative total costs of owning different funds. In addition, if these transactional costs were included, your costs would have been higher.
5
Expense Table – continued
| | | | | | | | | | | | | | | | | | |
Share
Class | | | | Annualized
Expense
Ratio | | | Beginning
Account Value
3/01/13 | | | Ending
Account Value
8/31/13 | | | Expenses
Paid During
Period (p)
3/01/13-8/31/13 | |
| A | | Actual | | | 0.13% | | | | $1,000.00 | | | | $1,000.00 | | | | $0.66 | |
| | Hypothetical (h) | | | 0.13% | | | | $1,000.00 | | | | $1,024.55 | | | | $0.66 | |
| B | | Actual | | | 0.13% | | | | $1,000.00 | | | | $1,000.00 | | | | $0.66 | �� |
| | Hypothetical (h) | | | 0.13% | | | | $1,000.00 | | | | $1,024.55 | | | | $0.66 | |
| C | | Actual | | | 0.13% | | | | $1,000.00 | | | | $1,000.00 | | | | $0.66 | |
| | Hypothetical (h) | | | 0.13% | | | | $1,000.00 | | | | $1,024.55 | | | | $0.66 | |
| R1 | | Actual | | | 0.13% | | | | $1,000.00 | | | | $1,000.00 | | | | $0.66 | |
| | Hypothetical (h) | | | 0.13% | | | | $1,000.00 | | | | $1,024.55 | | | | $0.66 | |
| R2 | | Actual | | | 0.13% | | | | $1,000.00 | | | | $1,000.00 | | | | $0.66 | |
| | Hypothetical (h) | | | 0.13% | | | | $1,000.00 | | | | $1,024.55 | | | | $0.66 | |
| R3 | | Actual | | | 0.13% | | | | $1,000.00 | | | | $1,000.00 | | | | $0.66 | |
| | Hypothetical (h) | | | 0.13% | | | | $1,000.00 | | | | $1,024.55 | | | | $0.66 | |
| R4 | | Actual | | | 0.13% | | | | $1,000.00 | | | | $1,000.00 | | | | $0.66 | |
| | Hypothetical (h) | | | 0.13% | | | | $1,000.00 | | | | $1,024.55 | | | | $0.66 | |
| 529A | | Actual | | | 0.13% | | | | $1,000.00 | | | | $1,000.00 | | | | $0.66 | |
| | Hypothetical (h) | | | 0.13% | | | | $1,000.00 | | | | $1,024.55 | | | | $0.66 | |
| 529B | | Actual | | | 0.13% | | | | $1,000.00 | | | | $1,000.00 | | | | $0.66 | |
| | Hypothetical (h) | | | 0.13% | | | | $1,000.00 | | | | $1,024.55 | | | | $0.66 | |
| 529C | | Actual | | | 0.13% | | | | $1,000.00 | | | | $1,000.00 | | | | $0.66 | |
| | Hypothetical (h) | | | 0.13% | | | | $1,000.00 | | | | $1,024.55 | | | | $0.66 | |
| (h) | 5% class return per year before expenses. |
| (p) | Expenses paid are equal to each class’s annualized expense ratio, as shown above, multiplied by the average account value over the period, multiplied by the number of days in the period, divided by the number of days in the year. Expenses paid do not include any applicable sales charges (loads). If these transaction costs had been included, your costs would have been higher. |
Notes to Expense Table
As more fully disclosed in footnote 3 to the financial statements, the expense ratios reported above include additional expense reductions to avoid a negative yield.
6
PORTFOLIO OF INVESTMENTS
8/31/13
The Portfolio of Investments is a complete list of all securities owned by your fund. It is categorized by broad-based asset classes.
| | | | | | | | |
| Certificates of Deposit - 14.3% | | | | | | | | |
| Issuer | | Shares/Par | | | Value ($) | |
| Major Banks - 6.6% | | | | | | | | |
| Bank of Montreal/Chicago Branch, 0.1%, due 9/04/13 | | $ | 10,932,000 | | | $ | 10,932,000 | |
| Bank of Nova Scotia/Houston Branch, 0.12%, due 10/18/13 | | | 10,070,000 | | | | 10,070,000 | |
| Chase Bank USA N.A., 0.22%, due 12/04/13 | | | 6,360,000 | | | | 6,360,000 | |
| | | | | | | | |
| | | | $ | 27,362,000 | |
| Other Banks & Diversified Financials - 7.7% | | | | | | | | |
| Branch Banking & Trust Co., 0.11%, due 10/01/13 | | $ | 15,962,000 | | | $ | 15,962,000 | |
| Mizuho Corporate Bank (USA)/New York Branch, 0.22%, due 9/17/13 | | | 15,720,000 | | | | 15,720,000 | |
| | | | | | | | |
| | | | $ | 31,682,000 | |
| Total Certificates of Deposit, at Cost and Value | | | | | | $ | 59,044,000 | |
| | |
| Commercial Paper (y) - 31.4% | | | | | | | | |
| Automotive - 5.2% | | | | | | | | |
| American Honda Finance Corp., 0.09%, due 10/08/13 | | $ | 5,790,000 | | | $ | 5,789,464 | |
| Toyota Motor Credit Corp., 0.11%, due 9/06/13 | | | 7,014,000 | | | | 7,013,893 | |
| Toyota Motor Credit Corp., 0.11%, due 10/15/13 | | | 8,884,000 | | | | 8,882,806 | |
| | | | | | | | |
| | | | $ | 21,686,163 | |
| Consumer Products - 2.4% | | | | | | | | |
| Kimberly Clark Worldwide, Inc., 0.06%, due 9/06/13 (t) | | $ | 10,000,000 | | | $ | 9,999,917 | |
| | |
| Financial Institutions - 0.7% | | | | | | | | |
| General Electric Capital Corp., 0.15%, due 11/13/13 | | $ | 2,787,000 | | | $ | 2,786,152 | |
| | |
| Food & Beverages - 7.4% | | | | | | | | |
| Anheuser-Busch InBev Worldwide, Inc., 0.21%, due 9/18/13 (t) | | $ | 265,000 | | | $ | 264,974 | |
| Anheuser-Busch InBev Worldwide, Inc., 0.24%, due 1/27/14 (t) | | | 8,457,000 | | | | 8,448,656 | |
| Coca-Cola Co., 0.05%, due 9/23/13 (t) | | | 4,109,000 | | | | 4,108,874 | |
| Coca-Cola Co., 0.13%, due 10/24/13 (t) | | | 1,550,000 | | | | 1,549,703 | |
| Coca-Cola Co., 0.13%, due 12/17/13 (t) | | | 3,188,000 | | | | 3,186,768 | |
| Coca-Cola Co., 0.17%, due 10/21/13 (t) | | | 7,342,000 | | | | 7,340,266 | |
| PepsiCo, Inc., 0.05%, due 9/10/13 (t) | | | 5,665,000 | | | | 5,664,929 | |
| | | | | | | | |
| | | | $ | 30,564,170 | |
| Major Banks - 14.0% | | | | | | | | |
| ANZ National (International) Ltd., 0.19%, due 9/27/13 (t) | | $ | 2,550,000 | | | $ | 2,549,650 | |
| ANZ National (International) Ltd., 0.24%, due 10/09/13 (t) | | | 14,011,000 | | | | 14,007,451 | |
| JPMorgan Chase & Co., 0.22%, due 12/09/13 | | | 2,786,000 | | | | 2,784,314 | |
| JPMorgan Chase & Co., 0.3%, due 11/04/13 (t) | | | 6,780,000 | | | | 6,776,384 | |
7
Portfolio of Investments – continued
| | | | | | | | |
| Issuer | | Shares/Par | | | Value ($) | |
| Commercial Paper (y) - continued | | | | | | | | |
| Major Banks - continued | | | | | | | | |
| National Australia Funding (Delaware), Inc., 0.175%, due 11/18/13 (t) | | $ | 15,988,000 | | | $ | 15,981,938 | |
| Wells Fargo & Co., 0.18%, due 12/06/13 | | | 15,605,000 | | | | 15,597,510 | |
| | | | | | | | |
| | | | $ | 57,697,247 | |
| Retailers - 1.7% | | | | | | | | |
| Wal-Mart Stores, Inc., 0.1%, due 9/23/13 (t) | | $ | 7,000,000 | | | $ | 6,999,572 | |
| Total Commercial Paper, at Amortized Cost and Value | | | $ | 129,733,221 | |
| |
| U.S. Government Agencies and Equivalents (y) - 43.2% | | | | | |
| Fannie Mae, 0.095%, due 9/04/13 | | $ | 937,000 | | | $ | 936,993 | |
| Fannie Mae, 0.085%, due 12/11/13 | | | 10,000,000 | | | | 9,997,615 | |
| Federal Home Loan Bank, 0.06%, due 10/30/13 | | | 12,208,000 | | | | 12,206,800 | |
| Federal Home Loan Bank, 0.045%, due 9/04/13 | | | 16,120,000 | | | | 16,119,940 | |
| Federal Home Loan Bank, 0.04%, due 9/11/13 | | | 14,200,000 | | | | 14,199,842 | |
| Federal Home Loan Bank, 0.065%, due 10/11/13 | | | 16,120,000 | | | | 16,118,836 | |
| Federal Home Loan Bank, 0.055%, due 10/16/13 | | | 7,820,000 | | | | 7,819,462 | |
| Federal Home Loan Bank, 0.065%, due 10/18/13 | | | 6,000,000 | | | | 5,999,491 | |
| Freddie Mac, 0.045%, due 11/25/13 | | | 3,459,000 | | | | 3,458,632 | |
| U.S. Treasury Bill, 0.043%, due 11/14/13 | | | 16,120,000 | | | | 16,118,592 | |
| U.S. Treasury Bill, 0.098%, due 10/03/13 | | | 7,000,000 | | | | 6,999,393 | |
| U.S. Treasury Bill, 0.093%, due 10/10/13 | | | 10,110,000 | | | | 10,108,987 | |
| U.S. Treasury Bill, 0.055%, due 9/05/13 | | | 16,130,000 | | | | 16,129,901 | |
| U.S. Treasury Bill, 0.048%, due 9/19/13 | | | 14,000,000 | | | | 13,999,668 | |
| U.S. Treasury Bill, 0.04%, due 9/12/13 | | | 6,000,000 | | | | 5,999,927 | |
| U.S. Treasury Bill, 0.085%, due 12/05/13 | | | 16,340,000 | | | | 16,336,335 | |
| U.S. Treasury Bill, 0.09%, due 12/19/13 | | | 6,000,000 | | | | 5,998,365 | |
| Total U.S. Government Agencies and Equivalents, at Amortized Cost and Value | | | $ | 178,548,779 | |
| | |
| Floating Rate Demand Notes - 4.0% | | | | | | | | |
| East Baton Rouge, LA, Pollution Control Rev. (Exxon Mobil Corp.), 0.03%, due 9/03/13 | | $ | 9,700,000 | | | $ | 9,700,000 | |
| Lincoln County, WY, Pollution Control Rev. (Exxon Mobil Corp.), 0.03%, due 9/03/13 | | | 5,300,000 | | | | 5,300,000 | |
| Lincoln County, WY, Pollution Control Rev. (Exxon Mobil Corp.), “A”, 0.03%, due 9/03/13 | | | 1,300,000 | | | | 1,300,000 | |
| Total Floating Rate Demand Notes, at Cost and Value | | | $ | 16,300,000 | |
8
Portfolio of Investments – continued
| | | | | | | | |
| Repurchase Agreements - 7.4% | | | | | | | | |
| Issuer | | Shares/Par | | | Value ($) | |
| Goldman Sachs Repurchase Agreement, 0.04%, dated 8/30/13, due 9/03/13, total to be received $30,758,137 (secured by U.S. Treasury and Federal Agency obligations valued at $31,373,170 in a jointly traded account), at Cost and Value | | $ | 30,758,000 | | | $ | 30,758,000 | |
| Total Investments, at Amortized Cost and Value | | | $ | 414,384,000 | |
| |
| Other Assets, Less Liabilities - (0.3)% | | | | (1,250,509 | ) |
| Net Assets - 100.0% | | | $ | 413,133,491 | |
| (t) | Security exempt from registration with the U.S. Securities and Exchange Commission under Section 4(2) of the Securities Act of 1933. |
| (y) | The rate shown represents an annualized yield at time of purchase. |
See Notes to Financial Statements
9
Financial Statements
STATEMENT OF ASSETS AND LIABILITIES
At 8/31/13
This statement represents your fund’s balance sheet, which details the assets and liabilities comprising the total value of the fund.
| | | | |
| Assets | | | | |
Investments, at amortized cost and value | | | $414,384,000 | |
Cash | | | 117 | |
Receivables for | | | | |
Fund shares sold | | | 1,184,892 | |
Interest | | | 14,083 | |
Receivable from investment adviser and distributor | | | 122,713 | |
Other assets | | | 663 | |
Total assets | | | $415,706,468 | |
| Liabilities | | | | |
Payable for fund shares reacquired | | | $2,191,561 | |
Payable to affiliates | | | | |
Shareholder servicing costs | | | 316,610 | |
Payable for independent Trustees’ compensation | | | 13,271 | |
Accrued expenses and other liabilities | | | 51,535 | |
Total liabilities | | | $2,572,977 | |
Net assets | | | $413,133,491 | |
| Net assets consist of | | | | |
Paid-in capital | | | $413,355,798 | |
Accumulated net realized gain (loss) on investments | | | (207,708 | ) |
Accumulated net investment loss | | | (14,599 | ) |
Net assets | | | $413,133,491 | |
Shares of beneficial interest outstanding | | | 413,363,808 | |
| | | | | | | | | | | | |
| | | Net assets | | | Shares
outstanding | | | Net asset value
per share | |
Class A | | | $145,061,672 | | | | 145,132,950 | | | | $1.00 | |
Class B | | | 30,833,045 | | | | 30,880,151 | | | | 1.00 | |
Class C | | | 58,363,356 | | | | 58,393,176 | | | | 1.00 | |
Class R1 | | | 21,080,101 | | | | 21,089,753 | | | | 1.00 | |
Class R2 | | | 74,405,851 | | | | 74,442,993 | | | | 1.00 | |
Class R3 | | | 64,924,511 | | | | 64,955,482 | | | | 1.00 | |
Class R4 | | | 819,508 | | | | 821,223 | | | | 1.00 | |
Class 529A | | | 10,897,473 | | | | 10,899,042 | | | | 1.00 | |
Class 529B | | | 675,539 | | | | 675,855 | | | | 1.00 | |
Class 529C | | | 6,072,435 | | | | 6,073,183 | | | | 1.00 | |
A contingent deferred sales charge may be imposed on redemptions of Class A, Class B, Class C, Class 529B, and Class 529C shares. Redemption price per share was equal to the net asset value per share for Classes R1, R2, R3, R4, and 529A.
See Notes to Financial Statements
10
Financial Statements
STATEMENT OF OPERATIONS
Year ended 8/31/13
This statement describes how much your fund earned in investment income and accrued in expenses. It also describes any gains and/or losses generated by fund operations.
| | | | |
| Net investment income | | | | |
Interest income | | | $602,286 | |
Expenses | | | | |
Management fee | | | $1,611,278 | |
Distribution and service fees | | | 2,036,969 | |
Program manager fees | | | 16,732 | |
Shareholder servicing costs | | | 824,380 | |
Administrative services fee | | | 62,316 | |
Independent Trustees’ compensation | | | 10,572 | |
Custodian fee | | | 38,765 | |
Shareholder communications | | | 23,199 | |
Audit and tax fees | | | 36,084 | |
Legal fees | | | 3,564 | |
Miscellaneous | | | 132,054 | |
Total expenses | | | $4,795,913 | |
Fees paid indirectly | | | (194 | ) |
Reduction of expenses by investment adviser and distributor | | | (4,193,433 | ) |
Net expenses | | | $602,286 | |
Net investment income | | | $0 | |
Change in net assets from operations | | | $0 | |
See Notes to Financial Statements
11
Financial Statements
STATEMENTS OF CHANGES IN NET ASSETS
These statements describe the increases and/or decreases in net assets resulting from operations, any distributions, and any shareholder transactions.
| | | | | | | | |
| | | Years ended 8/31 | |
| | | 2013 | | | 2012 | |
| Change in net assets | | | | | | |
| From operations | | | | | | | | |
Net investment income | | | $0 | | | | $0 | |
Change in net assets from operations | | | $0 | | | | $0 | |
Change in net assets from fund share transactions | | | $(2,037,038 | ) | | | $(91,272,886 | ) |
Total change in net assets | | | $(2,037,038 | ) | | | $(91,272,886 | ) |
| Net assets | | | | | | | | |
At beginning of period | | | 415,170,529 | | | | 506,443,415 | |
At end of period (including accumulated net investment loss of $14,599 and $16,692, respectively) | | | $413,133,491 | | | | $415,170,529 | |
See Notes to Financial Statements
12
Financial Statements
FINANCIAL HIGHLIGHTS
The financial highlights table is intended to help you understand the fund’s financial performance for the past 5 years. Certain information reflects financial results for a single fund share. The total returns in the table represent the rate by which an investor would have earned (or lost) on an investment in the fund share class (assuming reinvestment of all distributions) held for the entire period.
| | | | | | | | | | | | | | | | | | | | |
| Class A | | Years ended 8/31 | |
| | | 2013 | | | 2012 | | | 2011 | | | 2010 | | | 2009 | |
Net asset value, beginning of period | | | $1.00 | | | | $1.00 | | | | $1.00 | | | | $1.00 | | | | $1.00 | |
| Income (loss) from investment operations | | | | | | | | | | | | | |
Net investment income (d) | | | $0.00 | | | | $0.00 | | | | $0.00 | (w) | | | $0.00 | (w) | | | $0.00 | (w) |
Net realized and unrealized gain (loss)
on investments | | | — | | | | — | | | | (0.00 | )(w) | | | 0.00 | (w) | | | (0.00 | )(w) |
Total from investment operations | | | $0.00 | | | | $0.00 | | | | $0.00 | (w) | | | $0.00 | (w) | | | $0.00 | (w) |
| Less distributions declared to shareholders | | | | | | | | | | | | | |
From net investment income | | | $— | | | | $— | | | | $(0.00 | )(w) | | | $(0.00 | )(w) | | | $(0.00 | )(w) |
From tax return of capital | | | — | | | | — | | | | (0.00 | )(w) | | | (0.00 | )(w) | | | — | |
Total distributions declared to shareholders | | | $— | | | | $— | | | | $(0.00 | )(w) | | | $(0.00 | )(w) | | | $(0.00 | )(w) |
Net asset value, end of period | | | $1.00 | | | | $1.00 | | | | $1.00 | | | | $1.00 | | | | $1.00 | |
Total return (%) (r)(t) | | | 0.00 | | | | 0.00 | | | | 0.00 | (w) | | | 0.00 | (w) | | | 0.31 | |
Ratios (%) (to average net assets)
and Supplemental data: | | | | | | | | | |
Expenses before expense reductions (f) | | | 0.93 | | | | 0.93 | | | | 0.94 | | | | 0.85 | | | | 0.72 | |
Expenses after expense reductions (f) | | | 0.15 | | | | 0.13 | | | | 0.20 | | | | 0.27 | | | | 0.39 | |
Net investment income | | | 0.00 | | | | 0.00 | | | | 0.00 | (w) | | | 0.00 | (w) | | | 0.33 | |
Net assets at end of period (000 omitted) | | | $145,062 | | | | $126,283 | | | | $153,634 | | | | $141,832 | | | | $173,135 | |
See Notes to Financial Statements
13
Financial Highlights – continued
| | | | | | | | | | | | | | | | | | | | |
| Class B | | Years ended 8/31 | |
| | | 2013 | | | 2012 | | | 2011 | | | 2010 | | | 2009 | |
Net asset value, beginning of period | | | $1.00 | | | | $1.00 | | | | $1.00 | | | | $1.00 | | | | $1.00 | |
| Income (loss) from investment operations | | | | | | | | | | | | | |
Net investment income (d) | | | $0.00 | | | | $0.00 | | | | $0.00 | (w) | | | $0.00 | (w) | | | $0.00 | (w) |
Net realized and unrealized gain (loss)
on investments | | | — | | | | — | | | | (0.00 | )(w) | | | 0.00 | (w) | | | (0.00 | )(w) |
Total from investment operations | | | $0.00 | | | | $0.00 | | | | $(0.00 | )(w) | | | $0.00 | (w) | | | $0.00 | (w) |
| Less distributions declared to shareholders | | | | | | | | | | | | | |
From net investment income | | | $— | | | | $— | | | | $— | | | | $(0.00 | )(w) | | | $(0.00 | )(w) |
From tax return of capital | | | — | | | | — | | | | — | | | | (0.00 | )(w) | | | — | |
Total distributions declared to shareholders | | | $— | | | | $— | | | | $— | | | | $(0.00 | )(w) | | | $(0.00 | )(w) |
Net asset value, end of period | | | $1.00 | | | | $1.00 | | | | $1.00 | | | | $1.00 | | | | $1.00 | |
Total return (%) (r)(t) | | | 0.00 | | | | 0.00 | | | | 0.00 | (w) | | | 0.00 | (w) | | | 0.10 | |
Ratios (%) (to average net assets)
and Supplemental data: | | | | | | | | | |
Expenses before expense reductions (f) | | | 1.68 | | | | 1.68 | | | | 1.69 | | | | 1.69 | | | | 1.72 | |
Expenses after expense reductions (f) | | | 0.15 | | | | 0.12 | | | | 0.20 | | | | 0.27 | | | | 0.60 | |
Net investment income | | | 0.00 | | | | 0.00 | | | | 0.00 | (w) | | | 0.00 | (w) | | | 0.08 | |
Net assets at end of period (000 omitted) | | | $30,833 | | | | $35,098 | | | | $50,379 | | | | $66,601 | | | | $104,696 | |
| |
| Class C | | Years ended 8/31 | |
| | | 2013 | | | 2012 | | | 2011 | | | 2010 | | | 2009 | |
Net asset value, beginning of period | | | $1.00 | | | | $1.00 | | | | $1.00 | | | | $1.00 | | | | $1.00 | |
| Income (loss) from investment operations | | | | | | | | | | | | | |
Net investment income (d) | | | $0.00 | | | | $0.00 | | | | $0.00 | | | | $0.00 | (w) | | | $0.00 | (w) |
Net realized and unrealized gain (loss)
on investments | | | — | | | | — | | | | (0.00 | )(w) | | | 0.00 | (w) | | | (0.00 | )(w) |
Total from investment operations | | | $0.00 | | | | $0.00 | | | | $(0.00 | )(w) | | | $0.00 | (w) | | | $0.00 | (w) |
| Less distributions declared to shareholders | | | | | | | | | | | | | |
From net investment income | | | $— | | | | $— | | | | $— | | | | $(0.00 | )(w) | | | $(0.00 | )(w) |
From tax return of capital | | | — | | | | — | | | | — | | | | (0.00 | )(w) | | | — | |
Total distributions declared to shareholders | | | $— | | | | $— | | | | $— | | | | $— | | | | $(0.00 | )(w) |
Net asset value, end of period | | | $1.00 | | | | $1.00 | | | | $1.00 | | | | $1.00 | | | | $1.00 | |
Total return (%) (r)(t) | | | 0.00 | | | | 0.00 | | | | 0.00 | (w) | | | 0.00 | (w) | | | 0.10 | |
Ratios (%) (to average net assets)
and Supplemental data: | | | | | | | | | |
Expenses before expense reductions (f) | | | 1.68 | | | | 1.68 | | | | 1.69 | | | | 1.69 | | | | 1.72 | |
Expenses after expense reductions (f) | | | 0.15 | | | | 0.13 | | | | 0.20 | | | | 0.27 | | | | 0.60 | |
Net investment income | | | 0.00 | | | | 0.00 | | | | 0.00 | | | | 0.00 | (w) | | | 0.08 | |
Net assets at end of period (000 omitted) | | | $58,363 | | | | $49,851 | | | | $61,943 | | | | $50,196 | | | | $70,005 | |
See Notes to Financial Statements
14
Financial Highlights – continued
| | | | | | | | | | | | | | | | | | | | |
| Class R1 | | Years ended 8/31 | |
| | | 2013 | | | 2012 | | | 2011 | | | 2010 | | | 2009 | |
Net asset value, beginning of period | | | $1.00 | | | | $1.00 | | | | $1.00 | | | | $1.00 | | | | $1.00 | |
| Income (loss) from investment operations | | | | | | | | | | | | | |
Net investment income (d) | | | $0.00 | | | | $0.00 | | | | $0.00 | | | | $0.00 | (w) | | | $0.00 | (w) |
Net realized and unrealized gain (loss)
on investments | | | — | | | | — | | | | (0.00 | )(w) | | | 0.00 | (w) | | | (0.00 | )(w) |
Total from investment operations | | | $0.00 | | | | $0.00 | | | | $(0.00 | )(w) | | | $0.00 | (w) | | | $0.00 | (w) |
| Less distributions declared to shareholders | | | | | | | | | | | | | |
From net investment income | | | $— | | | | $— | | | | $— | | | | $(0.00 | )(w) | | | $(0.00 | )(w) |
From tax return of capital | | | — | | | | — | | | | — | | | | (0.00 | )(w) | | | — | |
Total distributions declared to shareholders | | | $— | | | | $— | | | | $— | | | | $(0.00 | )(w) | | | $(0.00 | )(w) |
Net asset value, end of period | | | $1.00 | | | | $1.00 | | | | $1.00 | | | | $1.00 | | | | $1.00 | |
Total return (%) (r) | | | 0.00 | | | | 0.00 | | | | 0.00 | (w) | | | 0.00 | (w) | | | 0.10 | |
Ratios (%) (to average net assets)
and Supplemental data: | | | | | | | | | |
Expenses before expense reductions (f) | | | 1.68 | | | | 1.68 | | | | 1.69 | | | | 1.69 | | | | 1.72 | |
Expenses after expense reductions (f) | | | 0.15 | | | | 0.13 | | | | 0.20 | | | | 0.27 | | | | 0.58 | |
Net investment income | | | 0.00 | | | | 0.00 | | | | 0.00 | | | | 0.00 | (w) | | | 0.09 | |
Net assets at end of period (000 omitted) | | | $21,080 | | | | $24,361 | | | | $28,705 | | | | $30,233 | | | | $29,457 | |
| |
| Class R2 | | Years ended 8/31 | |
| | | 2013 | | | 2012 | | | 2011 | | | 2010 | | | 2009 | |
Net asset value, beginning of period | | | $1.00 | | | | $1.00 | | | | $1.00 | | | | $1.00 | | | | $1.00 | |
| Income (loss) from investment operations | | | | | | | | | | | | | |
Net investment income (d) | | | $0.00 | | | | $0.00 | | | | $0.00 | | | | $0.00 | (w) | | | $0.00 | (w) |
Net realized and unrealized gain (loss)
on investments | | | — | | | | — | | | | (0.00 | )(w) | | | 0.00 | (w) | | | (0.00 | )(w) |
Total from investment operations | | | $0.00 | | | | $0.00 | | | | $(0.00 | )(w) | | | $0.00 | (w) | | | $(0.00 | )(w) |
| Less distributions declared to shareholders | | | | | | | | | | | | | |
From net investment income | | | $— | | | | $— | | | | $— | | | | $(0.00 | )(w) | | | $(0.00 | )(w) |
From tax return of capital | | | — | | | | — | | | | — | | | | (0.00 | )(w) | | | — | |
Total distributions declared to shareholders | | | $— | | | | $— | | | | $— | | | | $(0.00 | )(w) | | | $(0.00 | )(w) |
Net asset value, end of period | | | $1.00 | | | | $1.00 | | | | $1.00 | | | | $1.00 | | | | $1.00 | |
Total return (%) (r) | | | 0.00 | | | | 0.00 | | | | 0.00 | (w) | | | 0.00 | (w) | | | 0.17 | |
Ratios (%) (to average net assets)
and Supplemental data: | | | | | | | | | |
Expenses before expense reductions (f) | | | 1.18 | | | | 1.18 | | | | 1.19 | | | | 1.19 | | | | 1.22 | |
Expenses after expense reductions (f) | | | 0.15 | | | | 0.13 | | | | 0.20 | | | | 0.27 | | | | 0.51 | |
Net investment income | | | 0.00 | | | | 0.00 | | | | 0.00 | | | | 0.00 | (w) | | | 0.15 | |
Net assets at end of period (000 omitted) | | | $74,406 | | | | $83,723 | | | | $104,130 | | | | $109,362 | | | | $120,476 | |
See Notes to Financial Statements
15
Financial Highlights – continued
| | | | | | | | | | | | | | | | | | | | |
| Class R3 | | Years ended 8/31 | |
| | | 2013 | | | 2012 | | | 2011 | | | 2010 | | | 2009 | |
Net asset value, beginning of period | | | $1.00 | | | | $1.00 | | | | $1.00 | | | | $1.00 | | | | $1.00 | |
| Income (loss) from investment operations | | | | | | | | | | | | | |
Net investment income (d) | | | $0.00 | | | | $0.00 | | | | $0.00 | | | | $0.00 | (w) | | | $0.00 | (w) |
Net realized and unrealized gain (loss)
on investments | | | — | | | | — | | | | (0.00 | )(w) | | | 0.00 | (w) | | | (0.00 | )(w) |
Total from investment operations | | | $0.00 | | | | $0.00 | | | | $(0.00 | )(w) | | | $0.00 | (w) | | | $0.00 | (w) |
| Less distributions declared to shareholders | | | | | | | | | | | | | |
From net investment income | | | $— | | | | $— | | | | $— | | | | $(0.00 | )(w) | | | $(0.00 | )(w) |
From tax return of capital | | | — | | | | — | | | | — | | | | (0.00 | )(w) | | | — | |
Total distributions declared to shareholders | | | $— | | | | $— | | | | $— | | | | $(0.00 | )(w) | | | $(0.00 | )(w) |
Net asset value, end of period | | | $1.00 | | | | $1.00 | | | | $1.00 | | | | $1.00 | | | | $1.00 | |
Total return (%) (r) | | | 0.00 | | | | 0.00 | | | | 0.00 | (w) | | | 0.00 | (w) | | | 0.23 | |
Ratios (%) (to average net assets)
and Supplemental data: | | | | | | | | | |
Expenses before expense reductions (f) | | | 0.93 | | | | 0.93 | | | | 0.94 | | | | 0.94 | | | | 0.97 | |
Expenses after expense reductions (f) | | | 0.15 | | | | 0.13 | | | | 0.20 | | | | 0.27 | | | | 0.45 | |
Net investment income | | | 0.00 | | | | 0.00 | | | | 0.00 | | | | 0.00 | (w) | | | 0.20 | |
Net assets at end of period (000 omitted) | | | $64,925 | | | | $79,029 | | | | $85,602 | | | | $90,331 | | | | $104,062 | |
| |
| Class R4 | | Years ended 8/31 | |
| | | 2013 | | | 2012 | | | 2011 | | | 2010 | | | 2009 | |
Net asset value, beginning of period | | | $1.00 | | | | $1.00 | | | | $1.00 | | | | $1.00 | | | | $1.00 | |
| Income (loss) from investment operations | | | | | | | | | | | | | |
Net investment income (d) | | | $0.00 | | | | $0.00 | | | | $0.00 | (w) | | | $0.00 | (w) | | | $0.00 | (w) |
Net realized and unrealized gain (loss)
on investments | | | — | | | | — | | | | (0.00 | )(w) | | | 0.00 | (w) | | | (0.00 | )(w) |
Total from investment operations | | | $0.00 | | | | $0.00 | | | | $0.00 | (w) | | | $0.00 | (w) | | | $0.00 | (w) |
| Less distributions declared to shareholders | | | | | | | | | | | | | |
From net investment income | | | $— | | | | $— | | | | $(0.00 | )(w) | | | $(0.00 | )(w) | | | $(0.00 | )(w) |
From tax return of capital | | | — | | | | — | | | | (0.00 | )(w) | | | (0.00 | )(w) | | | — | |
Total distributions declared to shareholders | | | $— | | | | $— | | | | $(0.00 | )(w) | | | $(0.00 | )(w) | | | $(0.00 | )(w) |
Net asset value, end of period | | | $1.00 | | | | $1.00 | | | | $1.00 | | | | $1.00 | | | | $1.00 | |
Total return (%) (r) | | | 0.00 | | | | 0.00 | | | | 0.00 | (w) | | | 0.00 | (w) | | | 0.31 | |
Ratios (%) (to average net assets)
and Supplemental data: | | | | | | | | | |
Expenses before expense reductions (f) | | | 0.68 | | | | 0.69 | | | | 0.69 | | | | 0.68 | | | | 0.72 | |
Expenses after expense reductions (f) | | | 0.15 | | | | 0.12 | | | | 0.20 | | | | 0.27 | | | | 0.38 | |
Net investment income | | | 0.00 | | | | 0.00 | | | | 0.00 | (w) | | | 0.00 | (w) | | | 0.23 | |
Net assets at end of period (000 omitted) | | | $820 | | | | $810 | | | | $5,743 | | | | $6,172 | | | | $5,697 | |
See Notes to Financial Statements
16
Financial Highlights – continued
| | | | | | | | | | | | | | | | | | | | |
| Class 529A | | Years ended 8/31 | |
| | | 2013 | | | 2012 | | | 2011 | | | 2010 | | | 2009 | |
Net asset value, beginning of period | | | $1.00 | | | | $1.00 | | | | $1.00 | | | | $1.00 | | | | $1.00 | |
| Income (loss) from investment operations | | | | | | | | | | | | | |
Net investment income (d) | | | $0.00 | | | | $0.00 | | | | $0.00 | | | | $0.00 | (w) | | | $0.00 | (w) |
Net realized and unrealized gain (loss)
on investments | | | — | | | | — | | | | (0.00 | )(w) | | | 0.00 | (w) | | | (0.00 | )(w) |
Total from investment operations | | | $0.00 | | | | $0.00 | | | | $(0.00 | )(w) | | | $0.00 | (w) | | | $0.00 | (w) |
| Less distributions declared to shareholders | | | | | | | | | | | | | |
From net investment income | | | $— | | | | $— | | | | $— | | | | $(0.00 | )(w) | | | $(0.00 | )(w) |
From tax return of capital | | | — | | | | — | | | | — | | | | (0.00 | )(w) | | | — | |
Total distributions declared to shareholders | | | $— | | | | $— | | | | $— | | | | $(0.00 | )(w) | | | $(0.00 | )(w) |
Net asset value, end of period (x) | | | $1.00 | | | | $1.00 | | | | $1.00 | | | | $1.00 | | | | $1.00 | |
Total return (%) (r) | | | 0.00 | | | | 0.00 | | | | 0.00 | (w) | | | 0.00 | (w) | | | 0.28 | |
Ratios (%) (to average net assets)
and Supplemental data: | | | | | | | | | |
Expenses before expense reductions (f) | | | 1.03 | | | | 1.03 | | | | 1.04 | | | | 1.03 | | | | 1.12 | |
Expenses after expense reductions (f) | | | 0.15 | | | | 0.13 | | | | 0.20 | | | | 0.27 | | | | 0.40 | |
Net investment income | | | 0.00 | | | | 0.00 | | | | 0.00 | | | | 0.00 | (w) | | | 0.19 | |
Net assets at end of period (000 omitted) | | | $10,897 | | | | $10,330 | | | | $9,710 | | | | $9,919 | | | | $6,926 | |
| |
| Class 529B | | Years ended 8/31 | |
| | | 2013 | | | 2012 | | | 2011 | | | 2010 | | | 2009 | |
Net asset value, beginning of period | | | $1.00 | | | | $1.00 | | | | $1.00 | | | | $1.00 | | | | $1.00 | |
| Income (loss) from investment operations | | | | | | | | | | | | | |
Net investment income (d) | | | $0.00 | | | | $0.00 | | | | $0.00 | | | | $0.00 | (w) | | | $0.00 | (w) |
Net realized and unrealized gain (loss)
on investments | | | — | | | | — | | | | (0.00 | )(w) | | | 0.00 | (w) | | | (0.00 | )(w) |
Total from investment operations | | | $0.00 | | | | $0.00 | | | | $(0.00 | )(w) | | | $0.00 | (w) | | | $0.00 | (w) |
| Less distributions declared to shareholders | | | | | | | | | | | | | |
From net investment income | | | $— | | | | $— | | | | $— | | | | $(0.00 | )(w) | | | $(0.00 | )(w) |
From tax return of capital | | | — | | | | — | | | | — | | | | (0.00 | )(w) | | | — | |
Total distributions declared to shareholders | | | $— | | | | $— | | | | $— | | | | $(0.00 | )(w) | | | $(0.00 | )(w) |
Net asset value, end of period (x) | | | $1.00 | | | | $1.00 | | | | $1.00 | | | | $1.00 | | | | $1.00 | |
Total return (%) (r)(t) | | | 0.00 | | | | 0.00 | | | | 0.00 | (w) | | | 0.00 | (w) | | | 0.08 | |
Ratios (%) (to average net assets)
and Supplemental data: | | | | | | | | | |
Expenses before expense reductions (f) | | | 1.78 | | | | 1.78 | | | | 1.79 | | | | 1.79 | | | | 1.83 | |
Expenses after expense reductions (f) | | | 0.15 | | | | 0.12 | | | | 0.20 | | | | 0.27 | | | | 0.51 | |
Net investment income | | | 0.00 | | | | 0.00 | | | | 0.00 | | | | 0.00 | (w) | | | 0.04 | |
Net assets at end of period (000 omitted) | | | $676 | | | | $665 | | | | $1,073 | | | | $1,613 | | | | $1,942 | |
See Notes to Financial Statements
17
Financial Highlights – continued
| | | | | | | | | | | | | | | | | | | | |
| Class 529C | | Years ended 8/31 | |
| | | 2013 | | | 2012 | | | 2011 | | | 2010 | | | 2009 | |
Net asset value, beginning of period | | | $1.00 | | | | $1.00 | | | | $1.00 | | | | $1.00 | | | | $1.00 | |
| Income (loss) from investment operations | | | | | | | | | | | | | |
Net investment income (d) | | | $0.00 | | | | $0.00 | | | | $0.00 | | | | $0.00 | (w) | | | $0.00 | (w) |
Net realized and unrealized gain (loss)
on investments | | | — | | | | — | | | | (0.00 | )(w) | | | 0.00 | (w) | | | (0.00 | )(w) |
Total from investment operations | | | $0.00 | | | | $0.00 | | | | $(0.00 | )(w) | | | $0.00 | (w) | | | $0.00 | (w) |
| Less distributions declared to shareholders | | | | | | | | | | | | | |
From net investment income | | | $— | | | | $— | | | | $— | | | | $(0.00 | )(w) | | | $(0.00 | )(w) |
From tax return of capital | | | — | | | | — | | | | — | | | | (0.00 | )(w) | | | — | |
Total distributions declared to shareholders | | | $— | | | | $— | | | | $— | | | | $(0.00 | )(w) | | | $(0.00 | )(w) |
Net asset value, end of period | | | $1.00 | | | | $1.00 | | | | $1.00 | | | | $1.00 | | | | $1.00 | |
Total return (%) (r)(t) | | | 0.00 | | | | 0.00 | | | | 0.00 | (w) | | | 0.00 | (w) | | | 0.08 | |
Ratios (%) (to average net assets)
and Supplemental data: | | | | | | | | | |
Expenses before expense reductions (f) | | | 1.78 | | | | 1.78 | | | | 1.79 | | | | 1.78 | | | | 1.83 | |
Expenses after expense reductions (f) | | | 0.15 | | | | 0.13 | | | | 0.20 | | | | 0.27 | | | | 0.52 | |
Net investment income | | | 0.00 | | | | 0.00 | | | | 0.00 | | | | 0.00 | (w) | | | 0.04 | |
Net assets at end of period (000 omitted) | | | $6,072 | | | | $5,020 | | | | $5,525 | | | | $6,224 | | | | $4,391 | |
| (d) | Per share data is based on average shares outstanding. |
| (f) | Ratios do not reflect reductions from fees paid indirectly, if applicable. |
| (r) | Certain expenses have been reduced without which performance would have been lower. |
| (t) | Total returns do not include any applicable sales charges. |
| (w) | Per share amount was less than $0.01 and total return or ratio was less than 0.01%, as applicable. |
See Notes to Financial Statements
18
NOTES TO FINANCIAL STATEMENTS
(1) Business and Organization
MFS Cash Reserve Fund (the fund) is a series of MFS Series Trust I (the trust). The trust is organized as a Massachusetts business trust and is registered under the Investment Company Act of 1940, as amended, as an open-end management investment company.
(2) Significant Accounting Policies
General – The preparation of financial statements in conformity with U.S. generally accepted accounting principles requires management to make estimates and assumptions that affect the reported amounts of assets and liabilities, and disclosure of contingent assets and liabilities at the date of the financial statements and the reported amounts of revenues and expenses during the reporting period. Actual results could differ from those estimates. In the preparation of these financial statements, management has evaluated subsequent events occurring after the date of the fund’s Statement of Assets and Liabilities through the date that the financial statements were issued.
In January 2013, the Financial Accounting Standards Board (FASB) issued Accounting Standards Update 2013-01 (“ASU 2013-01”) entitled Balance Sheet (Topic 210) – Clarifying the Scope of Disclosures about Offsetting Assets and Liabilities which is intended to clarify the scope of Accounting Standards Update 2011-11 (“ASU 2011-11”), Balance Sheet (Topic 210) – Disclosures about Offsetting Assets and Liabilities. Consistent with the effective date for ASU 2011-11, ASU 2013-01 is effective for annual reporting periods beginning on or after January 1, 2013, and interim periods within those annual periods. ASU 2013-01 limits the scope of ASU 2011-11’s disclosure requirements on offsetting to financial assets and financial liabilities related to derivatives, repurchase and reverse repurchase agreements, and securities lending and securities borrowing transactions. Although still evaluating the potential impact of these two ASUs to the fund, management expects that the impact of the fund’s adoption will be limited to additional financial statement disclosures.
In June 2013, FASB issued Accounting Standards Update 2013-08 Financial Services – Investment Companies (Topic 946) – Amendments to the Scope, Measurement, and Disclosure Requirements (“ASU 2013-08”) which is effective for interim and annual reporting periods in fiscal years that begin after December 15, 2013. ASU 2013-08 sets forth a methodology for determining whether an entity should be characterized as an investment company and prescribes fair value accounting for an investment company’s non-controlling ownership interest in another investment company. FASB has determined that a fund registered under the Investment Company Act of 1940 automatically meets ASU 2013-08’s criteria for an investment company. Although still evaluating the potential impacts of ASU 2013-08 to the fund, management expects that the impact of the fund’s adoption will be limited to additional financial statement disclosures.
Investment Valuations – Pursuant to procedures approved by the Board of Trustees, investments held by the fund are generally valued at amortized cost, which approximates market value. Amortized cost involves valuing an instrument at its cost as adjusted for amortization of premium or accretion of discount rather than its current market value. The amortized cost value of an instrument can be different from the market value of an instrument.
19
Notes to Financial Statements – continued
Various inputs are used in determining the value of the fund’s assets or liabilities. These inputs are categorized into three broad levels. In certain cases, the inputs used to measure fair value may fall into different levels of the fair value hierarchy. In such cases, an investment’s level within the fair value hierarchy is based on the lowest level of input that is significant to the fair value measurement. The fund’s assessment of the significance of a particular input to the fair value measurement in its entirety requires judgment, and considers factors specific to the investment. Level 1 includes unadjusted quoted prices in active markets for identical assets or liabilities. Level 2 includes other significant observable market-based inputs (including quoted prices for similar securities, interest rates, prepayment speed, and credit risk). Level 3 includes unobservable inputs, which may include the adviser’s own assumptions in determining the fair value of investments. The following is a summary of the levels used as of August 31, 2013 in valuing the fund’s assets or liabilities:
| | | | | | | | | | | | | | | | |
| Investments at Value | | Level 1 | | | Level 2 | | | Level 3 | | | Total | |
| Short Term Securities | | | $— | | | | $414,384,000 | | | | $— | | | | $414,384,000 | |
For further information regarding security characteristics, see the Portfolio of Investments.
Repurchase Agreements – The fund entered into repurchase agreements with approved counterparties. Each repurchase agreement is recorded at cost. The fund requires that the securities collateral in a repurchase transaction be transferred to a custodian. The fund monitors, on a daily basis, the value of the collateral to ensure that its value, including accrued interest, is greater than amounts owed to the fund under each such repurchase agreement. The fund and other funds managed by MFS may utilize a joint trading account for the purpose of entering into one or more repurchase agreements.
Indemnifications – Under the fund’s organizational documents, its officers and Trustees may be indemnified against certain liabilities and expenses arising out of the performance of their duties to the fund. Additionally, in the normal course of business, the fund enters into agreements with service providers that may contain indemnification clauses. The fund’s maximum exposure under these agreements is unknown as this would involve future claims that may be made against the fund that have not yet occurred.
Investment Transactions and Income – Investment transactions are recorded on the trade date. Interest income is recorded on the accrual basis. All premium and discount is amortized or accreted for financial statement purposes in accordance with U.S. generally accepted accounting principles.
Fees Paid Indirectly – The fund’s custody fee may be reduced according to an arrangement that measures the value of cash deposited with the custodian by the fund. This amount, for the year ended August 31, 2013, is shown as a reduction of total expenses in the Statement of Operations.
Tax Matters and Distributions – The fund intends to qualify as a regulated investment company, as defined under Subchapter M of the Internal Revenue Code, and to distribute all of its taxable income, including realized capital gains. As a result, no provision for federal income tax is required. The fund’s federal tax returns, when filed, will remain subject to examination by the Internal Revenue Service for a three year period.
20
Notes to Financial Statements – continued
Distributions to shareholders are recorded on the ex-dividend date. Income and capital gain distributions are determined in accordance with income tax regulations, which may differ from U.S. generally accepted accounting principles. Certain capital accounts in the financial statements are periodically adjusted for permanent differences in order to reflect their tax character. These adjustments have no impact on net assets or net asset value per share. Temporary differences which arise from recognizing certain items of income, expense, gain or loss in different periods for financial statement and tax purposes will reverse at some time in the future. Distributions in excess of net investment income or net realized gains are temporary overdistributions for financial statement purposes resulting from differences in the recognition or classification of income or distributions for financial statement and tax purposes.
Book/tax differences primarily relate to the timing of recognition of certain expenses.
The fund declared no distributions for the years ended August 31, 2013 and August 31, 2012.
The federal tax cost and the tax basis components of distributable earnings were as follows:
| | | | |
| As of 8/31/31 | | | |
| Cost of investments | | | $414,384,000 | |
| Capital loss carryforwards | | | (207,708 | ) |
| Late year ordinary loss deferral | | | (1,338 | ) |
| Other temporary differences | | | (13,261 | ) |
Under the Regulated Investment Company Modernization Act of 2010 (the “Act”), net capital losses recognized for fund fiscal years beginning after August 31, 2011 may be carried forward indefinitely, and their character is retained as short-term and/or long-term losses (“post-enactment losses”). Previously, net capital losses were carried forward for eight years and treated as short-term losses (“pre-enactment losses”). As a transition rule, the Act requires that all post-enactment net capital losses be used before pre-enactment net capital losses.
As of August 31, 2013, the fund had capital loss carryforwards available to offset future realized gains as follows:
| | | | |
| Pre-enactment losses expire as follows: | |
| 8/31/15 | | | $(219 | ) |
| 8/31/16 | | | (22,989 | ) |
| 8/31/17 | | | (184,390 | ) |
| Total | | | $(207,598 | ) |
|
Post-enactment losses which are
characterized as follows: | |
| Short-Term | | | $(110 | ) |
Multiple Classes of Shares of Beneficial Interest – The fund offers multiple classes of shares, which differ in their respective distribution, service, and program manager fees. The fund’s income and common expenses are allocated to shareholders based on the value of settled shares outstanding of each class. The fund’s realized and unrealized gain (loss) are allocated to shareholders based on the daily net assets of each class.
21
Notes to Financial Statements – continued
Dividends are declared separately for each class. Differences in per share dividend rates are generally due to differences in separate class expenses. Class B and Class 529B shares will convert to Class A and Class 529A shares, respectively approximately eight years after purchase.
(3) Transactions with Affiliates
Investment Adviser – The fund has an investment advisory agreement with MFS to provide overall investment management and related administrative services and facilities to the fund. The management fee is computed daily and paid monthly at an annual rate of 0.40% of the fund’s average daily net assets.
During the year ended August 31, 2013, MFS voluntarily waived receipt of $1,610,378 of the fund’s management fee in order to avoid a negative yield. Effective April 1, 2013, MFS has agreed in writing to reduce its management fee by a specified amount if certain MFS mutual fund assets exceed thresholds agreed to by MFS and the fund’s Board of Trustees. For the period April 1, 2013 through August 31, 2013 this management fee reduction amounted to $900, which is shown as a reduction of total expenses in the Statement of Operations. For the year ended August 31, 2013, these waivers had the effect of reducing the management fee by 0.40% of average daily net assets on an annualized basis. The management fee incurred for the year ended August 31, 2013 was equivalent to an annual effective rate of 0.00% of the fund’s average daily net assets.
In order to avoid a negative yield for the year ended August 31, 2013, MFS voluntarily agreed to reduce certain other expenses in the amount of $527,376, which is shown as a reduction of total expenses in the Statement of Operations.
Distributor – The Board of Trustees has adopted a distribution plan for certain class shares pursuant to Rule 12b-1 of the Investment Company Act of 1940.
The fund’s distribution plan provides that the fund will pay MFS Fund Distributors, Inc. (MFD) for services provided by MFD and financial intermediaries in connection with the distribution and servicing of certain share classes. One component of the plan is a distribution fee paid to MFD and another component of the plan is a service fee paid to MFD. MFD may subsequently pay all, or a portion, of the distribution and/or service fees to financial intermediaries.
Distribution Plan Fee Table:
| | | | | | | | | | | | | | | | | | | | |
| | | Distribution Fee Rate (d) | | | Service
Fee Rate (d) | | | Total
Distribution
Plan (d) | | | Annual
Effective
Rate (e) | | | Distribution
and Service
Fee | |
| Class A | | | — | | | | 0.25% | | | | 0.25% | | | | 0.00% | | | | $321,389 | |
| Class B | | | 0.75% | | | | 0.25% | | | | 1.00% | | | | 0.00% | | | | 323,260 | |
| Class C | | | 0.75% | | | | 0.25% | | | | 1.00% | | | | 0.00% | | | | 499,004 | |
| Class R1 | | | 0.75% | | | | 0.25% | | | | 1.00% | | | | 0.00% | | | | 226,797 | |
| Class R2 | | | 0.25% | | | | 0.25% | | | | 0.50% | | | | 0.00% | | | | 402,456 | |
| Class R3 | | | — | | | | 0.25% | | | | 0.25% | | | | 0.00% | | | | 178,380 | |
| Class 529A | | | — | | | | 0.25% | | | | 0.25% | | | | 0.00% | | | | 27,211 | |
| Class 529B | | | 0.75% | | | | 0.25% | | | | 1.00% | | | | 0.00% | | | | 6,575 | |
| Class 529C | | | 0.75% | | | | 0.25% | | | | 1.00% | | | | 0.00% | | | | 51,897 | |
| Total Distribution and Service Fees | | | | $2,036,969 | |
22
Notes to Financial Statements – continued
| (d) | In accordance with the distribution plan for certain classes, the fund pays distribution and/or service fees equal to these annual percentage rates of each class’s average daily net assets. The distribution and service fee rates disclosed by class represent the current rates in effect at the end of the reporting period. |
| (e) | The annual effective rates represent actual fees incurred under the distribution plan for the year ended August 31, 2013 based on each class’s average daily net assets. MFD has agreed in writing to waive the Class A and Class 529A service fee. This written agreement will continue until modified by the fund’s Board of Trustees, but such agreement will continue until at least December 31, 2013. These reductions for Class A and Class 529A amounted to $321,389 and $27,211, respectively, and are shown as a reduction of total expenses in the Statement of Operations. During the year ended August 31, 2013, MFD voluntarily waived a receipt of $1,688,369 of the fund’s distribution and service fees to ensure the fund avoids a negative yield for Class B, Class C, Class R1, Class R2, Class R3, Class 529B, and Class 529C shares. This amount is reflected as a reduction of total expenses in the Statement of Operations. |
Certain Class A shares acquired through an exchange may be subject to a contingent deferred sales charge (CDSC) upon redemption depending on when the shares exchanged were originally purchased. Class C and Class 529C shares are subject to a CDSC in the event of a shareholder redemption within 12 months of purchase. Class B and Class 529B shares are subject to a CDSC in the event of a shareholder redemption within six years of purchase. All contingent deferred sales charges are paid to MFD and during the year ended August 31, 2013, were as follows:
| | | | |
| | | Amount | |
| Class A | | | $106 | |
| Class B | | | 102,196 | |
| Class C | | | 13,990 | |
| Class 529C | | | 50 | |
The fund has entered into and may from time to time enter into contracts with program managers and other parties which administer the tuition programs through which an investment in the fund’s 529 share classes is made. The fund has entered into an agreement with MFD pursuant to which MFD receives an annual fee of up to 0.10% of the average daily net assets attributable to each 529 share class. MFD has agreed to waive a portion of this fee in an amount equal to 0.05% of the average daily net assets for each 529 share class. This waiver agreement will expire on December 31, 2014, unless MFD elects to extend the waiver. For the year ended August 31, 2013, this waiver amounted to $8,366. In addition, MFS voluntarily waived receipt of $8,366 of the fund’s program manager fees in order to avoid a negative yield for Class 529A, Class 529B, and Class 529C shares. This voluntary waiver had the effect of reducing the program manager fee by 0.05% of average daily net assets attributable to Class 529A, Class 529B, and Class 529C shares on an annualized basis. The program manager fee incurred for the year ended August 31, 2013 was equivalent to an annual effective rate of 0.00% of the average daily net assets attributable to each 529 share class. The services provided by MFD, or a third party with which MFD contracts, include recordkeeping and tax reporting and account services, as well as services designed to
23
Notes to Financial Statements – continued
maintain the program’s compliance with the Internal Revenue Code and other regulatory requirements. Program manager fees and waivers for the year ended August 31, 2013, were as follows:
| | | | | | | | |
| | | Fee | | | Waiver | |
| Class 529A | | | $10,884 | | | | $10,884 | |
| Class 529B | | | 658 | | | | 658 | |
| Class 529C | | | 5,190 | | | | 5190 | |
| Total Program Manager Fees and Waivers | | | $16,732 | | | | $16,732 | |
Shareholder Servicing Agent – MFS Service Center, Inc. (MFSC), a wholly-owned subsidiary of MFS, receives a fee from the fund for its services as shareholder servicing agent calculated as a percentage of the average daily net assets of the fund as determined periodically under the supervision of the fund’s Board of Trustees. For the year ended August 31, 2013, the fee was $244,349, which equated to 0.0607% annually of the fund’s average daily net assets. MFSC also receives payment from the fund for out-of-pocket expenses, sub-accounting and other shareholder servicing costs which may be paid to affiliated and unaffiliated service providers. For the year ended August 31, 2013, these out-of-pocket expenses, sub-accounting and other shareholder servicing costs amounted to $580,031.
Administrator – MFS provides certain financial, legal, shareholder communications, compliance, and other administrative services to the fund. Under an administrative services agreement, the fund partially reimburses MFS the costs incurred to provide these services. The fund is charged an annual fixed amount of $17,500 plus a fee based on average daily net assets. The administrative services fee incurred for the year ended August 31, 2013 was equivalent to an annual effective rate of 0.0155% of the fund’s average daily net assets.
Trustees’ and Officers’ Compensation – The fund pays compensation to independent Trustees in the form of a retainer, attendance fees, and additional compensation to Board and Committee chairpersons. The fund does not pay compensation directly to Trustees or officers of the fund who are also officers of the investment adviser, all of whom receive remuneration for their services to the fund from MFS. Certain officers and Trustees of the fund are officers or directors of MFS, MFD, and MFSC.
Prior to December 31, 2001, the fund had an unfunded defined benefit plan (“DB plan”) for independent Trustees. As of December 31, 2001, the Board took action to terminate the DB plan with respect to then-current and any future independent Trustees, such that the DB plan covers only certain of those former independent Trustees who retired on or before December 31, 2001. The DB plan resulted in a pension expense of $788 and is included in independent Trustees’ compensation for the year ended August 31, 2013. The liability for deferred retirement benefits payable to certain independent Trustees under the DB plan amounted to $13,261 at August 31, 2013, and is included in “Payable for independent Trustees’ compensation” in the Statement of Assets and Liabilities.
Other – This fund and certain other funds managed by MFS (the funds) have entered into services agreements (the Agreements) which provide for payment of fees by the
24
Notes to Financial Statements – continued
funds to Tarantino LLC and Griffin Compliance LLC in return for the provision of services of an Independent Chief Compliance Officer (ICCO) and Assistant ICCO, respectively, for the funds. The ICCO and Assistant ICCO are officers of the funds and the sole members of Tarantino LLC and Griffin Compliance LLC, respectively. The funds can terminate the Agreements with Tarantino LLC and Griffin Compliance LLC at any time under the terms of the Agreements. For the year ended August 31, 2013, the aggregate fees paid by the fund to Tarantino LLC and Griffin Compliance LLC were $2,880 and are included in “Miscellaneous” expense in the Statement of Operations. MFS has agreed to reimburse the fund for a portion of the payments made by the fund in the amount of $1,078, which is shown as a reduction of total expenses in the Statement of Operations. Additionally, MFS has agreed to bear all expenses associated with office space, other administrative support, and supplies provided to the ICCO and Assistant ICCO.
(4) Shares of Beneficial Interest
The fund’s Declaration of Trust permits the Trustees to issue an unlimited number of full and fractional shares of beneficial interest. Transactions in fund shares were as follows:
| | | | | | | | | | | | | | | | |
| | | Year ended
8/31/13 | | | Year ended
8/31/12 | |
| | | Shares | | | Amount | | | Shares | | | Amount | |
| Shares sold | | | | | | | | | | | | | |
Class A | | | 90,857,358 | | | | $90,857,364 | | | | 57,061,460 | | | | $57,061,469 | |
Class B | | | 18,713,001 | | | | 18,713,002 | | | | 15,789,004 | | | | 15,789,004 | |
Class C | | | 50,242,109 | | | | 50,242,109 | | | | 33,095,076 | | | | 33,095,075 | |
Class R1 | | | 8,748,971 | | | | 8,748,971 | | | | 6,221,434 | | | | 6,221,434 | |
Class R2 | | | 22,356,847 | | | | 22,356,847 | | | | 21,753,341 | | | | 21,753,341 | |
Class R3 | | | 20,910,727 | | | | 20,910,725 | | | | 16,302,385 | | | | 16,302,385 | |
Class R4 | | | 373,688 | | | | 373,688 | | | | 5,164,020 | | | | 5,164,020 | |
Class 529A | | | 5,719,574 | | | | 5,719,574 | | | | 4,265,918 | | | | 4,265,919 | |
Class 529B | | | 386,062 | | | | 386,062 | | | | 263,423 | | | | 263,423 | |
Class 529C | | | 3,685,179 | | | | 3,685,179 | | | | 2,477,346 | | | | 2,477,345 | |
| | | 221,993,516 | | | | $221,993,521 | | | | 162,393,407 | | | | $162,393,415 | |
| | | |
| Shares reacquired | | | | | | | | | | | | | |
Class A | | | (72,078,513 | ) | | | $(72,078,513 | ) | | | (84,412,371 | ) | | | $(84,412,372 | ) |
Class B | | | (22,978,285 | ) | | | (22,978,292 | ) | | | (31,069,642 | ) | | | (31,069,650 | ) |
Class C | | | (41,729,343 | ) | | | (41,729,343 | ) | | | (45,187,020 | ) | | | (45,187,020 | ) |
Class R1 | | | (12,030,084 | ) | | | (12,030,084 | ) | | | (10,565,350 | ) | | | (10,565,350 | ) |
Class R2 | | | (31,674,198 | ) | | | (31,674,198 | ) | | | (42,160,206 | ) | | | (42,160,206 | ) |
Class R3 | | | (35,015,288 | ) | | | (35,015,288 | ) | | | (22,875,541 | ) | | | (22,875,541 | ) |
Class R4 | | | (364,480 | ) | | | (364,479 | ) | | | (10,096,711 | ) | | | (10,096,711 | ) |
Class 529A | | | (5,151,748 | ) | | | (5,151,747 | ) | | | (3,645,993 | ) | | | (3,645,993 | ) |
Class 529B | | | (375,895 | ) | | | (375,896 | ) | | | (671,541 | ) | | | (671,541 | ) |
Class 529C | | | (2,632,719 | ) | | | (2,632,719 | ) | | | (2,981,917 | ) | | | (2,981,917 | ) |
| | | (224,030,553 | ) | | | $(224,030,559 | ) | | | (253,666,292 | ) | | | $(253,666,301 | ) |
25
Notes to Financial Statements – continued
| | | | | | | | | | | | | | | | |
| | | Year ended
8/31/13 | | | Year ended
8/31/12 | |
| | | Shares | | | Amount | | | Shares | | | Amount | |
| Net change | | | | | | | | | | | | | | | | |
Class A | | | 18,778,845 | | | | $18,778,851 | | | | (27,350,911 | ) | | | $(27,350,903 | ) |
Class B | | | (4,265,284 | ) | | | (4,265,290 | ) | | | (15,280,638 | ) | | | (15,280,646 | ) |
Class C | | | 8,512,766 | | | | 8,512,766 | | | | (12,091,944 | ) | | | (12,091,945 | ) |
Class R1 | | | (3,281,113 | ) | | | (3,281,113 | ) | | | (4,343,916 | ) | | | (4,343,916 | ) |
Class R2 | | | (9,317,351 | ) | | | (9,317,351 | ) | | | (20,406,865 | ) | | | (20,406,865 | ) |
Class R3 | | | (14,104,561 | ) | | | (14,104,563 | ) | | | (6,573,156 | ) | | | (6,573,156 | ) |
Class R4 | | | 9,208 | | | | 9,209 | | | | (4,932,691 | ) | | | (4,932,691 | ) |
Class 529A | | | 567,826 | | | | 567,827 | | | | 619,925 | | | | 619,926 | |
Class 529B | | | 10,167 | | | | 10,166 | | | | (408,118 | ) | | | (408,118 | ) |
Class 529C | | | 1,052,460 | | | | 1,052,460 | | | | (504,571 | ) | | | (504,572 | ) |
| | | (2,037,037 | ) | | | $(2,037,038 | ) | | | (91,272,885 | ) | | | $(91,272,886 | ) |
The sale of fund shares has been suspended except in special circumstances. Please see the fund’s prospectus for details.
(5) Line of Credit
The fund and certain other funds managed by MFS participate in a $1.1 billion unsecured committed line of credit, subject to a $1 billion sublimit, provided by a syndication of banks under a credit agreement. Borrowings may be made for temporary financing needs. Interest is charged to each fund, based on its borrowings, generally at a rate equal to the higher of the Federal Reserve funds rate or one month LIBOR plus an agreed upon spread. A commitment fee, based on the average daily, unused portion of the committed line of credit, is allocated among the participating funds at the end of each calendar quarter. In addition, the fund and other funds managed by MFS have established unsecured uncommitted borrowing arrangements with certain banks for temporary financing needs. Interest is charged to each fund, based on its borrowings, at a rate equal to the Federal Reserve funds rate plus an agreed upon spread. For the year ended August 31, 2013, the fund’s commitment fee and interest expense were $2,187 and $0, respectively, and are included in “Miscellaneous” expense in the Statement of Operations.
26
REPORT OF INDEPENDENT REGISTERED PUBLIC ACCOUNTING FIRM
To the Board of Trustees of MFS Series Trust I and the Shareholders of MFS Cash Reserve Fund:
We have audited the accompanying statement of assets and liabilities, including the portfolio of investments, of MFS Cash Reserve Fund (one of the portfolios comprising MFS Series Trust I) (the “Fund”) as of August 31, 2013, and the related statement of operations for the year then ended, the statements of changes in net assets for each of the two years in the period then ended, and the financial highlights for each of the five years in the period then ended. These financial statements and financial highlights are the responsibility of the Fund’s management. Our responsibility is to express an opinion on these financial statements and financial highlights based on our audits.
We conducted our audits in accordance with the standards of the Public Company Accounting Oversight Board (United States). Those standards require that we plan and perform the audit to obtain reasonable assurance about whether the financial statements and financial highlights are free of material misstatement. The Fund is not required to have, nor were we engaged to perform, an audit of its internal control over financial reporting. Our audits included consideration of internal control over financial reporting as a basis for designing audit procedures that are appropriate in the circumstances, but not for the purpose of expressing an opinion on the effectiveness of the Fund’s internal control over financial reporting. Accordingly, we express no such opinion. An audit also includes examining, on a test basis, evidence supporting the amounts and disclosures in the financial statements, assessing the accounting principles used and significant estimates made by management, as well as evaluating the overall financial statement presentation. Our procedures included confirmation of securities owned as of August 31, 2013, by correspondence with the custodian and brokers; where replies were not received from brokers, we performed other auditing procedures. We believe that our audits provide a reasonable basis for our opinion.
In our opinion, the financial statements and financial highlights referred to above present fairly, in all material respects, the financial position of MFS Cash Reserve Fund as of August 31, 2013, the results of its operations for the year then ended, the changes in its net assets for each of the two years in the period then ended, and the financial highlights for each of the five years in the period then ended, in conformity with accounting principles generally accepted in the United States of America.
DELOITTE & TOUCHE LLP
Boston, Massachusetts
October 17, 2013
27
TRUSTEES AND OFFICERS — IDENTIFICATION AND BACKGROUND
The Trustees and Officers of the Trust, as of October 1, 2013, are listed below, together with their principal occupations during the past five years. (Their titles may have varied during that period.) The address of each Trustee and officer is 111 Huntington Avenue, Boston, Massachusetts 02199-7618.
| | | | | | | | |
Name, Age | | Position(s) Held with Fund | | Trustee/Officer
Since (h) | | Principal
Occupations During the Past Five Years | | Other Directorships (j) |
| INTERESTED TRUSTEES |
Robert J. Manning (k) (age 49) | | Trustee | | February 2004 | | Massachusetts Financial Services Company, Chairman, Chief Executive Officer and Director; President (until 2009); Chief Investment Officer (until 2010) | | N/A |
| INDEPENDENT TRUSTEES |
David H. Gunning (age 71) | | Trustee and Chair of Trustees | | January 2004 | | Private investor | | Lincoln Electric Holdings, Inc. (welding equipment manufacturer), Director; Development Alternatives, Inc. (consulting), Director/Non-Executive Chairman; Portman Limited (mining), Director (until 2008) |
Robert E. Butler (age 71) | | Trustee | | January 2006 | | Consultant – investment company industry regulatory and compliance matters | | N/A |
Maureen R. Goldfarb (age 58) | | Trustee | | January 2009 | | Private investor | | N/A |
William R. Gutow (age 72) | | Trustee | | December 1993 | | Private investor and real estate consultant; Capitol Entertainment Management Company (video franchise), Vice Chairman | | Texas Donuts (donut franchise), Vice Chairman (until 2010) |
28
Trustees and Officers – continued
| | | | | | | | |
Name, Age | | Position(s) Held with Fund | | Trustee/Officer
Since (h) | | Principal
Occupations During the Past Five Years | | Other Directorships (j) |
Michael Hegarty (age 68) | | Trustee | | December 2004 | | Private investor | | Brookfield Office Properties, Inc. (real estate), Director; Rouse Properties Inc. (real estate), Director; Capmark Financial Group Inc. (real estate), Director |
John P. Kavanaugh (age 58) | | Trustee | | January 2009 | | Private investor | | N/A |
J. Dale Sherratt (age 75) | | Trustee | | June 1989 | | Insight Resources, Inc. (acquisition planning specialists), President; Wellfleet Investments (investor in health care companies), Managing General Partner | | N/A |
Laurie J. Thomsen (age 56) | | Trustee | | March 2005 | | Private investor; New Profit, Inc. (venture philanthropy), Executive Partner (until 2010) | | The Travelers Companies (insurance), Director |
Robert W. Uek (age 72) | | Trustee | | January 2006 | | Consultant to investment company industry | | N/A |
| OFFICERS |
John M. Corcoran (k) (age 48) | | President | | October 2008 | | Massachusetts Financial Services Company, Senior Vice President (since October 2008); State Street Bank and Trust (financial services provider), Senior Vice President, (until 2008) | | N/A |
Christopher R. Bohane (k) (age 39) | | Assistant Secretary and Assistant Clerk | | July 2005 | | Massachusetts Financial Services Company, Vice President and Assistant General Counsel | | N/A |
Kino Clark (k) (age 45) | | Assistant Treasurer | | January 2012 | | Massachusetts Financial Services Company, Vice President | | N/A |
29
Trustees and Officers – continued
| | | | | | | | |
Name, Age | | Position(s) Held with Fund | | Trustee/Officer
Since (h) | | Principal
Occupations During the Past Five Years | | Other Directorships (j) |
Thomas H. Connors (k) (age 54) | | Assistant Secretary and Assistant Clerk | | September 2012 | | Massachusetts Financial Services Company, Vice President and Senior Counsel; Deutsche Investment Management Americas Inc. (financial service provider), Director and Senior Counsel (until 2012) | | N/A |
Ethan D. Corey (k) (age 49) | | Assistant Secretary and Assistant Clerk | | July 2005 | | Massachusetts Financial Services Company, Senior Vice President and Associate General Counsel | | N/A |
David L. DiLorenzo (k)
(age 45) | | Treasurer | | July 2005 | | Massachusetts Financial Services Company, Senior Vice President | | N/A |
Robyn L. Griffin (age 38) | | Assistant Independent Chief Compliance Officer | | August 2008 | | Griffin Compliance LLC (provider of compliance services), Principal (since August 2008); State Street Corporation (financial services provider), Mutual Fund Administration Assistant Vice President (until 2008) | | N/A |
Brian E. Langenfeld (k) (age 40) | | Assistant Secretary and Assistant Clerk | | June 2006 | | Massachusetts Financial Services Company, Vice President and Senior Counsel | | N/A |
Susan S. Newton (k) (age 63) | | Assistant Secretary and Assistant Clerk | | May 2005 | | Massachusetts Financial Services Company, Senior Vice President and Associate General Counsel | | N/A |
Susan A. Pereira (k) (age 42) | | Assistant Secretary and Assistant Clerk | | July 2005 | | Massachusetts Financial Services Company, Vice President and Senior Counsel | | N/A |
30
Trustees and Officers – continued
| | | | | | | | |
Name, Age | | Position(s) Held with Fund | | Trustee/Officer
Since (h) | | Principal
Occupations During the Past Five Years | | Other Directorships (j) |
Kasey L. Phillips (k) (age 42) | | Assistant Treasurer | | September 2012 | | Massachusetts Financial Services Company, Vice President; Wells Fargo Funds Management, LLC, Senior Vice President, Fund Treasurer (until 2012) | | N/A |
Mark N. Polebaum (k) (age 61) | | Secretary and Clerk | | January 2006 | | Massachusetts Financial Services Company, Executive Vice President, General Counsel and Secretary | | N/A |
Frank L. Tarantino (age 69) | | Independent Chief Compliance Officer | | June 2004 | | Tarantino LLC (provider of compliance services), Principal | | N/A |
Richard S. Weitzel (k) (age 43) | | Assistant Secretary and Assistant Clerk | | October 2007 | | Massachusetts Financial Services Company, Senior Vice President and Associate General Counsel | | N/A |
James O. Yost (k) (age 53) | | Deputy Treasurer | | September 1990 | | Massachusetts Financial Services Company, Senior Vice President | | N/A |
| (h) | Date first appointed to serve as Trustee/officer of an MFS Fund. Each Trustee has served continuously since appointment unless indicated otherwise. For the period from December 15, 2004 until February 22, 2005, Mr. Manning served as Advisory Trustee. For the period October 2008, until January 2012, Mr. Corcoran served as Treasurer of the Funds. Prior to January 2012, Messrs. DiLorenzo and Yost served as Assistant Treasurers of the Funds. |
| (j) | Directorships or trusteeships of companies required to report to the Securities and Exchange Commission (i.e., “public companies”). |
| (k) | “Interested person” of the Trust within the meaning of the Investment Company Act of 1940 (referred to as the 1940 Act), which is the principal federal law governing investment companies like the fund, as a result of position with MFS. The address of MFS is 111 Huntington Avenue, Boston, Massachusetts 02199-7618. |
Each Trustee has been elected by shareholders and each Trustee and officer holds office until his or her successor is chosen and qualified or until his or her earlier death, resignation, retirement or removal. The Trust does not hold annual meetings for the purpose of electing Trustees, and Trustees are not elected for fixed terms. Messrs. Butler, Kavanaugh, Uek and Ms. Thomsen are members of the Trust’s Audit Committee.
Each of the Fund’s Trustees and officers holds comparable positions with certain other funds of which MFS or a subsidiary is the investment adviser or distributor, and, in the case of the officers, with certain affiliates of MFS. As of January 1, 2013, the Trustees served as board members of 143 funds within the MFS Family of Funds.
31
Trustees and Officers – continued
The Statement of Additional Information for the Fund includes further information about the Trustees and is available without charge upon request by calling 1-800-225-2606.
| | |
| Investment Adviser | | Custodian |
Massachusetts Financial Services Company
111 Huntington Avenue
Boston, MA 02199-7618 | | State Street Bank and Trust Company 1 Lincoln Street Boston, MA 02111-2900 |
| Distributor | | Independent Registered Public Accounting Firm |
MFS Fund Distributors, Inc.
111 Huntington Avenue
Boston, MA 02199-7618 | | Deloitte & Touche LLP 200 Berkeley Street
Boston, MA 02116 |
| Portfolio Manager | | |
Edward O’Dette | | |
32
BOARD REVIEW OF INVESTMENT ADVISORY AGREEMENT
The Investment Company Act of 1940 requires that both the full Board of Trustees and a majority of the non-interested (“independent”) Trustees, voting separately, annually approve the continuation of the Fund’s investment advisory agreement with MFS. The Trustees consider matters bearing on the Fund and its advisory arrangements at their meetings throughout the year, including a review of performance data at each regular meeting. In addition, the independent Trustees met several times over the course of three months beginning in May and ending in July, 2013 (“contract review meetings”) for the specific purpose of considering whether to approve the continuation of the investment advisory agreement for the Fund and the other investment companies that the Board oversees (the “MFS Funds”). The independent Trustees were assisted in their evaluation of the Fund’s investment advisory agreement by independent legal counsel, from whom they received separate legal advice and with whom they met separately from MFS during various contract review meetings. The independent Trustees were also assisted in this process by the MFS Funds’ Independent Chief Compliance Officer, a full-time senior officer appointed by and reporting to the independent Trustees.
In connection with their deliberations regarding the continuation of the investment advisory agreement, the Trustees, including the independent Trustees, considered such information and factors as they believed, in light of the legal advice furnished to them and their own business judgment, to be relevant. The investment advisory agreement for the Fund was considered separately, although the Trustees also took into account the common interests of all MFS Funds in their review. As described below, the Trustees considered the nature, quality, and extent of the various investment advisory, administrative, and shareholder services performed by MFS under the existing investment advisory agreement and other arrangements with the Fund.
In connection with their contract review meetings, the Trustees received and relied upon materials that included, among other items: (i) information provided by Lipper Inc., an independent third party, on the investment performance of the Fund for various time periods ended December 31, 2012 and the investment performance of a group of funds with substantially similar investment classifications/objectives (the “Lipper performance universe”), (ii) information provided by Lipper Inc. on the Fund’s advisory fees and other expenses and the advisory fees and other expenses of comparable funds identified by Lipper Inc. (the “Lipper expense group”), (iii) information provided by MFS on the advisory fees of comparable portfolios of other clients of MFS, including institutional separate accounts and other clients, (iv) information as to whether and to what extent applicable expense waivers, reimbursements or fee “breakpoints” are observed for the Fund, (v) information regarding MFS’ financial results and financial condition, including MFS’ and certain of its affiliates’ estimated profitability from services performed for the Fund and the MFS Funds as a whole, and compared to MFS’ institutional business, (vi) MFS’ views regarding the outlook for the mutual fund industry and the strategic business plans of MFS, (vii) descriptions of various functions performed by MFS for the Funds, such as compliance monitoring and portfolio trading practices, and (viii) information regarding the overall organization of MFS, including information about MFS’ senior management and other personnel providing investment advisory, administrative and other services to
33
Board Review of Investment Advisory Agreement – continued
the Fund and the other MFS Funds. The comparative performance, fee and expense information prepared and provided by Lipper Inc. was not independently verified and the independent Trustees did not independently verify any information provided to them by MFS.
The Trustees’ conclusion as to the continuation of the investment advisory agreement was based on a comprehensive consideration of all information provided to the Trustees and not the result of any single factor. Some of the factors that figured particularly in the Trustees’ deliberations are described below, although individual Trustees may have evaluated the information presented differently from one another, giving different weights to various factors. It is also important to recognize that the fee arrangements for the Fund and other MFS Funds are the result of years of review and discussion between the independent Trustees and MFS, that certain aspects of such arrangements may receive greater scrutiny in some years than in others, and that the Trustees’ conclusions may be based, in part, on their consideration of these same arrangements during the course of the year and in prior years.
Based on information provided by Lipper Inc. and MFS, the Trustees reviewed the Fund’s total return investment performance as well as the performance of peer groups of funds over various time periods. The Trustees placed particular emphasis on the total return performance of the Fund’s Class A shares in comparison to the performance of funds in its Lipper performance universe over the three-year period ended December 31, 2012, which the Trustees believed was a long enough period to reflect differing market conditions. The total return performance of the Fund’s Class A shares was in the 4th quintile relative to the other funds in the universe for this three-year period (the 1st quintile being the best performers and the 5th quintile being the worst performers). The total return performance of the Fund’s Class A shares was in the 4th quintile for each of the one- and five-year periods ended December 31, 2012 relative to the Lipper performance universe. Because of the passage of time, these performance results may differ from the performance results for more recent periods, including those shown elsewhere in this report.
In the course of their deliberations, the Trustees took into account information provided by MFS in connection with the contract review meetings, as well as during investment review meetings conducted with portfolio management personnel during the course of the year regarding the Fund’s performance. In addition, the Trustees noted the market conditions affecting all money market funds, in particular the low interest rate environment, and MFS’ voluntary waiver of its fees to ensure that the Fund avoids a negative yield. After reviewing these and related factors, the Trustees concluded, within the context of their overall conclusions regarding the investment advisory agreement, that they were satisfied with MFS’ responses and efforts relating to investment performance.
In assessing the reasonableness of the Fund’s advisory fee, the Trustees considered, among other information, the Fund’s advisory fee and the total expense ratio of the Fund’s Class A shares as a percentage of average daily net assets and the advisory fee and total expense ratios of peer groups of funds based on information provided by Lipper Inc. The Trustees considered that MFS Fund Distributors, Inc. (“MFD”), an affiliate of MFS, currently observes a Class A 12b-1 fee waiver, which may not be changed without the Trustees’ approval. The Trustees also considered that, according
34
Board Review of Investment Advisory Agreement – continued
to the Lipper data (which takes into account any fee reductions or expense limitations that were in effect during the Fund’s last fiscal year), the Fund’s effective advisory fee rate was lower than the Lipper expense group median, and the Fund’s total expense ratio was approximately at the Lipper expense group median.
The Trustees also considered the advisory fees charged by MFS to any comparable institutional accounts. In comparing these fees, the Trustees considered information provided by MFS as to the generally broader scope of services provided by MFS to the Fund in comparison to institutional accounts, the higher demands placed on MFS’ investment personnel and trading infrastructure as a result of the daily cash in-flows and out-flows of the Fund, and the impact on MFS and expenses associated with the more extensive regulatory regime to which the Fund is subject in comparison to institutional accounts.
The Trustees also considered whether the Fund may benefit from any economies of scale in the management of the Fund in the event of growth in assets of the Fund and/or growth in assets of the MFS Funds as a whole. They noted that the Fund’s advisory fee rate schedule is not subject to any breakpoints. Taking into account that the Fund’s effective advisory fee rate was lower than the Lipper expense group median described above, the Trustees determined not to recommend any advisory fee breakpoints for the Fund at this time. The Trustees also noted that MFS has agreed in writing to waive a portion of the management fees of certain MFS Funds, including the Fund, if the total combined assets of certain funds within the MFS Funds’ complex increase above agreed upon thresholds (the “group fee waiver”), enabling the Fund’s shareholders to share in the benefits from any economies of scale at the complex level. The group fee waiver is reviewed and renewed annually between the Board and MFS. The Trustees concluded that the group fee waiver was sufficient to allow the Fund to benefit from economies of scale as its assets and overall complex assets grow.
The Trustees also considered information prepared by MFS relating to MFS’ costs and profits with respect to the Fund, the MFS Funds considered as a group, and other investment companies and accounts advised by MFS, as well as MFS’ methodologies used to determine and allocate its costs to the MFS Funds, the Fund and other accounts and products for purposes of estimating profitability.
After reviewing these and other factors described herein, the Trustees concluded, within the context of their overall conclusions regarding the investment advisory agreement, that the advisory fees charged to the Fund represent reasonable compensation in light of the services being provided by MFS to the Fund.
In addition, the Trustees considered MFS’ resources and related efforts to continue to retain, attract and motivate capable personnel to serve the Fund. The Trustees also considered current and developing conditions in the financial services industry, including the presence of large and well-capitalized companies which are spending, and appear to be prepared to continue to spend, substantial sums to engage personnel and to provide services to competing investment companies. In this regard, the Trustees also considered the financial resources of MFS and its ultimate parent, Sun Life Financial Inc. The Trustees also considered the advantages and possible disadvantages to the Fund of having an adviser that also serves other investment companies as well as other accounts.
35
Board Review of Investment Advisory Agreement – continued
The Trustees also considered the nature, quality, cost, and extent of administrative, transfer agency, and distribution services provided to the Fund by MFS and its affiliates under agreements and plans other than the investment advisory agreement, including any 12b-1 fees the Fund pays to MFD. The Trustees also considered the nature, extent and quality of certain other services MFS performs or arranges for on the Fund’s behalf, which may include securities lending programs, directed expense payment programs, class action recovery programs, and MFS’ interaction with third-party service providers, principally custodians and sub-custodians. The Trustees concluded that the various non-advisory services provided by MFS and its affiliates on behalf of the Fund were satisfactory.
The Trustees also considered benefits to MFS from the use of the Fund’s portfolio brokerage commissions, if applicable, to pay for investment research and various other factors. Additionally, the Trustees considered so-called “fall-out benefits” to MFS such as reputational value derived from serving as investment manager to the Fund.
Based on their evaluation of factors that they deemed to be material, including those factors described above, the Board of Trustees, including the independent Trustees, concluded that the Fund’s investment advisory agreement with MFS should be continued for an additional one-year period, commencing August 1, 2013.
A discussion regarding the Board’s most recent review and renewal of the fund’s Investment Advisory Agreement with MFS is available by clicking on the fund’s name under “Mutual Funds” in the “Products” section of the MFS Web site (mfs.com).
36
PROXY VOTING POLICIES AND INFORMATION
A general description of the MFS funds’ proxy voting policies and procedures is available without charge, upon request, by calling 1-800-225-2606, by visiting the Proxy Voting section of mfs.com or by visiting the SEC’s Web site at http://www.sec.gov.
Information regarding how the fund voted proxies relating to portfolio securities during the most recent twelve-month period ended June 30 is available without charge by visiting the Proxy Voting section of mfs.com or by visiting the SEC’s Web site at http://www.sec.gov.
QUARTERLY PORTFOLIO DISCLOSURE
The fund will file a complete schedule of portfolio holdings with the Securities and Exchange Commission (the Commission) for the first and third quarters of each fiscal year on Form N-Q. A shareholder can obtain the quarterly portfolio holdings report at mfs.com. The fund’s Form N-Q is also available on the EDGAR database on the Commission’s Internet Web site at http://www.sec.gov, and may be reviewed and copied at the:
Public Reference Room
Securities and Exchange Commission
100 F Street, NE, Room 1580
Washington, D.C. 20549
Information on the operation of the Public Reference Room may be obtained by calling the Commission at 1-800-SEC-0330. Copies of the fund’s Form N-Q also may be obtained, upon payment of a duplicating fee, by electronic request at the following e-mail address: publicinfo@sec.gov or by writing the Public Reference Section at the above address.
FURTHER INFORMATION
From time to time, MFS may post important information about the fund or the MFS funds on the MFS web site (mfs.com). This information is available by visiting the “News & Commentary” section of mfs.com or by clicking on the fund’s name under “Mutual Funds” in the “Products” section of mfs.com.
FEDERAL TAX INFORMATION (unaudited)
The fund will notify shareholders of amounts for use in preparing 2013 income tax forms in January 2014.
37
rev. 3/11
| | | | |
| | | |
FACTS | | WHAT DOES MFS DO WITH YOUR PERSONAL INFORMATION? | |  |
| | |
| Why? | | Financial companies choose how they share your personal information. Federal law gives consumers the right to limit some but not all sharing. Federal law also requires us to tell you how we collect, share, and protect your personal information. Please read this notice carefully to understand what we do. |
| | |
| What? | | The types of personal information we collect and share depend on the product or service you have with us. This information can include: • Social Security number and account balances • Account transactions and transaction history • Checking account information and wire transfer instructions When you are no longer our customer, we continue to share your information as described in this notice. |
| | |
| How? | | All financial companies need to share customers’ personal information to run their everyday business. In the section below, we list the reasons financial companies can share their customers’ personal information; the reasons MFS chooses to share; and whether you can limit this sharing. |
| | | | |
Reasons we can share your
personal information | | Does MFS
share? | | Can you limit
this sharing? |
For our everyday business purposes – such as to process your transactions, maintain your account(s), respond to court orders and legal investigations, or report to credit bureaus | | Yes | | No |
For our marketing purposes – to offer our products and services to you | | No | | We don’t share |
| For joint marketing with other financial companies | | No | | We don’t share |
For our affiliates’ everyday business purposes – information about your transactions and experiences | | No | | We don’t share |
For our affiliates’ everyday business purposes – information about your creditworthiness | | No | | We don’t share |
| For nonaffiliates to market to you | | No | | We don’t share |
| | |
| Questions? | | Call 800-225-2606 or go to mfs.com. |
38
| | |
| Who we are |
| Who is providing this notice? | | MFS Funds, MFS Investment Management, MFS Institutional Advisors, Inc., MFS Fund Distributors, Inc., MFS Heritage Trust Company, and MFS Service Center, Inc. |
| | |
| What we do |
| How does MFS protect my personal information? | | To protect your personal information from unauthorized access and use, we use security measures that comply with federal law. These measures include procedural, electronic, and physical safeguards for the protection of the personal information we collect about you. |
| How does MFS collect my personal information? | | We collect your personal information, for example, when you • open an account or provide account information • direct us to buy securities or direct us to sell your securities • make a wire transfer We also collect your personal information from others, such as credit bureaus, affiliates and other companies. |
| Why can’t I limit all sharing? | | Federal law gives you the right to limit only • sharing for affiliates’ everyday business purposes – information about your creditworthiness • affiliates from using your information to market to you • sharing for nonaffiliates to market to you State laws and individual companies may give you additional rights to limit sharing. |
| | |
| Definitions |
| Affiliates | | Companies related by common ownership or control. They can be financial and nonfinancial companies. • MFS does not share personal information with affiliates, except for everyday business purposes as described on page one of this notice. |
| Nonaffiliates | | Companies not related by common ownership or control. They can be financial and nonfinancial companies. • MFS does not share with nonaffiliates so they can market to you. |
| Joint Marketing | | A formal agreement between nonaffiliated financial companies that together market financial products or services to you. • MFS doesn’t jointly market. |
| | |
| Other important information |
| If you own an MFS product or receive an MFS service in the name of a third party such as a bank or broker-dealer, their privacy policy may apply to you instead of ours. |
39
Save paper with eDelivery.

| MFS® will send you prospectuses, |
reports, and proxies directly via e-mail so you will get information faster with less mailbox clutter.
To sign up:
1. Go to mfs.com.
2. Log in via MFS® Access.
3. Select eDelivery.
If you own your MFS fund shares through a financial institution or a retirement plan, MFS® TALK, MFS® Access, or eDelivery may not be available to you.
CONTACT
WEB SITE
mfs.com
MFS TALK
1-800-637-8255
24 hours a day
ACCOUNT SERVICE AND LITERATURE
Shareholders
1-800-225-2606
Financial advisors
1-800-343-2829
Retirement plan services
1-800-637-1255
MAILING ADDRESS
MFS Service Center, Inc.
P.O. Box 55824
Boston, MA 02205-5824
OVERNIGHT MAIL
MFS Service Center, Inc.
c/o Boston Financial Data Services
30 Dan Road
Canton, MA 02021-2809
ANNUAL REPORT
August 31, 2013

MFS® CORE EQUITY FUND

RGI-ANN
MFS® CORE EQUITY FUND
CONTENTS
The report is prepared for the general information of shareholders.
It is authorized for distribution to prospective investors only when preceded or accompanied by a current prospectus.
NOT FDIC INSURED Ÿ MAY LOSE VALUE Ÿ NO BANK GUARANTEE

LETTER FROM THE CHAIRMAN AND CEO
Dear Shareholders:
Global economic trends appear to favor growth again despite risks created by the U.S. government’s gridlock. The U.S. economy’s slow but steady expansion is no longer the
exception. The eurozone has emerged from its 18-month-long recession, with Germany leading the way. China’s monthly gauges of economic activity once again point toward expansion. And Japan is picking up momentum in response to its government’s and central bank’s aggressive program of monetary easing.
However, geopolitical risks have risen, with violence erupting in Egypt and Syria and the possibility of further unrest in the Middle East. The U.S. Federal Reserve’s expected tapering of its bond-buying stimulus program has weighed on global markets
since May. Emerging markets, including Brazil and India, have borne much of the brunt, as their currency values have dropped and nervous investors have fled to safety elsewhere. In Europe, unemployment persists at historically high levels. The trend towards a pickup in global growth, while encouraging, appears tenuous, particularly with the risk of a U.S. debt default.
As always, managing risk in the face of uncertainty remains a top priority for investors. At MFS®, our uniquely collaborative investment process employs integrated, global research and active risk management. Our global team of investment professionals shares ideas and evaluates opportunities across continents, investment disciplines and asset classes — all with a goal of building better insights, and ultimately better results, for our clients.
We are mindful of the many economic challenges investors face, and believe it is more important than ever to maintain a long-term view and employ time-tested principles, such as asset allocation and diversification. We remain confident that our unique approach can serve investors well as they work with their financial advisors to identify and pursue the most suitable opportunities.
Respectfully,

Robert J. Manning
Chairman and Chief Executive Officer
MFS Investment Management®
October 17, 2013
The opinions expressed in this letter are subject to change, may not be relied upon for investment advice, and no forecasts can be guaranteed.
1
PORTFOLIO COMPOSITION
Portfolio structure (i)

| | | | |
| Top ten holdings (i) | | | | |
| Exxon Mobil Corp. | | | 3.7% | |
| Apple, Inc. | | | 2.3% | |
| ACE Ltd. | | | 1.7% | |
| Procter & Gamble Co. | | | 1.6% | |
| Hewlett-Packard Co. | | | 1.6% | |
| Pfizer, Inc. | | | 1.5% | |
| Wells Fargo & Co. | | | 1.5% | |
| Johnson & Johnson | | | 1.4% | |
| Google, Inc., “A” | | | 1.4% | |
| Citigroup, Inc. | | | 1.3% | |
| | | | |
| Equity sectors (i) | | | | |
| Financial Services | | | 17.8% | |
| Technology | | | 16.0% | |
| Health Care | | | 12.6% | |
| Energy | | | 9.3% | |
| Consumer Staples | | | 6.9% | |
| Industrial Goods & Services | | | 6.9% | |
| Retailing | | | 6.6% | |
| Utilities & Communications | | | 5.9% | |
| Leisure | | | 5.7% | |
| Basic Materials | | | 3.4% | |
| Autos & Housing | | | 2.9% | |
| Special Products & Services | | | 2.7% | |
| Transportation | | | 2.1% | |
| (i) | For purposes of this presentation, the components include the market value of securities, less any securities sold short, and reflect the impact of the equivalent exposure of derivative positions. These amounts may be negative from time to time. Equivalent exposure is a calculated amount that translates the derivative position into a reasonable approximation of the amount of the underlying asset that the portfolio would have to hold at a given point in time to have the same price sensitivity that results from the portfolio’s ownership of the derivative contract. When dealing with derivatives, equivalent exposure is a more representative measure of the potential impact of a position on portfolio performance than market value. |
Percentages are based on net assets as of 8/31/13.
The portfolio is actively managed and current holdings may be different.
2
MANAGEMENT REVIEW
Summary of Results
For the twelve months ended August 31, 2013, Class A shares of the MFS Core Equity Fund (“fund”) provided a total return of 21.63%, at net asset value. This compares with a return of 20.32% for the fund’s benchmark, the Russell 3000 Index.
Market Environment
At the beginning of the period, markets were suffering a bout of risk aversion due to broadly weaker global macroeconomic indicators, as well as renewed concerns over the eurozone’s capacity and determination to address its ongoing crisis. However, a few months into the period, this renewed weakness in the fundamentals precipitated yet a further round of monetary easing by both the US Federal Reserve (through a third round of quantitative easing) and the European Central Bank (ECB) (through a new bond purchase facility), which soon instilled additional confidence in risk markets.
Nonetheless, towards the end of the calendar year, weaker equity earnings reports and declining forward guidance caused market sentiment to soften again. In addition, year-end fiscal cliff negotiations between the Republicans in the US Congress and President Obama were a particular source of market attention, where uncertainty surrounding the fiscal negotiations continued right up to the end-of-year deadline. A last minute political agreement averted the worst-case scenario and markets gravitated towards risk assets again, though the implementation of the US budget sequester, combined with the uncertainty surrounding the Italian election results, inserted a continued degree of caution as we entered the second half of the period.
During the first few months of 2013, market sentiment improved markedly, as global macroeconomic indicators improved and fears of fiscal austerity in the US waned. Later in the period, however, global growth dynamics looked to be weakening again, though markets were generally unfazed, continuing their risk-on path, especially in light of continued easing by global central banks and the Bank of Japan in particular. At the end of the period, the growing risk that the Fed would begin tapering its quantitative easing program caused sovereign bond yields to spike, credit spreads to widen, and equity valuation to fall.
Contributors to Performance
Security selection in the health care sector was a significant factor that contributed positively to performance relative to the Russell 3000 Index. The fund’s holdings of multinational pharmaceutical company Valeant Pharmaceuticals International (b) (Canada) and an overweight position in biopharmaceutical company Celgene Corp. aided relative results as both stocks significantly outpaced the benchmark during the reporting period. Shares of Celgene Corp. rose after the company stated it expected sales to double by 2017 as it benefits from efforts to find new therapies and expand uses for older drugs.
Stock selection in the special products & services sector further strengthened relative returns. An overweight position in strong-performing specialized payment products provider FleetCor Technologies benefited relative performance. Shares of FleetCor Technologies outperformed the overall market after the company announced earnings
3
Management Review – continued
that topped analyst estimates because of international expansion and lower wholesale costs. Additionally, management issued guidance above early forecasts which was also positive for the stock.
Elsewhere, the fund’s overweight positions in transportation services company Swift Transportation, global vehicle components manufacturer Delphi Automotive (United Kingdom), global financial services firm JPMorgan Chase, independent oil and gas exploration production company Pioneer Natural Resources and insurance company MetLife contributed to relative performance. Shares of MetLife rose as the company reported positive earnings driven by their life and annuity segments and importantly announced that its bank holding company status had been lifted. Additionally, positive spreads across products were supported by increased variable investment income. An underweight position in computer products and services International Business Machines (h), and not holding poor-performing semiconductor company Intel, also contributed to relative returns.
Detractors from Performance
Overweight positions in computer and personal electronics maker Apple, integrated oil and gas company Exxon Mobil, apartment management real estate investment trust Mid-America Apartment Communities, access infrastructure products manufacturer Citrix Systems, general merchandise retailer Target, outlet center operator Tanger Factory Outlet Centers, global semiconductor company Altera and managed hosting solutions provider Rackspace Hosting (h) were among the fund’s top relative detractors during the reporting period. Shares of Apple were negatively impacted by management’s cut of both sales and earnings guidance to below consensus expectations signaling increased pressure on market share and margins. Not holding financial services firm Bank of America further weighed on relative results as the stock outperformed the benchmark during the reporting period.
The fund’s cash and/or cash equivalents position during the period was also a detractor from relative performance. Under normal market conditions, the fund strives to be fully invested and generally holds cash to buy new holdings and to provide liquidity. In a period when equity markets rose, as measured by the fund’s benchmark, holding cash hurt performance versus the benchmark, which has no cash position.
Respectfully,
Joseph MacDougall
Portfolio Manager
| (b) | Security is not a benchmark constituent. |
| (h) | Security was not held in the portfolio at period end. |
The views expressed in this report are those of the portfolio manager only through the end of the period of the report as stated on the cover and do not necessarily reflect the views of MFS or any other person in the MFS organization. These views are subject to change at any time based on market or other conditions, and MFS disclaims any responsibility to update such views. These views may not be relied upon as investment advice or an indication of trading intent on behalf of any MFS portfolio. References to specific securities are not recommendations of such securities, and may not be representative of any MFS portfolio’s current or future investments.
4
PERFORMANCE SUMMARY THROUGH 8/31/13
The following chart illustrates a representative class of the fund’s historical performance in comparison to its benchmark(s). Performance results include the deduction of the maximum applicable sales charge and reflect the percentage change in net asset value, including reinvestment of dividends and capital gains distributions. The performance of other share classes will be greater than or less than that of the class depicted below. Benchmarks are unmanaged and may not be invested in directly. Benchmark returns do not reflect sales charges, commissions or expenses. (See Notes to Performance Summary.)
Performance data shown represents past performance and is no guarantee of future results. Investment return and principal value fluctuate so your shares, when sold, may be worth more or less than the original cost; current performance may be lower or higher than quoted. The performance shown does not reflect the deduction of taxes, if any, that a shareholder would pay on fund distributions or the redemption of fund shares.
Growth of a Hypothetical $10,000 Investment
5
Performance Summary – continued
Total Returns through 8/31/13
Average annual without sales charge
| | | | | | | | | | | | | | |
| | | Share class | | Class inception date | | 1-yr | | 5-yr | | 10-yr | | Life (t) | | |
| | | A | | 1/02/96 | | 21.63% | | 8.02% | | 7.88% | | N/A | | |
| | | B | | 1/02/97 | | 20.75% | | 7.21% | | 7.13% | | N/A | | |
| | | C | | 1/02/97 | | 20.73% | | 7.23% | | 7.14% | | N/A | | |
| | | I | | 1/02/97 | | 21.97% | | 8.30% | | 8.22% | | N/A | | |
| | | R1 | | 4/01/05 | | 20.77% | | 7.22% | | N/A | | 6.10% | | |
| | | R2 | | 10/31/03 | | 21.38% | | 7.76% | | N/A | | 7.25% | | |
| | | R3 | | 4/01/05 | | 21.62% | | 8.03% | | N/A | | 6.89% | | |
| | | R4 | | 4/01/05 | | 21.97% | | 8.27% | | N/A | | 7.16% | | |
| | | R5 | | 1/02/13 | | N/A | | N/A | | N/A | | 18.17% | | |
| Comparative Benchmark | | | | | | | | | | |
| | | Russell 3000 Index (f) | | 20.32% | | 7.63% | | 7.60% | | N/A | | |
| Average annual with sales charge | | | | | | | | | | |
| | | A
With Initial Sales Charge (5.75%) | | 14.63% | | 6.75% | | 7.25% | | N/A | | |
| | | B
With CDSC (Declining over six years from 4% to 0%) (x) | | 16.75% | | 6.91% | | 7.13% | | N/A | | |
| | | C
With CDSC (1% for 12 months) (x) | | 19.73% | | 7.23% | | 7.14% | | N/A | | |
Class I, R1, R2, R3, R4, and R5 shares do not have a sales charge.
CDSC – Contingent Deferred Sales Charge.
| (f) | Source: FactSet Research Systems Inc. |
| (t) | For the period from the class inception date through the stated period end (for those share classes with less than 10 years of performance history). No comparative benchmark performance information is provided for “life” periods. (See Notes to Performance Summary.) |
| (x) | Assuming redemption at the end of the applicable period. |
Benchmark Definition
Russell 3000 Index – constructed to provide a comprehensive barometer for the 3,000 largest U.S. companies based on total market capitalization, which represents approximately 98% of the investable U.S. equity market.
It is not possible to invest directly in an index.
Notes to Performance Summary
Average annual total return represents the average annual change in value for each share class for the periods presented. Life returns are presented where the share class has less than 10 years of performance history and represent the average annual total return from the class inception date to the stated period end date. As the funds share
6
Performance Summary – continued
classes may have different inception dates, the life returns may represent different time periods and may not be comparable. As a result, no comparative benchmark performance information is provided for life periods.
Performance results reflect any applicable expense subsidies and waivers in effect during the periods shown. Without such subsidies and waivers the fund’s performance results would be less favorable. Please see the prospectus and financial statements for complete details.
Performance results do not include adjustments made for financial reporting purposes in accordance with U.S. generally accepted accounting principles and may differ from amounts reported in the financial highlights.
From time to time the fund may receive proceeds from litigation settlements, without which performance would be lower.
7
EXPENSE TABLE
Fund expenses borne by the shareholders during the period,
March 1, 2013 through August 31, 2013
As a shareholder of the fund, you incur two types of costs: (1) transaction costs, including sales charges (loads) on certain purchase or redemption payments, and (2) ongoing costs, including management fees; distribution and service (12b-1) fees; and other fund expenses. This example is intended to help you understand your ongoing costs (in dollars) of investing in the fund and to compare these costs with the ongoing costs of investing in other mutual funds.
The example is based on an investment of $1,000 invested at the beginning of the period and held for the entire period March 1, 2013 through August 31, 2013.
Actual Expenses
The first line for each share class in the following table provides information about actual account values and actual expenses. You may use the information in this line, together with the amount you invested, to estimate the expenses that you paid over the period. Simply divide your account value by $1,000 (for example, an $8,600 account value divided by $1,000 = 8.6), then multiply the result by the number in the first line under the heading entitled “Expenses Paid During Period” to estimate the expenses you paid on your account during this period.
Hypothetical Example for Comparison Purposes
The second line for each share class in the following table provides information about hypothetical account values and hypothetical expenses based on the fund’s actual expense ratio and an assumed rate of return of 5% per year before expenses, which is not the fund’s actual return. The hypothetical account values and expenses may not be used to estimate the actual ending account balance or expenses you paid for the period. You may use this information to compare the ongoing costs of investing in the fund and other funds. To do so, compare this 5% hypothetical example with the 5% hypothetical examples that appear in the shareholder reports of the other funds.
Please note that the expenses shown in the table are meant to highlight your ongoing costs only and do not reflect any transactional costs, such as sales charges (loads). Therefore, the second line for each share class in the table is useful in comparing ongoing costs only, and will not help you determine the relative total costs of owning different funds. In addition, if these transactional costs were included, your costs would have been higher.
8
Expense Table – continued
| | | | | | | | | | | | | | | | | | |
Share
Class | | | | Annualized Expense Ratio | | | Beginning
Account Value
3/01/13 | | | Ending Account Value
8/31/13 | | | Expenses Paid During
Period (p)
3/01/13-8/31/13 | |
| A | | Actual | | | 1.10% | | | | $1,000.00 | | | | $1,098.20 | | | | $5.82 | |
| | Hypothetical (h) | | | 1.10% | | | | $1,000.00 | | | | $1,019.66 | | | | $5.60 | |
| B | | Actual | | | 1.85% | | | | $1,000.00 | | | | $1,094.00 | | | | $9.76 | |
| | Hypothetical (h) | | | 1.85% | | | | $1,000.00 | | | | $1,015.88 | | | | $9.40 | |
| C | | Actual | | | 1.85% | | | | $1,000.00 | | | | $1,094.21 | | | | $9.77 | |
| | Hypothetical (h) | | | 1.85% | | | | $1,000.00 | | | | $1,015.88 | | | | $9.40 | |
| I | | Actual | | | 0.86% | | | | $1,000.00 | | | | $1,099.69 | | | | $4.55 | |
| | Hypothetical (h) | | | 0.86% | | | | $1,000.00 | | | | $1,020.87 | | | | $4.38 | |
| R1 | | Actual | | | 1.85% | | | | $1,000.00 | | | | $1,094.35 | | | | $9.77 | |
| | Hypothetical (h) | | | 1.85% | | | | $1,000.00 | | | | $1,015.88 | | | | $9.40 | |
| R2 | | Actual | | | 1.36% | | | | $1,000.00 | | | | $1,096.76 | | | | $7.19 | |
| | Hypothetical (h) | | | 1.36% | | | | $1,000.00 | | | | $1,018.35 | | | | $6.92 | |
| R3 | | Actual | | | 1.10% | | | | $1,000.00 | | | | $1,098.01 | | | | $5.82 | |
| | Hypothetical (h) | | | 1.10% | | | | $1,000.00 | | | | $1,019.66 | | | | $5.60 | |
| R4 | | Actual | | | 0.86% | | | | $1,000.00 | | | | $1,099.45 | | | | $4.55 | |
| | Hypothetical (h) | | | 0.86% | | | | $1,000.00 | | | | $1,020.87 | | | | $4.38 | |
| R5 | | Actual | | | 0.75% | | | | $1,000.00 | | | | $1,100.58 | | | | $3.97 | |
| | Hypothetical (h) | | | 0.75% | | | | $1,000.00 | | | | $1,021.42 | | | | $3.82 | |
| (h) | 5% class return per year before expenses. |
| (p) | Expenses paid are equal to each class’s annualized expense ratio, as shown above, multiplied by the average account value over the period, multiplied by the number of days in the period, divided by the number of days in the year. Expenses paid do not include any applicable sales charges (loads). If these transaction costs had been included, your costs would have been higher. |
Notes to Expense Table
Each class with a Rule 12b-1 service fee is subject to a rebate of a portion of such fee. Such rebates are included in the expense ratios above and are outside of the expense limitation arrangement. For Class A and R3 shares, this rebate reduced the expense ratios above by 0.01% and 0.01%, respectively. See Note 3 in the Notes to Financial Statements for additional information.
9
PORTFOLIO OF INVESTMENTS
8/31/13
The Portfolio of Investments is a complete list of all securities owned by your fund. It is categorized by broad-based asset classes.
| | | | | | | | |
| Common Stocks - 98.5% | | | | | | | | |
| Issuer | | Shares/Par | | | Value ($) | |
| Aerospace - 3.0% | | | | | | | | |
| Honeywell International, Inc. | | | 161,300 | | | $ | 12,834,641 | |
| Precision Castparts Corp. | | | 39,631 | | | | 8,371,652 | |
| United Technologies Corp. | | | 119,630 | | | | 11,974,963 | |
| | | | | | | | |
| | | | | | | $ | 33,181,256 | |
| Apparel Manufacturers - 1.5% | | | | | | | | |
| Guess?, Inc. | | | 87,300 | | | $ | 2,662,650 | |
| Michael Kors Holdings Ltd. (a) | | | 61,940 | | | | 4,589,135 | |
| NIKE, Inc., “B” | | | 76,050 | | | | 4,777,461 | |
| VF Corp. | | | 24,150 | | | | 4,521,122 | |
| | | | | | | | |
| | | | | | | $ | 16,550,368 | |
| Automotive - 2.0% | | | | | | | | |
| Delphi Automotive PLC | | | 183,920 | | | $ | 10,119,278 | |
| General Motors Co. (a) | | | 221,590 | | | | 7,551,787 | |
| Johnson Controls, Inc. | | | 101,470 | | | | 4,112,579 | |
| | | | | | | | |
| | | | | | | $ | 21,783,644 | |
| Biotechnology - 1.8% | | | | | | | | |
| Biogen Idec, Inc. (a) | | | 27,988 | | | $ | 5,962,004 | |
| Celgene Corp. (a) | | | 54,572 | | | | 7,638,989 | |
| Gilead Sciences, Inc. (a) | | | 104,970 | | | | 6,326,542 | |
| | | | | | | | |
| | | | | | | $ | 19,927,535 | |
| Broadcasting - 2.2% | | | | | | | | |
| Time Warner, Inc. | | | 92,260 | | | $ | 5,584,498 | |
| Twenty-First Century Fox, Inc. | | | 445,550 | | | | 13,959,082 | |
| Walt Disney Co. | | | 87,880 | | | | 5,345,740 | |
| | | | | | | | |
| | | | | | | $ | 24,889,320 | |
| Brokerage & Asset Managers - 1.5% | | | | | | | | |
| BlackRock, Inc. | | | 12,017 | | | $ | 3,128,265 | |
| Franklin Resources, Inc. | | | 97,898 | | | | 4,518,972 | |
| FXCM, Inc., “A” | | | 111,940 | | | | 2,125,741 | |
| IntercontinentalExchange, Inc. (a) | | | 24,360 | | | | 4,378,710 | |
| NASDAQ OMX Group, Inc. | | | 95,610 | | | | 2,854,915 | |
| | | | | | | | |
| | | | | | | $ | 17,006,603 | |
| Business Services - 1.4% | | | | | | | | |
| Accenture PLC, “A” | | | 58,400 | | | $ | 4,219,400 | |
| Fidelity National Information Services, Inc. | | | 130,890 | | | | 5,819,369 | |
10
Portfolio of Investments – continued
| | | | | | | | |
| Issuer | | Shares/Par | | | Value ($) | |
| Common Stocks - continued | | | | | | | | |
| Business Services - continued | | | | | | | | |
| FleetCor Technologies, Inc. (a) | | | 37,530 | | | $ | 3,869,718 | |
| Forrester Research, Inc. | | | 58,540 | | | | 1,930,649 | |
| | | | | | | | |
| | | | | | | $ | 15,839,136 | |
| Cable TV - 1.1% | | | | | | | | |
| Comcast Corp., “Special A” | | | 155,000 | | | $ | 6,314,700 | |
| Time Warner Cable, Inc. | | | 58,770 | | | | 6,308,960 | |
| | | | | | | | |
| | | | | | | $ | 12,623,660 | |
| Chemicals - 1.2% | | | | | | | | |
| Celanese Corp. | | | 95,980 | | | $ | 4,726,055 | |
| LyondellBasell Industries N.V., “A” | | | 65,050 | | | | 4,563,258 | |
| PPG Industries, Inc. | | | 28,296 | | | | 4,420,118 | |
| | | | | | | | |
| | | | | | | $ | 13,709,431 | |
| Computer Software - 4.8% | | | | | | | | |
| Autodesk, Inc. (a) | | | 141,360 | | | $ | 5,194,980 | |
| Check Point Software Technologies Ltd. (a) | | | 178,051 | | | | 9,983,320 | |
| Citrix Systems, Inc. (a) | | | 82,550 | | | | 5,842,064 | |
| CommVault Systems, Inc. (a) | | | 72,100 | | | | 6,044,143 | |
| Microsoft Corp. | | | 86,150 | | | | 2,877,410 | |
| Oracle Corp. | | | 216,030 | | | | 6,882,716 | |
| Qlik Technologies, Inc. (a) | | | 150,010 | | | | 4,918,828 | |
| Salesforce.com, Inc. (a) | | | 113,147 | | | | 5,558,912 | |
| Symantec Corp. | | | 232,770 | | | | 5,961,240 | |
| | | | | | | | |
| | | | | | | $ | 53,263,613 | |
| Computer Software - Systems - 5.9% | | | | | | | | |
| Apple, Inc. (s) | | | 51,847 | | | $ | 25,252,081 | |
| EMC Corp. | | | 361,550 | | | | 9,320,759 | |
| Hewlett-Packard Co. | | | 781,890 | | | | 17,467,423 | |
| NCR Corp. (a) | | | 38,630 | | | | 1,374,455 | |
| SS&C Technologies Holdings, Inc. (a) | | | 159,350 | | | | 5,639,397 | |
| Vantiv, Inc., “A” (a) | | | 224,560 | | | | 5,930,630 | |
| | | | | | | | |
| | | | | | | $ | 64,984,745 | |
| Construction - 0.9% | | | | | | | | |
| Pool Corp. | | | 28,500 | | | $ | 1,484,565 | |
| Sherwin-Williams Co. | | | 13,037 | | | | 2,247,579 | |
| Stanley Black & Decker, Inc. | | | 77,420 | | | | 6,600,829 | |
| | | | | | | | |
| | | | | | | $ | 10,332,973 | |
11
Portfolio of Investments – continued
| | | | | | | | |
| Issuer | | Shares/Par | | | Value ($) | |
| Common Stocks - continued | | | | | | | | |
| Consumer Products - 2.5% | | | | | | | | |
| Estee Lauder Cos., Inc., “A” | | | 149,340 | | | $ | 9,760,862 | |
| Procter & Gamble Co. | | | 225,450 | | | | 17,560,301 | |
| | | | | | | | |
| | | | | | | $ | 27,321,163 | |
| Consumer Services - 1.2% | | | | | | | | |
| Grand Canyon Education, Inc. (a) | | | 100,970 | | | $ | 3,484,475 | |
| Priceline.com, Inc. (a) | | | 11,019 | | | | 10,341,662 | |
| | | | | | | | |
| | | | | | | $ | 13,826,137 | |
| Containers - 0.5% | | | | | | | | |
| Crown Holdings, Inc. (a) | | | 36,140 | | | $ | 1,570,644 | |
| Packaging Corp. of America | | | 85,740 | | | | 4,547,650 | |
| | | | | | | | |
| | | | | | | $ | 6,118,294 | |
| Electrical Equipment - 1.3% | | | | | | | | |
| AMETEK, Inc. | | | 86,750 | | | $ | 3,723,310 | |
| Danaher Corp. | | | 83,000 | | | | 5,438,160 | |
| Sensata Technologies Holding B.V. (a) | | | 105,760 | | | | 3,942,733 | |
| W.W. Grainger, Inc. | | | 7,631 | | | | 1,887,528 | |
| | | | | | | | |
| | | | | | | $ | 14,991,731 | |
| Electronics - 2.8% | | | | | | | | |
| Altera Corp. | | | 258,580 | | | $ | 9,094,259 | |
| KLA-Tencor Corp. | | | 94,620 | | | | 5,218,293 | |
| Linear Technology Corp. | | | 73,020 | | | | 2,798,857 | |
| Microchip Technology, Inc. | | | 237,840 | | | | 9,230,570 | |
| NXP Semiconductors N.V. (a) | | | 130,760 | | | | 4,860,349 | |
| | | | | | | | |
| | | | | | | $ | 31,202,328 | |
| Energy - Independent - 4.2% | | | | | | | | |
| Anadarko Petroleum Corp. | | | 30,720 | | | $ | 2,808,422 | |
| Athlon Energy, Inc. (a) | | | 92,540 | | | | 2,572,612 | |
| Cabot Oil & Gas Corp. | | | 74,700 | | | | 2,923,011 | |
| Concho Resources, Inc. (a) | | | 29,110 | | | | 2,809,406 | |
| CONSOL Energy, Inc. | | | 25,340 | | | | 791,368 | |
| EOG Resources, Inc. | | | 26,651 | | | | 4,185,540 | |
| EQT Corp. | | | 32,980 | | | | 2,827,046 | |
| Gulfport Energy Corp. (a) | | | 30,640 | | | | 1,807,760 | |
| Marathon Petroleum Corp. | | | 135,380 | | | | 9,816,404 | |
| Noble Energy, Inc. | | | 108,079 | | | | 6,639,293 | |
| PDC Energy, Inc. (a) | | | 10,900 | | | | 625,442 | |
| Peabody Energy Corp. | | | 27,640 | | | | 475,408 | |
| Pioneer Natural Resources Co. | | | 45,586 | | | | 7,976,182 | |
| | | | | | | | |
| | | | | | | $ | 46,257,894 | |
12
Portfolio of Investments – continued
| | | | | | | | |
| Issuer | | Shares/Par | | | Value ($) | |
| Common Stocks - continued | | | | | | | | |
| Energy - Integrated - 3.7% | | | | | | | | |
| Exxon Mobil Corp. (s) | | | 470,872 | | | $ | 41,041,201 | |
| | |
| Food & Beverages - 3.0% | | | | | | | | |
| Coca-Cola Co. | | | 339,850 | | | $ | 12,975,473 | |
| Coca-Cola Enterprises, Inc. | | | 72,910 | | | | 2,726,834 | |
| General Mills, Inc. | | | 114,080 | | | | 5,626,426 | |
| Mead Johnson Nutrition Co., “A” | | | 37,580 | | | | 2,819,627 | |
| Mondelez International, Inc. | | | 290,580 | | | | 8,912,089 | |
| | | | | | | | |
| | | | | | | $ | 33,060,449 | |
| Food & Drug Stores - 0.9% | | | | | | | | |
| CVS Caremark Corp. | | | 137,310 | | | $ | 7,970,846 | |
| Fairway Group Holdings Corp. (a) | | | 104,930 | | | | 2,432,277 | |
| | | | | | | | |
| | | | | | | $ | 10,403,123 | |
| Gaming & Lodging - 0.7% | | | | | | | | |
| Wynn Resorts Ltd. | | | 53,752 | | | $ | 7,581,182 | |
| | |
| General Merchandise - 1.7% | | | | | | | | |
| Kohl’s Corp. | | | 117,690 | | | $ | 6,038,674 | |
| Target Corp. | | | 194,350 | | | | 12,304,299 | |
| | | | | | | | |
| | | | | | | $ | 18,342,973 | |
| Health Maintenance Organizations - 0.8% | | | | | | | | |
| Aetna, Inc. | | | 103,460 | | | $ | 6,558,329 | |
| UnitedHealth Group, Inc. | | | 35,110 | | | | 2,518,791 | |
| | | | | | | | |
| | | | | | | $ | 9,077,120 | |
| Insurance - 4.2% | | | | | | | | |
| ACE Ltd. (s) | | | 210,140 | | | $ | 18,433,481 | |
| American International Group, Inc. | | | 173,560 | | | | 8,063,598 | |
| MetLife, Inc. | | | 299,090 | | | | 13,814,967 | |
| Third Point Reinsurance Ltd. (a) | | | 455,670 | | | | 6,010,287 | |
| | | | | | | | |
| | | | | | | $ | 46,322,333 | |
| Internet - 2.3% | | | | | | | | |
| ChannelAdvisor Corp. (a) | | | 142,380 | | | $ | 4,359,676 | |
| eBay, Inc. (a) | | | 75,390 | | | | 3,768,746 | |
| Facebook, Inc., “A “ (a) | | | 35,630 | | | | 1,470,806 | |
| Google, Inc., “A” (a) | | | 17,982 | | | | 15,228,956 | |
| Yelp, Inc. (a) | | | 21,540 | | | | 1,119,649 | |
| | | | | | | | |
| | | | | | | $ | 25,947,833 | |
| Leisure & Toys - 0.4% | | | | | | | | |
| Brunswick Corp. | | | 126,790 | | | $ | 4,610,084 | |
13
Portfolio of Investments – continued
| | | | | | | | |
| Issuer | | Shares/Par | | | Value ($) | |
| Common Stocks - continued | | | | | | | | |
| Machinery & Tools - 2.3% | | | | | | | | |
| Eaton Corp. PLC | | | 94,600 | | | $ | 5,990,072 | |
| Illinois Tool Works, Inc. | | | 39,040 | | | | 2,790,189 | |
| Joy Global, Inc. | | | 101,040 | | | | 4,963,085 | |
| Kennametal, Inc. | | | 85,880 | | | | 3,651,618 | |
| Roper Industries, Inc. | | | 67,898 | | | | 8,398,983 | |
| | | | | | | | |
| | | | | | | $ | 25,793,947 | |
| Major Banks - 4.2% | | | | | | | | |
| Goldman Sachs Group, Inc. | | | 29,269 | | | $ | 4,452,693 | |
| JPMorgan Chase & Co. | | | 273,200 | | | | 13,804,796 | |
| Morgan Stanley | | | 221,710 | | | | 5,711,250 | |
| State Street Corp. | | | 84,580 | | | | 5,643,178 | |
| Wells Fargo & Co. | | | 401,810 | | | | 16,506,355 | |
| | | | | | | | |
| | | | | | | $ | 46,118,272 | |
| Medical & Health Technology & Services - 1.2% | | | | | | | | |
| Catamaran Corp. (a) | | | 56,030 | | | $ | 3,076,607 | |
| Cerner Corp. (a) | | | 29,480 | | | | 1,357,849 | |
| Express Scripts Holding Co. (a) | | | 111,870 | | | | 7,146,256 | |
| Henry Schein, Inc. (a) | | | 19,180 | | | | 1,938,139 | |
| | | | | | | | |
| | | | | | | $ | 13,518,851 | |
| Medical Equipment - 3.0% | | | | | | | | |
| AtriCure, Inc. (a) | | | 118,450 | | | $ | 1,041,176 | |
| Cooper Cos., Inc. | | | 39,793 | | | | 5,197,364 | |
| Covidien PLC | | | 92,300 | | | | 5,482,620 | |
| DexCom, Inc. (a) | | | 57,510 | | | | 1,555,646 | |
| Endologix, Inc. (a) | | | 64,970 | | | | 1,027,825 | |
| GenMark Diagnostics, Inc. (a) | | | 93,890 | | | | 1,079,735 | |
| NxStage Medical, Inc. (a) | | | 140,550 | | | | 1,735,793 | |
| Sirona Dental Systems, Inc. (a) | | | 23,300 | | | | 1,509,141 | |
| St. Jude Medical, Inc. | | | 90,800 | | | | 4,577,228 | |
| Stryker Corp. | | | 68,320 | | | | 4,569,925 | |
| TearLab Corp. (a) | | | 44,210 | | | | 580,919 | |
| Thermo Fisher Scientific, Inc. | | | 50,960 | | | | 4,526,777 | |
| | | | | | | | |
| | | | | | | $ | 32,884,149 | |
| Metals & Mining - 0.4% | | | | | | | | |
| Lundin Mining Corp. (a) | | | 356,630 | | | $ | 1,469,452 | |
| Teck Resources Ltd., “B” | | | 69,555 | | | | 1,751,257 | |
| U.S. Silica Holdings, Inc. | | | 40,490 | | | | 951,515 | |
| Uranium Participation Corp. (a) | | | 175,010 | | | | 807,508 | |
| | | | | | | | |
| | | | | | | $ | 4,979,732 | |
14
Portfolio of Investments – continued
| | | | | | | | |
| Issuer | | Shares/Par | | | Value ($) | |
| Common Stocks - continued | | | | | | | | |
| Natural Gas - Distribution - 0.2% | | | | | | | | |
| Spectra Energy Corp. | | | 80,230 | | | $ | 2,656,415 | |
| | |
| Natural Gas - Pipeline - 0.7% | | | | | | | | |
| Enbridge, Inc. | | | 112,250 | | | $ | 4,596,638 | |
| Williams Cos., Inc. | | | 77,170 | | | | 2,796,641 | |
| | | | | | | | |
| | | | | | | $ | 7,393,279 | |
| Network & Telecom - 0.2% | | | | | | | | |
| Juniper Networks, Inc. (a) | | | 63,610 | | | $ | 1,202,229 | |
| Qualcomm, Inc. | | | 15,980 | | | | 1,059,154 | |
| | | | | | | | |
| | | | | | | $ | 2,261,383 | |
| Oil Services - 1.5% | | | | | | | | |
| Cameron International Corp. (a) | | | 95,630 | | | $ | 5,430,828 | |
| Dresser-Rand Group, Inc. (a) | | | 64,590 | | | | 3,936,115 | |
| Halliburton Co. | | | 73,740 | | | | 3,539,520 | |
| Schlumberger Ltd. | | | 39,910 | | | | 3,230,315 | |
| | | | | | | | |
| | | | | | | $ | 16,136,778 | |
| Other Banks & Diversified Financials - 4.8% | | | | | | | | |
| American Express Co. | | | 73,200 | | | $ | 5,263,812 | |
| Cathay General Bancorp, Inc. | | | 108,480 | | | | 2,388,730 | |
| CIT Group, Inc. (a) | | | 88,640 | | | | 4,243,197 | |
| Citigroup, Inc. | | | 291,060 | | | | 14,066,930 | |
| EuroDekania Ltd. (a)(z) | | | 580,280 | | | | 638,467 | |
| Fifth Third Bancorp | | | 402,000 | | | | 7,352,580 | |
| PrivateBancorp, Inc. | | | 247,360 | | | | 5,397,395 | |
| TCF Financial Corp. | | | 231,660 | | | | 3,254,823 | |
| Visa, Inc., “A” | | | 59,259 | | | | 10,335,955 | |
| | | | | | | | |
| | | | | | | $ | 52,941,889 | |
| Pharmaceuticals - 5.7% | | | | | | | | |
| Bristol-Myers Squibb Co. | | | 157,800 | | | $ | 6,578,682 | |
| Johnson & Johnson | | | 181,410 | | | | 15,675,638 | |
| Mylan, Inc. (a) | | | 95,500 | | | | 3,374,970 | |
| Perrigo Co. | | | 37,455 | | | | 4,552,655 | |
| Pfizer, Inc. | | | 605,526 | | | | 17,081,888 | |
| Valeant Pharmaceuticals International, Inc. (a) | | | 122,170 | | | | 12,014,198 | |
| Zoetis, Inc. | | | 154,590 | | | | 4,506,294 | |
| | | | | | | | |
| | | | | | | $ | 63,784,325 | |
| Pollution Control - 0.2% | | | | | | | | |
| Stericycle, Inc. (a) | | | 19,860 | | | $ | 2,235,442 | |
15
Portfolio of Investments – continued
| | | | | | | | |
| Issuer | | Shares/Par | | | Value ($) | |
| Common Stocks - continued | | | | | | | | |
| Railroad & Shipping - 1.0% | | | | | | | | |
| Canadian Pacific Railway Ltd. | | | 9,785 | | | $ | 1,154,920 | |
| Diana Shipping, Inc. (a) | | | 194,210 | | | | 2,109,121 | |
| Kansas City Southern Co. | | | 16,204 | | | | 1,708,226 | |
| Union Pacific Corp. | | | 41,223 | | | | 6,329,379 | |
| | | | | | | | |
| | | | | | | $ | 11,301,646 | |
| Real Estate - 3.2% | | | | | | | | |
| Digital Realty Trust, Inc., REIT | | | 121,490 | | | $ | 6,754,844 | |
| Equity Lifestyle Properties, Inc., REIT | | | 168,920 | | | | 5,869,970 | |
| Mid-America Apartment Communities, Inc., REIT | | | 127,220 | | | | 7,844,385 | |
| Public Storage, Inc., REIT | | | 15,010 | | | | 2,291,577 | |
| Tanger Factory Outlet Centers, Inc., REIT | | | 191,570 | | | | 5,909,935 | |
| Weyerhaeuser Co., REIT | | | 243,150 | | | | 6,657,447 | |
| | | | | | | | |
| | | | | | | $ | 35,328,158 | |
| Restaurants - 1.2% | | | | | | | | |
| McDonald’s Corp. | | | 58,113 | | | $ | 5,483,543 | |
| YUM! Brands, Inc. | | | 112,130 | | | | 7,851,343 | |
| | | | | | | | |
| | | | | | | $ | 13,334,886 | |
| Specialty Chemicals - 1.2% | | | | | | | | |
| Airgas, Inc. | | | 34,063 | | | $ | 3,462,504 | |
| Ecolab, Inc. | | | 40,210 | | | | 3,673,184 | |
| FMC Corp. | | | 89,470 | | | | 5,959,597 | |
| | | | | | | | |
| | | | | | | $ | 13,095,285 | |
| Specialty Stores - 2.5% | | | | | | | | |
| Amazon.com, Inc. (a) | | | 4,299 | | | $ | 1,207,933 | |
| AutoZone, Inc. (a) | | | 16,581 | | | | 6,963,025 | |
| Bed Bath & Beyond, Inc. (a) | | | 91,810 | | | | 6,770,069 | |
| Children’s Place Retail Store, Inc. (a) | | | 65,690 | | | | 3,493,394 | |
| Dick’s Sporting Goods, Inc. | | | 123,870 | | | | 5,748,807 | |
| Sally Beauty Holdings, Inc. (a) | | | 149,280 | | | | 3,900,686 | |
| | | | | | | | |
| | | | | | | $ | 28,083,914 | |
| Telecommunications - Wireless - 1.0% | | | | | | | | |
| American Tower Corp., REIT | | | 92,880 | | | $ | 6,454,231 | |
| SBA Communications Corp. (a) | | | 57,550 | | | | 4,316,250 | |
| | | | | | | | |
| | | | | | | $ | 10,770,481 | |
| Telephone Services - 1.6% | | | | | | | | |
| AT&T, Inc. | | | 244,430 | | | $ | 8,269,067 | |
| Verizon Communications, Inc. | | | 196,170 | | | | 9,294,535 | |
| | | | | | | | |
| | | | | | | $ | 17,563,602 | |
16
Portfolio of Investments – continued
| | | | | | | | |
| Issuer | | Shares/Par | | | Value ($) | |
| Common Stocks - continued | | | | | | | | |
| Tobacco - 1.5% | | | | | | | | |
| Lorillard, Inc. | | | 97,600 | | | $ | 4,128,480 | |
| Philip Morris International, Inc. | | | 145,030 | | | | 12,101,303 | |
| | | | | | | | |
| | | | | | | $ | 16,229,783 | |
| Trucking - 1.1% | | | | | | | | |
| Expeditors International of Washington, Inc. | | | 146,480 | | | $ | 5,941,229 | |
| Swift Transportation Co. (a) | | | 327,310 | | | | 5,878,488 | |
| | | | | | | | |
| | | | | | | $ | 11,819,717 | |
| Utilities - Electric Power - 2.3% | | | | | | | | |
| AES Corp. | | | 189,710 | | | $ | 2,411,214 | |
| American Electric Power Co., Inc. | | | 80,020 | | | | 3,424,856 | |
| Calpine Corp. (a) | | | 186,450 | | | | 3,604,079 | |
| CMS Energy Corp. | | | 138,427 | | | | 3,672,468 | |
| Edison International | | | 74,640 | | | | 3,425,230 | |
| Great Plains Energy, Inc. | | | 148,740 | | | | 3,260,381 | |
| NRG Yield, Inc. (a) | | | 15,320 | | | | 426,815 | |
| PG&E Corp. | | | 67,000 | | | | 2,771,120 | |
| PPL Corp. | | | 80,929 | | | | 2,484,520 | |
| | | | | | | | |
| | | | | | | $ | 25,480,683 | |
| Total Common Stocks (Identified Cost, $922,218,783) | | | | | | $ | 1,093,908,746 | |
| | |
| Convertible Preferred Stocks - 0.2% | | | | | | | | |
| Utilities - Electric Power - 0.2% | | | | | | | | |
| PPL Corp., 8.75% (Identified Cost, $2,128,000) | | | 42,560 | | | $ | 2,276,534 | |
| | |
| Issuer/Expiration Date/Strike Price | | Number
of
Contracts | | | | |
| Call Options Purchased - 0.0% | | | | | | | | |
| Pharmaceuticals - 0.0% | | | | | | | | |
| Eli Lilly & Co. - October 2013 @ $55 (Premiums Paid, $52,612) | | | 773 | | | $ | 34,785 | |
| | |
| Issuer | | Shares/Par | | | | |
| Money Market Funds - 0.9% | | | | | | | | |
MFS Institutional Money Market Portfolio, 0.09%,
at Cost and Net Asset Value (v) | | | 10,013,362 | | | $ | 10,013,362 | |
| Total Investments (Identified Cost, $934,412,757) | | | | | | $ | 1,106,233,427 | |
17
Portfolio of Investments – continued
| | | | | | | | |
| Call Options Written - 0.0% | | | | | | | | |
| Issuer/Expiration Date/Strike Price | | Number
of
Contracts | | | Value ($) | |
| Electronics - 0.0% | | | | | | | | |
Linear Technology Corp. - September 2013 @ $40
(Premiums Received, $11,437) | | | (284 | ) | | $ | (2,840 | ) |
| | |
| Put Options Written - 0.0% | | | | | | | | |
| Pharmaceuticals - 0.0% | | | | | | | | |
| Eli Lilly & Co. - October 2013 @ $42 (Premiums Received, $41,694) | | | (773 | ) | | $ | (3,092 | ) |
| | |
| Other Assets, Less Liabilities - 0.4% | | | | | | | 4,124,915 | |
| Net Assets - 100.0% | | | | | | $ | 1,110,352,410 | |
| (a) | Non-income producing security. |
| (s) | Security or a portion of the security was pledged to cover collateral requirements for securities sold short and certain derivative transactions. At August 31, 2013, the fund had no short sales outstanding. |
| (v) | Underlying affiliated fund that is available only to investment companies managed by MFS. The rate quoted for the MFS Institutional Money Market Portfolio is the annualized seven-day yield of the fund at period end. |
| (z) | Restricted securities are not registered under the Securities Act of 1933 and are subject to legal restrictions on resale. These securities generally may be resold in transactions exempt from registration or to the public if the securities are subsequently registered. Disposal of these securities may involve time-consuming negotiations and prompt sale at an acceptable price may be difficult. The fund holds the following restricted securities: |
| | | | | | | | | | |
| Restricted Securities | | Acquisition Date | | Cost | | | Value | |
| EuroDekania Ltd. | | 3/08/07-6/25/07 | | | $8,173,430 | | | | $638,467 | |
| % of Net assets | | | | | | | | | 0.1% | |
At August 31, 2013, the fund had cash collateral of $2,700 and other liquid securities with an aggregate value of $2,185,535 to cover any commitments for securities sold short and certain derivative contracts. Cash collateral is comprised of “Deposits with brokers” in the Statement of Assets and Liabilities.
The following abbreviations are used in this report and are defined:
| PLC | | Public Limited Company |
| REIT | | Real Estate Investment Trust |
See Notes to Financial Statements
18
Financial Statements
STATEMENT OF ASSETS AND LIABILITIES
At 8/31/13
This statement represents your fund’s balance sheet, which details the assets and liabilities comprising the total value of the fund.
| | | | |
| Assets | | | | |
Investments- | | | | |
Non-affiliated issuers, at value (identified cost, $924,399,395) | | | $1,096,220,065 | |
Underlying affiliated funds, at cost and value | | | 10,013,362 | |
Total investments, at value (identified cost, $934,412,757) | | | $1,106,233,427 | |
Cash | | | 123,871 | |
Deposits with brokers | | | 2,700 | |
Receivables for | | | | |
Fund shares sold | | | 4,882,686 | |
Interest and dividends | | | 1,835,228 | |
Other assets | | | 1,456 | |
Total assets | | | $1,113,079,368 | |
| Liabilities | | | | |
Payables for | | | | |
Investments purchased | | | $694,733 | |
Fund shares reacquired | | | 960,241 | |
Written options outstanding, at value (premiums received, $53,131) | | | 5,932 | |
Payable to affiliates | | | | |
Investment adviser | | | 55,017 | |
Shareholder servicing costs | | | 756,351 | |
Distribution and service fees | | | 25,212 | |
Payable for independent Trustees’ compensation | | | 113,171 | |
Accrued expenses and other liabilities | | | 116,301 | |
Total liabilities | | | $2,726,958 | |
Net assets | | | $1,110,352,410 | |
| Net assets consist of | | | | |
Paid-in capital | | | $942,540,539 | |
Unrealized appreciation (depreciation) on investments and translation of assets and liabilities in foreign currencies | | | 171,867,346 | |
Accumulated net realized gain (loss) on investments and foreign currency | | | (11,092,701 | ) |
Undistributed net investment income | | | 7,037,226 | |
Net assets | | | $1,110,352,410 | |
Shares of beneficial interest outstanding | | | 47,068,454 | |
19
Statement of Assets and Liabilities – continued
| | | | | | | | | | | | |
| | | Net assets | | | Shares
outstanding | | | Net asset value
per share (a) | |
Class A | | | $873,139,313 | | | | 36,652,250 | | | | $23.82 | |
Class B | | | 40,494,541 | | | | 1,850,624 | | | | 21.88 | |
Class C | | | 78,776,804 | | | | 3,627,163 | | | | 21.72 | |
Class I | | | 29,812,445 | | | | 1,201,256 | | | | 24.82 | |
Class R1 | | | 3,839,426 | | | | 177,042 | | | | 21.69 | |
Class R2 | | | 19,624,970 | | | | 840,544 | | | | 23.35 | |
Class R3 | | | 58,380,669 | | | | 2,457,774 | | | | 23.75 | |
Class R4 | | | 6,165,029 | | | | 257,001 | | | | 23.99 | |
Class R5 | | | 119,213 | | | | 4,800 | | | | 24.84 | |
| (a) | Maximum offering price per share was equal to the net asset value per share for all share classes, except for Class A, for which the maximum offering price per share was $25.27 [100 / 94.25 x $23.82]. On sales of $50,000 or more, the maximum offering price of Class A shares is reduced. A contingent deferred sales charge may be imposed on redemptions of Class A, Class B, and Class C shares. Redemption price per share was equal to the net asset value per share for Classes I, R1, R2, R3, R4, and R5. |
See Notes to Financial Statements
20
Financial Statements
STATEMENT OF OPERATIONS
Year ended 8/31/13
This statement describes how much your fund earned in investment income and accrued in expenses. It also describes any gains and/or losses generated by fund operations.
| | | | |
| Net investment income | | | | |
Income | | | | |
Dividends | | | $18,893,330 | |
Interest | | | 107,073 | |
Dividends from underlying affiliated funds | | | 14,686 | |
Foreign taxes withheld | | | (43,998 | ) |
Total investment income | | | $18,971,091 | |
Expenses | | | | |
Management fee | | | $5,935,954 | |
Distribution and service fees | | | 3,314,612 | |
Shareholder servicing costs | | | 1,922,137 | |
Administrative services fee | | | 136,310 | |
Independent Trustees’ compensation | | | 40,783 | |
Custodian fee | | | 103,092 | |
Shareholder communications | | | 96,273 | |
Audit and tax fees | | | 54,200 | |
Legal fees | | | 8,972 | |
Dividend and interest expense on securities sold short | | | 51,268 | |
Miscellaneous | | | 194,447 | |
Total expenses | | | $11,858,048 | |
Fees paid indirectly | | | (78 | ) |
Reduction of expenses by investment adviser and distributor | | | (37,469 | ) |
Net expenses | | | $11,820,501 | |
Net investment income | | | $7,150,590 | |
| Realized and unrealized gain (loss) on investments and foreign currency | |
Realized gain (loss) (identified cost basis) | | | | |
Investments | | | $101,646,218 | |
Written options | | | 49,267 | |
Securities sold short | | | (1,139,266 | ) |
Foreign currency | | | (2,157 | ) |
Net realized gain (loss) on investments and foreign currency | | | $100,554,062 | |
Change in unrealized appreciation (depreciation) | | | | |
Investments | | | $82,294,882 | |
Written options | | | 47,199 | |
Translation of assets and liabilities in foreign currencies | | | (523 | ) |
Net unrealized gain (loss) on investments and foreign currency translation | | | $82,341,558 | |
Net realized and unrealized gain (loss) on investments and foreign currency | | | $182,895,620 | |
Change in net assets from operations | | | $190,046,210 | |
See Notes to Financial Statements
21
Financial Statements
STATEMENTS OF CHANGES IN NET ASSETS
These statements describe the increases and/or decreases in net assets resulting from operations, any distributions, and any shareholder transactions.
| | | | | | | | |
| | | Years ended 8/31 | |
| | | 2013 | | | 2012 | |
| Change in net assets | | | | | | |
| From operations | | | | | | | | |
Net investment income | | | $7,150,590 | | | | $4,257,841 | |
Net realized gain (loss) on investments and foreign currency | | | 100,554,062 | | | | 43,944,879 | |
Net unrealized gain (loss) on investments and foreign currency translation | | | 82,341,558 | | | | 69,484,871 | |
Change in net assets from operations | | | $190,046,210 | | | | $117,687,591 | |
| Distributions declared to shareholders | | | | | | | | |
From net investment income | | | $(4,250,197 | ) | | | $(4,062,237 | ) |
Change in net assets from fund share transactions | | | $39,750,638 | | | | $(23,975,464 | ) |
Total change in net assets | | | $225,546,651 | | | | $89,649,890 | |
| Net assets | | | | | | | | |
At beginning of period | | | 884,805,759 | | | | 795,155,869 | |
At end of period (including undistributed net investment
income of $7,037,226 and $4,138,948, respectively) | | | $1,110,352,410 | | | | $884,805,759 | |
See Notes to Financial Statements
22
Financial Statements
FINANCIAL HIGHLIGHTS
The financial highlights table is intended to help you understand the fund’s financial performance for the past 5 years (or life of a particular share class, if shorter). Certain information reflects financial results for a single fund share. The total returns in the table represent the rate by which an investor would have earned (or lost) on an investment in the fund share class (assuming reinvestment of all distributions) held for the entire period.
| | | | | | | | | | | | | | | | | | | | |
| Class A | | Years ended 8/31 | |
| | | 2013 | | | 2012 | | | 2011 | | | 2010 | | | 2009 | |
Net asset value, beginning of period | | | $19.68 | | | | $17.20 | | | | $14.62 | | | | $13.87 | | | | $16.75 | |
| Income (loss) from investment operations | | | | | | | | | | | | | | | | | |
Net investment income (d) | | | $0.18 | | | | $0.11 | | | | $0.11 | | | | $0.10 | | | | $0.12 | |
Net realized and unrealized gain (loss)
on investments and foreign currency | | | 4.07 | | | | 2.47 | | | | 2.58 | | | | 0.77 | | | | (2.92 | ) |
Total from investment operations | | | $4.25 | | | | $2.58 | | | | $2.69 | | | | $0.87 | | | | $(2.80 | ) |
| Less distributions declared to shareholders | | | | | | | | | | | | | | | | | |
From net investment income | | | $(0.11 | ) | | | $(0.10 | ) | | | $(0.11 | ) | | | $(0.12 | ) | | | $(0.08 | ) |
Net asset value, end of period (x) | | | $23.82 | | | | $19.68 | | | | $17.20 | | | | $14.62 | | | | $13.87 | |
Total return (%) (r)(s)(t)(x) | | | 21.69 | | | | 15.10 | | | | 18.39 | | | | 6.27 | | | | (16.55 | ) |
Ratios (%) (to average net assets)
and Supplemental data: | | | | | | | | | | | | | | | | | | | | |
Expenses before expense reductions (f) | | | 1.11 | | | | 1.15 | | | | 1.18 | | | | 1.24 | | | | 1.36 | |
Expenses after expense reductions (f) | | | 1.11 | | | | 1.15 | | | | 1.18 | | | | 1.23 | | | | 1.21 | |
Net investment income | | | 0.81 | | | | 0.61 | | | | 0.60 | | | | 0.68 | | | | 1.03 | |
Portfolio turnover | | | 58 | | | | 65 | | | | 66 | | | | 77 | | | | 109 | |
Net assets at end of period (000 omitted) | | | $873,139 | | | | $686,616 | | | | $612,504 | | | | $547,296 | | | | $559,572 | |
| Supplemental Ratios (%): | | | | | | | | | | | | | | | | | | | | |
Ratio of expenses to average net assets after
expense reductions excluding short sale
dividend and interest expense (f) | | | 1.10 | | | | 1.15 | | | | 1.17 | | | | 1.22 | | | | 1.21 | |
See Notes to Financial Statements
23
Financial Highlights – continued
| | | | | | | | | | | | | | | | | | | | |
| Class B | | Years ended 8/31 | |
| | | 2013 | | | 2012 | | | 2011 | | | 2010 | | | 2009 | |
Net asset value, beginning of period | | | $18.11 | | | | $15.86 | | | | $13.50 | | | | $12.80 | | | | $15.45 | |
| Income (loss) from investment operations | | | | | | | | | | | | | | | | | |
Net investment income (loss) (d) | | | $0.01 | | | | $(0.02 | ) | | | $(0.02 | ) | | | $(0.01 | ) | | | $0.05 | |
Net realized and unrealized gain (loss)
on investments and foreign currency | | | 3.76 | | | | 2.27 | | | | 2.38 | | | | 0.71 | | | | (2.70 | ) |
Total from investment operations | | | $3.77 | | | | $2.25 | | | | $2.36 | | | | $0.70 | | | | $(2.65 | ) |
| Less distributions declared to shareholders | | | | | | | | | | | | | | | | | |
From net investment income | | | $— | | | | $— | | | | $— | | | | $(0.00 | )(w) | | | $— | |
Net asset value, end of period (x) | | | $21.88 | | | | $18.11 | | | | $15.86 | | | | $13.50 | | | | $12.80 | |
Total return (%) (r)(s)(t)(x) | | | 20.82 | | | | 14.19 | | | | 17.48 | | | | 5.49 | | | | (17.15 | ) |
Ratios (%) (to average net assets)
and Supplemental data: | | | | | | | | | | | | | | | | | | | | |
Expenses before expense reductions (f) | | | 1.86 | | | | 1.91 | | | | 1.93 | | | | 1.99 | | | | 2.07 | |
Expenses after expense reductions (f) | | | 1.86 | | | | 1.90 | | | | 1.93 | | | | 1.98 | | | | 1.90 | |
Net investment income (loss) | | | 0.07 | | | | (0.14 | ) | | | (0.15 | ) | | | (0.06 | ) | | | 0.42 | |
Portfolio turnover | | | 58 | | | | 65 | | | | 66 | | | | 77 | | | | 109 | |
Net assets at end of period (000 omitted) | | | $40,495 | | | | $43,320 | | | | $49,181 | | | | $55,327 | | | | $79,608 | |
| Supplemental Ratios (%): | | | | | | | | | | | | | | | | | | | | |
Ratio of expenses to average net assets after
expense reductions excluding short sale
dividend and interest expense (f) | | | 1.86 | | | | 1.90 | | | | 1.92 | | | | 1.97 | | | | 1.90 | |
See Notes to Financial Statements
24
Financial Highlights – continued
| | | | | | | | | | | | | | | | | | | | |
| Class C | | Years ended 8/31 | |
| | | 2013 | | | 2012 | | | 2011 | | | 2010 | | | 2009 | |
Net asset value, beginning of period | | | $17.98 | | | | $15.74 | | | | $13.39 | | | | $12.75 | | | | $15.38 | |
| Income (loss) from investment operations | | | | | | | | | | | | | | | | | |
Net investment income (loss) (d) | | | $0.01 | | | | $(0.02 | ) | | | $(0.02 | ) | | | $(0.01 | ) | | | $0.04 | |
Net realized and unrealized gain (loss)
on investments and foreign currency | | | 3.73 | | | | 2.26 | | | | 2.37 | | | | 0.70 | | | | (2.67 | ) |
Total from investment operations | | | $3.74 | | | | $2.24 | | | | $2.35 | | | | $0.69 | | | | $(2.63 | ) |
| Less distributions declared to shareholders | | | | | | | | | | | | | | | | | |
From net investment income | | | $— | | | | $— | | | | $— | | | | $(0.05 | ) | | | $— | |
Net asset value, end of period (x) | | | $21.72 | | | | $17.98 | | | | $15.74 | | | | $13.39 | | | | $12.75 | |
Total return (%) (r)(s)(t)(x) | | | 20.80 | | | | 14.23 | | | | 17.55 | | | | 5.40 | | | | (17.10 | ) |
Ratios (%) (to average net assets)
and Supplemental data: | | | | | | | | | | | | | | | | | | | | |
Expenses before expense reductions (f) | | | 1.86 | | | | 1.90 | | | | 1.93 | | | | 1.99 | | | | 2.06 | |
Expenses after expense reductions (f) | | | 1.86 | | | | 1.90 | | | | 1.93 | | | | 1.98 | | | | 1.91 | |
Net investment income (loss) | | | 0.06 | | | | (0.14 | ) | | | (0.15 | ) | | | (0.07 | ) | | | 0.34 | |
Portfolio turnover | | | 58 | | | | 65 | | | | 66 | | | | 77 | | | | 109 | |
Net assets at end of period (000 omitted) | | | $78,777 | | | | $64,258 | | | | $62,249 | | | | $59,265 | | | | $63,993 | |
| Supplemental Ratios (%): | | | | | | | | | | | | | | | | | | | | |
Ratio of expenses to average net assets after
expense reductions excluding short sale
dividend and interest expense (f) | | | 1.86 | | | | 1.90 | | | | 1.92 | | | | 1.97 | | | | 1.91 | |
See Notes to Financial Statements
25
Financial Highlights – continued
| | | | | | | | | | | | | | | | | | | | |
| Class I | | Years ended 8/31 | |
| | | 2013 | | | 2012 | | | 2011 | | | 2010 | | | 2009 | |
Net asset value, beginning of period | | | $20.49 | | | | $17.91 | | | | $15.21 | | | | $14.43 | | | | $17.47 | |
| Income (loss) from investment operations | | | | | | | | | | | | | | | | | |
Net investment income (d) | | | $0.24 | | | | $0.16 | | | | $0.15 | | | | $0.15 | | | | $0.17 | |
Net realized and unrealized gain (loss)
on investments and foreign currency | | | 4.25 | | | | 2.57 | | | | 2.70 | | | | 0.79 | | | | (3.06 | ) |
Total from investment operations | | | $4.49 | | | | $2.73 | | | | $2.85 | | | | $0.94 | | | | $(2.89 | ) |
| Less distributions declared to shareholders | | | | | | | | | | | | | | | | | |
From net investment income | | | $(0.16 | ) | | | $(0.15 | ) | | | $(0.15 | ) | | | $(0.16 | ) | | | $(0.15 | ) |
Net asset value, end of period (x) | | | $24.82 | | | | $20.49 | | | | $17.91 | | | | $15.21 | | | | $14.43 | |
Total return (%) (r)(s)(x) | | | 22.03 | | | | 15.36 | | | | 18.73 | | | | 6.47 | | | | (16.29 | ) |
Ratios (%) (to average net assets)
and Supplemental data: | | | | | | | | | | | | | | | | | | | | |
Expenses before expense reductions (f) | | | 0.86 | | | | 0.90 | | | | 0.93 | | | | 0.99 | | | | 1.06 | |
Expenses after expense reductions (f) | | | 0.86 | | | | 0.90 | | | | 0.93 | | | | 0.98 | | | | 0.91 | |
Net investment income | | | 1.05 | | | | 0.86 | | | | 0.83 | | | | 0.93 | | | | 1.32 | |
Portfolio turnover | | | 58 | | | | 65 | | | | 66 | | | | 77 | | | | 109 | |
Net assets at end of period (000 omitted) | | | $29,812 | | | | $20,441 | | | | $17,250 | | | | $16,291 | | | | $15,766 | |
| Supplemental Ratios (%): | | | | | | | | | | | | | | | | | | | | |
Ratio of expenses to average net assets after
expense reductions excluding short sale
dividend and interest expense (f) | | | 0.86 | | | | 0.90 | | | | 0.92 | | | | 0.97 | | | | 0.91 | |
See Notes to Financial Statements
26
Financial Highlights – continued
| | | | | | | | | | | | | | | | | | | | |
| Class R1 | | Years ended 8/31 | |
| | | 2013 | | | 2012 | | | 2011 | | | 2010 | | | 2009 | |
Net asset value, beginning of period | | | $17.95 | | | | $15.72 | | | | $13.38 | | | | $12.75 | | | | $15.39 | |
| Income (loss) from investment operations | | | | | | | | | | | | | | | | | |
Net investment income (loss) (d) | | | $0.02 | | | | $(0.02 | ) | | | $(0.02 | ) | | | $(0.01 | ) | | | $0.04 | |
Net realized and unrealized gain (loss)
on investments and foreign currency | | | 3.72 | | | | 2.25 | | | | 2.37 | | | | 0.70 | | | | (2.68 | ) |
Total from investment operations | | | $3.74 | | | | $2.23 | | | | $2.35 | | | | $0.69 | | | | $(2.64 | ) |
| Less distributions declared to shareholders | | | | | | | | | | | | | | | | | |
From net investment income | | | $— | | | | $— | | | | $(0.01 | ) | | | $(0.06 | ) | | | $— | |
Net asset value, end of period (x) | | | $21.69 | | | | $17.95 | | | | $15.72 | | | | $13.38 | | | | $12.75 | |
Total return (%) (r)(s)(x) | | | 20.84 | | | | 14.19 | �� | | | 17.56 | | | | 5.43 | | | | (17.15 | ) |
Ratios (%) (to average net assets)
and Supplemental data: | | | | | | | | | | | | | | | | | | | | |
Expenses before expense reductions (f) | | | 1.86 | | | | 1.90 | | | | 1.93 | | | | 1.99 | | | | 2.06 | |
Expenses after expense reductions (f) | | | 1.86 | | | | 1.90 | | | | 1.93 | | | | 1.98 | | | | 1.91 | |
Net investment income (loss) | | | 0.08 | | | | (0.14 | ) | | | (0.15 | ) | | | (0.07 | ) | | | 0.32 | |
Portfolio turnover | | | 58 | | | | 65 | | | | 66 | | | | 77 | | | | 109 | |
Net assets at end of period (000 omitted) | | | $3,839 | | | | $4,098 | | | | $3,904 | | | | $3,688 | | | | $3,735 | |
| Supplemental Ratios (%): | | | | | | | | | | | | | | | | | | | | |
Ratio of expenses to average net assets after
expense reductions excluding short sale
dividend and interest expense (f) | | | 1.85 | | | | 1.90 | | | | 1.92 | | | | 1.97 | | | | 1.91 | |
See Notes to Financial Statements
27
Financial Highlights – continued
| | | | | | | | | | | | | | | | | | | | |
| Class R2 | | Years ended 8/31 | |
| | | 2013 | | | 2012 | | | 2011 | | | 2010 | | | 2009 | |
Net asset value, beginning of period | | | $19.28 | | | | $16.86 | | | | $14.33 | | | | $13.62 | | | | $16.45 | |
| Income (loss) from investment operations | | | | | | | | | | | | | | | | | |
Net investment income (d) | | | $0.12 | | | | $0.06 | | | | $0.06 | | | | $0.06 | | | | $0.10 | |
Net realized and unrealized gain (loss)
on investments and foreign currency | | | 4.00 | | | | 2.42 | | | | 2.54 | | | | 0.75 | | | | (2.87 | ) |
Total from investment operations | | | $4.12 | | | | $2.48 | | | | $2.60 | | | | $0.81 | | | | $(2.77 | ) |
| Less distributions declared to shareholders | | | | | | | | | | | | | | | | | |
From net investment income | | | $(0.05 | ) | | | $(0.06 | ) | | | $(0.07 | ) | | | $(0.10 | ) | | | $(0.06 | ) |
Net asset value, end of period (x) | | | $23.35 | | | | $19.28 | | | | $16.86 | | | | $14.33 | | | | $13.62 | |
Total return (%) (r)(s)(x) | | | 21.44 | | | | 14.74 | | | | 18.14 | | | | 5.97 | | | | (16.71 | ) |
Ratios (%) (to average net assets)
and Supplemental data: | | | | | | | | | | | | | | | | | | | | |
Expenses before expense reductions (f) | | | 1.36 | | | | 1.40 | | | | 1.43 | | | | 1.49 | | | | 1.56 | |
Expenses after expense reductions (f) | | | 1.36 | | | | 1.40 | | | | 1.43 | | | | 1.48 | | | | 1.41 | |
Net investment income | | | 0.56 | | | | 0.36 | | | | 0.35 | | | | 0.43 | | | | 0.82 | |
Portfolio turnover | | | 58 | | | | 65 | | | | 66 | | | | 77 | | | | 109 | |
Net assets at end of period (000 omitted) | | | $19,625 | | | | $17,369 | | | | $16,424 | | | | $14,013 | | | | $15,483 | |
| Supplemental Ratios (%): | | | | | | | | | | | | | | | | | | | | |
Ratio of expenses to average net assets after
expense reductions excluding short sale
dividend and interest expense (f) | | | 1.36 | | | | 1.40 | | | | 1.42 | | | | 1.47 | | | | 1.41 | |
See Notes to Financial Statements
28
Financial Highlights – continued
| | | | | | | | | | | | | | | | | | | | |
| Class R3 | | Years ended 8/31 | |
| | | 2013 | | | 2012 | | | 2011 | | | 2010 | | | 2009 | |
Net asset value, beginning of period | | | $19.63 | | | | $17.16 | | | | $14.59 | | | | $13.85 | | | | $16.73 | |
| Income (loss) from investment operations | | | | | | | | | | | | | | | | | |
Net investment income (d) | | | $0.18 | | | | $0.11 | | | | $0.11 | | | | $0.10 | | | | $0.13 | |
Net realized and unrealized gain (loss)
on investments and foreign currency | | | 4.05 | | | | 2.47 | | | | 2.57 | | | | 0.77 | | | | (2.91 | ) |
Total from investment operations | | | $4.23 | | | | $2.58 | | | | $2.68 | | | | $0.87 | | | | $(2.78 | ) |
| Less distributions declared to shareholders | | | | | | | | | | | | | | | | | |
From net investment income | | | $(0.11 | ) | | | $(0.11 | ) | | | $(0.11 | ) | | | $(0.13 | ) | | | $(0.10 | ) |
Net asset value, end of period (x) | | | $23.75 | | | | $19.63 | | | | $17.16 | | | | $14.59 | | | | $13.85 | |
Total return (%) (r)(s)(x) | | | 21.68 | | | | 15.12 | | | | 18.38 | | | | 6.25 | | | | (16.48 | ) |
Ratios (%) (to average net assets)
and Supplemental data: | | | | | | | | | | | | | | | | | | | | |
Expenses before expense reductions (f) | | | 1.11 | | | | 1.15 | | | | 1.18 | | | | 1.24 | | | | 1.32 | |
Expenses after expense reductions (f) | | | 1.11 | | | | 1.15 | | | | 1.18 | | | | 1.23 | | | | 1.16 | |
Net investment income | | | 0.81 | | | | 0.61 | | | | 0.60 | | | | 0.68 | | | | 1.07 | |
Portfolio turnover | | | 58 | | | | 65 | | | | 66 | | | | 77 | | | | 109 | |
Net assets at end of period (000 omitted) | | | $58,381 | | | | $46,833 | | | | $32,277 | | | | $26,573 | | | | $25,741 | |
| Supplemental Ratios (%): | | | | | | | | | | | | | | | | | | | | |
Ratio of expenses to average net assets after
expense reductions excluding short sale
dividend and interest expense (f) | | | 1.10 | | | | 1.15 | | | | 1.17 | | | | 1.22 | | | | 1.16 | |
See Notes to Financial Statements
29
Financial Highlights – continued
| | | | | | | | | | | | | | | | | | | | |
| Class R4 | | Years ended 8/31 | |
| | | 2013 | | | 2012 | | | 2011 | | | 2010 | | | 2009 | |
Net asset value, beginning of period | | | $19.81 | | | | $17.32 | | | | $14.72 | | | | $13.98 | | | | $16.92 | |
| Income (loss) from investment operations | | | | | | | | | | | | | | | | | |
Net investment income (d) | | | $0.23 | | | | $0.16 | | | | $0.13 | | | | $0.14 | | | | $0.10 | |
Net realized and unrealized gain (loss)
on investments and foreign currency | | | 4.11 | | | | 2.48 | | | | 2.62 | | | | 0.76 | | | | (2.90 | ) |
Total from investment operations | | | $4.34 | | | | $2.64 | | | | $2.75 | | | | $0.90 | | | | $(2.80 | ) |
| Less distributions declared to shareholders | | | | | | | | | | | | | | | | | |
From net investment income | | | $(0.16 | ) | | | $(0.15 | ) | | | $(0.15 | ) | | | $(0.16 | ) | | | $(0.14 | ) |
Net asset value, end of period (x) | | | $23.99 | | | | $19.81 | | | | $17.32 | | | | $14.72 | | | | $13.98 | |
Total return (%) (r)(s)(x) | | | 22.03 | | | | 15.36 | | | | 18.68 | | | | 6.40 | | | | (16.28 | ) |
Ratios (%) (to average net assets)
and Supplemental data: | | | | | | | | | | | | | | | | | | | | |
Expenses before expense reductions (f) | | | 0.86 | | | | 0.91 | | | | 0.92 | | | | 0.98 | | | | 0.96 | |
Expenses after expense reductions (f) | | | 0.86 | | | | 0.90 | | | | 0.92 | | | | 0.97 | | | | 0.95 | |
Net investment income | | | 1.04 | | | | 0.86 | | | | 0.75 | | | | 0.92 | | | | 0.75 | |
Portfolio turnover | | | 58 | | | | 65 | | | | 66 | | | | 77 | | | | 109 | |
Net assets at end of period (000 omitted) | | | $6,165 | | | | $1,871 | | | | $1,367 | | | | $408 | | | | $1,633 | |
| Supplemental Ratios (%): | | | | | | | | | | | | | | | | | | | | |
Ratio of expenses to average net assets after
expense reductions excluding short sale
dividend and interest expense (f) | | | 0.86 | | | | 0.90 | | | | 0.91 | | | | 0.97 | | | | 0.95 | |
See Notes to Financial Statements
30
Financial Highlights – continued
| | | | |
| Class R5 | | Period ended
8/31/13 (i) | |
Net asset value, beginning of period | | | $21.02 | |
| Income (loss) from investment operations | | | | |
Net investment income (d) | | | $0.22 | |
Net realized and unrealized gain (loss) on investments and
foreign currency | | | 3.60 | |
Total from investment operations | | | $3.82 | |
Net asset value, end of period (x) | | | $24.84 | |
Total return (%) (r)(s)(x) | | | 18.17 | (n) |
Ratios (%) (to average net assets)
and Supplemental data: | | | | |
Expenses before expense reductions (f) | | | 0.76 | (a) |
Expenses after expense reductions (f) | | | 0.76 | (a) |
Net investment income | | | 1.39 | (a) |
Portfolio turnover | | | 58 | |
Net assets at end of period (000 omitted) | | | $119 | |
| Supplemental Ratios (%): | | | | |
Ratio of expenses to average net assets after expense reductions
excluding short sale dividend and interest expense (f) | | | 0.75 | (a) |
| (d) | Per share data is based on average shares outstanding. |
| (f) | Ratios do not reflect reductions from fees paid indirectly, if applicable. |
| (i) | For the period from the class inception, January 2, 2013, through the stated period end. |
| (r) | Certain expenses have been reduced without which performance would have been lower. |
| (s) | From time to time the fund may receive proceeds from litigation settlements, without which performance would be lower. Excluding the effect of the proceeds received from a nonrecurring litigation settlement against Enron Corp., the Class A, Class B, Class C, Class I, Class R1, Class R2, Class R3, and Class R4 total returns for the year ended August 31, 2009 would have been lower by approximately 2.41%, 2.40%, 2.42%, 2.40%, 2.40%, 2.36%, 2.40% and 2.40%, respectively. |
| (t) | Total returns do not include any applicable sales charges. |
| (w) | Per share amount was less than $0.01. |
| (x) | The net asset values per share and total returns have been calculated on net assets which include adjustments made in accordance with U.S. generally accepted accounting principles required at period end for financial reporting purposes. |
See Notes to Financial Statements
31
NOTES TO FINANCIAL STATEMENTS
(1) Business and Organization
MFS Core Equity Fund (the fund) is a series of MFS Series Trust I (the trust). The trust is organized as a Massachusetts business trust and is registered under the Investment Company Act of 1940, as amended, as an open-end management investment company.
(2) Significant Accounting Policies
General – The preparation of financial statements in conformity with U.S. generally accepted accounting principles requires management to make estimates and assumptions that affect the reported amounts of assets and liabilities, and disclosure of contingent assets and liabilities at the date of the financial statements and the reported amounts of revenues and expenses during the reporting period. Actual results could differ from those estimates. In the preparation of these financial statements, management has evaluated subsequent events occurring after the date of the fund’s Statement of Assets and Liabilities through the date that the financial statements were issued.
In January 2013, the Financial Accounting Standards Board (FASB) issued Accounting Standards Update 2013-01 (“ASU 2013-01”) entitled Balance Sheet (Topic 210) – Clarifying the Scope of Disclosures about Offsetting Assets and Liabilities which is intended to clarify the scope of Accounting Standards Update 2011-11 (“ASU 2011-11”), Balance Sheet (Topic 210) – Disclosures about Offsetting Assets and Liabilities. Consistent with the effective date for ASU 2011-11, ASU 2013-01 is effective for annual reporting periods beginning on or after January 1, 2013, and interim periods within those annual periods. ASU 2013-01 limits the scope of ASU 2011-11’s disclosure requirements on offsetting to financial assets and financial liabilities related to derivatives, repurchase and reverse repurchase agreements, and securities lending and securities borrowing transactions. Although still evaluating the potential impact of these two ASUs to the fund, management expects that the impact of the fund’s adoption will be limited to additional financial statement disclosures.
In June 2013, FASB issued Accounting Standards Update 2013-08 Financial Services – Investment Companies (Topic 946) – Amendments to the Scope, Measurement, and Disclosure Requirements (“ASU 2013-08”) which is effective for interim and annual reporting periods in fiscal years that begin after December 15, 2013. ASU 2013-08 sets forth a methodology for determining whether an entity should be characterized as an investment company and prescribes fair value accounting for an investment company’s non-controlling ownership interest in another investment company. FASB has determined that a fund registered under the Investment Company Act of 1940 automatically meets ASU 2013-08’s criteria for an investment company. Although still evaluating the potential impacts of ASU 2013-08 to the fund, management expects that the impact of the fund’s adoption will be limited to additional financial statement disclosures.
Investment Valuations – Equity securities, including restricted equity securities, are generally valued at the last sale or official closing price as provided by a third-party pricing service on the market or exchange on which they are primarily traded. Equity securities, for which there were no sales reported that day, are generally valued at the
32
Notes to Financial Statements – continued
last quoted daily bid quotation as provided by a third-party pricing service on the market or exchange on which such securities are primarily traded. Equity securities held short, for which there were no sales reported for that day, are generally valued at the last quoted daily ask quotation as provided by a third-party pricing service on the market or exchange on which such securities are primarily traded. Short-term instruments with a maturity at issuance of 60 days or less generally are valued at amortized cost, which approximates market value. Exchange-traded options are generally valued at the last sale or official closing price as provided by a third-party pricing service on the exchange on which such options are primarily traded. Exchange-traded options for which there were no sales reported that day are generally valued at the last daily bid quotation as provided by a third-party pricing service on the exchange on which such options are primarily traded. Options not traded on an exchange are generally valued at a broker/dealer bid quotation. Foreign currency options are generally valued at valuations provided by a third-party pricing service. Open-end investment companies are generally valued at net asset value per share. Securities and other assets generally valued on the basis of information from a third-party pricing service may also be valued at a broker/dealer bid quotation. Values obtained from third-party pricing services can utilize both transaction data and market information such as yield, quality, coupon rate, maturity, type of issue, trading characteristics, and other market data. The values of foreign securities and other assets and liabilities expressed in foreign currencies are converted to U.S. dollars using the mean of bid and asked prices for rates provided by a third-party pricing service.
The Board of Trustees has delegated primary responsibility for determining or causing to be determined the value of the fund’s investments (including any fair valuation) to the adviser pursuant to valuation policies and procedures approved by the Board. If the adviser determines that reliable market quotations are not readily available, investments are valued at fair value as determined in good faith by the adviser in accordance with such procedures under the oversight of the Board of Trustees. Under the fund’s valuation policies and procedures, market quotations are not considered to be readily available for most types of debt instruments and floating rate loans and many types of derivatives. These investments are generally valued at fair value based on information from third-party pricing services. In addition, investments may be valued at fair value if the adviser determines that an investment’s value has been materially affected by events occurring after the close of the exchange or market on which the investment is principally traded (such as foreign exchange or market) and prior to the determination of the fund’s net asset value, or after the halting of trading of a specific security where trading does not resume prior to the close of the exchange or market on which the security is principally traded. Events that occur on a frequent basis after foreign markets close (such as developments in foreign markets and significant movements in the U.S. markets) and prior to the determination of the fund’s net asset value may be deemed to have a material effect on the value of securities traded in foreign markets. Accordingly, the fund’s foreign equity securities may often be valued at fair value. The adviser generally relies on third-party pricing services or other information (such as the correlation with price movements of similar securities in the same or other markets; the type, cost and investment characteristics of the security; the business and financial condition of the issuer; and trading and other market data) to assist in determining
33
Notes to Financial Statements – continued
whether to fair value and at what value to fair value an investment. The value of an investment for purposes of calculating the fund’s net asset value can differ depending on the source and method used to determine value. When fair valuation is used, the value of an investment used to determine the fund’s net asset value may differ from quoted or published prices for the same investment. There can be no assurance that the fund could obtain the fair value assigned to an investment if it were to sell the investment at the same time at which the fund determines its net asset value per share.
Various inputs are used in determining the value of the fund’s assets or liabilities. These inputs are categorized into three broad levels. In certain cases, the inputs used to measure fair value may fall into different levels of the fair value hierarchy. In such cases, an investment’s level within the fair value hierarchy is based on the lowest level of input that is significant to the fair value measurement. The fund’s assessment of the significance of a particular input to the fair value measurement in its entirety requires judgment, and considers factors specific to the investment. Level 1 includes unadjusted quoted prices in active markets for identical assets or liabilities. Level 2 includes other significant observable market-based inputs (including quoted prices for similar securities, interest rates, prepayment speed, and credit risk). Level 3 includes unobservable inputs, which may include the adviser’s own assumptions in determining the fair value of investments. Other financial instruments are derivative instruments not reflected in total investments, such as written options. The following is a summary of the levels used as of August 31, 2013 in valuing the fund’s assets or liabilities:
| | | | | | | | | | | | | | | | |
| Investments at Value | | Level 1 | | | Level 2 | | | Level 3 | | | Total | |
| Equity Securities: | | | | | | | | | | | | | | | | |
United States | | | $1,047,747,941 | | | | $— | | | | $— | | | | $1,047,747,941 | |
Canada | | | 24,870,580 | | | | — | | | | — | | | | 24,870,580 | |
Israel | | | 9,983,320 | | | | — | | | | — | | | | 9,983,320 | |
Bermuda | | | 6,010,287 | | | | — | | | | — | | | | 6,010,287 | |
Netherlands | | | 4,860,349 | | | | — | | | | — | | | | 4,860,349 | |
Greece | | | 2,109,121 | | | | — | | | | — | | | | 2,109,121 | |
United Kingdom | | | — | | | | — | | | | 638,467 | | | | 638,467 | |
| Mutual Funds | | | 10,013,362 | | | | — | | | | — | | | | 10,013,362 | |
| Total Investments | | | $1,105,594,960 | | | | $— | | | | $638,467 | | | | $1,106,233,427 | |
| | | | |
| Other Financial Instruments | | | | | | | | | | | | |
| Written Options | | | $(5,932 | ) | | | $— | | | | $— | | | | $(5,932 | ) |
For further information regarding security characteristics, see the Portfolio of Investments.
The following is a reconciliation of level 3 assets for which significant unobservable inputs were used to determine fair value. The fund’s policy is to recognize transfers between the levels as of the end of the period. The table presents the activity of level 3 securities held at the beginning and the end of the period.
| | | | |
| | | Equity Securities | |
| Balance as of 8/31/12 | | | $849,797 | |
Change in unrealized appreciation (depreciation) | | | (211,330 | ) |
| Balance as of 8/31/13 | | | $638,467 | |
34
Notes to Financial Statements – continued
The net change in unrealized appreciation (depreciation) from investments still held as level 3 at August 31, 2013 is $(211,330).
Foreign Currency Translation – Purchases and sales of foreign investments, income, and expenses are converted into U.S. dollars based upon currency exchange rates prevailing on the respective dates of such transactions or on the reporting date for foreign denominated receivables and payables. Gains and losses attributable to foreign currency exchange rates on sales of securities are recorded for financial statement purposes as net realized gains and losses on investments. Gains and losses attributable to foreign exchange rate movements on receivables, payables, income and expenses are recorded for financial statement purposes as foreign currency transaction gains and losses. That portion of both realized and unrealized gains and losses on investments that results from fluctuations in foreign currency exchange rates is not separately disclosed.
Derivatives – The fund uses derivatives for different purposes, primarily to increase or decrease exposure to a particular market or segment of the market, or security, to increase or decrease interest rate or currency exposure, or as alternatives to direct investments. Derivatives are used for hedging or non-hedging purposes. While hedging can reduce or eliminate losses, it can also reduce or eliminate gains. When the fund uses derivatives as an investment to increase market exposure, or for hedging purposes, gains and losses from derivative instruments may be substantially greater than the derivative’s original cost.
The derivative instruments used by the fund were written options and purchased options. The following table presents, by major type of derivative contract, the fair value, on a gross basis, of the asset and liability components of derivatives held by the fund at August 31, 2013 as reported in the Statement of Assets and Liabilities:
| | | | | | | | | | |
| | | | | Fair Value (a) | |
| Risk | | Derivative Contracts | | Asset Derivatives | | | Liability Derivatives | |
| Equity | | Purchased Equity Options | | | $34,785 | | | | $— | |
| Equity | | Written Equity Options | | | — | | | | (5,932 | ) |
| Total | | | | | $34,785 | | | | $(5,932 | ) |
| (a) | The value of purchased options outstanding is included in total investments, at value, within the fund’s Statement of Assets and Liabilities. |
The following table presents, by major type of derivative contract, the realized gain (loss) on derivatives held by the fund for the year ended August 31, 2013 as reported in the Statement of Operations:
| | | | | | | | |
| Risk | | Investments
(Purchased
Options) | | | Written
Options | |
| Equity | | | $151,616 | | | | $49,267 | |
35
Notes to Financial Statements – continued
The following table presents, by major type of derivative contract, the change in unrealized appreciation (depreciation) on derivatives held by the fund for the year ended August 31, 2013 as reported in the Statement of Operations:
| | | | | | | | |
| Risk | | Investments
(Purchased
Options) | | | Written
Options | |
| Equity | | | $(17,827 | ) | | | $(47,199 | ) |
Derivative counterparty credit risk is managed through formal evaluation of the creditworthiness of all potential counterparties. On certain, but not all, over-the-counter derivatives, the fund attempts to reduce its exposure to counterparty credit risk whenever possible by entering into an International Swaps and Derivatives Association (ISDA) Master Agreement on a bilateral basis with each of the counterparties with whom it undertakes a significant volume of transactions. The ISDA Master Agreement gives each party to the agreement the right to terminate all transactions traded under such agreement if there is a certain deterioration in the credit quality of the other party. Upon an event of default or a termination of the ISDA Master Agreement, the non-defaulting party has the right to close out all transactions traded under such agreement and to net amounts owed under each transaction to one net amount payable by one party to the other. This right to close out and net payments across all transactions traded under the ISDA Master Agreement could result in a reduction of the fund’s credit risk to such counterparty equal to any amounts payable by the fund under the applicable transactions, if any.
Collateral and margin requirements differ by type of derivative. Margin requirements are set by the broker or clearing house for cleared derivatives (i.e., futures contracts, cleared swaps, and exchange-traded options) while collateral terms are contract specific for over-the-counter traded derivatives (i.e., forward foreign currency exchange contracts, uncleared swap agreements, and over-the-counter options). For derivatives traded under an ISDA Master Agreement, the collateral requirements are netted across all transactions traded under such agreement and one amount is posted from one party to the other to collateralize such obligations. Cash that has been segregated to cover the fund’s collateral or margin obligations under derivative contracts, if any, will be reported separately in the Statement of Assets and Liabilities as “Deposits with brokers.” Securities pledged as collateral or margin for the same purpose, if any, is noted in the Portfolio of Investments.
The fund’s accounting policy with respect to balance sheet offsetting is that, absent an event of default by the counterparty or a termination of the agreement, the ISDA Master Agreement does not result in an offset of reported amounts of financial assets and financial liabilities in the Statement of Assets and Liabilities across transactions between the fund and the applicable counterparty.
Written Options – In exchange for a premium, the fund wrote call options on securities that it anticipated the price would decline and also wrote put options on securities that it anticipated the price would increase. At the time the option was written, the fund believed the premium received exceeded the potential loss that could result from adverse price changes in the options’ underlying securities. In a written option, the fund as the option writer grants the buyer the right to purchase from, or
36
Notes to Financial Statements – continued
sell to, the fund a specified number of shares or units of a particular security, currency or index at a specified price within a specified period of time.
The premium received is initially recorded as a liability in the Statement of Assets and Liabilities. The option is subsequently marked-to-market daily with the difference between the premium received and the market value of the written option being recorded as unrealized appreciation or depreciation. When a written option expires, the fund realizes a gain equal to the amount of the premium received. The difference between the premium received and the amount paid on effecting a closing transaction is considered a realized gain or loss. When a written call option is exercised, the premium received is offset against the proceeds to determine the realized gain or loss. When a written put option is exercised, the premium reduces the cost basis of the security purchased by the fund.
At the initiation of the written option contract, for exchange traded options, the fund is required to deposit securities or cash as collateral with the custodian for the benefit of the broker. For over-the-counter options, the fund may post collateral subject to the terms of an ISDA Master Agreement as generally described above if the market value of the options contract moves against it. The fund, as writer of an option, may have no control over whether the underlying securities may be sold (call) or purchased (put) and, as a result, bears the market risk of an unfavorable change in the price of the securities underlying the written option. Losses from writing options can exceed the premium received and can exceed the potential loss from an ordinary buy and sell transaction. Although the fund’s market risk may be significant, the maximum counterparty credit risk to the fund is equal to the market value of any collateral posted to the broker. For over-the-counter options, this risk is mitigated in cases where there is an ISDA Master Agreement between the fund and the counterparty providing for netting as described above.
The following table represents the written option activity in the fund during the year ended August 31, 2013:
| | | | | | | | |
| | | Number of
Contracts | | | Premiums
Received | |
| Outstanding, beginning of period | | | — | | | | $— | |
| Options written | | | 3,637 | | | | 687,679 | |
| Options closed | | | (2,515 | ) | | | (629,391 | ) |
| Options expired | | | (65 | ) | | | (5,157 | ) |
| Outstanding, end of period | | | 1,057 | | | | $53,131 | |
Purchased Options – The fund purchased call and put options for a premium. Purchased call and put options entitle the holder to buy and sell a specified number of shares or units of a particular security, currency or index at a specified price at a specified date or within a specified period of time. Purchasing call options may hedge against an anticipated increase in the dollar cost of securities or currency to be acquired or increase the fund’s exposure to an underlying instrument. Purchasing put options may hedge against an anticipated decline in the value of portfolio securities or currency or decrease the fund’s exposure to an underlying instrument.
37
Notes to Financial Statements – continued
The premium paid is initially recorded as an investment in the Statement of Assets and Liabilities. That investment is subsequently marked-to-market daily with the difference between the premium paid and the market value of the purchased option being recorded as unrealized appreciation or depreciation. Premiums paid for purchased call and put options which have expired are treated as realized losses on investments in the Statement of Operations. Upon the exercise or closing of a purchased call option, the premium paid is added to the cost of the security or financial instrument purchased. Upon the exercise or closing of a purchased put option, the premium paid is offset against the proceeds on the sale of the underlying security or financial instrument in order to determine the realized gain or loss on investments.
Whether or not the option is exercised, the fund’s maximum risk of loss from purchasing an option is the amount of premium paid. All option contracts involve credit risk if the counterparty to the option contract fails to perform. For over-the-counter options, this risk is mitigated in cases where there is an ISDA Master Agreement between the fund and the counterparty providing for netting as described above and for posting of collateral by the counterparty to the fund to cover the fund’s exposure to the counterparty under such ISDA Master Agreement.
Short Sales – The fund entered into short sales whereby it sells a security it does not own in anticipation of a decline in the value of that security. The fund will realize a gain if the security price decreases and a loss if the security price increases between the date of the short sale and the date on which the fund replaces the borrowed security. Losses from short sales can exceed the proceeds of the security sold; and they can also exceed the potential loss from an ordinary buy and sell transaction. The amount of any premium, dividends, or interest the fund may be required to pay in connection with a short sale will be recognized as a fund expense. During the year ended August 31, 2013, this expense amounted to $51,268. The fund segregates cash or marketable securities in an amount that, when combined with the amount of proceeds from the short sale deposited with the broker, at least equals the current market value of the security sold short. At August 31, 2013, the fund had no short sales outstanding.
Security Loans – State Street Bank and Trust Company (“State Street”), as lending agent, loans the securities of the fund to certain qualified institutions (the “Borrowers”) approved by the fund. The loans are collateralized by cash and/or U.S. Treasury and federal agency obligations in an amount typically at least equal to the market value of the securities loaned. The market value of the loaned securities is determined at the close of business of the fund and any additional required collateral is delivered to the fund on the next business day. State Street provides the fund with indemnification against Borrower default. The fund bears the risk of loss with respect to the investment of cash collateral. On loans collateralized by cash, the cash collateral is invested in a money market fund or short-term securities. A portion of the income generated upon investment of the collateral is remitted to the Borrowers, and the remainder is allocated between the fund and the lending agent. On loans collateralized by U.S. Treasury and/or federal agency obligations, a fee is received from the Borrower, and is allocated between the fund and the lending agent. Income from securities lending is included in “Interest” income in the Statement of Operations. The dividend and interest income earned on the securities loaned is accounted for in the same manner as other dividend and interest income. At August 31, 2013, there were no securities on loan or collateral outstanding.
38
Notes to Financial Statements – continued
Indemnifications – Under the fund’s organizational documents, its officers and Trustees may be indemnified against certain liabilities and expenses arising out of the performance of their duties to the fund. Additionally, in the normal course of business, the fund enters into agreements with service providers that may contain indemnification clauses. The fund’s maximum exposure under these agreements is unknown as this would involve future claims that may be made against the fund that have not yet occurred.
Investment Transactions and Income – Investment transactions are recorded on the trade date. Interest income is recorded on the accrual basis. Dividends received in cash are recorded on the ex-dividend date. Certain dividends from foreign securities will be recorded when the fund is informed of the dividend if such information is obtained subsequent to the ex-dividend date. Dividend and interest payments received in additional securities are recorded on the ex-dividend or ex-interest date in an amount equal to the value of the security on such date.
The fund may receive proceeds from litigation settlements. Any proceeds received from litigation involving portfolio holdings are reflected in the Statement of Operations in realized gain/loss if the security has been disposed of by the fund or in unrealized gain/loss if the security is still held by the fund. Any other proceeds from litigation not related to portfolio holdings are reflected as other income in the Statement of Operations.
Fees Paid Indirectly – The fund’s custody fee may be reduced according to an arrangement that measures the value of cash deposited with the custodian by the fund. This amount, for the year ended August 31, 2013, is shown as a reduction of total expenses in the Statement of Operations.
Tax Matters and Distributions – The fund intends to qualify as a regulated investment company, as defined under Subchapter M of the Internal Revenue Code, and to distribute all of its taxable income, including realized capital gains. As a result, no provision for federal income tax is required. The fund’s federal tax returns, when filed, will remain subject to examination by the Internal Revenue Service for a three year period. Foreign taxes have been accrued by the fund in the accompanying financial statements in accordance with the applicable foreign tax law. Foreign income taxes may be withheld by certain countries in which the fund invests.
Distributions to shareholders are recorded on the ex-dividend date. Income and capital gain distributions are determined in accordance with income tax regulations, which may differ from U.S. generally accepted accounting principles. Certain capital accounts in the financial statements are periodically adjusted for permanent differences in order to reflect their tax character. These adjustments have no impact on net assets or net asset value per share. Temporary differences which arise from recognizing certain items of income, expense, gain or loss in different periods for financial statement and tax purposes will reverse at some time in the future. Distributions in excess of net investment income or net realized gains are temporary overdistributions for financial statement purposes resulting from differences in the recognition or classification of income or distributions for financial statement and tax purposes.
Book/tax differences primarily relate to expiration of capital loss carryforwards and wash sale loss deferrals.
39
Notes to Financial Statements – continued
The tax character of distributions declared to shareholders for the last two fiscal years is as follows:
| | | | | | | | |
| | | 8/31/13 | | | 8/31/12 | |
| Ordinary income (including any short-term capital gains) | | | $4,250,197 | | | | $4,062,237 | |
The federal tax cost and the tax basis components of distributable earnings were as follows:
| | | | |
| As of 8/31/13 | | | |
| Cost of investments | | | $934,840,631 | |
| Gross appreciation | | | 190,820,224 | |
| Gross depreciation | | | (19,427,428 | ) |
| Net unrealized appreciation (depreciation) | | | $171,392,796 | |
| Undistributed ordinary income | | | 7,148,276 | |
| Capital loss carryforwards | | | (10,472,027 | ) |
| Other temporary differences | | | (257,174 | ) |
Under the Regulated Investment Company Modernization Act of 2010 (the “Act”), net capital losses recognized for fund fiscal years beginning after August 31, 2011 may be carried forward indefinitely, and their character is retained as short-term and/or long-term losses (“post-enactment losses”). Previously, net capital losses were carried forward for eight years and treated as short-term losses (“pre-enactment losses”). As a transition rule, the Act requires that all post-enactment net capital losses be used before pre-enactment net capital losses.
As of August 31, 2013, the fund had capital loss carryforwards available to offset future realized gains. Such pre-enactment losses expire as follows:
| | | | |
| 8/31/16 | | | $(9,599,724 | ) |
| 8/31/18 | | | (872,303 | ) |
| Total | | | $(10,472,027 | ) |
The availability of $9,599,724 of the capital loss carryforwards, which were acquired on July 24, 2009 in connection with the MFS New Endeavor Fund merger, may be limited in a given year.
Multiple Classes of Shares of Beneficial Interest – The fund offers multiple classes of shares, which differ in their respective distribution and service fees. The fund’s income, realized and unrealized gain (loss), and common expenses are allocated to shareholders based on the daily net assets of each class. Dividends are declared separately for each class. Differences in per share dividend rates are generally due to differences in separate class expenses. Class B shares will convert to Class A shares
40
Notes to Financial Statements – continued
approximately eight years after purchase. The fund’s distributions declared to shareholders as reported in the Statements of Changes in Net Assets are presented by class as follows:
| | | | | | | | |
| | | From net investment
income | |
| | | Year
ended
8/31/13 | | | Year
ended
8/31/12 | |
| Class A | | | $3,763,479 | | | | $3,629,814 | |
| Class I | | | 153,997 | | | | 144,617 | |
| Class R2 | | | 46,102 | | | | 53,991 | |
| Class R3 | | | 268,678 | | | | 219,844 | |
| Class R4 | | | 17,941 | | | | 13,971 | |
| Total | | | $4,250,197 | | | | $4,062,237 | |
(3) Transactions with Affiliates
Investment Adviser – The fund has an investment advisory agreement with MFS to provide overall investment management and related administrative services and facilities to the fund. The management fee is computed daily and paid monthly at the following annual rates:
| | | | |
| First $500 million of average daily net assets | | | 0.65 | % |
| Average daily net assets in excess of $500 million | | | 0.55 | % |
Effective August 1, 2013, the investment adviser has agreed in writing to reduce its management fee to 0.50% of average daily net assets in excess of $2.5 billion. This written agreement will continue until modified by the fund’s Board of Trustees, but such agreement will continue at least until December 31, 2014. For the period from August 1, 2013 through August 31, 2013, the fund’s average daily net assets did not exceed $2.5 billion and therefore, the management fee was not reduced.
Effective April 1, 2013, MFS has agreed in writing to reduce its management fee by a specified amount if certain MFS mutual fund assets exceed thresholds agreed to by MFS and the fund’s Board of Trustees. For the period April 1, 2013 through August 31, 2013, this management fee reduction amounted to $2,431, which is shown as a reduction of total expenses in the Statement of Operations. The management fee incurred for the year ended August 31, 2013 was equivalent to an annual effective rate of 0.60% of the fund’s average daily net assets.
The investment adviser has agreed in writing to pay a portion of the fund’s total annual operating expenses, exclusive of interest, taxes, extraordinary expenses, brokerage and transaction costs, and investment-related expenses, such that total fund operating expenses do not exceed the following rates annually of each class’s average daily net assets:
| | | | | | | | | | | | | | | | |
| Classes |
| A | | B | | C | | I | | R1 | | R2 | | R3 | | R4 | | R5 |
| 1.26% | | 2.01% | | 2.01% | | 1.01% | | 2.01% | | 1.51% | | 1.26% | | 1.01% | | 0.94% |
This written agreement will terminate on December 31, 2013. For the year ended August 31, 2013, the fund’s actual operating expenses did not exceed the limit and therefore, the investment adviser did not pay any portion of the fund’s expenses related to this agreement.
41
Notes to Financial Statements – continued
Distributor – MFS Fund Distributors, Inc. (MFD), a wholly-owned subsidiary of MFS, as distributor, received $606,276 for the year ended August 31, 2013, as its portion of the initial sales charge on sales of Class A shares of the fund.
The Board of Trustees has adopted a distribution plan for certain class shares pursuant to Rule 12b-1 of the Investment Company Act of 1940.
The fund’s distribution plan provides that the fund will pay MFD for services provided by MFD and financial intermediaries in connection with the distribution and servicing of certain share classes. One component of the plan is a distribution fee paid to MFD and another component of the plan is a service fee paid to MFD. MFD may subsequently pay all, or a portion, of the distribution and/or service fees to financial intermediaries.
Distribution Plan Fee Table:
| | | | | | | | | | | | | | | | | | | | |
| | | Distribution
Fee Rate (d) | | | Service
Fee Rate (d) | | | Total
Distribution
Plan (d) | | | Annual
Effective
Rate (e) | | | Distribution and Service Fee | |
| Class A | | | — | | | | 0.25% | | | | 0.25% | | | | 0.25% | | | | $1,938,903 | |
| Class B | | | 0.75% | | | | 0.25% | | | | 1.00% | | | | 1.00% | | | | 419,986 | |
| Class C | | | 0.75% | | | | 0.25% | | | | 1.00% | | | | 1.00% | | | | 696,776 | |
| Class R1 | | | 0.75% | | | | 0.25% | | | | 1.00% | | | | 1.00% | | | | 37,533 | |
| Class R2 | | | 0.25% | | | | 0.25% | | | | 0.50% | | | | 0.50% | | | | 91,083 | |
| Class R3 | | | — | | | | 0.25% | | | | 0.25% | | | | 0.25% | | | | 130,331 | |
| Total Distribution and Service Fees | | | | | | | | $3,314,612 | |
| (d) | In accordance with the distribution plan for certain classes, the fund pays distribution and/or service fees equal to these annual percentage rates of each class’s average daily net assets. The distribution and service fee rates disclosed by class represent the current rates in effect at the end of the reporting period. |
| (e) | The annual effective rates represent actual fees incurred under the distribution plan for the year ended August 31, 2013 based on each class’s average daily net assets. Effective January 1, 2013, MFD has voluntarily agreed to rebate a portion of each class’s 0.25% service fee attributable to accounts for which MFD retains the 0.25% service fee except for accounts attributable to MFS or its subsidiaries’ seed money. For the period January 1, 2013 through August 31, 2013, this rebate amounted to $29,146, $504, $969, and $1,723 for Class A, Class B, Class C, and Class R3, respectively, and is reflected as a reduction of total expenses in the Statement of Operations. |
Certain Class A shares are subject to a contingent deferred sales charge (CDSC) in the event of a shareholder redemption within 18 months of purchase for shares purchased on or after August 1, 2012, and within 24 months of purchase for shares purchased prior to August 1, 2012. Class C shares are subject to a CDSC in the event of a shareholder redemption within 12 months of purchase. Class B shares are subject to a CDSC in the event of a shareholder redemption within six years of purchase. All contingent deferred sales charges are paid to MFD and during the year ended August 31, 2013, were as follows:
| | | | |
| | | Amount | |
| Class A | | | $5,226 | |
| Class B | | | 38,259 | |
| Class C | | | 2,235 | |
42
Notes to Financial Statements – continued
Shareholder Servicing Agent – MFS Service Center, Inc. (MFSC), a wholly-owned subsidiary of MFS, receives a fee from the fund for its services as shareholder servicing agent calculated as a percentage of the average daily net assets of the fund as determined periodically under the supervision of the fund’s Board of Trustees. For the year ended August 31, 2013, the fee was $579,497, which equated to 0.0586% annually of the fund’s average daily net assets. MFSC also receives payment from the fund for out-of-pocket expenses, sub-accounting and other shareholder servicing costs which may be paid to affiliated and unaffiliated service providers. Class R5 shares do not incur sub-accounting fees. For the year ended August 31, 2013, these out-of-pocket expenses, sub-accounting and other shareholder servicing costs amounted to $1,342,640.
Administrator – MFS provides certain financial, legal, shareholder communications, compliance, and other administrative services to the fund. Under an administrative services agreement, the fund partially reimburses MFS the costs incurred to provide these services. The fund is charged an annual fixed amount of $17,500 plus a fee based on average daily net assets. The administrative services fee incurred for the year ended August 31, 2013 was equivalent to an annual effective rate of 0.0138% of the fund’s average daily net assets.
Trustees’ and Officers’ Compensation – The fund pays compensation to independent Trustees in the form of a retainer, attendance fees, and additional compensation to Board and Committee chairpersons. The fund does not pay compensation directly to Trustees or officers of the fund who are also officers of the investment adviser, all of whom receive remuneration for their services to the fund from MFS. Certain officers and Trustees of the fund are officers or directors of MFS, MFD, and MFSC.
Prior to December 31, 2001, the fund had an unfunded defined benefit plan (“DB plan”) for independent Trustees. As of December 31, 2001, the Board took action to terminate the DB plan with respect to then-current and any future independent Trustees, such that the DB plan covers only certain of those former independent Trustees who retired on or before December 31, 2001. Effective January 1, 2002, accrued benefits under the DB plan for then-current independent Trustees who continued were credited to an unfunded retirement deferral plan (the “Retirement Deferral plan”), which was established for and exists solely with respect to these credited amounts, and is not available for other deferrals by these or other independent Trustees. Although the Retirement Deferral plan is unfunded, amounts deferred under the plan are periodically adjusted for investment experience as if they had been invested in shares of the fund. The DB plan resulted in a pension expense of $2,868 and the Retirement Deferral plan resulted in an expense of $20,464. Both amounts are included in independent Trustees’ compensation for the year ended August 31, 2013. The liability for deferred retirement benefits payable to certain independent Trustees under both plans amounted to $113,159 at August 31, 2013, and is included in “Payable for independent Trustees’ compensation” in the Statement of Assets and Liabilities.
Other – This fund and certain other funds managed by MFS (the funds) have entered into services agreements (the Agreements) which provide for payment of fees by the funds to Tarantino LLC and Griffin Compliance LLC in return for the provision of
43
Notes to Financial Statements – continued
services of an Independent Chief Compliance Officer (ICCO) and Assistant ICCO, respectively, for the funds. The ICCO and Assistant ICCO are officers of the funds and the sole members of Tarantino LLC and Griffin Compliance LLC, respectively. The funds can terminate the Agreements with Tarantino LLC and Griffin Compliance LLC at any time under the terms of the Agreements. For the year ended August 31, 2013, the aggregate fees paid by the fund to Tarantino LLC and Griffin Compliance LLC were $6,654 and are included in “Miscellaneous” expense in the Statement of Operations. MFS has agreed to reimburse the fund for a portion of the payments made by the fund in the amount of $2,696, which is shown as a reduction of total expenses in the Statement of Operations. Additionally, MFS has agreed to bear all expenses associated with office space, other administrative support, and supplies provided to the ICCO and Assistant ICCO.
The fund invests in the MFS Institutional Money Market Portfolio which is managed by MFS and seeks current income consistent with preservation of capital and liquidity. Income earned on this investment is included in “Dividends from underlying affiliated funds” in the Statement of Operations. This money market fund does not pay a management fee to MFS.
On December 31, 2012, MFS purchased 4,757 shares of Class R5 for an aggregate amount of $100,000. At August 31, 2013, MFS held 99.1% of the outstanding shares of Class R5.
(4) Portfolio Securities
Purchases and sales of investments, other than purchased option transactions, short sales, and short-term obligations, aggregated $605,976,261 and $560,700,650, respectively.
(5) Shares of Beneficial Interest
The fund’s Declaration of Trust permits the Trustees to issue an unlimited number of full and fractional shares of beneficial interest. Transactions in fund shares were as follows:
| | | | | | | | | | | | | | | | |
| | | Year ended
8/31/13 (i) | | | Year ended
8/31/12 | |
| | | Shares | | | Amount | | | Shares | | | Amount | |
| Shares sold | | | | | | | | | | | | | | | | |
Class A | | | 7,546,868 | | | | $166,053,426 | | | | 6,098,731 | | | | $112,010,702 | |
Class B | | | 196,291 | | | | 4,012,467 | | | | 365,332 | | | | 6,162,175 | |
Class C | | | 584,686 | | | | 12,153,640 | | | | 273,865 | | | | 4,562,737 | |
Class I | | | 357,017 | | | | 8,396,899 | | | | 219,369 | | | | 4,167,067 | |
Class R1 | | | 37,458 | | | | 768,353 | | | | 44,008 | | | | 723,302 | |
Class R2 | | | 151,192 | | | | 3,277,836 | | | | 271,987 | | | | 4,901,210 | |
Class R3 | | | 358,175 | | | | 7,872,236 | | | | 700,462 | | | | 12,884,565 | |
Class R4 | | | 197,759 | | | | 4,502,021 | | | | 69,234 | | | | 1,292,761 | |
Class R5 | | | 4,800 | | | | 89,803 | | | | — | | | | — | |
| | | 9,434,246 | | | | $207,126,681 | | | | 8,042,988 | | | | $146,704,519 | |
44
Notes to Financial Statements – continued
| | | | | | | | | | | | | | | | |
| | | Year ended
8/31/13 (i) | | | Year ended
8/31/12 | |
| | | Shares | | | Amount | | | Shares | | | Amount | |
| Shares issued to shareholders in reinvestment of distributions | | | | | | | | | | | | | | | | |
Class A | | | 173,769 | | | | $3,492,749 | | | | 191,573 | | | | $3,293,135 | |
Class I | | | 6,426 | | | | 134,304 | | | | 6,214 | | | | 110,986 | |
Class R2 | | | 2,220 | | | | 43,807 | | | | 2,968 | | | | 50,059 | |
Class R3 | | | 13,407 | | | | 268,678 | | | | 12,826 | | | | 219,844 | |
Class R4 | | | 888 | | | | 17,941 | | | | 709 | | | | 12,243 | |
| | | 196,710 | | | | $3,957,479 | | | | 214,290 | | | | $3,686,267 | |
| | | | |
| Shares reacquired | | | | | | | | | | | | | | | | |
Class A | | | (5,962,394 | ) | | | $(129,142,090 | ) | | | (7,005,794 | ) | | | $(129,393,313 | ) |
Class B | | | (737,297 | ) | | | (14,746,274 | ) | | | (1,074,996 | ) | | | (18,090,170 | ) |
Class C | | | (531,761 | ) | | | (10,486,616 | ) | | | (654,543 | ) | | | (11,047,038 | ) |
Class I | | | (159,773 | ) | | | (3,592,449 | ) | | | (191,258 | ) | | | (3,650,463 | ) |
Class R1 | | | (88,685 | ) | | | (1,715,763 | ) | | | (64,177 | ) | | | (1,096,038 | ) |
Class R2 | | | (213,567 | ) | | | (4,451,724 | ) | | | (348,657 | ) | | | (6,285,007 | ) |
Class R3 | | | (300,016 | ) | | | (6,406,822 | ) | | | (207,778 | ) | | | (3,754,987 | ) |
Class R4 | | | (36,085 | ) | | | (791,784 | ) | | | (54,459 | ) | | | (1,049,234 | ) |
| | | (8,029,578 | ) | | | $(171,333,522 | ) | | | (9,601,662 | ) | | | $(174,366,250 | ) |
| | | | |
| Net change | | | | | | | | | | | | | | | | |
Class A | | | 1,758,243 | | | | $40,404,085 | | | | (715,490 | ) | | | $(14,089,476 | ) |
Class B | | | (541,006 | ) | | | (10,733,807 | ) | | | (709,664 | ) | | | (11,927,995 | ) |
Class C | | | 52,925 | | | | 1,667,024 | | | | (380,678 | ) | | | (6,484,301 | ) |
Class I | | | 203,670 | | | | 4,938,754 | | | | 34,325 | | | | 627,590 | |
Class R1 | | | (51,227 | ) | | | (947,410 | ) | | | (20,169 | ) | | | (372,736 | ) |
Class R2 | | | (60,155 | ) | | | (1,130,081 | ) | | | (73,702 | ) | | | (1,333,738 | ) |
Class R3 | | | 71,566 | | | | 1,734,092 | | | | 505,510 | | | | 9,349,422 | |
Class R4 | | | 162,562 | | | | 3,728,178 | | | | 15,484 | | | | 255,770 | |
Class R5 | | | 4,800 | | | | 89,803 | | | | — | | | | — | |
| | | 1,601,378 | | | | $39,750,638 | | | | (1,344,384 | ) | | | $(23,975,464 | ) |
| (i) | For Class R5, the period is from inception, January 2, 2013, through the stated period end. |
(6) Line of Credit
The fund and certain other funds managed by MFS participate in a $1.1 billion unsecured committed line of credit, subject to a $1 billion sublimit, provided by a syndication of banks under a credit agreement. Borrowings may be made for temporary financing needs. Interest is charged to each fund, based on its borrowings, generally at a rate equal to the higher of the Federal Reserve funds rate or one month LIBOR plus an agreed upon spread. A commitment fee, based on the average daily, unused portion of the committed line of credit, is allocated among the participating funds at the end of each calendar quarter. In addition, the fund and other funds managed by MFS have established unsecured uncommitted borrowing arrangements with certain banks for temporary financing needs. Interest is charged to each fund, based on its borrowings, at a rate equal to the Federal Reserve funds rate plus an
45
Notes to Financial Statements – continued
agreed upon spread. For the year ended August 31, 2013, the fund’s commitment fee and interest expense were $5,111 and $0, respectively, and are included in “Miscellaneous” expense in the Statement of Operations.
(7) Transactions in Underlying Affiliated Funds-Affiliated Issuers
An affiliated issuer may be considered one in which the fund owns 5% or more of the outstanding voting securities, or a company which is under common control. For the purposes of this report, the fund assumes the following to be an affiliated issuer:
| | | | | | | | | | | | | | | | |
| Underlying Affiliated Fund | | Beginning
Shares/Par
Amount | | | Acquisitions
Shares/Par
Amount | | | Dispositions
Shares/Par
Amount | | | Ending
Shares/Par
Amount | |
MFS Institutional Money
Market Portfolio | | | 12,697,876 | | | | 138,338,661 | | | | (141,023,175 | ) | | | 10,013,362 | |
| | | | |
| Underlying Affiliated Fund | | Realized
Gain (Loss) | | | Capital Gain
Distributions | | | Dividend
Income | | | Ending
Value | |
MFS Institutional Money
Market Portfolio | | | $— | | | | $— | | | | $14,686 | | | | $10,013,362 | |
46
REPORT OF INDEPENDENT REGISTERED PUBLIC ACCOUNTING FIRM
To the Board of Trustees of MFS Series Trust I and Shareholders of MFS Core Equity Fund:
We have audited the accompanying statement of assets and liabilities of MFS Core Equity Fund (the Fund) (one of the portfolios comprising MFS Series Trust I), including the portfolio of investments, as of August 31, 2013, and the related statement of operations for the year then ended, the statements of changes in net assets for each of the two years in the period then ended, and the financial highlights for each of the periods indicated therein. These financial statements and financial highlights are the responsibility of the Fund’s management. Our responsibility is to express an opinion on these financial statements and financial highlights based on our audits.
We conducted our audits in accordance with the standards of the Public Company Accounting Oversight Board (United States). Those standards require that we plan and perform the audit to obtain reasonable assurance about whether the financial statements and financial highlights are free of material misstatement. We were not engaged to perform an audit of the Fund’s internal control over financial reporting. Our audits included consideration of internal control over financial reporting as a basis for designing audit procedures that are appropriate in the circumstances, but not for the purpose of expressing an opinion on the effectiveness of the Fund’s internal control over financial reporting. Accordingly, we express no such opinion. An audit also includes examining, on a test basis, evidence supporting the amounts and disclosures in the financial statements and financial highlights, assessing the accounting principles used and significant estimates made by management, and evaluating the overall financial statement presentation. Our procedures included confirmation of securities owned as of August 31, 2013, by correspondence with the custodian and others or by other appropriate auditing procedures where replies from others were not received. We believe that our audits provide a reasonable basis for our opinion.
In our opinion, the financial statements and financial highlights referred to above present fairly, in all material respects, the financial position of MFS Core Equity Fund at August 31, 2013, the results of its operations for the year then ended, the changes in its net assets for each of the two years in the period then ended, and its financial highlights for each of the periods indicated therein, in conformity with U.S. generally accepted accounting principles.

Boston, Massachusetts
October 17, 2013
47
TRUSTEES AND OFFICERS — IDENTIFICATION AND BACKGROUND
The Trustees and Officers of the Trust, as of October 1, 2013, are listed below, together with their principal occupations during the past five years. (Their titles may have varied during that period.) The address of each Trustee and officer is 111 Huntington Avenue, Boston, Massachusetts 02199-7618.
| | | | | | | | |
Name, Age | | Position(s) Held with Fund | | Trustee/Officer
Since (h) | | Principal
Occupations During the Past Five Years | | Other Directorships (j) |
| INTERESTED TRUSTEES |
Robert J. Manning (k) (age 49) | | Trustee | | February 2004 | | Massachusetts Financial Services Company, Chairman, Chief Executive Officer and Director; President (until 2009); Chief Investment Officer (until 2010) | | N/A |
| INDEPENDENT TRUSTEES |
David H. Gunning (age 71) | | Trustee and Chair of Trustees | | January 2004 | | Private investor | | Lincoln Electric Holdings, Inc. (welding equipment manufacturer), Director; Development Alternatives, Inc. (consulting), Director/Non-Executive Chairman; Portman Limited (mining), Director (until 2008) |
Robert E. Butler (age 71) | | Trustee | | January 2006 | | Consultant – investment company industry regulatory and compliance matters | | N/A |
Maureen R. Goldfarb (age 58) | | Trustee | | January 2009 | | Private investor | | N/A |
William R. Gutow (age 72) | | Trustee | | December 1993 | | Private investor and real estate consultant; Capitol Entertainment Management Company (video franchise), Vice Chairman | | Texas Donuts (donut franchise), Vice Chairman (until 2010) |
48
Trustees and Officers – continued
| | | | | | | | |
Name, Age | | Position(s) Held with Fund | | Trustee/Officer
Since (h) | | Principal
Occupations During the Past Five Years | | Other Directorships (j) |
Michael Hegarty (age 68) | | Trustee | | December 2004 | | Private investor | | Brookfield Office Properties, Inc. (real estate), Director; Rouse Properties Inc. (real estate), Director; Capmark Financial Group Inc. (real estate), Director |
John P. Kavanaugh (age 58) | | Trustee | | January 2009 | | Private investor | | N/A |
J. Dale Sherratt (age 75) | | Trustee | | June 1989 | | Insight Resources, Inc. (acquisition planning specialists), President; Wellfleet Investments (investor in health care companies), Managing General Partner | | N/A |
Laurie J. Thomsen (age 56) | | Trustee | | March 2005 | | Private investor; New Profit, Inc. (venture philanthropy), Executive Partner (until 2010) | | The Travelers Companies (insurance), Director |
Robert W. Uek (age 72) | | Trustee | | January 2006 | | Consultant to investment company industry | | N/A |
| OFFICERS |
John M. Corcoran (k) (age 48) | | President | | October 2008 | | Massachusetts Financial Services Company, Senior Vice President (since October 2008); State Street Bank and Trust (financial services provider), Senior Vice President, (until 2008) | | N/A |
Christopher R. Bohane (k) (age 39) | | Assistant Secretary and Assistant Clerk | | July 2005 | | Massachusetts Financial Services Company, Vice President and Assistant General Counsel | | N/A |
Kino Clark (k) (age 45) | | Assistant Treasurer | | January 2012 | | Massachusetts Financial Services Company, Vice President | | N/A |
49
Trustees and Officers – continued
| | | | | | | | |
Name, Age | | Position(s) Held with Fund | | Trustee/Officer
Since (h) | | Principal
Occupations During the Past Five Years | | Other Directorships (j) |
Thomas H. Connors (k) (age 54) | | Assistant Secretary and Assistant Clerk | | September 2012 | | Massachusetts Financial Services Company, Vice President and Senior Counsel; Deutsche Investment Management Americas Inc. (financial service provider), Director and Senior Counsel (until 2012) | | N/A |
Ethan D. Corey (k) (age 49) | | Assistant Secretary and Assistant Clerk | | July 2005 | | Massachusetts Financial Services Company, Senior Vice President and Associate General Counsel | | N/A |
David L. DiLorenzo (k)
(age 45) | | Treasurer | | July 2005 | | Massachusetts Financial Services Company, Senior Vice President | | N/A |
Robyn L. Griffin (age 38) | | Assistant Independent Chief Compliance Officer | | August 2008 | | Griffin Compliance LLC (provider of compliance services), Principal (since August 2008); State Street Corporation (financial services provider), Mutual Fund Administration Assistant Vice President (until 2008) | | N/A |
Brian E. Langenfeld (k) (age 40) | | Assistant Secretary and Assistant Clerk | | June 2006 | | Massachusetts Financial Services Company, Vice President and Senior Counsel | | N/A |
Susan S. Newton (k) (age 63) | | Assistant Secretary and Assistant Clerk | | May 2005 | | Massachusetts Financial Services Company, Senior Vice President and Associate General Counsel | | N/A |
Susan A. Pereira (k) (age 42) | | Assistant Secretary and Assistant Clerk | | July 2005 | | Massachusetts Financial Services Company, Vice President and Senior Counsel | | N/A |
50
Trustees and Officers – continued
| | | | | | | | |
Name, Age | | Position(s) Held with Fund | | Trustee/Officer
Since (h) | | Principal
Occupations During the Past Five Years | | Other Directorships (j) |
Kasey L. Phillips (k) (age 42) | | Assistant Treasurer | | September 2012 | | Massachusetts Financial Services Company, Vice President; Wells Fargo Funds Management, LLC, Senior Vice President, Fund Treasurer (until 2012) | | N/A |
Mark N. Polebaum (k) (age 61) | | Secretary and Clerk | | January 2006 | | Massachusetts Financial Services Company, Executive Vice President, General Counsel and Secretary | | N/A |
Frank L. Tarantino (age 69) | | Independent Chief Compliance Officer | | June 2004 | | Tarantino LLC (provider of compliance services), Principal | | N/A |
Richard S. Weitzel (k) (age 43) | | Assistant Secretary and Assistant Clerk | | October 2007 | | Massachusetts Financial Services Company, Senior Vice President and Associate General Counsel | | N/A |
James O. Yost (k) (age 53) | | Deputy Treasurer | | September 1990 | | Massachusetts Financial Services Company, Senior Vice President | | N/A |
| (h) | Date first appointed to serve as Trustee/officer of an MFS Fund. Each Trustee has served continuously since appointment unless indicated otherwise. For the period from December 15, 2004 until February 22, 2005, Mr. Manning served as Advisory Trustee. For the period October 2008, until January 2012, Mr. Corcoran served as Treasurer of the Funds. Prior to January 2012, Messrs. DiLorenzo and Yost served as Assistant Treasurers of the Funds. |
| (j) | Directorships or trusteeships of companies required to report to the Securities and Exchange Commission (i.e., “public companies”). |
| (k) | “Interested person” of the Trust within the meaning of the Investment Company Act of 1940 (referred to as the 1940 Act), which is the principal federal law governing investment companies like the fund, as a result of position with MFS. The address of MFS is 111 Huntington Avenue, Boston, Massachusetts 02199-7618. |
Each Trustee has been elected by shareholders and each Trustee and officer holds office until his or her successor is chosen and qualified or until his or her earlier death, resignation, retirement or removal. The Trust does not hold annual meetings for the purpose of electing Trustees, and Trustees are not elected for fixed terms. Messrs. Butler, Kavanaugh, Uek and Ms. Thomsen are members of the Trust’s Audit Committee.
Each of the Fund’s Trustees and officers holds comparable positions with certain other funds of which MFS or a subsidiary is the investment adviser or distributor, and, in the case of the officers, with certain affiliates of MFS. As of January 1, 2013, the Trustees served as board members of 143 funds within the MFS Family of Funds.
51
Trustees and Officers – continued
The Statement of Additional Information for the Fund includes further information about the Trustees and is available without charge upon request by calling 1-800-225-2606.
| | |
| Investment Adviser | | Custodian |
Massachusetts Financial Services Company
111 Huntington Avenue
Boston, MA 02199-7618 | | State Street Bank and Trust Company 1 Lincoln Street Boston, MA 02111-2900 |
| Distributor | | Independent Registered Public Accounting Firm |
MFS Fund Distributors, Inc.
111 Huntington Avenue
Boston, MA 02199-7618 | | Ernst & Young LLP 200 Clarendon Street
Boston, MA 02116 |
| Portfolio Manager | | |
Joseph MacDougall | | |
52
BOARD REVIEW OF INVESTMENT ADVISORY AGREEMENT
The Investment Company Act of 1940 requires that both the full Board of Trustees and a majority of the non-interested (“independent”) Trustees, voting separately, annually approve the continuation of the Fund’s investment advisory agreement with MFS. The Trustees consider matters bearing on the Fund and its advisory arrangements at their meetings throughout the year, including a review of performance data at each regular meeting. In addition, the independent Trustees met several times over the course of three months beginning in May and ending in July, 2013 (“contract review meetings”) for the specific purpose of considering whether to approve the continuation of the investment advisory agreement for the Fund and the other investment companies that the Board oversees (the “MFS Funds”). The independent Trustees were assisted in their evaluation of the Fund’s investment advisory agreement by independent legal counsel, from whom they received separate legal advice and with whom they met separately from MFS during various contract review meetings. The independent Trustees were also assisted in this process by the MFS Funds’ Independent Chief Compliance Officer, a full-time senior officer appointed by and reporting to the independent Trustees.
In connection with their deliberations regarding the continuation of the investment advisory agreement, the Trustees, including the independent Trustees, considered such information and factors as they believed, in light of the legal advice furnished to them and their own business judgment, to be relevant. The investment advisory agreement for the Fund was considered separately, although the Trustees also took into account the common interests of all MFS Funds in their review. As described below, the Trustees considered the nature, quality, and extent of the various investment advisory, administrative, and shareholder services performed by MFS under the existing investment advisory agreement and other arrangements with the Fund.
In connection with their contract review meetings, the Trustees received and relied upon materials that included, among other items: (i) information provided by Lipper Inc., an independent third party, on the investment performance of the Fund for various time periods ended December 31, 2012 and the investment performance of a group of funds with substantially similar investment classifications/objectives (the “Lipper performance universe”), (ii) information provided by Lipper Inc. on the Fund’s advisory fees and other expenses and the advisory fees and other expenses of comparable funds identified by Lipper Inc. (the “Lipper expense group”), (iii) information provided by MFS on the advisory fees of comparable portfolios of other clients of MFS, including institutional separate accounts and other clients, (iv) information as to whether and to what extent applicable expense waivers, reimbursements or fee “breakpoints” are observed for the Fund, (v) information regarding MFS’ financial results and financial condition, including MFS’ and certain of its affiliates’ estimated profitability from services performed for the Fund and the MFS Funds as a whole, and compared to MFS’ institutional business, (vi) MFS’ views regarding the outlook for the mutual fund industry and the strategic business plans of MFS, (vii) descriptions of various functions performed by MFS for the Funds, such as compliance monitoring and portfolio trading practices, and (viii) information regarding the overall organization of MFS, including information about MFS’ senior management and other personnel providing investment advisory, administrative and other services to the Fund and the other MFS Funds. The comparative performance, fee and expense
53
Board Review of Investment Advisory Agreement – continued
information prepared and provided by Lipper Inc. was not independently verified and the independent Trustees did not independently verify any information provided to them by MFS.
The Trustees’ conclusion as to the continuation of the investment advisory agreement was based on a comprehensive consideration of all information provided to the Trustees and not the result of any single factor. Some of the factors that figured particularly in the Trustees’ deliberations are described below, although individual Trustees may have evaluated the information presented differently from one another, giving different weights to various factors. It is also important to recognize that the fee arrangements for the Fund and other MFS Funds are the result of years of review and discussion between the independent Trustees and MFS, that certain aspects of such arrangements may receive greater scrutiny in some years than in others, and that the Trustees’ conclusions may be based, in part, on their consideration of these same arrangements during the course of the year and in prior years.
Based on information provided by Lipper Inc. and MFS, the Trustees reviewed the Fund’s total return investment performance as well as the performance of peer groups of funds over various time periods. The Trustees placed particular emphasis on the total return performance of the Fund’s Class A shares in comparison to the performance of funds in its Lipper performance universe over the three-year period ended December 31, 2012, which the Trustees believed was a long enough period to reflect differing market conditions. The total return performance of the Fund’s Class A shares was in the 2nd quintile relative to the other funds in the universe for this three-year period (the 1st quintile being the best performers and the 5th quintile being the worst performers). The total return performance of the Fund’s Class A shares was in the 2nd quintile for each of the one- and five-year periods ended December 31, 2012 relative to the Lipper performance universe. Because of the passage of time, these performance results may differ from the performance results for more recent periods, including those shown elsewhere in this report.
In the course of their deliberations, the Trustees took into account information provided by MFS in connection with the contract review meetings, as well as during investment review meetings conducted with portfolio management personnel during the course of the year regarding the Fund’s performance. After reviewing these and related factors, the Trustees concluded, within the context of their overall conclusions regarding the investment advisory agreement, that they were satisfied with MFS’ responses and efforts relating to investment performance.
In assessing the reasonableness of the Fund’s advisory fee, the Trustees considered, among other information, the Fund’s advisory fee and the total expense ratio of the Fund’s Class A shares as a percentage of average daily net assets and the advisory fee and total expense ratios of peer groups of funds based on information provided by Lipper Inc. The Trustees considered that, according to the Lipper data (which takes into account any fee reductions or expense limitations that were in effect during the Fund’s last fiscal year), the Fund’s effective advisory fee rate was lower than the Lipper expense group median, and the Fund’s total expense ratio was approximately at the Lipper expense group median.
54
Board Review of Investment Advisory Agreement – continued
The Trustees also considered the advisory fees charged by MFS to any comparable institutional accounts. In comparing these fees, the Trustees considered information provided by MFS as to the generally broader scope of services provided by MFS to the Fund in comparison to institutional accounts, the higher demands placed on MFS’ investment personnel and trading infrastructure as a result of the daily cash in-flows and out-flows of the Fund, and the impact on MFS and expenses associated with the more extensive regulatory regime to which the Fund is subject in comparison to institutional accounts.
The Trustees also considered whether the Fund may benefit from any economies of scale in the management of the Fund in the event of growth in assets of the Fund and/or growth in assets of the MFS Funds as a whole. They noted that the Fund’s advisory fee rate schedule is subject to a contractual breakpoint that reduces the Fund’s advisory fee rate on average daily net assets over $500 million, and that MFS has agreed in writing to implement an additional breakpoint that reduces the Fund’s advisory fee rate on average daily net assets over $2.5 billion, which may not be changed without the Trustees’ approval. The Trustees also noted that MFS has agreed in writing to waive a portion of the management fees of certain MFS Funds, including the Fund, if the total combined assets of certain funds within the MFS Funds’ complex increase above agreed upon thresholds (the “group fee waiver”), enabling the Fund’s shareholders to share in the benefits from any economies of scale at the complex level. The group fee waiver is reviewed and renewed annually between the Board and MFS. The Trustees concluded that the existing breakpoints and the group fee waiver were sufficient to allow the Fund to benefit from economies of scale as its assets and overall complex assets grow.
The Trustees also considered information prepared by MFS relating to MFS’ costs and profits with respect to the Fund, the MFS Funds considered as a group, and other investment companies and accounts advised by MFS, as well as MFS’ methodologies used to determine and allocate its costs to the MFS Funds, the Fund and other accounts and products for purposes of estimating profitability.
After reviewing these and other factors described herein, the Trustees concluded, within the context of their overall conclusions regarding the investment advisory agreement, that the advisory fees charged to the Fund represent reasonable compensation in light of the services being provided by MFS to the Fund.
In addition, the Trustees considered MFS’ resources and related efforts to continue to retain, attract and motivate capable personnel to serve the Fund. The Trustees also considered current and developing conditions in the financial services industry, including the presence of large and well-capitalized companies which are spending, and appear to be prepared to continue to spend, substantial sums to engage personnel and to provide services to competing investment companies. In this regard, the Trustees also considered the financial resources of MFS and its ultimate parent, Sun Life Financial Inc. The Trustees also considered the advantages and possible disadvantages to the Fund of having an adviser that also serves other investment companies as well as other accounts.
The Trustees also considered the nature, quality, cost, and extent of administrative, transfer agency, and distribution services provided to the Fund by MFS and its affiliates
55
Board Review of Investment Advisory Agreement – continued
under agreements and plans other than the investment advisory agreement, including any 12b-1 fees the Fund pays to MFS Fund Distributors, Inc., an affiliate of MFS. The Trustees also considered the nature, extent and quality of certain other services MFS performs or arranges for on the Fund’s behalf, which may include securities lending programs, directed expense payment programs, class action recovery programs, and MFS’ interaction with third-party service providers, principally custodians and sub-custodians. The Trustees concluded that the various non-advisory services provided by MFS and its affiliates on behalf of the Fund were satisfactory.
The Trustees also considered benefits to MFS from the use of the Fund’s portfolio brokerage commissions, if applicable, to pay for investment research and various other factors. Additionally, the Trustees considered so-called “fall-out benefits” to MFS such as reputational value derived from serving as investment manager to the Fund.
Based on their evaluation of factors that they deemed to be material, including those factors described above, the Board of Trustees, including the independent Trustees, concluded that the Fund’s investment advisory agreement with MFS should be continued for an additional one-year period, commencing August 1, 2013.
A discussion regarding the Board’s most recent review and renewal of the fund’s Investment Advisory Agreement with MFS is available by clicking on the fund’s name under “Mutual Funds” in the “Products” section of the MFS Web site (mfs.com).
56
PROXY VOTING POLICIES AND INFORMATION
A general description of the MFS funds’ proxy voting policies and procedures is available without charge, upon request, by calling 1-800-225-2606, by visiting the Proxy Voting section of mfs.com or by visiting the SEC’s Web site at http://www.sec.gov.
Information regarding how the fund voted proxies relating to portfolio securities during the most recent twelve-month period ended June 30 is available without charge by visiting the Proxy Voting section of mfs.com or by visiting the SEC’s Web site at http://www.sec.gov.
QUARTERLY PORTFOLIO DISCLOSURE
The fund will file a complete schedule of portfolio holdings with the Securities and Exchange Commission (the Commission) for the first and third quarters of each fiscal year on Form N-Q. A shareholder can obtain the quarterly portfolio holdings report at mfs.com. The fund’s Form N-Q is also available on the EDGAR database on the Commission’s Internet Web site at http://www.sec.gov, and may be reviewed and copied at the:
Public Reference Room
Securities and Exchange Commission
100 F Street, NE, Room 1580
Washington, D.C. 20549
Information on the operation of the Public Reference Room may be obtained by calling the Commission at 1-800-SEC-0330. Copies of the fund’s Form N-Q also may be obtained, upon payment of a duplicating fee, by electronic request at the following e-mail address: publicinfo@sec.gov or by writing the Public Reference Section at the above address.
FURTHER INFORMATION
From time to time, MFS may post important information about the fund or the MFS funds on the MFS web site (mfs.com). This information is available by visiting the “News & Commentary” section of mfs.com or by clicking on the fund’s name under “Mutual Funds” in the “Products” section of mfs.com.
FEDERAL TAX INFORMATION (unaudited)
The fund will notify shareholders of amounts for use in preparing 2013 income tax forms in January 2014. The following information is provided pursuant to provisions of the Internal Revenue Code.
The fund designates the maximum amount allowable as qualified dividend income eligible for the 15% tax rate.
For corporate shareholders, 100% of the ordinary income dividends paid during the fiscal year qualify for the corporate dividends received deduction.
57
rev. 3/11
| | | | |
| | | |
FACTS | | WHAT DOES MFS DO WITH YOUR PERSONAL INFORMATION? | |  |
| | |
| Why? | | Financial companies choose how they share your personal information. Federal law gives consumers the right to limit some but not all sharing. Federal law also requires us to tell you how we collect, share, and protect your personal information. Please read this notice carefully to understand what we do. |
| | |
| What? | | The types of personal information we collect and share depend on the product or service you have with us. This information can include: • Social Security number and account balances • Account transactions and transaction history • Checking account information and wire transfer instructions When you are no longer our customer, we continue to share your information as described in this notice. |
| | |
| How? | | All financial companies need to share customers’ personal information to run their everyday business. In the section below, we list the reasons financial companies can share their customers’ personal information; the reasons MFS chooses to share; and whether you can limit this sharing. |
| | | | |
Reasons we can share your
personal information | | Does MFS
share? | | Can you limit
this sharing? |
For our everyday business purposes – such as to process your transactions, maintain your account(s), respond to court orders and legal investigations, or report to credit bureaus | | Yes | | No |
For our marketing purposes – to offer our products and services to you | | No | | We don’t share |
| For joint marketing with other financial companies | | No | | We don’t share |
For our affiliates’ everyday business purposes – information about your transactions and experiences | | No | | We don’t share |
For our affiliates’ everyday business purposes – information about your creditworthiness | | No | | We don’t share |
| For nonaffiliates to market to you | | No | | We don’t share |
| | |
| Questions? | | Call 800-225-2606 or go to mfs.com. |
58
| | |
| Who we are |
| Who is providing this notice? | | MFS Funds, MFS Investment Management, MFS Institutional Advisors, Inc., MFS Fund Distributors, Inc., MFS Heritage Trust Company, and MFS Service Center, Inc. |
| | |
| What we do |
| How does MFS protect my personal information? | | To protect your personal information from unauthorized access and use, we use security measures that comply with federal law. These measures include procedural, electronic, and physical safeguards for the protection of the personal information we collect about you. |
| How does MFS collect my personal information? | | We collect your personal information, for example, when you • open an account or provide account information • direct us to buy securities or direct us to sell your securities • make a wire transfer We also collect your personal information from others, such as credit bureaus, affiliates and other companies. |
| Why can’t I limit all sharing? | | Federal law gives you the right to limit only • sharing for affiliates’ everyday business purposes – information about your creditworthiness • affiliates from using your information to market to you • sharing for nonaffiliates to market to you State laws and individual companies may give you additional rights to limit sharing. |
| | |
| Definitions |
| Affiliates | | Companies related by common ownership or control. They can be financial and nonfinancial companies. • MFS does not share personal information with affiliates, except for everyday business purposes as described on page one of this notice. |
| Nonaffiliates | | Companies not related by common ownership or control. They can be financial and nonfinancial companies. • MFS does not share with nonaffiliates so they can market to you. |
| Joint Marketing | | A formal agreement between nonaffiliated financial companies that together market financial products or services to you. • MFS doesn’t jointly market. |
| | |
| Other important information |
| If you own an MFS product or receive an MFS service in the name of a third party such as a bank or broker-dealer, their privacy policy may apply to you instead of ours. |
59
Save paper with eDelivery.

| MFS® will send you prospectuses, |
reports, and proxies directly via e-mail so you will get information faster with less mailbox clutter.
To sign up:
1. Go to mfs.com.
2. Log in via MFS® Access.
3. Select eDelivery.
If you own your MFS fund shares through a financial institution or a retirement plan, MFS® TALK, MFS® Access, or eDelivery may not be available to you.
CONTACT
WEB SITE
mfs.com
MFS TALK
1-800-637-8255
24 hours a day
ACCOUNT SERVICE AND LITERATURE
Shareholders
1-800-225-2606
Financial advisors
1-800-343-2829
Retirement plan services
1-800-637-1255
MAILING ADDRESS
MFS Service Center, Inc.
P.O. Box 55824
Boston, MA 02205-5824
OVERNIGHT MAIL
MFS Service Center, Inc.
c/o Boston Financial Data Services
30 Dan Road
Canton, MA 02021-2809
ANNUAL REPORT
August 31, 2013

MFS® NEW DISCOVERY FUND

NDF-ANN
MFS® NEW DISCOVERY FUND
CONTENTS
The report is prepared for the general information of shareholders.
It is authorized for distribution to prospective investors only when preceded or accompanied by a current prospectus.
NOT FDIC INSURED Ÿ MAY LOSE VALUE Ÿ NO BANK GUARANTEE

LETTER FROM THE CHAIRMAN AND CEO
Dear Shareholders:
Global economic trends appear to favor growth again despite risks created by the U.S. government’s gridlock. The U.S. economy’s slow but steady expansion is no longer the
exception. The eurozone has emerged from its 18-month-long recession, with Germany leading the way. China’s monthly gauges of economic activity once again point toward expansion. And Japan is picking up momentum in response to its government’s and central bank’s aggressive program of monetary easing.
However, geopolitical risks have risen, with violence erupting in Egypt and Syria and the possibility of further unrest in the Middle East. The U.S. Federal Reserve’s expected tapering of its bond-buying stimulus program has weighed on global markets
since May. Emerging markets, including Brazil and India, have borne much of the brunt, as their currency values have dropped and nervous investors have fled to safety elsewhere. In Europe, unemployment persists at historically high levels. The trend towards a pickup in global growth, while encouraging, appears tenuous, particularly with the risk of a U.S. debt default.
As always, managing risk in the face of uncertainty remains a top priority for investors. At MFS®, our uniquely collaborative investment process employs integrated, global research and active risk management. Our global team of investment professionals shares ideas and evaluates opportunities across continents, investment disciplines and asset classes — all with a goal of building better insights, and ultimately better results, for our clients.
We are mindful of the many economic challenges investors face, and believe it is more important than ever to maintain a long-term view and employ time-tested principles, such as asset allocation and diversification. We remain confident that our unique approach can serve investors well as they work with their financial advisors to identify and pursue the most suitable opportunities.
Respectfully,

Robert J. Manning
Chairman and Chief Executive Officer
MFS Investment Management®
October 17, 2013
The opinions expressed in this letter are subject to change, may not be relied upon for investment advice, and no forecasts can be guaranteed.
1
PORTFOLIO COMPOSITION
Portfolio structure

| | | | |
| Top ten holdings | | | | |
| Polypore International, Inc. | | | 2.2% | |
| Tronox Ltd., “A” | | | 2.2% | |
| Cabot Oil & Gas Corp. | | | 2.2% | |
| CONSOL Energy, Inc. | | | 2.1% | |
| Constant Contact, Inc. | | | 2.0% | |
| Atwood Oceanics, Inc. | | | 1.9% | |
| Diana Shipping, Inc. | | | 1.9% | |
| Swift Transportation Co. | | | 1.9% | |
| Endologix, Inc. | | | 1.7% | |
| Silicon Laboratories, Inc. | | | 1.7% | |
| | | | |
| Equity sectors | | | | |
| Technology | | | 24.3% | |
| Industrial Goods & Services | | | 14.2% | |
| Energy | | | 12.8% | |
| Health Care | | | 11.6% | |
| Special Products & Services | | | 10.4% | |
| Basic Materials | | | 9.9% | |
| Transportation | | | 6.2% | |
| Retailing | | | 3.8% | |
| Leisure | | | 2.3% | |
| Financial Services | | | 2.2% | |
| Autos & Housing | | | 1.0% | |
| Consumer Staples | | | 0.8% | |
Percentages are based on net assets as of 8/31/13.
The portfolio is actively managed and current holdings may be different.
2
MANAGEMENT REVIEW
Summary of Results
For the twelve months ended August 31, 2013, Class A shares of the MFS New Discovery Fund (the “fund”) provided a total return of 28.21%, at net asset value. This compares with a return of 28.14% for the fund’s benchmark, the Russell 2000 Growth Index.
Market Environment
At the beginning of the period, markets were suffering a bout of risk aversion due to broadly weaker global macroeconomic indicators, as well as renewed concerns over the eurozone’s capacity and determination to address its ongoing crisis. However, a few months into the period, this renewed weakness in the fundamentals precipitated yet a further round of monetary easing by both the US Federal Reserve (through a third round of quantitative easing) and the European Central Bank (ECB) (through a new bond purchase facility), which soon instilled additional confidence in risk markets.
Nonetheless, towards the end of the calendar year, weaker equity earnings reports and declining forward guidance caused market sentiment to soften again. In addition, year-end fiscal cliff negotiations between the Republicans in the US Congress and President Obama were a particular source of market attention, where uncertainty surrounding the fiscal negotiations continued right up to the end-of-year deadline. A last minute political agreement averted the worst-case scenario and markets gravitated towards risk assets again, though the implementation of the US budget sequester, combined with the uncertainty surrounding the Italian election results, inserted a continued degree of caution as we entered the second half of the period.
During the first few months of 2013, market sentiment improved markedly, as global macroeconomic indicators improved and fears of fiscal austerity in the US waned. Later in the period, however, global growth dynamics looked to be weakening again, though markets were generally unfazed, continuing their risk-on path, especially in light of continued easing by global central banks and the Bank of Japan in particular. At the end of the period, the growing risk that the Fed would begin tapering its quantitative easing program caused sovereign bond yields to spike, credit spreads to widen and equity valuation to fall.
Contributors to Performance
Stock selection in the consumer staples sector contributed to performance relative to the Russell 2000 Growth Index. The fund’s holding of specialty coffee producer Green Mountain Coffee Roasters (b) boosted relative returns. The company continued to enjoy the benefits of strong customer demand for its K-cups products and the renewal of its distribution contract with Starbucks for five more years which helped the stock appreciate during the period.
Stock selection in the transportation sector was another positive factor for relative results. The fund’s overweight position in shares of transportation services company Swift Transportation bolstered relative returns as the stock delivered strong performance. Shares of Swift Transportation increased after the company announced better-than-expected financial results based on successful fleet rationalization and rising consumer confidence. Holding shares of Greek shipping company Diana Shipping (b) also bolstered relative returns.
3
Management Review – continued
Stock selection in the retailing sector supported relative results. However, there were no individual stocks within this sector that were among the fund’s top relative contributors during the reporting period.
Elsewhere, the fund’s overweight positions in shares of fleet management solutions provider FleetMatics Group, medical device maker Conceptus (h), custom parts manufacturer Proto Labs, interactive marketing software company ExactTarget (h), and digital personal photography company Shutterfly boosted relative performance as all five stocks delivered strong returns. Holdings of oil and gas exploration company Cabot Oil & Gas (b) and payment solutions provider FleetCor Technologies (b) also contributed to relative returns. Shares of Cabot Oil & Gas rose as the company reported higher earnings from better-than-expected production in its Marcellus wells.
Detractors from Performance
The combination of the fund’s stock selection and an overweight position in the basic materials sector detracted from relative performance. The fund’s holdings of potassium-related products producer Intrepid Potash (b) and rare earth materials producer Molycorp (b) hindered relative returns as both stocks posted poor performance. Shares of Intrepid Potash declined late in the period after Russia’s Uralkali Group, the world’s largest fertilizer producer, pulled out of one of the consortiums and vowed to ramp up production, a move that threatens to drive potash prices down significantly. Additionally, the fund’s overweight position in shares of silicon-based metals and alloys producer Globe Specialty Metals weighed on relative performance as the stock declined during the period.
Stock selection in the technology sector was another factor that negatively impacted relative results. Timing in the ownership of the fund’s overweight position in enterprise data storage provider Fusion-io (h) hurt relative returns as the stock underperformed the broad market during the period. Shares of the company declined throughout the period despite having reported positive earnings growth as management’s outlook remained uncertain because of the challenging macroeconomic environment, which management cited as becoming a factor on visibility, and increased competition within the industry. The fund’s holdings of fabless semiconductor company Mellanox Technologies (b), voice and language solutions provider Nuance Communications (b)(h), and network security solutions provider Fortinet (b) also hampered relative performance as all three stocks declined. Additionally, the fund’s overweight position in revenue management systems developer Model N detracted from relative results as the stock underperformed the benchmark.
The combination of weak stock selection and an underweight position in the leisure sector hindered relative performance. The fund’s holdings of South American McDonald’s franchise operator Arcos Dorados Holdings (b) (Argentina) detracted from relative results as the stock posted negative performance.
Additionally, the fund’s holdings of global aircraft and aviation solutions provider Atlas Air Worldwide Holdings (b) dampened relative returns as the stock declined during the period.
During the reporting period, the fund’s relative currency exposure, resulting primarily from differences between the portfolio’s and the benchmark’s exposures to holdings of securities denominated in foreign currencies, was another detractor from relative
4
Management Review – continued
performance. All of MFS’ investment decisions are driven by the fundamentals of each individual opportunity and as such, it is common for our portfolios to have different currency exposure than the benchmark.
Respectfully,
Thomas Wetherald
Portfolio Manager
| (b) | Security is not a benchmark constituent. |
| (h) | Security was not held in the portfolio at period end. |
The views expressed in this report are those of the portfolio manager only through the end of the period of the report as stated on the cover and do not necessarily reflect the views of MFS or any other person in the MFS organization. These views are subject to change at any time based on market or other conditions, and MFS disclaims any responsibility to update such views. These views may not be relied upon as investment advice or an indication of trading intent on behalf of any MFS portfolio. References to specific securities are not recommendations of such securities, and may not be representative of any MFS portfolio’s current or future investments.
5
PERFORMANCE SUMMARY THROUGH 8/31/13
The following chart illustrates a representative class of the fund’s historical performance in comparison to its benchmark(s). Performance results include the deduction of the maximum applicable sales charge and reflect the percentage change in net asset value, including reinvestment of dividends and capital gains distributions. The performance of other share classes will be greater than or less than that of the class depicted below. Benchmarks are unmanaged and may not be invested in directly. Benchmark returns do not reflect sales charges, commissions or expenses. (See Notes to Performance Summary.)
Performance data shown represents past performance and is no guarantee of future results. Investment return and principal value fluctuate so your shares, when sold, may be worth more or less than the original cost; current performance may be lower or higher than quoted. The performance shown does not reflect the deduction of taxes, if any, that a shareholder would pay on fund distributions or the redemption of fund shares.
Growth of a Hypothetical $10,000 Investment
6
Performance Summary – continued
Total Returns through 8/31/13
Average annual without sales charge
| | | | | | | | | | | | | | |
| | | Share class | | Class inception date | | 1-yr | | 5-yr | | 10-yr | | Life (t) | | |
| | | A | | 1/02/97 | | 28.21% | | 13.49% | | 9.15% | | N/A | | |
| | | B | | 11/03/97 | | 27.26% | | 12.66% | | 8.40% | | N/A | | |
| | | C | | 11/03/97 | | 27.28% | | 12.64% | | 8.39% | | N/A | | |
| | | I | | 1/02/97 | | 28.54% | | 13.78% | | 9.49% | | N/A | | |
| | | R1 | | 4/01/05 | | 27.30% | | 12.65% | | N/A | | 9.72% | | |
| | | R2 | | 10/31/03 | | 27.92% | | 13.21% | | N/A | | 8.43% | | |
| | | R3 | | 4/01/05 | | 28.24% | | 13.50% | | N/A | | 10.53% | | |
| | | R4 | | 4/01/05 | | 28.54% | | 13.77% | | N/A | | 10.83% | | |
| | | R5 | | 6/01/12 | | 28.68% | | N/A | | N/A | | 30.90% | | |
| | | 529A | | 7/31/02 | | 28.17% | | 13.40% | | 8.98% | | N/A | | |
| | | 529B | | 7/31/02 | | 27.18% | | 12.57% | | 8.23% | | N/A | | |
| | | 529C | | 7/31/02 | | 27.17% | | 12.56% | | 8.22% | | N/A | | |
| Comparative Benchmark | | | | | | | | | | |
| | | Russell 2000 Growth Index (f) | | 28.14% | | 9.01% | | 8.84% | | N/A | | |
| Average annual with sales charge | | | | | | | | | | |
| | | A
With Initial Sales Charge (5.75%) | | 20.84% | | 12.15% | | 8.51% | | N/A | | |
| | | B
With CDSC (Declining over six years
from 4% to 0%) (x) | | 23.26% | | 12.41% | | 8.40% | | N/A | | |
| | | C
With CDSC (1% for 12 months) (x) | | 26.28% | | 12.64% | | 8.39% | | N/A | | |
| | | 529A
With Initial Sales Charge (5.75%) | | 20.80% | | 12.07% | | 8.34% | | N/A | | |
| | | 529B
With CDSC (Declining over six years
from 4% to 0%) (x) | | 23.18% | | 12.32% | | 8.23% | | N/A | | |
| | | 529C
With CDSC (1% for 12 months) (x) | | 26.17% | | 12.56% | | 8.22% | | N/A | | |
Class I, R1, R2, R3, R4, and R5 shares do not have a sales charge.
CDSC – Contingent Deferred Sales Charge.
| (f) | Source: FactSet Research Systems Inc. |
| (t) | For the period from the class inception date through the stated period end (for those share classes with less than 10 years of performance history). No comparative benchmark performance information is provided for “life” periods. (See Notes to Performance Summary.) |
| (x) | Assuming redemption at the end of the applicable period. |
7
Performance Summary – continued
Benchmark Definition
Russell 2000 Growth Index – constructed to provide a comprehensive barometer for growth securities in the small-cap segment of the U.S. equity universe. Companies in this index generally have higher price-to-book ratios and higher forecasted growth values.
It is not possible to invest directly in an index.
Notes to Performance Summary
Average annual total return represents the average annual change in value for each share class for the periods presented. Life returns are presented where the share class has less than 10 years of performance history and represent the average annual total return from the class inception date to the stated period end date. As the fund’s share classes may have different inception dates, the life returns may represent different time periods and may not be comparable. As a result, no comparative benchmark performance information is provided for life periods.
Performance results reflect any applicable expense subsidies and waivers in effect during the periods shown. Without such subsidies and waivers the fund’s performance results would be less favorable. Please see the prospectus and financial statements for complete details.
Performance results do not include adjustments made for financial reporting purposes in accordance with U.S. generally accepted accounting principles and may differ from amounts reported in the financial highlights.
From time to time the fund may receive proceeds from litigation settlements, without which performance would be lower.
8
EXPENSE TABLE
Fund expenses borne by the shareholders during the period,
March 1, 2013 through August 31, 2013
As a shareholder of the fund, you incur two types of costs: (1) transaction costs, including sales charges (loads) on certain purchase or redemption payments, and (2) ongoing costs, including management fees; distribution and service (12b-1) fees; and other fund expenses. This example is intended to help you understand your ongoing costs (in dollars) of investing in the fund and to compare these costs with the ongoing costs of investing in other mutual funds.
The example is based on an investment of $1,000 invested at the beginning of the period and held for the entire period March 1, 2013 through August 31, 2013.
Actual Expenses
The first line for each share class in the following table provides information about actual account values and actual expenses. You may use the information in this line, together with the amount you invested, to estimate the expenses that you paid over the period. Simply divide your account value by $1,000 (for example, an $8,600 account value divided by $1,000 = 8.6), then multiply the result by the number in the first line under the heading entitled “Expenses Paid During Period” to estimate the expenses you paid on your account during this period.
Hypothetical Example for Comparison Purposes
The second line for each share class in the following table provides information about hypothetical account values and hypothetical expenses based on the fund’s actual expense ratio and an assumed rate of return of 5% per year before expenses, which is not the fund’s actual return. The hypothetical account values and expenses may not be used to estimate the actual ending account balance or expenses you paid for the period. You may use this information to compare the ongoing costs of investing in the fund and other funds. To do so, compare this 5% hypothetical example with the 5% hypothetical examples that appear in the shareholder reports of the other funds.
Please note that the expenses shown in the table are meant to highlight your ongoing costs only and do not reflect any transactional costs, such as sales charges (loads). Therefore, the second line for each share class in the table is useful in comparing ongoing costs only, and will not help you determine the relative total costs of owning different funds. In addition, if these transactional costs were included, your costs would have been higher.
9
Expense Table – continued
| | | | | | | | | | | | | | | | | | |
Share
Class | | | | Annualized
Expense
Ratio | | | Beginning
Account Value
3/01/13 | | | Ending
Account Value
8/31/13 | | | Expenses Paid During Period (p) 3/01/13-8/31/13 | |
| A | | Actual | | | 1.29% | | | | $1,000.00 | | | | $1,125.82 | | | | $6.91 | |
| | Hypothetical (h) | | | 1.29% | | | | $1,000.00 | | | | $1,018.70 | | | | $6.56 | |
| B | | Actual | | | 2.05% | | | | $1,000.00 | | | | $1,121.87 | | | | $10.96 | |
| | Hypothetical (h) | | | 2.05% | | | | $1,000.00 | | | | $1,014.87 | | | | $10.41 | |
| C | | Actual | | | 2.05% | | | | $1,000.00 | | | | $1,121.69 | | | | $10.96 | |
| | Hypothetical (h) | | | 2.05% | | | | $1,000.00 | | | | $1,014.87 | | | | $10.41 | |
| I | | Actual | | | 1.05% | | | | $1,000.00 | | | | $1,127.40 | | | | $5.63 | |
| | Hypothetical (h) | | | 1.05% | | | | $1,000.00 | | | | $1,019.91 | | | | $5.35 | |
| R1 | | Actual | | | 2.05% | | | | $1,000.00 | | | | $1,122.04 | | | | $10.96 | |
| | Hypothetical (h) | | | 2.05% | | | | $1,000.00 | | | | $1,014.87 | | | | $10.41 | |
| R2 | | Actual | | | 1.55% | | | | $1,000.00 | | | | $1,124.78 | | | | $8.30 | |
| | Hypothetical (h) | | | 1.55% | | | | $1,000.00 | | | | $1,017.39 | | | | $7.88 | |
| R3 | | Actual | | | 1.29% | | | | $1,000.00 | | | | $1,125.93 | | | | $6.91 | |
| | Hypothetical (h) | | | 1.29% | | | | $1,000.00 | | | | $1,018.70 | | | | $6.56 | |
| R4 | | Actual | | | 1.05% | | | | $1,000.00 | | | | $1,127.28 | | | | $5.63 | |
| | Hypothetical (h) | | | 1.05% | | | | $1,000.00 | | | | $1,019.91 | | | | $5.35 | |
| R5 | | Actual | | | 0.95% | | | | $1,000.00 | | | | $1,127.70 | | | | $5.09 | |
| | Hypothetical (h) | | | 0.95% | | | | $1,000.00 | | | | $1,020.42 | | | | $4.84 | |
| 529A | | Actual | | | 1.30% | | | | $1,000.00 | | | | $1,126.23 | | | | $6.97 | |
| | Hypothetical (h) | | | 1.30% | | | | $1,000.00 | | | | $1,018.65 | | | | $6.61 | |
| 529B | | Actual | | | 2.08% | | | | $1,000.00 | | | | $1,121.35 | | | | $11.12 | |
| | Hypothetical (h) | | | 2.08% | | | | $1,000.00 | | | | $1,014.72 | | | | $10.56 | |
| 529C | | Actual | | | 2.10% | | | | $1,000.00 | | | | $1,121.29 | | | | $11.23 | |
| | Hypothetical (h) | | | 2.10% | | | | $1,000.00 | | | | $1,014.62 | | | | $10.66 | |
| (h) | 5% class return per year before expenses. |
| (p) | Expenses paid are equal to each class’s annualized expense ratio, as shown above, multiplied by the average account value over the period, multiplied by the number of days in the period, divided by the number of days in the year. Expenses paid do not include any applicable sales charges (loads). If these transaction costs had been included, your costs would have been higher. |
Notes to Expense Table
Each class with a Rule 12b-1 service fee is subject to a rebate of a portion of such fee. Such rebates are included in the expense ratios above and are outside of the expense limitation arrangement. For Class A, Class 529A, and Class 529B shares, this rebate reduced the expense ratios above by 0.01%, 0.04%, and 0.01%, respectively. See Note 3 in the Notes to Financial Statements for additional information.
10
PORTFOLIO OF INVESTMENTS
8/31/13
The Portfolio of Investments is a complete list of all securities owned by your fund. It is categorized by broad-based asset classes.
| | | | | | | | |
| Common Stocks - 99.5% | | | | | | | | |
| Issuer | | Shares/Par | | | Value ($) | |
| Brokerage & Asset Managers - 1.2% | | | | | | | | |
| LPL Financial Holdings, Inc. | | | 675,000 | | | $ | 24,826,497 | |
| | |
| Business Services - 6.3% | | | | | | | | |
| Bright Horizons Family Solutions, Inc. (a) | | | 802,430 | | | $ | 29,216,476 | |
| Concur Technologies, Inc. (a) | | | 115,340 | | | | 11,271,025 | |
| Constant Contact, Inc. (a)(h) | | | 2,109,135 | | | | 40,347,753 | |
| FleetCor Technologies, Inc. (a) | | | 99,370 | | | | 10,246,041 | |
| Gartner, Inc. (a) | | | 176,410 | | | | 10,226,488 | |
| Performant Financial Corp. (a) | | | 1,217,050 | | | | 13,180,652 | |
| Xoom Corp. (a) | | | 509,068 | | | | 13,688,839 | |
| | | | | | | | |
| | | | | | | $ | 128,177,274 | |
| Chemicals - 1.4% | | | | | | | | |
| Intrepid Potash, Inc. (l) | | | 1,681,780 | | | $ | 20,921,343 | |
| Marrone Bio Innovations, Inc. (a) | | | 516,797 | | | | 6,795,881 | |
| | | | | | | | |
| | | | | | | $ | 27,717,224 | |
| Computer Software - 3.9% | | | | | | | | |
| ANSYS, Inc. (a) | | | 115,980 | | | $ | 9,740,000 | |
| CommVault Systems, Inc. (a) | | | 400,800 | | | | 33,599,064 | |
| Qlik Technologies, Inc. (a) | | | 566,485 | | | | 18,575,043 | |
| SolarWinds, Inc. (a) | | | 459,862 | | | | 16,761,970 | |
| | | | | | | | |
| | | | | | | $ | 78,676,077 | |
| Computer Software - Systems - 8.6% | | | | | | | | |
| Cvent, Inc. (a) | | | 461,960 | | | $ | 16,450,396 | |
| E2open, Inc. (a) | | | 107,460 | | | | 2,173,916 | |
| Exa Corp. (a) | | | 587,320 | | | | 8,369,310 | |
| FleetMatics Group PLC (a) | | | 672,519 | | | | 33,256,065 | |
| Guidewire Software, Inc. (a) | | | 302,150 | | | | 13,886,814 | |
| Linx S.A. | | | 453,600 | | | | 7,376,383 | |
| MiX Telematics Ltd., SP ADR (a) | | | 1,050,990 | | | | 16,279,835 | |
| Model N, Inc. (a)(h) | | | 1,833,988 | | | | 26,427,767 | |
| SciQuest, Inc. (a)(h) | | | 1,196,265 | | | | 24,882,312 | |
| SS&C Technologies Holdings, Inc. (a) | | | 577,974 | | | | 20,454,500 | |
| Tableau Software, Inc., “A” (a) | | | 67,545 | | | | 4,884,179 | |
| | | | | | | | |
| | | | | | | $ | 174,441,477 | |
11
Portfolio of Investments – continued
| | | | | | | | |
| Issuer | | Shares/Par | | | Value ($) | |
| Common Stocks - continued | | | | | | | | |
| Consumer Services - 4.1% | | | | | | | | |
| Diamond Resorts International, Inc. (a) | | | 1,066,200 | | | $ | 17,315,088 | |
| HomeAway, Inc. (a) | | | 946,827 | | | | 29,862,924 | |
| Kroton Educacional S.A. | | | 1,786,000 | | | | 23,953,561 | |
| MakeMyTrip Ltd. (a) | | | 986,671 | | | | 13,468,059 | |
| | | | | | | | |
| | | | | | | $ | 84,599,632 | |
| Electrical Equipment - 2.4% | | | | | | | | |
| MSC Industrial Direct Co., Inc., “A” | | | 285,728 | | | $ | 21,715,328 | |
| Sensata Technologies Holding B.V. (a) | | | 708,327 | | | | 26,406,431 | |
| | | | | | | | |
| | | | | | | $ | 48,121,759 | |
| Electronics - 7.1% | | | | | | | | |
| Mellanox Technologies Ltd. (a) | | | 476,850 | | | $ | 18,797,427 | |
| Monolithic Power Systems, Inc. | | | 357,832 | | | | 10,956,816 | |
| Rubicon Technology, Inc. (a)(l) | | | 695,940 | | | | 8,497,427 | |
| Silicon Laboratories, Inc. (a) | | | 873,710 | | | | 33,803,840 | |
| Stratasys Ltd. (a) | | | 147,050 | | | | 15,774,054 | |
| Ultratech, Inc. (a) | | | 895,610 | | | | 25,327,851 | |
| Universal Display Corp. (a) | | | 230,827 | | | | 7,988,922 | |
| Veeco Instruments, Inc. (a) | | | 644,773 | | | | 22,644,428 | |
| | | | | | | | |
| | | | | | | $ | 143,790,765 | |
| Energy - Independent - 8.4% | | | | | | | | |
| Alpha Natural Resources, Inc. (a) | | | 1,943,910 | | | $ | 11,818,973 | |
| Arch Coal, Inc. | | | 2,591,200 | | | | 11,582,664 | |
| Cabot Oil & Gas Corp. | | | 1,133,656 | | | | 44,359,959 | |
| CONSOL Energy, Inc. | | | 1,373,340 | | | | 42,889,408 | |
| Peabody Energy Corp. | | | 1,206,230 | | | | 20,747,156 | |
| Range Resources Corp. | | | 376,794 | | | | 28,252,014 | |
| Walter Energy, Inc. (l) | | | 955,360 | | | | 12,362,358 | |
| | | | | | | | |
| | | | | | | $ | 172,012,532 | |
| Food & Beverages - 0.8% | | | | | | | | |
| Green Mountain Coffee Roasters, Inc. (a) | | | 186,060 | | | $ | 16,058,839 | |
| | |
| Food��& Drug Stores - 1.2% | | | | | | | | |
| Brazil Pharma S.A. (a) | | | 1,155,700 | | | $ | 4,117,207 | |
| Fairway Group Holdings Corp. (a) | | | 857,450 | | | | 19,875,691 | |
| | | | | | | | |
| | | | | | | $ | 23,992,898 | |
| Furniture & Appliances - 1.0% | | | | | | | | |
| SodaStream International Ltd. (a)(l) | | | 336,670 | | | $ | 21,038,508 | |
12
Portfolio of Investments – continued
| | | | | | | | |
| Issuer | | Shares/Par | | | Value ($) | |
| Common Stocks - continued | | | | | | | | |
| Gaming & Lodging - 0.8% | | | | | | | | |
| Norwegian Cruise Line Holdings Ltd. (a) | | | 543,230 | | | $ | 16,889,021 | |
| | |
| General Merchandise - 0.4% | | | | | | | | |
| Five Below, Inc. (a) | | | 245,466 | | | $ | 9,020,876 | |
| | |
| Internet - 3.8% | | | | | | | | |
| ChannelAdvisor Corp. (a) | | | 444,509 | | | $ | 13,610,866 | |
| Millennial Media, Inc. (a)(l) | | | 2,155,210 | | | | 14,116,626 | |
| Pandora Media, Inc. (a) | | | 667,950 | | | | 12,303,639 | |
| Shutterfly, Inc. (a) | | | 446,580 | | | | 23,204,297 | |
| Shutterstock, Inc. (a) | | | 188,820 | | | | 9,373,025 | |
| Yelp, Inc. (a) | | | 99,070 | | | | 5,149,659 | |
| | | | | | | | |
| | | | | | | $ | 77,758,112 | |
| Machinery & Tools - 11.9% | | | | | | | | |
| Allison Transmission Holdings, Inc. | | | 1,178,990 | | | $ | 26,539,065 | |
| IPG Photonics Corp. | | | 467,900 | | | | 25,154,304 | |
| Joy Global, Inc. | | | 627,466 | | | | 30,821,130 | |
| Kennametal, Inc. | | | 628,920 | | | | 26,741,678 | |
| Nordson Corp. | | | 193,200 | | | | 12,876,780 | |
| Polypore International, Inc. (a) | | | 1,056,573 | | | | 45,168,496 | |
| Proto Labs, Inc. (a) | | | 393,190 | | | | 27,932,218 | |
| United Rentals, Inc. (a) | | | 361,445 | | | | 19,796,343 | |
| WABCO Holdings, Inc. (a) | | | 349,987 | | | | 27,295,486 | |
| | | | | | | | |
| | | | | | | $ | 242,325,500 | |
| Medical & Health Technology & Services - 2.7% | | | | | | | | |
| Advisory Board Co. (a) | | | 328,156 | | | $ | 17,973,104 | |
| Healthcare Services Group, Inc. | | | 1,137,023 | | | | 27,527,327 | |
| HealthStream, Inc. (a) | | | 281,630 | | | | 9,336,035 | |
| | | | | | | | |
| | | | | | | $ | 54,836,466 | |
| Medical Equipment - 8.5% | | | | | | | | |
| Align Technology, Inc. (a) | | | 626,244 | | | $ | 27,272,926 | |
| Cardiovascular Systems, Inc. (a) | | | 1,021,110 | | | | 20,953,177 | |
| Cepheid, Inc. (a) | | | 775,140 | | | | 27,734,509 | |
| Endologix, Inc. (a) | | | 2,157,053 | | | | 34,124,578 | |
| GenMark Diagnostics, Inc. (a) | | | 1,019,600 | | | | 11,725,400 | |
| Globus Medical, Inc., “A” (a) | | | 1,018,067 | | | | 17,938,341 | |
| Novadaq Technologies, Inc. (a) | | | 358,660 | | | | 5,340,447 | |
| NxStage Medical, Inc. (a) | | | 1,011,424 | | | | 12,491,086 | |
| TearLab Corp. (a) | | | 801,389 | | | | 10,530,251 | |
| Uroplasty, Inc. (a)(h) | | | 1,567,473 | | | | 5,674,252 | |
| | | | | | | | |
| | | | | | | $ | 173,784,967 | |
13
Portfolio of Investments – continued
| | | | | | | | |
| Issuer | | Shares/Par | | | Value ($) | |
| Common Stocks - continued | | | | | | | | |
| Metals & Mining - 5.6% | | | | | | | | |
| Century Aluminum Co. (a) | | | 1,610,190 | | | $ | 12,575,584 | |
| Globe Specialty Metals, Inc. | | | 2,390,418 | | | | 30,716,871 | |
| GrafTech International Ltd. (a) | | | 2,825,170 | | | | 22,092,829 | |
| Horsehead Holding Corp. (a) | | | 800,090 | | | | 9,497,068 | |
| Iluka Resources Ltd. | | | 2,574,513 | | | | 24,382,577 | |
| Molycorp, Inc. (a)(l) | | | 2,392,180 | | | | 14,592,298 | |
| | | | | | | | |
| | | | | | | $ | 113,857,227 | |
| Network & Telecom - 1.0% | | | | | | | | |
| Fortinet, Inc. (a) | | | 492,030 | | | $ | 9,742,194 | |
| Palo Alto Networks, Inc. (a) | | | 227,500 | | | | 10,924,550 | |
| | | | | | | | |
| | | | | | | $ | 20,666,744 | |
| Oil Services - 4.3% | | | | | | | | |
| Atwood Oceanics, Inc. (a) | | | 708,209 | | | $ | 39,433,077 | |
| Dresser-Rand Group, Inc. (a) | | | 439,514 | | | | 26,783,983 | |
| Frank’s International N.V. (a) | | | 797,230 | | | | 22,091,243 | |
| | | | | | | | |
| | | | | | | $ | 88,308,303 | |
| Other Banks & Diversified Financials - 1.0% | | | | | | | | |
| First Republic Bank | | | 450,100 | | | $ | 19,930,428 | |
| | |
| Pharmaceuticals - 0.3% | | | | | | | | |
| Kythera Biopharmaceuticals, Inc. (a) | | | 272,560 | | | $ | 7,195,584 | |
| | |
| Railroad & Shipping - 2.8% | | | | | | | | |
| Diana Shipping, Inc. (a) | | | 3,566,978 | | | $ | 38,737,381 | |
| Navios Maritime Holdings, Inc. | | | 3,067,586 | | | | 18,650,923 | |
| | | | | | | | |
| | | | | | | $ | 57,388,304 | |
| Restaurants - 1.5% | | | | | | | | |
| Arcos Dorados Holdings, Inc. | | | 1,862,050 | | | $ | 19,923,935 | |
| Chuy’s Holdings, Inc. (a) | | | 277,593 | | | | 9,979,468 | |
| | | | | | | | |
| | | | | | | $ | 29,903,403 | |
| Specialty Chemicals - 3.0% | | | | | | | | |
| Rockwood Holdings, Inc. | | | 238,830 | | | $ | 15,251,684 | |
| Tronox Ltd., “A” | | | 2,112,680 | | | | 45,126,845 | |
| | | | | | | | |
| | | | | | | $ | 60,378,529 | |
| Specialty Stores - 2.1% | | | | | | | | |
| Citi Trends, Inc. (a)(h) | | | 1,312,543 | | | $ | 21,302,573 | |
| Monro Muffler Brake, Inc. | | | 507,283 | | | | 22,457,418 | |
| | | | | | | | |
| | | | | | | $ | 43,759,991 | |
14
Portfolio of Investments – continued
| | | | | | | | |
| Issuer | | Shares/Par | | | Value ($) | |
| Common Stocks - continued | | | | | | | | |
| Trucking - 3.4% | | | | | | | | |
| Atlas Air Worldwide Holdings, Inc. (a) | | | 651,096 | | | $ | 30,080,635 | |
| Swift Transportation Co. (a) | | | 2,145,720 | | | | 38,537,131 | |
| | | | | | | | |
| | | | | | | $ | 68,617,766 | |
| Total Common Stocks (Identified Cost, $1,745,548,816) | | | $ | 2,028,074,703 | |
| | |
| Money Market Funds - 0.6% | | | | | | | | |
MFS Institutional Money Market Portfolio, 0.09%,
at Cost and Net Asset Value (v) | | | 11,908,354 | | | $ | 11,908,354 | |
| | |
| Collateral for Securities Loaned - 2.3% | | | | | | | | |
Navigator Securities Lending Prime Portfolio, 0.16%,
at Cost and Net Asset Value (j) | | | 46,736,588 | | | $ | 46,736,588 | |
| Total Investments (Identified Cost, $1,804,193,758) | | | $ | 2,086,719,645 | |
| | |
| Other Assets, Less Liabilities - (2.4)% | | | | | | | (48,196,667 | ) |
| Net Assets - 100.0% | | | | | | $ | 2,038,522,978 | |
| (a) | Non-income producing security. |
| (h) | Affiliated issuers are those in which the fund’s holdings of an issuer represent 5% or more of the outstanding voting securities of the issuer. |
| (j) | The rate quoted is the annualized seven-day yield of the fund at period end. |
| (l) | A portion of this security is on loan. |
| (v) | Underlying affiliated fund that is available only to investment companies managed by MFS. The rate quoted for the MFS Institutional Money Market Portfolio is the annualized seven-day yield of the fund at period end. |
The following abbreviations are used in this report and are defined:
| ADR | | American Depositary Receipt |
| PLC | | Public Limited Company |
See Notes to Financial Statements
15
Financial Statements
STATEMENT OF ASSETS AND LIABILITIES
At 8/31/13
This statement represents your fund’s balance sheet, which details the assets and liabilities comprising the total value of the fund.
| | | | |
| Assets | | | | |
Investments- | | | | |
Non-affiliated issuers, at value (identified cost, $1,671,996,840) | | | $1,956,176,634 | |
Underlying affiliated funds, at cost and value | | | 11,908,354 | |
Other affiliated issuers, at value (identified cost, $120,288,564) | | | 118,634,657 | |
Total investments, at value, including $44,992,474 of securities on loan
(identified cost, $1,804,193,758) | | | $2,086,719,645 | |
Cash | | | 503,787 | |
Foreign currency, at value (identified cost, $41,214) | | | 40,949 | |
Receivables for | | | | |
Fund shares sold | | | 6,448,382 | |
Interest and dividends | | | 1,201,840 | |
Other assets | | | 1,947 | |
Total assets | | | $2,094,916,550 | |
| Liabilities | | | | |
Payables for | | | | |
Investments purchased | | | $5,185,755 | |
Fund shares reacquired | | | 3,014,261 | |
Collateral for securities loaned, at value | | | 46,736,588 | |
Payable to affiliates | | | | |
Investment adviser | | | 160,038 | |
Shareholder servicing costs | | | 1,081,739 | |
Distribution and service fees | | | 34,409 | |
Program manager fees | | | 25 | |
Payable for independent Trustees’ compensation | | | 4,747 | |
Accrued expenses and other liabilities | | | 176,010 | |
Total liabilities | | | $56,393,572 | |
Net assets | | | $2,038,522,978 | |
| Net assets consist of | | | | |
Paid-in capital | | | $1,674,760,871 | |
Unrealized appreciation (depreciation) on investments and translation of assets and liabilities in foreign currencies | | | 282,525,543 | |
Accumulated net realized gain (loss) on investments and foreign currency | | | 81,241,297 | |
Accumulated net investment loss | | | (4,733 | ) |
Net assets | | | $2,038,522,978 | |
Shares of beneficial interest outstanding | | | 78,153,108 | |
16
Statement of Assets and Liabilities – continued
| | | | | | | | | | | | |
| | | Net assets | | | Shares outstanding | | | Net asset value per share (a) | |
Class A | | | $866,006,080 | | | | 33,489,842 | | | | $25.86 | |
Class B | | | 37,951,595 | | | | 1,662,680 | | | | 22.83 | |
Class C | | | 136,912,621 | | | | 5,989,008 | | | | 22.86 | |
Class I | | | 368,806,467 | | | | 13,359,825 | | | | 27.61 | |
Class R1 | | | 8,972,411 | | | | 395,118 | | | | 22.71 | |
Class R2 | | | 60,500,605 | | | | 2,422,946 | | | | 24.97 | |
Class R3 | | | 110,561,647 | | | | 4,278,770 | | | | 25.84 | |
Class R4 | | | 197,884,077 | | | | 7,446,661 | | | | 26.57 | |
Class R5 | | | 244,655,283 | | | | 8,850,569 | | | | 27.64 | |
Class 529A | | | 4,518,565 | | | | 178,986 | | | | 25.25 | |
Class 529B | | | 299,774 | | | | 13,459 | | | | 22.27 | |
Class 529C | | | 1,453,853 | | | | 65,244 | | | | 22.28 | |
| (a) | Maximum offering price per share was equal to the net asset value per share for all share classes, except for Classes A and 529A, for which the maximum offering prices per share were $27.44 [100 / 94.25 x $25.86] and $26.79 [100 / 94.25 x $25.25], respectively. On sales of $50,000 or more, the maximum offering prices of Class A and Class 529A shares are reduced. A contingent deferred sales charge may be imposed on redemptions of Class A, Class B, Class C, Class 529B, and Class 529C shares. Redemption price per share was equal to the net asset value per share for Classes I, R1, R2, R3, R4, R5, and 529A. |
See Notes to Financial Statements
17
Financial Statements
STATEMENT OF OPERATIONS
Year ended 8/31/13
This statement describes how much your fund earned in investment income and accrued in expenses. It also describes any gains and/or losses generated by fund operations.
| | | | |
| Net investment loss | | | | |
Income | | | | |
Dividends | | | $9,469,986 | |
Income on securities loaned | | | 1,427,409 | |
Dividends from underlying affiliated funds | | | 15,014 | |
Foreign taxes withheld | | | (12,924 | ) |
Total investment income | | | $10,899,485 | |
Expenses | | | | |
Management fee | | | $13,736,565 | |
Distribution and service fees | | | 3,517,732 | |
Program manager fees | | | 5,293 | |
Shareholder servicing costs | | | 1,973,708 | |
Administrative services fee | | | 203,726 | |
Independent Trustees’ compensation | | | 27,082 | |
Custodian fee | | | 138,211 | |
Shareholder communications | | | 106,349 | |
Audit and tax fees | | | 55,926 | |
Legal fees | | | 14,311 | |
Miscellaneous | | | 271,451 | |
Total expenses | | | $20,050,354 | |
Fees paid indirectly | | | (908 | ) |
Reduction of expenses by investment adviser and distributor | | | (558,240 | ) |
Net expenses | | | $19,491,206 | |
Net investment loss | | | $(8,591,721 | ) |
| Realized and unrealized gain (loss) on investments and foreign currency | |
Realized gain (loss) (identified cost basis) | | | | |
Investments: | | | | |
Non-affiliated issuers | | | $205,707,557 | |
Other affiliated issuers | | | (538,329 | ) |
Foreign currency | | | 40,845 | |
Net realized gain (loss) on investments and foreign currency | | | $205,210,073 | |
Change in unrealized appreciation (depreciation) | | | | |
Investments | | | $179,463,456 | |
Translation of assets and liabilities in foreign currencies | | | (344 | ) |
Net unrealized gain (loss) on investments and foreign currency translation | | | $179,463,112 | |
Net realized and unrealized gain (loss) on investments and foreign currency | | | $384,673,185 | |
Change in net assets from operations | | | $376,081,464 | |
See Notes to Financial Statements
18
Financial Statements
STATEMENTS OF CHANGES IN NET ASSETS
These statements describe the increases and/or decreases in net assets resulting from operations, any distributions, and any shareholder transactions.
| | | | | | | | |
| | | Years ended 8/31 | |
| | | 2013 | | | 2012 | |
| Change in net assets | | | | | | |
| From operations | | | | | | | | |
Net investment loss | | | $(8,591,721 | ) | | | $(9,789,936 | ) |
Net realized gain (loss) on investments and foreign currency | | | 205,210,073 | | | | (77,936,137 | ) |
Net unrealized gain (loss) on investments and foreign
currency translation | | | 179,463,112 | | | | 197,089,128 | |
Change in net assets from operations | | | $376,081,464 | | | | $109,363,055 | |
| Distributions declared to shareholders | | | | | | | | |
From net realized gain on investments | | | $— | | | | $(208,715,402 | ) |
Change in net assets from fund share transactions | | | $415,383,480 | | | | $125,313,234 | |
Total change in net assets | | | $791,464,944 | | | | $25,960,887 | |
| Net assets | | | | | | | | |
At beginning of period | | | 1,247,058,034 | | | | 1,221,097,147 | |
At end of period (including accumulated net investment loss of $4,733 and $7,106,777, respectively) | | | $2,038,522,978 | | | | $1,247,058,034 | |
See Notes to Financial Statements
19
Financial Statements
FINANCIAL HIGHLIGHTS
The financial highlights table is intended to help you understand the fund’s financial performance for the past 5 years (or life of a particular share class, if shorter). Certain information reflects financial results for a single fund share. The total returns in the table represent the rate by which an investor would have earned (or lost) on an investment in the fund share class (assuming reinvestment of all distributions) held for the entire period.
| | | | | | | | | | | | | | | | | | | | |
| Class A | | Years ended 8/31 | |
| | | 2013 | | | 2012 | | | 2011 | | | 2010 | | | 2009 | |
Net asset value, beginning of period | | | $20.17 | | | | $22.63 | | | | $19.03 | | | | $16.22 | | | | $17.96 | |
| Income (loss) from investment operations | | | | | | | | | | | | | | | | | |
Net investment loss (d) | | | $(0.14 | ) | | | $(0.16 | ) | | | $(0.22 | ) | | | $(0.17 | ) | | | $(0.13 | ) |
Net realized and unrealized gain (loss)
on investments and foreign currency | | | 5.83 | | | | 1.80 | | | | 5.23 | | | | 2.98 | | | | (1.61 | )(g) |
Total from investment operations | | | $5.69 | | | | $1.64 | | | | $5.01 | | | | $2.81 | | | | $(1.74 | ) |
| Less distributions declared to shareholders | | | | | | | | | | | | | | | | | |
From net realized gain on investments | | | $— | | | | $(4.10 | ) | | | $(1.41 | ) | | | $— | | | | $— | |
Net asset value, end of period (x) | | | $25.86 | | | | $20.17 | | | | $22.63 | | | | $19.03 | | | | $16.22 | |
Total return (%) (r)(s)(t)(x) | | | 28.21 | | | | 9.88 | | | | 26.13 | | | | 17.32 | | | | (9.69 | ) |
Ratios (%) (to average net assets)
and Supplemental data: | | | | | | | | | | | | | | | | | | | | |
Expenses before expense reductions (f) | | | 1.35 | | | | 1.39 | | | | 1.40 | | | | 1.51 | | | | 1.70 | |
Expenses after expense reductions (f) | | | 1.31 | | | | 1.35 | | | | 1.30 | | | | 1.41 | | | | 1.60 | |
Net investment loss | | | (0.59 | ) | | | (0.83 | ) | | | (0.90 | ) | | | (0.92 | ) | | | (1.05 | ) |
Portfolio turnover | | | 96 | | | | 128 | | | | 205 | | | | 167 | | | | 150 | |
Net assets at end of period (000 omitted) | | | $866,006 | | | | $529,749 | | | | $626,258 | | | | $338,380 | | | | $248,658 | |
See Notes to Financial Statements
20
Financial Highlights – continued
| | | | | | | | | | | | | | | | | | | | |
| Class B | | Years ended 8/31 | |
| | | 2013 | | | 2012 | | | 2011 | | | 2010 | | | 2009 | |
Net asset value, beginning of period | | | $17.94 | | | | $20.73 | | | | $17.65 | | | | $15.16 | | | | $16.90 | |
| Income (loss) from investment operations | | | | | | | | | | | | | | | | | |
Net investment loss (d) | | | $(0.27 | ) | | | $(0.28 | ) | | | $(0.37 | ) | | | $(0.29 | ) | | | $(0.21 | ) |
Net realized and unrealized gain (loss)
on investments and foreign currency | | | 5.16 | | | | 1.59 | | | | 4.86 | | | | 2.78 | | | | (1.53 | )(g) |
Total from investment operations | | | $4.89 | | | | $1.31 | | | | $4.49 | | | | $2.49 | | | | $(1.74 | ) |
| Less distributions declared to shareholders | | | | | | | | | | | | | | | | | |
From net realized gain on investments | | | $— | | | | $(4.10 | ) | | | $(1.41 | ) | | | $— | | | | $— | |
Net asset value, end of period (x) | | | $22.83 | | | | $17.94 | | | | $20.73 | | | | $17.65 | | | | $15.16 | |
Total return (%) (r)(s)(t)(x) | | | 27.26 | | | | 9.08 | | | | 25.18 | | | | 16.42 | | | | (10.30 | ) |
Ratios (%) (to average net assets)
and Supplemental data: | | | | | | | | | | | | | | | | | | | | |
Expenses before expense reductions (f) | | | 2.10 | | | | 2.14 | | | | 2.15 | | | | 2.26 | | | | 2.41 | |
Expenses after expense reductions (f) | | | 2.06 | | | | 2.10 | | | | 2.05 | | | | 2.16 | | | | 2.30 | |
Net investment loss | | | (1.34 | ) | | | (1.59 | ) | | | (1.65 | ) | | | (1.67 | ) | | | (1.76 | ) |
Portfolio turnover | | | 96 | | | | 128 | | | | 205 | | | | 167 | | | | 150 | |
Net assets at end of period (000 omitted) | | | $37,952 | | | | $30,308 | | | | $33,037 | | | | $26,777 | | | | $27,582 | |
| |
| Class C | | Years ended 8/31 | |
| | | 2013 | | | 2012 | | | 2011 | | | 2010 | | | 2009 | |
Net asset value, beginning of period | | | $17.96 | | | | $20.76 | | | | $17.67 | | | | $15.18 | | | | $16.93 | |
| Income (loss) from investment operations | | | | | | | | | | | | | | | | | |
Net investment loss (d) | | | $(0.27 | ) | | | $(0.28 | ) | | | $(0.37 | ) | | | $(0.30 | ) | | | $(0.21 | ) |
Net realized and unrealized gain (loss)
on investments and foreign currency | | | 5.17 | | | | 1.58 | | | | 4.87 | | | | 2.79 | | | | (1.54 | )(g) |
Total from investment operations | | | $4.90 | | | | $1.30 | | | | $4.50 | | | | $2.49 | | | | $(1.75 | ) |
| Less distributions declared to shareholders | | | | | | | | | | | | | | | | | |
From net realized gain on investments | | | $— | | | | $(4.10 | ) | | | $(1.41 | ) | | | $— | | | | $— | |
Net asset value, end of period (x) | | | $22.86 | | | | $17.96 | | | | $20.76 | | | | $17.67 | | | | $15.18 | |
Total return (%) (r)(s)(t)(x) | | | 27.28 | | | | 9.01 | | | | 25.21 | | | | 16.40 | | | | (10.34 | ) |
Ratios (%) (to average net assets)
and Supplemental data: | | | | | | | | | | | | | | | | | | | | |
Expenses before expense reductions (f) | | | 2.10 | | | | 2.14 | | | | 2.15 | | | | 2.26 | | | | 2.40 | |
Expenses after expense reductions (f) | | | 2.06 | | | | 2.10 | | | | 2.05 | | | | 2.16 | | | | 2.30 | |
Net investment loss | | | (1.35 | ) | | | (1.59 | ) | | | (1.65 | ) | | | (1.67 | ) | | | (1.75 | ) |
Portfolio turnover | | | 96 | | | | 128 | | | | 205 | | | | 167 | | | | 150 | |
Net assets at end of period (000 omitted) | | | $136,913 | | | | $91,138 | | | | $95,479 | | | | $37,144 | | | | $25,431 | |
See Notes to Financial Statements
21
Financial Highlights – continued
| | | | | | | | | | | | | | | | | | | | |
| Class I | | Years ended 8/31 | |
| | | 2013 | | | 2012 | | | 2011 | | | 2010 | | | 2009 | |
Net asset value, beginning of period | | | $21.48 | | | | $23.77 | | | | $19.88 | | | | $16.91 | | | | $18.67 | |
| Income (loss) from investment operations | | | | | | | | | | | | | | | | | |
Net investment loss (d) | | | $(0.09 | ) | | | $(0.12 | ) | | | $(0.17 | ) | | | $(0.13 | ) | | | $(0.10 | ) |
Net realized and unrealized gain (loss)
on investments and foreign currency | | | 6.22 | | | | 1.93 | | | | 5.47 | | | | 3.10 | | | | (1.66 | )(g) |
Total from investment operations | | | $6.13 | | | | $1.81 | | | | $5.30 | | | | $2.97 | | | | $(1.76 | ) |
| Less distributions declared to shareholders | | | | | | | | | | | | | | | | | |
From net realized gain on investments | | | $— | | | | $(4.10 | ) | | | $(1.41 | ) | | | $— | | | | $— | |
Net asset value, end of period (x) | | | $27.61 | | | | $21.48 | | | | $23.77 | | | | $19.88 | | | | $16.91 | |
Total return (%) (r)(s)(x) | | | 28.54 | | | | 10.16 | | | | 26.48 | | | | 17.56 | | | | (9.43 | ) |
Ratios (%) (to average net assets)
and Supplemental data: | | | | | | | | | | | | | | | | | | | | |
Expenses before expense reductions (f) | | | 1.10 | | | | 1.15 | | | | 1.15 | | | | 1.26 | | | | 1.35 | |
Expenses after expense reductions (f) | | | 1.06 | | | | 1.10 | | | | 1.05 | | | | 1.16 | | | | 1.25 | |
Net investment loss | | | (0.36 | ) | | | (0.59 | ) | | | (0.65 | ) | | | (0.67 | ) | | | (0.71 | ) |
Portfolio turnover | | | 96 | | | | 128 | | | | 205 | | | | 167 | | | | 150 | |
Net assets at end of period (000 omitted) | | | $368,806 | | | | $170,830 | | | | $323,848 | | | | $263,575 | | | | $238,410 | |
| |
| Class R1 | | Years ended 8/31 | |
| | | 2013 | | | 2012 | | | 2011 | | | 2010 | | | 2009 | |
Net asset value, beginning of period | | | $17.84 | | | | $20.65 | | | | $17.58 | | | | $15.10 | | | | $16.84 | |
| Income (loss) from investment operations | | | | | | | | | | | | | | | | | |
Net investment loss (d) | | | $(0.27 | ) | | | $(0.28 | ) | | | $(0.37 | ) | | | $(0.29 | ) | | | $(0.21 | ) |
Net realized and unrealized gain (loss)
on investments and foreign currency | | | 5.14 | | | | 1.57 | | | | 4.85 | | | | 2.77 | | | | (1.53 | )(g) |
Total from investment operations | | | $4.87 | | | | $1.29 | | | | $4.48 | | | | $2.48 | | | | $(1.74 | ) |
| Less distributions declared to shareholders | | | | | | | | | | | | | | | | | |
From net realized gain on investments | | | $— | | | | $(4.10 | ) | | | $(1.41 | ) | | | $— | | | | $— | |
Net asset value, end of period (x) | | | $22.71 | | | | $17.84 | | | | $20.65 | | | | $17.58 | | | | $15.10 | |
Total return (%) (r)(s)(x) | | | 27.30 | | | | 9.00 | | | | 25.22 | | | | 16.42 | | | | (10.33 | ) |
Ratios (%) (to average net assets)
and Supplemental data: | | | | | | | | | | | | | | | | | | | | |
Expenses before expense reductions (f) | | | 2.10 | | | | 2.14 | | | | 2.15 | | | | 2.26 | | | | 2.40 | |
Expenses after expense reductions (f) | | | 2.06 | | | | 2.10 | | | | 2.05 | | | | 2.16 | | | | 2.30 | |
Net investment loss | | | (1.34 | ) | | | (1.59 | ) | | | (1.65 | ) | | | (1.67 | ) | | | (1.76 | ) |
Portfolio turnover | | | 96 | | | | 128 | | | | 205 | | | | 167 | | | | 150 | |
Net assets at end of period (000 omitted) | | | $8,972 | | | | $7,506 | | | | $6,904 | | | | $5,253 | | | | $4,217 | |
See Notes to Financial Statements
22
Financial Highlights – continued
| | | | | | | | | | | | | | | | | | | | |
| Class R2 | | Years ended 8/31 | |
| | | 2013 | | | 2012 | | | 2011 | | | 2010 | | | 2009 | |
Net asset value, beginning of period | | | $19.52 | | | | $22.09 | | | | $18.65 | | | | $15.94 | | | | $17.68 | |
| Income (loss) from investment operations | | | | | | | | | | | | | | | | | |
Net investment loss (d) | | | $(0.19 | ) | | | $(0.21 | ) | | | $(0.28 | ) | | | $(0.22 | ) | | | $(0.16 | ) |
Net realized and unrealized gain (loss)
on investments and foreign currency | | | 5.64 | | | | 1.74 | | | | 5.13 | | | | 2.93 | | | | (1.58 | )(g) |
Total from investment operations | | | $5.45 | | | | $1.53 | | | | $4.85 | | | | $2.71 | | | | $(1.74 | ) |
| Less distributions declared to shareholders | | | | | | | | | | | | | | | | | |
From net realized gain on investments | | | $— | | | | $(4.10 | ) | | | $(1.41 | ) | | | $— | | | | $— | |
Net asset value, end of period (x) | | | $24.97 | | | | $19.52 | | | | $22.09 | | | | $18.65 | | | | $15.94 | |
Total return (%) (r)(s)(x) | | | 27.92 | | | | 9.58 | | | | 25.79 | | | | 17.00 | | | | (9.84 | ) |
Ratios (%) (to average net assets)
and Supplemental data: | | | | | | | | | | | | | | | | | | | | |
Expenses before expense reductions (f) | | | 1.60 | | | | 1.64 | | | | 1.65 | | | | 1.76 | | | | 1.90 | |
Expenses after expense reductions (f) | | | 1.56 | | | | 1.60 | | | | 1.55 | | | | 1.66 | | | | 1.80 | |
Net investment loss | | | (0.85 | ) | | | (1.09 | ) | | | (1.15 | ) | | | (1.17 | ) | | | (1.26 | ) |
Portfolio turnover | | | 96 | | | | 128 | | | | 205 | | | | 167 | | | | 150 | |
Net assets at end of period (000 omitted) | | | $60,501 | | | | $35,599 | | | | $24,316 | | | | $13,125 | | | | $11,312 | |
| |
| Class R3 | | Years ended 8/31 | |
| | | 2013 | | | 2012 | | | 2011 | | | 2010 | | | 2009 | |
Net asset value, beginning of period | | | $20.15 | | | | $22.62 | | | | $19.02 | | | | $16.22 | | | | $17.94 | |
| Income (loss) from investment operations | | | | | | | | | | | | | | | | | |
Net investment loss (d) | | | $(0.14 | ) | | | $(0.16 | ) | | | $(0.22 | ) | | | $(0.18 | ) | | | $(0.13 | ) |
Net realized and unrealized gain (loss)
on investments and foreign currency | | | 5.83 | | | | 1.79 | | | | 5.23 | | | | 2.98 | | | | (1.59 | )(g) |
Total from investment operations | | | $5.69 | | | | $1.63 | | | | $5.01 | | | | $2.80 | | | | $(1.72 | ) |
| Less distributions declared to shareholders | | | | | | | | | | | | | | | | | |
From net realized gain on investments | | | $— | | | | $(4.10 | ) | | | $(1.41 | ) | | | $— | | | | $— | |
Net asset value, end of period (x) | | | $25.84 | | | | $20.15 | | | | $22.62 | | | | $19.02 | | | | $16.22 | |
Total return (%) (r)(s)(x) | | | 28.24 | | | | 9.84 | | | | 26.14 | | | | 17.26 | | | | (9.59 | ) |
Ratios (%) (to average net assets)
and Supplemental data: | | | | | | | | | | | | | | | | | | | | |
Expenses before expense reductions (f) | | | 1.35 | | | | 1.39 | | | | 1.40 | | | | 1.51 | | | | 1.65 | |
Expenses after expense reductions (f) | | | 1.31 | | | | 1.35 | | | | 1.30 | | | | 1.41 | | | | 1.55 | |
Net investment loss | | | (0.60 | ) | | | (0.83 | ) | | | (0.90 | ) | | | (0.93 | ) | | | (1.00 | ) |
Portfolio turnover | | | 96 | | | | 128 | | | | 205 | | | | 167 | | | | 150 | |
Net assets at end of period (000 omitted) | | | $110,562 | | | | $61,125 | | | | $28,966 | | | | $6,456 | | | | $3,492 | |
See Notes to Financial Statements
23
Financial Highlights – continued
| | | | | | | | | | | | | | | | | | | | |
| Class R4 | | Years ended 8/31 | |
| | | 2013 | | | 2012 | | | 2011 | | | 2010 | | | 2009 | |
Net asset value, beginning of period | | | $20.67 | | | | $23.04 | | | | $19.31 | | | | $16.42 | | | | $18.13 | |
| Income (loss) from investment operations | | | | | | | | | | | | | | | | | |
Net investment loss (d) | | | $(0.08 | ) | | | $(0.12 | ) | | | $(0.16 | ) | | | $(0.13 | ) | | | $(0.10 | ) |
Net realized and unrealized gain (loss)
on investments and foreign currency | | | 5.98 | | | | 1.85 | | | | 5.30 | | | | 3.02 | | | | (1.61 | )(g) |
Total from investment operations | | | $5.90 | | | | $1.73 | | | | $5.14 | | | | $2.89 | | | | $(1.71 | ) |
| Less distributions declared to shareholders | | | | | | | | | | | | | | | | | |
From net realized gain on investments | | | $— | | | | $(4.10 | ) | | | $(1.41 | ) | | | $— | | | | $— | |
Net asset value, end of period (x) | | | $26.57 | | | | $20.67 | | | | $23.04 | | | | $19.31 | | | | $16.42 | |
Total return (%) (r)(s)(x) | | | 28.54 | | | | 10.13 | | | | 26.43 | | | | 17.60 | | | | (9.43 | ) |
Ratios (%) (to average net assets)
and Supplemental data: | | | | | | | | | | | | | | | | | | | | |
Expenses before expense reductions (f) | | | 1.10 | | | | 1.14 | | | | 1.15 | | | | 1.26 | | | | 1.40 | |
Expenses after expense reductions (f) | | | 1.06 | | | | 1.10 | | | | 1.05 | | | | 1.16 | | | | 1.30 | |
Net investment loss | | | (0.35 | ) | | | (0.58 | ) | | | (0.66 | ) | | | (0.67 | ) | | | (0.76 | ) |
Portfolio turnover | | | 96 | | | | 128 | | | | 205 | | | | 167 | | | | 150 | |
Net assets at end of period (000 omitted) | | | $197,884 | | | | $141,694 | | | | $78,534 | | | | $50,147 | | | | $42,974 | |
| | | | | | | | |
| Class R5 | | Years ended 8/31 | |
| | | 2013 | | | 2012 (i) | |
Net asset value, beginning of period | | | $21.48 | | | | $19.73 | |
| Income (loss) from investment operations | | | | | |
Net investment loss (d) | | | $(0.06 | ) | | | $(0.03 | ) |
Net realized and unrealized gain (loss) on investments and foreign currency | | | 6.22 | | | | 1.78 | |
Total from investment operations | | | $6.16 | | | | $1.75 | |
Net asset value, end of period (x) | | | $27.64 | | | | $21.48 | |
Total return (%) (r)(s)(x) | | | 28.68 | | | | 8.87 | (n) |
Ratios (%) (to average net assets)
and Supplemental data: | | | | | | | | |
Expenses before expense reductions (f) | | | 0.99 | | | | 1.07 | (a) |
Expenses after expense reductions (f) | | | 0.96 | | | | 1.05 | (a) |
Net investment loss | | | (0.24 | ) | | | (0.49 | )(a) |
Portfolio turnover | | | 96 | | | | 128 | |
Net assets at end of period (000 omitted) | | | $244,655 | | | | $174,681 | |
See Notes to Financial Statements
24
Financial Highlights – continued
| | | | | | | | | | | | | | | | | | | | |
| Class 529A | | Years ended 8/31 | |
| | | 2013 | | | 2012 | | | 2011 | | | 2010 | | | 2009 | |
Net asset value, beginning of period | | | $19.70 | | | | $22.22 | | | | $18.71 | | | | $15.97 | | | | $17.70 | |
| Income (loss) from investment operations | | | | | | | | | | | | | | | | | |
Net investment loss (d) | | | $(0.14 | ) | | | $(0.17 | ) | | | $(0.24 | ) | | | $(0.19 | ) | | | $(0.14 | ) |
Net realized and unrealized gain (loss)
on investments and foreign currency | | | 5.69 | | | | 1.75 | | | | 5.16 | | | | 2.93 | | | | (1.59 | )(g) |
Total from investment operations | | | $5.55 | | | | $1.58 | | | | $4.92 | | | | $2.74 | | | | $(1.73 | ) |
| Less distributions declared to shareholders | | | | | | | | | | | | | | | | | |
From net realized gain on investments | | | $— | | | | $(4.10 | ) | | | $(1.41 | ) | | | $— | | | | $— | |
Net asset value, end of period (x) | | | $25.25 | | | | $19.70 | | | | $22.22 | | | | $18.71 | | | | $15.97 | |
Total return (%) (r)(s)(t)(x) | | | 28.17 | | | | 9.80 | | | | 26.09 | | | | 17.16 | | | | (9.77 | ) |
Ratios (%) (to average net assets)
and Supplemental data: | | | | | | | | | | | | | | | | | | | | |
Expenses before expense reductions (f) | | | 1.45 | | | | 1.49 | | | | 1.50 | | | | 1.61 | | | | 1.80 | |
Expenses after expense reductions (f) | | | 1.34 | | | | 1.40 | | | | 1.39 | | | | 1.51 | | | | 1.70 | |
Net investment loss | | | (0.62 | ) | | | (0.89 | ) | | | (0.99 | ) | | | (1.02 | ) | | | (1.15 | ) |
Portfolio turnover | | | 96 | | | | 128 | | | | 205 | | | | 167 | | | | 150 | |
Net assets at end of period (000 omitted) | | | $4,519 | | | | $3,304 | | | | $2,848 | | | | $1,735 | | | | $1,444 | |
| |
| Class 529B | | Years ended 8/31 | |
| | | 2013 | | | 2012 | | | 2011 | | | 2010 | | | 2009 | |
Net asset value, beginning of period | | | $17.51 | | | | $20.35 | | | | $17.36 | | | | $14.92 | | | | $16.65 | |
| Income (loss) from investment operations | | | | | | | | | | | | | | | | | |
Net investment loss (d) | | | $(0.28 | ) | | | $(0.28 | ) | | | $(0.38 | ) | | | $(0.31 | ) | | | $(0.22 | ) |
Net realized and unrealized gain (loss)
on investments and foreign currency | | | 5.04 | | | | 1.54 | | | | 4.78 | | | | 2.75 | | | | (1.51 | )(g) |
Total from investment operations | | | $4.76 | | | | $1.26 | | | | $4.40 | | | | $2.44 | | | | $(1.73 | ) |
| Less distributions declared to shareholders | | | | | | | | | | | | | | | | | |
From net realized gain on investments | | | $— | | | | $(4.10 | ) | | | $(1.41 | ) | | | $— | | | | $— | |
Net asset value, end of period (x) | | | $22.27 | | | | $17.51 | | | | $20.35 | | | | $17.36 | | | | $14.92 | |
Total return (%) (r)(s)(t)(x) | | | 27.18 | | | | 8.99 | | | | 25.08 | | | | 16.35 | | | | (10.39 | ) |
Ratios (%) (to average net assets)
and Supplemental data: | | | | | | | | | | | | | | | | | | | | |
Expenses before expense reductions (f) | | | 2.20 | | | | 2.24 | | | | 2.24 | | | | 2.36 | | | | 2.50 | |
Expenses after expense reductions (f) | | | 2.10 | | | | 2.15 | | | | 2.14 | | | | 2.26 | | | | 2.40 | |
Net investment loss | | | (1.39 | ) | | | (1.64 | ) | | | (1.74 | ) | | | (1.77 | ) | | | (1.85 | ) |
Portfolio turnover | | | 96 | | | | 128 | | | | 205 | | | | 167 | | | | 150 | |
Net assets at end of period (000 omitted) | | | $300 | | | | $217 | | | | $197 | | | | $204 | | | | $175 | |
See Notes to Financial Statements
25
Financial Highlights – continued
| | | | | | | | | | | | | | | | | | | | |
| Class 529C | | Years ended 8/31 | |
| | | 2013 | | | 2012 | | | 2011 | | | 2010 | | | 2009 | |
Net asset value, beginning of period | | | $17.52 | | | | $20.36 | | | | $17.36 | | | | $14.93 | | | | $16.66 | |
| Income (loss) from investment operations | | | | | | | | | | | | | | | | | |
Net investment loss (d) | | | $(0.28 | ) | | | $(0.28 | ) | | | $(0.38 | ) | | | $(0.31 | ) | | | $(0.22 | ) |
Net realized and unrealized gain (loss)
on investments and foreign currency | | | 5.04 | | | | 1.54 | | | | 4.79 | | | | 2.74 | | | | (1.51 | )(g) |
Total from investment operations | | | $4.76 | | | | $1.26 | | | | $4.41 | | | | $2.43 | | | | $(1.73 | ) |
| Less distributions declared to shareholders | | | | | | | | | | | | | | | | | |
From net realized gain on investments | | | $— | | | | $(4.10 | ) | | | $(1.41 | ) | | | $— | | | | $— | |
Net asset value, end of period (x) | | | $22.28 | | | | $17.52 | | | | $20.36 | | | | $17.36 | | | | $14.93 | |
Total return (%) (r)(s)(t)(x) | | | 27.17 | | | | 8.98 | | | | 25.14 | | | | 16.28 | | | | (10.38 | ) |
Ratios (%) (to average net assets)
and Supplemental data: | | | | | | | | | | | | | | | | | | | | |
Expenses before expense reductions (f) | | | 2.20 | | | | 2.24 | | | | 2.25 | | | | 2.36 | | | | 2.48 | |
Expenses after expense reductions (f) | | | 2.11 | | | | 2.15 | | | | 2.14 | | | | 2.26 | | | | 2.38 | |
Net investment loss | | | (1.39 | ) | | | (1.64 | ) | | | (1.74 | ) | | | (1.78 | ) | | | (1.83 | ) |
Portfolio turnover | | | 96 | | | | 128 | | | | 205 | | | | 167 | | | | 150 | |
Net assets at end of period (000 omitted) | | | $1,454 | | | | $906 | | | | $709 | | | | $469 | | | | $393 | |
| (d) | Per share data is based on average shares outstanding. |
| (f) | Ratios do not reflect reductions from fees paid indirectly, if applicable. |
| (g) | The per share amount varies from the net realized and unrealized gain/loss for the period because of the timing of sales of fund shares and the per share amount of realized and unrealized gains and losses at such time. |
| (i) | For the period from the class inception, June 1, 2012, through the stated period end. |
| (r) | Certain expenses have been reduced without which performance would have been lower. |
| (s) | From time to time the fund may receive proceeds from litigation settlements, without which performance would be lower. |
| (t) | Total returns do not include any applicable sales charges. |
| (x) | The net asset values per share and total returns have been calculated on net assets which include adjustments made in accordance with U.S. generally accepted accounting principles required at period end for financial reporting purposes. |
See Notes to Financial Statements
26
NOTES TO FINANCIAL STATEMENTS
(1) Business and Organization
MFS New Discovery Fund (the fund) is a series of MFS Series Trust I (the trust). The trust is organized as a Massachusetts business trust and is registered under the Investment Company Act of 1940, as amended, as an open-end management investment company.
(2) Significant Accounting Policies
General – The preparation of financial statements in conformity with U.S. generally accepted accounting principles requires management to make estimates and assumptions that affect the reported amounts of assets and liabilities, and disclosure of contingent assets and liabilities at the date of the financial statements and the reported amounts of revenues and expenses during the reporting period. Actual results could differ from those estimates. In the preparation of these financial statements, management has evaluated subsequent events occurring after the date of the fund’s Statement of Assets and Liabilities through the date that the financial statements were issued. The fund will generally focus on securities of small size companies which may be more volatile than those of larger companies.
In January 2013, the Financial Accounting Standards Board (FASB) issued Accounting Standards Update 2013-01 (“ASU 2013-01”) entitled Balance Sheet (Topic 210) – Clarifying the Scope of Disclosures about Offsetting Assets and Liabilities which is intended to clarify the scope of Accounting Standards Update 2011-11 (“ASU 2011-11”), Balance Sheet (Topic 210) – Disclosures about Offsetting Assets and Liabilities. Consistent with the effective date for ASU 2011-11, ASU 2013-01 is effective for annual reporting periods beginning on or after January 1, 2013, and interim periods within those annual periods. ASU 2013-01 limits the scope of ASU 2011-11’s disclosure requirements on offsetting to financial assets and financial liabilities related to derivatives, repurchase and reverse repurchase agreements, and securities lending and securities borrowing transactions. Although still evaluating the potential impact of these two ASUs to the fund, management expects that the impact of the fund’s adoption will be limited to additional financial statement disclosures.
In June 2013, FASB issued Accounting Standards Update 2013-08 Financial Services – Investment Companies (Topic 946) – Amendments to the Scope, Measurement, and Disclosure Requirements (“ASU 2013-08”) which is effective for interim and annual reporting periods in fiscal years that begin after December 15, 2013. ASU 2013-08 sets forth a methodology for determining whether an entity should be characterized as an investment company and prescribes fair value accounting for an investment company’s non-controlling ownership interest in another investment company. FASB has determined that a fund registered under the Investment Company Act of 1940 automatically meets ASU 2013-08’s criteria for an investment company. Although still evaluating the potential impacts of ASU 2013-08 to the fund, management expects that the impact of the fund’s adoption will be limited to additional financial statement disclosures.
Investment Valuations – Equity securities, including restricted equity securities, are generally valued at the last sale or official closing price as provided by a third-party
27
Notes to Financial Statements – continued
pricing service on the market or exchange on which they are primarily traded. Equity securities, for which there were no sales reported that day, are generally valued at the last quoted daily bid quotation as provided by a third-party pricing service on the market or exchange on which such securities are primarily traded. Short-term instruments with a maturity at issuance of 60 days or less generally are valued at amortized cost, which approximates market value. Open-end investment companies are generally valued at net asset value per share. Securities and other assets generally valued on the basis of information from a third-party pricing service may also be valued at a broker/dealer bid quotation. Values obtained from third-party pricing services can utilize both transaction data and market information such as yield, quality, coupon rate, maturity, type of issue, trading characteristics, and other market data. The values of foreign securities and other assets and liabilities expressed in foreign currencies are converted to U.S. dollars using the mean of bid and asked prices for rates provided by a third-party pricing service.
The Board of Trustees has delegated primary responsibility for determining or causing to be determined the value of the fund’s investments (including any fair valuation) to the adviser pursuant to valuation policies and procedures approved by the Board. If the adviser determines that reliable market quotations are not readily available, investments are valued at fair value as determined in good faith by the adviser in accordance with such procedures under the oversight of the Board of Trustees. Under the fund’s valuation policies and procedures, market quotations are not considered to be readily available for most types of debt instruments and floating rate loans and many types of derivatives. These investments are generally valued at fair value based on information from third-party pricing services. In addition, investments may be valued at fair value if the adviser determines that an investment’s value has been materially affected by events occurring after the close of the exchange or market on which the investment is principally traded (such as foreign exchange or market) and prior to the determination of the fund’s net asset value, or after the halting of trading of a specific security where trading does not resume prior to the close of the exchange or market on which the security is principally traded. Events that occur on a frequent basis after foreign markets close (such as developments in foreign markets and significant movements in the U.S. markets) and prior to the determination of the fund’s net asset value may be deemed to have a material effect on the value of securities traded in foreign markets. Accordingly, the fund’s foreign equity securities may often be valued at fair value. The adviser generally relies on third-party pricing services or other information (such as the correlation with price movements of similar securities in the same or other markets; the type, cost and investment characteristics of the security; the business and financial condition of the issuer; and trading and other market data) to assist in determining whether to fair value and at what value to fair value an investment. The value of an investment for purposes of calculating the fund’s net asset value can differ depending on the source and method used to determine value. When fair valuation is used, the value of an investment used to determine the fund’s net asset value may differ from quoted or published prices for the same investment. There can be no assurance that the fund could obtain the fair value assigned to an investment if it were to sell the investment at the same time at which the fund determines its net asset value per share.
28
Notes to Financial Statements – continued
Various inputs are used in determining the value of the fund’s assets or liabilities. These inputs are categorized into three broad levels. In certain cases, the inputs used to measure fair value may fall into different levels of the fair value hierarchy. In such cases, an investment’s level within the fair value hierarchy is based on the lowest level of input that is significant to the fair value measurement. The fund’s assessment of the significance of a particular input to the fair value measurement in its entirety requires judgment, and considers factors specific to the investment. Level 1 includes unadjusted quoted prices in active markets for identical assets or liabilities. Level 2 includes other significant observable market-based inputs (including quoted prices for similar securities, interest rates, prepayment speed, and credit risk). Level 3 includes unobservable inputs, which may include the adviser’s own assumptions in determining the fair value of investments. The following is a summary of the levels used as of August 31, 2013 in valuing the fund’s assets or liabilities:
| | | | | | | | | | | | | | | | |
| Investments at Value | | Level 1 | | | Level 2 | | | Level 3 | | | Total | |
| Equity Securities: | | | | | | | | | | | | | | | | |
United States | | | $1,796,940,590 | | | | $— | | | | $— | | | | $1,796,940,590 | |
Greece | | | 57,388,304 | | | | — | | | | — | | | | 57,388,304 | |
Israel | | | 36,812,562 | | | | — | | | | — | | | | 36,812,562 | |
Brazil | | | 35,447,151 | | | | — | | | | — | | | | 35,447,151 | |
Australia | | | — | | | | 24,382,577 | | | | — | | | | 24,382,577 | |
Netherlands | | | 22,091,243 | | | | — | | | | — | | | | 22,091,243 | |
Argentina | | | 19,923,935 | | | | — | | | | — | | | | 19,923,935 | |
South Africa | | | 16,279,835 | | | | — | | | | — | | | | 16,279,835 | |
India | | | 13,468,059 | | | | — | | | | — | | | | 13,468,059 | |
Other countries | | | 5,340,447 | | | | — | | | | — | | | | 5,340,447 | |
| Mutual Funds | | | 58,644,942 | | | | — | | | | — | | | | 58,644,942 | |
| Total Investments | | | $2,062,337,068 | | | | $24,382,577 | | | | $— | | | | $2,086,719,645 | |
For further information regarding security characteristics, see the Portfolio of Investments.
Of the level 2 investments presented above, equity investments amounting to $24,382,577 would have been considered level 1 investments at the beginning of the period. The primary reason for changes in the classifications between levels 1 and 2 occurs when foreign equity securities are fair valued using other observable market-based inputs in place of the closing exchange price due to events occurring after the close of the exchange or market on which the investment is principally traded. The fund’s foreign equity securities may often be valued at fair value. The fund’s policy is to recognize transfers between the levels as of the end of the period.
Foreign Currency Translation – Purchases and sales of foreign investments, income, and expenses are converted into U.S. dollars based upon currency exchange rates prevailing on the respective dates of such transactions or on the reporting date for foreign denominated receivables and payables. Gains and losses attributable to foreign currency exchange rates on sales of securities are recorded for financial statement purposes as net realized gains and losses on investments. Gains and losses attributable to foreign exchange rate movements on receivables, payables, income and expenses are recorded for financial statement purposes as foreign currency transaction gains and
29
Notes to Financial Statements – continued
losses. That portion of both realized and unrealized gains and losses on investments that results from fluctuations in foreign currency exchange rates is not separately disclosed.
Security Loans – State Street Bank and Trust Company (“State Street”), as lending agent, loans the securities of the fund to certain qualified institutions (the “Borrowers”) approved by the fund. The loans are collateralized by cash and/or U.S. Treasury and federal agency obligations in an amount typically at least equal to the market value of the securities loaned. The market value of the loaned securities is determined at the close of business of the fund and any additional required collateral is delivered to the fund on the next business day. State Street provides the fund with indemnification against Borrower default. The fund bears the risk of loss with respect to the investment of cash collateral. On loans collateralized by cash, the cash collateral is invested in a money market fund or short-term securities. Collateral for securities loaned is held at carrying value, which approximates fair value. If the collateral for securities loaned was carried at fair value, its fair value would be considered level 2 under the fair value hierarchy. A portion of the income generated upon investment of the collateral is remitted to the Borrowers, and the remainder is allocated between the fund and the lending agent. On loans collateralized by U.S. Treasury and/or federal agency obligations, a fee is received from the Borrower, and is allocated between the fund and the lending agent. Income from securities lending is separately reported in the Statement of Operations. The dividend and interest income earned on the securities loaned is accounted for in the same manner as other dividend and interest income.
Indemnifications – Under the fund’s organizational documents, its officers and Trustees may be indemnified against certain liabilities and expenses arising out of the performance of their duties to the fund. Additionally, in the normal course of business, the fund enters into agreements with service providers that may contain indemnification clauses. The fund’s maximum exposure under these agreements is unknown as this would involve future claims that may be made against the fund that have not yet occurred.
Investment Transactions and Income – Investment transactions are recorded on the trade date. Dividends received in cash are recorded on the ex-dividend date. Certain dividends from foreign securities will be recorded when the fund is informed of the dividend if such information is obtained subsequent to the ex-dividend date. Dividend payments received in additional securities are recorded on the ex-dividend date in an amount equal to the value of the security on such date.
The fund may receive proceeds from litigation settlements. Any proceeds received from litigation involving portfolio holdings are reflected in the Statement of Operations in realized gain/loss if the security has been disposed of by the fund or in unrealized gain/loss if the security is still held by the fund. Any other proceeds from litigation not related to portfolio holdings are reflected as other income in the Statement of Operations.
Fees Paid Indirectly – The fund’s custody fee may be reduced according to an arrangement that measures the value of cash deposited with the custodian by the fund. This amount, for the year ended August 31, 2013, is shown as a reduction of total expenses in the Statement of Operations.
30
Notes to Financial Statements – continued
Tax Matters and Distributions – The fund intends to qualify as a regulated investment company, as defined under Subchapter M of the Internal Revenue Code, and to distribute all of its taxable income, including realized capital gains. As a result, no provision for federal income tax is required. The fund’s federal tax returns, when filed, will remain subject to examination by the Internal Revenue Service for a three year period. Foreign taxes have been accrued by the fund in the accompanying financial statements in accordance with the applicable foreign tax law. Foreign income taxes may be withheld by certain countries in which the fund invests.
Distributions to shareholders are recorded on the ex-dividend date. Income and capital gain distributions are determined in accordance with income tax regulations, which may differ from U.S. generally accepted accounting principles. Certain capital accounts in the financial statements are periodically adjusted for permanent differences in order to reflect their tax character. These adjustments have no impact on net assets or net asset value per share. Temporary differences which arise from recognizing certain items of income, expense, gain or loss in different periods for financial statement and tax purposes will reverse at some time in the future. Distributions in excess of net investment income or net realized gains are temporary overdistributions for financial statement purposes resulting from differences in the recognition or classification of income or distributions for financial statement and tax purposes.
Book/tax differences primarily relate to wash sale loss deferrals and treating a portion of the proceeds from redemptions as a distribution for tax purposes.
The tax character of distributions declared to shareholders for the last two fiscal years is as follows:
| | | | | | | | |
| | | 8/31/13 | | | 8/31/12 | |
| Ordinary income (including any short-term capital gains) | | | $— | | | | $178,380,330 | |
| Long-term capital gains | | | — | | | | 30,335,072 | |
| Total distributions | | | $— | | | | $208,715,402 | |
The federal tax cost and the tax basis components of distributable earnings were as follows:
| | | | |
| As of 8/31/13 | | | |
| Cost of investments | | | $1,822,597,825 | |
| Gross appreciation | | | 352,921,732 | |
| Gross depreciation | | | (88,799,912 | ) |
| Net unrealized appreciation (depreciation) | | | $264,121,820 | |
| Undistributed ordinary income | | | 46,692,710 | |
| Undistributed long-term capital gain | | | 52,952,654 | |
| Other temporary differences | | | (5,077 | ) |
Multiple Classes of Shares of Beneficial Interest – The fund offers multiple classes of shares, which differ in their respective distribution, service, and program manager fees. The fund’s income, realized and unrealized gain (loss), and common expenses are allocated to shareholders based on the daily net assets of each class. Dividends are declared separately for each class. Differences in per share dividend rates are generally
31
Notes to Financial Statements – continued
due to differences in separate class expenses. Class B and Class 529B shares will convert to Class A and Class 529A shares, respectively, approximately eight years after purchase. The fund’s distributions declared to shareholders as reported in the Statements of Changes in Net Assets are presented by class as follows:
| | | | | | | | |
| | | From net realized gain on
investments | |
| | | Year
ended
8/31/13 | | | Year
ended
8/31/12 | |
| Class A | | | $— | | | | $99,420,129 | |
| Class B | | | — | | | | 6,304,306 | |
| Class C | | | — | | | | 18,068,323 | |
| Class I | | | — | | | | 55,378,566 | |
| Class R1 | | | — | | | | 1,433,390 | |
| Class R2 | | | — | | | | 4,989,580 | |
| Class R3 | | | — | | | | 7,142,920 | |
| Class R4 | | | — | | | | 15,256,911 | |
| Class 529A | | | — | | | | 525,456 | |
| Class 529B | | | — | | | | 41,844 | |
| Class 529C | | | — | | | | 153,977 | |
| Total | | | $— | | | | $208,715,402 | |
(3) Transactions with Affiliates
Investment Adviser – The fund has an investment advisory agreement with MFS to provide overall investment management and related administrative services and facilities to the fund. The management fee is computed daily and paid monthly at an annual rate of 0.90% of the fund’s average daily net assets. The investment adviser has agreed in writing to reduce its management fee to 0.80% of average daily net assets in excess of $1 billion up to $2.5 billion and 0.75% of average daily net assets in excess of $2.5 billion. This written agreement will continue until modified by the fund’s Board of Trustees, but such agreement will continue at least until December 31, 2014. For the year ended August 31, 2013, this management fee reduction amounted to $524,541, which is shown as a reduction of total expenses in the Statement of Operations. Effective April 1, 2013, MFS has agreed in writing to reduce its management fee by a specified amount if certain MFS mutual fund assets exceed thresholds agreed to by MFS and the fund’s Board of Trustees. For the period April 1, 2013 through August 31, 2013, this management fee reduction amounted to $4,030, which is shown as a reduction of total expenses in the Statement of Operations. The management fee incurred for the year ended August 31, 2013 was equivalent to an annual effective rate of 0.87% of the fund’s average daily net assets.
The investment adviser has agreed in writing to pay a portion of the fund’s total annual operating expenses, exclusive of interest, taxes, extraordinary expenses, brokerage and transaction costs, and investment-related expenses, such that total annual fund operating expenses do not exceed the following rates annually of each class’s average daily net assets:
| | | | | | | | | | | | | | | | | | | | | | |
| Classes |
| A | | B | | C | | I | | R1 | | R2 | | R3 | | R4 | | R5 | | 529A | | 529B | | 529C |
| 1.41% | | 2.16% | | 2.16% | | 1.16% | | 2.16% | | 1.66% | | 1.41% | | 1.16% | | 1.10% | | 1.46% | | 2.21% | | 2.21% |
32
Notes to Financial Statements – continued
This written agreement will terminate on December 31, 2013. For the year ended August 31, 2013, the fund’s actual operating expenses did not exceed the limit and therefore, the investment adviser did not pay any portion of the fund’s expenses related to this agreement.
Distributor – MFS Fund Distributors, Inc. (MFD), a wholly-owned subsidiary of MFS, as distributor, received $223,364 and $2,599 for the year ended August 31, 2013, as its portion of the initial sales charge on sales of Class A and Class 529A shares of the fund, respectively.
The Board of Trustees has adopted a distribution plan for certain class shares pursuant to Rule 12b-1 of the Investment Company Act of 1940.
The fund’s distribution plan provides that the fund will pay MFD for services provided by MFD and financial intermediaries in connection with the distribution and servicing of certain share classes. One component of the plan is a distribution fee paid to MFD and another component of the plan is a service fee paid to MFD. MFD may subsequently pay all, or a portion, of the distribution and/or service fees to financial intermediaries.
Distribution Plan Fee Table:
| | | | | | | | | | | | | | | | | | | | |
| | | Distribution
Fee Rate (d) | | | Service
Fee Rate (d) | | | Total
Distribution
Plan (d) | | | Annual
Effective
Rate (e) | | | Distribution
and Service
Fee | |
| Class A | | | — | | | | 0.25% | | | | 0.25% | | | | 0.25% | | | | $1,584,905 | |
| Class B | | | 0.75% | | | | 0.25% | | | | 1.00% | | | | 1.00% | | | | 333,140 | |
| Class C | | | 0.75% | | | | 0.25% | | | | 1.00% | | | | 1.00% | | | | 1,071,153 | |
| Class R1 | | | 0.75% | | | | 0.25% | | | | 1.00% | | | | 1.00% | | | | 79,595 | |
| Class R2 | | | 0.25% | | | | 0.25% | | | | 0.50% | | | | 0.50% | | | | 223,924 | |
| Class R3 | | | — | | | | 0.25% | | | | 0.25% | | | | 0.25% | | | | 200,882 | |
| Class 529A | | | — | | | | 0.25% | | | | 0.25% | | | | 0.23% | | | | 9,601 | |
| Class 529B | | | 0.75% | | | | 0.25% | | | | 1.00% | | | | 0.99% | | | | 2,576 | |
| Class 529C | | | 0.75% | | | | 0.25% | | | | 1.00% | | | | 1.00% | | | | 11,956 | |
| Total Distribution and Service Fees | | | | $3,517,732 | |
| (d) | In accordance with the distribution plan for certain classes, the fund pays distribution and/or service fees equal to these annual percentage rates of each class’s average daily net assets. The distribution and service fee rates disclosed by class represent the current rates in effect at the end of the reporting period. |
| (e) | The annual effective rates represent actual fees incurred under the distribution plan for the year ended August 31, 2013 based on each class’s average daily net assets. Effective January 1, 2013, MFD has voluntarily agreed to rebate a portion of each class’s 0.25% service fee attributable to accounts for which MFD retains the 0.25% service fee except for accounts attributable to MFS or its subsidiaries’ seed money. For the period January 1, 2013 through August 31, 2013, this rebate amounted to $19,527, $245, $160, $1,925, $920, and $19 for Class A, Class B, Class C, Class R3, Class 529A, and Class 529B, respectively, and is reflected as a reduction of total expenses in the Statement of Operations. |
Certain Class A shares are subject to a contingent deferred sales charge (CDSC) in the event of a shareholder redemption within 18 months of purchase for shares purchased on or after August 1, 2012, and within 24 months of purchase for shares purchased prior to August 1, 2012. Class C and Class 529C shares are subject to a CDSC in the event of a shareholder redemption within 12 months of purchase. Class B and Class
33
Notes to Financial Statements – continued
529B shares are subject to a CDSC in the event of a shareholder redemption within six years of purchase. All contingent deferred sales charges are paid to MFD and during the year ended August 31, 2013, were as follows:
| | | | |
| | | Amount | |
| Class A | | | $2,783 | |
| Class B | | | 41,313 | |
| Class C | | | 11,286 | |
| Class 529B | | | 1 | |
| Class 529C | | | — | |
The fund has entered into and may from time to time enter into contracts with program managers and other parties which administer the tuition programs through which an investment in the fund’s 529 share classes is made. The fund has entered into an agreement with MFD pursuant to which MFD receives an annual fee of up to 0.10% of the average daily net assets attributable to each 529 share class. MFD has agreed to waive a portion of this fee in an amount equal to 0.05% of the average daily net assets for each 529 share class. This waiver agreement will expire on December 31, 2014, unless MFD elects to extend the waiver. For the year ended August 31, 2013, this waiver amounted to $2,647 and is reflected as a reduction of total expenses in the Statement of Operations. The program manager fee incurred for the year ended August 31, 2013 was equivalent to an annual effective rate of 0.05% of the average daily net assets attributable to each 529 share class. The services provided by MFD, or a third party with which MFD contracts, include recordkeeping and tax reporting and account services, as well as services designed to maintain the program’s compliance with the Internal Revenue Code and other regulatory requirements. Program manager fees and waivers for the year ended August 31, 2013, were as follows:
| | | | | | | | |
| | | Fee | | | Waiver | |
| Class 529A | | | $3,840 | | | | $1,920 | |
| Class 529B | | | 258 | | | | 129 | |
| Class 529C | | | 1,195 | | | | 598 | |
| Total Program Manager Fees and Waivers | | | $5,293 | | | | $2,647 | |
Shareholder Servicing Agent – MFS Service Center, Inc. (MFSC), a wholly-owned subsidiary of MFS, receives a fee from the fund for its services as shareholder servicing agent calculated as a percentage of the average daily net assets of the fund as determined periodically under the supervision of the fund’s Board of Trustees. For the year ended August 31, 2013, the fee was $348,993, which equated to 0.0229% annually of the fund’s average daily net assets. MFSC also receives payment from the fund for out-of-pocket expenses, sub-accounting and other shareholder servicing costs which may be paid to affiliated and unaffiliated service providers. Class R5 shares do not incur sub-accounting fees. For the year ended August 31, 2013, these out-of-pocket expenses, sub-accounting and other shareholder servicing costs amounted to $1,624,715.
Administrator – MFS provides certain financial, legal, shareholder communications, compliance, and other administrative services to the fund. Under an administrative services agreement, the fund partially reimburses MFS the costs incurred to provide these services. The fund is charged an annual fixed amount of $17,500 plus a fee
34
Notes to Financial Statements – continued
based on average daily net assets. The administrative services fee incurred for the year ended August 31, 2013 was equivalent to an annual effective rate of 0.0133% of the fund’s average daily net assets.
Trustees’ and Officers’ Compensation – The fund pays compensation to independent Trustees in the form of a retainer, attendance fees, and additional compensation to Board and Committee chairpersons. The fund does not pay compensation directly to Trustees or officers of the fund who are also officers of the investment adviser, all of whom receive remuneration for their services to the fund from MFS. Certain officers and Trustees of the fund are officers or directors of MFS, MFD, and MFSC.
Prior to December 31, 2001, the fund had an unfunded defined benefit plan (“DB plan”) for independent Trustees. As of December 31, 2001, the Board took action to terminate the DB plan with respect to then-current and any future independent Trustees, such that the DB plan covers only certain of those former independent Trustees who retired on or before December 31, 2001. The DB plan resulted in a pension expense of $180 and is included in independent Trustees’ compensation for the year ended August 31, 2013. The liability for deferred retirement benefits payable to certain independent Trustees under the DB plan amounted to $4,733 at August 31, 2013, and is included in “Payable for independent Trustees’ compensation” in the Statement of Assets and Liabilities.
Other – This fund and certain other funds managed by MFS (the funds) have entered into services agreements (the Agreements) which provide for payment of fees by the funds to Tarantino LLC and Griffin Compliance LLC in return for the provision of services of an Independent Chief Compliance Officer (ICCO) and Assistant ICCO, respectively, for the funds. The ICCO and Assistant ICCO are officers of the funds and the sole members of Tarantino LLC and Griffin Compliance LLC, respectively. The funds can terminate the Agreements with Tarantino LLC and Griffin Compliance LLC at any time under the terms of the Agreements. For the year ended August 31, 2013, the aggregate fees paid by the fund to Tarantino LLC and Griffin Compliance LLC were $9,881 and are included in “Miscellaneous” expense in the Statement of Operations. MFS has agreed to reimburse the fund for a portion of the payments made by the fund in the amount of $4,226, which is shown as a reduction of total expenses in the Statement of Operations. Additionally, MFS has agreed to bear all expenses associated with office space, other administrative support, and supplies provided to the ICCO and Assistant ICCO.
The fund invests in the MFS Institutional Money Market Portfolio which is managed by MFS and seeks current income consistent with preservation of capital and liquidity. Income earned on this investment is included in “Dividends from underlying affiliated funds” in the Statement of Operations. This money market fund does not pay a management fee to MFS.
On May 31, 2012, MFS purchased 5,068 shares of Class R5 for an aggregate amount of $100,000.
(4) Portfolio Securities
Purchases and sales of investments, other than short-term obligations, aggregated $1,861,038,270 and $1,458,761,081, respectively.
35
Notes to Financial Statements – continued
(5) Shares of Beneficial Interest
The fund’s Declaration of Trust permits the Trustees to issue an unlimited number of full and fractional shares of beneficial interest. Transactions in fund shares were as follows:
| | | | | | | | | | | | | | | | |
| | | Year ended
8/31/13 | | | Year ended
8/31/12 (i) | |
| | | Shares | | | Amount | | | Shares | | | Amount | |
| Shares sold | | | | | | | | | | | | | | | | |
Class A | | | 13,280,657 | | | | $317,286,546 | | | | 8,858,818 | | | | $175,776,653 | |
Class B | | | 413,203 | | | | 8,490,226 | | | | 400,753 | | | | 7,115,653 | |
Class C | | | 2,088,673 | | | | 43,663,588 | | | | 1,508,319 | | | | 26,246,463 | |
Class I | | | 9,044,050 | | | | 226,138,227 | | | | 5,957,386 | | | | 122,417,695 | |
Class R1 | | | 119,137 | | | | 2,448,027 | | | | 138,140 | | | | 2,476,394 | |
Class R2 | | | 1,281,338 | | | | 28,806,578 | | | | 1,059,597 | | | | 20,115,423 | |
Class R3 | | | 2,302,409 | | | | 53,724,050 | | | | 2,162,572 | | | | 41,914,938 | |
Class R4 | | | 2,656,356 | | | | 63,852,249 | | | | 4,077,139 | | | | 81,702,018 | |
Class R5 | | | 1,766,087 | | | | 42,150,539 | | | | 8,463,019 | | | | 167,200,800 | |
Class 529A | | | 34,989 | | | | 806,060 | | | | 24,840 | | | | 473,601 | |
Class 529B | | | 3,557 | | | | 69,765 | | | | 2,413 | | | | 42,428 | |
Class 529C | | | 18,424 | | | | 354,241 | | | | 11,978 | | | | 206,930 | |
| | | 33,008,880 | | | | $787,790,096 | | | | 32,664,974 | | | | $645,688,996 | |
| | | |
Shares issued to shareholders in
reinvestment of distributions | | | | | | | | | | | | | |
Class A | | | — | | | | $— | | | | 4,208,808 | | | | $74,032,927 | |
Class B | | | — | | | | — | | | | 354,912 | | | | 5,582,759 | |
Class C | | | — | | | | — | | | | 807,632 | | | | 12,720,205 | |
Class I | | | — | | | | — | | | | 2,058,795 | | | | 38,499,472 | |
Class R1 | | | — | | | | — | | | | 91,590 | | | | 1,433,390 | |
Class R2 | | | — | | | | — | | | | 243,767 | | | | 4,158,664 | |
Class R3 | | | — | | | | — | | | | 406,309 | | | | 7,142,920 | |
Class R4 | | | — | | | | — | | | | 842,465 | | | | 15,164,363 | |
Class 529A | | | — | | | | — | | | | 30,586 | | | | 525,456 | |
Class 529B | | | — | | | | — | | | | 2,724 | | | | 41,844 | |
Class 529C | | | — | | | | — | | | | 10,017 | | | | 153,977 | |
| | | — | | | | $— | | | | 9,057,605 | | | | $159,455,977 | |
36
Notes to Financial Statements – continued
| | | | | | | | | | | | | | | | |
| | | Year ended
8/31/13 | | | Year ended
8/31/12 (i) | |
| | | Shares | | | Amount | | | Shares | | | Amount | |
| Shares reacquired | | | | | | | | | | | | | | | | |
Class A | | | (6,057,209 | ) | | | $(136,602,612 | ) | | | (14,471,666 | ) | | | $(292,040,337 | ) |
Class B | | | (440,250 | ) | | | (8,819,700 | ) | | | (659,423 | ) | | | (11,595,176 | ) |
Class C | | | (1,172,917 | ) | | | (23,417,729 | ) | | | (1,842,148 | ) | | | (32,728,132 | ) |
Class I | | | (3,638,323 | ) | | | (86,932,110 | ) | | | (13,683,903 | ) | | | (276,958,702 | ) |
Class R1 | | | (144,665 | ) | | | (2,881,900 | ) | | | (143,450 | ) | | | (2,531,852 | ) |
Class R2 | | | (681,686 | ) | | | (14,889,511 | ) | | | (580,642 | ) | | | (11,240,311 | ) |
Class R3 | | | (1,056,634 | ) | | | (23,946,508 | ) | | | (816,514 | ) | | | (15,912,499 | ) |
Class R4 | | | (2,063,176 | ) | | | (48,545,028 | ) | | | (1,474,168 | ) | | | (29,566,876 | ) |
Class R5 | | | (1,046,242 | ) | | | (25,688,737 | ) | | | (332,295 | ) | | | (6,826,002 | ) |
Class 529A | | | (23,748 | ) | | | (532,514 | ) | | | (15,891 | ) | | | (304,266 | ) |
Class 529B | | | (2,507 | ) | | | (50,279 | ) | | | (2,408 | ) | | | (39,477 | ) |
Class 529C | | | (4,901 | ) | | | (99,988 | ) | | | (5,113 | ) | | | (88,109 | ) |
| | | (16,332,258 | ) | | | $(372,406,616 | ) | | | (34,027,621 | ) | | | $(679,831,739 | ) |
| | | | |
| Net change | | | | | | | | | | | | | | | | |
Class A | | | 7,223,448 | | | | $180,683,934 | | | | (1,404,040 | ) | | | $(42,230,757 | ) |
Class B | | | (27,047 | ) | | | (329,474 | ) | | | 96,242 | | | | 1,103,236 | |
Class C | | | 915,756 | | | | 20,245,859 | | | | 473,803 | | | | 6,238,536 | |
Class I | | | 5,405,727 | | | | 139,206,117 | | | | (5,667,722 | ) | | | (116,041,535 | ) |
Class R1 | | | (25,528 | ) | | | (433,873 | ) | | | 86,280 | | | | 1,377,932 | |
Class R2 | | | 599,652 | | | | 13,917,067 | | | | 722,722 | | | | 13,033,776 | |
Class R3 | | | 1,245,775 | | | | 29,777,542 | | | | 1,752,367 | | | | 33,145,359 | |
Class R4 | | | 593,180 | | | | 15,307,221 | | | | 3,445,436 | | | | 67,299,505 | |
Class R5 | | | 719,845 | | | | 16,461,802 | | | | 8,130,724 | | | | 160,374,798 | |
Class 529A | | | 11,241 | | | | 273,546 | | | | 39,535 | | | | 694,791 | |
Class 529B | | | 1,050 | | | | 19,486 | | | | 2,729 | | | | 44,795 | |
Class 529C | | | 13,523 | | | | 254,253 | | | | 16,882 | | | | 272,798 | |
| | | 16,676,622 | | | | $415,383,480 | | | | 7,694,958 | | | | $125,313,234 | |
| (i) | For Class R5, the period is from inception, June 1, 2012, through the stated period end. |
The fund is one of several mutual funds in which the MFS funds-of-funds may invest. The MFS funds-of-funds do not invest in the underlying MFS funds for the purpose of exercising management or control. At the end of the period, the MFS Moderate Allocation Fund, MFS Growth Allocation Fund, MFS Aggressive Growth Allocation Fund, and MFS Conservative Allocation Fund were the owners of record of approximately 4%, 4%, 2%, and 1%, respectively, of the value of outstanding voting shares of the fund. In addition, the MFS Lifetime 2010 Fund, MFS Lifetime 2015 Fund, MFS Lifetime 2020 Fund, MFS Lifetime 2025 Fund, MFS Lifetime 2030 Fund, MFS Lifetime 2035 Fund, MFS Lifetime 2040 Fund, MFS Lifetime 2045 Fund, MFS Lifetime 2050 Fund, MFS Lifetime 2055 Fund, and MFS Lifetime Retirement Income Fund were each the owners of record of less than 1% of the value of outstanding voting shares of the fund.
37
Notes to Financial Statements – continued
(6) Line of Credit
The fund and certain other funds managed by MFS participate in a $1.1 billion unsecured committed line of credit, subject to a $1 billion sublimit, provided by a syndication of banks under a credit agreement. Borrowings may be made for temporary financing needs. Interest is charged to each fund, based on its borrowings, generally at a rate equal to the higher of the Federal Reserve funds rate or one month LIBOR plus an agreed upon spread. A commitment fee, based on the average daily, unused portion of the committed line of credit, is allocated among the participating funds at the end of each calendar quarter. In addition, the fund and other funds managed by MFS have established unsecured uncommitted borrowing arrangements with certain banks for temporary financing needs. Interest is charged to each fund, based on its borrowings, at a rate equal to the Federal Reserve funds rate plus an agreed upon spread. For the year ended August 31, 2013, the fund’s commitment fee and interest expense were $7,537 and $0, respectively, and are included in “Miscellaneous” expense in the Statement of Operations.
(7) Transactions in Underlying Affiliated Funds-Affiliated Issuers
An affiliated issuer may be considered one in which the fund owns 5% or more of the outstanding voting securities, or a company which is under common control. For the purposes of this report, the fund assumes the following to be affiliated issuers:
| | | | | | | | | | | | | | | | |
| Underlying Affiliated Fund | | Beginning
Shares/Par
Amount | | | Acquisitions
Shares/Par
Amount | | | Dispositions
Shares/Par
Amount | | | Ending
Shares/Par
Amount | |
MFS Institutional Money
Market Portfolio | | | 1,725,717 | | | | 586,452,609 | | | | (576,269,972 | ) | | | 11,908,354 | |
| | | | |
| Underlying Affiliated Fund | | Realized
Gain (Loss) | | | Capital Gain
Distributions | | | Dividend
Income | | | Ending
Value | |
MFS Institutional Money
Market Portfolio | | | $— | | | | $— | | | | $15,014 | | | | $11,908,354 | |
| | | | |
| Other Affiliated Issuers | | Beginning
Shares/Par
Amount | | | Acquisitions
Shares/Par
Amount | | | Dispositions
Shares/Par
Amount | | | Ending
Shares/Par
Amount | |
| Citi Trends, Inc. | | | 1,075,873 | | | | 257,470 | | | | (20,800 | ) | | | 1,312,543 | |
| Constant Contact, Inc. | | | 884,165 | | | | 1,345,230 | | | | (120,260 | ) | | | 2,109,135 | |
| Model N, Inc. | | | — | | | | 1,874,328 | | | | (40,340 | ) | | | 1,833,988 | |
| SciQuest, Inc. | | | 1,035,584 | | | | 326,841 | | | | (166,160 | ) | | | 1,196,265 | |
| Uroplasty, Inc. | | | 1,389,553 | | | | 204,630 | | | | (26,710 | ) | | | 1,567,473 | |
| | | | |
| Other Affiliated Issuers | | Realized
Gain (Loss) | | | Capital Gain
Distributions | | | Dividend
Income | | | Ending
Value | |
| Citi Trends, Inc. | | | $(443,170 | ) | | | $— | | | | $— | | | | $21,302,573 | |
| Constant Contact, Inc. | | | (618,816 | ) | | | — | | | | — | | | | 40,347,753 | |
| Model N, Inc. | | | 22,637 | | | | — | | | | — | | | | 26,427,767 | |
| SciQuest, Inc. | | | 614,294 | | | | — | | | | — | | | | 24,882,312 | |
| Uroplasty, Inc. | | | (113,274 | ) | | | — | | | | — | | | | 5,674,252 | |
| | | | | | | | | | | | | | | | |
| | | $(538,329 | ) | | | $— | | | | $— | | | | $118,634,657 | |
| | | | | | | | | | | | | | | | |
38
REPORT OF INDEPENDENT REGISTERED PUBLIC ACCOUNTING FIRM
To the Board of Trustees of MFS Series Trust I and Shareholders of MFS New Discovery Fund:
We have audited the accompanying statement of assets and liabilities of MFS New Discovery Fund (the Fund) (one of the portfolios comprising MFS Series Trust I), including the portfolio of investments, as of August 31, 2013, and the related statement of operations for the year then ended, the statements of changes in net assets for each of the two years in the period then ended, and the financial highlights for each of the periods indicated therein. These financial statements and financial highlights are the responsibility of the Fund’s management. Our responsibility is to express an opinion on these financial statements and financial highlights based on our audits.
We conducted our audits in accordance with the standards of the Public Company Accounting Oversight Board (United States). Those standards require that we plan and perform the audit to obtain reasonable assurance about whether the financial statements and financial highlights are free of material misstatement. We were not engaged to perform an audit of the Fund’s internal control over financial reporting. Our audits included consideration of internal control over financial reporting as a basis for designing audit procedures that are appropriate in the circumstances, but not for the purpose of expressing an opinion on the effectiveness of the Fund’s internal control over financial reporting. Accordingly, we express no such opinion. An audit also includes examining, on a test basis, evidence supporting the amounts and disclosures in the financial statements and financial highlights, assessing the accounting principles used and significant estimates made by management, and evaluating the overall financial statement presentation. Our procedures included confirmation of securities owned as of August 31, 2013, by correspondence with the custodian and others or by other appropriate auditing procedures where replies from others were not received. We believe that our audits provide a reasonable basis for our opinion.
In our opinion, the financial statements and financial highlights referred to above present fairly, in all material respects, the financial position of MFS New Discovery Fund at August 31, 2013, the results of its operations for the year then ended, the changes in its net assets for each of the two years in the period then ended, and its financial highlights for each of the periods indicated therein, in conformity with U.S. generally accepted accounting principles.

Boston, Massachusetts
October 17, 2013
39
TRUSTEES AND OFFICERS — IDENTIFICATION AND BACKGROUND
The Trustees and Officers of the Trust, as of October 1, 2013, are listed below, together with their principal occupations during the past five years. (Their titles may have varied during that period.) The address of each Trustee and officer is 111 Huntington Avenue, Boston, Massachusetts 02199-7618.
| | | | | | | | |
Name, Age | | Position(s) Held with Fund | | Trustee/Officer
Since (h) | | Principal
Occupations During the Past Five Years | | Other Directorships (j) |
| INTERESTED TRUSTEES |
Robert J. Manning (k) (age 49) | | Trustee | | February 2004 | | Massachusetts Financial Services Company, Chairman, Chief Executive Officer and Director; President (until 2009); Chief Investment Officer (until 2010) | | N/A |
| INDEPENDENT TRUSTEES |
David H. Gunning (age 71) | | Trustee and Chair of Trustees | | January 2004 | | Private investor | | Lincoln Electric Holdings, Inc. (welding equipment manufacturer), Director; Development Alternatives, Inc. (consulting), Director/Non-Executive Chairman; Portman Limited (mining), Director (until 2008) |
Robert E. Butler (age 71) | | Trustee | | January 2006 | | Consultant – investment company industry regulatory and compliance matters | | N/A |
Maureen R. Goldfarb (age 58) | | Trustee | | January 2009 | | Private investor | | N/A |
William R. Gutow (age 72) | | Trustee | | December 1993 | | Private investor and real estate consultant; Capitol Entertainment Management Company (video franchise), Vice Chairman | | Texas Donuts (donut franchise), Vice Chairman (until 2010) |
40
Trustees and Officers – continued
| | | | | | | | |
Name, Age | | Position(s) Held with Fund | | Trustee/Officer
Since (h) | | Principal
Occupations During the Past Five Years | | Other Directorships (j) |
Michael Hegarty (age 68) | | Trustee | | December 2004 | | Private investor | | Brookfield Office Properties, Inc. (real estate), Director; Rouse Properties Inc. (real estate), Director; Capmark Financial Group Inc. (real estate), Director |
John P. Kavanaugh (age 58) | | Trustee | | January 2009 | | Private investor | | N/A |
J. Dale Sherratt (age 75) | | Trustee | | June 1989 | | Insight Resources, Inc. (acquisition planning specialists), President; Wellfleet Investments (investor in health care companies), Managing General Partner | | N/A |
Laurie J. Thomsen (age 56) | | Trustee | | March 2005 | | Private investor; New Profit, Inc. (venture philanthropy), Executive Partner (until 2010) | | The Travelers Companies (insurance), Director |
Robert W. Uek (age 72) | | Trustee | | January 2006 | | Consultant to investment company industry | | N/A |
| OFFICERS |
John M. Corcoran (k) (age 48) | | President | | October 2008 | | Massachusetts Financial Services Company, Senior Vice President (since October 2008); State Street Bank and Trust (financial services provider), Senior Vice President, (until 2008) | | N/A |
Christopher R. Bohane (k) (age 39) | | Assistant Secretary and Assistant Clerk | | July 2005 | | Massachusetts Financial Services Company, Vice President and Assistant General Counsel | | N/A |
Kino Clark (k) (age 45) | | Assistant Treasurer | | January 2012 | | Massachusetts Financial Services Company, Vice President | | N/A |
41
Trustees and Officers – continued
| | | | | | | | |
Name, Age | | Position(s) Held with Fund | | Trustee/Officer
Since (h) | | Principal
Occupations During the Past Five Years | | Other Directorships (j) |
Thomas H. Connors (k) (age 54) | | Assistant Secretary and Assistant Clerk | | September 2012 | | Massachusetts Financial Services Company, Vice President and Senior Counsel; Deutsche Investment Management Americas Inc. (financial service provider), Director and Senior Counsel (until 2012) | | N/A |
Ethan D. Corey (k) (age 49) | | Assistant Secretary and Assistant Clerk | | July 2005 | | Massachusetts Financial Services Company, Senior Vice President and Associate General Counsel | | N/A |
David L. DiLorenzo (k)
(age 45) | | Treasurer | | July 2005 | | Massachusetts Financial Services Company, Senior Vice President | | N/A |
Robyn L. Griffin (age 38) | | Assistant Independent Chief Compliance Officer | | August 2008 | | Griffin Compliance LLC (provider of compliance services), Principal (since August 2008); State Street Corporation (financial services provider), Mutual Fund Administration Assistant Vice President (until 2008) | | N/A |
Brian E. Langenfeld (k) (age 40) | | Assistant Secretary and Assistant Clerk | | June 2006 | | Massachusetts Financial Services Company, Vice President and Senior Counsel | | N/A |
Susan S. Newton (k) (age 63) | | Assistant Secretary and Assistant Clerk | | May 2005 | | Massachusetts Financial Services Company, Senior Vice President and Associate General Counsel | | N/A |
Susan A. Pereira (k) (age 42) | | Assistant Secretary and Assistant Clerk | | July 2005 | | Massachusetts Financial Services Company, Vice President and Senior Counsel | | N/A |
42
Trustees and Officers – continued
| | | | | | | | |
Name, Age | | Position(s) Held with Fund | | Trustee/Officer
Since (h) | | Principal
Occupations During the Past Five Years | | Other Directorships (j) |
Kasey L. Phillips (k) (age 42) | | Assistant Treasurer | | September 2012 | | Massachusetts Financial Services Company, Vice President; Wells Fargo Funds Management, LLC, Senior Vice President, Fund Treasurer (until 2012) | | N/A |
Mark N. Polebaum (k) (age 61) | | Secretary and Clerk | | January 2006 | | Massachusetts Financial Services Company, Executive Vice President, General Counsel and Secretary | | N/A |
Frank L. Tarantino (age 69) | | Independent Chief Compliance Officer | | June 2004 | | Tarantino LLC (provider of compliance services), Principal | | N/A |
Richard S. Weitzel (k) (age 43) | | Assistant Secretary and Assistant Clerk | | October 2007 | | Massachusetts Financial Services Company, Senior Vice President and Associate General Counsel | | N/A |
James O. Yost (k) (age 53) | | Deputy Treasurer | | September 1990 | | Massachusetts Financial Services Company, Senior Vice President | | N/A |
| (h) | Date first appointed to serve as Trustee/officer of an MFS Fund. Each Trustee has served continuously since appointment unless indicated otherwise. For the period from December 15, 2004 until February 22, 2005, Mr. Manning served as Advisory Trustee. For the period October 2008, until January 2012, Mr. Corcoran served as Treasurer of the Funds. Prior to January 2012, Messrs. DiLorenzo and Yost served as Assistant Treasurers of the Funds. |
| (j) | Directorships or trusteeships of companies required to report to the Securities and Exchange Commission (i.e., “public companies”). |
| (k) | “Interested person” of the Trust within the meaning of the Investment Company Act of 1940 (referred to as the 1940 Act), which is the principal federal law governing investment companies like the fund, as a result of position with MFS. The address of MFS is 111 Huntington Avenue, Boston, Massachusetts 02199-7618. |
Each Trustee has been elected by shareholders and each Trustee and officer holds office until his or her successor is chosen and qualified or until his or her earlier death, resignation, retirement or removal. The Trust does not hold annual meetings for the purpose of electing Trustees, and Trustees are not elected for fixed terms. Messrs. Butler, Kavanaugh, Uek and Ms. Thomsen are members of the Trust’s Audit Committee.
Each of the Fund’s Trustees and officers holds comparable positions with certain other funds of which MFS or a subsidiary is the investment adviser or distributor, and, in the case of the officers, with certain affiliates of MFS. As of January 1, 2013, the Trustees served as board members of 143 funds within the MFS Family of Funds.
43
Trustees and Officers – continued
The Statement of Additional Information for the Fund includes further information about the Trustees and is available without charge upon request by calling 1-800-225-2606.
| | |
| Investment Adviser | | Custodian |
Massachusetts Financial Services Company
111 Huntington Avenue
Boston, MA 02199-7618 | | State Street Bank and Trust Company 1 Lincoln Street Boston, MA 02111-2900 |
| Distributor | | Independent Registered Public Accounting Firm |
MFS Fund Distributors, Inc.
111 Huntington Avenue
Boston, MA 02199-7618 | | Ernst & Young LLP 200 Clarendon Street
Boston, MA 02116 |
| Portfolio Manager | | |
| Thomas Wetherald | | |
44
BOARD REVIEW OF INVESTMENT ADVISORY AGREEMENT
The Investment Company Act of 1940 requires that both the full Board of Trustees and a majority of the non-interested (“independent”) Trustees, voting separately, annually approve the continuation of the Fund’s investment advisory agreement with MFS. The Trustees consider matters bearing on the Fund and its advisory arrangements at their meetings throughout the year, including a review of performance data at each regular meeting. In addition, the independent Trustees met several times over the course of three months beginning in May and ending in July, 2013 (“contract review meetings”) for the specific purpose of considering whether to approve the continuation of the investment advisory agreement for the Fund and the other investment companies that the Board oversees (the “MFS Funds”). The independent Trustees were assisted in their evaluation of the Fund’s investment advisory agreement by independent legal counsel, from whom they received separate legal advice and with whom they met separately from MFS during various contract review meetings. The independent Trustees were also assisted in this process by the MFS Funds’ Independent Chief Compliance Officer, a full-time senior officer appointed by and reporting to the independent Trustees.
In connection with their deliberations regarding the continuation of the investment advisory agreement, the Trustees, including the independent Trustees, considered such information and factors as they believed, in light of the legal advice furnished to them and their own business judgment, to be relevant. The investment advisory agreement for the Fund was considered separately, although the Trustees also took into account the common interests of all MFS Funds in their review. As described below, the Trustees considered the nature, quality, and extent of the various investment advisory, administrative, and shareholder services performed by MFS under the existing investment advisory agreement and other arrangements with the Fund.
In connection with their contract review meetings, the Trustees received and relied upon materials that included, among other items: (i) information provided by Lipper Inc., an independent third party, on the investment performance of the Fund for various time periods ended December 31, 2012 and the investment performance of a group of funds with substantially similar investment classifications/objectives (the “Lipper performance universe”), (ii) information provided by Lipper Inc. on the Fund’s advisory fees and other expenses and the advisory fees and other expenses of comparable funds identified by Lipper Inc. (the “Lipper expense group”), (iii) information provided by MFS on the advisory fees of comparable portfolios of other clients of MFS, including institutional separate accounts and other clients, (iv) information as to whether and to what extent applicable expense waivers, reimbursements or fee “breakpoints” are observed for the Fund, (v) information regarding MFS’ financial results and financial condition, including MFS’ and certain of its affiliates’ estimated profitability from services performed for the Fund and the MFS Funds as a whole, and compared to MFS’ institutional business, (vi) MFS’ views regarding the outlook for the mutual fund industry and the strategic business plans of MFS, (vii) descriptions of various functions performed by MFS for the Funds, such as compliance monitoring and portfolio trading practices, and (viii) information regarding the overall organization of MFS, including information about MFS’ senior management and other personnel providing investment advisory, administrative and other services to
45
Board Review of Investment Advisory Agreement – continued
the Fund and the other MFS Funds. The comparative performance, fee and expense information prepared and provided by Lipper Inc. was not independently verified and the independent Trustees did not independently verify any information provided to them by MFS.
The Trustees’ conclusion as to the continuation of the investment advisory agreement was based on a comprehensive consideration of all information provided to the Trustees and not the result of any single factor. Some of the factors that figured particularly in the Trustees’ deliberations are described below, although individual Trustees may have evaluated the information presented differently from one another, giving different weights to various factors. It is also important to recognize that the fee arrangements for the Fund and other MFS Funds are the result of years of review and discussion between the independent Trustees and MFS, that certain aspects of such arrangements may receive greater scrutiny in some years than in others, and that the Trustees’ conclusions may be based, in part, on their consideration of these same arrangements during the course of the year and in prior years.
Based on information provided by Lipper Inc. and MFS, the Trustees reviewed the Fund’s total return investment performance as well as the performance of peer groups of funds over various time periods. The Trustees placed particular emphasis on the total return performance of the Fund’s Class A shares in comparison to the performance of funds in its Lipper performance universe over the three-year period ended December 31, 2012, which the Trustees believed was a long enough period to reflect differing market conditions. The total return performance of the Fund’s Class A shares was in the 2nd quintile relative to the other funds in the universe for this three-year period (the 1st quintile being the best performers and the 5th quintile being the worst performers). The total return performance of the Fund’s Class A shares was in the 1st quintile for each of the one- and five-year periods ended December 31, 2012 relative to the Lipper performance universe. Because of the passage of time, these performance results may differ from the performance results for more recent periods, including those shown elsewhere in this report.
In the course of their deliberations, the Trustees took into account information provided by MFS in connection with the contract review meetings, as well as during investment review meetings conducted with portfolio management personnel during the course of the year regarding the Fund’s performance. After reviewing these and related factors, the Trustees concluded, within the context of their overall conclusions regarding the investment advisory agreement, that they were satisfied with MFS’ responses and efforts relating to investment performance.
In assessing the reasonableness of the Fund’s advisory fee, the Trustees considered, among other information, the Fund’s advisory fee and the total expense ratio of the Fund’s Class A shares as a percentage of average daily net assets and the advisory fee and total expense ratios of peer groups of funds based on information provided by Lipper Inc. The Trustees considered that, according to the Lipper data (which takes into account any fee reductions or expense limitations that were in effect during the Fund’s last fiscal year), the Fund’s effective advisory fee rate was higher than the Lipper expense group median, and the Fund’s total expense ratio was approximately at the Lipper expense group median.
46
Board Review of Investment Advisory Agreement – continued
The Trustees also considered the advisory fees charged by MFS to any comparable institutional accounts. In comparing these fees, the Trustees considered information provided by MFS as to the generally broader scope of services provided by MFS to the Fund in comparison to institutional accounts, the higher demands placed on MFS’ investment personnel and trading infrastructure as a result of the daily cash in-flows and out-flows of the Fund, and the impact on MFS and expenses associated with the more extensive regulatory regime to which the Fund is subject in comparison to institutional accounts.
The Trustees also considered whether the Fund may benefit from any economies of scale in the management of the Fund in the event of growth in assets of the Fund and/or growth in assets of the MFS Funds as a whole. They noted that MFS has agreed in writing to reduce its advisory fee on the Fund’s average daily net assets over $1 billion and $2.5 billion, which may not be changed without the Trustees’ approval. The Trustees also noted that MFS has agreed in writing to waive a portion of the management fees of certain MFS Funds, including the Fund, if the total combined assets of certain funds within the MFS Funds’ complex increase above agreed upon thresholds (the “group fee waiver”), enabling the Fund’s shareholders to share in the benefits from any economies of scale at the complex level. The group fee waiver is reviewed and renewed annually between the Board and MFS. The Trustees concluded that the existing breakpoints and the group fee waiver were sufficient to allow the Fund to benefit from economies of scale as its assets and overall complex assets grow.
The Trustees also considered information prepared by MFS relating to MFS’ costs and profits with respect to the Fund, the MFS Funds considered as a group, and other investment companies and accounts advised by MFS, as well as MFS’ methodologies used to determine and allocate its costs to the MFS Funds, the Fund and other accounts and products for purposes of estimating profitability.
After reviewing these and other factors described herein, the Trustees concluded, within the context of their overall conclusions regarding the investment advisory agreement, that the advisory fees charged to the Fund represent reasonable compensation in light of the services being provided by MFS to the Fund.
In addition, the Trustees considered MFS’ resources and related efforts to continue to retain, attract and motivate capable personnel to serve the Fund. The Trustees also considered current and developing conditions in the financial services industry, including the presence of large and well-capitalized companies which are spending, and appear to be prepared to continue to spend, substantial sums to engage personnel and to provide services to competing investment companies. In this regard, the Trustees also considered the financial resources of MFS and its ultimate parent, Sun Life Financial Inc. The Trustees also considered the advantages and possible disadvantages to the Fund of having an adviser that also serves other investment companies as well as other accounts.
The Trustees also considered the nature, quality, cost, and extent of administrative, transfer agency, and distribution services provided to the Fund by MFS and its affiliates under agreements and plans other than the investment advisory agreement, including any 12b-1 fees the Fund pays to MFS Fund Distributors, Inc., an affiliate of MFS. The Trustees also considered the nature, extent and quality of certain other services MFS
47
Board Review of Investment Advisory Agreement – continued
performs or arranges for on the Fund’s behalf, which may include securities lending programs, directed expense payment programs, class action recovery programs, and MFS’ interaction with third-party service providers, principally custodians and sub-custodians. The Trustees concluded that the various non-advisory services provided by MFS and its affiliates on behalf of the Fund were satisfactory.
The Trustees also considered benefits to MFS from the use of the Fund’s portfolio brokerage commissions, if applicable, to pay for investment research and various other factors. Additionally, the Trustees considered so-called “fall-out benefits” to MFS such as reputational value derived from serving as investment manager to the Fund.
Based on their evaluation of factors that they deemed to be material, including those factors described above, the Board of Trustees, including the independent Trustees, concluded that the Fund’s investment advisory agreement with MFS should be continued for an additional one-year period, commencing August 1, 2013.
A discussion regarding the Board’s most recent review and renewal of the fund’s Investment Advisory Agreement with MFS is available by clicking on the fund’s name under “Mutual Funds” in the “Products” section of the MFS Web site (mfs.com).
48
PROXY VOTING POLICIES AND INFORMATION
A general description of the MFS funds’ proxy voting policies and procedures is available without charge, upon request, by calling 1-800-225-2606, by visiting the Proxy Voting section of mfs.com or by visiting the SEC’s Web site at http://www.sec.gov.
Information regarding how the fund voted proxies relating to portfolio securities during the most recent twelve-month period ended June 30 is available without charge by visiting the Proxy Voting section of mfs.com or by visiting the SEC’s Web site at http://www.sec.gov.
QUARTERLY PORTFOLIO DISCLOSURE
The fund will file a complete schedule of portfolio holdings with the Securities and Exchange Commission (the Commission) for the first and third quarters of each fiscal year on Form N-Q. A shareholder can obtain the quarterly portfolio holdings report at mfs.com. The fund’s Form N-Q is also available on the EDGAR database on the Commission’s Internet Web site at http://www.sec.gov, and may be reviewed and copied at the:
Public Reference Room
Securities and Exchange Commission
100 F Street, NE, Room 1580
Washington, D.C. 20549
Information on the operation of the Public Reference Room may be obtained by calling the Commission at 1-800-SEC-0330. Copies of the fund’s Form N-Q also may be obtained, upon payment of a duplicating fee, by electronic request at the following e-mail address: publicinfo@sec.gov or by writing the Public Reference Section at the above address.
FURTHER INFORMATION
From time to time, MFS may post important information about the fund or the MFS funds on the MFS web site (mfs.com). This information is available by visiting the “News & Commentary” section of mfs.com or by clicking on the fund’s name under “Mutual Funds” in the “Products” section of mfs.com.
FEDERAL TAX INFORMATION (unaudited)
The fund will notify shareholders of amounts for use in preparing 2013 income tax forms in January 2014. The following information is provided pursuant to provisions of the Internal Revenue Code.
The fund designates $3,382,526 as capital gain dividends paid during the fiscal year.
49
rev. 3/11
| | | | |
| | | |
FACTS | | WHAT DOES MFS DO WITH YOUR PERSONAL INFORMATION? | |  |
| | |
| Why? | | Financial companies choose how they share your personal information. Federal law gives consumers the right to limit some but not all sharing. Federal law also requires us to tell you how we collect, share, and protect your personal information. Please read this notice carefully to understand what we do. |
| | |
| What? | | The types of personal information we collect and share depend on the product or service you have with us. This information can include: • Social Security number and account balances • Account transactions and transaction history • Checking account information and wire transfer instructions When you are no longer our customer, we continue to share your information as described in this notice. |
| | |
| How? | | All financial companies need to share customers’ personal information to run their everyday business. In the section below, we list the reasons financial companies can share their customers’ personal information; the reasons MFS chooses to share; and whether you can limit this sharing. |
| | | | |
Reasons we can share your
personal information | | Does MFS
share? | | Can you limit
this sharing? |
For our everyday business purposes – such as to process your transactions, maintain your account(s), respond to court orders and legal investigations, or report to credit bureaus | | Yes | | No |
For our marketing purposes – to offer our products and services to you | | No | | We don’t share |
| For joint marketing with other financial companies | | No | | We don’t share |
For our affiliates’ everyday business purposes – information about your transactions and experiences | | No | | We don’t share |
For our affiliates’ everyday business purposes – information about your creditworthiness | | No | | We don’t share |
| For nonaffiliates to market to you | | No | | We don’t share |
| | |
| Questions? | | Call 800-225-2606 or go to mfs.com. |
50
| | |
| Who we are |
| Who is providing this notice? | | MFS Funds, MFS Investment Management, MFS Institutional Advisors, Inc., MFS Fund Distributors, Inc., MFS Heritage Trust Company, and MFS Service Center, Inc. |
| | |
| What we do |
| How does MFS protect my personal information? | | To protect your personal information from unauthorized access and use, we use security measures that comply with federal law. These measures include procedural, electronic, and physical safeguards for the protection of the personal information we collect about you. |
| How does MFS collect my personal information? | | We collect your personal information, for example, when you •open an account or provide account information •direct us to buy securities or direct us to sell your securities •make a wire transfer We also collect your personal information from others, such as credit bureaus, affiliates and other companies. |
| Why can’t I limit all sharing? | | Federal law gives you the right to limit only •sharing for affiliates’ everyday business purposes – information about your creditworthiness •affiliates from using your information to market to you •sharing for nonaffiliates to market to you State laws and individual companies may give you additional rights to limit sharing. |
| | |
| Definitions |
| Affiliates | | Companies related by common ownership or control. They can be financial and nonfinancial companies. •MFS does not share personal information with affiliates, except for everyday business purposes as described on page one of this notice. |
| Nonaffiliates | | Companies not related by common ownership or control. They can be financial and nonfinancial companies. •MFS does not share with nonaffiliates so they can market to you. |
| Joint Marketing | | A formal agreement between nonaffiliated financial companies that together market financial products or services to you. •MFS doesn’t jointly market. |
| | |
| Other important information |
| If you own an MFS product or receive an MFS service in the name of a third party such as a bank or broker-dealer, their privacy policy may apply to you instead of ours. |
51
Save paper with eDelivery.

| MFS® will send you prospectuses, |
reports, and proxies directly via e-mail so you will get information faster with less mailbox clutter.
To sign up:
1. Go to mfs.com.
2. Log in via MFS® Access.
3. Select eDelivery.
If you own your MFS fund shares through a financial institution or a retirement plan, MFS® TALK, MFS® Access, or eDelivery may not be available to you.
CONTACT
WEB SITE
mfs.com
MFS TALK
1-800-637-8255
24 hours a day
ACCOUNT SERVICE AND LITERATURE
Shareholders
1-800-225-2606
Financial advisors
1-800-343-2829
Retirement plan services
1-800-637-1255
MAILING ADDRESS
MFS Service Center, Inc.
P.O. Box 55824
Boston, MA 02205-5824
OVERNIGHT MAIL
MFS Service Center, Inc.
c/o Boston Financial Data Services
30 Dan Road
Canton, MA 02021-2809
ANNUAL REPORT
August 31, 2013

MFS® RESEARCH INTERNATIONAL FUND

RIF-ANN
MFS® RESEARCH INTERNATIONAL FUND
CONTENTS
The report is prepared for the general information of shareholders.
It is authorized for distribution to prospective investors only when preceded or accompanied by a current prospectus.
NOT FDIC INSURED Ÿ MAY LOSE VALUE Ÿ NO BANK GUARANTEE

LETTER FROM THE CHAIRMAN AND CEO
Dear Shareholders:
Global economic trends appear to favor growth again despite risks created by the U.S. government’s gridlock. The U.S. economy’s slow but steady expansion is no longer the
exception. The eurozone has emerged from its 18-month-long recession, with Germany leading the way. China’s monthly gauges of economic activity once again point toward expansion. And Japan is picking up momentum in response to its government’s and central bank’s aggressive program of monetary easing.
However, geopolitical risks have risen, with violence erupting in Egypt and Syria and the possibility of further unrest in the Middle East. The U.S. Federal Reserve’s expected tapering of its bond-buying stimulus program has weighed on global markets
since May. Emerging markets, including Brazil and India, have borne much of the brunt, as their currency values have dropped and nervous investors have fled to safety elsewhere. In Europe, unemployment persists at historically high levels. The trend towards a pickup in global growth, while encouraging, appears tenuous, particularly with the risk of a U.S. debt default.
As always, managing risk in the face of uncertainty remains a top priority for investors. At MFS®, our uniquely collaborative investment process employs integrated, global research and active risk management. Our global team of investment professionals shares ideas and evaluates opportunities across continents, investment disciplines and asset classes — all with a goal of building better insights, and ultimately better results, for our clients.
We are mindful of the many economic challenges investors face, and believe it is more important than ever to maintain a long-term view and employ time-tested principles, such as asset allocation and diversification. We remain confident that our unique approach can serve investors well as they work with their financial advisors to identify and pursue the most suitable opportunities.
Respectfully,

Robert J. Manning
Chairman and Chief Executive Officer
MFS Investment Management®
October 17, 2013
The opinions expressed in this letter are subject to change, may not be relied upon for investment advice, and no forecasts can be guaranteed.
1
PORTFOLIO COMPOSITION
Portfolio structure

| | | | |
| Top ten holdings | | | | |
| Royal Dutch Shell PLC, “A” | | | 3.2% | |
| HSBC Holdings PLC | | | 2.8% | |
| Nestle S.A. | | | 2.7% | |
| Novartis AG | | | 2.3% | |
| Roche Holding AG | | | 2.2% | |
| GlaxoSmithKline PLC | | | 2.0% | |
| Rio Tinto Ltd. | | | 2.0% | |
| Sumitomo Mitsui Financial Group, Inc. | | | 1.9% | |
| Westpac Banking Corp. | | | 1.9% | |
| Groupe Danone | | | 1.8% | |
|
| Global equity sectors | |
| Financial Services | | | 24.8% | |
| Capital Goods | | | 23.2% | |
| Energy | | | 10.6% | |
| Health Care | | | 10.4% | |
| Consumer Staples | | | 9.3% | |
| Consumer Cyclicals | | | 7.7% | |
| Technology | | | 7.3% | |
| Telecommunications/Cable Television | | | 5.3% | |
| | | | |
| Issuer country weightings (x) | |
| Japan | | | 21.1% | |
| United Kingdom | | | 18.3% | |
| Switzerland | | | 10.9% | |
| France | | | 10.7% | |
| Germany | | | 6.1% | |
| Hong Kong | | | 4.7% | |
| Netherlands | | | 3.7% | |
| United States | | | 3.7% | |
| Sweden | | | 3.4% | |
| Other Countries | | | 17.4% | |
|
| Currency exposure weightings (y) | |
| Euro | | | 24.4% | |
| Japanese Yen | | | 21.1% | |
| British Pound Sterling | | | 18.3% | |
| Swiss Franc | | | 10.9% | |
| Hong Kong Dollar | | | 5.9% | |
| United States Dollar | | | 4.4% | |
| Swedish Krona | | | 3.4% | |
| Australian Dollar | | | 3.2% | |
| Brazilian Real | | | 3.1% | |
| Other Currencies | | | 5.3% | |
| (x) | Represents the portfolio’s exposure to issuer countries as a percentage of a portfolio’s net assets. |
| (y) | Represents the portfolio’s exposure to a particular currency as a percentage of a portfolio’s net assets. |
Percentages are based on net assets as of 8/31/13.
The portfolio is actively managed and current holdings may be different.
2
MANAGEMENT REVIEW
Summary of Results
For the twelve months ended August 31, 2013, Class A shares of the MFS Research International Fund (“fund”) provided a total return of 16.08%, at net asset value. This compares with a return of 19.17% for the fund’s benchmark, the MSCI EAFE Index.
Market Environment
At the beginning of the period, markets were suffering a bout of risk aversion due to broadly weaker global macroeconomic indicators, as well as renewed concerns over the eurozone’s capacity and determination to address its ongoing crisis. However, a few months into the period, this renewed weakness in the fundamentals precipitated yet a further round of monetary easing by both the US Federal Reserve (through a third round of quantitative easing) and the European Central Bank (ECB) (through a new bond purchase facility), which soon instilled additional confidence in risk markets.
Nonetheless, towards the end of the calendar year, weaker equity earnings reports and declining forward guidance caused market sentiment to soften again. In addition, year-end fiscal cliff negotiations between the Republicans in the US Congress and President Obama were a particular source of market attention, where uncertainty surrounding the fiscal negotiations continued right up to the end-of-year deadline. A last minute political agreement averted the worst-case scenario and markets gravitated towards risk assets again, though the implementation of the US budget sequester, combined with the uncertainty surrounding the Italian election results, inserted a continued degree of caution as we entered the second half of the period.
During the first few months of 2013, market sentiment improved markedly, as global macroeconomic indicators improved and fears of fiscal austerity in the US waned. Later in the period, however, global growth dynamics looked to be weakening again, though markets were generally unfazed, continuing their risk-on path, especially in light of continued easing by global central banks and the Bank of Japan in particular. At the end of the period, the growing risk that the Fed would begin tapering its quantitative easing program caused sovereign bond yields to spike, credit spreads to widen and equity valuation to fall.
Detractors from Performance
Stock selection within the capital goods sector detracted from performance relative to the MSCI EAFE Index. Within this sector, not holding Japanese car maker Toyota Motor Corp. held back relative results as the stock performed well during the period. Additionally, the fund’s holdings of mining equipment manufacturer Joy Global (b) (United States) dampened relative returns. Shares declined throughout the second half of the period as the company’s customers cut capital spending in response to lower commodity prices, forcing management to lower their earnings guidance.
In the energy sector, stock selection held back relative returns. The fund’s holdings of Brazilian energy distribution company Energias do Brasil (b) and electric utility company CEZ (b)(h) (Czech Republic) weighed on relative results as both stocks posted poor performance. The fund’s overweight positions in oil and gas exploration company
3
Management Review – continued
INPEX Corporation (Japan), natural gas producer Tokyo Gas and global energy and petrochemicals company Royal Dutch Shell also dampened relative returns as all three stocks declined.
Additionally, stock selection in the financial services sector hampered relative performance. Not holding diversified financial services provider Lloyds Bank (United Kingdom) detracted from relative returns as the stock delivered strong performance.
In other sectors, the fund’s overweight position in Li & Fung (Hong Kong), a leading supplier to global retailers, hindered relative performance. The stock fell early in the period as the company announced poor earnings for the second half of 2012 because of decreased operating income driven by a slower-than-expected recovery in its US operations.
During the reporting period, the fund’s relative currency exposure, resulting primarily from differences between the portfolio’s and the benchmark’s exposures to holdings of securities denominated in foreign currencies, weakened relative performance. All of MFS’ investment decisions are driven by the fundamentals of each individual opportunity and as such, it is common for our portfolios to have different currency exposure than the benchmark.
The fund’s cash and/or cash equivalents position during the period also detracted from relative performance. Under normal market conditions, the fund strives to be fully invested and generally holds cash to buy new holdings and to provide liquidity. In a period when markets rose, as measured by the fund’s benchmark, holding cash hurt performance versus the benchmark, which has no cash position.
Contributors to Performance
Stock selection in the health care sector benefited relative performance. The fund’s overweight positions in pharmaceutical company GlaxoSmithKline (United Kingdom) and healthcare products maker Bayer (Germany) boosted relative results as both stocks delivered positive returns during the period. GlaxoSmithKline reported better-than-expected earnings results during the first half of 2013 and Bayer continued to benefit from a number of successful drug launches throughout the period.
Stock selection in the consumer staples sector was another factor that contributed to relative performance. However, there were no individual stocks within this sector that were among the fund’s top relative contributors.
In other sectors, the fund’s overweight positions in shares of financial services firms Barclays (United Kingdom), KBC Groep (h) (Belgium), Sumitomo Mitsui Financial Group (Japan) and Erste Group Bank (Austria) supported relative results as all four stocks posted solid performance. The fund’s overweight positions in shares of casino resorts operator Sands China (Hong Kong), automotive parts manufacturer DENSO (Japan) and global banking group BNP Paribas (France) were also among the fund’s top relative contributors. Shares of Sands China posted better-than-expected earnings driven by the opening of its newest property, the Sands Cotai Central, higher mass
4
Management Review – continued
market and VIP revenue growth and a more favorable win rate for the casino. The fund’s avoidance of mining giant BHP Billiton (Australia) also supported relative returns as the stock underperformed the benchmark.
Respectfully,
| | |
| Jose Luis Garcia | | Thomas Melendez |
| Portfolio Manager | | Portfolio Manager |
| (b) | Security is not a benchmark constituent. |
| (h) | Security was not held in the portfolio at period end. |
The views expressed in this report are those of the portfolio managers only through the end of the period of the report as stated on the cover and do not necessarily reflect the views of MFS or any other person in the MFS organization. These views are subject to change at any time based on market or other conditions, and MFS disclaims any responsibility to update such views. These views may not be relied upon as investment advice or an indication of trading intent on behalf of any MFS portfolio. References to specific securities are not recommendations of such securities, and may not be representative of any MFS portfolio’s current or future investments.
5
PERFORMANCE SUMMARY THROUGH 8/31/13
The following chart illustrates a representative class of the fund’s historical performance in comparison to its benchmark(s). Performance results include the deduction of the maximum applicable sales charge and reflect the percentage change in net asset value, including reinvestment of dividends and capital gains distributions. The performance of other share classes will be greater than or less than that of the class depicted below. Benchmarks are unmanaged and may not be invested in directly. Benchmark returns do not reflect sales charges, commissions or expenses. (See Notes to Performance Summary.)
Performance data shown represents past performance and is no guarantee of future results. Investment return and principal value fluctuate so your shares, when sold, may be worth more or less than the original cost; current performance may be lower or higher than quoted. The performance shown does not reflect the deduction of taxes, if any, that a shareholder would pay on fund distributions or the redemption of fund shares.
Growth of a Hypothetical $10,000 Investment
6
Performance Summary – continued
Total Returns through 8/31/13
Average annual without sales charge
| | | | | | | | | | | | | | |
| | | Share class | | Class inception date | | 1-yr | | 5-yr | | 10-yr | | Life (t) | | |
| | | A | | 1/02/97 | | 16.08% | | 2.16% | | 8.27% | | N/A | | |
| | | B | | 1/02/98 | | 15.19% | | 1.40% | | 7.53% | | N/A | | |
| | | C | | 1/02/98 | | 15.22% | | 1.41% | | 7.53% | | N/A | | |
| | | I | | 1/02/97 | | 16.32% | | 2.41% | | 8.60% | | N/A | | |
| | | R1 | | 4/01/05 | | 15.24% | | 1.41% | | N/A | | 4.62% | | |
| | | R2 | | 10/31/03 | | 15.79% | | 1.91% | | N/A | | 7.03% | | |
| | | R3 | | 4/01/05 | | 16.13% | | 2.17% | | N/A | | 5.39% | | |
| | | R4 | | 4/01/05 | | 16.42% | | 2.42% | | N/A | | 5.68% | | |
| | | R5 | | 5/01/06 | | 16.50% | | 2.36% | | N/A | | 2.04% | | |
| | | 529A | | 7/31/02 | | 16.05% | | 2.07% | | 8.10% | | N/A | | |
| | | 529B | | 7/31/02 | | 15.15% | | 1.31% | | 7.34% | | N/A | | |
| | | 529C | | 7/31/02 | | 15.17% | | 1.32% | | 7.35% | | N/A | | |
| Comparative Benchmark | | | | | | | | | | |
| | | MSCI EAFE (Europe, Australasia, Far East)
Index (f) | | 19.17% | | 2.11% | | 8.05% | | N/A | | |
| Average annual with sales charge | | | | | | | | | | |
| | | A
With Initial Sales Charge (5.75%) | | 9.40% | | 0.96% | | 7.64% | | N/A | | |
| | | B
With CDSC (Declining over six years
from 4% to 0%) (x) | | 11.19% | | 1.02% | | 7.53% | | N/A | | |
| | | C
With CDSC (1% for 12 months) (x) | | 14.22% | | 1.41% | | 7.53% | | N/A | | |
| | | 529A
With Initial Sales Charge (5.75%) | | 9.38% | | 0.87% | | 7.46% | | N/A | | |
| | | 529B
With CDSC (Declining over six years
from 4% to 0%) (x) | | 11.15% | | 0.93% | | 7.34% | | N/A | | |
| | | 529C
With CDSC (1% for 12 months) (x) | | 14.17% | | 1.32% | | 7.35% | | N/A | | |
Class I, R1, R2, R3, R4, and R5 shares do not have a sales charge.
CDSC – Contingent Deferred Sales Charge.
| (f) | Source: FactSet Research Systems Inc. |
| (t) | For the period from the class inception date through the stated period end (for those share classes with less than 10 years of performance history). No comparative benchmark performance information is provided for “life” periods. (See Notes to Performance Summary.) |
| (x) | Assuming redemption at the end of the applicable period. |
7
Performance Summary – continued
As further discussed in Note 5 in the Notes to Financial Statements, on May 10, 2012, sales of Class W shares (including exchanges) were suspended. On May 11, 2012, certain Class W shares were automatically converted to Class I shares. Shareholders of certain Class W shares became shareholders of Class I and received Class I shares with a total net asset value equal to their Class W shares at the time of the conversion. On May 30, 2012, remaining Class W shares, which represented MFS seed money, were redesignated Class R5. Class R5 shares are generally available only to certain eligible retirement plans and to funds distributed by MFD. Class R5 shares do not pay a 12b-1 distribution fee or sub-accounting costs. On June 1, 2012, Class R5 shares were offered for sale to the public. For further information about the fund’s fee arrangements, please see Note 3 in the Notes to Financial Statements.
Benchmark Definition
MSCI EAFE (Europe, Australasia, Far East) Index – a market capitalization-weighted index that is designed to measure equity market performance in the developed markets, excluding the U.S. and Canada.
It is not possible to invest directly in an index.
Notes to Performance Summary
Average annual total return represents the average annual change in value for each share class for the periods presented. Life returns are presented where the share class has less than 10 years of performance history and represent the average annual total return from the class inception date to the stated period end date. As the fund’s share classes may have different inception dates, the life returns may represent different time periods and may not be comparable. As a result, no comparative benchmark performance information is provided for life periods.
Performance results reflect any applicable expense subsidies and waivers in effect during the periods shown. Without such subsidies and waivers the fund’s performance results would be less favorable. Please see the prospectus and financial statements for complete details.
Performance results do not include adjustments made for financial reporting purposes in accordance with U.S. generally accepted accounting principles and may differ from amounts reported in the financial highlights.
From time to time the fund may receive proceeds from litigation settlements, without which performance would be lower.
8
EXPENSE TABLE
Fund expenses borne by the shareholders during the period, March 1, 2013 through August 31, 2013
As a shareholder of the fund, you incur two types of costs: (1) transaction costs, including sales charges (loads) on certain purchase or redemption payments, and (2) ongoing costs, including management fees; distribution and service (12b-1) fees; and other fund expenses. This example is intended to help you understand your ongoing costs (in dollars) of investing in the fund and to compare these costs with the ongoing costs of investing in other mutual funds.
The example is based on an investment of $1,000 invested at the beginning of the period and held for the entire period March 1, 2013 through August 31, 2013.
Actual Expenses
The first line for each share class in the following table provides information about actual account values and actual expenses. You may use the information in this line, together with the amount you invested, to estimate the expenses that you paid over the period. Simply divide your account value by $1,000 (for example, an $8,600 account value divided by $1,000 = 8.6), then multiply the result by the number in the first line under the heading entitled “Expenses Paid During Period” to estimate the expenses you paid on your account during this period.
Hypothetical Example for Comparison Purposes
The second line for each share class in the following table provides information about hypothetical account values and hypothetical expenses based on the fund’s actual expense ratio and an assumed rate of return of 5% per year before expenses, which is not the fund’s actual return. The hypothetical account values and expenses may not be used to estimate the actual ending account balance or expenses you paid for the period. You may use this information to compare the ongoing costs of investing in the fund and other funds. To do so, compare this 5% hypothetical example with the 5% hypothetical examples that appear in the shareholder reports of the other funds.
Please note that the expenses shown in the table are meant to highlight your ongoing costs only and do not reflect any transactional costs, such as sales charges (loads). Therefore, the second line for each share class in the table is useful in comparing ongoing costs only, and will not help you determine the relative total costs of owning different funds. In addition, if these transactional costs were included, your costs would have been higher.
9
Expense Table – continued
| | | | | | | | | | | | | | | | | | | | | | |
Share
Class | | | | Annualized
Expense Ratio | | Beginning
Account Value
3/01/13 | | Ending Account Value 8/31/13 | | Expenses Paid During
Period (p) 3/01/13-8/31/13 |
| A | | Actual | | | | 1.18% | | | | | $1,000.00 | | | | | $1,031.09 | | | | | $6.04 | |
| | Hypothetical (h) | | | | 1.18% | | | | | $1,000.00 | | | | | $1,019.26 | | | | | $6.01 | |
| B | | Actual | | | | 1.93% | | | | | $1,000.00 | | | | | $1,027.13 | | | | | $9.86 | |
| | Hypothetical (h) | | | | 1.93% | | | | | $1,000.00 | | | | | $1,015.48 | | | | | $9.80 | |
| C | | Actual | | | | 1.93% | | | | | $1,000.00 | | | | | $1,027.61 | | | | | $9.86 | |
| | Hypothetical (h) | | | | 1.93% | | | | | $1,000.00 | | | | | $1,015.48 | | | | | $9.80 | |
| I | | Actual | | | | 0.93% | | | | | $1,000.00 | | | | | $1,031.98 | | | | | $4.76 | |
| | Hypothetical (h) | | | | 0.93% | | | | | $1,000.00 | | | | | $1,020.52 | | | | | $4.74 | |
| R1 | | Actual | | | | 1.93% | | | | | $1,000.00 | | | | | $1,027.36 | | | | | $9.86 | |
| | Hypothetical (h) | | | | 1.93% | | | | | $1,000.00 | | | | | $1,015.48 | | | | | $9.80 | |
| R2 | | Actual | | | | 1.43% | | | | | $1,000.00 | | | | | $1,029.41 | | | | | $7.31 | |
| | Hypothetical (h) | | | | 1.43% | | | | | $1,000.00 | | | | | $1,018.00 | | | | | $7.27 | |
| R3 | | Actual | | | | 1.18% | | | | | $1,000.00 | | | | | $1,031.43 | | | | | $6.04 | |
| | Hypothetical (h) | | | | 1.18% | | | | | $1,000.00 | | | | | $1,019.26 | | | | | $6.01 | |
| R4 | | Actual | | | | 0.93% | | | | | $1,000.00 | | | | | $1,032.36 | | | | | $4.76 | |
| | Hypothetical (h) | | | | 0.93% | | | | | $1,000.00 | | | | | $1,020.52 | | | | | $4.74 | |
| R5 | | Actual | | | | 0.81% | | | | | $1,000.00 | | | | | $1,033.14 | | | | | $4.15 | |
| | Hypothetical (h) | | | | 0.81% | | | | | $1,000.00 | | | | | $1,021.12 | | | | | $4.13 | |
| 529A | | Actual | | | | 1.20% | | | | | $1,000.00 | | | | | $1,030.87 | | | | | $6.14 | |
| | Hypothetical (h) | | | | 1.20% | | | | | $1,000.00 | | | | | $1,019.16 | | | | | $6.11 | |
| 529B | | Actual | | | | 1.98% | | | | | $1,000.00 | | | | | $1,026.44 | | | | | $10.11 | |
| | Hypothetical (h) | | | | 1.98% | | | | | $1,000.00 | | | | | $1,015.22 | | | | | $10.06 | |
| 529C | | Actual | | | | 1.98% | | | | | $1,000.00 | | | | | $1,026.73 | | | | | $10.11 | |
| | Hypothetical (h) | | | | 1.98% | | | | | $1,000.00 | | | | | $1,015.22 | | | | | $10.06 | |
| (h) | 5% class return per year before expenses. |
| (p) | Expenses paid are equal to each class’s annualized expense ratio, as shown above, multiplied by the average account value over the period, multiplied by the number of days in the period, divided by the number of days in the year. Expenses paid do not include any applicable sales charges (loads). If these transaction costs had been included, your costs would have been higher. |
Notes to Expense Table
Changes to the fund’s fee arrangements occurred during the six month period. Had these fee changes been in effect throughout the entire six month period, the annualized expense ratios would have been 1.17%, 1.92%, 1.92%, 0.92%, 1.92%, 1.42%, 1.17%, 0.92%, 0.80%,
10
Expense Table – continued
1.19%, 1.97% and 1.97% for Classes A, B, C, I, R1, R2, R3, R4, R5, 529A, 529B, and 529C, respectively; the actual expenses paid during the period would have been approximately $5.99, $9.81, $9.81, $4.71, $9.81, $7.26, $5.99, $4.71, $4.10, $6.09, $10.06 and $10.06 for Classes A, B, C, I, R1, R2, R3, R4, R5, 529A, 529B, and 529C, respectively; and the hypothetical expenses paid during the period would have been approximately $5.96, $9.75, $9.75, $4.69, $9.75, $7.22, $5.96, $4.69, $4.08, $6.06, $10.01 and $10.01 for Classes A, B, C, I, R1, R2, R3, R4, R5, 529A, 529B, and 529C, respectively. For further information about the fund’s fee arrangements and changes to those fee arrangements, please see Note 3 in the Notes to Financial Statements.
Each class with a Rule 12b-1 service fee is subject to a rebate of a portion of such fee. Such rebates are included in the expense ratios above. For Class 529A shares, this rebate reduced the expense ratio above by 0.03%. See Note 3 in the Notes to Financial Statements for additional information.
11
PORTFOLIO OF INVESTMENTS
8/31/13
The Portfolio of Investments is a complete list of all securities owned by your fund. It is categorized by broad-based asset classes.
| | | | | | | | |
| Common Stocks - 98.6% | | | | | | | | |
| Issuer | | Shares/Par | | | Value ($) | |
| Alcoholic Beverages - 2.1% | | | | | | | | |
| Heineken N.V. (l) | | | 559,677 | | | $ | 38,427,263 | |
| Pernod Ricard S.A. | | | 762,711 | | | | 88,545,966 | |
| | | | | | | | |
| | | | | | | $ | 126,973,229 | |
| Apparel Manufacturers - 2.4% | | | | | | | | |
| Li & Fung Ltd. | | | 55,100,000 | | | $ | 81,003,811 | |
| LVMH Moet Hennessy Louis Vuitton S.A. | | | 385,224 | | | | 67,485,351 | |
| | | | | | | | |
| | | | | | | $ | 148,489,162 | |
| Automotive - 4.9% | | | | | | | | |
| Autoliv, Inc. | | | 653,029 | | | $ | 52,882,288 | |
| DENSO Corp. | | | 2,255,900 | | | | 102,475,289 | |
| Honda Motor Co. Ltd. | | | 3,089,800 | | | | 110,627,350 | |
| Kia Motors Corp. | | | 589,880 | | | | 35,505,712 | |
| | | | | | | | |
| | | | | | | $ | 301,490,639 | |
| Broadcasting - 1.7% | | | | | | | | |
| Nippon Television Holdings, Inc. | | | 2,241,900 | | | $ | 39,269,835 | |
| Publicis Groupe S.A. | | | 877,718 | | | | 65,333,225 | |
| | | | | | | | |
| | | | | | | $ | 104,603,060 | |
| Business Services - 3.1% | | | | | | | | |
| Cognizant Technology Solutions Corp., “A” (a) | | | 571,410 | | | $ | 41,884,353 | |
| Compass Group PLC | | | 2,851,024 | | | | 37,820,076 | |
| Experian Group Ltd. | | | 2,264,877 | | | | 39,661,654 | |
| Mitsubishi Corp. | | | 1,946,000 | | | | 36,310,066 | |
| Nomura Research, Inc. | | | 1,221,100 | | | | 37,954,810 | |
| | | | | | | | |
| | | | | | | $ | 193,630,959 | |
| Computer Software - 0.4% | | | | | | | | |
| Dassault Systems S.A. | | | 207,063 | | | $ | 26,449,703 | |
| | |
| Computer Software - Systems - 0.7% | | | | | | | | |
| Canon, Inc. | | | 1,545,100 | | | $ | 46,297,519 | |
| | |
| Conglomerates - 0.9% | | | | | | | | |
| Hutchison Whampoa Ltd. | | | 4,694,000 | | | $ | 54,093,890 | |
| | |
| Consumer Products - 0.9% | | | | | | | | |
| Reckitt Benckiser Group PLC | | | 825,148 | | | $ | 56,072,408 | |
12
Portfolio of Investments – continued
| | | | | | | | |
| Issuer | | Shares/Par | | | Value ($) | |
| Common Stocks - continued | | | | | | | | |
| Electrical Equipment - 3.5% | | | | | | | | |
| Legrand S.A. | | | 425,155 | | | $ | 21,563,146 | |
| Schneider Electric S.A. | | | 1,245,545 | | | | 95,313,503 | |
| Siemens AG | | | 923,268 | | | | 97,728,790 | |
| | | | | | | | |
| | | | | | | $ | 214,605,439 | |
| Electronics - 1.3% | | | | | | | | |
| Infineon Technologies AG | | | 3,775,953 | | | $ | 34,234,748 | |
| Taiwan Semiconductor Manufacturing Co. Ltd. | | | 14,202,326 | | | | 47,132,326 | |
| | | | | | | | |
| | | | | | | $ | 81,367,074 | |
| Energy - Independent - 2.4% | | | | | | | | |
| Cairn Energy PLC (a) | | | 3,177,362 | | | $ | 13,417,789 | |
| Cenovus Energy, Inc. | | | 981,730 | | | | 28,129,319 | |
| Galp Energia SGPS S.A., “B” | | | 947,305 | | | | 15,944,291 | |
| INPEX Corp. | | | 8,261 | | | | 37,306,565 | |
| Oil Search Ltd. | | | 3,411,280 | | | | 25,372,263 | |
| Reliance Industries Ltd. | | | 2,301,967 | | | | 29,749,274 | |
| | | | | | | | |
| | | | | | | $ | 149,919,501 | |
| Energy - Integrated - 5.1% | | | | | | | | |
| BG Group PLC | | | 3,683,015 | | | $ | 70,031,884 | |
| Petroleo Brasileiro S.A., ADR | | | 3,523,910 | | | | 47,643,263 | |
| Royal Dutch Shell PLC, “A” | | | 6,157,180 | | | | 199,184,753 | |
| | | | | | | | |
| | | | | | | $ | 316,859,900 | |
| Engineering - Construction - 1.0% | | | | | | | | |
| JGC Corp. | | | 1,853,000 | | | $ | 63,019,184 | |
| | |
| Food & Beverages - 5.0% | | | | | | | | |
| Groupe Danone | | | 1,516,809 | | | $ | 112,944,265 | |
| M. Dias Branco S.A. Industria e Comercio de Alimentos | | | 829,700 | | | | 31,696,873 | |
| Nestle S.A. | | | 2,552,522 | | | | 167,479,680 | |
| | | | | | | | |
| | | | | | | $ | 312,120,818 | |
| Food & Drug Stores - 0.4% | | | | | | | | |
| Sundrug Co. Ltd. | | | 210,000 | | | $ | 9,740,664 | |
| Wumart Stores, Inc., “H” | | | 7,199,000 | | | | 13,590,928 | |
| | | | | | | | |
| | | | | | | $ | 23,331,592 | |
| Gaming & Lodging - 0.9% | | | | | | | | |
| Sands China Ltd. | | | 9,518,000 | | | $ | 54,500,774 | |
| | |
| Health Maintenance Organizations - 0.2% | | | | | | | | |
| OdontoPrev S.A. | | | 4,005,200 | | | $ | 14,788,999 | |
13
Portfolio of Investments – continued
| | | | | | | | |
| Issuer | | Shares/Par | | | Value ($) | |
| Common Stocks - continued | | | | | | | | |
| Insurance - 4.3% | | | | | | | | |
| AIA Group Ltd. | | | 23,369,400 | | | $ | 102,189,815 | |
| Delta Lloyd N.V. | | | 1,200,160 | | | | 22,920,466 | |
| Hiscox Ltd. | | | 3,051,660 | | | | 30,503,075 | |
| ING Groep N.V. (a) | | | 7,758,287 | | | | 84,234,471 | |
| Sony Financial Holdings, Inc. | | | 1,501,400 | | | | 24,342,299 | |
| | | | | | | | |
| | | | | | | $ | 264,190,126 | |
| Internet - 0.7% | | | | | | | | |
| Yahoo Japan Corp. | | | 92,827 | | | $ | 45,767,408 | |
| | |
| Machinery & Tools - 3.7% | | | | | | | | |
| Atlas Copco AB, “A” | | | 2,875,137 | | | $ | 77,698,784 | |
| Glory Ltd. | | | 1,823,200 | | | | 38,033,041 | |
| Joy Global, Inc. | | | 916,680 | | | | 45,027,322 | |
| Schindler Holding AG | | | 492,281 | | | | 67,880,759 | |
| | | | | | | | |
| | | | | | | $ | 228,639,906 | |
| Major Banks - 12.0% | | | | | | | | |
| Banco Santander S.A. | | | 4,652,944 | | | $ | 32,838,667 | |
| Barclays PLC | | | 20,783,002 | | | | 91,259,746 | |
| BNP Paribas | | | 1,700,045 | | | | 106,535,075 | |
| HSBC Holdings PLC | | | 16,524,753 | | | | 173,112,899 | |
| Mitsubishi UFJ Financial Group, Inc. | | | 10,951,700 | | | | 63,759,543 | |
| Standard Chartered PLC | | | 1,913,305 | | | | 42,726,365 | |
| Sumitomo Mitsui Financial Group, Inc. | | | 2,626,800 | | | | 116,378,062 | |
| Westpac Banking Corp. | | | 4,184,275 | | | | 116,014,887 | |
| | | | | | | | |
| | | | | | | $ | 742,625,244 | |
| Medical & Health Technology & Services - 0.5% | | | | | | | | |
| Kobayashi Pharmaceutical Co. Ltd. | | | 289,500 | | | $ | 15,979,614 | |
| Miraca Holdings, Inc. | | | 341,500 | | | | 15,185,690 | |
| | | | | | | | |
| | | | | | | $ | 31,165,304 | |
| Medical Equipment - 0.6% | | | | | | | | |
| Sonova Holding AG | | | 311,970 | | | $ | 34,534,806 | |
| | |
| Metals & Mining - 3.3% | | | | | | | | |
| Gerdau S.A., ADR | | | 3,496,700 | | | $ | 25,106,306 | |
| Iluka Resources Ltd. | | | 6,048,304 | | | | 57,281,993 | |
| Rio Tinto Ltd. | | | 2,758,634 | | | | 124,532,391 | |
| | | | | | | | |
| | | | | | | $ | 206,920,690 | |
| Natural Gas - Distribution - 2.0% | | | | | | | | |
| China Resources Gas Group Ltd. | | | 9,474,000 | | | $ | 22,287,197 | |
| GDF SUEZ | | | 2,435,216 | | | | 52,783,451 | |
14
Portfolio of Investments – continued
| | | | | | | | |
| Issuer | | Shares/Par | | | Value ($) | |
| Common Stocks - continued | | | | | | | | |
| Natural Gas - Distribution - continued | | | | | | | | |
| Tokyo Gas Co. Ltd. | | | 9,925,000 | | | $ | 51,299,652 | |
| | | | | | | | |
| | | | | | | $ | 126,370,300 | |
| Network & Telecom - 1.0% | | | | | | | | |
| Ericsson, Inc., “B” | | | 5,037,509 | | | $ | 59,212,498 | |
| | |
| Other Banks & Diversified Financials - 7.0% | | | | | | | | |
| Aeon Credit Service Co. Ltd. (l) | | | 1,120,000 | | | $ | 29,892,601 | |
| Bank Rakyat Indonesia | | | 14,331,000 | | | | 8,613,929 | |
| DBS Group Holdings Ltd. | | | 3,571,000 | | | | 44,110,957 | |
| Erste Group Bank AG | | | 2,241,164 | | | | 71,844,142 | |
| HDFC Bank Ltd., ADR | | | 927,930 | | | | 26,891,411 | |
| ICICI Bank Ltd. | | | 995,808 | | | | 12,066,802 | |
| Itau Unibanco Holding S.A., ADR | | | 1,203,161 | | | | 14,642,469 | |
| Kasikornbank PLC, NVDR | | | 4,587,600 | | | | 22,483,344 | |
| KBC Group N.V. | | | 1,432,261 | | | | 62,997,299 | |
| Sberbank of Russia, ADR | | | 2,996,397 | | | | 31,582,024 | |
| UBS AG | | | 3,944,867 | | | | 76,400,133 | |
| UniCredit S.p.A. | | | 6,024,561 | | | | 34,062,979 | |
| | | | | | | | |
| | | | | | | $ | 435,588,090 | |
| Pharmaceuticals - 9.1% | | | | | | | | |
| Bayer AG | | | 780,593 | | | $ | 86,701,605 | |
| GlaxoSmithKline PLC | | | 4,962,698 | | | | 126,550,391 | |
| Novartis AG | | | 1,959,970 | | | | 142,924,353 | |
| Roche Holding AG | | | 543,487 | | | | 135,572,393 | |
| Santen Pharmaceutical Co. Ltd. | | | 1,515,200 | | | | 70,370,342 | |
| | | | | | | | |
| | | | | | | $ | 562,119,084 | |
| Railroad & Shipping - 0.8% | | | | | | | | |
| Kuehne & Nagel, Inc. AG | | | 382,360 | | | $ | 47,628,055 | |
| | |
| Real Estate - 1.6% | | | | | | | | |
| GSW Immobilien AG | | | 524,664 | | | $ | 22,858,661 | |
| Mitsubishi Estate Co. Ltd. | | | 2,855,000 | | | | 73,847,576 | |
| | | | | | | | |
| | | | | | | $ | 96,706,237 | |
| Restaurants - 1.6% | | | | | | | | |
| Arcos Dorados Holdings, Inc. | | | 4,194,020 | | | $ | 44,876,014 | |
| Whitbread PLC | | | 1,182,384 | | | | 56,436,103 | |
| | | | | | | | |
| | | | | | | $ | 101,312,117 | |
| Specialty Chemicals - 3.7% | | | | | | | | |
| Akzo Nobel N.V. | | | 1,476,803 | | | $ | 86,846,080 | |
| Chugoku Marine Paints Ltd. | | | 1,972,000 | | | | 9,845,019 | |
15
Portfolio of Investments – continued
| | | | | | | | |
| Issuer | | Shares/Par | | | Value ($) | |
| Common Stocks - continued | | | | | | | | |
| Specialty Chemicals - continued | | | | | | | | |
| Linde AG | | | 551,066 | | | $ | 105,970,029 | |
| Symrise AG | | | 676,877 | | | | 29,593,184 | |
| | | | | | | | |
| | | | | | | $ | 232,254,312 | |
| Specialty Stores - 0.7% | | | | | | | | |
| Hennes & Mauritz AB, “B” | | | 1,146,850 | | | $ | 42,137,200 | |
| | |
| Telecommunications - Wireless - 3.4% | | | | | | | | |
| KDDI Corp. | | | 2,161,200 | | | $ | 102,781,016 | |
| Tele2 AB, “B” | | | 2,549,118 | | | | 32,040,186 | |
| TIM Participacoes S.A., ADR | | | 1,414,891 | | | | 27,901,651 | |
| Vodafone Group PLC | | | 14,263,604 | | | | 45,590,146 | |
| | | | | | | | |
| | | | | | | $ | 208,312,999 | |
| Telephone Services - 2.0% | | | | | | | | |
| Bezeq - The Israel Telecommunication Corp. Ltd. | | | 6,736,930 | | | $ | 10,980,748 | |
| BT Group PLC | | | 4,751,012 | | | | 23,950,685 | |
| China Unicom (Hong Kong) Ltd. | | | 25,862,000 | | | | 39,069,351 | |
| TDC A.S. | | | 3,620,746 | | | | 29,566,405 | |
| Telecom Italia S.p.A. - Savings Shares | | | 32,748,948 | | | | 18,196,024 | |
| | | | | | | | |
| | | | | | | $ | 121,763,213 | |
| Tobacco - 1.3% | | | | | | | | |
| Japan Tobacco, Inc. | | | 2,388,800 | | | $ | 80,518,603 | |
| | |
| Trucking - 1.4% | | | | | | | | |
| Yamato Holdings Co. Ltd. | | | 4,004,200 | | | $ | 85,739,045 | |
| | |
| Utilities - Electric Power - 0.5% | | | | | | | | |
| Energias do Brasil S.A. | | | 7,334,100 | | | $ | 32,890,408 | |
| | |
| Utilities - Water - 0.5% | | | | | | | | |
| SUEZ Environnement | | | 1,918,840 | | | $ | 28,593,792 | |
| Total Common Stocks (Identified Cost, $5,588,814,117) | | | | | | $ | 6,103,603,287 | |
| | |
| Money Market Funds - 0.5% | | | | | | | | |
MFS Institutional Money Market Portfolio, 0.09%,
at Cost and Net Asset Value (v) | | | 30,851,777 | | | $ | 30,851,777 | |
16
Portfolio of Investments – continued
| | | | | | | | |
| Collateral for Securities Loaned - 0.5% | | | | | | | | |
| Issuer | | Shares/Par | | | Value ($) | |
Navigator Securities Lending Prime Portfolio, 0.16%,
at Cost and Net Asset Value (j) | | | 34,992,502 | | | $ | 34,992,502 | |
| Total Investments (Identified Cost, $5,654,658,396) | | | | | | $ | 6,169,447,566 | |
| | |
| Other Assets, Less Liabilities - 0.4% | | | | | | | 21,709,053 | |
| Net Assets - 100.0% | | | | | | $ | 6,191,156,619 | |
| (a) | Non-income producing security. |
| (j) | The rate quoted is the annualized seven-day yield of the fund at period end. |
| (l) | A portion of this security is on loan. |
| (v) | Underlying affiliated fund that is available only to investment companies managed by MFS. The rate quoted for the MFS Institutional Money Market Portfolio is the annualized seven-day yield of the fund at period end. |
The following abbreviations are used in this report and are defined:
| ADR | | American Depositary Receipt |
| NVDR | | Non-Voting Depositary Receipt |
| PLC | | Public Limited Company |
See Notes to Financial Statements
17
Financial Statements
STATEMENT OF ASSETS AND LIABILITIES
At 8/31/13
This statement represents your fund’s balance sheet, which details the assets and liabilities comprising the total value of the fund.
| | | | |
| Assets | | | | |
Investments- | | | | |
Non-affiliated issuers, at value (identified cost, $5,623,806,619) | | | $6,138,595,789 | |
Underlying affiliated funds, at cost and value | | | 30,851,777 | |
Total investments, at value, including $33,252,134 of securities on loan (identified cost, $5,654,658,396) | | | $6,169,447,566 | |
Foreign currency, at value (identified cost, $6,561,364) | | | 6,549,944 | |
Receivables for | | | | |
Investments sold | | | 56,260,994 | |
Fund shares sold | | | 9,674,889 | |
Interest and dividends | | | 22,207,411 | |
Other assets | | | 7,558 | |
Total assets | | | $6,264,148,362 | |
| Liabilities | | | | |
Payables for | | | | |
Investments purchased | | | $30,273,355 | |
Fund shares reacquired | | | 3,912,388 | |
Collateral for securities loaned, at value | | | 34,992,502 | |
Payable to affiliates | | | | |
Investment adviser | | | 380,546 | |
Shareholder servicing costs | | | 2,914,837 | |
Distribution and service fees | | | 41,167 | |
Program manager fees | | | 13 | |
Payable for independent Trustees’ compensation | | | 15,174 | |
Accrued expenses and other liabilities | | | 461,761 | |
Total liabilities | | | $72,991,743 | |
Net assets | | | $6,191,156,619 | |
| Net assets consist of | | | | |
Paid-in capital | | | $6,318,302,654 | |
Unrealized appreciation (depreciation) on investments and translation of assets and liabilities in foreign currencies | | | 514,429,744 | |
Accumulated net realized gain (loss) on investments and foreign currency | | | (744,277,089 | ) |
Undistributed net investment income | | | 102,701,310 | |
Net assets | | | $6,191,156,619 | |
Shares of beneficial interest outstanding | | | 378,547,492 | |
18
Statement of Assets and Liabilities – continued
| | | | | | | | | | | | |
| | | Net assets | | | Shares
outstanding | | | Net asset value
per share (a) | |
Class A | | | $1,108,795,090 | | | | 68,237,947 | | | | $16.25 | |
Class B | | | 19,751,061 | | | | 1,272,702 | | | | 15.52 | |
Class C | | | 86,792,818 | | | | 5,689,231 | | | | 15.26 | |
Class I | | | 1,834,498,330 | | | | 109,299,274 | | | | 16.78 | |
Class R1 | | | 4,033,850 | | | | 268,653 | | | | 15.02 | |
Class R2 | | | 136,443,849 | | | | 8,662,803 | | | | 15.75 | |
Class R3 | | | 195,358,355 | | | | 12,151,548 | | | | 16.08 | |
Class R4 | | | 470,915,435 | | | | 28,948,569 | | | | 16.27 | |
Class R5 | | | 2,331,324,711 | | | | 143,809,625 | | | | 16.21 | |
Class 529A | | | 2,104,576 | | | | 131,259 | | | | 16.03 | |
Class 529B | | | 188,329 | | | | 12,437 | | | | 15.14 | |
Class 529C | | | 950,215 | | | | 63,444 | | | | 14.98 | |
| (a) | Maximum offering price per share was equal to the net asset value per share for all share classes, except for Classes A and 529A, for which the maximum offering prices per share were $17.24 [100 / 94.25 x $16.25] and $17.01 [100 / 94.25 x $16.03], respectively. On sales of $50,000 or more, the maximum offering prices of Class A and Class 529A shares are reduced. A contingent deferred sales charge may be imposed on redemptions of Class A, Class B, Class C, Class 529B, and Class 529C shares. Redemption price per share was equal to the net asset value per share for Classes I, R1, R2, R3, R4, R5, and 529A. |
See Notes to Financial Statements
19
Financial Statements
STATEMENT OF OPERATIONS
Year ended 8/31/13
This statement describes how much your fund earned in investment income and accrued in expenses. It also describes any gains and/or losses generated by fund operations.
| | | | |
| Net investment income | | | | |
Income | | | | |
Dividends | | | $167,140,758 | |
Interest | | | 1,797,409 | |
Dividends from underlying affiliated funds | | | 83,695 | |
Foreign taxes withheld | | | (13,275,929 | ) |
Total investment income | | | $155,745,933 | |
Expenses | | | | |
Management fee | | | $41,627,851 | |
Distribution and service fees | | | 4,945,106 | |
Program manager fees | | | 3,180 | |
Shareholder servicing costs | | | 4,845,472 | |
Administrative services fee | | | 518,978 | |
Independent Trustees’ compensation | | | 82,379 | |
Custodian fee | | | 1,186,571 | |
Shareholder communications | | | 187,664 | |
Audit and tax fees | | | 94,723 | |
Legal fees | | | 52,823 | |
Miscellaneous | | | 521,040 | |
Total expenses | | | $54,065,787 | |
Fees paid indirectly | | | (201 | ) |
Reduction of expenses by investment adviser and distributor | | | (95,280 | ) |
Net expenses | | | $53,970,306 | |
Net investment income | | | $101,775,627 | |
| Realized and unrealized gain (loss) on investments and foreign currency | |
Realized gain (loss) (identified cost basis) | | | | |
Investments (net of $886,955 country tax) | | | $297,499,585 | |
Foreign currency | | | (2,584,867 | ) |
Net realized gain (loss) on investments and foreign currency | | | $294,914,718 | |
Change in unrealized appreciation (depreciation) | | | | |
Investments (net of $649,240 decrease in deferred country tax) | | | $380,349,383 | |
Translation of assets and liabilities in foreign currencies | | | (247,426 | ) |
Net unrealized gain (loss) on investments and foreign currency translation | | | $380,101,957 | |
Net realized and unrealized gain (loss) on investments and foreign currency | | | $675,016,675 | |
Change in net assets from operations | | | $776,792,302 | |
See Notes to Financial Statements
20
Financial Statements
STATEMENTS OF CHANGES IN NET ASSETS
These statements describe the increases and/or decreases in net assets resulting from operations, any distributions, and any shareholder transactions.
| | | | | | | | |
| | | Years ended 8/31 | |
| | | 2013 | | | 2012 | |
| Change in net assets | | | | | | |
| From operations | | | | | | | | |
Net investment income | | | $101,775,627 | | | | $98,185,186 | |
Net realized gain (loss) on investments and foreign currency | | | 294,914,718 | | | | (44,297,721 | ) |
Net unrealized gain (loss) on investments and foreign currency translation | | | 380,101,957 | | | | (79,771,886 | ) |
Change in net assets from operations | | | $776,792,302 | | | | $(25,884,421 | ) |
| Distributions declared to shareholders | | | | | | | | |
From net investment income | | | $(97,500,392 | ) | | | $(86,230,428 | ) |
Change in net assets from fund share transactions | | | $746,775,414 | | | | $407,269,195 | |
Total change in net assets | | | $1,426,067,324 | | | | $295,154,346 | |
| Net assets | | | | | | | | |
At beginning of period | | | 4,765,089,295 | | | | 4,469,934,949 | |
At end of period (including undistributed net investment income of $102,701,310 and $97,006,857, respectively) | | | $6,191,156,619 | | | | $4,765,089,295 | |
See Notes to Financial Statements
21
Financial Statements
FINANCIAL HIGHLIGHTS
The financial highlights table is intended to help you understand the fund’s financial performance for the past 5 years. Certain information reflects financial results for a single fund share. The total returns in the table represent the rate by which an investor would have earned (or lost) on an investment in the fund share class (assuming reinvestment of all distributions) held for the entire period.
| | | | | | | | | | | | | | | | | | | | |
| Class A | | Years ended 8/31 | |
| | | 2013 | | | 2012 | | | 2011 | | | 2010 | | | 2009 | |
Net asset value, beginning of period | | | $14.25 | | | | $14.66 | | | | $12.93 | | | | $13.03 | | | | $16.14 | |
| Income (loss) from investment operations | | | | | | | | | | | | | | | | | |
Net investment income (d) | | | $0.26 | | | | $0.28 | | | | $0.26 | | | | $0.21 | | | | $0.22 | |
Net realized and unrealized gain (loss)
on investments and foreign currency | | | 2.01 | | | | (0.45 | ) | | | 1.67 | | | | (0.11 | ) | | | (2.92 | ) |
Total from investment operations | | | $2.27 | | | | $(0.17 | ) | | | $1.93 | | | | $0.10 | | | | $(2.70 | ) |
| Less distributions declared to shareholders | | | | | | | | | | | | | | | | | |
From net investment income | | | $(0.27 | ) | | | $(0.24 | ) | | | $(0.20 | ) | | | $(0.20 | ) | | | $(0.20 | ) |
From net realized gain on investments | | | — | | | | — | | | | — | | | | — | | | | (0.21 | ) |
Total distributions declared to shareholders | | | $(0.27 | ) | | | $(0.24 | ) | | | $(0.20 | ) | | | $(0.20 | ) | | | $(0.41 | ) |
Net asset value, end of period (x) | | | $16.25 | | | | $14.25 | | | | $14.66 | | | | $12.93 | | | | $13.03 | |
Total return (%) (r)(s)(t)(x) | | | 16.08 | | | | (1.03 | ) | | | 14.89 | | | | 0.65 | | | | (16.22 | ) |
Ratios (%) (to average net assets)
and Supplemental data: | | | | | | | | | | | | | | | | | | | | |
Expenses before expense reductions (f) | | | 1.18 | | | | 1.21 | | | | 1.19 | | | | 1.25 | | | | 1.35 | |
Expenses after expense reductions (f) | | | 1.18 | | | | 1.21 | | | | 1.19 | | | | 1.25 | | | | 1.35 | |
Net investment income | | | 1.65 | | | | 2.02 | | | | 1.67 | | | | 1.59 | | | | 1.95 | |
Portfolio turnover | | | 32 | | | | 37 | | | | 43 | | | | 56 | | | | 88 | |
Net assets at end of period (000 omitted) | | | $1,108,795 | | | | $970,501 | | | | $1,008,654 | | | | $1,466,337 | | | | $1,254,399 | |
See Notes to Financial Statements
22
Financial Highlights – continued
| | | | | | | | | | | | | | | | | | | | |
| Class B | | Years ended 8/31 | |
| | | 2013 | | | 2012 | | | 2011 | | | 2010 | | | 2009 | |
Net asset value, beginning of period | | | $13.59 | | | | $13.96 | | | | $12.30 | | | | $12.39 | | | | $15.34 | |
| Income (loss) from investment operations | | | | | | | | | | | | | | | | | |
Net investment income (d) | | | $0.12 | | | | $0.16 | | | | $0.11 | | | | $0.09 | | | | $0.13 | |
Net realized and unrealized gain (loss)
on investments and foreign currency | | | 1.94 | | | | (0.42 | ) | | | 1.62 | | | | (0.09 | ) | | | (2.77 | ) |
Total from investment operations | | | $2.06 | | | | $(0.26 | ) | | | $1.73 | | | | $— | | | | $(2.64 | ) |
| Less distributions declared to shareholders | | | | | | | | | | | | | | | | | |
From net investment income | | | $(0.13 | ) | | | $(0.11 | ) | | | $(0.07 | ) | | | $(0.09 | ) | | | $(0.10 | ) |
From net realized gain on investments | | | — | | | | — | | | | — | | | | — | | | | (0.21 | ) |
Total distributions declared to shareholders | | | $(0.13 | ) | | | $(0.11 | ) | | | $(0.07 | ) | | | $(0.09 | ) | | | $(0.31 | ) |
Net asset value, end of period (x) | | | $15.52 | | | | $13.59 | | | | $13.96 | | | | $12.30 | | | | $12.39 | |
Total return (%) (r)(s)(t)(x) | | | 15.27 | | | | (1.82 | ) | | | 14.02 | | | | (0.09 | ) | | | (16.85 | ) |
Ratios (%) (to average net assets)
and Supplemental data: | | | | | | | | | | | | | | | | | | | | |
Expenses before expense reductions (f) | | | 1.93 | | | | 1.96 | | | | 1.95 | | | | 1.99 | | | | 2.05 | |
Expenses after expense reductions (f) | | | 1.93 | | | | 1.96 | | | | 1.94 | | | | 1.99 | | | | 2.05 | |
Net investment income | | | 0.83 | | | | 1.19 | | | | 0.76 | | | | 0.71 | | | | 1.25 | |
Portfolio turnover | | | 32 | | | | 37 | | | | 43 | | | | 56 | | | | 88 | |
Net assets at end of period (000 omitted) | | | $19,751 | | | | $23,369 | | | | $33,059 | | | | $40,476 | | | | $55,961 | |
| |
| Class C | | Years ended 8/31 | |
| | | 2013 | | | 2012 | | | 2011 | | | 2010 | | | 2009 | |
Net asset value, beginning of period | | | $13.39 | | | | $13.78 | | | | $12.16 | | | | $12.27 | | | | $15.23 | |
| Income (loss) from investment operations | | | | | | | | | | | | | | | | | |
Net investment income (d) | | | $0.13 | | | | $0.16 | | | | $0.12 | | | | $0.10 | | | | $0.14 | |
Net realized and unrealized gain (loss)
on investments and foreign currency | | | 1.90 | | | | (0.42 | ) | | | 1.59 | | | | (0.10 | ) | | | (2.77 | ) |
Total from investment operations | | | $2.03 | | | | $(0.26 | ) | | | $1.71 | | | | $— | | | | $(2.63 | ) |
| Less distributions declared to shareholders | | | | | | | | | | | | | | | | | |
From net investment income | | | $(0.16 | ) | | | $(0.13 | ) | | | $(0.09 | ) | | | $(0.11 | ) | | | $(0.12 | ) |
From net realized gain on investments | | | — | | | | — | | | | — | | | | — | | | | (0.21 | ) |
Total distributions declared to shareholders | | | $(0.16 | ) | | | $(0.13 | ) | | | $(0.09 | ) | | | $(0.11 | ) | | | $(0.33 | ) |
Net asset value, end of period (x) | | | $15.26 | | | | $13.39 | | | | $13.78 | | | | $12.16 | | | | $12.27 | |
Total return (%) (r)(s)(t)(x) | | | 15.22 | | | | (1.80 | ) | | | 14.05 | | | | (0.03 | ) | | | (16.88 | ) |
Ratios (%) (to average net assets)
and Supplemental data: | | | | | | | | | | | | | | | | | | | | |
Expenses before expense reductions (f) | | | 1.93 | | | | 1.96 | | | | 1.95 | | | | 2.00 | | | | 2.05 | |
Expenses after expense reductions (f) | | | 1.93 | | | | 1.96 | | | | 1.95 | | | | 2.00 | | | | 2.05 | |
Net investment income | | | 0.87 | | | | 1.23 | | | | 0.80 | | | | 0.78 | | | | 1.30 | |
Portfolio turnover | | | 32 | | | | 37 | | | | 43 | | | | 56 | | | | 88 | |
Net assets at end of period (000 omitted) | | | $86,793 | | | | $84,133 | | | | $99,830 | | | | $101,267 | | | | $110,142 | |
See Notes to Financial Statements
23
Financial Highlights – continued
| | | | | | | | | | | | | | | | | | | | |
| Class I | | Years ended 8/31 | |
| | | 2013 | | | 2012 | | | 2011 | | | 2010 | | | 2009 | |
Net asset value, beginning of period | | | $14.71 | | | | $15.15 | | | | $13.35 | | | | $13.44 | | | | $16.65 | |
| Income (loss) from investment operations | | | | | | | | | | | | | | | | | |
Net investment income (d) | | | $0.31 | | | | $0.35 | | | | $0.29 | | | | $0.26 | | | | $0.26 | |
Net realized and unrealized gain (loss)
on investments and foreign currency | | | 2.06 | | | | (0.49 | ) | | | 1.74 | | | | (0.12 | ) | | | (3.01 | ) |
Total from investment operations | | | $2.37 | | | | $(0.14 | ) | | | $2.03 | | | | $0.14 | | | | $(2.75 | ) |
| Less distributions declared to shareholders | | | | | | | | | | | | | | | | | |
From net investment income | | | $(0.30 | ) | | | $(0.30 | ) | | | $(0.23 | ) | | | $(0.23 | ) | | | $(0.25 | ) |
From net realized gain on investments | | | — | | | | — | | | | — | | | | — | | | | (0.21 | ) |
Total distributions declared to shareholders | | | $(0.30 | ) | | | $(0.30 | ) | | | $(0.23 | ) | | | $(0.23 | ) | | | $(0.46 | ) |
Net asset value, end of period (x) | | | $16.78 | | | | $14.71 | | | | $15.15 | | | | $13.35 | | | | $13.44 | |
Total return (%) (r)(s)(x) | | | 16.32 | | | | (0.82 | ) | | | 15.19 | | | | 0.92 | | | | (16.00 | ) |
Ratios (%) (to average net assets)
and Supplemental data: | | | | | | | | | | | | | | | | | | | | |
Expenses before expense reductions (f) | | | 0.93 | | | | 0.96 | | | | 0.95 | | | | 1.00 | | | | 1.05 | |
Expenses after expense reductions (f) | | | 0.93 | | | | 0.96 | | | | 0.95 | | | | 1.00 | | | | 1.05 | |
Net investment income | | | 1.89 | | | | 2.45 | | | | 1.86 | | | | 1.90 | | | | 2.31 | |
Portfolio turnover | | | 32 | | | | 37 | | | | 43 | | | | 56 | | | | 88 | |
Net assets at end of period (000 omitted) | | | $1,834,498 | | | | $1,143,621 | | | | $2,484,795 | | | | $1,926,221 | | | | $1,456,884 | |
| |
| Class R1 | | Years ended 8/31 | |
| | | 2013 | | | 2012 | | | 2011 | | | 2010 | | | 2009 | |
Net asset value, beginning of period | | | $13.17 | | | | $13.57 | | | | $11.98 | | | | $12.10 | | | | $15.05 | |
| Income (loss) from investment operations | | | | | | | | | | | | | | | | | |
Net investment income (d) | | | $0.12 | | | | $0.15 | | | | $0.12 | | | | $0.10 | | | | $0.14 | |
Net realized and unrealized gain (loss)
on investments and foreign currency | | | 1.87 | | | | (0.40 | ) | | | 1.57 | | | | (0.10 | ) | | | (2.74 | ) |
Total from investment operations | | | $1.99 | | | | $(0.25 | ) | | | $1.69 | | | | $— | | | | $(2.60 | ) |
| Less distributions declared to shareholders | | | | | | | | | | | | | | | | | |
From net investment income | | | $(0.14 | ) | | | $(0.15 | ) | | | $(0.10 | ) | | | $(0.12 | ) | | | $(0.14 | ) |
From net realized gain on investments | | | — | | | | — | | | | — | | | | — | | | | (0.21 | ) |
Total distributions declared to shareholders | | | $(0.14 | ) | | | $(0.15 | ) | | | $(0.10 | ) | | | $(0.12 | ) | | | $(0.35 | ) |
Net asset value, end of period (x) | | | $15.02 | | | | $13.17 | | | | $13.57 | | | | $11.98 | | | | $12.10 | |
Total return (%) (r)(s)(x) | | | 15.24 | | | | (1.80 | ) | | | 14.09 | | | | (0.09 | ) | | | (16.87 | ) |
Ratios (%) (to average net assets)
and Supplemental data: | | | | | | | | | | | | | | | | | | | | |
Expenses before expense reductions (f) | | | 1.93 | | | | 1.96 | | | | 1.95 | | | | 2.00 | | | | 2.05 | |
Expenses after expense reductions (f) | | | 1.93 | | | | 1.96 | | | | 1.95 | | | | 2.00 | | | | 2.05 | |
Net investment income | | | 0.85 | | | | 1.18 | | | | 0.84 | | | | 0.77 | | | | 1.34 | |
Portfolio turnover | | | 32 | | | | 37 | | | | 43 | | | | 56 | | | | 88 | |
Net assets at end of period (000 omitted) | | | $4,034 | | | | $4,914 | | | | $6,288 | | | | $5,868 | | | | $6,311 | |
See Notes to Financial Statements
24
Financial Highlights – continued
| | | | | | | | | | | | | | | | | | | | |
| Class R2 | | Years ended 8/31 | |
| | | 2013 | | | 2012 | | | 2011 | | | 2010 | | | 2009 | |
Net asset value, beginning of period | | | $13.83 | | | | $14.26 | | | | $12.59 | | | | $12.70 | | | | $15.76 | |
| Income (loss) from investment operations | | | | | | | | | | | | | | | | | |
Net investment income (d) | | | $0.21 | | | | $0.24 | | | | $0.20 | | | | $0.18 | | | | $0.20 | |
Net realized and unrealized gain (loss)
on investments and foreign currency | | | 1.95 | | | | (0.44 | ) | | | 1.64 | | | | (0.11 | ) | | | (2.87 | ) |
Total from investment operations | | | $2.16 | | | | $(0.20 | ) | | | $1.84 | | | | $0.07 | | | | $(2.67 | ) |
| Less distributions declared to shareholders | | | | | | | | | | | | | | | | | |
From net investment income | | | $(0.24 | ) | | | $(0.23 | ) | | | $(0.17 | ) | | | $(0.18 | ) | | | $(0.18 | ) |
From net realized gain on investments | | | — | | | | — | | | | — | | | | — | | | | (0.21 | ) |
Total distributions declared to shareholders | | | $(0.24 | ) | | | $(0.23 | ) | | | $(0.17 | ) | | | $(0.18 | ) | | | $(0.39 | ) |
Net asset value, end of period (x) | | | $15.75 | | | | $13.83 | | | | $14.26 | | | | $12.59 | | | | $12.70 | |
Total return (%) (r)(s)(x) | | | 15.79 | | | | (1.32 | ) | | | 14.61 | | | | 0.45 | | | | (16.45 | ) |
Ratios (%) (to average net assets)
and Supplemental data: | | | | | | | | | | | | | | | | | | | | |
Expenses before expense reductions (f) | | | 1.43 | | | | 1.46 | | | | 1.45 | | | | 1.50 | | | | 1.54 | |
Expenses after expense reductions (f) | | | 1.43 | | | | 1.46 | | | | 1.45 | | | | 1.50 | | | | 1.54 | |
Net investment income | | | 1.41 | | | | 1.78 | | | | 1.37 | | | | 1.34 | | | | 1.88 | |
Portfolio turnover | | | 32 | | | | 37 | | | | 43 | | | | 56 | | | | 88 | |
Net assets at end of period (000 omitted) | | | $136,444 | | | | $107,567 | | | | $91,693 | | | | $72,425 | | | | $60,790 | |
| |
| Class R3 | | Years ended 8/31 | |
| | | 2013 | | | 2012 | | | 2011 | | | 2010 | | | 2009 | |
Net asset value, beginning of period | | | $14.10 | | | | $14.53 | | | | $12.82 | | | | $12.92 | | | | $16.06 | |
| Income (loss) from investment operations | | | | | | | | | | | | | | | | | |
Net investment income (d) | | | $0.25 | | | | $0.28 | | | | $0.23 | | | | $0.21 | | | | $0.23 | |
Net realized and unrealized gain (loss)
on investments and foreign currency | | | 2.00 | | | | (0.45 | ) | | | 1.68 | | | | (0.10 | ) | | | (2.93 | ) |
Total from investment operations | | | $2.25 | | | | $(0.17 | ) | | | $1.91 | | | | $0.11 | | | | $(2.70 | ) |
| Less distributions declared to shareholders | | | | | | | | | | | | | | | | | |
From net investment income | | | $(0.27 | ) | | | $(0.26 | ) | | | $(0.20 | ) | | | $(0.21 | ) | | | $(0.23 | ) |
From net realized gain on investments | | | — | | | | — | | | | — | | | | — | | | | (0.21 | ) |
Total distributions declared to shareholders | | | $(0.27 | ) | | | $(0.26 | ) | | | $(0.20 | ) | | | $(0.21 | ) | | | $(0.44 | ) |
Net asset value, end of period (x) | | | $16.08 | | | | $14.10 | | | | $14.53 | | | | $12.82 | | | | $12.92 | |
Total return (%) (r)(s)(x) | | | 16.13 | | | | (1.06 | ) | | | 14.88 | | | | 0.72 | | | | (16.26 | ) |
Ratios (%) (to average net assets)
and Supplemental data: | | | | | | | | | | | | | | | | | | | | |
Expenses before expense reductions (f) | | | 1.18 | | | | 1.21 | | | | 1.20 | | | | 1.25 | | | | 1.29 | |
Expenses after expense reductions (f) | | | 1.18 | | | | 1.21 | | | | 1.20 | | | | 1.25 | | | | 1.29 | |
Net investment income | | | 1.63 | | | | 2.05 | | | | 1.54 | | | | 1.55 | | | | 2.09 | |
Portfolio turnover | | | 32 | | | | 37 | | | | 43 | | | | 56 | | | | 88 | |
Net assets at end of period (000 omitted) | | | $195,358 | | | | $168,989 | | | | $154,869 | | | | $151,073 | | | | $133,545 | |
See Notes to Financial Statements
25
Financial Highlights – continued
| | | | | | | | | | | | | | | | | | | | |
| Class R4 | | Years ended 8/31 | |
| | | 2013 | | | 2012 | | | 2011 | | | 2010 | | | 2009 | |
Net asset value, beginning of period | | | $14.26 | | | | $14.70 | | | | $12.96 | | | | $13.05 | | | | $16.19 | |
| Income (loss) from investment operations | | | | | | | | | | | | | | | | | |
Net investment income (d) | | | $0.25 | | | | $0.32 | | | | $0.28 | | | | $0.24 | | | | $0.20 | |
Net realized and unrealized gain (loss)
on investments and foreign currency | | | 2.06 | | | | (0.46 | ) | | | 1.69 | | | | (0.10 | ) | | | (2.88 | ) |
Total from investment operations | | | $2.31 | | | | $(0.14 | ) | | | $1.97 | | | | $0.14 | | | | $(2.68 | ) |
| Less distributions declared to shareholders | | | | | | | | | | | | | | | | | |
From net investment income | | | $(0.30 | ) | | | $(0.30 | ) | | | $(0.23 | ) | | | $(0.23 | ) | | | $(0.25 | ) |
From net realized gain on investments | | | — | | | | — | | | | — | | | | — | | | | (0.21 | ) |
Total distributions declared to shareholders | | | $(0.30 | ) | | | $(0.30 | ) | | | $(0.23 | ) | | | $(0.23 | ) | | | $(0.46 | ) |
Net asset value, end of period (x) | | | $16.27 | | | | $14.26 | | | | $14.70 | | | | $12.96 | | | | $13.05 | |
Total return (%) (r)(s)(x) | | | 16.42 | | | | (0.84 | ) | | | 15.19 | | | | 0.95 | | | | (16.03 | ) |
Ratios (%) (to average net assets)
and Supplemental data: | | | | | | | | | | | | | | | | | | | | |
Expenses before expense reductions (f) | | | 0.93 | | | | 0.96 | | | | 0.95 | | | | 1.00 | | | | 1.00 | |
Expenses after expense reductions (f) | | | 0.93 | | | | 0.96 | | | | 0.95 | | | | 1.00 | | | | 1.00 | |
Net investment income | | | 1.60 | | | | 2.28 | | | | 1.83 | | | | 1.77 | | | | 1.72 | |
Portfolio turnover | | | 32 | | | | 37 | | | | 43 | | | | 56 | | | | 88 | |
Net assets at end of period (000 omitted) | | | $470,915 | | | | $825,288 | | | | $561,557 | | | | $482,217 | | | | $476,076 | |
| |
| Class R5 (y) | | Years ended 8/31 | |
| | | 2013 | | | 2012 | | | 2011 | | | 2010 | | | 2009 | |
Net asset value, beginning of period | | | $14.20 | | | | $14.63 | | | | $12.90 | | | | $13.00 | | | | $16.14 | |
| Income (loss) from investment operations | | | | | | | | | | | | | | | | | |
Net investment income (d) | | | $0.33 | | | | $0.17 | | | | $0.26 | | | | $0.23 | | | | $0.24 | |
Net realized and unrealized gain (loss)
on investments and foreign currency | | | 1.99 | | | | (0.31 | )(g) | | | 1.69 | | | | (0.11 | ) | | | (2.93 | ) |
Total from investment operations | | | $2.32 | | | | $(0.14 | ) | | | $1.95 | | | | $0.12 | | | | $(2.69 | ) |
| Less distributions declared to shareholders | | | | | | | | | | | | | | | | | |
From net investment income | | | $(0.31 | ) | | | $(0.29 | ) | | | $(0.22 | ) | | | $(0.22 | ) | | | $(0.24 | ) |
From net realized gain on investments | | | — | | | | — | | | | — | | | | — | | | | (0.21 | ) |
Total distributions declared to shareholders | | | $(0.31 | ) | | | $(0.29 | ) | | | $(0.22 | ) | | | $(0.22 | ) | | | $(0.45 | ) |
Net asset value, end of period (x) | | | $16.21 | | | | $14.20 | | | | $14.63 | | | | $12.90 | | | | $13.00 | |
Total return (%) (r)(s)(x) | | | 16.50 | | | | (0.85 | ) | | | 15.07 | | | | 0.81 | | | | (16.12 | ) |
Ratios (%) (to average net assets)
and Supplemental data: | | | | | | | | | | | | | | | | | | | | |
Expenses before expense reductions (f) | | | 0.81 | | | | 0.89 | | | | 1.05 | | | | 1.10 | | | | 1.14 | |
Expenses after expense reductions (f) | | | 0.81 | | | | 0.89 | | | | 1.05 | | | | 1.10 | | | | 1.14 | |
Net investment income | | | 2.09 | | | | 1.20 | (l) | | | 1.71 | | | | 1.73 | | | | 2.25 | |
Portfolio turnover | | | 32 | | | | 37 | | | | 43 | | | | 56 | | | | 88 | |
Net assets at end of period (000 omitted) | | | $2,331,325 | | | | $1,433,832 | | | | $26,173 | | | | $24,820 | | | | $23,560 | |
See Notes to Financial Statements
26
Financial Highlights – continued
| | | | | | | | | | | | | | | | | | | | |
| Class 529A | | Years ended 8/31 | |
| | | 2013 | | | 2012 | | | 2011 | | | 2010 | | | 2009 | |
Net asset value, beginning of period | | | $14.06 | | | | $14.49 | | | | $12.78 | | | | $12.88 | | | | $15.96 | |
| Income (loss) from investment operations | | | | | | | | | | | | | | | | | |
Net investment income (d) | | | $0.25 | | | | $0.27 | | | | $0.22 | | | | $0.20 | | | | $0.21 | |
Net realized and unrealized gain (loss)
on investments and foreign currency | | | 1.98 | | | | (0.45 | ) | | | 1.68 | | | | (0.12 | ) | | | (2.89 | ) |
Total from investment operations | | | $2.23 | | | | $(0.18 | ) | | | $1.90 | | | | $0.08 | | | | $(2.68 | ) |
| Less distributions declared to shareholders | | | | | | | | | | | | | | | | | |
From net investment income | | | $(0.26 | ) | | | $(0.25 | ) | | | $(0.19 | ) | | | $(0.18 | ) | | | $(0.19 | ) |
From net realized gain on investments | | | — | | | | — | | | | — | | | | — | | | | (0.21 | ) |
Total distributions declared to shareholders | | | $(0.26 | ) | | | $(0.25 | ) | | | $(0.19 | ) | | | $(0.18 | ) | | | $(0.40 | ) |
Net asset value, end of period (x) | | | $16.03 | | | | $14.06 | | | | $14.49 | | | | $12.78 | | | | $12.88 | |
Total return (%) (r)(s)(t)(x) | | | 16.05 | | | | (1.15 | ) | | | 14.80 | | | | 0.54 | | | | (16.32 | ) |
Ratios (%) (to average net assets)
and Supplemental data: | | | | | | | | | | | | | | | | | | | | |
Expenses before expense reductions (f) | | | 1.28 | | | | 1.31 | | | | 1.30 | | | | 1.35 | | | | 1.45 | |
Expenses after expense reductions (f) | | | 1.21 | | | | 1.26 | | | | 1.29 | | | | 1.35 | | | | 1.45 | |
Net investment income | | | 1.62 | | | | 1.96 | | | | 1.47 | | | | 1.47 | | | | 1.90 | |
Portfolio turnover | | | 32 | | | | 37 | | | | 43 | | | | 56 | | | | 88 | |
Net assets at end of period (000 omitted) | | | $2,105 | | | | $1,762 | | | | $1,747 | | | | $1,512 | | | | $1,451 | |
| |
| Class 529B | | Years ended 8/31 | |
| | | 2013 | �� | | 2012 | | | 2011 | | | 2010 | | | 2009 | |
Net asset value, beginning of period | | | $13.25 | | | | $13.57 | | | | $11.99 | | | | $12.11 | | | | $15.05 | |
| Income (loss) from investment operations | | | | | | | | | | | | | | | | | |
Net investment income (d) | | | $0.12 | | | | $0.13 | | | | $0.09 | | | | $0.09 | | | | $0.12 | |
Net realized and unrealized gain (loss)
on investments and foreign currency | | | 1.88 | | | | (0.38 | ) | | | 1.58 | | | | (0.10 | ) | | | (2.74 | ) |
Total from investment operations | | | $2.00 | | | | $(0.25 | ) | | | $1.67 | | | | $(0.01 | ) | | | $(2.62 | ) |
| Less distributions declared to shareholders | | | | | | | | | | | | | | | | | |
From net investment income | | | $(0.11 | ) | | | $(0.07 | ) | | | $(0.09 | ) | | | $(0.11 | ) | | | $(0.11 | ) |
From net realized gain on investments | | | — | | | | — | | | | — | | | | — | | | | (0.21 | ) |
Total distributions declared to shareholders | | | $(0.11 | ) | | | $(0.07 | ) | | | $(0.09 | ) | | | $(0.11 | ) | | | $(0.32 | ) |
Net asset value, end of period (x) | | | $15.14 | | | | $13.25 | | | | $13.57 | | | | $11.99 | | | | $12.11 | |
Total return (%) (r)(s)(t)(x) | | | 15.15 | | | | (1.84 | ) | | | 13.90 | | | | (0.14 | ) | | | (16.99 | ) |
Ratios (%) (to average net assets)
and Supplemental data: | | | | | | | | | | | | | | | | | | | | |
Expenses before expense reductions (f) | | | 2.03 | | | | 2.06 | | | | 2.04 | | | | 2.10 | | | | 2.15 | |
Expenses after expense reductions (f) | | | 1.98 | | | | 2.01 | | | | 2.04 | | | | 2.10 | | | | 2.15 | |
Net investment income | | | 0.82 | | | | 1.03 | | | | 0.66 | | | | 0.69 | | | | 1.19 | |
Portfolio turnover | | | 32 | | | | 37 | | | | 43 | | | | 56 | | | | 88 | |
Net assets at end of period (000 omitted) | | | $188 | | | | $199 | | | | $366 | | | | $461 | | | | $449 | |
See Notes to Financial Statements
27
Financial Highlights – continued
| | | | | | | | | | | | | | | | | | | | |
| Class 529C | | Years ended 8/31 | |
| | | 2013 | | | 2012 | | | 2011 | | | 2010 | | | 2009 | |
Net asset value, beginning of period | | | $13.17 | | | | $13.56 | | | | $12.00 | | | | $12.12 | | | | $15.06 | |
| Income (loss) from investment operations | | | | | | | | | | | | | | | | | |
Net investment income (d) | | | $0.12 | | | | $0.15 | | | | $0.11 | | | | $0.09 | | | | $0.13 | |
Net realized and unrealized gain (loss)
on investments and foreign currency | | | 1.86 | | | | (0.41 | ) | | | 1.56 | | | | (0.10 | ) | | | (2.75 | ) |
Total from investment operations | | | $1.98 | | | | $(0.26 | ) | | | $1.67 | | | | $(0.01 | ) | | | $(2.62 | ) |
| Less distributions declared to shareholders | | | | | | | | | | | | | | | | | |
From net investment income | | | $(0.17 | ) | | | $(0.13 | ) | | | $(0.11 | ) | | | $(0.11 | ) | | | $(0.11 | ) |
From net realized gain on investments | | | — | | | | — | | | | — | | | | — | | | | (0.21 | ) |
Total distributions declared to shareholders | | | $(0.17 | ) | | | $(0.13 | ) | | | $(0.11 | ) | | | $(0.11 | ) | | | $(0.32 | ) |
Net asset value, end of period (x) | | | $14.98 | | | | $13.17 | | | | $13.56 | | | | $12.00 | | | | $12.12 | |
Total return (%) (r)(s)(t)(x) | | | 15.17 | | | | (1.83 | ) | | | 13.89 | | | | (0.11 | ) | | | (16.98 | ) |
Ratios (%) (to average net assets)
and Supplemental data: | | | | | | | | | | | | | | | | | | | | |
Expenses before expense reductions (f) | | | 2.03 | | | | 2.06 | | | | 2.05 | | | | 2.10 | | | | 2.15 | |
Expenses after expense reductions (f) | | | 1.98 | | | | 2.01 | | | | 2.04 | | | | 2.10 | | | | 2.15 | |
Net investment income | | | 0.81 | | | | 1.19 | | | | 0.81 | | | | 0.76 | | | | 1.23 | |
Portfolio turnover | | | 32 | | | | 37 | | | | 43 | | | | 56 | | | | 88 | |
Net assets at end of period (000 omitted) | | | $950 | | | | $914 | | | | $906 | | | | $796 | | | | $631 | |
| (d) | Per share data is based on average shares outstanding. |
| (f) | Ratios do not reflect reductions from fees paid indirectly, if applicable. |
| (g) | The per share amount varies from the net realized and unrealized gain/loss for the period because of the timing of sales of fund shares and the per share amount of realized and unrealized gains and losses at such time. |
| (l) | The net investment income ratio does not vary by the class specific expense differential because of the timing of sales of fund shares and the allocation of fund level income at such time. |
| (r) | Certain expenses have been reduced without which performance would have been lower. |
| (s) | From time to time the fund may receive proceeds from litigation settlements, without which performance would be lower. |
| (t) | Total returns do not include any applicable sales charges. |
| (x) | The net asset values per share and total returns have been calculated on net assets which include adjustments made in accordance with U.S. generally accepted accounting principles required at period end for financial reporting purposes. |
| (y) | As further discussed in Note 5 in the Notes to Financial Statements, on May 10, 2012, sales of Class W shares (including exchanges) were suspended. On May 11, 2012, certain Class W shares were automatically converted to Class I shares. Shareholders of certain Class W shares became shareholders of Class I and received Class I shares with a total net asset value equal to their Class W shares at the time of the conversion. On May 30, 2012, remaining Class W shares, which represented MFS seed money, were redesignated Class R5. Class R5 shares are generally available only to certain eligible retirement plans and to funds distributed by MFD. Class R5 shares do not pay a 12b-1 distribution fee or sub-accounting costs. On June 1, 2012, Class R5 shares were offered for sale to the public. For further information about the fund’s fee arrangements, please see Note 3 in the Notes to Financial Statements. |
See Notes to Financial Statements
28
NOTES TO FINANCIAL STATEMENTS
(1) Business and Organization
MFS Research International Fund (the fund) is a series of MFS Series Trust I (the trust). The trust is organized as a Massachusetts business trust and is registered under the Investment Company Act of 1940, as amended, as an open-end management investment company.
(2) Significant Accounting Policies
General – The preparation of financial statements in conformity with U.S. generally accepted accounting principles requires management to make estimates and assumptions that affect the reported amounts of assets and liabilities, and disclosure of contingent assets and liabilities at the date of the financial statements and the reported amounts of revenues and expenses during the reporting period. Actual results could differ from those estimates. In the preparation of these financial statements, management has evaluated subsequent events occurring after the date of the fund’s Statement of Assets and Liabilities through the date that the financial statements were issued. The fund invests in foreign securities. Investments in foreign securities are vulnerable to the effects of changes in the relative values of the local currency and the U.S. dollar and to the effects of changes in each country’s legal, political, and economic environment.
In January 2013, the Financial Accounting Standards Board (FASB) issued Accounting Standards Update 2013-01 (“ASU 2013-01”) entitled Balance Sheet (Topic 210) – Clarifying the Scope of Disclosures about Offsetting Assets and Liabilities which is intended to clarify the scope of Accounting Standards Update 2011-11 (“ASU 2011-11”), Balance Sheet (Topic 210) – Disclosures about Offsetting Assets and Liabilities. Consistent with the effective date for ASU 2011-11, ASU 2013-01 is effective for annual reporting periods beginning on or after January 1, 2013, and interim periods within those annual periods. ASU 2013-01 limits the scope of ASU 2011-11’s disclosure requirements on offsetting to financial assets and financial liabilities related to derivatives, repurchase and reverse repurchase agreements, and securities lending and securities borrowing transactions. Although still evaluating the potential impact of these two ASUs to the fund, management expects that the impact of the fund’s adoption will be limited to additional financial statement disclosures.
In June 2013, FASB issued Accounting Standards Update 2013-08 Financial Services – Investment Companies (Topic 946) – Amendments to the Scope, Measurement, and Disclosure Requirements (“ASU 2013-08”) which is effective for interim and annual reporting periods in fiscal years that begin after December 15, 2013. ASU 2013-08 sets forth a methodology for determining whether an entity should be characterized as an investment company and prescribes fair value accounting for an investment company’s non-controlling ownership interest in another investment company. FASB has determined that a fund registered under the Investment Company Act of 1940 automatically meets ASU 2013-08’s criteria for an investment company. Although still evaluating the potential impacts of ASU 2013-08 to the fund, management expects that the impact of the fund’s adoption will be limited to additional financial statement disclosures.
29
Notes to Financial Statements – continued
Investment Valuations – Equity securities, including restricted equity securities, are generally valued at the last sale or official closing price as provided by a third-party pricing service on the market or exchange on which they are primarily traded. Equity securities, for which there were no sales reported that day, are generally valued at the last quoted daily bid quotation as provided by a third-party pricing service on the market or exchange on which such securities are primarily traded. Short-term instruments with a maturity at issuance of 60 days or less generally are valued at amortized cost, which approximates market value. Open-end investment companies are generally valued at net asset value per share. Securities and other assets generally valued on the basis of information from a third-party pricing service may also be valued at a broker/dealer bid quotation. Values obtained from third-party pricing services can utilize both transaction data and market information such as yield, quality, coupon rate, maturity, type of issue, trading characteristics, and other market data. The values of foreign securities and other assets and liabilities expressed in foreign currencies are converted to U.S. dollars using the mean of bid and asked prices for rates provided by a third-party pricing service.
The Board of Trustees has delegated primary responsibility for determining or causing to be determined the value of the fund’s investments (including any fair valuation) to the adviser pursuant to valuation policies and procedures approved by the Board. If the adviser determines that reliable market quotations are not readily available, investments are valued at fair value as determined in good faith by the adviser in accordance with such procedures under the oversight of the Board of Trustees. Under the fund’s valuation policies and procedures, market quotations are not considered to be readily available for most types of debt instruments and floating rate loans and many types of derivatives. These investments are generally valued at fair value based on information from third-party pricing services. In addition, investments may be valued at fair value if the adviser determines that an investment’s value has been materially affected by events occurring after the close of the exchange or market on which the investment is principally traded (such as foreign exchange or market) and prior to the determination of the fund’s net asset value, or after the halting of trading of a specific security where trading does not resume prior to the close of the exchange or market on which the security is principally traded. Events that occur on a frequent basis after foreign markets close (such as developments in foreign markets and significant movements in the U.S. markets) and prior to the determination of the fund’s net asset value may be deemed to have a material effect on the value of securities traded in foreign markets. Accordingly, the fund’s foreign equity securities may often be valued at fair value. The adviser generally relies on third-party pricing services or other information (such as the correlation with price movements of similar securities in the same or other markets; the type, cost and investment characteristics of the security; the business and financial condition of the issuer; and trading and other market data) to assist in determining whether to fair value and at what value to fair value an investment. The value of an investment for purposes of calculating the fund’s net asset value can differ depending on the source and method used to determine value. When fair valuation is used, the value of an investment used to determine the fund’s net asset value may differ from quoted or published prices for the same investment. There can be no assurance that
30
Notes to Financial Statements – continued
the fund could obtain the fair value assigned to an investment if it were to sell the investment at the same time at which the fund determines its net asset value per share.
Various inputs are used in determining the value of the fund’s assets or liabilities. These inputs are categorized into three broad levels. In certain cases, the inputs used to measure fair value may fall into different levels of the fair value hierarchy. In such cases, an investment’s level within the fair value hierarchy is based on the lowest level of input that is significant to the fair value measurement. The fund’s assessment of the significance of a particular input to the fair value measurement in its entirety requires judgment, and considers factors specific to the investment. Level 1 includes unadjusted quoted prices in active markets for identical assets or liabilities. Level 2 includes other significant observable market-based inputs (including quoted prices for similar securities, interest rates, prepayment speed, and credit risk). Level 3 includes unobservable inputs, which may include the adviser’s own assumptions in determining the fair value of investments. The following is a summary of the levels used as of August 31, 2013 in valuing the fund’s assets or liabilities:
| | | | | | | | | | | | | | | | |
| Investments at Value | | Level 1 | | | Level 2 | | | Level 3 | | | Total | |
| Equity Securities: | | | | | | | | | | | | | | | | |
Japan | | | $186,748,404 | | | | $1,119,992,388 | | | | $— | | | | $1,306,740,792 | |
United Kingdom | | | 1,130,850,365 | | | | — | | | | — | | | | 1,130,850,365 | |
Switzerland | | | 672,420,178 | | | | — | | | | — | | | | 672,420,178 | |
France | | | 665,547,476 | | | | — | | | | — | | | | 665,547,476 | |
Germany | | | 377,087,018 | | | | — | | | | — | | | | 377,087,018 | |
Hong Kong | | | 81,003,811 | | | | 210,784,479 | | | | — | | | | 291,788,290 | |
Netherlands | | | 232,428,280 | | | | — | | | | — | | | | 232,428,280 | |
Sweden | | | 211,088,669 | | | | — | | | | — | | | | 211,088,669 | |
Australia | | | — | | | | 198,669,143 | | | | — | | | | 198,669,143 | |
Other Countries | | | 772,122,531 | | | | 244,860,545 | | | | — | | | | 1,016,983,076 | |
| Mutual Funds | | | 65,844,279 | | | | — | | | | — | | | | 65,844,279 | |
| Total Investments | | | $4,395,141,011 | | | | $1,774,306,555 | | | | $— | | | | $6,169,447,566 | |
For further information regarding security characteristics, see the Portfolio of Investments.
Of the level 2 investments presented above, equity investments amounting to $192,301,370 would have been considered level 1 investments at the beginning of the period. Of the level 1 investments presented above, equity investments amounting to $297,501,488 would have been considered level 2 investments at the beginning of the period. The primary reason for changes in the classifications between levels 1 and 2 occurs when foreign equity securities are fair valued using other observable market-based inputs in place of the closing exchange price due to events occurring after the close of the exchange or market on which the investment is principally traded. The fund’s foreign equity securities may often be valued at fair value. The fund’s policy is to recognize transfers between the levels as of the end of the period.
Foreign Currency Translation – Purchases and sales of foreign investments, income, and expenses are converted into U.S. dollars based upon currency exchange rates prevailing on the respective dates of such transactions or on the reporting date for foreign denominated receivables and payables. Gains and losses attributable to foreign
31
Notes to Financial Statements – continued
currency exchange rates on sales of securities are recorded for financial statement purposes as net realized gains and losses on investments. Gains and losses attributable to foreign exchange rate movements on receivables, payables, income and expenses are recorded for financial statement purposes as foreign currency transaction gains and losses. That portion of both realized and unrealized gains and losses on investments that results from fluctuations in foreign currency exchange rates is not separately disclosed.
Security Loans – State Street Bank and Trust Company (“State Street”), as lending agent, loans the securities of the fund to certain qualified institutions (the “Borrowers”) approved by the fund. The loans are collateralized by cash and/or U.S. Treasury and federal agency obligations in an amount typically at least equal to the market value of the securities loaned. The market value of the loaned securities is determined at the close of business of the fund and any additional required collateral is delivered to the fund on the next business day. State Street provides the fund with indemnification against Borrower default. The fund bears the risk of loss with respect to the investment of cash collateral. On loans collateralized by cash, the cash collateral is invested in a money market fund or short-term securities. Collateral for securities loaned is held at carrying value, which approximates fair value. If the collateral for securities loaned was carried at fair value, its fair value would be considered level 2 under the fair value hierarchy. A portion of the income generated upon investment of the collateral is remitted to the Borrowers, and the remainder is allocated between the fund and the lending agent. On loans collateralized by U.S. Treasury and/or federal agency obligations, a fee is received from the Borrower, and is allocated between the fund and the lending agent. Income from securities lending is included in “Interest” income in the Statement of Operations. The dividend and interest income earned on the securities loaned is accounted for in the same manner as other dividend and interest income.
Indemnifications – Under the fund’s organizational documents, its officers and Trustees may be indemnified against certain liabilities and expenses arising out of the performance of their duties to the fund. Additionally, in the normal course of business, the fund enters into agreements with service providers that may contain indemnification clauses. The fund’s maximum exposure under these agreements is unknown as this would involve future claims that may be made against the fund that have not yet occurred.
Investment Transactions and Income – Investment transactions are recorded on the trade date. Interest income is recorded on the accrual basis. Dividends received in cash are recorded on the ex-dividend date. Certain dividends from foreign securities will be recorded when the fund is informed of the dividend if such information is obtained subsequent to the ex-dividend date. Dividend and interest payments received in additional securities are recorded on the ex-dividend or ex-interest date in an amount equal to the value of the security on such date.
The fund may receive proceeds from litigation settlements. Any proceeds received from litigation involving portfolio holdings are reflected in the Statement of Operations in realized gain/loss if the security has been disposed of by the fund or in unrealized gain/loss if the security is still held by the fund. Any other proceeds from litigation not related to portfolio holdings are reflected as other income in the Statement of Operations.
32
Notes to Financial Statements – continued
Fees Paid Indirectly – The fund’s custody fee may be reduced according to an arrangement that measures the value of cash deposited with the custodian by the fund. This amount, for the year ended August 31, 2013, is shown as a reduction of total expenses in the Statement of Operations.
Tax Matters and Distributions – The fund intends to qualify as a regulated investment company, as defined under Subchapter M of the Internal Revenue Code, and to distribute all of its taxable income, including realized capital gains. As a result, no provision for federal income tax is required. The fund’s federal tax returns, when filed, will remain subject to examination by the Internal Revenue Service for a three year period. Foreign taxes have been accrued by the fund in the accompanying financial statements in accordance with the applicable foreign tax law. Foreign income taxes may be withheld by certain countries in which the fund invests. Additionally, capital gains realized by the fund on securities issued in or by certain foreign countries may be subject to capital gains tax imposed by those countries.
Distributions to shareholders are recorded on the ex-dividend date. Income and capital gain distributions are determined in accordance with income tax regulations, which may differ from U.S. generally accepted accounting principles. Certain capital accounts in the financial statements are periodically adjusted for permanent differences in order to reflect their tax character. These adjustments have no impact on net assets or net asset value per share. Temporary differences which arise from recognizing certain items of income, expense, gain or loss in different periods for financial statement and tax purposes will reverse at some time in the future. Distributions in excess of net investment income or net realized gains are temporary overdistributions for financial statement purposes resulting from differences in the recognition or classification of income or distributions for financial statement and tax purposes.
Book/tax differences primarily relate to passive foreign investment companies and wash sale loss deferrals.
The tax character of distributions declared to shareholders for the last two fiscal years is as follows:
| | | | | | | | |
| | | 8/31/13 | | | 8/31/12 | |
Ordinary income (including any
short-term capital gains) | | | $97,500,392 | | | | $86,230,428 | |
The federal tax cost and the tax basis components of distributable earnings were as follows:
| | | | |
| As of 8/31/13 | | | |
| Cost of investments | | | $5,708,914,847 | |
| Gross appreciation | | | 785,706,233 | |
| Gross depreciation | | | (325,173,514 | ) |
| Net unrealized appreciation (depreciation) | | | $460,532,719 | |
| Undistributed ordinary income | | | 103,215,727 | |
| Capital loss carryforwards | | | (690,020,638 | ) |
| Other temporary differences | | | (873,843 | ) |
33
Notes to Financial Statements – continued
Under the Regulated Investment Company Modernization Act of 2010 (the “Act”), net capital losses recognized for fund fiscal years beginning after August 31, 2011 may be carried forward indefinitely, and their character is retained as short-term and/or long-term losses (“post-enactment losses”). Previously, net capital losses were carried forward for eight years and treated as short-term losses (“pre-enactment losses”). As a transition rule, the Act requires that all post-enactment net capital losses be used before pre-enactment net capital losses.
As of August 31, 2013, the fund had capital loss carryforwards available to offset future realized gains. Such pre-enactment losses expire as follows:
Multiple Classes of Shares of Beneficial Interest – The fund offers multiple classes of shares, which differ in their respective distribution, service, and program manager fees. The fund’s income, realized and unrealized gain (loss), and common expenses are allocated to shareholders based on the daily net assets of each class. Dividends are declared separately for each class. Differences in per share dividend rates are generally due to differences in separate class expenses. Class B and Class 529B shares will convert to Class A and Class 529A shares, respectively, approximately eight years after purchase. The fund’s distributions declared to shareholders as reported in the Statements of Changes in Net Assets are presented by class as follows:
| | | | | | | | |
| | | From net investment
income | |
| | | Year
ended
8/31/13 | | | Year
ended
8/31/12 | |
| Class A | | | $18,082,585 | | | | $17,123,611 | |
| Class B | | | 216,225 | | | | 241,704 | |
| Class C | | | 914,829 | | | | 927,483 | |
| Class I | | | 24,235,060 | | | | 50,054,535 | |
| Class R1 | | | 49,846 | | | | 67,476 | |
| Class R2 | | | 1,877,801 | | | | 1,503,599 | |
| Class R3 | | | 3,284,789 | | | | 2,881,452 | |
| Class R4 | | | 17,572,798 | | | | 12,653,505 | |
| Class R5 (formerly Class W) | | | 31,219,429 | | | | 736,250 | |
| Class 529A | | | 33,635 | | | | 30,552 | |
| Class 529B | | | 1,468 | | | | 1,521 | |
| Class 529C | | | 11,927 | | | | 8,740 | |
| Total | | | $97,500,392 | | | | $86,230,428 | |
On May 30, 2012, Class W shares were redesignated Class R5. See Note 5 for additional information.
(3) Transactions with Affiliates
Investment Adviser – The fund has an investment advisory agreement with MFS to provide overall investment management and related administrative services and facilities to the fund.
34
Notes to Financial Statements – continued
The management fee is computed daily and paid monthly at the following annual rates:
| | | | |
| First $1 billion of average daily net assets | | | 0.90 | % |
| Next $1 billion of average daily net assets | | | 0.80 | % |
| Average daily net assets in excess of $2 billion | | | 0.70 | % |
Effective August 1, 2013, the investment adviser has agreed in writing to reduce its management fee to 0.65% of average daily net assets in excess of $5 billion up to $10 billion, and 0.60% of average daily net assets in excess of $10 billion. This written agreement will continue until modified by the fund’s Board of Trustees, but such agreement will continue at least until December 31, 2014. For the period August 1, 2013 through August 31, 2013, this management fee reduction amounted to $58,316, which is shown as a reduction of total expenses in the Statement of Operations. Effective April 1, 2013, MFS has agreed in writing to reduce its management fee by a specified amount if certain MFS mutual fund assets exceed thresholds agreed to by MFS and the fund’s Board of Trustees. For the period April 1, 2013 through August 31, 2013, this management fee reduction amounted to $13,688, which is shown as a reduction of total expenses in the Statement of Operations. The management fee incurred for the year ended August 31, 2013 was equivalent to an annual effective rate of 0.75% of the fund’s average daily net assets.
Distributor – MFS Fund Distributors, Inc. (MFD), a wholly-owned subsidiary of MFS, as distributor, received $56,837 and $1,321 for the year ended August 31, 2013, as its portion of the initial sales charge on sales of Class A and Class 529A shares of the fund, respectively.
The Board of Trustees has adopted a distribution plan for certain class shares pursuant to Rule 12b-1 of the Investment Company Act of 1940.
The fund’s distribution plan provides that the fund will pay MFD for services provided by MFD and financial intermediaries in connection with the distribution and servicing of certain share classes. One component of the plan is a distribution fee paid to MFD and another component of the plan is a service fee paid to MFD. MFD may subsequently pay all, or a portion, of the distribution and/or service fees to financial intermediaries.
Distribution Plan Fee Table:
| | | | | | | | | | | | | | | | | | | | |
| | | Distribution
Fee Rate (d) | | | Service Fee
Rate (d) | | | Total
Distribution Plan (d) | | | Annual
Effective Rate (e) | | | Distribution
and Service
Fee | |
| Class A | | | — | | | | 0.25% | | | | 0.25% | | | | 0.25% | | | | $2,704,580 | |
| Class B | | | 0.75% | | | | 0.25% | | | | 1.00% | | | | 1.00% | | | | 223,486 | |
| Class C | | | 0.75% | | | | 0.25% | | | | 1.00% | | | | 1.00% | | | | 862,908 | |
| Class R1 | | | 0.75% | | | | 0.25% | | | | 1.00% | | | | 1.00% | | | | 46,309 | |
| Class R2 | | | 0.25% | | | | 0.25% | | | | 0.50% | | | | 0.50% | | | | 619,564 | |
| Class R3 | | | — | | | | 0.25% | | | | 0.25% | | | | 0.25% | | | | 471,713 | |
| Class 529A | | | — | | | | 0.25% | | | | 0.25% | | | | 0.23% | | | | 5,082 | |
| Class 529B | | | 0.75% | | | | 0.25% | | | | 1.00% | | | | 1.00% | | | | 1,948 | |
| Class 529C | | | 0.75% | | | | 0.25% | | | | 1.00% | | | | 1.00% | | | | 9,516 | |
| Total Distribution and Service Fees | | | | $4,945,106 | |
35
Notes to Financial Statements – continued
| (d) | In accordance with the distribution plan for certain classes, the fund pays distribution and/or service fees equal to these annual percentage rates of each class’s average daily net assets. The distribution and service fee rates disclosed by class represent the current rates in effect at the end of the reporting period. |
| (e) | The annual effective rates represent actual fees incurred under the distribution plan for the year ended August 31, 2013 based on each class’s average daily net assets. Effective January 1, 2013, MFD has voluntarily agreed to rebate a portion of each class’s 0.25% service fee attributable to accounts for which MFD retains the 0.25% service fee except for accounts attributable to MFS or its subsidiaries’ seed money. For the period January 1, 2013 through August 31, 2013, this rebate amounted to $6,113, $91, $57, $389, and $2 for Class A, Class B, Class C, Class 529A, and Class 529B, respectively, and is reflected as a reduction of total expenses in the Statement of Operations. |
Certain Class A shares are subject to a contingent deferred sales charge (CDSC) in the event of a shareholder redemption within 18 months of purchase for shares purchased on or after August 1, 2012, and within 24 months of purchase for shares purchased prior to August 1, 2012. Class C and Class 529C shares are subject to a CDSC in the event of a shareholder redemption within 12 months of purchase. Class B and Class 529B shares are subject to a CDSC in the event of a shareholder redemption within six years of purchase. All contingent deferred sales charges are paid to MFD and during the year ended August 31, 2013, were as follows:
| | | | |
| | | Amount | |
| Class A | | | $950 | |
| Class B | | | 22,020 | |
| Class C | | | 4,889 | |
| Class 529B | | | — | |
| Class 529C | | | — | |
The fund has entered into and may from time to time enter into contracts with program managers and other parties which administer the tuition programs through which an investment in the fund’s 529 share classes is made. The fund has entered into an agreement with MFD pursuant to which MFD receives an annual fee of up to 0.10% of the average daily net assets attributable to each 529 share class. MFD has agreed to waive a portion of this fee in an amount equal to 0.05% of the average daily net assets for each 529 share class. This waiver agreement will expire on December 31, 2014 unless MFD elects to extend the waiver. For the year ended August 31, 2013, this waiver amounted to $1,589 and is reflected as a reduction of total expenses in the Statement of Operations. The program manager fee incurred for the year ended August 31, 2013 was equivalent to an annual effective rate of 0.05% of the average daily net assets attributable to each 529 share class. The services provided by MFD, or a third party with which MFD contracts, include recordkeeping and tax reporting and account services, as well as services designed to maintain the program’s compliance with the Internal Revenue Code and other regulatory requirements. Program manager fees and waivers for the year ended August 31, 2013, were as follows:
| | | | | | | | |
| | | Fee | | | Waiver | |
| Class 529A | | | $2,033 | | | | $1,016 | |
| Class 529B | | | 195 | | | | 97 | |
| Class 529C | | | 952 | | | | 476 | |
| Total Program Manager Fees and Waivers | | | $3,180 | | | | $1,589 | |
36
Notes to Financial Statements – continued
Shareholder Servicing Agent – MFS Service Center, Inc. (MFSC), a wholly-owned subsidiary of MFS, receives a fee from the fund for its services as shareholder servicing agent calculated as a percentage of the average daily net assets of the fund as determined periodically under the supervision of the fund’s Board of Trustees. For the year ended August 31, 2013, the fee was $399,146, which equated to 0.0072% annually of the fund’s average daily net assets. MFSC also receives payment from the fund for out-of-pocket expenses, sub-accounting and other shareholder servicing costs which may be paid to affiliated and unaffiliated service providers. Class R5 shares do not incur sub-accounting fees. For the year ended August 31, 2013, these out-of-pocket expenses, sub-accounting and other shareholder servicing costs amounted to $4,446,326.
Administrator – MFS provides certain financial, legal, shareholder communications, compliance, and other administrative services to the fund. Under an administrative services agreement, the fund partially reimburses MFS the costs incurred to provide these services. The fund is charged an annual fixed amount of $17,500 plus a fee based on average daily net assets. The administrative services fee incurred for the year ended August 31, 2013 was equivalent to an annual effective rate of 0.0094% of the fund’s average daily net assets.
Trustees’ and Officers’ Compensation – The fund pays compensation to independent Trustees in the form of a retainer, attendance fees, and additional compensation to Board and Committee chairpersons. The fund does not pay compensation directly to Trustees or officers of the fund who are also officers of the investment adviser, all of whom receive remuneration for their services to the fund from MFS. Certain officers and Trustees of the fund are officers or directors of MFS, MFD, and MFSC.
Prior to December 31, 2001, the fund had an unfunded defined benefit plan (“DB plan”) for independent Trustees. As of December 31, 2001, the Board took action to terminate the DB plan with respect to then-current and any future independent Trustees, such that the DB plan covers only certain of those former independent Trustees who retired on or before December 31, 2001. Effective January 1, 2002, accrued benefits under the DB plan for then-current independent Trustees who continued were credited to an unfunded retirement deferral plan (the “Retirement Deferral plan”), which was established for and exists solely with respect to these credited amounts, and is not available for other deferrals by these or other independent Trustees. Although the Retirement Deferral plan is unfunded, amounts deferred under the plan are periodically adjusted for investment experience as if they had been invested in shares of the fund. The DB plan resulted in a pension expense of $119 and the Retirement Deferral plan resulted in an expense of $2,455. Both amounts are included in independent Trustees’ compensation for the year ended August 31, 2013. The liability for deferred retirement benefits payable to certain independent Trustees under both plans amounted to $15,163 at August 31, 2013, and is included in “Payable for independent Trustees’ compensation” in the Statement of Assets and Liabilities.
Other – This fund and certain other funds managed by MFS (the funds) have entered into services agreements (the Agreements) which provide for payment of fees by the funds to Tarantino LLC and Griffin Compliance LLC in return for the provision of
37
Notes to Financial Statements – continued
services of an Independent Chief Compliance Officer (ICCO) and Assistant ICCO, respectively, for the funds. The ICCO and Assistant ICCO are officers of the funds and the sole members of Tarantino LLC and Griffin Compliance LLC, respectively. The funds can terminate the Agreements with Tarantino LLC and Griffin Compliance LLC at any time under the terms of the Agreements. For the year ended August 31, 2013, the aggregate fees paid by the fund to Tarantino LLC and Griffin Compliance LLC were $36,804 and are included in “Miscellaneous” expense in the Statement of Operations. MFS has agreed to reimburse the fund for a portion of the payments made by the fund in the amount of $15,035, which is shown as a reduction of total expenses in the Statement of Operations. Additionally, MFS has agreed to bear all expenses associated with office space, other administrative support, and supplies provided to the ICCO and Assistant ICCO.
The fund invests in the MFS Institutional Money Market Portfolio which is managed by MFS and seeks current income consistent with preservation of capital and liquidity. Income earned on this investment is included in “Dividends from underlying affiliated funds” in the Statement of Operations. This money market fund does not pay a management fee to MFS.
(4) Portfolio Securities
Purchases and sales of investments, other than short-term obligations, aggregated $2,456,205,196 and $1,709,099,831, respectively.
(5) Shares of Beneficial Interest
The fund’s Declaration of Trust permits the Trustees to issue an unlimited number of full and fractional shares of beneficial interest. Transactions in fund shares were as follows:
| | | | | | | | | | | | | | | | |
| | | Year ended
8/31/13 | | | Year ended
8/31/12 | |
| | | Shares | | | Amount | | | Shares | | | Amount | |
| Shares sold | | | | | | | | | | | | | | | | |
Class A | | | 16,279,457 | | | | $254,419,782 | | | | 31,745,318 | | | | $434,532,911 | |
Class B | | | 113,999 | | | | 1,720,590 | | | | 141,471 | | | | 1,876,698 | |
Class C | | | 856,729 | | | | 12,689,293 | | | | 782,952 | | | | 10,214,753 | |
Class I | | | 61,242,598 | | | | 1,017,828,706 | | | | 39,915,301 | | | | 570,186,885 | |
Class R1 | | | 60,541 | | | | 876,339 | | | | 89,252 | | | | 1,159,150 | |
Class R2 | | | 2,636,872 | | | | 40,136,497 | | | | 2,630,956 | | | | 35,516,421 | |
Class R3 | | | 3,459,308 | | | | 53,661,367 | | | | 4,393,432 | | | | 60,527,319 | |
Class R4 | | | 7,651,892 | | | | 118,459,587 | | | | 25,237,244 | | | | 348,372,570 | |
Class R5 (formerly Class W) | | | 48,012,029 | | | | 741,180,408 | | | | 104,354,070 | | | | 1,365,285,483 | |
Class 529A | | | 19,927 | | | | 308,135 | | | | 21,880 | | | | 298,046 | |
Class 529B | | | 940 | | | | 13,451 | | | | 667 | | | | 8,530 | |
Class 529C | | | 5,559 | | | | 79,642 | | | | 12,601 | | | | 161,456 | |
| | | 140,339,851 | | | | $2,241,373,797 | | | | 209,325,144 | | | | $2,828,140,222 | |
38
Notes to Financial Statements – continued
| | | | | | | | | | | | | | | | |
| | | Year ended
8/31/13 | | | Year ended
8/31/12 | |
| | | Shares | | | Amount | | | Shares | | | Amount | |
Shares issued to shareholders in
reinvestment of distributions | | | | | | | | | | | | | |
Class A | | | 988,881 | | | | $14,783,775 | | | | 828,065 | | | | $11,038,101 | |
Class B | | | 12,620 | | | | 181,228 | | | | 15,518 | | | | 198,473 | |
Class C | | | 34,473 | | | | 486,411 | | | | 38,748 | | | | 488,229 | |
Class I | | | 1,092,849 | | | | 16,840,811 | | | | 2,844,394 | | | | 39,081,977 | |
Class R1 | | | 3,550 | | | | 49,310 | | | | 5,200 | | | | 64,422 | |
Class R2 | | | 120,670 | | | | 1,752,131 | | | | 105,935 | | | | 1,373,973 | |
Class R3 | | | 222,095 | | | | 3,284,789 | | | | 218,292 | | | | 2,881,452 | |
Class R4 | | | 1,161,239 | | | | 17,348,909 | | | | 929,045 | | | | 12,374,873 | |
Class R5 (formerly Class W) | | | 2,099,491 | | | | 31,219,429 | | | | 46,986 | | | | 623,506 | |
Class 529A | | | 2,280 | | | | 33,635 | | | | 2,317 | | | | 30,517 | |
Class 529B | | | 103 | | | | 1,468 | | | | 122 | | | | 1,521 | |
Class 529C | | | 861 | | | | 11,927 | | | | 705 | | | | 8,740 | |
| | | 5,739,112 | | | | $85,993,823 | | | | 5,035,327 | | | | $68,165,784 | |
| | | | |
| Shares reacquired | | | | | | | | | | | | | | | | |
Class A | | | (17,149,034 | ) | | | $(268,162,272 | ) | | | (33,254,297 | ) | | | $(455,872,069 | ) |
Class B | | | (572,885 | ) | | | (8,623,274 | ) | | | (805,715 | ) | | | (10,705,015 | ) |
Class C | | | (1,487,418 | ) | | | (21,691,721 | ) | | | (1,783,058 | ) | | | (23,317,054 | ) |
Class I | | | (30,802,793 | ) | | | (503,136,411 | ) | | | (129,048,653 | ) | | | (1,770,003,865 | ) |
Class R1 | | | (168,622 | ) | | | (2,424,736 | ) | | | (184,770 | ) | | | (2,392,107 | ) |
Class R2 | | | (1,873,333 | ) | | | (28,103,295 | ) | | | (1,390,102 | ) | | | (18,857,493 | ) |
Class R3 | | | (3,512,663 | ) | | | (54,511,524 | ) | | | (3,285,867 | ) | | | (45,202,740 | ) |
Class R4 | | | (37,734,633 | ) | | | (579,114,162 | ) | | | (6,505,443 | ) | | | (90,617,432 | ) |
Class R5 (formerly Class W) | | | (7,286,685 | ) | | | (114,338,763 | ) | | | (5,205,165 | ) | | | (71,497,180 | ) |
Class 529A | | | (16,241 | ) | | | (255,887 | ) | | | (19,472 | ) | | | (267,078 | ) |
Class 529B | | | (3,651 | ) | | | (52,851 | ) | | | (12,677 | ) | | | (163,810 | ) |
Class 529C | | | (12,369 | ) | | | (177,310 | ) | | | (10,733 | ) | | | (140,968 | ) |
| | | (100,620,327 | ) | | | $(1,580,592,206 | ) | | | (181,505,952 | ) | | | $(2,489,036,811 | ) |
| | | | |
| Net change | | | | | | | | | | | | | | | | |
Class A | | | 119,304 | | | | $1,041,285 | | | | (680,914 | ) | | | $(10,301,057 | ) |
Class B | | | (446,266 | ) | | | (6,721,456 | ) | | | (648,726 | ) | | | (8,629,844 | ) |
Class C | | | (596,216 | ) | | | (8,516,017 | ) | | | (961,358 | ) | | | (12,614,072 | ) |
Class I | | | 31,532,654 | | | | 531,533,106 | | | | (86,288,958 | ) | | | (1,160,735,003 | ) |
Class R1 | | | (104,531 | ) | | | (1,499,087 | ) | | | (90,318 | ) | | | (1,168,535 | ) |
Class R2 | | | 884,209 | | | | 13,785,333 | | | | 1,346,789 | | | | 18,032,901 | |
Class R3 | | | 168,740 | | | | 2,434,632 | | | | 1,325,857 | | | | 18,206,031 | |
Class R4 | | | (28,921,502 | ) | | | (443,305,666 | ) | | | 19,660,846 | | | | 270,130,011 | |
Class R5 (formerly Class W) | | | 42,824,835 | | | | 658,061,074 | | | | 99,195,891 | | | | 1,294,411,809 | |
Class 529A | | | 5,966 | | | | 85,883 | | | | 4,725 | | | | 61,485 | |
Class 529B | | | (2,608 | ) | | | (37,932 | ) | | | (11,888 | ) | | | (153,759 | ) |
Class 529C | | | (5,949 | ) | | | (85,741 | ) | | | 2,573 | | | | 29,228 | |
| | | 45,458,636 | | | | $746,775,414 | | | | 32,854,519 | | | | $407,269,195 | |
39
Notes to Financial Statements – continued
The fund is one of several mutual funds in which the MFS funds-of-funds may invest. The MFS funds-of-funds do not invest in the underlying MFS funds for the purpose of exercising management or control. At the end of the period, the MFS International Diversification Fund, the MFS Moderate Allocation Fund, the MFS Growth Allocation Fund, the MFS Aggressive Growth Allocation Fund, and the MFS Conservative Allocation Fund were the owners of record of approximately 17%, 5%, 4%, 2%, and 2% respectively, of the value of outstanding voting shares of the fund. In addition, the MFS Lifetime 2010 Fund, the MFS Lifetime 2015 Fund, the MFS Lifetime 2020 Fund, the MFS Lifetime 2025 Fund, the MFS Lifetime 2030 Fund, the MFS Lifetime 2035 Fund, the MFS Lifetime 2040 Fund, the MFS Lifetime 2045 Fund, the MFS Lifetime 2050 Fund, the MFS Lifetime 2055 Fund, and the MFS Lifetime Retirement Income Fund were each the owners of record of less than 1% of the value of outstanding voting shares of the fund.
Redesignation of Class W to Class R5 – On May 10, 2012, sales of Class W shares (including exchanges) were suspended. On May 11, 2012, certain Class W shares were automatically converted to Class I shares. Shareholders of certain Class W shares became shareholders of Class I and received Class I shares with a total net asset value equal to their Class W shares at the time of the conversion. On May 30, 2012, remaining Class W shares, which represented MFS seed money, were redesignated Class R5. Class R5 shares are generally available only to certain eligible retirement plans and to funds distributed by MFD. Class R5 shares do not pay a 12b-1 distribution fee or sub-accounting costs. On June 1, 2012, Class R5 shares were offered for sale to the public.
(6) Line of Credit
The fund and certain other funds managed by MFS participate in a $1.1 billion unsecured committed line of credit, subject to a $1 billion sublimit, provided by a syndication of banks under a credit agreement. Borrowings may be made for temporary financing needs. Interest is charged to each fund, based on its borrowings, generally at a rate equal to the higher of the Federal Reserve funds rate or one month LIBOR plus an agreed upon spread. A commitment fee, based on the average daily, unused portion of the committed line of credit, is allocated among the participating funds at the end of each calendar quarter. In addition, the fund and other funds managed by MFS have established unsecured uncommitted borrowing arrangements with certain banks for temporary financing needs. Interest is charged to each fund, based on its borrowings, at a rate equal to the Federal Reserve funds rate plus an agreed upon spread. For the year ended August 31, 2013, the fund’s commitment fee and interest expense were $28,217 and $0, respectively, and are included in “Miscellaneous” expense in the Statement of Operations.
40
Notes to Financial Statements – continued
(7) Transactions in Underlying Affiliated Funds-Affiliated Issuers
An affiliated issuer may be considered one in which the fund owns 5% or more of the outstanding voting securities, or a company which is under common control. For the purposes of this report, the fund assumes the following to be an affiliated issuer:
| | | | | | | | | | | | | | | | |
| Underlying Affiliated Fund | | Beginning Shares/Par
Amount | | | Acquisitions Shares/Par
Amount | | | Dispositions Shares/Par
Amount | | | Ending Shares/Par
Amount | |
MFS Institutional Money
Market Portfolio | | | 3,603 | | | | 1,383,270,090 | | | | (1,352,421,916 | ) | | | 30,851,777 | |
| | | | |
| Underlying Affiliated Fund | | Realized
Gain (Loss) | | | Capital Gain
Distributions | | | Dividend
Income | | | Ending
Value | |
MFS Institutional Money
Market Portfolio | | | $— | | | | $— | | | | $83,695 | | | | $30,851,777 | |
41
REPORT OF INDEPENDENT REGISTERED PUBLIC ACCOUNTING FIRM
To the Board of Trustees of MFS Series Trust I and Shareholders of MFS Research International Fund:
We have audited the accompanying statement of assets and liabilities of MFS Research International Fund (the Fund) (one of the portfolios comprising MFS Series Trust I), including the portfolio of investments, as of August 31, 2013, and the related statement of operations for the year then ended, the statements of changes in net assets for each of the two years in the period then ended, and the financial highlights for each of the five years in the period then ended. These financial statements and financial highlights are the responsibility of the Fund’s management. Our responsibility is to express an opinion on these financial statements and financial highlights based on our audits.
We conducted our audits in accordance with the standards of the Public Company Accounting Oversight Board (United States). Those standards require that we plan and perform the audit to obtain reasonable assurance about whether the financial statements and financial highlights are free of material misstatement. We were not engaged to perform an audit of the Fund’s internal control over financial reporting. Our audits included consideration of internal control over financial reporting as a basis for designing audit procedures that are appropriate in the circumstances, but not for the purpose of expressing an opinion on the effectiveness of the Fund’s internal control over financial reporting. Accordingly, we express no such opinion. An audit also includes examining, on a test basis, evidence supporting the amounts and disclosures in the financial statements and financial highlights, assessing the accounting principles used and significant estimates made by management, and evaluating the overall financial statement presentation. Our procedures included confirmation of securities owned as of August 31, 2013, by correspondence with the custodian and others or by other appropriate auditing procedures where replies from others were not received. We believe that our audits provide a reasonable basis for our opinion.
In our opinion, the financial statements and financial highlights referred to above present fairly, in all material respects, the financial position of MFS Research International Fund at August 31, 2013, the results of its operations for the year then ended, the changes in its net assets for each of the two years in the period then ended, and its financial highlights for each of the five years in the period then ended, in conformity with U.S. generally accepted accounting principles.

Boston, Massachusetts
October 17, 2013
42
TRUSTEES AND OFFICERS — IDENTIFICATION AND BACKGROUND
The Trustees and Officers of the Trust, as of October 1, 2013, are listed below, together with their principal occupations during the past five years. (Their titles may have varied during that period.) The address of each Trustee and officer is 111 Huntington Avenue, Boston, Massachusetts 02199-7618.
| | | | | | | | |
Name, Age | | Position(s) Held with Fund | | Trustee/Officer
Since (h) | | Principal
Occupations During the Past Five Years | | Other Directorships (j) |
| INTERESTED TRUSTEES |
Robert J. Manning (k) (age 49) | | Trustee | | February 2004 | | Massachusetts Financial Services Company, Chairman, Chief Executive Officer and Director; President (until 2009); Chief Investment Officer (until 2010) | | N/A |
| INDEPENDENT TRUSTEES |
David H. Gunning (age 71) | | Trustee and Chair of Trustees | | January 2004 | | Private investor | | Lincoln Electric Holdings, Inc. (welding equipment manufacturer), Director; Development Alternatives, Inc. (consulting), Director/Non-Executive Chairman; Portman Limited (mining), Director (until 2008) |
Robert E. Butler (age 71) | | Trustee | | January 2006 | | Consultant – investment company industry regulatory and compliance matters | | N/A |
Maureen R. Goldfarb (age 58) | | Trustee | | January 2009 | | Private investor | | N/A |
William R. Gutow (age 72) | | Trustee | | December 1993 | | Private investor and real estate consultant; Capitol Entertainment Management Company (video franchise), Vice Chairman | | Texas Donuts (donut franchise), Vice Chairman (until 2010) |
43
Trustees and Officers – continued
| | | | | | | | |
Name, Age | | Position(s) Held with Fund | | Trustee/Officer
Since (h) | | Principal
Occupations During the Past Five Years | | Other Directorships (j) |
Michael Hegarty (age 68) | | Trustee | | December 2004 | | Private investor | | Brookfield Office Properties, Inc. (real estate), Director; Rouse Properties Inc. (real estate), Director; Capmark Financial Group Inc. (real estate), Director |
John P. Kavanaugh (age 58) | | Trustee | | January 2009 | | Private investor | | N/A |
J. Dale Sherratt (age 75) | | Trustee | | June 1989 | | Insight Resources, Inc. (acquisition planning specialists), President; Wellfleet Investments (investor in health care companies), Managing General Partner | | N/A |
Laurie J. Thomsen (age 56) | | Trustee | | March 2005 | | Private investor; New Profit, Inc. (venture philanthropy), Executive Partner (until 2010) | | The Travelers Companies (insurance), Director |
Robert W. Uek (age 72) | | Trustee | | January 2006 | | Consultant to investment company industry | | N/A |
| OFFICERS |
John M. Corcoran (k) (age 48) | | President | | October 2008 | | Massachusetts Financial Services Company, Senior Vice President (since October 2008); State Street Bank and Trust (financial services provider), Senior Vice President, (until 2008) | | N/A |
Christopher R. Bohane (k) (age 39) | | Assistant Secretary and Assistant Clerk | | July 2005 | | Massachusetts Financial Services Company, Vice President and Assistant General Counsel | | N/A |
Kino Clark (k) (age 45) | | Assistant Treasurer | | January 2012 | | Massachusetts Financial Services Company, Vice President | | N/A |
44
Trustees and Officers – continued
| | | | | | | | |
Name, Age | | Position(s) Held with Fund | | Trustee/Officer
Since (h) | | Principal
Occupations During the Past Five Years | | Other Directorships (j) |
Thomas H. Connors (k) (age 54) | | Assistant Secretary and Assistant Clerk | | September 2012 | | Massachusetts Financial Services Company, Vice President and Senior Counsel; Deutsche Investment Management Americas Inc. (financial service provider), Director and Senior Counsel (until 2012) | | N/A |
Ethan D. Corey (k) (age 49) | | Assistant Secretary and Assistant Clerk | | July 2005 | | Massachusetts Financial Services Company, Senior Vice President and Associate General Counsel | | N/A |
David L. DiLorenzo (k)
(age 45) | | Treasurer | | July 2005 | | Massachusetts Financial Services Company, Senior Vice President | | N/A |
Robyn L. Griffin (age 38) | | Assistant Independent Chief Compliance Officer | | August 2008 | | Griffin Compliance LLC (provider of compliance services), Principal (since August 2008); State Street Corporation (financial services provider), Mutual Fund Administration Assistant Vice President (until 2008) | | N/A |
Brian E. Langenfeld (k) (age 40) | | Assistant Secretary and Assistant Clerk | | June 2006 | | Massachusetts Financial Services Company, Vice President and Senior Counsel | | N/A |
Susan S. Newton (k) (age 63) | | Assistant Secretary and Assistant Clerk | | May 2005 | | Massachusetts Financial Services Company, Senior Vice President and Associate General Counsel | | N/A |
Susan A. Pereira (k) (age 42) | | Assistant Secretary and Assistant Clerk | | July 2005 | | Massachusetts Financial Services Company, Vice President and Senior Counsel | | N/A |
45
Trustees and Officers – continued
| | | | | | | | |
Name, Age | | Position(s) Held with Fund | | Trustee/Officer
Since (h) | | Principal
Occupations During the Past Five Years | | Other Directorships (j) |
Kasey L. Phillips (k) (age 42) | | Assistant Treasurer | | September 2012 | | Massachusetts Financial Services Company, Vice President; Wells Fargo Funds Management, LLC, Senior Vice President, Fund Treasurer (until 2012) | | N/A |
Mark N. Polebaum (k) (age 61) | | Secretary and Clerk | | January 2006 | | Massachusetts Financial Services Company, Executive Vice President, General Counsel and Secretary | | N/A |
Frank L. Tarantino (age 69) | | Independent Chief Compliance Officer | | June 2004 | | Tarantino LLC (provider of compliance services), Principal | | N/A |
Richard S. Weitzel (k) (age 43) | | Assistant Secretary and Assistant Clerk | | October 2007 | | Massachusetts Financial Services Company, Senior Vice President and Associate General Counsel | | N/A |
James O. Yost (k) (age 53) | | Deputy Treasurer | | September 1990 | | Massachusetts Financial Services Company, Senior Vice President | | N/A |
| (h) | Date first appointed to serve as Trustee/officer of an MFS Fund. Each Trustee has served continuously since appointment unless indicated otherwise. For the period from December 15, 2004 until February 22, 2005, Mr. Manning served as Advisory Trustee. For the period October 2008, until January 2012, Mr. Corcoran served as Treasurer of the Funds. Prior to January 2012, Messrs. DiLorenzo and Yost served as Assistant Treasurers of the Funds. |
| (j) | Directorships or trusteeships of companies required to report to the Securities and Exchange Commission (i.e., “public companies”). |
| (k) | “Interested person” of the Trust within the meaning of the Investment Company Act of 1940 (referred to as the 1940 Act), which is the principal federal law governing investment companies like the fund, as a result of position with MFS. The address of MFS is 111 Huntington Avenue, Boston, Massachusetts 02199-7618. |
Each Trustee has been elected by shareholders and each Trustee and officer holds office until his or her successor is chosen and qualified or until his or her earlier death, resignation, retirement or removal. The Trust does not hold annual meetings for the purpose of electing Trustees, and Trustees are not elected for fixed terms. Messrs. Butler, Kavanaugh, Uek and Ms. Thomsen are members of the Trust’s Audit Committee.
Each of the Fund’s Trustees and officers holds comparable positions with certain other funds of which MFS or a subsidiary is the investment adviser or distributor, and, in the case of the officers, with certain affiliates of MFS. As of January 1, 2013, the Trustees served as board members of 143 funds within the MFS Family of Funds.
46
Trustees and Officers – continued
The Statement of Additional Information for the Fund includes further information about the Trustees and is available without charge upon request by calling 1-800-225-2606.
| | |
| Investment Adviser | | Custodian |
Massachusetts Financial Services Company
111 Huntington Avenue
Boston, MA 02199-7618 | | State Street Bank and Trust Company 1 Lincoln Street Boston, MA 02111-2900 |
| Distributor | | Independent Registered Public Accounting Firm |
MFS Fund Distributors, Inc.
111 Huntington Avenue
Boston, MA 02199-7618 | | Ernst & Young LLP 200 Clarendon Street
Boston, MA 02116 |
| Portfolio Managers | | |
Jose Luis Garcia | | |
Thomas Melendez | | |
47
BOARD REVIEW OF INVESTMENT ADVISORY AGREEMENT
The Investment Company Act of 1940 requires that both the full Board of Trustees and a majority of the non-interested (“independent”) Trustees, voting separately, annually approve the continuation of the Fund’s investment advisory agreement with MFS. The Trustees consider matters bearing on the Fund and its advisory arrangements at their meetings throughout the year, including a review of performance data at each regular meeting. In addition, the independent Trustees met several times over the course of three months beginning in May and ending in July, 2013 (“contract review meetings”) for the specific purpose of considering whether to approve the continuation of the investment advisory agreement for the Fund and the other investment companies that the Board oversees (the “MFS Funds”). The independent Trustees were assisted in their evaluation of the Fund’s investment advisory agreement by independent legal counsel, from whom they received separate legal advice and with whom they met separately from MFS during various contract review meetings. The independent Trustees were also assisted in this process by the MFS Funds’ Independent Chief Compliance Officer, a full-time senior officer appointed by and reporting to the independent Trustees.
In connection with their deliberations regarding the continuation of the investment advisory agreement, the Trustees, including the independent Trustees, considered such information and factors as they believed, in light of the legal advice furnished to them and their own business judgment, to be relevant. The investment advisory agreement for the Fund was considered separately, although the Trustees also took into account the common interests of all MFS Funds in their review. As described below, the Trustees considered the nature, quality, and extent of the various investment advisory, administrative, and shareholder services performed by MFS under the existing investment advisory agreement and other arrangements with the Fund.
In connection with their contract review meetings, the Trustees received and relied upon materials that included, among other items: (i) information provided by Lipper Inc., an independent third party, on the investment performance of the Fund for various time periods ended December 31, 2012 and the investment performance of a group of funds with substantially similar investment classifications/objectives (the “Lipper performance universe”), (ii) information provided by Lipper Inc. on the Fund’s advisory fees and other expenses and the advisory fees and other expenses of comparable funds identified by Lipper Inc. (the “Lipper expense group”), (iii) information provided by MFS on the advisory fees of comparable portfolios of other clients of MFS, including institutional separate accounts and other clients, (iv) information as to whether and to what extent applicable expense waivers, reimbursements or fee “breakpoints” are observed for the Fund, (v) information regarding MFS’ financial results and financial condition, including MFS’ and certain of its affiliates’ estimated profitability from services performed for the Fund and the MFS Funds as a whole, and compared to MFS’ institutional business, (vi) MFS’ views regarding the outlook for the mutual fund industry and the strategic business plans of MFS, (vii) descriptions of various functions performed by MFS for the Funds, such as compliance monitoring and portfolio trading practices, and (viii) information regarding the overall organization of MFS, including information about MFS’ senior management and other personnel providing investment advisory, administrative and other services to
48
Board Review of Investment Advisory Agreement – continued
the Fund and the other MFS Funds. The comparative performance, fee and expense information prepared and provided by Lipper Inc. was not independently verified and the independent Trustees did not independently verify any information provided to them by MFS.
The Trustees’ conclusion as to the continuation of the investment advisory agreement was based on a comprehensive consideration of all information provided to the Trustees and not the result of any single factor. Some of the factors that figured particularly in the Trustees’ deliberations are described below, although individual Trustees may have evaluated the information presented differently from one another, giving different weights to various factors. It is also important to recognize that the fee arrangements for the Fund and other MFS Funds are the result of years of review and discussion between the independent Trustees and MFS, that certain aspects of such arrangements may receive greater scrutiny in some years than in others, and that the Trustees’ conclusions may be based, in part, on their consideration of these same arrangements during the course of the year and in prior years.
Based on information provided by Lipper Inc. and MFS, the Trustees reviewed the Fund’s total return investment performance as well as the performance of peer groups of funds over various time periods. The Trustees placed particular emphasis on the total return performance of the Fund’s Class A shares in comparison to the performance of funds in its Lipper performance universe over the three-year period ended December 31, 2012, which the Trustees believed was a long enough period to reflect differing market conditions. The total return performance of the Fund’s Class A shares was in the 1st quintile relative to the other funds in the universe for this three-year period (the 1st quintile being the best performers and the 5th quintile being the worst performers). The total return performance of the Fund’s Class A shares was in the 4th quintile for the one-year period and the 2nd quintile for the five-year period ended December 31, 2012 relative to the Lipper performance universe. Because of the passage of time, these performance results may differ from the performance results for more recent periods, including those shown elsewhere in this report.
In the course of their deliberations, the Trustees took into account information provided by MFS in connection with the contract review meetings, as well as during investment review meetings conducted with portfolio management personnel during the course of the year regarding the Fund’s performance. After reviewing these and related factors, the Trustees concluded, within the context of their overall conclusions regarding the investment advisory agreement, that they were satisfied with MFS’ responses and efforts relating to investment performance.
In assessing the reasonableness of the Fund’s advisory fee, the Trustees considered, among other information, the Fund’s advisory fee and the total expense ratio of the Fund’s Class A shares as a percentage of average daily net assets and the advisory fee and total expense ratios of peer groups of funds based on information provided by Lipper Inc. The Trustees considered that, according to the Lipper data (which takes into account any fee reductions or expense limitations that were in effect during the Fund’s last fiscal year), the Fund’s effective advisory fee rate was higher than the Lipper expense group median, and the Fund’s total expense ratio was lower than Lipper expense group median.
49
Board Review of Investment Advisory Agreement – continued
The Trustees also considered the advisory fees charged by MFS to any comparable institutional accounts. In comparing these fees, the Trustees considered information provided by MFS as to the generally broader scope of services provided by MFS to the Fund in comparison to institutional accounts, the higher demands placed on MFS’ investment personnel and trading infrastructure as a result of the daily cash in-flows and out-flows of the Fund, and the impact on MFS and expenses associated with the more extensive regulatory regime to which the Fund is subject in comparison to institutional accounts.
The Trustees also considered whether the Fund may benefit from any economies of scale in the management of the Fund in the event of growth in assets of the Fund and/or growth in assets of the MFS Funds as a whole. They noted that the Fund’s advisory fee rate schedule is subject to contractual breakpoints that reduce the Fund’s advisory fee rate on average daily net assets over $1 billion and $2 billion, and that MFS has agreed in writing to implement additional breakpoints that reduce the Fund’s advisory fee rate on average daily net assets over $5 billion and $10 billion, which may not be changed without the Trustees’ approval. The Trustees also noted that MFS has agreed in writing to waive a portion of the management fees of certain MFS Funds, including the Fund, if the total combined assets of certain funds within the MFS Funds’ complex increase above agreed upon thresholds (the “group fee waiver”), enabling the Fund’s shareholders to share in the benefits from any economies of scale at the complex level. The group fee waiver is reviewed and renewed annually between the Board and MFS. The Trustees concluded that the existing breakpoints and the group fee waiver were sufficient to allow the Fund to benefit from economies of scale as its assets and overall complex assets grow.
The Trustees also considered information prepared by MFS relating to MFS’ costs and profits with respect to the Fund, the MFS Funds considered as a group, and other investment companies and accounts advised by MFS, as well as MFS’ methodologies used to determine and allocate its costs to the MFS Funds, the Fund and other accounts and products for purposes of estimating profitability.
After reviewing these and other factors described herein, the Trustees concluded, within the context of their overall conclusions regarding the investment advisory agreement, that the advisory fees charged to the Fund represent reasonable compensation in light of the services being provided by MFS to the Fund.
In addition, the Trustees considered MFS’ resources and related efforts to continue to retain, attract and motivate capable personnel to serve the Fund. The Trustees also considered current and developing conditions in the financial services industry, including the presence of large and well-capitalized companies which are spending, and appear to be prepared to continue to spend, substantial sums to engage personnel and to provide services to competing investment companies. In this regard, the Trustees also considered the financial resources of MFS and its ultimate parent, Sun Life Financial Inc. The Trustees also considered the advantages and possible disadvantages to the Fund of having an adviser that also serves other investment companies as well as other accounts.
The Trustees also considered the nature, quality, cost, and extent of administrative, transfer agency, and distribution services provided to the Fund by MFS and its affiliates
50
Board Review of Investment Advisory Agreement – continued
under agreements and plans other than the investment advisory agreement, including any 12b-1 fees the Fund pays to MFS Fund Distributors, Inc., an affiliate of MFS. The Trustees also considered the nature, extent and quality of certain other services MFS performs or arranges for on the Fund’s behalf, which may include securities lending programs, directed expense payment programs, class action recovery programs, and MFS’ interaction with third-party service providers, principally custodians and sub-custodians. The Trustees concluded that the various non-advisory services provided by MFS and its affiliates on behalf of the Fund were satisfactory.
The Trustees also considered benefits to MFS from the use of the Fund’s portfolio brokerage commissions, if applicable, to pay for investment research and various other factors. Additionally, the Trustees considered so-called “fall-out benefits” to MFS such as reputational value derived from serving as investment manager to the Fund.
Based on their evaluation of factors that they deemed to be material, including those factors described above, the Board of Trustees, including the independent Trustees, concluded that the Fund’s investment advisory agreement with MFS should be continued for an additional one-year period, commencing August 1, 2013.
A discussion regarding the Board’s most recent review and renewal of the fund’s Investment Advisory Agreement with MFS is available by clicking on the fund’s name under “Mutual Funds” in the “Products” section of the MFS Web site (mfs.com).
51
PROXY VOTING POLICIES AND INFORMATION
A general description of the MFS funds’ proxy voting policies and procedures is available without charge, upon request, by calling 1-800-225-2606, by visiting the Proxy Voting section of mfs.com or by visiting the SEC’s Web site at http://www.sec.gov.
Information regarding how the fund voted proxies relating to portfolio securities during the most recent twelve-month period ended June 30 is available without charge by visiting the Proxy Voting section of mfs.com or by visiting the SEC’s Web site at http://www.sec.gov.
QUARTERLY PORTFOLIO DISCLOSURE
The fund will file a complete schedule of portfolio holdings with the Securities and Exchange Commission (the Commission) for the first and third quarters of each fiscal year on Form N-Q. A shareholder can obtain the quarterly portfolio holdings report at mfs.com. The fund’s Form N-Q is also available on the EDGAR database on the Commission’s Internet Web site at http://www.sec.gov, and may be reviewed and copied at the:
Public Reference Room
Securities and Exchange Commission
100 F Street, NE, Room 1580
Washington, D.C. 20549
Information on the operation of the Public Reference Room may be obtained by calling the Commission at 1-800-SEC-0330. Copies of the fund’s Form N-Q also may be obtained, upon payment of a duplicating fee, by electronic request at the following e-mail address: publicinfo@sec.gov or by writing the Public Reference Section at the above address.
FURTHER INFORMATION
From time to time, MFS may post important information about the fund or the MFS funds on the MFS web site (mfs.com). This information is available by visiting the “News & Commentary” section of mfs.com or by clicking on the fund’s name under “Mutual Funds” in the “Products” section of mfs.com.
FEDERAL TAX INFORMATION (unaudited)
The fund will notify shareholders of amounts for use in preparing 2013 income tax forms in January 2014. The following information is provided pursuant to provisions of the Internal Revenue Code.
The fund designates the maximum amount allowable as qualified dividend income eligible for the 15% tax rate.
Income derived from foreign sources was $145,020,351. The fund intends to pass through foreign tax credits of $10,987,724 for the fiscal year.
52
rev. 3/11
| | | | |
| | | |
FACTS | | WHAT DOES MFS DO WITH YOUR PERSONAL INFORMATION? | |  |
| | |
| Why? | | Financial companies choose how they share your personal information. Federal law gives consumers the right to limit some but not all sharing. Federal law also requires us to tell you how we collect, share, and protect your personal information. Please read this notice carefully to understand what we do. |
| | |
| What? | | The types of personal information we collect and share depend on the product or service you have with us. This information can include: • Social Security number and account balances • Account transactions and transaction history • Checking account information and wire transfer instructions When you are no longer our customer, we continue to share your information as described in this notice. |
| | |
| How? | | All financial companies need to share customers’ personal information to run their everyday business. In the section below, we list the reasons financial companies can share their customers’ personal information; the reasons MFS chooses to share; and whether you can limit this sharing. |
| | | | |
Reasons we can share your
personal information | | Does MFS
share? | | Can you limit
this sharing? |
For our everyday business purposes – such as to process your transactions, maintain your account(s), respond to court orders and legal investigations, or report to credit bureaus | | Yes | | No |
For our marketing purposes – to offer our products and services to you | | No | | We don’t share |
| For joint marketing with other financial companies | | No | | We don’t share |
For our affiliates’ everyday business purposes – information about your transactions and experiences | | No | | We don’t share |
For our affiliates’ everyday business purposes – information about your creditworthiness | | No | | We don’t share |
| For nonaffiliates to market to you | | No | | We don’t share |
| | |
| Questions? | | Call 800-225-2606 or go to mfs.com. |
53
| | |
| Who we are |
| Who is providing this notice? | | MFS Funds, MFS Investment Management, MFS Institutional Advisors, Inc., MFS Fund Distributors, Inc., MFS Heritage Trust Company, and MFS Service Center, Inc. |
| | |
| What we do |
| How does MFS protect my personal information? | | To protect your personal information from unauthorized access and use, we use security measures that comply with federal law. These measures include procedural, electronic, and physical safeguards for the protection of the personal information we collect about you. |
| How does MFS collect my personal information? | | We collect your personal information, for example, when you •open an account or provide account information •direct us to buy securities or direct us to sell your securities •make a wire transfer We also collect your personal information from others, such as credit bureaus, affiliates and other companies. |
| Why can’t I limit all sharing? | | Federal law gives you the right to limit only •sharing for affiliates’ everyday business purposes – information about your creditworthiness •affiliates from using your information to market to you •sharing for nonaffiliates to market to you State laws and individual companies may give you additional rights to limit sharing. |
| | |
| Definitions |
| Affiliates | | Companies related by common ownership or control. They can be financial and nonfinancial companies. •MFS does not share personal information with affiliates, except for everyday business purposes as described on page one of this notice. |
| Nonaffiliates | | Companies not related by common ownership or control. They can be financial and nonfinancial companies. •MFS does not share with nonaffiliates so they can market to you. |
| Joint Marketing | | A formal agreement between nonaffiliated financial companies that together market financial products or services to you. •MFS doesn’t jointly market. |
| | |
| Other important information |
| If you own an MFS product or receive an MFS service in the name of a third party such as a bank or broker-dealer, their privacy policy may apply to you instead of ours. |
54
Save paper with eDelivery.

| MFS® will send you prospectuses, |
reports, and proxies directly via e-mail so you will get information faster with less mailbox clutter.
To sign up:
1. Go to mfs.com.
2. Log in via MFS® Access.
3. Select eDelivery.
If you own your MFS fund shares through a financial institution or a retirement plan, MFS® TALK, MFS® Access, or eDelivery may not be available to you.
CONTACT
WEB SITE
mfs.com
MFS TALK
1-800-637-8255
24 hours a day
ACCOUNT SERVICE
AND LITERATURE
Shareholders
1-800-225-2606
Financial advisors
1-800-343-2829
Retirement plan services
1-800-637-1255
MAILING ADDRESS
MFS Service Center, Inc.
P.O. Box 55824
Boston, MA 02205-5824
OVERNIGHT MAIL
MFS Service Center, Inc.
c/o Boston Financial Data Services
30 Dan Road
Canton, MA 02021-2809
ANNUAL REPORT
August 31, 2013

MFS® TECHNOLOGY FUND

SCT-ANN
MFS® TECHNOLOGY FUND
CONTENTS
The report is prepared for the general information of shareholders.
It is authorized for distribution to prospective investors only when preceded or accompanied by a current prospectus.
NOT FDIC INSURED Ÿ MAY LOSE VALUE Ÿ NO BANK GUARANTEE

LETTER FROM THE CHAIRMAN AND CEO
Dear Shareholders:
Global economic trends appear to favor growth again despite risks created by the U.S. government’s gridlock. The U.S. economy’s slow but steady expansion is no longer the
exception. The eurozone has emerged from its 18-month-long recession, with Germany leading the way. China’s monthly gauges of economic activity once again point toward expansion. And Japan is picking up momentum in response to its government’s and central bank’s aggressive program of monetary easing.
However, geopolitical risks have risen, with violence erupting in Egypt and Syria and the possibility of further unrest in the Middle East. The U.S. Federal Reserve’s expected tapering of its bond-buying stimulus program has weighed on global markets
since May. Emerging markets, including Brazil and India, have borne much of the brunt, as their currency values have dropped and nervous investors have fled to safety elsewhere. In Europe, unemployment persists at historically high levels. The trend towards a pickup in global growth, while encouraging, appears tenuous, particularly with the risk of a U.S. debt default.
As always, managing risk in the face of uncertainty remains a top priority for investors. At MFS®, our uniquely collaborative investment process employs integrated, global research and active risk management. Our global team of investment professionals shares ideas and evaluates opportunities across continents, investment disciplines and asset classes — all with a goal of building better insights, and ultimately better results, for our clients.
We are mindful of the many economic challenges investors face, and believe it is more important than ever to maintain a long-term view and employ time-tested principles, such as asset allocation and diversification. We remain confident that our unique approach can serve investors well as they work with their financial advisors to identify and pursue the most suitable opportunities.
Respectfully,

Robert J. Manning
Chairman and Chief Executive Officer
MFS Investment Management®
October 17, 2013
The opinions expressed in this letter are subject to change, may not be relied upon for investment advice, and no forecasts can be guaranteed.
1
PORTFOLIO COMPOSITION
Portfolio structure (i)

| | | | |
| Top ten holdings (i) | | | | |
| Google, Inc., “A” | | | 9.1% | |
| Apple, Inc. | | | 8.0% | |
| Hewlett-Packard Co. | | | 5.1% | |
| Qualcomm, Inc. | | | 4.4% | |
| Amazon.com, Inc. | | | 4.4% | |
| Visa, Inc., “A” | | | 4.2% | |
| Priceline.com, Inc. | | | 4.1% | |
| Oracle Corp. | | | 3.9% | |
| EMC Corp. | | | 3.5% | |
| Microchip Technology, Inc. | | | 3.4% | |
| | | | |
| Top five industries (i) | | | | |
| Computer Software - Systems (s) | | | 22.3% | |
| Internet | | | 17.8% | |
| Computer Software | | | 11.9% | |
| Electronics (s) | | | 11.7% | |
| Other Banks & Diversified Financials | | | 7.4% | |
| (i) | For purposes of this presentation, the components include the market value of securities, less any securities sold short, and reflect the impact of the equivalent exposure of derivative positions. These amounts may be negative from time to time. Equivalent exposure is a calculated amount that translates the derivative position into a reasonable approximation of the amount of the underlying asset that the portfolio would have to hold at a given point in time to have the same price sensitivity that results from the portfolio’s ownership of the derivative contract. When dealing with derivatives, equivalent exposure is a more representative measure of the potential impact of a position on portfolio performance than market value. |
| (s) | Includes securities sold short. |
Percentages are based on net assets as of 8/31/13.
The portfolio is actively managed and current holdings may be different.
2
MANAGEMENT REVIEW
Summary of Results
For the twelve months ended August 31, 2013, Class A shares of the MFS Technology Fund (“fund”) provided a total return of 15.54%, at net asset value. This compares with a return of 18.70% for the fund’s benchmark, the Standard & Poor’s 500 Stock Index, and a return of 13.53% for the fund’s other benchmark, the Standard & Poor’s North American Technology Sector Index.
Market Environment
At the beginning of the period, markets were suffering a bout of risk aversion due to broadly weaker global macroeconomic indicators, as well as renewed concerns over the eurozone’s capacity and determination to address its ongoing crisis. However, a few months into the period, this renewed weakness in the fundamentals precipitated yet a further round of monetary easing by both the US Federal Reserve (through a third round of quantitative easing) and the European Central Bank (ECB) (through a new bond purchase facility), which soon instilled additional confidence in risk markets.
Nonetheless, towards the end of the calendar year, weaker equity earnings reports and declining forward guidance caused market sentiment to soften again. In addition, year-end fiscal cliff negotiations between the Republicans in the US Congress and President Obama were a particular source of market attention, where uncertainty surrounding the fiscal negotiations continued right up to the end-of-year deadline. A last minute political agreement averted the worst-case scenario and markets gravitated towards risk assets again, though the implementation of the US budget sequester, combined with the uncertainty surrounding the Italian election results, inserted a continued degree of caution as we entered the second half of the period.
During the first few months of 2013, market sentiment improved markedly, as global macroeconomic indicators improved and fears of fiscal austerity in the US waned. Late in the period, however, global growth dynamics looked to be weakening again, though markets were generally unfazed, continuing their risk-on path, especially in light of continued easing by global central banks and the Bank of Japan in particular. At the end of the period, the growing risk that the Fed would begin tapering its quantitative easing program caused sovereign bond yields to spike, credit spreads to widen, and equity valuation to fall.
Detractors from Performance
Stock selection and an underweight position in the entertainment industry detracted from the fund’s performance relative to the Standard & Poor’s North American Technology Sector Index. Most notably, a short position in shares of internet TV show and movie subscription services provider Netflix (h) hampered relative results as the stock traded higher during the period. Netflix surged in the first half of the period as the company released results that beat consensus estimates on the back of better-than-expected domestic streaming subscription growth, lower-than-expected losses in international markets and improved margins.
Stocks in other industries that negatively impacted relative results included overweight positions in weak-performing computer and personal electronics maker Apple, access infrastructure products manufacturer Citrix Systems and data storage systems provider
3
Management Review – continued
EMC. An underweight position in enterprise software products maker Oracle also held back relative returns. Shares of Apple declined in the first half of the period after the company announced disappointing profit and sales growth. Investors seemingly discounted prospects of increasing competition and lower margins for the company. Short positions in IT and professional services company Computer Sciences (h), publishing software company Adobe Systems (h) and semiconductor company Texas Instruments also weighed on relative results as all three stocks appreciated during the period. Not holding common stock shares of strong-performing network equipment company Cisco System, and the fund’s holdings of semiconductor company Mellanox Technologies (b), were additional factors that detracted from relative performance.
Contributors to Performance
An underweight position and stock selection in the computer systems industry were positive factors that contributed to performance relative to the Standard & Poor’s North American Technology Sector Index. Within this industry, an underweight position in poor-performing diversified technology products and services company IBM (h) and an overweight allocation to computer products and services provider Hewlett-Packard aided relative results. The fund’s holdings of software solution provider FleetMatics Group (b) also helped. Hewlett-Packard’s price rose in the middle of the period after the company reported better-than-expected revenues and earnings. Its free cash flow generation was quite strong and much better than previous quarters. Additionally, news during the period that rival personal computer maker Dell was attempting to go private appeared to have given investors optimism that we may see a more rational pricing environment for PCs moving forward.
An overweight position in the broadcasting industry also benefited relative results as this industry outperformed the index over the period. Here, the fund’s holdings of strong-performing media and entertainment company Twenty-First Century Fox (b)(h) boosted relative returns.
The fund’s overweight allocations to both the other banks & diversified financials and consumer services industries contributed to relative performance. Within these industries, an overweight position in debit and credit transaction processing company Mastercard and online travel company priceline.com strengthened relative results.
Elsewhere, overweight allocations to strong-performing global fleet vehicle fuel card provider FleetCor Technologies, online information portal Yahoo! and fiber optics manufacturer Finisar boosted relative returns. FleetCor Technologies traded higher towards the middle of the period as the company announced quarterly earnings that topped analyst estimates because of international expansion and lower wholesale costs. Additionally, management issued guidance above early forecasts which further supported the stock. The fund’s avoidance of weak-performing semiconductor company Intel also contributed to relative performance.
Respectfully,
Matthew Sabel
Portfolio Manager
| (b) | Security is not a benchmark constituent. |
| (h) | Security was not held in the portfolio at period end. |
4
Management Review – continued
The views expressed in this report are those of the portfolio manager only through the end of the period of the report as stated on the cover and do not necessarily reflect the views of MFS or any other person in the MFS organization. These views are subject to change at any time based on market or other conditions, and MFS disclaims any responsibility to update such views. These views may not be relied upon as investment advice or an indication of trading intent on behalf of any MFS portfolio. References to specific securities are not recommendations of such securities, and may not be representative of any MFS portfolio’s current or future investments.
5
PERFORMANCE SUMMARY THROUGH 8/31/13
The following chart illustrates a representative class of the fund’s historical performance in comparison to its benchmark(s). Performance results include the deduction of the maximum applicable sales charge and reflect the percentage change in net asset value, including reinvestment of dividends and capital gains distributions. The performance of other share classes will be greater than or less than that of the class depicted below. Benchmarks are unmanaged and may not be invested in directly. Benchmark returns do not reflect sales charges, commissions or expenses. (See Notes to Performance Summary.)
Performance data shown represents past performance and is no guarantee of future results. Investment return and principal value fluctuate so your shares, when sold, may be worth more or less than the original cost; current performance may be lower or higher than quoted. The performance shown does not reflect the deduction of taxes, if any, that a shareholder would pay on fund distributions or the redemption of fund shares.
Growth of a Hypothetical $10,000 Investment
6
Performance Summary – continued
Total Returns through 8/31/13
Average annual without sales charge
| | | | | | | | | | | | | | |
| | | Share class | | Class inception date | | 1-yr | | 5-yr | | 10-yr | | Life (t) | | |
| | | A | | 1/02/97 | | 15.54% | | 9.27% | | 8.87% | | N/A | | |
| | | B | | 4/14/00 | | 14.66% | | 8.47% | | 8.12% | | N/A | | |
| | | C | | 4/14/00 | | 14.63% | | 8.46% | | 8.11% | | N/A | | |
| | | I | | 1/02/97 | | 15.77% | | 9.56% | | 9.20% | | N/A | | |
| | | R1 | | 4/01/05 | | 14.66% | | 8.46% | | N/A | | 9.86% | | |
| | | R2 | | 10/31/03 | | 15.22% | | 9.00% | | N/A | | 8.06% | | |
| | | R3 | | 4/01/05 | | 15.54% | | 9.29% | | N/A | | 10.68% | | |
| | | R4 | | 4/01/05 | | 15.80% | | 9.56% | | N/A | | 10.98% | | |
| | | R5 | | 1/02/13 | | N/A | | N/A | | N/A | | 15.05% | | |
| Comparative Benchmarks | | | | | | | | | | |
| | | Standard & Poor’s 500 Stock Index (f) | | 18.70% | | 7.32% | | 7.12% | | N/A | | |
| | | Standard & Poor’s North American
Technology Sector Index (f) | | 13.53% | | 8.86% | | 7.40% | | N/A | | |
| Average annual with sales charge | | | | | | | | | | |
| | | A
With Initial Sales Charge (5.75%) | | 8.89% | | 7.98% | | 8.22% | | N/A | | |
| | | B
With CDSC (Declining over six years
from 4% to 0%) (x) | | 10.66% | | 8.18% | | 8.12% | | N/A | | |
| | | C
With CDSC (1% for 12 months) (x) | | 13.63% | | 8.46% | | 8.11% | | N/A | | |
Class I, R1, R2, R3, R4, and R5 shares do not have a sales charge.
CDSC – Contingent Deferred Sales Charge.
| (f) | Source: FactSet Research Systems Inc. |
| (t) | For the period from the class inception date through the stated period end (for those share classes with less than 10 years of performance history). No comparative benchmark performance information is provided for “life” periods. (See Notes to Performance Summary.) |
| (x) | Assuming redemption at the end of the applicable period. |
Benchmark Definitions
Standard & Poor’s 500 Stock Index – a market capitalization-weighted index of 500 widely held equity securities, designed to measure broad U.S. equity performance.
Standard & Poor’s North American Technology Sector Index – a modified market capitalization-weighted index that measures the performance of selected technology stocks.
It is not possible to invest directly in an index.
7
Performance Summary – continued
Notes to Performance Summary
Average annual total return represents the average annual change in value for each share class for the periods presented. Life returns are presented where the share class has less than 10 years of performance history and represent the average annual total return from the class inception date to the stated period end date. As the fund’s share classes may have different inception dates, the life returns may represent different time periods and may not be comparable. As a result, no comparative benchmark performance information is provided for life periods.
Performance results reflect any applicable expense subsidies and waivers in effect during the periods shown. Without such subsidies and waivers the fund’s performance results would be less favorable. Please see the prospectus and financial statements for complete details.
Performance results do not include adjustments made for financial reporting purposes in accordance with U.S. generally accepted accounting principles and may differ from amounts reported in the financial highlights.
From time to time the fund may receive proceeds from litigation settlements, without which performance would be lower.
8
EXPENSE TABLE
Fund expenses borne by the shareholders during the period, March 1, 2013 through August 31, 2013
As a shareholder of the fund, you incur two types of costs: (1) transaction costs, including sales charges (loads) on certain purchase or redemption payments, and (2) ongoing costs, including management fees; distribution and service (12b-1) fees; and other fund expenses. This example is intended to help you understand your ongoing costs (in dollars) of investing in the fund and to compare these costs with the ongoing costs of investing in other mutual funds.
The example is based on an investment of $1,000 invested at the beginning of the period and held for the entire period March 1, 2013 through August 31, 2013.
Actual Expenses
The first line for each share class in the following table provides information about actual account values and actual expenses. You may use the information in this line, together with the amount you invested, to estimate the expenses that you paid over the period. Simply divide your account value by $1,000 (for example, an $8,600 account value divided by $1,000 = 8.6), then multiply the result by the number in the first line under the heading entitled “Expenses Paid During Period” to estimate the expenses you paid on your account during this period.
Hypothetical Example for Comparison Purposes
The second line for each share class in the following table provides information about hypothetical account values and hypothetical expenses based on the fund’s actual expense ratio and an assumed rate of return of 5% per year before expenses, which is not the fund’s actual return. The hypothetical account values and expenses may not be used to estimate the actual ending account balance or expenses you paid for the period. You may use this information to compare the ongoing costs of investing in the fund and other funds. To do so, compare this 5% hypothetical example with the 5% hypothetical examples that appear in the shareholder reports of the other funds.
Please note that the expenses shown in the table are meant to highlight your ongoing costs only and do not reflect any transactional costs, such as sales charges (loads). Therefore, the second line for each share class in the table is useful in comparing ongoing costs only, and will not help you determine the relative total costs of owning different funds. In addition, if these transactional costs were included, your costs would have been higher.
9
Expense Table – continued
| | | | | | | | | | | | | | | | | | |
Share Class | | | | Annualized Expense Ratio | | | Beginning Account Value 3/01/13 | | | Ending Account Value 8/31/13 | | | Expenses Paid During Period (p) 3/01/13-8/31/13 | |
| A | | Actual | | | 1.53% | | | | $1,000.00 | | | | $1,102.22 | | | | $8.11 | |
| | Hypothetical (h) | | | 1.53% | | | | $1,000.00 | | | | $1,017.49 | | | | $7.78 | |
| B | | Actual | | | 2.29% | | | | $1,000.00 | | | | $1,098.39 | | | | $12.11 | |
| | Hypothetical (h) | | | 2.29% | | | | $1,000.00 | | | | $1,013.66 | | | | $11.62 | |
| C | | Actual | | | 2.29% | | | | $1,000.00 | | | | $1,097.95 | | | | $12.11 | |
| | Hypothetical (h) | | | 2.29% | | | | $1,000.00 | | | | $1,013.66 | | | | $11.62 | |
| I | | Actual | | | 1.29% | | | | $1,000.00 | | | | $1,103.69 | | | | $6.84 | |
| | Hypothetical (h) | | | 1.29% | | | | $1,000.00 | | | | $1,018.70 | | | | $6.56 | |
| R1 | | Actual | | | 2.29% | | | | $1,000.00 | | | | $1,098.14 | | | | $12.11 | |
| | Hypothetical (h) | | | 2.29% | | | | $1,000.00 | | | | $1,013.66 | | | | $11.62 | |
| R2 | | Actual | | | 1.79% | | | | $1,000.00 | | | | $1,101.05 | | | | $9.48 | |
| | Hypothetical (h) | | | 1.79% | | | | $1,000.00 | | | | $1,016.18 | | | | $9.10 | |
| R3 | | Actual | | | 1.54% | | | | $1,000.00 | | | | $1,102.84 | | | | $8.16 | |
| | Hypothetical (h) | | | 1.54% | | | | $1,000.00 | | | | $1,017.44 | | | | $7.83 | |
| R4 | | Actual | | | 1.30% | | | | $1,000.00 | | | | $1,103.33 | | | | $6.89 | |
| | Hypothetical (h) | | | 1.30% | | | | $1,000.00 | | | | $1,018.65 | | | | $6.61 | |
| R5 | | Actual | | | 1.15% | | | | $1,000.00 | | | | $1,104.24 | | | | $6.10 | |
| | Hypothetical (h) | | | 1.15% | | | | $1,000.00 | | | | $1,019.41 | | | | $5.85 | |
| (h) | 5% class return per year before expenses. |
| (p) | Expenses paid are equal to each class’s annualized expense ratio, as shown above, multiplied by the average account value over the period, multiplied by the number of days in the period, divided by the number of days in the year. Expenses paid do not include any applicable sales charges (loads). If these transaction costs had been included, your costs would have been higher. |
Notes to Expense Table
Expense ratios include 0.13% of investment related expense from short sales that are outside of the expense limitation arrangement (See Notes 2 and 3 of the Notes to Financial Statements).
Each class with a Rule 12b-1 service fee is subject to a rebate of a portion of such fee. Such rebates are included in the expense ratios above and are outside of the expense limitation arrangement. For Class A shares, this rebate reduced the expense ratio above by 0.01%. See Note 3 in the Notes to Financial Statements for additional information.
10
PORTFOLIO OF INVESTMENTS
8/31/13
The Portfolio of Investments is a complete list of all securities owned by your fund. It is categorized by broad-based asset classes.
| | | | | | | | |
| Common Stocks - 100.4% | | | | | | | | |
| Issuer | | Shares/Par | | | Value ($) | |
| Broadcasting - 4.7% | | | | | | | | |
| Discovery Communications, Inc., “C” (a) | | | 19,090 | | | $ | 1,358,635 | |
| Time Warner, Inc. | | | 34,320 | | | | 2,077,390 | |
| Twenty-First Century Fox, Inc. | | | 181,060 | | | | 5,672,610 | |
| Viacom, Inc., “B” | | | 10,750 | | | | 855,270 | |
| Walt Disney Co. | | | 19,510 | | | | 1,186,793 | |
| | | | | | | | |
| | | | | | | $ | 11,150,698 | |
| Brokerage & Asset Managers - 0.5% | | | | | | | | |
| IntercontinentalExchange, Inc. (a) | | | 6,735 | | | $ | 1,210,616 | |
| | |
| Business Services - 4.0% | | | | | | | | |
| Accenture PLC, “A” | | | 34,650 | | | $ | 2,503,463 | |
| Cognizant Technology Solutions Corp., “A” (a) | | | 26,010 | | | | 1,906,533 | |
| Fidelity National Information Services, Inc. | | | 63,000 | | | | 2,800,980 | |
| FleetCor Technologies, Inc. (a) | | | 17,000 | | | | 1,752,870 | |
| QIWI PLC, ADR | | | 21,560 | | | | 642,488 | |
| | | | | | | | |
| | | | | | | $ | 9,606,334 | |
| Computer Software - 11.8% | | | | | | | | |
| Autodesk, Inc. (a) | | | 56,250 | | | $ | 2,067,188 | |
| Citrix Systems, Inc. (a) | | | 34,380 | | | | 2,433,073 | |
| Microsoft Corp. | | | 58,360 | | | | 1,949,224 | |
| Oracle Corp. (s) | | | 290,010 | | | | 9,239,719 | |
| Qlik Technologies, Inc. (a) | | | 60,230 | | | | 1,974,942 | |
| Salesforce.com, Inc. (a) | | | 124,349 | | | | 6,109,266 | |
| Symantec Corp. | | | 102,560 | | | | 2,626,562 | |
| TIBCO Software, Inc. (a) | | | 70,100 | | | | 1,580,054 | |
| | | | | | | | |
| | | | | | | $ | 27,980,028 | |
| Computer Software - Systems - 22.5% | | | | | | | | |
| Apple, Inc. (s) | | | 39,184 | | | $ | 19,084,567 | |
| CDW Corp. (a) | | | 113,528 | | | | 2,489,669 | |
| Cvent, Inc. (a) | | | 2,020 | | | | 71,932 | |
| EMC Corp. | | | 325,440 | | | | 8,389,843 | |
| FleetMatics Group PLC (a) | | | 40,730 | | | | 2,014,099 | |
| Guidewire Software, Inc. (a) | | | 51,680 | | | | 2,375,213 | |
| Hewlett-Packard Co. (s) | | | 544,390 | | | | 12,161,673 | |
| Model N, Inc. (a) | | | 45,270 | | | | 652,341 | |
| NCR Corp. (a) | | | 26,890 | | | | 956,746 | |
| Qualys, Inc. (a) | | | 43,110 | | | | 861,769 | |
11
Portfolio of Investments – continued
| | | | | | | | |
| Issuer | | Shares/Par | | | Value ($) | |
| Common Stocks - continued | | | | | | | | |
| Computer Software - Systems - continued | | | | | | | | |
| Splunk, Inc. (a) | | | 25,470 | | | $ | 1,406,199 | |
| SS&C Technologies Holdings, Inc. (a) | | | 40,390 | | | | 1,429,402 | |
| Vantiv, Inc., “A” (a) | | | 63,240 | | | | 1,670,168 | |
| | | | | | | | |
| | | | | | | $ | 53,563,621 | |
| Consumer Services - 5.2% | | | | | | | | |
| Grand Canyon Education, Inc. (a) | | | 12,830 | | | $ | 442,763 | |
| Groupon, Inc. (a) | | | 97,740 | | | | 993,038 | |
| Priceline.com, Inc. (a) | | | 10,430 | | | | 9,788,868 | |
| TripAdvisor, Inc. (a) | | | 15,520 | | | | 1,148,014 | |
| | | | | | | | |
| | | | | | | $ | 12,372,683 | |
| Electrical Equipment - 2.5% | | | | | | | | |
| Amphenol Corp., “A” | | | 38,730 | | | $ | 2,934,572 | |
| TE Connectivity Ltd. | | | 46,910 | | | | 2,298,590 | |
| W.W. Grainger, Inc. | | | 2,847 | | | | 704,205 | |
| | | | | | | | |
| | | | | | | $ | 5,937,367 | |
| Electronics - 12.7% | | | | | | | | |
| Aeroflex Holding Corp. (a) | | | 223,670 | | | $ | 1,570,163 | |
| Altera Corp. | | | 142,350 | | | | 5,006,450 | |
| Freescale Semiconductor Ltd. (a) | | | 137,610 | | | | 1,970,575 | |
| JDS Uniphase Corp. (a) | | | 422,330 | | | | 5,418,494 | |
| Linear Technology Corp. | | | 35,280 | | | | 1,352,282 | |
| Mellanox Technologies Ltd. (a) | | | 34,980 | | | | 1,378,912 | |
| Microchip Technology, Inc. | | | 210,140 | | | | 8,155,533 | |
| NXP Semiconductors N.V. (a) | | | 74,810 | | | | 2,780,688 | |
| Ultratech, Inc. (a) | | | 46,820 | | | | 1,324,070 | |
| Veeco Instruments, Inc. (a) | | | 31,460 | | | | 1,104,875 | |
| | | | | | | | |
| | | | | | | $ | 30,062,042 | |
| Entertainment - 0.8% | | | | | | | | |
| AMC Networks, Inc., “A” (a) | | | 31,590 | | | $ | 1,957,948 | |
| | |
| Internet - 17.8% | | | | | | | | |
| ChannelAdvisor Corp. (a) | | | 46,130 | | | $ | 1,412,501 | |
| eBay, Inc. (a) | | | 147,570 | | | | 7,377,024 | |
| Facebook, Inc., “A “ (a) | | | 75,860 | | | | 3,131,501 | |
| Google, Inc., “A” (a)(s) | | | 25,636 | | | | 21,711,128 | |
| LinkedIn Corp., “A” (a) | | | 8,284 | | | | 1,988,491 | |
| Rackspace Hosting, Inc. (a) | | | 9,930 | | | | 445,063 | |
| Yahoo!, Inc. (a) | | | 195,440 | | | | 5,300,333 | |
| Yelp, Inc. (a) | | | 16,100 | | | | 836,878 | |
| | | | | | | | |
| | | | | | | $ | 42,202,919 | |
12
Portfolio of Investments – continued
| | | | | | | | |
| Issuer | | Shares/Par | | | Value ($) | |
| Common Stocks - continued | | | | | | | | |
| Network & Telecom - 6.1% | | | | | | | | |
| Finisar Corp. (a) | | | 119,140 | | | $ | 2,438,796 | |
| Juniper Networks, Inc. (a) | | | 81,630 | | | | 1,542,807 | |
| Qualcomm, Inc. (s) | | | 159,370 | | | | 10,563,044 | |
| | | | | | | | |
| | | | | | | $ | 14,544,647 | |
| Other Banks & Diversified Financials - 7.4% | | | | | | | | |
| MasterCard, Inc., “A” | | | 12,478 | | | $ | 7,562,666 | |
| Visa, Inc., “A” | | | 56,896 | | | | 9,923,800 | |
| | | | | | | | |
| | | | | | | $ | 17,486,466 | |
| Specialty Stores - 4.4% | | | | | | | | |
| Amazon.com, Inc. (a)(s) | | | 36,943 | | | $ | 10,380,244 | |
| Total Common Stocks (Identified Cost, $184,566,516) | | | | | | $ | 238,455,613 | |
| | |
| Money Market Funds - 2.1% | | | | | | | | |
MFS Institutional Money Market Portfolio, 0.09%,
at Cost and Net Asset Value (v) | | | 5,062,331 | | | $ | 5,062,331 | |
| Total Investments (Identified Cost, $189,628,847) | | | | | | $ | 243,517,944 | |
| | |
| Issuer/Expiration Date/Strike Price | | Number
of
Contracts | | | | |
| Call Options Written - 0.0% | | | | | | | | |
| Computer Software - Systems - 0.0% | | | | | | | | |
| Hewlett-Packard Co. - September 2013 @ $24 | | | (471 | ) | | $ | (8,949 | ) |
| Hewlett-Packard Co. - September 2013 @ $25 | | | (707 | ) | | | (7,070 | ) |
| Hewlett-Packard Co. - September 2013 @ $26 | | | (990 | ) | | | (6,930 | ) |
| | | | | | | | |
| | | | | | | $ | (22,949 | ) |
| Consumer Services - 0.0% | | | | | | | | |
| Tripadvisor, Inc. - September 2013 @ $75 | | | (35 | ) | | $ | (7,875 | ) |
| Tripadvisor, Inc. - September 2013 @ $80 | | | (70 | ) | | | (4,550 | ) |
| | | | | | | | |
| | | | | | | $ | (12,425 | ) |
| Electronics - 0.0% | | | | | | | | |
| Linear Technology Corp. - September 2013 @ $40 | | | (155 | ) | | $ | (1,550 | ) |
| NXP Semiconductors N.V. - September 2013 @ $35 | | | (103 | ) | | | (25,235 | ) |
| NXP Semiconductors N.V. - September 2013 @ $38 | | | (103 | ) | | | (11,330 | ) |
| | | | | | | | |
| | | | | | | $ | (38,115 | ) |
| Internet - 0.0% | | | | | | | | |
| Yelp, Inc. - September 2013 @ $60 | | | (161 | ) | | $ | (9,660 | ) |
13
Portfolio of Investments – continued
| | | | | | | | |
| Issuer/Expiration Date/Strike Price | | Number
of
Contracts | | | Value ($) | |
| Call Options Written - continued | | | | | | | | |
| Network & Telecom - 0.0% | | | | | | | | |
| Finisar Corp. - September 2013 @ $23 | | | (178 | ) | | $ | (6,230 | ) |
| Total Call Options Written (Premiums Received, $82,587) | | | | | | $ | (89,379 | ) |
| | |
| Put Options Written - (0.1)% | | | | | | | | |
| Computer Software - 0.0% | | | | | | | | |
| Autodesk, Inc. - September 2013 @ $33 | | | (138 | ) | | $ | (1,518 | ) |
| Microsoft Corp. - September 2013 @ $30 | | | (849 | ) | | | (6,792 | ) |
| | | | | | | | |
| | | | | | | $ | (8,310 | ) |
| Computer Software - Systems - (0.1)% | | | | | | | | |
| Apple, Inc. - September 2013 @ $490 | | | (56 | ) | | $ | (86,520 | ) |
| Hewlett-Packard Co. - September 2013 @ $20 | | | (802 | ) | | | (9,624 | ) |
| Hewlett-Packard Co. - September 2013 @ $21 | | | (471 | ) | | | (12,717 | ) |
| | | | | | | | |
| | | | | | | $ | (108,861 | ) |
| Consumer Services - 0.0% | | | | | | | | |
| Tripadvisor, Inc. - September 2013 @ $63 | | | (70 | ) | | $ | (1,050 | ) |
| | |
| Internet - 0.0% | | | | | | | | |
| Yelp, Inc. - September 2013 @ $45 | | | (99 | ) | | $ | (4,950 | ) |
| Yelp, Inc. - September 2013 @ $48 | | | (124 | ) | | | (13,020 | ) |
| | | | | | | | |
| | | | | | | $ | (17,970 | ) |
| Total Put Options Written (Premiums Received, $167,886) | | | $ | (136,191 | ) |
| | |
| Issuer | | Shares/Par | | | | |
| Securities Sold Short - (3.0)% | | | | | | | | |
| Business Services - (1.3)% | | | | | | | | |
| FactSet Research Systems, Inc. | | | (28,900 | ) | | $ | (2,957,915 | ) |
| | |
| Computer Software - Systems - (0.8)% | | | | | | | | |
| Lexmark International, Inc., “A” | | | (22,500 | ) | | $ | (768,600 | ) |
| Synaptics Inc. (a) | | | (30,400 | ) | | | (1,175,264 | ) |
| | | | | | | | |
| | | | | | | $ | (1,943,864 | ) |
| Electronics - (0.7)% | | | | | | | | |
| Texas Instruments, Inc. | | | (46,300 | ) | | $ | (1,768,660 | ) |
14
Portfolio of Investments – continued
| | | | | | | | |
| Issuer | | Shares/Par | | | Value ($) | |
| Securities Sold Short - continued | | | | | | | | |
| Network & Telecom - (0.2)% | | | | | | | | |
| BlackBerry Ltd. (a) | | | (51,500 | ) | | $ | (521,180 | ) |
| Total Securities Sold Short (Proceeds Received, $7,289,024) | | | $ | (7,191,619 | ) |
| | |
| Other Assets, Less Liabilities - 0.6% | | | | | | | 1,375,830 | |
| Net Assets - 100.0% | | | | | | $ | 237,476,585 | |
| (a) | Non-income producing security. |
| (s) | Security or a portion of the security was pledged to cover collateral requirements for securities sold short and/or certain derivative transactions. |
| (v) | Underlying affiliated fund that is available only to investment companies managed by MFS. The rate quoted for the MFS Institutional Money Market Portfolio is the annualized seven-day yield of the fund at period end. |
At August 31, 2013, the fund had cash collateral of $1,827,154 and other liquid securities with an aggregate value of $11,163,080 to cover any commitments for securities sold short and/or certain derivative contracts. Cash collateral is comprised of “Deposits with brokers” on the Statement of Assets and Liabilities.
The following abbreviations are used in this report and are defined:
| ADR | | American Depositary Receipt |
| PLC | | Public Limited Company |
See Notes to Financial Statements
15
Financial Statements
STATEMENT OF ASSETS AND LIABILITIES
At 8/31/13
This statement represents your fund’s balance sheet, which details the assets and liabilities comprising the total value of the fund.
| | | | |
| Assets | | | | |
Investments- | | | | |
Non-affiliated issuers, at value (identified cost, $184,566,516) | | | $238,455,613 | |
Underlying affiliated funds, at cost and value | | | 5,062,331 | |
Total investments, at value (identified cost, $189,628,847) | | | $243,517,944 | |
Deposits with brokers | | | 1,827,154 | |
Receivables for | | | | |
Investments sold | | | 313,694 | |
Fund shares sold | | | 535,191 | |
Interest and dividends | | | 236,062 | |
Other assets | | | 464 | |
Total assets | | | $246,430,509 | |
| Liabilities | | | | |
Payables for | | | | |
Dividends on securities sold short | | | $16,865 | |
Securities sold short, at value (proceeds received, $7,289,024) | | | 7,191,619 | |
Investments purchased | | | 830,762 | |
Fund shares reacquired | | | 317,148 | |
Written options outstanding, at value (premiums received, $250,473) | | | 225,570 | |
Payable to affiliates | | | | |
Investment adviser | | | 14,882 | |
Shareholder servicing costs | | | 229,409 | |
Distribution and service fees | | | 6,280 | |
Payable for independent Trustees’ compensation | | | 41,507 | |
Accrued expenses and other liabilities | | | 79,882 | |
Total liabilities | | | $8,953,924 | |
Net assets | | | $237,476,585 | |
| Net assets consist of | | | | |
Paid-in capital | | | $189,799,983 | |
Unrealized appreciation (depreciation) on investments | | | 54,011,405 | |
Accumulated net realized gain (loss) on investments and foreign currency | | | (5,001,315 | ) |
Accumulated net investment loss | | | (1,333,488 | ) |
Net assets | | | $237,476,585 | |
Shares of beneficial interest outstanding | | | 12,379,420 | |
16
Statement of Assets and Liabilities – continued
| | | | | | | | | | | | |
| | | Net assets | | | Shares
outstanding | | | Net asset value
per share (a) | |
Class A | | | $141,146,772 | | | | 7,271,147 | | | | $19.41 | |
Class B | | | 13,009,031 | | | | 733,089 | | | | 17.75 | |
Class C | | | 25,025,628 | | | | 1,412,715 | | | | 17.71 | |
Class I | | | 30,614,767 | | | | 1,505,959 | | | | 20.33 | |
Class R1 | | | 1,542,385 | | | | 87,224 | | | | 17.68 | |
Class R2 | | | 15,889,822 | | | | 843,018 | | | | 18.85 | |
Class R3 | | | 8,863,318 | | | | 456,687 | | | | 19.41 | |
Class R4 | | | 1,268,688 | | | | 63,870 | | | | 19.86 | |
Class R5 | | | 116,174 | | | | 5,711 | | | | 20.34 | |
| (a) | Maximum offering price per share was equal to the net asset value per share for all share classes, except for Class A, for which the maximum offering price per share was $20.59 [100 / 94.25 x $19.41]. On sales of $50,000 or more, the maximum offering price of Class A shares is reduced. A contingent deferred sales charge may be imposed on redemptions of Class A, Class B, and Class C shares. Redemption price per share was equal to the net asset value per share for Classes I, R1, R2, R3, R4, and R5. |
See Notes to Financial Statements
17
Financial Statements
STATEMENT OF OPERATIONS
Year ended 8/31/13
This statement describes how much your fund earned in investment income and accrued in expenses. It also describes any gains and/or losses generated by fund operations.
| | | | |
| Net investment loss | | | | |
Income | | | | |
Dividends | | | $1,917,819 | |
Interest | | | 45,876 | |
Dividends from underlying affiliated funds | | | 2,625 | |
Foreign taxes withheld | | | (2,804 | ) |
Total investment income | | | $1,963,516 | |
Expenses | | | | |
Management fee | | | $1,740,666 | |
Distribution and service fees | | | 833,059 | |
Shareholder servicing costs | | | 509,715 | |
Administrative services fee | | | 40,620 | |
Independent Trustees’ compensation | | | 14,625 | |
Custodian fee | | | 34,424 | |
Shareholder communications | | | 38,367 | |
Audit and tax fees | | | 68,367 | |
Legal fees | | | 2,820 | |
Dividend and interest expense on securities sold short | | | 413,288 | |
Miscellaneous | | | 148,177 | |
Total expenses | | | $3,844,128 | |
Fees paid indirectly | | | (59 | ) |
Reduction of expenses by investment adviser and distributor | | | (7,078 | ) |
Net expenses | | | $3,836,991 | |
Net investment loss | | | $(1,873,475 | ) |
| Realized and unrealized gain (loss) on investments and foreign currency | |
Realized gain (loss) (identified cost basis) | | | | |
Investments | | | $2,969,399 | |
Written options | | | 1,457,958 | |
Securities sold short | | | (3,121,966 | ) |
Foreign currency | | | 888 | |
Net realized gain (loss) on investments and foreign currency | | | $1,306,279 | |
Change in unrealized appreciation (depreciation) | | | | |
Investments | | | $31,506,450 | |
Written options | | | 24,903 | |
Securities sold short | | | 1,464,971 | |
Net unrealized gain (loss) on investments | | | $32,996,324 | |
Net realized and unrealized gain (loss) on investments | | | $34,302,603 | |
Change in net assets from operations | | | $32,429,128 | |
See Notes to Financial Statements
18
Financial Statements
STATEMENTS OF CHANGES IN NET ASSETS
These statements describe the increases and/or decreases in net assets resulting from operations, any distributions, and any shareholder transactions.
| | | | | | | | |
| | | Years ended 8/31 | |
| | | 2013 | | | 2012 | |
| Change in net assets | | | | | | |
| From operations | | | | | | | | |
Net investment loss | | | $(1,873,475 | ) | | | $(2,469,006 | ) |
Net realized gain (loss) on investments and foreign currency | | | 1,306,279 | | | | 12,752,221 | |
Net unrealized gain (loss) on investments and foreign currency translation | | | 32,996,324 | | | | 18,514,293 | |
Change in net assets from operations | | | $32,429,128 | | | | $28,797,508 | |
Change in net assets from fund share transactions | | | $(26,253,234 | ) | | | $40,209,443 | |
Total change in net assets | | | $6,175,894 | | | | $69,006,951 | |
| Net assets | | | | | | | | |
At beginning of period | | | 231,300,691 | | | | 162,293,740 | |
At end of period (including accumulated net investment loss of $1,333,488 and $1,767,082, respectively) | | | $237,476,585 | | | | $231,300,691 | |
See Notes to Financial Statements
19
Financial Statements
FINANCIAL HIGHLIGHTS
The financial highlights table is intended to help you understand the fund’s financial performance for the past 5 years (or life of a particular share class, if shorter). Certain information reflects financial results for a single fund share. The total returns in the table represent the rate by which an investor would have earned (or lost) on an investment in the fund share class (assuming reinvestment of all distributions) held for the entire period.
| | | | | | | | | | | | | | | | | | | | |
| Class A | | Years ended 8/31 | |
| | | 2013 | | | 2012 | | | 2011 | | | 2010 | | | 2009 | |
Net asset value, beginning of period | | | $16.80 | | | | $14.50 | | | | $11.80 | | | | $11.06 | | | | $12.46 | |
| Income (loss) from investment operations | | | | | | | | | | | | | | | | | | | | |
Net investment loss (d) | | | $(0.12 | ) | | | $(0.17 | ) | | | $(0.09 | ) | | | $(0.11 | ) | | | $(0.03 | ) |
Net realized and unrealized gain (loss) on
investments and foreign currency | | | 2.73 | | | | 2.47 | | | | 2.79 | | | | 0.85 | | | | (1.37 | ) |
Total from investment operations | | | $2.61 | | | | $2.30 | | | | $2.70 | | | | $0.74 | | | | $(1.40 | ) |
Net asset value, end of period (x) | | | $19.41 | | | | $16.80 | | | | $14.50 | | | | $11.80 | | | | $11.06 | |
Total return (%) (r)(s)(t)(x) | | | 15.54 | | | | 15.86 | | | | 22.88 | | | | 6.69 | | | | (11.24 | ) |
Ratios (%) (to average net assets)
and Supplemental data: | | | | | | | | | | | | | | | | | | | | |
Expenses before expense reductions (f) | | | 1.55 | | | | 1.45 | | | | 1.52 | | | | 1.63 | | | | 1.85 | |
Expenses after expense reductions (f) | | | 1.54 | | | | 1.45 | | | | 1.52 | | | | 1.57 | | | | 1.48 | |
Net investment loss | | | (0.70 | ) | | | (1.08 | ) | | | (0.61 | ) | | | (0.91 | ) | | | (0.34 | ) |
Portfolio turnover | | | 54 | | | | 68 | | | | 106 | | | | 182 | | | | 226 | |
Net assets at end of period (000 omitted) | | | $141,147 | | | | $143,595 | | | | $96,785 | | | | $82,976 | | | | $86,720 | |
| Supplemental Ratios (%): | | | | | | | | | | | | | | | | | | | | |
Ratio of expenses to average net assets after expense
reductions excluding short sale dividend and
interest expense (f) | | | 1.36 | | | | 1.38 | | | | 1.43 | | | | 1.53 | | | | 1.44 | |
See Notes to Financial Statements
20
Financial Highlights – continued
| | | | | | | | | | | | | | | | | | | | |
| Class B | | Years ended 8/31 | |
| | | 2013 | | | 2012 | | | 2011 | | | 2010 | | | 2009 | |
Net asset value, beginning of period | | | $15.48 | | | | $13.45 | | | | $11.03 | | | | $10.42 | | | | $11.82 | |
| Income (loss) from investment operations | | | | | | | | | | | | | | | | | | | | |
Net investment loss (d) | | | $(0.23 | ) | | | $(0.27 | ) | | | $(0.18 | ) | | | $(0.19 | ) | | | $(0.08 | ) |
Net realized and unrealized gain (loss) on
investments and foreign currency | | | 2.50 | | | | 2.30 | | | | 2.60 | | | | 0.80 | | | | (1.32 | ) |
Total from investment operations | | | $2.27 | | | | $2.03 | | | | $2.42 | | | | $0.61 | | | | $(1.40 | ) |
Net asset value, end of period (x) | | | $17.75 | | | | $15.48 | | | | $13.45 | | | | $11.03 | | | | $10.42 | |
Total return (%) (r)(s)(t)(x) | | | 14.66 | | | | 15.09 | | | | 21.94 | | | | 5.85 | | | | (11.84 | ) |
Ratios (%) (to average net assets)
and Supplemental data: | | | | | | | | | | | | | | | | | | | | |
Expenses before expense reductions (f) | | | 2.30 | | | | 2.20 | | | | 2.27 | | | | 2.37 | | | | 2.58 | |
Expenses after expense reductions (f) | | | 2.29 | | | | 2.20 | | | | 2.27 | | | | 2.32 | | | | 2.19 | |
Net investment loss | | | (1.44 | ) | | | (1.83 | ) | | | (1.35 | ) | | | (1.66 | ) | | | (0.98 | ) |
Portfolio turnover | | | 54 | | | | 68 | | | | 106 | | | | 182 | | | | 226 | |
Net assets at end of period (000 omitted) | | | $13,009 | | | | $12,911 | | | | $11,365 | | | | $11,849 | | | | $15,182 | |
| Supplemental Ratios (%): | | | | | | | | | | | | | | | | | | | | |
Ratio of expenses to average net assets after expense
reductions excluding short sale dividend and
interest expense (f) | | | 2.12 | | | | 2.13 | | | | 2.18 | | | | 2.27 | | | | 2.15 | |
| |
| Class C | | Years ended 8/31 | |
| | | 2013 | | | 2012 | | | 2011 | | | 2010 | | | 2009 | |
Net asset value, beginning of period | | | $15.45 | | | | $13.43 | | | | $11.01 | | | | $10.40 | | | | $11.80 | |
| Income (loss) from investment operations | | | | | | | | | | | | | | | | | | | | |
Net investment loss (d) | | | $(0.24 | ) | | | $(0.27 | ) | | | $(0.19 | ) | | | $(0.19 | ) | | | $(0.08 | ) |
Net realized and unrealized gain (loss) on
investments and foreign currency | | | 2.50 | | | | 2.29 | | | | 2.61 | | | | 0.80 | | | | (1.32 | ) |
Total from investment operations | | | $2.26 | | | | $2.02 | | | | $2.42 | | | | $0.61 | | | | $(1.40 | ) |
Net asset value, end of period (x) | | | $17.71 | | | | $15.45 | | | | $13.43 | | | | $11.01 | | | | $10.40 | |
Total return (%) (r)(s)(t)(x) | | | 14.63 | | | | 15.04 | | | | 21.98 | | | | 5.87 | | | | (11.86 | ) |
Ratios (%) (to average net assets)
and Supplemental data: | | | | | | | | | | | | | | | | | | | | |
Expenses before expense reductions (f) | | | 2.30 | | | | 2.20 | | | | 2.27 | | | | 2.38 | | | | 2.57 | |
Expenses after expense reductions (f) | | | 2.30 | | | | 2.20 | | | | 2.27 | | | | 2.33 | | | | 2.19 | |
Net investment loss | | | (1.45 | ) | | | (1.83 | ) | | | (1.37 | ) | | | (1.66 | ) | | | (1.00 | ) |
Portfolio turnover | | | 54 | | | | 68 | | | | 106 | | | | 182 | | | | 226 | |
Net assets at end of period (000 omitted) | | | $25,026 | | | | $23,940 | | | | $19,251 | | | | $16,858 | | | | $15,356 | |
| Supplemental Ratios (%): | | | | | | | | | | | | | | | | | | | | |
Ratio of expenses to average net assets after expense
reductions excluding short sale dividend and
interest expense (f) | | | 2.12 | | | | 2.13 | | | | 2.18 | | | | 2.28 | | | | 2.15 | |
See Notes to Financial Statements
21
Financial Highlights – continued
| | | | | | | | | | | | | | | | | | | | |
| Class I | | Years ended 8/31 | |
| | | 2013 | | | 2012 | | | 2011 | | | 2010 | | | 2009 | |
Net asset value, beginning of period | | | $17.56 | | | | $15.11 | | | | $12.26 | | | | $11.47 | | | | $12.88 | |
| Income (loss) from investment operations | | | | | | | | | | | | | | | | | | | | |
Net investment loss (d) | | | $(0.08 | ) | | | $(0.14 | ) | | | $(0.06 | ) | | | $(0.08 | ) | | | $(0.00 | )(w) |
Net realized and unrealized gain (loss) on
investments and foreign currency | | | 2.85 | | | | 2.59 | | | | 2.91 | | | | 0.87 | | | | (1.41 | ) |
Total from investment operations | | | $2.77 | | | | $2.45 | | | | $2.85 | | | | $0.79 | | | | $(1.41 | ) |
Net asset value, end of period (x) | | | $20.33 | | | | $17.56 | | | | $15.11 | | | | $12.26 | | | | $11.47 | |
Total return (%) (r)(s)(x) | | | 15.77 | | | | 16.21 | | | | 23.25 | | | | 6.89 | | | | (10.95 | ) |
Ratios (%) (to average net assets)
and Supplemental data: | | | | | | | | | | | | | | | | | | | | |
Expenses before expense reductions (f) | | | 1.30 | | | | 1.20 | | | | 1.27 | | | | 1.38 | | | | 1.56 | |
Expenses after expense reductions (f) | | | 1.30 | | | | 1.20 | | | | 1.27 | | | | 1.33 | | | | 1.19 | |
Net investment loss | | | (0.45 | ) | | | (0.83 | ) | | | (0.38 | ) | | | (0.66 | ) | | | (0.03 | ) |
Portfolio turnover | | | 54 | | | | 68 | | | | 106 | | | | 182 | | | | 226 | |
Net assets at end of period (000 omitted) | | | $30,615 | | | | $21,898 | | | | $10,833 | | | | $8,873 | | | | $6,726 | |
| Supplemental Ratios (%): | | | | | | | | | | | | | | | | | | | | |
Ratio of expenses to average net assets after expense
reductions excluding short sale dividend and
interest expense (f) | | | 1.12 | | | | 1.12 | | | | 1.18 | | | | 1.29 | | | | 1.15 | |
| |
| Class R1 | | Years ended 8/31 | |
| | | 2013 | | | 2012 | | | 2011 | | | 2010 | | | 2009 | |
Net asset value, beginning of period | | | $15.42 | | | | $13.41 | | | | $10.99 | | | | $10.39 | | | | $11.78 | |
| Income (loss) from investment operations | | | | | | | | | | | | | | | | | | | | |
Net investment loss (d) | | | $(0.23 | ) | | | $(0.26 | ) | | | $(0.19 | ) | | | $(0.19 | ) | | | $(0.08 | ) |
Net realized and unrealized gain (loss) on
investments and foreign currency | | | 2.49 | | | | 2.27 | | | | 2.61 | | | | 0.79 | | | | (1.31 | ) |
Total from investment operations | | | $2.26 | | | | $2.01 | | | | $2.42 | | | | $0.60 | | | | $(1.39 | ) |
Net asset value, end of period (x) | | | $17.68 | | | | $15.42 | | | | $13.41 | | | | $10.99 | | | | $10.39 | |
Total return (%) (r)(s)(x) | | | 14.66 | | | | 14.99 | | | | 22.02 | | | | 5.77 | | | | (11.80 | ) |
Ratios (%) (to average net assets)
and Supplemental data: | | | | | | | | | | | | | | | | | | | | |
Expenses before expense reductions (f) | | | 2.30 | | | | 2.21 | | | | 2.27 | | | | 2.38 | | | | 2.58 | |
Expenses after expense reductions (f) | | | 2.30 | | | | 2.21 | | | | 2.27 | | | | 2.32 | | | | 2.19 | |
Net investment loss | | | (1.45 | ) | | | (1.82 | ) | | | (1.39 | ) | | | (1.66 | ) | | | (0.96 | ) |
Portfolio turnover | | | 54 | | | | 68 | | | | 106 | | | | 182 | | | | 226 | |
Net assets at end of period (000 omitted) | | | $1,542 | | | | $1,666 | | | | $1,831 | | | | $1,421 | | | | $1,585 | |
| Supplemental Ratios (%): | | | | | | | | | | | | | | | | | | | | |
Ratio of expenses to average net assets after expense
reductions excluding short sale dividend and
interest expense (f) | | | 2.12 | | | | 2.13 | | | | 2.18 | | | | 2.28 | | | | 2.15 | |
See Notes to Financial Statements
22
Financial Highlights – continued
| | | | | | | | | | | | | | | | | | | | |
| Class R2 | | Years ended 8/31 | |
| | | 2013 | | | 2012 | | | 2011 | | | 2010 | | | 2009 | |
Net asset value, beginning of period | | | $16.36 | | | | $14.15 | | | | $11.54 | | | | $10.85 | | | | $12.25 | |
| Income (loss) from investment operations | | | | | | | | | | | | | | | | | | | | |
Net investment loss (d) | | | $(0.16 | ) | | | $(0.20 | ) | | | $(0.12 | ) | | | $(0.14 | ) | | | $(0.04 | ) |
Net realized and unrealized gain (loss) on
investments and foreign currency | | | 2.65 | | | | 2.41 | | | | 2.73 | | | | 0.83 | | | | (1.36 | ) |
Total from investment operations | | | $2.49 | | | | $2.21 | | | | $2.61 | | | | $0.69 | | | | $(1.40 | ) |
Net asset value, end of period (x) | | | $18.85 | | | | $16.36 | | | | $14.15 | | | | $11.54 | | | | $10.85 | |
Total return (%) (r)(s)(x) | | | 15.22 | | | | 15.62 | | | | 22.62 | | | | 6.36 | | | | (11.43 | ) |
Ratios (%) (to average net assets)
and Supplemental data: | | | | | | | | | | | | | | | | | | | | |
Expenses before expense reductions (f) | | | 1.79 | | | | 1.70 | | | | 1.77 | | | | 1.87 | | | | 2.07 | |
Expenses after expense reductions (f) | | | 1.79 | | | | 1.70 | | | | 1.77 | | | | 1.82 | | | | 1.69 | |
Net investment loss | | | (0.94 | ) | | | (1.33 | ) | | | (0.87 | ) | | | (1.16 | ) | | | (0.50 | ) |
Portfolio turnover | | | 54 | | | | 68 | | | | 106 | | | | 182 | | | | 226 | |
Net assets at end of period (000 omitted) | | | $15,890 | | | | $17,748 | | | | $15,911 | | | | $13,501 | | | | $13,775 | |
| Supplemental Ratios (%): | | | | | | | | | | | | | | | | | | | | |
Ratio of expenses to average net assets after expense
reductions excluding short sale dividend and
interest expense (f) | | | 1.62 | | | | 1.63 | | | | 1.68 | | | | 1.78 | | | | 1.65 | |
| |
| Class R3 | | Years ended 8/31 | |
| | | 2013 | | | 2012 | | | 2011 | | | 2010 | | | 2009 | |
Net asset value, beginning of period | | | $16.80 | | | | $14.49 | | | | $11.79 | | | | $11.06 | | | | $12.45 | |
| Income (loss) from investment operations | | | | | | | | | | | | | | | | | | | | |
Net investment loss (d) | | | $(0.12 | ) | | | $(0.17 | ) | | | $(0.09 | ) | | | $(0.11 | ) | | | $(0.02 | ) |
Net realized and unrealized gain (loss) on
investments and foreign currency | | | 2.73 | | | | 2.48 | | | | 2.79 | | | | 0.84 | | | | (1.37 | ) |
Total from investment operations | | | $2.61 | | | | $2.31 | | | | $2.70 | | | | $0.73 | | | | $(1.39 | ) |
Net asset value, end of period (x) | | | $19.41 | | | | $16.80 | | | | $14.49 | | | | $11.79 | | | | $11.06 | |
Total return (%) (r)(s)(x) | | | 15.54 | | | | 15.94 | | | | 22.90 | | | | 6.60 | | | | (11.16 | ) |
Ratios (%) (to average net assets)
and Supplemental data: | | | | | | | | | | | | | | | | | | | | |
Expenses before expense reductions (f) | | | 1.55 | | | | 1.45 | | | | 1.52 | | | | 1.62 | | | | 1.82 | |
Expenses after expense reductions (f) | | | 1.55 | | | | 1.45 | | | | 1.52 | | | | 1.58 | | | | 1.44 | |
Net investment loss | | | (0.70 | ) | | | (1.08 | ) | | | (0.63 | ) | | | (0.90 | ) | | | (0.24 | ) |
Portfolio turnover | | | 54 | | | | 68 | | | | 106 | | | | 182 | | | | 226 | |
Net assets at end of period (000 omitted) | | | $8,863 | | | | $8,720 | | | | $5,949 | | | | $4,589 | | | | $3,133 | |
| Supplemental Ratios (%): | | | | | | | | | | | | | | | | | | | | |
Ratio of expenses to average net assets after expense
reductions excluding short sale dividend and
interest expense (f) | | | 1.37 | | | | 1.38 | | | | 1.43 | | | | 1.53 | | | | 1.40 | |
See Notes to Financial Statements
23
Financial Highlights – continued
| | | | | | | | | | | | | | | | | | | | |
| Class R4 | | Years ended 8/31 | |
| | | 2013 | | | 2012 | | | 2011 | | | 2010 | | | 2009 | |
Net asset value, beginning of period | | | $17.15 | | | | $14.76 | | | | $11.98 | | | | $11.21 | | | | $12.58 | |
| Income (loss) from investment operations | | | | | | | | | | | | | |
Net investment income (loss) (d) | | | $(0.08 | ) | | | $(0.14 | ) | | | $(0.05 | ) | | | $(0.08 | ) | | | $(0.00 | )(w) |
Net realized and unrealized gain (loss) on
investments and foreign currency | | | 2.79 | | | | 2.53 | | | | 2.83 | | | | 0.85 | | | | (1.37 | ) |
Total from investment operations | | | $2.71 | | | | $2.39 | | | | $2.78 | | | | $0.77 | | | | $(1.37 | ) |
Net asset value, end of period (x) | | | $19.86 | | | | $17.15 | | | | $14.76 | | | | $11.98 | | | | $11.21 | |
Total return (%) (r)(s)(x) | | | 15.80 | | | | 16.19 | | | | 23.21 | | | | 6.87 | | | | (10.89 | ) |
Ratios (%) (to average net assets)
and Supplemental data: | | | | | | | | | | | | | | | | | | | | |
Expenses before expense reductions (f) | | | 1.29 | | | | 1.20 | | | | 1.26 | | | | 1.39 | | | | 1.54 | |
Expenses after expense reductions (f) | | | 1.29 | | | | 1.20 | | | | 1.26 | | | | 1.36 | | | | 1.18 | |
Net investment loss | | | (0.45 | ) | | | (0.84 | ) | | | (0.32 | ) | | | (0.65 | ) | | | (0.02 | ) |
Portfolio turnover | | | 54 | | | | 68 | | | | 106 | | | | 182 | | | | 226 | |
Net assets at end of period (000 omitted) | | | $1,269 | | | | $823 | | | | $368 | | | | $445 | | | | $153 | |
| Supplemental Ratios (%): | | | | | | | | | | | | | | | | | | | | |
Ratio of expenses to average net assets after expense
reductions excluding short sale dividend and
interest expense (f) | | | 1.12 | | | | 1.12 | | | | 1.17 | | | | 1.31 | | | | 1.15 | |
| | | | |
| Class R5 | | Period
ended
8/31/13 (i) | |
Net asset value, beginning of period | | | $17.68 | |
| Income (loss) from investment operations | | | | |
Net investment loss (d) | | | $(0.04 | ) |
Net realized and unrealized gain (loss) on investments and foreign currency | | | 2.70 | |
Total from investment operations | | | $2.66 | |
Net asset value, end of period (x) | | | $20.34 | |
Total return (%) (r)(s)(x) | | | 15.05 | (n) |
Ratios (%) (to average net assets)
and Supplemental data: | | | | |
Expenses before expense reductions (f) | | | 1.13 | (a) |
Expenses after expense reductions (f) | | | 1.13 | (a) |
Net investment loss | | | (0.35 | )(a) |
Portfolio Turnover | | | 54 | (n) |
Net assets at end of period (000 omitted) | | | $116 | |
| Supplemental Ratios (%): | | | | |
Ratio of expenses to average net assets after expense reductions excluding short sale dividend and interest expense (f) | | | 1.01 | (a) |
See Notes to Financial Statements
24
Financial Highlights – continued
| (d) | Per share data is based on average shares outstanding. |
| (f) | Ratios do not reflect reductions from fees paid indirectly, if applicable. |
| (i) | For the period from the class’s inception, January 2, 2013, through the stated period end. |
| (r) | Certain expenses have been reduced without which performance would have been lower. |
| (s) | From time to time the fund may receive proceeds from litigation settlements, without which performance would be lower. |
| (t) | Total returns do not include any applicable sales charges. |
| (w) | Per share amount was less than $0.01. |
| (x) | The net asset values per share and total returns have been calculated on net assets which include adjustments made in accordance with U.S. generally accepted accounting principles required at period end for financial reporting purposes. |
See Notes to Financial Statements
25
NOTES TO FINANCIAL STATEMENTS
(1) Business and Organization
MFS Technology Fund (the fund) is a series of MFS Series Trust I (the trust). The trust is organized as a Massachusetts business trust and is registered under the Investment Company Act of 1940, as amended, as an open-end management investment company.
(2) Significant Accounting Policies
General – The preparation of financial statements in conformity with U.S. generally accepted accounting principles requires management to make estimates and assumptions that affect the reported amounts of assets and liabilities, and disclosure of contingent assets and liabilities at the date of the financial statements and the reported amounts of revenues and expenses during the reporting period. Actual results could differ from those estimates. In the preparation of these financial statements, management has evaluated subsequent events occurring after the date of the fund’s Statement of Assets and Liabilities through the date that the financial statements were issued. The fund invests primarily in securities of issuers in the technology industry. Issuers in a single industry can react similarly to market, economic, political and regulatory conditions and developments.
In January 2013, the Financial Accounting Standards Board (FASB) issued Accounting Standards Update 2013-01 (“ASU 2013-01”) entitled Balance Sheet (Topic 210) – Clarifying the Scope of Disclosures about Offsetting Assets and Liabilities which is intended to clarify the scope of Accounting Standards Update 2011-11 (“ASU 2011-11”), Balance Sheet (Topic 210) – Disclosures about Offsetting Assets and Liabilities. Consistent with the effective date for ASU 2011-11, ASU 2013-01 is effective for annual reporting periods beginning on or after January 1, 2013, and interim periods within those annual periods. ASU 2013-01 limits the scope of ASU 2011-11’s disclosure requirements on offsetting to financial assets and financial liabilities related to derivatives, repurchase and reverse repurchase agreements, and securities lending and securities borrowing transactions. Although still evaluating the potential impact of these two ASUs to the fund, management expects that the impact of the fund’s adoption will be limited to additional financial statement disclosures.
In June 2013, FASB issued Accounting Standards Update 2013-08 Financial Services – Investment Companies (Topic 946) – Amendments to the Scope, Measurement, and Disclosure Requirements (“ASU 2013-08”) which is effective for interim and annual reporting periods in fiscal years that begin after December 15, 2013. ASU 2013-08 sets forth a methodology for determining whether an entity should be characterized as an investment company and prescribes fair value accounting for an investment company’s non-controlling ownership interest in another investment company. FASB has determined that a fund registered under the Investment Company Act of 1940 automatically meets ASU 2013-08’s criteria for an investment company. Although still evaluating the potential impacts of ASU 2013-08 to the fund, management expects that the impact of the fund’s adoption will be limited to additional financial statement disclosures.
Investment Valuations – Equity securities, including restricted equity securities, are generally valued at the last sale or official closing price as provided by a third-party
26
Notes to Financial Statements – continued
pricing service on the market or exchange on which they are primarily traded. Equity securities, for which there were no sales reported that day, are generally valued at the last quoted daily bid quotation as provided by a third-party pricing service on the market or exchange on which such securities are primarily traded. Equity securities held short, for which there were no sales reported for that day, are generally valued at the last quoted daily ask quotation as provided by a third-party pricing service on the market or exchange on which such securities are primarily traded. Short-term instruments with a maturity at issuance of 60 days or less generally are valued at amortized cost, which approximates market value. Exchange-traded options are generally valued at the last sale or official closing price as provided by a third-party pricing service on the exchange on which such options are primarily traded. Exchange-traded options for which there were no sales reported that day are generally valued at the last daily bid quotation as provided by a third-party pricing service on the exchange on which such options are primarily traded. Options not traded on an exchange are generally valued at a broker/dealer bid quotation. Foreign currency options are generally valued at valuations provided by a third-party pricing service. Open-end investment companies are generally valued at net asset value per share. Securities and other assets generally valued on the basis of information from a third-party pricing service may also be valued at a broker/dealer bid quotation. Values obtained from third-party pricing services can utilize both transaction data and market information such as yield, quality, coupon rate, maturity, type of issue, trading characteristics, and other market data. The values of foreign securities and other assets and liabilities expressed in foreign currencies are converted to U.S. dollars using the mean of bid and asked prices for rates provided by a third-party pricing service.
The Board of Trustees has delegated primary responsibility for determining or causing to be determined the value of the fund’s investments (including any fair valuation) to the adviser pursuant to valuation policies and procedures approved by the Board. If the adviser determines that reliable market quotations are not readily available, investments are valued at fair value as determined in good faith by the adviser in accordance with such procedures under the oversight of the Board of Trustees. Under the fund’s valuation policies and procedures, market quotations are not considered to be readily available for most types of debt instruments and floating rate loans and many types of derivatives. These investments are generally valued at fair value based on information from third-party pricing services. In addition, investments may be valued at fair value if the adviser determines that an investment’s value has been materially affected by events occurring after the close of the exchange or market on which the investment is principally traded (such as foreign exchange or market) and prior to the determination of the fund’s net asset value, or after the halting of trading of a specific security where trading does not resume prior to the close of the exchange or market on which the security is principally traded. Events that occur on a frequent basis after foreign markets close (such as developments in foreign markets and significant movements in the U.S. markets) and prior to the determination of the fund’s net asset value may be deemed to have a material effect on the value of securities traded in foreign markets. Accordingly, the fund’s foreign equity securities may often be valued at fair value. The adviser generally relies on third-party pricing services or other information (such as the correlation with price movements of similar securities in the same or other markets; the
27
Notes to Financial Statements – continued
type, cost and investment characteristics of the security; the business and financial condition of the issuer; and trading and other market data) to assist in determining whether to fair value and at what value to fair value an investment. The value of an investment for purposes of calculating the fund’s net asset value can differ depending on the source and method used to determine value. When fair valuation is used, the value of an investment used to determine the fund’s net asset value may differ from quoted or published prices for the same investment. There can be no assurance that the fund could obtain the fair value assigned to an investment if it were to sell the investment at the same time at which the fund determines its net asset value per share.
Various inputs are used in determining the value of the fund’s assets or liabilities. These inputs are categorized into three broad levels. In certain cases, the inputs used to measure fair value may fall into different levels of the fair value hierarchy. In such cases, an investment’s level within the fair value hierarchy is based on the lowest level of input that is significant to the fair value measurement. The fund’s assessment of the significance of a particular input to the fair value measurement in its entirety requires judgment, and considers factors specific to the investment. Level 1 includes unadjusted quoted prices in active markets for identical assets or liabilities. Level 2 includes other significant observable market-based inputs (including quoted prices for similar securities, interest rates, prepayment speed, and credit risk). Level 3 includes unobservable inputs, which may include the adviser’s own assumptions in determining the fair value of investments. Other financial instruments are derivative instruments not reflected in total investments, such as written options. The following is a summary of the levels used as of August 31, 2013 in valuing the fund’s assets or liabilities:
| | | | | | | | | | | | | | | | |
| Investments at Value | | Level 1 | | | Level 2 | | | Level 3 | | | Total | |
| Equity Securities | | | $238,455,613 | | | | $— | | | | $— | | | | $238,455,613 | |
| Mutual Funds | | | 5,062,331 | | | | — | | | | — | | | | 5,062,331 | |
| Total Investments | | | $243,517,944 | | | | $— | | | | $— | | | | $243,517,944 | |
| Short Sales | | | $(7,191,619 | ) | | | $— | | | | $— | | | | $(7,191,619 | ) |
| | | | |
| Other Financial Instruments | | | | | | | | | | | | |
| Written Options | | | $(225,570 | ) | | | $— | | | | $— | | | | $(225,570 | ) |
For further information regarding security characteristics, see the Portfolio of Investments.
Foreign Currency Translation – Purchases and sales of foreign investments, income, and expenses are converted into U.S. dollars based upon currency exchange rates prevailing on the respective dates of such transactions or on the reporting date for foreign denominated receivables and payables. Gains and losses attributable to foreign currency exchange rates on sales of securities are recorded for financial statement purposes as net realized gains and losses on investments. Gains and losses attributable to foreign exchange rate movements on receivables, payables, income and expenses are recorded for financial statement purposes as foreign currency transaction gains and losses. That portion of both realized and unrealized gains and losses on investments that results from fluctuations in foreign currency exchange rates is not separately disclosed.
28
Notes to Financial Statements – continued
Derivatives – The fund uses derivatives for different purposes, primarily to increase or decrease exposure to a particular market or segment of the market, or security, to increase or decrease interest rate or currency exposure, or as alternatives to direct investments. Derivatives are used for hedging or non-hedging purposes. While hedging can reduce or eliminate losses, it can also reduce or eliminate gains. When the fund uses derivatives as an investment to increase market exposure, or for hedging purposes, gains and losses from derivative instruments may be substantially greater than the derivative’s original cost.
The derivative instruments used by the fund were written options and purchased options. The fund’s period end derivatives, as presented in the Portfolio of Investments, generally are indicative of the volume of its derivative activity during the period.
The following table presents, by major type of derivative contract, the fair value, on a gross basis, of the asset and liability components of derivatives held by the fund at August 31, 2013 as reported in the Statement of Assets and Liabilities:
| | | | | | | | | | |
| | | | | Fair Value | |
| Risk | | Derivative Contracts | | Asset Derivatives | | | Liability Derivatives | |
| Equity | | Written Equity Options | | $ | — | | | $ | (225,570 | ) |
The following table presents, by major type of derivative contract, the realized gain (loss) on derivatives held by the fund for the year ended August 31, 2013 as reported in the Statement of Operations:
| | | | | | | | |
| Risk | | Investments
(Purchased
Options) | | | Written
Options | |
| Equity | | | $(1,735,439 | ) | | | $1,457,958 | |
The following table presents, by major type of derivative contract, the change in unrealized appreciation (depreciation) on derivatives held by the fund for the year ended August 31, 2013 as reported in the Statement of Operations:
| | | | | | | | |
| Risk | | Investments
(Purchased
Options) | | | Written
Options | |
| Equity | | | $81,283 | | | | $24,903 | |
Derivative counterparty credit risk is managed through formal evaluation of the creditworthiness of all potential counterparties. On certain, but not all, over-the-counter derivatives, the fund attempts to reduce its exposure to counterparty credit risk whenever possible by entering into an International Swaps and Derivatives Association (ISDA) Master Agreement on a bilateral basis with each of the counterparties with whom it undertakes a significant volume of transactions. The ISDA Master Agreement gives each party to the agreement the right to terminate all transactions traded under such agreement if there is a certain deterioration in the credit quality of the other party. Upon an event of default or a termination of the ISDA Master Agreement, the non-defaulting party has the right to close out all transactions traded under such agreement and to net amounts owed under each transaction to one net amount payable by one party to the other. This right to close out and net payments
29
Notes to Financial Statements – continued
across all transactions traded under the ISDA Master Agreement could result in a reduction of the fund’s credit risk to such counterparty equal to any amounts payable by the fund under the applicable transactions, if any.
Collateral and margin requirements differ by type of derivative. Margin requirements are set by the broker or clearing house for cleared derivatives (i.e., futures contracts, cleared swaps, and exchange-traded options) while collateral terms are contract specific for over-the-counter traded derivatives (i.e., forward foreign currency exchange contracts, uncleared swap agreements, and over-the-counter options). For derivatives traded under an ISDA Master Agreement, the collateral requirements are netted across all transactions traded under such agreement and one amount is posted from one party to the other to collateralize such obligations. Cash that has been segregated to cover the fund’s collateral or margin obligations under derivative contracts, if any, will be reported separately in the Statement of Assets and Liabilities as “Deposits with brokers.” Securities pledged as collateral or margin for the same purpose, if any, is noted in the Portfolio of Investments.
The fund’s accounting policy with respect to balance sheet offsetting is that, absent an event of default by the counterparty or a termination of the agreement, the ISDA Master Agreement does not result in an offset of reported amounts of financial assets and financial liabilities in the Statement of Assets and Liabilities across transactions between the fund and the applicable counterparty.
Written Options – In exchange for a premium, the fund wrote call options on securities that it anticipated the price would decline and also wrote put options on securities that it anticipated the price would increase. At the time the option was written, the fund believed the premium received exceeded the potential loss that could result from adverse price changes in the options’ underlying securities. In a written option, the fund as the option writer grants the buyer the right to purchase from, or sell to, the fund a specified number of shares or units of a particular security, currency or index at a specified price within a specified period of time.
The premium received is initially recorded as a liability in the Statement of Assets and Liabilities. The option is subsequently marked-to-market daily with the difference between the premium received and the market value of the written option being recorded as unrealized appreciation or depreciation. When a written option expires, the fund realizes a gain equal to the amount of the premium received. The difference between the premium received and the amount paid on effecting a closing transaction is considered a realized gain or loss. When a written call option is exercised, the premium received is offset against the proceeds to determine the realized gain or loss. When a written put option is exercised, the premium reduces the cost basis of the security purchased by the fund.
At the initiation of the written option contract, for exchange traded options, the fund is required to deposit securities or cash as collateral with the custodian for the benefit of the broker. For over-the-counter options, the fund may post collateral subject to the terms of an ISDA Master Agreement as generally described above if the market value of the options contract moves against it. The fund, as writer of an option, may have no control over whether the underlying securities may be sold (call) or purchased (put) and, as a result, bears the market risk of an unfavorable change in the price of the
30
Notes to Financial Statements – continued
securities underlying the written option. Losses from writing options can exceed the premium received and can exceed the potential loss from an ordinary buy and sell transaction. Although the fund’s market risk may be significant, the maximum counterparty credit risk to the fund is equal to the market value of any collateral posted to the broker. For over-the-counter options, this risk is mitigated in cases where there is an ISDA Master Agreement between the fund and the counterparty providing for netting as described above.
The following table represents the written option activity in the fund during the year ended August 31, 2013:
| | | | | | | | |
| | | Number of
contracts | | | Premiums
received | |
| Outstanding, beginning of period | | | — | | | | $— | |
| Options written | | | 66,683 | | | | 2,763,848 | |
| Options closed | | | (9,261 | ) | | | (520,071 | ) |
| Options exercised | | | (13,308 | ) | | | (527,198 | ) |
| Options expired | | | (38,532 | ) | | | (1,466,106 | ) |
| Outstanding, end of period | | | 5,582 | | | | $250,473 | |
Purchased Options – The fund purchased call and put options for a premium. Purchased call and put options entitle the holder to buy and sell a specified number of shares or units of a particular security, currency or index at a specified price at a specified date or within a specified period of time. Purchasing call options may hedge against an anticipated increase in the dollar cost of securities or currency to be acquired or increase the fund’s exposure to an underlying instrument. Purchasing put options may hedge against an anticipated decline in the value of portfolio securities or currency or decrease the fund’s exposure to an underlying instrument.
The premium paid is initially recorded as an investment in the Statement of Assets and Liabilities. That investment is subsequently marked-to-market daily with the difference between the premium paid and the market value of the purchased option being recorded as unrealized appreciation or depreciation. Premiums paid for purchased call and put options which have expired are treated as realized losses on investments in the Statement of Operations. Upon the exercise or closing of a purchased call option, the premium paid is added to the cost of the security or financial instrument purchased. Upon the exercise or closing of a purchased put option, the premium paid is offset against the proceeds on the sale of the underlying security or financial instrument in order to determine the realized gain or loss on investments.
Whether or not the option is exercised, the fund’s maximum risk of loss from purchasing an option is the amount of premium paid. All option contracts involve credit risk if the counterparty to the option contract fails to perform. For over-the-counter options, this risk is mitigated in cases where there is an ISDA Master Agreement between the fund and the counterparty providing for netting as described above and for posting of collateral by the counterparty to the fund to cover the fund’s exposure to the counterparty under such ISDA Master Agreement.
Short Sales – The fund entered into short sales whereby it sells a security it does not own in anticipation of a decline in the value of that security. The fund will realize a gain if the security price decreases and a loss if the security price increases between the date
31
Notes to Financial Statements – continued
of the short sale and the date on which the fund replaces the borrowed security. Losses from short sales can exceed the proceeds of the security sold; and they can also exceed the potential loss from an ordinary buy and sell transaction. The amount of any premium, dividends, or interest the fund may be required to pay in connection with a short sale will be recognized as a fund expense. During the year ended August 31, 2013, this expense amounted to $413,288. The fund segregates cash or marketable securities in an amount that, when combined with the amount of proceeds from the short sale deposited with the broker, at least equals the current market value of the security sold short.
Security Loans – Under its Securities Lending Agency Agreement with the fund, State Street Bank and Trust Company (“State Street”), as lending agent, loans the securities of the fund to certain qualified institutions (the “Borrowers”) approved by the fund. The loans are collateralized by cash and/or U.S. Treasury and federal agency obligations in an amount typically at least equal to the market value of the securities loaned. The market value of the loaned securities is determined at the close of business of the fund and any additional required collateral is delivered to the fund on the next business day. State Street provides the fund with indemnification against Borrower default. In the event of Borrower default, State Street will for the benefit of the fund either purchase securities identical to those loaned or, when such purchase is commercially impracticable, pay the fund the market value of the loaned securities. In return, State Street assumes the fund’s rights to the related collateral. If the collateral value is less than the cost to purchase identical securities, State Street is responsible for the shortfall, but only to the extent that such shortfall is not due to a decline in collateral value resulting from collateral reinvestment for which the fund bears the risk of loss. On loans collateralized by cash, the cash collateral is invested in a money market fund or short-term securities. A portion of the income generated upon investment of the collateral is remitted to the Borrowers, and the remainder is allocated between the fund and the lending agent. On loans collateralized by U.S. Treasury and/or federal agency obligations, a fee is received from the Borrower, and is allocated between the fund and the lending agent. Income from securities lending is included in “Interest” income in the Statement of Operations. The dividend and interest income earned on the securities loaned is accounted for in the same manner as other dividend and interest income.
Indemnifications – Under the fund’s organizational documents, its officers and Trustees may be indemnified against certain liabilities and expenses arising out of the performance of their duties to the fund. Additionally, in the normal course of business, the fund enters into agreements with service providers that may contain indemnification clauses. The fund’s maximum exposure under these agreements is unknown as this would involve future claims that may be made against the fund that have not yet occurred.
Investment Transactions and Income – Investment transactions are recorded on the trade date. Interest income is recorded on the accrual basis. Dividends received in cash are recorded on the ex-dividend date. Certain dividends from foreign securities will be recorded when the fund is informed of the dividend if such information is obtained subsequent to the ex-dividend date. Dividend and interest payments received in additional securities are recorded on the ex-dividend or ex-interest date in an amount equal to the value of the security on such date.
32
Notes to Financial Statements – continued
The fund may receive proceeds from litigation settlements. Any proceeds received from litigation involving portfolio holdings are reflected in the Statement of Operations in realized gain/loss if the security has been disposed of by the fund or in unrealized gain/loss if the security is still held by the fund. Any other proceeds from litigation not related to portfolio holdings are reflected as other income in the Statement of Operations.
Fees Paid Indirectly – The fund’s custody fee may be reduced according to an arrangement that measures the value of cash deposited with the custodian by the fund. This amount, for the year ended August 31, 2013, is shown as a reduction of total expenses in the Statement of Operations.
Tax Matters and Distributions – The fund intends to qualify as a regulated investment company, as defined under Subchapter M of the Internal Revenue Code, and to distribute all of its taxable income, including realized capital gains. As a result, no provision for federal income tax is required. The fund’s federal tax returns, when filed, will remain subject to examination by the Internal Revenue Service for a three year period. Foreign taxes have been accrued by the fund in the accompanying financial statements in accordance with the applicable foreign tax law. Foreign income taxes may be withheld by certain countries in which the fund invests.
Distributions to shareholders are recorded on the ex-dividend date. Income and capital gain distributions are determined in accordance with income tax regulations, which may differ from U.S. generally accepted accounting principles. Certain capital accounts in the financial statements are periodically adjusted for permanent differences in order to reflect their tax character. These adjustments have no impact on net assets or net asset value per share. Temporary differences which arise from recognizing certain items of income, expense, gain or loss in different periods for financial statement and tax purposes will reverse at some time in the future. Distributions in excess of net investment income or net realized gains are temporary overdistributions for financial statement purposes resulting from differences in the recognition or classification of income or distributions for financial statement and tax purposes.
Book/tax differences primarily relate to net operating losses, wash sale loss deferrals, and straddle loss deferrals.
The fund declared no distributions for the years ended August 31, 2013 and August 31, 2012.
The federal tax cost and the tax basis components of distributable earnings were as follows:
| | | | |
| As of 8/31/13 | | | |
| Cost of investments | | | $190,260,830 | |
| Gross appreciation | | | 54,783,347 | |
| Gross depreciation | | | (1,526,233 | ) |
| Net unrealized appreciation (depreciation) | | | $53,257,114 | |
| Capital loss carryforwards | | | (2,831,415 | ) |
| Post-October capital loss deferral | | | (247,331 | ) |
| Late year ordinary loss deferral | | | (1,292,146 | ) |
| Other temporary differences | | | (1,209,620 | ) |
33
Notes to Financial Statements – continued
Under the Regulated Investment Company Modernization Act of 2010 (the “Act”), net capital losses recognized for fund fiscal years beginning after August 31, 2011 may be carried forward indefinitely, and their character is retained as short-term and/or long-term losses (“post-enactment losses”). Previously, net capital losses were carried forward for eight years and treated as short-term losses (“pre-enactment losses”). As a transition rule, the Act requires that all post-enactment net capital losses be used before pre-enactment net capital losses.
As of August 31, 2013, the fund had capital loss carryforwards available to offset future realized gains. Such pre-enactment losses expire as follows:
Multiple Classes of Shares of Beneficial Interest – The fund offers multiple classes of shares, which differ in their respective distribution and service fees. The fund’s income, realized and unrealized gain (loss), and common expenses are allocated to shareholders based on the daily net assets of each class. Dividends are declared separately for each class. Differences in per share dividend rates are generally due to differences in separate class expenses. Class B shares will convert to Class A shares approximately eight years after purchase.
(3) Transactions with Affiliates
Investment Adviser – The fund has an investment advisory agreement with MFS to provide overall investment management and related administrative services and facilities to the fund. The management fee is computed daily and paid monthly at the following annual rates:
| | | | |
| First $1 billion of average daily net assets | | | 0.75 | % |
| Average daily net assets in excess of $1 billion | | | 0.70 | % |
Effective April 1, 2013, MFS has agreed in writing to reduce its management fee by a specified amount if certain MFS mutual fund assets exceed thresholds agreed to by MFS and the fund’s Board of Trustees. For the period April 1, 2013 through August 31, 2013, this management fee reduction amounted to $526, which is shown as a reduction of total expenses in the Statement of Operations. The management fee incurred for the year ended August 31, 2013 was equivalent to an annual effective rate of 0.75% of the fund’s average daily net assets.
The investment adviser had agreed in writing to pay a portion of the fund’s total annual operating expenses, exclusive of interest, taxes, extraordinary expenses, brokerage and transaction costs, and investment-related expenses (such as short sale dividend and interest expenses incurred in connection with the fund’s investment activity) such that total fund operating expenses do not exceed the following rates annually of each class’s average daily net assets.
| | | | | | | | | | | | | | | | | | | | | | | | | | | | | | |
| Class A | | | Class B | | | Class C | | | Class I | | | Class R1 | | | Class R2 | | | Class R3 | | | Class R4 | |
| | 1.63% | | | | 2.38 | % | | | 2.38 | % | | | 1.38 | % | | | 2.38 | % | | | 1.88 | % | | | 1.63 | % | | | 1.38 | % |
Effective January 1, 2013 this written agreement was eliminated. For the period September 1, 2012 to January 1, 2013, the fund’s actual operating expenses did not exceed the limit and therefore, the investment adviser did not pay any portion of the fund’s expenses related to this agreement.
34
Notes to Financial Statements – continued
Distributor – MFS Fund Distributors, Inc. (MFD), a wholly-owned subsidiary of MFS, as distributor, received $55,604 for the year ended August 31, 2013, as its portion of the initial sales charge on sales of Class A shares of the fund.
The Board of Trustees has adopted a distribution plan for certain class shares pursuant to Rule 12b-1 of the Investment Company Act of 1940.
The fund’s distribution plan provides that the fund will pay MFD for services provided by MFD and financial intermediaries in connection with the distribution and servicing of certain share classes. One component of the plan is a distribution fee paid to MFD and another component of the plan is a service fee paid to MFD. MFD may subsequently pay all, or a portion, of the distribution and/or service fees to financial intermediaries.
Distribution Plan Fee Table:
| | | | | | | | | | | | | | | | | | | | |
| | | Distribution
Fee Rate (d) | | | Service Fee Rate (d) | | | Total
Distribution
Plan (d) | | | Annual
Effective
Rate (e) | | | Distribution
and Service
Fee | |
| Class A | | | — | | | | 0.25% | | | | 0.25% | | | | 0.25% | | | | $345,834 | |
| Class B | | | 0.75% | | | | 0.25% | | | | 1.00% | | | | 1.00% | | | | 127,944 | |
| Class C | | | 0.75% | | | | 0.25% | | | | 1.00% | | | | 1.00% | | | | 240,745 | |
| Class R1 | | | 0.75% | | | | 0.25% | | | | 1.00% | | | | 1.00% | | | | 15,633 | |
| Class R2 | | | 0.25% | | | | 0.25% | | | | 0.50% | | | | 0.50% | | | | 80,954 | |
| Class R3 | | | — | | | | 0.25% | | | | 0.25% | | | | 0.25% | | | | 21,949 | |
| Total Distribution and Service Fees | | | | | | | | $833,059 | |
| (d) | In accordance with the distribution plan for certain classes, the fund pays distribution and/or service fees equal to these annual percentage rates of each class’s average daily net assets. The distribution and service fee rates disclosed by class represent the current rates in effect at the end of the reporting period. |
| (e) | The annual effective rates represent actual fees incurred under the distribution plan for the year ended August 31, 2013 based on each class’s average daily net assets. Effective January 1, 2013, MFD has voluntarily agreed to rebate a portion of each class’s 0.25% service fee attributable to accounts for which MFD retains the 0.25% service fee except for accounts attributable to MFS or its subsidiaries’ seed money. For the period January 1, 2013 through August 31, 2013, this rebate amounted to $5,689, $112, and $131 for Class A, Class B, and Class C, respectively, and is reflected as a reduction of total expenses in the Statement of Operations. |
Certain Class A shares are subject to a contingent deferred sales charge (CDSC) in the event of a shareholder redemption within 18 months of purchase for shares purchased on or after August 1, 2012, and within 24 months of purchase for shares purchased prior to August 1, 2012. Class C shares are subject to a CDSC in the event of a shareholder redemption within 12 months of purchase. Class B shares are subject to a CDSC in the event of a shareholder redemption within six years of purchase. All contingent deferred sales charges are paid to MFD and during the year ended August 31, 2013, were as follows:
| | | | |
| | | Amount | |
| Class A | | | $279 | |
| Class B | | | 15,260 | |
| Class C | | | 1,607 | |
35
Notes to Financial Statements – continued
Shareholder Servicing Agent – MFS Service Center, Inc. (MFSC), a wholly-owned subsidiary of MFS, receives a fee from the fund for its services as shareholder servicing agent calculated as a percentage of the average daily net assets of the fund as determined periodically under the supervision of the fund’s Board of Trustees. For the year ended August 31, 2013, the fee was $124,826, which equated to 0.0537% annually of the fund’s average daily net assets. MFSC also receives payment from the fund for out-of-pocket expenses, sub-accounting and other shareholder servicing costs which may be paid to affiliated and unaffiliated service providers. Class R5 shares do not incur sub-accounting fees. For the year ended August 31, 2013, these out-of-pocket expenses, sub-accounting and other shareholder servicing costs amounted to $384,889.
Administrator – MFS provides certain financial, legal, shareholder communications, compliance, and other administrative services to the fund. Under an administrative services agreement, the fund partially reimburses MFS the costs incurred to provide these services. The fund is charged an annual fixed amount of $17,500 plus a fee based on average daily net assets. The administrative services fee incurred for the year ended August 31, 2013 was equivalent to an annual effective rate of 0.0175% of the fund’s average daily net assets.
Trustees’ and Officers’ Compensation – The fund pays compensation to independent Trustees in the form of a retainer, attendance fees, and additional compensation to Board and Committee chairpersons. The fund does not pay compensation directly to Trustees or officers of the fund who are also officers of the investment adviser, all of whom receive remuneration for their services to the fund from MFS. Certain officers and Trustees of the fund are officers or directors of MFS, MFD, and MFSC.
Prior to December 31, 2001, the fund had an unfunded defined benefit plan (“DB plan”) for independent Trustees. As of December 31, 2001, the Board took action to terminate the DB plan with respect to then-current and any future independent Trustees, such that the DB plan covers only certain of those former independent Trustees who retired on or before December 31, 2001. Effective January 1, 2002, accrued benefits under the DB plan for then-current independent Trustees who continued were credited to an unfunded retirement deferral plan (the “Retirement Deferral plan”), which was established for and exists solely with respect to these credited amounts, and is not available for other deferrals by these or other independent Trustees. Although the Retirement Deferral plan is unfunded, amounts deferred under the plan are periodically adjusted for investment experience as if they had been invested in shares of the fund. The DB plan resulted in a pension expense of $116 and the Retirement Deferral plan resulted in an expense of $6,918. Both amounts are included in independent Trustees’ compensation for the year ended August 31, 2013. The liability for deferred retirement benefits payable to certain independent Trustees under both plans amounted to $41,506 at August 31, 2013, and is included in “Payable for independent Trustees’ compensation” in the Statement of Assets and Liabilities.
Other – This fund and certain other funds managed by MFS (the funds) have entered into services agreements (the Agreements) which provide for payment of fees by the
36
Notes to Financial Statements – continued
funds to Tarantino LLC and Griffin Compliance LLC in return for the provision of services of an Independent Chief Compliance Officer (ICCO) and Assistant ICCO, respectively, for the funds. The ICCO and Assistant ICCO are officers of the funds and the sole members of Tarantino LLC and Griffin Compliance LLC, respectively. The funds can terminate the Agreements with Tarantino LLC and Griffin Compliance LLC at any time under the terms of the Agreements. For the year ended August 31, 2013, the aggregate fees paid by the fund to Tarantino LLC and Griffin Compliance LLC were $1,605 and are included in “Miscellaneous” expense in the Statement of Operations. MFS has agreed to reimburse the fund for a portion of the payments made by the fund in the amount of $620, which is shown as a reduction of total expenses in the Statement of Operations. Additionally, MFS has agreed to bear all expenses associated with office space, other administrative support, and supplies provided to the ICCO and Assistant ICCO.
The fund invests in the MFS Institutional Money Market Portfolio which is managed by MFS and seeks current income consistent with preservation of capital and liquidity. Income earned on this investment is included in “Dividends from underlying affiliated funds” in the Statement of Operations. This money market fund does not pay a management fee to MFS.
On December 31, 2012, MFS purchased 5,656 shares of Class R5 for an aggregate amount of $100,000.
At August 31, 2013, MFS held 99% of the outstanding shares of Class R5.
(4) Portfolio Securities
Purchases and sales of investments, other than purchased option transactions, short sales, and short-term obligations, aggregated $126,660,622 and $157,659,443, respectively.
(5) Shares of Beneficial Interest
The fund’s Declaration of Trust permits the Trustees to issue an unlimited number of full and fractional shares of beneficial interest. Transactions in fund shares were as follows:
| | | | | | | | | | | | | | | | |
| | | Year ended
8/31/13 (i) | | | Year ended
8/31/12 | |
| | | Shares | | | Amount | | | Shares | | | Amount | |
| Shares sold | | | | | | | | | | | | | | | | |
Class A | | | 1,998,801 | | | | $35,474,800 | | | | 4,385,487 | | | | $68,224,840 | |
Class B | | | 143,289 | | | | 2,310,258 | | | | 249,166 | | | | 3,681,517 | |
Class C | | | 296,811 | | | | 4,831,432 | | | | 452,692 | | | | 6,675,463 | |
Class I | | | 1,041,965 | | | | 18,680,506 | | | | 825,858 | | | | 13,582,625 | |
Class R1 | | | 38,814 | | | | 620,331 | | | | 65,270 | | | | 952,929 | |
Class R2 | | | 270,131 | | | | 4,615,415 | | | | 449,751 | | | | 6,881,970 | |
Class R3 | | | 163,093 | | | | 2,927,544 | | | | 217,083 | | | | 3,429,874 | |
Class R4 | | | 35,406 | | | | 647,688 | | | | 33,836 | | | | 580,313 | |
Class R5 | | | 5,711 | | | | 101,001 | | | | — | | | | — | |
| | | 3,994,021 | | | | $70,208,975 | | | | 6,679,143 | | | | $104,009,531 | |
37
Notes to Financial Statements – continued
| | | | | | | | | | | | | | | | |
| | | Year ended
8/31/13 (i) | | | Year ended
8/31/12 | |
| | | Shares | | | Amount | | | Shares | | | Amount | |
| Shares reacquired | | | | | | | | | | | | | | | | |
Class A | | | (3,272,672 | ) | | | $(56,758,621 | ) | | | (2,516,406 | ) | | | $(39,626,319 | ) |
Class B | | | (244,390 | ) | | | (3,969,475 | ) | | | (259,722 | ) | | | (3,774,776 | ) |
Class C | | | (433,533 | ) | | | (7,011,725 | ) | | | (336,739 | ) | | | (4,866,313 | ) |
Class I | | | (783,374 | ) | | | (14,730,202 | ) | | | (295,603 | ) | | | (4,806,624 | ) |
Class R1 | | | (59,602 | ) | | | (962,229 | ) | | | (93,859 | ) | | | (1,325,651 | ) |
Class R2 | | | (512,114 | ) | | | (8,690,192 | ) | | | (489,349 | ) | | | (7,511,245 | ) |
Class R3 | | | (225,398 | ) | | | (3,998,155 | ) | | | (108,503 | ) | | | (1,713,405 | ) |
Class R4 | | | (19,529 | ) | | | (341,610 | ) | | | (10,799 | ) | | | (175,755 | ) |
Class R5 | | | — | | | | — | | | | — | | | | — | |
| | | (5,550,612 | ) | | | $(96,462,209 | ) | | | (4,110,980 | ) | | | $(63,800,088 | ) |
| | | | |
| Net change | | | | | | | | | | | | | | | | |
Class A | | | (1,273,871 | ) | | | $(21,283,821 | ) | | | 1,869,081 | | | | $28,598,521 | |
Class B | | | (101,101 | ) | | | (1,659,217 | ) | | | (10,556 | ) | | | (93,259 | ) |
Class C | | | (136,722 | ) | | | (2,180,293 | ) | | | 115,953 | | | | 1,809,150 | |
Class I | | | 258,591 | | | | 3,950,304 | | | | 530,255 | | | | 8,776,001 | |
Class R1 | | | (20,788 | ) | | | (341,898 | ) | | | (28,589 | ) | | | (372,722 | ) |
Class R2 | | | (241,983 | ) | | | (4,074,777 | ) | | | (39,598 | ) | | | (629,275 | ) |
Class R3 | | | (62,305 | ) | | | (1,070,611 | ) | | | 108,580 | | | | 1,716,469 | |
Class R4 | | | 15,877 | | | | 306,078 | | | | 23,037 | | | | 404,558 | |
Class R5 | | | 5,711 | | | | 101,001 | | | | — | | | | — | |
| | | (1,556,591 | ) | | | $(26,253,234 | ) | | | 2,568,163 | | | | $40,209,443 | |
| (i) | For Class R5, the period is from inception, January 2, 2013, though the stated period end. |
(6) Line of Credit
The fund and certain other funds managed by MFS participate in a $1.1 billion unsecured committed line of credit, subject to a $1 billion sublimit, provided by a syndication of banks under a credit agreement. Borrowings may be made for temporary financing needs. Interest is charged to each fund, based on its borrowings, generally at a rate equal to the higher of the Federal Reserve funds rate or one month LIBOR plus an agreed upon spread. A commitment fee, based on the average daily, unused portion of the committed line of credit, is allocated among the participating funds at the end of each calendar quarter. In addition, the fund and other funds managed by MFS have established unsecured uncommitted borrowing arrangements with certain banks for temporary financing needs. Interest is charged to each fund, based on its borrowings, at a rate equal to the Federal Reserve funds rate plus an agreed upon spread. For the year ended August 31, 2013, the fund’s commitment fee and interest expense were $1,235 and $0, respectively, and are included in “Miscellaneous” expense in the Statement of Operations.
38
Notes to Financial Statements – continued
(7) Transactions in Underlying Affiliated Funds-Affiliated Issuers
An affiliated issuer may be considered one in which the fund owns 5% or more of the outstanding voting securities, or a company which is under common control. For the purposes of this report, the fund assumes the following to be an affiliated issuer:
| | | | | | | | | | | | | | | | |
| Underlying Affiliated Fund | | Beginning
Shares/Par
Amount | | | Acquisitions
Shares/Par
Amount | | | Dispositions
Shares/Par
Amount | | | Ending
Shares/Par
Amount | |
| MFS Institutional Money Market Portfolio | | | 2,655,233 | | | | 84,906,684 | | | | (82,499,586 | ) | | | 5,062,331 | |
| | | | |
| Underlying Affiliated Fund | | Realized
Gain (Loss) | | | Capital Gain
Distributions | | | Dividend
Income | | | Ending
Value | |
| MFS Institutional Money Market Portfolio | | | $— | | | | $— | | | | $2,625 | | | | $5,062,331 | |
39
REPORT OF INDEPENDENT REGISTERED PUBLIC ACCOUNTING FIRM
To the Board of Trustees of MFS Series Trust I and Shareholders of MFS Technology Fund:
We have audited the accompanying statement of assets and liabilities of MFS Technology Fund (the Fund) (one of the portfolios comprising MFS Series Trust I), including the portfolio of investments, as of August 31, 2013, and the related statement of operations for the year then ended, the statements of changes in net assets for each of the two years in the period then ended, and the financial highlights for each of the periods indicated therein. These financial statements and financial highlights are the responsibility of the Fund’s management. Our responsibility is to express an opinion on these financial statements and financial highlights based on our audits.
We conducted our audits in accordance with the standards of the Public Company Accounting Oversight Board (United States). Those standards require that we plan and perform the audit to obtain reasonable assurance about whether the financial statements and financial highlights are free of material misstatement. We were not engaged to perform an audit of the Fund’s internal control over financial reporting. Our audits included consideration of internal control over financial reporting as a basis for designing audit procedures that are appropriate in the circumstances, but not for the purpose of expressing an opinion on the effectiveness of the Fund’s internal control over financial reporting. Accordingly, we express no such opinion. An audit also includes examining, on a test basis, evidence supporting the amounts and disclosures in the financial statements and financial highlights, assessing the accounting principles used and significant estimates made by management, and evaluating the overall financial statement presentation. Our procedures included confirmation of securities owned as of August 31, 2013, by correspondence with the custodian and others or by other appropriate auditing procedures where replies from others were not received. We believe that our audits provide a reasonable basis for our opinion.
In our opinion, the financial statements and financial highlights referred to above present fairly, in all material respects, the financial position of MFS Technology Fund at August 31, 2013, the results of its operations for the year then ended, the changes in its net assets for each of the two years in the period then ended, and its financial highlights for each of the periods indicated therein, in conformity with U.S. generally accepted accounting principles.

Boston, Massachusetts
October 17, 2013
40
TRUSTEES AND OFFICERS — IDENTIFICATION AND BACKGROUND
The Trustees and Officers of the Trust, as of October 1, 2013, are listed below, together with their principal occupations during the past five years. (Their titles may have varied during that period.) The address of each Trustee and officer is 111 Huntington Avenue, Boston, Massachusetts 02199-7618.
| | | | | | | | |
Name, Age | | Position(s) Held with Fund | | Trustee/Officer
Since (h) | | Principal
Occupations During the Past Five Years | | Other Directorships (j) |
| INTERESTED TRUSTEES |
Robert J. Manning (k) (age 49) | | Trustee | | February 2004 | | Massachusetts Financial Services Company, Chairman, Chief Executive Officer and Director; President (until 2009); Chief Investment Officer (until 2010) | | N/A |
| INDEPENDENT TRUSTEES |
David H. Gunning (age 71) | | Trustee and Chair of Trustees | | January 2004 | | Private investor | | Lincoln Electric Holdings, Inc. (welding equipment manufacturer), Director; Development Alternatives, Inc. (consulting), Director/Non-Executive Chairman; Portman Limited (mining), Director (until 2008) |
Robert E. Butler (age 71) | | Trustee | | January 2006 | | Consultant – investment company industry regulatory and compliance matters | | N/A |
Maureen R. Goldfarb (age 58) | | Trustee | | January 2009 | | Private investor | | N/A |
William R. Gutow (age 72) | | Trustee | | December 1993 | | Private investor and real estate consultant; Capitol Entertainment Management Company (video franchise), Vice Chairman | | Texas Donuts (donut franchise), Vice Chairman (until 2010) |
41
Trustees and Officers – continued
| | | | | | | | |
Name, Age | | Position(s) Held with Fund | | Trustee/Officer
Since (h) | | Principal
Occupations During the Past Five Years | | Other Directorships (j) |
Michael Hegarty (age 68) | | Trustee | | December 2004 | | Private investor | | Brookfield Office Properties, Inc. (real estate), Director; Rouse Properties Inc. (real estate), Director; Capmark Financial Group Inc. (real estate), Director |
John P. Kavanaugh (age 58) | | Trustee | | January 2009 | | Private investor | | N/A |
J. Dale Sherratt (age 75) | | Trustee | | June 1989 | | Insight Resources, Inc. (acquisition planning specialists), President; Wellfleet Investments (investor in health care companies), Managing General Partner | | N/A |
Laurie J. Thomsen (age 56) | | Trustee | | March 2005 | | Private investor; New Profit, Inc. (venture philanthropy), Executive Partner (until 2010) | | The Travelers Companies (insurance), Director |
Robert W. Uek (age 72) | | Trustee | | January 2006 | | Consultant to investment company industry | | N/A |
| OFFICERS |
John M. Corcoran (k) (age 48) | | President | | October 2008 | | Massachusetts Financial Services Company, Senior Vice President (since October 2008); State Street Bank and Trust (financial services provider), Senior Vice President, (until 2008) | | N/A |
Christopher R. Bohane (k) (age 39) | | Assistant Secretary and Assistant Clerk | | July 2005 | | Massachusetts Financial Services Company, Vice President and Assistant General Counsel | | N/A |
Kino Clark (k) (age 45) | | Assistant Treasurer | | January 2012 | | Massachusetts Financial Services Company, Vice President | | N/A |
42
Trustees and Officers – continued
| | | | | | | | |
Name, Age | | Position(s) Held with Fund | | Trustee/Officer
Since (h) | | Principal
Occupations During the Past Five Years | | Other Directorships (j) |
Thomas H. Connors (k) (age 54) | | Assistant Secretary and Assistant Clerk | | September 2012 | | Massachusetts Financial Services Company, Vice President and Senior Counsel; Deutsche Investment Management Americas Inc. (financial service provider), Director and Senior Counsel (until 2012) | | N/A |
Ethan D. Corey (k) (age 49) | | Assistant Secretary and Assistant Clerk | | July 2005 | | Massachusetts Financial Services Company, Senior Vice President and Associate General Counsel | | N/A |
David L. DiLorenzo (k)
(age 45) | | Treasurer | | July 2005 | | Massachusetts Financial Services Company, Senior Vice President | | N/A |
Robyn L. Griffin (age 38) | | Assistant Independent Chief Compliance Officer | | August 2008 | | Griffin Compliance LLC (provider of compliance services), Principal (since August 2008); State Street Corporation (financial services provider), Mutual Fund Administration Assistant Vice President (until 2008) | | N/A |
Brian E. Langenfeld (k) (age 40) | | Assistant Secretary and Assistant Clerk | | June 2006 | | Massachusetts Financial Services Company, Vice President and Senior Counsel | | N/A |
Susan S. Newton (k) (age 63) | | Assistant Secretary and Assistant Clerk | | May 2005 | | Massachusetts Financial Services Company, Senior Vice President and Associate General Counsel | | N/A |
Susan A. Pereira (k) (age 42) | | Assistant Secretary and Assistant Clerk | | July 2005 | | Massachusetts Financial Services Company, Vice President and Senior Counsel | | N/A |
43
Trustees and Officers – continued
| | | | | | | | |
Name, Age | | Position(s) Held with Fund | | Trustee/Officer
Since (h) | | Principal
Occupations During the Past Five Years | | Other Directorships (j) |
Kasey L. Phillips (k) (age 42) | | Assistant Treasurer | | September 2012 | | Massachusetts Financial Services Company, Vice President; Wells Fargo Funds Management, LLC, Senior Vice President, Fund Treasurer (until 2012) | | N/A |
Mark N. Polebaum (k) (age 61) | | Secretary and Clerk | | January 2006 | | Massachusetts Financial Services Company, Executive Vice President, General Counsel and Secretary | | N/A |
Frank L. Tarantino (age 69) | | Independent Chief Compliance Officer | | June 2004 | | Tarantino LLC (provider of compliance services), Principal | | N/A |
Richard S. Weitzel (k) (age 43) | | Assistant Secretary and Assistant Clerk | | October 2007 | | Massachusetts Financial Services Company, Senior Vice President and Associate General Counsel | | N/A |
James O. Yost (k) (age 53) | | Deputy Treasurer | | September 1990 | | Massachusetts Financial Services Company, Senior Vice President | | N/A |
| (h) | Date first appointed to serve as Trustee/officer of an MFS Fund. Each Trustee has served continuously since appointment unless indicated otherwise. For the period from December 15, 2004 until February 22, 2005, Mr. Manning served as Advisory Trustee. For the period October 2008, until January 2012, Mr. Corcoran served as Treasurer of the Funds. Prior to January 2012, Messrs. DiLorenzo and Yost served as Assistant Treasurers of the Funds. |
| (j) | Directorships or trusteeships of companies required to report to the Securities and Exchange Commission (i.e., “public companies”). |
| (k) | “Interested person” of the Trust within the meaning of the Investment Company Act of 1940 (referred to as the 1940 Act), which is the principal federal law governing investment companies like the fund, as a result of position with MFS. The address of MFS is 111 Huntington Avenue, Boston, Massachusetts 02199-7618. |
Each Trustee has been elected by shareholders and each Trustee and officer holds office until his or her successor is chosen and qualified or until his or her earlier death, resignation, retirement or removal. The Trust does not hold annual meetings for the purpose of electing Trustees, and Trustees are not elected for fixed terms. Messrs. Butler, Kavanaugh, Uek and Ms. Thomsen are members of the Trust’s Audit Committee.
Each of the Fund’s Trustees and officers holds comparable positions with certain other funds of which MFS or a subsidiary is the investment adviser or distributor, and, in the case of the officers, with certain affiliates of MFS. As of January 1, 2013, the Trustees served as board members of 143 funds within the MFS Family of Funds.
44
Trustees and Officers – continued
The Statement of Additional Information for the Fund includes further information about the Trustees and is available without charge upon request by calling 1-800-225-2606.
| | |
| Investment Adviser | | Custodian |
| Massachusetts Financial Services Company | | State Street Bank and Trust Company |
| 111 Huntington Avenue | | 1 Lincoln Street |
| Boston, MA 02199-7618 | | Boston, MA 02111-2900 |
| Distributor | | Independent Registered Public Accounting Firm |
| MFS Fund Distributors, Inc. | | Ernst & Young LLP |
| 111 Huntington Avenue | | 200 Clarendon Street |
| Boston, MA 02199-7618 | | Boston, MA 02116 |
| Portfolio Manager | | |
| Matthew Sabel | | |
45
BOARD REVIEW OF INVESTMENT ADVISORY AGREEMENT
The Investment Company Act of 1940 requires that both the full Board of Trustees and a majority of the non-interested (“independent”) Trustees, voting separately, annually approve the continuation of the Fund’s investment advisory agreement with MFS. The Trustees consider matters bearing on the Fund and its advisory arrangements at their meetings throughout the year, including a review of performance data at each regular meeting. In addition, the independent Trustees met several times over the course of three months beginning in May and ending in July, 2013 (“contract review meetings”) for the specific purpose of considering whether to approve the continuation of the investment advisory agreement for the Fund and the other investment companies that the Board oversees (the “MFS Funds”). The independent Trustees were assisted in their evaluation of the Fund’s investment advisory agreement by independent legal counsel, from whom they received separate legal advice and with whom they met separately from MFS during various contract review meetings. The independent Trustees were also assisted in this process by the MFS Funds’ Independent Chief Compliance Officer, a full-time senior officer appointed by and reporting to the independent Trustees.
In connection with their deliberations regarding the continuation of the investment advisory agreement, the Trustees, including the independent Trustees, considered such information and factors as they believed, in light of the legal advice furnished to them and their own business judgment, to be relevant. The investment advisory agreement for the Fund was considered separately, although the Trustees also took into account the common interests of all MFS Funds in their review. As described below, the Trustees considered the nature, quality, and extent of the various investment advisory, administrative, and shareholder services performed by MFS under the existing investment advisory agreement and other arrangements with the Fund.
In connection with their contract review meetings, the Trustees received and relied upon materials that included, among other items: (i) information provided by Lipper Inc., an independent third party, on the investment performance of the Fund for various time periods ended December 31, 2012 and the investment performance of a group of funds with substantially similar investment classifications/objectives (the “Lipper performance universe”), (ii) information provided by Lipper Inc. on the Fund’s advisory fees and other expenses and the advisory fees and other expenses of comparable funds identified by Lipper Inc. (the “Lipper expense group”), (iii) information provided by MFS on the advisory fees of comparable portfolios of other clients of MFS, including institutional separate accounts and other clients, (iv) information as to whether and to what extent applicable expense waivers, reimbursements or fee “breakpoints” are observed for the Fund, (v) information regarding MFS’ financial results and financial condition, including MFS’ and certain of its affiliates’ estimated profitability from services performed for the Fund and the MFS Funds as a whole, and compared to MFS’ institutional business, (vi) MFS’ views regarding the outlook for the mutual fund industry and the strategic business plans of MFS, (vii) descriptions of various functions performed by MFS for the Funds, such as compliance monitoring and portfolio trading practices, and (viii) information regarding the overall organization of MFS, including information about MFS’ senior management and other personnel providing investment advisory, administrative and other services to
46
Board Review of Investment Advisory Agreement – continued
the Fund and the other MFS Funds. The comparative performance, fee and expense information prepared and provided by Lipper Inc. was not independently verified and the independent Trustees did not independently verify any information provided to them by MFS.
The Trustees’ conclusion as to the continuation of the investment advisory agreement was based on a comprehensive consideration of all information provided to the Trustees and not the result of any single factor. Some of the factors that figured particularly in the Trustees’ deliberations are described below, although individual Trustees may have evaluated the information presented differently from one another, giving different weights to various factors. It is also important to recognize that the fee arrangements for the Fund and other MFS Funds are the result of years of review and discussion between the independent Trustees and MFS, that certain aspects of such arrangements may receive greater scrutiny in some years than in others, and that the Trustees’ conclusions may be based, in part, on their consideration of these same arrangements during the course of the year and in prior years.
Based on information provided by Lipper Inc. and MFS, the Trustees reviewed the Fund’s total return investment performance as well as the performance of peer groups of funds over various time periods. The Trustees placed particular emphasis on the total return performance of the Fund’s Class A shares in comparison to the performance of funds in its Lipper performance universe over the three-year period ended December 31, 2012, which the Trustees believed was a long enough period to reflect differing market conditions. The total return performance of the Fund’s Class A shares was in the 1st quintile relative to the other funds in the universe for this three-year period (the 1st quintile being the best performers and the 5th quintile being the worst performers). The total return performance of the Fund’s Class A shares was in the 3rd quintile for the one-year period and the 2nd quintile for the five-year period ended December 31, 2012 relative to the Lipper performance universe. Because of the passage of time, these performance results may differ from the performance results for more recent periods, including those shown elsewhere in this report.
In the course of their deliberations, the Trustees took into account information provided by MFS in connection with the contract review meetings, as well as during investment review meetings conducted with portfolio management personnel during the course of the year regarding the Fund’s performance. After reviewing these and related factors, the Trustees concluded, within the context of their overall conclusions regarding the investment advisory agreement, that they were satisfied with MFS’ responses and efforts relating to investment performance.
In assessing the reasonableness of the Fund’s advisory fee, the Trustees considered, among other information, the Fund’s advisory fee and the total expense ratio of the Fund’s Class A shares as a percentage of average daily net assets and the advisory fee and total expense ratios of peer groups of funds based on information provided by Lipper Inc. The Trustees considered that, according to the Lipper data (which takes into account any fee reductions or expense limitations that were in effect during the Fund’s last fiscal year), the Fund’s effective advisory fee rate and total expense ratio were each lower than the Lipper expense group median.
47
Board Review of Investment Advisory Agreement – continued
The Trustees also considered the advisory fees charged by MFS to any comparable institutional accounts. In comparing these fees, the Trustees considered information provided by MFS as to the generally broader scope of services provided by MFS to the Fund in comparison to institutional accounts, the higher demands placed on MFS’ investment personnel and trading infrastructure as a result of the daily cash in-flows and out-flows of the Fund, and the impact on MFS and expenses associated with the more extensive regulatory regime to which the Fund is subject in comparison to institutional accounts.
The Trustees also considered whether the Fund may benefit from any economies of scale in the management of the Fund in the event of growth in assets of the Fund and/or growth in assets of the MFS Funds as a whole. They noted that the Fund’s advisory fee rate schedule is subject to a contractual breakpoint that reduces the Fund’s advisory fee rate on average daily net assets over $1 billion. The Trustees also noted that MFS has agreed in writing to waive a portion of the management fees of certain MFS Funds, including the Fund, if the total combined assets of certain funds within the MFS Funds’ complex increase above agreed upon thresholds (the “group fee waiver”), enabling the Fund’s shareholders to share in the benefits from any economies of scale at the complex level. The group fee waiver is reviewed and renewed annually between the Board and MFS. The Trustees concluded that the existing breakpoint and the group fee waiver were sufficient to allow the Fund to benefit from economies of scale as its assets and overall complex assets grow.
The Trustees also considered information prepared by MFS relating to MFS’ costs and profits with respect to the Fund, the MFS Funds considered as a group, and other investment companies and accounts advised by MFS, as well as MFS’ methodologies used to determine and allocate its costs to the MFS Funds, the Fund and other accounts and products for purposes of estimating profitability.
After reviewing these and other factors described herein, the Trustees concluded, within the context of their overall conclusions regarding the investment advisory agreement, that the advisory fees charged to the Fund represent reasonable compensation in light of the services being provided by MFS to the Fund.
In addition, the Trustees considered MFS’ resources and related efforts to continue to retain, attract and motivate capable personnel to serve the Fund. The Trustees also considered current and developing conditions in the financial services industry, including the presence of large and well-capitalized companies which are spending, and appear to be prepared to continue to spend, substantial sums to engage personnel and to provide services to competing investment companies. In this regard, the Trustees also considered the financial resources of MFS and its ultimate parent, Sun Life Financial Inc. The Trustees also considered the advantages and possible disadvantages to the Fund of having an adviser that also serves other investment companies as well as other accounts.
The Trustees also considered the nature, quality, cost, and extent of administrative, transfer agency, and distribution services provided to the Fund by MFS and its affiliates under agreements and plans other than the investment advisory agreement, including any 12b-1 fees the Fund pays to MFS Fund Distributors, Inc., an affiliate of MFS. The Trustees also considered the nature, extent and quality of certain other services MFS
48
Board Review of Investment Advisory Agreement – continued
performs or arranges for on the Fund’s behalf, which may include securities lending programs, directed expense payment programs, class action recovery programs, and MFS’ interaction with third-party service providers, principally custodians and sub-custodians. The Trustees concluded that the various non-advisory services provided by MFS and its affiliates on behalf of the Fund were satisfactory.
The Trustees also considered benefits to MFS from the use of the Fund’s portfolio brokerage commissions, if applicable, to pay for investment research and various other factors. Additionally, the Trustees considered so-called “fall-out benefits” to MFS such as reputational value derived from serving as investment manager to the Fund.
Based on their evaluation of factors that they deemed to be material, including those factors described above, the Board of Trustees, including the independent Trustees, concluded that the Fund’s investment advisory agreement with MFS should be continued for an additional one-year period, commencing August 1, 2013.
A discussion regarding the Board’s most recent review and renewal of the fund’s Investment Advisory Agreement with MFS is available by clicking on the fund’s name under “Mutual Funds” in the “Products” section of the MFS Web site (mfs.com).
49
PROXY VOTING POLICIES AND INFORMATION
A general description of the MFS funds’ proxy voting policies and procedures is available without charge, upon request, by calling 1-800-225-2606, by visiting the Proxy Voting section of mfs.com or by visiting the SEC’s Web site at http://www.sec.gov.
Information regarding how the fund voted proxies relating to portfolio securities during the most recent twelve-month period ended June 30 is available without charge by visiting the Proxy Voting section of mfs.com or by visiting the SEC’s Web site at http://www.sec.gov.
QUARTERLY PORTFOLIO DISCLOSURE
The fund will file a complete schedule of portfolio holdings with the Securities and Exchange Commission (the Commission) for the first and third quarters of each fiscal year on Form N-Q. A shareholder can obtain the quarterly portfolio holdings report at mfs.com. The fund’s Form N-Q is also available on the EDGAR database on the Commission’s Internet Web site at http://www.sec.gov, and may be reviewed and copied at the:
Public Reference Room
Securities and Exchange Commission
100 F Street, NE, Room 1580
Washington, D.C. 20549
Information on the operation of the Public Reference Room may be obtained by calling the Commission at 1-800-SEC-0330. Copies of the fund’s Form N-Q also may be obtained, upon payment of a duplicating fee, by electronic request at the following e-mail address: publicinfo@sec.gov or by writing the Public Reference Section at the above address.
FURTHER INFORMATION
From time to time, MFS may post important information about the fund or the MFS funds on the MFS web site (mfs.com). This information is available by visiting the “News & Commentary” section of mfs.com or by clicking on the fund’s name under “Mutual Funds” in the “Products” section of mfs.com.
FEDERAL TAX INFORMATION (unaudited)
The fund will notify shareholders of amounts for use in preparing 2013 income tax forms in January 2014.
50
rev. 3/11
| | | | |
| | | |
FACTS | | WHAT DOES MFS DO WITH YOUR PERSONAL INFORMATION? | |  |
| | |
| Why? | | Financial companies choose how they share your personal information. Federal law gives consumers the right to limit some but not all sharing. Federal law also requires us to tell you how we collect, share, and protect your personal information. Please read this notice carefully to understand what we do. |
| | |
| What? | | The types of personal information we collect and share depend on the product or service you have with us. This information can include: • Social Security number and account balances • Account transactions and transaction history • Checking account information and wire transfer instructions When you are no longer our customer, we continue to share your information as described in this notice. |
| | |
| How? | | All financial companies need to share customers’ personal information to run their everyday business. In the section below, we list the reasons financial companies can share their customers’ personal information; the reasons MFS chooses to share; and whether you can limit this sharing. |
| | | | |
Reasons we can share your
personal information | | Does MFS
share? | | Can you limit
this sharing? |
For our everyday business purposes – such as to process your transactions, maintain your account(s), respond to court orders and legal investigations, or report to credit bureaus | | Yes | | No |
For our marketing purposes – to offer our products and services to you | | No | | We don’t share |
| For joint marketing with other financial companies | | No | | We don’t share |
For our affiliates’ everyday business purposes – information about your transactions and experiences | | No | | We don’t share |
For our affiliates’ everyday business purposes – information about your creditworthiness | | No | | We don’t share |
| For nonaffiliates to market to you | | No | | We don’t share |
| | |
| Questions? | | Call 800-225-2606 or go to mfs.com. |
51
| | |
| Who we are |
| Who is providing this notice? | | MFS Funds, MFS Investment Management, MFS Institutional Advisors, Inc., MFS Fund Distributors, Inc., MFS Heritage Trust Company, and MFS Service Center, Inc. |
| | |
| What we do |
| How does MFS protect my personal information? | | To protect your personal information from unauthorized access and use, we use security measures that comply with federal law. These measures include procedural, electronic, and physical safeguards for the protection of the personal information we collect about you. |
| How does MFS collect my personal information? | | We collect your personal information, for example, when you • open an account or provide account information • direct us to buy securities or direct us to sell your securities • make a wire transfer We also collect your personal information from others, such as credit bureaus, affiliates and other companies. |
| Why can’t I limit all sharing? | | Federal law gives you the right to limit only • sharing for affiliates’ everyday business purposes – information about your creditworthiness • affiliates from using your information to market to you • sharing for nonaffiliates to market to you State laws and individual companies may give you additional rights to limit sharing. |
| | |
| Definitions |
| Affiliates | | Companies related by common ownership or control. They can be financial and nonfinancial companies. • MFS does not share personal information with affiliates, except for everyday business purposes as described on page one of this notice. |
| Nonaffiliates | | Companies not related by common ownership or control. They can be financial and nonfinancial companies. • MFS does not share with nonaffiliates so they can market to you. |
| Joint Marketing | | A formal agreement between nonaffiliated financial companies that together market financial products or services to you. • MFS doesn’t jointly market. |
| | |
| Other important information |
| If you own an MFS product or receive an MFS service in the name of a third party such as a bank or broker-dealer, their privacy policy may apply to you instead of ours. |
52
Save paper with eDelivery.

| MFS® will send you prospectuses, |
reports, and proxies directly via e-mail so you will get information faster with less mailbox clutter.
To sign up:
1. Go to mfs.com.
2. Log in via MFS® Access.
3. Select eDelivery.
If you own your MFS fund shares through a financial institution or a retirement plan, MFS® TALK, MFS® Access, or eDelivery may not be available to you.
CONTACT
WEB SITE
mfs.com
MFS TALK
1-800-637-8255
24 hours a day
ACCOUNT SERVICE AND LITERATURE
Shareholders
1-800-225-2606
Financial advisors
1-800-343-2829
Retirement plan services
1-800-637-1255
MAILING ADDRESS
MFS Service Center, Inc.
P.O. Box 55824
Boston, MA 02205-5824
OVERNIGHT MAIL
MFS Service Center, Inc.
c/o Boston Financial Data Services
30 Dan Road
Canton, MA 02021-2809
ANNUAL REPORT
August 31, 2013

MFS® VALUE FUND

EIF-ANN
MFS® VALUE FUND
CONTENTS
The report is prepared for the general information of shareholders.
It is authorized for distribution to prospective investors only when preceded or accompanied by a current prospectus.
NOT FDIC INSURED Ÿ MAY LOSE VALUE Ÿ NO BANK GUARANTEE

LETTER FROM THE CHAIRMAN AND CEO
Dear Shareholders:
Global economic trends appear to favor growth again despite risks created by the U.S. government’s gridlock. The U.S. economy’s slow but steady expansion is no longer the
exception. The eurozone has emerged from its 18-month-long recession, with Germany leading the way. China’s monthly gauges of economic activity once again point toward expansion. And Japan is picking up momentum in response to its government’s and central bank’s aggressive program of monetary easing.
However, geopolitical risks have risen, with violence erupting in Egypt and Syria and the possibility of further unrest in the Middle East. The U.S. Federal Reserve’s expected tapering of its bond-buying stimulus program has weighed on global markets
since May. Emerging markets, including Brazil and India, have borne much of the brunt, as their currency values have dropped and nervous investors have fled to safety elsewhere. In Europe, unemployment persists at historically high levels. The trend towards a pickup in global growth, while encouraging, appears tenuous, particularly with the risk of a U.S. debt default.
As always, managing risk in the face of uncertainty remains a top priority for investors. At MFS®, our uniquely collaborative investment process employs integrated, global research and active risk management. Our global team of investment professionals shares ideas and evaluates opportunities across continents, investment disciplines and asset classes — all with a goal of building better insights, and ultimately better results, for our clients.
We are mindful of the many economic challenges investors face, and believe it is more important than ever to maintain a long-term view and employ time-tested principles, such as asset allocation and diversification. We remain confident that our unique approach can serve investors well as they work with their financial advisors to identify and pursue the most suitable opportunities.
Respectfully,

Robert J. Manning
Chairman and Chief Executive Officer
MFS Investment Management®
October 17, 2013
The opinions expressed in this letter are subject to change, may not be relied upon for investment advice, and no forecasts can be guaranteed.
1
PORTFOLIO COMPOSITION
Portfolio structure

| | | | |
| Top ten holdings | | | | |
| Philip Morris International, Inc. | | | 3.9% | |
| Johnson & Johnson | | | 3.6% | |
| Lockheed Martin Corp. | | | 3.4% | |
| JPMorgan Chase & Co. | | | 3.4% | |
| Pfizer, Inc. | | | 3.2% | |
| Wells Fargo & Co. | | | 2.7% | |
| Goldman Sachs Group, Inc. | | | 2.0% | |
| United Technologies Corp. | | | 2.0% | |
| Exxon Mobil Corp. | | | 2.0% | |
| MetLife, Inc. | | | 2.0% | |
| | | | |
| Equity sectors | | | | |
| Financial Services | | | 21.2% | |
| Health Care | | | 14.3% | |
| Consumer Staples | | | 13.0% | |
| Industrial Goods & Services | | | 12.5% | |
| Leisure | | | 7.2% | |
| Energy | | | 6.3% | |
| Basic Materials | | | 4.3% | |
| Retailing | | | 4.1% | |
| Utilities & Communications | | | 3.9% | |
| Technology | | | 3.8% | |
| Autos & Housing | | | 2.9% | |
| Special Products & Services | | | 2.8% | |
| Transportation | | | 2.0% | |
Percentages are based on net assets as of 8/31/13.
The portfolio is actively managed and current holdings may be different.
2
MANAGEMENT REVIEW
Summary of Results
For the twelve months ended August 31, 2013, Class A shares of the MFS Value Fund (“fund”) provided a total return of 22.75%, at net asset value. This compares with a return of 23.10% for the fund’s benchmark, the Russell 1000 Value Index.
Market Environment
At the beginning of the period, markets were suffering a bout of risk aversion due to broadly weaker global macroeconomic indicators, as well as renewed concerns over the eurozone’s capacity and determination to address its ongoing crisis. However, a few months into the period, this renewed weakness in the fundamentals precipitated yet a further round of monetary easing by both the US Federal Reserve (through a third round of quantitative easing) and the European Central Bank (ECB) (through a new bond purchase facility), which soon instilled additional confidence in risk markets.
Nonetheless, towards the end of the calendar year, weaker equity earnings reports and declining forward guidance caused market sentiment to soften again. In addition, year-end fiscal cliff negotiations between the Republicans in the US Congress and President Obama were a particular source of market attention, where uncertainty surrounding the fiscal negotiations continued right up to the end-of-year deadline. A last minute political agreement averted the worst-case scenario and markets gravitated towards risk assets again, though the implementation of the US budget sequester, combined with the uncertainty surrounding the Italian election results, inserted a continued degree of caution as we entered the second half of the period.
During the first few months of 2013, market sentiment improved markedly, as global macroeconomic indicators improved and fears of fiscal austerity in the US waned. Late in the period, however, global growth dynamics looked to be weakening again, though markets were generally unfazed, continuing their risk-on path, especially in light of continued easing by global central banks and the Bank of Japan in particular. At the end of the period, the growing risk that the Fed would begin tapering its quantitative easing program caused sovereign bond yields to spike, credit spreads to widen, and equity valuation to fall.
Detractors from Performance
Stock selection in the consumer staples sector dampened returns relative to the Russell 1000 Value Index. An overweight position in shares of tobacco company Philip Morris International held back relative performance as the stock traded lower during the period.
Security selection in the technology sector was another factor that weakened relative results. The fund’s holdings of diversified technology products and services company International Business Machines (IBM) (b) and enterprise software products maker Oracle (b) hindered relative performance as both stocks lagged the benchmark. Shares of IBM declined early in the period after reported revenues came in below expectations and cash flow generation was weaker than normal because of a soft macro-economic environment and currency headwinds. Additionally, management’s commentary that its business fell off during the month of September 2012, particularly in its Global
3
Management Review – continued
Business Services division and its software segment, appeared to have been a concern for investors. Not holding strong-performing computer and personal electronics maker Apple also detracted from relative performance.
Elsewhere, the fund’s underweight position in financial services firm Bank of America (h) early in the period, and not holding its shares later in the period, detracted from relative performance as the stock appreciated over the period. Not holding strong-performing diversified financial services firm Citigroup and global auto maker Ford also detracted from relative returns. Additionally, an overweight position in retail store operator Target, and holdings of payment service provider Western Union (b), held back results. Shares of Target weakened early in the period as investors appeared to have had concerns regarding soft sales figures and growing competition from online competitors.
The fund’s cash and/or cash equivalents position during the period weakened relative performance. Under normal market conditions, the fund strives to be fully invested and generally holds cash to buy new holdings and to provide liquidity. In a period when markets rose, as measured by the fund’s benchmark, holding cash hurt performance versus the benchmark, which has no cash position.
Contributors to Performance
Security selection in the industrial goods & services aided relative results. Within this sector, the fund’s overweight position in defense contractor Lockheed Martin and holdings of building and airplane controls manufacturer Honeywell (b) boosted relative performance as both stocks outpaced the benchmark. Shares of Lockheed Martin appreciated in the latter half of the period as the company reported better-than-expected earnings results driven by solid execution across all of its business segments. Free cash flow generation was also quite strong and the company continued to return a significant portion of that to shareholders via its dividend and share repurchase program.
Underweight allocations to the utilities & communications and energy sectors were additional positive factors for relative performance as both sectors lagged the benchmark over the reporting period. Within the energy sector, an underweight position in integrated oil and gas company Exxon Mobil boosted relative results.
Stock selection in the basic materials sector contributed to relative results led by an overweight position in strong-performing chemical company PPG Industries.
Stocks in other sectors that benefited relative performance included an overweight allocation to strong-performing investment banking firm Goldman Sachs, holdings of media company Viacom (b), an overweight position in asset manager BlackRock, holdings of vehicle component manufacturer Delphi Automotive (b) and credit ratings agency Moody’s (b), and an overweight allocation to custody bank State Street.
Respectfully,
| | |
| Nevin Chitkara | | Steven Gorham |
| Portfolio Manager | | Portfolio Manager |
| (b) | Security is not a benchmark constituent. |
| (h) | Security was not held in the portfolio at period end. |
4
Management Review – continued
The views expressed in this report are those of the portfolio managers only through the end of the period of the report as stated on the cover and do not necessarily reflect the views of MFS or any other person in the MFS organization. These views are subject to change at any time based on market or other conditions, and MFS disclaims any responsibility to update such views. These views may not be relied upon as investment advice or an indication of trading intent on behalf of any MFS portfolio. References to specific securities are not recommendations of such securities, and may not be representative of any MFS portfolio’s current or future investments.
5
PERFORMANCE SUMMARY THROUGH 8/31/13
The following chart illustrates a representative class of the fund’s historical performance in comparison to its benchmark(s). Performance results include the deduction of the maximum applicable sales charge and reflect the percentage change in net asset value, including reinvestment of dividends and capital gains distributions. The performance of other share classes will be greater than or less than that of the class depicted below. Benchmarks are unmanaged and may not be invested in directly. Benchmark returns do not reflect sales charges, commissions or expenses. (See Notes to Performance Summary.)
Performance data shown represents past performance and is no guarantee of future results. Investment return and principal value fluctuate so your shares, when sold, may be worth more or less than the original cost; current performance may be lower or higher than quoted. The performance shown does not reflect the deduction of taxes, if any, that a shareholder would pay on fund distributions or the redemption of fund shares.
Growth of a Hypothetical $10,000 Investment
6
Performance Summary – continued
Total Returns through 8/31/13
Average annual without sales charge
| | | | | | | | | | | | | | |
| | | Share class | | Class inception date | | 1-yr | | 5-yr | | 10-yr | | Life (t) | | |
| | | A | | 1/02/96 | | 22.75% | | 6.59% | | 8.35% | | N/A | | |
| | | B | | 11/04/97 | | 21.82% | | 5.80% | | 7.60% | | N/A | | |
| | | C | | 11/05/97 | | 21.83% | | 5.79% | | 7.59% | | N/A | | |
| | | I | | 1/02/97 | | 23.06% | | 6.86% | | 8.67% | | N/A | | |
| | | R1 | | 4/01/05 | | 21.83% | | 5.80% | | N/A | | 5.66% | | |
| | | R2 | | 10/31/03 | | 22.47% | | 6.33% | | N/A | | 7.73% | | |
| | | R3 | | 4/01/05 | | 22.77% | | 6.60% | | N/A | | 6.45% | | |
| | | R4 | | 4/01/05 | | 23.09% | | 6.86% | | N/A | | 6.73% | | |
| | | R5 | | 5/01/06 | | 23.18% | | 6.83% | | N/A | | 5.76% | | |
| | | 529A | | 7/31/02 | | 22.73% | | 6.50% | | 8.16% | | N/A | | |
| | | 529B | | 7/31/02 | | 21.74% | | 5.71% | | 7.42% | | N/A | | |
| | | 529C | | 7/31/02 | | 21.80% | | 5.72% | | 7.42% | | N/A | | |
| Comparative Benchmark | | | | | | | | | | |
| | | Russell 1000 Value Index (f) | | 23.10% | | 6.69% | | 7.61% | | N/A | | |
| Average annual with sales charge | | | | | | | | | | |
| | | A
With Initial Sales Charge (5.75%) | | 15.69% | | 5.33% | | 7.71% | | N/A | | |
| | | B
With CDSC (Declining over six years
from 4% to 0%) (x) | | 17.82% | | 5.47% | | 7.60% | | N/A | | |
| | | C
With CDSC (1% for 12 months) (x) | | 20.83% | | 5.79% | | 7.59% | | N/A | | |
| | | 529A
With Initial Sales Charge (5.75%) | | 15.68% | | 5.25% | | 7.52% | | N/A | | |
| | | 529B
With CDSC (Declining over six years
from 4% to 0%) (x) | | 17.74% | | 5.39% | | 7.42% | | N/A | | |
| | | 529C
With CDSC (1% for 12 months) (x) | | 20.80% | | 5.72% | | 7.42% | | N/A | | |
Class I, R1, R2, R3, R4, and R5 shares do not have a sales charge.
CDSC – Contingent Deferred Sales Charge.
As further discussed in Note 5 in the Notes to Financial Statements, on May 10, 2012, sales of Class W shares (including exchanges) were suspended. On May 11, 2012, certain Class W shares were automatically converted to Class I shares. Shareholders of certain Class W shares became shareholders of Class I and received Class I shares with a total net asset value equal to their Class W shares at the time of the conversion. On May 30, 2012, remaining Class W shares, which represented MFS seed money, were redesignated Class R5. Class R5 shares are generally available
7
Performance Summary – continued
only to certain eligible retirement plans and to funds distributed by MFD. Class R5 shares do not pay a 12b-1 distribution fee or sub-accounting costs. On June 1, 2012, Class R5 shares were offered for sale to the public. For further information about the fund’s fee arrangements, please see Note 3 in the Notes to Financial Statements.
| (f) | Source: FactSet Research Systems Inc. |
| (t) | For the period from the class inception date through the stated period end (for those share classes with less than 10 years of performance history). No comparative benchmark performance information is provided for “life” periods. (See Notes to Performance Summary.) |
| (x) | Assuming redemption at the end of the applicable period. |
Benchmark Definition
Russell 1000 Value Index – constructed to provide a comprehensive barometer for the value securities in the large-cap segment of the U.S. equity universe. Companies in this index generally have lower price-to-book ratios and lower forecasted growth values.
It is not possible to invest directly in an index.
Notes to Performance Summary
Average annual total return represents the average annual change in value for each share class for the periods presented. Life returns are presented where the share class has less than 10 years of performance history and represent the average annual total return from the class inception date to the stated period end date. As the funds share classes may have different inception dates, the life returns may represent different time periods and may not be comparable. As a result, no comparative benchmark performance information is provided for life periods.
Performance results reflect any applicable expense subsidies and waivers in effect during the periods shown. Without such subsidies and waivers the fund’s performance results would be less favorable. Please see the prospectus and financial statements for complete details.
Performance results do not include adjustments made for financial reporting purposes in accordance with U.S. generally accepted accounting principles and may differ from amounts reported in the financial highlights.
From time to time the fund may receive proceeds from litigation settlements, without which performance would be lower.
8
EXPENSE TABLE
Fund expenses borne by the shareholders during the period,
March 1, 2013 through August 31, 2013
As a shareholder of the fund, you incur two types of costs: (1) transaction costs, including sales charges (loads) on certain purchase or redemption payments, and (2) ongoing costs, including management fees; distribution and service (12b-1) fees; and other fund expenses. This example is intended to help you understand your ongoing costs (in dollars) of investing in the fund and to compare these costs with the ongoing costs of investing in other mutual funds.
The example is based on an investment of $1,000 invested at the beginning of the period and held for the entire period March 1, 2013 through August 31, 2013.
Actual Expenses
The first line for each share class in the following table provides information about actual account values and actual expenses. You may use the information in this line, together with the amount you invested, to estimate the expenses that you paid over the period. Simply divide your account value by $1,000 (for example, an $8,600 account value divided by $1,000 = 8.6), then multiply the result by the number in the first line under the heading entitled “Expenses Paid During Period” to estimate the expenses you paid on your account during this period.
Hypothetical Example for Comparison Purposes
The second line for each share class in the following table provides information about hypothetical account values and hypothetical expenses based on the fund’s actual expense ratio and an assumed rate of return of 5% per year before expenses, which is not the fund’s actual return. The hypothetical account values and expenses may not be used to estimate the actual ending account balance or expenses you paid for the period. You may use this information to compare the ongoing costs of investing in the fund and other funds. To do so, compare this 5% hypothetical example with the 5% hypothetical examples that appear in the shareholder reports of the other funds.
Please note that the expenses shown in the table are meant to highlight your ongoing costs only and do not reflect any transactional costs, such as sales charges (loads). Therefore, the second line for each share class in the table is useful in comparing ongoing costs only, and will not help you determine the relative total costs of owning different funds. In addition, if these transactional costs were included, your costs would have been higher.
9
Expense Table – continued
| | | | | | | | | | | | | | | | | | |
Share
Class | | | | Annualized
Expense
Ratio | | | Beginning
Account Value
3/01/13 | | | Ending
Account Value
8/31/13 | | | Expenses
Paid During
Period (p)
3/01/13-8/31/13 | |
| A | | Actual | | | 0.92% | | | | $1,000.00 | | | | $1,100.18 | | | | $4.87 | |
| | Hypothetical (h) | | | 0.92% | | | | $1,000.00 | | | | $1,020.57 | | | | $4.69 | |
| B | | Actual | | | 1.67% | | | | $1,000.00 | | | | $1,095.56 | | | | $8.82 | |
| | Hypothetical (h) | | | 1.67% | | | | $1,000.00 | | | | $1,016.79 | | | | $8.49 | |
| C | | Actual | | | 1.67% | | | | $1,000.00 | | | | $1,095.46 | | | | $8.82 | |
| | Hypothetical (h) | | | 1.67% | | | | $1,000.00 | | | | $1,016.79 | | | | $8.49 | |
| I | | Actual | | | 0.67% | | | | $1,000.00 | | | | $1,101.32 | | | | $3.55 | |
| | Hypothetical (h) | | | 0.67% | | | | $1,000.00 | | | | $1,021.83 | | | | $3.41 | |
| R1 | | Actual | | | 1.67% | | | | $1,000.00 | | | | $1,096.04 | | | | $8.82 | |
| | Hypothetical (h) | | | 1.67% | | | | $1,000.00 | | | | $1,016.79 | | | | $8.49 | |
| R2 | | Actual | | | 1.17% | | | | $1,000.00 | | | | $1,098.59 | | | | $6.19 | |
| | Hypothetical (h) | | | 1.17% | | | | $1,000.00 | | | | $1,019.31 | | | | $5.96 | |
| R3 | | Actual | | | 0.92% | | | | $1,000.00 | | | | $1,100.09 | | | | $4.87 | |
| | Hypothetical (h) | | | 0.92% | | | | $1,000.00 | | | | $1,020.57 | | | | $4.69 | |
| R4 | | Actual | | | 0.67% | | | | $1,000.00 | | | | $1,101.42 | | | | $3.55 | |
| | Hypothetical (h) | | | 0.67% | | | | $1,000.00 | | | | $1,021.83 | | | | $3.41 | |
| R5 | | Actual | | | 0.56% | | | | $1,000.00 | | | | $1,101.58 | | | | $2.97 | |
| | Hypothetical (h) | | | 0.56% | | | | $1,000.00 | | | | $1,022.38 | | | | $2.85 | |
| 529A | | Actual | | | 0.90% | | | | $1,000.00 | | | | $1,099.57 | | | | $4.76 | |
| | Hypothetical (h) | | | 0.90% | | | | $1,000.00 | | | | $1,020.67 | | | | $4.58 | |
| 529B | | Actual | | | 1.72% | | | | $1,000.00 | | | | $1,095.49 | | | | $9.08 | |
| | Hypothetical (h) | | | 1.72% | | | | $1,000.00 | | | | $1,016.53 | | | | $8.74 | |
| 529C | | Actual | | | 1.72% | | | | $1,000.00 | | | | $1,095.46 | | | | $9.08 | |
| | Hypothetical (h) | | | 1.72% | | | | $1,000.00 | | | | $1,016.53 | | | | $8.74 | |
| (h) | 5% class return per year before expenses. |
| (p) | Expenses paid are equal to each class’s annualized expense ratio, as shown above, multiplied by the average account value over the period, multiplied by the number of days in the period, divided by the number of days in the year. Expenses paid do not include any applicable sales charges (loads). If these transaction costs had been included, your costs would have been higher. |
Notes to Expense Table
Each class with a Rule 12b-1 service fee is subject to a rebate of a portion of such fee. Such rebates are included in the expense ratios above. For Class 529A shares, this rebate reduced the expense ratio above by 0.07%. See Note 3 in the Notes to Financial Statements for additional information.
10
PORTFOLIO OF INVESTMENTS
8/31/13
The Portfolio of Investments is a complete list of all securities owned by your fund. It is categorized by broad-based asset classes.
| | | | | | | | |
| Common Stocks - 98.2% | | | | | | | | |
| Issuer | | Shares/Par | | | Value ($) | |
| Aerospace - 8.4% | | | | | | | | |
| Honeywell International, Inc. | | | 6,296,600 | | | $ | 501,020,460 | |
| Lockheed Martin Corp. | | | 7,619,429 | | | | 932,770,498 | |
| Northrop Grumman Corp. | | | 3,087,848 | | | | 284,915,735 | |
| United Technologies Corp. | | | 5,426,925 | | | | 543,235,193 | |
| | | | | | | | |
| | | | | | | $ | 2,261,941,886 | |
| Alcoholic Beverages - 1.7% | | | | | | | | |
| Diageo PLC | | | 14,650,042 | | | $ | 448,160,706 | |
| | |
| Automotive - 1.9% | | | | | | | | |
| Delphi Automotive PLC | | | 3,574,813 | | | $ | 196,686,211 | |
| General Motors Co. (a) | | | 1,748,872 | | | | 59,601,558 | |
| Johnson Controls, Inc. | | | 6,642,662 | | | | 269,227,091 | |
| | | | | | | | |
| | | | | | | $ | 525,514,860 | |
| Broadcasting - 4.1% | | | | | | | | |
| Omnicom Group, Inc. | | | 5,078,169 | | | $ | 307,990,950 | |
| Viacom, Inc., “B” | | | 4,747,958 | | | | 377,747,538 | |
| Walt Disney Co. | | | 6,713,997 | | | | 408,412,438 | |
| | | | | | | | |
| | | | | | | $ | 1,094,150,926 | |
| Brokerage & Asset Managers - 1.9% | | | | | | | | |
| BlackRock, Inc. | | | 917,585 | | | $ | 238,865,727 | |
| Franklin Resources, Inc. | | | 4,980,999 | | | | 229,922,914 | |
| NASDAQ OMX Group, Inc. | | | 1,765,159 | | | | 52,707,648 | |
| | | | | | | | |
| | | | | | | $ | 521,496,289 | |
| Business Services - 2.8% | | | | | | | | |
| Accenture PLC, “A” | | | 6,798,125 | | | $ | 491,164,531 | |
| Dun & Bradstreet Corp. | | | 536,204 | | | | 53,341,574 | |
| Fidelity National Information Services, Inc. | | | 1,631,480 | | | | 72,535,601 | |
| Fiserv, Inc. (a) | | | 1,462,442 | | | | 140,789,291 | |
| | | | | | | | |
| | | | | | | $ | 757,830,997 | |
| Cable TV - 0.9% | | | | | | | | |
| Comcast Corp., “Special A” | | | 6,245,448 | | | $ | 254,439,552 | |
11
Portfolio of Investments – continued
| | | | | | | | |
| Issuer | | Shares/Par | | | Value ($) | |
| Common Stocks - continued | | | | | | | | |
| Chemicals - 3.5% | | | | | | | | |
| 3M Co. | | | 4,553,294 | | | $ | 517,163,133 | |
| PPG Industries, Inc. | | | 2,754,833 | | | | 430,332,463 | |
| | | | | | | | |
| | | | | | | $ | 947,495,596 | |
| Computer Software - 1.2% | | | | | | | | |
| Oracle Corp. | | | 9,814,257 | | | $ | 312,682,228 | |
| | |
| Computer Software - Systems - 2.1% | | | | | | | | |
| Hewlett-Packard Co. | | | 2,163,775 | | | $ | 48,338,734 | |
| International Business Machines Corp. | | | 2,771,572 | | | | 505,174,428 | |
| | | | | | | | |
| | | | | | | $ | 553,513,162 | |
| Construction - 1.0% | | | | | | | | |
| Stanley Black & Decker, Inc. | | | 3,164,429 | | | $ | 269,799,217 | |
| | |
| Consumer Products - 0.6% | | | | | | | | |
| Procter & Gamble Co. | | | 2,007,720 | | | $ | 156,381,311 | |
| | |
| Electrical Equipment - 2.6% | | | | | | | | |
| Danaher Corp. | | | 5,011,685 | | | $ | 328,365,601 | |
| Pentair Ltd. | | | 1,851,180 | | | | 111,274,430 | |
| Tyco International Ltd. | | | 8,242,025 | | | | 272,316,506 | |
| | | | | | | | |
| | | | | | | $ | 711,956,537 | |
| Electronics - 0.6% | | | | | | | | |
| Intel Corp. | | | 7,043,300 | | | $ | 154,811,734 | |
| | |
| Energy - Independent - 2.5% | | | | | | | | |
| Apache Corp. | | | 1,582,644 | | | $ | 135,600,938 | |
| EOG Resources, Inc. | | | 960,614 | | | | 150,864,429 | |
| Occidental Petroleum Corp. | | | 4,432,565 | | | | 390,996,559 | |
| | | | | | | | |
| | | | | | | $ | 677,461,926 | |
| Energy - Integrated - 3.7% | | | | | | | | |
| Chevron Corp. | | | 3,979,088 | | | $ | 479,201,568 | |
| Exxon Mobil Corp. | | | 6,107,922 | | | | 532,366,482 | |
| | | | | | | | |
| | | | | | | $ | 1,011,568,050 | |
| Engineering - Construction - 0.1% | | | | | | | | |
| Fluor Corp. | | | 597,249 | | | $ | 37,883,504 | |
| | |
| Food & Beverages - 5.4% | | | | | | | | |
| Coca-Cola Enterprises, Inc. | | | 2,504,860 | | | $ | 93,681,764 | |
| Dr Pepper Snapple Group, Inc. | | | 2,429,010 | | | | 108,722,488 | |
12
Portfolio of Investments – continued
| | | | | | | | |
| Issuer | | Shares/Par | | | Value ($) | |
| Common Stocks - continued | | | | | | | | |
| Food & Beverages - continued | | | | | | | | |
| General Mills, Inc. | | | 8,476,462 | | | $ | 418,059,106 | |
| Groupe Danone | | | 3,444,566 | | | | 256,488,440 | |
| J.M. Smucker Co. | | | 719,349 | | | | 76,351,703 | |
| Kellogg Co. | | | 1,389,954 | | | | 84,384,107 | |
| Nestle S.A. | | | 6,443,751 | | | | 422,796,495 | |
| | | | | | | | |
| | | | | | | $ | 1,460,484,103 | |
| Food & Drug Stores - 1.6% | | | | | | | | |
| CVS Caremark Corp. | | | 7,640,919 | | | $ | 443,555,348 | |
| | |
| General Merchandise - 1.7% | | | | | | | | |
| Kohl’s Corp. | | | 1,330,132 | | | $ | 68,249,073 | |
| Target Corp. | | | 6,161,518 | | | | 390,085,705 | |
| | | | | | | | |
| | | | | | | $ | 458,334,778 | |
| Insurance - 7.3% | | | | | | | | |
| ACE Ltd. | | | 3,283,979 | | | $ | 288,070,638 | |
| Aon PLC | | | 3,836,806 | | | | 254,687,182 | |
| Chubb Corp. | | | 2,118,159 | | | | 176,167,284 | |
| MetLife, Inc. | | | 11,466,681 | | | | 529,645,995 | |
| Prudential Financial, Inc. | | | 4,550,921 | | | | 340,772,964 | |
| Travelers Cos., Inc. | | | 4,758,478 | | | | 380,202,392 | |
| | | | | | | | |
| | | | | | | $ | 1,969,546,455 | |
| Leisure & Toys - 0.6% | | | | | | | | |
| Hasbro, Inc. | | | 3,352,658 | | | $ | 152,814,152 | |
| | |
| Machinery & Tools - 1.3% | | | | | | | | |
| Eaton Corp. PLC | | | 3,680,110 | | | $ | 233,024,565 | |
| Illinois Tool Works, Inc. | | | 1,608,907 | | | | 114,988,583 | |
| | | | | | | | |
| | | | | | | $ | 348,013,148 | |
| Major Banks - 11.2% | | | | | | | | |
| Bank of New York Mellon Corp. | | | 13,005,227 | | | $ | 386,775,451 | |
| Goldman Sachs Group, Inc. | | | 3,585,987 | | | | 545,536,202 | |
| JPMorgan Chase & Co. | | | 18,210,170 | | | | 920,159,890 | |
| PNC Financial Services Group, Inc. | | | 2,683,125 | | | | 193,909,444 | |
| State Street Corp. | | | 4,075,070 | | | | 271,888,670 | |
| Wells Fargo & Co. | | | 17,542,179 | | | | 720,632,713 | |
| | | | | | | | |
| | | | | | | $ | 3,038,902,370 | |
| Medical & Health Technology & Services - 1.2% | | | | | | | | |
| Express Scripts Holding Co. (a) | | | 3,222,630 | | | $ | 205,861,604 | |
| Quest Diagnostics, Inc. | | | 1,996,586 | | | | 117,039,871 | |
| | | | | | | | |
| | | | | | | $ | 322,901,475 | |
13
Portfolio of Investments – continued
| | | | | | | | |
| Issuer | | Shares/Par | | | Value ($) | |
| Common Stocks - continued | | | | | | | | |
| Medical Equipment - 4.5% | | | | | | | | |
| Abbott Laboratories | | | 6,671,013 | | | $ | 222,344,863 | |
| Covidien PLC | | | 1,957,080 | | | | 116,250,552 | |
| Medtronic, Inc. | | | 6,002,290 | | | | 310,618,508 | |
| St. Jude Medical, Inc. | | | 4,767,908 | | | | 240,350,242 | |
| Thermo Fisher Scientific, Inc. | | | 3,701,623 | | | | 328,815,171 | |
| | | | | | | | |
| | | | | | | $ | 1,218,379,336 | |
| Other Banks & Diversified Financials - 0.8% | | | | | | | | |
| MasterCard, Inc., “A” | | | 177,274 | | | $ | 107,442,226 | |
| Western Union Co. | | | 6,168,448 | | | | 108,132,893 | |
| | | | | | | | |
| | | | | | | $ | 215,575,119 | |
| Pharmaceuticals - 8.6% | | | | | | | | |
| AbbVie, Inc. | | | 2,256,893 | | | $ | 96,166,211 | |
| Johnson & Johnson | | | 11,200,635 | | | | 967,846,870 | |
| Merck & Co., Inc. | | | 5,002,079 | | | | 236,548,316 | |
| Pfizer, Inc. | | | 30,529,955 | | | | 861,250,031 | |
| Roche Holding AG | | | 652,803 | | | | 162,841,180 | |
| Zoetis, Inc. | | | 271,890 | | | | 7,925,594 | |
| | | | | | | | |
| | | | | | | $ | 2,332,578,202 | |
| Printing & Publishing - 1.0% | | | | | | | | |
| McGraw-Hill Cos., Inc. | | | 2,118,090 | | | $ | 123,632,913 | |
| Moody’s Corp. | | | 2,416,589 | | | | 153,598,397 | |
| | | | | | | | |
| | | | | | | $ | 277,231,310 | |
| Railroad & Shipping - 0.4% | | | | | | | | |
| Canadian National Railway Co. | | | 1,199,191 | | | $ | 112,400,172 | |
| | |
| Restaurants - 0.7% | | | | | | | | |
| McDonald’s Corp. | | | 1,880,683 | | | $ | 177,461,248 | |
| | |
| Specialty Chemicals - 0.8% | | | | | | | | |
| Air Products & Chemicals, Inc. | | | 1,944,430 | | | $ | 198,604,080 | |
| Valspar Corp. | | | 396,300 | | | | 24,634,008 | |
| | | | | | | | |
| | | | | | | $ | 223,238,088 | |
| Specialty Stores - 0.7% | | | | | | | | |
| Advance Auto Parts, Inc. | | | 1,808,270 | | | $ | 144,788,179 | |
| Staples, Inc. | | | 3,921,391 | | | | 54,546,549 | |
| | | | | | | | |
| | | | | | | $ | 199,334,728 | |
| Telecommunications - Wireless - 1.3% | | | | | | | | |
| Vodafone Group PLC | | | 113,246,899 | | | $ | 361,966,212 | |
14
Portfolio of Investments – continued
| | | | | | | | |
| Issuer | | Shares/Par | | | Value ($) | |
| Common Stocks - continued | | | | | | | | |
| Telephone Services - 2.1% | | | | | | | | |
| AT&T, Inc. | | | 11,994,778 | | | $ | 405,783,340 | |
| Verizon Communications, Inc. | | | 3,591,320 | | | | 170,156,742 | |
| | | | | | | | |
| | | | | | | $ | 575,940,082 | |
| Tobacco - 5.4% | | | | | | | | |
| Altria Group, Inc. | | | 3,523,265 | | | $ | 119,368,218 | |
| Lorillard, Inc. | | | 6,892,723 | | | | 291,562,183 | |
| Philip Morris International, Inc. | | | 12,511,562 | | | | 1,043,964,733 | |
| | | | | | | | |
| | | | | | | $ | 1,454,895,134 | |
| Trucking - 1.6% | | | | | | | | |
| United Parcel Service, Inc., “B” | | | 4,899,089 | | | $ | 419,264,037 | |
| | |
| Utilities - Electric Power - 0.4% | | | | | | | | |
| PPL Corp. | | | 2,215,214 | | | $ | 68,007,070 | |
| Public Service Enterprise Group, Inc. | | | 1,402,675 | | | | 45,474,724 | |
| | | | | | | | |
| | | | | | | $ | 113,481,794 | |
| Total Common Stocks (Identified Cost, $19,287,607,777) | | | $ | 26,573,385,772 | |
| | |
| Convertible Preferred Stocks - 0.1% | | | | | | | | |
| Aerospace - 0.1% | | | | | | | | |
| United Technologies Corp., 7.5% (Identified Cost, $18,338,355) | | | 364,100 | | | $ | 22,614,251 | |
| | |
| Money Market Funds - 1.4% | | | | | | | | |
MFS Institutional Money Market Portfolio, 0.09%,
at Cost and Net Asset Value (v) | | | 382,071,026 | | | $ | 382,071,026 | |
| Total Investments (Identified Cost, $19,688,017,158) | | | | | | $ | 26,978,071,049 | |
| | |
| Other Assets, Less Liabilities - 0.3% | | | | | | | 84,109,859 | |
| Net Assets - 100.0% | | | | | | $ | 27,062,180,908 | |
| (a) | Non-income producing security. |
| (v) | Underlying affiliated fund that is available only to investment companies managed by MFS. The rate quoted for the MFS Institutional Money Market Portfolio is the annualized seven-day yield of the fund at period end. |
The following abbreviations are used in this report and are defined:
| PLC | | Public Limited Company |
See Notes to Financial Statements
15
Financial Statements
STATEMENT OF ASSETS AND LIABILITIES
At 8/31/13
This statement represents your fund’s balance sheet, which details the assets and liabilities comprising the total value of the fund.
| | | | |
| Assets | | | | |
Investments- | | | | |
Non-affiliated issuers, at value (identified cost, $19,305,946,132) | | | $26,596,000,023 | |
Underlying affiliated funds, at cost and value | | | 382,071,026 | |
Total investments, at value (identified cost, $19,688,017,158) | | | $26,978,071,049 | |
Receivables for | | | | |
Fund shares sold | | | 59,178,477 | |
Dividends | | | 86,465,858 | |
Other assets | | | 33,354 | |
Total assets | | | $27,123,748,738 | |
| Liabilities | | | | |
Payable for fund shares reacquired | | | $42,163,474 | |
Payable to affiliates | | | | |
Investment adviser | | | 1,142,946 | |
Shareholder servicing costs | | | 16,960,703 | |
Distribution and service fees | | | 309,269 | |
Program manager fees | | | 63 | |
Payable for independent Trustees’ compensation | | | 4,241 | |
Accrued expenses and other liabilities | | | 987,134 | |
Total liabilities | | | $61,567,830 | |
Net assets | | | $27,062,180,908 | |
| Net assets consist of | | | | |
Paid-in capital | | | $19,705,670,918 | |
Unrealized appreciation (depreciation) on investments and translation of assets and liabilities in foreign currencies | | | 7,290,005,333 | |
Accumulated distributions in excess of net realized gain on investments and foreign currency | | | (25,249,661 | ) |
Undistributed net investment income | | | 91,754,318 | |
Net assets | | | $27,062,180,908 | |
Shares of beneficial interest outstanding | | | 906,793,188 | |
16
Statement of Assets and Liabilities – continued
| | | | | | | | | | | | |
| | | Net assets | | | Shares outstanding | | | Net asset value per share (a) | |
Class A | | | $8,058,858,000 | | | | 270,372,696 | | | | $29.81 | |
Class B | | | 169,208,132 | | | | 5,708,235 | | | | 29.64 | |
Class C | | | 1,090,690,452 | | | | 36,968,796 | | | | 29.50 | |
Class I | | | 10,568,572,757 | | | | 352,808,774 | | | | 29.96 | |
Class R1 | | | 33,484,860 | | | | 1,142,199 | | | | 29.32 | |
Class R2 | | | 572,589,785 | | | | 19,372,933 | | | | 29.56 | |
Class R3 | | | 1,299,125,969 | | | | 43,704,055 | | | | 29.73 | |
Class R4 | | | 2,892,340,041 | | | | 96,998,054 | | | | 29.82 | |
Class R5 | | | 2,362,011,513 | | | | 79,199,070 | | | | 29.82 | |
Class 529A | | | 10,899,170 | | | | 367,907 | | | | 29.62 | |
Class 529B | | | 1,013,329 | | | | 34,592 | | | | 29.29 | |
Class 529C | | | 3,386,900 | | | | 115,877 | | | | 29.23 | |
| (a) | Maximum offering price per share was equal to the net asset value per share for all share classes, except for Classes A and 529A, for which the maximum offering prices per share were $31.63 [100 / 94.25 x $29.81] and $31.43 [100 / 94.25 x $29.62], respectively. On sales of $50,000 or more, the maximum offering prices of Class A and Class 529A shares are reduced. A contingent deferred sales charge may be imposed on redemptions of Class A, Class B, Class C, Class 529B, and Class 529C shares. Redemption price per share was equal to the net asset value per share for Classes I, R1, R2, R3, R4, R5, and 529A. |
See Notes to Financial Statements
17
Financial Statements
STATEMENT OF OPERATIONS
Year ended 8/31/13
This statement describes how much your fund earned in investment income and accrued in expenses. It also describes any gains and/or losses generated by fund operations.
| | | | |
| Net investment income | | | | |
Income | | | | |
Dividends | | | $650,651,891 | |
Interest | | | 2,374,549 | |
Dividends from underlying affiliated funds | | | 432,159 | |
Foreign taxes withheld | | | (3,798,570 | ) |
Total investment income | | | $649,660,029 | |
Expenses | | | | |
Management fee | | | $127,901,829 | |
Distribution and service fees | | | 35,832,226 | |
Program manager fees | | | 13,745 | |
Shareholder servicing costs | | | 28,962,962 | |
Administrative services fee | | | 518,978 | |
Independent Trustees’ compensation | | | 196,468 | |
Custodian fee | | | 593,270 | |
Shareholder communications | | | 1,413,647 | |
Audit and tax fees | | | 62,123 | |
Legal fees | | | 231,271 | |
Miscellaneous | | | 1,348,964 | |
Total expenses | | | $197,075,483 | |
Fees paid indirectly | | | (538 | ) |
Reduction of expenses by investment adviser and distributor | | | (3,428,847 | ) |
Net expenses | | | $193,646,098 | |
Net investment income | | | $456,013,931 | |
| Realized and unrealized gain (loss) on investments and foreign currency | |
Realized gain (loss) (identified cost basis) | | | | |
Investments | | | $174,602,556 | |
Foreign currency | | | (472,389 | ) |
Net realized gain (loss) on investments and foreign currency | | | $174,130,167 | |
Change in unrealized appreciation (depreciation) | | | | |
Investments | | | $4,167,730,396 | |
Translation of assets and liabilities in foreign currencies | | | 55,649 | |
Net unrealized gain (loss) on investments and foreign currency translation | | | $4,167,786,045 | |
Net realized and unrealized gain (loss) on investments and foreign currency | | | $4,341,916,212 | |
Change in net assets from operations | | | $4,797,930,143 | |
See Notes to Financial Statements
18
Financial Statements
STATEMENTS OF CHANGES IN NET ASSETS
These statements describe the increases and/or decreases in net assets resulting from operations, any distributions, and any shareholder transactions.
| | | | | | | | |
| | | Years ended 8/31 | |
| | | 2013 | | | 2012 | |
| Change in net assets | | | | | | |
| From operations | | | | | | | | |
Net investment income | | | $456,013,931 | | | | $346,024,592 | |
Net realized gain (loss) on investments and foreign currency | | | 174,130,167 | | | | 643,305,033 | |
Net unrealized gain (loss) on investments and foreign currency translation | | | 4,167,786,045 | | | | 1,685,564,127 | |
Change in net assets from operations | | | $4,797,930,143 | | | | $2,674,893,752 | |
| Distributions declared to shareholders | | | | | | | | |
From net investment income | | | $(430,454,430 | ) | | | $(327,177,582 | ) |
From net realized gain on investments | | | (157,367,309 | ) | | | — | |
Total distributions declared to shareholders | | | $(587,821,739 | ) | | | $(327,177,582 | ) |
Change in net assets from fund share transactions | | | $2,245,166,320 | | | | $2,172,787,694 | |
Total change in net assets | | | $6,455,274,724 | | | | $4,520,503,864 | |
| Net assets | | | | | | | | |
At beginning of period | | | 20,606,906,184 | | | | 16,086,402,320 | |
At end of period (including undistributed net investment income of $91,754,318 and $66,667,206, respectively) | | | $27,062,180,908 | | | | $20,606,906,184 | |
See Notes to Financial Statements
19
Financial Statements
FINANCIAL HIGHLIGHTS
The financial highlights table is intended to help you understand the fund’s financial performance for the past 5 years. Certain information reflects financial results for a single fund share. The total returns in the table represent the rate by which an investor would have earned (or lost) on an investment in the fund share class (assuming reinvestment of all distributions) held for the entire period.
| | | | | | | | | | | | | | | | | | | | |
| Class A | | Years ended 8/31 | |
| | | 2013 | | | 2012 | | | 2011 | | | 2010 | | | 2009 | |
Net asset value, beginning of period | | | $24.90 | | | | $21.83 | | | | $19.46 | | | | $19.39 | | | | $23.75 | |
| Income (loss) from investment operations | | | | | | | | | | | | | | | | | |
Net investment income (d) | | | $0.50 | | | | $0.43 | | | | $0.34 | | | | $0.32 | | | | $0.34 | |
Net realized and unrealized gain (loss)
on investments and foreign currency | | | 5.08 | | | | 3.05 | | | | 2.35 | | | | 0.06 | (g) | | | (4.35 | ) |
Total from investment operations | | | $5.58 | | | | $3.48 | | | | $2.69 | | | | $0.38 | | | | $(4.01 | ) |
| Less distributions declared to shareholders | | | | | | | | | | | | | | | | | |
From net investment income | | | $(0.48 | ) | | | $(0.41 | ) | | | $(0.32 | ) | | | $(0.31 | ) | | | $(0.35 | ) |
From net realized gain on investments | | | (0.19 | ) | | | — | | | | — | | | | — | | | | — | |
Total distributions declared to
shareholders | | | $(0.67 | ) | | | $(0.41 | ) | | | $(0.32 | ) | | | $(0.31 | ) | | | $(0.35 | ) |
Net asset value, end of period (x) | | | $29.81 | | | | $24.90 | | | | $21.83 | | | | $19.46 | | | | $19.39 | |
Total return (%) (r)(s)(t)(x) | | | 22.75 | | | | 16.16 | | | | 13.78 | | | | 1.88 | | | | (16.75 | ) |
Ratios (%) (to average net assets)
and Supplemental data: | | | | | | | | | | | | | | | | | | | | |
Expenses before expense reductions (f) | | | 0.93 | | | | 0.95 | | | | 0.95 | | | | 0.98 | | | | 1.09 | |
Expenses after expense reductions (f) | | | 0.92 | | | | 0.93 | | | | 0.94 | | | | 0.98 | | | | 1.09 | |
Net investment income | | | 1.80 | | | | 1.86 | | | | 1.49 | | | | 1.54 | | | | 1.94 | |
Portfolio turnover | | | 12 | | | | 14 | | | | 17 | | | | 22 | | | | 33 | |
Net assets at end of period
(000 omitted) | | | $8,058,858 | | | | $6,628,244 | | | | $5,086,069 | | | | $4,980,816 | | | | $4,665,411 | |
See Notes to Financial Statements
20
Financial Highlights – continued
| | | | | | | | | | | | | | | | | | | | |
| Class B | | Years ended 8/31 | |
| | | 2013 | | | 2012 | | | 2011 | | | 2010 | | | 2009 | |
Net asset value, beginning of period | | | $24.76 | | | | $21.70 | | | | $19.34 | | | | $19.26 | | | | $23.59 | |
| Income (loss) from investment operations | | | | | | | | | | | | | | | | | |
Net investment income (d) | | | $0.29 | | | | $0.26 | | | | $0.16 | | | | $0.16 | | | | $0.22 | |
Net realized and unrealized gain (loss)
on investments and foreign currency | | | 5.05 | | | | 3.03 | | | | 2.34 | | | | 0.07 | (g) | | | (4.34 | ) |
Total from investment operations | | | $5.34 | | | | $3.29 | | | | $2.50 | | | | $0.23 | | | | $(4.12 | ) |
| Less distributions declared to shareholders | | | | | | | | | | | | | | | | | |
From net investment income | | | $(0.27 | ) | | | $(0.23 | ) | | | $(0.14 | ) | | | $(0.15 | ) | | | $(0.21 | ) |
From net realized gain on investments | | | (0.19 | ) | | | — | | | | — | | | | — | | | | — | |
Total distributions declared to
shareholders | | | $(0.46 | ) | | | $(0.23 | ) | | | $(0.14 | ) | | | $(0.15 | ) | | | $(0.21 | ) |
Net asset value, end of period (x) | | | $29.64 | | | | $24.76 | | | | $21.70 | | | | $19.34 | | | | $19.26 | |
Total return (%) (r)(s)(t)(x) | | | 21.82 | | | | 15.28 | | | | 12.92 | | | | 1.14 | | | | (17.36 | ) |
Ratios (%) (to average net assets)
and Supplemental data: | | | | | | | | | | | | | | | | | | | | |
Expenses before expense reductions (f) | | | 1.68 | | | | 1.70 | | | | 1.70 | | | | 1.73 | | | | 1.79 | |
Expenses after expense reductions (f) | | | 1.67 | | | | 1.68 | | | | 1.69 | | | | 1.73 | | | | 1.79 | |
Net investment income | | | 1.05 | | | | 1.11 | | | | 0.73 | | | | 0.80 | | | | 1.26 | |
Portfolio turnover | | | 12 | | | | 14 | | | | 17 | | | | 22 | | | | 33 | |
Net assets at end of period
(000 omitted) | | | $169,208 | | | | $167,949 | | | | $182,654 | | | | $238,473 | | | | $371,270 | |
See Notes to Financial Statements
21
Financial Highlights – continued
| | | | | | | | | | | | | | | | | | | | |
| Class C | | Years ended 8/31 | |
| | | 2013 | | | 2012 | | | 2011 | | | 2010 | | | 2009 | |
Net asset value, beginning of period | | | $24.65 | | | | $21.62 | | | | $19.27 | | | | $19.21 | | | | $23.54 | |
| Income (loss) from investment operations | | | | | | | | | | | | | | | | | |
Net investment income (d) | | | $0.29 | | | | $0.25 | | | | $0.17 | | | | $0.16 | | | | $0.22 | |
Net realized and unrealized gain (loss)
on investments and foreign currency | | | 5.03 | | | | 3.02 | | | | 2.33 | | | | 0.06 | (g) | | | (4.33 | ) |
Total from investment operations | | | $5.32 | | | | $3.27 | | | | $2.50 | | | | $0.22 | | | | $(4.11 | ) |
| Less distributions declared to shareholders | | | | | | | | | | | | | | | | | |
From net investment income | | | $(0.28 | ) | | | $(0.24 | ) | | | $(0.15 | ) | | | $(0.16 | ) | | | $(0.22 | ) |
From net realized gain on investments | | | (0.19 | ) | | | — | | | | — | | | | — | | | | — | |
Total distributions declared to
shareholders | | | $(0.47 | ) | | | $(0.24 | ) | | | $(0.15 | ) | | | $(0.16 | ) | | | $(0.22 | ) |
Net asset value, end of period (x) | | | $29.50 | | | | $24.65 | | | | $21.62 | | | | $19.27 | | | | $19.21 | |
Total return (%) (r)(s)(t)(x) | | | 21.83 | | | | 15.23 | | | | 12.97 | | | | 1.11 | | | | (17.35 | ) |
Ratios (%) (to average net assets)
and Supplemental data: | | | | | | | | | | | | | | | | | | | | |
Expenses before expense reductions (f) | | | 1.68 | | | | 1.69 | | | | 1.70 | | | | 1.73 | | | | 1.79 | |
Expenses after expense reductions (f) | | | 1.67 | | | | 1.68 | | | | 1.69 | | | | 1.73 | | | | 1.79 | |
Net investment income | | | 1.05 | | | | 1.11 | | | | 0.74 | | | | 0.79 | | | | 1.24 | |
Portfolio turnover | | | 12 | | | | 14 | | | | 17 | | | | 22 | | | | 33 | |
Net assets at end of period
(000 omitted) | | | $1,090,690 | | | | $906,572 | | | | $871,026 | | | | $832,696 | | | | $776,373 | |
See Notes to Financial Statements
22
Financial Highlights – continued
| | | | | | | | | | | | | | | | | | | | |
| Class I | | Years ended 8/31 | |
| | | 2013 | | | 2012 | | | 2011 | | | 2010 | | | 2009 | |
Net asset value, beginning of period | | | $25.02 | | | | $21.94 | | | | $19.55 | | | | $19.48 | | | | $23.87 | |
| Income (loss) from investment operations | | | | | | | | | | | | | | | | | |
Net investment income (d) | | | $0.57 | | | | $0.49 | | | | $0.40 | | | | $0.37 | | | | $0.40 | |
Net realized and unrealized gain (loss)
on investments and foreign currency | | | 5.10 | | | | 3.06 | | | | 2.37 | | | | 0.06 | (g) | | | (4.38 | ) |
Total from investment operations | | | $5.67 | | | | $3.55 | | | | $2.77 | | | | $0.43 | | | | $(3.98 | ) |
| Less distributions declared to shareholders | | | | | | | | | | | | | | | | | |
From net investment income | | | $(0.54 | ) | | | $(0.47 | ) | | | $(0.38 | ) | | | $(0.36 | ) | | | $(0.41 | ) |
From net realized gain on investments | | | (0.19 | ) | | | — | | | | — | | | | — | | | | — | |
Total distributions declared to
shareholders | | | $(0.73 | ) | | | $(0.47 | ) | | | $(0.38 | ) | | | $(0.36 | ) | | | $(0.41 | ) |
Net asset value, end of period (x) | | | $29.96 | | | | $25.02 | | | | $21.94 | | | | $19.55 | | | | $19.48 | |
Total return (%) (r)(s)(x) | | | 23.06 | | | | 16.42 | | | | 14.10 | | | | 2.12 | | | | (16.53 | ) |
Ratios (%) (to average net assets)
and Supplemental data: | | | | | | | | | | | | | | | | | | | | |
Expenses before expense reductions (f) | | | 0.68 | | | | 0.70 | | | | 0.70 | | | | 0.73 | | | | 0.79 | |
Expenses after expense reductions (f) | | | 0.67 | | | | 0.68 | | | | 0.69 | | | | 0.73 | | | | 0.79 | |
Net investment income | | | 2.05 | | | | 2.11 | | | | 1.75 | | | | 1.79 | | | | 2.26 | |
Portfolio turnover | | | 12 | | | | 14 | | | | 17 | | | | 22 | | | | 33 | |
Net assets at end of period
(000 omitted) | | | $10,568,573 | | | | $7,472,693 | | | | $5,272,157 | | | | $3,289,827 | | | | $2,335,922 | |
See Notes to Financial Statements
23
Financial Highlights – continued
| | | | | | | | | | | | | | | | | | | | |
| Class R1 | | Years ended 8/31 | |
| | | 2013 | | | 2012 | | | 2011 | | | 2010 | | | 2009 | |
Net asset value, beginning of period | | | $24.50 | | | | $21.48 | | | | $19.15 | | | | $19.09 | | | | $23.42 | |
| Income (loss) from investment operations | | | | | | | | | | | | | | | | | |
Net investment income (d) | | | $0.29 | | | | $0.25 | | | | $0.17 | | | | $0.16 | | | | $0.21 | |
Net realized and unrealized gain (loss)
on investments and foreign currency | | | 5.00 | | | | 3.01 | | | | 2.32 | | | | 0.06 | (g) | | | (4.31 | ) |
Total from investment operations | | | $5.29 | | | | $3.26 | | | | $2.49 | | | | $0.22 | | | | $(4.10 | ) |
| Less distributions declared to shareholders | | | | | | | | | | | | | | | | | |
From net investment income | | | $(0.28 | ) | | | $(0.24 | ) | | | $(0.16 | ) | | | $(0.16 | ) | | | $(0.23 | ) |
From net realized gain on investments | | | (0.19 | ) | | | — | | | | — | | | | — | | | | — | |
Total distributions declared to
shareholders | | | $(0.47 | ) | | | $(0.24 | ) | | | $(0.16 | ) | | | $(0.16 | ) | | | $(0.23 | ) |
Net asset value, end of period (x) | | | $29.32 | | | | $24.50 | | | | $21.48 | | | | $19.15 | | | | $19.09 | |
Total return (%) (r)(s)(x) | | | 21.83 | | | | 15.29 | | | | 12.95 | | | | 1.13 | | | | (17.38 | ) |
Ratios (%) (to average net assets)
and Supplemental data: | | | | | | | | | | | | | | | | | | | | |
Expenses before expense reductions (f) | | | 1.68 | | | | 1.69 | | | | 1.70 | | | | 1.73 | | | | 1.78 | |
Expenses after expense reductions (f) | | | 1.67 | | | | 1.68 | | | | 1.69 | | | | 1.73 | | | | 1.78 | |
Net investment income | | | 1.06 | | | | 1.10 | | | | 0.74 | | | | 0.80 | | | | 1.24 | |
Portfolio turnover | | | 12 | | | | 14 | | | | 17 | | | | 22 | | | | 33 | |
Net assets at end of period
(000 omitted) | | | $33,485 | | | | $32,389 | | | | $33,806 | | | | $32,934 | | | | $30,690 | |
See Notes to Financial Statements
24
Financial Highlights – continued
| | | | | | | | | | | | | | | | | | | | |
| Class R2 | | Years ended 8/31 | |
| | | 2013 | | | 2012 | | | 2011 | | | 2010 | | | 2009 | |
Net asset value, beginning of period | | | $24.69 | | | | $21.66 | | | | $19.31 | | | | $19.24 | | | | $23.59 | |
| Income (loss) from investment operations | | | | | | | | | | | | | | | | | |
Net investment income (d) | | | $0.43 | | | | $0.37 | | | | $0.28 | | | | $0.26 | | | | $0.30 | |
Net realized and unrealized gain (loss)
on investments and foreign currency | | | 5.04 | | | | 3.01 | | | | 2.34 | | | | 0.07 | (g) | | | (4.33 | ) |
Total from investment operations | | | $5.47 | | | | $3.38 | | | | $2.62 | | | | $0.33 | | | | $(4.03 | ) |
| Less distributions declared to shareholders | | | | | | | | | | | | | | | | | |
From net investment income | | | $(0.41 | ) | | | $(0.35 | ) | | | $(0.27 | ) | | | $(0.26 | ) | | | $(0.32 | ) |
From net realized gain on investments | | | (0.19 | ) | | | — | | | | — | | | | — | | | | — | |
Total distributions declared to
shareholders | | | $(0.60 | ) | | | $(0.35 | ) | | | $(0.27 | ) | | | $(0.26 | ) | | | $(0.32 | ) |
Net asset value, end of period (x) | | | $29.56 | | | | $24.69 | | | | $21.66 | | | | $19.31 | | | | $19.24 | |
Total return (%) (r)(s)(x) | | | 22.47 | | | | 15.80 | | | | 13.51 | | | | 1.66 | | | | (16.96 | ) |
Ratios (%) (to average net assets)
and Supplemental data: | | | | | | | | | | | | | | | | | | | | |
Expenses before expense reductions (f) | | | 1.18 | | | | 1.20 | | | | 1.20 | | | | 1.23 | | | | 1.29 | |
Expenses after expense reductions (f) | | | 1.17 | | | | 1.18 | | | | 1.19 | | | | 1.23 | | | | 1.28 | |
Net investment income | | | 1.55 | | | | 1.61 | | | | 1.24 | | | | 1.29 | | | | 1.73 | |
Portfolio turnover | | | 12 | | | | 14 | | | | 17 | | | | 22 | | | | 33 | |
Net assets at end of period
(000 omitted) | | | $572,590 | | | | $517,005 | | | | $496,236 | | | | $426,938 | | | | $286,115 | |
See Notes to Financial Statements
25
Financial Highlights – continued
| | | | | | | | | | | | | | | | | | | | |
| Class R3 | | Years ended 8/31 | |
| | | 2013 | | | 2012 | | | 2011 | | | 2010 | | | 2009 | |
Net asset value, beginning of period | | | $24.83 | | | | $21.78 | | | | $19.41 | | | | $19.34 | | | | $23.71 | |
| Income (loss) from investment operations | | | | | | | | | | | | | | | | | |
Net investment income (d) | | | $0.50 | | | | $0.43 | | | | $0.34 | | | | $0.31 | | | | $0.34 | |
Net realized and unrealized gain (loss)
on investments and foreign currency | | | 5.07 | | | | 3.03 | | | | 2.35 | | | | 0.07 | (g) | | | (4.35 | ) |
Total from investment operations | | | $5.57 | | | | $3.46 | | | | $2.69 | | | | $0.38 | | | | $(4.01 | ) |
| Less distributions declared to shareholders | | | | | | | | | | | | | | | | | |
From net investment income | | | $(0.48 | ) | | | $(0.41 | ) | | | $(0.32 | ) | | | $(0.31 | ) | | | $(0.36 | ) |
From net realized gain on investments | | | (0.19 | ) | | | — | | | | — | | | | — | | | | — | |
Total distributions declared to
shareholders | | | $(0.67 | ) | | | $(0.41 | ) | | | $(0.32 | ) | | | $(0.31 | ) | | | $(0.36 | ) |
Net asset value, end of period (x) | | | $29.73 | | | | $24.83 | | | | $21.78 | | | | $19.41 | | | | $19.34 | |
Total return (%) (r)(s)(x) | | | 22.77 | | | | 16.11 | | | | 13.82 | | | | 1.90 | | | | (16.75 | ) |
Ratios (%) (to average net assets)
and Supplemental data: | | | | | | | | | | | | | | | | | | | | |
Expenses before expense reductions (f) | | | 0.93 | | | | 0.95 | | | | 0.95 | | | | 0.99 | | | | 1.03 | |
Expenses after expense reductions (f) | | | 0.91 | | | | 0.93 | | | | 0.94 | | | | 0.98 | | | | 1.03 | |
Net investment income | | | 1.80 | | | | 1.86 | | | | 1.49 | | | | 1.53 | | | | 1.94 | |
Portfolio turnover | | | 12 | | | | 14 | | | | 17 | | | | 22 | | | | 33 | |
Net assets at end of period
(000 omitted) | | | $1,299,126 | | | | $1,022,504 | | | | $763,670 | | | | $587,645 | | | | $341,993 | |
See Notes to Financial Statements
26
Financial Highlights – continued
| | | | | | | | | | | | | | | | | | | | |
| Class R4 | | Years ended 8/31 | |
| | | 2013 | | | 2012 | | | 2011 | | | 2010 | | | 2009 | |
Net asset value, beginning of period | | | $24.90 | | | | $21.84 | | | | $19.47 | | | | $19.39 | | | | $23.77 | |
| Income (loss) from investment operations | | | | | | | | | | | | | | | | | |
Net investment income (d) | | | $0.57 | | | | $0.49 | | | | $0.40 | | | | $0.36 | | | | $0.37 | |
Net realized and unrealized gain (loss)
on investments and foreign currency | | | 5.08 | | | | 3.04 | | | | 2.35 | | | | 0.08 | (g) | | | (4.34 | ) |
Total from investment operations | | | $5.65 | | | | $3.53 | | | | $2.75 | | | | $0.44 | | | | $(3.97 | ) |
| Less distributions declared to shareholders | | | | | | | | | | | | | | | | | |
From net investment income | | | $(0.54 | ) | | | $(0.47 | ) | | | $(0.38 | ) | | | $(0.36 | ) | | | $(0.41 | ) |
From net realized gain on investments | | | (0.19 | ) | | | — | | | | — | | | | — | | | | — | |
Total distributions declared to
shareholders | | | $(0.73 | ) | | | $(0.47 | ) | | | $(0.38 | ) | | | $(0.36 | ) | | | $(0.41 | ) |
Net asset value, end of period (x) | | | $29.82 | | | | $24.90 | | | | $21.84 | | | | $19.47 | | | | $19.39 | |
Total return (%) (r)(s)(x) | | | 23.09 | | | | 16.40 | | | | 14.05 | | | | 2.18 | | | | (16.56 | ) |
Ratios (%) (to average net assets)
and Supplemental data: | | | | | | | | | | | | | | | | | | | | |
Expenses before expense reductions (f) | | | 0.68 | | | | 0.70 | | | | 0.70 | | | | 0.74 | | | | 0.77 | |
Expenses after expense reductions (f) | | | 0.67 | | | | 0.68 | | | | 0.69 | | | | 0.73 | | | | 0.77 | |
Net investment income | | | 2.07 | | | | 2.10 | | | | 1.74 | | | | 1.77 | | | | 2.10 | |
Portfolio turnover | | | 12 | | | | 14 | | | | 17 | | | | 22 | | | | 33 | |
Net assets at end of period
(000 omitted) | | | $2,892,340 | | | | $2,907,088 | | | | $2,036,438 | | | | $1,266,492 | | | | $652,906 | |
See Notes to Financial Statements
27
Financial Highlights – continued
| | | | | | | | | | | | | | | | | | | | |
| Class R5 (y) | | Years ended 8/31 | |
| | | 2013 | | | 2012 | | | 2011 | | | 2010 | | | 2009 | |
Net asset value, beginning of period | | | $24.90 | | | | $21.81 | | | | $19.44 | | | | $19.37 | | | | $23.74 | |
| Income (loss) from investment operations | | | | | | | | | | | | | | | | | |
Net investment income (d) | | | $0.60 | | | | $0.46 | | | | $0.37 | | | | $0.35 | | | | $0.37 | |
Net realized and unrealized gain (loss)
on investments and foreign currency | | | 5.07 | | | | 3.08 | | | | 2.35 | | | | 0.06 | (g) | | | (4.35 | ) |
Total from investment operations | | | $5.67 | | | | $3.54 | | | | $2.72 | | | | $0.41 | | | | $(3.98 | ) |
| Less distributions declared to shareholders | | | | | | | | | | | | | | | | | |
From net investment income | | | $(0.56 | ) | | | $(0.45 | ) | | | $(0.35 | ) | | | $(0.34 | ) | | | $(0.39 | ) |
From net realized gain on investments | | | (0.19 | ) | | | — | | | | — | | | | — | | | | — | |
Total distributions declared to
shareholders | | | $(0.75 | ) | | | $(0.45 | ) | | | $(0.35 | ) | | | $(0.34 | ) | | | $(0.39 | ) |
Net asset value, end of period (x) | | | $29.82 | | | | $24.90 | | | | $21.81 | | | | $19.44 | | | | $19.37 | |
Total return (%) (r)(s)(x) | | | 23.18 | | | | 16.48 | | | | 13.96 | | | | 2.04 | | | | (16.61 | ) |
Ratios (%) (to average net assets)
and Supplemental data: | | | | | | | | | | | | | | | | | | | | |
Expenses before expense reductions (f) | | | 0.57 | | | | 0.77 | | | | 0.80 | | | | 0.83 | | | | 0.89 | |
Expenses after expense reductions (f) | | | 0.56 | | | | 0.76 | | | | 0.79 | | | | 0.83 | | | | 0.88 | |
Net investment income | | | 2.12 | | | | 1.98 | | | | 1.63 | | | | 1.70 | | | | 2.12 | |
Portfolio turnover | | | 12 | | | | 14 | | | | 17 | | | | 22 | | | | 33 | |
Net assets at end of period
(000 omitted) | | | $2,362,012 | | | | $940,695 | | | | $1,334,446 | | | | $1,393,429 | | | | $999,969 | |
See Notes to Financial Statements
28
Financial Highlights – continued
| | | | | | | | | | | | | | | | | | | | |
| Class 529A | | Years ended 8/31 | |
| | | 2013 | | | 2012 | | | 2011 | | | 2010 | | | 2009 | |
Net asset value, beginning of period | | | $24.74 | | | | $21.70 | | | | $19.34 | | | | $19.28 | | | | $23.62 | |
| Income (loss) from investment operations | | | | | | | | | | | | | | | | | |
Net investment income (d) | | | $0.49 | | | | $0.42 | | | | $0.32 | | | | $0.29 | | | | $0.32 | |
Net realized and unrealized gain (loss)
on investments and foreign currency | | | 5.05 | | | | 3.02 | | | | 2.34 | | | | 0.06 | (g) | | | (4.33 | ) |
Total from investment operations | | | $5.54 | | | | $3.44 | | | | $2.66 | | | | $0.35 | | | | $(4.01 | ) |
| Less distributions declared to shareholders | | | | | | | | | | | | | | | | | |
From net investment income | | | $(0.47 | ) | | | $(0.40 | ) | | | $(0.30 | ) | | | $(0.29 | ) | | | $(0.33 | ) |
From net realized gain on investments | | | (0.19 | ) | | | — | | | | — | | | | — | | | | — | |
Total distributions declared to
shareholders | | | $(0.66 | ) | | | $(0.40 | ) | | | $(0.30 | ) | | | $(0.29 | ) | | | $(0.33 | ) |
Net asset value, end of period (x) | | | $29.62 | | | | $24.74 | | | | $21.70 | | | | $19.34 | | | | $19.28 | |
Total return (%) (r)(s)(t)(x) | | | 22.73 | | | | 16.06 | | | | 13.71 | | | | 1.74 | | | | (16.84 | ) |
Ratios (%) (to average net assets)
and Supplemental data: | | | | | | | | | | | | | | | | | | | | |
Expenses before expense reductions (f) | | | 1.03 | | | | 1.05 | | | | 1.05 | | | | 1.08 | | | | 1.19 | |
Expenses after expense reductions (f) | | | 0.93 | | | | 0.98 | | | | 1.03 | | | | 1.08 | | | | 1.19 | |
Net investment income | | | 1.79 | | | | 1.80 | | | | 1.40 | | | | 1.44 | | | | 1.84 | |
Portfolio turnover | | | 12 | | | | 14 | | | | 17 | | | | 22 | | | | 33 | |
Net assets at end of period
(000 omitted) | | | $10,899 | | | | $8,195 | | | | $6,315 | | | | $5,192 | | | | $5,008 | |
See Notes to Financial Statements
29
Financial Highlights – continued
| | | | | | | | | | | | | | | | | | | | |
| Class 529B | | Years ended 8/31 | |
| | | 2013 | | | 2012 | | | 2011 | | | 2010 | | | 2009 | |
Net asset value, beginning of period | | | $24.48 | | | | $21.45 | | | | $19.12 | | | | $19.06 | | | | $23.37 | |
| Income (loss) from investment operations | | | | | | | | | | | | | | | | | |
Net investment income (d) | | | $0.27 | | | | $0.24 | | | | $0.14 | | | | $0.14 | | | | $0.20 | |
Net realized and unrealized gain (loss)
on investments and foreign currency | | | 4.99 | | | | 3.01 | | | | 2.32 | | | | 0.06 | (g) | | | (4.30 | ) |
Total from investment operations | | | $5.26 | | | | $3.25 | | | | $2.46 | | | | $0.20 | | | | $(4.10 | ) |
| Less distributions declared to shareholders | | | | | | | | | | | | | | | | | |
From net investment income | | | $(0.26 | ) | | | $(0.22 | ) | | | $(0.13 | ) | | | $(0.14 | ) | | | $(0.21 | ) |
From net realized gain on investments | | | (0.19 | ) | | | — | | | | — | | | | — | | | | — | |
Total distributions declared to
shareholders | | | $(0.45 | ) | | | $(0.22 | ) | | | $(0.13 | ) | | | $(0.14 | ) | | | $(0.21 | ) |
Net asset value, end of period (x) | | | $29.29 | | | | $24.48 | | | | $21.45 | | | | $19.12 | | | | $19.06 | |
Total return (%) (r)(s)(t)(x) | | | 21.74 | | | | 15.27 | | | | 12.84 | | | | 1.01 | | | | (17.46 | ) |
Ratios (%) (to average net assets)
and Supplemental data: | | | | | | | | | | | | | | | | | | | | |
Expenses before expense reductions (f) | | | 1.78 | | | | 1.79 | | | | 1.80 | | | | 1.83 | | | | 1.89 | |
Expenses after expense reductions (f) | | | 1.71 | | | | 1.73 | | | | 1.78 | | | | 1.83 | | | | 1.89 | |
Net investment income | | | 1.00 | | | | 1.05 | | | | 0.64 | | | | 0.70 | | | | 1.15 | |
Portfolio turnover | | | 12 | | | | 14 | | | | 17 | | | | 22 | | | | 33 | |
Net assets at end of period
(000 omitted) | | | $1,013 | | | | $963 | | | | $1,147 | | | | $1,198 | | | | $1,215 | |
See Notes to Financial Statements
30
Financial Highlights – continued
| | | | | | | | | | | | | | | | | | | | |
| Class 529C | | Years ended 8/31 | |
| | | 2013 | | | 2012 | | | 2011 | | | 2010 | | | 2009 | |
Net asset value, beginning of period | | | $24.43 | | | | $21.43 | | | | $19.11 | | | | $19.05 | | | | $23.35 | |
| Income (loss) from investment operations | | | | | | | | | | | | | | | | | |
Net investment income (d) | | | $0.27 | | | | $0.24 | | | | $0.15 | | | | $0.14 | | | | $0.20 | |
Net realized and unrealized gain (loss)
on investments and foreign currency | | | 4.99 | | | | 2.99 | | | | 2.31 | | | | 0.07 | (g) | | | (4.30 | ) |
Total from investment operations | | | $5.26 | | | | $3.23 | | | | $2.46 | | | | $0.21 | | | | $(4.10 | ) |
| Less distributions declared to shareholders | | | | | | | | | | | | | | | | | |
From net investment income | | | $(0.27 | ) | | | $(0.23 | ) | | | $(0.14 | ) | | | $(0.15 | ) | | | $(0.20 | ) |
From net realized gain on investments | | | (0.19 | ) | | | — | | | | — | | | | — | | | | — | |
Total distributions declared to
shareholders | | | $(0.46 | ) | | | $(0.23 | ) | | | $(0.14 | ) | | | $(0.15 | ) | | | $(0.20 | ) |
Net asset value, end of period (x) | | | $29.23 | | | | $24.43 | | | | $21.43 | | | | $19.11 | | | | $19.05 | |
Total return (%) (r)(s)(t)(x) | | | 21.80 | | | | 15.18 | | | | 12.82 | | | | 1.06 | | | | (17.45 | ) |
Ratios (%) (to average net assets)
and Supplemental data: | | | | | | | | | | | | | | | | | | | | |
Expenses before expense reductions (f) | | | 1.78 | | | | 1.79 | | | | 1.80 | | | | 1.83 | | | | 1.89 | |
Expenses after expense reductions (f) | | | 1.72 | | | | 1.73 | | | | 1.78 | | | | 1.83 | | | | 1.89 | |
Net investment income | | | 1.00 | | | | 1.06 | | | | 0.65 | | | | 0.69 | | | | 1.15 | |
Portfolio turnover | | | 12 | | | | 14 | | | | 17 | | | | 22 | | | | 33 | |
Net assets at end of period
(000 omitted) | | | $3,387 | | | | $2,610 | | | | $2,438 | | | | $2,180 | | | | $1,710 | |
| (d) | Per share data is based on average shares outstanding. |
| (f) | Ratios do not reflect reductions from fees paid indirectly, if applicable. |
| (g) | The per share amount varies from the net realized and unrealized gain/loss for the period because of the timing of sales of fund shares and the per share amount of realized and unrealized gains and losses at such time. |
| (r) | Certain expenses have been reduced without which performance would have been lower. |
| (s) | From time to time the fund may receive proceeds from litigation settlements, without which performance would be lower. |
| (t) | Total returns do not include any applicable sales charges. |
| (x) | The net asset values per share and total returns have been calculated on net assets which include adjustments made in accordance with U.S. generally accepted accounting principles required at period end for financial reporting purposes. |
| (y) | As further discussed in Note 5 in the Notes to Financial Statements, on May 10, 2012, sales of Class W shares (including exchanges) were suspended. On May 11, 2012, certain Class W shares were automatically converted to Class I shares. Shareholders of certain Class W shares became shareholders of Class I and received Class I shares with a total net asset value equal to their Class W shares at the time of the conversion. On May 30, 2012, remaining Class W shares, which represented MFS seed money, were redesignated Class R5. Class R5 shares are generally available only to certain eligible retirement plans and to funds distributed by MFD. Class R5 shares do not pay a 12b-1 distribution fee or sub-accounting costs. On June 1, 2012, Class R5 shares were offered for sale to the public. For further information about the fund’s fee arrangements, please see Note 3 in the Notes to Financial Statements. |
See Notes to Financial Statements
31
NOTES TO FINANCIAL STATEMENTS
(1) Business and Organization
MFS Value Fund (the fund) is a series of MFS Series Trust I (the trust). The trust is organized as a Massachusetts business trust and is registered under the Investment Company Act of 1940, as amended, as an open-end management investment company.
(2) Significant Accounting Policies
General – The preparation of financial statements in conformity with U.S. generally accepted accounting principles requires management to make estimates and assumptions that affect the reported amounts of assets and liabilities, and disclosure of contingent assets and liabilities at the date of the financial statements and the reported amounts of revenues and expenses during the reporting period. Actual results could differ from those estimates. In the preparation of these financial statements, management has evaluated subsequent events occurring after the date of the fund’s Statement of Assets and Liabilities through the date that the financial statements were issued.
In January 2013, the Financial Accounting Standards Board (FASB) issued Accounting Standards Update 2013-01 (“ASU 2013-01”) entitled Balance Sheet (Topic 210) – Clarifying the Scope of Disclosures about Offsetting Assets and Liabilities which is intended to clarify the scope of Accounting Standards Update 2011-11 (“ASU 2011-11”), Balance Sheet (Topic 210) – Disclosures about Offsetting Assets and Liabilities. Consistent with the effective date for ASU 2011-11, ASU 2013-01 is effective for annual reporting periods beginning on or after January 1, 2013, and interim periods within those annual periods. ASU 2013-01 limits the scope of ASU 2011-11’s disclosure requirements on offsetting to financial assets and financial liabilities related to derivatives, repurchase and reverse repurchase agreements, and securities lending and securities borrowing transactions. Although still evaluating the potential impact of these two ASUs to the fund, management expects that the impact of the fund’s adoption will be limited to additional financial statement disclosures.
In June 2013, FASB issued Accounting Standards Update 2013-08 Financial Services – Investment Companies (Topic 946) – Amendments to the Scope, Measurement, and Disclosure Requirements (“ASU 2013-08”) which is effective for interim and annual reporting periods in fiscal years that begin after December 15, 2013. ASU 2013-08 sets forth a methodology for determining whether an entity should be characterized as an investment company and prescribes fair value accounting for an investment company’s non-controlling ownership interest in another investment company. FASB has determined that a fund registered under the Investment Company Act of 1940 automatically meets ASU 2013-08’s criteria for an investment company. Although still evaluating the potential impacts of ASU 2013-08 to the fund, management expects that the impact of the fund’s adoption will be limited to additional financial statement disclosures.
Investment Valuations – Equity securities, including restricted equity securities, are generally valued at the last sale or official closing price as provided by a third-party pricing service on the market or exchange on which they are primarily traded. Equity securities, for which there were no sales reported that day, are generally valued at the
32
Notes to Financial Statements – continued
last quoted daily bid quotation as provided by a third-party pricing service on the market or exchange on which such securities are primarily traded. Short-term instruments with a maturity at issuance of 60 days or less generally are valued at amortized cost, which approximates market value. Open-end investment companies are generally valued at net asset value per share. Securities and other assets generally valued on the basis of information from a third-party pricing service may also be valued at a broker/dealer bid quotation. Values obtained from third-party pricing services can utilize both transaction data and market information such as yield, quality, coupon rate, maturity, type of issue, trading characteristics, and other market data. The values of foreign securities and other assets and liabilities expressed in foreign currencies are converted to U.S. dollars using the mean of bid and asked prices for rates provided by a third-party pricing service.
The Board of Trustees has delegated primary responsibility for determining or causing to be determined the value of the fund’s investments (including any fair valuation) to the adviser pursuant to valuation policies and procedures approved by the Board. If the adviser determines that reliable market quotations are not readily available, investments are valued at fair value as determined in good faith by the adviser in accordance with such procedures under the oversight of the Board of Trustees. Under the fund’s valuation policies and procedures, market quotations are not considered to be readily available for most types of debt instruments and floating rate loans and many types of derivatives. These investments are generally valued at fair value based on information from third-party pricing services. In addition, investments may be valued at fair value if the adviser determines that an investment’s value has been materially affected by events occurring after the close of the exchange or market on which the investment is principally traded (such as foreign exchange or market) and prior to the determination of the fund’s net asset value, or after the halting of trading of a specific security where trading does not resume prior to the close of the exchange or market on which the security is principally traded. Events that occur on a frequent basis after foreign markets close (such as developments in foreign markets and significant movements in the U.S. markets) and prior to the determination of the fund’s net asset value may be deemed to have a material effect on the value of securities traded in foreign markets. Accordingly, the fund’s foreign equity securities may often be valued at fair value. The adviser generally relies on third-party pricing services or other information (such as the correlation with price movements of similar securities in the same or other markets; the type, cost and investment characteristics of the security; the business and financial condition of the issuer; and trading and other market data) to assist in determining whether to fair value and at what value to fair value an investment. The value of an investment for purposes of calculating the fund’s net asset value can differ depending on the source and method used to determine value. When fair valuation is used, the value of an investment used to determine the fund’s net asset value may differ from quoted or published prices for the same investment. There can be no assurance that the fund could obtain the fair value assigned to an investment if it were to sell the investment at the same time at which the fund determines its net asset value per share.
Various inputs are used in determining the value of the fund’s assets or liabilities. These inputs are categorized into three broad levels. In certain cases, the inputs used to measure fair value may fall into different levels of the fair value hierarchy. In such cases,
33
Notes to Financial Statements – continued
an investment’s level within the fair value hierarchy is based on the lowest level of input that is significant to the fair value measurement. The fund’s assessment of the significance of a particular input to the fair value measurement in its entirety requires judgment, and considers factors specific to the investment. Level 1 includes unadjusted quoted prices in active markets for identical assets or liabilities. Level 2 includes other significant observable market-based inputs (including quoted prices for similar securities, interest rates, prepayment speed, and credit risk). Level 3 includes unobservable inputs, which may include the adviser’s own assumptions in determining the fair value of investments. The following is a summary of the levels used as of August 31, 2013 in valuing the fund’s assets or liabilities:
| | | | | | | | | | | | | | | | |
| Investments at Value | | Level 1 | | | Level 2 | | | Level 3 | | | Total | |
| Equity Securities | | | $26,596,000,023 | | | | $— | | | | $— | | | | $26,596,000,023 | |
| Mutual Funds | | | 382,071,026 | | | | — | | | | — | | | | 382,071,026 | |
| Total Investments | | | $26,978,071,049 | | | | $— | | | | $— | | | | $26,978,071,049 | |
For further information regarding security characteristics, see the Portfolio of Investments.
Foreign Currency Translation – Purchases and sales of foreign investments, income, and expenses are converted into U.S. dollars based upon currency exchange rates prevailing on the respective dates of such transactions or on the reporting date for foreign denominated receivables and payables. Gains and losses attributable to foreign currency exchange rates on sales of securities are recorded for financial statement purposes as net realized gains and losses on investments. Gains and losses attributable to foreign exchange rate movements on receivables, payables, income and expenses are recorded for financial statement purposes as foreign currency transaction gains and losses. That portion of both realized and unrealized gains and losses on investments that results from fluctuations in foreign currency exchange rates is not separately disclosed.
Security Loans – State Street Bank and Trust Company (“State Street”), as lending agent, loans the securities of the fund to certain qualified institutions (the “Borrowers”) approved by the fund. The loans are collateralized by cash and/or U.S. Treasury and federal agency obligations in an amount typically at least equal to the market value of the securities loaned. The market value of the loaned securities is determined at the close of business of the fund and any additional required collateral is delivered to the fund on the next business day. State Street provides the fund with indemnification against Borrower default. The fund bears the risk of loss with respect to the investment of cash collateral. On loans collateralized by cash, the cash collateral is invested in a money market fund or short-term securities. A portion of the income generated upon investment of the collateral is remitted to the Borrowers, and the remainder is allocated between the fund and the lending agent. On loans collateralized by U.S. Treasury and/or federal agency obligations, a fee is received from the Borrower, and is allocated between the fund and the lending agent. Income from securities lending is included in “Interest” income in the Statement of Operations. The dividend and interest income earned on the securities loaned is accounted for in the same manner as other dividend and interest income. At August 31, 2013, there were no securities on loan or collateral outstanding.
34
Notes to Financial Statements – continued
Indemnifications – Under the fund’s organizational documents, its officers and Trustees may be indemnified against certain liabilities and expenses arising out of the performance of their duties to the fund. Additionally, in the normal course of business, the fund enters into agreements with service providers that may contain indemnification clauses. The fund’s maximum exposure under these agreements is unknown as this would involve future claims that may be made against the fund that have not yet occurred.
Investment Transactions and Income – Investment transactions are recorded on the trade date. Interest income is recorded on the accrual basis. Dividends received in cash are recorded on the ex-dividend date. Certain dividends from foreign securities will be recorded when the fund is informed of the dividend if such information is obtained subsequent to the ex-dividend date. Dividend and interest payments received in additional securities are recorded on the ex-dividend or ex-interest date in an amount equal to the value of the security on such date.
The fund may receive proceeds from litigation settlements. Any proceeds received from litigation involving portfolio holdings are reflected in the Statement of Operations in realized gain/loss if the security has been disposed of by the fund or in unrealized gain/loss if the security is still held by the fund. Any other proceeds from litigation not related to portfolio holdings are reflected as other income in the Statement of Operations.
Fees Paid Indirectly – The fund’s custody fee may be reduced according to an arrangement that measures the value of cash deposited with the custodian by the fund. This amount, for the year ended August 31, 2013, is shown as a reduction of total expenses in the Statement of Operations.
Tax Matters and Distributions – The fund intends to qualify as a regulated investment company, as defined under Subchapter M of the Internal Revenue Code, and to distribute all of its taxable income, including realized capital gains. As a result, no provision for federal income tax is required. The fund’s federal tax returns, when filed, will remain subject to examination by the Internal Revenue Service for a three year period. Foreign taxes have been accrued by the fund in the accompanying financial statements in accordance with the applicable foreign tax law. Foreign income taxes may be withheld by certain countries in which the fund invests.
Distributions to shareholders are recorded on the ex-dividend date. Income and capital gain distributions are determined in accordance with income tax regulations, which may differ from U.S. generally accepted accounting principles. Certain capital accounts in the financial statements are periodically adjusted for permanent differences in order to reflect their tax character. These adjustments have no impact on net assets or net asset value per share. Temporary differences which arise from recognizing certain items of income, expense, gain or loss in different periods for financial statement and tax purposes will reverse at some time in the future. Distributions in excess of net investment income or net realized gains are temporary overdistributions for financial statement purposes resulting from differences in the recognition or classification of income or distributions for financial statement and tax purposes.
Book/tax differences primarily relate to wash sale loss deferrals and treating a portion of the proceeds from redemptions as a distribution for tax purposes.
35
Notes to Financial Statements – continued
The tax character of distributions declared to shareholders for the last two fiscal years is as follows:
| | | | | | | | |
| | | 8/31/13 | | | 8/31/12 | |
| Ordinary income (including any short-term capital gains) | | | $430,454,430 | | | | $327,177,582 | |
| Long-term capital gains | | | 157,367,309 | | | | — | |
| Total distributions | | | $587,821,739 | | | | $327,177,582 | |
The federal tax cost and the tax basis components of distributable earnings were as follows:
| | | | |
| As of 8/31/13 | | | |
| Cost of investments | | | $19,843,708,868 | |
| Gross appreciation | | | 7,179,687,830 | |
| Gross depreciation | | | (45,325,649 | ) |
| Net unrealized appreciation (depreciation) | | | $7,134,362,181 | |
| Undistributed ordinary income | | | 201,576,358 | |
| Undistributed long-term capital gain | | | 46,280,507 | |
| Capital loss carryforwards | | | (25,656,270 | ) |
| Other temporary differences | | | (52,786 | ) |
Under the Regulated Investment Company Modernization Act of 2010 (the “Act”), net capital losses recognized after August 31, 2011 may be carried forward indefinitely, and their character is retained as short-term and/or long-term losses (“post-enactment losses”). Previously, net capital losses were carried forward for eight years and treated as short-term losses (“pre-enactment losses”). As a transition rule, the Act requires that post-enactment net capital losses be used before pre-enactment net capital losses.
As of August 31, 2013, the fund had capital loss carryforwards available to offset future realized gains. Such pre-enactment losses expire as follows:
The availability of $25,656,270 of the capital loss carryforwards, which were acquired on July 24, 2009 in connection with the MFS Strategic Value Fund merger, may be limited in a given year.
Multiple Classes of Shares of Beneficial Interest – The fund offers multiple classes of shares, which differ in their respective distribution, service, and program manager fees. The fund’s income, realized and unrealized gain (loss), and common expenses are allocated to shareholders based on the daily net assets of each class. Dividends are declared separately for each class. Differences in per share dividend rates are generally due to differences in separate class expenses. Class B and Class 529B shares will convert to Class A and Class 529A shares, respectively, approximately eight years after
36
Notes to Financial Statements – continued
purchase. The fund’s distributions declared to shareholders as reported in the Statements of Changes in Net Assets are presented by class as follows:
| | | | | | | | | | | | | | | | |
| | | From net investment
income | | | From net realized gain on
investments | |
| | | Year
ended
8/31/13 | | | Year
ended
8/31/12 | | | Year
ended
8/31/13 | | | Year
ended
8/31/12 | |
| Class A | | | $124,516,423 | | | | $98,708,200 | | | | $49,243,771 | | | | $— | |
| Class B | | | 1,678,264 | | | | 1,726,725 | | | | 1,211,702 | | | | — | |
| Class C | | | 10,011,832 | | | | 9,100,000 | | | | 6,733,945 | | | | — | |
| Class I | | | 176,018,883 | | | | 120,549,342 | | | | 57,935,944 | | | | — | |
| Class R1 | | | 339,938 | | | | 349,942 | | | | 240,515 | | | | — | |
| Class R2 | | | 8,205,027 | | | | 7,834,093 | | | | 3,801,881 | | | | — | |
| Class R3 | | | 19,969,447 | | | | 16,118,766 | | | | 7,763,177 | | | | — | |
| Class R4 | | | 61,227,720 | | | | 47,793,898 | | | | 22,718,740 | | | | — | |
| Class R5 (formerly Class W) | | | 28,283,283 | | | | 24,836,399 | | | | 7,624,734 | | | | — | |
| Class 529A | | | 163,205 | | | | 123,759 | | | | 64,487 | | | | — | |
| Class 529B | | | 9,739 | | | | 10,871 | | | | 7,173 | | | | — | |
| Class 529C | | | 30,669 | | | | 25,587 | | | | 21,240 | | | | — | |
| Total | | | $430,454,430 | | | | $327,177,582 | | | | $157,367,309 | | | | $— | |
On May 30, 2012, Class W shares were redesignated Class R5. See Note 5 for additional information.
(3) Transactions with Affiliates
Investment Adviser – The fund has an investment advisory agreement with MFS to provide overall investment management and related administrative services and facilities to the fund. The management fee is computed daily and paid monthly at the following annual rates:
| | | | |
| First $7.5 billion of average daily net assets | | | 0.60 | % |
| Next $2.5 billion of average daily net assets | | | 0.53 | % |
| Average daily net assets in excess of $10 billion | | | 0.50 | % |
The investment adviser had agreed in writing to reduce its management fee to 0.45% of average daily net assets in excess of $12.5 billion. This written agreement was terminated on December 31, 2012. For the period September 1, 2012 through December 31, 2012, this management fee reduction amounted to $1,451,029, which is shown as a reduction of total expenses in the Statement of Operations. Effective January 1, 2013, the investment adviser has agreed in writing to reduce its management fee to 0.45% of average daily net assets in excess of $20 billion. This written agreement will continue until modified by the fund’s Board of Trustees, but such agreement will continue at least until December 31, 2014. For the period January 1, 2013 through August 31, 2013, this management fee reduction amounted to $1,756,468, which is shown as a reduction of total expenses in the Statement of Operations. Effective April 1, 2013, MFS has agreed in writing to reduce its management fee by a specified amount if certain MFS mutual fund assets exceed thresholds agreed to by MFS and the fund’s Board of Trustees. For the period April 1, 2013 through August 31, 2013, this management fee reduction amounted to
37
Notes to Financial Statements – continued
$59,885, which is shown as a reduction of total expenses in the Statement of Operations. The management fee incurred for the year ended August 31, 2013 was equivalent to an annual effective rate of 0.52% of the fund’s average daily net assets.
Distributor – MFS Fund Distributors, Inc. (MFD), a wholly-owned subsidiary of MFS, as distributor, received $2,217,891 and $6,810 for the year ended August 31, 2013, as its portion of the initial sales charge on sales of Class A and Class 529A shares of the fund, respectively.
The Board of Trustees has adopted a distribution plan for certain class shares pursuant to Rule 12b-1 of the Investment Company Act of 1940.
The fund’s distribution plan provides that the fund will pay MFD for services provided by MFD and financial intermediaries in connection with the distribution and servicing of certain share classes. One component of the plan is a distribution fee paid to MFD and another component of the plan is a service fee paid to MFD. MFD may subsequently pay all, or a portion, of the distribution and/or service fees to financial intermediaries.
Distribution Plan Fee Table:
| | | | | | | | | | | | | | | | | | | | |
| | | Distribution
Fee Rate (d) | | | Service
Fee Rate (d) | | | Total
Distribution
Plan (d) | | | Annual
Effective
Rate (e) | | | Distribution
and Service
Fee | |
| Class A | | | — | | | | 0.25% | | | | 0.25% | | | | 0.25% | | | | $18,184,694 | |
| Class B | | | 0.75% | | | | 0.25% | | | | 1.00% | | | | 1.00% | | | | 1,691,188 | |
| Class C | | | 0.75% | | | | 0.25% | | | | 1.00% | | | | 1.00% | | | | 9,894,737 | |
| Class R1 | | | 0.75% | | | | 0.25% | | | | 1.00% | | | | 1.00% | | | | 330,513 | |
| Class R2 | | | 0.25% | | | | 0.25% | | | | 0.50% | | | | 0.50% | | | | 2,746,930 | |
| Class R3 | | | — | | | | 0.25% | | | | 0.25% | | | | 0.25% | | | | 2,919,443 | |
| Class 529A | | | — | | | | 0.25% | | | | 0.25% | | | | 0.21% | | | | 24,239 | |
| Class 529B | | | 0.75% | | | | 0.25% | | | | 1.00% | | | | 1.00% | | | | 10,047 | |
| Class 529C | | | 0.75% | | | | 0.25% | | | | 1.00% | | | | 1.00% | | | | 30,435 | |
| Total Distribution and Service Fees | | | | | | | | $35,832,226 | |
| (d) | In accordance with the distribution plan for certain classes, the fund pays distribution and/or service fees equal to these annual percentage rates of each class’s average daily net assets. The distribution and service fee rates disclosed by class represent the current rates in effect at the end of the reporting period. |
| (e) | The annual effective rates represent actual fees incurred under the distribution plan for the year ended August 31, 2013 based on each class’s average daily net assets. Effective January 1, 2013, MFD has voluntarily agreed to rebate a portion of each class’s 0.25% service fee attributable to accounts for which MFD retains the 0.25% service fee except for accounts attributable to MFS or its subsidiaries’ seed money. For the period January 1, 2013 through August 31, 2013, this rebate amounted to $39,849, $464, $615, $79, $811, $43,427, $3,793, $22, and $23 for Class A, Class B, Class C, Class R1, Class R2, Class R3, Class 529A, Class 529B, and Class 529C, respectively, and is reflected as a reduction of total expenses in the Statement of Operations. |
Certain Class A shares are subject to a contingent deferred sales charge (CDSC) in the event of a shareholder redemption within 18 months of purchase for shares purchased on or after August 1, 2012, and within 24 months of purchase for shares purchased prior to August 1, 2012. Class C and Class 529C shares are subject to a CDSC in the event of a shareholder redemption within 12 months of purchase. Class B and
38
Notes to Financial Statements – continued
Class 529B shares are subject to a CDSC in the event of a shareholder redemption within six years of purchase. All contingent deferred sales charges are paid to MFD and during the year ended August 31, 2013, were as follows:
| | | | |
| | | Amount | |
| Class A | | | $22,148 | |
| Class B | | | 184,415 | |
| Class C | | | 50,415 | |
| Class 529B | | | 82 | |
| Class 529C | | | 1 | |
The fund has entered into and may from time to time enter into contracts with program managers and other parties which administer the tuition programs through which an investment in the fund’s 529 share classes is made. The fund has entered into an agreement with MFD pursuant to which MFD receives an annual fee of up to 0.10% of the average daily net assets attributable to each 529 share class. MFD has agreed to waive a portion of this fee in an amount equal to 0.05% of the average daily net assets for each 529 share class. This waiver agreement will expire on December 31, 2014, unless MFD elects to extend the waiver. For the year ended August 31, 2013, this waiver amounted to $6,872 and is reflected as a reduction of total expenses in the Statement of Operations. The program manager fee incurred for the year ended August 31, 2013 was equivalent to an annual effective rate of 0.05% of the average daily net assets attributable to each 529 share class. The services provided by MFD, or a third party with which MFD contracts, include recordkeeping and tax reporting and account services, as well as services designed to maintain the program’s compliance with the Internal Revenue Code and other regulatory requirements. Program manager fees and waivers for the year ended August 31, 2013, were as follows:
| | | | | | | | |
| | | Fee | | | Waiver | |
| Class 529A | | | $9,696 | | | | $4,848 | |
| Class 529B | | | 1,005 | | | | 502 | |
| Class 529C | | | 3,044 | | | | 1,522 | |
| Total Program Manager Fees and Waivers | | | $13,745 | | | | $6,872 | |
Shareholder Servicing Agent – MFS Service Center, Inc. (MFSC), a wholly-owned subsidiary of MFS, receives a fee from the fund for its services as shareholder servicing agent calculated as a percentage of the average daily net assets of the fund as determined periodically under the supervision of the fund’s Board of Trustees. For the year ended August 31, 2013, the fee was $2,455,572, which equated to 0.0103% annually of the fund’s average daily net assets. MFSC also receives payment from the fund for out-of-pocket expenses, sub-accounting and other shareholder servicing costs which may be paid to affiliated and unaffiliated service providers. Class R5 shares do not incur sub-accounting fees. For the year ended August 31, 2013, these out-of-pocket expenses, sub-accounting and other shareholder servicing costs amounted to $26,507,390.
Administrator – MFS provides certain financial, legal, shareholder communications, compliance, and other administrative services to the fund. Under an administrative services agreement, the fund partially reimburses MFS the costs incurred to provide these services. The fund is charged an annual fixed amount of $17,500 plus a fee
39
Notes to Financial Statements – continued
based on average daily net assets. The administrative services fee incurred for the year ended August 31, 2013 was equivalent to an annual effective rate of 0.0022% of the fund’s average daily net assets.
Trustees’ and Officers’ Compensation – The fund pays compensation to independent Trustees in the form of a retainer, attendance fees, and additional compensation to Board and Committee chairpersons. The fund does not pay compensation directly to Trustees or officers of the fund who are also officers of the investment adviser, all of whom receive remuneration for their services to the fund from MFS. Certain officers and Trustees of the fund are officers or directors of MFS and MFSC.
Prior to December 31, 2001, the fund had an unfunded defined benefit plan (“DB plan”) for independent Trustees. As of December 31, 2001, the Board took action to terminate the DB plan with respect to then-current and any future independent Trustees, such that the DB plan covers only certain of those former independent Trustees who retired on or before December 31, 2001. The DB plan resulted in a pension expense of $176 and is included in independent Trustees’ compensation for the year ended August 31, 2013. The liability for deferred retirement benefits payable to certain independent Trustees under the DB plan amounted to $4,228 at August 31, 2013, and is included in “Payable for independent Trustees’ compensation” in the Statement of Assets and Liabilities.
Other – This fund and certain other funds managed by MFS (the funds) have entered into services agreements (the Agreements) which provide for payment of fees by the funds to Tarantino LLC and Griffin Compliance LLC in return for the provision of services of an Independent Chief Compliance Officer (ICCO) and Assistant ICCO, respectively, for the funds. The ICCO and Assistant ICCO are officers of the funds and the sole members of Tarantino LLC and Griffin Compliance LLC, respectively. The funds can terminate the Agreements with Tarantino LLC and Griffin Compliance LLC at any time under the terms of the Agreements. For the year ended August 31, 2013, the aggregate fees paid by the fund to Tarantino LLC and Griffin Compliance LLC were $158,186 and are included in “Miscellaneous” expense in the Statement of Operations. MFS has agreed to reimburse the fund for a portion of the payments made by the fund in the amount of $65,510, which is shown as a reduction of total expenses in the Statement of Operations. Additionally, MFS has agreed to bear all expenses associated with office space, other administrative support, and supplies provided to the ICCO and Assistant ICCO.
The fund invests in the MFS Institutional Money Market Portfolio which is managed by MFS and seeks current income consistent with preservation of capital and liquidity. Income earned on this investment is included in “Dividends from underlying affiliated funds” in the Statement of Operations. This money market fund does not pay a management fee to MFS.
(4) Portfolio Securities
Purchases and sales of investments, other than short-term obligations, aggregated $4,593,121,579 and $2,751,245,564, respectively.
40
Notes to Financial Statements – continued
(5) Shares of Beneficial Interest
The fund’s Declaration of Trust permits the Trustees to issue an unlimited number of full and fractional shares of beneficial interest. Transactions in fund shares were as follows:
| | | | | | | | | | | | | | | | |
| | | Year ended
8/31/13 | | | Year ended
8/31/12 | |
| | | Shares | | | Amount | | | Shares | | | Amount | |
| Shares sold | | | | | | | | | | | | | | | | |
Class A | | | 67,116,915 | | | | $1,889,877,634 | | | | 101,576,026 | | | | $2,400,718,106 | |
Class B | | | 708,666 | | | | 20,011,073 | | | | 1,177,218 | | | | 27,341,091 | |
Class C | | | 6,158,073 | | | | 172,478,672 | | | | 4,208,466 | | | | 97,217,907 | |
Class I | | | 131,671,398 | | | | 3,656,207,857 | | | | 162,020,533 | | | | 3,889,917,304 | |
Class R1 | | | 285,909 | | | | 7,814,415 | | | | 346,230 | | | | 7,942,833 | |
Class R2 | | | 4,158,241 | | | | 114,058,643 | | | | 4,909,546 | | | | 113,270,694 | |
Class R3 | | | 12,097,117 | | | | 336,373,199 | | | | 15,359,979 | | | | 352,757,135 | |
Class R4 | | | 27,985,159 | | | | 771,830,606 | | | | 40,785,478 | | | | 960,911,334 | |
Class R5 (formerly Class W) | | | 43,743,094 | | | | 1,209,937,672 | | | | 52,410,054 | | | | 1,218,231,409 | |
Class 529A | | | 63,689 | | | | 1,774,775 | | | | 64,477 | | | | 1,492,662 | |
Class 529B | | | 3,293 | | | | 90,545 | | | | 5,300 | | | | 121,535 | |
Class 529C | | | 23,338 | | | | 635,837 | | | | 16,701 | | | | 387,565 | |
| | | 294,014,892 | | | | $8,181,090,928 | | | | 382,880,008 | | | | $9,070,309,575 | |
| | | |
Shares issued to shareholders in
reinvestment of distributions | | | | | | | | | | | | | |
Class A | | | 5,951,959 | | | | $157,662,290 | | | | 3,818,234 | | | | $86,086,303 | |
Class B | | | 100,309 | | | | 2,617,280 | | | | 68,019 | | | | 1,522,062 | |
Class C | | | 403,650 | | | | 10,521,773 | | | | 242,838 | | | | 5,421,963 | |
Class I | | | 5,760,185 | | | | 153,740,898 | | | | 3,531,395 | | | | 80,008,450 | |
Class R1 | | | 22,442 | | | | 579,636 | | | | 15,756 | | | | 349,568 | |
Class R2 | | | 438,901 | | | | 11,500,677 | | | | 337,968 | | | | 7,539,321 | |
Class R3 | | | 1,048,279 | | | | 27,727,975 | | | | 715,369 | | | | 16,114,074 | |
Class R4 | | | 3,091,705 | | | | 81,724,939 | | | | 2,054,612 | | | | 46,411,632 | |
Class R5 (formerly Class W) | | | 1,333,660 | | | | 35,908,017 | | | | 1,075,411 | | | | 24,060,387 | |
Class 529A | | | 8,630 | | | | 227,628 | | | | 5,520 | | | | 123,759 | |
Class 529B | | | 653 | | | | 16,883 | | | | 491 | | | | 10,866 | |
Class 529C | | | 2,010 | | | | 51,909 | | | | 1,146 | | | | 25,352 | |
| | | 18,162,383 | | | | $482,279,905 | | | | 11,866,759 | | | | $267,673,737 | |
41
Notes to Financial Statements – continued
| | | | | | | | | | | | | | | | |
| | | Year ended
8/31/13 | | | Year ended
8/31/12 | |
| | | Shares | | | Amount | | | Shares | | | Amount | |
| Shares reacquired | | | | | | | | | | | | | | | | |
Class A | | | (68,940,476 | ) | | | $(1,899,985,019 | ) | | | (72,104,947 | ) | | | $(1,686,180,512 | ) |
Class B | | | (1,883,982 | ) | | | (51,710,790 | ) | | | (2,877,934 | ) | | | (66,122,400 | ) |
Class C | | | (6,368,042 | ) | | | (172,465,155 | ) | | | (7,970,996 | ) | | | (182,992,253 | ) |
Class I | | | (83,338,753 | ) | | | (2,318,973,834 | ) | | | (107,169,770 | ) | | | (2,516,493,364 | ) |
Class R1 | | | (488,335 | ) | | | (13,148,405 | ) | | | (613,462 | ) | | | (13,941,269 | ) |
Class R2 | | | (6,162,208 | ) | | | (167,459,751 | ) | | | (7,224,225 | ) | | | (165,364,122 | ) |
Class R3 | | | (10,622,008 | ) | | | (294,129,563 | ) | | | (9,963,593 | ) | | | (233,775,094 | ) |
Class R4 | | | (50,807,188 | ) | | | (1,394,609,059 | ) | | | (19,348,080 | ) | | | (452,651,858 | ) |
Class R5 (formerly Class W) | | | (3,658,419 | ) | | | (104,034,634 | ) | | | (76,888,139 | ) | | | (1,845,948,480 | ) |
Class 529A | | | (35,610 | ) | | | (1,007,941 | ) | | | (29,757 | ) | | | (689,366 | ) |
Class 529B | | | (8,708 | ) | | | (239,427 | ) | | | (19,917 | ) | | | (462,377 | ) |
Class 529C | | | (16,277 | ) | | | (440,935 | ) | | | (24,801 | ) | | | (574,523 | ) |
| | | (232,330,006 | ) | | | $(6,418,204,513 | ) | | | (304,235,621 | ) | | | $(7,165,195,618 | ) |
| | | | |
| Net change | | | | | | | | | | | | | | | | |
Class A | | | 4,128,398 | | | | $147,554,905 | | | | 33,289,313 | | | | $800,623,897 | |
Class B | | | (1,075,007 | ) | | | (29,082,437 | ) | | | (1,632,697 | ) | | | (37,259,247 | ) |
Class C | | | 193,681 | | | | 10,535,290 | | | | (3,519,692 | ) | | | (80,352,383 | ) |
Class I | | | 54,092,830 | | | | 1,490,974,921 | | | | 58,382,158 | | | | 1,453,432,390 | |
Class R1 | | | (179,984 | ) | | | (4,754,354 | ) | | | (251,476 | ) | | | (5,648,868 | ) |
Class R2 | | | (1,565,066 | ) | | | (41,900,431 | ) | | | (1,976,711 | ) | | | (44,554,107 | ) |
Class R3 | | | 2,523,388 | | | | 69,971,611 | | | | 6,111,755 | | | | 135,096,115 | |
Class R4 | | | (19,730,324 | ) | | | (541,053,514 | ) | | | 23,492,010 | | | | 554,671,108 | |
Class R5 (formerly Class W) | | | 41,418,335 | | | | 1,141,811,055 | | | | (23,402,674 | ) | | | (603,656,684 | ) |
Class 529A | | | 36,709 | | | | 994,462 | | | | 40,240 | | | | 927,055 | |
Class 529B | | | (4,762 | ) | | | (131,999 | ) | | | (14,126 | ) | | | (329,976 | ) |
Class 529C | | | 9,071 | | | | 246,811 | | | | (6,954 | ) | | | (161,606 | ) |
| | | 79,847,269 | | | | $2,245,166,320 | | | | 90,511,146 | | | | $2,172,787,694 | |
The fund is one of several mutual funds in which the MFS funds-of-funds may invest. The MFS funds-of-funds do not invest in the underlying MFS funds for the purpose of exercising management or control. At the end of the period, the MFS Growth Allocation Fund, the MFS Moderate Allocation Fund, the MFS Aggressive Growth Allocation Fund, and the MFS Conservative Allocation Fund were the owners of record of approximately 2%, 1%, 1%, and 1%, respectively, of the value of outstanding voting shares of the fund. In addition, the MFS Lifetime Retirement Income Fund, the MFS Lifetime 2010 Fund, the MFS Lifetime 2015 Fund, the MFS Lifetime 2020 Fund, the MFS Lifetime 2025 Fund, the MFS Lifetime 2030 Fund, the MFS Lifetime 2035 Fund, the MFS Lifetime 2040 Fund, the MFS Lifetime 2045 Fund, the MFS Lifetime 2050 Fund, and the MFS Lifetime 2055 Fund were each the owners of record of less than 1% of the value of outstanding voting shares of the fund.
Redesignation of Class W to Class R5 – On May 10, 2012, sales of Class W shares (including exchanges) were suspended. On May 11, 2012, certain Class W shares were
42
Notes to Financial Statements – continued
automatically converted to Class I shares. Shareholders of certain Class W shares became shareholders of Class I and received Class I shares with a total net asset value equal to their Class W shares at the time of the conversion. On May 30, 2012, remaining Class W shares, which represented MFS seed money, were redesignated Class R5. Class R5 shares are generally available only to certain eligible retirement plans and to funds distributed by MFD. Class R5 shares do not pay a 12b-1 distribution fee or sub-accounting costs. On June 1, 2012, Class R5 shares were offered for sale to the public.
(6) Line of Credit
The fund and certain other funds managed by MFS participate in a $1.1 billion unsecured committed line of credit, subject to a $1 billion sublimit, provided by a syndication of banks under a credit agreement. Borrowings may be made for temporary financing needs. Interest is charged to each fund, based on its borrowings, generally at a rate equal to the higher of the Federal Reserve funds rate or one month LIBOR plus an agreed upon spread. A commitment fee, based on the average daily, unused portion of the committed line of credit, is allocated among the participating funds at the end of each calendar quarter. In addition, the fund and other funds managed by MFS have established unsecured uncommitted borrowing arrangements with certain banks for temporary financing needs. Interest is charged to each fund, based on its borrowings, at a rate equal to the Federal Reserve funds rate plus an agreed upon spread. For the year ended August 31, 2013, the fund’s commitment fee and interest expense were $122,386 and $0, respectively, and are included in “Miscellaneous” expense in the Statement of Operations.
(7) Transactions in Underlying Affiliated Funds-Affiliated Issuers
An affiliated issuer may be considered one in which the fund owns 5% or more of the outstanding voting securities, or a company which is under common control. For the purposes of this report, the fund assumes the following to be an affiliated issuer:
| | | | | | | | | | | | | | | | |
| Underlying Affiliated Fund | | Beginning
Shares/Par
Amount | | | Acquisitions
Shares/Par
Amount | | | Dispositions
Shares/Par
Amount | | | Ending
Shares/Par
Amount | |
MFS Institutional Money
Market Portfolio | | | 84,789,410 | | | | 3,352,608,757 | | | | (3,055,327,141 | ) | | | 382,071,026 | |
| | | | |
| Underlying Affiliated Fund | | Realized
Gain (Loss) | | | Capital Gain
Distributions | | | Dividend
Income | | | Ending
Value | |
MFS Institutional Money
Market Portfolio | | | $— | | | | $— | | | | $432,159 | | | | $382,071,026 | |
(8) Redemptions In-Kind
On September 13, 2011, the fund recorded redemption proceeds for a distribution in-kind of portfolio securities that were valued at $14,673,898. The redeeming shareholder generally receives a pro rata share of the securities held by the fund. The distribution of such securities generated a realized gain of $4,770,592 for the fund.
On January 26, 2012, the fund recorded redemption proceeds for a distribution in-kind of portfolio securities that were valued at $180,389,213. The redeeming shareholder generally receives a pro rata share of the securities held by the fund. The distribution of such securities generated a realized gain of $37,005,555 for the fund.
43
Notes to Financial Statements – continued
On April 30, 2012, the fund recorded redemption proceeds for a distribution in-kind of portfolio securities that were valued at $15,721,682. The redeeming shareholder generally receives a pro rata share of the securities held by the fund. The distribution of such securities generated a realized gain of $6,044,203 for the fund.
44
REPORT OF INDEPENDENT REGISTERED PUBLIC ACCOUNTING FIRM
To the Board of Trustees of MFS Series Trust I and Shareholders of MFS Value Fund:
We have audited the accompanying statement of assets and liabilities of MFS Value Fund (the Fund) (one of the portfolios comprising MFS Series Trust I), including the portfolio of investments, as of August 31, 2013, and the related statement of operations for the year then ended, the statements of changes in net assets for each of the two years in the period then ended, and the financial highlights for each of the five years in the period then ended. These financial statements and financial highlights are the responsibility of the Fund’s management. Our responsibility is to express an opinion on these financial statements and financial highlights based on our audits.
We conducted our audits in accordance with the standards of the Public Company Accounting Oversight Board (United States). Those standards require that we plan and perform the audit to obtain reasonable assurance about whether the financial statements and financial highlights are free of material misstatement. We were not engaged to perform an audit of the Fund’s internal control over financial reporting. Our audits included consideration of internal control over financial reporting as a basis for designing audit procedures that are appropriate in the circumstances, but not for the purpose of expressing an opinion on the effectiveness of the Fund’s internal control over financial reporting. Accordingly, we express no such opinion. An audit also includes examining, on a test basis, evidence supporting the amounts and disclosures in the financial statements and financial highlights, assessing the accounting principles used and significant estimates made by management, and evaluating the overall financial statement presentation. Our procedures included confirmation of securities owned as of August 31, 2013, by correspondence with the custodian and others. We believe that our audits provide a reasonable basis for our opinion.
In our opinion, the financial statements and financial highlights referred to above present fairly, in all material respects, the financial position of MFS Value Fund at August 31, 2013, the results of its operations for the year then ended, the changes in its net assets for each of the two years in the period then ended, and its financial highlights for each of the five years in the period then ended, in conformity with U.S. generally accepted accounting principles.

Boston, Massachusetts
October 17, 2013
45
TRUSTEES AND OFFICERS — IDENTIFICATION AND BACKGROUND
The Trustees and Officers of the Trust, as of October 1, 2013, are listed below, together with their principal occupations during the past five years. (Their titles may have varied during that period.) The address of each Trustee and officer is 111 Huntington Avenue, Boston, Massachusetts 02199-7618.
| | | | | | | | |
Name, Age | | Position(s) Held with Fund | | Trustee/Officer
Since (h) | | Principal
Occupations During the Past Five Years | | Other Directorships (j) |
| INTERESTED TRUSTEES |
Robert J. Manning (k) (age 49) | | Trustee | | February 2004 | | Massachusetts Financial Services Company, Chairman, Chief Executive Officer and Director; President (until 2009); Chief Investment Officer (until 2010) | | N/A |
| INDEPENDENT TRUSTEES |
David H. Gunning (age 71) | | Trustee and Chair of Trustees | | January 2004 | | Private investor | | Lincoln Electric Holdings, Inc. (welding equipment manufacturer), Director; Development Alternatives, Inc. (consulting), Director/Non-Executive Chairman; Portman Limited (mining), Director (until 2008) |
Robert E. Butler (age 71) | | Trustee | | January 2006 | | Consultant – investment company industry regulatory and compliance matters | | N/A |
Maureen R. Goldfarb (age 58) | | Trustee | | January 2009 | | Private investor | | N/A |
William R. Gutow (age 72) | | Trustee | | December 1993 | | Private investor and real estate consultant; Capitol Entertainment Management Company (video franchise), Vice Chairman | | Texas Donuts (donut franchise), Vice Chairman (until 2010) |
46
Trustees and Officers – continued
| | | | | | | | |
Name, Age | | Position(s) Held with Fund | | Trustee/Officer
Since (h) | | Principal
Occupations During the Past Five Years | | Other Directorships (j) |
Michael Hegarty (age 68) | | Trustee | | December 2004 | | Private investor | | Brookfield Office Properties, Inc. (real estate), Director; Rouse Properties Inc. (real estate), Director; Capmark Financial Group Inc. (real estate), Director |
John P. Kavanaugh (age 58) | | Trustee | | January 2009 | | Private investor | | N/A |
J. Dale Sherratt (age 75) | | Trustee | | June 1989 | | Insight Resources, Inc. (acquisition planning specialists), President; Wellfleet Investments (investor in health care companies), Managing General Partner | | N/A |
Laurie J. Thomsen (age 56) | | Trustee | | March 2005 | | Private investor; New Profit, Inc. (venture philanthropy), Executive Partner (until 2010) | | The Travelers Companies (insurance), Director |
Robert W. Uek (age 72) | | Trustee | | January 2006 | | Consultant to investment company industry | | N/A |
| OFFICERS |
John M. Corcoran (k) (age 48) | | President | | October 2008 | | Massachusetts Financial Services Company, Senior Vice President (since October 2008); State Street Bank and Trust (financial services provider), Senior Vice President, (until 2008) | | N/A |
Christopher R. Bohane (k) (age 39) | | Assistant Secretary and Assistant Clerk | | July 2005 | | Massachusetts Financial Services Company, Vice President and Assistant General Counsel | | N/A |
Kino Clark (k) (age 45) | | Assistant Treasurer | | January 2012 | | Massachusetts Financial Services Company, Vice President | | N/A |
47
Trustees and Officers – continued
| | | | | | | | |
Name, Age | | Position(s) Held with Fund | | Trustee/Officer
Since (h) | | Principal
Occupations During the Past Five Years | | Other Directorships (j) |
Thomas H. Connors (k) (age 54) | | Assistant Secretary and Assistant Clerk | | September 2012 | | Massachusetts Financial Services Company, Vice President and Senior Counsel; Deutsche Investment Management Americas Inc. (financial service provider), Director and Senior Counsel (until 2012) | | N/A |
Ethan D. Corey (k) (age 49) | | Assistant Secretary and Assistant Clerk | | July 2005 | | Massachusetts Financial Services Company, Senior Vice President and Associate General Counsel | | N/A |
David L. DiLorenzo (k)
(age 45) | | Treasurer | | July 2005 | | Massachusetts Financial Services Company, Senior Vice President | | N/A |
Robyn L. Griffin (age 38) | | Assistant Independent Chief Compliance Officer | | August 2008 | | Griffin Compliance LLC (provider of compliance services), Principal (since August 2008); State Street Corporation (financial services provider), Mutual Fund Administration Assistant Vice President (until 2008) | | N/A |
Brian E. Langenfeld (k) (age 40) | | Assistant Secretary and Assistant Clerk | | June 2006 | | Massachusetts Financial Services Company, Vice President and Senior Counsel | | N/A |
Susan S. Newton (k) (age 63) | | Assistant Secretary and Assistant Clerk | | May 2005 | | Massachusetts Financial Services Company, Senior Vice President and Associate General Counsel | | N/A |
Susan A. Pereira (k) (age 42) | | Assistant Secretary and Assistant Clerk | | July 2005 | | Massachusetts Financial Services Company, Vice President and Senior Counsel | | N/A |
48
Trustees and Officers – continued
| | | | | | | | |
Name, Age | | Position(s) Held with Fund | | Trustee/Officer
Since (h) | | Principal
Occupations During the Past Five Years | | Other Directorships (j) |
Kasey L. Phillips (k) (age 42) | | Assistant Treasurer | | September 2012 | | Massachusetts Financial Services Company, Vice President; Wells Fargo Funds Management, LLC, Senior Vice President, Fund Treasurer (until 2012) | | N/A |
Mark N. Polebaum (k) (age 61) | | Secretary and Clerk | | January 2006 | | Massachusetts Financial Services Company, Executive Vice President, General Counsel and Secretary | | N/A |
Frank L. Tarantino (age 69) | | Independent Chief Compliance Officer | | June 2004 | | Tarantino LLC (provider of compliance services), Principal | | N/A |
Richard S. Weitzel (k) (age 43) | | Assistant Secretary and Assistant Clerk | | October 2007 | | Massachusetts Financial Services Company, Senior Vice President and Associate General Counsel | | N/A |
James O. Yost (k) (age 53) | | Deputy Treasurer | | September 1990 | | Massachusetts Financial Services Company, Senior Vice President | | N/A |
| (h) | Date first appointed to serve as Trustee/officer of an MFS Fund. Each Trustee has served continuously since appointment unless indicated otherwise. For the period from December 15, 2004 until February 22, 2005, Mr. Manning served as Advisory Trustee. For the period October 2008, until January 2012, Mr. Corcoran served as Treasurer of the Funds. Prior to January 2012, Messrs. DiLorenzo and Yost served as Assistant Treasurers of the Funds. |
| (j) | Directorships or trusteeships of companies required to report to the Securities and Exchange Commission (i.e., “public companies”). |
| (k) | “Interested person” of the Trust within the meaning of the Investment Company Act of 1940 (referred to as the 1940 Act), which is the principal federal law governing investment companies like the fund, as a result of position with MFS. The address of MFS is 111 Huntington Avenue, Boston, Massachusetts 02199-7618. |
Each Trustee has been elected by shareholders and each Trustee and officer holds office until his or her successor is chosen and qualified or until his or her earlier death, resignation, retirement or removal. The Trust does not hold annual meetings for the purpose of electing Trustees, and Trustees are not elected for fixed terms. Messrs. Butler, Kavanaugh, Uek and Ms. Thomsen are members of the Trust’s Audit Committee.
Each of the Fund’s Trustees and officers holds comparable positions with certain other funds of which MFS or a subsidiary is the investment adviser or distributor, and, in the case of the officers, with certain affiliates of MFS. As of January 1, 2013, the Trustees served as board members of 143 funds within the MFS Family of Funds.
49
Trustees and Officers – continued
The Statement of Additional Information for the Fund includes further information about the Trustees and is available without charge upon request by calling 1-800-225-2606.
| | |
| Investment Adviser | | Custodian |
Massachusetts Financial Services Company
111 Huntington Avenue
Boston, MA 02199-7618 | | State Street Bank and Trust Company 1 Lincoln Street Boston, MA 02111-2900 |
| Distributor | | Independent Registered Public Accounting Firm |
MFS Fund Distributors, Inc.
111 Huntington Avenue
Boston, MA 02199-7618 | | Ernst & Young LLP 200 Clarendon Street
Boston, MA 02116 |
| Portfolio Managers | | |
| Nevin Chitkara | | |
| Steven Gorham | | |
50
BOARD REVIEW OF INVESTMENT ADVISORY AGREEMENT
The Investment Company Act of 1940 requires that both the full Board of Trustees and a majority of the non-interested (“independent”) Trustees, voting separately, annually approve the continuation of the Fund’s investment advisory agreement with MFS. The Trustees consider matters bearing on the Fund and its advisory arrangements at their meetings throughout the year, including a review of performance data at each regular meeting. In addition, the independent Trustees met several times over the course of three months beginning in May and ending in July, 2013 (“contract review meetings”) for the specific purpose of considering whether to approve the continuation of the investment advisory agreement for the Fund and the other investment companies that the Board oversees (the “MFS Funds”). The independent Trustees were assisted in their evaluation of the Fund’s investment advisory agreement by independent legal counsel, from whom they received separate legal advice and with whom they met separately from MFS during various contract review meetings. The independent Trustees were also assisted in this process by the MFS Funds’ Independent Chief Compliance Officer, a full-time senior officer appointed by and reporting to the independent Trustees.
In connection with their deliberations regarding the continuation of the investment advisory agreement, the Trustees, including the independent Trustees, considered such information and factors as they believed, in light of the legal advice furnished to them and their own business judgment, to be relevant. The investment advisory agreement for the Fund was considered separately, although the Trustees also took into account the common interests of all MFS Funds in their review. As described below, the Trustees considered the nature, quality, and extent of the various investment advisory, administrative, and shareholder services performed by MFS under the existing investment advisory agreement and other arrangements with the Fund.
In connection with their contract review meetings, the Trustees received and relied upon materials that included, among other items: (i) information provided by Lipper Inc., an independent third party, on the investment performance of the Fund for various time periods ended December 31, 2012 and the investment performance of a group of funds with substantially similar investment classifications/objectives (the “Lipper performance universe”), (ii) information provided by Lipper Inc. on the Fund’s advisory fees and other expenses and the advisory fees and other expenses of comparable funds identified by Lipper Inc. (the “Lipper expense group”), (iii) information provided by MFS on the advisory fees of comparable portfolios of other clients of MFS, including institutional separate accounts and other clients, (iv) information as to whether and to what extent applicable expense waivers, reimbursements or fee “breakpoints” are observed for the Fund, (v) information regarding MFS’ financial results and financial condition, including MFS’ and certain of its affiliates’ estimated profitability from services performed for the Fund and the MFS Funds as a whole, and compared to MFS’ institutional business, (vi) MFS’ views regarding the outlook for the mutual fund industry and the strategic business plans of MFS, (vii) descriptions of various functions performed by MFS for the Funds, such as compliance monitoring and portfolio trading practices, and (viii) information regarding the overall organization of MFS, including information about MFS’ senior management and other personnel providing investment advisory, administrative and other services to
51
Board Review of Investment Advisory Agreement – continued
the Fund and the other MFS Funds. The comparative performance, fee and expense information prepared and provided by Lipper Inc. was not independently verified and the independent Trustees did not independently verify any information provided to them by MFS.
The Trustees’ conclusion as to the continuation of the investment advisory agreement was based on a comprehensive consideration of all information provided to the Trustees and not the result of any single factor. Some of the factors that figured particularly in the Trustees’ deliberations are described below, although individual Trustees may have evaluated the information presented differently from one another, giving different weights to various factors. It is also important to recognize that the fee arrangements for the Fund and other MFS Funds are the result of years of review and discussion between the independent Trustees and MFS, that certain aspects of such arrangements may receive greater scrutiny in some years than in others, and that the Trustees’ conclusions may be based, in part, on their consideration of these same arrangements during the course of the year and in prior years.
Based on information provided by Lipper Inc. and MFS, the Trustees reviewed the Fund’s total return investment performance as well as the performance of peer groups of funds over various time periods. The Trustees placed particular emphasis on the total return performance of the Fund’s Class A shares in comparison to the performance of funds in its Lipper performance universe over the three-year period ended December 31, 2012, which the Trustees believed was a long enough period to reflect differing market conditions. The total return performance of the Fund’s Class A shares was in the 3rd quintile relative to the other funds in the universe for this three-year period (the 1st quintile being the best performers and the 5th quintile being the worst performers). The total return performance of the Fund’s Class A shares was in the 2nd quintile for the one-year period and the 3rd quintile for the five-year period ended December 31, 2012 relative to the Lipper performance universe. Because of the passage of time, these performance results may differ from the performance results for more recent periods, including those shown elsewhere in this report.
In addition to considering the performance information provided in connection with the contract review meetings, the Trustees noted that, in light of the Fund’s substandard relative performance at the time of their contract review meetings in 2012, they had met at each of their regular meetings since then with MFS’ senior investment management personnel to discuss the Fund’s performance and MFS’ efforts to improve the Fund’s performance. The Trustees further noted that the Fund’s three-year performance as compared to its benchmark improved for the period ended December 31, 2012, as compared to the prior year. Taking this information into account, the Trustees concluded, within the context of their overall conclusions regarding the investment advisory agreement, that they were satisfied with MFS’ responses and efforts relating to investment performance.
In assessing the reasonableness of the Fund’s advisory fee, the Trustees considered, among other information, the Fund’s advisory fee and the total expense ratio of the Fund’s Class A shares as a percentage of average daily net assets and the advisory fee and total expense ratios of peer groups of funds based on information provided by Lipper Inc. The Trustees considered that, according to the Lipper data (which takes into account any fee reductions or expense limitations that were in effect during the Fund’s
52
Board Review of Investment Advisory Agreement – continued
last fiscal year), the Fund’s effective advisory fee rate was approximately at the Lipper expense group median, and the Fund’s total expense ratio was lower than the Lipper expense group median.
The Trustees also considered the advisory fees charged by MFS to any comparable institutional accounts. In comparing these fees, the Trustees considered information provided by MFS as to the generally broader scope of services provided by MFS to the Fund in comparison to institutional accounts, the higher demands placed on MFS’ investment personnel and trading infrastructure as a result of the daily cash in-flows and out-flows of the Fund, and the impact on MFS and expenses associated with the more extensive regulatory regime to which the Fund is subject in comparison to institutional accounts.
The Trustees also considered whether the Fund may benefit from any economies of scale in the management of the Fund in the event of growth in assets of the Fund and/or growth in assets of the MFS Funds as a whole. They noted that the Fund’s advisory fee rate schedule is subject to contractual breakpoints that reduce the Fund’s advisory fee rate on average daily net assets over $7.5 billion and $10 billion, and that MFS has agreed in writing to reduce its advisory fee on the Fund’s average daily net assets over $20 billion, which may not be changed without the Trustees’ approval. The Trustees also noted that MFS has agreed in writing to waive a portion of the management fees of certain MFS Funds, including the Fund, if the total combined assets of certain funds within the MFS Funds’ complex increase above agreed upon thresholds (the “group fee waiver”), enabling the Fund’s shareholders to share in the benefits from any economies of scale at the complex level. The group fee waiver is reviewed and renewed annually between the Board and MFS. The Trustees concluded that the existing breakpoints and the group fee waiver were sufficient to allow the Fund to benefit from economies of scale as its assets and overall complex assets grow.
The Trustees also considered information prepared by MFS relating to MFS’ costs and profits with respect to the Fund, the MFS Funds considered as a group, and other investment companies and accounts advised by MFS, as well as MFS’ methodologies used to determine and allocate its costs to the MFS Funds, the Fund and other accounts and products for purposes of estimating profitability.
After reviewing these and other factors described herein, the Trustees concluded, within the context of their overall conclusions regarding the investment advisory agreement, that the advisory fees charged to the Fund represent reasonable compensation in light of the services being provided by MFS to the Fund.
In addition, the Trustees considered MFS’ resources and related efforts to continue to retain, attract and motivate capable personnel to serve the Fund. The Trustees also considered current and developing conditions in the financial services industry, including the presence of large and well-capitalized companies which are spending, and appear to be prepared to continue to spend, substantial sums to engage personnel and to provide services to competing investment companies. In this regard, the Trustees also considered the financial resources of MFS and its ultimate parent, Sun Life Financial Inc. The Trustees also considered the advantages and possible disadvantages to the Fund of having an adviser that also serves other investment companies as well as other accounts.
53
Board Review of Investment Advisory Agreement – continued
The Trustees also considered the nature, quality, cost, and extent of administrative, transfer agency, and distribution services provided to the Fund by MFS and its affiliates under agreements and plans other than the investment advisory agreement, including any 12b-1 fees the Fund pays to MFS Fund Distributors, Inc., an affiliate of MFS. The Trustees also considered the nature, extent and quality of certain other services MFS performs or arranges for on the Fund’s behalf, which may include securities lending programs, directed expense payment programs, class action recovery programs, and MFS’ interaction with third-party service providers, principally custodians and sub-custodians. The Trustees concluded that the various non-advisory services provided by MFS and its affiliates on behalf of the Fund were satisfactory.
The Trustees also considered benefits to MFS from the use of the Fund’s portfolio brokerage commissions, if applicable, to pay for investment research and various other factors. Additionally, the Trustees considered so-called “fall-out benefits” to MFS such as reputational value derived from serving as investment manager to the Fund.
Based on their evaluation of factors that they deemed to be material, including those factors described above, the Board of Trustees, including the independent Trustees, concluded that the Fund’s investment advisory agreement with MFS should be continued for an additional one-year period, commencing August 1, 2013.
A discussion regarding the Board’s most recent review and renewal of the fund’s Investment Advisory Agreement with MFS is available by clicking on the fund’s name under “Mutual Funds” in the “Products” section of the MFS Web site (mfs.com).
54
PROXY VOTING POLICIES AND INFORMATION
A general description of the MFS funds’ proxy voting policies and procedures is available without charge, upon request, by calling 1-800-225-2606, by visiting the Proxy Voting section of mfs.com or by visiting the SEC’s Web site at http://www.sec.gov.
Information regarding how the fund voted proxies relating to portfolio securities during the most recent twelve-month period ended June 30 is available without charge by visiting the Proxy Voting section of mfs.com or by visiting the SEC’s Web site at http://www.sec.gov.
QUARTERLY PORTFOLIO DISCLOSURE
The fund will file a complete schedule of portfolio holdings with the Securities and Exchange Commission (the Commission) for the first and third quarters of each fiscal year on Form N-Q. A shareholder can obtain the quarterly portfolio holdings report at mfs.com. The fund’s Form N-Q is also available on the EDGAR database on the Commission’s Internet Web site at http://www.sec.gov, and may be reviewed and copied at the:
Public Reference Room
Securities and Exchange Commission
100 F Street, NE, Room 1580
Washington, D.C. 20549
Information on the operation of the Public Reference Room may be obtained by calling the Commission at 1-800-SEC-0330. Copies of the fund’s Form N-Q also may be obtained, upon payment of a duplicating fee, by electronic request at the following e-mail address: publicinfo@sec.gov or by writing the Public Reference Section at the above address.
FURTHER INFORMATION
From time to time, MFS may post important information about the fund or the MFS funds on the MFS web site (mfs.com). This information is available by visiting the “News & Commentary” section of mfs.com or by clicking on the fund’s name under “Mutual Funds” in the “Products” section of mfs.com.
FEDERAL TAX INFORMATION (unaudited)
The fund will notify shareholders of amounts for use in preparing 2013 income tax forms in January 2014. The following information is provided pursuant to provisions of the Internal Revenue Code.
The fund designates the maximum amount allowable as qualified dividend income eligible for the 15% tax rate.
The fund designates $182,693,000 as capital gain dividends paid during the fiscal year.
For corporate shareholders, 98.83% of the ordinary income dividends paid during the fiscal year qualify for the corporate dividends received deduction.
55
rev. 3/11
| | | | |
| | | |
FACTS | | WHAT DOES MFS DO WITH YOUR PERSONAL INFORMATION? | |  |
| | |
| Why? | | Financial companies choose how they share your personal information. Federal law gives consumers the right to limit some but not all sharing. Federal law also requires us to tell you how we collect, share, and protect your personal information. Please read this notice carefully to understand what we do. |
| | |
| What? | | The types of personal information we collect and share depend on the product or service you have with us. This information can include: • Social Security number and account balances • Account transactions and transaction history • Checking account information and wire transfer instructions When you are no longer our customer, we continue to share your information as described in this notice. |
| | |
| How? | | All financial companies need to share customers’ personal information to run their everyday business. In the section below, we list the reasons financial companies can share their customers’ personal information; the reasons MFS chooses to share; and whether you can limit this sharing. |
| | | | |
Reasons we can share your
personal information | | Does MFS
share? | | Can you limit
this sharing? |
For our everyday business purposes – such as to process your transactions, maintain your account(s), respond to court orders and legal investigations, or report to credit bureaus | | Yes | | No |
For our marketing purposes – to offer our products and services to you | | No | | We don’t share |
| For joint marketing with other financial companies | | No | | We don’t share |
For our affiliates’ everyday business purposes – information about your transactions and experiences | | No | | We don’t share |
For our affiliates’ everyday business purposes – information about your creditworthiness | | No | | We don’t share |
| For nonaffiliates to market to you | | No | | We don’t share |
| | |
| Questions? | | Call 800-225-2606 or go to mfs.com. |
56
| | |
| Who we are |
| Who is providing this notice? | | MFS Funds, MFS Investment Management, MFS Institutional Advisors, Inc., MFS Fund Distributors, Inc., MFS Heritage Trust Company, and MFS Service Center, Inc. |
| | |
| What we do |
| How does MFS protect my personal information? | | To protect your personal information from unauthorized access and use, we use security measures that comply with federal law. These measures include procedural, electronic, and physical safeguards for the protection of the personal information we collect about you. |
| How does MFS collect my personal information? | | We collect your personal information, for example, when you •open an account or provide account information •direct us to buy securities or direct us to sell your securities •make a wire transfer We also collect your personal information from others, such as credit bureaus, affiliates and other companies. |
| Why can’t I limit all sharing? | | Federal law gives you the right to limit only •sharing for affiliates’ everyday business purposes – information about your creditworthiness •affiliates from using your information to market to you •sharing for nonaffiliates to market to you State laws and individual companies may give you additional rights to limit sharing. |
| | |
| Definitions |
| Affiliates | | Companies related by common ownership or control. They can be financial and nonfinancial companies. •MFS does not share personal information with affiliates, except for everyday business purposes as described on page one of this notice. |
| Nonaffiliates | | Companies not related by common ownership or control. They can be financial and nonfinancial companies. •MFS does not share with nonaffiliates so they can market to you. |
| Joint Marketing | | A formal agreement between nonaffiliated financial companies that together market financial products or services to you. •MFS doesn’t jointly market. |
| | |
| Other important information |
| If you own an MFS product or receive an MFS service in the name of a third party such as a bank or broker-dealer, their privacy policy may apply to you instead of ours. |
57
Save paper with eDelivery.

| MFS® will send you prospectuses, |
reports, and proxies directly via e-mail so you will get information faster with less mailbox clutter.
To sign up:
1. Go to mfs.com.
2. Log in via MFS® Access.
3. Select eDelivery.
If you own your MFS fund shares through a financial institution or a retirement plan, MFS® TALK, MFS® Access, or eDelivery may not be available to you.
CONTACT
WEB SITE
mfs.com
MFS TALK
1-800-637-8255
24 hours a day
ACCOUNT SERVICE AND LITERATURE
Shareholders
1-800-225-2606
Financial advisors
1-800-343-2829
Retirement plan services
1-800-637-1255
MAILING ADDRESS
MFS Service Center, Inc.
P.O. Box 55824
Boston, MA 02205-5824
OVERNIGHT MAIL
MFS Service Center, Inc.
c/o Boston Financial Data Services
30 Dan Road
Canton, MA 02021-2809
ANNUAL REPORT
August 31, 2013

MFS® GLOBAL LEADERS FUND

GLD-ANN
MFS® GLOBAL LEADERS FUND
CONTENTS
The report is prepared for the general information of shareholders.
It is authorized for distribution to prospective investors only when preceded or accompanied by a current prospectus.
NOT FDIC INSURED Ÿ MAY LOSE VALUE Ÿ NO BANK GUARANTEE

LETTER FROM THE CHAIRMAN AND CEO
Dear Shareholders:
Global economic trends appear to favor growth again despite risks created by the U.S. government’s gridlock. The U.S. economy’s slow but steady expansion is no longer the
exception. The eurozone has emerged from its 18-month-long recession, with Germany leading the way. China’s monthly gauges of economic activity once again point toward expansion. And Japan is picking up momentum in response to its government’s and central bank’s aggressive program of monetary easing.
However, geopolitical risks have risen, with violence erupting in Egypt and Syria and the possibility of further unrest in the Middle East. The U.S. Federal Reserve’s expected tapering of its bond-buying stimulus program has weighed on global markets
since May. Emerging markets, including Brazil and India, have borne much of the brunt, as their currency values have dropped and nervous investors have fled to safety elsewhere. In Europe, unemployment persists at historically high levels. The trend towards a pickup in global growth, while encouraging, appears tenuous, particularly with the risk of a U.S. debt default.
As always, managing risk in the face of uncertainty remains a top priority for investors. At MFS®, our uniquely collaborative investment process employs integrated, global research and active risk management. Our global team of investment professionals shares ideas and evaluates opportunities across continents, investment disciplines and asset classes — all with a goal of building better insights, and ultimately better results, for our clients.
We are mindful of the many economic challenges investors face, and believe it is more important than ever to maintain a long-term view and employ time-tested principles, such as asset allocation and diversification. We remain confident that our unique approach can serve investors well as they work with their financial advisors to identify and pursue the most suitable opportunities.
Respectfully,

Robert J. Manning
Chairman and Chief Executive Officer
MFS Investment Management®
October 17, 2013
The opinions expressed in this letter are subject to change, may not be relied upon for investment advice, and no forecasts can be guaranteed.
1
PORTFOLIO COMPOSITION
Portfolio structure

| | | | |
| Top ten holdings | | | | |
| Nestle S.A. | | | 3.3% | |
| Groupe Danone | | | 3.2% | |
| Japan Tobacco, Inc. | | | 3.0% | |
| NIKE, Inc., “B” | | | 3.0% | |
| Pernod Ricard S.A. | | | 2.9% | |
| Walt Disney Co. | | | 2.9% | |
| SAP AG | | | 2.9% | |
| Danaher Corp. | | | 2.9% | |
| Twenty-First Century Fox, Inc. | | | 2.9% | |
| Kering S.A. | | | 2.9% | |
| |
| Equity sectors | | | | |
Consumer Staples | | | 37.5% | |
Retailing | | | 24.1% | |
Leisure | | | 17.0% | |
| Industrial Goods & Services | | | 5.5% | |
Financial Services | | | 4.9% | |
Technology | | | 2.9% | |
| Basic Materials | | | 2.7% | |
Special Products & Services | | | 1.7% | |
| | | | |
| Issuer country weightings (x) | |
| United States | | | 36.0% | |
| France | | | 17.0% | |
| United Kingdom | | | 11.7% | |
| Switzerland | | | 7.9% | |
| Japan | | | 5.3% | |
| China | | | 3.6% | |
| Netherlands | | | 3.6% | |
| Germany | | | 2.9% | |
| Italy | | | 2.5% | |
| Other Countries | | | 9.5% | |
|
| Currency exposure weightings (y) | |
| United States Dollar | | | 36.0% | |
| Euro | | | 29.3% | |
| British Pound Sterling | | | 11.7% | |
| Swiss Franc | | | 7.9% | |
| Hong Kong Dollar | | | 5.6% | |
| Japanese Yen | | | 5.3% | |
| Brazilian Real | | | 2.4% | |
| Swedish Krona | | | 1.8% | |
| (x) | Represents the portfolio’s exposure to issuer countries as a percentage of a portfolio’s net assets. |
| (y) | Represents the portfolio’s exposure to a particular currency as a percentage of a portfolio’s net assets. |
Percentages are based on net assets as of 8/31/13.
The portfolio is actively managed and current holdings may be different.
2
MANAGEMENT REVIEW
Summary of Results
For the twelve months ended August 31, 2013, Class A shares of the MFS Global Leaders Fund (“fund”) provided a total return of 16.39%, at net asset value. This compares with a return of 16.11% for the fund’s benchmark, the MSCI All Country World Index.
Market Environment
At the beginning of the period, markets were suffering a bout of risk aversion due to broadly weaker global macroeconomic indicators, as well as renewed concerns over the eurozone’s capacity and determination to address its ongoing crisis. However, a few months into the period, this renewed weakness in the fundamentals precipitated yet a further round of monetary easing by both the US Federal Reserve (through a third round of quantitative easing) and the European Central Bank (ECB) (through a new bond purchase facility), which soon instilled additional confidence in risk markets.
Nonetheless, towards the end of the calendar year, weaker equity earnings reports and declining forward guidance caused market sentiment to soften again. In addition, year-end fiscal cliff negotiations between the Republicans in the US Congress and President Obama were a particular source of market attention, where uncertainty surrounding the fiscal negotiations continued right up to the end-of-year deadline. A last minute political agreement averted the worst-case scenario and markets gravitated towards risk assets again, though the implementation of the US budget sequester, combined with the uncertainty surrounding the Italian election results, inserted a continued degree of caution as we entered the second half of the period.
During the first few months of 2013, market sentiment improved markedly, as global macroeconomic indicators improved and fears of fiscal austerity in the US waned. Later in the period, however, global growth dynamics looked to be weakening again, though markets were generally unfazed, continuing their risk-on path, especially in light of continued easing by global central banks and the Bank of Japan in particular. Later in the period, the growing risk that the Fed would begin tapering its quantitative easing program caused sovereign bond yields to spike, credit spreads to widen and equity valuation to fall.
Contributors to Performance
The combination of an underweight position and stock selection in the basic materials sector was a primary factor that contributed to performance relative to the MSCI All Country World Index. There were no individual stocks within this sector that were among the fund’s top relative contributors.
Stock selection in the retailing sector also benefited relative performance. Here, overweight positions in luxury goods company Richemont (Switzerland), and athletic shoes and apparel manufacturer NIKE (United States) boosted relative returns. Shares of Richemont rose as the company released results that highlighted strong growth and higher-than-expected net income. The sales growth was driven by a combination of an acceleration in the European region, double-digit growth in the Americas and a rebound in the Japanese market. Holdings of Italian leather goods manufacturer Tod’s (b) and the timing of the fund’s overweight position in luxury goods retailer
3
Management Review – continued
Burberry Group (United Kingdom) also strengthened relative results. Shares of Tod’s rose as investors appeared to have rewarded the firm’s pursuit of new growth opportunities in its leather goods business and its focus on the growing luxury shoes business in particular.
The fund’s avoidance of the energy sector was a positive factor for relative performance as the sector significantly underperformed the benchmark during the reporting period. There were no individual stocks within this sector that were among the fund’s top relative contributors.
Elsewhere, overweight positions in French advertising and marketing services provider Publicis Groupe, Swiss wealth management firm Julius Baer, global payments technology company Visa (United States) and Dutch brewer Heineken aided relative returns. Publicis Groupe announced results that beat consensus estimates because of stronger margins, improved performance in healthcare and no longer having a drag from the loss of the GM account. Several acquisitions aimed at enhancing capabilities in digital and mobile advertising further supported results. The timing of the fund’s overweight position in media and entertainment company Twenty-First Century Fox (United States) and holdings of broadcasting conglomerate Nippon Television (b) (Japan) also helped relative results.
During the reporting period, the fund’s relative currency exposure, resulting primarily from differences between the portfolio’s and the benchmark’s exposures to holdings of securities denominated in foreign currencies, was another contributor to relative performance. All of MFS’ investment decisions are driven by the fundamentals of each individual opportunity and as such, it is common for our portfolios to have different currency exposure than the benchmark.
Detractors from Performance
Avoiding both the strong-performing health care and autos & housing sectors detracted from relative results. There were no individual stocks in either sector that were among the fund’s top relative detractors.
An underweight position in the financial services sector also hurt relative performance. Here, not holding shares of strong-performing US-based financial services firm Bank of America (h) held back relative returns.
Elsewhere, overweight positions in instant food manufacturer Tingyi Holding (China), global sourcing and supply chain management company Li & Fung (Hong Kong), retail giant Target (United States), tobacco product manufacturer Imperial Tobacco (United Kingdom) and global food company Nestle (Switzerland) detracted from relative results. Li & Fung announced poor earnings at the beginning of 2013 because of decreased operating income driven by a slower-than-expected recovery at its US-based business unit. The fund’s overweight positions in convenience store chain Lawson (h) (Japan), apparel retailer Urban Outfitters (h) (United States) and enterprise applications company SAP (Germany) also hurt relative performance.
The fund’s cash and/or cash equivalents position was also a detractor from relative results. The fund strives to be fully invested and only holds cash to buy new holdings and to provide liquidity. In a period when equity markets rose, as measured by the fund’s benchmark, holding cash hurt performance versus the benchmark, which has no cash position.
4
Management Review – continued
Respectfully,
| | |
| Matthew Barrett | | Maile Clark |
| Portfolio Manager | | Portfolio Manager |
| (b) | Security is not a benchmark constituent. |
| (h) | Security was not held in the portfolio at period end. |
The views expressed in this report are those of the portfolio managers only through the end of the period of the report as stated on the cover and do not necessarily reflect the views of MFS or any other person in the MFS organization. These views are subject to change at any time based on market or other conditions, and MFS disclaims any responsibility to update such views. These views may not be relied upon as investment advice or an indication of trading intent on behalf of any MFS portfolio. References to specific securities are not recommendations of such securities, and may not be representative of any MFS portfolio’s current or future investments.
5
PERFORMANCE SUMMARY THROUGH 8/31/13
The following chart illustrates a representative class of the fund’s historical performance in comparison to its benchmark(s). Performance results include the deduction of the maximum applicable sales charge and reflect the percentage change in net asset value, including reinvestment of dividends and capital gains distributions. The performance of other share classes will be greater than or less than that of the class depicted below. Benchmarks are unmanaged and may not be invested in directly. Benchmark returns do not reflect sales charges, commissions or expenses. (See Notes to Performance Summary.)
Performance data shown represents past performance and is no guarantee of future results. Investment return and principal value fluctuate so your shares, when sold, may be worth more or less than the original cost; current performance may be lower or higher than quoted. The performance shown does not reflect the deduction of taxes, if any, that a shareholder would pay on fund distributions or the redemption of fund shares.
Growth of a Hypothetical $10,000 Investment (t)
6
Performance Summary – continued
Total Returns through 8/31/13
Average annual without sales charge
| | | | | | | | | | |
| | | Share class | | Class inception date | | 1-yr | | Life (t) | | |
| | | A | | 9/28/11 | | 16.39% | | 19.73% | | |
| | | B | | 9/28/11 | | 15.55% | | 18.83% | | |
| | | C | | 9/28/11 | | 15.57% | | 18.83% | | |
| | | I | | 9/28/11 | | 16.72% | | 20.01% | | |
| Comparative Benchmark | | | | | | |
| | | MSCI All Country World Index (f) | | 16.11% | | 15.94% | | |
| Average annual with sales charge | | | | | | |
| | | A
With Initial Sales Charge (5.75%) | | 9.69% | | 16.11% | | |
| | | B
With CDSC (Declining over six years
from 4% to 0%) (x) | | 11.55% | | 17.05% | | |
| | | C
With CDSC (1% for 12 months) (x) | | 14.57% | | 18.83% | | |
Class I shares do not have a sales charge.
CDSC – Contingent Deferred Sales Charge.
| (f) | Source: FactSet Research Systems Inc. |
| (t) | For the period from the class inception date through the stated period end. (See Notes to Performance Summary.) |
| (x) | Assuming redemption at the end of the applicable period. |
Benchmark Definition
MSCI All Country World Index – a market capitalization-weighted index that is designed to measure equity market performance in the global developed and emerging markets.
It is not possible to invest directly in an index.
Notes to Performance Summary
Average annual total return represents the average annual change in value for each share class for the periods presented. Life returns are presented where the share class has less than 10 years of performance history and represent the average annual total return from the class inception date to the stated period end date.
Performance results reflect any applicable expense subsidies and waivers in effect during the periods shown. Without such subsidies and waivers the fund’s performance results would be less favorable. Please see the prospectus and financial statements for complete details.
Performance results do not include adjustments made for financial reporting purposes in accordance with U.S. generally accepted accounting principles and may differ from amounts reported in the financial highlights.
From time to time the fund may receive proceeds from litigation settlements, without which performance would be lower.
7
EXPENSE TABLE
Fund expenses borne by the shareholders during the period,
March 1, 2013 through August 31, 2013
As a shareholder of the fund, you incur two types of costs: (1) transaction costs, including sales charges (loads) on certain purchase or redemption payments, and (2) ongoing costs, including management fees; distribution and service (12b-1) fees; and other fund expenses. This example is intended to help you understand your ongoing costs (in dollars) of investing in the fund and to compare these costs with the ongoing costs of investing in other mutual funds.
The example is based on an investment of $1,000 invested at the beginning of the period and held for the entire period March 1, 2013 through August 31, 2013.
Actual Expenses
The first line for each share class in the following table provides information about actual account values and actual expenses. You may use the information in this line, together with the amount you invested, to estimate the expenses that you paid over the period. Simply divide your account value by $1,000 (for example, an $8,600 account value divided by $1,000 = 8.6), then multiply the result by the number in the first line under the heading entitled “Expenses Paid During Period” to estimate the expenses you paid on your account during this period.
Hypothetical Example for Comparison Purposes
The second line for each share class in the following table provides information about hypothetical account values and hypothetical expenses based on the fund’s actual expense ratio and an assumed rate of return of 5% per year before expenses, which is not the fund’s actual return. The hypothetical account values and expenses may not be used to estimate the actual ending account balance or expenses you paid for the period. You may use this information to compare the ongoing costs of investing in the fund and other funds. To do so, compare this 5% hypothetical example with the 5% hypothetical examples that appear in the shareholder reports of the other funds.
Please note that the expenses shown in the table are meant to highlight your ongoing costs only and do not reflect any transactional costs, such as sales charges (loads). Therefore, the second line for each share class in the table is useful in comparing ongoing costs only, and will not help you determine the relative total costs of owning different funds. In addition, if these transactional costs were included, your costs would have been higher.
8
Expense Table – continued
| | | | | | | | | | | | | | | | | | |
Share Class | | | | Annualized Expense Ratio | | | Beginning Account Value
3/01/13 | | | Ending
Account Value
8/31/13 | | | Expenses Paid During Period (p) 3/01/13-8/31/13 | |
| A | | Actual | | | 1.45% | | | | $1,000.00 | | | | $1,046.51 | | | | $7.48 | |
| | Hypothetical (h) | | | 1.45% | | | | $1,000.00 | | | | $1,017.90 | | | | $7.38 | |
| B | | Actual | | | 2.21% | | | | $1,000.00 | | | | $1,043.05 | | | | $11.38 | |
| | Hypothetical (h) | | | 2.21% | | | | $1,000.00 | | | | $1,014.06 | | | | $11.22 | |
| C | | Actual | | | 2.21% | | | | $1,000.00 | | | | $1,043.05 | | | | $11.38 | |
| | Hypothetical (h) | | | 2.21% | | | | $1,000.00 | | | | $1,014.06 | | | | $11.22 | |
| I | | Actual | | | 1.21% | | | | $1,000.00 | | | | $1,047.90 | | | | $6.25 | |
| | Hypothetical (h) | | | 1.21% | | | | $1,000.00 | | | | $1,019.11 | | | | $6.16 | |
| (h) | 5% class return per year before expenses. |
| (p) | Expenses paid are equal to each class’s annualized expense ratio, as shown above, multiplied by the average account value over the period, multiplied by the number of days in the period, divided by the number of days in the year. Expenses paid do not include any applicable sales charges (loads). If these transaction costs had been included, your costs would have been higher. |
Notes to Expense Table
Each class with a Rule 12b-1 service fee is subject to a rebate of a portion of such fee. Such rebates are included in the expense ratios above and are outside of the expense limitation arrangement. For Class A shares, this rebate reduced the expense ratio above by 0.01%. See Note 3 in the Notes to Financial Statements for additional information.
Expense ratios include 0.01% of interest expense on overdrafts that are outside of the expense limitation arrangement (See Note 3 of the Notes to Financial Statements).
9
PORTFOLIO OF INVESTMENTS
8/31/13
The Portfolio of Investments is a complete list of all securities owned by your fund. It is categorized by broad-based asset classes.
| | | | | | | | |
| Common Stocks - 96.3% | | | | | | | | |
| Issuer | | Shares/Par | | | Value ($) | |
| Alcoholic Beverages - 12.9% | | | | | | | | |
| Anheuser-Busch InBev N.V. | | | 2,522 | | | $ | 234,591 | |
| Beam, Inc. | | | 1,630 | | | | 102,120 | |
| Diageo PLC | | | 9,852 | | | | 301,383 | |
| Heineken N.V. | | | 2,197 | | | | 150,845 | |
| Pernod Ricard S.A. | | | 2,685 | | | | 311,712 | |
| SABMiller PLC | | | 5,540 | | | | 263,913 | |
| | | | | | | | |
| | | | | | | $ | 1,364,564 | |
| Apparel Manufacturers - 18.4% | | | | | | | | |
| Burberry Group PLC | | | 9,389 | | | $ | 223,199 | |
| Compagnie Financiere Richemont S.A. | | | 2,093 | | | | 198,851 | |
| Guess?, Inc. | | | 4,510 | | | | 137,555 | |
| Kering S.A. | | | 1,342 | | | | 303,118 | |
| Li & Fung Ltd. | | | 146,000 | | | | 214,638 | |
| LVMH Moet Hennessy Louis Vuitton S.A. | | | 1,646 | | | | 288,354 | |
| NIKE, Inc., “B” | | | 5,096 | | | | 320,131 | |
| Tod’s S.p.A. | | | 1,512 | | | | 270,375 | |
| | | | | | | | |
| | | | | | | $ | 1,956,221 | |
| Broadcasting - 10.6% | | | | | | | | |
| Nippon Television Holdings, Inc. | | | 13,400 | | | $ | 234,719 | |
| Publicis Groupe S.A. | | | 3,755 | | | | 279,505 | |
| Twenty-First Century Fox, Inc. | | | 9,700 | | | | 303,901 | |
| Walt Disney Co. | | | 5,096 | | | | 309,990 | |
| | | | | | | | |
| | | | | | | $ | 1,128,115 | |
| Business Services - 1.7% | | | | | | | | |
| Accenture PLC, “A” | | | 2,440 | | | $ | 176,290 | |
| | |
| Chemicals - 2.7% | | | | | | | | |
| 3M Co. | | | 2,526 | | | $ | 286,903 | |
| | |
| Computer Software - 2.9% | | | | | | | | |
| SAP AG | | | 4,131 | | | $ | 305,363 | |
| | |
| Consumer Products - 4.3% | | | | | | | | |
| Procter & Gamble Co. | | | 3,728 | | | $ | 290,374 | |
| Reckitt Benckiser Group PLC | | | 2,486 | | | | 168,935 | |
| | | | | | | | |
| | | | | | | $ | 459,309 | |
10
Portfolio of Investments – continued
| | | | | | | | |
| Issuer | | Shares/Par | | | Value ($) | |
| Common Stocks - continued | | | | | | | | |
| Electrical Equipment - 5.5% | | | | | | | | |
| Danaher Corp. | | | 4,660 | | | $ | 305,323 | |
| Schneider Electric S.A. | | | 3,702 | | | | 283,290 | |
| | | | | | | | |
| | | | | | | $ | 588,613 | |
| Food & Beverages - 14.7% | | | | | | | | |
| Groupe Danone | | | 4,545 | | | $ | 338,429 | |
| M. Dias Branco S.A. Industria e Comercio de Alimentos | | | 6,600 | | | | 252,139 | |
| Nestle S.A. | | | 5,415 | | | | 355,297 | |
| Tingyi (Cayman Islands) Holding Corp. | | | 66,000 | | | | 162,999 | |
| Unilever N.V. | | | 6,083 | | | | 228,526 | |
| Want Want China Holdings Ltd. | | | 152,000 | | | | 224,508 | |
| | | | | | | | |
| | | | | | | $ | 1,561,898 | |
| Gaming & Lodging - 1.9% | | | | | | | | |
| InterContinental Hotels Group PLC | | | 7,173 | | | $ | 200,422 | |
| | |
| General Merchandise - 2.6% | | | | | | | | |
| Target Corp. | | | 4,443 | | | $ | 281,286 | |
| | |
| Other Banks & Diversified Financials - 4.9% | | | | | | | | |
| Julius Baer Group Ltd. | | | 6,473 | | | $ | 285,231 | |
| Visa, Inc., “A” | | | 1,347 | | | | 234,944 | |
| | | | | | | | |
| | | | | | | $ | 520,175 | |
| Restaurants - 4.5% | | | | | | | | |
| McDonald’s Corp. | | | 2,558 | | | $ | 241,373 | |
| YUM! Brands, Inc. | | | 3,320 | | | | 232,466 | |
| | | | | | | | |
| | | | | | | $ | 473,839 | |
| Specialty Stores - 3.1% | | | | | | | | |
| AutoZone, Inc. (a) | | | 491 | | | $ | 206,191 | |
| Industria de Diseno Textil S.A. | | | 903 | | | | 119,524 | |
| | | | | | | | |
| | | | | | | $ | 325,715 | |
| Tobacco - 5.6% | | | | | | | | |
| Imperial Tobacco Group PLC | | | 2,410 | | | $ | 79,625 | |
| Japan Tobacco, Inc. | | | 9,600 | | | | 323,584 | |
| Swedish Match AB | | | 5,429 | | | | 189,556 | |
| | | | | | | | |
| | | | | | | $ | 592,765 | |
| Total Common Stocks (Identified Cost, $9,086,356) | | | | | | $ | 10,221,478 | |
11
Portfolio of Investments – continued
| | | | | | | | |
| Money Market Funds - 4.4% | | | | | | | | |
| Issuer | | Shares/Par | | | Value ($) | |
MFS Institutional Money Market Portfolio, 0.09%,
at Cost and Net Asset Value (v) | | | 466,176 | | | $ | 466,176 | |
| Total Investments (Identified Cost, $9,552,532) | | | | | | $ | 10,687,654 | |
| | |
| Other Assets, Less Liabilities - (0.7)% | | | | | | | (75,483 | ) |
| Net Assets - 100.0% | | | | | | $ | 10,612,171 | |
| (a) | Non-income producing security. |
| (v) | Underlying affiliated fund that is available only to investment companies managed by MFS. The rate quoted for the MFS Institutional Money Market Portfolio is the annualized seven-day yield of the fund at period end. |
The following abbreviations are used in this report and are defined:
| PLC | | Public Limited Company |
See Notes to Financial Statements
12
Financial Statements
STATEMENT OF ASSETS AND LIABILITIES
At 8/31/13
This statement represents your fund’s balance sheet, which details the assets and liabilities comprising the total value of the fund.
| | | | |
| Assets | | | | |
Investments- | | | | |
Non-affiliated issuers, at value (identified cost, $9,086,356) | | | $10,221,478 | |
Underlying affiliated funds, at cost and value | | | 466,176 | |
Total investments, at value (identified cost, $9,552,532) | | | $10,687,654 | |
Foreign currency, at value (identified cost, $129,167) | | | 128,243 | |
Receivables for | | | | |
Fund shares sold | | | 31,533 | |
Interest and dividends | | | 34,156 | |
Receivable from investment adviser | | | 15,330 | |
Other assets | | | 60 | |
Total assets | | | $10,896,976 | |
| Liabilities | | | | |
Payables for investments purchased | | | $212,943 | |
Payable to affiliates | | | | |
Shareholder servicing costs | | | 3,051 | |
Distribution and service fees | | | 195 | |
Payable for independent Trustees’ compensation | | | 2 | |
Accrued expenses and other liabilities | | | 68,614 | |
Total liabilities | | | $284,805 | |
Net assets | | | $10,612,171 | |
| Net assets consist of | | | | |
Paid-in capital | | | $8,647,447 | |
Unrealized appreciation (depreciation) on investments and translation of assets and liabilities in foreign currencies | | | 1,134,937 | |
Accumulated net realized gain (loss) on investments and foreign currency | | | 763,224 | |
Undistributed net investment income | | | 66,563 | |
Net assets | | | $10,612,171 | |
Shares of beneficial interest outstanding | | | 760,852 | |
| | | | | | | | | | | | |
| | | Net assets | | | Shares outstanding | | | Net asset value per share (a) | |
Class A | | | $6,631,590 | | | | 475,247 | | | | $13.95 | |
Class B | | | 363,727 | | | | 26,344 | | | | 13.81 | |
Class C | | | 927,009 | | | | 67,131 | | | | 13.81 | |
Class I | | | 2,689,845 | | | | 192,130 | | | | 14.00 | |
| (a) | Maximum offering price per share was equal to the net asset value per share for all share classes, except for Class A, for which the maximum offering price per share was $14.80 [100 / 94.25 x $13.95]. On sales of $50,000 or more, the maximum offering price of Class A shares is reduced. A contingent deferred sales charge may be imposed on redemptions of Class A, Class B, and Class C shares. Redemption price per share was equal to the net asset value per share for Class I. |
See Notes to Financial Statements
13
Financial Statements
STATEMENT OF OPERATIONS
Year ended 8/31/13
This statement describes how much your fund earned in investment income and accrued in expenses. It also describes any gains and/or losses generated by fund operations.
| | | | |
| Net investment income | | | | |
Income | | | | |
Dividends | | | $230,965 | |
Dividends from underlying affiliated funds | | | 704 | |
Foreign taxes withheld | | | (12,764 | ) |
Total investment income | | | $218,905 | |
Expenses | | | | |
Management fee | | | $94,687 | |
Distribution and service fees | | | 26,421 | |
Shareholder servicing costs | | | 11,810 | |
Administrative services fee | | | 17,500 | |
Independent Trustees’ compensation | | | 1,181 | |
Custodian fee | | | 23,217 | |
Shareholder communications | | | 10,473 | |
Audit and tax fees | | | 54,696 | |
Legal fees | | | 103 | |
Registration fees | | | 61,569 | |
Miscellaneous | | | 11,468 | |
Total expenses | | | $313,125 | |
Fees paid indirectly | | | (1 | ) |
Reduction of expenses by investment adviser and distributor | | | (160,264 | ) |
Net expenses | | | $152,860 | |
Net investment income | | | $66,045 | |
| Realized and unrealized gain (loss) on investments and foreign currency | |
Realized gain (loss) (identified cost basis) | | | | |
Investments | | | $868,750 | |
Foreign currency | | | (4,118 | ) |
Net realized gain (loss) on investments and foreign currency | | | $864,632 | |
Change in unrealized appreciation (depreciation) | | | | |
Investments | | | $693,917 | |
Translation of assets and liabilities in foreign currencies | | | (272 | ) |
Net unrealized gain (loss) on investments and foreign currency translation | | | $693,645 | |
Net realized and unrealized gain (loss) on investments and foreign currency | | | $1,558,277 | |
Change in net assets from operations | | | $1,624,322 | |
See Notes to Financial Statements
14
Financial Statements
STATEMENTS OF CHANGES IN NET ASSETS
These statements describe the increases and/or decreases in net assets resulting from operations, any distributions, and any shareholder transactions.
| | | | | | | | |
| | | Years ended 8/31 | |
| | | 2013 | | | 2012 (c) | |
| Change in net assets | | | | | | |
| From operations | | | | | | | | |
Net investment income | | | $66,045 | | | | $29,840 | |
Net realized gain (loss) on investments and foreign currency | | | 864,632 | | | | 83,911 | |
Net unrealized gain (loss) on investments and foreign currency translation | | | 693,645 | | | | 441,292 | |
Change in net assets from operations | | | $1,624,322 | | | | $555,043 | |
| Distributions declared to shareholders | | | | | | | | |
From net investment income | | | $(60,003 | ) | | | $— | |
From net realized gain on investments | | | (128,508 | ) | | | — | |
Total distributions declared to shareholders | | | $(188,511 | ) | | | $— | |
Change in net assets from fund share transactions | | | $(1,612,004 | ) | | | $10,233,321 | |
Total change in net assets | | | $(176,193 | ) | | | $10,788,364 | |
| Net assets | | | | | | | | |
At beginning of period | | | 10,788,364 | | | | — | |
At end of period (including undistributed net investment income of $66,563 and $33,728, respectively) | | | $10,612,171 | | | | $10,788,364 | |
| (c) | For the period from the commencement of the fund’s investment operations, September 28, 2011, through the stated period end. |
See Notes to Financial Statements
15
Financial Statements
FINANCIAL HIGHLIGHTS
The financial highlights table is intended to help you understand the fund’s financial performance for the past 5 years (or life of a particular share class, if shorter). Certain information reflects financial results for a single fund share. The total returns in the table represent the rate by which an investor would have earned (or lost) on an investment in the fund share class (assuming reinvestment of all distributions) held for the entire period.
| | | | | | | | |
| Class A | | Years ended 8/31 | |
| | | 2013 | | | 2012 (c) | |
Net asset value, beginning of period | | | $12.16 | | | | $10.00 | |
| Income (loss) from investment operations | | | | | | | | |
Net investment income (d) | | | $0.07 | | | | $0.20 | |
Net realized and unrealized gain (loss) on investments and foreign currency | | | 1.91 | | | | 1.96 | |
Total from investment operations | | | $1.98 | | | | $2.16 | |
| Less distributions declared to shareholders | | | | | | | | |
From net investment income | | | $(0.06 | ) | | | $�� | |
From net realized gain on investments | | | (0.13 | ) | | | — | |
Total distributions declared to shareholders | | | $(0.19 | ) | | | $— | |
Net asset value, end of period (x) | | | $13.95 | | | | $12.16 | |
Total return (%) (r)(s)(t)(x) | | | 16.39 | | | | 21.60 | (n) |
Ratios (%) (to average net assets)
and Supplemental data: | | | | | | | | |
Expenses before expense reductions (f) | | | 2.89 | | | | 6.60 | (a) |
Expenses after expense reductions (f) | | | 1.45 | | | | 1.45 | (a) |
Net investment income | | | 0.55 | (l) | | | 1.83 | (a)(l) |
Portfolio turnover | | | 82 | | | | 19 | (n) |
Net assets at end of period (000 omitted) | | | $6,632 | | | | $8,331 | |
See Notes to Financial Statements
16
Financial Highlights – continued
| | | | | | | | |
| Class B | | Years ended 8/31 | |
| | | 2013 | | | 2012 (c) | |
Net asset value, beginning of period | | | $12.07 | | | | $10.00 | |
| Income (loss) from investment operations | | | | | | | | |
Net investment income (loss) (d) | | | $0.01 | | | | $(0.01 | ) |
Net realized and unrealized gain (loss) on investments and foreign currency | | | 1.86 | | | | 2.08 | |
Total from investment operations | | | $1.87 | | | | $2.07 | |
| Less distributions declared to shareholders | | | | | | | | |
From net realized gain on investments | | | $(0.13 | ) | | | $— | |
Net asset value, end of period (x) | | | $13.81 | | | | $12.07 | |
Total return (%) (r)(s)(t)(x) | | | 15.55 | | | | 20.70 | (n) |
Ratios (%) (to average net assets)
and Supplemental data: | | | | | | | | |
Expenses before expense reductions (f) | | | 3.96 | | | | 5.96 | (a) |
Expenses after expense reductions (f) | | | 2.21 | | | | 2.20 | (a) |
Net investment income (loss) | | | 0.09 | | | | (0.10 | )(a) |
Portfolio turnover | | | 82 | | | | 19 | (n) |
Net assets at end of period (000 omitted) | | | $364 | | | | $131 | |
| |
| Class C | | Years ended 8/31 | |
| | | 2013 | | | 2012 (c) | |
Net asset value, beginning of period | | | $12.07 | | | | $10.00 | |
| Income (loss) from investment operations | | | | | | | | |
Net investment income (loss) (d) | | | $0.02 | | | | $(0.01 | ) |
Net realized and unrealized gain (loss) on investments and foreign currency | | | 1.85 | | | | 2.08 | |
Total from investment operations | | | $1.87 | | | | $2.07 | |
| Less distributions declared to shareholders | | | | | | | | |
From net investment income | | | $(0.00 | )(w) | | | $— | |
From net realized gain on investments | | | (0.13 | ) | | | — | |
Total distributions declared to shareholders | | | $(0.13 | ) | | | $— | |
Net asset value, end of period (x) | | | $13.81 | | | | $12.07 | |
Total return (%) (r)(s)(t)(x) | | | 15.57 | | | | 20.70 | (n) |
Ratios (%) (to average net assets)
and Supplemental data: | | | | | | | | |
Expenses before expense reductions (f) | | | 4.02 | | | | 5.96 | (a) |
Expenses after expense reductions (f) | | | 2.21 | | | | 2.20 | (a) |
Net investment income (loss) | | | 0.16 | | | | (0.07 | )(a) |
Portfolio turnover | | | 82 | | | | 19 | (n) |
Net assets at end of period (000 omitted) | | | $927 | | | | $133 | |
See Notes to Financial Statements
17
Financial Highlights – continued
| | | | | | | | |
| Class I | | Years ended 8/31 | |
| | | 2013 | | | 2012 (c) | |
Net asset value, beginning of period | | | $12.18 | | | | $10.00 | |
| Income (loss) from investment operations | | | | | | | | |
Net investment income (d) | | | $0.14 | | | | $0.09 | |
Net realized and unrealized gain (loss) on investments and foreign currency | �� | | 1.88 | | | | 2.09 | |
Total from investment operations | | | $2.02 | | | | $2.18 | |
| Less distributions declared to shareholders | | | | | | | | |
From net investment income | | | $(0.07 | ) | | | $— | |
From net realized gain on investments | | | (0.13 | ) | | | — | |
Total distributions declared to shareholders | | | $(0.20 | ) | | | $— | |
Net asset value, end of period (x) | | | $14.00 | | | | $12.18 | |
Total return (%) (r)(s)(x) | | | 16.72 | | | | 21.80 | (n) |
Ratios (%) (to average net assets)
and Supplemental data: | | | | | | | | |
Expenses before expense reductions (f) | | | 2.86 | | | | 4.94 | (a) |
Expenses after expense reductions (f) | | | 1.21 | | | | 1.20 | (a) |
Net investment income | | | 1.03 | | | | 0.90 | (a) |
Portfolio turnover | | | 82 | | | | 19 | (n) |
Net assets at end of period (000 omitted) | | | $2,690 | | | | $2,193 | |
| (c) | For the period from the commencement of the fund’s investment operations, September 28, 2011, through the stated period end. |
| (d) | Per share data is based on average shares outstanding. |
| (f) | Ratios do not reflect reductions from fees paid indirectly, if applicable. |
| (l) | The net investment income ratio does not vary by the class specific expense differential because of the timing of sales of fund shares and the allocation of fund level income at such time. |
| (r) | Certain expenses have been reduced without which performance would have been lower. |
| (s) | From time to time the fund may receive proceeds from litigation settlements, without which performance would be lower. |
| (t) | Total returns do not include any applicable sales charges. |
| (w) | Per share amount was less than $0.01. |
| (x) | The net asset values per share and total returns have been calculated on net assets which include adjustments made in accordance with U.S. generally accepted accounting principles required at period end for financial reporting purposes. |
See Notes to Financial Statements
18
NOTES TO FINANCIAL STATEMENTS
(1) Business and Organization
MFS Global Leaders Fund (the fund) is a series of MFS Series Trust I (the trust). The trust is organized as a Massachusetts business trust and is registered under the Investment Company Act of 1940, as amended, as an open-end management investment company.
(2) Significant Accounting Policies
General – The preparation of financial statements in conformity with U.S. generally accepted accounting principles requires management to make estimates and assumptions that affect the reported amounts of assets and liabilities, and disclosure of contingent assets and liabilities at the date of the financial statements and the reported amounts of revenues and expenses during the reporting period. Actual results could differ from those estimates. In the preparation of these financial statements, management has evaluated subsequent events occurring after the date of the fund’s Statement of Assets and Liabilities through the date that the financial statements were issued. The fund invests in foreign securities. Investments in foreign securities are vulnerable to the effects of changes in the relative values of the local currency and the U.S. dollar and to the effects of changes in each country’s legal, political, and economic environment.
In January 2013, the Financial Accounting Standards Board (FASB) issued Accounting Standards Update 2013-01 (“ASU 2013-01”) entitled Balance Sheet (Topic 210) – Clarifying the Scope of Disclosures about Offsetting Assets and Liabilities which is intended to clarify the scope of Accounting Standards Update 2011-11 (“ASU 2011-11”), Balance Sheet (Topic 210) – Disclosures about Offsetting Assets and Liabilities. Consistent with the effective date for ASU 2011-11, ASU 2013-01 is effective for annual reporting periods beginning on or after January 1, 2013, and interim periods within those annual periods. ASU 2013-01 limits the scope of ASU 2011-11’s disclosure requirements on offsetting to financial assets and financial liabilities related to derivatives, repurchase and reverse repurchase agreements, and securities lending and securities borrowing transactions. Although still evaluating the potential impact of these two ASUs to the fund, management expects that the impact of the fund’s adoption will be limited to additional financial statement disclosures.
In June 2013, FASB issued Accounting Standards Update 2013-08 Financial Services – Investment Companies (Topic 946) – Amendments to the Scope, Measurement, and Disclosure Requirements (“ASU 2013-08”) which is effective for interim and annual reporting periods in fiscal years that begin after December 15, 2013. ASU 2013-08 sets forth a methodology for determining whether an entity should be characterized as an investment company and prescribes fair value accounting for an investment company’s non-controlling ownership interest in another investment company. FASB has determined that a fund registered under the Investment Company Act of 1940 automatically meets ASU 2013-08’s criteria for an investment company. Although still evaluating the potential impacts of ASU 2013-08 to the fund, management expects that the impact of the fund’s adoption will be limited to additional financial statement disclosures.
19
Notes to Financial Statements – continued
Investment Valuations – Equity securities, including restricted equity securities, are generally valued at the last sale or official closing price as provided by a third-party pricing service on the market or exchange on which they are primarily traded. Equity securities, for which there were no sales reported that day, are generally valued at the last quoted daily bid quotation as provided by a third-party pricing service on the market or exchange on which such securities are primarily traded. Short-term instruments with a maturity at issuance of 60 days or less generally are valued at amortized cost, which approximates market value. Open-end investment companies are generally valued at net asset value per share. Securities and other assets generally valued on the basis of information from a third-party pricing service may also be valued at a broker/dealer bid quotation. Values obtained from third-party pricing services can utilize both transaction data and market information such as yield, quality, coupon rate, maturity, type of issue, trading characteristics, and other market data. The values of foreign securities and other assets and liabilities expressed in foreign currencies are converted to U.S. dollars using the mean of bid and asked prices for rates provided by a third-party pricing service.
The Board of Trustees has delegated primary responsibility for determining or causing to be determined the value of the fund’s investments (including any fair valuation) to the adviser pursuant to valuation policies and procedures approved by the Board. If the adviser determines that reliable market quotations are not readily available, investments are valued at fair value as determined in good faith by the adviser in accordance with such procedures under the oversight of the Board of Trustees. Under the fund’s valuation policies and procedures, market quotations are not considered to be readily available for most types of debt instruments and floating rate loans and many types of derivatives. These investments are generally valued at fair value based on information from third-party pricing services. In addition, investments may be valued at fair value if the adviser determines that an investment’s value has been materially affected by events occurring after the close of the exchange or market on which the investment is principally traded (such as foreign exchange or market) and prior to the determination of the fund’s net asset value, or after the halting of trading of a specific security where trading does not resume prior to the close of the exchange or market on which the security is principally traded. Events that occur on a frequent basis after foreign markets close (such as developments in foreign markets and significant movements in the U.S. markets) and prior to the determination of the fund’s net asset value may be deemed to have a material effect on the value of securities traded in foreign markets. Accordingly, the fund’s foreign equity securities may often be valued at fair value. The adviser generally relies on third-party pricing services or other information (such as the correlation with price movements of similar securities in the same or other markets; the type, cost and investment characteristics of the security; the business and financial condition of the issuer; and trading and other market data) to assist in determining whether to fair value and at what value to fair value an investment. The value of an investment for purposes of calculating the fund’s net asset value can differ depending on the source and method used to determine value. When fair valuation is used, the value of an investment used to determine the fund’s net asset value may differ from quoted or published prices for the same investment. There can be no assurance that
20
Notes to Financial Statements – continued
the fund could obtain the fair value assigned to an investment if it were to sell the investment at the same time at which the fund determines its net asset value per share.
Various inputs are used in determining the value of the fund’s assets or liabilities. These inputs are categorized into three broad levels. In certain cases, the inputs used to measure fair value may fall into different levels of the fair value hierarchy. In such cases, an investment’s level within the fair value hierarchy is based on the lowest level of input that is significant to the fair value measurement. The fund’s assessment of the significance of a particular input to the fair value measurement in its entirety requires judgment, and considers factors specific to the investment. Level 1 includes unadjusted quoted prices in active markets for identical assets or liabilities. Level 2 includes other significant observable market-based inputs (including quoted prices for similar securities, interest rates, prepayment speed, and credit risk). Level 3 includes unobservable inputs, which may include the adviser’s own assumptions in determining the fair value of investments. The following is a summary of the levels used as of August 31, 2013 in valuing the fund’s assets or liabilities:
| | | | | | | | | | | | | | | | |
| Investments at Value | | Level 1 | | | Level 2 | | | Level 3 | | | Total | |
| Equity Securities: | | | | | | | | | | | | | | | | |
United States | | | $3,428,847 | | | | $— | | | | $— | | | | $3,428,847 | |
France | | | 1,804,408 | | | | — | | | | — | | | | 1,804,408 | |
United Kingdom | | | 1,237,477 | | | | — | | | | — | | | | 1,237,477 | |
Switzerland | | | 839,379 | | | | — | | | | — | | | | 839,379 | |
Japan | | | — | | | | 558,303 | | | | — | | | | 558,303 | |
China | | | — | | | | 387,507 | | | | — | | | | 387,507 | |
Netherlands | | | 379,371 | | | | — | | | | — | | | | 379,371 | |
Germany | | | 305,363 | | | | — | | | | — | | | | 305,363 | |
Italy | | | 270,375 | | | | — | | | | — | | | | 270,375 | |
Other Countries | | | 1,010,448 | | | | — | | | | — | | | | 1,010,448 | |
| Mutual Funds | | | 466,176 | | | | — | | | | — | | | | 466,176 | |
| Total Investments | | | $9,741,844 | | | | $945,810 | | | | $— | | | | $10,687,654 | |
For further information regarding security characteristics, see the Portfolio of Investments.
Of the level 2 investments presented above, equity investments amounting to $323,584 would have been considered level 1 investments at the beginning of the period. Of the level 1 investments presented above, equity investments amounting to $214,638 would have been considered level 2 investments at the beginning of the period. The primary reason for changes in the classifications between levels 1 and 2 occurs when foreign equity securities are fair valued using other observable market-based inputs in place of the closing exchange price due to events occurring after the close of the exchange or market on which the investment is principally traded. The fund’s foreign equity securities may often be valued at fair value. The fund’s policy is to recognize transfers between the levels as of the end of the period.
Foreign Currency Translation – Purchases and sales of foreign investments, income, and expenses are converted into U.S. dollars based upon currency exchange rates prevailing on the respective dates of such transactions or on the reporting date for
21
Notes to Financial Statements – continued
foreign denominated receivables and payables. Gains and losses attributable to foreign currency exchange rates on sales of securities are recorded for financial statement purposes as net realized gains and losses on investments. Gains and losses attributable to foreign exchange rate movements on receivables, payables, income and expenses are recorded for financial statement purposes as foreign currency transaction gains and losses. That portion of both realized and unrealized gains and losses on investments that results from fluctuations in foreign currency exchange rates is not separately disclosed.
Indemnifications – Under the fund’s organizational documents, its officers and Trustees may be indemnified against certain liabilities and expenses arising out of the performance of their duties to the fund. Additionally, in the normal course of business, the fund enters into agreements with service providers that may contain indemnification clauses. The fund’s maximum exposure under these agreements is unknown as this would involve future claims that may be made against the fund that have not yet occurred.
Investment Transactions and Income – Investment transactions are recorded on the trade date. Dividends received in cash are recorded on the ex-dividend date. Certain dividends from foreign securities will be recorded when the fund is informed of the dividend if such information is obtained subsequent to the ex-dividend date. Dividend payments received in additional securities are recorded on the ex-dividend date in an amount equal to the value of the security on such date.
The fund may receive proceeds from litigation settlements. Any proceeds received from litigation involving portfolio holdings are reflected in the Statement of Operations in realized gain/loss if the security has been disposed of by the fund or in unrealized gain/loss if the security is still held by the fund. Any other proceeds from litigation not related to portfolio holdings are reflected as other income in the Statement of Operations.
Fees Paid Indirectly – The fund’s custody fee may be reduced according to an arrangement that measures the value of cash deposited with the custodian by the fund. This amount, for the year ended August 31, 2013, is shown as a reduction of total expenses in the Statement of Operations.
Tax Matters and Distributions – The fund intends to qualify as a regulated investment company, as defined under Subchapter M of the Internal Revenue Code, and to distribute all of its taxable income, including realized capital gains. As a result, no provision for federal income tax is required. The fund’s federal tax returns, when filed, will remain subject to examination by the Internal Revenue Service for a three year period. Foreign taxes have been accrued by the fund in the accompanying financial statements in accordance with the applicable foreign tax law. Foreign income taxes may be withheld by certain countries in which the fund invests.
Distributions to shareholders are recorded on the ex-dividend date. Income and capital gain distributions are determined in accordance with income tax regulations, which may differ from U.S. generally accepted accounting principles. Certain capital accounts in the financial statements are periodically adjusted for permanent differences in order to reflect their tax character. These adjustments have no impact on net assets or net asset value per share. Temporary differences which arise from recognizing certain items
22
Notes to Financial Statements – continued
of income, expense, gain or loss in different periods for financial statement and tax purposes will reverse at some time in the future. Distributions in excess of net investment income or net realized gains are temporary overdistributions for financial statement purposes resulting from differences in the recognition or classification of income or distributions for financial statement and tax purposes.
Book/tax differences primarily relate to passive foreign investment companies, wash sale loss deferrals, and treating a portion of the proceeds from redemptions as a distribution for tax purposes.
The tax character of distributions declared to shareholders for the last two fiscal years is as follows:
| | | | | | | | |
| | | 8/31/13 | | | 8/31/12 | |
Ordinary income (including any
short-term capital gains) | | | $188,511 | | | | $— | |
The federal tax cost and the tax basis components of distributable earnings were as follows:
| | | | |
| As of 8/31/13 | | | |
| Cost of investments | | | $9,599,622 | |
| Gross appreciation | | | 1,122,816 | |
| Gross depreciation | | | (34,784 | ) |
| Net unrealized appreciation (depreciation) | | | $1,088,032 | |
| Undistributed ordinary income | | | 794,016 | |
| Undistributed long-term capital gain | | | 83,332 | |
| Other temporary differences | | | (656 | ) |
Multiple Classes of Shares of Beneficial Interest – The fund offers multiple classes of shares, which differ in their respective distribution and service fees. The fund’s income, realized and unrealized gain (loss), and common expenses are allocated to shareholders based on the daily net assets of each class. Dividends are declared separately for each class. Differences in per share dividend rates are generally due to differences in separate class expenses. Class B shares will convert to Class A shares approximately eight years after purchase. The fund’s distributions declared to shareholders as reported in the Statements of Changes in Net Assets are presented by class as follows:
| | | | | | | | | | | | | | | | |
| | | From net investment
income | | | From net realized gain on
investments | |
| | | Year
ended
8/31/13 | | | Year
ended
8/31/12 (c) | | | Year
ended
8/31/13 | | | Year
ended
8/31/12 (c) | |
| Class A | | | $47,256 | | | | $— | | | | $101,361 | | | | $— | |
| Class B | | | — | | | | — | | | | 1,620 | | | | — | |
| Class C | | | 30 | | | | — | | | | 2,914 | | | | — | |
| Class I | | | 12,717 | | | | — | | | | 22,613 | | | | — | |
| Total | | | $60,003 | | | | $— | | | | $128,508 | | | | $— | |
| (c) | For the period from the commencement of the fund’s investment operations, September 28, 2011, through the stated period end. |
23
Notes to Financial Statements – continued
(3) Transactions with Affiliates
Investment Adviser – The fund has an investment advisory agreement with MFS to provide overall investment management and related administrative services and facilities to the fund. The management fee is computed daily and paid monthly at the following annual rates:
| | | | |
| First $1 billion of average daily net assets | | | 0.90% | |
| Next $1.5 billion of average daily net assets | | | 0.75% | |
| Average daily net assets in excess of $2.5 billion | | | 0.65% | |
Effective April 1, 2013, MFS has agreed in writing to reduce its management fee by a specified amount if certain MFS mutual fund assets exceed thresholds agreed to by MFS and the fund’s Board of Trustees. For the period April 1, 2013 through August 31, 2013, this management fee reduction amounted to $21, which is shown as a reduction of total expenses in the Statement of Operations. The management fee incurred for the year ended August 31, 2013 was equivalent to an annual effective rate of 0.90% of the fund’s average daily net assets.
The investment adviser has agreed in writing to pay a portion of the fund’s total annual operating expenses, exclusive of interest, taxes, extraordinary expenses, brokerage and transaction costs, and investment-related expenses, such that total fund operating expenses do not exceed the following rates annually of each class’s average daily net assets.
| | | | | | | | | | | | | | |
| Class A | | | Class B | | | Class C | | | Class I | |
| | 1.45% | | | | 2.20 | % | | | 2.20 | % | | | 1.20 | % |
This written agreement will continue until modified by the fund’s Board of Trustees, but such agreement will continue at least until December 31, 2014. For the year ended August 31, 2013, this reduction amounted to $159,932 and is reflected as a reduction of total expenses in the Statement of Operations.
Distributor – MFS Fund Distributors, Inc. (MFD), a wholly-owned subsidiary of MFS, as distributor, received $14,868 for the year ended August 31, 2013, as its portion of the initial sales charge on sales of Class A shares of the fund.
The Board of Trustees has adopted a distribution plan for certain class shares pursuant to Rule 12b-1 of the Investment Company Act of 1940.
The fund’s distribution plan provides that the fund will pay MFD for services provided by MFD and financial intermediaries in connection with the distribution and servicing of certain share classes. One component of the plan is a distribution fee paid to MFD and another component of the plan is a service fee paid to MFD. MFD may subsequently pay all, or a portion, of the distribution and/or service fees to financial intermediaries.
Distribution Plan Fee Table:
| | | | | | | | | | | | | | | | | | | | |
| | | Distribution
Fee Rate (d) | | | Service
Fee Rate (d) | | | Total
Distribution
Plan (d) | | | Annual
Effective
Rate (e) | | | Distribution
and Service
Fee | |
| Class A | | | — | | | | 0.25% | | | | 0.25% | | | | 0.25% | | | | $18,052 | |
| Class B | | | 0.75% | | | | 0.25% | | | | 1.00% | | | | 1.00% | | | | 2,399 | |
| Class C | | | 0.75% | | | | 0.25% | | | | 1.00% | | | | 1.00% | | | | 5,970 | |
| Total Distribution and Service Fees | | | | | | | | $26,421 | |
24
Notes to Financial Statements – continued
| (d) | In accordance with the distribution plan for certain classes, the fund pays distribution and/or service fees equal to these annual percentage rates of each class’s average daily net assets. The distribution and service fee rates disclosed by class represent the current rates in effect at the end of the reporting period. |
| (e) | The annual effective rates represent actual fees incurred under the distribution plan for the year ended August 31, 2013 based on each class’s average daily net assets. Effective January 1, 2013, MFD has voluntarily agreed to rebate a portion of each class’s 0.25% service fee attributable to accounts for which MFD retains the 0.25% service fee except for accounts attributable to MFS or its subsidiaries’ seed money. For the period January 1, 2013 through August 31, 2013, this rebate amounted to $284 for Class A, and is reflected as a reduction of total expenses in the Statement of Operations. |
Certain Class A shares are subject to a contingent deferred sales charge (CDSC) in the event of a shareholder redemption within 18 months of purchase for shares purchased on or after August 1, 2012, and within 24 months of purchase for shares purchased prior to August 1, 2012. Class C shares are subject to a CDSC in the event of a shareholder redemption within 12 months of purchase. Class B shares are subject to a CDSC in the event of a shareholder redemption within six years of purchase. All contingent deferred sales charges are paid to MFD and during the year ended August 31, 2013, were as follows:
| | | | |
| Class A | | | $— | |
| Class B | | | 10 | |
| Class C | | | 68 | |
Shareholder Servicing Agent – MFS Service Center, Inc. (MFSC), a wholly-owned subsidiary of MFS, receives a fee from the fund for its services as shareholder servicing agent calculated as a percentage of the average daily net assets of the fund as determined periodically under the supervision of the fund’s Board of Trustees. For the year ended August 31, 2013, the fee was $5,281, which equated to 0.0502% annually of the fund’s average daily net assets. MFSC also receives payment from the fund for out-of-pocket expenses, sub-accounting and other shareholder servicing costs which may be paid to affiliated and unaffiliated service providers. For the year ended August 31, 2013, these out-of-pocket expenses, sub-accounting and other shareholder servicing costs amounted to $6,529.
Administrator – MFS provides certain financial, legal, shareholder communications, compliance, and other administrative services to the fund. Under an administrative services agreement, the fund partially reimburses MFS the costs incurred to provide these services. The fund is charged an annual fixed amount of $17,500 plus a fee based on average daily net assets. The administrative services fee incurred for the year ended August 31, 2013 was equivalent to an annual effective rate of 0.1662% of the fund’s average daily net assets.
Trustees’ and Officers’ Compensation – The fund pays compensation to independent Trustees in the form of a retainer, attendance fees, and additional compensation to Board and Committee chairpersons. The fund does not pay compensation directly to Trustees or officers of the fund who are also officers of the investment adviser, all of whom receive remuneration for their services to the fund from MFS. Certain officers and Trustees of the fund are officers or directors of MFS, MFD, and MFSC.
25
Notes to Financial Statements – continued
Other – This fund and certain other funds managed by MFS (the funds) have entered into services agreements (the Agreements) which provide for payment of fees by the funds to Tarantino LLC and Griffin Compliance LLC in return for the provision of services of an Independent Chief Compliance Officer (ICCO) and Assistant ICCO, respectively, for the funds. The ICCO and Assistant ICCO are officers of the funds and the sole members of Tarantino LLC and Griffin Compliance LLC, respectively. The funds can terminate the Agreements with Tarantino LLC and Griffin Compliance LLC at any time under the terms of the Agreements. For the year ended August 31, 2013, the aggregate fees paid by the fund to Tarantino LLC and Griffin Compliance LLC were $68 and are included in “Miscellaneous” expense in the Statement of Operations. MFS has agreed to reimburse the fund for a portion of the payments made by the fund in the amount of $27, which is shown as a reduction of total expenses in the Statement of Operations. Additionally, MFS has agreed to bear all expenses associated with office space, other administrative support, and supplies provided to the ICCO and Assistant ICCO.
The fund invests in the MFS Institutional Money Market Portfolio which is managed by MFS and seeks current income consistent with preservation of capital and liquidity. Income earned on this investment is included in “Dividends from underlying affiliated funds” in the Statement of Operations. This money market fund does not pay a management fee to MFS.
On September 27, 2011, MFS purchased 10,000 shares each of Class A, Class B, and Class C and 180,000 shares of Class I for an aggregate amount of $2,100,000. At August 31, 2013, MFS held 95% of the outstanding shares of Class I.
(4) Portfolio Securities
Purchases and sales of investments, other than short-term obligations, aggregated $8,170,880 and $9,904,477, respectively.
(5) Shares of Beneficial Interest
The fund’s Declaration of Trust permits the Trustees to issue an unlimited number of full and fractional shares of beneficial interest. Transactions in fund shares were as follows:
| | | | | | | | | | | | | | | | |
| | | Year ended
8/31/13 | | | Year ended
8/31/12 (c) | |
| | | Shares | | | Amount | | | Shares | | | Amount | |
| Shares sold | | | | | | | | | | | | | | | | |
Class A | | | 491,804 | | | | $6,548,966 | | | | 696,148 | | | | $8,342,949 | |
Class B | | | 15,708 | | | | 209,931 | | | | 10,883 | | | | 110,505 | |
Class C | | | 56,826 | | | | 739,685 | | | | 11,386 | | | | 116,228 | |
Class I | | | 9,352 | | | | 130,223 | | | | 180,000 | | | | 1,800,000 | |
| | | 573,690 | | | | $7,628,805 | | | | 898,417 | | | | $10,369,682 | |
26
Notes to Financial Statements – continued
| | | | | | | | | | | | | | | | |
| | | Year ended
8/31/13 | | | Year ended
8/31/12 (c) | |
| | | Shares | | | Amount | | | Shares | | | Amount | |
| Shares issued to shareholders in reinvestment of distributions | | | | | | | | | | | | | | | | |
Class A | | | 11,590 | | | | $147,077 | | | | — | | | | $— | |
Class B | | | 128 | | | | 1,620 | | | | — | | | | — | |
Class C | | | 233 | | | | 2,944 | | | | — | | | | — | |
Class I | | | 2,778 | | | | 35,330 | | | | — | | | | — | |
| | | 14,729 | | | | $186,971 | | | | — | | | | $— | |
| | | | |
| Shares reacquired | | | | | | | | | | | | | | | | |
Class A | | | (713,390 | ) | | | $(9,410,438 | ) | | | (10,905 | ) | | | $(131,549 | ) |
Class B | | | (310 | ) | | | (4,144 | ) | | | (65 | ) | | | (766 | ) |
Class C | | | (970 | ) | | | (13,198 | ) | | | (344 | ) | | | (4,046 | ) |
| | | (714,670 | ) | | | $(9,427,780 | ) | | | (11,314 | ) | | | $(136,361 | ) |
| | | | |
| Net change | | | | | | | | | | | | | | | | |
Class A | | | (209,996 | ) | | | $(2,714,395 | ) | | | 685,243 | | | | $8,211,400 | |
Class B | | | 15,526 | | | | 207,407 | | | | 10,818 | | | | 109,739 | |
Class C | | | 56,089 | | | | 729,431 | | | | 11,042 | | | | 112,182 | |
Class I | | | 12,130 | | | | 165,553 | | | | 180,000 | | | | 1,800,000 | |
| | | (126,251 | ) | �� | | $(1,612,004 | ) | | | 887,103 | | | | $10,233,321 | |
| (c) | For the period from the commencement of the fund’s investment operations, September 28, 2011, through the stated period end. |
(6) Line of Credit
The fund and certain other funds managed by MFS participate in a $1.1 billion unsecured committed line of credit, subject to a $1 billion sublimit, provided by a syndication of banks under a credit agreement. Borrowings may be made for temporary financing needs. Interest is charged to each fund, based on its borrowings, generally at a rate equal to the higher of the Federal Reserve funds rate or one month LIBOR plus an agreed upon spread. A commitment fee, based on the average daily, unused portion of the committed line of credit, is allocated among the participating funds at the end of each calendar quarter. In addition, the fund and other funds managed by MFS have established unsecured uncommitted borrowing arrangements with certain banks for temporary financing needs. Interest is charged to each fund, based on its borrowings, at a rate equal to the Federal Reserve funds rate plus an agreed upon spread. For the year ended August 31, 2013, the fund’s commitment fee and interest expense were $52 and $0, respectively, and are included in “Miscellaneous” expense in the Statement of Operations.
27
Notes to Financial Statements – continued
(7) Transactions in Underlying Affiliated Funds-Affiliated Issuers
An affiliated issuer may be considered one in which the fund owns 5% or more of the outstanding voting securities, or a company which is under common control. For the purposes of this report, the fund assumes the following to be an affiliated issuer:
| | | | | | | | | | | | | | | | |
| Underlying Affiliated Fund | | Beginning
Shares/Par
Amount | | | Acquisitions
Shares/Par
Amount | | | Dispositions
Shares/Par
Amount | | | Ending
Shares/Par
Amount | |
| MFS Institutional Money Market Portfolio | | | 358,853 | | | | 6,599,891 | | | | (6,492,568 | ) | | | 466,176 | |
| | | | |
| Underlying Affiliated Fund | | Realized
Gain (Loss) | | | Capital Gain
Distributions | | | Dividend
Income | | | Ending
Value | |
| MFS Institutional Money Market Portfolio | | | $— | | | | $— | | | | $704 | | | | $466,176 | |
28
REPORT OF INDEPENDENT REGISTERED PUBLIC ACCOUNTING FIRM
To the Board of Trustees of MFS Series Trust I and the Shareholders of MFS Global Leaders Fund:
We have audited the accompanying statement of assets and liabilities, including the portfolio of investments, of MFS Global Leaders Fund (one of the portfolios comprising MFS Series Trust I) (the “Fund”) as of August 31, 2013, and the related statement of operations for the year then ended, and the statements of changes in net assets and the financial highlights for the year then ended and for the period from September 28, 2011 (the commencement of the Fund’s operations) through August 31, 2012. These financial statements and financial highlights are the responsibility of the Fund’s management. Our responsibility is to express an opinion on these financial statements and financial highlights based on our audits.
We conducted our audits in accordance with the standards of the Public Company Accounting Oversight Board (United States). Those standards require that we plan and perform the audit to obtain reasonable assurance about whether the financial statements and financial highlights are free of material misstatement. The Fund is not required to have, nor were we engaged to perform, an audit of its internal control over financial reporting. Our audits included consideration of internal control over financial reporting as a basis for designing audit procedures that are appropriate in the circumstances, but not for the purpose of expressing an opinion on the effectiveness of the Fund’s internal control over financial reporting. Accordingly, we express no such opinion. An audit also includes examining, on a test basis, evidence supporting the amounts and disclosures in the financial statements, assessing the accounting principles used and significant estimates made by management, as well as evaluating the overall financial statement presentation. Our procedures included confirmation of securities owned as of August 31, 2013, by correspondence with the custodian and brokers; where replies were not received from brokers, we performed other auditing procedures. We believe that our audits provide a reasonable basis for our opinion.
In our opinion, the financial statements and financial highlights referred to above present fairly, in all material respects, the financial position of MFS Global Leaders Fund as of August 31, 2013, the results of its operations for the year then ended, and the changes in its net assets and the financial highlights for the year then ended and for the period from September 28, 2011 (the commencement of the Fund’s operations) through August 31, 2012, in conformity with accounting principles generally accepted in the United States of America.
DELOITTE & TOUCHE LLP
Boston, Massachusetts
October 17, 2013
29
TRUSTEES AND OFFICERS — IDENTIFICATION AND BACKGROUND
The Trustees and Officers of the Trust, as of October 1, 2013, are listed below, together with their principal occupations during the past five years. (Their titles may have varied during that period.) The address of each Trustee and officer is 111 Huntington Avenue, Boston, Massachusetts 02199-7618.
| | | | | | | | |
Name, Age | | Position(s) Held with Fund | | Trustee/Officer
Since (h) | | Principal
Occupations During the Past Five Years | | Other Directorships (j) |
| INTERESTED TRUSTEES |
Robert J. Manning (k) (age 49) | | Trustee | | February 2004 | | Massachusetts Financial Services Company, Chairman, Chief Executive Officer and Director; President (until 2009); Chief Investment Officer (until 2010) | | N/A |
| INDEPENDENT TRUSTEES |
David H. Gunning (age 71) | | Trustee and Chair of Trustees | | January 2004 | | Private investor | | Lincoln Electric Holdings, Inc. (welding equipment manufacturer), Director; Development Alternatives, Inc. (consulting), Director/Non-Executive Chairman; Portman Limited (mining), Director (until 2008) |
Robert E. Butler (age 71) | | Trustee | | January 2006 | | Consultant – investment company industry regulatory and compliance matters | | N/A |
Maureen R. Goldfarb (age 58) | | Trustee | | January 2009 | | Private investor | | N/A |
William R. Gutow (age 72) | | Trustee | | December 1993 | | Private investor and real estate consultant; Capitol Entertainment Management Company (video franchise), Vice Chairman | | Texas Donuts (donut franchise), Vice Chairman (until 2010) |
30
Trustees and Officers – continued
| | | | | | | | |
Name, Age | | Position(s) Held with Fund | | Trustee/Officer
Since (h) | | Principal
Occupations During the Past Five Years | | Other Directorships (j) |
Michael Hegarty (age 68) | | Trustee | | December 2004 | | Private investor | | Brookfield Office Properties, Inc. (real estate), Director; Rouse Properties Inc. (real estate), Director; Capmark Financial Group Inc. (real estate), Director |
John P. Kavanaugh (age 58) | | Trustee | | January 2009 | | Private investor | | N/A |
J. Dale Sherratt (age 75) | | Trustee | | June 1989 | | Insight Resources, Inc. (acquisition planning specialists), President; Wellfleet Investments (investor in health care companies), Managing General Partner | | N/A |
Laurie J. Thomsen (age 56) | | Trustee | | March 2005 | | Private investor; New Profit, Inc. (venture philanthropy), Executive Partner (until 2010) | | The Travelers Companies (insurance), Director |
Robert W. Uek (age 72) | | Trustee | | January 2006 | | Consultant to investment company industry | | N/A |
| OFFICERS |
John M. Corcoran��(k) (age 48) | | President | | October 2008 | | Massachusetts Financial Services Company, Senior Vice President (since October 2008); State Street Bank and Trust (financial services provider), Senior Vice President, (until 2008) | | N/A |
Christopher R. Bohane (k) (age 39) | | Assistant Secretary and Assistant Clerk | | July 2005 | | Massachusetts Financial Services Company, Vice President and Assistant General Counsel | | N/A |
Kino Clark (k) (age 45) | | Assistant Treasurer | | January 2012 | | Massachusetts Financial Services Company, Vice President | | N/A |
31
Trustees and Officers – continued
| | | | | | | | |
Name, Age | | Position(s) Held with Fund | | Trustee/Officer
Since (h) | | Principal
Occupations During the Past Five Years | | Other Directorships (j) |
Thomas H. Connors (k) (age 54) | | Assistant Secretary and Assistant Clerk | | September 2012 | | Massachusetts Financial Services Company, Vice President and Senior Counsel; Deutsche Investment Management Americas Inc. (financial service provider), Director and Senior Counsel (until 2012) | | N/A |
Ethan D. Corey (k) (age 49) | | Assistant Secretary and Assistant Clerk | | July 2005 | | Massachusetts Financial Services Company, Senior Vice President and Associate General Counsel | | N/A |
David L. DiLorenzo (k)
(age 45) | | Treasurer | | July 2005 | | Massachusetts Financial Services Company, Senior Vice President | | N/A |
Robyn L. Griffin (age 38) | | Assistant Independent Chief Compliance Officer | | August 2008 | | Griffin Compliance LLC (provider of compliance services), Principal (since August 2008); State Street Corporation (financial services provider), Mutual Fund Administration Assistant Vice President (until 2008) | | N/A |
Brian E. Langenfeld (k) (age 40) | | Assistant Secretary and Assistant Clerk | | June 2006 | | Massachusetts Financial Services Company, Vice President and Senior Counsel | | N/A |
Susan S. Newton (k) (age 63) | | Assistant Secretary and Assistant Clerk | | May 2005 | | Massachusetts Financial Services Company, Senior Vice President and Associate General Counsel | | N/A |
Susan A. Pereira (k) (age 42) | | Assistant Secretary and Assistant Clerk | | July 2005 | | Massachusetts Financial Services Company, Vice President and Senior Counsel | | N/A |
32
Trustees and Officers – continued
| | | | | | | | |
Name, Age | | Position(s) Held with Fund | | Trustee/Officer
Since (h) | | Principal
Occupations During the Past Five Years | | Other Directorships (j) |
Kasey L. Phillips (k) (age 42) | | Assistant Treasurer | | September 2012 | | Massachusetts Financial Services Company, Vice President; Wells Fargo Funds Management, LLC, Senior Vice President, Fund Treasurer (until 2012) | | N/A |
Mark N. Polebaum (k) (age 61) | | Secretary and Clerk | | January 2006 | | Massachusetts Financial Services Company, Executive Vice President, General Counsel and Secretary | | N/A |
Frank L. Tarantino (age 69) | | Independent Chief Compliance Officer | | June 2004 | | Tarantino LLC (provider of compliance services), Principal | | N/A |
Richard S. Weitzel (k) (age 43) | | Assistant Secretary and Assistant Clerk | | October 2007 | | Massachusetts Financial Services Company, Senior Vice President and Associate General Counsel | | N/A |
James O. Yost (k) (age 53) | | Deputy Treasurer | | September 1990 | | Massachusetts Financial Services Company, Senior Vice President | | N/A |
| (h) | Date first appointed to serve as Trustee/officer of an MFS Fund. Each Trustee has served continuously since appointment unless indicated otherwise. For the period from December 15, 2004 until February 22, 2005, Mr. Manning served as Advisory Trustee. For the period October 2008, until January 2012, Mr. Corcoran served as Treasurer of the Funds. Prior to January 2012, Messrs. DiLorenzo and Yost served as Assistant Treasurers of the Funds. |
| (j) | Directorships or trusteeships of companies required to report to the Securities and Exchange Commission (i.e., “public companies”). |
| (k) | “Interested person” of the Trust within the meaning of the Investment Company Act of 1940 (referred to as the 1940 Act), which is the principal federal law governing investment companies like the fund, as a result of position with MFS. The address of MFS is 111 Huntington Avenue, Boston, Massachusetts 02199-7618. |
Each Trustee has been elected by shareholders and each Trustee and officer holds office until his or her successor is chosen and qualified or until his or her earlier death, resignation, retirement or removal. The Trust does not hold annual meetings for the purpose of electing Trustees, and Trustees are not elected for fixed terms. Messrs. Butler, Kavanaugh, Uek and Ms. Thomsen are members of the Trust’s Audit Committee.
Each of the Fund’s Trustees and officers holds comparable positions with certain other funds of which MFS or a subsidiary is the investment adviser or distributor, and, in the case of the officers, with certain affiliates of MFS. As of January 1, 2013, the Trustees served as board members of 143 funds within the MFS Family of Funds.
33
Trustees and Officers – continued
The Statement of Additional Information for the Fund includes further information about the Trustees and is available without charge upon request by calling 1-800-225-2606.
| | |
| Investment Adviser | | Custodian |
| Massachusetts Financial Services Company | | State Street Bank and Trust Company |
| 111 Huntington Avenue | | 1 Lincoln Street |
| Boston, MA 02199-7618 | | Boston, MA 02111-2900 |
| Distributor | | Independent Registered Public Accounting Firm |
| MFS Fund Distributors, Inc. | | Deloitte & Touche LLP |
| 111 Huntington Avenue | | 200 Berkeley Street |
| Boston, MA 02199-7618 | | Boston, MA 02116 |
| Portfolio Managers | | |
| Matthew Barrett | | |
| Maile Clark | | |
34
BOARD REVIEW OF INVESTMENT ADVISORY AGREEMENT
The Investment Company Act of 1940 requires that both the full Board of Trustees and a majority of the non-interested (“independent”) Trustees, voting separately, annually approve the continuation of the Fund’s investment advisory agreement with MFS. The Trustees consider matters bearing on the Fund and its advisory arrangements at their meetings throughout the year, including a review of performance data at each regular meeting. In addition, the independent Trustees met several times over the course of three months beginning in May and ending in July, 2013 (“contract review meetings”) for the specific purpose of considering whether to approve the continuation of the investment advisory agreement for the Fund and the other investment companies that the Board oversees (the “MFS Funds”). The independent Trustees were assisted in their evaluation of the Fund’s investment advisory agreement by independent legal counsel, from whom they received separate legal advice and with whom they met separately from MFS during various contract review meetings. The independent Trustees were also assisted in this process by the MFS Funds’ Independent Chief Compliance Officer, a full-time senior officer appointed by and reporting to the independent Trustees.
In connection with their deliberations regarding the continuation of the investment advisory agreement, the Trustees, including the independent Trustees, considered such information and factors as they believed, in light of the legal advice furnished to them and their own business judgment, to be relevant. The investment advisory agreement for the Fund was considered separately, although the Trustees also took into account the common interests of all MFS Funds in their review. As described below, the Trustees considered the nature, quality, and extent of the various investment advisory, administrative, and shareholder services performed by MFS under the existing investment advisory agreement and other arrangements with the Fund.
In connection with their contract review meetings, the Trustees received and relied upon materials that included, among other items: (i) information provided by Lipper Inc., an independent third party, on the investment performance of the Fund for the one-year period ended December 31, 2012 and the investment performance of a group of funds with substantially similar investment classifications/objectives (the “Lipper performance universe”), (ii) information provided by Lipper Inc. on the Fund’s advisory fees and other expenses and the advisory fees and other expenses of comparable funds identified by Lipper Inc. (the “Lipper expense group”), (iii) information provided by MFS on the advisory fees of comparable portfolios of other clients of MFS, including institutional separate accounts and other clients, (iv) information as to whether and to what extent applicable expense waivers, reimbursements or fee “breakpoints” are observed for the Fund, (v) information regarding MFS’ financial results and financial condition, including MFS’ and certain of its affiliates’ estimated profitability from services performed for the Fund and the MFS Funds as a whole, and compared to MFS’ institutional business, (vi) MFS’ views regarding the outlook for the mutual fund industry and the strategic business plans of MFS, (vii) descriptions of various functions performed by MFS for the Funds, such as compliance monitoring and portfolio trading practices, and (viii) information regarding the overall organization of MFS, including information about MFS’ senior management and other personnel providing investment advisory, administrative and other services to
35
Board Review of Investment Advisory Agreement – continued
the Fund and the other MFS Funds. The comparative performance, fee and expense information prepared and provided by Lipper Inc. was not independently verified and the independent Trustees did not independently verify any information provided to them by MFS.
The Trustees’ conclusion as to the continuation of the investment advisory agreement was based on a comprehensive consideration of all information provided to the Trustees and not the result of any single factor. Some of the factors that figured particularly in the Trustees’ deliberations are described below, although individual Trustees may have evaluated the information presented differently from one another, giving different weights to various factors. It is also important to recognize that the fee arrangements for the Fund and other MFS Funds are the result of years of review and discussion between the independent Trustees and MFS, that certain aspects of such arrangements may receive greater scrutiny in some years than in others, and that the Trustees’ conclusions may be based, in part, on their consideration of these same arrangements during the course of the year and in prior years.
Based on information provided by Lipper Inc. and MFS, the Trustees reviewed the Fund’s total return investment performance as well as the performance of peer groups of funds for the one-year period ended December 31, 2012. The total return performance of the Fund’s Class A shares was in the 1st quintile relative to the other funds in the universe for this one-year period (the 1st quintile being the best performers and the 5th quintile being the worst performers). The Fund commenced operations on September 28, 2011 and has a limited operating history and performance record; therefore no performance data for the three- or five-year periods was available. Because of the passage of time, these performance results may differ from the performance results for more recent periods, including those shown elsewhere in this report.
In the course of their deliberations, the Trustees took into account information provided by MFS in connection with the contract review meetings, as well as during investment review meetings conducted with portfolio management personnel during the course of the year regarding the Fund’s performance. After reviewing these and related factors, the Trustees concluded, within the context of their overall conclusions regarding the investment advisory agreement, that they were satisfied with MFS’ responses and efforts relating to investment performance.
In assessing the reasonableness of the Fund’s advisory fee, the Trustees considered, among other information, the Fund’s advisory fee and the total expense ratio of the Fund’s Class A shares as a percentage of average daily net assets and the advisory fee and total expense ratios of peer groups of funds based on information provided by Lipper Inc. The Trustees considered that MFS currently observes an expense limitation for the Fund, which may not be changed without the Trustees’ approval. The Trustees also considered that, according to the Lipper data (which takes into account any fee reductions or expense limitations that were in effect during the Fund’s last fiscal year), the Fund’s effective advisory fee rate and total expense ratio were each lower than the Lipper expense group median.
The Trustees also considered the advisory fees charged by MFS to any comparable institutional accounts. In comparing these fees, the Trustees considered information
36
Board Review of Investment Advisory Agreement – continued
provided by MFS as to the generally broader scope of services provided by MFS to the Fund in comparison to institutional accounts, the higher demands placed on MFS’ investment personnel and trading infrastructure as a result of the daily cash in-flows and out-flows of the Fund, and the impact on MFS and expenses associated with the more extensive regulatory regime to which the Fund is subject in comparison to institutional accounts.
The Trustees also considered whether the Fund may benefit from any economies of scale in the management of the Fund in the event of growth in assets of the Fund and/or growth in assets of the MFS Funds as a whole. They noted that the Fund’s advisory fee rate schedule is subject to contractual breakpoints that reduce the Fund’s advisory fee rate on average daily net assets over $1 billion and $2.5 billion. The Trustees also noted that MFS has agreed in writing to waive a portion of the management fees of certain MFS Funds, including the Fund, if the total combined assets of certain funds within the MFS Funds’ complex increase above agreed upon thresholds (the “group fee waiver”), enabling the Fund’s shareholders to share in the benefits from any economies of scale at the complex level. The group fee waiver is reviewed and renewed annually between the Board and MFS. The Trustees concluded that the existing breakpoints and the group fee waiver were sufficient to allow the Fund to benefit from economies of scale as its assets and overall complex assets grow.
The Trustees also considered information prepared by MFS relating to MFS’ costs and profits with respect to the Fund, the MFS Funds considered as a group, and other investment companies and accounts advised by MFS, as well as MFS’ methodologies used to determine and allocate its costs to the MFS Funds, the Fund and other accounts and products for purposes of estimating profitability.
After reviewing these and other factors described herein, the Trustees concluded, within the context of their overall conclusions regarding the investment advisory agreement, that the advisory fees charged to the Fund represent reasonable compensation in light of the services being provided by MFS to the Fund.
In addition, the Trustees considered MFS’ resources and related efforts to continue to retain, attract and motivate capable personnel to serve the Fund. The Trustees also considered current and developing conditions in the financial services industry, including the presence of large and well-capitalized companies which are spending, and appear to be prepared to continue to spend, substantial sums to engage personnel and to provide services to competing investment companies. In this regard, the Trustees also considered the financial resources of MFS and its ultimate parent, Sun Life Financial Inc. The Trustees also considered the advantages and possible disadvantages to the Fund of having an adviser that also serves other investment companies as well as other accounts.
The Trustees also considered the nature, quality, cost, and extent of administrative, transfer agency, and distribution services provided to the Fund by MFS and its affiliates under agreements and plans other than the investment advisory agreement, including any 12b-1 fees the Fund pays to MFS Fund Distributors, Inc., an affiliate of MFS. The Trustees also considered the nature, extent and quality of certain other services MFS performs or arranges for on the Fund’s behalf, which may include securities lending programs, directed expense payment programs, class action recovery programs, and
37
Board Review of Investment Advisory Agreement – continued
MFS’ interaction with third-party service providers, principally custodians and sub-custodians. The Trustees concluded that the various non-advisory services provided by MFS and its affiliates on behalf of the Fund were satisfactory.
The Trustees also considered benefits to MFS from the use of the Fund’s portfolio brokerage commissions, if applicable, to pay for investment research and various other factors. Additionally, the Trustees considered so-called “fall-out benefits” to MFS such as reputational value derived from serving as investment manager to the Fund.
Based on their evaluation of factors that they deemed to be material, including those factors described above, the Board of Trustees, including the independent Trustees, concluded that the Fund’s investment advisory agreement with MFS should be continued for an additional one-year period, commencing August 1, 2013.
A discussion regarding the Board’s most recent review and renewal of the fund’s Investment Advisory Agreement with MFS is available by clicking on the fund’s name under “Mutual Funds” in the “Products” section of the MFS Web site (mfs.com).
38
PROXY VOTING POLICIES AND INFORMATION
A general description of the MFS funds’ proxy voting policies and procedures is available without charge, upon request, by calling 1-800-225-2606, by visiting the Proxy Voting section of mfs.com or by visiting the SEC’s Web site at http://www.sec.gov.
Information regarding how the fund voted proxies relating to portfolio securities during the most recent twelve-month period ended June 30 is available without charge by visiting the Proxy Voting section of mfs.com or by visiting the SEC’s Web site at http://www.sec.gov.
QUARTERLY PORTFOLIO DISCLOSURE
The fund will file a complete schedule of portfolio holdings with the Securities and Exchange Commission (the Commission) for the first and third quarters of each fiscal year on Form N-Q. A shareholder can obtain the quarterly portfolio holdings report at mfs.com. The fund’s Form N-Q is also available on the EDGAR database on the Commission’s Internet Web site at http://www.sec.gov, and may be reviewed and copied at the:
Public Reference Room
Securities and Exchange Commission
100 F Street, NE, Room 1580
Washington, D.C. 20549
Information on the operation of the Public Reference Room may be obtained by calling the Commission at 1-800-SEC-0330. Copies of the fund’s Form N-Q also may be obtained, upon payment of a duplicating fee, by electronic request at the following e-mail address: publicinfo@sec.gov or by writing the Public Reference Section at the above address.
FURTHER INFORMATION
From time to time, MFS may post important information about the fund or the MFS funds on the MFS web site (mfs.com). This information is available by visiting the “News & Commentary” section of mfs.com or by clicking on the fund’s name under “Mutual Funds” in the “Products” section of mfs.com.
FEDERAL TAX INFORMATION (unaudited)
The fund will notify shareholders of amounts for use in preparing 2013 income tax forms in January 2014. The following information is provided pursuant to provisions of the Internal Revenue Code.
The fund designates the maximum amount allowable as qualified dividend income eligible for the 15% tax rate.
The fund designates $29,033 as capital gain dividends paid during the fiscal year.
For corporate shareholders, 11.82% of the ordinary income dividends paid during the fiscal year qualify for the corporate dividends received deduction.
Income derived from foreign sources was $174,439. The fund intends to pass through foreign tax credits of $12,276 for the fiscal year.
39
rev. 3/11
| | | | |
| | | |
FACTS | | WHAT DOES MFS DO WITH YOUR PERSONAL INFORMATION? | |  |
| | |
| Why? | | Financial companies choose how they share your personal information. Federal law gives consumers the right to limit some but not all sharing. Federal law also requires us to tell you how we collect, share, and protect your personal information. Please read this notice carefully to understand what we do. |
| | |
| What? | | The types of personal information we collect and share depend on the product or service you have with us. This information can include: •Social Security number and account balances •Account transactions and transaction history •Checking account information and wire transfer instructions When you are no longer our customer, we continue to share your information as described in this notice. |
| | |
| How? | | All financial companies need to share customers’ personal information to run their everyday business. In the section below, we list the reasons financial companies can share their customers’ personal information; the reasons MFS chooses to share; and whether you can limit this sharing. |
| | | | |
Reasons we can share your
personal information | | Does MFS
share? | | Can you limit
this sharing? |
For our everyday business purposes – such as to process your transactions, maintain your account(s), respond to court orders and legal investigations, or report to credit bureaus | | Yes | | No |
For our marketing purposes – to offer our products and services to you | | No | | We don’t share |
| For joint marketing with other financial companies | | No | | We don’t share |
For our affiliates’ everyday business purposes – information about your transactions and experiences | | No | | We don’t share |
For our affiliates’ everyday business purposes – information about your creditworthiness | | No | | We don’t share |
| For nonaffiliates to market to you | | No | | We don’t share |
| | |
| Questions? | | Call 800-225-2606 or go to mfs.com. |
40
| | |
| Who we are |
| Who is providing this notice? | | MFS Funds, MFS Investment Management, MFS Institutional Advisors, Inc., MFS Fund Distributors, Inc., MFS Heritage Trust Company, and MFS Service Center, Inc. |
| | |
| What we do |
| How does MFS protect my personal information? | | To protect your personal information from unauthorized access and use, we use security measures that comply with federal law. These measures include procedural, electronic, and physical safeguards for the protection of the personal information we collect about you. |
| How does MFS collect my personal information? | | We collect your personal information, for example, when you •open an account or provide account information •direct us to buy securities or direct us to sell your securities •make a wire transfer We also collect your personal information from others, such as credit bureaus, affiliates and other companies. |
| Why can’t I limit all sharing? | | Federal law gives you the right to limit only •sharing for affiliates’ everyday business purposes – information about your creditworthiness •affiliates from using your information to market to you •sharing for nonaffiliates to market to you State laws and individual companies may give you additional rights to limit sharing. |
| | |
| Definitions |
| Affiliates | | Companies related by common ownership or control. They can be financial and nonfinancial companies. •MFS does not share personal information with affiliates, except for everyday business purposes as described on page one of this notice. |
| Nonaffiliates | | Companies not related by common ownership or control. They can be financial and nonfinancial companies. •MFS does not share with nonaffiliates so they can market to you. |
| Joint Marketing | | A formal agreement between nonaffiliated financial companies that together market financial products or services to you. •MFS doesn’t jointly market. |
| | |
| Other important information |
| If you own an MFS product or receive an MFS service in the name of a third party such as a bank or broker-dealer, their privacy policy may apply to you instead of ours. |
41
Save paper with eDelivery.

| MFS® will send you prospectuses, |
reports, and proxies directly via e-mail so you will get information faster with less mailbox clutter.
To sign up:
1. Go to mfs.com.
2. Log in via MFS® Access.
3. Select eDelivery.
If you own your MFS fund shares through a financial institution or a retirement plan, MFS® TALK, MFS® Access, or eDelivery may not be available to you.
CONTACT
WEB SITE
mfs.com
MFS TALK
1-800-637-8255
24 hours a day
ACCOUNT SERVICE AND LITERATURE
Shareholders
1-800-225-2606
Financial advisors
1-800-343-2829
Retirement plan services
1-800-637-1255
MAILING ADDRESS
MFS Service Center, Inc.
P.O. Box 55824
Boston, MA 02205-5824
OVERNIGHT MAIL
MFS Service Center, Inc.
c/o Boston Financial Data Services
30 Dan Road
Canton, MA 02021-2809
The Registrant has adopted a Code of Ethics pursuant to Section 406 of the Sarbanes-Oxley Act and as defined in Form N-CSR that applies to the Registrant’s principal executive officer and principal financial and accounting officer. During the period covered by this report, the Registrant has not amended any provision in its Code of Ethics (the “Code”) that relates to an element of the Code’s definitions enumerated in paragraph (b) of Item 2 of this Form N-CSR. During the period covered by this report, the Registrant did not grant a waiver, including an implicit waiver, from any provision of the Code.
A copy of the Code of Ethics is filed as an exhibit to this Form N-CSR.
| ITEM 3. | AUDIT COMMITTEE FINANCIAL EXPERT. |
Messrs. Robert E. Butler, John P. Kavanaugh and Robert W. Uek and Ms. Laurie J. Thomsen, members of the Audit Committee, have been determined by the Board of Trustees in their reasonable business judgment to meet the definition of “audit committee financial expert” as such term is defined in Form N-CSR. In addition, Messrs. Butler, Kavanaugh and Uek and Ms. Thomsen are “independent” members of the Audit Committee (as such term has been defined by the Securities and Exchange Commission in regulations implementing Section 407 of the Sarbanes-Oxley Act of 2002). The Securities and Exchange Commission has stated that the designation of a person as an audit committee financial expert pursuant to this Item 3 on the Form N-CSR does not impose on such a person any duties, obligations or liability that are greater than the duties, obligations or liability imposed on such person as a member of the Audit Committee and the Board of Trustees in the absence of such designation or identification.
| ITEM 4. | PRINCIPAL ACCOUNTANT FEES AND SERVICES. |
Items 4(a) through 4(d) and 4(g):
The Board of Trustees has appointed Deloitte & Touche LLP (“Deloitte”) to serve as independent accountants to certain series of the Registrant and Ernst & Young LLP (“E&Y”) to serve in the same capacity to certain other series of the Registrant (the series referred to collectively as the “Funds” and singularly as a “Fund”). The tables below set forth the audit fees billed to the Funds as well as fees for non-audit services provided to the Funds and/or to the Funds’ investment adviser, Massachusetts Financial Services Company (“MFS”), and to various entities either controlling, controlled by, or under common control with MFS that provide ongoing services to the Funds (“MFS Related Entities”).
For the fiscal years ended August 31, 2013 and 2012, audit fees billed to the Funds by Deloitte and E&Y were as follows:**
| | | | | | | | |
| | | Audit Fees | |
Fees Billed by Deloitte | | 2013 | | | 2012 | |
MFS Cash Reserve Fund | | | 30,532 | | | | 29,949 | |
MFS Global Leaders Fund | | | 43,640 | | | | 21,800 | |
Total | | | 74,172 | | | | 51,749 | |
| |
| | | Audit Fees | |
Fees Billed by E&Y | | 2013 | | | 2012 | |
MFS Core Equity Fund | | | 43,252 | | | | 41,930 | |
MFS New Discovery Fund | | | 43,262 | | | | 42,430 | |
MFS Research International Fund | | | 46,106 | | | | 45,218 | |
MFS Technology Fund | | | 43,252 | | | | 41,930 | |
MFS Value Fund | | | 43,375 | | | | 42,540 | |
Total | | | 219,247 | | | | 214,048 | |
For the fiscal years ended August 31, 2013 and 2012, fees billed by Deloitte and E&Y for audit-related, tax and other services provided to the Funds and for audit-related, tax and other services provided to MFS and MFS Related Entities were as follows:**
| | | | | | | | | | | | | | | | | | | | | | | | |
| | | Audit-Related Fees1 | | | Tax Fees2 | | | All Other Fees3 | |
Fees Billed by Deloitte | | 2013 | | | 2012 | | | 2013 | | | 2012 | | | 2013 | | | 2012 | |
To MFS Cash Reserve Fund | | | 0 | | | | 0 | | | | 3,092 | | | | 3,031 | | | | 1,040 | | | | 798 | |
To MFS Global Leaders Fund | | | 0 | | | | 0 | | | | 5,697 | | | | 5,585 | | | | 1,001 | | | | 1,001 | |
Total fees billed by Deloitte To above Funds | | | 0 | | | | 0 | | | | 8,789 | | | | 8,616 | | | | 2,041 | | | | 1,799 | |
| | | |
| | | Audit-Related Fees | | | Tax Fees | | | All Other Fees | |
Fees Billed by Deloitte | | 2013 | | | 2012 | | | 2013 | | | 2012 | | | 2013 | | | 2012 | |
To MFS and MFS Related Entities of MFS Cash Reserve Fund* | | | 1,493,881 | | | | 1,249,664 | | | | 0 | | | | 0 | | | | 0 | | | | 0 | |
To MFS and MFS Related Entities of MFS Global Leaders Fund* | | | 1,493,881 | | | | 1,249,664 | | | | 0 | | | | 0 | | | | 0 | | | | 0 | |
| | | | | | | | |
| | | Aggregate Fees for Non-audit Services | |
Fees Billed by Deloitte | | 2013 | | | 20125 | |
To MFS Cash Reserve Fund, MFS and MFS Related Entities# | | | 1,527,124 | | | | 1,552,342 | |
To MFS Global Leaders Fund, MFS and MFS Related Entities# | | | 1,529,690 | | | | 1,555,099 | |
| | | | | | | | | | | | | | | | | | | | | | | | |
| | | Audit-Related Fees1 | | | Tax Fees2 | | | All Other Fees4 | |
Fees Billed by E&Y | | 2013 | | | 2012 | | | 2013 | | | 2012 | | | 2013 | | | 2012 | |
To MFS Core Equity Fund | | | 0 | | | | 0 | | | | 8,358 | | | | 8,800 | | | | 0 | | | | 0 | |
To MFS New Discovery Fund | | | 0 | | | | 0 | | | | 8,358 | | | | 8,800 | | | | 0 | | | | 0 | |
To MFS Research International Fund | | | 0 | | | | 0 | | | | 8,784 | | | | 9,217 | | | | 0 | | | | 0 | |
To MFS Technology Fund | | | 0 | | | | 0 | | | | 8,358 | | | | 8,800 | | | | 0 | | | | 0 | |
To MFS Value Fund | | | 0 | | | | 0 | | | | 8,357 | | | | 8,800 | | | | 0 | | | | 0 | |
Total fees billed by E&Y To above Funds | | | 0 | | | | 0 | | | | 42,215 | | | | 44,417 | | | | 0 | | | | 0 | |
| | | |
| | | Audit-Related Fees | | | Tax Fees | | | All Other Fees | |
Fees Billed by E&Y | | 2013 | | | 2012 | | | 2013 | | | 2012 | | | 2013 | | | 2012 | |
To MFS and MFS Related Entities of MFS Core Equity Fund* | | | 0 | | | | 0 | | | | 0 | | | | 0 | | | | 0 | | | | 0 | |
To MFS and MFS Related Entities of MFS New Discovery Fund* | | | 0 | | | | 0 | | | | 0 | | | | 0 | | | | 0 | | | | 0 | |
To MFS and MFS Related Entities of MFS Research International Fund* | | | 0 | | | | 0 | | | | 0 | | | | 0 | | | | 0 | | | | 0 | |
To MFS and MFS Related Entities of MFS Technology Fund* | | | 0 | | | | 0 | | | | 0 | | | | 0 | | | | 0 | | | | 0 | |
To MFS and MFS Related Entities of MFS Value Fund* | | | 0 | | | | 0 | | | | 0 | | | | 0 | | | | 0 | | | | 0 | |
| | | | | | | | |
| | | Aggregate Fees for Non-audit Services | |
Fees Billed by E&Y | | 2013 | | | 2012 | |
To MFS Core Equity Fund, MFS and MFS Related Entities# | | | 56,358 | | | | 133,800 | |
To MFS New Discovery Fund, MFS and MFS Related Entities# | | | 56,358 | | | | 133,800 | |
To MFS Research International Fund, MFS and MFS Related Entities# | | | 56,784 | | | | 134,217 | |
To MFS Technology Fund, MFS and MFS Related Entities# | | | 56,358 | | | | 133,800 | |
To MFS Value Fund, MFS and MFS Related Entities# | | | 56,357 | | | | 133,800 | |
| * | This amount reflects the fees billed to MFS and MFS Related Entities for non-audit services relating directly to the operations and financial reporting of the Funds (portions of which services also related to the operations and financial reporting of other funds within the MFS Funds complex). |
| ** | Information regarding the MFS Low Volatility Equity Fund and MFS Low Volatility Global Equity Fund has not been included because these series of the Registrant did not commence investment operations during the reporting period. See note above. |
| # | This amount reflects the aggregate fees billed by Deloitte or E&Y for non-audit services rendered to the Funds and for non-audit services rendered to MFS and the MFS Related Entities. |
| 1 | The fees included under “Audit-Related Fees” are fees related to assurance and related services that are reasonably related to the performance of the audit or review of financial statements, but not reported under ‘‘Audit Fees,’’ including accounting consultations, agreed-upon procedure reports, attestation reports, comfort letters and internal control reviews. |
| 2 | The fees included under “Tax Fees” are fees associated with tax compliance, tax advice and tax planning, including services relating to the filing or amendment of federal, state or local income tax returns, regulated investment company qualification reviews and tax distribution and analysis. |
| 3 | The fees included under “All Other Fees” are fees for products and services provided by Deloitte other than those reported under “Audit Fees,” “Audit-Related Fees” and “Tax Fees,” including fees for services related to analysis of certain portfolio holdings, and review of internal controls and review of Rule 38a-1 compliance program. |
| 4 | The fees under “All Other Fees” are fees for products and services provided by E&Y other than those reported under “Audit Fees,” “Audit-Related Fees” and “Tax Fees”. |
| 5 | Certain fees reported in 2012 have been restated in this filing from those reported in the Registrant’s filing for the reporting period ended August 31, 2012. |
Item 4(e)(1):
Set forth below are the policies and procedures established by the Audit Committee of the Board of Trustees relating to the pre-approval of audit and non-audit related services:
To the extent required by applicable law, pre-approval by the Audit Committee of the Board is needed for all audit and permissible non-audit services rendered to the Funds and all permissible non-audit services rendered to MFS or MFS Related Entities if the services relate directly to the operations and financial reporting of the Registrant. Pre-approval is currently on an engagement-by-engagement basis. In the event pre-approval of such services is necessary between regular meetings of the Audit Committee and it is not practical to wait to seek pre-approval at the next regular meeting of the Audit Committee, pre-approval of such services may be referred to the Chair of the Audit Committee for approval; provided that the Chair may not pre-approve any individual engagement for such services exceeding $50,000 or multiple engagements for such services in the aggregate exceeding $100,000 in each period between regular meetings of the Audit Committee. Any engagement pre-approved by the Chair between regular meetings of the Audit Committee shall be presented for ratification by the entire Audit Committee at its next regularly scheduled meeting.
Item 4(e)(2):
None, or 0%, of the services relating to the Audit-Related Fees, Tax Fees and All Other Fees paid by the Fund and MFS and MFS Related Entities relating directly to the operations and financial reporting of the Registrant disclosed above were approved by the audit committee pursuant to paragraphs (c)(7)(i)(C) of Rule 2-01 of Regulation S-X (which permits audit committee approval after the start of the engagement with respect to services other than audit, review or attest services, if certain conditions are satisfied).
Item 4(f): Not applicable.
Item 4(h): The Registrant’s Audit Committee has considered whether the provision by a Registrant’s independent registered public accounting firm of non-audit services to MFS and MFS Related Entities that were not pre-approved by the Committee (because such services did not relate directly to the operations and financial reporting of the Registrant) was compatible with maintaining the independence of the independent registered public accounting firm as the Registrant’s principal auditors.
| ITEM 5. | AUDIT COMMITTEE OF LISTED REGISTRANTS. |
Not applicable to the Registrant.
A schedule of investments of the Registrant is included as part of the report to shareholders of such series under Item 1 of this Form N-CSR.
| ITEM 7. | DISCLOSURE OF PROXY VOTING POLICIES AND PROCEDURES FOR CLOSED-END MANAGEMENT INVESTMENT COMPANIES. |
Not applicable to the Registrant.
| ITEM 8. | PORTFOLIO MANAGERS OF CLOSED-END MANAGEMENT INVESTMENT COMPANIES. |
Not applicable to the Registrant.
| ITEM 9. | PURCHASES OF EQUITY SECURITIES BY CLOSED-END MANAGEMENT INVESTMENT COMPANY AND AFFILIATED PURCHASERS. |
Not applicable to the Registrant.
| ITEM 10. | SUBMISSION OF MATTERS TO A VOTE OF SECURITY HOLDERS. |
There were no material changes to the procedures by which shareholders may send recommendations to the Board for nominees to the Registrant’s Board since the Registrant last provided disclosure as to such procedures in response to the requirements of Item 407 (c)(2)(iv) of Regulation S-K or this Item.
| ITEM 11. | CONTROLS AND PROCEDURES. |
| (a) | Based upon their evaluation of the effectiveness of the registrant’s disclosure controls and procedures (as defined in Rule 30a-3(c) under the Investment Company Act of 1940 (the “Act”)) as conducted within 90 days of the filing date of this report on Form N-CSR, the registrant’s principal financial officer and principal executive officer have concluded that those disclosure controls and procedures provide reasonable assurance that the material information required to be disclosed by the registrant on this report is recorded, processed, summarized and reported within the time periods specified in the Securities and Exchange Commission’s rules and forms. |
| (b) | There were no changes in the registrant’s internal controls over financial reporting (as defined in Rule 30a-3(d) under the Act) that occurred during the second fiscal quarter of the period covered by the report that have materially affected, or are reasonably likely to materially affect, the registrant’s internal control over financial reporting. |
| (a) | File the exhibits listed below as part of this form. Letter or number the exhibits in the sequence indicated. |
| | (1) | Any code of ethics, or amendment thereto, that is the subject of the disclosure required by Item 2, to the extent that the registrant intends to satisfy the Item 2 requirements through filing of an exhibit: Code of Ethics attached hereto. |
| | (2) | A separate certification for each principal executive officer and principal financial officer of the registrant as required by Rule 30a-2 under the Act (17 CFR 270.30a-2): Attached hereto. |
| (b) | If the report is filed under Section 13(a) or 15(d) of the Exchange Act, provide the certifications required by Rule 30a-2(b) under the Act (17 CFR 270.30a-2(b)), Rule 13a-14(b) or Rule 15d-14(b) under the Exchange Act (17 CFR 240.13a-14(b) or 240.15d-14(b)) and Section 1350 of Chapter 63 of Title 18 of the United States Code (18 U.S.C. 1350) as an exhibit. A certification furnished pursuant to this paragraph will not be deemed “filed” for the purposes of Section 18 of the Exchange Act (15 U.S.C. 78r), or otherwise subject to the liability of that section. Such certification will not be deemed to be incorporated by reference into any filing under the Securities Act of 1933 or the Exchange Act, except to the extent that the registrant specifically incorporates it by reference: Attached hereto. |
Notice
A copy of the Amended and Restated Declaration of Trust, as amended, of the Registrant is on file with the Secretary of State of The Commonwealth of Massachusetts and notice is hereby given that this instrument is executed on behalf of the Registrant by an officer of the Registrant as an officer and not individually and the obligations of or arising out of this instrument are not binding upon any of the Trustees or shareholders individually, but are binding only upon the assets and property of the respective constituent series of the Registrant.
SIGNATURES
Pursuant to the requirements of the Securities Exchange Act of 1934 and the Investment Company Act of 1940, the registrant has duly caused this report to be signed on its behalf by the undersigned, thereunto duly authorized.
(Registrant) MFS SERIES TRUST I
| | |
| By (Signature and Title)* | | JOHN M. CORCORAN |
| | John M. Corcoran, President |
Date: October 17, 2013
Pursuant to the requirements of the Securities Exchange Act of 1934 and the Investment Company Act of 1940, this report has been signed below by the following persons on behalf of the registrant and in the capacities and on the dates indicated.
| | |
| By (Signature and Title)* | | JOHN M. CORCORAN |
| | John M. Corcoran, President (Principal Executive Officer) |
Date: October 17, 2013
| | |
| By (Signature and Title)* | | DAVID L. DILORENZO |
| | David L. DiLorenzo, Treasurer (Principal Financial Officer and Accounting Officer) |
Date: October 17, 2013
| * | Print name and title of each signing officer under his or her signature. |