UNITED STATES
SECURITIES AND EXCHANGE COMMISSION Washington, D.C. 20549
FORM N-CSR
CERTIFIED SHAREHOLDER REPORT OF REGISTERED MANAGEMENT INVESTMENT COMPANIES
Investment Company Act file number 811-04777
MFS SERIES TRUST I
(Exact name of registrant as specified in charter)
111 Huntington Avenue, Boston, Massachusetts 02199 (Address of principal executive offices) (Zip code)
Christopher R. Bohane
Massachusetts Financial Services Company
111Huntington Avenue Boston, Massachusetts 02199
(Name and address of agents for service)
Registrant's telephone number, including area code: (617) 954-5000
Date of fiscal year end: August 31
Date of reporting period: February 28, 2023
ITEM 1. REPORTS TO STOCKHOLDERS.
Item 1(a):
Semiannual Report
February 28, 2023
The report is prepared for the general information of shareholders. It is authorized for distribution to prospective investors only when preceded or accompanied by a current prospectus.
NOT FDIC INSURED • MAY LOSE VALUE • NO BANK GUARANTEE
LETTER FROM THE CHAIR AND CEO
Dear Shareholders:
Markets — which rallied in late 2022 and early 2023 on signs of peaking inflation, hopes that monetary policy tightening cycles may be nearing an end and a rapid reopening of China’s economy — have hit turbulence after the sudden collapse of two US regional banks and the government-led merger of Switzerland’s two largest lenders. At the same time, US inflation data suggest that price pressures will prove more persistent than expected, making the US Federal Reserve’s job of trying to corral four-decade-high inflation without tipping the economy into recession that much more difficult. On a positive note, markets have largely adjusted to the challenges posed by Russia’s invasion of Ukraine, thanks in part to mild European winter weather that has alleviated concerns over potential near-term shortages of natural gas. Resilient labor markets in much of the developed world have further contributed to a brighter-than-expected economic backdrop. However, after the recent banking turmoil, investors are increasingly mindful that the lagged effects of ongoing monetary policy tightening have yet to fully work their way through the global economy.
One result of the banking crisis has been a rally in global government bond markets as investors sense that the global monetary tightening campaign is nearing its end, and the resulting lower yields have eased some of the pressure on interest rate–sensitive parts of the economy. Over the near term, amid tighter financial conditions, we feel companies will face a challenging earnings backdrop as they are forced to absorb higher input and labor costs while pricing power dwindles. As for fixed income, the rise in interest rates in recent months has made bonds more attractive than they have been in years, which may provide balance for investors’ portfolios.
During times of market transition, it is important to have a deep understanding of company fundamentals, and we have built our unique global research platform to do just that.
At MFS®, we put our clients’ assets to work responsibly by carefully navigating increasingly complex global capital markets. Our investment team is guided by a commitment to long-term fundamental investing. Our global investment platform — combining collective expertise, long-term discipline, and thoughtful risk management — seeks to uncover what we believe are the best, most durable investment ideas in markets around the world, enabling us to potentially create value for investors.
Respectfully,
Michael W. Roberge
Chair and Chief Executive Officer
MFS Investment Management
April 14, 2023
The opinions expressed in this letter are subject to change and may not be relied upon for investment advice. No forecasts can be guaranteed.
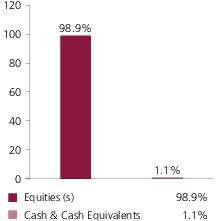
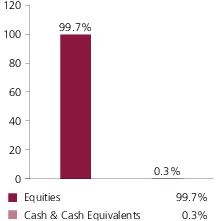
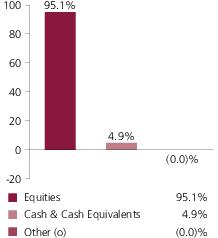
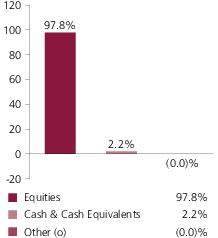
Portfolio structure
Top ten holdings
| Apple, Inc. | 6.2% |
| Microsoft Corp. | 5.7% |
| Alphabet, Inc., “A” | 3.1% |
| Amazon.com, Inc. | 2.6% |
| Exxon Mobil Corp. | 2.2% |
| Visa, Inc., “A” | 1.8% |
| JPMorgan Chase & Co. | 1.7% |
| Cigna Group | 1.4% |
| Johnson & Johnson | 1.3% |
| Home Depot, Inc. | 1.2% |
Global equity sectors (k)
| Technology | 28.1% |
| Financial Services | 15.2% |
| Health Care (s) | 14.8% |
| Capital Goods | 14.1% |
| Consumer Cyclicals | 11.5% |
| Energy | 8.1% |
| Consumer Staples | 5.1% |
| Telecommunications/Cable Television (s) | 2.0% |
| (k) | The sectors set forth above and the associated portfolio composition are based on MFS’ own custom sector classification methodology. |
| (s) | Includes securities sold short. |
Cash & Cash Equivalents includes any cash, investments in money market funds, short-term securities, and other assets less liabilities. Please see the Statement of Assets and Liabilities for additional information related to the fund’s cash position and other assets and liabilities.
Percentages are based on net assets as of February 28, 2023.
The portfolio is actively managed and current holdings may be different.
Expense Table
Fund expenses borne by the shareholders during the period,
September 1, 2022 through February 28, 2023
As a shareholder of the fund, you incur two types of costs: (1) transaction costs, including sales charges (loads) on certain purchase or redemption payments, and (2) ongoing costs, including management fees; distribution and service (12b-1) fees; and other fund expenses. This example is intended to help you understand your ongoing costs (in dollars) of investing in the fund and to compare these costs with the ongoing costs of investing in other mutual funds.
The example is based on an investment of $1,000 invested at the beginning of the period and held for the entire period September 1, 2022 through February 28, 2023.
Actual Expenses
The first line for each share class in the following table provides information about actual account values and actual expenses. You may use the information in this line, together with the amount you invested, to estimate the expenses that you paid over the period. Simply divide your account value by $1,000 (for example, an $8,600 account value divided by $1,000 = 8.6), then multiply the result by the number in the first line under the heading entitled “Expenses Paid During Period” to estimate the expenses you paid on your account during this period.
Hypothetical Example for Comparison Purposes
The second line for each share class in the following table provides information about hypothetical account values and hypothetical expenses based on the fund’s actual expense ratio and an assumed rate of return of 5% per year before expenses, which is not the fund’s actual return. The hypothetical account values and expenses may not be used to estimate the actual ending account balance or expenses you paid for the period. You may use this information to compare the ongoing costs of investing in the fund and other funds. To do so, compare this 5% hypothetical example with the 5% hypothetical examples that appear in the shareholder reports of the other funds.
Please note that the expenses shown in the table are meant to highlight your ongoing costs only and do not reflect any transactional costs, such as sales charges (loads). Therefore, the second line for each share class in the table is useful in comparing ongoing costs only, and will not help you determine the relative total costs of owning different funds. In addition, if these transactional costs were included, your costs would have been higher.
Expense Table - continued
Share
Class | | Annualized
Expense
Ratio | Beginning
Account Value
9/01/22 | Ending
Account Value
2/28/23 | Expenses
Paid During
Period (p)
9/01/22-2/28/23 |
| A | Actual | 0.91% | $1,000.00 | $1,012.41 | $4.54 |
| Hypothetical (h) | 0.91% | $1,000.00 | $1,020.28 | $4.56 |
| B | Actual | 1.66% | $1,000.00 | $1,009.01 | $8.27 |
| Hypothetical (h) | 1.66% | $1,000.00 | $1,016.56 | $8.30 |
| C | Actual | 1.66% | $1,000.00 | $1,008.85 | $8.27 |
| Hypothetical (h) | 1.66% | $1,000.00 | $1,016.56 | $8.30 |
| I | Actual | 0.66% | $1,000.00 | $1,013.99 | $3.30 |
| Hypothetical (h) | 0.66% | $1,000.00 | $1,021.52 | $3.31 |
| R1 | Actual | 1.66% | $1,000.00 | $1,008.71 | $8.27 |
| Hypothetical (h) | 1.66% | $1,000.00 | $1,016.56 | $8.30 |
| R2 | Actual | 1.14% | $1,000.00 | $1,011.35 | $5.69 |
| Hypothetical (h) | 1.14% | $1,000.00 | $1,019.14 | $5.71 |
| R3 | Actual | 0.91% | $1,000.00 | $1,012.52 | $4.54 |
| Hypothetical (h) | 0.91% | $1,000.00 | $1,020.28 | $4.56 |
| R4 | Actual | 0.66% | $1,000.00 | $1,013.83 | $3.30 |
| Hypothetical (h) | 0.66% | $1,000.00 | $1,021.52 | $3.31 |
| R6 | Actual | 0.57% | $1,000.00 | $1,014.19 | $2.85 |
| Hypothetical (h) | 0.57% | $1,000.00 | $1,021.97 | $2.86 |
| (h) | 5% class return per year before expenses. |
| (p) | “Expenses Paid During Period” are equal to each class’s annualized expense ratio, as shown above, multiplied by the average account value over the period, multiplied by 181/365 (to reflect the one-half year period). Expenses paid do not include any applicable sales charges (loads). If these transaction costs had been included, your costs would have been higher. |
Notes to Expense Table
Expense ratios include 0.01% of investment related expenses from short sales (See Note 2 of the Notes to Financial Statements).
Each class with a Rule 12b-1 service fee is subject to a rebate of a portion of such fee. Such rebates are included in the expense ratios above. For Class R2 shares, this rebate reduced the expense ratio above by 0.01%. See Note 3 in the Notes to Financial Statements for additional information.
Portfolio of Investments
2/28/23 (unaudited)
The Portfolio of Investments is a complete list of all securities owned by your fund. It is categorized by broad-based asset classes.
| Issuer | | | Shares/Par | Value ($) |
| Common Stocks – 99.1% |
| Aerospace & Defense – 2.4% | |
| Boeing Co. (a) | | 72,331 | $14,578,313 |
| Curtiss-Wright Corp. | | 55,702 | 9,736,153 |
| General Dynamics Corp. | | 84,682 | 19,299,875 |
| Honeywell International, Inc. | | 176,454 | 33,787,412 |
| Howmet Aerospace, Inc. | | 381,581 | 16,095,087 |
| Leidos Holdings, Inc. | | 106,903 | 10,377,074 |
| Raytheon Technologies Corp. | | 327,973 | 32,170,871 |
| | | | | $136,044,785 |
| Alcoholic Beverages – 0.5% | |
| Constellation Brands, Inc., “A” | | 120,920 | $27,049,804 |
| Apparel Manufacturers – 0.4% | |
| NIKE, Inc., “B” | | 66,701 | $7,923,412 |
| On Holding AG (a) | | 274,982 | 6,013,856 |
| Skechers USA, Inc., “A” (a) | | 136,600 | 6,080,066 |
| | | | | $20,017,334 |
| Automotive – 0.9% | |
| Aptiv PLC (a) | | 225,310 | $26,199,047 |
| LKQ Corp. | | 431,250 | 24,706,312 |
| | | | | $50,905,359 |
| Biotechnology – 0.1% | |
| Adaptive Biotechnologies Corp. (a) | | 318,825 | $2,725,954 |
| Oxford Nanopore Technologies PLC (a) | | 958,296 | 2,409,114 |
| | | | | $5,135,068 |
| Broadcasting – 1.1% | |
| Omnicom Group, Inc. | | 131,709 | $11,928,884 |
| Walt Disney Co. (a) | | 349,592 | 34,822,859 |
| Warner Bros. Discovery, Inc. (a) | | 852,078 | 13,309,459 |
| | | | | $60,061,202 |
| Brokerage & Asset Managers – 2.0% | |
| Charles Schwab Corp. | | 390,092 | $30,395,969 |
| CME Group, Inc. | | 149,199 | 27,655,527 |
| Invesco Ltd. | | 99,971 | 1,765,488 |
| KKR & Co., Inc. | | 203,210 | 11,450,883 |
| LPL Financial Holdings, Inc. | | 27,730 | 6,920,299 |
Portfolio of Investments (unaudited) – continued
| Issuer | | | Shares/Par | Value ($) |
| Common Stocks – continued |
| Brokerage & Asset Managers – continued | |
| Raymond James Financial, Inc. | | 309,172 | $33,532,795 |
| | | | | $111,720,961 |
| Business Services – 2.3% | |
| Accenture PLC, “A” | | 172,860 | $45,902,973 |
| Amdocs Ltd. | | 215,022 | 19,698,165 |
| Equifax, Inc. | | 23,022 | 4,662,646 |
| Fidelity National Information Services, Inc. | | 254,721 | 16,141,670 |
| Thoughtworks Holding, Inc. (a) | | 651,880 | 4,797,837 |
| TriNet Group, Inc. (a) | | 115,118 | 9,539,829 |
| WNS (Holdings) Ltd., ADR (a) | | 295,220 | 25,660,522 |
| | | | | $126,403,642 |
| Cable TV – 0.3% | |
| Cable One, Inc. | | 24,111 | $16,651,298 |
| Chemicals – 0.1% | |
| Element Solutions, Inc. | | 378,460 | $7,773,568 |
| Computer Software – 9.4% | |
| Adobe Systems, Inc. (a) | | 109,035 | $35,321,888 |
| Atlassian Corp. (a) | | 135,464 | 22,260,799 |
| Black Knight, Inc. (a) | | 288,382 | 17,187,567 |
| Cadence Design Systems, Inc. (a) | | 168,112 | 32,435,530 |
| Check Point Software Technologies Ltd. (a) | | 66,874 | 8,273,651 |
| Dun & Bradstreet Holdings, Inc. | | 899,687 | 10,805,241 |
| Elastic N.V. (a) | | 103,006 | 6,079,414 |
| Intuit, Inc. | | 56,412 | 22,969,838 |
| Microsoft Corp. (s) | | 1,283,839 | 320,215,124 |
| NICE Systems Ltd., ADR (a) | | 79,242 | 16,435,583 |
| Salesforce, Inc. (a) | | 229,065 | 37,477,325 |
| | | | | $529,461,960 |
| Computer Software - Systems – 7.7% | |
| Apple, Inc. (s) | | 2,372,326 | $349,704,575 |
| Block, Inc., “A” (a) | | 189,251 | 14,521,229 |
| Five9, Inc. (a) | | 81,056 | 5,349,696 |
| Rapid7, Inc. (a) | | 169,133 | 7,999,991 |
| ServiceNow, Inc. (a) | | 95,041 | 41,073,869 |
| Zebra Technologies Corp., “A” (a) | | 45,891 | 13,778,773 |
| | | | | $432,428,133 |
Portfolio of Investments (unaudited) – continued
| Issuer | | | Shares/Par | Value ($) |
| Common Stocks – continued |
| Construction – 1.4% | |
| AvalonBay Communities, Inc., REIT | | 109,818 | $18,945,802 |
| AZEK Co., Inc. (a) | | 401,070 | 9,661,776 |
| Masco Corp. | | 290,941 | 15,254,037 |
| Sherwin-Williams Co. | | 76,995 | 17,042,843 |
| Vulcan Materials Co. | | 88,186 | 15,953,729 |
| | | | | $76,858,187 |
| Consumer Products – 1.4% | |
| Colgate-Palmolive Co. | | 311,071 | $22,801,504 |
| International Flavors & Fragrances, Inc. | | 111,786 | 10,418,455 |
| Kimberly-Clark Corp. | | 146,714 | 18,346,586 |
| Procter & Gamble Co. | | 187,274 | 25,761,412 |
| | | | | $77,327,957 |
| Consumer Services – 0.8% | |
| Booking Holdings, Inc. (a) | | 8,654 | $21,842,696 |
| Bright Horizons Family Solutions, Inc. (a) | | 162,971 | 12,848,634 |
| Grand Canyon Education, Inc. (a) | | 72,366 | 8,198,344 |
| | | | | $42,889,674 |
| Containers – 0.2% | |
| Crown Holdings, Inc. | | 111,739 | $9,666,541 |
| Electrical Equipment – 2.0% | |
| AMETEK, Inc. | | 239,573 | $33,913,954 |
| Amphenol Corp., “A” | | 190,596 | 14,775,002 |
| Johnson Controls International PLC | | 493,596 | 30,958,341 |
| Sensata Technologies Holding PLC | | 504,982 | 25,541,990 |
| TE Connectivity Ltd. | | 50,936 | 6,485,171 |
| | | | | $111,674,458 |
| Electronics – 4.8% | |
| Advanced Micro Devices (a) | | 260,468 | $20,467,575 |
| Analog Devices, Inc. | | 210,120 | 38,550,716 |
| Applied Materials, Inc. | | 312,046 | 36,244,143 |
| Broadcom, Inc. | | 101,168 | 60,123,131 |
| Lam Research Corp. | | 56,549 | 27,483,380 |
| Marvell Technology, Inc. | | 386,392 | 17,445,599 |
| Monolithic Power Systems, Inc. | | 34,281 | 16,601,945 |
| NXP Semiconductors N.V. | | 164,731 | 29,401,189 |
| Texas Instruments, Inc. | | 149,280 | 25,594,056 |
| | | | | $271,911,734 |
Portfolio of Investments (unaudited) – continued
| Issuer | | | Shares/Par | Value ($) |
| Common Stocks – continued |
| Energy - Independent – 1.8% | |
| ConocoPhillips | | 312,664 | $32,313,824 |
| Diamondback Energy, Inc. | | 181,591 | 25,528,063 |
| Hess Corp. | | 126,657 | 17,060,698 |
| Valero Energy Corp. | | 191,931 | 25,283,071 |
| | | | | $100,185,656 |
| Energy - Integrated – 2.2% | |
| Exxon Mobil Corp. (s) | | 1,137,172 | $124,986,574 |
| Energy - Renewables – 0.2% | |
| Enphase Energy, Inc. (a) | | 47,205 | $9,938,068 |
| Generac Holdings, Inc. (a) | | 20,374 | 2,445,084 |
| | | | | $12,383,152 |
| Engineering - Construction – 0.3% | |
| APi Group, Inc. (a) | | 290,601 | $6,826,217 |
| Jacobs Solutions, Inc. | | 92,184 | 11,015,988 |
| | | | | $17,842,205 |
| Entertainment – 0.1% | |
| Vivid Seats, Inc., “A” (a)(l) | | 700,232 | $5,370,779 |
| Food & Beverages – 2.6% | |
| Archer Daniels Midland Co. | | 206,198 | $16,413,361 |
| Coca-Cola Co. | | 164,235 | 9,773,625 |
| Coca-Cola Europacific Partners PLC | | 221,371 | 12,175,405 |
| J.M. Smucker Co. | | 67,512 | 9,984,350 |
| Mondelez International, Inc. | | 579,436 | 37,767,638 |
| Oatly Group AB, ADR (a)(l) | | 2,373,645 | 5,222,019 |
| PepsiCo, Inc. | | 323,335 | 56,108,322 |
| | | | | $147,444,720 |
| Forest & Paper Products – 0.4% | |
| Rayonier, Inc., REIT | | 673,589 | $22,619,119 |
| Gaming & Lodging – 0.6% | |
| International Game Technology PLC | | 460,686 | $12,235,820 |
| Las Vegas Sands Corp. (a) | | 83,041 | 4,772,367 |
| Marriott International, Inc., “A” | | 97,680 | 16,531,363 |
| | | | | $33,539,550 |
| General Merchandise – 0.9% | |
| Dollar General Corp. | | 146,041 | $31,588,668 |
| Dollar Tree, Inc. (a) | | 146,817 | 21,329,574 |
| | | | | $52,918,242 |
Portfolio of Investments (unaudited) – continued
| Issuer | | | Shares/Par | Value ($) |
| Common Stocks – continued |
| Health Maintenance Organizations – 1.5% | |
| Cigna Group | | 259,999 | $75,945,708 |
| Humana, Inc. | | 18,779 | 9,295,980 |
| | | | | $85,241,688 |
| Insurance – 4.0% | |
| Aon PLC | | 179,710 | $54,640,825 |
| Arthur J. Gallagher & Co. | | 168,304 | 31,531,754 |
| Assurant, Inc. | | 68,737 | 8,756,406 |
| Chubb Ltd. | | 179,435 | 37,864,374 |
| Hartford Financial Services Group, Inc. | | 243,338 | 19,048,499 |
| MetLife, Inc. | | 250,247 | 17,950,217 |
| Reinsurance Group of America, Inc. | | 76,299 | 11,022,917 |
| Voya Financial, Inc. | | 273,928 | 20,404,897 |
| Willis Towers Watson PLC | | 91,205 | 21,374,804 |
| | | | | $222,594,693 |
| Internet – 3.2% | |
| Alphabet, Inc., “A” (a)(s) | | 1,922,081 | $173,102,615 |
| Gartner, Inc. (a) | | 26,890 | 8,814,811 |
| | | | | $181,917,426 |
| Leisure & Toys – 0.7% | |
| Electronic Arts, Inc. | | 207,007 | $22,965,356 |
| Funko, Inc., “A” (a) | | 674,226 | 7,288,383 |
| Take-Two Interactive Software, Inc. (a) | | 86,383 | 9,463,258 |
| | | | | $39,716,997 |
| Machinery & Tools – 2.8% | |
| Dover Corp. | | 129,367 | $19,392,113 |
| Eaton Corp. PLC | | 231,032 | 40,414,428 |
| Flowserve Corp. | | 333,644 | 11,574,110 |
| Ingersoll Rand, Inc. | | 385,905 | 22,409,503 |
| PACCAR, Inc. | | 260,992 | 18,843,623 |
| Regal Rexnord Corp. | | 133,377 | 21,025,550 |
| Wabtec Corp. | | 218,108 | 22,755,208 |
| | | | | $156,414,535 |
| Major Banks – 3.8% | |
| JPMorgan Chase & Co. | | 659,050 | $94,474,817 |
| Morgan Stanley | | 421,164 | 40,642,326 |
| PNC Financial Services Group, Inc. | | 115,105 | 18,177,382 |
| Regions Financial Corp. | | 952,808 | 22,219,483 |
| Wells Fargo & Co. | | 758,586 | 35,479,067 |
| | | | | $210,993,075 |
Portfolio of Investments (unaudited) – continued
| Issuer | | | Shares/Par | Value ($) |
| Common Stocks – continued |
| Medical & Health Technology & Services – 1.7% | |
| ICON PLC (a) | | 178,403 | $40,253,069 |
| IDEXX Laboratories, Inc. (a) | | 7,418 | 3,510,494 |
| McKesson Corp. | | 105,722 | 36,982,613 |
| Veeva Systems, Inc. (a) | | 103,433 | 17,134,711 |
| | | | | $97,880,887 |
| Medical Equipment – 5.1% | |
| Agilent Technologies, Inc. | | 162,360 | $23,050,249 |
| Align Technology, Inc. (a) | | 5,022 | 1,554,309 |
| Becton, Dickinson and Co. | | 195,495 | 45,853,352 |
| Boston Scientific Corp. (a) | | 1,248,952 | 58,351,037 |
| Envista Holdings Corp. (a) | | 329,975 | 12,756,834 |
| Maravai Lifesciences Holdings, Inc., “A” (a) | | 2,045,391 | 30,169,517 |
| Medtronic PLC | | 683,666 | 56,607,545 |
| Quidel Corp. (a) | | 297,792 | 25,890,036 |
| STERIS PLC | | 177,285 | 33,334,899 |
| | | | | $287,567,778 |
| Natural Gas - Pipeline – 0.2% | |
| Cheniere Energy, Inc. | | 86,755 | $13,650,032 |
| Network & Telecom – 0.7% | |
| Equinix, Inc., REIT | | 28,283 | $19,466,340 |
| Motorola Solutions, Inc. | | 65,658 | 17,255,579 |
| | | | | $36,721,919 |
| Oil Services – 0.7% | |
| Cactus, Inc., “A” | | 305,167 | $14,022,424 |
| Schlumberger Ltd. | | 462,028 | 24,584,510 |
| | | | | $38,606,934 |
| Other Banks & Diversified Financials – 3.9% | |
| American Express Co. | | 60,918 | $10,599,123 |
| First Interstate BancSystem, Inc. | | 260,289 | 9,250,671 |
| M&T Bank Corp. | | 221,597 | 34,411,798 |
| Moody's Corp. | | 82,698 | 23,994,825 |
| Northern Trust Corp. | | 101,521 | 9,671,906 |
| Signature Bank | | 53,846 | 6,194,982 |
| SLM Corp. | | 681,848 | 9,804,974 |
| SVB Financial Group (a) | | 20,072 | 5,782,944 |
| United Community Bank, Inc. | | 244,331 | 8,089,799 |
| Visa, Inc., “A” | | 452,072 | 99,428,716 |
| | | | | $217,229,738 |
Portfolio of Investments (unaudited) – continued
| Issuer | | | Shares/Par | Value ($) |
| Common Stocks – continued |
| Pharmaceuticals – 6.5% | |
| Eli Lilly & Co. | | 163,392 | $50,850,858 |
| Johnson & Johnson | | 482,219 | 73,904,884 |
| Merck & Co., Inc. | | 601,213 | 63,872,869 |
| Organon & Co. | | 674,380 | 16,515,566 |
| Pfizer, Inc. | | 1,409,838 | 57,197,128 |
| Vertex Pharmaceuticals, Inc. (a) | | 180,133 | 52,290,809 |
| Zoetis, Inc. | | 296,520 | 49,518,840 |
| | | | | $364,150,954 |
| Pollution Control – 0.5% | |
| GFL Environmental, Inc. | | 954,514 | $28,988,590 |
| Printing & Publishing – 0.1% | |
| Warner Music Group Corp. | | 153,411 | $4,841,651 |
| Railroad & Shipping – 1.0% | |
| Canadian Pacific Railway Ltd. | | 468,175 | $35,553,209 |
| CSX Corp. | | 704,612 | 21,483,620 |
| | | | | $57,036,829 |
| Real Estate – 1.6% | |
| Broadstone Net Lease, Inc., REIT | | 973,344 | $17,276,856 |
| Empire State Realty Trust, REIT, “A” | | 1,413,767 | 10,306,362 |
| Extra Space Storage, Inc., REIT | | 116,203 | 19,132,824 |
| Jones Lang LaSalle, Inc. (a) | | 48,148 | 8,399,900 |
| Prologis, Inc., REIT | | 53,098 | 6,552,293 |
| Spirit Realty Capital, Inc., REIT | | 376,592 | 15,508,059 |
| Sun Communities, Inc., REIT | | 98,810 | 14,143,663 |
| | | | | $91,319,957 |
| Restaurants – 1.4% | |
| Starbucks Corp. | | 557,678 | $56,933,347 |
| Wendy's Co. | | 1,045,226 | 22,953,163 |
| | | | | $79,886,510 |
| Specialty Chemicals – 1.7% | |
| Air Products & Chemicals, Inc. | | 69,663 | $19,922,225 |
| Axalta Coating Systems Ltd. (a) | | 350,152 | 10,434,530 |
| Chemours Co. | | 189,027 | 6,460,943 |
| Diversey Holdings Ltd. (a) | | 1,656,414 | 9,789,407 |
| DuPont de Nemours, Inc. | | 235,844 | 17,223,687 |
| Linde PLC | | 73,877 | 25,736,530 |
| Univar Solutions, Inc. (a) | | 168,404 | 5,852,039 |
| | | | | $95,419,361 |
Portfolio of Investments (unaudited) – continued
| Issuer | | | Shares/Par | Value ($) |
| Common Stocks – continued |
| Specialty Stores – 5.5% | |
| Amazon.com, Inc. (a)(s) | | 1,564,402 | $147,413,601 |
| Home Depot, Inc. | | 233,810 | 69,334,017 |
| Lululemon Athletica, Inc. (a) | | 53,812 | 16,638,670 |
| Ross Stores, Inc. | | 292,126 | 32,291,608 |
| Target Corp. | | 236,829 | 39,905,687 |
| | | | | $305,583,583 |
| Telecommunications - Wireless – 1.7% | |
| Liberty Broadband Corp. (a) | | 275,146 | $23,846,904 |
| SBA Communications Corp., REIT | | 121,071 | 31,399,764 |
| T-Mobile US, Inc. (a) | | 282,275 | 40,133,859 |
| | | | | $95,380,527 |
| Telephone Services – 0.1% | |
| Altice USA, Inc., “A” (a) | | 848,727 | $3,360,959 |
| Tobacco – 0.6% | |
| Philip Morris International, Inc. | | 357,481 | $34,782,901 |
| Trucking – 0.3% | |
| Saia, Inc. (a) | | 69,833 | $18,915,665 |
| Utilities - Electric Power – 2.9% | |
| CenterPoint Energy, Inc. | | 684,187 | $19,034,082 |
| Constellation Energy | | 100,354 | 7,515,511 |
| Dominion Energy, Inc. | | 110,451 | 6,143,285 |
| Duke Energy Corp. | | 170,350 | 16,057,191 |
| Evergy, Inc. | | 89,772 | 5,279,491 |
| Exelon Corp. | | 301,060 | 12,159,813 |
| NextEra Energy, Inc. | | 432,134 | 30,694,478 |
| PG&E Corp. (a) | | 1,970,840 | 30,784,521 |
| PPL Corp. | | 222,088 | 6,011,922 |
| Sempra Energy | | 67,637 | 10,142,845 |
| Xcel Energy, Inc. | | 292,788 | 18,905,321 |
| | | | | $162,728,460 |
| Total Common Stocks (Identified Cost, $4,380,913,083) | | $5,562,203,311 |
| Investment Companies (h) – 0.8% |
| Money Market Funds – 0.8% | |
| MFS Institutional Money Market Portfolio, 4.55% (v) (Identified Cost, $47,523,799) | | | 47,525,062 | $47,525,062 |
Portfolio of Investments (unaudited) – continued
| Issuer | | | Shares/Par | Value ($) |
| Collateral for Securities Loaned – 0.1% |
| State Street Navigator Securities Lending Government Money Market Portfolio, 4.59% (j) (Identified Cost, $3,647,311) | | | 3,647,311 | $3,647,311 |
| Securities Sold Short – (0.2)% |
| Medical & Health Technology & Services – (0.1)% |
| Healthcare Services Group, Inc. | | | (581,597) | $(7,717,792) |
| Telecommunications - Wireless – (0.1)% |
| Crown Castle, Inc., REIT | | | (44,300) | $(5,792,225) |
| Total Securities Sold Short (Proceeds Received, $21,409,922) | $(13,510,017) |
|
|
| Other Assets, Less Liabilities – 0.2% | | 11,669,156 |
| Net Assets – 100.0% | $5,611,534,823 |
| (a) | Non-income producing security. | | | |
| (h) | An affiliated issuer, which may be considered one in which the fund owns 5% or more of the outstanding voting securities, or a company which is under common control. At period end, the aggregate values of the fund's investments in affiliated issuers and in unaffiliated issuers were $47,525,062 and $5,565,850,622, respectively. | | | |
| (j) | The rate quoted is the annualized seven-day yield of the fund at period end. | | | |
| (l) | A portion of this security is on loan. See Note 2 for additional information. | | | |
| (s) | Security or a portion of the security was pledged to cover collateral requirements for securities sold short. | | | |
| (v) | Affiliated issuer that is available only to investment companies managed by MFS. The rate quoted for the MFS Institutional Money Market Portfolio is the annualized seven-day yield of the fund at period end. | | | |
| The following abbreviations are used in this report and are defined: |
| ADR | American Depositary Receipt |
| REIT | Real Estate Investment Trust |
At February 28, 2023, the fund had cash collateral of $53,345 and other liquid securities with an aggregate value of $38,495,694 to cover any collateral or margin obligations for securities sold short. Restricted cash and/or deposits with brokers in the Statement of Assets and Liabilities are comprised of cash collateral.
See Notes to Financial Statements
Financial Statements
Statement of Assets and Liabilities
At 2/28/23 (unaudited)
This statement represents your fund’s balance sheet, which details the assets and liabilities comprising the total value of the fund.
| Assets | |
| Investments in unaffiliated issuers, at value, including $3,263,204 of securities on loan (identified cost, $4,384,560,394) | $5,565,850,622 |
| Investments in affiliated issuers, at value (identified cost, $47,523,799) | 47,525,062 |
| Deposits with brokers for | |
| Securities sold short | 53,345 |
| Receivables for | |
| Investments sold | 19,796,287 |
| Fund shares sold | 7,108,038 |
| Interest and dividends | 7,766,918 |
| Other assets | 70,392 |
| Total assets | $5,648,170,664 |
| Liabilities | |
| Payable to custodian | $7,959,861 |
| Payables for | |
| Securities sold short, at value (proceeds received, $21,409,922) | 13,510,017 |
| Fund shares reacquired | 10,120,125 |
| Collateral for securities loaned, at value | 3,647,311 |
| Payable to affiliates | |
| Investment adviser | 158,659 |
| Administrative services fee | 3,537 |
| Shareholder servicing costs | 892,225 |
| Distribution and service fees | 36,966 |
| Payable for independent Trustees' compensation | 15,037 |
| Accrued expenses and other liabilities | 292,103 |
| Total liabilities | $36,635,841 |
| Net assets | $5,611,534,823 |
| Net assets consist of | |
| Paid-in capital | $4,441,196,627 |
| Total distributable earnings (loss) | 1,170,338,196 |
| Net assets | $5,611,534,823 |
| Shares of beneficial interest outstanding | 138,464,171 |
Statement of Assets and Liabilities (unaudited) – continued
| | Net assets | Shares
outstanding | Net asset value
per share (a) |
| Class A | $2,155,877,476 | 55,132,723 | $39.10 |
| Class B | 12,854,634 | 391,241 | 32.86 |
| Class C | 100,404,752 | 3,110,866 | 32.28 |
| Class I | 1,444,385,237 | 34,447,466 | 41.93 |
| Class R1 | 6,075,403 | 188,120 | 32.30 |
| Class R2 | 18,934,386 | 499,120 | 37.94 |
| Class R3 | 58,974,825 | 1,512,827 | 38.98 |
| Class R4 | 35,808,265 | 905,265 | 39.56 |
| Class R6 | 1,778,219,845 | 42,276,543 | 42.06 |
| (a) | Maximum offering price per share was equal to the net asset value per share for all share classes, except for Class A, for which the maximum offering price per share was $41.49 [100 / 94.25 x $39.10]. On sales of $50,000 or more, the maximum offering price of Class A shares is reduced. A contingent deferred sales charge may be imposed on redemptions of Class A, Class B, and Class C shares. Redemption price per share was equal to the net asset value per share for Classes I, R1, R2, R3, R4, and R6. |
See Notes to Financial Statements
Financial Statements
Statement of Operations
Six months ended 2/28/23 (unaudited)
This statement describes how much your fund earned in investment income and accrued in expenses. It also describes any gains and/or losses generated by fund operations.
| Net investment income (loss) | |
| Income | |
| Dividends | $40,431,442 |
| Dividends from affiliated issuers | 1,022,975 |
| Other | 110,981 |
| Income on securities loaned | 11,833 |
| Foreign taxes withheld | (65,354) |
| Total investment income | $41,511,877 |
| Expenses | |
| Management fee | $14,532,879 |
| Distribution and service fees | 3,387,228 |
| Shareholder servicing costs | 2,039,551 |
| Administrative services fee | 316,715 |
| Independent Trustees' compensation | 41,869 |
| Custodian fee | 69,897 |
| Shareholder communications | 146,315 |
| Audit and tax fees | 33,022 |
| Legal fees | 12,437 |
| Dividend and interest expense on securities sold short | 334,459 |
| Interest expense and fees | 14,162 |
| Miscellaneous | 168,786 |
| Total expenses | $21,097,320 |
| Reduction of expenses by investment adviser and distributor | (368,958) |
| Net expenses | $20,728,362 |
| Net investment income (loss) | $20,783,515 |
Statement of Operations (unaudited) – continued
| Realized and unrealized gain (loss) |
| Realized gain (loss) (identified cost basis) | |
| Unaffiliated issuers | $(35,449,096) |
| Affiliated issuers | (4,517) |
| Securities sold short | 4,054,986 |
| Foreign currency | (1,170) |
| Net realized gain (loss) | $(31,399,797) |
| Change in unrealized appreciation or depreciation | |
| Unaffiliated issuers | $86,332,967 |
| Affiliated issuers | (2,747) |
| Securities sold short | (1,107,757) |
| Net unrealized gain (loss) | $85,222,463 |
| Net realized and unrealized gain (loss) | $53,822,666 |
| Change in net assets from operations | $74,606,181 |
See Notes to Financial Statements
Financial Statements
Statements of Changes in Net Assets
These statements describe the increases and/or decreases in net assets resulting from operations, any distributions, and any shareholder transactions.
| | Six months ended | Year ended |
| | 2/28/23
(unaudited) | 8/31/22 |
| Change in net assets | | |
| From operations | | |
| Net investment income (loss) | $20,783,515 | $29,779,079 |
| Net realized gain (loss) | (31,399,797) | 204,862,215 |
| Net unrealized gain (loss) | 85,222,463 | (1,040,675,828) |
| Change in net assets from operations | $74,606,181 | $(806,034,534) |
| Total distributions to shareholders | $(203,307,193) | $(433,307,610) |
| Change in net assets from fund share transactions | $155,123,178 | $730,427,616 |
| Total change in net assets | $26,422,166 | $(508,914,528) |
| Net assets | | |
| At beginning of period | 5,585,112,657 | 6,094,027,185 |
| At end of period | $5,611,534,823 | $5,585,112,657 |
See Notes to Financial Statements
Financial Statements
Financial Highlights
The financial highlights table is intended to help you understand the fund's financial performance for the semiannual period and the past 5 fiscal years. Certain information reflects financial results for a single fund share. The total returns in the table represent the rate that an investor would have earned (or lost) on an investment in the fund share class (assuming reinvestment of all distributions) held for the entire period.
| Class A | Six months
ended | Year ended |
| | 2/28/23
(unaudited) | 8/31/22 | 8/31/21 | 8/31/20 | 8/31/19 | 8/31/18 |
| Net asset value, beginning of period | $40.07 | $49.38 | $38.41 | $32.45 | $34.18 | $30.46 |
| Income (loss) from investment operations |
| Net investment income (loss) (d) | $0.12 | $0.15 | $0.09 | $0.19 | $0.20 | $0.20 |
| Net realized and unrealized gain (loss) | 0.36 | (6.00) | 11.50 | 6.41 | 1.05 | 5.63 |
| Total from investment operations | $0.48 | $(5.85) | $11.59 | $6.60 | $1.25 | $5.83 |
| Less distributions declared to shareholders |
| From net investment income | $(0.15) | $(0.08) | $(0.15) | $(0.15) | $(0.16) | $(0.17) |
| From net realized gain | (1.30) | (3.39) | (0.47) | (0.49) | (2.82) | (1.94) |
| Total distributions declared to shareholders | $(1.45) | $(3.46) | $(0.62) | $(0.64) | $(2.98) | $(2.11) |
| Net asset value, end of period (x) | $39.10 | $40.07 | $49.38 | $38.41 | $32.45 | $34.18 |
| Total return (%) (r)(s)(t)(x) | 1.24(n) | (12.87) | 30.57 | 20.59 | 4.94 | 19.89 |
Ratios (%) (to average net assets)
and Supplemental data: |
| Expenses before expense reductions | 0.92(a) | 0.92 | 0.94 | 0.97 | 1.00 | 1.00 |
| Expenses after expense reductions | 0.91(a) | 0.91 | 0.92 | 0.96 | 0.98 | 0.99 |
| Net investment income (loss) | 0.60(a) | 0.35 | 0.22 | 0.56 | 0.65 | 0.62 |
| Portfolio turnover | 16(n) | 25 | 38 | 46 | 39 | 42 |
| Net assets at end of period (000 omitted) | $2,155,877 | $2,156,741 | $2,462,032 | $1,960,597 | $1,373,524 | $1,184,976 |
| Supplemental Ratios (%): |
| Ratios of expenses to average net assets after expense reductions excluding short sale expenses and interest expense and fees | 0.90(a) | 0.89 | 0.90 | 0.93 | 0.96 | 0.97 |
See Notes to Financial Statements
Financial Highlights – continued
| Class B | Six months
ended | Year ended |
| | 2/28/23
(unaudited) | 8/31/22 | 8/31/21 | 8/31/20 | 8/31/19 | 8/31/18 |
| Net asset value, beginning of period | $33.87 | $42.49 | $33.24 | $28.23 | $30.19 | $27.17 |
| Income (loss) from investment operations |
| Net investment income (loss) (d) | $(0.02) | $(0.16) | $(0.19) | $(0.05) | $(0.03) | $(0.04) |
| Net realized and unrealized gain (loss) | 0.31 | (5.07) | 9.91 | 5.55 | 0.89 | 5.00 |
| Total from investment operations | $0.29 | $(5.23) | $9.72 | $5.50 | $0.86 | $4.96 |
| Less distributions declared to shareholders |
| From net investment income | $— | $— | $— | $— | $— | $— |
| From net realized gain | (1.30) | (3.39) | (0.47) | (0.49) | (2.82) | (1.94) |
| Total distributions declared to shareholders | $(1.30) | $(3.39) | $(0.47) | $(0.49) | $(2.82) | $(1.94) |
| Net asset value, end of period (x) | $32.86 | $33.87 | $42.49 | $33.24 | $28.23 | $30.19 |
| Total return (%) (r)(s)(t)(x) | 0.90(n) | (13.52) | 29.58 | 19.69 | 4.16 | 19.01 |
Ratios (%) (to average net assets)
and Supplemental data: |
| Expenses before expense reductions | 1.67(a) | 1.67 | 1.69 | 1.72 | 1.75 | 1.75 |
| Expenses after expense reductions | 1.66(a) | 1.66 | 1.67 | 1.71 | 1.73 | 1.74 |
| Net investment income (loss) | (0.15)(a) | (0.42) | (0.53) | (0.18) | (0.11) | (0.14) |
| Portfolio turnover | 16(n) | 25 | 38 | 46 | 39 | 42 |
| Net assets at end of period (000 omitted) | $12,855 | $15,456 | $24,861 | $25,018 | $22,759 | $26,993 |
| Supplemental Ratios (%): |
| Ratios of expenses to average net assets after expense reductions excluding short sale expenses and interest expense and fees | 1.65(a) | 1.64 | 1.65 | 1.68 | 1.71 | 1.72 |
See Notes to Financial Statements
Financial Highlights – continued
| Class C | Six months
ended | Year ended |
| | 2/28/23
(unaudited) | 8/31/22 | 8/31/21 | 8/31/20 | 8/31/19 | 8/31/18 |
| Net asset value, beginning of period | $33.30 | $41.83 | $32.72 | $27.86 | $29.84 | $26.88 |
| Income (loss) from investment operations |
| Net investment income (loss) (d) | $(0.02) | $(0.15) | $(0.19) | $(0.05) | $(0.03) | $(0.05) |
| Net realized and unrealized gain (loss) | 0.30 | (4.99) | 9.77 | 5.46 | 0.87 | 4.95 |
| Total from investment operations | $0.28 | $(5.14) | $9.58 | $5.41 | $0.84 | $4.90 |
| Less distributions declared to shareholders |
| From net investment income | $— | $— | $— | $(0.06) | $— | $— |
| From net realized gain | (1.30) | (3.39) | (0.47) | (0.49) | (2.82) | (1.94) |
| Total distributions declared to shareholders | $(1.30) | $(3.39) | $(0.47) | $(0.55) | $(2.82) | $(1.94) |
| Net asset value, end of period (x) | $32.28 | $33.30 | $41.83 | $32.72 | $27.86 | $29.84 |
| Total return (%) (r)(s)(t)(x) | 0.89(n) | (13.51) | 29.62 | 19.66 | 4.14 | 18.98 |
Ratios (%) (to average net assets)
and Supplemental data: |
| Expenses before expense reductions | 1.67(a) | 1.67 | 1.69 | 1.72 | 1.75 | 1.75 |
| Expenses after expense reductions | 1.66(a) | 1.66 | 1.67 | 1.71 | 1.74 | 1.74 |
| Net investment income (loss) | (0.15)(a) | (0.41) | (0.53) | (0.18) | (0.10) | (0.17) |
| Portfolio turnover | 16(n) | 25 | 38 | 46 | 39 | 42 |
| Net assets at end of period (000 omitted) | $100,405 | $105,731 | $140,242 | $128,709 | $72,093 | $56,413 |
| Supplemental Ratios (%): |
| Ratios of expenses to average net assets after expense reductions excluding short sale expenses and interest expense and fees | 1.65(a) | 1.64 | 1.65 | 1.69 | 1.71 | 1.72 |
See Notes to Financial Statements
Financial Highlights – continued
| Class I | Six months
ended | Year ended |
| | 2/28/23
(unaudited) | 8/31/22 | 8/31/21 | 8/31/20 | 8/31/19 | 8/31/18 |
| Net asset value, beginning of period | $42.90 | $52.62 | $40.87 | $34.47 | $36.12 | $32.07 |
| Income (loss) from investment operations |
| Net investment income (loss) (d) | $0.18 | $0.29 | $0.22 | $0.29 | $0.30 | $0.30 |
| Net realized and unrealized gain (loss) | 0.40 | (6.44) | 12.24 | 6.82 | 1.11 | 5.93 |
| Total from investment operations | $0.58 | $(6.15) | $12.46 | $7.11 | $1.41 | $6.23 |
| Less distributions declared to shareholders |
| From net investment income | $(0.25) | $(0.18) | $(0.24) | $(0.22) | $(0.24) | $(0.24) |
| From net realized gain | (1.30) | (3.39) | (0.47) | (0.49) | (2.82) | (1.94) |
| Total distributions declared to shareholders | $(1.55) | $(3.57) | $(0.71) | $(0.71) | $(3.06) | $(2.18) |
| Net asset value, end of period (x) | $41.93 | $42.90 | $52.62 | $40.87 | $34.47 | $36.12 |
| Total return (%) (r)(s)(t)(x) | 1.40(n) | (12.67) | 30.91 | 20.89 | 5.17 | 20.21 |
Ratios (%) (to average net assets)
and Supplemental data: |
| Expenses before expense reductions | 0.67(a) | 0.68 | 0.68 | 0.72 | 0.75 | 0.75 |
| Expenses after expense reductions | 0.66(a) | 0.66 | 0.67 | 0.71 | 0.74 | 0.74 |
| Net investment income (loss) | 0.85(a) | 0.60 | 0.47 | 0.81 | 0.90 | 0.88 |
| Portfolio turnover | 16(n) | 25 | 38 | 46 | 39 | 42 |
| Net assets at end of period (000 omitted) | $1,444,385 | $1,405,183 | $1,416,134 | $841,296 | $467,860 | $246,779 |
| Supplemental Ratios (%): |
| Ratios of expenses to average net assets after expense reductions excluding short sale expenses and interest expense and fees | 0.65(a) | 0.64 | 0.65 | 0.69 | 0.72 | 0.73 |
See Notes to Financial Statements
Financial Highlights – continued
| Class R1 | Six months
ended | Year ended |
| | 2/28/23
(unaudited) | 8/31/22 | 8/31/21 | 8/31/20 | 8/31/19 | 8/31/18 |
| Net asset value, beginning of period | $33.35 | $41.89 | $32.77 | $27.84 | $29.82 | $26.86 |
| Income (loss) from investment operations |
| Net investment income (loss) (d) | $(0.02) | $(0.15) | $(0.19) | $(0.06) | $(0.03) | $(0.04) |
| Net realized and unrealized gain (loss) | 0.31 | (5.00) | 9.78 | 5.48 | 0.87 | 4.94 |
| Total from investment operations | $0.29 | $(5.15) | $9.59 | $5.42 | $0.84 | $4.90 |
| Less distributions declared to shareholders |
| From net investment income | $(0.04) | $— | $— | $— | $— | $— |
| From net realized gain | (1.30) | (3.39) | (0.47) | (0.49) | (2.82) | (1.94) |
| Total distributions declared to shareholders | $(1.34) | $(3.39) | $(0.47) | $(0.49) | $(2.82) | $(1.94) |
| Net asset value, end of period (x) | $32.30 | $33.35 | $41.89 | $32.77 | $27.84 | $29.82 |
| Total return (%) (r)(s)(t)(x) | 0.90(n) | (13.52) | 29.60 | 19.68 | 4.14 | 19.00 |
Ratios (%) (to average net assets)
and Supplemental data: |
| Expenses before expense reductions | 1.67(a) | 1.68 | 1.69 | 1.72 | 1.75 | 1.75 |
| Expenses after expense reductions | 1.66(a) | 1.66 | 1.67 | 1.71 | 1.74 | 1.74 |
| Net investment income (loss) | (0.15)(a) | (0.41) | (0.53) | (0.20) | (0.11) | (0.14) |
| Portfolio turnover | 16(n) | 25 | 38 | 46 | 39 | 42 |
| Net assets at end of period (000 omitted) | $6,075 | $2,974 | $3,791 | $3,816 | $3,186 | $3,448 |
| Supplemental Ratios (%): |
| Ratios of expenses to average net assets after expense reductions excluding short sale expenses and interest expense and fees | 1.65(a) | 1.64 | 1.65 | 1.69 | 1.71 | 1.73 |
See Notes to Financial Statements
Financial Highlights – continued
| Class R2 | Six months
ended | Year ended |
| | 2/28/23
(unaudited) | 8/31/22 | 8/31/21 | 8/31/20 | 8/31/19 | 8/31/18 |
| Net asset value, beginning of period | $38.87 | $48.04 | $37.40 | $31.61 | $33.33 | $29.75 |
| Income (loss) from investment operations |
| Net investment income (loss) (d) | $0.07 | $0.05 | $(0.01) | $0.10 | $0.12 | $0.11 |
| Net realized and unrealized gain (loss) | 0.36 | (5.83) | 11.20 | 6.24 | 1.02 | 5.50 |
| Total from investment operations | $0.43 | $(5.78) | $11.19 | $6.34 | $1.14 | $5.61 |
| Less distributions declared to shareholders |
| From net investment income | $(0.06) | $— | $(0.08) | $(0.06) | $(0.04) | $(0.09) |
| From net realized gain | (1.30) | (3.39) | (0.47) | (0.49) | (2.82) | (1.94) |
| Total distributions declared to shareholders | $(1.36) | $(3.39) | $(0.55) | $(0.55) | $(2.86) | $(2.03) |
| Net asset value, end of period (x) | $37.94 | $38.87 | $48.04 | $37.40 | $31.61 | $33.33 |
| Total return (%) (r)(s)(t)(x) | 1.16(n) | (13.08) | 30.27 | 20.28 | 4.66 | 19.61 |
Ratios (%) (to average net assets)
and Supplemental data: |
| Expenses before expense reductions | 1.17(a) | 1.18 | 1.19 | 1.22 | 1.25 | 1.25 |
| Expenses after expense reductions | 1.14(a) | 1.15 | 1.16 | 1.20 | 1.23 | 1.24 |
| Net investment income (loss) | 0.37(a) | 0.11 | (0.02) | 0.31 | 0.39 | 0.35 |
| Portfolio turnover | 16(n) | 25 | 38 | 46 | 39 | 42 |
| Net assets at end of period (000 omitted) | $18,934 | $18,825 | $21,214 | $17,335 | $13,416 | $15,202 |
| Supplemental Ratios (%): |
| Ratios of expenses to average net assets after expense reductions excluding short sale expenses and interest expense and fees | 1.13(a) | 1.13 | 1.14 | 1.17 | 1.20 | 1.22 |
See Notes to Financial Statements
Financial Highlights – continued
| Class R3 | Six months
ended | Year ended |
| | 2/28/23
(unaudited) | 8/31/22 | 8/31/21 | 8/31/20 | 8/31/19 | 8/31/18 |
| Net asset value, beginning of period | $39.94 | $49.22 | $38.29 | $32.36 | $34.11 | $30.33 |
| Income (loss) from investment operations |
| Net investment income (loss) (d) | $0.12 | $0.15 | $0.09 | $0.19 | $0.20 | $0.20 |
| Net realized and unrealized gain (loss) | 0.36 | (5.98) | 11.47 | 6.38 | 1.04 | 5.61 |
| Total from investment operations | $0.48 | $(5.83) | $11.56 | $6.57 | $1.24 | $5.81 |
| Less distributions declared to shareholders |
| From net investment income | $(0.14) | $(0.06) | $(0.16) | $(0.15) | $(0.17) | $(0.09) |
| From net realized gain | (1.30) | (3.39) | (0.47) | (0.49) | (2.82) | (1.94) |
| Total distributions declared to shareholders | $(1.44) | $(3.45) | $(0.63) | $(0.64) | $(2.99) | $(2.03) |
| Net asset value, end of period (x) | $38.98 | $39.94 | $49.22 | $38.29 | $32.36 | $34.11 |
| Total return (%) (r)(s)(t)(x) | 1.25(n) | (12.87) | 30.59 | 20.56 | 4.91 | 19.91 |
Ratios (%) (to average net assets)
and Supplemental data: |
| Expenses before expense reductions | 0.92(a) | 0.92 | 0.94 | 0.97 | 1.00 | 1.00 |
| Expenses after expense reductions | 0.91(a) | 0.91 | 0.92 | 0.96 | 0.99 | 0.99 |
| Net investment income (loss) | 0.60(a) | 0.34 | 0.22 | 0.56 | 0.64 | 0.61 |
| Portfolio turnover | 16(n) | 25 | 38 | 46 | 39 | 42 |
| Net assets at end of period (000 omitted) | $58,975 | $60,662 | $77,453 | $63,347 | $42,199 | $34,916 |
| Supplemental Ratios (%): |
| Ratios of expenses to average net assets after expense reductions excluding short sale expenses and interest expense and fees | 0.90(a) | 0.89 | 0.90 | 0.94 | 0.96 | 0.98 |
See Notes to Financial Statements
Financial Highlights – continued
| Class R4 | Six months
ended | Year ended |
| | 2/28/23
(unaudited) | 8/31/22 | 8/31/21 | 8/31/20 | 8/31/19 | 8/31/18 |
| Net asset value, beginning of period | $40.56 | $49.93 | $38.81 | $32.76 | $34.48 | $30.71 |
| Income (loss) from investment operations |
| Net investment income (loss) (d) | $0.17 | $0.27 | $0.20 | $0.27 | $0.28 | $0.28 |
| Net realized and unrealized gain (loss) | 0.38 | (6.08) | 11.63 | 6.48 | 1.05 | 5.67 |
| Total from investment operations | $0.55 | $(5.81) | $11.83 | $6.75 | $1.33 | $5.95 |
| Less distributions declared to shareholders |
| From net investment income | $(0.25) | $(0.17) | $(0.24) | $(0.21) | $(0.23) | $(0.24) |
| From net realized gain | (1.30) | (3.39) | (0.47) | (0.49) | (2.82) | (1.94) |
| Total distributions declared to shareholders | $(1.55) | $(3.56) | $(0.71) | $(0.70) | $(3.05) | $(2.18) |
| Net asset value, end of period (x) | $39.56 | $40.56 | $49.93 | $38.81 | $32.76 | $34.48 |
| Total return (%) (r)(s)(t)(x) | 1.41(n) | (12.67) | 30.92 | 20.88 | 5.18 | 20.18 |
Ratios (%) (to average net assets)
and Supplemental data: |
| Expenses before expense reductions | 0.67(a) | 0.67 | 0.69 | 0.72 | 0.75 | 0.75 |
| Expenses after expense reductions | 0.66(a) | 0.66 | 0.67 | 0.71 | 0.74 | 0.74 |
| Net investment income (loss) | 0.85(a) | 0.60 | 0.47 | 0.80 | 0.89 | 0.86 |
| Portfolio turnover | 16(n) | 25 | 38 | 46 | 39 | 42 |
| Net assets at end of period (000 omitted) | $35,808 | $36,425 | $42,883 | $35,770 | $29,218 | $27,707 |
| Supplemental Ratios (%): |
| Ratios of expenses to average net assets after expense reductions excluding short sale expenses and interest expense and fees | 0.65(a) | 0.64 | 0.65 | 0.69 | 0.71 | 0.73 |
See Notes to Financial Statements
Financial Highlights – continued
| Class R6 | Six months
ended | Year ended |
| | 2/28/23
(unaudited) | 8/31/22 | 8/31/21 | 8/31/20 | 8/31/19 | 8/31/18 |
| Net asset value, beginning of period | $43.06 | $52.78 | $40.98 | $34.55 | $36.18 | $32.12 |
| Income (loss) from investment operations |
| Net investment income (loss) (d) | $0.20 | $0.33 | $0.25 | $0.32 | $0.32 | $0.32 |
| Net realized and unrealized gain (loss) | 0.39 | (6.45) | 12.29 | 6.83 | 1.13 | 5.95 |
| Total from investment operations | $0.59 | $(6.12) | $12.54 | $7.15 | $1.45 | $6.27 |
| Less distributions declared to shareholders |
| From net investment income | $(0.29) | $(0.22) | $(0.27) | $(0.23) | $(0.26) | $(0.27) |
| From net realized gain | (1.30) | (3.39) | (0.47) | (0.49) | (2.82) | (1.94) |
| Total distributions declared to shareholders | $(1.59) | $(3.60) | $(0.74) | $(0.72) | $(3.08) | $(2.21) |
| Net asset value, end of period (x) | $42.06 | $43.06 | $52.78 | $40.98 | $34.55 | $36.18 |
| Total return (%) (r)(s)(t)(x) | 1.42(n) | (12.57) | 31.03 | 20.98 | 5.28 | 20.29 |
Ratios (%) (to average net assets)
and Supplemental data: |
| Expenses before expense reductions | 0.58(a) | 0.59 | 0.60 | 0.64 | 0.67 | 0.67 |
| Expenses after expense reductions | 0.57(a) | 0.57 | 0.59 | 0.63 | 0.66 | 0.66 |
| Net investment income (loss) | 0.94(a) | 0.69 | 0.56 | 0.89 | 0.98 | 0.95 |
| Portfolio turnover | 16(n) | 25 | 38 | 46 | 39 | 42 |
| Net assets at end of period (000 omitted) | $1,778,220 | $1,783,116 | $1,905,417 | $1,303,858 | $783,340 | $577,588 |
| Supplemental Ratios (%): |
| Ratios of expenses to average net assets after expense reductions excluding short sale expenses and interest expense and fees | 0.56(a) | 0.55 | 0.57 | 0.60 | 0.63 | 0.65 |
| (a) | Annualized. |
| (d) | Per share data is based on average shares outstanding. |
| (n) | Not annualized. |
| (r) | Certain expenses have been reduced without which performance would have been lower. |
| (s) | From time to time the fund may receive proceeds from litigation settlements, without which performance would be lower. |
| (t) | Total returns do not include any applicable sales charges. |
| (x) | The net asset values and total returns have been calculated on net assets which include adjustments made in accordance with U.S. generally accepted accounting principles required at period end for financial reporting purposes. |
See Notes to Financial Statements
Notes to Financial Statements
(unaudited)
(1) Business and Organization
MFS Core Equity Fund (the fund) is a diversified series of MFS Series Trust I (the trust). The trust is organized as a Massachusetts business trust and is registered under the Investment Company Act of 1940, as amended, as an open-end management investment company.
The fund is an investment company and accordingly follows the investment company accounting and reporting guidance of the Financial Accounting Standards Board (FASB) Accounting Standards Codification Topic 946 Financial Services - Investment Companies.
(2) Significant Accounting Policies
General — The preparation of financial statements in conformity with U.S. generally accepted accounting principles requires management to make estimates and assumptions that affect the reported amounts of assets and liabilities, and disclosure of contingent assets and liabilities at the date of the financial statements and the reported amounts of increases and decreases in net assets from operations during the reporting period. Actual results could differ from those estimates. In the preparation of these financial statements, management has evaluated subsequent events occurring after the date of the fund’s Statement of Assets and Liabilities through the date that the financial statements were issued.
Balance Sheet Offsetting — The fund's accounting policy with respect to balance sheet offsetting is that, absent an event of default by the counterparty or a termination of the agreement, the International Swaps and Derivatives Association (ISDA) Master Agreement, or similar agreement, does not result in an offset of reported amounts of financial assets and financial liabilities in the Statement of Assets and Liabilities across transactions between the fund and the applicable counterparty. The fund's right to setoff may be restricted or prohibited by the bankruptcy or insolvency laws of the particular jurisdiction to which a specific master netting agreement counterparty is subject. Balance sheet offsetting disclosures, to the extent applicable to the fund, have been included in the fund’s Significant Accounting Policies note under the captions for each of the fund’s in-scope financial instruments and transactions.
Investment Valuations — Subject to its oversight, the fund's Board of Trustees has delegated primary responsibility for determining or causing to be determined the value of the fund’s investments to MFS as the fund's adviser, pursuant to the fund’s valuation policy and procedures which have been adopted by the adviser and approved by the Board. Effective September 8, 2022, and in accordance with Rule 2a-5 under the Investment Company Act of 1940, the Board of Trustees designated the adviser as the “valuation designee” of the fund. If the adviser, as valuation designee, determines that reliable market quotations are not readily available for an investment, the investment is valued at fair value as determined in good faith by the adviser in accordance with the adviser’s fair valuation policy and procedures.
Under the fund's valuation policy and procedures, equity securities, including restricted equity securities and equity securities sold short, are generally valued at the last sale or official closing price on their primary market or exchange as provided by a third-party pricing service. Equity securities, for which there were no sales reported that day, are generally valued at the last quoted daily bid quotation on their primary market or
Notes to Financial Statements (unaudited) - continued
exchange as provided by a third-party pricing service. Equity securities sold short, for which there were no sales reported that day, are generally valued at the last quoted daily ask quotation on their primary market or exchange as provided by a third-party pricing service. Short-term instruments with a maturity at issuance of 60 days or less may be valued at amortized cost, which approximates market value. Open-end investment companies are generally valued at net asset value per share. The values of foreign securities and other assets and liabilities expressed in foreign currencies are converted to U.S. dollars using the mean of bid and asked prices for rates provided by a third-party pricing service.
Under the fund’s valuation policy and procedures, market quotations are not considered to be readily available for debt instruments, floating rate loans, and many types of derivatives. These investments are generally valued at fair value based on information from third-party pricing services or otherwise determined by the adviser in accordance with the adviser’s fair valuation policy and procedures. Securities and other assets generally valued on the basis of information from a third-party pricing service may also be valued at a broker/dealer bid quotation. In determining values, third-party pricing services can utilize both transaction data and market information such as yield, quality, coupon rate, maturity, type of issue, trading characteristics, spreads and other market data. An investment may also be valued at fair value if the adviser determines that the investment’s value has been materially affected by events occurring after the close of the exchange or market on which the investment is principally traded (such as foreign exchange or market) and prior to the determination of the fund’s net asset value, or after the halt of trading of a specific security where trading does not resume prior to the close of the exchange or market on which the security is principally traded. Events that occur after foreign markets close (such as developments in foreign markets and significant movements in the U.S. markets) and prior to the determination of the fund’s net asset value may be deemed to have a material effect on the value of securities traded in foreign markets. Accordingly, the fund’s foreign equity securities may often be valued at fair value. The adviser generally relies on third-party pricing services or other information (such as the correlation with price movements of similar securities in the same or other markets; the type, cost and investment characteristics of the security; the business and financial condition of the issuer; and trading and other market data) to assist in determining whether to fair value and at what value to fair value an investment. The value of an investment for purposes of calculating the fund’s net asset value can differ depending on the source and method used to determine value. When fair valuation is used, the value of an investment used to determine the fund’s net asset value may differ from quoted or published prices for the same investment. There can be no assurance that the fund could obtain the fair value assigned to an investment if it were to sell the investment at the same time at which the fund determines its net asset value per share.
Various inputs are used in determining the value of the fund's assets or liabilities. These inputs are categorized into three broad levels. In certain cases, the inputs used to measure fair value may fall into different levels of the fair value hierarchy. In such cases, an investment's level within the fair value hierarchy is based on the lowest level of input that is significant to the fair value measurement. The fund's assessment of the significance of a particular input to the fair value measurement in its entirety requires judgment, and considers factors specific to the investment. Level 1 includes unadjusted quoted prices in active markets for identical assets or liabilities. Level 2 includes other significant observable market-based inputs (including quoted prices for similar
Notes to Financial Statements (unaudited) - continued
securities, interest rates, prepayment speed, and credit risk). Level 3 includes significant unobservable inputs, which may include the adviser's own assumptions in determining the fair value of investments. The following is a summary of the levels used as of February 28, 2023 in valuing the fund's assets and liabilities:
| Financial Instruments | Level 1 | Level 2 | Level 3 | Total |
| Equity Securities | $5,562,203,311 | $— | $— | $5,562,203,311 |
| Mutual Funds | 51,172,373 | — | — | 51,172,373 |
| Total | $5,613,375,684 | $— | $— | $5,613,375,684 |
| Securities Sold Short | $(13,510,017) | $— | $— | $(13,510,017) |
For further information regarding security characteristics, see the Portfolio of Investments.
Foreign Currency Translation — Purchases and sales of foreign investments, income, and expenses are converted into U.S. dollars based upon currency exchange rates prevailing on the respective dates of such transactions or on the reporting date for foreign denominated receivables and payables. Gains and losses attributable to foreign currency exchange rates on sales of securities are recorded for financial statement purposes as net realized gains and losses on investments. Gains and losses attributable to foreign exchange rate movements on receivables, payables, income and expenses are recorded for financial statement purposes as foreign currency transaction gains and losses. That portion of both realized and unrealized gains and losses on investments that results from fluctuations in foreign currency exchange rates is not separately disclosed.
Short Sales — The fund entered into short sales whereby it sells a security it does not own in anticipation of a decline in the value of that security. The fund will realize a gain if the security price decreases and a loss if the security price increases between the date of the short sale and the date on which the fund replaces the borrowed security. Losses from short sales can exceed the proceeds of the security sold; and they can also exceed the potential loss from an ordinary buy and sell transaction. The amount of any premium, dividends, or interest the fund may be required to pay in connection with a short sale will be recognized as a fund expense. During the six months ended February 28, 2023, this expense amounted to $334,459.
Security Loans — Under its Securities Lending Agency Agreement with the fund, State Street Bank and Trust Company, as lending agent, loans the securities of the fund to certain qualified institutions (the “Borrowers”) approved by the fund. Security loans can be terminated at the discretion of either the lending agent or the fund and the related securities must be returned within the earlier of the standard trade settlement period for such securities or within three business days. The loans are collateralized by cash and/or U.S. Treasury and federal agency obligations in an amount typically at least equal to the market value of the securities loaned. On loans collateralized by cash, the cash collateral is invested in a money market fund. The market value of the loaned securities is determined at the close of business of the fund and any additional required collateral is delivered to the fund on the next business day. The lending agent provides the fund with indemnification against Borrower default. In the event of Borrower default, the lending agent will, for the benefit of the fund, either purchase securities identical to those loaned or, when such purchase is commercially impracticable, pay the fund the market value of the loaned securities. In return, the lending agent assumes the fund's rights to the related collateral. If the collateral value is less than the cost to
Notes to Financial Statements (unaudited) - continued
purchase identical securities, the lending agent is responsible for the shortfall, but only to the extent that such shortfall is not due to a decline in collateral value resulting from collateral reinvestment for which the fund bears the risk of loss. At period end, the fund had investment securities on loan, all of which were classified as equity securities in the fund's Portfolio of Investments, with a fair value of $3,263,204. The fair value of the fund's investment securities on loan and a related liability of $3,647,311 for cash collateral received on securities loaned are both presented gross in the Statement of Assets and Liabilities. The collateral on securities loaned exceeded the value of securities on loan at period end. The liability for cash collateral for securities loaned is carried at fair value, which is categorized as level 2 within the fair value hierarchy. A portion of the income generated upon investment of the collateral is remitted to the Borrowers, and the remainder is allocated between the fund and the lending agent. On loans collateralized by U.S. Treasury and/or federal agency obligations, a fee is received from the Borrower, and is allocated between the fund and the lending agent. Income from securities lending is separately reported in the Statement of Operations. The dividend and interest income earned on the securities loaned is accounted for in the same manner as other dividend and interest income.
Indemnifications — Under the fund's organizational documents, its officers and Trustees may be indemnified against certain liabilities and expenses arising out of the performance of their duties to the fund. Additionally, in the normal course of business, the fund enters into agreements with service providers that may contain indemnification clauses. The fund's maximum exposure under these agreements is unknown as this would involve future claims that may be made against the fund that have not yet occurred.
Investment Transactions and Income — Investment transactions are recorded on the trade date. Dividends received in cash are recorded on the ex-dividend date. Certain dividends from foreign securities will be recorded when the fund is informed of the dividend if such information is obtained subsequent to the ex-dividend date. Dividend payments received in additional securities are recorded on the ex-dividend date in an amount equal to the value of the security on such date. In determining the net gain or loss on securities sold, the cost of securities is determined on the identified cost basis.
The fund may receive proceeds from litigation settlements. Any proceeds received from litigation involving portfolio holdings are reflected in the Statement of Operations in realized gain/loss if the security has been disposed of by the fund or in unrealized gain/loss if the security is still held by the fund. Any other proceeds from litigation not related to portfolio holdings are reflected as other income in the Statement of Operations.
Tax Matters and Distributions — The fund intends to qualify as a regulated investment company, as defined under Subchapter M of the Internal Revenue Code, and to distribute all of its taxable income, including realized capital gains. As a result, no provision for federal income tax is required. The fund’s federal tax returns, when filed, will remain subject to examination by the Internal Revenue Service for a three year period. Management has analyzed the fund’s tax positions taken on federal and state tax returns for all open tax years and does not believe that there are any uncertain tax positions that require recognition of a tax liability. Foreign taxes, if any, have been accrued by the fund in the accompanying financial statements in accordance with the
Notes to Financial Statements (unaudited) - continued
applicable foreign tax law. Foreign income taxes may be withheld by certain countries in which the fund invests. Additionally, capital gains realized by the fund on securities issued in or by certain foreign countries may be subject to capital gains tax imposed by those countries.
Distributions to shareholders are recorded on the ex-dividend date. Income and capital gain distributions are determined in accordance with income tax regulations, which may differ from U.S. generally accepted accounting principles. Certain capital accounts in the financial statements are periodically adjusted for permanent differences in order to reflect their tax character. These adjustments have no impact on net assets or net asset value per share. Temporary differences which arise from recognizing certain items of income, expense, gain or loss in different periods for financial statement and tax purposes will reverse at some time in the future.
Book/tax differences primarily relate to wash sale loss deferrals, treating a portion of the proceeds from redemptions as a distribution for tax purposes, and partnership adjustments.
The tax character of distributions made during the current period will be determined at fiscal year end. The tax character of distributions declared to shareholders for the last fiscal year is as follows:
| | Year ended
8/31/22 |
| Ordinary income (including any short-term capital gains) | $183,307,105 |
| Long-term capital gains | 250,000,505 |
| Total distributions | $433,307,610 |
The federal tax cost and the tax basis components of distributable earnings were as follows:
| As of 2/28/23 | |
| Cost of investments | $4,445,174,232 |
| Gross appreciation | 1,410,102,697 |
| Gross depreciation | (241,901,245) |
| Net unrealized appreciation (depreciation) | $1,168,201,452 |
| As of 8/31/22 | |
| Undistributed ordinary income | 28,189,853 |
| Undistributed long-term capital gain | 174,804,849 |
| Other temporary differences | 4,480,256 |
| Net unrealized appreciation (depreciation) | 1,091,564,250 |
The aggregate cost above includes prior fiscal year end tax adjustments, if applicable.
Multiple Classes of Shares of Beneficial Interest — The fund offers multiple classes of shares, which differ in their respective distribution and service fees. The fund's income, realized and unrealized gain (loss), and common expenses are allocated to shareholders based on the daily net assets of each class. Dividends are declared separately for each class. Differences in per share dividend rates are generally due to differences in separate class expenses. Class B and Class C shares will convert to
Notes to Financial Statements (unaudited) - continued
Class A shares approximately eight years after purchase. The fund’s distributions declared to shareholders as reported in the Statements of Changes in Net Assets are presented by class as follows:
| | Six months
ended
2/28/23 | | Year
ended
8/31/22 |
| Class A | $78,167,508 | | $172,852,603 |
| Class B | 539,902 | | 1,835,488 |
| Class C | 4,075,665 | | 11,222,207 |
| Class I | 50,980,529 | | 102,395,888 |
| Class R1 | 241,291 | | 303,682 |
| Class R2 | 669,798 | | 1,478,984 |
| Class R3 | 2,119,841 | | 5,462,151 |
| Class R4 | 1,377,761 | | 2,852,391 |
| Class R6 | 65,134,898 | | 134,904,216 |
| Total | $203,307,193 | | $433,307,610 |
(3) Transactions with Affiliates
Investment Adviser — The fund has an investment advisory agreement with MFS to provide overall investment management and related administrative services and facilities to the fund. The management fee is computed daily and paid monthly at the following annual rates based on the fund's average daily net assets:
| Up to $500 million | 0.65% |
| In excess of $500 million and up to $2.5 billion | 0.55% |
| In excess of $2.5 billion and up to $5 billion | 0.50% |
| In excess of $5 billion and up to $10 billion | 0.47% |
| In excess of $10 billion | 0.45% |
MFS has agreed in writing to reduce its management fee by a specified amount if certain MFS mutual fund assets exceed thresholds agreed to by MFS and the fund's Board of Trustees. MFS has also agreed in writing to waive at least 0.01% of its management fee as part of this agreement. The agreement to waive at least 0.01% of the management fee will continue until modified by the fund's Board of Trustees, but such agreement will continue at least until December 31, 2023. For the six months ended February 28, 2023, this management fee reduction amounted to $367,106, which is included in the reduction of total expenses in the Statement of Operations.
The management fee incurred for the six months ended February 28, 2023 was equivalent to an annual effective rate of 0.51% of the fund's average daily net assets.
Distributor — MFS Fund Distributors, Inc. (MFD), a wholly-owned subsidiary of MFS, as distributor, received $142,177 for the six months ended February 28, 2023, as its portion of the initial sales charge on sales of Class A shares of the fund.
The Board of Trustees has adopted a distribution plan for certain share classes pursuant to Rule 12b-1 of the Investment Company Act of 1940.
Notes to Financial Statements (unaudited) - continued
The fund's distribution plan provides that the fund will pay MFD for services provided by MFD and financial intermediaries in connection with the distribution and servicing of certain share classes. One component of the plan is a distribution fee paid to MFD and another component of the plan is a service fee paid to MFD. MFD may subsequently pay all, or a portion, of the distribution and/or service fees to financial intermediaries.
Distribution Plan Fee Table:
| | Distribution
Fee Rate (d) | Service
Fee Rate (d) | Total
Distribution
Plan (d) | Annual
Effective
Rate (e) | Distribution
and Service
Fee |
| Class A | — | 0.25% | 0.25% | 0.25% | $ 2,655,688 |
| Class B | 0.75% | 0.25% | 1.00% | 1.00% | 69,442 |
| Class C | 0.75% | 0.25% | 1.00% | 1.00% | 513,267 |
| Class R1 | 0.75% | 0.25% | 1.00% | 1.00% | 29,058 |
| Class R2 | 0.25% | 0.25% | 0.50% | 0.49% | 47,084 |
| Class R3 | — | 0.25% | 0.25% | 0.25% | 72,689 |
| Total Distribution and Service Fees | | | | | $3,387,228 |
| (d) | In accordance with the distribution plan for certain classes, the fund pays distribution and/or service fees equal to these annual percentage rates of each class’s average daily net assets. The distribution and service fee rates disclosed by class represent the current rates in effect at the end of the reporting period. Any rate changes, if applicable, are detailed below. |
| (e) | The annual effective rates represent actual fees incurred under the distribution plan for the six months ended February 28, 2023 based on each class's average daily net assets. MFD has voluntarily agreed to rebate a portion of each class's 0.25% service fee attributable to accounts for which there is no financial intermediary specified on the account except for accounts attributable to MFS or its affiliates' seed money. For the six months ended February 28, 2023, this rebate amounted to $505, $10, $14, and $1,323 for Class A, Class B, Class C, and Class R2 shares, respectively, and is included in the reduction of total expenses in the Statement of Operations. |
Certain Class A shares are subject to a contingent deferred sales charge (CDSC) in the event of a shareholder redemption within 18 months of purchase. Class B shares are subject to a CDSC in the event of a shareholder redemption within six years of purchase. Class C shares are subject to a CDSC in the event of a shareholder redemption within 12 months of purchase. All contingent deferred sales charges are paid to MFD and during the six months ended February 28, 2023, were as follows:
| | Amount |
| Class A | $31,571 |
| Class B | 3,521 |
| Class C | 8,970 |
Shareholder Servicing Agent — MFS Service Center, Inc. (MFSC), a wholly-owned subsidiary of MFS, receives a fee from the fund for its services as shareholder servicing agent calculated as a percentage of the average daily net assets of the fund as determined periodically under the supervision of the fund's Board of Trustees. For the six months ended February 28, 2023, the fee was $237,613, which equated to 0.0086% annually of the fund's average daily net assets. MFSC also receives reimbursement from the fund for out-of-pocket expenses, sub-accounting and other shareholder servicing costs which may be paid to affiliated and unaffiliated service
Notes to Financial Statements (unaudited) - continued
providers. Class R6 shares do not incur sub-accounting fees. For the six months ended February 28, 2023, these out-of-pocket expenses, sub-accounting and other shareholder servicing costs amounted to $1,801,938.
Administrator — MFS provides certain financial, legal, shareholder communications, compliance, and other administrative services to the fund. Under an administrative services agreement, the fund reimburses MFS the costs incurred to provide these services. The fund is charged an annual fixed amount of $17,500 plus a fee based on average daily net assets. The administrative services fee incurred for the six months ended February 28, 2023 was equivalent to an annual effective rate of 0.0115% of the fund's average daily net assets.
Trustees’ and Officers’ Compensation — The fund pays compensation to independent Trustees in the form of a retainer, attendance fees, and additional compensation to Board and Committee chairpersons. The fund does not pay compensation directly to Trustees or officers of the fund who are also officers of the investment adviser, all of whom receive remuneration from MFS for their services to the fund. Certain officers and Trustees of the fund are officers or directors of MFS, MFD, and MFSC.
Prior to December 31, 2001, the fund had an unfunded defined benefit plan (“DB plan”) for independent Trustees. As of December 31, 2001, the Board took action to terminate the DB plan with respect to then-current and any future independent Trustees, such that the DB plan covers only certain of those former independent Trustees who retired on or before December 31, 2001. The DB plan resulted in a net decrease in pension expense of $16 and is included in “Independent Trustees’ compensation” in the Statement of Operations for the six months ended February 28, 2023. The liability for deferred retirement benefits payable to those former independent Trustees under the DB plan amounted to $1,879 at February 28, 2023, and is included in “Payable for independent Trustees’ compensation” in the Statement of Assets and Liabilities.
Other — The fund invests in the MFS Institutional Money Market Portfolio which is managed by MFS and seeks current income consistent with preservation of capital and liquidity. This money market fund does not pay a management fee to MFS but does incur investment and operating costs.
The fund is permitted to engage in purchase and sale transactions with funds and accounts for which MFS serves as investment adviser or sub-adviser (“cross-trades”) pursuant to a policy adopted by the Board of Trustees. This policy has been designed to ensure that cross-trades conducted by the fund comply with Rule 17a-7 under the Investment Company Act of 1940. During the six months ended February 28, 2023, the fund engaged in purchase transactions pursuant to this policy, which amounted to $3,906,573.
The adviser has voluntarily undertaken to reimburse the fund from its own resources on a quarterly basis for the cost of investment research embedded in the cost of the fund’s securities trades. This agreement may be rescinded at any time. For the six months ended February 28, 2023, this reimbursement amounted to $110,981, which is included in “Other” income in the Statement of Operations.
Notes to Financial Statements (unaudited) - continued
(4) Portfolio Securities
For the six months ended February 28, 2023, purchases and sales of investments, other than short sales, and short-term obligations, aggregated $888,811,602 and $887,809,340, respectively.
(5) Shares of Beneficial Interest
The fund's Declaration of Trust permits the Trustees to issue an unlimited number of full and fractional shares of beneficial interest. Transactions in fund shares were as follows:
| | Six months ended
2/28/23 | | Year ended
8/31/22 |
| | Shares | Amount | | Shares | Amount |
| Shares sold | | | | | |
| Class A | 3,342,751 | $130,870,577 | | 7,081,371 | $313,593,228 |
| Class B | 1,615 | 54,387 | | 8,590 | 324,881 |
| Class C | 275,625 | 8,898,484 | | 446,130 | 16,898,958 |
| Class I | 6,465,698 | 270,690,227 | | 14,165,832 | 670,955,988 |
| Class R1 | 108,035 | 3,634,474 | | 33,104 | 1,229,815 |
| Class R2 | 49,287 | 1,901,731 | | 123,562 | 5,247,874 |
| Class R3 | 97,748 | 3,818,343 | | 274,974 | 12,197,273 |
| Class R4 | 68,567 | 2,699,091 | | 161,191 | 7,287,844 |
| Class R6 | 3,772,989 | 159,004,216 | | 10,609,102 | 508,104,101 |
| | 14,182,315 | $581,571,530 | | 32,903,856 | $1,535,839,962 |
Shares issued to shareholders
in reinvestment of distributions | | | | | |
| Class A | 1,954,844 | $75,672,028 | | 3,562,980 | $167,210,640 |
| Class B | 16,436 | 535,482 | | 45,078 | 1,798,152 |
| Class C | 118,418 | 3,790,562 | | 267,931 | 10,505,565 |
| Class I | 1,024,361 | 42,500,719 | | 1,818,846 | 91,233,293 |
| Class R1 | 7,533 | 241,291 | | 7,733 | 303,682 |
| Class R2 | 17,823 | 669,798 | | 32,394 | 1,477,502 |
| Class R3 | 54,932 | 2,119,841 | | 116,763 | 5,462,151 |
| Class R4 | 34,809 | 1,362,425 | | 59,453 | 2,819,255 |
| Class R6 | 1,540,429 | 64,097,237 | | 2,641,838 | 132,884,430 |
| | 4,769,585 | $190,989,383 | | 8,553,016 | $413,694,670 |
Notes to Financial Statements (unaudited) - continued
| | Six months ended
2/28/23 | | Year ended
8/31/22 |
| | Shares | Amount | | Shares | Amount |
| Shares reacquired | | | | | |
| Class A | (3,994,794) | $(156,390,840) | | (6,675,894) | $(294,800,220) |
| Class B | (83,140) | (2,734,731) | | (182,384) | (6,872,702) |
| Class C | (458,749) | (14,939,536) | | (891,321) | (33,011,810) |
| Class I | (5,793,636) | (243,576,842) | | (10,147,556) | (474,213,363) |
| Class R1 | (16,619) | (527,033) | | (42,175) | (1,536,764) |
| Class R2 | (52,271) | (1,998,262) | | (113,258) | (4,915,479) |
| Class R3 | (158,728) | (6,244,833) | | (446,435) | (19,633,182) |
| Class R4 | (96,083) | (3,800,456) | | (181,591) | (8,309,164) |
| Class R6 | (4,450,946) | (187,225,202) | | (7,940,262) | (375,814,332) |
| | (15,104,966) | $(617,437,735) | | (26,620,876) | $(1,219,107,016) |
| Net change | | | | | |
| Class A | 1,302,801 | $50,151,765 | | 3,968,457 | $186,003,648 |
| Class B | (65,089) | (2,144,862) | | (128,716) | (4,749,669) |
| Class C | (64,706) | (2,250,490) | | (177,260) | (5,607,287) |
| Class I | 1,696,423 | 69,614,104 | | 5,837,122 | 287,975,918 |
| Class R1 | 98,949 | 3,348,732 | | (1,338) | (3,267) |
| Class R2 | 14,839 | 573,267 | | 42,698 | 1,809,897 |
| Class R3 | (6,048) | (306,649) | | (54,698) | (1,973,758) |
| Class R4 | 7,293 | 261,060 | | 39,053 | 1,797,935 |
| Class R6 | 862,472 | 35,876,251 | | 5,310,678 | 265,174,199 |
| | 3,846,934 | $155,123,178 | | 14,835,996 | $730,427,616 |
Effective June 1, 2019, purchases of the fund’s Class B shares were closed to new and existing investors subject to certain exceptions.
(6) Line of Credit
The fund and certain other funds managed by MFS participate in a $1.45 billion unsecured committed line of credit of which $1.2 billion is reserved for use by the fund and certain other MFS U.S. funds. The line of credit is provided by a syndicate of banks under a credit agreement. Borrowings may be made for temporary financing needs. Interest is charged to each fund, based on its borrowings, generally at a rate equal to the highest of 1) Daily Simple SOFR (Secured Overnight Financing Rate) plus 0.10%, 2) the Federal Funds Effective Rate, or 3) the Overnight Bank Funding Rate, each plus an agreed upon spread. A commitment fee, based on the average daily unused portion of the committed line of credit, is allocated among the participating funds. The line of credit expires on March 14, 2024 unless extended or renewed. In addition, the fund and other funds managed by MFS have established unsecured uncommitted borrowing arrangements with certain banks for temporary financing needs. Interest is charged to each fund, based on its borrowings, at rates equal to customary reference rates plus an
Notes to Financial Statements (unaudited) - continued
agreed upon spread. For the six months ended February 28, 2023, the fund’s commitment fee and interest expense were $14,153 and $0, respectively, and are included in “Interest expense and fees” in the Statement of Operations.
(7) Investments in Affiliated Issuers
An affiliated issuer may be considered one in which the fund owns 5% or more of the outstanding voting securities, or a company which is under common control. For the purposes of this report, the following were affiliated issuers:
| Affiliated Issuers | Beginning
Value | Purchases | Sales
Proceeds | Realized
Gain
(Loss) | Change in
Unrealized
Appreciation or
Depreciation | Ending
Value |
| MFS Institutional Money Market Portfolio | $86,682,431 | $310,854,110 | $350,004,215 | $(4,517) | $(2,747) | $47,525,062 |
| Affiliated Issuers | Dividend
Income | Capital Gain
Distributions |
| MFS Institutional Money Market Portfolio | $1,022,975 | $— |
(8) LIBOR Transition
Certain of the fund's investments, including investments in certain debt instruments and derivatives (if any), as well as borrowings by the fund and certain other contractual arrangements of the fund, may be based on the London Interbank Offered Rate (“LIBOR”). In 2017, the regulatory authority that oversees financial services firms in the United Kingdom announced plans to transition away from LIBOR by the end of 2021. In March 2021, the administrator of LIBOR announced the extension of the publication of the more commonly used U.S. dollar LIBOR settings to the end of June 2023. Although the full impacts of the transition away from LIBOR are not fully known, the transition may result in, among other things, an increase in volatility or illiquidity of the markets for instruments that currently rely on LIBOR to determine interest rates and this could have an adverse impact on the fund's performance. With respect to the fund's accounting for investments, including investments in certain debt instruments and derivatives, as well as borrowings by the fund and any other contractual arrangements of the fund that undergo reference rate-related modifications as a result of the transition, management will rely upon the relief provided by FASB Codification Topic 848 – Reference Rate Reform (Topic 848). The guidance in Topic 848 permits the fund to account for those modified contracts as a continuation of the existing contracts. The situation remains fluid, and management believes, based on best available information, that the impact of the transition will not be material to the fund.
(9) Subsequent Event
On March 30, 2023, the fund announced that effective after the close of business on September 29, 2023, purchases of Class R1 and Class R2 shares will be closed to new eligible investors.
Proxy Voting Policies and Information
MFS votes proxies on behalf of the fund pursuant to proxy voting policies and procedures that are available without charge, upon request, by calling 1-800-225-2606, by visiting mfs.com/proxyvoting, or by visiting the SEC’s Web site at http://www.sec.gov.
Information regarding how the fund voted proxies relating to portfolio securities during the most recent twelve-month period ended June 30 is available by August 31 of each year without charge by visiting mfs.com/proxyvoting, or by visiting the SEC’s Web site at http://www.sec.gov.
Quarterly Portfolio Disclosure
The fund files a complete schedule of portfolio holdings with the SEC for the first and third quarters of each fiscal year as an exhibit to its reports on Form N-PORT. The fund's Form N-PORT reports are available on the SEC's Web site at http://www.sec.gov. A shareholder can obtain the portfolio holdings report for the first and third quarters of the fund's fiscal year at mfs.com/openendfunds by choosing the fund's name and then scrolling to the “Resources” section and clicking on the “Prospectus and Reports” tab.
Further Information
From time to time, MFS may post important information about the fund or the MFS Funds on the MFS Web site (mfs.com). This information is available at https://www.mfs.com/announcements or at mfs.com/openendfunds by choosing the fund’s name and then scrolling to the “Resources” section and clicking on the “Announcements” tab, if any.
Information About Fund Contracts and Legal Claims
The fund has entered into contractual arrangements with an investment adviser, administrator, distributor, shareholder servicing agent, and custodian who each provide services to the fund. Unless expressly stated otherwise, shareholders are not parties to, or intended beneficiaries of these contractual arrangements, and these contractual arrangements are not intended to create any shareholder right to enforce them against the service providers or to seek any remedy under them against the service providers, either directly or on behalf of the fund.
Under the Trust’s By-Laws and Declaration of Trust, any claims asserted against or on behalf of the MFS Funds, including claims against Trustees and Officers, must be brought in state and federal courts located within the Commonwealth of Massachusetts.
Provision of Financial Reports and Summary Prospectuses
The fund produces financial reports every six months and updates its summary prospectus and prospectus annually. To avoid sending duplicate copies of materials to households, only one copy of the fund’s annual and semiannual report and summary prospectus may be mailed to shareholders having the same last name and residential address on the fund’s records. However, any shareholder may contact MFSC (please see back cover for address and telephone number) to request that copies of these reports and summary prospectuses be sent personally to that shareholder.
Save paper with eDelivery.
MFS® will send you prospectuses, reports, and proxies directly via e-mail so you will get information faster with less mailbox clutter.
To sign up:
1. Go to mfs.com.
2. Log in via MFS® Access.
3. Select eDelivery.
If you own your MFS fund shares through a financial institution or a retirement plan, MFS® TALK, MFS® Access, or eDelivery may not be available to you.
CONTACT
WEB SITE
mfs.com
MFS TALK
1-800-637-8255
24 hours a day
ACCOUNT SERVICE AND LITERATURE
Shareholders
1-800-225-2606
Financial advisors
1-800-343-2829
Retirement plan services
1-800-637-1255
MAILING ADDRESS
MFS Service Center, Inc.
P.O. Box 219341
Kansas City, MO 64121-9341
OVERNIGHT MAIL
MFS Service Center, Inc.
Suite 219341
430 W 7th Street
Kansas City, MO 64105-1407
Semiannual Report
February 28, 2023
MFS® Low Volatility
Equity Fund
MFS® Low Volatility
Equity Fund
The report is prepared for the general information of shareholders. It is authorized for distribution to prospective investors only when preceded or accompanied by a current prospectus.
NOT FDIC INSURED • MAY LOSE VALUE • NO BANK GUARANTEE
LETTER FROM THE CHAIR AND CEO
Dear Shareholders:
Markets — which rallied in late 2022 and early 2023 on signs of peaking inflation, hopes that monetary policy tightening cycles may be nearing an end and a rapid reopening of China’s economy — have hit turbulence after the sudden collapse of two US regional banks and the government-led merger of Switzerland’s two largest lenders. At the same time, US inflation data suggest that price pressures will prove more persistent than expected, making the US Federal Reserve’s job of trying to corral four-decade-high inflation without tipping the economy into recession that much more difficult. On a positive note, markets have largely adjusted to the challenges posed by Russia’s invasion of Ukraine, thanks in part to mild European winter weather that has alleviated concerns over potential near-term shortages of natural gas. Resilient labor markets in much of the developed world have further contributed to a brighter-than-expected economic backdrop. However, after the recent banking turmoil, investors are increasingly mindful that the lagged effects of ongoing monetary policy tightening have yet to fully work their way through the global economy.
One result of the banking crisis has been a rally in global government bond markets as investors sense that the global monetary tightening campaign is nearing its end, and the resulting lower yields have eased some of the pressure on interest rate–sensitive parts of the economy. Over the near term, amid tighter financial conditions, we feel companies will face a challenging earnings backdrop as they are forced to absorb higher input and labor costs while pricing power dwindles. As for fixed income, the rise in interest rates in recent months has made bonds more attractive than they have been in years, which may provide balance for investors’ portfolios.
During times of market transition, it is important to have a deep understanding of company fundamentals, and we have built our unique global research platform to do just that.
At MFS®, we put our clients’ assets to work responsibly by carefully navigating increasingly complex global capital markets. Our investment team is guided by a commitment to long-term fundamental investing. Our global investment platform — combining collective expertise, long-term discipline, and thoughtful risk management — seeks to uncover what we believe are the best, most durable investment ideas in markets around the world, enabling us to potentially create value for investors.
Respectfully,
Michael W. Roberge
Chair and Chief Executive Officer
MFS Investment Management
April 14, 2023
The opinions expressed in this letter are subject to change and may not be relied upon for investment advice. No forecasts can be guaranteed.
Portfolio structure
Top ten holdings
| Amdocs Ltd. | 3.4% |
| Merck & Co., Inc. | 3.3% |
| Johnson & Johnson | 3.0% |
| Accenture PLC, “A” | 2.5% |
| Microsoft Corp. | 2.3% |
| Everest Re Group Ltd. | 2.3% |
| Republic Services, Inc. | 2.2% |
| PepsiCo, Inc. | 2.2% |
| Visa, Inc., “A” | 2.0% |
| Eli Lilly & Co. | 1.9% |
GICS equity sectors (g)
| Information Technology | 23.6% |
| Health Care | 16.4% |
| Industrials | 12.2% |
| Consumer Staples | 11.1% |
| Financials | 9.8% |
| Consumer Discretionary | 8.8% |
| Utilities | 7.2% |
| Communication Services | 5.2% |
| Real Estate | 3.6% |
| Materials | 1.8% |
| (g) | The Global Industry Classification Standard (GICS®) was developed by and/or is the exclusive property of MSCI, Inc. and S&P Global Market Intelligence Inc. (“S&P Global Market Intelligence”). GICS is a service mark of MSCI and S&P Global Market Intelligence and has been licensed for use by MFS. MFS has applied its own internal sector/industry classification methodology for equity securities and non-equity securities that are unclassified by GICS. |
Cash & Cash Equivalents includes any cash, investments in money market funds, short-term securities, and other assets less liabilities. Please see the Statement of Assets and Liabilities for additional information related to the fund’s cash position and other assets and liabilities.
Percentages are based on net assets as of February 28, 2023.
The portfolio is actively managed and current holdings may be different.
Expense Table
Fund expenses borne by the shareholders during the period,
September 1, 2022 through February 28, 2023
As a shareholder of the fund, you incur two types of costs: (1) transaction costs, including sales charges (loads) on certain purchase or redemption payments, and (2) ongoing costs, including management fees; distribution and service (12b-1) fees; and other fund expenses. This example is intended to help you understand your ongoing costs (in dollars) of investing in the fund and to compare these costs with the ongoing costs of investing in other mutual funds.
The example is based on an investment of $1,000 invested at the beginning of the period and held for the entire period September 1, 2022 through February 28, 2023.
Actual Expenses
The first line for each share class in the following table provides information about actual account values and actual expenses. You may use the information in this line, together with the amount you invested, to estimate the expenses that you paid over the period. Simply divide your account value by $1,000 (for example, an $8,600 account value divided by $1,000 = 8.6), then multiply the result by the number in the first line under the heading entitled “Expenses Paid During Period” to estimate the expenses you paid on your account during this period.
Hypothetical Example for Comparison Purposes
The second line for each share class in the following table provides information about hypothetical account values and hypothetical expenses based on the fund’s actual expense ratio and an assumed rate of return of 5% per year before expenses, which is not the fund’s actual return. The hypothetical account values and expenses may not be used to estimate the actual ending account balance or expenses you paid for the period. You may use this information to compare the ongoing costs of investing in the fund and other funds. To do so, compare this 5% hypothetical example with the 5% hypothetical examples that appear in the shareholder reports of the other funds.
Please note that the expenses shown in the table are meant to highlight your ongoing costs only and do not reflect any transactional costs, such as sales charges (loads). Therefore, the second line for each share class in the table is useful in comparing ongoing costs only, and will not help you determine the relative total costs of owning different funds. In addition, if these transactional costs were included, your costs would have been higher.
Expense Table - continued
Share
Class | | Annualized
Expense
Ratio | Beginning
Account Value
9/01/22 | Ending
Account Value
2/28/23 | Expenses
Paid During
Period (p)
9/01/22-2/28/23 |
| A | Actual | 0.89% | $1,000.00 | $1,016.20 | $4.45 |
| Hypothetical (h) | 0.89% | $1,000.00 | $1,020.38 | $4.46 |
| B | Actual | 1.64% | $1,000.00 | $1,012.68 | $8.18 |
| Hypothetical (h) | 1.64% | $1,000.00 | $1,016.66 | $8.20 |
| C | Actual | 1.64% | $1,000.00 | $1,012.96 | $8.19 |
| Hypothetical (h) | 1.64% | $1,000.00 | $1,016.66 | $8.20 |
| I | Actual | 0.64% | $1,000.00 | $1,017.63 | $3.20 |
| Hypothetical (h) | 0.64% | $1,000.00 | $1,021.62 | $3.21 |
| R1 | Actual | 1.64% | $1,000.00 | $1,012.47 | $8.18 |
| Hypothetical (h) | 1.64% | $1,000.00 | $1,016.66 | $8.20 |
| R2 | Actual | 1.14% | $1,000.00 | $1,015.20 | $5.70 |
| Hypothetical (h) | 1.14% | $1,000.00 | $1,019.14 | $5.71 |
| R3 | Actual | 0.89% | $1,000.00 | $1,016.71 | $4.45 |
| Hypothetical (h) | 0.89% | $1,000.00 | $1,020.38 | $4.46 |
| R4 | Actual | 0.64% | $1,000.00 | $1,017.62 | $3.20 |
| Hypothetical (h) | 0.64% | $1,000.00 | $1,021.62 | $3.21 |
| R6 | Actual | 0.55% | $1,000.00 | $1,018.23 | $2.75 |
| Hypothetical (h) | 0.55% | $1,000.00 | $1,022.07 | $2.76 |
| (h) | 5% class return per year before expenses. |
| (p) | “Expenses Paid During Period” are equal to each class’s annualized expense ratio, as shown above, multiplied by the average account value over the period, multiplied by 181/365 (to reflect the one-half year period). Expenses paid do not include any applicable sales charges (loads). If these transaction costs had been included, your costs would have been higher. |
Portfolio of Investments
2/28/23 (unaudited)
The Portfolio of Investments is a complete list of all securities owned by your fund. It is categorized by broad-based asset classes.
| Issuer | | | Shares/Par | Value ($) |
| Common Stocks – 99.7% |
| Aerospace & Defense – 2.4% | |
| CACI International, Inc., “A” (a) | | 14,517 | $4,253,481 |
| General Dynamics Corp. | | 9,213 | 2,099,735 |
| Honeywell International, Inc. | | 12,711 | 2,433,902 |
| Huntington Ingalls Industries, Inc. | | 8,789 | 1,891,393 |
| | | | | $10,678,511 |
| Automotive – 0.4% | |
| Lear Corp. | | 13,795 | $1,926,472 |
| Broadcasting – 0.5% | |
| Omnicom Group, Inc. | | 22,480 | $2,036,014 |
| Brokerage & Asset Managers – 0.9% | |
| LPL Financial Holdings, Inc. | | 8,093 | $2,019,689 |
| Raymond James Financial, Inc. | | 19,284 | 2,091,543 |
| | | | | $4,111,232 |
| Business Services – 9.6% | |
| Accenture PLC, “A” | | 42,485 | $11,281,892 |
| Amdocs Ltd. | | 163,228 | 14,953,317 |
| Cognizant Technology Solutions Corp., “A” | | 90,085 | 5,642,023 |
| Fidelity National Information Services, Inc. | | 52,393 | 3,320,144 |
| Fiserv, Inc. (a) | | 23,530 | 2,708,068 |
| FleetCor Technologies, Inc. (a) | | 22,034 | 4,732,683 |
| | | | | $42,638,127 |
| Cable TV – 0.6% | |
| Comcast Corp., “A” | | 72,788 | $2,705,530 |
| Computer Software – 2.3% | |
| Microsoft Corp. | | 41,441 | $10,336,214 |
| Computer Software - Systems – 2.5% | |
| Box, Inc., “A” (a) | | 67,313 | $2,244,889 |
| Juniper Networks, Inc. | | 99,280 | 3,055,838 |
| SS&C Technologies Holdings, Inc. | | 102,550 | 6,019,685 |
| | | | | $11,320,412 |
| Construction – 0.5% | |
| AvalonBay Communities, Inc., REIT | | 11,532 | $1,989,501 |
Portfolio of Investments (unaudited) – continued
| Issuer | | | Shares/Par | Value ($) |
| Common Stocks – continued |
| Consumer Products – 2.4% | |
| Colgate-Palmolive Co. | | 57,523 | $4,216,436 |
| Procter & Gamble Co. | | 46,938 | 6,456,791 |
| | | | | $10,673,227 |
| Containers – 0.5% | |
| Graphic Packaging Holding Co. | | 87,818 | $2,090,068 |
| Electrical Equipment – 2.2% | |
| AMETEK, Inc. | | 17,877 | $2,530,668 |
| TE Connectivity Ltd. | | 57,154 | 7,276,847 |
| | | | | $9,807,515 |
| Electronics – 1.6% | |
| Texas Instruments, Inc. | | 40,918 | $7,015,391 |
| Food & Beverages – 6.0% | |
| Archer Daniels Midland Co. | | 19,589 | $1,559,284 |
| General Mills, Inc. | | 95,725 | 7,611,095 |
| J.M. Smucker Co. | | 37,048 | 5,479,029 |
| Mondelez International, Inc. | | 38,939 | 2,538,044 |
| PepsiCo, Inc. | | 55,380 | 9,610,091 |
| | | | | $26,797,543 |
| Food & Drug Stores – 0.9% | |
| Kroger Co. | | 95,297 | $4,111,113 |
| Gaming & Lodging – 0.5% | |
| Hilton Worldwide Holdings, Inc. | | 13,988 | $2,021,406 |
| General Merchandise – 1.0% | |
| Dollar General Corp. | | 20,076 | $4,342,439 |
| Health Maintenance Organizations – 1.2% | |
| Cigna Group | | 9,915 | $2,896,171 |
| UnitedHealth Group, Inc. | | 4,673 | 2,224,068 |
| | | | | $5,120,239 |
| Insurance – 8.0% | |
| Ameriprise Financial, Inc. | | 6,874 | $2,356,888 |
| Aon PLC | | 6,552 | 1,992,136 |
| Assurant, Inc. | | 21,827 | 2,780,542 |
| Chubb Ltd. | | 26,239 | 5,536,954 |
| Equitable Holdings, Inc. | | 62,295 | 1,957,309 |
| Everest Re Group Ltd. | | 26,707 | 10,254,687 |
| Hanover Insurance Group, Inc. | | 16,786 | 2,341,311 |
| Hartford Financial Services Group, Inc. | | 37,015 | 2,897,534 |
Portfolio of Investments (unaudited) – continued
| Issuer | | | Shares/Par | Value ($) |
| Common Stocks – continued |
| Insurance – continued | |
| MetLife, Inc. | | 42,310 | $3,034,896 |
| Reinsurance Group of America, Inc. | | 17,808 | 2,572,722 |
| | | | | $35,724,979 |
| Internet – 2.4% | |
| Alphabet, Inc., “A” (a) | | 86,580 | $7,797,395 |
| Alphabet, Inc., “C” (a) | | 31,193 | 2,816,728 |
| | | | | $10,614,123 |
| Machinery & Tools – 3.8% | |
| Eaton Corp. PLC | | 45,553 | $7,968,587 |
| PACCAR, Inc. | | 31,135 | 2,247,947 |
| Roper Technologies, Inc. | | 11,041 | 4,749,838 |
| Timken Co. | | 24,940 | 2,131,123 |
| | | | | $17,097,495 |
| Major Banks – 0.4% | |
| JPMorgan Chase & Co. | | 13,698 | $1,963,608 |
| Medical & Health Technology & Services – 1.7% | |
| McKesson Corp. | | 21,604 | $7,557,295 |
| Medical Equipment – 4.2% | |
| Abbott Laboratories | | 21,472 | $2,184,132 |
| Danaher Corp. | | 11,100 | 2,747,583 |
| Medtronic PLC | | 65,498 | 5,423,234 |
| STERIS PLC | | 30,219 | 5,682,079 |
| Thermo Fisher Scientific, Inc. | | 4,912 | 2,661,125 |
| | | | | $18,698,153 |
| Natural Gas - Distribution – 0.4% | |
| UGI Corp. | | 53,192 | $1,980,338 |
| Network & Telecom – 1.5% | |
| Motorola Solutions, Inc. | | 26,028 | $6,840,419 |
| Other Banks & Diversified Financials – 3.8% | |
| Mastercard, Inc., “A” | | 16,543 | $5,877,562 |
| U.S. Bancorp | | 43,134 | 2,058,786 |
| Visa, Inc., “A” | | 41,167 | 9,054,270 |
| | | | | $16,990,618 |
| Pharmaceuticals – 9.3% | |
| Eli Lilly & Co. | | 27,333 | $8,506,576 |
| Johnson & Johnson | | 88,067 | 13,497,148 |
| Merck & Co., Inc. | | 136,932 | 14,547,656 |
Portfolio of Investments (unaudited) – continued
| Issuer | | | Shares/Par | Value ($) |
| Common Stocks – continued |
| Pharmaceuticals – continued | |
| Zoetis, Inc. | | 29,505 | $4,927,335 |
| | | | | $41,478,715 |
| Pollution Control – 4.1% | |
| Republic Services, Inc. | | 76,599 | $9,875,909 |
| Waste Connections, Inc. | | 40,301 | 5,397,110 |
| Waste Management, Inc. | | 20,819 | 3,117,853 |
| | | | | $18,390,872 |
| Railroad & Shipping – 0.5% | |
| CSX Corp. | | 72,434 | $2,208,513 |
| Real Estate – 3.2% | |
| Life Storage, Inc., REIT | | 16,240 | $1,957,245 |
| National Retail Properties, Inc., REIT | | 43,950 | 1,991,814 |
| Public Storage, Inc., REIT | | 14,418 | 4,310,261 |
| Spirit Realty Capital, Inc., REIT | | 50,924 | 2,097,050 |
| Sun Communities, Inc., REIT | | 12,189 | 1,744,733 |
| W.P. Carey, Inc., REIT | | 24,247 | 1,967,887 |
| | | | | $14,068,990 |
| Restaurants – 2.7% | |
| McDonald's Corp. | | 20,576 | $5,430,212 |
| Starbucks Corp. | | 45,051 | 4,599,257 |
| Texas Roadhouse, Inc. | | 20,909 | 2,123,100 |
| | | | | $12,152,569 |
| Specialty Chemicals – 1.3% | |
| Ashland, Inc. | | 33,934 | $3,453,802 |
| Ecolab, Inc. | | 15,934 | 2,539,402 |
| | | | | $5,993,204 |
| Specialty Stores – 6.0% | |
| AutoZone, Inc. (a) | | 3,109 | $7,730,653 |
| Home Depot, Inc. | | 17,319 | 5,135,776 |
| O'Reilly Automotive, Inc. (a) | | 2,725 | 2,262,023 |
| Ulta Beauty, Inc. (a) | | 6,729 | 3,491,005 |
| Walmart Stores, Inc. | | 56,816 | 8,075,258 |
| | | | | $26,694,715 |
| Telecommunications - Wireless – 1.8% | |
| T-Mobile US, Inc. (a) | | 55,663 | $7,914,165 |
Portfolio of Investments (unaudited) – continued
| Issuer | | | Shares/Par | Value ($) |
| Common Stocks – continued |
| Trucking – 1.8% | |
| J.B. Hunt Transport Services, Inc. | | 12,957 | $2,342,496 |
| Landstar System, Inc. | | 17,710 | 3,201,791 |
| Old Dominion Freight Line, Inc. | | 7,405 | 2,512,220 |
| | | | | $8,056,507 |
| Utilities - Electric Power – 6.8% | |
| American Electric Power Co., Inc. | | 38,337 | $3,372,506 |
| DTE Energy Co. | | 28,273 | 3,101,831 |
| Duke Energy Corp. | | 40,161 | 3,785,576 |
| Edison International | | 36,109 | 2,390,777 |
| Evergy, Inc. | | 41,940 | 2,466,491 |
| Exelon Corp. | | 158,745 | 6,411,710 |
| NextEra Energy, Inc. | | 22,181 | 1,575,516 |
| Sempra Energy | | 14,786 | 2,217,309 |
| Xcel Energy, Inc. | | 76,607 | 4,946,514 |
| | | | | $30,268,230 |
| Total Common Stocks (Identified Cost, $349,812,078) | | $444,414,462 |
| Investment Companies (h) – 0.2% |
| Money Market Funds – 0.2% | |
| MFS Institutional Money Market Portfolio, 4.55% (v) (Identified Cost, $769,383) | | | 769,384 | $769,384 |
|
|
| Other Assets, Less Liabilities – 0.1% | | 620,042 |
| Net Assets – 100.0% | $445,803,888 |
| (a) | Non-income producing security. | | | |
| (h) | An affiliated issuer, which may be considered one in which the fund owns 5% or more of the outstanding voting securities, or a company which is under common control. At period end, the aggregate values of the fund's investments in affiliated issuers and in unaffiliated issuers were $769,384 and $444,414,462, respectively. | | | |
| (v) | Affiliated issuer that is available only to investment companies managed by MFS. The rate quoted for the MFS Institutional Money Market Portfolio is the annualized seven-day yield of the fund at period end. | | | |
| The following abbreviations are used in this report and are defined: |
| REIT | Real Estate Investment Trust |
See Notes to Financial Statements
Financial Statements
Statement of Assets and Liabilities
At 2/28/23 (unaudited)
This statement represents your fund’s balance sheet, which details the assets and liabilities comprising the total value of the fund.
| Assets | |
| Investments in unaffiliated issuers, at value (identified cost, $349,812,078) | $444,414,462 |
| Investments in affiliated issuers, at value (identified cost, $769,383) | 769,384 |
| Receivables for | |
| Fund shares sold | 444,257 |
| Dividends | 660,618 |
| Receivable from investment adviser | 1,174 |
| Other assets | 47,303 |
| Total assets | $446,337,198 |
| Liabilities | |
| Payables for | |
| Fund shares reacquired | $357,323 |
| Payable to affiliates | |
| Administrative services fee | 423 |
| Shareholder servicing costs | 79,515 |
| Distribution and service fees | 3,712 |
| Payable for independent Trustees' compensation | 1,350 |
| Accrued expenses and other liabilities | 90,987 |
| Total liabilities | $533,310 |
| Net assets | $445,803,888 |
| Net assets consist of | |
| Paid-in capital | $345,188,180 |
| Total distributable earnings (loss) | 100,615,708 |
| Net assets | $445,803,888 |
| Shares of beneficial interest outstanding | 25,419,055 |
Statement of Assets and Liabilities (unaudited) – continued
| | Net assets | Shares
outstanding | Net asset value
per share (a) |
| Class A | $161,884,775 | 9,238,066 | $17.52 |
| Class B | 1,545,936 | 88,525 | 17.46 |
| Class C | 24,267,082 | 1,396,521 | 17.38 |
| Class I | 150,559,997 | 8,576,829 | 17.55 |
| Class R1 | 561,782 | 32,118 | 17.49 |
| Class R2 | 456,860 | 25,927 | 17.62 |
| Class R3 | 659,293 | 37,469 | 17.60 |
| Class R4 | 98,375 | 5,600 | 17.57 |
| Class R6 | 105,769,788 | 6,018,000 | 17.58 |
| (a) | Maximum offering price per share was equal to the net asset value per share for all share classes, except for Class A, for which the maximum offering price per share was $18.59 [100 / 94.25 x $17.52]. On sales of $50,000 or more, the maximum offering price of Class A shares is reduced. A contingent deferred sales charge may be imposed on redemptions of Class A, Class B, and Class C shares. Redemption price per share was equal to the net asset value per share for Classes I, R1, R2, R3, R4, and R6. |
See Notes to Financial Statements
Financial Statements
Statement of Operations
Six months ended 2/28/23 (unaudited)
This statement describes how much your fund earned in investment income and accrued in expenses. It also describes any gains and/or losses generated by fund operations.
| Net investment income (loss) | |
| Income | |
| Dividends | $4,018,503 |
| Dividends from affiliated issuers | 36,924 |
| Other | 3,034 |
| Foreign taxes withheld | (3,399) |
| Total investment income | $4,055,062 |
| Expenses | |
| Management fee | $1,134,039 |
| Distribution and service fees | 338,262 |
| Shareholder servicing costs | 180,746 |
| Administrative services fee | 38,555 |
| Independent Trustees' compensation | 4,479 |
| Custodian fee | 18,003 |
| Shareholder communications | 23,669 |
| Audit and tax fees | 29,949 |
| Legal fees | 1,090 |
| Miscellaneous | 89,264 |
| Total expenses | $1,858,056 |
| Reduction of expenses by investment adviser and distributor | (113,604) |
| Net expenses | $1,744,452 |
| Net investment income (loss) | $2,310,610 |
| Realized and unrealized gain (loss) |
| Realized gain (loss) (identified cost basis) | |
| Unaffiliated issuers | $10,061,890 |
| Affiliated issuers | (136) |
| Foreign currency | (36) |
| Net realized gain (loss) | $10,061,718 |
| Change in unrealized appreciation or depreciation | |
| Unaffiliated issuers | $(4,523,907) |
| Affiliated issuers | 1 |
| Translation of assets and liabilities in foreign currencies | 153 |
| Net unrealized gain (loss) | $(4,523,753) |
| Net realized and unrealized gain (loss) | $5,537,965 |
| Change in net assets from operations | $7,848,575 |
See Notes to Financial Statements
Financial Statements
Statements of Changes in Net Assets
These statements describe the increases and/or decreases in net assets resulting from operations, any distributions, and any shareholder transactions.
| | Six months ended | Year ended |
| | 2/28/23
(unaudited) | 8/31/22 |
| Change in net assets | | |
| From operations | | |
| Net investment income (loss) | $2,310,610 | $3,869,466 |
| Net realized gain (loss) | 10,061,718 | 68,425,059 |
| Net unrealized gain (loss) | (4,523,753) | (124,232,463) |
| Change in net assets from operations | $7,848,575 | $(51,937,938) |
| Total distributions to shareholders | $(51,549,075) | $(31,271,225) |
| Change in net assets from fund share transactions | $57,539,863 | $(113,407,964) |
| Total change in net assets | $13,839,363 | $(196,617,127) |
| Net assets | | |
| At beginning of period | 431,964,525 | 628,581,652 |
| At end of period | $445,803,888 | $431,964,525 |
See Notes to Financial Statements
Financial Statements
Financial Highlights
The financial highlights table is intended to help you understand the fund's financial performance for the semiannual period and the past 5 fiscal years. Certain information reflects financial results for a single fund share. The total returns in the table represent the rate that an investor would have earned (or lost) on an investment in the fund share class (assuming reinvestment of all distributions) held for the entire period.
| Class A | Six months
ended | Year ended |
| | 2/28/23
(unaudited) | 8/31/22 | 8/31/21 | 8/31/20 | 8/31/19 | 8/31/18 |
| Net asset value, beginning of period | $19.36 | $22.51 | $17.32 | $16.28 | $15.05 | $13.77 |
| Income (loss) from investment operations |
| Net investment income (loss) (d) | $0.08 | $0.13 | $0.14 | $0.18 | $0.18 | $0.18 |
| Net realized and unrealized gain (loss) | 0.24 | (2.15) | 5.22 | 1.04 | 1.68 | 1.47 |
| Total from investment operations | $0.32 | $(2.02) | $5.36 | $1.22 | $1.86 | $1.65 |
| Less distributions declared to shareholders |
| From net investment income | $(0.09) | $(0.12) | $(0.17) | $(0.16) | $(0.17) | $(0.18) |
| From net realized gain | (2.07) | (1.01) | — | (0.02) | (0.46) | (0.19) |
| Total distributions declared to shareholders | $(2.16) | $(1.13) | $(0.17) | $(0.18) | $(0.63) | $(0.37) |
| Net asset value, end of period (x) | $17.52 | $19.36 | $22.51 | $17.32 | $16.28 | $15.05 |
| Total return (%) (r)(s)(t)(x) | 1.62(n) | (9.47) | 31.16 | 7.64 | 13.23 | 12.14 |
Ratios (%) (to average net assets)
and Supplemental data: |
| Expenses before expense reductions | 0.94(a) | 0.94 | 0.92 | 0.92 | 1.05 | 1.16 |
| Expenses after expense reductions | 0.89(a) | 0.89 | 0.89 | 0.89 | 0.89 | 0.88 |
| Net investment income (loss) | 0.89(a) | 0.63 | 0.71 | 1.11 | 1.22 | 1.25 |
| Portfolio turnover | 19(n) | 36 | 20 | 34 | 28 | 30 |
| Net assets at end of period (000 omitted) | $161,885 | $161,776 | $171,216 | $135,199 | $85,022 | $41,177 |
See Notes to Financial Statements
Financial Highlights – continued
| Class B | Six months
ended | Year ended |
| | 2/28/23
(unaudited) | 8/31/22 | 8/31/21 | 8/31/20 | 8/31/19 | 8/31/18 |
| Net asset value, beginning of period | $19.28 | $22.46 | $17.29 | $16.25 | $15.02 | $13.74 |
| Income (loss) from investment operations |
| Net investment income (loss) (d) | $0.01 | $(0.03) | $(0.01) | $0.06 | $0.07 | $0.07 |
| Net realized and unrealized gain (loss) | 0.25 | (2.14) | 5.22 | 1.03 | 1.68 | 1.47 |
| Total from investment operations | $0.26 | $(2.17) | $5.21 | $1.09 | $1.75 | $1.54 |
| Less distributions declared to shareholders |
| From net investment income | $(0.01) | $(0.00)(w) | $(0.04) | $(0.03) | $(0.06) | $(0.07) |
| From net realized gain | (2.07) | (1.01) | — | (0.02) | (0.46) | (0.19) |
| Total distributions declared to shareholders | $(2.08) | $(1.01) | $(0.04) | $(0.05) | $(0.52) | $(0.26) |
| Net asset value, end of period (x) | $17.46 | $19.28 | $22.46 | $17.29 | $16.25 | $15.02 |
| Total return (%) (r)(s)(t)(x) | 1.27(n) | (10.15) | 30.19 | 6.77 | 12.41 | 11.32 |
Ratios (%) (to average net assets)
and Supplemental data: |
| Expenses before expense reductions | 1.69(a) | 1.69 | 1.67 | 1.67 | 1.81 | 1.91 |
| Expenses after expense reductions | 1.64(a) | 1.64 | 1.64 | 1.64 | 1.64 | 1.64 |
| Net investment income (loss) | 0.15(a) | (0.14) | (0.04) | 0.35 | 0.48 | 0.50 |
| Portfolio turnover | 19(n) | 36 | 20 | 34 | 28 | 30 |
| Net assets at end of period (000 omitted) | $1,546 | $1,712 | $2,511 | $2,198 | $2,558 | $2,211 |
See Notes to Financial Statements
Financial Highlights – continued
| Class C | Six months
ended | Year ended |
| | 2/28/23
(unaudited) | 8/31/22 | 8/31/21 | 8/31/20 | 8/31/19 | 8/31/18 |
| Net asset value, beginning of period | $19.20 | $22.37 | $17.22 | $16.20 | $14.98 | $13.70 |
| Income (loss) from investment operations |
| Net investment income (loss) (d) | $0.01 | $(0.03) | $(0.01) | $0.06 | $0.07 | $0.07 |
| Net realized and unrealized gain (loss) | 0.25 | (2.13) | 5.20 | 1.03 | 1.67 | 1.48 |
| Total from investment operations | $0.26 | $(2.16) | $5.19 | $1.09 | $1.74 | $1.55 |
| Less distributions declared to shareholders |
| From net investment income | $(0.01) | $— | $(0.04) | $(0.05) | $(0.06) | $(0.08) |
| From net realized gain | (2.07) | (1.01) | — | (0.02) | (0.46) | (0.19) |
| Total distributions declared to shareholders | $(2.08) | $(1.01) | $(0.04) | $(0.07) | $(0.52) | $(0.27) |
| Net asset value, end of period (x) | $17.38 | $19.20 | $22.37 | $17.22 | $16.20 | $14.98 |
| Total return (%) (r)(s)(t)(x) | 1.30(n) | (10.14) | 30.20 | 6.75 | 12.40 | 11.36 |
Ratios (%) (to average net assets)
and Supplemental data: |
| Expenses before expense reductions | 1.69(a) | 1.69 | 1.67 | 1.67 | 1.81 | 1.91 |
| Expenses after expense reductions | 1.64(a) | 1.64 | 1.64 | 1.64 | 1.64 | 1.64 |
| Net investment income (loss) | 0.14(a) | (0.14) | (0.03) | 0.35 | 0.47 | 0.50 |
| Portfolio turnover | 19(n) | 36 | 20 | 34 | 28 | 30 |
| Net assets at end of period (000 omitted) | $24,267 | $25,754 | $32,839 | $29,429 | $21,859 | $13,942 |
See Notes to Financial Statements
Financial Highlights – continued
| Class I | Six months
ended | Year ended |
| | 2/28/23
(unaudited) | 8/31/22 | 8/31/21 | 8/31/20 | 8/31/19 | 8/31/18 |
| Net asset value, beginning of period | $19.39 | $22.55 | $17.34 | $16.31 | $15.07 | $13.78 |
| Income (loss) from investment operations |
| Net investment income (loss) (d) | $0.11 | $0.17 | $0.19 | $0.22 | $0.23 | $0.21 |
| Net realized and unrealized gain (loss) | 0.24 | (2.15) | 5.23 | 1.03 | 1.68 | 1.49 |
| Total from investment operations | $0.35 | $(1.98) | $5.42 | $1.25 | $1.91 | $1.70 |
| Less distributions declared to shareholders |
| From net investment income | $(0.12) | $(0.17) | $(0.21) | $(0.20) | $(0.21) | $(0.22) |
| From net realized gain | (2.07) | (1.01) | — | (0.02) | (0.46) | (0.19) |
| Total distributions declared to shareholders | $(2.19) | $(1.18) | $(0.21) | $(0.22) | $(0.67) | $(0.41) |
| Net asset value, end of period (x) | $17.55 | $19.39 | $22.55 | $17.34 | $16.31 | $15.07 |
| Total return (%) (r)(s)(t)(x) | 1.76(n) | (9.28) | 31.55 | 7.82 | 13.55 | 12.49 |
Ratios (%) (to average net assets)
and Supplemental data: |
| Expenses before expense reductions | 0.69(a) | 0.68 | 0.67 | 0.67 | 0.78 | 0.91 |
| Expenses after expense reductions | 0.64(a) | 0.64 | 0.64 | 0.64 | 0.64 | 0.64 |
| Net investment income (loss) | 1.15(a) | 0.82 | 0.99 | 1.35 | 1.46 | 1.50 |
| Portfolio turnover | 19(n) | 36 | 20 | 34 | 28 | 30 |
| Net assets at end of period (000 omitted) | $150,560 | $163,689 | $335,165 | $464,428 | $246,245 | $30,751 |
See Notes to Financial Statements
Financial Highlights – continued
| Class R1 | Six months
ended | Year ended |
| | 2/28/23
(unaudited) | 8/31/22 | 8/31/21 | 8/31/20 | 8/31/19 | 8/31/18 |
| Net asset value, beginning of period | $19.32 | $22.50 | $17.33 | $16.29 | $15.06 | $13.77 |
| Income (loss) from investment operations |
| Net investment income (loss) (d) | $0.01 | $(0.03) | $(0.01) | $0.05 | $0.07 | $0.07 |
| Net realized and unrealized gain (loss) | 0.24 | (2.14) | 5.23 | 1.05 | 1.68 | 1.48 |
| Total from investment operations | $0.25 | $(2.17) | $5.22 | $1.10 | $1.75 | $1.55 |
| Less distributions declared to shareholders |
| From net investment income | $(0.01) | $(0.00)(w) | $(0.05) | $(0.04) | $(0.06) | $(0.07) |
| From net realized gain | (2.07) | (1.01) | — | (0.02) | (0.46) | (0.19) |
| Total distributions declared to shareholders | $(2.08) | $(1.01) | $(0.05) | $(0.06) | $(0.52) | $(0.26) |
| Net asset value, end of period (x) | $17.49 | $19.32 | $22.50 | $17.33 | $16.29 | $15.06 |
| Total return (%) (r)(s)(t)(x) | 1.25(n) | (10.12) | 30.18 | 6.79 | 12.37 | 11.36 |
Ratios (%) (to average net assets)
and Supplemental data: |
| Expenses before expense reductions | 1.69(a) | 1.69 | 1.67 | 1.67 | 1.81 | 1.91 |
| Expenses after expense reductions | 1.64(a) | 1.64 | 1.64 | 1.64 | 1.64 | 1.64 |
| Net investment income (loss) | 0.15(a) | (0.14) | (0.07) | 0.34 | 0.48 | 0.49 |
| Portfolio turnover | 19(n) | 36 | 20 | 34 | 28 | 30 |
| Net assets at end of period (000 omitted) | $562 | $522 | $683 | $340 | $164 | $136 |
See Notes to Financial Statements
Financial Highlights – continued
| Class R2 | Six months
ended | Year ended |
| | 2/28/23
(unaudited) | 8/31/22 | 8/31/21 | 8/31/20 | 8/31/19 | 8/31/18 |
| Net asset value, beginning of period | $19.45 | $22.61 | $17.39 | $16.36 | $15.12 | $13.83 |
| Income (loss) from investment operations |
| Net investment income (loss) (d) | $0.06 | $0.07 | $0.09 | $0.14 | $0.15 | $0.14 |
| Net realized and unrealized gain (loss) | 0.24 | (2.16) | 5.25 | 1.04 | 1.68 | 1.49 |
| Total from investment operations | $0.30 | $(2.09) | $5.34 | $1.18 | $1.83 | $1.63 |
| Less distributions declared to shareholders |
| From net investment income | $(0.06) | $(0.06) | $(0.12) | $(0.13) | $(0.13) | $(0.15) |
| From net realized gain | (2.07) | (1.01) | — | (0.02) | (0.46) | (0.19) |
| Total distributions declared to shareholders | $(2.13) | $(1.07) | $(0.12) | $(0.15) | $(0.59) | $(0.34) |
| Net asset value, end of period (x) | $17.62 | $19.45 | $22.61 | $17.39 | $16.36 | $15.12 |
| Total return (%) (r)(s)(t)(x) | 1.52(n) | (9.72) | 30.88 | 7.29 | 12.94 | 11.93 |
Ratios (%) (to average net assets)
and Supplemental data: |
| Expenses before expense reductions | 1.19(a) | 1.19 | 1.17 | 1.17 | 1.30 | 1.42 |
| Expenses after expense reductions | 1.14(a) | 1.14 | 1.14 | 1.14 | 1.14 | 1.14 |
| Net investment income (loss) | 0.64(a) | 0.34 | 0.45 | 0.86 | 0.98 | 1.01 |
| Portfolio turnover | 19(n) | 36 | 20 | 34 | 28 | 30 |
| Net assets at end of period (000 omitted) | $457 | $511 | $742 | $531 | $368 | $156 |
See Notes to Financial Statements
Financial Highlights – continued
| Class R3 | Six months
ended | Year ended |
| | 2/28/23
(unaudited) | 8/31/22 | 8/31/21 | 8/31/20 | 8/31/19 | 8/31/18 |
| Net asset value, beginning of period | $19.43 | $22.59 | $17.38 | $16.34 | $15.10 | $13.81 |
| Income (loss) from investment operations |
| Net investment income (loss) (d) | $0.08 | $0.13 | $0.14 | $0.18 | $0.19 | $0.18 |
| Net realized and unrealized gain (loss) | 0.25 | (2.16) | 5.24 | 1.05 | 1.68 | 1.48 |
| Total from investment operations | $0.33 | $(2.03) | $5.38 | $1.23 | $1.87 | $1.66 |
| Less distributions declared to shareholders |
| From net investment income | $(0.09) | $(0.12) | $(0.17) | $(0.17) | $(0.17) | $(0.18) |
| From net realized gain | (2.07) | (1.01) | — | (0.02) | (0.46) | (0.19) |
| Total distributions declared to shareholders | $(2.16) | $(1.13) | $(0.17) | $(0.19) | $(0.63) | $(0.37) |
| Net asset value, end of period (x) | $17.60 | $19.43 | $22.59 | $17.38 | $16.34 | $15.10 |
| Total return (%) (r)(s)(t)(x) | 1.67(n) | (9.49) | 31.17 | 7.65 | 13.24 | 12.18 |
Ratios (%) (to average net assets)
and Supplemental data: |
| Expenses before expense reductions | 0.94(a) | 0.94 | 0.92 | 0.93 | 1.05 | 1.16 |
| Expenses after expense reductions | 0.89(a) | 0.89 | 0.89 | 0.89 | 0.89 | 0.89 |
| Net investment income (loss) | 0.89(a) | 0.62 | 0.70 | 1.15 | 1.22 | 1.25 |
| Portfolio turnover | 19(n) | 36 | 20 | 34 | 28 | 30 |
| Net assets at end of period (000 omitted) | $659 | $644 | $786 | $573 | $100 | $67 |
See Notes to Financial Statements
Financial Highlights – continued
| Class R4 | Six months
ended | Year ended |
| | 2/28/23
(unaudited) | 8/31/22 | 8/31/21 | 8/31/20 | 8/31/19 | 8/31/18 |
| Net asset value, beginning of period | $19.41 | $22.56 | $17.36 | $16.32 | $15.08 | $13.79 |
| Income (loss) from investment operations |
| Net investment income (loss) (d) | $0.11 | $0.18 | $0.18 | $0.22 | $0.22 | $0.21 |
| Net realized and unrealized gain (loss) | 0.24 | (2.15) | 5.23 | 1.04 | 1.69 | 1.49 |
| Total from investment operations | $0.35 | $(1.97) | $5.41 | $1.26 | $1.91 | $1.70 |
| Less distributions declared to shareholders |
| From net investment income | $(0.12) | $(0.17) | $(0.21) | $(0.20) | $(0.21) | $(0.22) |
| From net realized gain | (2.07) | (1.01) | — | (0.02) | (0.46) | (0.19) |
| Total distributions declared to shareholders | $(2.19) | $(1.18) | $(0.21) | $(0.22) | $(0.67) | $(0.41) |
| Net asset value, end of period (x) | $17.57 | $19.41 | $22.56 | $17.36 | $16.32 | $15.08 |
| Total return (%) (r)(s)(t)(x) | 1.76(n) | (9.22) | 31.47 | 7.87 | 13.53 | 12.48 |
Ratios (%) (to average net assets)
and Supplemental data: |
| Expenses before expense reductions | 0.69(a) | 0.69 | 0.66 | 0.67 | 0.81 | 0.91 |
| Expenses after expense reductions | 0.64(a) | 0.64 | 0.64 | 0.64 | 0.64 | 0.64 |
| Net investment income (loss) | 1.14(a) | 0.87 | 0.96 | 1.35 | 1.48 | 1.50 |
| Portfolio turnover | 19(n) | 36 | 20 | 34 | 28 | 30 |
| Net assets at end of period (000 omitted) | $98 | $97 | $107 | $81 | $75 | $66 |
See Notes to Financial Statements
Financial Highlights – continued
| Class R6 | Six months
ended | Year ended |
| | 2/28/23
(unaudited) | 8/31/22 | 8/31/21 | 8/31/20 | 8/31/19 | 8/31/18 |
| Net asset value, beginning of period | $19.42 | $22.57 | $17.37 | $16.32 | $15.09 | $13.80 |
| Income (loss) from investment operations |
| Net investment income (loss) (d) | $0.11 | $0.20 | $0.20 | $0.23 | $0.23 | $0.23 |
| Net realized and unrealized gain (loss) | 0.25 | (2.15) | 5.23 | 1.05 | 1.68 | 1.48 |
| Total from investment operations | $0.36 | $(1.95) | $5.43 | $1.28 | $1.91 | $1.71 |
| Less distributions declared to shareholders |
| From net investment income | $(0.13) | $(0.19) | $(0.23) | $(0.21) | $(0.22) | $(0.23) |
| From net realized gain | (2.07) | (1.01) | — | (0.02) | (0.46) | (0.19) |
| Total distributions declared to shareholders | $(2.20) | $(1.20) | $(0.23) | $(0.23) | $(0.68) | $(0.42) |
| Net asset value, end of period (x) | $17.58 | $19.42 | $22.57 | $17.37 | $16.32 | $15.09 |
| Total return (%) (r)(s)(t)(x) | 1.82(n) | (9.13) | 31.57 | 8.02 | 13.56 | 12.57 |
Ratios (%) (to average net assets)
and Supplemental data: |
| Expenses before expense reductions | 0.60(a) | 0.59 | 0.58 | 0.59 | 0.71 | 0.82 |
| Expenses after expense reductions | 0.55(a) | 0.54 | 0.55 | 0.56 | 0.56 | 0.54 |
| Net investment income (loss) | 1.24(a) | 0.97 | 1.06 | 1.45 | 1.53 | 1.60 |
| Portfolio turnover | 19(n) | 36 | 20 | 34 | 28 | 30 |
| Net assets at end of period (000 omitted) | $105,770 | $77,259 | $84,532 | $78,929 | $31,283 | $8,632 |
| (a) | Annualized. |
| (d) | Per share data is based on average shares outstanding. |
| (n) | Not annualized. |
| (r) | Certain expenses have been reduced without which performance would have been lower. |
| (s) | From time to time the fund may receive proceeds from litigation settlements, without which performance would be lower. |
| (t) | Total returns do not include any applicable sales charges. |
| (w) | Per share amount was less than $0.01. |
| (x) | The net asset values and total returns have been calculated on net assets which include adjustments made in accordance with U.S. generally accepted accounting principles required at period end for financial reporting purposes. |
See Notes to Financial Statements
Notes to Financial Statements
(unaudited)
(1) Business and Organization
MFS Low Volatility Equity Fund (the fund) is a diversified series of MFS Series Trust I (the trust). The trust is organized as a Massachusetts business trust and is registered under the Investment Company Act of 1940, as amended, as an open-end management investment company.
The fund is an investment company and accordingly follows the investment company accounting and reporting guidance of the Financial Accounting Standards Board (FASB) Accounting Standards Codification Topic 946 Financial Services - Investment Companies.
(2) Significant Accounting Policies
General — The preparation of financial statements in conformity with U.S. generally accepted accounting principles requires management to make estimates and assumptions that affect the reported amounts of assets and liabilities, and disclosure of contingent assets and liabilities at the date of the financial statements and the reported amounts of increases and decreases in net assets from operations during the reporting period. Actual results could differ from those estimates. In the preparation of these financial statements, management has evaluated subsequent events occurring after the date of the fund’s Statement of Assets and Liabilities through the date that the financial statements were issued.
Balance Sheet Offsetting — The fund's accounting policy with respect to balance sheet offsetting is that, absent an event of default by the counterparty or a termination of the agreement, the International Swaps and Derivatives Association (ISDA) Master Agreement, or similar agreement, does not result in an offset of reported amounts of financial assets and financial liabilities in the Statement of Assets and Liabilities across transactions between the fund and the applicable counterparty. The fund's right to setoff may be restricted or prohibited by the bankruptcy or insolvency laws of the particular jurisdiction to which a specific master netting agreement counterparty is subject. Balance sheet offsetting disclosures, to the extent applicable to the fund, have been included in the fund’s Significant Accounting Policies note under the captions for each of the fund’s in-scope financial instruments and transactions.
Investment Valuations — Subject to its oversight, the fund's Board of Trustees has delegated primary responsibility for determining or causing to be determined the value of the fund’s investments to MFS as the fund's adviser, pursuant to the fund’s valuation policy and procedures which have been adopted by the adviser and approved by the Board. Effective September 8, 2022, and in accordance with Rule 2a-5 under the Investment Company Act of 1940, the Board of Trustees designated the adviser as the “valuation designee” of the fund. If the adviser, as valuation designee, determines that reliable market quotations are not readily available for an investment, the investment is valued at fair value as determined in good faith by the adviser in accordance with the adviser’s fair valuation policy and procedures.
Under the fund's valuation policy and procedures, equity securities, including restricted equity securities, are generally valued at the last sale or official closing price on their primary market or exchange as provided by a third-party pricing service. Equity securities, for which there were no sales reported that day, are generally valued at the last quoted daily bid quotation on their primary market or exchange as provided by a
Notes to Financial Statements (unaudited) - continued
third-party pricing service. Short-term instruments with a maturity at issuance of 60 days or less may be valued at amortized cost, which approximates market value.
Open-end investment companies are generally valued at net asset value per share. The values of foreign securities and other assets and liabilities expressed in foreign currencies are converted to U.S. dollars using the mean of bid and asked prices for rates provided by a third-party pricing service.
Under the fund’s valuation policy and procedures, market quotations are not considered to be readily available for debt instruments, floating rate loans, and many types of derivatives. These investments are generally valued at fair value based on information from third-party pricing services or otherwise determined by the adviser in accordance with the adviser’s fair valuation policy and procedures. Securities and other assets generally valued on the basis of information from a third-party pricing service may also be valued at a broker/dealer bid quotation. In determining values, third-party pricing services can utilize both transaction data and market information such as yield, quality, coupon rate, maturity, type of issue, trading characteristics, spreads and other market data. An investment may also be valued at fair value if the adviser determines that the investment’s value has been materially affected by events occurring after the close of the exchange or market on which the investment is principally traded (such as foreign exchange or market) and prior to the determination of the fund’s net asset value, or after the halt of trading of a specific security where trading does not resume prior to the close of the exchange or market on which the security is principally traded. Events that occur after foreign markets close (such as developments in foreign markets and significant movements in the U.S. markets) and prior to the determination of the fund’s net asset value may be deemed to have a material effect on the value of securities traded in foreign markets. Accordingly, the fund’s foreign equity securities may often be valued at fair value. The adviser generally relies on third-party pricing services or other information (such as the correlation with price movements of similar securities in the same or other markets; the type, cost and investment characteristics of the security; the business and financial condition of the issuer; and trading and other market data) to assist in determining whether to fair value and at what value to fair value an investment. The value of an investment for purposes of calculating the fund’s net asset value can differ depending on the source and method used to determine value. When fair valuation is used, the value of an investment used to determine the fund’s net asset value may differ from quoted or published prices for the same investment. There can be no assurance that the fund could obtain the fair value assigned to an investment if it were to sell the investment at the same time at which the fund determines its net asset value per share.
Various inputs are used in determining the value of the fund's assets or liabilities. These inputs are categorized into three broad levels. In certain cases, the inputs used to measure fair value may fall into different levels of the fair value hierarchy. In such cases, an investment's level within the fair value hierarchy is based on the lowest level of input that is significant to the fair value measurement. The fund's assessment of the significance of a particular input to the fair value measurement in its entirety requires judgment, and considers factors specific to the investment. Level 1 includes unadjusted quoted prices in active markets for identical assets or liabilities. Level 2 includes other significant observable market-based inputs (including quoted prices for similar securities, interest rates, prepayment speed, and credit risk). Level 3 includes significant
Notes to Financial Statements (unaudited) - continued
unobservable inputs, which may include the adviser's own assumptions in determining the fair value of investments. The following is a summary of the levels used as of February 28, 2023 in valuing the fund's assets and liabilities:
| Financial Instruments | Level 1 | Level 2 | Level 3 | Total |
| Equity Securities | $444,414,462 | $— | $— | $444,414,462 |
| Mutual Funds | 769,384 | — | — | 769,384 |
| Total | $445,183,846 | $— | $— | $445,183,846 |
For further information regarding security characteristics, see the Portfolio of Investments.
Foreign Currency Translation — Purchases and sales of foreign investments, income, and expenses are converted into U.S. dollars based upon currency exchange rates prevailing on the respective dates of such transactions or on the reporting date for foreign denominated receivables and payables. Gains and losses attributable to foreign currency exchange rates on sales of securities are recorded for financial statement purposes as net realized gains and losses on investments. Gains and losses attributable to foreign exchange rate movements on receivables, payables, income and expenses are recorded for financial statement purposes as foreign currency transaction gains and losses. That portion of both realized and unrealized gains and losses on investments that results from fluctuations in foreign currency exchange rates is not separately disclosed.
Indemnifications — Under the fund's organizational documents, its officers and Trustees may be indemnified against certain liabilities and expenses arising out of the performance of their duties to the fund. Additionally, in the normal course of business, the fund enters into agreements with service providers that may contain indemnification clauses. The fund's maximum exposure under these agreements is unknown as this would involve future claims that may be made against the fund that have not yet occurred.
Investment Transactions and Income — Investment transactions are recorded on the trade date. Dividends received in cash are recorded on the ex-dividend date. Certain dividends from foreign securities will be recorded when the fund is informed of the dividend if such information is obtained subsequent to the ex-dividend date. Dividend payments received in additional securities are recorded on the ex-dividend date in an amount equal to the value of the security on such date. In determining the net gain or loss on securities sold, the cost of securities is determined on the identified cost basis.
The fund may receive proceeds from litigation settlements. Any proceeds received from litigation involving portfolio holdings are reflected in the Statement of Operations in realized gain/loss if the security has been disposed of by the fund or in unrealized gain/loss if the security is still held by the fund. Any other proceeds from litigation not related to portfolio holdings are reflected as other income in the Statement of Operations.
Tax Matters and Distributions — The fund intends to qualify as a regulated investment company, as defined under Subchapter M of the Internal Revenue Code, and to distribute all of its taxable income, including realized capital gains. As a result, no provision for federal income tax is required. The fund’s federal tax returns, when filed, will remain subject to examination by the Internal Revenue Service for a three
Notes to Financial Statements (unaudited) - continued
year period. Management has analyzed the fund’s tax positions taken on federal and state tax returns for all open tax years and does not believe that there are any uncertain tax positions that require recognition of a tax liability. Foreign taxes, if any, have been accrued by the fund in the accompanying financial statements in accordance with the applicable foreign tax law. Foreign income taxes may be withheld by certain countries in which the fund invests. Additionally, capital gains realized by the fund on securities issued in or by certain foreign countries may be subject to capital gains tax imposed by those countries.
Distributions to shareholders are recorded on the ex-dividend date. Income and capital gain distributions are determined in accordance with income tax regulations, which may differ from U.S. generally accepted accounting principles. Certain capital accounts in the financial statements are periodically adjusted for permanent differences in order to reflect their tax character. These adjustments have no impact on net assets or net asset value per share. Temporary differences which arise from recognizing certain items of income, expense, gain or loss in different periods for financial statement and tax purposes will reverse at some time in the future.
Book/tax differences primarily relate to wash sale loss deferrals and treating a portion of the proceeds from redemptions as a distribution for tax purposes.
The tax character of distributions made during the current period will be determined at fiscal year end. The tax character of distributions declared to shareholders for the last fiscal year is as follows:
| | Year ended
8/31/22 |
| Ordinary income (including any short-term capital gains) | $3,631,213 |
| Long-term capital gains | 27,640,012 |
| Total distributions | $31,271,225 |
The federal tax cost and the tax basis components of distributable earnings were as follows:
| As of 2/28/23 | |
| Cost of investments | $355,031,506 |
| Gross appreciation | 98,310,764 |
| Gross depreciation | (8,158,424) |
| Net unrealized appreciation (depreciation) | $90,152,340 |
| As of 8/31/22 | |
| Undistributed ordinary income | 656,783 |
| Undistributed long-term capital gain | 48,869,911 |
| Other temporary differences | (153) |
| Net unrealized appreciation (depreciation) | 94,789,667 |
The aggregate cost above includes prior fiscal year end tax adjustments, if applicable.
Multiple Classes of Shares of Beneficial Interest — The fund offers multiple classes of shares, which differ in their respective distribution and service fees. The fund's income, realized and unrealized gain (loss), and common expenses are allocated to shareholders based on the daily net assets of each class. Dividends are declared separately for each class. Differences in per share dividend rates are generally due to
Notes to Financial Statements (unaudited) - continued
differences in separate class expenses. Class B and Class C shares will convert to Class A shares approximately eight years after purchase. The fund’s distributions declared to shareholders as reported in the Statements of Changes in Net Assets are presented by class as follows:
| | Six months
ended
2/28/23 | | Year
ended
8/31/22 |
| Class A | $18,177,077 | | $8,750,568 |
| Class B | 177,065 | | 112,448 |
| Class C | 2,692,285 | | 1,444,870 |
| Class I | 18,110,962 | | 16,367,684 |
| Class R1 | 58,762 | | 29,956 |
| Class R2 | 57,872 | | 36,843 |
| Class R3 | 72,035 | | 38,144 |
| Class R4 | 10,913 | | 5,631 |
| Class R6 | 12,192,104 | | 4,485,081 |
| Total | $51,549,075 | | $31,271,225 |
(3) Transactions with Affiliates
Investment Adviser — The fund has an investment advisory agreement with MFS to provide overall investment management and related administrative services and facilities to the fund. The management fee is computed daily and paid monthly at the following annual rates based on the fund's average daily net assets:
| Up to $1 billion | 0.50% |
| In excess of $1 billion and up to $2.5 billion | 0.475% |
| In excess of $2.5 billion | 0.45% |
MFS has agreed in writing to reduce its management fee by a specified amount if certain MFS mutual fund assets exceed thresholds agreed to by MFS and the fund's Board of Trustees. MFS has also agreed in writing to waive at least 0.01% of its management fee as part of this agreement. The agreement to waive at least 0.01% of the management fee will continue until modified by the fund's Board of Trustees, but such agreement will continue at least until December 31, 2023. For the six months ended February 28, 2023, this management fee reduction amounted to $30,240, which is included in the reduction of total expenses in the Statement of Operations.
The management fee incurred for the six months ended February 28, 2023 was equivalent to an annual effective rate of 0.49% of the fund's average daily net assets.
The investment adviser has agreed in writing to pay a portion of the fund’s total annual operating expenses, excluding interest, taxes, extraordinary expenses, brokerage and transaction costs, certain tax reclaim recovery expenses (including contingency fees and closing agreement expenses), and investment-related expenses, such that total fund operating expenses do not exceed the following rates annually of each class’s average daily net assets:
| | | | | Classes | | | | |
| A | B | C | I | R1 | R2 | R3 | R4 | R6 |
| 0.89% | 1.64% | 1.64% | 0.64% | 1.64% | 1.14% | 0.89% | 0.64% | 0.57% |
Notes to Financial Statements (unaudited) - continued
This written agreement will continue until modified by the fund’s Board of Trustees, but such agreement will continue at least until December 31, 2023. For the six months ended February 28, 2023, this reduction amounted to $83,362, which is included in the reduction of total expenses in the Statement of Operations.
Distributor — MFS Fund Distributors, Inc. (MFD), a wholly-owned subsidiary of MFS, as distributor, received $23,446 for the six months ended February 28, 2023, as its portion of the initial sales charge on sales of Class A shares of the fund.
The Board of Trustees has adopted a distribution plan for certain share classes pursuant to Rule 12b-1 of the Investment Company Act of 1940.
The fund's distribution plan provides that the fund will pay MFD for services provided by MFD and financial intermediaries in connection with the distribution and servicing of certain share classes. One component of the plan is a distribution fee paid to MFD and another component of the plan is a service fee paid to MFD. MFD may subsequently pay all, or a portion, of the distribution and/or service fees to financial intermediaries.
Distribution Plan Fee Table:
| | Distribution
Fee Rate (d) | Service
Fee Rate (d) | Total
Distribution
Plan (d) | Annual
Effective
Rate (e) | Distribution
and Service
Fee |
| Class A | — | 0.25% | 0.25% | 0.25% | $ 200,921 |
| Class B | 0.75% | 0.25% | 1.00% | 1.00% | 8,077 |
| Class C | 0.75% | 0.25% | 1.00% | 1.00% | 124,509 |
| Class R1 | 0.75% | 0.25% | 1.00% | 1.00% | 2,675 |
| Class R2 | 0.25% | 0.25% | 0.50% | 0.50% | 1,274 |
| Class R3 | — | 0.25% | 0.25% | 0.25% | 806 |
| Total Distribution and Service Fees | | | | | $338,262 |
| (d) | In accordance with the distribution plan for certain classes, the fund pays distribution and/or service fees equal to these annual percentage rates of each class’s average daily net assets. The distribution and service fee rates disclosed by class represent the current rates in effect at the end of the reporting period. Any rate changes, if applicable, are detailed below. |
| (e) | The annual effective rates represent actual fees incurred under the distribution plan for the six months ended February 28, 2023 based on each class's average daily net assets. MFD has voluntarily agreed to rebate a portion of each class's 0.25% service fee attributable to accounts for which there is no financial intermediary specified on the account except for accounts attributable to MFS or its affiliates' seed money. For the six months ended February 28, 2023, this rebate amounted to $2 for Class A shares and is included in the reduction of total expenses in the Statement of Operations. |
Certain Class A shares are subject to a contingent deferred sales charge (CDSC) in the event of a shareholder redemption within 18 months of purchase. Class B shares are subject to a CDSC in the event of a shareholder redemption within six years of
Notes to Financial Statements (unaudited) - continued
purchase. Class C shares are subject to a CDSC in the event of a shareholder redemption within 12 months of purchase. All contingent deferred sales charges are paid to MFD and during the six months ended February 28, 2023, were as follows:
| | Amount |
| Class A | $4,621 |
| Class B | — |
| Class C | 286 |
Shareholder Servicing Agent — MFS Service Center, Inc. (MFSC), a wholly-owned subsidiary of MFS, receives a fee from the fund for its services as shareholder servicing agent calculated as a percentage of the average daily net assets of the fund as determined periodically under the supervision of the fund's Board of Trustees. For the six months ended February 28, 2023, the fee was $10,471, which equated to 0.0046% annually of the fund's average daily net assets. MFSC also receives reimbursement from the fund for out-of-pocket expenses, sub-accounting and other shareholder servicing costs which may be paid to affiliated and unaffiliated service providers. Class R6 shares do not incur sub-accounting fees. For the six months ended February 28, 2023, these out-of-pocket expenses, sub-accounting and other shareholder servicing costs amounted to $170,275.
Administrator — MFS provides certain financial, legal, shareholder communications, compliance, and other administrative services to the fund. Under an administrative services agreement, the fund reimburses MFS the costs incurred to provide these services. The fund is charged an annual fixed amount of $17,500 plus a fee based on average daily net assets. The administrative services fee incurred for the six months ended February 28, 2023 was equivalent to an annual effective rate of 0.0170% of the fund's average daily net assets.
Trustees’ and Officers’ Compensation — The fund pays compensation to independent Trustees in the form of a retainer, attendance fees, and additional compensation to Board and Committee chairpersons. The fund does not pay compensation directly to Trustees or officers of the fund who are also officers of the investment adviser, all of whom receive remuneration from MFS for their services to the fund. Certain officers and Trustees of the fund are officers or directors of MFS, MFD, and MFSC.
Other — The fund invests in the MFS Institutional Money Market Portfolio which is managed by MFS and seeks current income consistent with preservation of capital and liquidity. This money market fund does not pay a management fee to MFS but does incur investment and operating costs.
On August 3, 2022, MFS redeemed 19 shares of Class I for an aggregate amount of $380.
At February 28, 2023, MFS held 100% of the outstanding shares of Class R4.
The adviser has voluntarily undertaken to reimburse the fund from its own resources on a quarterly basis for the cost of investment research embedded in the cost of the fund’s securities trades. This agreement may be rescinded at any time. For the six months ended February 28, 2023, this reimbursement amounted to $3,034, which is included in “Other” income in the Statement of Operations.
Notes to Financial Statements (unaudited) - continued
(4) Portfolio Securities
For the six months ended February 28, 2023, purchases and sales of investments, other than short-term obligations, aggregated $96,106,751 and $86,107,204, respectively.
(5) Shares of Beneficial Interest
The fund's Declaration of Trust permits the Trustees to issue an unlimited number of full and fractional shares of beneficial interest. Transactions in fund shares were as follows:
| | Six months ended
2/28/23 | | Year ended
8/31/22 |
| | Shares | Amount | | Shares | Amount |
| Shares sold | | | | | |
| Class A | 814,391 | $15,135,146 | | 1,622,679 | $33,715,405 |
| Class B | — | — | | 369 | 7,609 |
| Class C | 39,157 | 709,958 | | 93,061 | 1,949,533 |
| Class I | 1,316,661 | 24,437,290 | | 4,607,009 | 97,250,379 |
| Class R1 | 2,657 | 48,955 | | 4,130 | 83,856 |
| Class R2 | 1,080 | 20,377 | | 5,006 | 104,934 |
| Class R3 | 451 | 8,367 | | 4,711 | 100,551 |
| Class R6 | 2,126,516 | 41,199,249 | | 897,740 | 18,491,030 |
| | 4,300,913 | $81,559,342 | | 7,234,705 | $151,703,297 |
Shares issued to shareholders
in reinvestment of distributions | | | | | |
| Class A | 1,032,000 | $18,160,545 | | 404,541 | $8,744,240 |
| Class B | 10,089 | 177,065 | | 5,180 | 112,448 |
| Class C | 154,133 | 2,691,403 | | 66,811 | 1,444,445 |
| Class I | 918,929 | 16,194,043 | | 522,758 | 11,321,125 |
| Class R1 | 3,344 | 58,762 | | 1,377 | 29,956 |
| Class R2 | 3,269 | 57,872 | | 1,691 | 36,843 |
| Class R3 | 4,077 | 72,035 | | 1,758 | 38,144 |
| Class R4 | 619 | 10,913 | | 260 | 5,631 |
| Class R6 | 685,170 | 12,089,383 | | 204,031 | 4,406,979 |
| | 2,811,630 | $49,512,021 | | 1,208,407 | $26,139,811 |
Notes to Financial Statements (unaudited) - continued
| | Six months ended
2/28/23 | | Year ended
8/31/22 |
| | Shares | Amount | | Shares | Amount |
| Shares reacquired | | | | | |
| Class A | (965,142) | $(17,678,155) | | (1,276,450) | $(26,619,299) |
| Class B | (10,328) | (185,345) | | (28,577) | (583,653) |
| Class C | (138,056) | (2,513,196) | | (286,388) | (5,911,288) |
| Class I | (2,099,609) | (38,871,006) | | (11,555,119) | (239,417,585) |
| Class R1 | (915) | (16,459) | | (8,835) | (178,784) |
| Class R2 | (4,719) | (84,262) | | (13,245) | (274,035) |
| Class R3 | (183) | (3,365) | | (8,139) | (176,230) |
| Class R4 | — | — | | (8) | (171) |
| Class R6 | (772,918) | (14,179,712) | | (867,602) | (18,090,027) |
| | (3,991,870) | $(73,531,500) | | (14,044,363) | $(291,251,072) |
| Net change | | | | | |
| Class A | 881,249 | $15,617,536 | | 750,770 | $15,840,346 |
| Class B | (239) | (8,280) | | (23,028) | (463,596) |
| Class C | 55,234 | 888,165 | | (126,516) | (2,517,310) |
| Class I | 135,981 | 1,760,327 | | (6,425,352) | (130,846,081) |
| Class R1 | 5,086 | 91,258 | | (3,328) | (64,972) |
| Class R2 | (370) | (6,013) | | (6,548) | (132,258) |
| Class R3 | 4,345 | 77,037 | | (1,670) | (37,535) |
| Class R4 | 619 | 10,913 | | 252 | 5,460 |
| Class R6 | 2,038,768 | 39,108,920 | | 234,169 | 4,807,982 |
| | 3,120,673 | $57,539,863 | | (5,601,251) | $(113,407,964) |
Effective June 1, 2019, purchases of the fund’s Class B shares were closed to new and existing investors subject to certain exceptions.
(6) Line of Credit
The fund and certain other funds managed by MFS participate in a $1.45 billion unsecured committed line of credit of which $1.2 billion is reserved for use by the fund and certain other MFS U.S. funds. The line of credit is provided by a syndicate of banks under a credit agreement. Borrowings may be made for temporary financing needs. Interest is charged to each fund, based on its borrowings, generally at a rate equal to the highest of 1) Daily Simple SOFR (Secured Overnight Financing Rate) plus 0.10%, 2) the Federal Funds Effective Rate, or 3) the Overnight Bank Funding Rate, each plus an agreed upon spread. A commitment fee, based on the average daily unused portion of the committed line of credit, is allocated among the participating funds. The line of credit expires on March 14, 2024 unless extended or renewed. In addition, the fund and other funds managed by MFS have established unsecured uncommitted borrowing arrangements with certain banks for temporary financing needs. Interest is charged to each fund, based on its borrowings, at rates equal to customary reference rates plus an
Notes to Financial Statements (unaudited) - continued
agreed upon spread. For the six months ended February 28, 2023, the fund’s commitment fee and interest expense were $1,047 and $0, respectively, and are included in “Miscellaneous” expense in the Statement of Operations.
(7) Investments in Affiliated Issuers
An affiliated issuer may be considered one in which the fund owns 5% or more of the outstanding voting securities, or a company which is under common control. For the purposes of this report, the following were affiliated issuers:
| Affiliated Issuers | Beginning
Value | Purchases | Sales
Proceeds | Realized
Gain
(Loss) | Change in
Unrealized
Appreciation or
Depreciation | Ending
Value |
| MFS Institutional Money Market Portfolio | $2,259,582 | $62,724,267 | $64,214,330 | $(136) | $1 | $769,384 |
| Affiliated Issuers | Dividend
Income | Capital Gain
Distributions |
| MFS Institutional Money Market Portfolio | $36,924 | $— |
(8) LIBOR Transition
Certain of the fund's investments, including investments in certain debt instruments and derivatives (if any), as well as borrowings by the fund and certain other contractual arrangements of the fund, may be based on the London Interbank Offered Rate (“LIBOR”). In 2017, the regulatory authority that oversees financial services firms in the United Kingdom announced plans to transition away from LIBOR by the end of 2021. In March 2021, the administrator of LIBOR announced the extension of the publication of the more commonly used U.S. dollar LIBOR settings to the end of June 2023. Although the full impacts of the transition away from LIBOR are not fully known, the transition may result in, among other things, an increase in volatility or illiquidity of the markets for instruments that currently rely on LIBOR to determine interest rates and this could have an adverse impact on the fund's performance. With respect to the fund's accounting for investments, including investments in certain debt instruments and derivatives, as well as borrowings by the fund and any other contractual arrangements of the fund that undergo reference rate-related modifications as a result of the transition, management will rely upon the relief provided by FASB Codification Topic 848 – Reference Rate Reform (Topic 848). The guidance in Topic 848 permits the fund to account for those modified contracts as a continuation of the existing contracts. The situation remains fluid, and management believes, based on best available information, that the impact of the transition will not be material to the fund.
(9) Subsequent Event
On March 30, 2023, the fund announced that effective after the close of business on September 29, 2023, purchases of Class R1 and Class R2 shares will be closed to new eligible investors.
Proxy Voting Policies and Information
MFS votes proxies on behalf of the fund pursuant to proxy voting policies and procedures that are available without charge, upon request, by calling 1-800-225-2606, by visiting mfs.com/proxyvoting, or by visiting the SEC’s Web site at http://www.sec.gov.
Information regarding how the fund voted proxies relating to portfolio securities during the most recent twelve-month period ended June 30 is available by August 31 of each year without charge by visiting mfs.com/proxyvoting, or by visiting the SEC’s Web site at http://www.sec.gov.
Quarterly Portfolio Disclosure
The fund files a complete schedule of portfolio holdings with the SEC for the first and third quarters of each fiscal year as an exhibit to its reports on Form N-PORT. The fund's Form N-PORT reports are available on the SEC's Web site at http://www.sec.gov. A shareholder can obtain the portfolio holdings report for the first and third quarters of the fund's fiscal year at mfs.com/openendfunds by choosing the fund's name and then scrolling to the “Resources” section and clicking on the “Prospectus and Reports” tab.
Further Information
From time to time, MFS may post important information about the fund or the MFS Funds on the MFS Web site (mfs.com). This information is available at https://www.mfs.com/announcements or at mfs.com/openendfunds by choosing the fund’s name and then scrolling to the “Resources” section and clicking on the “Announcements” tab, if any.
Information About Fund Contracts and Legal Claims
The fund has entered into contractual arrangements with an investment adviser, administrator, distributor, shareholder servicing agent, and custodian who each provide services to the fund. Unless expressly stated otherwise, shareholders are not parties to, or intended beneficiaries of these contractual arrangements, and these contractual arrangements are not intended to create any shareholder right to enforce them against the service providers or to seek any remedy under them against the service providers, either directly or on behalf of the fund.
Under the Trust’s By-Laws and Declaration of Trust, any claims asserted against or on behalf of the MFS Funds, including claims against Trustees and Officers, must be brought in state and federal courts located within the Commonwealth of Massachusetts.
Provision of Financial Reports and Summary Prospectuses
The fund produces financial reports every six months and updates its summary prospectus and prospectus annually. To avoid sending duplicate copies of materials to households, only one copy of the fund’s annual and semiannual report and summary prospectus may be mailed to shareholders having the same last name and residential address on the fund’s records. However, any shareholder may contact MFSC (please see back cover for address and telephone number) to request that copies of these reports and summary prospectuses be sent personally to that shareholder.
Save paper with eDelivery.
MFS® will send you prospectuses, reports, and proxies directly via e-mail so you will get information faster with less mailbox clutter.
To sign up:
1. Go to mfs.com.
2. Log in via MFS® Access.
3. Select eDelivery.
If you own your MFS fund shares through a financial institution or a retirement plan, MFS® TALK, MFS® Access, or eDelivery may not be available to you.
CONTACT
WEB SITE
mfs.com
MFS TALK
1-800-637-8255
24 hours a day
ACCOUNT SERVICE AND LITERATURE
Shareholders
1-800-225-2606
Financial advisors
1-800-343-2829
Retirement plan services
1-800-637-1255
MAILING ADDRESS
MFS Service Center, Inc.
P.O. Box 219341
Kansas City, MO 64121-9341
OVERNIGHT MAIL
MFS Service Center, Inc.
Suite 219341
430 W 7th Street
Kansas City, MO 64105-1407
Semiannual Report
February 28, 2023
MFS® Low Volatility Global
Equity Fund
MFS® Low Volatility Global
Equity Fund
The report is prepared for the general information of shareholders. It is authorized for distribution to prospective investors only when preceded or accompanied by a current prospectus.
NOT FDIC INSURED • MAY LOSE VALUE • NO BANK GUARANTEE
LETTER FROM THE CHAIR AND CEO
Dear Shareholders:
Markets — which rallied in late 2022 and early 2023 on signs of peaking inflation, hopes that monetary policy tightening cycles may be nearing an end and a rapid reopening of China’s economy — have hit turbulence after the sudden collapse of two US regional banks and the government-led merger of Switzerland’s two largest lenders. At the same time, US inflation data suggest that price pressures will prove more persistent than expected, making the US Federal Reserve’s job of trying to corral four-decade-high inflation without tipping the economy into recession that much more difficult. On a positive note, markets have largely adjusted to the challenges posed by Russia’s invasion of Ukraine, thanks in part to mild European winter weather that has alleviated concerns over potential near-term shortages of natural gas. Resilient labor markets in much of the developed world have further contributed to a brighter-than-expected economic backdrop. However, after the recent banking turmoil, investors are increasingly mindful that the lagged effects of ongoing monetary policy tightening have yet to fully work their way through the global economy.
One result of the banking crisis has been a rally in global government bond markets as investors sense that the global monetary tightening campaign is nearing its end, and the resulting lower yields have eased some of the pressure on interest rate–sensitive parts of the economy. Over the near term, amid tighter financial conditions, we feel companies will face a challenging earnings backdrop as they are forced to absorb higher input and labor costs while pricing power dwindles. As for fixed income, the rise in interest rates in recent months has made bonds more attractive than they have been in years, which may provide balance for investors’ portfolios.
During times of market transition, it is important to have a deep understanding of company fundamentals, and we have built our unique global research platform to do just that.
At MFS®, we put our clients’ assets to work responsibly by carefully navigating increasingly complex global capital markets. Our investment team is guided by a commitment to long-term fundamental investing. Our global investment platform — combining collective expertise, long-term discipline, and thoughtful risk management — seeks to uncover what we believe are the best, most durable investment ideas in markets around the world, enabling us to potentially create value for investors.
Respectfully,
Michael W. Roberge
Chair and Chief Executive Officer
MFS Investment Management
April 14, 2023
The opinions expressed in this letter are subject to change and may not be relied upon for investment advice. No forecasts can be guaranteed.
Portfolio structure
Top ten holdings
| DBS Group Holdings Ltd. | 3.0% |
| Amdocs Ltd. | 3.0% |
| Everest Re Group Ltd. | 2.6% |
| Johnson & Johnson | 2.6% |
| McKesson Corp. | 2.3% |
| Microsoft Corp. | 2.2% |
| KDDI Corp. | 2.2% |
| Roche Holding AG | 2.2% |
| Merck & Co., Inc. | 2.0% |
| General Mills, Inc. | 1.9% |
GICS equity sectors (g)
| Information Technology | 19.0% |
| Health Care | 16.2% |
| Financials | 14.7% |
| Consumer Staples | 11.8% |
| Communication Services | 9.8% |
| Consumer Discretionary | 7.6% |
| Industrials | 7.5% |
| Utilities | 6.7% |
| Real Estate | 2.9% |
| Materials | 2.5% |
| Energy | 0.6% |
Issuer country weightings (x)
| United States | 54.7% |
| Japan | 10.3% |
| Canada | 6.1% |
| Switzerland | 5.0% |
| Singapore | 4.8% |
| South Korea | 3.2% |
| United Kingdom | 2.5% |
| Israel | 2.3% |
| France | 1.9% |
| Other Countries | 9.2% |
Currency exposure weightings (y)
| United States Dollar | 56.4% |
| Japanese Yen | 10.3% |
| Canadian Dollar | 5.5% |
| Euro | 5.3% |
| Swiss Franc | 5.0% |
| Singapore Dollar | 4.8% |
| South Korean Won | 3.2% |
| British Pound Sterling | 2.5% |
| Thailand Baht | 1.6% |
| Other Currencies | 5.4% |
Portfolio Composition - continued
| (g) | The Global Industry Classification Standard (GICS®) was developed by and/or is the exclusive property of MSCI, Inc. and S&P Global Market Intelligence Inc. (“S&P Global Market Intelligence”). GICS is a service mark of MSCI and S&P Global Market Intelligence and has been licensed for use by MFS. MFS has applied its own internal sector/industry classification methodology for equity securities and non-equity securities that are unclassified by GICS. |
| (x) | Represents the portfolio’s exposure to issuer countries as a percentage of a portfolio’s net assets. For purposes of this presentation, United States includes Cash & Cash Equivalents. |
| (y) | Represents the portfolio’s exposure to a particular currency as a percentage of a portfolio's net assets. For purposes of this presentation, United States Dollar includes Cash & Cash Equivalents. |
Cash & Cash Equivalents includes any cash, investments in money market funds, short-term securities, and other assets less liabilities. Please see the Statement of Assets and Liabilities for additional information related to the fund’s cash position and other assets and liabilities.
Percentages are based on net assets as of February 28, 2023.
The portfolio is actively managed and current holdings may be different.
Expense Table
Fund expenses borne by the shareholders during the period,
September 1, 2022 through February 28, 2023
As a shareholder of the fund, you incur two types of costs: (1) transaction costs, including sales charges (loads) on certain purchase or redemption payments, and (2) ongoing costs, including management fees; distribution and service (12b-1) fees; and other fund expenses. This example is intended to help you understand your ongoing costs (in dollars) of investing in the fund and to compare these costs with the ongoing costs of investing in other mutual funds.
The example is based on an investment of $1,000 invested at the beginning of the period and held for the entire period September 1, 2022 through February 28, 2023.
Actual Expenses
The first line for each share class in the following table provides information about actual account values and actual expenses. You may use the information in this line, together with the amount you invested, to estimate the expenses that you paid over the period. Simply divide your account value by $1,000 (for example, an $8,600 account value divided by $1,000 = 8.6), then multiply the result by the number in the first line under the heading entitled “Expenses Paid During Period” to estimate the expenses you paid on your account during this period.
Hypothetical Example for Comparison Purposes
The second line for each share class in the following table provides information about hypothetical account values and hypothetical expenses based on the fund’s actual expense ratio and an assumed rate of return of 5% per year before expenses, which is not the fund’s actual return. The hypothetical account values and expenses may not be used to estimate the actual ending account balance or expenses you paid for the period. You may use this information to compare the ongoing costs of investing in the fund and other funds. To do so, compare this 5% hypothetical example with the 5% hypothetical examples that appear in the shareholder reports of the other funds.
Please note that the expenses shown in the table are meant to highlight your ongoing costs only and do not reflect any transactional costs, such as sales charges (loads). Therefore, the second line for each share class in the table is useful in comparing ongoing costs only, and will not help you determine the relative total costs of owning different funds. In addition, if these transactional costs were included, your costs would have been higher.
Expense Table - continued
Share
Class | | Annualized
Expense
Ratio | Beginning
Account Value
9/01/22 | Ending
Account Value
2/28/23 | Expenses
Paid During
Period (p)
9/01/22-2/28/23 |
| A | Actual | 0.99% | $1,000.00 | $1,038.61 | $5.00 |
| Hypothetical (h) | 0.99% | $1,000.00 | $1,019.89 | $4.96 |
| B | Actual | 1.74% | $1,000.00 | $1,035.24 | $8.78 |
| Hypothetical (h) | 1.74% | $1,000.00 | $1,016.17 | $8.70 |
| C | Actual | 1.74% | $1,000.00 | $1,034.66 | $8.78 |
| Hypothetical (h) | 1.74% | $1,000.00 | $1,016.17 | $8.70 |
| I | Actual | 0.74% | $1,000.00 | $1,040.02 | $3.74 |
| Hypothetical (h) | 0.74% | $1,000.00 | $1,021.12 | $3.71 |
| R1 | Actual | 1.74% | $1,000.00 | $1,034.47 | $8.78 |
| Hypothetical (h) | 1.74% | $1,000.00 | $1,016.17 | $8.70 |
| R2 | Actual | 1.24% | $1,000.00 | $1,037.86 | $6.27 |
| Hypothetical (h) | 1.24% | $1,000.00 | $1,018.65 | $6.21 |
| R3 | Actual | 0.99% | $1,000.00 | $1,038.52 | $5.00 |
| Hypothetical (h) | 0.99% | $1,000.00 | $1,019.89 | $4.96 |
| R4 | Actual | 0.74% | $1,000.00 | $1,040.00 | $3.74 |
| Hypothetical (h) | 0.74% | $1,000.00 | $1,021.12 | $3.71 |
| R6 | Actual | 0.66% | $1,000.00 | $1,040.52 | $3.34 |
| Hypothetical (h) | 0.66% | $1,000.00 | $1,021.52 | $3.31 |
| (h) | 5% class return per year before expenses. |
| (p) | “Expenses Paid During Period” are equal to each class’s annualized expense ratio, as shown above, multiplied by the average account value over the period, multiplied by 181/365 (to reflect the one-half year period). Expenses paid do not include any applicable sales charges (loads). If these transaction costs had been included, your costs would have been higher. |
Portfolio of Investments
2/28/23 (unaudited)
The Portfolio of Investments is a complete list of all securities owned by your fund. It is categorized by broad-based asset classes.
| Issuer | | | Shares/Par | Value ($) |
| Common Stocks – 98.1% |
| Aerospace & Defense – 1.8% | |
| General Dynamics Corp. | | 8,008 | $1,825,103 |
| Singapore Technologies Engineering Ltd. | | 1,264,900 | 3,348,803 |
| | | | | $5,173,906 |
| Automotive – 0.8% | |
| Bridgestone Corp. | | 29,100 | $1,116,724 |
| Toyota Motor Corp. | | 85,000 | 1,162,737 |
| | | | | $2,279,461 |
| Brokerage & Asset Managers – 0.5% | |
| IG Group Holdings PLC | | 148,814 | $1,437,377 |
| Business Services – 5.7% | |
| Accenture PLC, “A” | | 4,050 | $1,075,477 |
| Amdocs Ltd. | | 91,700 | 8,400,637 |
| Fiserv, Inc. (a) | | 10,997 | 1,265,645 |
| NS Solutions Corp. | | 108,200 | 2,821,123 |
| Secom Co. Ltd. | | 18,500 | 1,076,534 |
| Sohgo Security Services Co. Ltd. | | 47,600 | 1,249,826 |
| | | | | $15,889,242 |
| Cable TV – 1.3% | |
| Charter Communications, Inc., “A” (a) | | 4,240 | $1,558,667 |
| Comcast Corp., “A” | | 54,696 | 2,033,050 |
| | | | | $3,591,717 |
| Computer Software – 5.6% | |
| ACI Worldwide, Inc. (a) | | 112,763 | $2,914,924 |
| Check Point Software Technologies Ltd. (a) | | 25,277 | 3,127,270 |
| Lumine Group, Inc. (a) | | 7,314 | 74,873 |
| Microsoft Corp. | | 24,930 | 6,218,041 |
| NICE Systems Ltd., ADR (a) | | 16,645 | 3,452,339 |
| | | | | $15,787,447 |
| Computer Software - Systems – 4.6% | |
| Constellation Software, Inc. | | 2,438 | $4,191,966 |
| Fujitsu Ltd. | | 24,400 | 3,139,716 |
| Hitachi Ltd. | | 45,200 | 2,287,305 |
| SS&C Technologies Holdings, Inc. | | 30,115 | 1,767,751 |
| Venture Corp. Ltd. | | 117,400 | 1,494,870 |
| | | | | $12,881,608 |
Portfolio of Investments (unaudited) – continued
| Issuer | | | Shares/Par | Value ($) |
| Common Stocks – continued |
| Construction – 0.6% | |
| AvalonBay Communities, Inc., REIT | | 9,923 | $1,711,916 |
| Consumer Products – 2.6% | |
| Colgate-Palmolive Co. | | 38,524 | $2,823,809 |
| Kimberly-Clark Corp. | | 21,839 | 2,730,967 |
| Procter & Gamble Co. | | 11,900 | 1,636,964 |
| | | | | $7,191,740 |
| Electronics – 2.6% | |
| Kyocera Corp. | | 70,200 | $3,458,570 |
| Taiwan Semiconductor Manufacturing Co. Ltd., ADR | | 43,653 | 3,800,867 |
| | | | | $7,259,437 |
| Energy - Integrated – 0.5% | |
| TotalEnergies SE | | 24,533 | $1,519,806 |
| Food & Beverages – 6.4% | |
| General Mills, Inc. | | 66,798 | $5,311,109 |
| J.M. Smucker Co. | | 13,796 | 2,040,290 |
| Mondelez International, Inc. | | 35,101 | 2,287,883 |
| Nestle S.A. | | 36,616 | 4,124,038 |
| PepsiCo, Inc. | | 23,116 | 4,011,320 |
| | | | | $17,774,640 |
| Food & Drug Stores – 1.6% | |
| Sundrug Co. Ltd. | | 67,100 | $1,816,044 |
| Tesco PLC | | 827,993 | 2,539,676 |
| | | | | $4,355,720 |
| General Merchandise – 2.6% | |
| Dollar General Corp. | | 23,003 | $4,975,549 |
| Dollarama, Inc. | | 38,389 | 2,217,531 |
| | | | | $7,193,080 |
| Health Maintenance Organizations – 0.7% | |
| Cigna Group | | 6,864 | $2,004,974 |
| Insurance – 7.8% | |
| Chubb Ltd. | | 8,513 | $1,796,413 |
| Everest Re Group Ltd. | | 18,929 | 7,268,168 |
| Fairfax Financial Holdings Ltd. | | 5,471 | 3,824,969 |
| MetLife, Inc. | | 27,213 | 1,951,988 |
| Reinsurance Group of America, Inc. | | 10,516 | 1,519,247 |
| Samsung Fire & Marine Insurance Co. Ltd. | | 20,312 | 3,292,593 |
Portfolio of Investments (unaudited) – continued
| Issuer | | | Shares/Par | Value ($) |
| Common Stocks – continued |
| Insurance – continued | |
| Zurich Insurance Group AG | | 4,237 | $2,008,172 |
| | | | | $21,661,550 |
| Internet – 1.2% | |
| Alphabet, Inc., “A” (a) | | 38,249 | $3,444,705 |
| Leisure & Toys – 2.4% | |
| Electronic Arts, Inc. | | 38,964 | $4,322,666 |
| Sankyo Co. Ltd. | | 56,000 | 2,282,693 |
| | | | | $6,605,359 |
| Machinery & Tools – 1.2% | |
| Eaton Corp. PLC | | 18,641 | $3,260,870 |
| Major Banks – 4.9% | |
| DBS Group Holdings Ltd. | | 333,900 | $8,461,095 |
| JPMorgan Chase & Co. | | 24,681 | 3,538,021 |
| Royal Bank of Canada | | 15,422 | 1,565,025 |
| | | | | $13,564,141 |
| Medical & Health Technology & Services – 2.3% | |
| McKesson Corp. | | 18,476 | $6,463,090 |
| Medical Equipment – 1.3% | |
| Becton, Dickinson and Co. | | 6,183 | $1,450,223 |
| Medtronic PLC | | 26,568 | 2,199,830 |
| | | | | $3,650,053 |
| Metals & Mining – 0.6% | |
| Rio Tinto PLC | | 26,590 | $1,826,913 |
| Natural Gas - Distribution – 1.3% | |
| Italgas S.p.A. | | 620,107 | $3,531,951 |
| Other Banks & Diversified Financials – 2.4% | |
| KB Financial Group, Inc. | | 55,047 | $2,134,072 |
| Mastercard, Inc., “A” | | 3,405 | 1,209,762 |
| U.S. Bancorp | | 45,916 | 2,191,571 |
| Visa, Inc., “A” | | 5,368 | 1,180,638 |
| | | | | $6,716,043 |
| Pharmaceuticals – 11.8% | |
| Bayer AG | | 27,734 | $1,651,224 |
| Eli Lilly & Co. | | 9,463 | 2,945,075 |
| Johnson & Johnson | | 47,187 | 7,231,880 |
| Merck & Co., Inc. | | 53,400 | 5,673,216 |
Portfolio of Investments (unaudited) – continued
| Issuer | | | Shares/Par | Value ($) |
| Common Stocks – continued |
| Pharmaceuticals – continued | |
| Novartis AG | | 19,210 | $1,616,997 |
| Novo Nordisk A.S., “B” | | 25,981 | 3,678,000 |
| Roche Holding AG | | 21,142 | 6,101,179 |
| Sanofi | | 14,362 | 1,350,300 |
| Vertex Pharmaceuticals, Inc. (a) | | 9,364 | 2,718,276 |
| | | | | $32,966,147 |
| Pollution Control – 1.1% | |
| Republic Services, Inc. | | 23,270 | $3,000,201 |
| Precious Metals & Minerals – 1.8% | |
| Franco-Nevada Corp. | | 39,963 | $5,101,030 |
| Railroad & Shipping – 0.8% | |
| Sankyu, Inc. | | 57,500 | $2,115,787 |
| Real Estate – 2.3% | |
| Extra Space Storage, Inc., REIT | | 10,715 | $1,764,225 |
| Life Storage, Inc., REIT | | 19,522 | 2,352,791 |
| Public Storage, Inc., REIT | | 7,558 | 2,259,464 |
| | | | | $6,376,480 |
| Restaurants – 2.5% | |
| McDonald's Corp. | | 11,319 | $2,987,197 |
| Starbucks Corp. | | 38,182 | 3,898,001 |
| | | | | $6,885,198 |
| Specialty Stores – 1.7% | |
| AutoZone, Inc. (a) | | 1,005 | $2,498,973 |
| Walmart Stores, Inc. | | 16,889 | 2,400,433 |
| | | | | $4,899,406 |
| Telecommunications - Wireless – 4.2% | |
| Advanced Info Service Public Co. Ltd. | | 792,100 | $4,527,406 |
| KDDI Corp. | | 210,100 | 6,150,774 |
| PLDT, Inc. | | 40,580 | 942,101 |
| | | | | $11,620,281 |
| Telephone Services – 1.6% | |
| Koninklijke KPN N.V. | | 636,881 | $2,183,231 |
| Orange S.A. | | 202,118 | 2,307,115 |
| | | | | $4,490,346 |
| Tobacco – 0.5% | |
| British American Tobacco PLC | | 34,470 | $1,303,365 |
Portfolio of Investments (unaudited) – continued
| Issuer | | | Shares/Par | Value ($) |
| Common Stocks – continued |
| Trucking – 1.0% | |
| Knight-Swift Transportation Holdings, Inc. | | 50,266 | $2,857,120 |
| Utilities - Electric Power – 5.5% | |
| American Electric Power Co., Inc. | | 30,808 | $2,710,180 |
| CLP Holdings Ltd. | | 442,500 | 3,131,561 |
| Duke Energy Corp. | | 11,847 | 1,116,698 |
| E.ON SE | | 212,232 | 2,322,222 |
| Edison International | | 20,275 | 1,342,408 |
| Evergy, Inc. | | 21,843 | 1,284,587 |
| Xcel Energy, Inc. | | 52,006 | 3,358,027 |
| | | | | $15,265,683 |
| Total Common Stocks (Identified Cost, $236,028,841) | | $273,657,790 |
| Preferred Stocks – 1.2% |
| Computer Software - Systems – 1.2% | | | | |
| Samsung Electronics Co. Ltd. (Identified Cost, $4,355,368) | | 85,870 | $3,465,300 |
| Investment Companies (h) – 0.4% |
| Money Market Funds – 0.4% | |
| MFS Institutional Money Market Portfolio, 4.55% (v) (Identified Cost, $1,199,606) | | | 1,199,606 | $1,199,606 |
|
|
| Other Assets, Less Liabilities – 0.3% | | 787,386 |
| Net Assets – 100.0% | $279,110,082 |
| (a) | Non-income producing security. | | | |
| (h) | An affiliated issuer, which may be considered one in which the fund owns 5% or more of the outstanding voting securities, or a company which is under common control. At period end, the aggregate values of the fund's investments in affiliated issuers and in unaffiliated issuers were $1,199,606 and $277,123,090, respectively. | | | |
| (v) | Affiliated issuer that is available only to investment companies managed by MFS. The rate quoted for the MFS Institutional Money Market Portfolio is the annualized seven-day yield of the fund at period end. | | | |
| The following abbreviations are used in this report and are defined: |
| ADR | American Depositary Receipt |
| REIT | Real Estate Investment Trust |
See Notes to Financial Statements
Financial Statements
Statement of Assets and Liabilities
At 2/28/23 (unaudited)
This statement represents your fund’s balance sheet, which details the assets and liabilities comprising the total value of the fund.
| Assets | |
| Investments in unaffiliated issuers, at value (identified cost, $240,384,209) | $277,123,090 |
| Investments in affiliated issuers, at value (identified cost, $1,199,606) | 1,199,606 |
| Receivables for | |
| Fund shares sold | 407,710 |
| Interest and dividends | 1,052,322 |
| Other assets | 46,361 |
| Total assets | $279,829,089 |
| Liabilities | |
| Payables for | |
| Investments purchased | $74,882 |
| Fund shares reacquired | 472,756 |
| Payable to affiliates | |
| Investment adviser | 6,287 |
| Administrative services fee | 285 |
| Shareholder servicing costs | 31,917 |
| Distribution and service fees | 636 |
| Payable for independent Trustees' compensation | 858 |
| Deferred country tax expense payable | 40,381 |
| Accrued expenses and other liabilities | 91,005 |
| Total liabilities | $719,007 |
| Net assets | $279,110,082 |
| Net assets consist of | |
| Paid-in capital | $244,524,048 |
| Total distributable earnings (loss) | 34,586,034 |
| Net assets | $279,110,082 |
| Shares of beneficial interest outstanding | 19,592,019 |
Statement of Assets and Liabilities (unaudited) – continued
| | Net assets | Shares
outstanding | Net asset value
per share (a) |
| Class A | $31,661,296 | 2,222,039 | $14.25 |
| Class B | 436,214 | 30,898 | 14.12 |
| Class C | 2,967,795 | 210,579 | 14.09 |
| Class I | 152,259,587 | 10,682,491 | 14.25 |
| Class R1 | 128,709 | 9,076 | 14.18 |
| Class R2 | 154,475 | 10,836 | 14.26 |
| Class R3 | 96,412 | 6,757 | 14.27 |
| Class R4 | 86,870 | 6,093 | 14.26 |
| Class R6 | 91,318,724 | 6,413,250 | 14.24 |
| (a) | Maximum offering price per share was equal to the net asset value per share for all share classes, except for Class A, for which the maximum offering price per share was $15.12 [100 / 94.25 x $14.25]. On sales of $50,000 or more, the maximum offering price of Class A shares is reduced. A contingent deferred sales charge may be imposed on redemptions of Class A, Class B, and Class C shares. Redemption price per share was equal to the net asset value per share for Classes I, R1, R2, R3, R4, and R6. |
See Notes to Financial Statements
Financial Statements
Statement of Operations
Six months ended 2/28/23 (unaudited)
This statement describes how much your fund earned in investment income and accrued in expenses. It also describes any gains and/or losses generated by fund operations.
| Net investment income (loss) | |
| Income | |
| Dividends | $2,732,961 |
| Dividends from affiliated issuers | 44,435 |
| Other | 4,175 |
| Income on securities loaned | 2,495 |
| Foreign taxes withheld | (141,197) |
| Total investment income | $2,642,869 |
| Expenses | |
| Management fee | $691,320 |
| Distribution and service fees | 54,681 |
| Shareholder servicing costs | 74,382 |
| Administrative services fee | 23,606 |
| Independent Trustees' compensation | 2,888 |
| Custodian fee | 28,761 |
| Shareholder communications | 8,883 |
| Audit and tax fees | 33,503 |
| Legal fees | 519 |
| Registration fees | 64,089 |
| Miscellaneous | 16,247 |
| Total expenses | $998,879 |
| Reduction of expenses by investment adviser | (47,113) |
| Net expenses | $951,766 |
| Net investment income (loss) | $1,691,103 |
| Realized and unrealized gain (loss) |
| Realized gain (loss) (identified cost basis) | |
| Unaffiliated issuers (net of $4,562 country tax) | $(418,857) |
| Affiliated issuers | 834 |
| Foreign currency | 14,887 |
| Net realized gain (loss) | $(403,136) |
| Change in unrealized appreciation or depreciation | |
| Unaffiliated issuers (net of $28,937 increase in deferred country tax) | $8,177,779 |
| Affiliated issuers | (107) |
| Translation of assets and liabilities in foreign currencies | 10,904 |
| Net unrealized gain (loss) | $8,188,576 |
| Net realized and unrealized gain (loss) | $7,785,440 |
| Change in net assets from operations | $9,476,543 |
See Notes to Financial Statements
Financial Statements
Statements of Changes in Net Assets
These statements describe the increases and/or decreases in net assets resulting from operations, any distributions, and any shareholder transactions.
| | Six months ended | Year ended |
| | 2/28/23
(unaudited) | 8/31/22 |
| Change in net assets | | |
| From operations | | |
| Net investment income (loss) | $1,691,103 | $3,412,071 |
| Net realized gain (loss) | (403,136) | 13,805,006 |
| Net unrealized gain (loss) | 8,188,576 | (38,841,943) |
| Change in net assets from operations | $9,476,543 | $(21,624,866) |
| Total distributions to shareholders | $(7,832,788) | $(20,522,243) |
| Change in net assets from fund share transactions | $38,510,187 | $53,368,468 |
| Total change in net assets | $40,153,942 | $11,221,359 |
| Net assets | | |
| At beginning of period | 238,956,140 | 227,734,781 |
| At end of period | $279,110,082 | $238,956,140 |
See Notes to Financial Statements
Financial Statements
Financial Highlights
The financial highlights table is intended to help you understand the fund's financial performance for the semiannual period and the past 5 fiscal years. Certain information reflects financial results for a single fund share. The total returns in the table represent the rate that an investor would have earned (or lost) on an investment in the fund share class (assuming reinvestment of all distributions) held for the entire period.
| Class A | Six months
ended | Year ended |
| | 2/28/23
(unaudited) | 8/31/22 | 8/31/21 | 8/31/20 | 8/31/19 | 8/31/18 |
| Net asset value, beginning of period | $14.14 | $17.04 | $14.18 | $13.92 | $13.73 | $12.82 |
| Income (loss) from investment operations |
| Net investment income (loss) (d) | $0.08 | $0.19 | $0.17 | $0.23 | $0.25 | $0.23 |
| Net realized and unrealized gain (loss) | 0.45 | (1.64) | 2.90 | 0.39 | 0.56 | 0.92 |
| Total from investment operations | $0.53 | $(1.45) | $3.07 | $0.62 | $0.81 | $1.15 |
| Less distributions declared to shareholders |
| From net investment income | $(0.08) | $(0.16) | $(0.21) | $(0.27) | $(0.23) | $(0.24) |
| From net realized gain | (0.34) | (1.29) | — | (0.09) | (0.39) | — |
| Total distributions declared to shareholders | $(0.42) | $(1.45) | $(0.21) | $(0.36) | $(0.62) | $(0.24) |
| Net asset value, end of period (x) | $14.25 | $14.14 | $17.04 | $14.18 | $13.92 | $13.73 |
| Total return (%) (r)(s)(t)(x) | 3.86(n) | (9.35) | 21.83 | 4.60 | 6.38 | 9.09 |
Ratios (%) (to average net assets)
and Supplemental data: |
| Expenses before expense reductions | 1.03(a) | 1.05 | 1.04 | 1.05 | 1.05 | 1.06 |
| Expenses after expense reductions | 0.99(a) | 0.99 | 0.99 | 0.99 | 0.98 | 0.97 |
| Net investment income (loss) | 1.10(a) | 1.23 | 1.14 | 1.68 | 1.86 | 1.75 |
| Portfolio turnover | 15(n) | 46 | 36 | 43 | 65 | 41 |
| Net assets at end of period (000 omitted) | $31,661 | $25,531 | $25,815 | $23,494 | $19,981 | $9,102 |
See Notes to Financial Statements
Financial Highlights – continued
| Class B | Six months
ended | Year ended |
| | 2/28/23
(unaudited) | 8/31/22 | 8/31/21 | 8/31/20 | 8/31/19 | 8/31/18 |
| Net asset value, beginning of period | $14.00 | $16.90 | $14.08 | $13.82 | $13.63 | $12.73 |
| Income (loss) from investment operations |
| Net investment income (loss) (d) | $0.02 | $0.07 | $0.06 | $0.12 | $0.14 | $0.13 |
| Net realized and unrealized gain (loss) | 0.47 | (1.62) | 2.86 | 0.40 | 0.57 | 0.91 |
| Total from investment operations | $0.49 | $(1.55) | $2.92 | $0.52 | $0.71 | $1.04 |
| Less distributions declared to shareholders |
| From net investment income | $(0.03) | $(0.06) | $(0.10) | $(0.17) | $(0.13) | $(0.14) |
| From net realized gain | (0.34) | (1.29) | — | (0.09) | (0.39) | — |
| Total distributions declared to shareholders | $(0.37) | $(1.35) | $(0.10) | $(0.26) | $(0.52) | $(0.14) |
| Net asset value, end of period (x) | $14.12 | $14.00 | $16.90 | $14.08 | $13.82 | $13.63 |
| Total return (%) (r)(s)(t)(x) | 3.52(n) | (10.03) | 20.88 | 3.81 | 5.60 | 8.25 |
Ratios (%) (to average net assets)
and Supplemental data: |
| Expenses before expense reductions | 1.78(a) | 1.80 | 1.78 | 1.80 | 1.79 | 1.81 |
| Expenses after expense reductions | 1.74(a) | 1.74 | 1.74 | 1.75 | 1.74 | 1.74 |
| Net investment income (loss) | 0.35(a) | 0.48 | 0.40 | 0.88 | 1.03 | 1.02 |
| Portfolio turnover | 15(n) | 46 | 36 | 43 | 65 | 41 |
| Net assets at end of period (000 omitted) | $436 | $438 | $475 | $410 | $410 | $380 |
See Notes to Financial Statements
Financial Highlights – continued
| Class C | Six months
ended | Year ended |
| | 2/28/23
(unaudited) | 8/31/22 | 8/31/21 | 8/31/20 | 8/31/19 | 8/31/18 |
| Net asset value, beginning of period | $13.98 | $16.88 | $14.05 | $13.80 | $13.62 | $12.71 |
| Income (loss) from investment operations |
| Net investment income (loss) (d) | $0.02 | $0.07 | $0.06 | $0.12 | $0.14 | $0.13 |
| Net realized and unrealized gain (loss) | 0.46 | (1.62) | 2.88 | 0.39 | 0.57 | 0.92 |
| Total from investment operations | $0.48 | $(1.55) | $2.94 | $0.51 | $0.71 | $1.05 |
| Less distributions declared to shareholders |
| From net investment income | $(0.03) | $(0.06) | $(0.11) | $(0.17) | $(0.14) | $(0.14) |
| From net realized gain | (0.34) | (1.29) | — | (0.09) | (0.39) | — |
| Total distributions declared to shareholders | $(0.37) | $(1.35) | $(0.11) | $(0.26) | $(0.53) | $(0.14) |
| Net asset value, end of period (x) | $14.09 | $13.98 | $16.88 | $14.05 | $13.80 | $13.62 |
| Total return (%) (r)(s)(t)(x) | 3.47(n) | (10.04) | 21.00 | 3.77 | 5.57 | 8.28 |
Ratios (%) (to average net assets)
and Supplemental data: |
| Expenses before expense reductions | 1.78(a) | 1.80 | 1.79 | 1.80 | 1.80 | 1.81 |
| Expenses after expense reductions | 1.74(a) | 1.74 | 1.74 | 1.75 | 1.74 | 1.74 |
| Net investment income (loss) | 0.35(a) | 0.49 | 0.39 | 0.90 | 1.02 | 1.01 |
| Portfolio turnover | 15(n) | 46 | 36 | 43 | 65 | 41 |
| Net assets at end of period (000 omitted) | $2,968 | $3,001 | $3,133 | $3,261 | $2,876 | $1,773 |
See Notes to Financial Statements
Financial Highlights – continued
| Class I | Six months
ended | Year ended |
| | 2/28/23
(unaudited) | 8/31/22 | 8/31/21 | 8/31/20 | 8/31/19 | 8/31/18 |
| Net asset value, beginning of period | $14.14 | $17.05 | $14.18 | $13.92 | $13.73 | $12.82 |
| Income (loss) from investment operations |
| Net investment income (loss) (d) | $0.10 | $0.24 | $0.21 | $0.26 | $0.28 | $0.27 |
| Net realized and unrealized gain (loss) | 0.45 | (1.66) | 2.90 | 0.39 | 0.56 | 0.91 |
| Total from investment operations | $0.55 | $(1.42) | $3.11 | $0.65 | $0.84 | $1.18 |
| Less distributions declared to shareholders |
| From net investment income | $(0.10) | $(0.20) | $(0.24) | $(0.30) | $(0.26) | $(0.27) |
| From net realized gain | (0.34) | (1.29) | — | (0.09) | (0.39) | — |
| Total distributions declared to shareholders | $(0.44) | $(1.49) | $(0.24) | $(0.39) | $(0.65) | $(0.27) |
| Net asset value, end of period (x) | $14.25 | $14.14 | $17.05 | $14.18 | $13.92 | $13.73 |
| Total return (%) (r)(s)(t)(x) | 4.00(n) | (9.18) | 22.21 | 4.85 | 6.61 | 9.34 |
Ratios (%) (to average net assets)
and Supplemental data: |
| Expenses before expense reductions | 0.78(a) | 0.80 | 0.79 | 0.80 | 0.79 | 0.81 |
| Expenses after expense reductions | 0.74(a) | 0.74 | 0.74 | 0.75 | 0.74 | 0.74 |
| Net investment income (loss) | 1.37(a) | 1.53 | 1.38 | 1.88 | 2.09 | 2.03 |
| Portfolio turnover | 15(n) | 46 | 36 | 43 | 65 | 41 |
| Net assets at end of period (000 omitted) | $152,260 | $124,266 | $102,723 | $106,849 | $118,907 | $114,259 |
See Notes to Financial Statements
Financial Highlights – continued
| Class R1 | Six months
ended | Year ended |
| | 2/28/23
(unaudited) | 8/31/22 | 8/31/21 | 8/31/20 | 8/31/19 | 8/31/18 |
| Net asset value, beginning of period | $14.07 | $16.97 | $14.13 | $13.88 | $13.69 | $12.78 |
| Income (loss) from investment operations |
| Net investment income (loss) (d) | $0.02 | $0.07 | $0.06 | $0.12 | $0.14 | $0.14 |
| Net realized and unrealized gain (loss) | 0.46 | (1.63) | 2.89 | 0.39 | 0.58 | 0.91 |
| Total from investment operations | $0.48 | $(1.56) | $2.95 | $0.51 | $0.72 | $1.05 |
| Less distributions declared to shareholders |
| From net investment income | $(0.03) | $(0.05) | $(0.11) | $(0.17) | $(0.14) | $(0.14) |
| From net realized gain | (0.34) | (1.29) | — | (0.09) | (0.39) | — |
| Total distributions declared to shareholders | $(0.37) | $(1.34) | $(0.11) | $(0.26) | $(0.53) | $(0.14) |
| Net asset value, end of period (x) | $14.18 | $14.07 | $16.97 | $14.13 | $13.88 | $13.69 |
| Total return (%) (r)(s)(t)(x) | 3.45(n) | (10.00) | 20.96 | 3.74 | 5.61 | 8.29 |
Ratios (%) (to average net assets)
and Supplemental data: |
| Expenses before expense reductions | 1.78(a) | 1.80 | 1.78 | 1.80 | 1.79 | 1.81 |
| Expenses after expense reductions | 1.74(a) | 1.74 | 1.74 | 1.75 | 1.74 | 1.74 |
| Net investment income (loss) | 0.35(a) | 0.48 | 0.40 | 0.90 | 1.03 | 1.03 |
| Portfolio turnover | 15(n) | 46 | 36 | 43 | 65 | 41 |
| Net assets at end of period (000 omitted) | $129 | $130 | $149 | $109 | $96 | $74 |
See Notes to Financial Statements
Financial Highlights – continued
| Class R2 | Six months
ended | Year ended |
| | 2/28/23
(unaudited) | 8/31/22 | 8/31/21 | 8/31/20 | 8/31/19 | 8/31/18 |
| Net asset value, beginning of period | $14.14 | $17.04 | $14.18 | $13.92 | $13.73 | $12.81 |
| Income (loss) from investment operations |
| Net investment income (loss) (d) | $0.06 | $0.15 | $0.15 | $0.19 | $0.21 | $0.20 |
| Net realized and unrealized gain (loss) | 0.47 | (1.65) | 2.88 | 0.40 | 0.57 | 0.92 |
| Total from investment operations | $0.53 | $(1.50) | $3.03 | $0.59 | $0.78 | $1.12 |
| Less distributions declared to shareholders |
| From net investment income | $(0.07) | $(0.11) | $(0.17) | $(0.24) | $(0.20) | $(0.20) |
| From net realized gain | (0.34) | (1.29) | — | (0.09) | (0.39) | — |
| Total distributions declared to shareholders | $(0.41) | $(1.40) | $(0.17) | $(0.33) | $(0.59) | $(0.20) |
| Net asset value, end of period (x) | $14.26 | $14.14 | $17.04 | $14.18 | ���$13.92 | $13.73 |
| Total return (%) (r)(s)(t)(x) | 3.79(n) | (9.63) | 21.56 | 4.33 | 6.09 | 8.87 |
Ratios (%) (to average net assets)
and Supplemental data: |
| Expenses before expense reductions | 1.28(a) | 1.30 | 1.28 | 1.30 | 1.29 | 1.31 |
| Expenses after expense reductions | 1.24(a) | 1.24 | 1.24 | 1.25 | 1.24 | 1.24 |
| Net investment income (loss) | 0.84(a) | 0.98 | 0.94 | 1.37 | 1.53 | 1.52 |
| Portfolio turnover | 15(n) | 46 | 36 | 43 | 65 | 41 |
| Net assets at end of period (000 omitted) | $154 | $137 | $263 | $170 | $75 | $66 |
See Notes to Financial Statements
Financial Highlights – continued
| Class R3 | Six months
ended | Year ended |
| | 2/28/23
(unaudited) | 8/31/22 | 8/31/21 | 8/31/20 | 8/31/19 | 8/31/18 |
| Net asset value, beginning of period | $14.16 | $17.06 | $14.20 | $13.94 | $13.74 | $12.82 |
| Income (loss) from investment operations |
| Net investment income (loss) (d) | $0.08 | $0.19 | $0.18 | $0.23 | $0.24 | $0.22 |
| Net realized and unrealized gain (loss) | 0.45 | (1.64) | 2.89 | 0.39 | 0.58 | 0.93 |
| Total from investment operations | $0.53 | $(1.45) | $3.07 | $0.62 | $0.82 | $1.15 |
| Less distributions declared to shareholders |
| From net investment income | $(0.08) | $(0.16) | $(0.21) | $(0.27) | $(0.23) | $(0.23) |
| From net realized gain | (0.34) | (1.29) | — | (0.09) | (0.39) | — |
| Total distributions declared to shareholders | $(0.42) | $(1.45) | $(0.21) | $(0.36) | $(0.62) | $(0.23) |
| Net asset value, end of period (x) | $14.27 | $14.16 | $17.06 | $14.20 | $13.94 | $13.74 |
| Total return (%) (r)(s)(t)(x) | 3.85(n) | (9.34) | 21.81 | 4.58 | 6.42 | 9.11 |
Ratios (%) (to average net assets)
and Supplemental data: |
| Expenses before expense reductions | 1.03(a) | 1.05 | 1.04 | 1.05 | 1.04 | 1.05 |
| Expenses after expense reductions | 0.99(a) | 0.99 | 0.99 | 1.00 | 0.99 | 0.99 |
| Net investment income (loss) | 1.11(a) | 1.23 | 1.15 | 1.65 | 1.78 | 1.69 |
| Portfolio turnover | 15(n) | 46 | 36 | 43 | 65 | 41 |
| Net assets at end of period (000 omitted) | $96 | $92 | $98 | $79 | $71 | $67 |
See Notes to Financial Statements
Financial Highlights – continued
| Class R4 | Six months
ended | Year ended |
| | 2/28/23
(unaudited) | 8/31/22 | 8/31/21 | 8/31/20 | 8/31/19 | 8/31/18 |
| Net asset value, beginning of period | $14.15 | $17.05 | $14.18 | $13.92 | $13.73 | $12.82 |
| Income (loss) from investment operations |
| Net investment income (loss) (d) | $0.10 | $0.23 | $0.21 | $0.26 | $0.27 | $0.27 |
| Net realized and unrealized gain (loss) | 0.45 | (1.64) | 2.90 | 0.39 | 0.57 | 0.91 |
| Total from investment operations | $0.55 | $(1.41) | $3.11 | $0.65 | $0.84 | $1.18 |
| Less distributions declared to shareholders |
| From net investment income | $(0.10) | $(0.20) | $(0.24) | $(0.30) | $(0.26) | $(0.27) |
| From net realized gain | (0.34) | (1.29) | — | (0.09) | (0.39) | — |
| Total distributions declared to shareholders | $(0.44) | $(1.49) | $(0.24) | $(0.39) | $(0.65) | $(0.27) |
| Net asset value, end of period (x) | $14.26 | $14.15 | $17.05 | $14.18 | $13.92 | $13.73 |
| Total return (%) (r)(s)(t)(x) | 4.00(n) | (9.12) | 22.21 | 4.85 | 6.61 | 9.34 |
Ratios (%) (to average net assets)
and Supplemental data: |
| Expenses before expense reductions | 0.78(a) | 0.80 | 0.79 | 0.81 | 0.79 | 0.81 |
| Expenses after expense reductions | 0.74(a) | 0.74 | 0.74 | 0.75 | 0.74 | 0.74 |
| Net investment income (loss) | 1.36(a) | 1.47 | 1.40 | 1.89 | 2.03 | 2.02 |
| Portfolio turnover | 15(n) | 46 | 36 | 43 | 65 | 41 |
| Net assets at end of period (000 omitted) | $87 | $84 | $92 | $75 | $72 | $67 |
See Notes to Financial Statements
Financial Highlights – continued
| Class R6 | Six months
ended | Year ended |
| | 2/28/23
(unaudited) | 8/31/22 | 8/31/21 | 8/31/20 | 8/31/19 | 8/31/18 |
| Net asset value, beginning of period | $14.13 | $17.03 | $14.17 | $13.91 | $13.72 | $12.81 |
| Income (loss) from investment operations |
| Net investment income (loss) (d) | $0.10 | $0.24 | $0.22 | $0.27 | $0.28 | $0.27 |
| Net realized and unrealized gain (loss) | 0.46 | (1.64) | 2.90 | 0.40 | 0.57 | 0.92 |
| Total from investment operations | $0.56 | $(1.40) | $3.12 | $0.67 | $0.85 | $1.19 |
| Less distributions declared to shareholders |
| From net investment income | $(0.11) | $(0.21) | $(0.26) | $(0.32) | $(0.27) | $(0.28) |
| From net realized gain | (0.34) | (1.29) | — | (0.09) | (0.39) | — |
| Total distributions declared to shareholders | $(0.45) | $(1.50) | $(0.26) | $(0.41) | $(0.66) | $(0.28) |
| Net asset value, end of period (x) | $14.24 | $14.13 | $17.03 | $14.17 | $13.91 | $13.72 |
| Total return (%) (r)(s)(t)(x) | 4.05(n) | (9.06) | 22.25 | 4.94 | 6.68 | 9.42 |
Ratios (%) (to average net assets)
and Supplemental data: |
| Expenses before expense reductions | 0.70(a) | 0.72 | 0.71 | 0.73 | 0.72 | 0.74 |
| Expenses after expense reductions | 0.66(a) | 0.66 | 0.67 | 0.67 | 0.67 | 0.67 |
| Net investment income (loss) | 1.43(a) | 1.54 | 1.44 | 2.01 | 2.11 | 2.08 |
| Portfolio turnover | 15(n) | 46 | 36 | 43 | 65 | 41 |
| Net assets at end of period (000 omitted) | $91,319 | $85,277 | $94,987 | $84,631 | $76,901 | $69,385 |
| (a) | Annualized. |
| (d) | Per share data is based on average shares outstanding. |
| (n) | Not annualized. |
| (r) | Certain expenses have been reduced without which performance would have been lower. |
| (s) | From time to time the fund may receive proceeds from litigation settlements, without which performance would be lower. |
| (t) | Total returns do not include any applicable sales charges. |
| (x) | The net asset values and total returns have been calculated on net assets which include adjustments made in accordance with U.S. generally accepted accounting principles required at period end for financial reporting purposes. |
See Notes to Financial Statements
Notes to Financial Statements
(unaudited)
(1) Business and Organization
MFS Low Volatility Global Equity Fund (the fund) is a diversified series of MFS Series Trust I (the trust). The trust is organized as a Massachusetts business trust and is registered under the Investment Company Act of 1940, as amended, as an open-end management investment company.
The fund is an investment company and accordingly follows the investment company accounting and reporting guidance of the Financial Accounting Standards Board (FASB) Accounting Standards Codification Topic 946 Financial Services - Investment Companies.
(2) Significant Accounting Policies
General — The preparation of financial statements in conformity with U.S. generally accepted accounting principles requires management to make estimates and assumptions that affect the reported amounts of assets and liabilities, and disclosure of contingent assets and liabilities at the date of the financial statements and the reported amounts of increases and decreases in net assets from operations during the reporting period. Actual results could differ from those estimates. In the preparation of these financial statements, management has evaluated subsequent events occurring after the date of the fund’s Statement of Assets and Liabilities through the date that the financial statements were issued. The fund invests in foreign securities. Investments in foreign securities are vulnerable to the effects of changes in the relative values of the local currency and the U.S. dollar and to the effects of changes in each country’s market, economic, industrial, political, regulatory, geopolitical, environmental, public health, and other conditions.
Balance Sheet Offsetting — The fund's accounting policy with respect to balance sheet offsetting is that, absent an event of default by the counterparty or a termination of the agreement, the International Swaps and Derivatives Association (ISDA) Master Agreement, or similar agreement, does not result in an offset of reported amounts of financial assets and financial liabilities in the Statement of Assets and Liabilities across transactions between the fund and the applicable counterparty. The fund's right to setoff may be restricted or prohibited by the bankruptcy or insolvency laws of the particular jurisdiction to which a specific master netting agreement counterparty is subject. Balance sheet offsetting disclosures, to the extent applicable to the fund, have been included in the fund’s Significant Accounting Policies note under the captions for each of the fund’s in-scope financial instruments and transactions.
Investment Valuations — Subject to its oversight, the fund's Board of Trustees has delegated primary responsibility for determining or causing to be determined the value of the fund’s investments to MFS as the fund's adviser, pursuant to the fund’s valuation policy and procedures which have been adopted by the adviser and approved by the Board. Effective September 8, 2022, and in accordance with Rule 2a-5 under the Investment Company Act of 1940, the Board of Trustees designated the adviser as the “valuation designee” of the fund. If the adviser, as valuation designee, determines that reliable market quotations are not readily available for an investment, the investment is valued at fair value as determined in good faith by the adviser in accordance with the adviser’s fair valuation policy and procedures.
Notes to Financial Statements (unaudited) - continued
Under the fund's valuation policy and procedures, equity securities, including restricted equity securities, are generally valued at the last sale or official closing price on their primary market or exchange as provided by a third-party pricing service. Equity securities, for which there were no sales reported that day, are generally valued at the last quoted daily bid quotation on their primary market or exchange as provided by a third-party pricing service. Short-term instruments with a maturity at issuance of 60 days or less may be valued at amortized cost, which approximates market value.
Open-end investment companies are generally valued at net asset value per share. The values of foreign securities and other assets and liabilities expressed in foreign currencies are converted to U.S. dollars using the mean of bid and asked prices for rates provided by a third-party pricing service.
Under the fund’s valuation policy and procedures, market quotations are not considered to be readily available for debt instruments, floating rate loans, and many types of derivatives. These investments are generally valued at fair value based on information from third-party pricing services or otherwise determined by the adviser in accordance with the adviser’s fair valuation policy and procedures. Securities and other assets generally valued on the basis of information from a third-party pricing service may also be valued at a broker/dealer bid quotation. In determining values, third-party pricing services can utilize both transaction data and market information such as yield, quality, coupon rate, maturity, type of issue, trading characteristics, spreads and other market data. An investment may also be valued at fair value if the adviser determines that the investment’s value has been materially affected by events occurring after the close of the exchange or market on which the investment is principally traded (such as foreign exchange or market) and prior to the determination of the fund’s net asset value, or after the halt of trading of a specific security where trading does not resume prior to the close of the exchange or market on which the security is principally traded. Events that occur after foreign markets close (such as developments in foreign markets and significant movements in the U.S. markets) and prior to the determination of the fund’s net asset value may be deemed to have a material effect on the value of securities traded in foreign markets. Accordingly, the fund’s foreign equity securities may often be valued at fair value. The adviser generally relies on third-party pricing services or other information (such as the correlation with price movements of similar securities in the same or other markets; the type, cost and investment characteristics of the security; the business and financial condition of the issuer; and trading and other market data) to assist in determining whether to fair value and at what value to fair value an investment. The value of an investment for purposes of calculating the fund’s net asset value can differ depending on the source and method used to determine value. When fair valuation is used, the value of an investment used to determine the fund’s net asset value may differ from quoted or published prices for the same investment. There can be no assurance that the fund could obtain the fair value assigned to an investment if it were to sell the investment at the same time at which the fund determines its net asset value per share.
Various inputs are used in determining the value of the fund's assets or liabilities. These inputs are categorized into three broad levels. In certain cases, the inputs used to measure fair value may fall into different levels of the fair value hierarchy. In such cases, an investment's level within the fair value hierarchy is based on the lowest level of input that is significant to the fair value measurement. The fund's assessment of the significance of a particular input to the fair value measurement in its entirety requires judgment, and considers factors specific to the investment. Level 1 includes unadjusted
Notes to Financial Statements (unaudited) - continued
quoted prices in active markets for identical assets or liabilities. Level 2 includes other significant observable market-based inputs (including quoted prices for similar securities, interest rates, prepayment speed, and credit risk). Level 3 includes significant unobservable inputs, which may include the adviser's own assumptions in determining the fair value of investments. The following is a summary of the levels used as of February 28, 2023 in valuing the fund's assets and liabilities:
| Financial Instruments | Level 1 | Level 2 | Level 3 | Total |
| Equity Securities: | | | | |
| United States | $150,790,020 | $— | $— | $150,790,020 |
| Japan | 28,677,833 | — | — | 28,677,833 |
| Canada | 16,900,521 | 74,873 | — | 16,975,394 |
| Switzerland | 13,850,386 | — | — | 13,850,386 |
| Singapore | 13,304,768 | — | — | 13,304,768 |
| South Korea | 8,891,965 | — | — | 8,891,965 |
| United Kingdom | 7,107,331 | — | — | 7,107,331 |
| Israel | 6,579,609 | — | — | 6,579,609 |
| France | 5,177,221 | — | — | 5,177,221 |
| Other Countries | 21,241,157 | 4,527,406 | — | 25,768,563 |
| Mutual Funds | 1,199,606 | — | — | 1,199,606 |
| Total | $273,720,417 | $4,602,279 | $— | $278,322,696 |
For further information regarding security characteristics, see the Portfolio of Investments.
Foreign Currency Translation — Purchases and sales of foreign investments, income, and expenses are converted into U.S. dollars based upon currency exchange rates prevailing on the respective dates of such transactions or on the reporting date for foreign denominated receivables and payables. Gains and losses attributable to foreign currency exchange rates on sales of securities are recorded for financial statement purposes as net realized gains and losses on investments. Gains and losses attributable to foreign exchange rate movements on receivables, payables, income and expenses are recorded for financial statement purposes as foreign currency transaction gains and losses. That portion of both realized and unrealized gains and losses on investments that results from fluctuations in foreign currency exchange rates is not separately disclosed.
Security Loans — Under its Securities Lending Agency Agreement with the fund, State Street Bank and Trust Company, as lending agent, loans the securities of the fund to certain qualified institutions (the “Borrowers”) approved by the fund. Security loans can be terminated at the discretion of either the lending agent or the fund and the related securities must be returned within the earlier of the standard trade settlement period for such securities or within three business days. The loans are collateralized by cash and/or U.S. Treasury and federal agency obligations in an amount typically at least equal to the market value of the securities loaned. On loans collateralized by cash, the cash collateral is invested in a money market fund. The market value of the loaned securities is determined at the close of business of the fund and any additional required collateral is delivered to the fund on the next business day. The lending agent provides the fund with indemnification against Borrower default. In the event of Borrower default, the lending agent will, for the benefit of the fund, either purchase securities identical to those loaned or, when such purchase is commercially impracticable, pay the
Notes to Financial Statements (unaudited) - continued
fund the market value of the loaned securities. In return, the lending agent assumes the fund's rights to the related collateral. If the collateral value is less than the cost to purchase identical securities, the lending agent is responsible for the shortfall, but only to the extent that such shortfall is not due to a decline in collateral value resulting from collateral reinvestment for which the fund bears the risk of loss. A portion of the income generated upon investment of the collateral is remitted to the Borrowers, and the remainder is allocated between the fund and the lending agent. On loans collateralized by U.S. Treasury and/or federal agency obligations, a fee is received from the Borrower, and is allocated between the fund and the lending agent. Income from securities lending is separately reported in the Statement of Operations. The dividend and interest income earned on the securities loaned is accounted for in the same manner as other dividend and interest income. At February 28, 2023, there were no securities on loan or collateral outstanding.
Indemnifications — Under the fund's organizational documents, its officers and Trustees may be indemnified against certain liabilities and expenses arising out of the performance of their duties to the fund. Additionally, in the normal course of business, the fund enters into agreements with service providers that may contain indemnification clauses. The fund's maximum exposure under these agreements is unknown as this would involve future claims that may be made against the fund that have not yet occurred.
Investment Transactions and Income — Investment transactions are recorded on the trade date. Dividends received in cash are recorded on the ex-dividend date. Certain dividends from foreign securities will be recorded when the fund is informed of the dividend if such information is obtained subsequent to the ex-dividend date. Dividend payments received in additional securities are recorded on the ex-dividend date in an amount equal to the value of the security on such date. In determining the net gain or loss on securities sold, the cost of securities is determined on the identified cost basis.
The fund may receive proceeds from litigation settlements. Any proceeds received from litigation involving portfolio holdings are reflected in the Statement of Operations in realized gain/loss if the security has been disposed of by the fund or in unrealized gain/loss if the security is still held by the fund. Any other proceeds from litigation not related to portfolio holdings are reflected as other income in the Statement of Operations.
Tax Matters and Distributions — The fund intends to qualify as a regulated investment company, as defined under Subchapter M of the Internal Revenue Code, and to distribute all of its taxable income, including realized capital gains. As a result, no provision for federal income tax is required. The fund’s federal tax returns, when filed, will remain subject to examination by the Internal Revenue Service for a three year period. Management has analyzed the fund’s tax positions taken on federal and state tax returns for all open tax years and does not believe that there are any uncertain tax positions that require recognition of a tax liability. Foreign taxes, if any, have been accrued by the fund in the accompanying financial statements in accordance with the applicable foreign tax law. Foreign income taxes may be withheld by certain countries in which the fund invests. Additionally, capital gains realized by the fund on securities issued in or by certain foreign countries may be subject to capital gains tax imposed by those countries.
Notes to Financial Statements (unaudited) - continued
Distributions to shareholders are recorded on the ex-dividend date. Income and capital gain distributions are determined in accordance with income tax regulations, which may differ from U.S. generally accepted accounting principles. Certain capital accounts in the financial statements are periodically adjusted for permanent differences in order to reflect their tax character. These adjustments have no impact on net assets or net asset value per share. Temporary differences which arise from recognizing certain items of income, expense, gain or loss in different periods for financial statement and tax purposes will reverse at some time in the future.
Book/tax differences primarily relate to passive foreign investment companies, wash sale loss deferrals, and treating a portion of the proceeds from redemptions as a distribution for tax purposes.
The tax character of distributions made during the current period will be determined at fiscal year end. The tax character of distributions declared to shareholders for the last fiscal year is as follows:
| | Year ended
8/31/22 |
| Ordinary income (including any short-term capital gains) | $2,983,213 |
| Long-term capital gains | 17,539,030 |
| Total distributions | $20,522,243 |
The federal tax cost and the tax basis components of distributable earnings were as follows:
| As of 2/28/23 | |
| Cost of investments | $243,517,385 |
| Gross appreciation | 41,216,734 |
| Gross depreciation | (6,411,423) |
| Net unrealized appreciation (depreciation) | $34,805,311 |
| As of 8/31/22 | |
| Undistributed ordinary income | 333,299 |
| Undistributed long-term capital gain | 6,060,870 |
| Other temporary differences | (47,194) |
| Net unrealized appreciation (depreciation) | 26,595,304 |
The aggregate cost above includes prior fiscal year end tax adjustments, if applicable.
Multiple Classes of Shares of Beneficial Interest — The fund offers multiple classes of shares, which differ in their respective distribution and service fees. The fund's income, realized and unrealized gain (loss), and common expenses are allocated to shareholders based on the daily net assets of each class. Dividends are declared separately for each class. Differences in per share dividend rates are generally due to differences in separate class expenses. Class B and Class C shares will convert to
Notes to Financial Statements (unaudited) - continued
Class A shares approximately eight years after purchase. The fund’s distributions declared to shareholders as reported in the Statements of Changes in Net Assets are presented by class as follows:
| | Six months
ended
2/28/23 | | Year
ended
8/31/22 |
| Class A | $883,201 | | $2,192,527 |
| Class B | 11,199 | | 37,962 |
| Class C | 77,372 | | 259,632 |
| Class I | 4,091,288 | | 9,515,931 |
| Class R1 | 3,524 | | 11,884 |
| Class R2 | 4,254 | | 12,733 |
| Class R3 | 2,810 | | 8,364 |
| Class R4 | 2,657 | | 8,073 |
| Class R6 | 2,756,483 | | 8,475,137 |
| Total | $7,832,788 | | $20,522,243 |
(3) Transactions with Affiliates
Investment Adviser — The fund has an investment advisory agreement with MFS to provide overall investment management and related administrative services and facilities to the fund. The management fee is computed daily and paid monthly at the following annual rates based on the fund's average daily net assets:
| Up to $1 billion | 0.55% |
| In excess of $1 billion and up to $2.5 billion | 0.525% |
| In excess of $2.5 billion | 0.50% |
MFS has agreed in writing to reduce its management fee by a specified amount if certain MFS mutual fund assets exceed thresholds agreed to by MFS and the fund's Board of Trustees. MFS has also agreed in writing to waive at least 0.01% of its management fee as part of this agreement. The agreement to waive at least 0.01% of the management fee will continue until modified by the fund's Board of Trustees, but such agreement will continue at least until December 31, 2023. For the six months ended February 28, 2023, this management fee reduction amounted to $16,747, which is included in the reduction of total expenses in the Statement of Operations.
The management fee incurred for the six months ended February 28, 2023 was equivalent to an annual effective rate of 0.54% of the fund's average daily net assets.
The investment adviser has agreed in writing to pay a portion of the fund’s total annual operating expenses, excluding interest, taxes, extraordinary expenses, brokerage and transaction costs, certain tax reclaim recovery expenses (including contingency fees and closing agreement expenses), and investment-related expenses, such that total fund operating expenses do not exceed the following rates annually of each class’s average daily net assets:
| | | | | Classes | | | | |
| A | B | C | I | R1 | R2 | R3 | R4 | R6 |
| 0.99% | 1.74% | 1.74% | 0.74% | 1.74% | 1.24% | 0.99% | 0.74% | 0.68% |
Notes to Financial Statements (unaudited) - continued
This written agreement will continue until modified by the fund’s Board of Trustees, but such agreement will continue at least until December 31, 2023. For the six months ended February 28, 2023, this reduction amounted to $30,366, which is included in the reduction of total expenses in the Statement of Operations.
Distributor — MFS Fund Distributors, Inc. (MFD), a wholly-owned subsidiary of MFS, as distributor, received $6,626 for the six months ended February 28, 2023, as its portion of the initial sales charge on sales of Class A shares of the fund.
The Board of Trustees has adopted a distribution plan for certain share classes pursuant to Rule 12b-1 of the Investment Company Act of 1940.
The fund's distribution plan provides that the fund will pay MFD for services provided by MFD and financial intermediaries in connection with the distribution and servicing of certain share classes. One component of the plan is a distribution fee paid to MFD and another component of the plan is a service fee paid to MFD. MFD may subsequently pay all, or a portion, of the distribution and/or service fees to financial intermediaries.
Distribution Plan Fee Table:
| | Distribution
Fee Rate (d) | Service
Fee Rate (d) | Total
Distribution
Plan (d) | Annual
Effective
Rate (e) | Distribution
and Service
Fee |
| Class A | — | 0.25% | 0.25% | 0.25% | $ 36,666 |
| Class B | 0.75% | 0.25% | 1.00% | 1.00% | 2,155 |
| Class C | 0.75% | 0.25% | 1.00% | 1.00% | 14,728 |
| Class R1 | 0.75% | 0.25% | 1.00% | 1.00% | 650 |
| Class R2 | 0.25% | 0.25% | 0.50% | 0.50% | 366 |
| Class R3 | — | 0.25% | 0.25% | 0.25% | 116 |
| Total Distribution and Service Fees | | | | | $54,681 |
| (d) | In accordance with the distribution plan for certain classes, the fund pays distribution and/or service fees equal to these annual percentage rates of each class’s average daily net assets. The distribution and service fee rates disclosed by class represent the current rates in effect at the end of the reporting period. Any rate changes, if applicable, are detailed below. |
| (e) | The annual effective rates represent actual fees incurred under the distribution plan for the six months ended February 28, 2023 based on each class's average daily net assets. MFD has voluntarily agreed to rebate a portion of each class's 0.25% service fee attributable to accounts for which there is no financial intermediary specified on the account except for accounts attributable to MFS or its affiliates' seed money. There were no service fee rebates for the six months ended February 28, 2023. |
Certain Class A shares are subject to a contingent deferred sales charge (CDSC) in the event of a shareholder redemption within 18 months of purchase. Class B shares are subject to a CDSC in the event of a shareholder redemption within six years of purchase. Class C shares are subject to a CDSC in the event of a shareholder redemption within 12 months of purchase. All contingent deferred sales charges are paid to MFD and during the six months ended February 28, 2023, were as follows:
| | Amount |
| Class A | $88 |
| Class B | — |
| Class C | 6 |
Notes to Financial Statements (unaudited) - continued
Shareholder Servicing Agent — MFS Service Center, Inc. (MFSC), a wholly-owned subsidiary of MFS, receives a fee from the fund for its services as shareholder servicing agent calculated as a percentage of the average daily net assets of the fund as determined periodically under the supervision of the fund's Board of Trustees. For the six months ended February 28, 2023, the fee was $3,050, which equated to 0.0024% annually of the fund's average daily net assets. MFSC also receives reimbursement from the fund for out-of-pocket expenses, sub-accounting and other shareholder servicing costs which may be paid to affiliated and unaffiliated service providers. Class R6 shares do not incur sub-accounting fees. For the six months ended February 28, 2023, these out-of-pocket expenses, sub-accounting and other shareholder servicing costs amounted to $71,332.
Administrator — MFS provides certain financial, legal, shareholder communications, compliance, and other administrative services to the fund. Under an administrative services agreement, the fund reimburses MFS the costs incurred to provide these services. The fund is charged an annual fixed amount of $17,500 plus a fee based on average daily net assets. The administrative services fee incurred for the six months ended February 28, 2023 was equivalent to an annual effective rate of 0.0188% of the fund's average daily net assets.
Trustees’ and Officers’ Compensation — The fund pays compensation to independent Trustees in the form of a retainer, attendance fees, and additional compensation to Board and Committee chairpersons. The fund does not pay compensation directly to Trustees or officers of the fund who are also officers of the investment adviser, all of whom receive remuneration from MFS for their services to the fund. Certain officers and Trustees of the fund are officers or directors of MFS, MFD, and MFSC.
Other — The fund invests in the MFS Institutional Money Market Portfolio which is managed by MFS and seeks current income consistent with preservation of capital and liquidity. This money market fund does not pay a management fee to MFS but does incur investment and operating costs.
At February 28, 2023, MFS held approximately 63%, 54%, and 88% of the outstanding shares of Class R1, Class R2, and Class R3, respectively, and 100% of the oustanding shares of Class R4.
The adviser has voluntarily undertaken to reimburse the fund from its own resources on a quarterly basis for the cost of investment research embedded in the cost of the fund’s securities trades. This agreement may be rescinded at any time. For the six months ended February 28, 2023, this reimbursement amounted to $4,163, which is included in “Other” income in the Statement of Operations.
(4) Portfolio Securities
For the six months ended February 28, 2023, purchases and sales of investments, other than short-term obligations, aggregated $69,974,320 and $38,421,367, respectively.
Notes to Financial Statements (unaudited) - continued
(5) Shares of Beneficial Interest
The fund's Declaration of Trust permits the Trustees to issue an unlimited number of full and fractional shares of beneficial interest. Transactions in fund shares were as follows:
| | Six months ended
2/28/23 | | Year ended
8/31/22 |
| | Shares | Amount | | Shares | Amount |
| Shares sold | | | | | |
| Class A | 574,691 | $7,960,325 | | 393,606 | $5,901,232 |
| Class B | — | — | | 1,562 | 23,879 |
| Class C | 18,939 | 265,982 | | 55,397 | 836,119 |
| Class I | 3,484,852 | 49,421,176 | | 5,000,573 | 75,676,454 |
| Class R1 | 336 | 4,717 | | 992 | 14,960 |
| Class R2 | 1,322 | 17,927 | | 396 | 6,510 |
| Class R3 | 84 | 1,160 | | 251 | 3,756 |
| Class R6 | 601,192 | 8,621,396 | | 1,276,664 | 19,149,326 |
| | 4,681,416 | $66,292,683 | | 6,729,441 | $101,612,236 |
Shares issued to shareholders
in reinvestment of distributions | | | | | |
| Class A | 62,688 | $883,201 | | 139,204 | $2,192,527 |
| Class B | 799 | 11,199 | | 2,423 | 37,962 |
| Class C | 5,531 | 77,372 | | 16,608 | 259,632 |
| Class I | 227,929 | 3,208,351 | | 503,719 | 7,925,672 |
| Class R1 | 250 | 3,524 | | 755 | 11,884 |
| Class R2 | 301 | 4,254 | | 806 | 12,733 |
| Class R3 | 199 | 2,810 | | 530 | 8,364 |
| Class R4 | 188 | 2,657 | | 513 | 8,073 |
| Class R6 | 192,120 | 2,700,889 | | 526,753 | 8,290,337 |
| | 490,005 | $6,894,257 | | 1,191,311 | $18,747,184 |
| Shares reacquired | | | | | |
| Class A | (221,114) | $(3,122,602) | | (242,209) | $(3,746,358) |
| Class B | (1,171) | (16,704) | | (840) | (12,019) |
| Class C | (28,524) | (400,412) | | (43,003) | (637,467) |
| Class I | (1,815,816) | (25,221,337) | | (2,745,265) | (41,851,906) |
| Class R1 | (757) | (10,889) | | (1,268) | (18,770) |
| Class R2 | (504) | (6,861) | | (6,902) | (117,133) |
| Class R3 | (8) | (114) | | (37) | (522) |
| Class R6 | (414,690) | (5,897,834) | | (1,346,988) | (20,606,777) |
| | (2,482,584) | $(34,676,753) | | (4,386,512) | $(66,990,952) |
Notes to Financial Statements (unaudited) - continued
| | Six months ended
2/28/23 | | Year ended
8/31/22 |
| | Shares | Amount | | Shares | Amount |
| Net change | | | | | |
| Class A | 416,265 | $5,720,924 | | 290,601 | $4,347,401 |
| Class B | (372) | (5,505) | | 3,145 | 49,822 |
| Class C | (4,054) | (57,058) | | 29,002 | 458,284 |
| Class I | 1,896,965 | 27,408,190 | | 2,759,027 | 41,750,220 |
| Class R1 | (171) | (2,648) | | 479 | 8,074 |
| Class R2 | 1,119 | 15,320 | | (5,700) | (97,890) |
| Class R3 | 275 | 3,856 | | 744 | 11,598 |
| Class R4 | 188 | 2,657 | | 513 | 8,073 |
| Class R6 | 378,622 | 5,424,451 | | 456,429 | 6,832,886 |
| | 2,688,837 | $38,510,187 | | 3,534,240 | $53,368,468 |
Effective June 1, 2019, purchases of the fund’s Class B shares were closed to new and existing investors subject to certain exceptions.
(6) Line of Credit
The fund and certain other funds managed by MFS participate in a $1.45 billion unsecured committed line of credit of which $1.2 billion is reserved for use by the fund and certain other MFS U.S. funds. The line of credit is provided by a syndicate of banks under a credit agreement. Borrowings may be made for temporary financing needs. Interest is charged to each fund, based on its borrowings, generally at a rate equal to the highest of 1) Daily Simple SOFR (Secured Overnight Financing Rate) plus 0.10%, 2) the Federal Funds Effective Rate, or 3) the Overnight Bank Funding Rate, each plus an agreed upon spread. A commitment fee, based on the average daily unused portion of the committed line of credit, is allocated among the participating funds. The line of credit expires on March 14, 2024 unless extended or renewed. In addition, the fund and other funds managed by MFS have established unsecured uncommitted borrowing arrangements with certain banks for temporary financing needs. Interest is charged to each fund, based on its borrowings, at rates equal to customary reference rates plus an agreed upon spread. For the six months ended February 28, 2023, the fund’s commitment fee and interest expense were $581 and $0, respectively, and are included in “Miscellaneous” expense in the Statement of Operations.
(7) Investments in Affiliated Issuers
An affiliated issuer may be considered one in which the fund owns 5% or more of the outstanding voting securities, or a company which is under common control. For the purposes of this report, the following were affiliated issuers:
| Affiliated Issuers | Beginning
Value | Purchases | Sales
Proceeds | Realized
Gain
(Loss) | Change in
Unrealized
Appreciation or
Depreciation | Ending
Value |
| MFS Institutional Money Market Portfolio | $3,133,480 | $40,040,387 | $41,974,988 | $834 | $(107) | $1,199,606 |
Notes to Financial Statements (unaudited) - continued
| Affiliated Issuers | Dividend
Income | Capital Gain
Distributions |
| MFS Institutional Money Market Portfolio | $44,435 | $— |
(8) LIBOR Transition
Certain of the fund's investments, including investments in certain debt instruments and derivatives (if any), as well as borrowings by the fund and certain other contractual arrangements of the fund, may be based on the London Interbank Offered Rate (“LIBOR”). In 2017, the regulatory authority that oversees financial services firms in the United Kingdom announced plans to transition away from LIBOR by the end of 2021. In March 2021, the administrator of LIBOR announced the extension of the publication of the more commonly used U.S. dollar LIBOR settings to the end of June 2023. Although the full impacts of the transition away from LIBOR are not fully known, the transition may result in, among other things, an increase in volatility or illiquidity of the markets for instruments that currently rely on LIBOR to determine interest rates and this could have an adverse impact on the fund's performance. With respect to the fund's accounting for investments, including investments in certain debt instruments and derivatives, as well as borrowings by the fund and any other contractual arrangements of the fund that undergo reference rate-related modifications as a result of the transition, management will rely upon the relief provided by FASB Codification Topic 848 – Reference Rate Reform (Topic 848). The guidance in Topic 848 permits the fund to account for those modified contracts as a continuation of the existing contracts. The situation remains fluid, and management believes, based on best available information, that the impact of the transition will not be material to the fund.
(9) Subsequent Event
On March 30, 2023, the fund announced that effective after the close of business on September 29, 2023, purchases of Class R1 and Class R2 shares will be closed to new eligible investors.
Proxy Voting Policies and Information
MFS votes proxies on behalf of the fund pursuant to proxy voting policies and procedures that are available without charge, upon request, by calling 1-800-225-2606, by visiting mfs.com/proxyvoting, or by visiting the SEC’s Web site at http://www.sec.gov.
Information regarding how the fund voted proxies relating to portfolio securities during the most recent twelve-month period ended June 30 is available by August 31 of each year without charge by visiting mfs.com/proxyvoting, or by visiting the SEC’s Web site at http://www.sec.gov.
Quarterly Portfolio Disclosure
The fund files a complete schedule of portfolio holdings with the SEC for the first and third quarters of each fiscal year as an exhibit to its reports on Form N-PORT. The fund's Form N-PORT reports are available on the SEC's Web site at http://www.sec.gov. A shareholder can obtain the portfolio holdings report for the first and third quarters of the fund's fiscal year at mfs.com/openendfunds by choosing the fund's name and then scrolling to the “Resources” section and clicking on the “Prospectus and Reports” tab.
Further Information
From time to time, MFS may post important information about the fund or the MFS Funds on the MFS Web site (mfs.com). This information is available at https://www.mfs.com/announcements or at mfs.com/openendfunds by choosing the fund’s name and then scrolling to the “Resources” section and clicking on the “Announcements” tab, if any.
Information About Fund Contracts and Legal Claims
The fund has entered into contractual arrangements with an investment adviser, administrator, distributor, shareholder servicing agent, and custodian who each provide services to the fund. Unless expressly stated otherwise, shareholders are not parties to, or intended beneficiaries of these contractual arrangements, and these contractual arrangements are not intended to create any shareholder right to enforce them against the service providers or to seek any remedy under them against the service providers, either directly or on behalf of the fund.
Under the Trust’s By-Laws and Declaration of Trust, any claims asserted against or on behalf of the MFS Funds, including claims against Trustees and Officers, must be brought in state and federal courts located within the Commonwealth of Massachusetts.
Provision of Financial Reports and Summary Prospectuses
The fund produces financial reports every six months and updates its summary prospectus and prospectus annually. To avoid sending duplicate copies of materials to households, only one copy of the fund’s annual and semiannual report and summary prospectus may be mailed to shareholders having the same last name and residential address on the fund’s records. However, any shareholder may contact MFSC (please see back cover for address and telephone number) to request that copies of these reports and summary prospectuses be sent personally to that shareholder.
Save paper with eDelivery.
MFS® will send you prospectuses, reports, and proxies directly via e-mail so you will get information faster with less mailbox clutter.
To sign up:
1. Go to mfs.com.
2. Log in via MFS® Access.
3. Select eDelivery.
If you own your MFS fund shares through a financial institution or a retirement plan, MFS® TALK, MFS® Access, or eDelivery may not be available to you.
CONTACT
WEB SITE
mfs.com
MFS TALK
1-800-637-8255
24 hours a day
ACCOUNT SERVICE AND LITERATURE
Shareholders
1-800-225-2606
Financial advisors
1-800-343-2829
Retirement plan services
1-800-637-1255
MAILING ADDRESS
MFS Service Center, Inc.
P.O. Box 219341
Kansas City, MO 64121-9341
OVERNIGHT MAIL
MFS Service Center, Inc.
Suite 219341
430 W 7th Street
Kansas City, MO 64105-1407
Semiannual Report
February 28, 2023
The report is prepared for the general information of shareholders. It is authorized for distribution to prospective investors only when preceded or accompanied by a current prospectus.
NOT FDIC INSURED • MAY LOSE VALUE • NO BANK GUARANTEE
LETTER FROM THE CHAIR AND CEO
Dear Shareholders:
Markets — which rallied in late 2022 and early 2023 on signs of peaking inflation, hopes that monetary policy tightening cycles may be nearing an end and a rapid reopening of China’s economy — have hit turbulence after the sudden collapse of two US regional banks and the government-led merger of Switzerland’s two largest lenders. At the same time, US inflation data suggest that price pressures will prove more persistent than expected, making the US Federal Reserve’s job of trying to corral four-decade-high inflation without tipping the economy into recession that much more difficult. On a positive note, markets have largely adjusted to the challenges posed by Russia’s invasion of Ukraine, thanks in part to mild European winter weather that has alleviated concerns over potential near-term shortages of natural gas. Resilient labor markets in much of the developed world have further contributed to a brighter-than-expected economic backdrop. However, after the recent banking turmoil, investors are increasingly mindful that the lagged effects of ongoing monetary policy tightening have yet to fully work their way through the global economy.
One result of the banking crisis has been a rally in global government bond markets as investors sense that the global monetary tightening campaign is nearing its end, and the resulting lower yields have eased some of the pressure on interest rate–sensitive parts of the economy. Over the near term, amid tighter financial conditions, we feel companies will face a challenging earnings backdrop as they are forced to absorb higher input and labor costs while pricing power dwindles. As for fixed income, the rise in interest rates in recent months has made bonds more attractive than they have been in years, which may provide balance for investors’ portfolios.
During times of market transition, it is important to have a deep understanding of company fundamentals, and we have built our unique global research platform to do just that.
At MFS®, we put our clients’ assets to work responsibly by carefully navigating increasingly complex global capital markets. Our investment team is guided by a commitment to long-term fundamental investing. Our global investment platform — combining collective expertise, long-term discipline, and thoughtful risk management — seeks to uncover what we believe are the best, most durable investment ideas in markets around the world, enabling us to potentially create value for investors.
Respectfully,
Michael W. Roberge
Chair and Chief Executive Officer
MFS Investment Management
April 14, 2023
The opinions expressed in this letter are subject to change and may not be relied upon for investment advice. No forecasts can be guaranteed.
Portfolio structure
Top ten holdings
| ChampionX Corp. | 2.9% |
| WNS (Holdings) Ltd., ADR | 2.4% |
| Sensata Technologies Holding PLC | 2.3% |
| GFL Environmental, Inc. | 2.2% |
| Axalta Coating Systems Ltd. | 1.9% |
| ExlService Holdings, Inc. | 1.9% |
| Element Solutions, Inc. | 1.9% |
| Ritchie Bros. Auctioneers, Inc. | 1.9% |
| Envista Holdings Corp. | 1.9% |
| Ingevity Corp. | 1.8% |
GICS equity sectors (g)
| Information Technology | 24.8% |
| Industrials | 16.2% |
| Health Care | 15.9% |
| Consumer Discretionary | 14.0% |
| Energy | 7.3% |
| Financials | 6.7% |
| Materials | 5.6% |
| Real Estate | 1.6% |
| Communication Services | 1.5% |
| Consumer Staples | 1.2% |
| Utilities | 0.3% |
| Equity Warrants (o) | 0.0% |
| (g) | The Global Industry Classification Standard (GICS®) was developed by and/or is the exclusive property of MSCI, Inc. and S&P Global Market Intelligence Inc. (“S&P Global Market Intelligence”). GICS is a service mark of MSCI and S&P Global Market Intelligence and has been licensed for use by MFS. MFS has applied its own internal sector/industry classification methodology for equity securities and non-equity securities that are unclassified by GICS. |
Cash & Cash Equivalents includes any cash, investments in money market funds, short-term securities, and other assets less liabilities. Please see the Statement of Assets and Liabilities for additional information related to the fund’s cash position and other assets and liabilities.
Other includes equivalent exposure from currency derivatives and/or any offsets to derivative positions and may be negative.
Percentages are based on net assets as of February 28, 2023.
The portfolio is actively managed and current holdings may be different.
Expense Table
Fund expenses borne by the shareholders during the period,
September 1, 2022 through February 28, 2023
As a shareholder of the fund, you incur two types of costs: (1) transaction costs, including sales charges (loads) on certain purchase or redemption payments, and (2) ongoing costs, including management fees; distribution and service (12b-1) fees; and other fund expenses. This example is intended to help you understand your ongoing costs (in dollars) of investing in the fund and to compare these costs with the ongoing costs of investing in other mutual funds.
The example is based on an investment of $1,000 invested at the beginning of the period and held for the entire period September 1, 2022 through February 28, 2023.
Actual Expenses
The first line for each share class in the following table provides information about actual account values and actual expenses. You may use the information in this line, together with the amount you invested, to estimate the expenses that you paid over the period. Simply divide your account value by $1,000 (for example, an $8,600 account value divided by $1,000 = 8.6), then multiply the result by the number in the first line under the heading entitled “Expenses Paid During Period” to estimate the expenses you paid on your account during this period.
Hypothetical Example for Comparison Purposes
The second line for each share class in the following table provides information about hypothetical account values and hypothetical expenses based on the fund’s actual expense ratio and an assumed rate of return of 5% per year before expenses, which is not the fund’s actual return. The hypothetical account values and expenses may not be used to estimate the actual ending account balance or expenses you paid for the period. You may use this information to compare the ongoing costs of investing in the fund and other funds. To do so, compare this 5% hypothetical example with the 5% hypothetical examples that appear in the shareholder reports of the other funds.
Please note that the expenses shown in the table are meant to highlight your ongoing costs only and do not reflect any transactional costs, such as sales charges (loads). Therefore, the second line for each share class in the table is useful in comparing ongoing costs only, and will not help you determine the relative total costs of owning different funds. In addition, if these transactional costs were included, your costs would have been higher.
Expense Table - continued
Share
Class | | Annualized
Expense
Ratio | Beginning
Account Value
9/01/22 | Ending
Account Value
2/28/23 | Expenses
Paid During
Period (p)
9/01/22-2/28/23 |
| A | Actual | 1.28% | $1,000.00 | $1,041.32 | $6.48 |
| Hypothetical (h) | 1.28% | $1,000.00 | $1,018.45 | $6.41 |
| B | Actual | 2.03% | $1,000.00 | $1,037.28 | $10.25 |
| Hypothetical (h) | 2.03% | $1,000.00 | $1,014.73 | $10.14 |
| C | Actual | 2.03% | $1,000.00 | $1,037.88 | $10.26 |
| Hypothetical (h) | 2.03% | $1,000.00 | $1,014.73 | $10.14 |
| I | Actual | 1.03% | $1,000.00 | $1,042.89 | $5.22 |
| Hypothetical (h) | 1.03% | $1,000.00 | $1,019.69 | $5.16 |
| R1 | Actual | 2.03% | $1,000.00 | $1,037.98 | $10.26 |
| Hypothetical (h) | 2.03% | $1,000.00 | $1,014.73 | $10.14 |
| R2 | Actual | 1.53% | $1,000.00 | $1,040.30 | $7.74 |
| Hypothetical (h) | 1.53% | $1,000.00 | $1,017.21 | $7.65 |
| R3 | Actual | 1.28% | $1,000.00 | $1,041.44 | $6.48 |
| Hypothetical (h) | 1.28% | $1,000.00 | $1,018.45 | $6.41 |
| R4 | Actual | 1.03% | $1,000.00 | $1,043.02 | $5.22 |
| Hypothetical (h) | 1.03% | $1,000.00 | $1,019.69 | $5.16 |
| R6 | Actual | 0.89% | $1,000.00 | $1,043.56 | $4.51 |
| Hypothetical (h) | 0.89% | $1,000.00 | $1,020.38 | $4.46 |
| (h) | 5% class return per year before expenses. |
| (p) | “Expenses Paid During Period” are equal to each class’s annualized expense ratio, as shown above, multiplied by the average account value over the period, multiplied by 181/365 (to reflect the one-half year period). Expenses paid do not include any applicable sales charges (loads). If these transaction costs had been included, your costs would have been higher. |
Portfolio of Investments
2/28/23 (unaudited)
The Portfolio of Investments is a complete list of all securities owned by your fund. It is categorized by broad-based asset classes.
| Issuer | | | Shares/Par | Value ($) |
| Common Stocks – 95.1% |
| Aerospace & Defense – 2.5% | |
| AeroVironment, Inc. (a) | | 134,444 | $11,527,228 |
| CACI International, Inc., “A” (a) | | 75,361 | 22,080,773 |
| KBR, Inc. | | 328,646 | 18,111,681 |
| Kratos Defense & Security Solutions, Inc. (a) | | 649,764 | 8,219,515 |
| | | | | $59,939,197 |
| Apparel Manufacturers – 2.3% | |
| On Holding AG (a) | | 862,886 | $18,871,317 |
| Skechers USA, Inc., “A” (a) | | 801,703 | 35,683,800 |
| | | | | $54,555,117 |
| Automotive – 2.7% | |
| Methode Electronics, Inc. | | 643,993 | $31,381,779 |
| Visteon Corp. (a) | | 197,053 | 32,915,733 |
| | | | | $64,297,512 |
| Biotechnology – 3.1% | |
| Abcam PLC, ADR (a) | | 1,751,097 | $25,233,308 |
| Adaptive Biotechnologies Corp. (a) | | 996,350 | 8,518,793 |
| AlloVir, Inc. (a) | | 533,582 | 3,601,679 |
| BioAtla, Inc. (a) | | 339,507 | 1,011,731 |
| BioXcel Therapeutics, Inc. (a)(l) | | 235,349 | 7,512,340 |
| Immunocore Holdings PLC, ADR (a) | | 233,584 | 12,812,082 |
| Lyell Immunopharma, Inc. (a) | | 676,627 | 1,454,748 |
| MaxCyte, Inc. (a) | | 1,271,360 | 5,771,974 |
| Oxford Nanopore Technologies PLC (a) | | 2,232,941 | 5,613,516 |
| Prelude Therapeutics, Inc. (a)(l) | | 327,699 | 1,854,776 |
| Sana Biotechnology, Inc. (a)(l) | | 522,248 | 1,916,650 |
| | | | | $75,301,597 |
| Brokerage & Asset Managers – 3.7% | |
| GCM Grosvenor, Inc., “A” (h) | | 2,116,336 | $17,417,445 |
| Hamilton Lane, Inc., “A” | | 495,575 | 38,555,735 |
| WisdomTree Investments, Inc. | | 5,650,495 | 33,733,455 |
| | | | | $89,706,635 |
| Business Services – 10.1% | |
| ExlService Holdings, Inc. (a) | | 279,875 | $46,042,236 |
| Keywords Studios PLC | | 768,889 | 26,746,893 |
| Payoneer Global, Inc. (a) | | 3,184,764 | 18,471,631 |
| Remitly Global, Inc. (a) | | 1,647,434 | 24,101,960 |
Portfolio of Investments (unaudited) – continued
| Issuer | | | Shares/Par | Value ($) |
| Common Stocks – continued |
| Business Services – continued | |
| TaskUs, Inc., “A” (a) | | 1,482,411 | $25,504,881 |
| Thoughtworks Holding, Inc. (a) | | 3,649,285 | 26,858,738 |
| TriNet Group, Inc. (a) | | 203,067 | 16,828,162 |
| WNS (Holdings) Ltd., ADR (a) | | 648,626 | 56,378,572 |
| | | | | $240,933,073 |
| Chemicals – 3.7% | |
| Element Solutions, Inc. | | 2,232,538 | $45,856,331 |
| Ingevity Corp. (a) | | 517,800 | 42,749,568 |
| | | | | $88,605,899 |
| Computer Software – 7.3% | |
| Alkami Technology, Inc. (a) | | 1,620,458 | $24,890,235 |
| Definitive Healthcare Corp. (a) | | 1,283,153 | 14,653,607 |
| DoubleVerify Holdings, Inc. (a) | | 788,185 | 20,705,620 |
| Kinaxis, Inc. (a) | | 158,707 | 18,443,510 |
| nCino, Inc. (a) | | 465,482 | 12,684,384 |
| Paycor HCM, Inc. (a) | | 836,240 | 20,713,665 |
| Paylocity Holding Corp. (a) | | 74,840 | 14,414,932 |
| Procore Technologies, Inc. (a) | | 438,610 | 29,382,484 |
| Sabre Corp. (a) | | 3,669,034 | 18,565,312 |
| | | | | $174,453,749 |
| Computer Software - Systems – 3.9% | |
| Five9, Inc. (a) | | 424,821 | $28,038,186 |
| Nuvei Corp. (a) | | 712,456 | 21,836,777 |
| Q2 Holdings, Inc. (a) | | 748,892 | 24,174,234 |
| Rapid7, Inc. (a) | | 408,208 | 19,308,238 |
| | | | | $93,357,435 |
| Construction – 1.2% | |
| AZEK Co., Inc. (a) | | 705,519 | $16,995,953 |
| Trex Co., Inc. (a) | | 219,997 | 11,248,446 |
| | | | | $28,244,399 |
| Consumer Services – 2.8% | |
| Boyd Group Services, Inc. | | 138,159 | $21,858,384 |
| Bright Horizons Family Solutions, Inc. (a) | | 300,276 | 23,673,760 |
| European Wax Center, Inc., “A” | | 1,181,602 | 21,812,373 |
| | | | | $67,344,517 |
Portfolio of Investments (unaudited) – continued
| Issuer | | | Shares/Par | Value ($) |
| Common Stocks – continued |
| Electrical Equipment – 3.3% | |
| Littlefuse, Inc. | | 93,378 | $24,159,690 |
| Sensata Technologies Holding PLC | | 1,077,763 | 54,513,252 |
| | | | | $78,672,942 |
| Electronics – 2.2% | |
| Advanced Energy Industries, Inc. | | 285,621 | $26,585,603 |
| Allegro MicroSystems, Inc. (a) | | 252,567 | 11,032,126 |
| Formfactor, Inc. (a) | | 460,306 | 13,855,211 |
| | | | | $51,472,940 |
| Energy - Independent – 3.0% | |
| Magnolia Oil & Gas Corp., “A” | | 1,548,367 | $33,831,819 |
| Matador Resources Co. | | 705,908 | 37,970,791 |
| | | | | $71,802,610 |
| Energy - Renewables – 0.2% | |
| Nextracker, Inc. “A” (a) | | 186,401 | $5,674,046 |
| Engineering - Construction – 1.5% | |
| Jacobs Solutions, Inc. | | 296,524 | $35,434,618 |
| Entertainment – 1.5% | |
| Manchester United PLC, “A” | | 882,713 | $18,316,295 |
| Vivid Seats, Inc., “A” (a)(l) | | 2,404,038 | 18,438,971 |
| | | | | $36,755,266 |
| Food & Beverages – 1.2% | |
| Duckhorn Portfolio, Inc. (a) | | 1,630,416 | $24,863,844 |
| Oatly Group AB, ADR (a)(l) | | 2,066,025 | 4,545,255 |
| | | | | $29,409,099 |
| Gaming & Lodging – 2.1% | |
| Genius Sports Ltd. (a) | | 2,578,078 | $12,477,898 |
| Penn Entertainment, Inc. (a) | | 1,274,225 | 38,902,089 |
| | | | | $51,379,987 |
| General Merchandise – 3.0% | |
| Five Below, Inc. (a) | | 144,089 | $29,437,383 |
| Ollie's Bargain Outlet Holdings, Inc. (a) | | 717,916 | 41,308,886 |
| | | | | $70,746,269 |
Portfolio of Investments (unaudited) – continued
| Issuer | | | Shares/Par | Value ($) |
| Common Stocks – continued |
| Leisure & Toys – 2.4% | |
| Brunswick Corp. | | 444,708 | $38,876,373 |
| Corsair Gaming, Inc. (a) | | 438,531 | 7,674,293 |
| Funko, Inc., “A” (a) | | 926,642 | 10,017,000 |
| | | | | $56,567,666 |
| Machinery & Tools – 1.9% | |
| Ritchie Bros. Auctioneers, Inc. | | 732,126 | $44,784,147 |
| Medical & Health Technology & Services – 1.9% | |
| Certara, Inc. (a) | | 1,257,014 | $22,777,094 |
| HealthEquity, Inc. (a) | | 351,219 | 22,888,942 |
| | | | | $45,666,036 |
| Medical Equipment – 7.7% | |
| Bruker BioSciences Corp. | | 459,545 | $31,671,841 |
| CryoPort, Inc. (a) | | 608,616 | 13,182,623 |
| Envista Holdings Corp. (a) | | 1,152,905 | 44,571,307 |
| Gerresheimer AG | | 369,442 | 32,491,583 |
| Maravai Lifesciences Holdings, Inc., “A” (a) | | 701,825 | 10,351,919 |
| OptiNose, Inc. (a)(l) | | 1,816,449 | 3,269,608 |
| Outset Medical, Inc. (a) | | 332,810 | 7,591,396 |
| PROCEPT BioRobotics Corp. (a) | | 235,181 | 8,807,529 |
| Shockwave Medical, Inc. (a) | | 96,560 | 18,369,574 |
| Silk Road Medical, Inc. (a) | | 249,482 | 13,220,051 |
| | | | | $183,527,431 |
| Oil Services – 4.3% | |
| Cactus, Inc., “A” | | 736,489 | $33,841,670 |
| ChampionX Corp. | | 2,265,342 | 69,251,505 |
| | | | | $103,093,175 |
| Other Banks & Diversified Financials – 3.0% | |
| First Interstate BancSystem, Inc. | | 336,923 | $11,974,243 |
| Pacific Premier Bancorp, Inc. | | 499,533 | 16,194,860 |
| Prosperity Bancshares, Inc. | | 245,525 | 18,043,632 |
| Umpqua Holdings Corp. | | 827,357 | 14,611,125 |
| United Community Bank, Inc. | | 306,007 | 10,131,892 |
| | | | | $70,955,752 |
| Pharmaceuticals – 2.6% | |
| Annexon, Inc. (a) | | 495,468 | $2,640,844 |
| Collegium Pharmaceutical, Inc. (a) | | 432,733 | 11,480,407 |
| Harmony Biosciences Holdings (a) | | 266,213 | 11,721,358 |
| Kymera Therapeutics, Inc. (a) | | 167,567 | 5,258,253 |
| Legend Biotech Corp., ADR (a) | | 205,596 | 9,494,423 |
Portfolio of Investments (unaudited) – continued
| Issuer | | | Shares/Par | Value ($) |
| Common Stocks – continued |
| Pharmaceuticals – continued | |
| Neurocrine Biosciences, Inc. (a) | | 108,893 | $11,226,868 |
| SpringWorks Therapeutics, Inc. (a) | | 311,291 | 9,930,183 |
| | | | | $61,752,336 |
| Pollution Control – 2.2% | |
| GFL Environmental, Inc. | | 1,753,396 | $53,250,637 |
| Real Estate – 1.6% | |
| STAG Industrial, Inc., REIT | | 1,115,651 | $37,530,500 |
| Specialty Chemicals – 2.5% | |
| Axalta Coating Systems Ltd. (a) | | 1,546,757 | $46,093,359 |
| Univar Solutions, Inc. (a) | | 417,800 | 14,518,550 |
| | | | | $60,611,909 |
| Specialty Stores – 2.0% | |
| ACV Auctions, Inc. (a) | | 1,404,359 | $17,189,354 |
| Leslie's, Inc. (a) | | 920,111 | 11,602,600 |
| Petco Health & Wellness Co., Inc. (a) | | 1,950,961 | 20,094,898 |
| | | | | $48,886,852 |
| Trucking – 1.7% | |
| Knight-Swift Transportation Holdings, Inc. | | 495,967 | $28,190,764 |
| Saia, Inc. (a) | | 44,296 | 11,998,458 |
| | | | | $40,189,222 |
| Total Common Stocks (Identified Cost, $2,332,499,691) | | $2,274,902,570 |
| | Strike
Price | First
Exercise | | |
| Warrants – 0.0% | | | | |
| Medical Equipment – 0.0% |
| OptiNose, Inc. (1 share for 1 warrant, Expiration 11/23/27) (a) (Identified Cost, $6,275) | $2.565 | 11/23/22 | 627,544 | $0 |
Portfolio of Investments (unaudited) – continued
| Issuer | | | Shares/Par | Value ($) |
| Investment Companies (h) – 5.0% |
| Money Market Funds – 5.0% | |
| MFS Institutional Money Market Portfolio, 4.55% (v) (Identified Cost, $118,713,187) | | | 118,722,103 | $118,722,103 |
| Collateral for Securities Loaned – 0.1% |
| State Street Navigator Securities Lending Government Money Market Portfolio, 4.59% (j) (Identified Cost, $3,408,244) | | | 3,408,244 | $3,408,244 |
|
|
| Other Assets, Less Liabilities – (0.2)% | | (4,967,595) |
| Net Assets – 100.0% | $2,392,065,322 |
| (a) | Non-income producing security. | | | |
| (h) | An affiliated issuer, which may be considered one in which the fund owns 5% or more of the outstanding voting securities, or a company which is under common control. At period end, the aggregate values of the fund's investments in affiliated issuers and in unaffiliated issuers were $136,139,548 and $2,260,893,369, respectively. | | | |
| (j) | The rate quoted is the annualized seven-day yield of the fund at period end. | | | |
| (l) | A portion of this security is on loan. See Note 2 for additional information. | | | |
| (v) | Affiliated issuer that is available only to investment companies managed by MFS. The rate quoted for the MFS Institutional Money Market Portfolio is the annualized seven-day yield of the fund at period end. | | | |
| The following abbreviations are used in this report and are defined: |
| ADR | American Depositary Receipt |
| REIT | Real Estate Investment Trust |
See Notes to Financial Statements
Financial Statements
Statement of Assets and Liabilities
At 2/28/23 (unaudited)
This statement represents your fund’s balance sheet, which details the assets and liabilities comprising the total value of the fund.
| Assets | |
| Investments in unaffiliated issuers, at value, including $4,970,185 of securities on loan (identified cost, $2,312,529,232) | $2,260,893,369 |
| Investments in affiliated issuers, at value (identified cost, $142,098,165) | 136,139,548 |
| Receivables for | |
| Investments sold | 13,743,809 |
| Fund shares sold | 2,096,759 |
| Interest and dividends | 1,947,923 |
| Other assets | 51,798 |
| Total assets | $2,414,873,206 |
| Liabilities | |
| Payables for | |
| Investments purchased | $15,477,690 |
| Fund shares reacquired | 3,157,059 |
| Collateral for securities loaned, at value (c) | 3,408,244 |
| Payable to affiliates | |
| Investment adviser | 109,433 |
| Administrative services fee | 2,031 |
| Shareholder servicing costs | 358,754 |
| Distribution and service fees | 14,339 |
| Payable for independent Trustees' compensation | 6,208 |
| Accrued expenses and other liabilities | 274,126 |
| Total liabilities | $22,807,884 |
| Net assets | $2,392,065,322 |
| Net assets consist of | |
| Paid-in capital | $2,837,632,730 |
| Total distributable earnings (loss) | (445,567,408) |
| Net assets | $2,392,065,322 |
| Shares of beneficial interest outstanding | 96,156,406 |
| (c) | Non-cash collateral is not included. |
Statement of Assets and Liabilities (unaudited) – continued
| | Net assets | Shares
outstanding | Net asset value
per share (a) |
| Class A | $746,186,749 | 33,522,116 | $22.26 |
| Class B | 5,608,762 | 416,892 | 13.45 |
| Class C | 27,341,173 | 2,021,965 | 13.52 |
| Class I | 306,642,124 | 11,326,714 | 27.07 |
| Class R1 | 3,219,619 | 243,759 | 13.21 |
| Class R2 | 19,310,101 | 992,794 | 19.45 |
| Class R3 | 112,553,079 | 5,069,016 | 22.20 |
| Class R4 | 42,091,151 | 1,696,614 | 24.81 |
| Class R6 | 1,129,112,564 | 40,866,536 | 27.63 |
| (a) | Maximum offering price per share was equal to the net asset value per share for all share classes, except for Class A, for which the maximum offering price per share was $23.62 [100 / 94.25 x $22.26]. On sales of $50,000 or more, the maximum offering price of Class A shares is reduced. A contingent deferred sales charge may be imposed on redemptions of Class A, Class B, and Class C shares. Redemption price per share was equal to the net asset value per share for Classes I, R1, R2, R3, R4, and R6. |
See Notes to Financial Statements
Financial Statements
Statement of Operations
Six months ended 2/28/23 (unaudited)
This statement describes how much your fund earned in investment income and accrued in expenses. It also describes any gains and/or losses generated by fund operations.
| Net investment income (loss) | |
| Income | |
| Dividends | $6,290,991 |
| Dividends from affiliated issuers | 2,594,033 |
| Other | 92,332 |
| Income on securities loaned | 38,764 |
| Foreign taxes withheld | (61,795) |
| Total investment income | $8,954,325 |
| Expenses | |
| Management fee | $9,604,977 |
| Distribution and service fees | 1,255,271 |
| Shareholder servicing costs | 1,008,096 |
| Administrative services fee | 173,624 |
| Independent Trustees' compensation | 18,073 |
| Custodian fee | 72,662 |
| Shareholder communications | 125,187 |
| Audit and tax fees | 34,292 |
| Legal fees | 5,695 |
| Miscellaneous | 127,734 |
| Total expenses | $12,425,611 |
| Reduction of expenses by investment adviser and distributor | (152,250) |
| Net expenses | $12,273,361 |
| Net investment income (loss) | $(3,319,036) |
| Realized and unrealized gain (loss) |
| Realized gain (loss) (identified cost basis) | |
| Unaffiliated issuers | $(259,474,630) |
| Affiliated issuers | 9,868 |
| Foreign currency | (30,077) |
| Net realized gain (loss) | $(259,494,839) |
| Change in unrealized appreciation or depreciation | |
| Unaffiliated issuers | $358,204,671 |
| Affiliated issuers | 803,693 |
| Translation of assets and liabilities in foreign currencies | 15,607 |
| Net unrealized gain (loss) | $359,023,971 |
| Net realized and unrealized gain (loss) | $99,529,132 |
| Change in net assets from operations | $96,210,096 |
See Notes to Financial Statements
Financial Statements
Statements of Changes in Net Assets
These statements describe the increases and/or decreases in net assets resulting from operations, any distributions, and any shareholder transactions.
| | Six months ended | Year ended |
| | 2/28/23
(unaudited) | 8/31/22 |
| Change in net assets | | |
| From operations | | |
| Net investment income (loss) | $(3,319,036) | $(16,390,152) |
| Net realized gain (loss) | (259,494,839) | (9,691,683) |
| Net unrealized gain (loss) | 359,023,971 | (1,178,150,037) |
| Change in net assets from operations | $96,210,096 | $(1,204,231,872) |
| Total distributions to shareholders | $(2,232,789) | $(586,440,707) |
| Change in net assets from fund share transactions | $(50,041,956) | $777,734,354 |
| Total change in net assets | $43,935,351 | $(1,012,938,225) |
| Net assets | | |
| At beginning of period | 2,348,129,971 | 3,361,068,196 |
| At end of period | $2,392,065,322 | $2,348,129,971 |
See Notes to Financial Statements
Financial Statements
Financial Highlights
The financial highlights table is intended to help you understand the fund's financial performance for the semiannual period and the past 5 fiscal years. Certain information reflects financial results for a single fund share. The total returns in the table represent the rate that an investor would have earned (or lost) on an investment in the fund share class (assuming reinvestment of all distributions) held for the entire period.
| Class A | Six months
ended | Year ended |
| | 2/28/23
(unaudited) | 8/31/22 | 8/31/21 | 8/31/20 | 8/31/19 | 8/31/18 |
| Net asset value, beginning of period | $21.40 | $40.53 | $32.45 | $27.56 | $33.30 | $27.27 |
| Income (loss) from investment operations |
| Net investment income (loss) (d) | $(0.05) | $(0.21) | $(0.23) | $(0.18) | $(0.19) | $(0.23) |
| Net realized and unrealized gain (loss) | 0.93 | (11.52) | 12.20 | 7.31 | 0.06(g) | 9.07 |
| Total from investment operations | $0.88 | $(11.73) | $11.97 | $7.13 | $(0.13) | $8.84 |
| Less distributions declared to shareholders |
| From net realized gain | $(0.02) | $(7.40) | $(3.89) | $(2.24) | $(5.61) | $(2.81) |
| Net asset value, end of period (x) | $22.26 | $21.40 | $40.53 | $32.45 | $27.56 | $33.30 |
| Total return (%) (r)(s)(t)(x) | 4.13(n) | (34.20) | 39.23 | 27.51 | 3.49 | 34.98 |
Ratios (%) (to average net assets)
and Supplemental data: |
| Expenses before expense reductions | 1.29(a) | 1.25 | 1.23 | 1.29 | 1.30 | 1.33 |
| Expenses after expense reductions | 1.28(a) | 1.24 | 1.22 | 1.27 | 1.29 | 1.31 |
| Net investment income (loss) | (0.50)(a) | (0.78) | (0.63) | (0.66) | (0.70) | (0.80) |
| Portfolio turnover | 27(n) | 58 | 71 | 64 | 69 | 67 |
| Net assets at end of period (000 omitted) | $746,187 | $746,682 | $1,171,166 | $755,202 | $549,660 | $525,698 |
See Notes to Financial Statements
Financial Highlights – continued
| Class B | Six months
ended | Year ended |
| | 2/28/23
(unaudited) | 8/31/22 | 8/31/21 | 8/31/20 | 8/31/19 | 8/31/18 |
| Net asset value, beginning of period | $12.99 | $27.92 | $23.55 | $20.72 | $26.86 | $22.65 |
| Income (loss) from investment operations |
| Net investment income (loss) (d) | $(0.08) | $(0.28) | $(0.36) | $(0.28) | $(0.30) | $(0.37) |
| Net realized and unrealized gain (loss) | 0.56 | (7.25) | 8.62 | 5.35 | (0.23)(g) | 7.39 |
| Total from investment operations | $0.48 | $(7.53) | $8.26 | $5.07 | $(0.53) | $7.02 |
| Less distributions declared to shareholders |
| From net realized gain | $(0.02) | $(7.40) | $(3.89) | $(2.24) | $(5.61) | $(2.81) |
| Net asset value, end of period (x) | $13.45 | $12.99 | $27.92 | $23.55 | $20.72 | $26.86 |
| Total return (%) (r)(s)(t)(x) | 3.73(n) | (34.71) | 38.19 | 26.58 | 2.69 | 34.00 |
Ratios (%) (to average net assets)
and Supplemental data: |
| Expenses before expense reductions | 2.04(a) | 2.00 | 1.99 | 2.04 | 2.06 | 2.08 |
| Expenses after expense reductions | 2.03(a) | 1.98 | 1.98 | 2.02 | 2.04 | 2.06 |
| Net investment income (loss) | (1.26)(a) | (1.58) | (1.40) | (1.40) | (1.45) | (1.55) |
| Portfolio turnover | 27(n) | 58 | 71 | 64 | 69 | 67 |
| Net assets at end of period (000 omitted) | $5,609 | $6,854 | $16,701 | $16,502 | $18,708 | $23,424 |
| Class C | Six months
ended | Year ended |
| | 2/28/23
(unaudited) | 8/31/22 | 8/31/21 | 8/31/20 | 8/31/19 | 8/31/18 |
| Net asset value, beginning of period | $13.05 | $28.02 | $23.62 | $20.78 | $26.91 | $22.70 |
| Income (loss) from investment operations |
| Net investment income (loss) (d) | $(0.08) | $(0.27) | $(0.36) | $(0.28) | $(0.30) | $(0.37) |
| Net realized and unrealized gain (loss) | 0.57 | (7.30) | 8.65 | 5.36 | (0.22)(g) | 7.39 |
| Total from investment operations | $0.49 | $(7.57) | $8.29 | $5.08 | $(0.52) | $7.02 |
| Less distributions declared to shareholders |
| From net realized gain | $(0.02) | $(7.40) | $(3.89) | $(2.24) | $(5.61) | $(2.81) |
| Net asset value, end of period (x) | $13.52 | $13.05 | $28.02 | $23.62 | $20.78 | $26.91 |
| Total return (%) (r)(s)(t)(x) | 3.79(n) | (34.73) | 38.21 | 26.55 | 2.72 | 33.92 |
Ratios (%) (to average net assets)
and Supplemental data: |
| Expenses before expense reductions | 2.04(a) | 2.00 | 1.99 | 2.04 | 2.05 | 2.08 |
| Expenses after expense reductions | 2.03(a) | 1.98 | 1.98 | 2.03 | 2.04 | 2.07 |
| Net investment income (loss) | (1.25)(a) | (1.56) | (1.40) | (1.41) | (1.45) | (1.55) |
| Portfolio turnover | 27(n) | 58 | 71 | 64 | 69 | 67 |
| Net assets at end of period (000 omitted) | $27,341 | $29,033 | $56,833 | $58,057 | $59,253 | $69,498 |
See Notes to Financial Statements
Financial Highlights – continued
| Class I | Six months
ended | Year ended |
| | 2/28/23
(unaudited) | 8/31/22 | 8/31/21 | 8/31/20 | 8/31/19 | 8/31/18 |
| Net asset value, beginning of period | $25.98 | $47.41 | $37.30 | $31.29 | $36.82 | $29.81 |
| Income (loss) from investment operations |
| Net investment income (loss) (d) | $(0.03) | $(0.19) | $(0.16) | $(0.14) | $(0.14) | $(0.18) |
| Net realized and unrealized gain (loss) | 1.14 | (13.84) | 14.16 | 8.39 | 0.22(g) | 10.00 |
| Total from investment operations | $1.11 | $(14.03) | $14.00 | $8.25 | $0.08 | $9.82 |
| Less distributions declared to shareholders |
| From net realized gain | $(0.02) | $(7.40) | $(3.89) | $(2.24) | $(5.61) | $(2.81) |
| Net asset value, end of period (x) | $27.07 | $25.98 | $47.41 | $37.30 | $31.29 | $36.82 |
| Total return (%) (r)(s)(t)(x) | 4.29(n) | (34.07) | 39.60 | 27.83 | 3.76 | 35.31 |
Ratios (%) (to average net assets)
and Supplemental data: |
| Expenses before expense reductions | 1.04(a) | 1.00 | 0.98 | 1.04 | 1.05 | 1.08 |
| Expenses after expense reductions | 1.03(a) | 0.98 | 0.97 | 1.03 | 1.05 | 1.07 |
| Net investment income (loss) | (0.25)(a) | (0.56) | (0.37) | (0.43) | (0.45) | (0.55) |
| Portfolio turnover | 27(n) | 58 | 71 | 64 | 69 | 67 |
| Net assets at end of period (000 omitted) | $306,642 | $328,438 | $621,379 | $331,177 | $164,593 | $180,591 |
| Class R1 | Six months
ended | Year ended |
| | 2/28/23
(unaudited) | 8/31/22 | 8/31/21 | 8/31/20 | 8/31/19 | 8/31/18 |
| Net asset value, beginning of period | $12.75 | $27.56 | $23.29 | $20.51 | $26.66 | $22.50 |
| Income (loss) from investment operations |
| Net investment income (loss) (d) | $(0.08) | $(0.26) | $(0.35) | $(0.28) | $(0.30) | $(0.37) |
| Net realized and unrealized gain (loss) | 0.56 | (7.15) | 8.51 | 5.30 | (0.24)(g) | 7.34 |
| Total from investment operations | $0.48 | $(7.41) | $8.16 | $5.02 | $(0.54) | $6.97 |
| Less distributions declared to shareholders |
| From net realized gain | $(0.02) | $(7.40) | $(3.89) | $(2.24) | $(5.61) | $(2.81) |
| Net asset value, end of period (x) | $13.21 | $12.75 | $27.56 | $23.29 | $20.51 | $26.66 |
| Total return (%) (r)(s)(t)(x) | 3.80(n) | (34.73) | 38.20 | 26.61 | 2.67 | 34.01 |
Ratios (%) (to average net assets)
and Supplemental data: |
| Expenses before expense reductions | 2.04(a) | 2.00 | 1.99 | 2.04 | 2.05 | 2.08 |
| Expenses after expense reductions | 2.03(a) | 1.99 | 1.97 | 2.03 | 2.05 | 2.07 |
| Net investment income (loss) | (1.25)(a) | (1.54) | (1.39) | (1.41) | (1.45) | (1.55) |
| Portfolio turnover | 27(n) | 58 | 71 | 64 | 69 | 67 |
| Net assets at end of period (000 omitted) | $3,220 | $3,296 | $5,923 | $4,946 | $4,652 | $5,342 |
See Notes to Financial Statements
Financial Highlights – continued
| Class R2 | Six months
ended | Year ended |
| | 2/28/23
(unaudited) | 8/31/22 | 8/31/21 | 8/31/20 | 8/31/19 | 8/31/18 |
| Net asset value, beginning of period | $18.72 | $36.54 | $29.65 | $25.42 | $31.31 | $25.85 |
| Income (loss) from investment operations |
| Net investment income (loss) (d) | $(0.07) | $(0.26) | $(0.30) | $(0.23) | $(0.24) | $(0.29) |
| Net realized and unrealized gain (loss) | 0.82 | (10.16) | 11.08 | 6.70 | (0.04)(g) | 8.56 |
| Total from investment operations | $0.75 | $(10.42) | $10.78 | $6.47 | $(0.28) | $8.27 |
| Less distributions declared to shareholders |
| From net realized gain | $(0.02) | $(7.40) | $(3.89) | $(2.24) | $(5.61) | $(2.81) |
| Net asset value, end of period (x) | $19.45 | $18.72 | $36.54 | $29.65 | $25.42 | $31.31 |
| Total return (%) (r)(s)(t)(x) | 4.03(n) | (34.38) | 38.89 | 27.21 | 3.19 | 34.68 |
Ratios (%) (to average net assets)
and Supplemental data: |
| Expenses before expense reductions | 1.54(a) | 1.50 | 1.49 | 1.54 | 1.56 | 1.58 |
| Expenses after expense reductions | 1.53(a) | 1.48 | 1.47 | 1.53 | 1.54 | 1.57 |
| Net investment income (loss) | (0.74)(a) | (1.05) | (0.89) | (0.90) | (0.95) | (1.05) |
| Portfolio turnover | 27(n) | 58 | 71 | 64 | 69 | 67 |
| Net assets at end of period (000 omitted) | $19,310 | $18,975 | $34,688 | $30,149 | $32,381 | $36,272 |
| Class R3 | Six months
ended | Year ended |
| | 2/28/23
(unaudited) | 8/31/22 | 8/31/21 | 8/31/20 | 8/31/19 | 8/31/18 |
| Net asset value, beginning of period | $21.34 | $40.45 | $32.39 | $27.51 | $33.26 | $27.24 |
| Income (loss) from investment operations |
| Net investment income (loss) (d) | $(0.05) | $(0.21) | $(0.22) | $(0.18) | $(0.19) | $(0.24) |
| Net realized and unrealized gain (loss) | 0.93 | (11.50) | 12.17 | 7.30 | 0.05(g) | 9.07 |
| Total from investment operations | $0.88 | $(11.71) | $11.95 | $7.12 | $(0.14) | $8.83 |
| Less distributions declared to shareholders |
| From net realized gain | $(0.02) | $(7.40) | $(3.89) | $(2.24) | $(5.61) | $(2.81) |
| Net asset value, end of period (x) | $22.20 | $21.34 | $40.45 | $32.39 | $27.51 | $33.26 |
| Total return (%) (r)(s)(t)(x) | 4.14(n) | (34.22) | 39.24 | 27.52 | 3.45 | 34.98 |
Ratios (%) (to average net assets)
and Supplemental data: |
| Expenses before expense reductions | 1.29(a) | 1.25 | 1.23 | 1.29 | 1.30 | 1.33 |
| Expenses after expense reductions | 1.28(a) | 1.24 | 1.22 | 1.28 | 1.30 | 1.32 |
| Net investment income (loss) | (0.49)(a) | (0.78) | (0.61) | (0.67) | (0.70) | (0.80) |
| Portfolio turnover | 27(n) | 58 | 71 | 64 | 69 | 67 |
| Net assets at end of period (000 omitted) | $112,553 | $109,206 | $178,005 | $71,489 | $52,559 | $50,895 |
See Notes to Financial Statements
Financial Highlights – continued
| Class R4 | Six months
ended | Year ended |
| | 2/28/23
(unaudited) | 8/31/22 | 8/31/21 | 8/31/20 | 8/31/19 | 8/31/18 |
| Net asset value, beginning of period | $23.81 | $44.11 | $34.94 | $29.44 | $35.05 | $28.48 |
| Income (loss) from investment operations |
| Net investment income (loss) (d) | $(0.02) | $(0.16) | $(0.15) | $(0.13) | $(0.13) | $(0.15) |
| Net realized and unrealized gain (loss) | 1.04 | (12.74) | 13.21 | 7.87 | 0.13(g) | 9.53 |
| Total from investment operations | $1.02 | $(12.90) | $13.06 | $7.74 | $0.00(w) | $9.38 |
| Less distributions declared to shareholders |
| From net realized gain | $(0.02) | $(7.40) | $(3.89) | $(2.24) | $(5.61) | $(2.81) |
| Net asset value, end of period (x) | $24.81 | $23.81 | $44.11 | $34.94 | $29.44 | $35.05 |
| Total return (%) (r)(s)(t)(x) | 4.30(n) | (34.06) | 39.58 | 27.84 | 3.72 | 35.42 |
Ratios (%) (to average net assets)
and Supplemental data: |
| Expenses before expense reductions | 1.04(a) | 1.00 | 0.99 | 1.04 | 1.05 | 1.08 |
| Expenses after expense reductions | 1.03(a) | 0.99 | 0.97 | 1.03 | 1.05 | 1.07 |
| Net investment income (loss) | (0.19)(a) | (0.52) | (0.37) | (0.43) | (0.45) | (0.51) |
| Portfolio turnover | 27(n) | 58 | 71 | 64 | 69 | 67 |
| Net assets at end of period (000 omitted) | $42,091 | $17,820 | $27,863 | $16,509 | $8,384 | $10,612 |
| Class R6 | Six months
ended | Year ended |
| | 2/28/23
(unaudited) | 8/31/22 | 8/31/21 | 8/31/20 | 8/31/19 | 8/31/18 |
| Net asset value, beginning of period | $26.50 | $48.14 | $37.79 | $31.64 | $37.13 | $30.01 |
| Income (loss) from investment operations |
| Net investment income (loss) (d) | $(0.01) | $(0.12) | $(0.12) | $(0.10) | $(0.11) | $(0.14) |
| Net realized and unrealized gain (loss) | 1.16 | (14.12) | 14.36 | 8.49 | 0.23(g) | 10.07 |
| Total from investment operations | $1.15 | $(14.24) | $14.24 | $8.39 | $0.12 | $9.93 |
| Less distributions declared to shareholders |
| From net realized gain | $(0.02) | $(7.40) | $(3.89) | $(2.24) | $(5.61) | $(2.81) |
| Net asset value, end of period (x) | $27.63 | $26.50 | $48.14 | $37.79 | $31.64 | $37.13 |
| Total return (%) (r)(s)(t)(x) | 4.36(n) | (33.98) | 39.73 | 27.97 | 3.85 | 35.45 |
Ratios (%) (to average net assets)
and Supplemental data: |
| Expenses before expense reductions | 0.91(a) | 0.89 | 0.89 | 0.94 | 0.96 | 0.97 |
| Expenses after expense reductions | 0.89(a) | 0.88 | 0.88 | 0.92 | 0.95 | 0.96 |
| Net investment income (loss) | (0.11)(a) | (0.36) | (0.28) | (0.32) | (0.35) | (0.44) |
| Portfolio turnover | 27(n) | 58 | 71 | 64 | 69 | 67 |
| Net assets at end of period (000 omitted) | $1,129,113 | $1,087,826 | $1,248,511 | $795,613 | $541,266 | $477,818 |
See Notes to Financial Statements
Financial Highlights – continued
| (a) | Annualized. |
| (d) | Per share data is based on average shares outstanding. |
| (g) | The per share amount varies from the net realized and unrealized gain/loss for the period because of the timing of sales of fund shares and the per share amount of realized and unrealized gains and losses at such time. |
| (n) | Not annualized. |
| (r) | Certain expenses have been reduced without which performance would have been lower. |
| (s) | From time to time the fund may receive proceeds from litigation settlements, without which performance would be lower. |
| (t) | Total returns do not include any applicable sales charges. |
| (w) | Per share amount was less than $0.01. |
| (x) | The net asset values and total returns have been calculated on net assets which include adjustments made in accordance with U.S. generally accepted accounting principles required at period end for financial reporting purposes. |
See Notes to Financial Statements
Notes to Financial Statements
(unaudited)
(1) Business and Organization
MFS New Discovery Fund (the fund) is a diversified series of MFS Series Trust I (the trust). The trust is organized as a Massachusetts business trust and is registered under the Investment Company Act of 1940, as amended, as an open-end management investment company.
The fund is an investment company and accordingly follows the investment company accounting and reporting guidance of the Financial Accounting Standards Board (FASB) Accounting Standards Codification Topic 946 Financial Services - Investment Companies.
(2) Significant Accounting Policies
General — The preparation of financial statements in conformity with U.S. generally accepted accounting principles requires management to make estimates and assumptions that affect the reported amounts of assets and liabilities, and disclosure of contingent assets and liabilities at the date of the financial statements and the reported amounts of increases and decreases in net assets from operations during the reporting period. Actual results could differ from those estimates. In the preparation of these financial statements, management has evaluated subsequent events occurring after the date of the fund’s Statement of Assets and Liabilities through the date that the financial statements were issued. The fund will generally focus on securities of small size companies which may be more volatile than those of larger companies. The fund invests in foreign securities. Investments in foreign securities are vulnerable to the effects of changes in the relative values of the local currency and the U.S. dollar and to the effects of changes in each country’s market, economic, industrial, political, regulatory, geopolitical, environmental, public health, and other conditions.
Balance Sheet Offsetting — The fund's accounting policy with respect to balance sheet offsetting is that, absent an event of default by the counterparty or a termination of the agreement, the International Swaps and Derivatives Association (ISDA) Master Agreement, or similar agreement, does not result in an offset of reported amounts of financial assets and financial liabilities in the Statement of Assets and Liabilities across transactions between the fund and the applicable counterparty. The fund's right to setoff may be restricted or prohibited by the bankruptcy or insolvency laws of the particular jurisdiction to which a specific master netting agreement counterparty is subject. Balance sheet offsetting disclosures, to the extent applicable to the fund, have been included in the fund’s Significant Accounting Policies note under the captions for each of the fund’s in-scope financial instruments and transactions.
Investment Valuations — Subject to its oversight, the fund's Board of Trustees has delegated primary responsibility for determining or causing to be determined the value of the fund’s investments to MFS as the fund's adviser, pursuant to the fund’s valuation policy and procedures which have been adopted by the adviser and approved by the Board. Effective September 8, 2022, and in accordance with Rule 2a-5 under the Investment Company Act of 1940, the Board of Trustees designated the adviser as the “valuation designee” of the fund. If the adviser, as valuation designee, determines that reliable market quotations are not readily available for an investment, the investment is valued at fair value as determined in good faith by the adviser in accordance with the adviser’s fair valuation policy and procedures.
Notes to Financial Statements (unaudited) - continued
Under the fund's valuation policy and procedures, equity securities, including restricted equity securities, are generally valued at the last sale or official closing price on their primary market or exchange as provided by a third-party pricing service. Equity securities, for which there were no sales reported that day, are generally valued at the last quoted daily bid quotation on their primary market or exchange as provided by a third-party pricing service. Short-term instruments with a maturity at issuance of 60 days or less may be valued at amortized cost, which approximates market value.
Open-end investment companies are generally valued at net asset value per share. The values of foreign securities and other assets and liabilities expressed in foreign currencies are converted to U.S. dollars using the mean of bid and asked prices for rates provided by a third-party pricing service.
Under the fund’s valuation policy and procedures, market quotations are not considered to be readily available for debt instruments, floating rate loans, and many types of derivatives. These investments are generally valued at fair value based on information from third-party pricing services or otherwise determined by the adviser in accordance with the adviser’s fair valuation policy and procedures. Securities and other assets generally valued on the basis of information from a third-party pricing service may also be valued at a broker/dealer bid quotation. In determining values, third-party pricing services can utilize both transaction data and market information such as yield, quality, coupon rate, maturity, type of issue, trading characteristics, spreads and other market data. An investment may also be valued at fair value if the adviser determines that the investment’s value has been materially affected by events occurring after the close of the exchange or market on which the investment is principally traded (such as foreign exchange or market) and prior to the determination of the fund’s net asset value, or after the halt of trading of a specific security where trading does not resume prior to the close of the exchange or market on which the security is principally traded. Events that occur after foreign markets close (such as developments in foreign markets and significant movements in the U.S. markets) and prior to the determination of the fund’s net asset value may be deemed to have a material effect on the value of securities traded in foreign markets. Accordingly, the fund’s foreign equity securities may often be valued at fair value. The adviser generally relies on third-party pricing services or other information (such as the correlation with price movements of similar securities in the same or other markets; the type, cost and investment characteristics of the security; the business and financial condition of the issuer; and trading and other market data) to assist in determining whether to fair value and at what value to fair value an investment. The value of an investment for purposes of calculating the fund’s net asset value can differ depending on the source and method used to determine value. When fair valuation is used, the value of an investment used to determine the fund’s net asset value may differ from quoted or published prices for the same investment. There can be no assurance that the fund could obtain the fair value assigned to an investment if it were to sell the investment at the same time at which the fund determines its net asset value per share.
Various inputs are used in determining the value of the fund's assets or liabilities. These inputs are categorized into three broad levels. In certain cases, the inputs used to measure fair value may fall into different levels of the fair value hierarchy. In such cases, an investment's level within the fair value hierarchy is based on the lowest level of input that is significant to the fair value measurement. The fund's assessment of the significance of a particular input to the fair value measurement in its entirety requires judgment, and considers factors specific to the investment. Level 1 includes unadjusted
Notes to Financial Statements (unaudited) - continued
quoted prices in active markets for identical assets or liabilities. Level 2 includes other significant observable market-based inputs (including quoted prices for similar securities, interest rates, prepayment speed, and credit risk). Level 3 includes significant unobservable inputs, which may include the adviser's own assumptions in determining the fair value of investments. The following is a summary of the levels used as of February 28, 2023 in valuing the fund's assets and liabilities:
| Financial Instruments | Level 1 | Level 2 | Level 3 | Total |
| Equity Securities: | | | | |
| United States | $1,896,293,228 | $0 | $— | $1,896,293,228 |
| Canada | 160,173,455 | — | — | 160,173,455 |
| United Kingdom | 101,199,992 | — | — | 101,199,992 |
| India | 56,378,572 | — | — | 56,378,572 |
| Germany | 32,491,583 | — | — | 32,491,583 |
| Switzerland | 18,871,317 | — | — | 18,871,317 |
| China | 9,494,423 | — | — | 9,494,423 |
| Mutual Funds | 122,130,347 | — | — | 122,130,347 |
| Total | $2,397,032,917 | $0 | $— | $2,397,032,917 |
For further information regarding security characteristics, see the Portfolio of Investments.
Foreign Currency Translation — Purchases and sales of foreign investments, income, and expenses are converted into U.S. dollars based upon currency exchange rates prevailing on the respective dates of such transactions or on the reporting date for foreign denominated receivables and payables. Gains and losses attributable to foreign currency exchange rates on sales of securities are recorded for financial statement purposes as net realized gains and losses on investments. Gains and losses attributable to foreign exchange rate movements on receivables, payables, income and expenses are recorded for financial statement purposes as foreign currency transaction gains and losses. That portion of both realized and unrealized gains and losses on investments that results from fluctuations in foreign currency exchange rates is not separately disclosed.
Security Loans — Under its Securities Lending Agency Agreement with the fund, State Street Bank and Trust Company, as lending agent, loans the securities of the fund to certain qualified institutions (the “Borrowers”) approved by the fund. Security loans can be terminated at the discretion of either the lending agent or the fund and the related securities must be returned within the earlier of the standard trade settlement period for such securities or within three business days. The loans are collateralized by cash and/or U.S. Treasury and federal agency obligations in an amount typically at least equal to the market value of the securities loaned. On loans collateralized by cash, the cash collateral is invested in a money market fund. The market value of the loaned securities is determined at the close of business of the fund and any additional required collateral is delivered to the fund on the next business day. The lending agent provides the fund with indemnification against Borrower default. In the event of Borrower default, the lending agent will, for the benefit of the fund, either purchase securities identical to those loaned or, when such purchase is commercially impracticable, pay the fund the market value of the loaned securities. In return, the lending agent assumes the fund's rights to the related collateral. If the collateral value is less than the cost to purchase identical securities, the lending agent is responsible for the shortfall, but only
Notes to Financial Statements (unaudited) - continued
to the extent that such shortfall is not due to a decline in collateral value resulting from collateral reinvestment for which the fund bears the risk of loss. At period end, the fund had investment securities on loan, all of which were classified as equity securities in the fund's Portfolio of Investments, with a fair value of $4,970,185. The fair value of the fund's investment securities on loan and a related liability of $3,408,244 for cash collateral received on securities loaned are both presented gross in the Statement of Assets and Liabilities. Additionally, these loans were collateralized by U.S. Treasury Obligations of $1,899,195 held by the lending agent. The collateral on securities loaned exceeded the value of securities on loan at period end. The liability for cash collateral for securities loaned is carried at fair value, which is categorized as level 2 within the fair value hierarchy. A portion of the income generated upon investment of the collateral is remitted to the Borrowers, and the remainder is allocated between the fund and the lending agent. On loans collateralized by U.S. Treasury and/or federal agency obligations, a fee is received from the Borrower, and is allocated between the fund and the lending agent. Income from securities lending is separately reported in the Statement of Operations. The dividend and interest income earned on the securities loaned is accounted for in the same manner as other dividend and interest income.
Indemnifications — Under the fund's organizational documents, its officers and Trustees may be indemnified against certain liabilities and expenses arising out of the performance of their duties to the fund. Additionally, in the normal course of business, the fund enters into agreements with service providers that may contain indemnification clauses. The fund's maximum exposure under these agreements is unknown as this would involve future claims that may be made against the fund that have not yet occurred.
Investment Transactions and Income — Investment transactions are recorded on the trade date. Dividends received in cash are recorded on the ex-dividend date. Certain dividends from foreign securities will be recorded when the fund is informed of the dividend if such information is obtained subsequent to the ex-dividend date. Dividend payments received in additional securities are recorded on the ex-dividend date in an amount equal to the value of the security on such date. In determining the net gain or loss on securities sold, the cost of securities is determined on the identified cost basis.
The fund may receive proceeds from litigation settlements. Any proceeds received from litigation involving portfolio holdings are reflected in the Statement of Operations in realized gain/loss if the security has been disposed of by the fund or in unrealized gain/loss if the security is still held by the fund. Any other proceeds from litigation not related to portfolio holdings are reflected as other income in the Statement of Operations.
Tax Matters and Distributions — The fund intends to qualify as a regulated investment company, as defined under Subchapter M of the Internal Revenue Code, and to distribute all of its taxable income, including realized capital gains. As a result, no provision for federal income tax is required. The fund’s federal tax returns, when filed, will remain subject to examination by the Internal Revenue Service for a three year period. Management has analyzed the fund’s tax positions taken on federal and state tax returns for all open tax years and does not believe that there are any uncertain tax positions that require recognition of a tax liability. Foreign taxes, if any, have been accrued by the fund in the accompanying financial statements in accordance with the
Notes to Financial Statements (unaudited) - continued
applicable foreign tax law. Foreign income taxes may be withheld by certain countries in which the fund invests. Additionally, capital gains realized by the fund on securities issued in or by certain foreign countries may be subject to capital gains tax imposed by those countries.
Distributions to shareholders are recorded on the ex-dividend date. Income and capital gain distributions are determined in accordance with income tax regulations, which may differ from U.S. generally accepted accounting principles. Certain capital accounts in the financial statements are periodically adjusted for permanent differences in order to reflect their tax character. These adjustments have no impact on net assets or net asset value per share. Temporary differences which arise from recognizing certain items of income, expense, gain or loss in different periods for financial statement and tax purposes will reverse at some time in the future.
Book/tax differences primarily relate to wash sale loss deferrals and passive foreign investment companies.
The tax character of distributions made during the current period will be determined at fiscal year end. The tax character of distributions declared to shareholders for the last fiscal year is as follows:
| | Year ended
8/31/22 |
| Ordinary income (including any short-term capital gains) | $260,950,590 |
| Long-term capital gains | 325,490,117 |
| Total distributions | $586,440,707 |
The federal tax cost and the tax basis components of distributable earnings were as follows:
| As of 2/28/23 | |
| Cost of investments | $2,469,016,842 |
| Gross appreciation | 310,912,376 |
| Gross depreciation | (382,896,301) |
| Net unrealized appreciation (depreciation) | $(71,983,925) |
| As of 8/31/22 | |
| Post-October capital loss deferral | (98,581,908) |
| Late year ordinary loss deferral | (9,933,418) |
| Other temporary differences | (37,100) |
| Net unrealized appreciation (depreciation) | (430,992,289) |
The aggregate cost above includes prior fiscal year end tax adjustments, if applicable.
Multiple Classes of Shares of Beneficial Interest — The fund offers multiple classes of shares, which differ in their respective distribution and service fees. The fund's income, realized and unrealized gain (loss), and common expenses are allocated to shareholders based on the daily net assets of each class. Dividends are declared separately for each class. Differences in per share dividend rates are generally due to differences in separate class expenses. Class B and Class C shares will convert to
Notes to Financial Statements (unaudited) - continued
Class A shares approximately eight years after purchase. The fund’s distributions declared to shareholders as reported in the Statements of Changes in Net Assets are presented by class as follows:
| | Six months
ended
2/28/23 | | Year
ended
8/31/22 |
| Class A | $785,743 | | $215,358,617 |
| Class B | 10,704 | | 3,997,534 |
| Class C | 47,203 | | 14,579,563 |
| Class I | 267,720 | | 100,195,846 |
| Class R1 | 5,839 | | 1,463,235 |
| Class R2 | 23,291 | | 6,788,083 |
| Class R3 | 116,633 | | 31,919,712 |
| Class R4 | 19,232 | | 4,708,685 |
| Class R6 | 956,424 | | 207,429,432 |
| Total | $2,232,789 | | $586,440,707 |
(3) Transactions with Affiliates
Investment Adviser — The fund has an investment advisory agreement with MFS to provide overall investment management and related administrative services and facilities to the fund. The management fee is computed daily and paid monthly at the following annual rates based on the fund's average daily net assets:
| Up to $1 billion | 0.90% |
| In excess of $1 billion and up to $2.5 billion | 0.80% |
| In excess of $2.5 billion and up to $5 billion | 0.75% |
| In excess of $5 billion | 0.70% |
MFS has agreed in writing to reduce its management fee by a specified amount if certain MFS mutual fund assets exceed thresholds agreed to by MFS and the fund's Board of Trustees. MFS has also agreed in writing to waive at least 0.01% of its management fee as part of this agreement. The agreement to waive at least 0.01% of the management fee will continue until modified by the fund's Board of Trustees, but such agreement will continue at least until December 31, 2023. For the six months ended February 28, 2023, this management fee reduction amounted to $151,995, which is included in the reduction of total expenses in the Statement of Operations.
The management fee incurred for the six months ended February 28, 2023 was equivalent to an annual effective rate of 0.83% of the fund's average daily net assets.
Distributor — MFS Fund Distributors, Inc. (MFD), a wholly-owned subsidiary of MFS, as distributor, received $66,271 for the six months ended February 28, 2023, as its portion of the initial sales charge on sales of Class A shares of the fund.
The Board of Trustees has adopted a distribution plan for certain share classes pursuant to Rule 12b-1 of the Investment Company Act of 1940.
The fund's distribution plan provides that the fund will pay MFD for services provided by MFD and financial intermediaries in connection with the distribution and servicing of certain share classes. One component of the plan is a distribution fee paid to MFD and another component of the plan is a service fee paid to MFD. MFD may subsequently pay all, or a portion, of the distribution and/or service fees to financial intermediaries.
Notes to Financial Statements (unaudited) - continued
Distribution Plan Fee Table:
| | Distribution
Fee Rate (d) | Service
Fee Rate (d) | Total
Distribution
Plan (d) | Annual
Effective
Rate (e) | Distribution
and Service
Fee |
| Class A | — | 0.25% | 0.25% | 0.25% | $ 896,427 |
| Class B | 0.75% | 0.25% | 1.00% | 1.00% | 29,674 |
| Class C | 0.75% | 0.25% | 1.00% | 1.00% | 134,285 |
| Class R1 | 0.75% | 0.25% | 1.00% | 1.00% | 15,705 |
| Class R2 | 0.25% | 0.25% | 0.50% | 0.50% | 46,360 |
| Class R3 | — | 0.25% | 0.25% | 0.25% | 132,820 |
| Total Distribution and Service Fees | | | | | $1,255,271 |
| (d) | In accordance with the distribution plan for certain classes, the fund pays distribution and/or service fees equal to these annual percentage rates of each class’s average daily net assets. The distribution and service fee rates disclosed by class represent the current rates in effect at the end of the reporting period. Any rate changes, if applicable, are detailed below. |
| (e) | The annual effective rates represent actual fees incurred under the distribution plan for the six months ended February 28, 2023 based on each class's average daily net assets. MFD has voluntarily agreed to rebate a portion of each class's 0.25% service fee attributable to accounts for which there is no financial intermediary specified on the account except for accounts attributable to MFS or its affiliates' seed money. For the six months ended February 28, 2023, this rebate amounted to $95, $1, and $159 for Class A, Class B, and Class R2 shares, respectively, and is included in the reduction of total expenses in the Statement of Operations. |
Certain Class A shares are subject to a contingent deferred sales charge (CDSC) in the event of a shareholder redemption within 18 months of purchase. Class B shares are subject to a CDSC in the event of a shareholder redemption within six years of purchase. Class C shares are subject to a CDSC in the event of a shareholder redemption within 12 months of purchase. All contingent deferred sales charges are paid to MFD and during the six months ended February 28, 2023, were as follows:
| | Amount |
| Class A | $8,955 |
| Class B | 1,864 |
| Class C | 851 |
Shareholder Servicing Agent — MFS Service Center, Inc. (MFSC), a wholly-owned subsidiary of MFS, receives a fee from the fund for its services as shareholder servicing agent calculated as a percentage of the average daily net assets of the fund as determined periodically under the supervision of the fund's Board of Trustees. For the six months ended February 28, 2023, the fee was $123,910, which equated to 0.0109% annually of the fund's average daily net assets. MFSC also receives reimbursement from the fund for out-of-pocket expenses, sub-accounting and other shareholder servicing costs which may be paid to affiliated and unaffiliated service providers. Class R6 shares do not incur sub-accounting fees. For the six months ended February 28, 2023, these out-of-pocket expenses, sub-accounting and other shareholder servicing costs amounted to $884,186.
Notes to Financial Statements (unaudited) - continued
Administrator — MFS provides certain financial, legal, shareholder communications, compliance, and other administrative services to the fund. Under an administrative services agreement, the fund reimburses MFS the costs incurred to provide these services. The fund is charged an annual fixed amount of $17,500 plus a fee based on average daily net assets. The administrative services fee incurred for the six months ended February 28, 2023 was equivalent to an annual effective rate of 0.0152% of the fund's average daily net assets.
Trustees’ and Officers’ Compensation — The fund pays compensation to independent Trustees in the form of a retainer, attendance fees, and additional compensation to Board and Committee chairpersons. The fund does not pay compensation directly to Trustees or officers of the fund who are also officers of the investment adviser, all of whom receive remuneration from MFS for their services to the fund. Certain officers and Trustees of the fund are officers or directors of MFS, MFD, and MFSC.
Other — The fund invests in the MFS Institutional Money Market Portfolio which is managed by MFS and seeks current income consistent with preservation of capital and liquidity. This money market fund does not pay a management fee to MFS but does incur investment and operating costs.
The fund is permitted to engage in purchase and sale transactions with funds and accounts for which MFS serves as investment adviser or sub-adviser (“cross-trades”) pursuant to a policy adopted by the Board of Trustees. This policy has been designed to ensure that cross-trades conducted by the fund comply with Rule 17a-7 under the Investment Company Act of 1940. During the six months ended February 28, 2023, the fund engaged in sale transactions pursuant to this policy, which amounted to $1,565,420. The sales transactions resulted in net realized gains (losses) of $(2,573,989).
The adviser has voluntarily undertaken to reimburse the fund from its own resources on a quarterly basis for the cost of investment research embedded in the cost of the fund’s securities trades. This agreement may be rescinded at any time. For the six months ended February 28, 2023, this reimbursement amounted to $92,332, which is included in “Other” income in the Statement of Operations.
(4) Portfolio Securities
For the six months ended February 28, 2023, purchases and sales of investments, other than short-term obligations, aggregated $589,536,535 and $658,960,972, respectively.
Notes to Financial Statements (unaudited) - continued
(5) Shares of Beneficial Interest
The fund's Declaration of Trust permits the Trustees to issue an unlimited number of full and fractional shares of beneficial interest. Transactions in fund shares were as follows:
| | Six months ended
2/28/23 | | Year ended
8/31/22 |
| | Shares | Amount | | Shares | Amount |
| Shares sold | | | | | |
| Class A | 2,245,214 | $47,431,954 | | 6,061,622 | $167,070,754 |
| Class B | 101 | 1,369 | | 7,284 | 140,632 |
| Class C | 170,038 | 2,153,217 | | 365,739 | 6,837,715 |
| Class I | 2,115,130 | 54,250,851 | | 6,223,697 | 212,001,901 |
| Class R1 | 13,392 | 168,154 | | 32,779 | 525,922 |
| Class R2 | 74,591 | 1,390,108 | | 208,194 | 4,980,138 |
| Class R3 | 350,243 | 7,494,288 | | 1,114,023 | 29,392,216 |
| Class R4 | 1,153,406 | 27,630,630 | | 311,466 | 9,300,825 |
| Class R6 | 3,897,469 | 102,036,252 | | 16,632,647 | 555,189,897 |
| | 10,019,584 | $242,556,823 | | 30,957,451 | $985,440,000 |
Shares issued to shareholders
in reinvestment of distributions | | | | | |
| Class A | 36,527 | $769,262 | | 6,998,076 | $210,222,217 |
| Class B | 833 | 10,625 | | 214,568 | 3,935,178 |
| Class C | 3,543 | 45,383 | | 762,461 | 14,052,153 |
| Class I | 9,682 | 247,862 | | 2,543,591 | 92,612,157 |
| Class R1 | 466 | 5,839 | | 81,291 | 1,463,235 |
| Class R2 | 1,257 | 23,133 | | 251,763 | 6,628,908 |
| Class R3 | 5,554 | 116,633 | | 1,065,411 | 31,919,712 |
| Class R4 | 799 | 18,746 | | 135,485 | 4,521,134 |
| Class R6 | 36,046 | 941,152 | | 5,467,893 | 202,858,835 |
| | 94,707 | $2,178,635 | | 17,520,539 | $568,213,529 |
| Shares reacquired | | | | | |
| Class A | (3,658,011) | $(76,853,890) | | (7,055,459) | $(186,240,817) |
| Class B | (111,705) | (1,428,415) | | (292,349) | (5,027,537) |
| Class C | (375,545) | (4,810,753) | | (932,651) | (15,940,843) |
| Class I | (3,437,804) | (87,428,405) | | (9,235,323) | (289,403,506) |
| Class R1 | (28,562) | (358,214) | | (70,537) | (1,304,358) |
| Class R2 | (96,588) | (1,790,579) | | (395,603) | (9,650,859) |
| Class R3 | (403,562) | (8,543,760) | | (1,462,883) | (39,494,202) |
| Class R4 | (205,897) | (4,996,833) | | (330,269) | (9,696,905) |
| Class R6 | (4,115,531) | (108,566,565) | | (6,986,289) | (219,160,148) |
| | (12,433,205) | $(294,777,414) | | (26,761,363) | $(775,919,175) |
Notes to Financial Statements (unaudited) - continued
| | Six months ended
2/28/23 | | Year ended
8/31/22 |
| | Shares | Amount | | Shares | Amount |
| Net change | | | | | |
| Class A | (1,376,270) | $(28,652,674) | | 6,004,239 | $191,052,154 |
| Class B | (110,771) | (1,416,421) | | (70,497) | (951,727) |
| Class C | (201,964) | (2,612,153) | | 195,549 | 4,949,025 |
| Class I | (1,312,992) | (32,929,692) | | (468,035) | 15,210,552 |
| Class R1 | (14,704) | (184,221) | | 43,533 | 684,799 |
| Class R2 | (20,740) | (377,338) | | 64,354 | 1,958,187 |
| Class R3 | (47,765) | (932,839) | | 716,551 | 21,817,726 |
| Class R4 | 948,308 | 22,652,543 | | 116,682 | 4,125,054 |
| Class R6 | (182,016) | (5,589,161) | | 15,114,251 | 538,888,584 |
| | (2,318,914) | $(50,041,956) | | 21,716,627 | $777,734,354 |
The fund is one of several mutual funds in which certain MFS funds may invest. The MFS funds do not invest in the underlying funds for the purpose of exercising management or control. At the end of the period, the MFS Growth Allocation Fund, the MFS Moderate Allocation Fund, the MFS Aggressive Growth Allocation Fund, and the MFS Conservative Allocation Fund were the owners of record of approximately 5%, 4%, 3%, and 2%, respectively, of the value of outstanding voting shares of the fund.
In addition, the MFS Lifetime 2025 Fund, the MFS Lifetime 2030 Fund, the MFS Lifetime 2035 Fund, the MFS Lifetime 2040 Fund, the MFS Lifetime 2045 Fund, the MFS Lifetime 2050 Fund, the MFS Lifetime 2055 Fund, the MFS Lifetime 2060 Fund, the MFS Lifetime 2065 Fund, and the MFS Lifetime Income Fund were each the owners of record of less than 1% of the value of outstanding voting shares of the fund.
Effective June 1, 2019, purchases of the fund’s Class B shares were closed to new and existing investors subject to certain exceptions.
(6) Line of Credit
The fund and certain other funds managed by MFS participate in a $1.45 billion unsecured committed line of credit of which $1.2 billion is reserved for use by the fund and certain other MFS U.S. funds. The line of credit is provided by a syndicate of banks under a credit agreement. Borrowings may be made for temporary financing needs. Interest is charged to each fund, based on its borrowings, generally at a rate equal to the highest of 1) Daily Simple SOFR (Secured Overnight Financing Rate) plus 0.10%, 2) the Federal Funds Effective Rate, or 3) the Overnight Bank Funding Rate, each plus an agreed upon spread. A commitment fee, based on the average daily unused portion of the committed line of credit, is allocated among the participating funds. The line of credit expires on March 14, 2024 unless extended or renewed. In addition, the fund and other funds managed by MFS have established unsecured uncommitted borrowing arrangements with certain banks for temporary financing needs. Interest is charged to each fund, based on its borrowings, at rates equal to customary reference rates plus an agreed upon spread. For the six months ended February 28, 2023, the fund’s commitment fee and interest expense were $5,879 and $0, respectively, and are included in “Miscellaneous” expense in the Statement of Operations.
Notes to Financial Statements (unaudited) - continued
(7) Investments in Affiliated Issuers
An affiliated issuer may be considered one in which the fund owns 5% or more of the outstanding voting securities, or a company which is under common control. For the purposes of this report, the following were affiliated issuers:
| Affiliated Issuers | Beginning
Value | Purchases | Sales
Proceeds | Realized
Gain
(Loss) | Change in
Unrealized
Appreciation or
Depreciation | Ending
Value |
| GCM Grosvenor, Inc., “A” | $16,613,237 | $— | $— | $— | $804,208 | $17,417,445 |
| MFS Institutional Money Market Portfolio | 104,169,558 | 320,930,196 | 306,387,004 | 9,868 | (515) | 118,722,103 |
| | $120,782,795 | $320,930,196 | $306,387,004 | $9,868 | $803,693 | $136,139,548 |
| Affiliated Issuers | Dividend
Income | Capital Gain
Distributions |
| GCM Grosvenor, Inc., “A” | $444,431 | $— |
| MFS Institutional Money Market Portfolio | 2,149,602 | — |
| | $2,594,033 | $— |
(8) LIBOR Transition
Certain of the fund's investments, including investments in certain debt instruments and derivatives (if any), as well as borrowings by the fund and certain other contractual arrangements of the fund, may be based on the London Interbank Offered Rate (“LIBOR”). In 2017, the regulatory authority that oversees financial services firms in the United Kingdom announced plans to transition away from LIBOR by the end of 2021. In March 2021, the administrator of LIBOR announced the extension of the publication of the more commonly used U.S. dollar LIBOR settings to the end of June 2023. Although the full impacts of the transition away from LIBOR are not fully known, the transition may result in, among other things, an increase in volatility or illiquidity of the markets for instruments that currently rely on LIBOR to determine interest rates and this could have an adverse impact on the fund's performance. With respect to the fund's accounting for investments, including investments in certain debt instruments and derivatives, as well as borrowings by the fund and any other contractual arrangements of the fund that undergo reference rate-related modifications as a result of the transition, management will rely upon the relief provided by FASB Codification Topic 848 – Reference Rate Reform (Topic 848). The guidance in Topic 848 permits the fund to account for those modified contracts as a continuation of the existing contracts. The situation remains fluid, and management believes, based on best available information, that the impact of the transition will not be material to the fund.
(9) Subsequent Event
On March 30, 2023, the fund announced that effective after the close of business on September 29, 2023, purchases of Class R1 and Class R2 shares will be closed to new eligible investors.
Proxy Voting Policies and Information
MFS votes proxies on behalf of the fund pursuant to proxy voting policies and procedures that are available without charge, upon request, by calling 1-800-225-2606, by visiting mfs.com/proxyvoting, or by visiting the SEC’s Web site at http://www.sec.gov.
Information regarding how the fund voted proxies relating to portfolio securities during the most recent twelve-month period ended June 30 is available by August 31 of each year without charge by visiting mfs.com/proxyvoting, or by visiting the SEC’s Web site at http://www.sec.gov.
Quarterly Portfolio Disclosure
The fund files a complete schedule of portfolio holdings with the SEC for the first and third quarters of each fiscal year as an exhibit to its reports on Form N-PORT. The fund's Form N-PORT reports are available on the SEC's Web site at http://www.sec.gov. A shareholder can obtain the portfolio holdings report for the first and third quarters of the fund's fiscal year at mfs.com/openendfunds by choosing the fund's name and then scrolling to the “Resources” section and clicking on the “Prospectus and Reports” tab.
Further Information
From time to time, MFS may post important information about the fund or the MFS Funds on the MFS Web site (mfs.com). This information is available at https://www.mfs.com/announcements or at mfs.com/openendfunds by choosing the fund’s name and then scrolling to the “Resources” section and clicking on the “Announcements” tab, if any.
Information About Fund Contracts and Legal Claims
The fund has entered into contractual arrangements with an investment adviser, administrator, distributor, shareholder servicing agent, and custodian who each provide services to the fund. Unless expressly stated otherwise, shareholders are not parties to, or intended beneficiaries of these contractual arrangements, and these contractual arrangements are not intended to create any shareholder right to enforce them against the service providers or to seek any remedy under them against the service providers, either directly or on behalf of the fund.
Under the Trust’s By-Laws and Declaration of Trust, any claims asserted against or on behalf of the MFS Funds, including claims against Trustees and Officers, must be brought in state and federal courts located within the Commonwealth of Massachusetts.
Provision of Financial Reports and Summary Prospectuses
The fund produces financial reports every six months and updates its summary prospectus and prospectus annually. To avoid sending duplicate copies of materials to households, only one copy of the fund’s annual and semiannual report and summary prospectus may be mailed to shareholders having the same last name and residential address on the fund’s records. However, any shareholder may contact MFSC (please see back cover for address and telephone number) to request that copies of these reports and summary prospectuses be sent personally to that shareholder.
Save paper with eDelivery.
MFS® will send you prospectuses, reports, and proxies directly via e-mail so you will get information faster with less mailbox clutter.
To sign up:
1. Go to mfs.com.
2. Log in via MFS® Access.
3. Select eDelivery.
If you own your MFS fund shares through a financial institution or a retirement plan, MFS® TALK, MFS® Access, or eDelivery may not be available to you.
CONTACT
WEB SITE
mfs.com
MFS TALK
1-800-637-8255
24 hours a day
ACCOUNT SERVICE AND LITERATURE
Shareholders
1-800-225-2606
Financial advisors
1-800-343-2829
Retirement plan services
1-800-637-1255
MAILING ADDRESS
MFS Service Center, Inc.
P.O. Box 219341
Kansas City, MO 64121-9341
OVERNIGHT MAIL
MFS Service Center, Inc.
Suite 219341
430 W 7th Street
Kansas City, MO 64105-1407
Semiannual Report
February 28, 2023
MFS® Research
International Fund
MFS® Research
International Fund
The report is prepared for the general information of shareholders. It is authorized for distribution to prospective investors only when preceded or accompanied by a current prospectus.
NOT FDIC INSURED • MAY LOSE VALUE • NO BANK GUARANTEE
LETTER FROM THE CHAIR AND CEO
Dear Shareholders:
Markets — which rallied in late 2022 and early 2023 on signs of peaking inflation, hopes that monetary policy tightening cycles may be nearing an end and a rapid reopening of China’s economy — have hit turbulence after the sudden collapse of two US regional banks and the government-led merger of Switzerland’s two largest lenders. At the same time, US inflation data suggest that price pressures will prove more persistent than expected, making the US Federal Reserve’s job of trying to corral four-decade-high inflation without tipping the economy into recession that much more difficult. On a positive note, markets have largely adjusted to the challenges posed by Russia’s invasion of Ukraine, thanks in part to mild European winter weather that has alleviated concerns over potential near-term shortages of natural gas. Resilient labor markets in much of the developed world have further contributed to a brighter-than-expected economic backdrop. However, after the recent banking turmoil, investors are increasingly mindful that the lagged effects of ongoing monetary policy tightening have yet to fully work their way through the global economy.
One result of the banking crisis has been a rally in global government bond markets as investors sense that the global monetary tightening campaign is nearing its end, and the resulting lower yields have eased some of the pressure on interest rate–sensitive parts of the economy. Over the near term, amid tighter financial conditions, we feel companies will face a challenging earnings backdrop as they are forced to absorb higher input and labor costs while pricing power dwindles. As for fixed income, the rise in interest rates in recent months has made bonds more attractive than they have been in years, which may provide balance for investors’ portfolios.
During times of market transition, it is important to have a deep understanding of company fundamentals, and we have built our unique global research platform to do just that.
At MFS®, we put our clients’ assets to work responsibly by carefully navigating increasingly complex global capital markets. Our investment team is guided by a commitment to long-term fundamental investing. Our global investment platform — combining collective expertise, long-term discipline, and thoughtful risk management — seeks to uncover what we believe are the best, most durable investment ideas in markets around the world, enabling us to potentially create value for investors.
Respectfully,
Michael W. Roberge
Chair and Chief Executive Officer
MFS Investment Management
April 14, 2023
The opinions expressed in this letter are subject to change and may not be relied upon for investment advice. No forecasts can be guaranteed.
Portfolio structure
Top ten holdings
| Novo Nordisk A.S., “B” | 3.3% |
| Linde PLC | 3.0% |
| LVMH Moet Hennessy Louis Vuitton SE | 2.9% |
| Roche Holding AG | 2.9% |
| Nestle S.A. | 2.8% |
| Schneider Electric SE | 2.8% |
| Hitachi Ltd. | 1.8% |
| TotalEnergies SE | 1.8% |
| BNP Paribas | 1.8% |
| UBS Group AG | 1.8% |
Global equity sectors (k)
| Capital Goods | 23.8% |
| Financial Services | 20.7% |
| Health Care | 12.4% |
| Technology | 11.6% |
| Consumer Cyclicals | 10.0% |
| Energy | 8.2% |
| Consumer Staples | 8.2% |
| Telecommunications/Cable Television | 2.9% |
Issuer country weightings (x)
| Japan | 18.3% |
| France | 14.0% |
| Switzerland | 12.7% |
| United Kingdom | 12.0% |
| United States | 9.8% |
| Germany | 7.4% |
| Hong Kong | 3.9% |
| Denmark | 3.6% |
| Australia | 3.4% |
| Other Countries | 14.9% |
Currency exposure weightings (y)
| Euro | 31.8% |
| Japanese Yen | 18.3% |
| Swiss Franc | 12.7% |
| British Pound Sterling | 12.3% |
| United States Dollar | 7.5% |
| Hong Kong Dollar | 5.4% |
| Danish Krone | 3.6% |
| Australian Dollar | 3.4% |
| Canadian Dollar | 1.6% |
| Other Currencies | 3.4% |
Portfolio Composition - continued
| (k) | The sectors set forth above and the associated portfolio composition are based on MFS’ own custom sector classification methodology. |
| (x) | Represents the portfolio’s exposure to issuer countries as a percentage of a portfolio’s net assets. For purposes of this presentation, United States includes Cash & Cash Equivalents and Other. |
| (y) | Represents the portfolio’s exposure to a particular currency as a percentage of a portfolio's net assets. For purposes of this presentation, United States Dollar includes Cash & Cash Equivalents. |
Cash & Cash Equivalents includes any cash, investments in money market funds, short-term securities, and other assets less liabilities. Please see the Statement of Assets and Liabilities for additional information related to the fund’s cash position and other assets and liabilities.
Other includes equivalent exposure from currency derivatives and/or any offsets to derivative positions and may be negative.
Percentages are based on net assets as of February 28, 2023.
The portfolio is actively managed and current holdings may be different.
Expense Table
Fund expenses borne by the shareholders during the period,
September 1, 2022 through February 28, 2023
As a shareholder of the fund, you incur two types of costs: (1) transaction costs, including sales charges (loads) on certain purchase or redemption payments, and (2) ongoing costs, including management fees; distribution and service (12b-1) fees; and other fund expenses. This example is intended to help you understand your ongoing costs (in dollars) of investing in the fund and to compare these costs with the ongoing costs of investing in other mutual funds.
The example is based on an investment of $1,000 invested at the beginning of the period and held for the entire period September 1, 2022 through February 28, 2023.
Actual Expenses
The first line for each share class in the following table provides information about actual account values and actual expenses. You may use the information in this line, together with the amount you invested, to estimate the expenses that you paid over the period. Simply divide your account value by $1,000 (for example, an $8,600 account value divided by $1,000 = 8.6), then multiply the result by the number in the first line under the heading entitled “Expenses Paid During Period” to estimate the expenses you paid on your account during this period.
Hypothetical Example for Comparison Purposes
The second line for each share class in the following table provides information about hypothetical account values and hypothetical expenses based on the fund’s actual expense ratio and an assumed rate of return of 5% per year before expenses, which is not the fund’s actual return. The hypothetical account values and expenses may not be used to estimate the actual ending account balance or expenses you paid for the period. You may use this information to compare the ongoing costs of investing in the fund and other funds. To do so, compare this 5% hypothetical example with the 5% hypothetical examples that appear in the shareholder reports of the other funds.
Please note that the expenses shown in the table are meant to highlight your ongoing costs only and do not reflect any transactional costs, such as sales charges (loads). Therefore, the second line for each share class in the table is useful in comparing ongoing costs only, and will not help you determine the relative total costs of owning different funds. In addition, if these transactional costs were included, your costs would have been higher.
Expense Table - continued
Share
Class | | Annualized
Expense
Ratio | Beginning
Account Value
9/01/22 | Ending
Account Value
2/28/23 | Expenses
Paid During
Period (p)
9/01/22-2/28/23 |
| A | Actual | 1.02% | $1,000.00 | $1,086.62 | $5.28 |
| Hypothetical (h) | 1.02% | $1,000.00 | $1,019.74 | $5.11 |
| B | Actual | 1.77% | $1,000.00 | $1,082.74 | $9.14 |
| Hypothetical (h) | 1.77% | $1,000.00 | $1,016.02 | $8.85 |
| C | Actual | 1.77% | $1,000.00 | $1,082.67 | $9.14 |
| Hypothetical (h) | 1.77% | $1,000.00 | $1,016.02 | $8.85 |
| I | Actual | 0.77% | $1,000.00 | $1,088.06 | $3.99 |
| Hypothetical (h) | 0.77% | $1,000.00 | $1,020.98 | $3.86 |
| R1 | Actual | 1.77% | $1,000.00 | $1,082.80 | $9.14 |
| Hypothetical (h) | 1.77% | $1,000.00 | $1,016.02 | $8.85 |
| R2 | Actual | 1.27% | $1,000.00 | $1,085.63 | $6.57 |
| Hypothetical (h) | 1.27% | $1,000.00 | $1,018.50 | $6.36 |
| R3 | Actual | 1.02% | $1,000.00 | $1,086.67 | $5.28 |
| Hypothetical (h) | 1.02% | $1,000.00 | $1,019.74 | $5.11 |
| R4 | Actual | 0.77% | $1,000.00 | $1,088.18 | $3.99 |
| Hypothetical (h) | 0.77% | $1,000.00 | $1,020.98 | $3.86 |
| R6 | Actual | 0.67% | $1,000.00 | $1,089.11 | $3.47 |
| Hypothetical (h) | 0.67% | $1,000.00 | $1,021.47 | $3.36 |
| (h) | 5% class return per year before expenses. |
| (p) | “Expenses Paid During Period” are equal to each class’s annualized expense ratio, as shown above, multiplied by the average account value over the period, multiplied by 181/365 (to reflect the one-half year period). Expenses paid do not include any applicable sales charges (loads). If these transaction costs had been included, your costs would have been higher. |
Notes to Expense Table
Expense ratios include 0.01% of tax reclaim recovery expenses.
Portfolio of Investments
2/28/23 (unaudited)
The Portfolio of Investments is a complete list of all securities owned by your fund. It is categorized by broad-based asset classes.
| Issuer | | | Shares/Par | Value ($) |
| Common Stocks – 97.8% |
| Aerospace & Defense – 1.2% | |
| MTU Aero Engines Holding AG | | 564,383 | $136,402,547 |
| Thales S.A. | | 348,285 | 48,699,957 |
| | | | | $185,102,504 |
| Airlines – 0.5% | |
| Ryanair Holdings PLC, ADR (a) | | 740,485 | $68,694,793 |
| Alcoholic Beverages – 2.0% | |
| Diageo PLC | | 5,091,715 | $216,136,016 |
| Kirin Holdings Co. Ltd. | | 5,413,000 | 81,062,811 |
| | | | | $297,198,827 |
| Apparel Manufacturers – 5.1% | |
| Burberry Group PLC | | 1,941,396 | $57,586,224 |
| Compagnie Financiere Richemont S.A. | | 1,235,549 | 185,952,190 |
| LVMH Moet Hennessy Louis Vuitton SE | | 526,696 | 439,540,984 |
| NIKE, Inc., “B” | | 649,472 | 77,150,779 |
| | | | | $760,230,177 |
| Automotive – 1.7% | |
| Bridgestone Corp. | | 2,133,100 | $81,858,525 |
| Compagnie Generale des Etablissements Michelin | | 2,778,541 | 87,387,055 |
| Koito Manufacturing Co. Ltd. | | 5,363,000 | 90,082,487 |
| | | | | $259,328,067 |
| Brokerage & Asset Managers – 3.4% | |
| Euronext N.V. | | 2,444,733 | $178,781,741 |
| Hong Kong Exchanges & Clearing Ltd. | | 3,343,800 | 134,017,821 |
| London Stock Exchange Group PLC | | 2,243,578 | 200,566,442 |
| | | | | $513,366,004 |
| Business Services – 1.1% | |
| Nomura Research Institute Ltd. | | 5,674,800 | $126,704,065 |
| Secom Co. Ltd. | | 765,300 | 44,533,597 |
| | | | | $171,237,662 |
| Computer Software – 1.5% | |
| Cadence Design Systems, Inc. (a) | | 471,933 | $91,054,753 |
| Lumine Group, Inc. (a) | | 308,082 | 3,153,797 |
| NAVER Corp. | | 305,726 | 48,172,205 |
Portfolio of Investments (unaudited) – continued
| Issuer | | | Shares/Par | Value ($) |
| Common Stocks – continued |
| Computer Software – continued | |
| NetEase, Inc., ADR | | 1,069,514 | $83,037,067 |
| | | | | $225,417,822 |
| Computer Software - Systems – 6.0% | |
| Amadeus IT Group S.A. (a) | | 2,383,091 | $149,723,311 |
| Constellation Software, Inc. | | 102,681 | 176,552,624 |
| Fujitsu Ltd. | | 1,508,900 | 194,160,538 |
| Hitachi Ltd. | | 5,329,700 | 269,704,623 |
| Samsung Electronics Co. Ltd. | | 2,404,942 | 110,137,529 |
| | | | | $900,278,625 |
| Construction – 0.7% | |
| Techtronic Industries Co. Ltd. | | 11,268,000 | $112,042,627 |
| Consumer Products – 1.5% | |
| Kao Corp. | | 2,018,600 | $75,463,068 |
| Reckitt Benckiser Group PLC | | 2,055,988 | 142,496,838 |
| | | | | $217,959,906 |
| Consumer Services – 1.0% | |
| Carsales.com Ltd. | | 3,394,909 | $51,833,811 |
| Persol Holdings Co. Ltd. | | 2,657,400 | 53,224,118 |
| SEEK Ltd. | | 2,419,038 | 39,359,492 |
| | | | | $144,417,421 |
| Electrical Equipment – 4.0% | |
| Legrand S.A. | | 1,949,873 | $180,664,484 |
| Schneider Electric SE | | 2,595,921 | 417,676,596 |
| | | | | $598,341,080 |
| Electronics – 2.5% | |
| ASML Holding N.V. | | 100,763 | $62,240,961 |
| Kyocera Corp. | | 1,937,300 | 95,445,694 |
| NXP Semiconductors N.V. | | 542,205 | 96,772,748 |
| Taiwan Semiconductor Manufacturing Co. Ltd. | | 7,259,326 | 120,345,502 |
| | | | | $374,804,905 |
| Energy - Independent – 1.1% | |
| Reliance Industries Ltd. | | 900,861 | $25,309,762 |
| Woodside Energy Group Ltd. | | 5,689,161 | 137,471,963 |
| | | | | $162,781,725 |
Portfolio of Investments (unaudited) – continued
| Issuer | | | Shares/Par | Value ($) |
| Common Stocks – continued |
| Energy - Integrated – 4.0% | |
| Eni S.p.A. | | 9,784,631 | $138,327,415 |
| Galp Energia SGPS S.A., “B” | | 11,202,976 | 136,978,874 |
| Idemitsu Kosan Co. Ltd. | | 2,318,200 | 51,674,467 |
| TotalEnergies SE | | 4,351,138 | 269,550,681 |
| | | | | $596,531,437 |
| Energy - Renewables – 0.3% | |
| Orsted A/S | | 555,685 | $48,579,648 |
| Food & Beverages – 3.5% | |
| Danone S.A. | | 1,709,722 | $96,277,743 |
| Nestle S.A. | | 3,745,963 | 421,905,563 |
| | | | | $518,183,306 |
| Food & Drug Stores – 0.2% | |
| Sugi Holdings Co. Ltd. (l) | | 763,700 | $31,971,577 |
| Gaming & Lodging – 1.3% | |
| Aristocrat Leisure Ltd. | | 3,633,829 | $89,347,732 |
| Flutter Entertainment PLC (a) | | 288,778 | 46,319,997 |
| Whitbread PLC | | 1,808,411 | 67,193,374 |
| | | | | $202,861,103 |
| Insurance – 5.8% | |
| AIA Group Ltd. | | 21,725,600 | $230,419,675 |
| Aon PLC | | 688,629 | 209,377,648 |
| Beazley PLC | | 12,078,709 | 99,232,200 |
| Hiscox Ltd. | | 5,734,081 | 78,628,515 |
| Willis Towers Watson PLC | | 319,256 | 74,820,836 |
| Zurich Insurance Group AG | | 371,346 | 176,003,455 |
| | | | | $868,482,329 |
| Internet – 0.5% | |
| Tencent Holdings Ltd. | | 1,641,400 | $71,850,720 |
| Leisure & Toys – 0.4% | |
| Yamaha Corp. | | 1,602,200 | $60,837,825 |
| Machinery & Tools – 7.1% | |
| Daikin Industries Ltd. | | 1,174,600 | $201,395,740 |
| GEA Group AG | | 3,333,153 | 146,730,257 |
| Kubota Corp. | | 8,721,700 | 131,669,453 |
| Ritchie Bros. Auctioneers, Inc. (l) | | 986,068 | 60,327,561 |
| Schindler Holding AG | | 566,699 | 127,196,654 |
| SMC Corp. | | 390,600 | 198,233,337 |
| Toyota Industries Corp. | | 1,855,400 | 108,880,658 |
Portfolio of Investments (unaudited) – continued
| Issuer | | | Shares/Par | Value ($) |
| Common Stocks – continued |
| Machinery & Tools – continued | |
| Weir Group PLC | | 3,807,624 | $86,974,195 |
| | | | | $1,061,407,855 |
| Major Banks – 6.2% | |
| Bank of Ireland Group PLC | | 3,762,466 | $41,506,799 |
| BNP Paribas | | 3,830,516 | 268,009,064 |
| Mitsubishi UFJ Financial Group, Inc. | | 18,558,200 | 131,545,069 |
| NatWest Group PLC | | 65,658,031 | 230,849,037 |
| UBS Group AG | | 12,194,090 | 264,765,239 |
| | | | | $936,675,208 |
| Medical Equipment – 2.2% | |
| ConvaTec Group PLC | | 28,872,641 | $77,932,886 |
| QIAGEN N.V. (a) | | 3,766,506 | 173,535,722 |
| Terumo Corp. | | 2,842,700 | 76,435,862 |
| | | | | $327,904,470 |
| Metals & Mining – 1.3% | |
| Glencore PLC | | 33,260,719 | $198,177,889 |
| Natural Gas - Distribution – 0.4% | |
| China Resources Gas Group Ltd. | | 14,790,700 | $62,370,649 |
| Natural Gas - Pipeline – 0.4% | |
| APA Group | | 7,810,820 | $56,395,812 |
| Other Banks & Diversified Financials – 3.7% | |
| HDFC Bank Ltd. | | 6,325,714 | $122,401,332 |
| Julius Baer Group Ltd. | | 2,147,164 | 142,163,983 |
| Macquarie Group Ltd. | | 1,117,129 | 142,465,228 |
| Visa, Inc., “A” | | 686,052 | 150,890,277 |
| | | | | $557,920,820 |
| Pharmaceuticals – 10.2% | |
| Bayer AG | | 1,955,997 | $116,455,978 |
| Kyowa Kirin Co. Ltd. | | 7,017,200 | 150,234,204 |
| Merck KGaA | | 790,673 | 149,989,426 |
| Novo Nordisk A.S., “B” | | 3,494,897 | 494,755,102 |
| Roche Holding AG | | 1,492,605 | 430,737,420 |
| Sanofi | | 1,160,581 | 109,116,572 |
| Santen Pharmaceutical Co. Ltd. | | 11,245,100 | 85,894,047 |
| | | | | $1,537,182,749 |
| Printing & Publishing – 0.6% | |
| Wolters Kluwer N.V. | | 744,184 | $86,150,628 |
Portfolio of Investments (unaudited) – continued
| Issuer | | | Shares/Par | Value ($) |
| Common Stocks – continued |
| Real Estate – 1.5% | |
| ESR Group Ltd. | | 27,498,000 | $46,732,657 |
| Grand City Properties S.A. | | 5,202,848 | 53,186,982 |
| LEG Immobilien SE | | 1,701,393 | 123,773,926 |
| | | | | $223,693,565 |
| Restaurants – 0.6% | |
| Yum China Holdings, Inc. | | 1,630,673 | $95,769,425 |
| Specialty Chemicals – 7.7% | |
| Akzo Nobel N.V. | | 1,511,344 | $110,683,463 |
| Croda International PLC | | 1,786,280 | 140,992,872 |
| Kansai Paint Co. Ltd. | | 3,352,300 | 44,958,318 |
| Linde PLC | | 1,304,175 | 449,416,800 |
| Nitto Denko Corp. | | 1,891,400 | 113,910,470 |
| Sika AG | | 560,084 | 156,931,749 |
| Symrise AG | | 1,304,623 | 133,574,249 |
| | | | | $1,150,467,921 |
| Specialty Stores – 0.3% | |
| Meituan, “B” (a) | | 165,250 | $2,865,254 |
| ZOZO, Inc. | | 2,060,500 | 45,778,800 |
| | | | | $48,644,054 |
| Telecommunications - Wireless – 2.5% | |
| Advanced Info Service Public Co. Ltd. | | 14,517,200 | $82,975,967 |
| Cellnex Telecom S.A. | | 2,478,106 | 93,206,024 |
| KDDI Corp. | | 4,161,600 | 121,832,747 |
| SoftBank Group Corp. | | 1,922,500 | 77,899,692 |
| | | | | $375,914,430 |
| Telephone Services – 0.4% | |
| Hellenic Telecommunications Organization S.A. | | 3,750,696 | $57,602,434 |
| Tobacco – 1.3% | |
| British American Tobacco PLC | | 5,241,325 | $198,182,796 |
| Utilities - Electric Power – 2.1% | |
| CLP Holdings Ltd. | | 8,788,500 | $62,195,986 |
| E.ON SE | | 7,248,797 | 79,315,631 |
| Iberdrola S.A. | | 14,477,391 | 166,372,824 |
| | | | | $307,884,441 |
| Total Common Stocks (Identified Cost, $12,141,348,380) | | $14,672,845,236 |
Portfolio of Investments (unaudited) – continued
| Issuer | Strike
Price | First
Exercise | Shares/Par | Value ($) |
| Warrants – 0.0% | | | | |
| Apparel Manufacturers – 0.0% |
| Compagnie Financiere Richemont S.A. (1 share for 2 warrants, Expiration 12/04/23) (a) (Identified Cost, $18,000) | CHF 67 | 11/20/23 | 2,052,106 | $2,396,684 |
| | | | | |
| Investment Companies (h) – 1.9% |
| Money Market Funds – 1.9% | |
| MFS Institutional Money Market Portfolio, 4.55% (v) (Identified Cost, $276,063,527) | | | 276,050,271 | $276,050,271 |
|
|
| Other Assets, Less Liabilities – 0.3% | | 48,799,247 |
| Net Assets – 100.0% | $15,000,091,438 |
| (a) | Non-income producing security. | | | |
| (h) | An affiliated issuer, which may be considered one in which the fund owns 5% or more of the outstanding voting securities, or a company which is under common control. At period end, the aggregate values of the fund's investments in affiliated issuers and in unaffiliated issuers were $276,050,271 and $14,675,241,920, respectively. | | | |
| (l) | A portion of this security is on loan. See Note 2 for additional information. | | | |
| (v) | Affiliated issuer that is available only to investment companies managed by MFS. The rate quoted for the MFS Institutional Money Market Portfolio is the annualized seven-day yield of the fund at period end. | | | |
| The following abbreviations are used in this report and are defined: |
| ADR | American Depositary Receipt |
| Abbreviations indicate amounts shown in currencies other than the U.S. dollar. All amounts are stated in U.S. dollars unless otherwise indicated. A list of abbreviations is shown below: |
| CHF | Swiss Franc |
See Notes to Financial Statements
Financial Statements
Statement of Assets and Liabilities
At 2/28/23 (unaudited)
This statement represents your fund’s balance sheet, which details the assets and liabilities comprising the total value of the fund.
| Assets | |
| Investments in unaffiliated issuers, at value, including $1,200,957 of securities on loan (identified cost, $12,141,366,380) | $14,675,241,920 |
| Investments in affiliated issuers, at value (identified cost, $276,063,527) | 276,050,271 |
| Foreign currency, at value (identified cost, $5,059) | 5,059 |
| Receivables for | |
| Investments sold | 20,284,981 |
| Fund shares sold | 6,140,310 |
| Interest and dividends | 61,785,353 |
| Other assets | 47,351 |
| Total assets | $15,039,555,245 |
| Liabilities | |
| Payable to custodian | $4,557,888 |
| Payables for | |
| Investments purchased | 19,717,728 |
| Fund shares reacquired | 8,235,524 |
| Payable to affiliates | |
| Investment adviser | 512,635 |
| Administrative services fee | 3,538 |
| Shareholder servicing costs | 777,891 |
| Distribution and service fees | 13,798 |
| Payable for independent Trustees' compensation | 18,610 |
| Deferred country tax expense payable | 3,179,034 |
| Accrued expenses and other liabilities | 2,447,161 |
| Total liabilities | $39,463,807 |
| Net assets | $15,000,091,438 |
| Net assets consist of | |
| Paid-in capital | $13,119,510,903 |
| Total distributable earnings (loss) | 1,880,580,535 |
| Net assets | $15,000,091,438 |
| Shares of beneficial interest outstanding | 727,002,451 |
Statement of Assets and Liabilities (unaudited) – continued
| | Net assets | Shares
outstanding | Net asset value
per share (a) |
| Class A | $683,726,833 | 33,060,072 | $20.68 |
| Class B | 942,110 | 46,938 | 20.07 |
| Class C | 13,079,166 | 673,087 | 19.43 |
| Class I | 1,573,920,107 | 73,332,014 | 21.46 |
| Class R1 | 10,641,733 | 564,759 | 18.84 |
| Class R2 | 78,472,404 | 3,935,337 | 19.94 |
| Class R3 | 63,980,763 | 3,128,552 | 20.45 |
| Class R4 | 72,374,258 | 3,494,048 | 20.71 |
| Class R6 | 12,502,954,064 | 608,767,644 | 20.54 |
| (a) | Maximum offering price per share was equal to the net asset value per share for all share classes, except for Class A, for which the maximum offering price per share was $21.94 [100 / 94.25 x $20.68]. On sales of $50,000 or more, the maximum offering price of Class A shares is reduced. A contingent deferred sales charge may be imposed on redemptions of Class A, Class B, and Class C shares. Redemption price per share was equal to the net asset value per share for Classes I, R1, R2, R3, R4, and R6. |
See Notes to Financial Statements
Financial Statements
Statement of Operations
Six months ended 2/28/23 (unaudited)
This statement describes how much your fund earned in investment income and accrued in expenses. It also describes any gains and/or losses generated by fund operations.
| Net investment income (loss) | |
| Income | |
| Dividends | $108,496,405 |
| Dividends from affiliated issuers | 2,414,183 |
| Income on securities loaned | 137,462 |
| Other | 910 |
| Foreign taxes withheld | (3,777,722) |
| Total investment income | $107,271,238 |
| Expenses | |
| Management fee | $45,341,045 |
| Distribution and service fees | 1,175,560 |
| Shareholder servicing costs | 1,408,345 |
| Administrative services fee | 316,715 |
| Independent Trustees' compensation | 60,953 |
| Custodian fee | 792,336 |
| Shareholder communications | 99,331 |
| Audit and tax fees | 40,709 |
| Legal fees | 33,520 |
| Miscellaneous | 1,200,365 |
| Total expenses | $50,468,879 |
| Reduction of expenses by investment adviser and distributor | (941,919) |
| Net expenses | $49,526,960 |
| Net investment income (loss) | $57,744,278 |
| Realized and unrealized gain (loss) |
| Realized gain (loss) (identified cost basis) | |
| Unaffiliated issuers (net of $95,067 country tax) | $(458,142,893) |
| Affiliated issuers | 5,847 |
| Foreign currency | (1,020,244) |
| Net realized gain (loss) | $(459,157,290) |
| Change in unrealized appreciation or depreciation | |
| Unaffiliated issuers (net of $1,268,273 increase in deferred country tax) | $1,613,984,412 |
| Affiliated issuers | (15,879) |
| Translation of assets and liabilities in foreign currencies | 1,665,638 |
| Net unrealized gain (loss) | $1,615,634,171 |
| Net realized and unrealized gain (loss) | $1,156,476,881 |
| Change in net assets from operations | $1,214,221,159 |
See Notes to Financial Statements
Financial Statements
Statements of Changes in Net Assets
These statements describe the increases and/or decreases in net assets resulting from operations, any distributions, and any shareholder transactions.
| | Six months ended | Year ended |
| | 2/28/23
(unaudited) | 8/31/22 |
| Change in net assets | | |
| From operations | | |
| Net investment income (loss) | $57,744,278 | $251,448,594 |
| Net realized gain (loss) | (459,157,290) | (39,205,562) |
| Net unrealized gain (loss) | 1,615,634,171 | (3,962,879,823) |
| Change in net assets from operations | $1,214,221,159 | $(3,750,636,791) |
| Total distributions to shareholders | $(245,003,054) | $(237,804,624) |
| Change in net assets from fund share transactions | $(11,538,227) | $784,984,932 |
| Total change in net assets | $957,679,878 | $(3,203,456,483) |
| Net assets | | |
| At beginning of period | 14,042,411,560 | 17,245,868,043 |
| At end of period | $15,000,091,438 | $14,042,411,560 |
See Notes to Financial Statements
Financial Statements
Financial Highlights
The financial highlights table is intended to help you understand the fund's financial performance for the semiannual period and the past 5 fiscal years. Certain information reflects financial results for a single fund share. The total returns in the table represent the rate that an investor would have earned (or lost) on an investment in the fund share class (assuming reinvestment of all distributions) held for the entire period.
| Class A | Six months
ended | Year ended |
| | 2/28/23
(unaudited) | 8/31/22 | 8/31/21 | 8/31/20 | 8/31/19 | 8/31/18 |
| Net asset value, beginning of period | $19.29 | $24.78 | $20.09 | $17.89 | $19.19 | $18.16 |
| Income (loss) from investment operations |
| Net investment income (loss) (d) | $0.05 | $0.28 | $0.21 | $0.19 | $0.32 | $0.26 |
| Net realized and unrealized gain (loss) | 1.61 | (5.52) | 4.64 | 2.33 | (0.77) | 0.97 |
| Total from investment operations | $1.66 | $(5.24) | $4.85 | $2.52 | $(0.45) | $1.23 |
| Less distributions declared to shareholders |
| From net investment income | $(0.27) | $(0.25) | $(0.16) | $(0.32) | $(0.72) | $(0.20) |
| From net realized gain | — | — | — | — | (0.13) | — |
| Total distributions declared to shareholders | $(0.27) | $(0.25) | $(0.16) | $(0.32) | $(0.85) | $(0.20) |
| Net asset value, end of period (x) | $20.68 | $19.29 | $24.78 | $20.09 | $17.89 | $19.19 |
| Total return (%) (r)(s)(t)(x) | 8.66(n) | (21.34) | 24.28 | 14.19 | (1.82) | 6.79 |
Ratios (%) (to average net assets)
and Supplemental data: |
| Expenses before expense reductions | 1.03(a) | 1.02 | 1.02 | 1.07 | 1.10 | 1.09 |
| Expenses after expense reductions | 1.02(a) | 1.00 | 1.00 | 1.06 | 1.09 | 1.08 |
| Net investment income (loss) | 0.50(a)(l) | 1.24 | 0.93 | 1.02 | 1.79 | 1.37 |
| Portfolio turnover | 6(n) | 15 | 19 | 22 | 22 | 25 |
| Net assets at end of period (000 omitted) | $683,727 | $651,907 | $963,468 | $772,695 | $622,639 | $686,128 |
See Notes to Financial Statements
Financial Highlights – continued
| Class B | Six months
ended | Year ended |
| | 2/28/23
(unaudited) | 8/31/22 | 8/31/21 | 8/31/20 | 8/31/19 | 8/31/18 |
| Net asset value, beginning of period | $18.60 | $23.88 | $19.36 | $17.23 | $18.48 | $17.48 |
| Income (loss) from investment operations |
| Net investment income (loss) (d) | $(0.02) | $0.08 | $0.04 | $0.04 | $0.16 | $0.10 |
| Net realized and unrealized gain (loss) | 1.56 | (5.31) | 4.48 | 2.26 | (0.72) | 0.95 |
| Total from investment operations | $1.54 | $(5.23) | $4.52 | $2.30 | $(0.56) | $1.05 |
| Less distributions declared to shareholders |
| From net investment income | $(0.07) | $(0.05) | $— | $(0.17) | $(0.56) | $(0.05) |
| From net realized gain | — | — | — | — | (0.13) | — |
| Total distributions declared to shareholders | $(0.07) | $(0.05) | $— | $(0.17) | $(0.69) | $(0.05) |
| Net asset value, end of period (x) | $20.07 | $18.60 | $23.88 | $19.36 | $17.23 | $18.48 |
| Total return (%) (r)(s)(t)(x) | 8.27(n) | (21.95) | 23.35 | 13.38 | (2.63) | 6.01 |
Ratios (%) (to average net assets)
and Supplemental data: |
| Expenses before expense reductions | 1.78(a) | 1.77 | 1.77 | 1.82 | 1.85 | 1.84 |
| Expenses after expense reductions | 1.77(a) | 1.75 | 1.76 | 1.81 | 1.84 | 1.82 |
| Net investment income (loss) | (0.20)(a)(l) | 0.39 | 0.17 | 0.21 | 0.97 | 0.55 |
| Portfolio turnover | 6(n) | 15 | 19 | 22 | 22 | 25 |
| Net assets at end of period (000 omitted) | $942 | $1,101 | $2,211 | $2,631 | $3,347 | $4,922 |
See Notes to Financial Statements
Financial Highlights – continued
| Class C | Six months
ended | Year ended |
| | 2/28/23
(unaudited) | 8/31/22 | 8/31/21 | 8/31/20 | 8/31/19 | 8/31/18 |
| Net asset value, beginning of period | $18.08 | $23.25 | $18.85 | $16.79 | $17.99 | $17.03 |
| Income (loss) from investment operations |
| Net investment income (loss) (d) | $(0.03) | $0.10 | $0.03 | $0.04 | $0.17 | $0.08 |
| Net realized and unrealized gain (loss) | 1.52 | (5.18) | 4.37 | 2.19 | (0.70) | 0.94 |
| Total from investment operations | $1.49 | $(5.08) | $4.40 | $2.23 | $(0.53) | $1.02 |
| Less distributions declared to shareholders |
| From net investment income | $(0.14) | $(0.09) | $— | $(0.17) | $(0.54) | $(0.06) |
| From net realized gain | — | — | — | — | (0.13) | — |
| Total distributions declared to shareholders | $(0.14) | $(0.09) | $— | $(0.17) | $(0.67) | $(0.06) |
| Net asset value, end of period (x) | $19.43 | $18.08 | $23.25 | $18.85 | $16.79 | $17.99 |
| Total return (%) (r)(s)(t)(x) | 8.27(n) | (21.95) | 23.34 | 13.36 | (2.56) | 5.97 |
Ratios (%) (to average net assets)
and Supplemental data: |
| Expenses before expense reductions | 1.78(a) | 1.77 | 1.77 | 1.82 | 1.85 | 1.84 |
| Expenses after expense reductions | 1.77(a) | 1.75 | 1.75 | 1.81 | 1.84 | 1.83 |
| Net investment income (loss) | (0.29)(a)(l) | 0.46 | 0.16 | 0.23 | 1.05 | 0.44 |
| Portfolio turnover | 6(n) | 15 | 19 | 22 | 22 | 25 |
| Net assets at end of period (000 omitted) | $13,079 | $11,050 | $15,664 | $17,620 | $22,825 | $27,800 |
See Notes to Financial Statements
Financial Highlights – continued
| Class I | Six months
ended | Year ended |
| | 2/28/23
(unaudited) | 8/31/22 | 8/31/21 | 8/31/20 | 8/31/19 | 8/31/18 |
| Net asset value, beginning of period | $20.03 | $25.74 | $20.85 | $18.55 | $19.87 | $18.79 |
| Income (loss) from investment operations |
| Net investment income (loss) (d) | $0.08 | $0.35 | $0.28 | $0.24 | $0.37 | $0.26 |
| Net realized and unrealized gain (loss) | 1.67 | (5.73) | 4.82 | 2.43 | (0.80) | 1.06 |
| Total from investment operations | $1.75 | $(5.38) | $5.10 | $2.67 | $(0.43) | $1.32 |
| Less distributions declared to shareholders |
| From net investment income | $(0.32) | $(0.33) | $(0.21) | $(0.37) | $(0.76) | $(0.24) |
| From net realized gain | — | — | — | — | (0.13) | — |
| Total distributions declared to shareholders | $(0.32) | $(0.33) | $(0.21) | $(0.37) | $(0.89) | $(0.24) |
| Net asset value, end of period (x) | $21.46 | $20.03 | $25.74 | $20.85 | $18.55 | $19.87 |
| Total return (%) (r)(s)(t)(x) | 8.81(n) | (21.18) | 24.62 | 14.48 | (1.61) | 7.05 |
Ratios (%) (to average net assets)
and Supplemental data: |
| Expenses before expense reductions | 0.78(a) | 0.77 | 0.76 | 0.82 | 0.85 | 0.84 |
| Expenses after expense reductions | 0.77(a) | 0.75 | 0.75 | 0.81 | 0.84 | 0.83 |
| Net investment income (loss) | 0.76(a)(l) | 1.52 | 1.21 | 1.25 | 2.03 | 1.31 |
| Portfolio turnover | 6(n) | 15 | 19 | 22 | 22 | 25 |
| Net assets at end of period (000 omitted) | $1,573,920 | $1,533,541 | $1,530,130 | $898,821 | $593,064 | $658,193 |
See Notes to Financial Statements
Financial Highlights – continued
| Class R1 | Six months
ended | Year ended |
| | 2/28/23
(unaudited) | 8/31/22 | 8/31/21 | 8/31/20 | 8/31/19 | 8/31/18 |
| Net asset value, beginning of period | $17.65 | $22.75 | $18.45 | $16.46 | $17.72 | $16.80 |
| Income (loss) from investment operations |
| Net investment income (loss) (d) | $(0.04) | $0.14 | $0.05 | $0.03 | $0.15 | $0.11 |
| Net realized and unrealized gain (loss) | 1.49 | (5.12) | 4.26 | 2.17 | (0.69) | 0.90 |
| Total from investment operations | $1.45 | $(4.98) | $4.31 | $2.20 | $(0.54) | $1.01 |
| Less distributions declared to shareholders |
| From net investment income | $(0.26) | $(0.12) | $(0.01) | $(0.21) | $(0.59) | $(0.09) |
| From net realized gain | — | — | — | — | (0.13) | — |
| Total distributions declared to shareholders | $(0.26) | $(0.12) | $(0.01) | $(0.21) | $(0.72) | $(0.09) |
| Net asset value, end of period (x) | $18.84 | $17.65 | $22.75 | $18.45 | $16.46 | $17.72 |
| Total return (%) (r)(s)(t)(x) | 8.28(n) | (21.99) | 23.39 | 13.40 | (2.62) | 5.99 |
Ratios (%) (to average net assets)
and Supplemental data: |
| Expenses before expense reductions | 1.78(a) | 1.77 | 1.76 | 1.82 | 1.85 | 1.84 |
| Expenses after expense reductions | 1.77(a) | 1.76 | 1.75 | 1.81 | 1.84 | 1.83 |
| Net investment income (loss) | (0.45)(a)(l) | 0.71 | 0.24 | 0.19 | 0.95 | 0.60 |
| Portfolio turnover | 6(n) | 15 | 19 | 22 | 22 | 25 |
| Net assets at end of period (000 omitted) | $10,642 | $3,600 | $3,042 | $1,628 | $1,751 | $2,153 |
See Notes to Financial Statements
Financial Highlights – continued
| Class R2 | Six months
ended | Year ended |
| | 2/28/23
(unaudited) | 8/31/22 | 8/31/21 | 8/31/20 | 8/31/19 | 8/31/18 |
| Net asset value, beginning of period | $18.58 | $23.90 | $19.37 | $17.25 | $18.53 | $17.55 |
| Income (loss) from investment operations |
| Net investment income (loss) (d) | $0.02 | $0.21 | $0.15 | $0.13 | $0.26 | $0.19 |
| Net realized and unrealized gain (loss) | 1.56 | (5.33) | 4.49 | 2.26 | (0.75) | 0.95 |
| Total from investment operations | $1.58 | $(5.12) | $4.64 | $2.39 | $(0.49) | $1.14 |
| Less distributions declared to shareholders |
| From net investment income | $(0.22) | $(0.20) | $(0.11) | $(0.27) | $(0.66) | $(0.16) |
| From net realized gain | — | — | — | — | (0.13) | — |
| Total distributions declared to shareholders | $(0.22) | $(0.20) | $(0.11) | $(0.27) | $(0.79) | $(0.16) |
| Net asset value, end of period (x) | $19.94 | $18.58 | $23.90 | $19.37 | $17.25 | $18.53 |
| Total return (%) (r)(s)(t)(x) | 8.56(n) | (21.58) | 24.02 | 13.95 | (2.14) | 6.49 |
Ratios (%) (to average net assets)
and Supplemental data: |
| Expenses before expense reductions | 1.28(a) | 1.27 | 1.27 | 1.32 | 1.35 | 1.34 |
| Expenses after expense reductions | 1.27(a) | 1.25 | 1.25 | 1.31 | 1.34 | 1.33 |
| Net investment income (loss) | 0.25(a)(l) | 0.97 | 0.70 | 0.73 | 1.51 | 1.04 |
| Portfolio turnover | 6(n) | 15 | 19 | 22 | 22 | 25 |
| Net assets at end of period (000 omitted) | $78,472 | $75,398 | $104,975 | $89,943 | $98,935 | $121,197 |
See Notes to Financial Statements
Financial Highlights – continued
| Class R3 | Six months
ended | Year ended |
| | 2/28/23
(unaudited) | 8/31/22 | 8/31/21 | 8/31/20 | 8/31/19 | 8/31/18 |
| Net asset value, beginning of period | $19.08 | $24.53 | $19.88 | $17.70 | $18.99 | $17.98 |
| Income (loss) from investment operations |
| Net investment income (loss) (d) | $0.05 | $0.27 | $0.21 | $0.18 | $0.30 | $0.25 |
| Net realized and unrealized gain (loss) | 1.59 | (5.46) | 4.60 | 2.32 | (0.75) | 0.96 |
| Total from investment operations | $1.64 | $(5.19) | $4.81 | $2.50 | $(0.45) | $1.21 |
| Less distributions declared to shareholders |
| From net investment income | $(0.27) | $(0.26) | $(0.16) | $(0.32) | $(0.71) | $(0.20) |
| From net realized gain | — | — | — | — | (0.13) | — |
| Total distributions declared to shareholders | $(0.27) | $(0.26) | $(0.16) | $(0.32) | $(0.84) | $(0.20) |
| Net asset value, end of period (x) | $20.45 | $19.08 | $24.53 | $19.88 | $17.70 | $18.99 |
| Total return (%) (r)(s)(t)(x) | 8.67(n) | (21.37) | 24.30 | 14.21 | (1.83) | 6.75 |
Ratios (%) (to average net assets)
and Supplemental data: |
| Expenses before expense reductions | 1.03(a) | 1.02 | 1.02 | 1.07 | 1.10 | 1.09 |
| Expenses after expense reductions | 1.02(a) | 1.00 | 1.00 | 1.06 | 1.09 | 1.08 |
| Net investment income (loss) | 0.49(a)(l) | 1.22 | 0.96 | 0.99 | 1.73 | 1.31 |
| Portfolio turnover | 6(n) | 15 | 19 | 22 | 22 | 25 |
| Net assets at end of period (000 omitted) | $63,981 | $58,785 | $76,512 | $63,920 | $61,214 | $82,289 |
See Notes to Financial Statements
Financial Highlights – continued
| Class R4 | Six months
ended | Year ended |
| | 2/28/23
(unaudited) | 8/31/22 | 8/31/21 | 8/31/20 | 8/31/19 | 8/31/18 |
| Net asset value, beginning of period | $19.34 | $24.86 | $20.15 | $17.93 | $19.25 | $18.21 |
| Income (loss) from investment operations |
| Net investment income (loss) (d) | $0.07 | $0.33 | $0.29 | $0.23 | $0.36 | $0.30 |
| Net realized and unrealized gain (loss) | 1.62 | (5.53) | 4.63 | 2.35 | (0.78) | 0.98 |
| Total from investment operations | $1.69 | $(5.20) | $4.92 | $2.58 | $(0.42) | $1.28 |
| Less distributions declared to shareholders |
| From net investment income | $(0.32) | $(0.32) | $(0.21) | $(0.36) | $(0.77) | $(0.24) |
| From net realized gain | — | — | — | — | (0.13) | — |
| Total distributions declared to shareholders | $(0.32) | $(0.32) | $(0.21) | $(0.36) | $(0.90) | $(0.24) |
| Net asset value, end of period (x) | $20.71 | $19.34 | $24.86 | $20.15 | $17.93 | $19.25 |
| Total return (%) (r)(s)(t)(x) | 8.82(n) | (21.17) | 24.58 | 14.49 | (1.65) | 7.07 |
Ratios (%) (to average net assets)
and Supplemental data: |
| Expenses before expense reductions | 0.78(a) | 0.77 | 0.76 | 0.82 | 0.85 | 0.84 |
| Expenses after expense reductions | 0.77(a) | 0.75 | 0.75 | 0.81 | 0.84 | 0.83 |
| Net investment income (loss) | 0.75(a)(l) | 1.45 | 1.26 | 1.24 | 2.04 | 1.57 |
| Portfolio turnover | 6(n) | 15 | 19 | 22 | 22 | 25 |
| Net assets at end of period (000 omitted) | $72,374 | $68,971 | $96,499 | $41,619 | $54,352 | $58,578 |
See Notes to Financial Statements
Financial Highlights – continued
| Class R6 | Six months
ended | Year ended |
| | 2/28/23
(unaudited) | 8/31/22 | 8/31/21 | 8/31/20 | 8/31/19 | 8/31/18 |
| Net asset value, beginning of period | $19.19 | $24.67 | $19.99 | $17.80 | $19.11 | $18.10 |
| Income (loss) from investment operations |
| Net investment income (loss) (d) | $0.08 | $0.36 | $0.29 | $0.25 | $0.38 | $0.34 |
| Net realized and unrealized gain (loss) | 1.62 | (5.49) | 4.62 | 2.33 | (0.77) | 0.95 |
| Total from investment operations | $1.70 | $(5.13) | $4.91 | $2.58 | $(0.39) | $1.29 |
| Less distributions declared to shareholders |
| From net investment income | $(0.35) | $(0.35) | $(0.23) | $(0.39) | $(0.79) | $(0.28) |
| From net realized gain | — | — | — | — | (0.13) | — |
| Total distributions declared to shareholders | $(0.35) | $(0.35) | $(0.23) | $(0.39) | $(0.92) | $(0.28) |
| Net asset value, end of period (x) | $20.54 | $19.19 | $24.67 | $19.99 | $17.80 | $19.11 |
| Total return (%) (r)(s)(t)(x) | 8.91(n) | (21.09) | 24.74 | 14.61 | (1.48) | 7.12 |
Ratios (%) (to average net assets)
and Supplemental data: |
| Expenses before expense reductions | 0.68(a) | 0.65 | 0.67 | 0.71 | 0.74 | 0.74 |
| Expenses after expense reductions | 0.67(a) | 0.64 | 0.65 | 0.70 | 0.73 | 0.73 |
| Net investment income (loss) | 0.85(a)(l) | 1.60 | 1.30 | 1.37 | 2.18 | 1.80 |
| Portfolio turnover | 6(n) | 15 | 19 | 22 | 22 | 25 |
| Net assets at end of period (000 omitted) | $12,502,954 | $11,638,059 | $14,433,482 | $9,787,763 | $7,350,641 | $6,756,773 |
| (a) | Annualized. |
| (d) | Per share data is based on average shares outstanding. |
| (l) | Recognition of net investment income by the fund may be affected by the timing of the declaration of dividends by companies in which the fund invests and the actual annual net investment income ratio may differ. |
| (n) | Not annualized. |
| (r) | Certain expenses have been reduced without which performance would have been lower. |
| (s) | From time to time the fund may receive proceeds from litigation settlements, without which performance would be lower. |
| (t) | Total returns do not include any applicable sales charges. |
| (x) | The net asset values and total returns have been calculated on net assets which include adjustments made in accordance with U.S. generally accepted accounting principles required at period end for financial reporting purposes. |
See Notes to Financial Statements
Notes to Financial Statements
(unaudited)
(1) Business and Organization
MFS Research International Fund (the fund) is a diversified series of MFS Series Trust I (the trust). The trust is organized as a Massachusetts business trust and is registered under the Investment Company Act of 1940, as amended, as an open-end management investment company.
The fund is an investment company and accordingly follows the investment company accounting and reporting guidance of the Financial Accounting Standards Board (FASB) Accounting Standards Codification Topic 946 Financial Services - Investment Companies.
(2) Significant Accounting Policies
General — The preparation of financial statements in conformity with U.S. generally accepted accounting principles requires management to make estimates and assumptions that affect the reported amounts of assets and liabilities, and disclosure of contingent assets and liabilities at the date of the financial statements and the reported amounts of increases and decreases in net assets from operations during the reporting period. Actual results could differ from those estimates. In the preparation of these financial statements, management has evaluated subsequent events occurring after the date of the fund’s Statement of Assets and Liabilities through the date that the financial statements were issued. The fund invests in foreign securities. Investments in foreign securities are vulnerable to the effects of changes in the relative values of the local currency and the U.S. dollar and to the effects of changes in each country’s market, economic, industrial, political, regulatory, geopolitical, environmental, public health, and other conditions.
Balance Sheet Offsetting — The fund's accounting policy with respect to balance sheet offsetting is that, absent an event of default by the counterparty or a termination of the agreement, the International Swaps and Derivatives Association (ISDA) Master Agreement, or similar agreement, does not result in an offset of reported amounts of financial assets and financial liabilities in the Statement of Assets and Liabilities across transactions between the fund and the applicable counterparty. The fund's right to setoff may be restricted or prohibited by the bankruptcy or insolvency laws of the particular jurisdiction to which a specific master netting agreement counterparty is subject. Balance sheet offsetting disclosures, to the extent applicable to the fund, have been included in the fund’s Significant Accounting Policies note under the captions for each of the fund’s in-scope financial instruments and transactions.
Investment Valuations — Subject to its oversight, the fund's Board of Trustees has delegated primary responsibility for determining or causing to be determined the value of the fund’s investments to MFS as the fund's adviser, pursuant to the fund’s valuation policy and procedures which have been adopted by the adviser and approved by the Board. Effective September 8, 2022, and in accordance with Rule 2a-5 under the Investment Company Act of 1940, the Board of Trustees designated the adviser as the “valuation designee” of the fund. If the adviser, as valuation designee, determines that reliable market quotations are not readily available for an investment, the investment is valued at fair value as determined in good faith by the adviser in accordance with the adviser’s fair valuation policy and procedures.
Notes to Financial Statements (unaudited) - continued
Under the fund's valuation policy and procedures, equity securities, including restricted equity securities, are generally valued at the last sale or official closing price on their primary market or exchange as provided by a third-party pricing service. Equity securities, for which there were no sales reported that day, are generally valued at the last quoted daily bid quotation on their primary market or exchange as provided by a third-party pricing service. Short-term instruments with a maturity at issuance of 60 days or less may be valued at amortized cost, which approximates market value.
Open-end investment companies are generally valued at net asset value per share. The values of foreign securities and other assets and liabilities expressed in foreign currencies are converted to U.S. dollars using the mean of bid and asked prices for rates provided by a third-party pricing service.
Under the fund’s valuation policy and procedures, market quotations are not considered to be readily available for debt instruments, floating rate loans, and many types of derivatives. These investments are generally valued at fair value based on information from third-party pricing services or otherwise determined by the adviser in accordance with the adviser’s fair valuation policy and procedures. Securities and other assets generally valued on the basis of information from a third-party pricing service may also be valued at a broker/dealer bid quotation. In determining values, third-party pricing services can utilize both transaction data and market information such as yield, quality, coupon rate, maturity, type of issue, trading characteristics, spreads and other market data. An investment may also be valued at fair value if the adviser determines that the investment’s value has been materially affected by events occurring after the close of the exchange or market on which the investment is principally traded (such as foreign exchange or market) and prior to the determination of the fund’s net asset value, or after the halt of trading of a specific security where trading does not resume prior to the close of the exchange or market on which the security is principally traded. Events that occur after foreign markets close (such as developments in foreign markets and significant movements in the U.S. markets) and prior to the determination of the fund’s net asset value may be deemed to have a material effect on the value of securities traded in foreign markets. Accordingly, the fund’s foreign equity securities may often be valued at fair value. The adviser generally relies on third-party pricing services or other information (such as the correlation with price movements of similar securities in the same or other markets; the type, cost and investment characteristics of the security; the business and financial condition of the issuer; and trading and other market data) to assist in determining whether to fair value and at what value to fair value an investment. The value of an investment for purposes of calculating the fund’s net asset value can differ depending on the source and method used to determine value. When fair valuation is used, the value of an investment used to determine the fund’s net asset value may differ from quoted or published prices for the same investment. There can be no assurance that the fund could obtain the fair value assigned to an investment if it were to sell the investment at the same time at which the fund determines its net asset value per share.
Various inputs are used in determining the value of the fund's assets or liabilities. These inputs are categorized into three broad levels. In certain cases, the inputs used to measure fair value may fall into different levels of the fair value hierarchy. In such cases, an investment's level within the fair value hierarchy is based on the lowest level of input that is significant to the fair value measurement. The fund's assessment of the significance of a particular input to the fair value measurement in its entirety requires judgment, and considers factors specific to the investment. Level 1 includes unadjusted
Notes to Financial Statements (unaudited) - continued
quoted prices in active markets for identical assets or liabilities. Level 2 includes other significant observable market-based inputs (including quoted prices for similar securities, interest rates, prepayment speed, and credit risk). Level 3 includes significant unobservable inputs, which may include the adviser's own assumptions in determining the fair value of investments. The following is a summary of the levels used as of February 28, 2023 in valuing the fund's assets and liabilities:
| Financial Instruments | Level 1 | Level 2 | Level 3 | Total |
| Equity Securities: | | | | |
| Japan | $2,745,391,792 | $— | $— | $2,745,391,792 |
| France | 2,095,704,877 | — | — | 2,095,704,877 |
| Switzerland | 1,908,052,937 | — | — | 1,908,052,937 |
| United Kingdom | 1,794,949,284 | — | — | 1,794,949,284 |
| United States | 1,149,483,841 | — | — | 1,149,483,841 |
| Germany | 1,112,964,718 | — | — | 1,112,964,718 |
| Hong Kong | 585,408,766 | — | — | 585,408,766 |
| Denmark | 543,334,750 | — | — | 543,334,750 |
| Australia | 516,874,038 | — | — | 516,874,038 |
| Other Countries | 2,016,601,651 | 206,475,266 | — | 2,223,076,917 |
| Mutual Funds | 276,050,271 | — | — | 276,050,271 |
| Total | $14,744,816,925 | $206,475,266 | $— | $14,951,292,191 |
For further information regarding security characteristics, see the Portfolio of Investments.
Foreign Currency Translation — Purchases and sales of foreign investments, income, and expenses are converted into U.S. dollars based upon currency exchange rates prevailing on the respective dates of such transactions or on the reporting date for foreign denominated receivables and payables. Gains and losses attributable to foreign currency exchange rates on sales of securities are recorded for financial statement purposes as net realized gains and losses on investments. Gains and losses attributable to foreign exchange rate movements on receivables, payables, income and expenses are recorded for financial statement purposes as foreign currency transaction gains and losses. That portion of both realized and unrealized gains and losses on investments that results from fluctuations in foreign currency exchange rates is not separately disclosed.
Security Loans — Under its Securities Lending Agency Agreement with the fund, State Street Bank and Trust Company, as lending agent, loans the securities of the fund to certain qualified institutions (the “Borrowers”) approved by the fund. Security loans can be terminated at the discretion of either the lending agent or the fund and the related securities must be returned within the earlier of the standard trade settlement period for such securities or within three business days. The loans are collateralized by cash and/or U.S. Treasury and federal agency obligations in an amount typically at least equal to the market value of the securities loaned. On loans collateralized by cash, the cash collateral is invested in a money market fund. The market value of the loaned securities is determined at the close of business of the fund and any additional required collateral is delivered to the fund on the next business day. The lending agent provides the fund with indemnification against Borrower default. In the event of Borrower default, the lending agent will, for the benefit of the fund, either purchase securities identical to those loaned or, when such purchase is commercially impracticable, pay the
Notes to Financial Statements (unaudited) - continued
fund the market value of the loaned securities. In return, the lending agent assumes the fund's rights to the related collateral. If the collateral value is less than the cost to purchase identical securities, the lending agent is responsible for the shortfall, but only to the extent that such shortfall is not due to a decline in collateral value resulting from collateral reinvestment for which the fund bears the risk of loss. At period end, the fund had investment securities on loan, all of which were classified as equity securities in the fund’s Portfolio of Investments, with a fair value of $1,200,957. The fair value of the fund’s investment securities on loan is presented gross in the Statement of Assets and Liabilities. These loans were collateralized by U.S. Treasury Obligations of $1,265,633 held by the lending agent. The collateral on securities loaned exceeded the value of securities on loan at period end. A portion of the income generated upon investment of the collateral is remitted to the Borrowers, and the remainder is allocated between the fund and the lending agent. On loans collateralized by U.S. Treasury and/or federal agency obligations, a fee is received from the Borrower, and is allocated between the fund and the lending agent. Income from securities lending is separately reported in the Statement of Operations. The dividend and interest income earned on the securities loaned is accounted for in the same manner as other dividend and interest income.
Indemnifications — Under the fund's organizational documents, its officers and Trustees may be indemnified against certain liabilities and expenses arising out of the performance of their duties to the fund. Additionally, in the normal course of business, the fund enters into agreements with service providers that may contain indemnification clauses. The fund's maximum exposure under these agreements is unknown as this would involve future claims that may be made against the fund that have not yet occurred.
Investment Transactions and Income — Investment transactions are recorded on the trade date. Dividends received in cash are recorded on the ex-dividend date. Certain dividends from foreign securities will be recorded when the fund is informed of the dividend if such information is obtained subsequent to the ex-dividend date. Dividend payments received in additional securities are recorded on the ex-dividend date in an amount equal to the value of the security on such date. In determining the net gain or loss on securities sold, the cost of securities is determined on the identified cost basis.
The fund may receive proceeds from litigation settlements. Any proceeds received from litigation involving portfolio holdings are reflected in the Statement of Operations in realized gain/loss if the security has been disposed of by the fund or in unrealized gain/loss if the security is still held by the fund. Any other proceeds from litigation not related to portfolio holdings are reflected as other income in the Statement of Operations.
Tax Matters and Distributions — The fund intends to qualify as a regulated investment company, as defined under Subchapter M of the Internal Revenue Code, and to distribute all of its taxable income, including realized capital gains. As a result, no provision for federal income tax is required. The fund’s federal tax returns, when filed, will remain subject to examination by the Internal Revenue Service for a three year period. Management has analyzed the fund’s tax positions taken on federal and state tax returns for all open tax years and does not believe that there are any uncertain tax positions that require recognition of a tax liability. Foreign taxes, if any, have been accrued by the fund in the accompanying financial statements in accordance with the
Notes to Financial Statements (unaudited) - continued
applicable foreign tax law. Foreign income taxes may be withheld by certain countries in which the fund invests. Additionally, capital gains realized by the fund on securities issued in or by certain foreign countries may be subject to capital gains tax imposed by those countries.
Distributions to shareholders are recorded on the ex-dividend date. Income and capital gain distributions are determined in accordance with income tax regulations, which may differ from U.S. generally accepted accounting principles. Certain capital accounts in the financial statements are periodically adjusted for permanent differences in order to reflect their tax character. These adjustments have no impact on net assets or net asset value per share. Temporary differences which arise from recognizing certain items of income, expense, gain or loss in different periods for financial statement and tax purposes will reverse at some time in the future.
Book/tax differences primarily relate to passive foreign investment companies and wash sale loss deferrals.
The tax character of distributions made during the current period will be determined at fiscal year end. The tax character of distributions declared to shareholders for the last fiscal year is as follows:
| | Year ended
8/31/22 |
| Ordinary income (including any short-term capital gains) | $237,804,624 |
The federal tax cost and the tax basis components of distributable earnings were as follows:
| As of 2/28/23 | |
| Cost of investments | $12,499,203,435 |
| Gross appreciation | 3,300,234,350 |
| Gross depreciation | (848,145,594) |
| Net unrealized appreciation (depreciation) | $2,452,088,756 |
| As of 8/31/22 | |
| Undistributed ordinary income | 165,255,089 |
| Capital loss carryforwards | (85,313,901) |
| Other temporary differences | (3,519,947) |
| Net unrealized appreciation (depreciation) | 834,941,189 |
The aggregate cost above includes prior fiscal year end tax adjustments, if applicable.
As of August 31, 2022, the fund had capital loss carryforwards available to offset future realized gains. These net capital losses may be carried forward indefinitely and their character is retained as short-term and/or long-term losses. Such losses are characterized as follows:
| Short-Term | $(68,643,167) |
| Long-Term | (16,670,734) |
| Total | $(85,313,901) |
Multiple Classes of Shares of Beneficial Interest — The fund offers multiple classes of shares, which differ in their respective distribution, service, and program manager fees. The fund's income, realized and unrealized gain (loss), and common expenses are
Notes to Financial Statements (unaudited) - continued
allocated to shareholders based on the daily net assets of each class. Dividends are declared separately for each class. Differences in per share dividend rates are generally due to differences in separate class expenses. Class B and Class C shares will convert to Class A shares approximately eight years after purchase. Effective March 21, 2022, all Class 529B and Class 529C shares were converted into Class 529A shares. Effective May 20, 2022, all Class 529A shares were redeemed. The fund’s distributions declared to shareholders as reported in the Statements of Changes in Net Assets are presented by class as follows:
| | Six months
ended
2/28/23 | | Year
ended
8/31/22 |
| Class A | $8,922,184 | | $8,307,737 |
| Class B | 3,328 | | 4,207 |
| Class C | 90,661 | | 55,254 |
| Class I | 23,723,332 | | 22,580,996 |
| Class R1 | 150,058 | | 15,980 |
| Class R2 | 899,295 | | 851,018 |
| Class R3 | 858,081 | | 809,844 |
| Class R4 | 1,154,502 | | 1,243,811 |
| Class R6 | 209,201,613 | | 203,740,590 |
| Class 529A | — | | 186,947 |
| Class 529B | — | | 376 |
| Class 529C | — | | 7,864 |
| Total | $245,003,054 | | $237,804,624 |
(3) Transactions with Affiliates
Investment Adviser — The fund has an investment advisory agreement with MFS to provide overall investment management and related administrative services and facilities to the fund. The management fee is computed daily and paid monthly at the following annual rates based on the fund's average daily net assets:
| Up to $1 billion | 0.90% |
| In excess of $1 billion and up to $2 billion | 0.80% |
| In excess of $2 billion and up to $5 billion | 0.70% |
| In excess of $5 billion and up to $10 billion | 0.60% |
| In excess of $10 billion and up to $20 billion | 0.55% |
| In excess of $20 billion | 0.50% |
MFS has agreed in writing to reduce its management fee by a specified amount if certain MFS mutual fund assets exceed thresholds agreed to by MFS and the fund's Board of Trustees. MFS has also agreed in writing to waive at least 0.01% of its management fee as part of this agreement. The agreement to waive at least 0.01% of the management fee will continue until modified by the fund's Board of Trustees, but such agreement will continue at least until December 31, 2023. For the six months ended February 28, 2023, this management fee reduction amounted to $941,901, which is included in the reduction of total expenses in the Statement of Operations.
The management fee incurred for the six months ended February 28, 2023 was equivalent to an annual effective rate of 0.63% of the fund's average daily net assets.
Notes to Financial Statements (unaudited) - continued
Distributor — MFS Fund Distributors, Inc. (MFD), a wholly-owned subsidiary of MFS, as distributor, received $29,725 for the six months ended February 28, 2023, as its portion of the initial sales charge on sales of Class A shares of the fund.
The Board of Trustees has adopted a distribution plan for certain share classes pursuant to Rule 12b-1 of the Investment Company Act of 1940.
The fund's distribution plan provides that the fund will pay MFD for services provided by MFD and financial intermediaries in connection with the distribution and servicing of certain share classes. One component of the plan is a distribution fee paid to MFD and another component of the plan is a service fee paid to MFD. MFD may subsequently pay all, or a portion, of the distribution and/or service fees to financial intermediaries.
Distribution Plan Fee Table:
| | Distribution
Fee Rate (d) | Service
Fee Rate (d) | Total
Distribution
Plan (d) | Annual
Effective
Rate (e) | Distribution
and Service
Fee |
| Class A | — | 0.25% | 0.25% | 0.25% | $ 809,578 |
| Class B | 0.75% | 0.25% | 1.00% | 1.00% | 4,851 |
| Class C | 0.75% | 0.25% | 1.00% | 1.00% | 59,928 |
| Class R1 | 0.75% | 0.25% | 1.00% | 1.00% | 37,137 |
| Class R2 | 0.25% | 0.25% | 0.50% | 0.50% | 188,528 |
| Class R3 | — | 0.25% | 0.25% | 0.25% | 75,538 |
| Total Distribution and Service Fees | | | | | $1,175,560 |
| (d) | In accordance with the distribution plan for certain classes, the fund pays distribution and/or service fees equal to these annual percentage rates of each class’s average daily net assets. The distribution and service fee rates disclosed by class represent the current rates in effect at the end of the reporting period. Any rate changes, if applicable, are detailed below. |
| (e) | The annual effective rates represent actual fees incurred under the distribution plan for the six months ended February 28, 2023 based on each class's average daily net assets. MFD has voluntarily agreed to rebate a portion of each class's 0.25% service fee attributable to accounts for which there is no financial intermediary specified on the account except for accounts attributable to MFS or its affiliates' seed money. For the six months ended February 28, 2023, this rebate amounted to $17 and $1 for Class A and Class B shares, respectively, and is included in the reduction of total expenses in the Statement of Operations. |
Certain Class A shares are subject to a contingent deferred sales charge (CDSC) in the event of a shareholder redemption within 18 months of purchase. Class B shares are subject to a CDSC in the event of a shareholder redemption within six years of purchase. Class C shares are subject to a CDSC in the event of a shareholder redemption within 12 months of purchase. All contingent deferred sales charges are paid to MFD and during the six months ended February 28, 2023, were as follows:
| | Amount |
| Class A | $4,521 |
| Class B | 88 |
| Class C | 103 |
Shareholder Servicing Agent — MFS Service Center, Inc. (MFSC), a wholly-owned subsidiary of MFS, receives a fee from the fund for its services as shareholder servicing agent calculated as a percentage of the average daily net assets of the fund as
Notes to Financial Statements (unaudited) - continued
determined periodically under the supervision of the fund's Board of Trustees. For the six months ended February 28, 2023, the fee was $74,406, which equated to 0.0011% annually of the fund's average daily net assets. MFSC also receives reimbursement from the fund for out-of-pocket expenses, sub-accounting and other shareholder servicing costs which may be paid to affiliated and unaffiliated service providers. Class R6 shares do not incur sub-accounting fees. For the six months ended February 28, 2023, these out-of-pocket expenses, sub-accounting and other shareholder servicing costs amounted to $1,333,939.
Administrator — MFS provides certain financial, legal, shareholder communications, compliance, and other administrative services to the fund. Under an administrative services agreement, the fund reimburses MFS the costs incurred to provide these services. The fund is charged an annual fixed amount of $17,500 plus a fee based on average daily net assets. The administrative services fee incurred for the six months ended February 28, 2023 was equivalent to an annual effective rate of 0.0045% of the fund's average daily net assets.
Trustees’ and Officers’ Compensation — The fund pays compensation to independent Trustees in the form of a retainer, attendance fees, and additional compensation to Board and Committee chairpersons. The fund does not pay compensation directly to Trustees or officers of the fund who are also officers of the investment adviser, all of whom receive remuneration from MFS for their services to the fund. Certain officers and Trustees of the fund are officers or directors of MFS, MFD, and MFSC.
Other — The fund invests in the MFS Institutional Money Market Portfolio which is managed by MFS and seeks current income consistent with preservation of capital and liquidity. This money market fund does not pay a management fee to MFS but does incur investment and operating costs.
The fund is permitted to engage in purchase and sale transactions with funds and accounts for which MFS serves as investment adviser or sub-adviser (“cross-trades”) pursuant to a policy adopted by the Board of Trustees. This policy has been designed to ensure that cross-trades conducted by the fund comply with Rule 17a-7 under the Investment Company Act of 1940. During the six months ended February 28, 2023, the fund engaged in sale transactions pursuant to this policy, which amounted to $11,435,433. The sales transactions resulted in net realized gains (losses) of $(1,485,654).
(4) Portfolio Securities
For the six months ended February 28, 2023, purchases and sales of investments, other than short-term obligations, aggregated $860,296,970 and $1,153,986,985, respectively.
Notes to Financial Statements (unaudited) - continued
(5) Shares of Beneficial Interest
The fund's Declaration of Trust permits the Trustees to issue an unlimited number of full and fractional shares of beneficial interest. Transactions in fund shares were as follows:
| | Six months ended
2/28/23 | | Year ended
8/31/22 |
| | Shares | Amount | | Shares | Amount |
| Shares sold | | | | | |
| Class A | 4,818,828 | $90,607,379 | | 10,553,698 | $225,924,005 |
| Class B | 2 | 45 | | 1,119 | 24,376 |
| Class C | 163,827 | 2,945,670 | | 120,033 | 2,440,571 |
| Class I | 14,695,195 | 298,532,585 | | 41,161,498 | 966,958,198 |
| Class R1 | 406,751 | 7,420,505 | | 119,482 | 2,420,401 |
| Class R2 | 324,180 | 6,179,277 | | 835,415 | 18,078,755 |
| Class R3 | 423,287 | 8,327,442 | | 866,170 | 19,276,792 |
| Class R4 | 336,840 | 6,619,019 | | 616,499 | 13,541,480 |
| Class R6 | 25,537,932 | 503,814,899 | | 46,195,626 | 1,036,050,594 |
| Class 529A | — | �� | | 135,894 | 3,000,678 |
| Class 529B | — | — | | 741 | 16,396 |
| Class 529C | — | — | | 9,562 | 207,671 |
| | 46,706,842 | $924,446,821 | | 100,615,737 | $2,287,939,917 |
Shares issued to shareholders
in reinvestment of distributions | | | | | |
| Class A | 410,746 | $8,223,125 | | 313,946 | $7,619,463 |
| Class B | 162 | 3,155 | | 143 | 3,364 |
| Class C | 4,338 | 81,769 | | 2,268 | 51,886 |
| Class I | 1,056,819 | 21,950,138 | | 795,596 | 20,017,192 |
| Class R1 | 8,209 | 150,058 | | 715 | 15,980 |
| Class R2 | 46,525 | 898,869 | | 36,242 | 849,152 |
| Class R3 | 43,330 | 857,936 | | 33,729 | 809,844 |
| Class R4 | 56,594 | 1,134,152 | | 49,603 | 1,205,350 |
| Class R6 | 9,869,794 | 196,112,812 | | 7,918,001 | 190,744,636 |
| Class 529A | — | — | | 7,774 | 184,710 |
| Class 529B | — | — | | 17 | 376 |
| Class 529C | — | — | | 356 | 7,817 |
| | 11,496,517 | $229,412,014 | | 9,158,390 | $221,509,770 |
Notes to Financial Statements (unaudited) - continued
| | Six months ended
2/28/23 | | Year ended
8/31/22 |
| | Shares | Amount | | Shares | Amount |
| Shares reacquired | | | | | |
| Class A | (5,972,263) | $(112,200,907) | | (15,939,834) | $(364,600,013) |
| Class B | (12,419) | (228,591) | | (34,664) | (754,476) |
| Class C | (106,333) | (1,951,384) | | (184,714) | (3,842,213) |
| Class I | (18,986,465) | (383,026,803) | | (24,842,490) | (557,285,533) |
| Class R1 | (54,115) | (999,226) | | (50,005) | (988,953) |
| Class R2 | (493,114) | (9,454,100) | | (1,206,840) | (26,339,521) |
| Class R3 | (419,661) | (8,312,876) | | (938,020) | (20,911,186) |
| Class R4 | (465,320) | (9,204,727) | | (981,315) | (22,668,338) |
| Class R6 | (33,014,073) | (640,018,448) | | (32,800,974) | (707,295,374) |
| Class 529A | — | — | | (870,095) | (17,524,590) |
| Class 529B | — | — | | (8,857) | (184,299) |
| Class 529C | — | — | | (102,803) | (2,070,259) |
| | (59,523,763) | $(1,165,397,062) | | (77,960,611) | $(1,724,464,755) |
| Net change | | | | | |
| Class A | (742,689) | $(13,370,403) | | (5,072,190) | $(131,056,545) |
| Class B | (12,255) | (225,391) | | (33,402) | (726,736) |
| Class C | 61,832 | 1,076,055 | | (62,413) | (1,349,756) |
| Class I | (3,234,451) | (62,544,080) | | 17,114,604 | 429,689,857 |
| Class R1 | 360,845 | 6,571,337 | | 70,192 | 1,447,428 |
| Class R2 | (122,409) | (2,375,954) | | (335,183) | (7,411,614) |
| Class R3 | 46,956 | 872,502 | | (38,121) | (824,550) |
| Class R4 | (71,886) | (1,451,556) | | (315,213) | (7,921,508) |
| Class R6 | 2,393,653 | 59,909,263 | | 21,312,653 | 519,499,856 |
| Class 529A | — | — | | (726,427) | (14,339,202) |
| Class 529B | — | — | | (8,099) | (167,527) |
| Class 529C | — | — | | (92,885) | (1,854,771) |
| | (1,320,404) | $(11,538,227) | | 31,813,516 | $784,984,932 |
The fund is one of several mutual funds in which certain MFS funds may invest. The MFS funds do not invest in the underlying funds for the purpose of exercising management or control. At the end of the period, the MFS International Diversification Fund, the MFS Growth Allocation Fund, the MFS Moderate Allocation Fund, and the MFS Aggressive Growth Allocation Fund were the owners of record of approximately 62%, 3%, 2%, and 1%, respectively, of the value of outstanding voting shares of the fund. In addition, the MFS Conservative Allocation Fund, the MFS Lifetime 2025 Fund, the MFS Lifetime 2030 Fund, the MFS Lifetime 2035 Fund, the MFS Lifetime 2040 Fund, the MFS Lifetime 2045 Fund, the MFS Lifetime 2050 Fund, the MFS Lifetime 2055 Fund, the MFS Lifetime 2060 Fund, the MFS Lifetime 2065 Fund, and the MFS Lifetime Income Fund were each the owners of record of less than 1% of the value of outstanding voting shares of the fund.
Notes to Financial Statements (unaudited) - continued
Effective June 1, 2019, purchases of the fund’s Class B and Class 529B shares were closed to new and existing investors subject to certain exceptions. Effective after the close of business on March 18, 2022, all sales of Class 529B and Class 529C shares were suspended, and Class 529B and Class 529C shares were converted into Class 529A shares of the fund effective March 21, 2022. Effective after the close of business on May 13, 2022, all sales and redemptions of Class 529A shares were suspended, and all Class 529A shares were redeemed on May 20, 2022.
(6) Line of Credit
The fund and certain other funds managed by MFS participate in a $1.45 billion unsecured committed line of credit of which $1.2 billion is reserved for use by the fund and certain other MFS U.S. funds. The line of credit is provided by a syndicate of banks under a credit agreement. Borrowings may be made for temporary financing needs. Interest is charged to each fund, based on its borrowings, generally at a rate equal to the highest of 1) Daily Simple SOFR (Secured Overnight Financing Rate) plus 0.10%, 2) the Federal Funds Effective Rate, or 3) the Overnight Bank Funding Rate, each plus an agreed upon spread. A commitment fee, based on the average daily unused portion of the committed line of credit, is allocated among the participating funds. The line of credit expires on March 14, 2024 unless extended or renewed. In addition, the fund and other funds managed by MFS have established unsecured uncommitted borrowing arrangements with certain banks for temporary financing needs. Interest is charged to each fund, based on its borrowings, at rates equal to customary reference rates plus an agreed upon spread. For the six months ended February 28, 2023, the fund’s commitment fee and interest expense were $35,817 and $0, respectively, and are included in “Miscellaneous” expense in the Statement of Operations.
(7) Investments in Affiliated Issuers
An affiliated issuer may be considered one in which the fund owns 5% or more of the outstanding voting securities, or a company which is under common control. For the purposes of this report, the following were affiliated issuers:
| Affiliated Issuers | Beginning
Value | Purchases | Sales
Proceeds | Realized
Gain
(Loss) | Change in
Unrealized
Appreciation or
Depreciation | Ending
Value |
| MFS Institutional Money Market Portfolio | $151,622,392 | $763,098,769 | $638,660,858 | $5,847 | $(15,879) | $276,050,271 |
| Affiliated Issuers | Dividend
Income | Capital Gain
Distributions |
| MFS Institutional Money Market Portfolio | $2,414,183 | $— |
(8) LIBOR Transition
Certain of the fund's investments, including investments in certain debt instruments and derivatives (if any), as well as borrowings by the fund and certain other contractual arrangements of the fund, may be based on the London Interbank Offered Rate (“LIBOR”). In 2017, the regulatory authority that oversees financial services firms in the United Kingdom announced plans to transition away from LIBOR by the end of 2021. In March 2021, the administrator of LIBOR announced the extension of the publication
Notes to Financial Statements (unaudited) - continued
of the more commonly used U.S. dollar LIBOR settings to the end of June 2023. Although the full impacts of the transition away from LIBOR are not fully known, the transition may result in, among other things, an increase in volatility or illiquidity of the markets for instruments that currently rely on LIBOR to determine interest rates and this could have an adverse impact on the fund's performance. With respect to the fund's accounting for investments, including investments in certain debt instruments and derivatives, as well as borrowings by the fund and any other contractual arrangements of the fund that undergo reference rate-related modifications as a result of the transition, management will rely upon the relief provided by FASB Codification Topic 848 – Reference Rate Reform (Topic 848). The guidance in Topic 848 permits the fund to account for those modified contracts as a continuation of the existing contracts. The situation remains fluid, and management believes, based on best available information, that the impact of the transition will not be material to the fund.
(9) Subsequent Event
On March 30, 2023, the fund announced that effective after the close of business on September 29, 2023, purchases of Class R1 and Class R2 shares will be closed to new eligible investors.
Proxy Voting Policies and Information
MFS votes proxies on behalf of the fund pursuant to proxy voting policies and procedures that are available without charge, upon request, by calling 1-800-225-2606, by visiting mfs.com/proxyvoting, or by visiting the SEC’s Web site at http://www.sec.gov.
Information regarding how the fund voted proxies relating to portfolio securities during the most recent twelve-month period ended June 30 is available by August 31 of each year without charge by visiting mfs.com/proxyvoting, or by visiting the SEC’s Web site at http://www.sec.gov.
Quarterly Portfolio Disclosure
The fund files a complete schedule of portfolio holdings with the SEC for the first and third quarters of each fiscal year as an exhibit to its reports on Form N-PORT. The fund's Form N-PORT reports are available on the SEC's Web site at http://www.sec.gov. A shareholder can obtain the portfolio holdings report for the first and third quarters of the fund's fiscal year at mfs.com/openendfunds by choosing the fund's name and then scrolling to the “Resources” section and clicking on the “Prospectus and Reports” tab.
Further Information
From time to time, MFS may post important information about the fund or the MFS Funds on the MFS Web site (mfs.com). This information is available at https://www.mfs.com/announcements or at mfs.com/openendfunds by choosing the fund’s name and then scrolling to the “Resources” section and clicking on the “Announcements” tab, if any.
Information About Fund Contracts and Legal Claims
The fund has entered into contractual arrangements with an investment adviser, administrator, distributor, shareholder servicing agent, and custodian who each provide services to the fund. Unless expressly stated otherwise, shareholders are not parties to, or intended beneficiaries of these contractual arrangements, and these contractual arrangements are not intended to create any shareholder right to enforce them against the service providers or to seek any remedy under them against the service providers, either directly or on behalf of the fund.
Under the Trust’s By-Laws and Declaration of Trust, any claims asserted against or on behalf of the MFS Funds, including claims against Trustees and Officers, must be brought in state and federal courts located within the Commonwealth of Massachusetts.
Provision of Financial Reports and Summary Prospectuses
The fund produces financial reports every six months and updates its summary prospectus and prospectus annually. To avoid sending duplicate copies of materials to households, only one copy of the fund’s annual and semiannual report and summary prospectus may be mailed to shareholders having the same last name and residential address on the fund’s records. However, any shareholder may contact MFSC (please see back cover for address and telephone number) to request that copies of these reports and summary prospectuses be sent personally to that shareholder.
Save paper with eDelivery.
MFS® will send you prospectuses, reports, and proxies directly via e-mail so you will get information faster with less mailbox clutter.
To sign up:
1. Go to mfs.com.
2. Log in via MFS® Access.
3. Select eDelivery.
If you own your MFS fund shares through a financial institution or a retirement plan, MFS® TALK, MFS® Access, or eDelivery may not be available to you.
CONTACT
WEB SITE
mfs.com
MFS TALK
1-800-637-8255
24 hours a day
ACCOUNT SERVICE AND LITERATURE
Shareholders
1-800-225-2606
Financial advisors
1-800-343-2829
Retirement plan services
1-800-637-1255
MAILING ADDRESS
MFS Service Center, Inc.
P.O. Box 219341
Kansas City, MO 64121-9341
OVERNIGHT MAIL
MFS Service Center, Inc.
Suite 219341
430 W 7th Street
Kansas City, MO 64105-1407
Semiannual Report
February 28, 2023
The report is prepared for the general information of shareholders. It is authorized for distribution to prospective investors only when preceded or accompanied by a current prospectus.
NOT FDIC INSURED • MAY LOSE VALUE • NO BANK GUARANTEE
LETTER FROM THE CHAIR AND CEO
Dear Shareholders:
Markets — which rallied in late 2022 and early 2023 on signs of peaking inflation, hopes that monetary policy tightening cycles may be nearing an end and a rapid reopening of China’s economy — have hit turbulence after the sudden collapse of two US regional banks and the government-led merger of Switzerland’s two largest lenders. At the same time, US inflation data suggest that price pressures will prove more persistent than expected, making the US Federal Reserve’s job of trying to corral four-decade-high inflation without tipping the economy into recession that much more difficult. On a positive note, markets have largely adjusted to the challenges posed by Russia’s invasion of Ukraine, thanks in part to mild European winter weather that has alleviated concerns over potential near-term shortages of natural gas. Resilient labor markets in much of the developed world have further contributed to a brighter-than-expected economic backdrop. However, after the recent banking turmoil, investors are increasingly mindful that the lagged effects of ongoing monetary policy tightening have yet to fully work their way through the global economy.
One result of the banking crisis has been a rally in global government bond markets as investors sense that the global monetary tightening campaign is nearing its end, and the resulting lower yields have eased some of the pressure on interest rate–sensitive parts of the economy. Over the near term, amid tighter financial conditions, we feel companies will face a challenging earnings backdrop as they are forced to absorb higher input and labor costs while pricing power dwindles. As for fixed income, the rise in interest rates in recent months has made bonds more attractive than they have been in years, which may provide balance for investors’ portfolios.
During times of market transition, it is important to have a deep understanding of company fundamentals, and we have built our unique global research platform to do just that.
At MFS®, we put our clients’ assets to work responsibly by carefully navigating increasingly complex global capital markets. Our investment team is guided by a commitment to long-term fundamental investing. Our global investment platform — combining collective expertise, long-term discipline, and thoughtful risk management — seeks to uncover what we believe are the best, most durable investment ideas in markets around the world, enabling us to potentially create value for investors.
Respectfully,
Michael W. Roberge
Chair and Chief Executive Officer
MFS Investment Management
April 14, 2023
The opinions expressed in this letter are subject to change and may not be relied upon for investment advice. No forecasts can be guaranteed.
Portfolio structure
Top ten holdings
| Microsoft Corp. | 12.6% |
| Amazon.com, Inc. | 8.5% |
| Alphabet, Inc., “A” | 8.3% |
| Mastercard, Inc., “A” | 5.8% |
| NVIDIA Corp. | 3.6% |
| Booking Holdings, Inc. | 3.2% |
| Intuit, Inc. | 2.5% |
| Adobe Systems, Inc. | 2.4% |
| Visa, Inc., “A” | 2.4% |
| Accenture PLC, “A” | 2.4% |
Top five industries
| Computer Software | 25.9% |
| Business Services | 13.8% |
| Internet | 11.8% |
| Other Banks & Diversified Financials | 8.8% |
| Specialty Stores | 8.5% |
Cash & Cash Equivalents includes any cash, investments in money market funds, short-term securities, and other assets less liabilities. Please see the Statement of Assets and Liabilities for additional information related to the fund’s cash position and other assets and liabilities.
Other includes equivalent exposure from currency derivatives and/or any offsets to derivative positions and may be negative.
Percentages are based on net assets as of February 28, 2023.
The portfolio is actively managed and current holdings may be different.
Expense Table
Fund expenses borne by the shareholders during the period,
September 1, 2022 through February 28, 2023
As a shareholder of the fund, you incur two types of costs: (1) transaction costs, including sales charges (loads) on certain purchase or redemption payments, and (2) ongoing costs, including management fees; distribution and service (12b-1) fees; and other fund expenses. This example is intended to help you understand your ongoing costs (in dollars) of investing in the fund and to compare these costs with the ongoing costs of investing in other mutual funds.
The example is based on an investment of $1,000 invested at the beginning of the period and held for the entire period September 1, 2022 through February 28, 2023.
Actual Expenses
The first line for each share class in the following table provides information about actual account values and actual expenses. You may use the information in this line, together with the amount you invested, to estimate the expenses that you paid over the period. Simply divide your account value by $1,000 (for example, an $8,600 account value divided by $1,000 = 8.6), then multiply the result by the number in the first line under the heading entitled “Expenses Paid During Period” to estimate the expenses you paid on your account during this period.
Hypothetical Example for Comparison Purposes
The second line for each share class in the following table provides information about hypothetical account values and hypothetical expenses based on the fund’s actual expense ratio and an assumed rate of return of 5% per year before expenses, which is not the fund’s actual return. The hypothetical account values and expenses may not be used to estimate the actual ending account balance or expenses you paid for the period. You may use this information to compare the ongoing costs of investing in the fund and other funds. To do so, compare this 5% hypothetical example with the 5% hypothetical examples that appear in the shareholder reports of the other funds.
Please note that the expenses shown in the table are meant to highlight your ongoing costs only and do not reflect any transactional costs, such as sales charges (loads). Therefore, the second line for each share class in the table is useful in comparing ongoing costs only, and will not help you determine the relative total costs of owning different funds. In addition, if these transactional costs were included, your costs would have been higher.
Expense Table - continued
Share
Class | | Annualized
Expense
Ratio | Beginning
Account Value
9/01/22 | Ending
Account Value
2/28/23 | Expenses
Paid During
Period (p)
9/01/22-2/28/23 |
| A | Actual | 1.15% | $1,000.00 | $964.19 | $5.60 |
| Hypothetical (h) | 1.15% | $1,000.00 | $1,019.09 | $5.76 |
| B | Actual | 1.90% | $1,000.00 | $960.61 | $9.24 |
| Hypothetical (h) | 1.90% | $1,000.00 | $1,015.37 | $9.49 |
| C | Actual | 1.90% | $1,000.00 | $960.52 | $9.24 |
| Hypothetical (h) | 1.90% | $1,000.00 | $1,015.37 | $9.49 |
| I | Actual | 0.90% | $1,000.00 | $965.29 | $4.39 |
| Hypothetical (h) | 0.90% | $1,000.00 | $1,020.33 | $4.51 |
| R1 | Actual | 1.90% | $1,000.00 | $960.39 | $9.24 |
| Hypothetical (h) | 1.90% | $1,000.00 | $1,015.37 | $9.49 |
| R2 | Actual | 1.40% | $1,000.00 | $963.04 | $6.81 |
| Hypothetical (h) | 1.40% | $1,000.00 | $1,017.85 | $7.00 |
| R3 | Actual | 1.15% | $1,000.00 | $964.14 | $5.60 |
| Hypothetical (h) | 1.15% | $1,000.00 | $1,019.09 | $5.76 |
| R4 | Actual | 0.90% | $1,000.00 | $965.35 | $4.39 |
| Hypothetical (h) | 0.90% | $1,000.00 | $1,020.33 | $4.51 |
| R6 | Actual | 0.81% | $1,000.00 | $965.71 | $3.95 |
| Hypothetical (h) | 0.81% | $1,000.00 | $1,020.78 | $4.06 |
| (h) | 5% class return per year before expenses. |
| (p) | “Expenses Paid During Period” are equal to each class’s annualized expense ratio, as shown above, multiplied by the average account value over the period, multiplied by 181/365 (to reflect the one-half year period). Expenses paid do not include any applicable sales charges (loads). If these transaction costs had been included, your costs would have been higher. |
Portfolio of Investments
2/28/23 (unaudited)
The Portfolio of Investments is a complete list of all securities owned by your fund. It is categorized by broad-based asset classes.
| Issuer | | | Shares/Par | Value ($) |
| Common Stocks – 94.8% |
| Brokerage & Asset Managers – 1.6% | |
| Charles Schwab Corp. | | 184,016 | $14,338,527 |
| Tradeweb Markets, Inc. | | 81,334 | 5,765,767 |
| | | | | $20,104,294 |
| Business Services – 13.8% | |
| Accenture PLC, “A” | | 108,887 | $28,914,943 |
| Endava PLC, ADR (a) | | 118,189 | 9,400,753 |
| Equifax, Inc. | | 31,536 | 6,386,986 |
| Factset Research Systems, Inc. | | 7,357 | 3,049,844 |
| Fidelity National Information Services, Inc. | | 145,295 | 9,207,344 |
| FleetCor Technologies, Inc. (a) | | 80,173 | 17,220,359 |
| Global Payments, Inc. | | 132,928 | 14,914,525 |
| Morningstar, Inc. | | 28,673 | 5,944,773 |
| MSCI, Inc. | | 18,091 | 9,446,216 |
| PayPal Holdings, Inc. (a) | | 230,166 | 16,940,218 |
| TaskUs, Inc., “A” (a) | | 134,971 | 2,322,176 |
| Thoughtworks Holding, Inc. (a) | | 583,780 | 4,296,621 |
| TransUnion | | 53,083 | 3,473,221 |
| Verisk Analytics, Inc., “A” | | 62,154 | 10,635,171 |
| WEX, Inc. (a) | | 141,214 | 27,227,471 |
| | | | | $169,380,621 |
| Cable TV – 0.6% | |
| Charter Communications, Inc., “A” (a) | | 19,095 | $7,019,513 |
| Computer Software – 25.9% | |
| Activision Blizzard, Inc. | | 119,903 | $9,142,604 |
| Adobe Systems, Inc. (a) | | 91,044 | 29,493,704 |
| Atlassian Corp. (a) | | 33,272 | 5,467,588 |
| Black Knight, Inc. (a) | | 216,276 | 12,890,049 |
| Dun & Bradstreet Holdings, Inc. | | 569,574 | 6,840,584 |
| Freshworks, Inc, “A” (a) | | 93,365 | 1,394,873 |
| Intuit, Inc. | | 76,598 | 31,189,174 |
| Lumine Group, Inc. (a) | | 22,151 | 226,757 |
| Microsoft Corp. (s) | | 620,831 | 154,847,668 |
| Mobileye Global, Inc., “A” (a) | | 230,496 | 9,106,897 |
| Palo Alto Networks, Inc. (a) | | 72,159 | 13,592,591 |
| Paycor HCM, Inc. (a) | | 154,954 | 3,838,210 |
| RAKUS Co. Ltd. | | 165,100 | 2,055,338 |
| RingCentral, Inc. (a) | | 112,482 | 3,716,405 |
| Salesforce, Inc. (a) | | 171,910 | 28,126,195 |
Portfolio of Investments (unaudited) – continued
| Issuer | | | Shares/Par | Value ($) |
| Common Stocks – continued |
| Computer Software – continued | |
| Topicus.com, Inc. (a) | | 98,970 | $6,435,044 |
| | | | | $318,363,681 |
| Computer Software - Systems – 7.8% | |
| Apple, Inc. | | 35,389 | $5,216,693 |
| Arista Networks, Inc. (a) | | 59,062 | 8,191,899 |
| Constellation Software, Inc. | | 7,383 | 12,694,540 |
| Descartes Systems Group, Inc. (a) | | 155,751 | 11,487,564 |
| Hitachi Ltd. | | 265,000 | 13,410,084 |
| HubSpot, Inc. (a) | | 20,562 | 7,954,615 |
| Nuvei Corp. (a) | | 82,222 | 2,520,104 |
| Q2 Holdings, Inc. (a) | | 104,344 | 3,368,224 |
| ServiceNow, Inc. (a) | | 49,456 | 21,373,400 |
| Shopify, Inc. (a) | | 247,628 | 10,187,416 |
| | | | | $96,404,539 |
| Consumer Services – 3.3% | |
| Booking Holdings, Inc. (a)(s) | | 15,837 | $39,972,588 |
| Electrical Equipment – 0.9% | |
| Amphenol Corp., “A” | | 136,777 | $10,602,953 |
| Electronics – 7.2% | |
| Advanced Micro Devices (a) | | 96,820 | $7,608,116 |
| KLA Corp. | | 40,571 | 15,391,826 |
| Lam Research Corp. | | 9,137 | 4,440,673 |
| Marvell Technology, Inc. | | 374,750 | 16,919,962 |
| NVIDIA Corp. | | 191,861 | 44,542,450 |
| | | | | $88,903,027 |
| Energy - Renewables – 0.4% | |
| Enphase Energy, Inc. (a) | | 21,586 | $4,544,501 |
| Insurance – 3.1% | |
| Aon PLC | | 48,333 | $14,695,648 |
| Arthur J. Gallagher & Co. | | 123,371 | 23,113,557 |
| | | | | $37,809,205 |
| Internet – 11.8% | |
| Alphabet, Inc., “A” (a)(s) | | 1,137,894 | $102,478,734 |
| Gartner, Inc. (a) | | 36,543 | 11,979,161 |
| Meta Platforms, Inc., “A” (a) | | 120,108 | 21,011,693 |
| Pinterest, Inc. (a) | | 98,943 | 2,484,459 |
| Tencent Holdings Ltd. | | 176,200 | 7,712,987 |
| | | | | $145,667,034 |
Portfolio of Investments (unaudited) – continued
| Issuer | | | Shares/Par | Value ($) |
| Common Stocks – continued |
| Leisure & Toys – 0.9% | |
| Take-Two Interactive Software, Inc. (a) | | 103,244 | $11,310,380 |
| Other Banks & Diversified Financials – 8.8% | |
| Mastercard, Inc., “A” (s) | | 200,868 | $71,366,392 |
| S&P Global, Inc. | | 24,216 | 8,262,499 |
| Visa, Inc., “A” | | 132,655 | 29,176,141 |
| | | | | $108,805,032 |
| Specialty Stores – 8.5% | |
| Amazon.com, Inc. (a)(s) | | 1,110,857 | $104,676,055 |
| Meituan, “B” (a) | | 26,660 | 462,255 |
| | | | | $105,138,310 |
| Telecommunications - Wireless – 0.2% | |
| SBA Communications Corp., REIT | | 7,058 | $1,830,492 |
| Total Common Stocks (Identified Cost, $729,148,970) | | $1,165,856,170 |
| Investment Companies (h) – 5.1% |
| Money Market Funds – 5.1% | |
| MFS Institutional Money Market Portfolio, 4.55% (v) (Identified Cost, $63,406,479) | | | 63,408,222 | $63,408,222 |
| Underlying/Expiration Date/Exercise Price | Put/Call | Counterparty | Notional
Amount | Par Amount/
Number of
Contracts | |
| Purchased Options – 0.2% | |
| Special Products & Services – 0.2% | |
| Invesco QQQ Trust Series I – June 2023 @ $295 (Premiums Paid, $4,708,011) | Put | Exchange Traded | $ 52,429,816 | 1,786 | $2,677,214 |
|
|
| Other Assets, Less Liabilities – (0.1)% | | (1,615,854) |
| Net Assets – 100.0% | $1,230,325,752 |
| (a) | Non-income producing security. | | | |
| (h) | An affiliated issuer, which may be considered one in which the fund owns 5% or more of the outstanding voting securities, or a company which is under common control. At period end, the aggregate values of the fund's investments in affiliated issuers and in unaffiliated issuers were $63,408,222 and $1,168,533,384, respectively. | | | |
| (s) | Security or a portion of the security was pledged to cover collateral requirements for securities sold short and/or certain derivative transactions. | | | |
| (v) | Affiliated issuer that is available only to investment companies managed by MFS. The rate quoted for the MFS Institutional Money Market Portfolio is the annualized seven-day yield of the fund at period end. | | | |
Portfolio of Investments (unaudited) – continued
| The following abbreviations are used in this report and are defined: |
| ADR | American Depositary Receipt |
| REIT | Real Estate Investment Trust |
At February 28, 2023, the fund had cash collateral of $14,356 and other liquid securities with an aggregate value of $355,368 to cover any collateral or margin obligations for securities sold short and certain derivative contracts. Restricted cash and/or deposits with brokers in the Statement of Assets and Liabilities are comprised of cash collateral.
See Notes to Financial Statements
Financial Statements
Statement of Assets and Liabilities
At 2/28/23 (unaudited)
This statement represents your fund’s balance sheet, which details the assets and liabilities comprising the total value of the fund.
| Assets | |
| Investments in unaffiliated issuers, at value (identified cost, $733,856,981) | $1,168,533,384 |
| Investments in affiliated issuers, at value (identified cost, $63,406,479) | 63,408,222 |
| Deposits with brokers for | |
| Exchange-traded options | 14,356 |
| Receivables for | |
| Investments sold | 14,215,403 |
| Fund shares sold | 1,011,612 |
| Interest and dividends | 1,451,800 |
| Other assets | 50,240 |
| Total assets | $1,248,685,017 |
| Liabilities | |
| Payable to custodian | $14,215,403 |
| Payables for | |
| Investments purchased | 868,033 |
| Fund shares reacquired | 2,779,736 |
| Payable to affiliates | |
| Investment adviser | 49,053 |
| Administrative services fee | 1,063 |
| Shareholder servicing costs | 264,033 |
| Distribution and service fees | 14,803 |
| Payable for independent Trustees' compensation | 4,482 |
| Accrued expenses and other liabilities | 162,659 |
| Total liabilities | $18,359,265 |
| Net assets | $1,230,325,752 |
| Net assets consist of | |
| Paid-in capital | $819,806,640 |
| Total distributable earnings (loss) | 410,519,112 |
| Net assets | $1,230,325,752 |
| Shares of beneficial interest outstanding | 29,810,774 |
Statement of Assets and Liabilities (unaudited) – continued
| | Net assets | Shares
outstanding | Net asset value
per share (a) |
| Class A | $523,229,975 | 12,862,706 | $40.68 |
| Class B | 18,202,682 | 577,289 | 31.53 |
| Class C | 92,870,054 | 2,954,722 | 31.43 |
| Class I | 291,473,842 | 6,451,427 | 45.18 |
| Class R1 | 7,475,372 | 238,567 | 31.33 |
| Class R2 | 19,793,404 | 528,298 | 37.47 |
| Class R3 | 44,146,489 | 1,086,233 | 40.64 |
| Class R4 | 19,471,713 | 446,934 | 43.57 |
| Class R6 | 213,662,221 | 4,664,598 | 45.81 |
| (a) | Maximum offering price per share was equal to the net asset value per share for all share classes, except for Class A, for which the maximum offering price per share was $43.16 [100 / 94.25 x $40.68]. On sales of $50,000 or more, the maximum offering price of Class A shares is reduced. A contingent deferred sales charge may be imposed on redemptions of Class A, Class B, and Class C shares. Redemption price per share was equal to the net asset value per share for Classes I, R1, R2, R3, R4, and R6. |
See Notes to Financial Statements
Financial Statements
Statement of Operations
Six months ended 2/28/23 (unaudited)
This statement describes how much your fund earned in investment income and accrued in expenses. It also describes any gains and/or losses generated by fund operations.
| Net investment income (loss) | |
| Income | |
| Dividends | $3,980,376 |
| Dividends from affiliated issuers | 674,938 |
| Other | 2,083 |
| Income on securities loaned | 1,535 |
| Foreign taxes withheld | (11,345) |
| Total investment income | $4,647,587 |
| Expenses | |
| Management fee | $4,601,827 |
| Distribution and service fees | 1,371,690 |
| Shareholder servicing costs | 666,866 |
| Administrative services fee | 97,154 |
| Independent Trustees' compensation | 11,149 |
| Custodian fee | 51,449 |
| Shareholder communications | 39,110 |
| Audit and tax fees | 34,275 |
| Legal fees | 3,739 |
| Miscellaneous | 98,734 |
| Total expenses | $6,975,993 |
| Reduction of expenses by investment adviser and distributor | (83,211) |
| Net expenses | $6,892,782 |
| Net investment income (loss) | $(2,245,195) |
| Realized and unrealized gain (loss) |
| Realized gain (loss) (identified cost basis) | |
| Unaffiliated issuers | $(8,766,142) |
| Affiliated issuers | 2,644 |
| Foreign currency | (23,677) |
| Net realized gain (loss) | $(8,787,175) |
| Change in unrealized appreciation or depreciation | |
| Unaffiliated issuers | $(43,716,803) |
| Affiliated issuers | (1,174) |
| Net unrealized gain (loss) | $(43,717,977) |
| Net realized and unrealized gain (loss) | $(52,505,152) |
| Change in net assets from operations | $(54,750,347) |
See Notes to Financial Statements
Financial Statements
Statements of Changes in Net Assets
These statements describe the increases and/or decreases in net assets resulting from operations, any distributions, and any shareholder transactions.
| | Six months ended | Year ended |
| | 2/28/23
(unaudited) | 8/31/22 |
| Change in net assets | | |
| From operations | | |
| Net investment income (loss) | $(2,245,195) | $(13,328,443) |
| Net realized gain (loss) | (8,787,175) | 193,446,749 |
| Net unrealized gain (loss) | (43,717,977) | (835,363,661) |
| Change in net assets from operations | $(54,750,347) | $(655,245,355) |
| Total distributions to shareholders | $(122,255,927) | $(249,750,373) |
| Change in net assets from fund share transactions | $1,604,686 | $(22,067,935) |
| Total change in net assets | $(175,401,588) | $(927,063,663) |
| Net assets | | |
| At beginning of period | 1,405,727,340 | 2,332,791,003 |
| At end of period | $1,230,325,752 | $1,405,727,340 |
See Notes to Financial Statements
Financial Statements
Financial Highlights
The financial highlights table is intended to help you understand the fund's financial performance for the semiannual period and the past 5 fiscal years. Certain information reflects financial results for a single fund share. The total returns in the table represent the rate that an investor would have earned (or lost) on an investment in the fund share class (assuming reinvestment of all distributions) held for the entire period.
| Class A | Six months
ended | Year ended |
| | 2/28/23
(unaudited) | 8/31/22 | 8/31/21 | 8/31/20 | 8/31/19 | 8/31/18 |
| Net asset value, beginning of period | $46.91 | $75.65 | $64.90 | $44.73 | $45.65 | $35.67 |
| Income (loss) from investment operations |
| Net investment income (loss) (d) | $(0.08) | $(0.45) | $(0.57) | $(0.35) | $(0.27) | $(0.26) |
| Net realized and unrealized gain (loss) | (1.81) | (19.94) | 14.83 | 21.50 | 1.24 | 11.61 |
| Total from investment operations | $(1.89) | $(20.39) | $14.26 | $21.15 | $0.97 | $11.35 |
| Less distributions declared to shareholders |
| From net realized gain | $(4.34) | $(8.35) | $(3.51) | $(0.98) | $(1.89) | $(1.37) |
| Net asset value, end of period (x) | $40.68 | $46.91 | $75.65 | $64.90 | $44.73 | $45.65 |
| Total return (%) (r)(s)(t)(x) | (3.58)(n) | (30.20) | 22.97 | 48.23 | 2.97 | 32.79 |
Ratios (%) (to average net assets)
and Supplemental data: |
| Expenses before expense reductions | 1.17(a) | 1.14 | 1.12 | 1.18 | 1.19 | 1.24 |
| Expenses after expense reductions | 1.15(a) | 1.13 | 1.11 | 1.16 | 1.18 | 1.22 |
| Net investment income (loss) | (0.41)(a) | (0.76) | (0.85) | (0.71) | (0.64) | (0.66) |
| Portfolio turnover | 8(n) | 30 | 36 | 46 | 32 | 30 |
| Net assets at end of period (000 omitted) | $523,230 | $572,702 | $888,416 | $745,157 | $471,468 | $484,477 |
| Supplemental Ratios (%): |
| Ratios of expenses to average net assets after expense reductions excluding short sale expenses and interest expense and fees | N/A | N/A | 1.11 | 1.13 | 1.15 | 1.16 |
See Notes to Financial Statements
Financial Highlights – continued
| Class B | Six months
ended | Year ended |
| | 2/28/23
(unaudited) | 8/31/22 | 8/31/21 | 8/31/20 | 8/31/19 | 8/31/18 |
| Net asset value, beginning of period | $37.55 | $62.67 | $54.73 | $38.16 | $39.55 | $31.31 |
| Income (loss) from investment operations |
| Net investment income (loss) (d) | $(0.19) | $(0.73) | $(0.89) | $(0.61) | $(0.50) | $(0.49) |
| Net realized and unrealized gain (loss) | (1.49) | (16.04) | 12.34 | 18.16 | 1.00 | 10.10 |
| Total from investment operations | $(1.68) | $(16.77) | $11.45 | $17.55 | $0.50 | $9.61 |
| Less distributions declared to shareholders |
| From net realized gain | $(4.34) | $(8.35) | $(3.51) | $(0.98) | $(1.89) | $(1.37) |
| Net asset value, end of period (x) | $31.53 | $37.55 | $62.67 | $54.73 | $38.16 | $39.55 |
| Total return (%) (r)(s)(t)(x) | (3.94)(n) | (30.73) | 22.06 | 47.07 | 2.21 | 31.77 |
Ratios (%) (to average net assets)
and Supplemental data: |
| Expenses before expense reductions | 1.92(a) | 1.89 | 1.87 | 1.93 | 1.94 | 1.99 |
| Expenses after expense reductions | 1.90(a) | 1.88 | 1.86 | 1.92 | 1.93 | 1.98 |
| Net investment income (loss) | (1.16)(a) | (1.52) | (1.59) | (1.46) | (1.39) | (1.41) |
| Portfolio turnover | 8(n) | 30 | 36 | 46 | 32 | 30 |
| Net assets at end of period (000 omitted) | $18,203 | $23,115 | $44,390 | $46,224 | $41,017 | $45,337 |
| Supplemental Ratios (%): |
| Ratios of expenses to average net assets after expense reductions excluding short sale expenses and interest expense and fees | N/A | N/A | 1.86 | 1.88 | 1.90 | 1.92 |
See Notes to Financial Statements
Financial Highlights – continued
| Class C | Six months
ended | Year ended |
| | 2/28/23
(unaudited) | 8/31/22 | 8/31/21 | 8/31/20 | 8/31/19 | 8/31/18 |
| Net asset value, beginning of period | $37.45 | $62.52 | $54.61 | $38.07 | $39.47 | $31.24 |
| Income (loss) from investment operations |
| Net investment income (loss) (d) | $(0.19) | $(0.73) | $(0.88) | $(0.61) | $(0.50) | $(0.49) |
| Net realized and unrealized gain (loss) | (1.49) | (15.99) | 12.30 | 18.13 | 0.99 | 10.09 |
| Total from investment operations | $(1.68) | $(16.72) | $11.42 | $17.52 | $0.49 | $9.60 |
| Less distributions declared to shareholders |
| From net realized gain | $(4.34) | $(8.35) | $(3.51) | $(0.98) | $(1.89) | $(1.37) |
| Net asset value, end of period (x) | $31.43 | $37.45 | $62.52 | $54.61 | $38.07 | $39.47 |
| Total return (%) (r)(s)(t)(x) | (3.95)(n) | (30.72) | 22.06 | 47.11 | 2.19 | 31.81 |
Ratios (%) (to average net assets)
and Supplemental data: |
| Expenses before expense reductions | 1.92(a) | 1.89 | 1.87 | 1.93 | 1.94 | 1.98 |
| Expenses after expense reductions | 1.90(a) | 1.88 | 1.86 | 1.92 | 1.93 | 1.97 |
| Net investment income (loss) | (1.16)(a) | (1.52) | (1.59) | (1.46) | (1.40) | (1.41) |
| Portfolio turnover | 8(n) | 30 | 36 | 46 | 32 | 30 |
| Net assets at end of period (000 omitted) | $92,870 | $112,241 | $194,857 | $183,286 | $128,817 | $128,707 |
| Supplemental Ratios (%): |
| Ratios of expenses to average net assets after expense reductions excluding short sale expenses and interest expense and fees | N/A | N/A | 1.86 | 1.88 | 1.91 | 1.92 |
See Notes to Financial Statements
Financial Highlights – continued
| Class I | Six months
ended | Year ended |
| | 2/28/23
(unaudited) | 8/31/22 | 8/31/21 | 8/31/20 | 8/31/19 | 8/31/18 |
| Net asset value, beginning of period | $51.52 | $82.06 | $69.94 | $48.02 | $48.74 | $37.90 |
| Income (loss) from investment operations |
| Net investment income (loss) (d) | $(0.04) | $(0.34) | $(0.43) | $(0.25) | $(0.18) | $(0.18) |
| Net realized and unrealized gain (loss) | (1.96) | (21.85) | 16.06 | 23.15 | 1.35 | 12.39 |
| Total from investment operations | $(2.00) | $(22.19) | $15.63 | $22.90 | $1.17 | $12.21 |
| Less distributions declared to shareholders |
| From net realized gain | $(4.34) | $(8.35) | $(3.51) | $(0.98) | $(1.89) | $(1.37) |
| Net asset value, end of period (x) | $45.18 | $51.52 | $82.06 | $69.94 | $48.02 | $48.74 |
| Total return (%) (r)(s)(t)(x) | (3.47)(n) | (30.02) | 23.28 | 48.57 | 3.20 | 33.14 |
Ratios (%) (to average net assets)
and Supplemental data: |
| Expenses before expense reductions | 0.92(a) | 0.89 | 0.87 | 0.93 | 0.94 | 0.99 |
| Expenses after expense reductions | 0.90(a) | 0.88 | 0.86 | 0.92 | 0.93 | 0.98 |
| Net investment income (loss) | (0.16)(a) | (0.52) | (0.59) | (0.46) | (0.40) | (0.41) |
| Portfolio turnover | 8(n) | 30 | 36 | 46 | 32 | 30 |
| Net assets at end of period (000 omitted) | $291,474 | $356,867 | $608,833 | $561,531 | $315,655 | $303,359 |
| Supplemental Ratios (%): |
| Ratios of expenses to average net assets after expense reductions excluding short sale expenses and interest expense and fees | N/A | N/A | 0.86 | 0.88 | 0.91 | 0.92 |
See Notes to Financial Statements
Financial Highlights – continued
| Class R1 | Six months
ended | Year ended |
| | 2/28/23
(unaudited) | 8/31/22 | 8/31/21 | 8/31/20 | 8/31/19 | 8/31/18 |
| Net asset value, beginning of period | $37.35 | $62.37 | $54.49 | $37.99 | $39.39 | $31.18 |
| Income (loss) from investment operations |
| Net investment income (loss) (d) | $(0.19) | $(0.72) | $(0.89) | $(0.62) | $(0.50) | $(0.49) |
| Net realized and unrealized gain (loss) | (1.49) | (15.95) | 12.28 | 18.10 | 0.99 | 10.07 |
| Total from investment operations | $(1.68) | $(16.67) | $11.39 | $17.48 | $0.49 | $9.58 |
| Less distributions declared to shareholders |
| From net realized gain | $(4.34) | $(8.35) | $(3.51) | $(0.98) | $(1.89) | $(1.37) |
| Net asset value, end of period (x) | $31.33 | $37.35 | $62.37 | $54.49 | $37.99 | $39.39 |
| Total return (%) (r)(s)(t)(x) | (3.96)(n) | (30.72) | 22.05 | 47.10 | 2.19 | 31.80 |
Ratios (%) (to average net assets)
and Supplemental data: |
| Expenses before expense reductions | 1.92(a) | 1.89 | 1.87 | 1.93 | 1.94 | 1.99 |
| Expenses after expense reductions | 1.90(a) | 1.88 | 1.86 | 1.91 | 1.93 | 1.98 |
| Net investment income (loss) | (1.15)(a) | (1.51) | (1.59) | (1.47) | (1.40) | (1.41) |
| Portfolio turnover | 8(n) | 30 | 36 | 46 | 32 | 30 |
| Net assets at end of period (000 omitted) | $7,475 | $7,558 | $10,498 | $9,882 | $5,715 | $5,534 |
| Supplemental Ratios (%): |
| Ratios of expenses to average net assets after expense reductions excluding short sale expenses and interest expense and fees | N/A | N/A | 1.86 | 1.88 | 1.91 | 1.92 |
See Notes to Financial Statements
Financial Highlights – continued
| Class R2 | Six months
ended | Year ended |
| | 2/28/23
(unaudited) | 8/31/22 | 8/31/21 | 8/31/20 | 8/31/19 | 8/31/18 |
| Net asset value, beginning of period | $43.63 | $71.12 | $61.36 | $42.45 | $43.55 | $34.17 |
| Income (loss) from investment operations |
| Net investment income (loss) (d) | $(0.13) | $(0.56) | $(0.68) | $(0.45) | $(0.36) | $(0.35) |
| Net realized and unrealized gain (loss) | (1.69) | (18.58) | 13.95 | 20.34 | 1.15 | 11.10 |
| Total from investment operations | $(1.82) | $(19.14) | $13.27 | $19.89 | $0.79 | $10.75 |
| Less distributions declared to shareholders |
| From net realized gain | $(4.34) | $(8.35) | $(3.51) | $(0.98) | $(1.89) | $(1.37) |
| Net asset value, end of period (x) | $37.47 | $43.63 | $71.12 | $61.36 | $42.45 | $43.55 |
| Total return (%) (r)(s)(t)(x) | (3.70)(n) | (30.38) | 22.67 | 47.84 | 2.69 | 32.46 |
Ratios (%) (to average net assets)
and Supplemental data: |
| Expenses before expense reductions | 1.42(a) | 1.39 | 1.37 | 1.43 | 1.44 | 1.48 |
| Expenses after expense reductions | 1.40(a) | 1.38 | 1.36 | 1.42 | 1.43 | 1.48 |
| Net investment income (loss) | (0.66)(a) | (1.02) | (1.09) | (0.97) | (0.90) | (0.91) |
| Portfolio turnover | 8(n) | 30 | 36 | 46 | 32 | 30 |
| Net assets at end of period (000 omitted) | $19,793 | $22,287 | $37,797 | $38,511 | $29,339 | $28,071 |
| Supplemental Ratios (%): |
| Ratios of expenses to average net assets after expense reductions excluding short sale expenses and interest expense and fees | N/A | N/A | 1.36 | 1.38 | 1.41 | 1.42 |
See Notes to Financial Statements
Financial Highlights – continued
| Class R3 | Six months
ended | Year ended |
| | 2/28/23
(unaudited) | 8/31/22 | 8/31/21 | 8/31/20 | 8/31/19 | 8/31/18 |
| Net asset value, beginning of period | $46.87 | $75.60 | $64.85 | $44.71 | $45.63 | $35.66 |
| Income (loss) from investment operations |
| Net investment income (loss) (d) | $(0.08) | $(0.46) | $(0.56) | $(0.35) | $(0.27) | $(0.27) |
| Net realized and unrealized gain (loss) | (1.81) | (19.92) | 14.82 | 21.47 | 1.24 | 11.61 |
| Total from investment operations | $(1.89) | $(20.38) | $14.26 | $21.12 | $0.97 | $11.34 |
| Less distributions declared to shareholders |
| From net realized gain | $(4.34) | $(8.35) | $(3.51) | $(0.98) | $(1.89) | $(1.37) |
| Net asset value, end of period (x) | $40.64 | $46.87 | $75.60 | $64.85 | $44.71 | $45.63 |
| Total return (%) (r)(s)(t)(x) | (3.59)(n) | (30.21) | 22.99 | 48.18 | 2.97 | 32.77 |
Ratios (%) (to average net assets)
and Supplemental data: |
| Expenses before expense reductions | 1.17(a) | 1.14 | 1.13 | 1.18 | 1.19 | 1.24 |
| Expenses after expense reductions | 1.15(a) | 1.13 | 1.11 | 1.17 | 1.18 | 1.23 |
| Net investment income (loss) | (0.41)(a) | (0.77) | (0.84) | (0.71) | (0.65) | (0.66) |
| Portfolio turnover | 8(n) | 30 | 36 | 46 | 32 | 30 |
| Net assets at end of period (000 omitted) | $44,146 | $49,755 | $96,784 | $109,884 | $80,242 | $79,534 |
| Supplemental Ratios (%): |
| Ratios of expenses to average net assets after expense reductions excluding short sale expenses and interest expense and fees | N/A | N/A | 1.11 | 1.13 | 1.16 | 1.17 |
See Notes to Financial Statements
Financial Highlights – continued
| Class R4 | Six months
ended | Year ended |
| | 2/28/23
(unaudited) | 8/31/22 | 8/31/21 | 8/31/20 | 8/31/19 | 8/31/18 |
| Net asset value, beginning of period | $49.85 | $79.68 | $68.01 | $46.72 | $47.47 | $36.95 |
| Income (loss) from investment operations |
| Net investment income (loss) (d) | $(0.04) | $(0.33) | $(0.42) | $(0.24) | $(0.17) | $(0.17) |
| Net realized and unrealized gain (loss) | (1.90) | (21.15) | 15.60 | 22.51 | 1.31 | 12.06 |
| Total from investment operations | $(1.94) | $(21.48) | $15.18 | $22.27 | $1.14 | $11.89 |
| Less distributions declared to shareholders |
| From net realized gain | $(4.34) | $(8.35) | $(3.51) | $(0.98) | $(1.89) | $(1.37) |
| Net asset value, end of period (x) | $43.57 | $49.85 | $79.68 | $68.01 | $46.72 | $47.47 |
| Total return (%) (r)(s)(t)(x) | (3.47)(n) | (30.03) | 23.28 | 48.57 | 3.22 | 33.12 |
Ratios (%) (to average net assets)
and Supplemental data: |
| Expenses before expense reductions | 0.92(a) | 0.89 | 0.87 | 0.93 | 0.94 | 0.99 |
| Expenses after expense reductions | 0.90(a) | 0.88 | 0.86 | 0.92 | 0.93 | 0.98 |
| Net investment income (loss) | (0.16)(a) | (0.52) | (0.59) | (0.47) | (0.40) | (0.41) |
| Portfolio turnover | 8(n) | 30 | 36 | 46 | 32 | 30 |
| Net assets at end of period (000 omitted) | $19,472 | $25,674 | $47,324 | $32,530 | $25,310 | $23,004 |
| Supplemental Ratios (%): |
| Ratios of expenses to average net assets after expense reductions excluding short sale expenses and interest expense and fees | N/A | N/A | 0.85 | 0.89 | 0.91 | 0.92 |
See Notes to Financial Statements
Financial Highlights – continued
| Class R6 | Six months
ended | Year ended |
| | 2/28/23
(unaudited) | 8/31/22 | 8/31/21 | 8/31/20 | 8/31/19 | 8/31/18 |
| Net asset value, beginning of period | $52.14 | $82.87 | $70.54 | $48.38 | $49.03 | $38.09 |
| Income (loss) from investment operations |
| Net investment income (loss) (d) | $(0.01) | $(0.27) | $(0.37) | $(0.20) | $(0.13) | $(0.13) |
| Net realized and unrealized gain (loss) | (1.98) | (22.11) | 16.21 | 23.34 | 1.37 | 12.44 |
| Total from investment operations | $(1.99) | $(22.38) | $15.84 | $23.14 | $1.24 | $12.31 |
| Less distributions declared to shareholders |
| From net realized gain | $(4.34) | $(8.35) | $(3.51) | $(0.98) | $(1.89) | $(1.37) |
| Net asset value, end of period (x) | $45.81 | $52.14 | $82.87 | $70.54 | $48.38 | $49.03 |
| Total return (%) (r)(s)(t)(x) | (3.41)(n) | (29.95) | 23.39 | 48.71 | 3.33 | 33.24 |
Ratios (%) (to average net assets)
and Supplemental data: |
| Expenses before expense reductions | 0.82(a) | 0.79 | 0.78 | 0.84 | 0.84 | 0.89 |
| Expenses after expense reductions | 0.81(a) | 0.77 | 0.77 | 0.82 | 0.83 | 0.88 |
| Net investment income (loss) | (0.06)(a) | (0.41) | (0.50) | (0.37) | (0.30) | (0.31) |
| Portfolio turnover | 8(n) | 30 | 36 | 46 | 32 | 30 |
| Net assets at end of period (000 omitted) | $213,662 | $235,529 | $403,893 | $316,404 | $168,352 | $138,924 |
| Supplemental Ratios (%): |
| Ratios of expenses to average net assets after expense reductions excluding short sale expenses and interest expense and fees | N/A | N/A | 0.77 | 0.79 | 0.81 | 0.82 |
| (a) | Annualized. |
| (d) | Per share data is based on average shares outstanding. |
| (n) | Not annualized. |
| (r) | Certain expenses have been reduced without which performance would have been lower. |
| (s) | From time to time the fund may receive proceeds from litigation settlements, without which performance would be lower. |
| (t) | Total returns do not include any applicable sales charges. |
| (x) | The net asset values and total returns have been calculated on net assets which include adjustments made in accordance with U.S. generally accepted accounting principles required at period end for financial reporting purposes. |
See Notes to Financial Statements
Notes to Financial Statements
(unaudited)
(1) Business and Organization
MFS Technology Fund (the fund) is a non-diversified series of MFS Series Trust I (the trust). The trust is organized as a Massachusetts business trust and is registered under the Investment Company Act of 1940, as amended, as an open-end management investment company.
The fund is an investment company and accordingly follows the investment company accounting and reporting guidance of the Financial Accounting Standards Board (FASB) Accounting Standards Codification Topic 946 Financial Services - Investment Companies.
(2) Significant Accounting Policies
General — The preparation of financial statements in conformity with U.S. generally accepted accounting principles requires management to make estimates and assumptions that affect the reported amounts of assets and liabilities, and disclosure of contingent assets and liabilities at the date of the financial statements and the reported amounts of increases and decreases in net assets from operations during the reporting period. Actual results could differ from those estimates. In the preparation of these financial statements, management has evaluated subsequent events occurring after the date of the fund’s Statement of Assets and Liabilities through the date that the financial statements were issued. The fund invests primarily in securities of issuers in the technology industry. Issuers in a single industry can react similarly to market, currency, political, economic, regulatory, geopolitical, environmental, public health, and other conditions. The value of stocks in the technology sector can be very volatile due to the rapid pace of product change, technological developments, and other factors.
Balance Sheet Offsetting — The fund's accounting policy with respect to balance sheet offsetting is that, absent an event of default by the counterparty or a termination of the agreement, the International Swaps and Derivatives Association (ISDA) Master Agreement, or similar agreement, does not result in an offset of reported amounts of financial assets and financial liabilities in the Statement of Assets and Liabilities across transactions between the fund and the applicable counterparty. The fund's right to setoff may be restricted or prohibited by the bankruptcy or insolvency laws of the particular jurisdiction to which a specific master netting agreement counterparty is subject. Balance sheet offsetting disclosures, to the extent applicable to the fund, have been included in the fund’s Significant Accounting Policies note under the captions for each of the fund’s in-scope financial instruments and transactions.
Investment Valuations — Subject to its oversight, the fund's Board of Trustees has delegated primary responsibility for determining or causing to be determined the value of the fund’s investments to MFS as the fund's adviser, pursuant to the fund’s valuation policy and procedures which have been adopted by the adviser and approved by the Board. Effective September 8, 2022, and in accordance with Rule 2a-5 under the Investment Company Act of 1940, the Board of Trustees designated the adviser as the “valuation designee” of the fund. If the adviser, as valuation designee, determines that reliable market quotations are not readily available for an investment, the investment is valued at fair value as determined in good faith by the adviser in accordance with the adviser’s fair valuation policy and procedures.
Notes to Financial Statements (unaudited) - continued
Under the fund's valuation policy and procedures, equity securities, including restricted equity securities and equity securities sold short, are generally valued at the last sale or official closing price on their primary market or exchange as provided by a third-party pricing service. Equity securities, for which there were no sales reported that day, are generally valued at the last quoted daily bid quotation on their primary market or exchange as provided by a third-party pricing service. Equity securities sold short, for which there were no sales reported that day, are generally valued at the last quoted daily ask quotation on their primary market or exchange as provided by a third-party pricing service. Short-term instruments with a maturity at issuance of 60 days or less may be valued at amortized cost, which approximates market value. Exchange-traded options are generally valued at the last sale or official closing price on their primary exchange as provided by a third-party pricing service. Exchange-traded options for which there were no sales reported that day are generally valued at the last daily bid quotation on their primary exchange as provided by a third-party pricing service. For put options, the position may be valued at the last daily ask quotation if there are no trades reported during the day. Options not traded on an exchange are generally valued at a broker/dealer bid quotation. Foreign currency options are generally valued at valuations provided by a third-party pricing service. Open-end investment companies are generally valued at net asset value per share. The values of foreign securities and other assets and liabilities expressed in foreign currencies are converted to U.S. dollars using the mean of bid and asked prices for rates provided by a third-party pricing service.
Under the fund’s valuation policy and procedures, market quotations are not considered to be readily available for debt instruments, floating rate loans, and many types of derivatives. These investments are generally valued at fair value based on information from third-party pricing services or otherwise determined by the adviser in accordance with the adviser’s fair valuation policy and procedures. Securities and other assets generally valued on the basis of information from a third-party pricing service may also be valued at a broker/dealer bid quotation. In determining values, third-party pricing services can utilize both transaction data and market information such as yield, quality, coupon rate, maturity, type of issue, trading characteristics, spreads and other market data. An investment may also be valued at fair value if the adviser determines that the investment’s value has been materially affected by events occurring after the close of the exchange or market on which the investment is principally traded (such as foreign exchange or market) and prior to the determination of the fund’s net asset value, or after the halt of trading of a specific security where trading does not resume prior to the close of the exchange or market on which the security is principally traded. Events that occur after foreign markets close (such as developments in foreign markets and significant movements in the U.S. markets) and prior to the determination of the fund’s net asset value may be deemed to have a material effect on the value of securities traded in foreign markets. Accordingly, the fund’s foreign equity securities may often be valued at fair value. The adviser generally relies on third-party pricing services or other information (such as the correlation with price movements of similar securities in the same or other markets; the type, cost and investment characteristics of the security; the business and financial condition of the issuer; and trading and other market data) to assist in determining whether to fair value and at what value to fair value an investment. The value of an investment for purposes of calculating the fund’s net asset value can differ depending on the source and method used to determine value. When fair valuation is used, the value of an investment used to determine the
Notes to Financial Statements (unaudited) - continued
fund’s net asset value may differ from quoted or published prices for the same investment. There can be no assurance that the fund could obtain the fair value assigned to an investment if it were to sell the investment at the same time at which the fund determines its net asset value per share.
Various inputs are used in determining the value of the fund's assets or liabilities. These inputs are categorized into three broad levels. In certain cases, the inputs used to measure fair value may fall into different levels of the fair value hierarchy. In such cases, an investment's level within the fair value hierarchy is based on the lowest level of input that is significant to the fair value measurement. The fund's assessment of the significance of a particular input to the fair value measurement in its entirety requires judgment, and considers factors specific to the investment. Level 1 includes unadjusted quoted prices in active markets for identical assets or liabilities. Level 2 includes other significant observable market-based inputs (including quoted prices for similar securities, interest rates, prepayment speed, and credit risk). Level 3 includes significant unobservable inputs, which may include the adviser's own assumptions in determining the fair value of investments. The following is a summary of the levels used as of February 28, 2023 in valuing the fund's assets and liabilities:
| Financial Instruments | Level 1 | Level 2 | Level 3 | Total |
| Equity Securities: | | | | |
| United States | $1,082,833,645 | $— | $— | $1,082,833,645 |
| Canada | 43,324,668 | 226,757 | — | 43,551,425 |
| Japan | 15,465,422 | — | — | 15,465,422 |
| United Kingdom | 9,400,753 | — | — | 9,400,753 |
| Israel | 9,106,897 | — | — | 9,106,897 |
| China | 8,175,242 | — | — | 8,175,242 |
| Mutual Funds | 63,408,222 | — | — | 63,408,222 |
| Total | $1,231,714,849 | $226,757 | $— | $1,231,941,606 |
For further information regarding security characteristics, see the Portfolio of Investments.
Foreign Currency Translation — Purchases and sales of foreign investments, income, and expenses are converted into U.S. dollars based upon currency exchange rates prevailing on the respective dates of such transactions or on the reporting date for foreign denominated receivables and payables. Gains and losses attributable to foreign currency exchange rates on sales of securities are recorded for financial statement purposes as net realized gains and losses on investments. Gains and losses attributable to foreign exchange rate movements on receivables, payables, income and expenses are recorded for financial statement purposes as foreign currency transaction gains and losses. That portion of both realized and unrealized gains and losses on investments that results from fluctuations in foreign currency exchange rates is not separately disclosed.
Derivatives — The fund uses derivatives primarily to increase or decrease exposure to a particular market or segment of the market, or security, to increase or decrease interest rate or currency exposure, or as alternatives to direct investments. Derivatives are used for hedging or non-hedging purposes. While hedging can reduce or eliminate
Notes to Financial Statements (unaudited) - continued
losses, it can also reduce or eliminate gains. When the fund uses derivatives as an investment to increase market exposure, or for hedging purposes, gains and losses from derivative instruments may be substantially greater than the derivative’s original cost.
The derivative instruments used by the fund during the period were purchased options. Depending on the type of derivative, a fund may exit a derivative position by entering into an offsetting transaction with a counterparty or exchange, negotiating an agreement with the derivative counterparty, or novating the position to a third party. The fund's period end derivatives, as presented in the Portfolio of Investments and the associated Derivative Contract tables, generally are indicative of the volume of its derivative activity during the period.
The following table presents, by major type of derivative contract, the fair value, on a gross basis, of the asset and liability components of derivatives held by the fund at February 28, 2023 as reported in the Statement of Assets and Liabilities:
| | | Fair Value (a) |
| Risk | Derivative Contracts | Asset Derivatives |
| Equity | Purchased Option Contracts | $2,677,214 |
| (a) | The value of purchased options outstanding is included in investments in unaffiliated issuers, at value, within the Statement of Assets and Liabilities. |
The following table presents, by major type of derivative contract, the realized gain (loss) on derivatives held by the fund for the six months ended February 28, 2023 as reported in the Statement of Operations:
| Risk | Unaffiliated Issuers
(Purchased
Options) |
| Equity | $2,272,615 |
The following table presents, by major type of derivative contract, the change in unrealized appreciation or depreciation on derivatives held by the fund for the six months ended February 28, 2023 as reported in the Statement of Operations:
| Risk | Unaffiliated Issuers
(Purchased
Options) |
| Equity | $(2,321,385) |
Derivative counterparty credit risk is managed through formal evaluation of the creditworthiness of all potential counterparties. On certain, but not all, uncleared derivatives, the fund attempts to reduce its exposure to counterparty credit risk whenever possible by entering into an ISDA Master Agreement on a bilateral basis. The ISDA Master Agreement gives each party to the agreement the right to terminate all transactions traded under such agreement if there is a specified deterioration in the credit quality of the other party. Upon an event of default or a termination of the ISDA Master Agreement, the non-defaulting party has the right to close out all transactions traded under such agreement and to net amounts owed under each agreement to one net amount payable by one party to the other. This right to close out and net payments
Notes to Financial Statements (unaudited) - continued
across all transactions traded under the ISDA Master Agreement could result in a reduction of the fund's credit risk to such counterparty equal to any amounts payable by the fund under the applicable transactions, if any.
Collateral and margin requirements differ by type of derivative. For cleared derivatives (e.g., futures contracts, cleared swaps, and exchange-traded options), margin requirements are set by the clearing broker and the clearing house and collateral, in the form of cash or securities, is posted by the fund directly with the clearing broker. Collateral terms are counterparty agreement specific for uncleared derivatives (e.g., forward foreign currency exchange contracts, uncleared swap agreements, and uncleared options) and collateral, in the form of cash and securities, is held in segregated accounts with the fund's custodian in connection with these agreements. For derivatives traded under an ISDA Master Agreement, which contains a credit support annex, the collateral requirements are netted across all transactions traded under such counterparty-specific agreement and an amount is posted from one party to the other to collateralize such obligations. Cash that has been segregated or delivered to cover the fund's collateral or margin obligations under derivative contracts, if any, will be reported separately in the Statement of Assets and Liabilities as restricted cash for uncleared derivatives and/or deposits with brokers for cleared derivatives. Securities pledged as collateral or margin for the same purpose, if any, are noted in the Portfolio of Investments. The fund may be required to make payments of interest on uncovered collateral or margin obligations with the broker. Any such payments are included in “Miscellaneous” expense in the Statement of Operations.
Purchased Options — The fund purchased put options for a premium. Purchased put options entitle the holder to sell a specified number of shares or units of a particular security, currency or index at a specified price at a specified date or within a specified period of time. Purchasing put options may hedge against an anticipated decline in the value of portfolio securities or currency or decrease the fund's exposure to an underlying instrument.
The premium paid is initially recorded as an investment in the Statement of Assets and Liabilities. That investment is subsequently marked-to-market daily with the difference between the premium paid and the market value of the purchased option being recorded as unrealized appreciation or depreciation. Premiums paid for purchased call and put options which have expired are treated as realized losses on investments in the Statement of Operations. Upon the exercise or closing of a purchased put option, the premium paid is offset against the proceeds on the sale of the underlying security or financial instrument in order to determine the realized gain or loss on investments.
Whether or not the option is exercised, the fund's maximum risk of loss from purchasing an option is the amount of premium paid. All option contracts involve credit risk if the counterparty to the option contract fails to perform. For uncleared options, this risk is mitigated in cases where there is an ISDA Master Agreement between the fund and the counterparty providing for netting as described above and, where applicable, by the posting of collateral by the counterparty to the fund to cover the fund’s exposure to the counterparty under such ISDA Master Agreement.
Short Sales — The fund may enter into short sales whereby it sells a security it does not own in anticipation of a decline in the value of that security. The fund will realize a gain if the security price decreases and a loss if the security price increases between the date of the short sale and the date on which the fund replaces the borrowed security. Losses from short sales can exceed the proceeds of the security sold; and they can also
Notes to Financial Statements (unaudited) - continued
exceed the potential loss from an ordinary buy and sell transaction. The amount of any premium, dividends, or interest the fund may be required to pay in connection with a short sale will be recognized as a fund expense. For the six months ended February 28, 2023, the fund did not enter into short sale transactions.
Security Loans — Under its Securities Lending Agency Agreement with the fund, State Street Bank and Trust Company, as lending agent, loans the securities of the fund to certain qualified institutions (the “Borrowers”) approved by the fund. Security loans can be terminated at the discretion of either the lending agent or the fund and the related securities must be returned within the earlier of the standard trade settlement period for such securities or within three business days. The loans are collateralized by cash and/or U.S. Treasury and federal agency obligations in an amount typically at least equal to the market value of the securities loaned. On loans collateralized by cash, the cash collateral is invested in a money market fund. The market value of the loaned securities is determined at the close of business of the fund and any additional required collateral is delivered to the fund on the next business day. The lending agent provides the fund with indemnification against Borrower default. In the event of Borrower default, the lending agent will, for the benefit of the fund, either purchase securities identical to those loaned or, when such purchase is commercially impracticable, pay the fund the market value of the loaned securities. In return, the lending agent assumes the fund's rights to the related collateral. If the collateral value is less than the cost to purchase identical securities, the lending agent is responsible for the shortfall, but only to the extent that such shortfall is not due to a decline in collateral value resulting from collateral reinvestment for which the fund bears the risk of loss. A portion of the income generated upon investment of the collateral is remitted to the Borrowers, and the remainder is allocated between the fund and the lending agent. On loans collateralized by U.S. Treasury and/or federal agency obligations, a fee is received from the Borrower, and is allocated between the fund and the lending agent. Income from securities lending is separately reported in the Statement of Operations. The dividend and interest income earned on the securities loaned is accounted for in the same manner as other dividend and interest income. At February 28, 2023, there were no securities on loan or collateral outstanding.
Indemnifications — Under the fund's organizational documents, its officers and Trustees may be indemnified against certain liabilities and expenses arising out of the performance of their duties to the fund. Additionally, in the normal course of business, the fund enters into agreements with service providers that may contain indemnification clauses. The fund's maximum exposure under these agreements is unknown as this would involve future claims that may be made against the fund that have not yet occurred.
Investment Transactions and Income — Investment transactions are recorded on the trade date. Dividends received in cash are recorded on the ex-dividend date. Certain dividends from foreign securities will be recorded when the fund is informed of the dividend if such information is obtained subsequent to the ex-dividend date. Dividend payments received in additional securities are recorded on the ex-dividend date in an amount equal to the value of the security on such date. In determining the net gain or loss on securities sold, the cost of securities is determined on the identified cost basis.
Notes to Financial Statements (unaudited) - continued
The fund may receive proceeds from litigation settlements. Any proceeds received from litigation involving portfolio holdings are reflected in the Statement of Operations in realized gain/loss if the security has been disposed of by the fund or in unrealized gain/loss if the security is still held by the fund. Any other proceeds from litigation not related to portfolio holdings are reflected as other income in the Statement of Operations.
Tax Matters and Distributions — The fund intends to qualify as a regulated investment company, as defined under Subchapter M of the Internal Revenue Code, and to distribute all of its taxable income, including realized capital gains. As a result, no provision for federal income tax is required. The fund’s federal tax returns, when filed, will remain subject to examination by the Internal Revenue Service for a three year period. Management has analyzed the fund’s tax positions taken on federal and state tax returns for all open tax years and does not believe that there are any uncertain tax positions that require recognition of a tax liability. Foreign taxes, if any, have been accrued by the fund in the accompanying financial statements in accordance with the applicable foreign tax law. Foreign income taxes may be withheld by certain countries in which the fund invests. Additionally, capital gains realized by the fund on securities issued in or by certain foreign countries may be subject to capital gains tax imposed by those countries.
Distributions to shareholders are recorded on the ex-dividend date. Income and capital gain distributions are determined in accordance with income tax regulations, which may differ from U.S. generally accepted accounting principles. Certain capital accounts in the financial statements are periodically adjusted for permanent differences in order to reflect their tax character. These adjustments have no impact on net assets or net asset value per share. Temporary differences which arise from recognizing certain items of income, expense, gain or loss in different periods for financial statement and tax purposes will reverse at some time in the future.
Book/tax differences primarily relate to wash sale loss deferrals, straddle loss deferrals, treating a portion of the proceeds from redemptions as a distribution for tax purposes, and net operating losses.
The tax character of distributions made during the current period will be determined at fiscal year end. The tax character of distributions declared to shareholders for the last fiscal year is as follows:
| | Year ended
8/31/22 |
| Ordinary income (including any short-term capital gains) | $64,444,592 |
| Long-term capital gains | 185,305,781 |
| Total distributions | $249,750,373 |
Notes to Financial Statements (unaudited) - continued
The federal tax cost and the tax basis components of distributable earnings were as follows:
| As of 2/28/23 | |
| Cost of investments | $803,427,569 |
| Gross appreciation | 502,407,926 |
| Gross depreciation | (73,893,889) |
| Net unrealized appreciation (depreciation) | $428,514,037 |
| As of 8/31/22 | |
| Undistributed long-term capital gain | 122,265,075 |
| Late year ordinary loss deferral | (6,971,703) |
| Net unrealized appreciation (depreciation) | 472,232,014 |
The aggregate cost above includes prior fiscal year end tax adjustments, if applicable.
Multiple Classes of Shares of Beneficial Interest — The fund offers multiple classes of shares, which differ in their respective distribution and service fees. The fund's income, realized and unrealized gain (loss), and common expenses are allocated to shareholders based on the daily net assets of each class. Dividends are declared separately for each class. Differences in per share dividend rates are generally due to differences in separate class expenses. Class B and Class C shares will convert to Class A shares approximately eight years after purchase. The fund’s distributions declared to shareholders as reported in the Statements of Changes in Net Assets are presented by class as follows:
| | Six months ended
2/28/23 | Year ended
8/31/22 |
| Class A | $51,623,165 | $97,004,773 |
| Class B | 2,466,860 | 5,633,192 |
| Class C | 12,088,461 | 25,137,122 |
| Class I | 27,364,310 | 62,813,302 |
| Class R1 | 882,693 | 1,457,279 |
| Class R2 | 2,055,032 | 4,354,112 |
| Class R3 | 4,485,667 | 9,789,520 |
| Class R4 | 2,209,428 | 4,407,863 |
| Class R6 | 19,080,311 | 39,153,210 |
| Total | $122,255,927 | $249,750,373 |
(3) Transactions with Affiliates
Investment Adviser — The fund has an investment advisory agreement with MFS to provide overall investment management and related administrative services and facilities to the fund. The management fee is computed daily and paid monthly at the following annual rates based on the fund's average daily net assets:
| Up to $1 billion | 0.75% |
| In excess of $1 billion and up to $2.5 billion | 0.70% |
| In excess of $2.5 billion | 0.65% |
MFS has agreed in writing to reduce its management fee by a specified amount if certain MFS mutual fund assets exceed thresholds agreed to by MFS and the fund's Board of Trustees. MFS has also agreed in writing to waive at least 0.01% of its
Notes to Financial Statements (unaudited) - continued
management fee as part of this agreement. The agreement to waive at least 0.01% of the management fee will continue until modified by the fund's Board of Trustees, but such agreement will continue at least until December 31, 2023. For the six months ended February 28, 2023, this management fee reduction amounted to $83,156, which is included in the reduction of total expenses in the Statement of Operations.
The management fee incurred for the six months ended February 28, 2023 was equivalent to an annual effective rate of 0.73% of the fund's average daily net assets.
Distributor — MFS Fund Distributors, Inc. (MFD), a wholly-owned subsidiary of MFS, as distributor, received $39,314 for the six months ended February 28, 2023, as its portion of the initial sales charge on sales of Class A shares of the fund.
The Board of Trustees has adopted a distribution plan for certain share classes pursuant to Rule 12b-1 of the Investment Company Act of 1940.
The fund's distribution plan provides that the fund will pay MFD for services provided by MFD and financial intermediaries in connection with the distribution and servicing of certain share classes. One component of the plan is a distribution fee paid to MFD and another component of the plan is a service fee paid to MFD. MFD may subsequently pay all, or a portion, of the distribution and/or service fees to financial intermediaries.
Distribution Plan Fee Table:
| | Distribution
Fee Rate (d) | Service
Fee Rate (d) | Total
Distribution
Plan (d) | Annual
Effective
Rate (e) | Distribution
and Service
Fee |
| Class A | — | 0.25% | 0.25% | 0.25% | $ 646,660 |
| Class B | 0.75% | 0.25% | 1.00% | 1.00% | 98,433 |
| Class C | 0.75% | 0.25% | 1.00% | 1.00% | 486,003 |
| Class R1 | 0.75% | 0.25% | 1.00% | 1.00% | 35,364 |
| Class R2 | 0.25% | 0.25% | 0.50% | 0.50% | 49,003 |
| Class R3 | — | 0.25% | 0.25% | 0.25% | 56,227 |
| Total Distribution and Service Fees | | | | | $1,371,690 |
| (d) | In accordance with the distribution plan for certain classes, the fund pays distribution and/or service fees equal to these annual percentage rates of each class’s average daily net assets. The distribution and service fee rates disclosed by class represent the current rates in effect at the end of the reporting period. Any rate changes, if applicable, are detailed below. |
| (e) | The annual effective rates represent actual fees incurred under the distribution plan for the six months ended February 28, 2023 based on each class's average daily net assets. MFD has voluntarily agreed to rebate a portion of each class's 0.25% service fee attributable to accounts for which there is no financial intermediary specified on the account except for accounts attributable to MFS or its affiliates' seed money. For the six months ended February 28, 2023, this rebate amounted to $51 and $4 for Class A and Class B shares, respectively, and is included in the reduction of total expenses in the Statement of Operations. |
Certain Class A shares are subject to a contingent deferred sales charge (CDSC) in the event of a shareholder redemption within 18 months of purchase. Class B shares are subject to a CDSC in the event of a shareholder redemption within six years of
Notes to Financial Statements (unaudited) - continued
purchase. Class C shares are subject to a CDSC in the event of a shareholder redemption within 12 months of purchase. All contingent deferred sales charges are paid to MFD and during the six months ended February 28, 2023, were as follows:
| | Amount |
| Class A | $5,758 |
| Class B | 6,136 |
| Class C | 1,933 |
Shareholder Servicing Agent — MFS Service Center, Inc. (MFSC), a wholly-owned subsidiary of MFS, receives a fee from the fund for its services as shareholder servicing agent calculated as a percentage of the average daily net assets of the fund as determined periodically under the supervision of the fund's Board of Trustees. For the six months ended February 28, 2023, the fee was $102,726, which equated to 0.0165% annually of the fund's average daily net assets. MFSC also receives reimbursement from the fund for out-of-pocket expenses, sub-accounting and other shareholder servicing costs which may be paid to affiliated and unaffiliated service providers. Class R6 shares do not incur sub-accounting fees. For the six months ended February 28, 2023, these out-of-pocket expenses, sub-accounting and other shareholder servicing costs amounted to $564,140.
Administrator — MFS provides certain financial, legal, shareholder communications, compliance, and other administrative services to the fund. Under an administrative services agreement, the fund reimburses MFS the costs incurred to provide these services. The fund is charged an annual fixed amount of $17,500 plus a fee based on average daily net assets. The administrative services fee incurred for the six months ended February 28, 2023 was equivalent to an annual effective rate of 0.0156% of the fund's average daily net assets.
Trustees’ and Officers’ Compensation — The fund pays compensation to independent Trustees in the form of a retainer, attendance fees, and additional compensation to Board and Committee chairpersons. The fund does not pay compensation directly to Trustees or officers of the fund who are also officers of the investment adviser, all of whom receive remuneration from MFS for their services to the fund. Certain officers and Trustees of the fund are officers or directors of MFS, MFD, and MFSC.
Other — The fund invests in the MFS Institutional Money Market Portfolio which is managed by MFS and seeks current income consistent with preservation of capital and liquidity. This money market fund does not pay a management fee to MFS but does incur investment and operating costs.
(4) Portfolio Securities
For the six months ended February 28, 2023, purchases and sales of investments, other than short-term obligations, aggregated $102,822,274 and $232,888,971, respectively.
Notes to Financial Statements (unaudited) - continued
(5) Shares of Beneficial Interest
The fund's Declaration of Trust permits the Trustees to issue an unlimited number of full and fractional shares of beneficial interest. Transactions in fund shares were as follows:
| | Six months ended
2/28/23 | | Year ended
8/31/22 |
| | Shares | Amount | | Shares | Amount |
| Shares sold | | | | | |
| Class A | 687,350 | $28,745,591 | | 1,539,626 | $90,958,488 |
| Class B | 2,515 | 82,716 | | 4,748 | 218,700 |
| Class C | 116,527 | 3,811,270 | | 217,987 | 10,422,115 |
| Class I | 550,235 | 25,190,605 | | 1,490,162 | 98,558,908 |
| Class R1 | 26,789 | 876,832 | | 66,023 | 3,082,736 |
| Class R2 | 51,167 | 1,985,524 | | 122,061 | 6,763,303 |
| Class R3 | 100,735 | 4,260,653 | | 248,869 | 14,433,290 |
| Class R4 | 63,303 | 2,783,907 | | 110,131 | 6,923,927 |
| Class R6 | 466,066 | 21,798,215 | | 945,092 | 61,311,730 |
| | 2,064,687 | $89,535,313 | | 4,744,699 | $292,673,197 |
Shares issued to shareholders
in reinvestment of distributions | | | | | |
| Class A | 1,291,127 | $50,057,003 | | 1,420,260 | $94,362,044 |
| Class B | 81,038 | 2,440,061 | | 103,866 | 5,554,746 |
| Class C | 386,365 | 11,594,810 | | 451,349 | 24,074,933 |
| Class I | 577,895 | 24,872,602 | | 788,615 | 57,442,721 |
| Class R1 | 29,422 | 880,297 | | 27,311 | 1,452,667 |
| Class R2 | 57,431 | 2,052,015 | | 69,869 | 4,325,571 |
| Class R3 | 115,789 | 4,485,667 | | 147,455 | 9,789,520 |
| Class R4 | 45,901 | 1,904,879 | | 54,585 | 3,847,149 |
| Class R6 | 391,841 | 17,096,020 | | 477,615 | 35,181,103 |
| | 2,976,809 | $115,383,354 | | 3,540,925 | $236,030,454 |
| Shares reacquired | | | | | |
| Class A | (1,324,020) | $(54,452,424) | | (2,494,973) | $(146,539,685) |
| Class B | (121,783) | (3,936,475) | | (201,409) | (9,484,025) |
| Class C | (545,233) | (17,815,957) | | (788,992) | (36,808,403) |
| Class I | (1,603,663) | (73,527,974) | | (2,770,879) | (171,977,632) |
| Class R1 | (19,991) | (683,479) | | (59,294) | (2,698,719) |
| Class R2 | (91,102) | (3,538,662) | | (212,605) | (11,586,171) |
| Class R3 | (191,779) | (7,994,136) | | (615,081) | (37,075,724) |
| Class R4 | (177,304) | (7,968,750) | | (243,626) | (15,880,342) |
| Class R6 | (710,395) | (33,396,124) | | (1,779,282) | (118,720,885) |
| | (4,785,270) | $(203,313,981) | | (9,166,141) | $(550,771,586) |
Notes to Financial Statements (unaudited) - continued
| | Six months ended
2/28/23 | | Year ended
8/31/22 |
| | Shares | Amount | | Shares | Amount |
| Net change | | | | | |
| Class A | 654,457 | $24,350,170 | | 464,913 | $38,780,847 |
| Class B | (38,230) | (1,413,698) | | (92,795) | (3,710,579) |
| Class C | (42,341) | (2,409,877) | | (119,656) | (2,311,355) |
| Class I | (475,533) | (23,464,767) | | (492,102) | (15,976,003) |
| Class R1 | 36,220 | 1,073,650 | | 34,040 | 1,836,684 |
| Class R2 | 17,496 | 498,877 | | (20,675) | (497,297) |
| Class R3 | 24,745 | 752,184 | | (218,757) | (12,852,914) |
| Class R4 | (68,100) | (3,279,964) | | (78,910) | (5,109,266) |
| Class R6 | 147,512 | 5,498,111 | | (356,575) | (22,228,052) |
| | 256,226 | $1,604,686 | | (880,517) | $(22,067,935) |
Effective June 1, 2019, purchases of the fund’s Class B shares were closed to new and existing investors subject to certain exceptions.
(6) Line of Credit
The fund and certain other funds managed by MFS participate in a $1.45 billion unsecured committed line of credit of which $1.2 billion is reserved for use by the fund and certain other MFS U.S. funds. The line of credit is provided by a syndicate of banks under a credit agreement. Borrowings may be made for temporary financing needs. Interest is charged to each fund, based on its borrowings, generally at a rate equal to the highest of 1) Daily Simple SOFR (Secured Overnight Financing Rate) plus 0.10%, 2) the Federal Funds Effective Rate, or 3) the Overnight Bank Funding Rate, each plus an agreed upon spread. A commitment fee, based on the average daily unused portion of the committed line of credit, is allocated among the participating funds. The line of credit expires on March 14, 2024 unless extended or renewed. In addition, the fund and other funds managed by MFS have established unsecured uncommitted borrowing arrangements with certain banks for temporary financing needs. Interest is charged to each fund, based on its borrowings, at rates equal to customary reference rates plus an agreed upon spread. For the six months ended February 28, 2023, the fund’s commitment fee and interest expense were $3,548 and $0, respectively, and are included in “Miscellaneous” expense in the Statement of Operations.
(7) Investments in Affiliated Issuers
An affiliated issuer may be considered one in which the fund owns 5% or more of the outstanding voting securities, or a company which is under common control. For the purposes of this report, the following were affiliated issuers:
| Affiliated Issuers | Beginning
Value | Purchases | Sales
Proceeds | Realized
Gain
(Loss) | Change in
Unrealized
Appreciation or
Depreciation | Ending
Value |
| MFS Institutional Money Market Portfolio | $55,247,779 | $146,261,352 | $138,102,379 | $2,644 | $(1,174) | $63,408,222 |
Notes to Financial Statements (unaudited) - continued
| Affiliated Issuers | Dividend
Income | Capital Gain
Distributions |
| MFS Institutional Money Market Portfolio | $674,938 | $— |
(8) LIBOR Transition
Certain of the fund's investments, including investments in certain debt instruments and derivatives (if any), as well as borrowings by the fund and certain other contractual arrangements of the fund, may be based on the London Interbank Offered Rate (“LIBOR”). In 2017, the regulatory authority that oversees financial services firms in the United Kingdom announced plans to transition away from LIBOR by the end of 2021. In March 2021, the administrator of LIBOR announced the extension of the publication of the more commonly used U.S. dollar LIBOR settings to the end of June 2023. Although the full impacts of the transition away from LIBOR are not fully known, the transition may result in, among other things, an increase in volatility or illiquidity of the markets for instruments that currently rely on LIBOR to determine interest rates and this could have an adverse impact on the fund's performance. With respect to the fund's accounting for investments, including investments in certain debt instruments and derivatives, as well as borrowings by the fund and any other contractual arrangements of the fund that undergo reference rate-related modifications as a result of the transition, management will rely upon the relief provided by FASB Codification Topic 848 – Reference Rate Reform (Topic 848). The guidance in Topic 848 permits the fund to account for those modified contracts as a continuation of the existing contracts. The situation remains fluid, and management believes, based on best available information, that the impact of the transition will not be material to the fund.
(9) Subsequent Event
On March 30, 2023, the fund announced that effective after the close of business on September 29, 2023, purchases of Class R1 and Class R2 shares will be closed to new eligible investors.
Proxy Voting Policies and Information
MFS votes proxies on behalf of the fund pursuant to proxy voting policies and procedures that are available without charge, upon request, by calling 1-800-225-2606, by visiting mfs.com/proxyvoting, or by visiting the SEC’s Web site at http://www.sec.gov.
Information regarding how the fund voted proxies relating to portfolio securities during the most recent twelve-month period ended June 30 is available by August 31 of each year without charge by visiting mfs.com/proxyvoting, or by visiting the SEC’s Web site at http://www.sec.gov.
Quarterly Portfolio Disclosure
The fund files a complete schedule of portfolio holdings with the SEC for the first and third quarters of each fiscal year as an exhibit to its reports on Form N-PORT. The fund's Form N-PORT reports are available on the SEC's Web site at http://www.sec.gov. A shareholder can obtain the portfolio holdings report for the first and third quarters of the fund's fiscal year at mfs.com/openendfunds by choosing the fund's name and then scrolling to the “Resources” section and clicking on the “Prospectus and Reports” tab.
Further Information
From time to time, MFS may post important information about the fund or the MFS Funds on the MFS Web site (mfs.com). This information is available at https://www.mfs.com/announcements or at mfs.com/openendfunds by choosing the fund’s name and then scrolling to the “Resources” section and clicking on the “Announcements” tab, if any.
Information About Fund Contracts and Legal Claims
The fund has entered into contractual arrangements with an investment adviser, administrator, distributor, shareholder servicing agent, and custodian who each provide services to the fund. Unless expressly stated otherwise, shareholders are not parties to, or intended beneficiaries of these contractual arrangements, and these contractual arrangements are not intended to create any shareholder right to enforce them against the service providers or to seek any remedy under them against the service providers, either directly or on behalf of the fund.
Under the Trust’s By-Laws and Declaration of Trust, any claims asserted against or on behalf of the MFS Funds, including claims against Trustees and Officers, must be brought in state and federal courts located within the Commonwealth of Massachusetts.
Provision of Financial Reports and Summary Prospectuses
The fund produces financial reports every six months and updates its summary prospectus and prospectus annually. To avoid sending duplicate copies of materials to households, only one copy of the fund’s annual and semiannual report and summary prospectus may be mailed to shareholders having the same last name and residential address on the fund’s records. However, any shareholder may contact MFSC (please see back cover for address and telephone number) to request that copies of these reports and summary prospectuses be sent personally to that shareholder.
Save paper with eDelivery.
MFS® will send you prospectuses, reports, and proxies directly via e-mail so you will get information faster with less mailbox clutter.
To sign up:
1. Go to mfs.com.
2. Log in via MFS® Access.
3. Select eDelivery.
If you own your MFS fund shares through a financial institution or a retirement plan, MFS® TALK, MFS® Access, or eDelivery may not be available to you.
CONTACT
WEB SITE
mfs.com
MFS TALK
1-800-637-8255
24 hours a day
ACCOUNT SERVICE AND LITERATURE
Shareholders
1-800-225-2606
Financial advisors
1-800-343-2829
Retirement plan services
1-800-637-1255
MAILING ADDRESS
MFS Service Center, Inc.
P.O. Box 219341
Kansas City, MO 64121-9341
OVERNIGHT MAIL
MFS Service Center, Inc.
Suite 219341
430 W 7th Street
Kansas City, MO 64105-1407
Semiannual Report
February 28, 2023
MFS® U.S. Government Cash Reserve Fund
MFS® U.S. Government Cash Reserve Fund
The report is prepared for the general information of shareholders. It is authorized for distribution to prospective investors only when preceded or accompanied by a current prospectus.
NOT FDIC INSURED • MAY LOSE VALUE • NO BANK GUARANTEE
LETTER FROM THE CHAIR AND CEO
Dear Shareholders:
Markets — which rallied in late 2022 and early 2023 on signs of peaking inflation, hopes that monetary policy tightening cycles may be nearing an end and a rapid reopening of China’s economy — have hit turbulence after the sudden collapse of two US regional banks and the government-led merger of Switzerland’s two largest lenders. At the same time, US inflation data suggest that price pressures will prove more persistent than expected, making the US Federal Reserve’s job of trying to corral four-decade-high inflation without tipping the economy into recession that much more difficult. On a positive note, markets have largely adjusted to the challenges posed by Russia’s invasion of Ukraine, thanks in part to mild European winter weather that has alleviated concerns over potential near-term shortages of natural gas. Resilient labor markets in much of the developed world have further contributed to a brighter-than-expected economic backdrop. However, after the recent banking turmoil, investors are increasingly mindful that the lagged effects of ongoing monetary policy tightening have yet to fully work their way through the global economy.
One result of the banking crisis has been a rally in global government bond markets as investors sense that the global monetary tightening campaign is nearing its end, and the resulting lower yields have eased some of the pressure on interest rate–sensitive parts of the economy. Over the near term, amid tighter financial conditions, we feel companies will face a challenging earnings backdrop as they are forced to absorb higher input and labor costs while pricing power dwindles. As for fixed income, the rise in interest rates in recent months has made bonds more attractive than they have been in years, which may provide balance for investors’ portfolios.
During times of market transition, it is important to have a deep understanding of company fundamentals, and we have built our unique global research platform to do just that.
At MFS®, we put our clients’ assets to work responsibly by carefully navigating increasingly complex global capital markets. Our investment team is guided by a commitment to long-term fundamental investing. Our global investment platform — combining collective expertise, long-term discipline, and thoughtful risk management — seeks to uncover what we believe are the best, most durable investment ideas in markets around the world, enabling us to potentially create value for investors.
Respectfully,
Michael W. Roberge
Chair and Chief Executive Officer
MFS Investment Management
April 14, 2023
The opinions expressed in this letter are subject to change and may not be relied upon for investment advice. No forecasts can be guaranteed.
Composition including fixed income credit quality (a)(u)
| A-1+ | 54.0% |
| A-1 | 46.1% |
| Other Assets Less Liabilities | (0.1)% |
Maturity breakdown (u)
| 0 - 7 days | 60.4% |
| 8 - 29 days | 39.7% |
| 30 - 59 days | 0.0% |
| 60 - 89 days | 0.0% |
| Other Assets Less Liabilities | (0.1)% |
| (a) | Ratings are assigned to portfolio securities utilizing ratings from Moody’s, Fitch, and Standard & Poor’s rating agencies and applying the following hierarchy: If all three agencies provide a rating, the middle rating (after dropping the highest and lowest ratings) is assigned; if two of the three agencies rate a security, the lower of the two is assigned. Ratings are shown in the S&P scale. All ratings are subject to change. The fund did not hold unrated securities. The fund is not rated by these agencies. |
| (u) | For purposes of this presentation, accrued interest, where applicable, is included. |
From time to time Other Assets Less Liabilities may be negative due to timing of cash receipts.
Percentages are based on net assets as of February 28, 2023.
The portfolio is actively managed and current holdings may be different.
Expense Table
Fund expenses borne by the shareholders during the period,
September 1, 2022 through February 28, 2023
As a shareholder of the fund, you incur two types of costs: (1) transaction costs, including sales charges (loads) on certain purchase or redemption payments, and (2) ongoing costs, including management fees; distribution and service (12b-1) fees; and other fund expenses. This example is intended to help you understand your ongoing costs (in dollars) of investing in the fund and to compare these costs with the ongoing costs of investing in other mutual funds.
The example is based on an investment of $1,000 invested at the beginning of the period and held for the entire period September 1, 2022 through February 28, 2023.
Actual Expenses
The first line for each share class in the following table provides information about actual account values and actual expenses. You may use the information in this line, together with the amount you invested, to estimate the expenses that you paid over the period. Simply divide your account value by $1,000 (for example, an $8,600 account value divided by $1,000 = 8.6), then multiply the result by the number in the first line under the heading entitled “Expenses Paid During Period” to estimate the expenses you paid on your account during this period.
Hypothetical Example for Comparison Purposes
The second line for each share class in the following table provides information about hypothetical account values and hypothetical expenses based on the fund’s actual expense ratio and an assumed rate of return of 5% per year before expenses, which is not the fund’s actual return. The hypothetical account values and expenses may not be used to estimate the actual ending account balance or expenses you paid for the period. You may use this information to compare the ongoing costs of investing in the fund and other funds. To do so, compare this 5% hypothetical example with the 5% hypothetical examples that appear in the shareholder reports of the other funds.
Please note that the expenses shown in the table are meant to highlight your ongoing costs only and do not reflect any transactional costs, such as sales charges (loads). Therefore, the second line for each share class in the table is useful in comparing ongoing costs only, and will not help you determine the relative total costs of owning different funds. In addition, if these transactional costs were included, your costs would have been higher.
Expense Table - continued
Share
Class | | Annualized
Expense
Ratio | Beginning
Account Value
9/01/22 | Ending
Account Value
2/28/23 | Expenses
Paid During
Period (p)
9/01/22-2/28/23 |
| A | Actual | 0.42% | $1,000.00 | $1,015.59 | $2.10 |
| Hypothetical (h) | 0.42% | $1,000.00 | $1,022.71 | $2.11 |
| B | Actual | 0.42% | $1,000.00 | $1,015.58 | $2.10 |
| Hypothetical (h) | 0.42% | $1,000.00 | $1,022.71 | $2.11 |
| C | Actual | 0.42% | $1,000.00 | $1,015.59 | $2.10 |
| Hypothetical (h) | 0.42% | $1,000.00 | $1,022.71 | $2.11 |
| I | Actual | 0.42% | $1,000.00 | $1,015.60 | $2.10 |
| Hypothetical (h) | 0.42% | $1,000.00 | $1,022.71 | $2.11 |
| R1 | Actual | 0.42% | $1,000.00 | $1,015.58 | $2.10 |
| Hypothetical (h) | 0.42% | $1,000.00 | $1,022.71 | $2.11 |
| R2 | Actual | 0.42% | $1,000.00 | $1,015.56 | $2.10 |
| Hypothetical (h) | 0.42% | $1,000.00 | $1,022.71 | $2.11 |
| R3 | Actual | 0.42% | $1,000.00 | $1,015.56 | $2.10 |
| Hypothetical (h) | 0.42% | $1,000.00 | $1,022.71 | $2.11 |
| R4 | Actual | 0.42% | $1,000.00 | $1,015.59 | $2.10 |
| Hypothetical (h) | 0.42% | $1,000.00 | $1,022.71 | $2.11 |
| R6 | Actual | 0.37% | $1,000.00 | $1,015.83 | $1.85 |
| Hypothetical (h) | 0.37% | $1,000.00 | $1,022.96 | $1.86 |
| (h) | 5% class return per year before expenses. |
| (p) | “Expenses Paid During Period” are equal to each class’s annualized expense ratio, as shown above, multiplied by the average account value over the period, multiplied by 181/365 (to reflect the one-half year period). Expenses paid do not include any applicable sales charges (loads). If these transaction costs had been included, your costs would have been higher. |
Portfolio of Investments
2/28/23 (unaudited)
The Portfolio of Investments is a complete list of all securities owned by your fund. It is categorized by broad-based asset classes.
| Issuer | | | Shares/Par | Value ($) |
| U.S. Government Agencies and Equivalents (y) – 81.7% |
| Fannie Mae, 4.43%, due 3/07/2023 | | $34,000,000 | $33,975,350 |
| Federal Farm Credit Bank, 4.55%, due 3/01/2023 | | 30,500,000 | 30,500,000 |
| Federal Home Loan Bank, 4.5%, due 3/01/2023 | | 34,000,000 | 34,000,000 |
| Freddie Mac, 4.39%, due 3/06/2023 | | 34,000,000 | 33,979,647 |
| U.S. Treasury Bill, 4.48%, due 3/02/2023 | | 49,167,000 | 49,160,987 |
| U.S. Treasury Bill, 4.56%, due 3/07/2023 | | 18,750,000 | 18,735,992 |
| U.S. Treasury Bill, 4.56%, due 3/09/2023 | | 18,750,000 | 18,731,323 |
| U.S. Treasury Bill, 4.55%, due 3/14/2023 | | 34,500,000 | 34,444,243 |
| U.S. Treasury Bill, 4.54%, due 3/16/2023 | | 37,000,000 | 36,931,242 |
| U.S. Treasury Bill, 4.58%, due 3/21/2023 | | 32,000,000 | 31,919,973 |
| U.S. Treasury Bill, 4.54%, due 3/23/2023 | | 26,000,000 | 25,929,295 |
| U.S. Treasury Bill, 4.61%, due 3/28/2023 | | 41,736,000 | 41,594,045 |
| Total U.S. Government Agencies and Equivalents, at Amortized Cost and Value | | | $389,902,097 |
| Repurchase Agreements – 18.4% | |
Bank of America Corp. Repurchase Agreement, 4.51%,
dated 2/28/2023, due 3/01/2023, total to be received $43,772,483
(secured by U.S. Treasury and/or U.S. Government Agency Securities valued at $45,072,750) | | $43,767,000 | $43,767,000 |
JPMorgan Chase & Co. Repurchase Agreement, 4.51%,
dated 2/28/2023, due 3/01/2023, total to be received $43,866,495
(secured by U.S. Treasury and/or U.S. Government Agency Securities valued at $44,734,288) | | 43,861,000 | 43,861,000 |
| Total Repurchase Agreements, at Cost and Value | | | | $87,628,000 |
|
|
| Other Assets, Less Liabilities – (0.1)% | | | (700,969) |
| Net Assets – 100.0% | | | $476,829,128 |
| (y) | The rate shown represents an annualized yield at time of purchase. |
See Notes to Financial Statements
Financial Statements
Statement of Assets and Liabilities
At 2/28/23 (unaudited)
This statement represents your fund’s balance sheet, which details the assets and liabilities comprising the total value of the fund.
| Assets | |
| Investments in unaffiliated issuers, at cost and value | $389,902,097 |
| Investments in unaffiliated repurchase agreements, at cost and value | 87,628,000 |
| Cash | 503 |
| Receivables for | |
| Fund shares sold | 165,904 |
| Interest | 10,978 |
| Receivable from investment adviser and distributor | 47,185 |
| Other assets | 18,720 |
| Total assets | $477,773,387 |
| Liabilities | |
| Payables for | |
| Distributions | $11,164 |
| Fund shares reacquired | 797,533 |
| Payable to affiliates | |
| Administrative services fee | 445 |
| Shareholder servicing costs | 81,505 |
| Payable for independent Trustees' compensation | 4,981 |
| Accrued expenses and other liabilities | 48,631 |
| Total liabilities | $944,259 |
| Net assets | $476,829,128 |
| Net assets consist of | |
| Paid-in capital | $476,838,417 |
| Total distributable earnings (loss) | (9,289) |
| Net assets | $476,829,128 |
| Shares of beneficial interest outstanding | 477,063,935 |
Statement of Assets and Liabilities (unaudited) – continued
| | Net assets | Shares
outstanding | Net asset value
per share |
| Class A | $172,065,210 | 172,150,043 | $1.00 |
| Class B | 4,287,405 | 4,289,511 | 1.00 |
| Class C | 25,817,635 | 25,830,326 | 1.00 |
| Class I | 16,593,124 | 16,601,337 | 1.00 |
| Class R1 | 9,026,712 | 9,031,141 | 1.00 |
| Class R2 | 19,191,935 | 19,201,524 | 1.00 |
| Class R3 | 17,969,776 | 17,978,594 | 1.00 |
| Class R4 | 2,725,729 | 2,727,067 | 1.00 |
| Class R6 | 209,151,602 | 209,254,392 | 1.00 |
A contingent deferred sales charge may be imposed on redemptions of Class A, Class B, and Class C shares. Redemption price per share was equal to the net asset value per share for Classes I, R1, R2, R3, R4, and R6.
See Notes to Financial Statements
Financial Statements
Statement of Operations
Six months ended 2/28/23 (unaudited)
This statement describes how much your fund earned in investment income and accrued in expenses. It also describes any gains and/or losses generated by fund operations.
| Net investment income (loss) | |
| Income | |
| Interest | $8,804,067 |
| Other | 1,474 |
| Total investment income | $8,805,541 |
| Expenses | |
| Management fee | $996,093 |
| Distribution and service fees | 551,799 |
| Shareholder servicing costs | 183,235 |
| Administrative services fee | 41,839 |
| Independent Trustees' compensation | 5,225 |
| Custodian fee | 9,759 |
| Shareholder communications | 7,923 |
| Audit and tax fees | 23,305 |
| Legal fees | 931 |
| Miscellaneous | 97,320 |
| Total expenses | $1,917,429 |
| Reduction of expenses by investment adviser and distributor | (923,658) |
| Net expenses | $993,771 |
| Net investment income (loss) | $7,811,770 |
| Change in net assets from operations | $7,811,770 |
See Notes to Financial Statements
Financial Statements
Statements of Changes in Net Assets
These statements describe the increases and/or decreases in net assets resulting from operations, any distributions, and any shareholder transactions.
| | Six months ended | Year ended |
| | 2/28/23
(unaudited) | 8/31/22 |
| Change in net assets | | |
| From operations | | |
| Net investment income (loss) | $7,811,770 | $1,411,816 |
| Net realized gain (loss) | — | (4,685) |
| Change in net assets from operations | $7,811,770 | $1,407,131 |
| Total distributions to shareholders | $(7,811,770) | $(1,446,753) |
| Change in net assets from fund share transactions | $(31,190,225) | $242,804,440 |
| Total change in net assets | $(31,190,225) | $242,764,818 |
| Net assets | | |
| At beginning of period | 508,019,353 | 265,254,535 |
| At end of period | $476,829,128 | $508,019,353 |
See Notes to Financial Statements
Financial Statements
Financial Highlights
The financial highlights table is intended to help you understand the fund's financial performance for the semiannual period and the past 5 fiscal years (or life of a particular share class, if shorter). Certain information reflects financial results for a single fund share. The total returns in the table represent the rate that an investor would have earned (or lost) on an investment in the fund share class (assuming reinvestment of all distributions) held for the entire period.
| Class A | Six months
ended | Year ended |
| | 2/28/23
(unaudited) | 8/31/22 | 8/31/21 | 8/31/20 | 8/31/19 | 8/31/18 |
| Net asset value, beginning of period | $1.00 | $1.00 | $1.00 | $1.00 | $1.00 | $1.00 |
| Income (loss) from investment operations |
| Net investment income (loss) (d) | $0.02 | $0.00(w) | $0.00 | $0.00(w) | $0.02 | $0.01 |
| Net realized and unrealized gain (loss) | — | (0.00)(w) | 0.00(w) | 0.00(w) | 0.00(w) | — |
| Total from investment operations | $0.02 | $0.00(w) | $0.00(w) | $0.00(w) | $0.02 | $0.01 |
| Less distributions declared to shareholders |
| From net investment income | $(0.02) | $(0.00)(w) | $— | $(0.00)(w) | $(0.02) | $(0.01) |
| From net realized gain | — | (0.00)(w) | — | — | — | — |
| Total distributions declared to shareholders | $(0.02) | $(0.00)(w) | $— | $(0.00)(w) | $(0.02) | $(0.01) |
| Net asset value, end of period | $1.00 | $1.00 | $1.00 | $1.00 | $1.00 | $1.00 |
| Total return (%) (r)(t) | 1.56(n) | 0.28 | 0.00 | 0.54 | 1.58 | 0.76 |
Ratios (%) (to average net assets)
and Supplemental data: |
| Expenses before expense reductions | 0.82(a) | 0.91 | 0.91 | 0.96 | 0.98 | 0.94 |
| Expenses after expense reductions | 0.42(a) | 0.21 | 0.05 | 0.44 | 0.72 | 0.68 |
| Net investment income (loss) | 3.14(a) | 0.33 | 0.00 | 0.44 | 1.57 | 0.76 |
| Net assets at end of period (000 omitted) | $172,065 | $173,514 | $128,482 | $140,426 | $99,511 | $100,463 |
See Notes to Financial Statements
Financial Highlights – continued
| Class B | Six months
ended | Year ended |
| | 2/28/23
(unaudited) | 8/31/22 | 8/31/21 | 8/31/20 | 8/31/19 | 8/31/18 |
| Net asset value, beginning of period | $1.00 | $1.00 | $1.00 | $1.00 | $1.00 | $1.00 |
| Income (loss) from investment operations |
| Net investment income (loss) (d) | $0.02 | $0.00(w) | $0.00 | $0.00(w) | $0.02 | $0.01 |
| Net realized and unrealized gain (loss) | — | (0.00)(w) | 0.00(w) | 0.00(w) | 0.00(w) | — |
| Total from investment operations | $0.02 | $0.00(w) | $0.00(w) | $0.00(w) | $0.02 | $0.01 |
| Less distributions declared to shareholders |
| From net investment income | $(0.02) | $(0.00)(w) | $— | $(0.00)(w) | $(0.02) | $(0.01) |
| From net realized gain | — | (0.00)(w) | — | — | — | — |
| Total distributions declared to shareholders | $(0.02) | $(0.00)(w) | $— | $(0.00)(w) | $(0.02) | $(0.01) |
| Net asset value, end of period | $1.00 | $1.00 | $1.00 | $1.00 | $1.00 | $1.00 |
| Total return (%) (r)(t) | 1.56(n) | 0.28 | 0.00 | 0.54 | 1.58 | 0.76 |
Ratios (%) (to average net assets)
and Supplemental data: |
| Expenses before expense reductions | 1.57(a) | 1.66 | 1.66 | 1.71 | 1.73 | 1.69 |
| Expenses after expense reductions | 0.42(a) | 0.18 | 0.05 | 0.47 | 0.72 | 0.68 |
| Net investment income (loss) | 3.09(a) | 0.25 | 0.00 | 0.49 | 1.57 | 0.72 |
| Net assets at end of period (000 omitted) | $4,287 | $5,194 | $6,792 | $9,528 | $8,977 | $11,664 |
See Notes to Financial Statements
Financial Highlights – continued
| Class C | Six months
ended | Year ended |
| | 2/28/23
(unaudited) | 8/31/22 | 8/31/21 | 8/31/20 | 8/31/19 | 8/31/18 |
| Net asset value, beginning of period | $1.00 | $1.00 | $1.00 | $1.00 | $1.00 | $1.00 |
| Income (loss) from investment operations |
| Net investment income (loss) (d) | $0.02 | $0.00(w) | $0.00 | $0.00(w) | $0.02 | $0.01 |
| Net realized and unrealized gain (loss) | — | (0.00)(w) | 0.00(w) | 0.00(w) | 0.00(w) | — |
| Total from investment operations | $0.02 | $0.00(w) | $0.00(w) | $0.00(w) | $0.02 | $0.01 |
| Less distributions declared to shareholders |
| From net investment income | $(0.02) | $(0.00)(w) | $— | $(0.00)(w) | $(0.02) | $(0.01) |
| From net realized gain | — | (0.00)(w) | — | — | — | — |
| Total distributions declared to shareholders | $(0.02) | $(0.00)(w) | $— | $(0.00)(w) | $(0.02) | $(0.01) |
| Net asset value, end of period | $1.00 | $1.00 | $1.00 | $1.00 | $1.00 | $1.00 |
| Total return (%) (r)(t) | 1.56(n) | 0.28 | 0.00 | 0.54 | 1.58 | 0.76 |
Ratios (%) (to average net assets)
and Supplemental data: |
| Expenses before expense reductions | 1.57(a) | 1.66 | 1.66 | 1.71 | 1.73 | 1.69 |
| Expenses after expense reductions | 0.42(a) | 0.25 | 0.05 | 0.40 | 0.72 | 0.68 |
| Net investment income (loss) | 3.01(a) | 0.40 | 0.00 | 0.37 | 1.57 | 0.68 |
| Net assets at end of period (000 omitted) | $25,818 | $43,674 | $23,748 | $34,508 | $19,438 | $18,451 |
See Notes to Financial Statements
Financial Highlights – continued
| Class I | Six months
ended | Year ended |
| | 2/28/23
(unaudited) | 8/31/22 | 8/31/21 | 8/31/20 | 8/31/19(i) |
| Net asset value, beginning of period | $1.00 | $1.00 | $1.00 | $1.00 | $1.00 |
| Income (loss) from investment operations |
| Net investment income (loss) (d) | $0.02 | $0.00(w) | $0.00 | $0.00(w) | $0.02 |
| Net realized and unrealized gain (loss) | — | (0.00)(w) | 0.00(w) | 0.00(w) | 0.00(w) |
| Total from investment operations | $0.02 | $0.00(w) | $0.00(w) | $0.00(w) | $0.02 |
| Less distributions declared to shareholders |
| From net investment income | $(0.02) | $(0.00)(w) | $— | $(0.00)(w) | $(0.02) |
| From net realized gain | — | (0.00)(w) | — | — | — |
| Total distributions declared to shareholders | $(0.02) | $(0.00)(w) | $— | $(0.00)(w) | $(0.02) |
| Net asset value, end of period | $1.00 | $1.00 | $1.00 | $1.00 | $1.00 |
| Total return (%) (r)(t) | 1.56(n) | 0.28 | 0.00 | 0.54 | 1.52(n) |
Ratios (%) (to average net assets)
and Supplemental data: |
| Expenses before expense reductions | 0.57(a) | 0.66 | 0.65 | 0.69 | 0.73(a) |
| Expenses after expense reductions | 0.42(a) | 0.20 | 0.05 | 0.23 | 0.72(a) |
| Net investment income (loss) | 3.11(a) | 0.29 | 0.00 | 0.06 | 1.60(a) |
| Net assets at end of period (000 omitted) | $16,593 | $17,382 | $12,819 | $9,797 | $56 |
See Notes to Financial Statements
Financial Highlights – continued
| Class R1 | Six months
ended | Year ended |
| | 2/28/23
(unaudited) | 8/31/22 | 8/31/21 | 8/31/20 | 8/31/19 | 8/31/18 |
| Net asset value, beginning of period | $1.00 | $1.00 | $1.00 | $1.00 | $1.00 | $1.00 |
| Income (loss) from investment operations |
| Net investment income (loss) (d) | $0.02 | $0.00(w) | $0.00 | $0.00(w) | $0.02 | $0.01 |
| Net realized and unrealized gain (loss) | — | (0.00)(w) | 0.00(w) | 0.00(w) | 0.00(w) | — |
| Total from investment operations | $0.02 | $0.00(w) | $0.00(w) | $0.00(w) | $0.02 | $0.01 |
| Less distributions declared to shareholders |
| From net investment income | $(0.02) | $(0.00)(w) | $— | $(0.00)(w) | $(0.02) | $(0.01) |
| From net realized gain | — | (0.00)(w) | — | — | — | — |
| Total distributions declared to shareholders | $(0.02) | $(0.00)(w) | $— | $(0.00)(w) | $(0.02) | $(0.01) |
| Net asset value, end of period | $1.00 | $1.00 | $1.00 | $1.00 | $1.00 | $1.00 |
| Total return (%) (r)(t) | 1.56(n) | 0.28 | 0.00 | 0.54 | 1.57 | 0.76 |
Ratios (%) (to average net assets)
and Supplemental data: |
| Expenses before expense reductions | 1.57(a) | 1.66 | 1.65 | 1.71 | 1.73 | 1.69 |
| Expenses after expense reductions | 0.42(a) | 0.19 | 0.05 | 0.47 | 0.72 | 0.68 |
| Net investment income (loss) | 3.12(a) | 0.27 | 0.00 | 0.48 | 1.57 | 0.72 |
| Net assets at end of period (000 omitted) | $9,027 | $9,298 | $8,761 | $9,209 | $7,610 | $8,305 |
See Notes to Financial Statements
Financial Highlights – continued
| Class R2 | Six months
ended | Year ended |
| | 2/28/23
(unaudited) | 8/31/22 | 8/31/21 | 8/31/20 | 8/31/19 | 8/31/18 |
| Net asset value, beginning of period | $1.00 | $1.00 | $1.00 | $1.00 | $1.00 | $1.00 |
| Income (loss) from investment operations |
| Net investment income (loss) (d) | $0.02 | $0.00(w) | $0.00 | $0.01 | $0.02 | $0.01 |
| Net realized and unrealized gain (loss) | — | (0.00)(w) | 0.00(w) | 0.00(w) | 0.00(w) | — |
| Total from investment operations | $0.02 | $0.00(w) | $0.00(w) | $0.01 | $0.02 | $0.01 |
| Less distributions declared to shareholders |
| From net investment income | $(0.02) | $(0.00)(w) | $— | $(0.01) | $(0.02) | $(0.01) |
| From net realized gain | — | (0.00)(w) | — | — | — | — |
| Total distributions declared to shareholders | $(0.02) | $(0.00)(w) | $— | $(0.01) | $(0.02) | $(0.01) |
| Net asset value, end of period | $1.00 | $1.00 | $1.00 | $1.00 | $1.00 | $1.00 |
| Total return (%) (r)(t) | 1.56(n) | 0.28 | 0.00 | 0.54 | 1.57 | 0.76 |
Ratios (%) (to average net assets)
and Supplemental data: |
| Expenses before expense reductions | 1.07(a) | 1.16 | 1.16 | 1.21 | 1.23 | 1.19 |
| Expenses after expense reductions | 0.42(a) | 0.19 | 0.05 | 0.48 | 0.72 | 0.68 |
| Net investment income (loss) | 3.08(a) | 0.26 | 0.00 | 0.51 | 1.57 | 0.73 |
| Net assets at end of period (000 omitted) | $19,192 | $23,726 | $26,432 | $33,676 | $31,672 | $34,993 |
See Notes to Financial Statements
Financial Highlights – continued
| Class R3 | Six months
ended | Year ended |
| | 2/28/23
(unaudited) | 8/31/22 | 8/31/21 | 8/31/20 | 8/31/19 | 8/31/18 |
| Net asset value, beginning of period | $1.00 | $1.00 | $1.00 | $1.00 | $1.00 | $1.00 |
| Income (loss) from investment operations |
| Net investment income (loss) (d) | $0.02 | $0.00(w) | $0.00 | $0.00(w) | $0.02 | $0.01 |
| Net realized and unrealized gain (loss) | — | (0.00)(w) | 0.00(w) | 0.00(w) | 0.00(w) | — |
| Total from investment operations | $0.02 | $0.00(w) | $0.00(w) | $0.00(w) | $0.02 | $0.01 |
| Less distributions declared to shareholders |
| From net investment income | $(0.02) | $(0.00)(w) | $— | $(0.00)(w) | $(0.02) | $(0.01) |
| From net realized gain | — | (0.00)(w) | — | — | — | — |
| Total distributions declared to shareholders | $(0.02) | $(0.00)(w) | $— | $(0.00)(w) | $(0.02) | $(0.01) |
| Net asset value, end of period | $1.00 | $1.00 | $1.00 | $1.00 | $1.00 | $1.00 |
| Total return (%) (r)(t) | 1.56(n) | 0.28 | 0.00 | 0.54 | 1.57 | 0.76 |
Ratios (%) (to average net assets)
and Supplemental data: |
| Expenses before expense reductions | 0.82(a) | 0.91 | 0.90 | 0.96 | 0.98 | 0.94 |
| Expenses after expense reductions | 0.42(a) | 0.19 | 0.05 | 0.44 | 0.72 | 0.68 |
| Net investment income (loss) | 3.09(a) | 0.29 | 0.00 | 0.44 | 1.55 | 0.73 |
| Net assets at end of period (000 omitted) | $17,970 | $21,166 | $21,266 | $24,536 | $16,471 | $26,227 |
See Notes to Financial Statements
Financial Highlights – continued
| Class R4 | Six months
ended | Year ended |
| | 2/28/23
(unaudited) | 8/31/22 | 8/31/21 | 8/31/20 | 8/31/19 | 8/31/18 |
| Net asset value, beginning of period | $1.00 | $1.00 | $1.00 | $1.00 | $1.00 | $1.00 |
| Income (loss) from investment operations |
| Net investment income (loss) (d) | $0.02 | $0.00(w) | $0.00 | $0.01 | $0.02 | $0.01 |
| Net realized and unrealized gain (loss) | — | (0.00)(w) | 0.00(w) | 0.00(w) | 0.00(w) | — |
| Total from investment operations | $0.02 | $0.00(w) | $0.00(w) | $0.01 | $0.02 | $0.01 |
| Less distributions declared to shareholders |
| From net investment income | $(0.02) | $(0.00)(w) | $— | $(0.01) | $(0.02) | $(0.01) |
| From net realized gain | — | (0.00)(w) | — | — | — | — |
| Total distributions declared to shareholders | $(0.02) | $(0.00)(w) | $— | $(0.01) | $(0.02) | $(0.01) |
| Net asset value, end of period | $1.00 | $1.00 | $1.00 | $1.00 | $1.00 | $1.00 |
| Total return (%) (r)(t) | 1.56(n) | 0.28 | 0.00 | 0.54 | 1.57 | 0.76 |
Ratios (%) (to average net assets)
and Supplemental data: |
| Expenses before expense reductions | 0.57(a) | 0.66 | 0.65 | 0.71 | 0.73 | 0.69 |
| Expenses after expense reductions | 0.42(a) | 0.19 | 0.05 | 0.49 | 0.72 | 0.68 |
| Net investment income (loss) | 3.13(a) | 0.27 | 0.00 | 0.54 | 1.57 | 0.74 |
| Net assets at end of period (000 omitted) | $2,726 | $2,684 | $2,676 | $2,709 | $2,676 | $2,729 |
See Notes to Financial Statements
Financial Highlights – continued
| Class R6 | Six months
ended | Year ended |
| | 2/28/23
(unaudited) | 8/31/22 | 8/31/21 | 8/31/20 | 8/31/19(i) |
| Net asset value, beginning of period | $1.00 | $1.00 | $1.00 | $1.00 | $1.00 |
| Income (loss) from investment operations |
| Net investment income (loss) (d) | $0.02 | $0.01 | $0.00 | $0.00(w) | $0.02 |
| Net realized and unrealized gain (loss) | — | (0.01) | 0.00(w) | 0.00(w) | 0.00(w) |
| Total from investment operations | $0.02 | $0.00(w) | $0.00(w) | $0.00(w) | $0.02 |
| Less distributions declared to shareholders |
| From net investment income | $(0.02) | $(0.00)(w) | $— | $(0.00)(w) | $(0.02) |
| From net realized gain | — | (0.00)(w) | — | — | — |
| Total distributions declared to shareholders | $(0.02) | $(0.00)(w) | $— | $(0.00)(w) | $(0.02) |
| Net asset value, end of period | $1.00 | $1.00 | $1.00 | $1.00 | $1.00 |
| Total return (%) (r)(t) | 1.58(n) | 0.30 | 0.00 | 0.58 | 1.58(n) |
Ratios (%) (to average net assets)
and Supplemental data: |
| Expenses before expense reductions | 0.52(a) | 0.56 | 0.59 | 0.65 | 0.66(a) |
| Expenses after expense reductions | 0.37(a) | 0.37 | 0.05 | 0.42 | 0.65(a) |
| Net investment income (loss) | 3.17(a) | 0.99 | 0.00 | 0.46 | 1.65(a) |
| Net assets at end of period (000 omitted) | $209,152 | $211,381 | $113 | $113 | $54 |
| (a) | Annualized. |
| (d) | Per share data is based on average shares outstanding. |
| (i) | For Class I and Class R6, the period is from the class inception, September 18, 2018, through the stated period end. |
| (n) | Not annualized. |
| (r) | Certain expenses have been reduced without which performance would have been lower. |
| (t) | Total returns do not include any applicable sales charges. |
| (w) | Per share amount was less than $0.01. |
See Notes to Financial Statements
Notes to Financial Statements
(unaudited)
(1) Business and Organization
MFS U.S. Government Cash Reserve Fund (the fund) is a diversified series of MFS Series Trust I (the trust). The trust is organized as a Massachusetts business trust and is registered under the Investment Company Act of 1940, as amended, as an open-end management investment company.
The fund is an investment company and accordingly follows the investment company accounting and reporting guidance of the Financial Accounting Standards Board (FASB) Accounting Standards Codification Topic 946 Financial Services - Investment Companies.
(2) Significant Accounting Policies
General — The preparation of financial statements in conformity with U.S. generally accepted accounting principles requires management to make estimates and assumptions that affect the reported amounts of assets and liabilities, and disclosure of contingent assets and liabilities at the date of the financial statements and the reported amounts of increases and decreases in net assets from operations during the reporting period. Actual results could differ from those estimates. In the preparation of these financial statements, management has evaluated subsequent events occurring after the date of the fund’s Statement of Assets and Liabilities through the date that the financial statements were issued.
Balance Sheet Offsetting — The fund's accounting policy with respect to balance sheet offsetting is that, absent an event of default by the counterparty or a termination of the agreement, the International Swaps and Derivatives Association (ISDA) Master Agreement, or similar agreement, does not result in an offset of reported amounts of financial assets and financial liabilities in the Statement of Assets and Liabilities across transactions between the fund and the applicable counterparty. The fund's right to setoff may be restricted or prohibited by the bankruptcy or insolvency laws of the particular jurisdiction to which a specific master netting agreement counterparty is subject. Balance sheet offsetting disclosures, to the extent applicable to the fund, have been included in the fund’s Significant Accounting Policies note under the captions for each of the fund’s in-scope financial instruments and transactions.
Investment Valuations — Subject to its oversight, the fund’s Board of Trustees has delegated primary responsibility for determining or causing to be determined the value of the fund’s investments to MFS as the fund’s adviser, pursuant to the fund’s valuation policy and procedures which have been adopted by the adviser and approved by the Board. Effective September 8, 2022, and in accordance with Rule 2a-5 under the Investment Company Act of 1940, the Board of Trustees designated the adviser as the “valuation designee” of the fund. If the adviser, as valuation designee, determines that reliable market quotations are not readily available for an investment, the investment is valued at fair value as determined in good faith by the adviser in accordance with the adviser’s fair valuation policy and procedures.
Under the fund's valuation policies and procedures, market quotations are not considered to be readily available for debt instruments. Debt instruments held by the fund are generally valued at amortized cost, which approximates market value.
Notes to Financial Statements (unaudited) - continued
Amortized cost involves valuing an instrument at its cost as adjusted for amortization of premium or accretion of discount rather than its current market value. The amortized cost value of an instrument can be different from the market value of an instrument.
Various inputs are used in determining the value of the fund's assets or liabilities. These inputs are categorized into three broad levels. In certain cases, the inputs used to measure fair value may fall into different levels of the fair value hierarchy. In such cases, an investment's level within the fair value hierarchy is based on the lowest level of input that is significant to the fair value measurement. The fund's assessment of the significance of a particular input to the fair value measurement in its entirety requires judgment, and considers factors specific to the investment. Level 1 includes unadjusted quoted prices in active markets for identical assets or liabilities. Level 2 includes other significant observable market-based inputs (including quoted prices for similar securities, interest rates, prepayment speed, and credit risk). Level 3 includes significant unobservable inputs, which may include the adviser's own assumptions in determining the fair value of investments. The following is a summary of the levels used as of February 28, 2023 in valuing the fund's assets and liabilities:
| Financial Instruments | Level 1 | Level 2 | Level 3 | Total |
| Short-Term Securities | $— | $477,530,097 | $— | $477,530,097 |
For further information regarding security characteristics, see the Portfolio of Investments.
Repurchase Agreements — The fund enters into repurchase agreements under the terms of Master Repurchase Agreements with approved counterparties. Each repurchase agreement is recorded at cost. The fund requires that the securities collateral in a repurchase transaction be transferred to a custodian. The fund monitors, on a daily basis, the value of the collateral to ensure that its value, including accrued interest, is greater than amounts owed to the fund under each such repurchase agreement. Upon an event of default under a Master Repurchase Agreement, the non-defaulting party may close out all transactions traded under such agreement and net amounts owed under each transaction to one net amount payable by one party to the other. Absent an event of default, the Master Repurchase Agreement does not result in an offset of reported amounts of assets and liabilities in the Statement of Assets and Liabilities across transactions between the fund and the applicable counterparty. At February 28, 2023, the fund had investments in repurchase agreements with a gross value of $87,628,000 in the Statement of Assets and Liabilities. The value of the related collateral exceeded the value of the repurchase agreements at period end.
Indemnifications — Under the fund's organizational documents, its officers and Trustees may be indemnified against certain liabilities and expenses arising out of the performance of their duties to the fund. Additionally, in the normal course of business, the fund enters into agreements with service providers that may contain indemnification clauses. The fund's maximum exposure under these agreements is unknown as this would involve future claims that may be made against the fund that have not yet occurred.
Notes to Financial Statements (unaudited) - continued
Investment Transactions and Income — Investment transactions are recorded on the trade date. Interest income is recorded on the accrual basis. All premium and discount is amortized or accreted for financial statement purposes in accordance with U.S. generally accepted accounting principles. In determining the net gain or loss on securities sold, the cost of securities is determined on the identified cost basis.
Tax Matters and Distributions — The fund intends to qualify as a regulated investment company, as defined under Subchapter M of the Internal Revenue Code, and to distribute all of its taxable income, including realized capital gains. As a result, no provision for federal income tax is required. The fund’s federal tax returns, when filed, will remain subject to examination by the Internal Revenue Service for a three year period. Management has analyzed the fund’s tax positions taken on federal and state tax returns for all open tax years and does not believe that there are any uncertain tax positions that require recognition of a tax liability.
Distributions to shareholders are recorded on the ex-dividend date. Income and capital gain distributions are determined in accordance with income tax regulations, which may differ from U.S. generally accepted accounting principles. Certain capital accounts in the financial statements are periodically adjusted for permanent differences in order to reflect their tax character. These adjustments have no impact on net assets or net asset value per share. Temporary differences which arise from recognizing certain items of income, expense, gain or loss in different periods for financial statement and tax purposes will reverse at some time in the future.
During the year ended August 31, 2022, there were no significant adjustments due to differences between book and tax accounting.
The tax character of distributions made during the current period will be determined at fiscal year end. The tax character of distributions declared to shareholders for the last fiscal year is as follows:
| | Year ended
8/31/22 |
| Ordinary income (including any short-term capital gains) | $1,446,753 |
The federal tax cost and the tax basis components of distributable earnings were as follows:
| As of 2/28/23 | |
| Cost of investments | $477,530,097 |
| As of 8/31/22 | |
| Undistributed ordinary income | 4,612 |
| Capital loss carryforwards | (4,685) |
| Other temporary differences | (9,216) |
The aggregate cost above includes prior fiscal year end tax adjustments, if applicable.
As of August 31, 2022, the fund had capital loss carryforwards available to offset future realized gains. These net capital losses may be carried forward indefinitely and their character is retained as short-term and/or long-term losses. Such losses are characterized as follows:
Notes to Financial Statements (unaudited) - continued
Multiple Classes of Shares of Beneficial Interest — The fund offers multiple classes of shares, which differ in their respective distribution, service, and program manager fees. The fund's income and common expenses are allocated to shareholders based on the value of settled shares outstanding of each class. The fund's realized and unrealized gain (loss) are allocated to shareholders based on the daily net assets of each class. Dividends are declared separately for each class. Differences in per share dividend rates are generally due to differences in separate class expenses. Class B and Class C shares will convert to Class A shares approximately eight years after purchase. Effective March 21, 2022, all Class 529B and Class 529C shares were converted into Class 529A shares. Effective May 20, 2022, all Class 529A shares were redeemed. The fund’s distributions declared to shareholders as reported in the Statements of Changes in Net Assets are presented by class as follows:
| | Six months
ended
2/28/23 | | Year
ended
8/31/22 |
| Class A | $2,873,456 | | $486,267 |
| Class B | 73,934 | | 15,213 |
| Class C | 529,271 | | 122,442 |
| Class I | 260,570 | | 43,743 |
| Class R1 | 142,835 | | 26,149 |
| Class R2 | 332,998 | | 67,713 |
| Class R3 | 286,987 | | 55,479 |
| Class R4 | 41,849 | | 7,536 |
| Class R6 | 3,269,870 | | 616,716 |
| Class 529A | — | | 4,756 |
| Class 529B | — | | 19 |
| Class 529C | — | | 720 |
| Total | $7,811,770 | | $1,446,753 |
(3) Transactions with Affiliates
Investment Adviser — The fund has an investment advisory agreement with MFS to provide overall investment management and related administrative services and facilities to the fund. The management fee is computed daily and paid monthly at the following annual rates based on the fund's average daily net assets:
| Up to $1 billion | 0.40% |
| In excess of $1 billion | 0.35% |
MFS has agreed in writing to reduce its management fee by a specified amount if certain MFS mutual fund assets exceed thresholds agreed to by MFS and the fund’s Board of Trustees. MFS has also agreed in writing to waive at least 0.01% of its management fee as part of this agreement. The agreement to waive at least 0.01% of the management fee will continue until modified by the fund’s Board of Trustees, but such agreement will continue at least until December 31, 2023. For the six months ended February 28, 2023, this management fee reduction amounted to $33,215, which is included in the reduction of total expenses in the Statement of Operations. The management fee incurred for the year ended August 31, 2022 was equivalent to an annual effective rate of 0.39% of the fund’s average daily net assets.
Notes to Financial Statements (unaudited) - continued
The investment adviser has agreed in writing to pay a portion of the fund’s total annual operating expenses, excluding interest, taxes, extraordinary expenses, brokerage and transaction costs, and investment-related expenses, such that total fund operating expenses do not exceed the following rates annually of each class’s average daily net assets:
| Classes |
| A | B | C | I | R1 | R2 | R3 | R4 | R6 |
| 0.45% | 0.45% | 0.45% | 0.45% | 0.45% | 0.45% | 0.45% | 0.45% | 0.37% |
This written agreement will continue until modified by the fund’s Board of Trustees, but such agreement will continue at least until December 31, 2023. For the six months ended February 28, 2023, this reduction amounted to $338,644, which is included in the reduction of total expenses in the Statement of Operations.
Distributor — The Board of Trustees has adopted a distribution plan for certain share classes pursuant to Rule 12b-1 of the Investment Company Act of 1940.
The fund’s distribution plan provides that the fund will pay MFS Fund Distributors, Inc. (MFD), a wholly-owned subsidiary of MFS, for services provided by MFD and financial intermediaries in connection with the distribution and servicing of certain share classes. One component of the plan is a distribution fee paid to MFD and another component of the plan is a service fee paid to MFD. MFD may subsequently pay all, or a portion, of the distribution and/or service fees to financial intermediaries.
Distribution Plan Fee Table:
| | Distribution
Fee Rate (d) | Service
Fee Rate (d) | Total
Distribution
Plan (d) | Annual
Effective
Rate (e) | Distribution
and Service
Fee |
| Class A | — | 0.25% | 0.25% | 0.00% | $ 229,105 |
| Class B | 0.75% | 0.25% | 1.00% | 0.00% | 23,936 |
| Class C | 0.75% | 0.25% | 1.00% | 0.00% | 175,661 |
| Class R1 | 0.75% | 0.25% | 1.00% | 0.00% | 45,835 |
| Class R2 | 0.25% | 0.25% | 0.50% | 0.00% | 54,038 |
| Class R3 | — | 0.25% | 0.25% | 0.00% | 23,224 |
| Total Distribution and Service Fees | | | | | $551,799 |
| (d) | In accordance with the distribution plan for certain classes, the fund pays distribution and/or service fees equal to these annual percentage rates of each class’s average daily net assets. The distribution and service fee rates disclosed by class represent the current rates in effect at the end of the reporting period. Any rate changes, if applicable, are detailed below. |
| (e) | The annual effective rates represent actual fees incurred under the distribution plan for the six months ended February 28, 2023 based on each class's average daily net assets. MFD has agreed in writing to waive any distribution and/or service fees for Class A, Class B, Class C, Class R1, Class R2, and Class R3 shares. This written agreement will continue until modified by the fund’s Board of Trustees, but such agreement will continue until at least December 31, 2023. These reductions, for the six months ended February 28, 2023, for Class A, Class B, Class C, Class R1, Class R2, and Class R3 shares, amounted to $229,105, $23,936, $175,661, $45,835, $54,038, and $23,224 respectively, and are included in the reduction of total expenses in the Statement of Operations. |
Notes to Financial Statements (unaudited) - continued
Certain Class A shares are subject to a contingent deferred sales charge (CDSC) in the event of a shareholder redemption within 18 months of purchase. Class B shares are subject to a CDSC in the event of a shareholder redemption within six years of purchase. Class C shares are subject to a CDSC in the event of a shareholder redemption within 12 months of purchase. All contingent deferred sales charges are paid to MFD and during the six months ended February 28, 2023, were as follows:
| | Amount |
| Class A | $24,934 |
| Class B | 3,215 |
| Class C | 4,133 |
Shareholder Servicing Agent — MFS Service Center, Inc. (MFSC), a wholly-owned subsidiary of MFS, receives a fee from the fund for its services as shareholder servicing agent calculated as a percentage of the average daily net assets of the fund as determined periodically under the supervision of the fund's Board of Trustees. For the six months ended February 28, 2023, the fee was $69,165, which equated to 0.0278% annually of the fund's average daily net assets. MFSC also receives reimbursement from the fund for out-of-pocket expenses, sub-accounting and other shareholder servicing costs which may be paid to affiliated and unaffiliated service providers. Class R6 shares do not incur sub-accounting fees. For the six months ended February 28, 2023, these out-of-pocket expenses, sub-accounting and other shareholder servicing costs amounted to $114,070.
Administrator — MFS provides certain financial, legal, shareholder communications, compliance, and other administrative services to the fund. Under an administrative services agreement, the fund reimburses MFS the costs incurred to provide these services. The fund is charged an annual fixed amount of $17,500 plus a fee based on average daily net assets. The administrative services fee incurred for the six months ended February 28, 2023 was equivalent to an annual effective rate of 0.0168% of the fund's average daily net assets.
Trustees’ and Officers’ Compensation — The fund pays compensation to independent Trustees in the form of a retainer, attendance fees, and additional compensation to Board and Committee chairpersons. The fund does not pay compensation directly to Trustees or officers of the fund who are also officers of the investment adviser, all of whom receive remuneration from MFS for their services to the fund. Certain officers and Trustees of the fund are officers or directors of MFS, MFD, and MFSC.
Prior to December 31, 2001, the fund had an unfunded defined benefit plan (“DB plan”) for independent Trustees. As of December 31, 2001, the Board took action to terminate the DB plan with respect to then-current and any future independent Trustees, such that the DB plan covers only certain of those former independent Trustees who retired on or before December 31, 2001. The DB plan resulted in a pension expense of $128 and is included in “Independent Trustees’ compensation” in the Statement of Operations for the six months ended February 28, 2023. The liability for deferred retirement benefits payable to those former independent Trustees under the DB plan amounted to $3,338 at February 28, 2023, and is included in “Payable for independent Trustees’ compensation” in the Statement of Assets and Liabilities.
Other — On August 3, 2022, MFS redeemed 51,120 shares of Class R6 for an aggregate amount of $51,120.
Notes to Financial Statements (unaudited) - continued
At February 28, 2023, MFS held 100% of the outstanding shares of Class R4.
(4) Shares of Beneficial Interest
The fund's Declaration of Trust permits the Trustees to issue an unlimited number of full and fractional shares of beneficial interest. The number of shares sold, reinvested and reacquired corresponds to the net proceeds from the sale of shares, reinvestment of distributions and cost of shares reacquired, respectively, since shares are sold and reacquired at $1.00 per share. Transactions in fund shares were as follows:
| | Six months ended
2/28/23 | | Year ended
8/31/22 |
| Shares sold | | | |
| Class A | 72,512,872 | | 123,951,695 |
| Class B | 672,327 | | 2,804,827 |
| Class C | 6,786,156 | | 40,945,876 |
| Class I | 5,020,917 | | 11,094,678 |
| Class R1 | 1,074,394 | | 5,278,718 |
| Class R2 | 2,843,563 | | 6,705,215 |
| Class R3 | 2,440,499 | | 10,309,753 |
| Class R6 | 15,135,733 | | 236,309,535 |
| Class 529A | — | | 15,058,151 |
| Class 529B | — | | 27,133 |
| Class 529C | — | | 825,851 |
| | 106,486,461 | | 453,311,432 |
Shares issued to shareholders in
reinvestment of distributions | | | |
| Class A | 2,817,174 | | 471,125 |
| Class B | 71,369 | | 14,689 |
| Class C | 515,818 | | 121,554 |
| Class I | 256,606 | | 43,511 |
| Class R1 | 142,835 | | 26,150 |
| Class R2 | 332,998 | | 67,713 |
| Class R3 | 286,986 | | 55,478 |
| Class R4 | 41,848 | | 7,536 |
| Class R6 | 3,269,870 | | 616,716 |
| Class 529A | — | | 3,968 |
| Class 529B | — | | 19 |
| Class 529C | — | | 719 |
| | 7,735,504 | | 1,429,178 |
Notes to Financial Statements (unaudited) - continued
| | Six months ended
2/28/23 | | Year ended
8/31/22 |
| Shares reacquired | | | |
| Class A | (76,774,631) | | (79,405,284) |
| Class B | (1,650,925) | | (4,420,196) |
| Class C | (25,165,935) | | (21,138,653) |
| Class I | (6,065,941) | | (6,577,364) |
| Class R1 | (1,488,469) | | (4,770,376) |
| Class R2 | (7,711,842) | | (9,487,735) |
| Class R3 | (5,924,563) | | (10,471,625) |
| Class R6 | (20,629,884) | | (25,560,214) |
| Class 529A | — | | (43,002,145) |
| Class 529B | — | | (209,387) |
| Class 529C | — | | (6,893,191) |
| | (145,412,190) | | (211,936,170) |
| Net change | | | |
| Class A | (1,444,585) | | 45,017,536 |
| Class B | (907,229) | | (1,600,680) |
| Class C | (17,863,961) | | 19,928,777 |
| Class I | (788,418) | | 4,560,825 |
| Class R1 | (271,240) | | 534,492 |
| Class R2 | (4,535,281) | | (2,714,807) |
| Class R3 | (3,197,078) | | (106,394) |
| Class R4 | 41,848 | | 7,536 |
| Class R6 | (2,224,281) | | 211,366,037 |
| Class 529A | — | | (27,940,026) |
| Class 529B | — | | (182,235) |
| Class 529C | — | | (6,066,621) |
| | (31,190,225) | | 242,804,440 |
Effective June 1, 2019, purchases of the fund’s Class B and Class 529B shares were closed to new and existing investors subject to certain exceptions. Effective after the close of business on March 18, 2022, all sales of Class 529B and Class 529C shares were suspended, and Class 529B and Class 529C shares were converted into Class 529A shares of the fund effective March 21, 2022. Effective after the close of business on May 13, 2022, all sales and redemptions of Class 529A shares were suspended, and all Class 529A shares were redeemed on May 20, 2022.
Effective at the close of business on May 29, 2020, the fund was closed to all purchases subject to certain exceptions.
(5) Line of Credit
The fund and certain other funds managed by MFS participate in a $1.45 billion unsecured committed line of credit of which $1.2 billion is reserved for use by the fund and certain other MFS U.S. funds. The line of credit is provided by a syndicate of banks
Notes to Financial Statements (unaudited) - continued
under a credit agreement. Borrowings may be made for temporary financing needs. Interest is charged to each fund, based on its borrowings, generally at a rate equal to the highest of 1) Daily Simple SOFR (Secured Overnight Financing Rate) plus 0.10%, 2) the Federal Funds Effective Rate, or 3) the Overnight Bank Funding Rate, each plus an agreed upon spread. A commitment fee, based on the average daily unused portion of the committed line of credit, is allocated among the participating funds. The line of credit expires on March 14, 2024 unless extended or renewed. In addition, the fund and other funds managed by MFS have established unsecured uncommitted borrowing arrangements with certain banks for temporary financing needs. Interest is charged to each fund, based on its borrowings, at rates equal to customary reference rates plus an agreed upon spread. For the six months ended February 28, 2023, the fund’s commitment fee and interest expense were $1,161 and $0, respectively, and are included in “Miscellaneous” expense in the Statement of Operations.
(6) LIBOR Transition
Certain of the fund's investments, including investments in certain debt instruments and derivatives (if any), as well as borrowings by the fund and certain other contractual arrangements of the fund, may be based on the London Interbank Offered Rate (“LIBOR”). In 2017, the regulatory authority that oversees financial services firms in the United Kingdom announced plans to transition away from LIBOR by the end of 2021. In March 2021, the administrator of LIBOR announced the extension of the publication of the more commonly used U.S. dollar LIBOR settings to the end of June 2023. Although the full impacts of the transition away from LIBOR are not fully known, the transition may result in, among other things, an increase in volatility or illiquidity of the markets for instruments that currently rely on LIBOR to determine interest rates and this could have an adverse impact on the fund's performance. With respect to the fund's accounting for investments, including investments in certain debt instruments and derivatives, as well as borrowings by the fund and any other contractual arrangements of the fund that undergo reference rate-related modifications as a result of the transition, management will rely upon the relief provided by FASB Codification Topic 848 – Reference Rate Reform (Topic 848). The guidance in Topic 848 permits the fund to account for those modified contracts as a continuation of the existing contracts. The situation remains fluid, and management believes, based on best available information, that the impact of the transition will not be material to the fund.
(7) Subsequent Event
On March 30, 2023, the fund announced that effective after the close of business on September 29, 2023, purchases of Class R1 and Class R2 shares will be closed to new eligible investors.
Proxy Voting Policies and Information
MFS votes proxies on behalf of the fund pursuant to proxy voting policies and procedures that are available without charge, upon request, by calling 1-800-225-2606, by visiting mfs.com/proxyvoting, or by visiting the SEC’s Web site at http://www.sec.gov.
Information regarding how the fund voted proxies relating to portfolio securities during the most recent twelve-month period ended June 30 is available by August 31 of each year without charge by visiting mfs.com/proxyvoting, or by visiting the SEC’s Web site at http://www.sec.gov.
Portfolio Holdings Information
The fund files monthly portfolio information with the SEC on Form N-MFP. The fund’s Form N-MFP reports are available on the SEC’s Web site at http://www.sec.gov. A shareholder can also access the fund’s portfolio holdings as of each month end and the fund’s Form N-MFP reports at mfs.com/openendfunds after choosing “Click here for access to Money Market fund reports”.
Further Information
From time to time, MFS may post important information about the fund or the MFS Funds on the MFS Web site (mfs.com). This information is available at https://www.mfs.com/announcements or at mfs.com/openendfunds by choosing the fund’s name and then scrolling to the “Resources” section and clicking on the “Announcements” tab, if any.
Information About Fund Contracts and Legal Claims
The fund has entered into contractual arrangements with an investment adviser, administrator, distributor, shareholder servicing agent, and custodian who each provide services to the fund. Unless expressly stated otherwise, shareholders are not parties to, or intended beneficiaries of these contractual arrangements, and these contractual arrangements are not intended to create any shareholder right to enforce them against the service providers or to seek any remedy under them against the service providers, either directly or on behalf of the fund.
Under the Trust’s By-Laws and Declaration of Trust, any claims asserted against or on behalf of the MFS Funds, including claims against Trustees and Officers, must be brought in state and federal courts located within the Commonwealth of Massachusetts.
Provision of Financial Reports and Summary Prospectuses
The fund produces financial reports every six months and updates its summary prospectus and prospectus annually. To avoid sending duplicate copies of materials to households, only one copy of the fund’s annual and semiannual report and summary prospectus may be mailed to shareholders having the same last name and residential address on the fund’s records. However, any shareholder may contact MFSC (please see back cover for address and telephone number) to request that copies of these reports and summary prospectuses be sent personally to that shareholder.
Save paper with eDelivery.
MFS® will send you prospectuses, reports, and proxies directly via e-mail so you will get information faster with less mailbox clutter.
To sign up:
1. Go to mfs.com.
2. Log in via MFS® Access.
3. Select eDelivery.
If you own your MFS fund shares through a financial institution or a retirement plan, MFS® TALK, MFS® Access, or eDelivery may not be available to you.
CONTACT
WEB SITE
mfs.com
MFS TALK
1-800-637-8255
24 hours a day
ACCOUNT SERVICE AND LITERATURE
Shareholders
1-800-225-2606
Financial advisors
1-800-343-2829
Retirement plan services
1-800-637-1255
MAILING ADDRESS
MFS Service Center, Inc.
P.O. Box 219341
Kansas City, MO 64121-9341
OVERNIGHT MAIL
MFS Service Center, Inc.
Suite 219341
430 W 7th Street
Kansas City, MO 64105-1407
Semiannual Report
February 28, 2023
The report is prepared for the general information of shareholders. It is authorized for distribution to prospective investors only when preceded or accompanied by a current prospectus.
NOT FDIC INSURED • MAY LOSE VALUE • NO BANK GUARANTEE
LETTER FROM THE CHAIR AND CEO
Dear Shareholders:
Markets — which rallied in late 2022 and early 2023 on signs of peaking inflation, hopes that monetary policy tightening cycles may be nearing an end and a rapid reopening of China’s economy — have hit turbulence after the sudden collapse of two US regional banks and the government-led merger of Switzerland’s two largest lenders. At the same time, US inflation data suggest that price pressures will prove more persistent than expected, making the US Federal Reserve’s job of trying to corral four-decade-high inflation without tipping the economy into recession that much more difficult. On a positive note, markets have largely adjusted to the challenges posed by Russia’s invasion of Ukraine, thanks in part to mild European winter weather that has alleviated concerns over potential near-term shortages of natural gas. Resilient labor markets in much of the developed world have further contributed to a brighter-than-expected economic backdrop. However, after the recent banking turmoil, investors are increasingly mindful that the lagged effects of ongoing monetary policy tightening have yet to fully work their way through the global economy.
One result of the banking crisis has been a rally in global government bond markets as investors sense that the global monetary tightening campaign is nearing its end, and the resulting lower yields have eased some of the pressure on interest rate–sensitive parts of the economy. Over the near term, amid tighter financial conditions, we feel companies will face a challenging earnings backdrop as they are forced to absorb higher input and labor costs while pricing power dwindles. As for fixed income, the rise in interest rates in recent months has made bonds more attractive than they have been in years, which may provide balance for investors’ portfolios.
During times of market transition, it is important to have a deep understanding of company fundamentals, and we have built our unique global research platform to do just that.
At MFS®, we put our clients’ assets to work responsibly by carefully navigating increasingly complex global capital markets. Our investment team is guided by a commitment to long-term fundamental investing. Our global investment platform — combining collective expertise, long-term discipline, and thoughtful risk management — seeks to uncover what we believe are the best, most durable investment ideas in markets around the world, enabling us to potentially create value for investors.
Respectfully,
Michael W. Roberge
Chair and Chief Executive Officer
MFS Investment Management
April 14, 2023
The opinions expressed in this letter are subject to change and may not be relied upon for investment advice. No forecasts can be guaranteed.
Portfolio structure
Top ten holdings
| JPMorgan Chase & Co. | 4.1% |
| Johnson & Johnson | 2.7% |
| Cigna Group | 2.7% |
| Progressive Corp. | 2.6% |
| Aon PLC | 2.5% |
| Northrop Grumman Corp. | 2.4% |
| Texas Instruments, Inc. | 2.4% |
| Comcast Corp., “A” | 2.3% |
| Marsh & McLennan Cos., Inc. | 2.3% |
| Pfizer, Inc. | 2.2% |
GICS equity sectors (g)
| Financials | 26.6% |
| Health Care | 17.6% |
| Industrials | 17.4% |
| Information Technology | 7.4% |
| Utilities | 6.6% |
| Consumer Staples | 5.5% |
| Consumer Discretionary | 4.6% |
| Energy | 4.2% |
| Materials | 4.2% |
| Communication Services | 3.4% |
| Real Estate | 1.7% |
| (g) | The Global Industry Classification Standard (GICS®) was developed by and/or is the exclusive property of MSCI, Inc. and S&P Global Market Intelligence Inc. (“S&P Global Market Intelligence”). GICS is a service mark of MSCI and S&P Global Market Intelligence and has been licensed for use by MFS. MFS has applied its own internal sector/industry classification methodology for equity securities and non-equity securities that are unclassified by GICS. |
Cash & Cash Equivalents includes any cash, investments in money market funds, short-term securities, and other assets less liabilities. Please see the Statement of Assets and Liabilities for additional information related to the fund’s cash position and other assets and liabilities.
Percentages are based on net assets as of February 28, 2023.
The portfolio is actively managed and current holdings may be different.
Expense Table
Fund expenses borne by the shareholders during the period,
September 1, 2022 through February 28, 2023
As a shareholder of the fund, you incur two types of costs: (1) transaction costs, including sales charges (loads) on certain purchase or redemption payments, and (2) ongoing costs, including management fees; distribution and service (12b-1) fees; and other fund expenses. This example is intended to help you understand your ongoing costs (in dollars) of investing in the fund and to compare these costs with the ongoing costs of investing in other mutual funds.
The example is based on an investment of $1,000 invested at the beginning of the period and held for the entire period September 1, 2022 through February 28, 2023.
Actual Expenses
The first line for each share class in the following table provides information about actual account values and actual expenses. You may use the information in this line, together with the amount you invested, to estimate the expenses that you paid over the period. Simply divide your account value by $1,000 (for example, an $8,600 account value divided by $1,000 = 8.6), then multiply the result by the number in the first line under the heading entitled “Expenses Paid During Period” to estimate the expenses you paid on your account during this period.
Hypothetical Example for Comparison Purposes
The second line for each share class in the following table provides information about hypothetical account values and hypothetical expenses based on the fund’s actual expense ratio and an assumed rate of return of 5% per year before expenses, which is not the fund’s actual return. The hypothetical account values and expenses may not be used to estimate the actual ending account balance or expenses you paid for the period. You may use this information to compare the ongoing costs of investing in the fund and other funds. To do so, compare this 5% hypothetical example with the 5% hypothetical examples that appear in the shareholder reports of the other funds.
Please note that the expenses shown in the table are meant to highlight your ongoing costs only and do not reflect any transactional costs, such as sales charges (loads). Therefore, the second line for each share class in the table is useful in comparing ongoing costs only, and will not help you determine the relative total costs of owning different funds. In addition, if these transactional costs were included, your costs would have been higher.
Expense Table - continued
Share
Class | | Annualized
Expense
Ratio | Beginning
Account Value
9/01/22 | Ending
Account Value
2/28/23 | Expenses
Paid During
Period (p)
9/01/22-2/28/23 |
| A | Actual | 0.79% | $1,000.00 | $1,033.10 | $3.98 |
| Hypothetical (h) | 0.79% | $1,000.00 | $1,020.88 | $3.96 |
| B | Actual | 1.54% | $1,000.00 | $1,029.07 | $7.75 |
| Hypothetical (h) | 1.54% | $1,000.00 | $1,017.16 | $7.70 |
| C | Actual | 1.54% | $1,000.00 | $1,029.31 | $7.75 |
| Hypothetical (h) | 1.54% | $1,000.00 | $1,017.16 | $7.70 |
| I | Actual | 0.54% | $1,000.00 | $1,034.33 | $2.72 |
| Hypothetical (h) | 0.54% | $1,000.00 | $1,022.12 | $2.71 |
| R1 | Actual | 1.54% | $1,000.00 | $1,029.04 | $7.75 |
| Hypothetical (h) | 1.54% | $1,000.00 | $1,017.16 | $7.70 |
| R2 | Actual | 1.04% | $1,000.00 | $1,031.83 | $5.24 |
| Hypothetical (h) | 1.04% | $1,000.00 | $1,019.64 | $5.21 |
| R3 | Actual | 0.79% | $1,000.00 | $1,033.26 | $3.98 |
| Hypothetical (h) | 0.79% | $1,000.00 | $1,020.88 | $3.96 |
| R4 | Actual | 0.54% | $1,000.00 | $1,034.34 | $2.72 |
| Hypothetical (h) | 0.54% | $1,000.00 | $1,022.12 | $2.71 |
| R6 | Actual | 0.44% | $1,000.00 | $1,035.03 | $2.22 |
| Hypothetical (h) | 0.44% | $1,000.00 | $1,022.61 | $2.21 |
| (h) | 5% class return per year before expenses. |
| (p) | “Expenses Paid During Period” are equal to each class’s annualized expense ratio, as shown above, multiplied by the average account value over the period, multiplied by 181/365 (to reflect the one-half year period). Expenses paid do not include any applicable sales charges (loads). If these transaction costs had been included, your costs would have been higher. |
Portfolio of Investments
2/28/23 (unaudited)
The Portfolio of Investments is a complete list of all securities owned by your fund. It is categorized by broad-based asset classes.
| Issuer | | | Shares/Par | Value ($) |
| Common Stocks – 99.2% |
| Aerospace & Defense – 7.0% | |
| General Dynamics Corp. | | 4,571,106 | $1,041,800,768 |
| Honeywell International, Inc. | | 6,301,720 | 1,206,653,346 |
| Northrop Grumman Corp. | | 2,976,214 | 1,381,290,680 |
| Raytheon Technologies Corp. | | 3,984,578 | 390,847,256 |
| | | | | $4,020,592,050 |
| Alcoholic Beverages – 1.5% | |
| Diageo PLC | | 20,433,653 | $867,379,332 |
| Brokerage & Asset Managers – 4.7% | |
| BlackRock, Inc. | | 891,746 | $614,796,445 |
| Citigroup, Inc. | | 15,813,415 | 801,582,006 |
| KKR & Co., Inc. | | 6,479,320 | 365,109,682 |
| NASDAQ, Inc. | | 16,415,928 | 920,276,924 |
| | | | | $2,701,765,057 |
| Business Services – 2.9% | |
| Accenture PLC, “A” | | 3,879,816 | $1,030,285,139 |
| Equifax, Inc. | | 3,224,501 | 653,058,187 |
| | | | | $1,683,343,326 |
| Cable TV – 3.4% | |
| Charter Communications, Inc., “A” (a) | | 1,660,348 | $610,360,529 |
| Comcast Corp., “A” | | 36,126,772 | 1,342,832,115 |
| | | | | $1,953,192,644 |
| Chemicals – 1.3% | |
| PPG Industries, Inc. | | 5,478,440 | $723,482,786 |
| Construction – 1.9% | |
| Masco Corp. | | 5,632,625 | $295,318,529 |
| Otis Worldwide Corp. | | 2,351,432 | 198,978,176 |
| Sherwin-Williams Co. | | 2,688,230 | 595,039,710 |
| | | | | $1,089,336,415 |
| Consumer Products – 1.6% | |
| International Flavors & Fragrances, Inc. | | 2,183,413 | $203,494,091 |
| Kimberly-Clark Corp. | | 3,721,617 | 465,388,206 |
| Reckitt Benckiser Group PLC | | 3,769,913 | 261,285,903 |
| | | | | $930,168,200 |
Portfolio of Investments (unaudited) – continued
| Issuer | | | Shares/Par | Value ($) |
| Common Stocks – continued |
| Electrical Equipment – 1.4% | |
| Johnson Controls International PLC | | 12,513,476 | $784,845,215 |
| Electronics – 5.6% | |
| Analog Devices, Inc. | | 2,661,616 | $488,326,688 |
| KLA Corp. | | 1,868,842 | 709,001,278 |
| NXP Semiconductors N.V. | | 3,594,636 | 641,570,633 |
| Texas Instruments, Inc. | | 7,998,407 | 1,371,326,880 |
| | | | | $3,210,225,479 |
| Energy - Independent – 4.2% | |
| ConocoPhillips | | 10,622,375 | $1,097,822,456 |
| EOG Resources, Inc. | | 4,228,155 | 477,866,078 |
| Pioneer Natural Resources Co. | | 4,120,550 | 825,799,426 |
| | | | | $2,401,487,960 |
| Food & Beverages – 2.7% | |
| Archer Daniels Midland Co. | | 2,327,098 | $185,237,001 |
| Nestle S.A. | | 7,507,150 | 845,525,797 |
| PepsiCo, Inc. | | 3,050,094 | 529,282,812 |
| | | | | $1,560,045,610 |
| Gaming & Lodging – 1.2% | |
| Marriott International, Inc., “A” | | 3,997,883 | $676,601,719 |
| Health Maintenance Organizations – 2.7% | |
| Cigna Group | | 5,340,328 | $1,559,909,809 |
| Insurance – 11.2% | |
| Aon PLC | | 4,641,134 | $1,411,136,793 |
| Chubb Ltd. | | 5,845,817 | 1,233,584,303 |
| Marsh & McLennan Cos., Inc. | | 8,107,867 | 1,314,609,556 |
| Progressive Corp. | | 10,470,141 | 1,502,674,636 |
| Travelers Cos., Inc. | | 5,354,965 | 991,311,121 |
| | | | | $6,453,316,409 |
| Machinery & Tools – 4.7% | |
| Eaton Corp. PLC | | 5,188,867 | $907,688,504 |
| Illinois Tool Works, Inc. | | 4,105,148 | 957,156,308 |
| PACCAR, Inc. | | 4,336,571 | 313,100,426 |
| Trane Technologies PLC | | 2,676,692 | 495,107,719 |
| | | | | $2,673,052,957 |
Portfolio of Investments (unaudited) – continued
| Issuer | | | Shares/Par | Value ($) |
| Common Stocks – continued |
| Major Banks – 7.9% | |
| Goldman Sachs Group, Inc. | | 923,702 | $324,819,808 |
| JPMorgan Chase & Co. | | 16,577,627 | 2,376,402,830 |
| Morgan Stanley | | 12,494,253 | 1,205,695,415 |
| PNC Financial Services Group, Inc. | | 3,979,602 | 628,458,748 |
| | | | | $4,535,376,801 |
| Medical & Health Technology & Services – 1.5% | |
| McKesson Corp. | | 2,430,349 | $850,160,384 |
| Medical Equipment – 6.2% | |
| Abbott Laboratories | | 7,981,284 | $811,856,209 |
| Boston Scientific Corp. (a) | | 14,919,276 | 697,028,575 |
| Danaher Corp. | | 1,501,845 | 371,751,693 |
| Medtronic PLC | | 7,720,138 | 639,227,426 |
| Thermo Fisher Scientific, Inc. | | 1,961,824 | 1,062,837,770 |
| | | | | $3,582,701,673 |
| Other Banks & Diversified Financials – 2.7% | |
| American Express Co. | | 5,760,553 | $1,002,278,616 |
| Moody's Corp. | | 762,107 | 221,125,346 |
| Truist Financial Corp. | | 7,189,505 | 337,547,260 |
| | | | | $1,560,951,222 |
| Pharmaceuticals – 7.2% | |
| Johnson & Johnson | | 10,255,905 | $1,571,820,000 |
| Merck & Co., Inc. | | 10,283,315 | 1,092,499,386 |
| Pfizer, Inc. | | 30,920,422 | 1,254,441,520 |
| Roche Holding AG | | 669,384 | 193,171,494 |
| | | | | $4,111,932,400 |
| Railroad & Shipping – 2.4% | |
| Canadian National Railway Co. | | 3,007,625 | $342,538,411 |
| Union Pacific Corp. | | 4,940,691 | 1,024,106,431 |
| | | | | $1,366,644,842 |
| Real Estate – 1.7% | |
| Prologis, Inc., REIT | | 5,970,255 | $736,729,467 |
| Public Storage, Inc., REIT | | 777,412 | 232,407,317 |
| | | | | $969,136,784 |
| Specialty Chemicals – 1.5% | |
| DuPont de Nemours, Inc. | | 11,855,210 | $865,785,986 |
Portfolio of Investments (unaudited) – continued
| Issuer | | | Shares/Par | Value ($) |
| Common Stocks – continued |
| Specialty Stores – 3.4% | |
| Lowe's Cos., Inc. | | 5,595,908 | $1,151,358,071 |
| Target Corp. | | 4,825,529 | 813,101,636 |
| | | | | $1,964,459,707 |
| Utilities - Electric Power – 6.7% | |
| American Electric Power Co., Inc. | | 3,664,838 | $322,395,799 |
| Dominion Energy, Inc. | | 14,100,583 | 784,274,427 |
| Duke Energy Corp. | | 11,670,594 | 1,100,070,190 |
| Exelon Corp. | | 7,976,878 | 322,186,102 |
| Southern Co. | | 15,068,511 | 950,220,304 |
| Xcel Energy, Inc. | | 5,217,953 | 336,923,225 |
| | | | | $3,816,070,047 |
| Total Common Stocks (Identified Cost, $32,623,856,856) | | $56,911,964,814 |
| Investment Companies (h) – 0.5% |
| Money Market Funds – 0.5% | |
| MFS Institutional Money Market Portfolio, 4.55% (v) (Identified Cost, $300,544,123) | | | 300,544,129 | $300,544,129 |
|
|
| Other Assets, Less Liabilities – 0.3% | | 155,395,234 |
| Net Assets – 100.0% | $57,367,904,177 |
| (a) | Non-income producing security. | | | |
| (h) | An affiliated issuer, which may be considered one in which the fund owns 5% or more of the outstanding voting securities, or a company which is under common control. At period end, the aggregate values of the fund's investments in affiliated issuers and in unaffiliated issuers were $300,544,129 and $56,911,964,814, respectively. | | | |
| (v) | Affiliated issuer that is available only to investment companies managed by MFS. The rate quoted for the MFS Institutional Money Market Portfolio is the annualized seven-day yield of the fund at period end. | | | |
| The following abbreviations are used in this report and are defined: |
| REIT | Real Estate Investment Trust |
See Notes to Financial Statements
Financial Statements
Statement of Assets and Liabilities
At 2/28/23 (unaudited)
This statement represents your fund’s balance sheet, which details the assets and liabilities comprising the total value of the fund.
| Assets | |
| Investments in unaffiliated issuers, at value (identified cost, $32,623,856,856) | $56,911,964,814 |
| Investments in affiliated issuers, at value (identified cost, $300,544,123) | 300,544,129 |
| Receivables for | |
| Investments sold | 145,723,609 |
| Fund shares sold | 50,792,242 |
| Dividends | 132,603,227 |
| Other assets | 207,042 |
| Total assets | $57,541,835,063 |
| Liabilities | |
| Payables for | |
| Investments purchased | $85,109,448 |
| Fund shares reacquired | 74,355,592 |
| Payable to affiliates | |
| Investment adviser | 1,339,944 |
| Administrative services fee | 3,537 |
| Shareholder servicing costs | 11,160,446 |
| Distribution and service fees | 182,938 |
| Payable for independent Trustees' compensation | 15,086 |
| Accrued expenses and other liabilities | 1,763,895 |
| Total liabilities | $173,930,886 |
| Net assets | $57,367,904,177 |
| Net assets consist of | |
| Paid-in capital | $32,123,952,015 |
| Total distributable earnings (loss) | 25,243,952,162 |
| Net assets | $57,367,904,177 |
| Shares of beneficial interest outstanding | 1,219,345,518 |
Statement of Assets and Liabilities (unaudited) – continued
| | Net assets | Shares
outstanding | Net asset value
per share (a) |
| Class A | $7,801,644,876 | 166,203,906 | $46.94 |
| Class B | 31,538,277 | 674,135 | 46.78 |
| Class C | 527,132,095 | 11,375,588 | 46.34 |
| Class I | 23,888,529,282 | 505,497,989 | 47.26 |
| Class R1 | 15,091,395 | 328,904 | 45.88 |
| Class R2 | 311,551,259 | 6,717,383 | 46.38 |
| Class R3 | 2,570,412,439 | 55,021,582 | 46.72 |
| Class R4 | 1,911,408,611 | 40,722,572 | 46.94 |
| Class R6 | 20,310,595,943 | 432,803,459 | 46.93 |
| (a) | Maximum offering price per share was equal to the net asset value per share for all share classes, except for Class A, for which the maximum offering price per share was $49.80 [100 / 94.25 x $46.94]. On sales of $50,000 or more, the maximum offering price of Class A shares is reduced. A contingent deferred sales charge may be imposed on redemptions of Class A, Class B, and Class C shares. Redemption price per share was equal to the net asset value per share for Classes I, R1, R2, R3, R4, and R6. |
See Notes to Financial Statements
Financial Statements
Statement of Operations
Six months ended 2/28/23 (unaudited)
This statement describes how much your fund earned in investment income and accrued in expenses. It also describes any gains and/or losses generated by fund operations.
| Net investment income (loss) | |
| Income | |
| Dividends | $682,003,476 |
| Dividends from affiliated issuers | 6,106,904 |
| Other | 202,704 |
| Income on securities loaned | 410 |
| Interest | 61 |
| Foreign taxes withheld | (1,406,943) |
| Total investment income | $686,906,612 |
| Expenses | |
| Management fee | $126,313,806 |
| Distribution and service fees | 16,748,806 |
| Shareholder servicing costs | 20,844,090 |
| Administrative services fee | 316,715 |
| Independent Trustees' compensation | 66,323 |
| Custodian fee | 295,521 |
| Shareholder communications | 948,999 |
| Audit and tax fees | 34,076 |
| Legal fees | 134,582 |
| Miscellaneous | 781,574 |
| Total expenses | $166,484,492 |
| Reduction of expenses by investment adviser and distributor | (3,859,764) |
| Net expenses | $162,624,728 |
| Net investment income (loss) | $524,281,884 |
| Realized and unrealized gain (loss) |
| Realized gain (loss) (identified cost basis) | |
| Unaffiliated issuers | $1,482,195,596 |
| Affiliated issuers | 49,694 |
| Foreign currency | (946,634) |
| Net realized gain (loss) | $1,481,298,656 |
| Change in unrealized appreciation or depreciation | |
| Unaffiliated issuers | $(30,166,071) |
| Affiliated issuers | (20,943) |
| Translation of assets and liabilities in foreign currencies | 996,504 |
| Net unrealized gain (loss) | $(29,190,510) |
| Net realized and unrealized gain (loss) | $1,452,108,146 |
| Change in net assets from operations | $1,976,390,030 |
See Notes to Financial Statements
Financial Statements
Statements of Changes in Net Assets
These statements describe the increases and/or decreases in net assets resulting from operations, any distributions, and any shareholder transactions.
| | Six months ended | Year ended |
| | 2/28/23
(unaudited) | 8/31/22 |
| Change in net assets | | |
| From operations | | |
| Net investment income (loss) | $524,281,884 | $1,003,732,902 |
| Net realized gain (loss) | 1,481,298,656 | 3,270,780,892 |
| Net unrealized gain (loss) | (29,190,510) | (8,339,275,510) |
| Change in net assets from operations | $1,976,390,030 | $(4,064,761,716) |
| Total distributions to shareholders | $(3,719,182,806) | $(2,296,655,204) |
| Change in net assets from fund share transactions | $708,691,220 | $(729,015,117) |
| Total change in net assets | $(1,034,101,556) | $(7,090,432,037) |
| Net assets | | |
| At beginning of period | 58,402,005,733 | 65,492,437,770 |
| At end of period | $57,367,904,177 | $58,402,005,733 |
See Notes to Financial Statements
Financial Statements
Financial Highlights
The financial highlights table is intended to help you understand the fund's financial performance for the semiannual period and the past 5 fiscal years. Certain information reflects financial results for a single fund share. The total returns in the table represent the rate that an investor would have earned (or lost) on an investment in the fund share class (assuming reinvestment of all distributions) held for the entire period.
| Class A | Six months
ended | Year ended |
| | 2/28/23
(unaudited) | 8/31/22 | 8/31/21 | 8/31/20 | 8/31/19 | 8/31/18 |
| Net asset value, beginning of period | $48.43 | $53.60 | $41.31 | $41.31 | $40.82 | $39.00 |
| Income (loss) from investment operations |
| Net investment income (loss) (d) | $0.38 | $0.70 | $0.59 | $0.63 | $0.79 | $0.59 |
| Net realized and unrealized gain (loss) | 1.24 | (4.12) | 12.77 | 0.57 | 1.03 | 3.04 |
| Total from investment operations | $1.62 | $(3.42) | $13.36 | $1.20 | $1.82 | $3.63 |
| Less distributions declared to shareholders |
| From net investment income | $(0.42) | $(0.69) | $(0.60) | $(0.65) | $(0.79) | $(0.60) |
| From net realized gain | (2.69) | (1.06) | (0.47) | (0.55) | (0.54) | (1.21) |
| Total distributions declared to shareholders | $(3.11) | $(1.75) | $(1.07) | $(1.20) | $(1.33) | $(1.81) |
| Net asset value, end of period (x) | $46.94 | $48.43 | $53.60 | $41.31 | $41.31 | $40.82 |
| Total return (%) (r)(s)(t)(x) | 3.31(n) | (6.59) | 32.85 | 2.93 | 4.85 | 9.42 |
Ratios (%) (to average net assets)
and Supplemental data: |
| Expenses before expense reductions | 0.80(a) | 0.81 | 0.80 | 0.83 | 0.83 | 0.82 |
| Expenses after expense reductions | 0.79(a) | 0.79 | 0.79 | 0.82 | 0.82 | 0.81 |
| Net investment income (loss) | 1.58(a) | 1.36 | 1.25 | 1.56 | 2.00 | 1.46 |
| Portfolio turnover | 5(n) | 12 | 8 | 16 | 11 | 11 |
| Net assets at end of period (000 omitted) | $7,801,645 | $7,741,830 | $8,523,158 | $6,460,837 | $6,520,132 | $6,736,296 |
See Notes to Financial Statements
Financial Highlights – continued
| Class B | Six months
ended | Year ended |
| | 2/28/23
(unaudited) | 8/31/22 | 8/31/21 | 8/31/20 | 8/31/19 | 8/31/18 |
| Net asset value, beginning of period | $48.25 | $53.38 | $41.12 | $41.09 | $40.59 | $38.76 |
| Income (loss) from investment operations |
| Net investment income (loss) (d) | $0.20 | $0.30 | $0.23 | $0.32 | $0.49 | $0.28 |
| Net realized and unrealized gain (loss) | 1.23 | (4.08) | 12.74 | 0.58 | 1.03 | 3.04 |
| Total from investment operations | $1.43 | $(3.78) | $12.97 | $0.90 | $1.52 | $3.32 |
| Less distributions declared to shareholders |
| From net investment income | $(0.21) | $(0.29) | $(0.24) | $(0.32) | $(0.48) | $(0.28) |
| From net realized gain | (2.69) | (1.06) | (0.47) | (0.55) | (0.54) | (1.21) |
| Total distributions declared to shareholders | $(2.90) | $(1.35) | $(0.71) | $(0.87) | $(1.02) | $(1.49) |
| Net asset value, end of period (x) | $46.78 | $48.25 | $53.38 | $41.12 | $41.09 | $40.59 |
| Total return (%) (r)(s)(t)(x) | 2.91(n) | (7.29) | 31.87 | 2.15 | 4.08 | 8.62 |
Ratios (%) (to average net assets)
and Supplemental data: |
| Expenses before expense reductions | 1.55(a) | 1.56 | 1.55 | 1.58 | 1.58 | 1.57 |
| Expenses after expense reductions | 1.54(a) | 1.54 | 1.54 | 1.56 | 1.57 | 1.56 |
| Net investment income (loss) | 0.84(a) | 0.59 | 0.50 | 0.79 | 1.24 | 0.71 |
| Portfolio turnover | 5(n) | 12 | 8 | 16 | 11 | 11 |
| Net assets at end of period (000 omitted) | $31,538 | $35,955 | $52,833 | $55,897 | $84,737 | $111,494 |
See Notes to Financial Statements
Financial Highlights – continued
| Class C | Six months
ended | Year ended |
| | 2/28/23
(unaudited) | 8/31/22 | 8/31/21 | 8/31/20 | 8/31/19 | 8/31/18 |
| Net asset value, beginning of period | $47.82 | $52.94 | $40.80 | $40.80 | $40.31 | $38.52 |
| Income (loss) from investment operations |
| Net investment income (loss) (d) | $0.20 | $0.30 | $0.23 | $0.32 | $0.49 | $0.28 |
| Net realized and unrealized gain (loss) | 1.23 | (4.05) | 12.63 | 0.56 | 1.03 | 3.01 |
| Total from investment operations | $1.43 | $(3.75) | $12.86 | $0.88 | $1.52 | $3.29 |
| Less distributions declared to shareholders |
| From net investment income | $(0.22) | $(0.31) | $(0.25) | $(0.33) | $(0.49) | $(0.29) |
| From net realized gain | (2.69) | (1.06) | (0.47) | (0.55) | (0.54) | (1.21) |
| Total distributions declared to shareholders | $(2.91) | $(1.37) | $(0.72) | $(0.88) | $(1.03) | $(1.50) |
| Net asset value, end of period (x) | $46.34 | $47.82 | $52.94 | $40.80 | $40.80 | $40.31 |
| Total return (%) (r)(s)(t)(x) | 2.93(n) | (7.29) | 31.86 | 2.14 | 4.10 | 8.58 |
Ratios (%) (to average net assets)
and Supplemental data: |
| Expenses before expense reductions | 1.55(a) | 1.56 | 1.55 | 1.58 | 1.58 | 1.57 |
| Expenses after expense reductions | 1.54(a) | 1.54 | 1.54 | 1.57 | 1.57 | 1.56 |
| Net investment income (loss) | 0.83(a) | 0.60 | 0.50 | 0.80 | 1.24 | 0.71 |
| Portfolio turnover | 5(n) | 12 | 8 | 16 | 11 | 11 |
| Net assets at end of period (000 omitted) | $527,132 | $562,575 | $686,442 | $650,697 | $881,020 | $1,050,477 |
See Notes to Financial Statements
Financial Highlights – continued
| Class I | Six months
ended | Year ended |
| | 2/28/23
(unaudited) | 8/31/22 | 8/31/21 | 8/31/20 | 8/31/19 | 8/31/18 |
| Net asset value, beginning of period | $48.75 | $53.94 | $41.56 | $41.56 | $41.06 | $39.22 |
| Income (loss) from investment operations |
| Net investment income (loss) (d) | $0.44 | $0.83 | $0.71 | $0.74 | $0.90 | $0.70 |
| Net realized and unrealized gain (loss) | 1.25 | (4.14) | 12.85 | 0.56 | 1.02 | 3.05 |
| Total from investment operations | $1.69 | $(3.31) | $13.56 | $1.30 | $1.92 | $3.75 |
| Less distributions declared to shareholders |
| From net investment income | $(0.49) | $(0.82) | $(0.71) | $(0.75) | $(0.88) | $(0.70) |
| From net realized gain | (2.69) | (1.06) | (0.47) | (0.55) | (0.54) | (1.21) |
| Total distributions declared to shareholders | $(3.18) | $(1.88) | $(1.18) | $(1.30) | $(1.42) | $(1.91) |
| Net asset value, end of period (x) | $47.26 | $48.75 | $53.94 | $41.56 | $41.56 | $41.06 |
| Total return (%) (r)(s)(t)(x) | 3.43(n) | (6.36) | 33.20 | 3.18 | 5.11 | 9.69 |
Ratios (%) (to average net assets)
and Supplemental data: |
| Expenses before expense reductions | 0.55(a) | 0.56 | 0.55 | 0.58 | 0.58 | 0.57 |
| Expenses after expense reductions | 0.54(a) | 0.54 | 0.54 | 0.57 | 0.57 | 0.57 |
| Net investment income (loss) | 1.83(a) | 1.60 | 1.50 | 1.81 | 2.25 | 1.72 |
| Portfolio turnover | 5(n) | 12 | 8 | 16 | 11 | 11 |
| Net assets at end of period (000 omitted) | $23,888,529 | $24,634,555 | $27,444,959 | $21,027,882 | $20,076,773 | $20,727,676 |
See Notes to Financial Statements
Financial Highlights – continued
| Class R1 | Six months
ended | Year ended |
| | 2/28/23
(unaudited) | 8/31/22 | 8/31/21 | 8/31/20 | 8/31/19 | 8/31/18 |
| Net asset value, beginning of period | $47.39 | $52.47 | $40.45 | $40.47 | $40.01 | $38.25 |
| Income (loss) from investment operations |
| Net investment income (loss) (d) | $0.20 | $0.30 | $0.23 | $0.32 | $0.48 | $0.28 |
| Net realized and unrealized gain (loss) | 1.20 | (4.01) | 12.52 | 0.55 | 1.02 | 2.99 |
| Total from investment operations | $1.40 | $(3.71) | $12.75 | $0.87 | $1.50 | $3.27 |
| Less distributions declared to shareholders |
| From net investment income | $(0.22) | $(0.31) | $(0.26) | $(0.34) | $(0.50) | $(0.30) |
| From net realized gain | (2.69) | (1.06) | (0.47) | (0.55) | (0.54) | (1.21) |
| Total distributions declared to shareholders | $(2.91) | $(1.37) | $(0.73) | $(0.89) | $(1.04) | $(1.51) |
| Net asset value, end of period (x) | $45.88 | $47.39 | $52.47 | $40.45 | $40.47 | $40.01 |
| Total return (%) (r)(s)(t)(x) | 2.90(n) | (7.28) | 31.88 | 2.13 | 4.08 | 8.61 |
Ratios (%) (to average net assets)
and Supplemental data: |
| Expenses before expense reductions | 1.55(a) | 1.56 | 1.55 | 1.58 | 1.58 | 1.57 |
| Expenses after expense reductions | 1.54(a) | 1.54 | 1.54 | 1.57 | 1.57 | 1.56 |
| Net investment income (loss) | 0.83(a) | 0.60 | 0.50 | 0.80 | 1.24 | 0.72 |
| Portfolio turnover | 5(n) | 12 | 8 | 16 | 11 | 11 |
| Net assets at end of period (000 omitted) | $15,091 | $16,339 | $20,580 | $18,914 | $21,820 | $24,791 |
See Notes to Financial Statements
Financial Highlights – continued
| Class R2 | Six months
ended | Year ended |
| | 2/28/23
(unaudited) | 8/31/22 | 8/31/21 | 8/31/20 | 8/31/19 | 8/31/18 |
| Net asset value, beginning of period | $47.88 | $53.01 | $40.86 | $40.87 | $40.39 | $38.60 |
| Income (loss) from investment operations |
| Net investment income (loss) (d) | $0.32 | $0.56 | $0.46 | $0.52 | $0.68 | $0.48 |
| Net realized and unrealized gain (loss) | 1.22 | (4.07) | 12.64 | 0.56 | 1.03 | 3.02 |
| Total from investment operations | $1.54 | $(3.51) | $13.10 | $1.08 | $1.71 | $3.50 |
| Less distributions declared to shareholders |
| From net investment income | $(0.35) | $(0.56) | $(0.48) | $(0.54) | $(0.69) | $(0.50) |
| From net realized gain | (2.69) | (1.06) | (0.47) | (0.55) | (0.54) | (1.21) |
| Total distributions declared to shareholders | $(3.04) | $(1.62) | $(0.95) | $(1.09) | $(1.23) | $(1.71) |
| Net asset value, end of period (x) | $46.38 | $47.88 | $53.01 | $40.86 | $40.87 | $40.39 |
| Total return (%) (r)(s)(t)(x) | 3.18(n) | (6.83) | 32.53 | 2.66 | 4.60 | 9.15 |
Ratios (%) (to average net assets)
and Supplemental data: |
| Expenses before expense reductions | 1.05(a) | 1.06 | 1.05 | 1.08 | 1.08 | 1.07 |
| Expenses after expense reductions | 1.04(a) | 1.04 | 1.04 | 1.07 | 1.07 | 1.07 |
| Net investment income (loss) | 1.33(a) | 1.10 | 1.00 | 1.30 | 1.73 | 1.21 |
| Portfolio turnover | 5(n) | 12 | 8 | 16 | 11 | 11 |
| Net assets at end of period (000 omitted) | $311,551 | $323,438 | $409,939 | $359,598 | $437,221 | $550,200 |
See Notes to Financial Statements
Financial Highlights – continued
| Class R3 | Six months
ended | Year ended |
| | 2/28/23
(unaudited) | 8/31/22 | 8/31/21 | 8/31/20 | 8/31/19 | 8/31/18 |
| Net asset value, beginning of period | $48.22 | $53.37 | $41.14 | $41.15 | $40.66 | $38.85 |
| Income (loss) from investment operations |
| Net investment income (loss) (d) | $0.38 | $0.69 | $0.59 | $0.63 | $0.79 | $0.59 |
| Net realized and unrealized gain (loss) | 1.23 | (4.08) | 12.71 | 0.56 | 1.03 | 3.03 |
| Total from investment operations | $1.61 | $(3.39) | $13.30 | $1.19 | $1.82 | $3.62 |
| Less distributions declared to shareholders |
| From net investment income | $(0.42) | $(0.70) | $(0.60) | $(0.65) | $(0.79) | $(0.60) |
| From net realized gain | (2.69) | (1.06) | (0.47) | (0.55) | (0.54) | (1.21) |
| Total distributions declared to shareholders | $(3.11) | $(1.76) | $(1.07) | $(1.20) | $(1.33) | $(1.81) |
| Net asset value, end of period (x) | $46.72 | $48.22 | $53.37 | $41.14 | $41.15 | $40.66 |
| Total return (%) (r)(s)(t)(x) | 3.30(n) | (6.58) | 32.85 | 2.92 | 4.87 | 9.43 |
Ratios (%) (to average net assets)
and Supplemental data: |
| Expenses before expense reductions | 0.80(a) | 0.81 | 0.80 | 0.83 | 0.83 | 0.82 |
| Expenses after expense reductions | 0.79(a) | 0.79 | 0.79 | 0.82 | 0.82 | 0.82 |
| Net investment income (loss) | 1.58(a) | 1.35 | 1.25 | 1.56 | 1.99 | 1.47 |
| Portfolio turnover | 5(n) | 12 | 8 | 16 | 11 | 11 |
| Net assets at end of period (000 omitted) | $2,570,412 | $2,479,059 | $2,774,355 | $2,036,093 | $2,096,743 | $2,259,562 |
See Notes to Financial Statements
Financial Highlights – continued
| Class R4 | Six months
ended | Year ended |
| | 2/28/23
(unaudited) | 8/31/22 | 8/31/21 | 8/31/20 | 8/31/19 | 8/31/18 |
| Net asset value, beginning of period | $48.44 | $53.61 | $41.31 | $41.32 | $40.82 | $39.00 |
| Income (loss) from investment operations |
| Net investment income (loss) (d) | $0.44 | $0.82 | $0.70 | $0.73 | $0.89 | $0.69 |
| Net realized and unrealized gain (loss) | 1.24 | (4.11) | 12.78 | 0.56 | 1.03 | 3.04 |
| Total from investment operations | $1.68 | $(3.29) | $13.48 | $1.29 | $1.92 | $3.73 |
| Less distributions declared to shareholders |
| From net investment income | $(0.49) | $(0.82) | $(0.71) | $(0.75) | $(0.88) | $(0.70) |
| From net realized gain | (2.69) | (1.06) | (0.47) | (0.55) | (0.54) | (1.21) |
| Total distributions declared to shareholders | $(3.18) | $(1.88) | $(1.18) | $(1.30) | $(1.42) | $(1.91) |
| Net asset value, end of period (x) | $46.94 | $48.44 | $53.61 | $41.31 | $41.32 | $40.82 |
| Total return (%) (r)(s)(t)(x) | 3.43(n) | (6.36) | 33.20 | 3.17 | 5.14 | 9.70 |
Ratios (%) (to average net assets)
and Supplemental data: |
| Expenses before expense reductions | 0.55(a) | 0.56 | 0.55 | 0.58 | 0.58 | 0.57 |
| Expenses after expense reductions | 0.54(a) | 0.54 | 0.54 | 0.57 | 0.57 | 0.57 |
| Net investment income (loss) | 1.83(a) | 1.59 | 1.50 | 1.80 | 2.24 | 1.72 |
| Portfolio turnover | 5(n) | 12 | 8 | 16 | 11 | 11 |
| Net assets at end of period (000 omitted) | $1,911,409 | $1,936,377 | $2,625,508 | $2,323,830 | $2,916,674 | $3,201,331 |
See Notes to Financial Statements
Financial Highlights – continued
| Class R6 | Six months
ended | Year ended |
| | 2/28/23
(unaudited) | 8/31/22 | 8/31/21 | 8/31/20 | 8/31/19 | 8/31/18 |
| Net asset value, beginning of period | $48.43 | $53.60 | $41.31 | $41.32 | $40.83 | $39.01 |
| Income (loss) from investment operations |
| Net investment income (loss) (d) | $0.46 | $0.88 | $0.76 | $0.78 | $0.93 | $0.73 |
| Net realized and unrealized gain (loss) | 1.25 | (4.11) | 12.76 | 0.55 | 1.02 | 3.04 |
| Total from investment operations | $1.71 | $(3.23) | $13.52 | $1.33 | $1.95 | $3.77 |
| Less distributions declared to shareholders |
| From net investment income | $(0.52) | $(0.88) | $(0.76) | $(0.79) | $(0.92) | $(0.74) |
| From net realized gain | (2.69) | (1.06) | (0.47) | (0.55) | (0.54) | (1.21) |
| Total distributions declared to shareholders | $(3.21) | $(1.94) | $(1.23) | $(1.34) | $(1.46) | $(1.95) |
| Net asset value, end of period (x) | $46.93 | $48.43 | $53.60 | $41.31 | $41.32 | $40.83 |
| Total return (%) (r)(s)(t)(x) | 3.50(n) | (6.26) | 33.33 | 3.29 | 5.22 | 9.81 |
Ratios (%) (to average net assets)
and Supplemental data: |
| Expenses before expense reductions | 0.45(a) | 0.44 | 0.45 | 0.47 | 0.48 | 0.47 |
| Expenses after expense reductions | 0.44(a) | 0.43 | 0.44 | 0.46 | 0.47 | 0.47 |
| Net investment income (loss) | 1.94(a) | 1.72 | 1.60 | 1.92 | 2.35 | 1.83 |
| Portfolio turnover | 5(n) | 12 | 8 | 16 | 11 | 11 |
| Net assets at end of period (000 omitted) | $20,310,596 | $20,671,878 | $22,910,207 | $16,158,507 | $14,716,194 | $13,941,823 |
| (a) | Annualized. |
| (d) | Per share data is based on average shares outstanding. |
| (n) | Not annualized. |
| (r) | Certain expenses have been reduced without which performance would have been lower. |
| (s) | From time to time the fund may receive proceeds from litigation settlements, without which performance would be lower. |
| (t) | Total returns do not include any applicable sales charges. |
| (x) | The net asset values and total returns have been calculated on net assets which include adjustments made in accordance with U.S. generally accepted accounting principles required at period end for financial reporting purposes. |
See Notes to Financial Statements
Notes to Financial Statements
(unaudited)
(1) Business and Organization
MFS Value Fund (the fund) is a diversified series of MFS Series Trust I (the trust). The trust is organized as a Massachusetts business trust and is registered under the Investment Company Act of 1940, as amended, as an open-end management investment company.
The fund is an investment company and accordingly follows the investment company accounting and reporting guidance of the Financial Accounting Standards Board (FASB) Accounting Standards Codification Topic 946 Financial Services - Investment Companies.
(2) Significant Accounting Policies
General - The preparation of financial statements in conformity with U.S. generally accepted accounting principles requires management to make estimates and assumptions that affect the reported amounts of assets and liabilities, and disclosure of contingent assets and liabilities at the date of the financial statements and the reported amounts of increases and decreases in net assets from operations during the reporting period. Actual results could differ from those estimates. In the preparation of these financial statements, management has evaluated subsequent events occurring after the date of the fund’s Statement of Assets and Liabilities through the date that the financial statements were issued.
Balance Sheet Offsetting — The fund's accounting policy with respect to balance sheet offsetting is that, absent an event of default by the counterparty or a termination of the agreement, the International Swaps and Derivatives Association (ISDA) Master Agreement, or similar agreement, does not result in an offset of reported amounts of financial assets and financial liabilities in the Statement of Assets and Liabilities across transactions between the fund and the applicable counterparty. The fund's right to setoff may be restricted or prohibited by the bankruptcy or insolvency laws of the particular jurisdiction to which a specific master netting agreement counterparty is subject. Balance sheet offsetting disclosures, to the extent applicable to the fund, have been included in the fund’s Significant Accounting Policies note under the captions for each of the fund’s in-scope financial instruments and transactions.
Investment Valuations — Subject to its oversight, the fund's Board of Trustees has delegated primary responsibility for determining or causing to be determined the value of the fund’s investments to MFS as the fund's adviser, pursuant to the fund’s valuation policy and procedures which have been adopted by the adviser and approved by the Board. Effective September 8, 2022, and in accordance with Rule 2a-5 under the Investment Company Act of 1940, the Board of Trustees designated the adviser as the “valuation designee” of the fund. If the adviser, as valuation designee, determines that reliable market quotations are not readily available for an investment, the investment is valued at fair value as determined in good faith by the adviser in accordance with the adviser’s fair valuation policy and procedures.
Under the fund's valuation policy and procedures, equity securities, including restricted equity securities, are generally valued at the last sale or official closing price on their primary market or exchange as provided by a third-party pricing service. Equity securities, for which there were no sales reported that day, are generally valued at the last quoted daily bid quotation on their primary market or exchange as provided by a
Notes to Financial Statements (unaudited) - continued
third-party pricing service. Short-term instruments with a maturity at issuance of 60 days or less may be valued at amortized cost, which approximates market value.
Open-end investment companies are generally valued at net asset value per share. The values of foreign securities and other assets and liabilities expressed in foreign currencies are converted to U.S. dollars using the mean of bid and asked prices for rates provided by a third-party pricing service.
Under the fund’s valuation policy and procedures, market quotations are not considered to be readily available for debt instruments, floating rate loans, and many types of derivatives. These investments are generally valued at fair value based on information from third-party pricing services or otherwise determined by the adviser in accordance with the adviser’s fair valuation policy and procedures. Securities and other assets generally valued on the basis of information from a third-party pricing service may also be valued at a broker/dealer bid quotation. In determining values, third-party pricing services can utilize both transaction data and market information such as yield, quality, coupon rate, maturity, type of issue, trading characteristics, spreads and other market data. An investment may also be valued at fair value if the adviser determines that the investment’s value has been materially affected by events occurring after the close of the exchange or market on which the investment is principally traded (such as foreign exchange or market) and prior to the determination of the fund’s net asset value, or after the halt of trading of a specific security where trading does not resume prior to the close of the exchange or market on which the security is principally traded. Events that occur after foreign markets close (such as developments in foreign markets and significant movements in the U.S. markets) and prior to the determination of the fund’s net asset value may be deemed to have a material effect on the value of securities traded in foreign markets. Accordingly, the fund’s foreign equity securities may often be valued at fair value. The adviser generally relies on third-party pricing services or other information (such as the correlation with price movements of similar securities in the same or other markets; the type, cost and investment characteristics of the security; the business and financial condition of the issuer; and trading and other market data) to assist in determining whether to fair value and at what value to fair value an investment. The value of an investment for purposes of calculating the fund’s net asset value can differ depending on the source and method used to determine value. When fair valuation is used, the value of an investment used to determine the fund’s net asset value may differ from quoted or published prices for the same investment. There can be no assurance that the fund could obtain the fair value assigned to an investment if it were to sell the investment at the same time at which the fund determines its net asset value per share.
Various inputs are used in determining the value of the fund's assets or liabilities. These inputs are categorized into three broad levels. In certain cases, the inputs used to measure fair value may fall into different levels of the fair value hierarchy. In such cases, an investment's level within the fair value hierarchy is based on the lowest level of input that is significant to the fair value measurement. The fund's assessment of the significance of a particular input to the fair value measurement in its entirety requires judgment, and considers factors specific to the investment. Level 1 includes unadjusted quoted prices in active markets for identical assets or liabilities. Level 2 includes other significant observable market-based inputs (including quoted prices for similar securities, interest rates, prepayment speed, and credit risk). Level 3 includes significant
Notes to Financial Statements (unaudited) - continued
unobservable inputs, which may include the adviser's own assumptions in determining the fair value of investments. The following is a summary of the levels used as of February 28, 2023 in valuing the fund's assets and liabilities:
| Financial Instruments | Level 1 | Level 2 | Level 3 | Total |
| Equity Securities | $56,911,964,814 | $— | $— | $56,911,964,814 |
| Mutual Funds | 300,544,129 | — | — | 300,544,129 |
| Total | $57,212,508,943 | $— | $— | $57,212,508,943 |
For further information regarding security characteristics, see the Portfolio of Investments.
Foreign Currency Translation — Purchases and sales of foreign investments, income, and expenses are converted into U.S. dollars based upon currency exchange rates prevailing on the respective dates of such transactions or on the reporting date for foreign denominated receivables and payables. Gains and losses attributable to foreign currency exchange rates on sales of securities are recorded for financial statement purposes as net realized gains and losses on investments. Gains and losses attributable to foreign exchange rate movements on receivables, payables, income and expenses are recorded for financial statement purposes as foreign currency transaction gains and losses. That portion of both realized and unrealized gains and losses on investments that results from fluctuations in foreign currency exchange rates is not separately disclosed.
Security Loans — Under its Securities Lending Agency Agreement with the fund, State Street Bank and Trust Company, as lending agent, loans the securities of the fund to certain qualified institutions (the “Borrowers”) approved by the fund. Security loans can be terminated at the discretion of either the lending agent or the fund and the related securities must be returned within the earlier of the standard trade settlement period for such securities or within three business days. The loans are collateralized by cash and/or U.S. Treasury and federal agency obligations in an amount typically at least equal to the market value of the securities loaned. On loans collateralized by cash, the cash collateral is invested in a money market fund. The market value of the loaned securities is determined at the close of business of the fund and any additional required collateral is delivered to the fund on the next business day. The lending agent provides the fund with indemnification against Borrower default. In the event of Borrower default, the lending agent will, for the benefit of the fund, either purchase securities identical to those loaned or, when such purchase is commercially impracticable, pay the fund the market value of the loaned securities. In return, the lending agent assumes the fund's rights to the related collateral. If the collateral value is less than the cost to purchase identical securities, the lending agent is responsible for the shortfall, but only to the extent that such shortfall is not due to a decline in collateral value resulting from collateral reinvestment for which the fund bears the risk of loss. A portion of the income generated upon investment of the collateral is remitted to the Borrowers, and the remainder is allocated between the fund and the lending agent. On loans collateralized by U.S. Treasury and/or federal agency obligations, a fee is received from the Borrower, and is allocated between the fund and the lending agent. Income from securities lending is separately reported in the Statement of Operations. The dividend and interest income earned on the securities loaned is accounted for in the same manner as other dividend and interest income. At February 28, 2023, there were no securities on loan or collateral outstanding.
Notes to Financial Statements (unaudited) - continued
Indemnifications — Under the fund's organizational documents, its officers and Trustees may be indemnified against certain liabilities and expenses arising out of the performance of their duties to the fund. Additionally, in the normal course of business, the fund enters into agreements with service providers that may contain indemnification clauses. The fund's maximum exposure under these agreements is unknown as this would involve future claims that may be made against the fund that have not yet occurred.
Investment Transactions and Income — Investment transactions are recorded on the trade date. Dividends received in cash are recorded on the ex-dividend date. Certain dividends from foreign securities will be recorded when the fund is informed of the dividend if such information is obtained subsequent to the ex-dividend date. Dividend payments received in additional securities are recorded on the ex-dividend date in an amount equal to the value of the security on such date. In determining the net gain or loss on securities sold, the cost of securities is determined on the identified cost basis.
The fund may receive proceeds from litigation settlements. Any proceeds received from litigation involving portfolio holdings are reflected in the Statement of Operations in realized gain/loss if the security has been disposed of by the fund or in unrealized gain/loss if the security is still held by the fund. Any other proceeds from litigation not related to portfolio holdings are reflected as other income in the Statement of Operations.
Tax Matters and Distributions — The fund intends to qualify as a regulated investment company, as defined under Subchapter M of the Internal Revenue Code, and to distribute all of its taxable income, including realized capital gains. As a result, no provision for federal income tax is required. The fund’s federal tax returns, when filed, will remain subject to examination by the Internal Revenue Service for a three year period. Management has analyzed the fund’s tax positions taken on federal and state tax returns for all open tax years and does not believe that there are any uncertain tax positions that require recognition of a tax liability. Foreign taxes, if any, have been accrued by the fund in the accompanying financial statements in accordance with the applicable foreign tax law. Foreign income taxes may be withheld by certain countries in which the fund invests. Additionally, capital gains realized by the fund on securities issued in or by certain foreign countries may be subject to capital gains tax imposed by those countries.
Distributions to shareholders are recorded on the ex-dividend date. Income and capital gain distributions are determined in accordance with income tax regulations, which may differ from U.S. generally accepted accounting principles. Certain capital accounts in the financial statements are periodically adjusted for permanent differences in order to reflect their tax character. These adjustments have no impact on net assets or net asset value per share. Temporary differences which arise from recognizing certain items of income, expense, gain or loss in different periods for financial statement and tax purposes will reverse at some time in the future.
Book/tax differences primarily relate to wash sale loss deferrals, treating a portion of the proceeds from redemptions as a distribution for tax purposes, and redemptions in-kind.
Notes to Financial Statements (unaudited) - continued
The tax character of distributions made during the current period will be determined at fiscal year end. The tax character of distributions declared to shareholders for the last fiscal year is as follows:
| | Year ended
8/31/22 |
| Ordinary income (including any short-term capital gains) | $1,056,449,863 |
| Long-term capital gains | 1,240,205,341 |
| Total distributions | $2,296,655,204 |
The federal tax cost and the tax basis components of distributable earnings were as follows:
| As of 2/28/23 | |
| Cost of investments | $33,046,645,212 |
| Gross appreciation | 25,021,846,346 |
| Gross depreciation | (855,982,615) |
| Net unrealized appreciation (depreciation) | $24,165,863,731 |
| As of 8/31/22 | |
| Undistributed ordinary income | 160,951,456 |
| Undistributed long-term capital gain | 2,596,924,612 |
| Other temporary differences | (943,469) |
| Net unrealized appreciation (depreciation) | 24,229,812,339 |
The aggregate cost above includes prior fiscal year end tax adjustments, if applicable.
Multiple Classes of Shares of Beneficial Interest — The fund offers multiple classes of shares, which differ in their respective distribution, service, and program manager fees. The fund's income, realized and unrealized gain (loss), and common expenses are allocated to shareholders based on the daily net assets of each class. Dividends are declared separately for each class. Differences in per share dividend rates are generally due to differences in separate class expenses. Class B and Class C shares will convert to Class A shares approximately eight years after purchase. Effective March 21, 2022, all Class 529B and Class 529C shares were converted into Class 529A shares. Effective
Notes to Financial Statements (unaudited) - continued
May 20, 2022, all Class 529A shares were redeemed. The fund’s distributions declared to shareholders as reported in the Statements of Changes in Net Assets are presented by class as follows:
| | Six months
ended
2/28/23 | | Year
ended
8/31/22 |
| Class A | $495,214,679 | | $273,517,488 |
| Class B | 2,024,131 | | 1,216,456 |
| Class C | 33,188,344 | | 17,060,745 |
| Class I | 1,554,617,740 | | 974,046,406 |
| Class R1 | 967,741 | | 496,764 |
| Class R2 | 20,328,048 | | 11,816,689 |
| Class R3 | 162,458,845 | | 92,181,871 |
| Class R4 | 122,840,595 | | 86,917,003 |
| Class R6 | 1,327,542,683 | | 838,098,191 |
| Class 529A | — | | 1,199,995 |
| Class 529B | — | | 12,068 |
| Class 529C | — | | 91,528 |
| Total | $3,719,182,806 | | $2,296,655,204 |
(3) Transactions with Affiliates
Investment Adviser — The fund has an investment advisory agreement with MFS to provide overall investment management and related administrative services and facilities to the fund. The management fee is computed daily and paid monthly at the following annual rates based on the fund's average daily net assets:
| Up to $7.5 billion | 0.60% |
| In excess of $7.5 billion and up to $10 billion | 0.53% |
| In excess of $10 billion and up to $20 billion | 0.50% |
| In excess of $20 billion and up to $25 billion | 0.45% |
| In excess of $25 billion and up to $30 billion | 0.42% |
| In excess of $30 billion and up to $35 billion | 0.40% |
| In excess of $35 billion and up to $40 billion | 0.38% |
| In excess of $40 billion and up to $45 billion | 0.36% |
| In excess of $45 billion and up to $50 billion | 0.35% |
| In excess of $50 billion and up to $60 billion | 0.34% |
| In excess of $60 billion and up to $70 billion | 0.33% |
| In excess of $70 billion | 0.32% |
MFS has agreed in writing to reduce its management fee by a specified amount if certain MFS mutual fund assets exceed thresholds agreed to by MFS and the fund's Board of Trustees. MFS has also agreed in writing to waive at least 0.01% of its management fee as part of this agreement. The agreement to waive at least 0.01% of the management fee will continue until modified by the fund's Board of Trustees, but such agreement will continue at least until December 31, 2023. For the six months ended February 28, 2023, this management fee reduction amounted to $3,858,747, which is included in the reduction of total expenses in the Statement of Operations.
The management fee incurred for the six months ended February 28, 2023 was equivalent to an annual effective rate of 0.42% of the fund's average daily net assets.
Notes to Financial Statements (unaudited) - continued
Distributor — MFS Fund Distributors, Inc. (MFD), a wholly-owned subsidiary of MFS, as distributor, received $411,945 for the six months ended February 28, 2023, as its portion of the initial sales charge on sales of Class A shares of the fund.
The Board of Trustees has adopted a distribution plan for certain share classes pursuant to Rule 12b-1 of the Investment Company Act of 1940.
The fund's distribution plan provides that the fund will pay MFD for services provided by MFD and financial intermediaries in connection with the distribution and servicing of certain share classes. One component of the plan is a distribution fee paid to MFD and another component of the plan is a service fee paid to MFD. MFD may subsequently pay all, or a portion, of the distribution and/or service fees to financial intermediaries.
Distribution Plan Fee Table:
| | Distribution
Fee Rate (d) | Service
Fee Rate (d) | Total
Distribution
Plan (d) | Annual
Effective
Rate (e) | Distribution
and Service
Fee |
| Class A | — | 0.25% | 0.25% | 0.25% | $ 9,757,525 |
| Class B | 0.75% | 0.25% | 1.00% | 1.00% | 170,278 |
| Class C | 0.75% | 0.25% | 1.00% | 1.00% | 2,757,382 |
| Class R1 | 0.75% | 0.25% | 1.00% | 1.00% | 79,060 |
| Class R2 | 0.25% | 0.25% | 0.50% | 0.50% | 803,856 |
| Class R3 | — | 0.25% | 0.25% | 0.25% | 3,180,705 |
| Total Distribution and Service Fees | | | | | $16,748,806 |
| (d) | In accordance with the distribution plan for certain classes, the fund pays distribution and/or service fees equal to these annual percentage rates of each class’s average daily net assets. The distribution and service fee rates disclosed by class represent the current rates in effect at the end of the reporting period. Any rate changes, if applicable, are detailed below. |
| (e) | The annual effective rates represent actual fees incurred under the distribution plan for the six months ended February 28, 2023 based on each class's average daily net assets. MFD has voluntarily agreed to rebate a portion of each class’s 0.25% service fee attributable to accounts for which there is no financial intermediary specified on the account except for accounts attributable to MFS or its affiliates’ seed money. For the six months ended February 28, 2023, this rebate amounted to $845, $2, $39, $130, and $1 for Class A, Class B, Class C, Class R2, and Class R3 shares, respectively, and is included in the reduction of total expenses in the Statement of Operations. |
Certain Class A shares are subject to a contingent deferred sales charge (CDSC) in the event of a shareholder redemption within 18 months of purchase. Class B shares are subject to a CDSC in the event of a shareholder redemption within six years of purchase. Class C shares are subject to a CDSC in the event of a shareholder redemption within 12 months of purchase. All contingent deferred sales charges are paid to MFD and during the six months ended February 28, 2023, were as follows:
| | Amount |
| Class A | $64,065 |
| Class B | 4,526 |
| Class C | 22,699 |
Notes to Financial Statements (unaudited) - continued
Shareholder Servicing Agent — MFS Service Center, Inc. (MFSC), a wholly-owned subsidiary of MFS, receives a fee from the fund for its services as shareholder servicing agent calculated as a percentage of the average daily net assets of the fund as determined periodically under the supervision of the fund's Board of Trustees. For the six months ended February 28, 2023, the fee was $617,263, which equated to 0.0021% annually of the fund's average daily net assets. MFSC also receives reimbursement from the fund for out-of-pocket expenses, sub-accounting and other shareholder servicing costs which may be paid to affiliated and unaffiliated service providers. Class R6 shares do not incur sub-accounting fees. For the six months ended February 28, 2023, these out-of-pocket expenses, sub-accounting and other shareholder servicing costs amounted to $20,226,827.
Administrator — MFS provides certain financial, legal, shareholder communications, compliance, and other administrative services to the fund. Under an administrative services agreement, the fund reimburses MFS the costs incurred to provide these services. The fund is charged an annual fixed amount of $17,500 plus a fee based on average daily net assets. The administrative services fee incurred for the six months ended February 28, 2023 was equivalent to an annual effective rate of 0.0011% of the fund's average daily net assets.
Trustees’ and Officers’ Compensation — The fund pays compensation to independent Trustees in the form of a retainer, attendance fees, and additional compensation to Board and Committee chairpersons. The fund does not pay compensation directly to Trustees or officers of the fund who are also officers of the investment adviser, all of whom receive remuneration from MFS for their services to the fund. Certain officers and Trustees of the fund are officers or directors of MFS, MFD, and MFSC.
Other — The fund invests in the MFS Institutional Money Market Portfolio which is managed by MFS and seeks current income consistent with preservation of capital and liquidity. This money market fund does not pay a management fee to MFS but does incur investment and operating costs.
The fund is permitted to engage in purchase and sale transactions with funds and accounts for which MFS serves as investment adviser or sub-adviser (“cross-trades”) pursuant to a policy adopted by the Board of Trustees. This policy has been designed to ensure that cross-trades conducted by the fund comply with Rule 17a-7 under the Investment Company Act of 1940. During the six months ended February 28, 2023, the fund engaged in sale transactions pursuant to this policy, which amounted to $40,376,427. The sales transactions resulted in net realized gains (losses) of $6,695,881.
The adviser has voluntarily undertaken to reimburse the fund from its own resources on a quarterly basis for the cost of investment research embedded in the cost of the fund’s securities trades. This agreement may be rescinded at any time. For the six months ended February 28, 2023, this reimbursement amounted to $202,704, which is included in “Other” income in the Statement of Operations.
(4) Portfolio Securities
For the six months ended February 28, 2023, purchases and sales of investments, other than short-term obligations, aggregated $2,730,988,580 and $5,270,815,326, respectively.
Notes to Financial Statements (unaudited) - continued
(5) Shares of Beneficial Interest
The fund's Declaration of Trust permits the Trustees to issue an unlimited number of full and fractional shares of beneficial interest. Transactions in fund shares were as follows:
| | Six months ended
2/28/23 | | Year ended
8/31/22 |
| | Shares | Amount | | Shares | Amount |
| Shares sold | | | | | |
| Class A | 12,490,337 | $600,194,698 | | 25,460,837 | $1,304,528,745 |
| Class B | 13,769 | 650,187 | | 28,780 | 1,448,061 |
| Class C | 902,771 | 43,036,566 | | 2,128,366 | 108,930,510 |
| Class I | 46,708,790 | 2,261,440,119 | | 104,177,233 | 5,398,148,950 |
| Class R1 | 59,251 | 2,872,594 | | 71,429 | 3,582,741 |
| Class R2 | 427,200 | 20,442,224 | | 1,017,872 | 51,547,704 |
| Class R3 | 4,612,770 | 221,346,949 | | 9,577,374 | 490,593,967 |
| Class R4 | 4,144,461 | 198,551,695 | | 8,666,712 | 449,117,644 |
| Class R6 | 33,168,978 | 1,600,103,437 | | 69,862,513 | 3,605,133,343 |
| Class 529A | — | — | | 181,738 | 9,356,790 |
| Class 529C | — | — | | 4,314 | 219,593 |
| | 102,528,327 | $4,948,638,469 | | 221,177,168 | $11,422,608,048 |
Shares issued to shareholders
in reinvestment of distributions | | | | | |
| Class A | 8,609,277 | $408,231,251 | | 4,260,498 | $223,606,230 |
| Class B | 41,077 | 1,945,499 | | 21,603 | 1,143,159 |
| Class C | 589,020 | 27,632,580 | | 269,156 | 14,097,412 |
| Class I | 27,027,449 | 1,289,038,722 | | 15,332,772 | 808,558,869 |
| Class R1 | 20,833 | 967,741 | | 9,567 | 496,670 |
| Class R2 | 431,540 | 20,231,174 | | 225,850 | 11,770,156 |
| Class R3 | 3,442,552 | 162,455,990 | | 1,763,839 | 92,179,872 |
| Class R4 | 2,523,167 | 119,535,969 | | 1,617,791 | 84,960,067 |
| Class R6 | 25,556,089 | 1,210,134,959 | | 14,489,736 | 758,305,034 |
| Class 529A | — | — | | 22,189 | 1,174,219 |
| Class 529B | — | — | | 230 | 12,068 |
| Class 529C | — | — | | 1,666 | 87,208 |
| | 68,241,004 | $3,240,173,885 | | 38,014,897 | $1,996,390,964 |
Notes to Financial Statements (unaudited) - continued
| | Six months ended
2/28/23 | | Year ended
8/31/22 |
| | Shares | Amount | | Shares | Amount |
| Shares reacquired | | | | | |
| Class A | (14,746,849) | $(711,177,230) | | (28,870,863) | $(1,488,027,464) |
| Class B | (125,966) | (6,028,864) | | (294,900) | (15,068,232) |
| Class C | (1,880,171) | (89,440,628) | | (3,599,146) | (182,095,198) |
| Class I | (73,600,831) | (3,569,216,427) | | (122,942,628) | (6,330,744,591) |
| Class R1 | (95,993) | (4,586,681) | | (128,377) | (6,430,683) |
| Class R2 | (896,327) | (42,544,705) | | (2,221,741) | (113,876,779) |
| Class R3 | (4,450,353) | (213,020,711) | | (11,903,542) | (606,937,905) |
| Class R4 | (5,922,466) | (285,388,520) | | (19,281,858) | (995,354,650) |
| Class R6 | (52,723,300) | (2,558,717,368) | | (84,949,346) | (4,358,664,209) |
| Class 529A | — | — | | (952,447) | (45,930,691) |
| Class 529B | — | — | | (9,347) | (478,205) |
| Class 529C | — | — | | (86,922) | (4,405,522) |
| | (154,442,256) | $(7,480,121,134) | | (275,241,117) | $(14,148,014,129) |
| Net change | | | | | |
| Class A | 6,352,765 | $297,248,719 | | 850,472 | $40,107,511 |
| Class B | (71,120) | (3,433,178) | | (244,517) | (12,477,012) |
| Class C | (388,380) | (18,771,482) | | (1,201,624) | (59,067,276) |
| Class I | 135,408 | (18,737,586) | | (3,432,623) | (124,036,772) |
| Class R1 | (15,909) | (746,346) | | (47,381) | (2,351,272) |
| Class R2 | (37,587) | (1,871,307) | | (978,019) | (50,558,919) |
| Class R3 | 3,604,969 | 170,782,228 | | (562,329) | (24,164,066) |
| Class R4 | 745,162 | 32,699,144 | | (8,997,355) | (461,276,939) |
| Class R6 | 6,001,767 | 251,521,028 | | (597,097) | 4,774,168 |
| Class 529A | — | — | | (748,520) | (35,399,682) |
| Class 529B | — | — | | (9,117) | (466,137) |
| Class 529C | — | — | | (80,942) | (4,098,721) |
| | 16,327,075 | $708,691,220 | | (16,049,052) | $(729,015,117) |
The fund is one of several mutual funds in which certain MFS funds may invest. The MFS funds do not invest in the underlying funds for the purpose of exercising management or control. At the end of the period, the MFS Growth Allocation Fund was the owner of record of approximately 1% of the value of outstanding voting shares of the fund. In addition, the MFS Aggressive Growth Allocation Fund, the MFS Conservative Allocation Fund, the MFS Lifetime 2025 Fund, the MFS Lifetime 2030 Fund, the MFS Lifetime 2035 Fund, the MFS Lifetime 2040 Fund, the MFS Lifetime 2045 Fund, the MFS Lifetime 2050 Fund, the MFS Lifetime 2055 Fund, the MFS Lifetime 2060 Fund, the MFS Lifetime 2065 Fund, the MFS Lifetime Income Fund, the MFS Managed Wealth Fund, and the MFS Moderate Allocation Fund were each the owners of record of less than 1% of the value of outstanding voting shares of the fund.
Notes to Financial Statements (unaudited) - continued
Effective June 1, 2019, purchases of the fund’s Class B and Class 529B shares were closed to new and existing investors subject to certain exceptions. Effective after the close of business on March 18, 2022, all sales of Class 529B and Class 529C shares were suspended, and Class 529B and Class 529C shares were converted into Class 529A shares of the fund effective March 21, 2022. Effective after the close of business on May 13, 2022, all sales and redemptions of Class 529A shares were suspended, and all Class 529A shares were redeemed on May 20, 2022.
(6) Line of Credit
The fund and certain other funds managed by MFS participate in a $1.45 billion unsecured committed line of credit of which $1.2 billion is reserved for use by the fund and certain other MFS U.S. funds. The line of credit is provided by a syndicate of banks under a credit agreement. Borrowings may be made for temporary financing needs. Interest is charged to each fund, based on its borrowings, generally at a rate equal to the highest of 1) Daily Simple SOFR (Secured Overnight Financing Rate) plus 0.10%, 2) the Federal Funds Effective Rate, or 3) the Overnight Bank Funding Rate, each plus an agreed upon spread. A commitment fee, based on the average daily unused portion of the committed line of credit, is allocated among the participating funds. The line of credit expires on March 14, 2024 unless extended or renewed. In addition, the fund and other funds managed by MFS have established unsecured uncommitted borrowing arrangements with certain banks for temporary financing needs. Interest is charged to each fund, based on its borrowings, at rates equal to customary reference rates plus an agreed upon spread. For the six months ended February 28, 2023, the fund’s commitment fee and interest expense were $147,208 and $0, respectively, and are included in “Miscellaneous” expense in the Statement of Operations.
(7) Investments in Affiliated Issuers
An affiliated issuer may be considered one in which the fund owns 5% or more of the outstanding voting securities, or a company which is under common control. For the purposes of this report, the following were affiliated issuers:
| Affiliated Issuers | Beginning
Value | Purchases | Sales
Proceeds | Realized
Gain
(Loss) | Change in
Unrealized
Appreciation or
Depreciation | Ending
Value |
| MFS Institutional Money Market Portfolio | $210,070,654 | $2,950,518,829 | $2,860,074,105 | $49,694 | $(20,943) | $300,544,129 |
| Affiliated Issuers | Dividend
Income | Capital Gain
Distributions |
| MFS Institutional Money Market Portfolio | $6,106,904 | $— |
(8) Redemptions In-Kind
On November 16, 2022, the fund recorded a redemption in-kind of portfolio securities and cash that was valued at $43,713,254. The redeeming shareholder generally receives a pro rata share of the securities held by the fund. The distribution of such securities generated a realized gain of $24,765,112 for the fund, which is included in Net realized gain in the Statement of Operations. For tax purposes, no gains or losses were recognized with respect to the portfolio securities redeemed in-kind.
Notes to Financial Statements (unaudited) - continued
On February 22, 2023, the fund recorded a redemption in-kind of portfolio securities and cash that was valued at $32,716,141. The redeeming shareholder generally receives a pro rata share of the securities held by the fund. The distribution of such securities generated a realized gain of $18,042,450 for the fund, which is included in Net realized gain in the Statement of Operations. For tax purposes, no gains or losses were recognized with respect to the portfolio securities redeemed in-kind.
(9) LIBOR Transition
Certain of the fund's investments, including investments in certain debt instruments and derivatives (if any), as well as borrowings by the fund and certain other contractual arrangements of the fund, may be based on the London Interbank Offered Rate (“LIBOR”). In 2017, the regulatory authority that oversees financial services firms in the United Kingdom announced plans to transition away from LIBOR by the end of 2021. In March 2021, the administrator of LIBOR announced the extension of the publication of the more commonly used U.S. dollar LIBOR settings to the end of June 2023. Although the full impacts of the transition away from LIBOR are not fully known, the transition may result in, among other things, an increase in volatility or illiquidity of the markets for instruments that currently rely on LIBOR to determine interest rates and this could have an adverse impact on the fund's performance. With respect to the fund's accounting for investments, including investments in certain debt instruments and derivatives, as well as borrowings by the fund and any other contractual arrangements of the fund that undergo reference rate-related modifications as a result of the transition, management will rely upon the relief provided by FASB Codification Topic 848 – Reference Rate Reform (Topic 848). The guidance in Topic 848 permits the fund to account for those modified contracts as a continuation of the existing contracts. The situation remains fluid, and management believes, based on best available information, that the impact of the transition will not be material to the fund.
(10) Subsequent Event
On March 17, 2023, the fund recorded redemption proceeds for a distribution in-kind of portfolio securities and cash that were valued at $125,962,065. The redeeming shareholder generally receives a pro rata share of the securities held by the fund. The distribution of such securities generated a realized gain (loss) of $65,639,817 for the fund.
On March 30, 2023, the fund announced that effective after the close of business on September 29, 2023, purchases of Class R1 and Class R2 shares will be closed to new eligible investors.
Proxy Voting Policies and Information
MFS votes proxies on behalf of the fund pursuant to proxy voting policies and procedures that are available without charge, upon request, by calling 1-800-225-2606, by visiting mfs.com/proxyvoting, or by visiting the SEC’s Web site at http://www.sec.gov.
Information regarding how the fund voted proxies relating to portfolio securities during the most recent twelve-month period ended June 30 is available by August 31 of each year without charge by visiting mfs.com/proxyvoting, or by visiting the SEC’s Web site at http://www.sec.gov.
Quarterly Portfolio Disclosure
The fund files a complete schedule of portfolio holdings with the SEC for the first and third quarters of each fiscal year as an exhibit to its reports on Form N-PORT. The fund's Form N-PORT reports are available on the SEC's Web site at http://www.sec.gov. A shareholder can obtain the portfolio holdings report for the first and third quarters of the fund's fiscal year at mfs.com/openendfunds by choosing the fund's name and then scrolling to the “Resources” section and clicking on the “Prospectus and Reports” tab.
Further Information
From time to time, MFS may post important information about the fund or the MFS Funds on the MFS Web site (mfs.com). This information is available at https://www.mfs.com/announcements or at mfs.com/openendfunds by choosing the fund’s name and then scrolling to the “Resources” section and clicking on the “Announcements” tab, if any.
Information About Fund Contracts and Legal Claims
The fund has entered into contractual arrangements with an investment adviser, administrator, distributor, shareholder servicing agent, and custodian who each provide services to the fund. Unless expressly stated otherwise, shareholders are not parties to, or intended beneficiaries of these contractual arrangements, and these contractual arrangements are not intended to create any shareholder right to enforce them against the service providers or to seek any remedy under them against the service providers, either directly or on behalf of the fund.
Under the Trust’s By-Laws and Declaration of Trust, any claims asserted against or on behalf of the MFS Funds, including claims against Trustees and Officers, must be brought in state and federal courts located within the Commonwealth of Massachusetts.
Provision of Financial Reports and Summary Prospectuses
The fund produces financial reports every six months and updates its summary prospectus and prospectus annually. To avoid sending duplicate copies of materials to households, only one copy of the fund’s annual and semiannual report and summary prospectus may be mailed to shareholders having the same last name and residential address on the fund’s records. However, any shareholder may contact MFSC (please see back cover for address and telephone number) to request that copies of these reports and summary prospectuses be sent personally to that shareholder.
Save paper with eDelivery.
MFS® will send you prospectuses, reports, and proxies directly via e-mail so you will get information faster with less mailbox clutter.
To sign up:
1. Go to mfs.com.
2. Log in via MFS® Access.
3. Select eDelivery.
If you own your MFS fund shares through a financial institution or a retirement plan, MFS® TALK, MFS® Access, or eDelivery may not be available to you.
CONTACT
WEB SITE
mfs.com
MFS TALK
1-800-637-8255
24 hours a day
ACCOUNT SERVICE AND LITERATURE
Shareholders
1-800-225-2606
Financial advisors
1-800-343-2829
Retirement plan services
1-800-637-1255
MAILING ADDRESS
MFS Service Center, Inc.
P.O. Box 219341
Kansas City, MO 64121-9341
OVERNIGHT MAIL
MFS Service Center, Inc.
Suite 219341
430 W 7th Street
Kansas City, MO 64105-1407
Item 1(b):
Not applicable.
ITEM 2. CODE OF ETHICS.
During the period covered by this report, the Registrant has not amended any provision in its Code of Ethics (the "Code") that relates to an element of the Code's definition enumerated in paragraph (b) of Item 2 of this Form N-CSR. During the period covered by this report, the Registrant did not grant a waiver, including an implicit waiver, from any provision of the Code.
ITEM 3. AUDIT COMMITTEE FINANCIAL EXPERT.
Not applicable for semi-annual reports.
ITEM 4. PRINCIPAL ACCOUNTANT FEES AND SERVICES.
Not applicable for semi-annual reports.
ITEM 5. AUDIT COMMITTEE OF LISTED REGISTRANTS.
Not applicable to the Registrant.
ITEM 6. INVESTMENTS
A schedule of investments for each series covered by this Form N-CSR is included as part of the report to shareholders of such series under Item 1(a) of this Form N-CSR.
ITEM 7. DISCLOSURE OF PROXY VOTING POLICIES AND PROCEDURES FOR CLOSED-END MANAGEMENT INVESTMENT COMPANIES.
Not applicable to the Registrant.
ITEM 8. PORTFOLIO MANAGERS OF CLOSED-END MANAGEMENT INVESTMENT COMPANIES.
Not applicable to the Registrant.
ITEM 9. PURCHASES OF EQUITY SECURITIES BY CLOSED-END MANAGEMENT INVESTMENT COMPANY AND AFFILIATED PURCHASERS.
Not applicable to the Registrant.
ITEM 10. SUBMISSION OF MATTERS TO A VOTE OF SECURITY HOLDERS.
There were no material changes to the procedures by which shareholders may send recommendations to the Board for nominees to the Registrant's Board since the Registrant last provided disclosure as to such procedures in response to the requirements of Item 407 (c)(2)(iv) of Regulation S-K or this Item.
ITEM 11. CONTROLS AND PROCEDURES.
(a)Based upon their evaluation of the effectiveness of the registrant's disclosure controls and procedures (as defined in Rule 30a-3(c) under the Investment Company Act of 1940 (the "Act")) as conducted within 90 days of the filing date of this report on Form N-CSR, the Registrant's principal financial officer and principal executive officer have concluded that those disclosure controls and procedures provide reasonable assurance that the material information required to be disclosed by the Registrant on this report is recorded, processed, summarized and reported within the time periods specified in the Securities and Exchange Commission's rules and forms.
(b)There were no changes in the Registrant's internal controls over financial reporting (as defined in Rule 30a-3(d) under the Act) that occurred during the period covered by the report that have materially affected, or are reasonably likely to materially affect, the Registrant's internal control over financial reporting.
ITEM 12. DISCLOSURE OF SECURITIES LENDING ACTIVITIES FOR CLOSED-END MANAGEMENT INVESTMENT COMPANIES.
Not applicable to the Registrant.
ITEM 13. EXHIBITS.
(a)(1) Any code of ethics, or amendment thereto, that is the subject of the disclosure required by Item 2, to the extent that the registrant intends to satisfy the Item 2 requirements through filing of an exhibit: Not applicable.
(2)A separate certification for each principal executive officer and principal financial officer of the registrant as required by Rule 30a-2(a) under the Act (17 CFR 270.30a-2): Attached hereto as EX-99.302CERT.
(3)Any written solicitation to purchase securities under Rule 23c-1 under the Act (17 CFR 270.23c-1) sent or given during the period covered by the report by or on behalf of the registrant to 10 or more persons. Not applicable.
(4)Change in the registrant's independent public accountant. Not applicable.
(b)If the report is filed under Section 13(a) or 15(d) of the Exchange Act, provide the certifications required by Rule 30a-2(b) under the Act (17 CFR 270.30a-2(b)), Rule 13a-14(b) or Rule 15d-14(b) under the Exchange Act (17 CFR 240.13a-14(b) or 240.15d-14(b)) and Section 1350 of Chapter 63 of Title 18 of the United States Code (18 U.S.C. 1350) as an exhibit. A certification furnished pursuant to this paragraph will not be deemed "filed" for the purposes of Section 18 of the Exchange Act (15 U.S.C. 78r), or otherwise subject to the liability of that section. Such certification will not be deemed to be incorporated by reference into any filing under the Securities Act of 1933 or the Exchange Act, except to the extent that the registrant specifically incorporates it by reference. Attached hereto as EX-99.906CERT.
Notice
A copy of the Amended and Restated Declaration of Trust, as amended, of the Registrant is on file with the Secretary of State of The Commonwealth of Massachusetts and notice is hereby given that this instrument is executed on behalf of the Registrant by an officer of the Registrant as an officer and not individually and the obligations of or arising out of this instrument are not binding upon any of the Trustees or shareholders individually, but are binding only upon the assets and property of the respective constituent series of the Registrant.
SIGNATURES
Pursuant to the requirements of the Securities Exchange Act of 1934 and the Investment Company Act of 1940, the registrant has duly caused this report to be signed on its behalf by the undersigned, thereunto duly authorized.
(Registrant) MFS SERIES TRUST I
By (Signature and Title)*
/S/ DAVID L. DILORENZO
David L. DiLorenzo, President
Date: April 14, 2023
Pursuant to the requirements of the Securities Exchange Act of 1934 and the Investment Company Act of 1940, this report has been signed below by the following persons on behalf of the registrant and in the capacities and on the dates indicated.
By (Signature and Title)*
/S/ DAVID L. DILORENZO
David L. DiLorenzo, President (Principal Executive Officer)
Date: April 14, 2023
By (Signature and Title)*
/S/ JAMES O. YOST
James O. Yost, Treasurer (Principal Financial Officer and Accounting Officer) Date: April 14, 2023
* Print name and title of each signing officer under his or her signature.